2020 INSEAD Global Talent Competitiveness Index
386
e Global Talent Competitiveness Index 2020 Global Talent in the Age of Artificial Intelligence Bruno Lanvin and Felipe Monteiro, Editors
-
Upload
khangminh22 -
Category
Documents
-
view
1 -
download
0
Transcript of 2020 INSEAD Global Talent Competitiveness Index
The Global Talent Competitiveness Index
2020 Global Talent in the Age of Artificial Intelligence
Bruno Lanvin and Felipe Monteiro, Editors

Bruno LanvinFelipe MonteiroEditors
The Global Talent Competitiveness Index
2020 Global Talent in the Age of Artificial Intelligence
INSEAD (2020): The Global Talent Competitiveness Index 2020: Global Talent in the Age of Artificial Intelligence, Fontainebleau, France.
Disclaimer: No representation or warranty, either express or im-plied, is provided in relation to the information contained herein and with regard to its fitness, sufficiency, or applicability for any particular purpose. The information contained in this report is provided for personal non-commercial use and information purposes only and may be reviewed and revised based on new information and data. INSEAD, the Adecco Group, and Google Inc. disclaim all liability relating to the content and use of the report and the information contained therein, and the report should not be used as a basis for any decision that may affect the business and financial interests of the reader or any other party. The index’s methodology and the rankings do not necessarily present the views of INSEAD, Adecco, or Google Inc. The same applies to the substantive chapters in this report, which are the responsibility of the authors.
© 2020 by INSEAD, the Adecco Group, and Google Inc.
The information contained herein is proprietary in nature and no part of this publication may be reproduced, stored in a retrieval system, or transmitted, in any form or by any means, electronic, mechanical, photocopying, or otherwise without the prior per-mission of INSEAD, the Adecco Group, and Google Inc.
ISBN: 979-10-95870-19-7
Designed by Kenneth Benson and Neil Weinberg, edited by Michael Fisher and Hope Steele, and published by INSEAD, Fontainebleau, France.
CONTENTS
THE GLOBAL TALENT COMPETITIVENESS INDEX 2020 iii
Contents
Preface ..............................................................................................................................................................................................................................................................................................vBruno Lanvin, Executive Director for Global Indices, INSEADFelipe Monteiro, Academic Director of the Global Talent Competitiveness Index; Senior Affiliate Professor of Strategy, INSEAD
The Adecco Group | Foreword ................................................................................................................................................................................................................................... viiAlain Dehaze, Chief Executive Officer, The Adecco Group
Google, Inc. | Foreword ......................................................................................................................................................................................................................................................ixKent Walker, Senior Vice President of Global Affairs, Google Inc.
Advisory Board and INSEAD GTCI Team ..............................................................................................................................................................................................................xi
CHAPTERS
Chapter 1: Global Talent in the Age of Artificial Intelligence.............................................................................................................................................................. 3Bruno Lanvin, Felipe Monteiro, and Michael Bratt, INSEAD
Statistical Annex to Chapter 1 ....................................................................................................................................................................................................................................23
Chapter 2: Latin America: The Next Big AI Talent Pool? ........................................................................................................................................................................39Fabio Caversan and Marco Stefanini, Stefanini
A Special GTCI Interview: AI and Talent Competitiveness: Luxembourg and the European Union .................................................................47An interview with Nicolas Schmit, European Union Commissioner for Jobs and Social Rights
Chapter 3: Preparing for Economic Transformation through Human-Centred AI ..........................................................................................................51Karine Perset, Andrew Wyckoff, and Alistair Nolan, Organisation for Economic Co-operation and Development (OECD)
Chapter 4: Artificial Intelligence and the SDGs: Harnessing AI for Sustainable Development ............................................................................61Houlin Zhao, International Telecommunication Union (ITU)
Chapter 5: New Skills for Augmenting Jobs and Enhancing Performance with AI .........................................................................................................67Dimitris Bertsimas, MIT Sloan School of ManagementTheodoros Evgeniou, INSEAD
Chapter 6: JRC Statistical Audit of the Global Talent Competitiveness Index 2020 .......................................................................................................73Michaela Saisana, Hedvig Norlén, Giulio Caperna, and Valentina Montalto, European Commission Joint Research Centre
SPECIAL SECTION: CITIES AND REGIONS
Chapter 7: Cities’ Talent Competitiveness in 2020: How AI Is Making a Difference at the Local Level ...........................................................91Bruno Lanvin and Michael Bratt, INSEAD
Chapter 8: How Cities Use AI to Be Talent Competitive: The Example of Bilbao ........................................................................................................... 101Ivan Jiménez Aira and Leire Lagunilla Ramos, Bizkaia Talent
A Special GTCI Interview: Porsche, AI, and Talent: Why Berlin Rather Than Stuttgart? ........................................................................................... 109An interview with Anja Hendel, Director, Porsche Digital Lab
Annex 1: Definition and sources of GCTCI variables ..............................................................................................................................................................................113
Annex 2: GCTCI rankings and scores: Overall and by variable ......................................................................................................................................................114
CONTENTS
iv THE GLOBAL TALENT COMPETITIVENESS INDEX 2020
COUNTRY PROFILES
How to Read the Country Profiles ........................................................................................................................................................................................................................ 123
Index of Countries ............................................................................................................................................................................................................................................................. 125
Country Profiles .................................................................................................................................................................................................................................................................. 127
DATA TABLES
How to Read the Data Tables ................................................................................................................................................................................................................................... 261
Index of Data Tables ........................................................................................................................................................................................................................................................263
Data Tables .............................................................................................................................................................................................................................................................................265
APPENDICES
Appendix I: Technical Notes .....................................................................................................................................................................................................................................345
Appendix II: Sources and Definitions ................................................................................................................................................................................................................349
Appendix III: About the Contributors and Partners .............................................................................................................................................................................. 361

PREFACE
THE GLOBAL TALENT COMPETITIVENESS INDEX 2020 v
This is the seventh edition of the Global Talent Competitiveness Index (GTCI) report. With its global coverage and wide range of variables, the GTCI continues to broaden its readership and to be used as a reference of choice by governments, business, and tal-ent experts around the world. Its city component is also rapidly gathering a large audience.
This new GTCI report focuses on Global Talent in the Age of Artificial Intelligence, following the path initially explored by the GTCI 2017 theme of Talent and Technology.
Big data—largely fuelled by the internet of things (IoT)—has taken deep learning and Artificial Intelligence (AI) to levels that, until a few years ago, many considered unreachable for sev-eral decades. But in and around AI, technical advances are often mismatched with the institutions and mechanisms necessary for their full social acceptance and sustainability: Regulatory, ethical, and values-based AI strategies are among the dimensions that require specific (and coordinated) efforts.
Talent competition, and labour markets in general, have started to be impacted by the rise of AI; this trend will not diminish in the foreseeable future. The analyses, chapters, and interviews contained in this report illustrate and explore sev-eral key dimensions of the talent/AI equation. Whether from the point of view of needed training and up-skilling that would allow workers to make the best of new opportunities, or from that of establishing a firm ‘value base’ from which to develop
‘AI for good’, contributors to this year’s edition of the GTCI are highlighting the potential of AI as well as the pitfalls that can be anticipated and mitigated.
Once again, the purpose of the GTCI is to be a tool for action. It is our hope that the data, inputs, and considerations contained in the following pages can be of value to the decision-makers of private and public organisations involved in talent and job creation.
This year again, the GTCI model has been refined and im-proved. Some variables have been removed or replaced and a few new ones have been added. One of the main new features is the introduction of a ‘Technology adoption’ component that provides a measure of how countries use and invest in new tech-nologies, including AI. As a result, the total number of indicators has increased from 68 to 70. Country coverage in the GTCI 2020 has also expanded and the index now includes 132 countries—up from last year’s 125 countries.
Now a regular feature of the report, the special section on cities offers a ranking of 155 cities along the various dimen-sions of the Global City Talent Competitiveness Index (GCTCI). This year, the model has primarily been improved in three ways: First, variables that are more business- and impact-oriented—for example, those on foreign direct investment and patent
applications—have been introduced to the model. Second, the share of values proxied by regional or national data has been reduced, so that almost all values refer to city-level data. Third, the structure of the model has been refined in that some indica-tors have been placed in another pillar for conceptual reasons, which has also resulted in bringing the GCTCI model closer to the GTCI model.
As last year, a time-series analysis is proposed, that looks at the evolution of national economies over a six-year period of GTCI data, illustrating ways in which countries’ talent competi-tiveness has changed over time, both in absolute terms and in comparison with other economies.
We have also pursued our strategy of minimising the en-vironmental impact of GTCI production and dissemination. The report is now produced exclusively in electronic format, and it remains accessible for free through dedicated websites.
This year again we want to express our deep feeling of grati-tude to our faithful partner, the Adecco Group. We also welcome Google as a new partner. Our thanks go to the executives and teams involved in these organisations, and also to all the indi-viduals, institutions, and entities that have contributed chapters, interviews, data, and ideas to the present edition.
As in previous years, we wish to direct special thanks to the European Commission Joint Research Centre (JRC), which has continued its highly professional and constructive evaluation of the strengths and weaknesses of the GTCI model. Finally, we acknowledge with gratitude the continued support of our pres-tigious Advisory Board.
The GTCI continues to be a work in progress, fed by the re-actions, suggestions, and criticisms received from its increasing circle of readers and users. We hence look forward to hearing more from you about the report, and how we can make it even better in the future.
Bruno LanvinExecutive Director for Global Indices, INSEAD
Felipe MonteiroAcademic Director of the Global Talent Competitiveness Index; Senior Affiliate Professor of Strategy, INSEAD
Preface
PREFACE

THE GLOBAL TALENT COMPETITIVENESS INDEX 2020 vii
We are witnessing one of the most fundamental shifts in society since the first industrial revolution, which mechanised and auto-mated traditional crafts, created new industries, and prompted the first wave of urbanisation. The technologies powering to-day’s fourth industrial revolution are being woven through every aspect of our lives—from how we work to how we spend our free time—even if we aren’t aware of them.
Companies and organisations that successfully harness the power of Artificial Intelligence (AI), machine learning, automa-tion, and data science for the benefit of their customers, employ-ees, and society will be the winners.
What does this mean for how we work? Automation, today combined with big data and AI, has migrated from the factory floor to the back office and, via the middle office, to the front of the house, where the company interacts with customers.
Human Resources services and operations are also being rapidly amplified by AI and digitalisation, where time-consuming tasks and inefficient processes are being replaced with auto-mated solutions. In addition, AI and machine learning are ena-bling companies to crunch massive amounts of data in order to identify, organise, and present patterns and trends that aid more effective decision-making in nearly all aspects of HR.
At the Adecco Group, as the world’s leading HR solutions partner, we see technology as an integral aspect of nearly all major employment and workforce transformations—whether it’s automating assembly lines, in recruitment and performance evaluation, or in knowledge and relationship management. For example, Lee Hecht Harrison, an Adecco Group company, is using the chatbot ‘Ella’ to interact with job-hunters. ‘She’ is the front end of a process that aggregates and presents the most suitable job opportunities from vast amounts of vacancy data, as a first step in helping a candidate find a new job. Ella ampli-fies, rather than replaces, the usual face-to-face coaching and guidance.
In this 2020 edition dedicated to Global Talent in the Age of Artificial Intelligence, the authors of the GTCI address the growing need to better under stand the ‘sweet spot’ where people and technology will cooperate, how rapid digitalisation will impact business and talent, and the skills needed for individuals to thrive
in the workplace of the future. Looking at previous GTCI data, we notice a widening gap between highly competitive countries and other countries in the ranking. Many countries are still strug-gling to leverage the skill sets of their workforce or to train them in the relevant skills for the future. Insights from the GTCI dem-onstrate a complex interconnection of economic performance, education systems, talent, and skills.
Technological advances are instrumental in augmenting the human role, rather than merely substituting it. There are huge benefits to be had for the organisations through optimis-ing business and decision-making processes, and for the em-ployees who can redirect their efforts away from these tasks and onto more strategic and human-centred leadership activities. It also means that workers, utilising AI to mine and present reliable, non-biased data, can better focus on finding innovative solutions for closing the skills gaps and building an inclusive workforce of the future. At the same time, the application of technology must not be a zero-sum game, with big winners and correspondingly big losers. A deep understanding of the profound ethical impli-cations and potential social impact of AI, as well as of the impact of accelerating the adoption of technology, is crucial.
We at the Adecco Group see that technology and AI are already generating tremendous opportunities. This may replace many jobs, but it will create even more new ones—including jobs that don’t yet exist—that require new skills and competen-cies. To leverage these opportunities, significant investments must be made in skilling and re-skilling. Adecco Group company General Assembly, for example, is working with individuals and client teams specifically to ensure they are updating their skills and learning for the demands of the data-rich digital world, thus smoothing many workforce transformations.
It is our intention that the GTCI help decision-makers across governments, business, and civil society to understand the chal-lenges and opportunities that technological developments pre-sent. The index provides crucial insights to help leaders develop talent strategies that are fit for the future, overcome talent mis-matches, and become more competitive in the global market-place—all of which are essential in being able to make the most of the future of work.
The Adecco Group | Foreword
FOREWORD
Alain DehazeChief Executive Officer, The Adecco Group

THE GLOBAL TALENT COMPETITIVENESS INDEX 2020 ix
We know the incredible potential of Artificial Intelligence (AI). AI applications are creating new ways for doctors to identify dis-ease, equipping first responders to get ahead of disasters, ena-bling scientists to discover new materials, empowering people to communicate across different languages, and helping govern-ments to prevent famine.
AI also holds incredible potential for our economies by boosting productivity, handling tedious tasks, and creating new jobs. Already farmers are using AI to increase the accuracy and usefulness of key agricultural factors. Banks are using AI to detect fraud with greater accuracy by rapidly identifying anomalous activities. Retailers are using AI to enable easier product discov-ery and better detect counterfeits.
But like groundbreaking technologies before it, AI will also affect people’s jobs and change the nature of work. We need to anticipate these changes and take steps to prepare for them. Business leaders, governments, educators, trade unions, and other stakeholders each have a responsibility to manage these changes and shape a future that works for everyone.
In the 18th and 19th centuries, the steam engine and other technologies made agricultural work and distribution radically more efficient, allowing people to get the same output from the land with much less labour input. In the 19th and 20th centuries, new technologies such as the Bessemer process enabled the mass production of steel and made industrial production radi-cally more efficient. We ultimately adapted to these changes—including by offering public secondary school education that would prepare people for more knowledge-dependent jobs.
Today, AI is changing work again. AI augments our intelli-gence. It will make many more routine tasks much easier, thereby reducing demand for those tasks and putting some jobs at risk. At the same time, it will create the need for new tasks and cre-ate opportunities that didn’t exist before, including enabling workers to spend more time on creative work. And it will trans-form some existing tasks, resulting in the ability to serve more people at scale.
While research by McKinsey and others has shown that few jobs—likely less than 5%—are at risk of outright displacement, these same studies suggest that as many as two-thirds of jobs will undergo substantial changes. Adapting to these changes will require helping people to gain critical skills. For some, it will mean skills in AI. For others, it will mean a broader set of digital skills.
At Google, we are working on both. We have developed Learn with Google AI (https://ai.google/education/), which is focused on AI education and includes our Machine Learning Crash Course. This course has already been used to train more than 20,000 engineers at Google—our own small future of work microcosm—and is available in 11 languages.
With respect to the broader set of digital skills that are needed for changes in work, Google has made a major commit-ment to training through our Grow with Google programme. For instance, since 2014, we have helped over 11 million people in Europe, the Middle East, and Africa access the skills needed for the jobs of the future. And in the United States, we launched an IT support certificate program that provides a pathway to jobs at top employers—including Google—to address skills gaps.
As we pursue programmes like these, and other business leaders pursue their own efforts, we need to better understand how AI will affect work so that we can target our efforts most effectively. What tasks are more likely to be simplified by AI and require a smaller workforce? What tasks can be performed en-tirely by a machine? What new human tasks will be created as a result of AI? And which countries and regions are best anticipat-ing these changes?
INSEAD’s research, and specifically the Global Talent Com-petitiveness Index, should help provide answers to some of these critical questions. With better data, and by sharing lessons learned across sectors and geographies, we all will be in a better position to leverage the opportunities from the next technology revolution.
Google, Inc. | Foreword
FOREWORD
Kent WalkerSenior Vice President of Global Affairs, Google Inc.

THE GLOBAL TALENT COMPETITIVENESS INDEX 2020 xi
Advisory Board
Talal Abu-GhazalehFounder and Chairman, Talal Abu-Ghazaleh Organization
Thierry BretonChairman and CEO, Atos; former Minister of the Economy, Finance and Industry for France
Peter CappelliGeorge W. Taylor Professor of Management and Director, Center for Human Resources at The Wharton School, University of Pennsylvania
Yoko IshikuraProfessor Emeritus, Hitotsubashi University; former Senior Manager at McKinsey & Company, Inc., Tokyo
Mats KarlssonDirector, The Swedish Institute of International Affairs; former Vice-President of the World Bank
Arnoud De MeyerPresident, Singapore Management University
Vineet NayarFounder, Sampark Foundation; former CEO of HCL Technologies
Advisory Board and INSEAD GTCI Team
INSEAD GTCI Team
Bruno LanvinExecutive Director for Global Indices
Felipe MonteiroAcademic Director of the Global Talent Competitiveness Index; Senior Affiliate Professor of Strategy
Michael BrattLead Researcher
Anna HenryProject Manager
Virginie Bongeot MinetSenior Coordinator
Editing Team
Kenneth BensonPrincipal, Pegasus Type
Michael FisherMichael Fisher Writing Services
Hope SteeleEditor, Steele Editorial Services
Neil WeinbergPrincipal, Neil Weinberg Design Group
ADVISORY BOARD AND INSEAD GTCI TEAM


Chapters

to address complex problems in mathematics and physics. Two main approaches were pursued. On one hand, GOFAI (for ‘Good Old-Fashioned Artificial Intelligence’) was based on the desire to identify abstract ways to allow machines to reason and analyse data, uninfluenced by the way in which human brains were func-tioning. On the other hand, efforts were being pursued to de-velop an ‘artificial neural network’, mimicking the human brain and trying to build a structure (an artificial brain) with a capacity to learn.
Until the 1970s, the GOFAI approach dominated, attract-ing both excitement and government funding. Disappointing results and the lack of operational applications (combined with the inability of neural networks to generate significant success) led to an ‘ice age’ of AI that lasted much of the following two decades. Then the sudden availability of big data—the result of the emergence of the internet, the internet of things (IoT), and the spectacular decrease in the price/performance ratio of processors and data storage—changed everything. Neural networks became the promising avenue, and ‘deep learning’
This seventh edition of the Global Talent Competitiveness Index (GTCI) report builds on the GTCI’s earlier findings on ‘Talent and Technology’,1 taking them one step further by focusing on Global Talent in the Age of Artificial Intelligence. Through a combination of analytical chapters and interviews, the report attempts to bring context to the data and rankings of this year’s results.
A BIT OF HISTORYArtificial Intelligence (AI) is not an entirely new concept. Starting with Blaise Pascal’s calculating machine (the ‘Pascaline’, 1642), Jacques de Vaucanson’s ‘Digesting Duck’ (1739) and mechanical loom (1740), and Joseph Jacquard’s punched cards programme (1802) and followed by the pioneering computer work of Charles Babbage, Ada Lovelace (1837), and Alan Turing (1950), AI has been a dream of mankind since the Enlightenment period. The term AI, however, was officially first used at a conference convened by Dartmouth College in Hanover, New Hampshire, in 1956.2
From then on, considerable attention, investment, and hopes coalesced around the promises of AI, seen largely as a way
CHAPTER 1
Global Talent in the Age of Artificial IntelligenceBruno Lanvin, Felipe Monteiro, and Michael BrattINSEAD
GLOBAL TALENT IN THE AGE OF ARTIFICIAL INTELLIGENCE
THE GLOBAL TALENT COMPETITIVENESS INDEX 2020 3
technologies develop, often in the absence of a proper and ef-fective regulatory legal framework.
In both cases, additional attention is clearly needed to ad-dress or mitigate such fears. Short of such an effort by all stake-holders (governments, business, citizens), counter-productive and divisive forces may gather in the guise of modern luddite-like movements or, more broadly, in the shape of diminished so-cial acceptance for progress and technology.
Two main avenues call for immediate attention: How will AI change the future of work? How can we ensure that AI re-mains a force for good and helps us improve the world’s future prospects?
As we see below, both avenues are tightly intertwined.
AI AND TALENT: SUPPLY AND DEMANDFrom a talent perspective, two main areas—which can be called the demand side and the supply side of skills—deserve particular attention. On the demand side, the key questions are: What skills need to be developed to allow humans to take full advantage
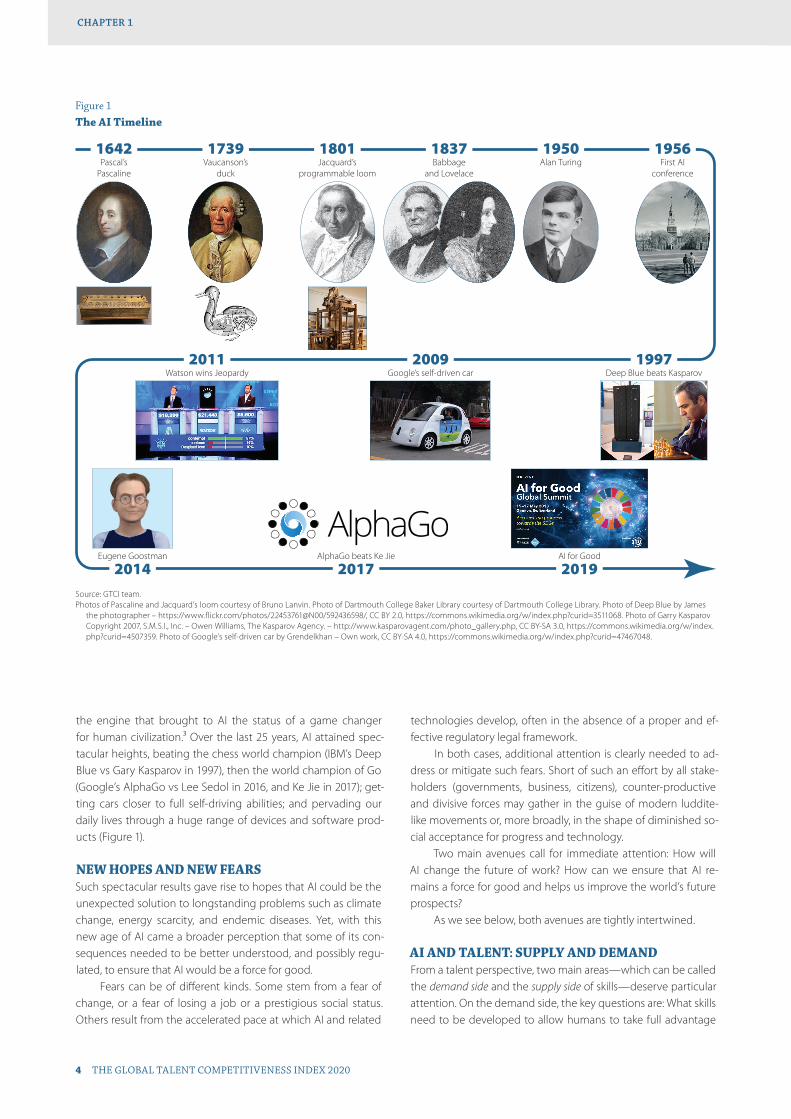
the engine that brought to AI the status of a game changer for human civilization.3 Over the last 25 years, AI attained spec-tacular heights, beating the chess world champion (IBM’s Deep Blue vs Gary Kasparov in 1997), then the world champion of Go (Google’s AlphaGo vs Lee Sedol in 2016, and Ke Jie in 2017); get-ting cars closer to full self-driving abilities; and pervading our daily lives through a huge range of devices and software prod-ucts (Figure 1).
NEW HOPES AND NEW FEARSSuch spectacular results gave rise to hopes that AI could be the unexpected solution to longstanding problems such as climate change, energy scarcity, and endemic diseases. Yet, with this new age of AI came a broader perception that some of its con-sequences needed to be better understood, and possibly regu-lated, to ensure that AI would be a force for good.
Fears can be of different kinds. Some stem from a fear of change, or a fear of losing a job or a prestigious social status. Others result from the accelerated pace at which AI and related
Figure 1The AI Timeline
Pascal’sPascaline
1642Vaucanson’s
duck
1739Jacquard’s
programmable loom
1801Babbage
and Lovelace
1837Alan Turing1950
First AIconference
1956
Watson wins Jeopardy2011
Google’s self-driven car2009
Deep Blue beats Kasparov1997
2014Eugene Goostman
2019AI for Good
2017AlphaGo beats Ke Jie
AlphaGo
Source: GTCI team.Photos of Pascaline and Jacquard’s loom courtesy of Bruno Lanvin. Photo of Dartmouth College Baker Library courtesy of Dartmouth College Library. Photo of Deep Blue by James
the photographer – https://www.flickr.com/photos/22453761@N00/592436598/, CC BY 2.0, https://commons.wikimedia.org/w/index.php?curid=3511068. Photo of Garry Kasparov Copyright 2007, S.M.S.I., Inc. – Owen Williams, The Kasparov Agency. – http://www.kasparovagent.com/photo_gallery.php, CC BY-SA 3.0, https://commons.wikimedia.org/w/index.php?curid=4507359. Photo of Google’s self-driven car by Grendelkhan – Own work, CC BY-SA 4.0, https://commons.wikimedia.org/w/index.php?curid=47467048.
GLOBAL TALENT IN THE AGE OF ARTIFICIAL INTELLIGENCECHAPTER 1
4 THE GLOBAL TALENT COMPETITIVENESS INDEX 2020

of the advances in AI, and how can those skills be provided, ac-quired, and updated? The main issue on the supply side is: What can one reasonably expect from new and future AI capabilities in terms of recruitment, human resources management, and the enhancing of current and future human skills?
Supplying AI for Better Labour MarketsA number of AI-based products are already available to help both job seekers to identify possible employment opportuni-ties, and employers to find the best-qualified people for specific functions within their organisations. It has been argued that AI often proves better than humans at identifying the best candi-dates for a particular job, as it is more immune to unconscious biases,4 a common trait of practically all humans.5
Many start-ups (including Cogito, Percolata, and pymetrics) are flooding the market with AI-based interview and recruitment tools. New York–based pymetrics, in particular, has met signifi-cant success with an AI programme that uses a series of games to test for relevant skills. The company stresses that algorithms are then analysed to make sure they are not creating biased hir-ing outcomes or favouring any particular group. In April 2019, another Swedish start-up (TNG) began to use a physical robot called Tengai to carry out job interviews, claiming it provided a more ‘bias free’ process than traditional interviews.6
AI systems go even further by offering continuous evalu-ations of workers’ performance, and even tools to predict their future performance: IBM, for example, which has been using Watson, its AI platform, during employee reviews to predict fu-ture performance, claims a 96% accuracy rate.7
A Growing Demand for AI-Compatible SkillsThe impact of automation on jobs has been the subject of the GTCI 2017, as well as of significant recent research, pointing towards different estimates of how many ‘old jobs’ would dis-appear and how many ‘new jobs’ would be created.8 Ample reference has been made to the rapidly expanding abilities of machines and equipment (robots, exoskeletons, among others) to replace or augment humans in dangerous or repetitive tasks (e.g., detecting and defusing explosives, performing physical tasks such as lifting, displacing or handling heavy or potentially harmful loads, etc.).
Yet, until recently, the dominant thinking (and analysts’ fo-cus) has tended to consider that old jobs (especially dangerous or repetitive ones) would be replaced with new jobs (typically those with a higher intellectual or creative component). In other words, automation was expected to destroy blue collar jobs and create new (white collar) ones. With the advent of ubiquitous AI, that equation will be significantly altered. By allowing machines and algorithms to rival humans in an increasing number of high-end jobs, AI is giving a new dimension to automation: The jobs of accountants, news reporters, doctors, radiologists, lawyers, bank-ers, and data analysts all now rely on an increasingly important AI component. This new characteristic of automation can be seen by many as the symptom of a rapid human/AI substitution process.
Even the simple principle that ‘humans manage machines, and not the other way around’ is being challenged by new
advances in AI. In a recent article, the New York Times underlined that ‘For decades, people have fearfully imagined armies of hyper-efficient robots invading offices and factories, gobbling up jobs once done by humans. But in all of the worry about the potential of Artificial Intelligence to replace rank-and-file workers, we may have overlooked the possibility it will replace the bosses, too. … The goal of automation has always been efficiency. What if artificial intelligence sees humanity itself as the thing to be optimized?’9
When it comes to identifying the skills that will be needed most in the age of AI, however, much of current reasoning has been focusing on the two ends of the spectrum—that is, lower-skills jobs (which can be most easily delegated to machines) on one hand, and jobs requiring sophisticated skills that only hu-mans can hold on the other. In this report, Chapter 5 by Dimitris Bertsimas and Theodoros Evgeniou brings an additional dimen-sion to this issue, considering AI in the context of ‘augmented work’. In their seminal book Human + Machine,10 Paul Daugherty and James Wilson emphasise the notion of a ‘missing middle’—the broad area of skills required for ‘hybrid tasks’ to be exercised jointly by humans and machines (see Figure 2).
The two authors consider that, in the workplace and in la-bour markets, the future of AI will rely on fruitful mutual contri-butions between humans on one hand and machines on the other through hybrid activities. To best fulfil and manage such activities, new skills—which they call fusion skills (see Figure 3)—will be required. Such skills include:
• rehumanizing time (fusion skill #1), which contributes to generating a better work-life balance for humans;
• responsible normalising (fusion skill #2), which is largely about safeguarding the social acceptability of AI by in-troducing it skilfully and progressively—in this context, Daugherty and Wilson insist on the role of Chief Executive Officers (CEOs), who ‘must develop a clear thesis on the fu-ture of work’;11
• judgement integration (fusion skill #3), whereby human judgement remains the one to be exercised whenever AI gets confused or hesitant;
• intelligent interrogation (fusion skill #4), a key tool for those working alongside AI to know how to guide it along the path where it can be most helpful;
• bot-based empowerment (fusion skill #5), which allows those who master it to obtain ‘superpowers’ from their AI agents;
• holistic melding (fusion skill #6), which allows humans to work with AI in a congenial way, as if AI were a natural extension of their own body or persona;
• reciprocal apprenticing (fusion skill #7), by which AI’s ability for deep learning is enhanced by the humans
GLOBAL TALENT IN THE AGE OF ARTIFICIAL INTELLIGENCE
THE GLOBAL TALENT COMPETITIVENESS INDEX 2020 5
CHAPTER 1

managing it, and, reciprocally, humans continue to ac-quire new abilities to leverage the power of AI; and, finally,
• relentless reimagining (fusion skill #8), which makes it possible to make a clear distinction between AI-enriched activities on one hand and mere automation on the other, by constantly creating new processes and business models from scratch.
Considering the profound impact of ubiquitous AI on skills, jobs, and the future of work, it is clear that not all of the nec-essary transitions will be frictionless. Social resistance may be high in some sectors. Even in those parts of society where the potential benefits of AI will be clearly perceived, its acceptability and sustainability will require more than a convincing economic
equation: Values-based AI strategies and principles-led AI poli-cies will be required.
AI AND VALUES: IN SEARCH OF CHECKS AND BALANCESIn all parts of the world, AI strategies have emphasised the need for early adoption of the rules and principles that should guide AI research, development, and deployment. For example, in Europe, the United Kingdom’s Centre for Data Ethics and Innovation (CDEI) has underlined the importance of the need for data pro-tection and the necessity of mitigating or preventing algorithmic bias.12 Similar principles are central to the French and European approaches to AI,13 which put special emphasis on data privacy and protection and the importance of developing algorithms that are explainable and intelligible to ordinary people.
It is also worth keeping in mind the potential role of AI as an engine for innovation and problem solving in the face of global issues that are often seen as intractable. How can AI help us protect the environment and identify optimal strategies to fight poverty, endemic diseases, inequalities, corruption, and terror-ism? How can it do all this while respecting our legitimate aspira-tion for freedom of expression, and the cultural, religious, and other sensitivities around the globe?
Such aspects are well covered by two other chapters in this report: Chapter 3 (by authors from the Organisation for Economic Co-operation and Development, OECD) spells out the OECD AI Principles, adopted in May 2019; and Chapter 4 (by the Secretary-General of the International Telecommunication Union or ITU, Houlin Zhao) describes the principles and objectives that have guided the United Nations approach to ‘AI for Good’.
AI AND GLOBAL TALENT COMPETITIVENESS: A GEO-POLITICAL VIEWAn increasing number of economies have adopted some kind of national (or international) AI strategy. Bill Dutton had identi-fied 24 of them by the end of 2018; the Future of Life Institute
Figure 2The missing middle of hybrid activities between humans and AI
Source: Based on Daugherty & Wilson (2018), p. 8.
Lead
Empa
this
e
Crea
te
Judg
e
Trai
n
Expl
ain
Sust
ain
Am
plify
Inte
ract
Embo
dy
Tran
sact
Iter
ate
Pred
ict
Ada
pt
Human-only activity
Humans complement machines
AI gives humans superpowers
Machine-only activity
Human and machine hybrid activitiesH + M
Figure 3The future of AI-human cooperation in the workplace: Fusion skills
Source: Based on Daugherty & Wilson (2018), p. 186.
Human and machine hybrid activity
Humans complement machines AI gives humans superpowers
Train Explain Sustain Amplify Interact Embody
Rehumanising time Intelligent interrogation
Responsible normalising Bot-based empowerment
Judgement integration Holistic melding
Reciprocal apprenticing
Relentless reimagining
GLOBAL TALENT IN THE AGE OF ARTIFICIAL INTELLIGENCECHAPTER 1
6 THE GLOBAL TALENT COMPETITIVENESS INDEX 2020
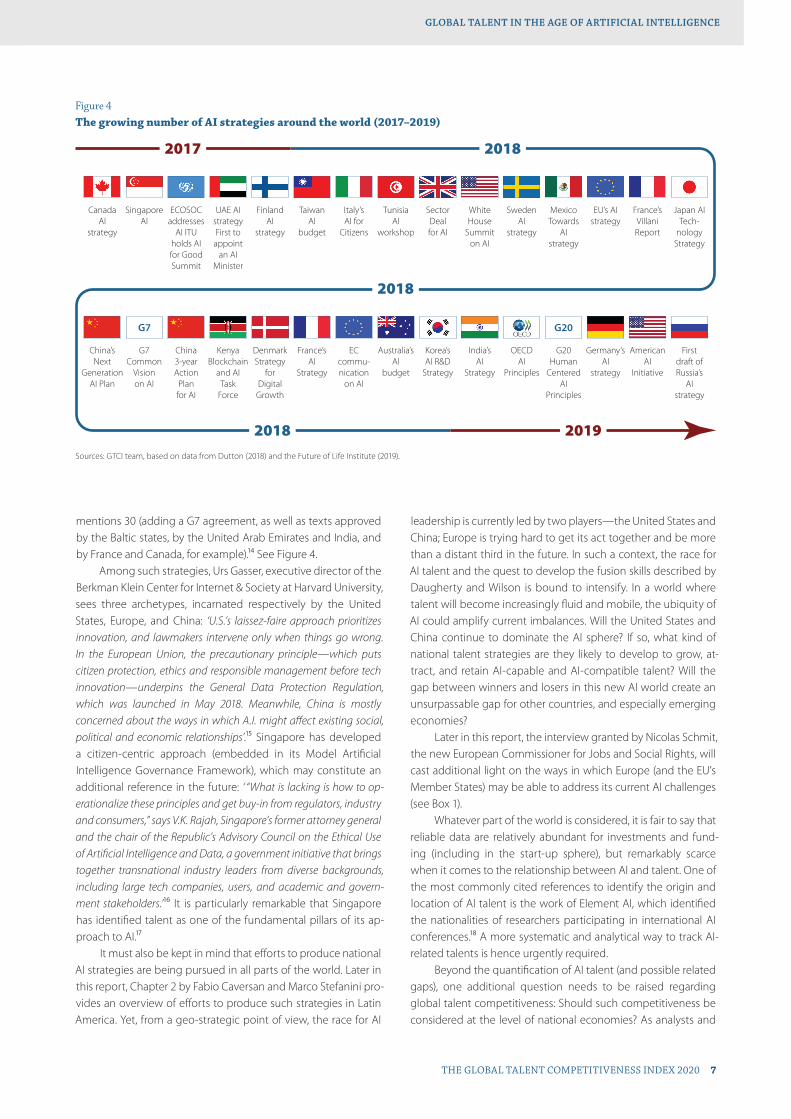
mentions 30 (adding a G7 agreement, as well as texts approved by the Baltic states, by the United Arab Emirates and India, and by France and Canada, for example).14 See Figure 4.
Among such strategies, Urs Gasser, executive director of the Berkman Klein Center for Internet & Society at Harvard University, sees three archetypes, incarnated respectively by the United States, Europe, and China: ‘U.S.’s laissez-faire approach prioritizes innovation, and lawmakers intervene only when things go wrong. In the European Union, the precautionary principle—which puts citizen protection, ethics and responsible management before tech innovation—underpins the General Data Protection Regulation, which was launched in May 2018. Meanwhile, China is mostly concerned about the ways in which A.I. might affect existing social, political and economic relationships’.15 Singapore has developed a citizen-centric approach (embedded in its Model Artificial Intelligence Governance Framework), which may constitute an additional reference in the future: ‘ “What is lacking is how to op-erationalize these principles and get buy-in from regulators, industry and consumers,” says V.K. Rajah, Singapore’s former attorney general and the chair of the Republic’s Advisory Council on the Ethical Use of Artificial Intelligence and Data, a government initiative that brings together transnational industry leaders from diverse backgrounds, including large tech companies, users, and academic and govern-ment stakeholders.’16 It is particularly remarkable that Singapore has identified talent as one of the fundamental pillars of its ap-proach to AI.17
It must also be kept in mind that efforts to produce national AI strategies are being pursued in all parts of the world. Later in this report, Chapter 2 by Fabio Caversan and Marco Stefanini pro-vides an overview of efforts to produce such strategies in Latin America. Yet, from a geo-strategic point of view, the race for AI
leadership is currently led by two players—the United States and China; Europe is trying hard to get its act together and be more than a distant third in the future. In such a context, the race for AI talent and the quest to develop the fusion skills described by Daugherty and Wilson is bound to intensify. In a world where talent will become increasingly fluid and mobile, the ubiquity of AI could amplify current imbalances. Will the United States and China continue to dominate the AI sphere? If so, what kind of national talent strategies are they likely to develop to grow, at-tract, and retain AI-capable and AI-compatible talent? Will the gap between winners and losers in this new AI world create an unsurpassable gap for other countries, and especially emerging economies?
Later in this report, the interview granted by Nicolas Schmit, the new European Commissioner for Jobs and Social Rights, will cast additional light on the ways in which Europe (and the EU’s Member States) may be able to address its current AI challenges (see Box 1).
Whatever part of the world is considered, it is fair to say that reliable data are relatively abundant for investments and fund-ing (including in the start-up sphere), but remarkably scarce when it comes to the relationship between AI and talent. One of the most commonly cited references to identify the origin and location of AI talent is the work of Element AI, which identified the nationalities of researchers participating in international AI conferences.18 A more systematic and analytical way to track AI-related talents is hence urgently required.
Beyond the quantification of AI talent (and possible related gaps), one additional question needs to be raised regarding global talent competitiveness: Should such competitiveness be considered at the level of national economies? As analysts and
Figure 4The growing number of AI strategies around the world (2017–2019)
CanadaAI
strategy
SingaporeAI
ECOSOCaddresses
AI ITU holds AI for Good Summit
UAE AI strategy First to
appointan AI
Minister
FinlandAI
strategy
TaiwanAI
budget
Italy’sAI for
Citizens
TunisiaAI
workshop
Sector Dealfor AI
White House
Summiton AI
SwedenAI
strategy
Mexico Towards
AIstrategy
EU’s AI strategy
France’s Villani Report
Japan AI Tech-
nology Strategy
China’s Next
Generation AI Plan
G7 Common
Visionon AI
China 3-year Action
Planfor AI
Kenya Blockchain
and AITask
Force
Denmark Strategy
forDigital Growth
France’sAI
Strategy
EC commu-nication
on AI
Australia’s AI
budget
Korea’sAI R&D
Strategy
India’sAI
Strategy
OECDAI
Principles
G20 Human
Centered AI
Principles
Germany’s AI
strategy
American AI
Initiative
Firstdraft of Russia’s
AIstrategy
G7 G20
2017 2018
2018 2019
2018
Sources: GTCI team, based on data from Dutton (2018) and the Future of Life Institute (2019).
GLOBAL TALENT IN THE AGE OF ARTIFICIAL INTELLIGENCE
THE GLOBAL TALENT COMPETITIVENESS INDEX 2020 7
CHAPTER 1

observers of the AI global scene have often stressed, the real powerhouses of AI may not be nations but large business enti-ties. In his seminal book AI Superpowers: China, Silicon Valley, and the New World Order,19 Kai-Fu Lee writes ‘Of the hundreds of com-panies pouring resources into AI research . . . seven have emerged as the new giants of corporate AI research: Google, Facebook, Amazon, Microsoft, Baidu, Alibaba and Tencent. These seven giants have, in effect, morphed into what nations were fifty years ago—that is, large and relatively closed-off systems that concentrate talent and resources on breakthroughs that will mostly remain “in house” ’.20
In addition to the AI/talent strategies pursued by nation-states on one hand and large corporations on the other, one must also grant due attention to the efforts pursued at sub-national levels, especially by cities. This is the purpose of the sec-tion of this report devoted to cities and regions, illustrated by a contribution from Bizkaia Talent (Bilbao) and an interview by Anja Hendel, Director, Porsche Digital Lab in Berlin.
KEY MESSAGES EMERGING FROM THE GTCI 2020
• Message 1: The gap between talent champions (al-most all of them high-income countries) and the rest of the world is widening. A similar gap is also seen in the universe of AI. AI talent is scarce and unequally distributed
across industries, sectors, and nations. More than half of the population in the developing world lack basic digital skills. In the age of AI, this digital skills divide is broaden-ing, with a few countries progressing quickly while most of the developing world is lagging. AI policies and pro-grammes should work to minimise negative outcomes and increase access to AI for those left behind.
• Message 2: AI may also provide significant opportu-nities for emerging markets to leapfrog. The GTCI’s longitudinal analyses highlight that—even if it is the ex-ception rather than the rule—some emerging countries (e.g., China, Costa Rica, and Malaysia) can become talent champions in their respective regions, while others (e.g., Ghana and India) have significantly improved their ca-pacity to enable, attract, grow, and retain talent over the past few years, and hence can be labelled talent movers. As India did in the late 1990s (becoming a global offshor-ing base for IT services), AI may provide opportunities for other countries/regions (e.g., Latin America) to become ‘global delivery centres’ for AI applications.
• Message 3: Turning AI into a force for good requires a proactive, cooperative approach. AI can play a key role in providing solutions to help humanity achieve the
BOX 1: AI: A SPECIAL CHALLENGE FOR EUROPE
In 2018, Europe began a coordinated effort to address the challenge presented by AI. The following excerpts are from the declaration that began this process and the proposals of the resulting plan. More information about each is available in the following websites.
‘On 10 April 2018 25 European countries [24 EU member countries and Norway] signed a Declaration of cooperation on Artificial Intelligence (AI). Whereas a number of Member States had already announced national initiatives on Artificial Intelligence, they now declared a strong will to join forces and engage in a European approach to deal therewith.’ https://ec.europa.eu/digital-single-market/en/news/eu-member-states-sign- cooperate-artificial-intelligence
As of 25 April 2018, the European Commission started working with Member States to have a coordinated plan on AI by the end of the year. The main aim was ‘to maxim-ise the impact of investment at the EU and national levels, en-courage cooperation across the EU, exchange best practices, and define the way forward together, so as to ensure the EU’s global competitiveness in this sector.’ In the meantime, the Commission continued ‘to invest in initiatives which are key for AI, including the development of more efficient electronic components and systems (such as chips specifically built to run AI operations), world-class high-performance computers, as well as flagship projects on quantum technologies and on the mapping of the human brain.’ https://ec.europa.eu/malta/
news/artificial-intelligence-commission-outlines-european-approach-boost-investment-and-set-ethical_en
‘A coordinated plan prepared with Member States to foster the development and use of AI in Europe . . . proposes joint ac-tions for closer and more efficient cooperation between Member States, Norway, Switzerland and the Commission in four key areas: increasing investment, making more data available, foster-ing talent and ensuring trust. Stronger coordination is essential for Europe to become the world-leading region for developing and deploying cutting-edge, ethical and secure AI.’
One of the four prioritised areas of public interest for this plan is to ‘nurture talent, skills and life-long learning’. The Member States agreed that ‘talent in Europe is essential for the development and use of AI, but EU countries face shortages of ICT professionals and lack AI-specialised higher education pro-grammes. That is why the Commission, together with European countries, will support advanced degrees in AI through, for exam-ple, dedicated scholarships. The Commission will also continue to support digital skills and lifelong learning for the whole of society, and especially for workers most affected by AI, as detailed in its AI strategy. For the development of human-centred AI, it is also important that AI is present in education programmes in other disciplines, such as law. Full use of the Blue Card system will also help to retain and attract highly-skilled AI professionals in Europe.’ https://ec.europa.eu/cyprus/news/20181207_en
GLOBAL TALENT IN THE AGE OF ARTIFICIAL INTELLIGENCECHAPTER 1
8 THE GLOBAL TALENT COMPETITIVENESS INDEX 2020
United Nations Sustainable Development Goals (SDGs): Education (with customised online programmes) and health (with personalised remote diagnosis and follow-up, as well as big data analysis to track and reduce endemic diseases and epidemics) are two of the most immediate examples. This, however, will require multi-stakeholder cooperation. The two sides (supply and demand) of the AI/talent equation deserve concurrent attention: (1) Build the skills necessary to ensure optimal human/machine cooperation and (2) create the conditions to maximise the social value and long-term sustainability of such co-operation. It is also fundamentally important that AI be designed within universally accepted guiding principles respecting the rule of law, fundamental human rights, in-clusion, and diversity.
• Message 4: The emergence of AI in the workplace requires a massive re-skilling of the workforce. At all levels of qualifications, workers will need training on adaptability, social intelligence, communication, and problem-solving. Life-long learning will increasingly play a key role in developing skills to foster empathy, creativity, imagination, judgement, and leadership, which are likely to continue to be human-only activities. Re-skilling will also be necessary to develop fusion skills in order to allow humans and machines to effectively and efficiently inter-act in hybrid activities.
• Message 5: When introducing AI to organisations, communities, or societies as a whole, acceptability is a condition for sustainability. It seems critical to create a narrative about AI and the future of jobs that emphasises its many possibilities instead of just instilling more fear. It is essential, however, that the broader workforce (includ-ing the youth, women, and older people) should have the opportunities, skills, and interest (and feel empowered) to fulfill the millions of new jobs that will be created by AI, directly or indirectly. It should be emphasised that AI will augment human capabilities directly and that human-AI teams could be more productive than either AI or work-ers alone. AI-based automation also offers opportunities to re-humanise time (e.g., through a better work-life bal-ance for humans) and to offer more intellectually stimulat-ing jobs. Policymakers and regulators will have key roles to play—including through the provision of social safety nets—to ensure smooth job transitions. Since AI-induced changes will be fast and broad-ranging, it will be impor-tant for educators and leaders to realise that new genera-tions will continue to attach key importance to values and seek jobs that offer them opportunities to contribute in a meaningful way to society.
• Message 6: Cities are striving to become AI hubs and attract relevant talents. Such efforts translate to differ-ent initiatives and strategies (curricula in local universities and schools and aggressive policies to detect, attract, and
retain AI talents, for example). In many respects, such ef-forts coincide with cities’ strategies to become smart cities, as AI becomes a core engine of the local transformation of transportation networks, energy grids, and other funda-mental components of urban strategies. Currently—and increasingly in the future—cities continue to be the main testbeds for new AI-based tools such as facial recogni-tion, tele-surveillance, and self-driven vehicles. Experience shows that perceptions of the value of such technologies vary greatly from one city to another, which is a phenom-enon worth watching before these tools can be sustain-ably deployed.
THE GTCI CONCEPTUAL FRAMEWORKAs underlined in the previous six editions of the GTCI, countries are competing globally to grow better talent; attract the talent they need; and retain those workers who contribute to com-petitiveness, innovation, and growth. Countries seek to put eco-nomic and social policies in place that will facilitate this. In such a context, governments, businesses, and various other stake-holders need quantitative instruments that can inform their deci-sions (as investors, employers, employees, or jobseekers) and can help them design and implement better policies in areas such as education, employment, and immigration, to name a few. This is the purpose of the GTCI.
Who Is Expected to Use the GTCI and Why?Decisions regarding the development, attraction, and empower-ment of talent are remarkably complex and multi-layered. They involve a multi-disciplinary endeavour to tackle talent dilemmas that have been raised in the fields of economics, education, hu-man resource management and organisational behaviour, en-trepreneurship, innovation, and strategy. At the policy level, this complexity is compounded by emotional dimensions and the international consequences of choices to be made in terms of immigration, social equity, and fiscal incentives, among other issues.
Faced with such intricate issues, decision-makers—both public and private—need quantitative tools that will enable them to benchmark the efforts made and results obtained in dif-ferent socioeconomic environments in terms of talent manage-ment and talent competitiveness. The GTCI has been designed to help address this challenge by providing a composite view of talent competitiveness applicable to a large number of countries (132 this year). Although a number of composite indices concern-ing skills, talent, and human capital have been developed in re-cent years, both private and public players in the field see the need for a neutral, global, and respected index that would en-able them to assess the effectiveness of talent-related policies and practices, identify priorities for action in relevant areas, and inform international and local debate in this arena.
The Structure of the GTCI ModelIn the context of the GTCI, talent competitiveness refers to the set of policies and practices that enable a country to develop, attract, and empower the human capital that contributes to productivity
GLOBAL TALENT IN THE AGE OF ARTIFICIAL INTELLIGENCE
THE GLOBAL TALENT COMPETITIVENESS INDEX 2020 9
CHAPTER 1

and prosperity. The GTCI is an Input-Output model (see Figure 5) in the sense that it combines an assessment of what countries do to produce and acquire talents (Input) and the kind of skills that are available to them as a result (Output). Feedback received on previous editions, additional research, and the availability of new data have allowed refinements to the model, though its basic structure is robust and unchanged.
The Input pillars of the GTCI are inspired by the Attract-Grow-Retain framework used by corporations to steer talent management. Multinational corporations frame talent man-agement in these terms, defining talent management as an organisation’s efforts to attract, select, develop, and retain talented employees to meet their strategic needs.21 The GTCI focuses on efforts by countries and thus the model is fed by macroeconomic and country-level variables. Attracting talent, in the context of national competitiveness, should be viewed in terms of luring foreign valuable resources, both productive businesses (through foreign direct investment and the like) and creative people (through high-skilled migration), while in-ternal attraction is focused on removing barriers to entering the talent pool for groups such as those from underprivileged backgrounds, women, and non-native people. Growing talent has traditionally meant education, but its definition should be broadened to include apprenticeships, training, and continuous education as well as experience and access to growth oppor-tunities (although we may acknowledge that most skill devel-opment occurs through experience, much remains to be done to conceptualise and measure its role). The more talented the person, the wider the global opportunities he or she can find elsewhere. Retaining talent is thus necessary to ensure sustain-ability, and one of the main components of retention is quality of life. In addition, the regulatory, market, business, and labour land-scapes within a country facilitate or impede talent attraction and growth; the GTCI classifies these elements as parts of the Enable pillar. Together, Enable, Attract, Grow, and Retain constitute the four Input pillars of the GTCI model.
Regarding Output, the GTCI differentiates between two levels of talent, which can be broadly thought of as mid-level and high-level skills. Mid-level skills, labelled Vocational and Technical Skills (or VT Skills), describes skills that have a technical or professional base acquired through vocational or professional training and experience. The impact of VT Skills is measured by the degree of employability to which they lead. Employability is measured by indicators of skills gaps and labour market mis-matches and by the adequacy of education systems. High-level skills, labelled Global Knowledge Skills (or GK Skills), deal with knowledge workers in professional, managerial, or leadership roles that require creativity and problem solving. Their economic impact is evaluated by indicators of innovation, entrepreneur-ship, and the development of high-value industries. Together, VT Skills and GK Skills constitute the two Output pillars of the GTCI model.
The GTCI attempts to offer an approach to talent competi-tiveness issues that is comprehensive, action-oriented, analytical, and practical. As described earlier, the GTCI is a composite index, relying on a simple but robust Input-Output model, composed
of six pillars (four on the Input side and two on the Output side), as illustrated in Figure 5. As such, the GTCI generates three main indices that are the most visible focus for analysis, namely:
1. The Talent Competitiveness Input sub-index, which is composed of four pillars describing the policies, resources, and efforts that a particular country can harness to foster its talent competitiveness. Enable (Pillar 1) reflects the extent to which the regulatory and business environment—in-cluding issues about competition, management practices, and the functioning of labour markets—create a favoura-ble climate for talent to develop and thrive. The other three pillars describe the three levers of talent competitiveness, which focus respectively on what countries are doing to Attract (Pillar 2), Grow (Pillar 3), and Retain (Pillar 4) talent. The Input sub-index is the simple arithmetic average of the scores registered on these four pillars.
2. The Talent Competitiveness Output sub-index, which aims to describe and measure the quality of talent in a country that results from the above policies, resources, and efforts. It is composed of two pillars describing the current situation of a particular country in terms of Vocational and Technical Skills (Pillar 5) and Global Knowledge Skills (Pillar 6). The Output sub-index is the simple arithmetic average of the scores obtained on these two pillars.
3. The Global Talent Competitiveness Index (GTCI), which is computed as the simple arithmetic average of the scores registered on each of the six pillars described above.
The GTCI model has been refined in this 2020 edition with respect to last year. In particular, four notable changes have been made. First, the variables Ease of hiring, Ease of redun-dancy, and Gender earnings gap included in GTCI 2019 have been dropped because of their weak explanatory power of the variation in GTCI scores—a point that has been made in previous Joint Research Centre (JRC) audits. Second, last year’s indicator Business-government relations has been dropped because it has not been updated since 2014 and is not slated for an update in the foreseeable future.
Third, a new conceptual component—Technology Adop-tion—has been created in the Business and Labour Landscape sub-pillar. This component consists of three variables: Technol-ogy utilisation (this is an old indicator that has been moved from the Market Landscape sub-pillar), Investment in emerging technologies (a new indicator), and Robot density (a new indica-tor). The Technology Adoption component aims to capture the extent to which countries are taking steps to be at the forefront of new technologies and, by implication, to develop talents as-sociated with AI, IoT, and so on. Fourth, four new variables have been introduced (in addition to the new Technology Adoption indicators): Rule of law adds another dimension to the strength of institutions in the Regulatory Landscape sub-pillar, Urbanisa-tion reflects the positive impact that cities can have on growth and human capital formation (Market Landscape sub-pillar),
GLOBAL TALENT IN THE AGE OF ARTIFICIAL INTELLIGENCECHAPTER 1
10 THE GLOBAL TALENT COMPETITIVENESS INDEX 2020

Unemployment with advanced education provides a measure of how supportive the enabling environment is for fostering higher skills, and Gender development gap increases the scope of the Gender Equality component in that it covers gender differences in health and knowledge as well as gender income differences (which was the sole focus of the dropped Gender earnings gap indicator).
This year’s model includes a total of 70 variables, up from 68 indicators used in the GTCI 2019. Country coverage has also increased—from 125 to 132 countries—representing 97% of the world’s GDP and 94% of its population. The audit carried out by the JRC of the European Commission (see Chapter 6) has confirmed that the changes introduced in the model have improved its accuracy, while maintaining its solidity and robust-ness. Further details of the variable definitions and the method of calculation can be found in the Sources and Definitions and Technical Notes sections in the Appendices. Improvements will continue to be made to the GTCI model in the future, based on further discussions with academics and business and govern-ment leaders, as well as feedback from users of the GTCI.
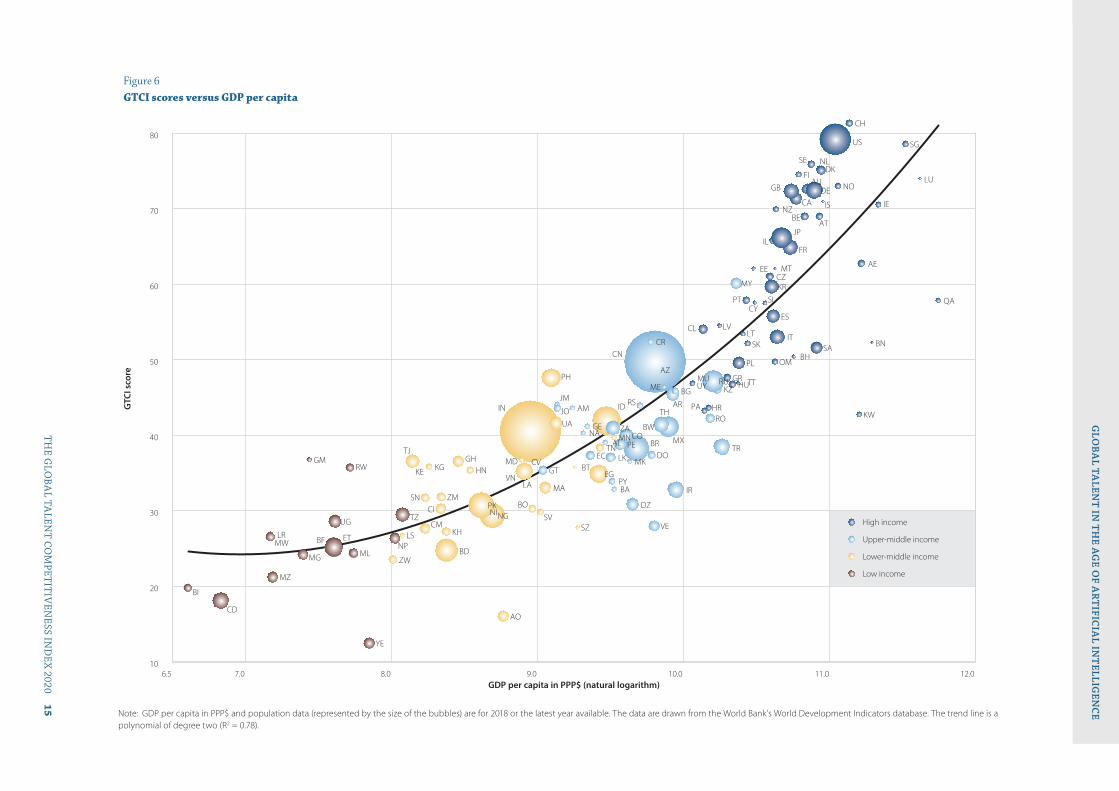
GLOBAL TALENT COMPETITIVENESS INDEX 2020: MAIN FINDINGSThe top positions in the ranking of the GTCI scores continue to be dominated by developed, high-income countries (see Table 1 on pages 12–14), and there is a high correlation be-tween GDP per capita and GTCI scores (see Figure 6 on pages
15–16. The Statistical Annex to this chapter presents more detailed information on country performance for the different sub-pillars and variables. European countries continue to domi-nate the GTCI rankings; 17 of them are in the top 25. Switzerland maintains its position at the top again this year, followed by the United States and Singapore. The other non-European counties that make the top 25 are Australia, Canada, New Zealand, Japan, Israel, and the United Arab Emirates.
An assessment of the top 15 countries in this ranking can be found in the Statistical Annex, along with an analysis and com-mentary on performances in the GTCI by income group and by region.
LONGER-TERM TRENDS IN TALENT COMPETITIVENESSLast year’s report included the first time-series analysis of GTCI data in order to assess how talent competitiveness is changing globally. Two main conclusions were drawn. First, that talent in-equalities appear to be broadening, as reflected by a widening gap between the talent champions and the rest. Second, that more talent competitive countries are, in general, more stable in their performances than countries lower down the rankings. Both these takeaways remain just as valid in this year’s updated analysis.
The approach used to analyse the time-series is unchanged from last year. It is based on comparing performances in the GTCI over two three-year periods: 2015–2017 against 2018–2020.22
Figure 5The GTCI 2020 model
Global Talent Competitiveness Index
(GTCI)
Input Output
AttractEnable Grow RetainGK
SkillsVT
Skills
Regulatory Landscape
Market Landscape
Business and Labour Landscape
External Openness
Internal Openness
Formal Education
Lifelong Learning
Access to Growth
Opportunities
High-Level Skills
Talent Impact
Sustainability
Lifestyle
Mid-Level Skills
Employability
Note: GK Skills = Global Knowledge Skills; VT Skills = Vocational and Technical Skills.
GLOBAL TALENT IN THE AGE OF ARTIFICIAL INTELLIGENCE
THE GLOBAL TALENT COMPETITIVENESS INDEX 2020 11
CHAPTER 1
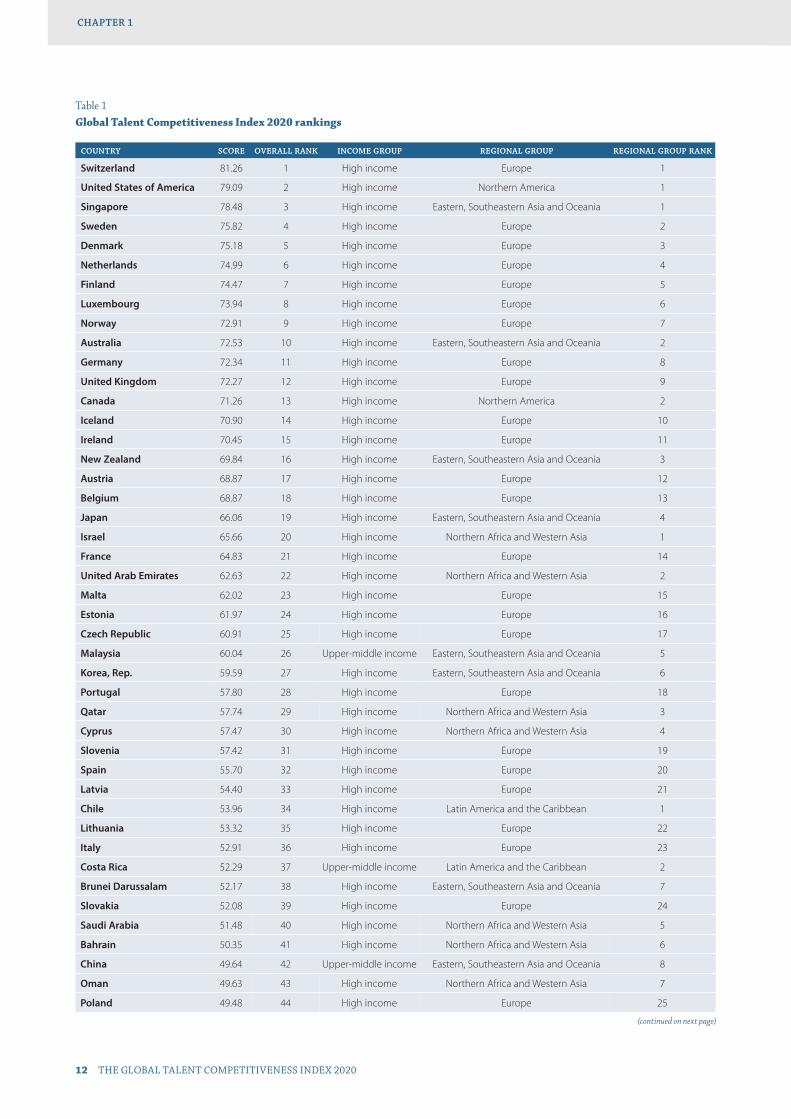
Table 1Global Talent Competitiveness Index 2020 rankings
COUNTRY SCORE OVERALL RANK INCOME GROUP REGIONAL GROUP REGIONAL GROUP RANK
Switzerland 81.26 1 High income Europe 1
United States of America 79.09 2 High income Northern America 1
Singapore 78.48 3 High income Eastern, Southeastern Asia and Oceania 1
Sweden 75.82 4 High income Europe 2
Denmark 75.18 5 High income Europe 3
Netherlands 74.99 6 High income Europe 4
Finland 74.47 7 High income Europe 5
Luxembourg 73.94 8 High income Europe 6
Norway 72.91 9 High income Europe 7
Australia 72.53 10 High income Eastern, Southeastern Asia and Oceania 2
Germany 72.34 11 High income Europe 8
United Kingdom 72.27 12 High income Europe 9
Canada 71.26 13 High income Northern America 2
Iceland 70.90 14 High income Europe 10
Ireland 70.45 15 High income Europe 11
New Zealand 69.84 16 High income Eastern, Southeastern Asia and Oceania 3
Austria 68.87 17 High income Europe 12
Belgium 68.87 18 High income Europe 13
Japan 66.06 19 High income Eastern, Southeastern Asia and Oceania 4
Israel 65.66 20 High income Northern Africa and Western Asia 1
France 64.83 21 High income Europe 14
United Arab Emirates 62.63 22 High income Northern Africa and Western Asia 2
Malta 62.02 23 High income Europe 15
Estonia 61.97 24 High income Europe 16
Czech Republic 60.91 25 High income Europe 17
Malaysia 60.04 26 Upper-middle income Eastern, Southeastern Asia and Oceania 5
Korea, Rep. 59.59 27 High income Eastern, Southeastern Asia and Oceania 6
Portugal 57.80 28 High income Europe 18
Qatar 57.74 29 High income Northern Africa and Western Asia 3
Cyprus 57.47 30 High income Northern Africa and Western Asia 4
Slovenia 57.42 31 High income Europe 19
Spain 55.70 32 High income Europe 20
Latvia 54.40 33 High income Europe 21
Chile 53.96 34 High income Latin America and the Caribbean 1
Lithuania 53.32 35 High income Europe 22
Italy 52.91 36 High income Europe 23
Costa Rica 52.29 37 Upper-middle income Latin America and the Caribbean 2
Brunei Darussalam 52.17 38 High income Eastern, Southeastern Asia and Oceania 7
Slovakia 52.08 39 High income Europe 24
Saudi Arabia 51.48 40 High income Northern Africa and Western Asia 5
Bahrain 50.35 41 High income Northern Africa and Western Asia 6
China 49.64 42 Upper-middle income Eastern, Southeastern Asia and Oceania 8
Oman 49.63 43 High income Northern Africa and Western Asia 7
Poland 49.48 44 High income Europe 25
(continued on next page)
GLOBAL TALENT IN THE AGE OF ARTIFICIAL INTELLIGENCECHAPTER 1
12 THE GLOBAL TALENT COMPETITIVENESS INDEX 2020
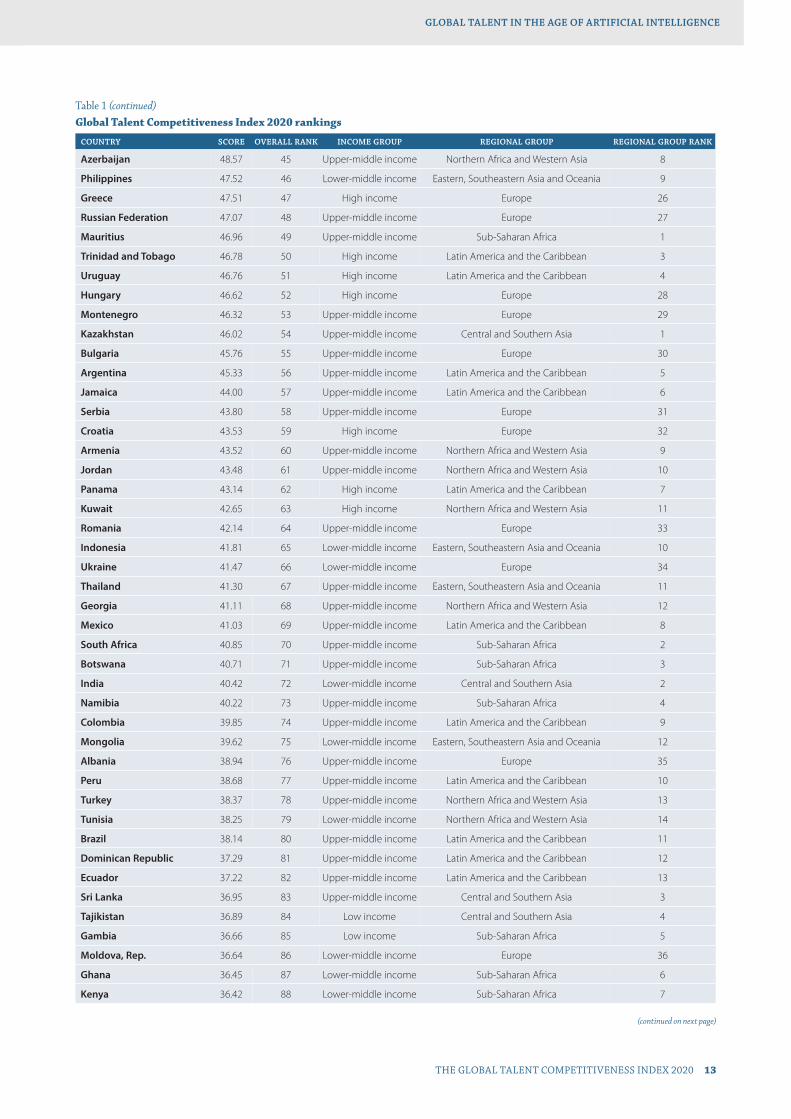
Table 1 (continued)Global Talent Competitiveness Index 2020 rankings
COUNTRY SCORE OVERALL RANK INCOME GROUP REGIONAL GROUP REGIONAL GROUP RANK
Azerbaijan 48.57 45 Upper-middle income Northern Africa and Western Asia 8
Philippines 47.52 46 Lower-middle income Eastern, Southeastern Asia and Oceania 9
Greece 47.51 47 High income Europe 26
Russian Federation 47.07 48 Upper-middle income Europe 27
Mauritius 46.96 49 Upper-middle income Sub-Saharan Africa 1
Trinidad and Tobago 46.78 50 High income Latin America and the Caribbean 3
Uruguay 46.76 51 High income Latin America and the Caribbean 4
Hungary 46.62 52 High income Europe 28
Montenegro 46.32 53 Upper-middle income Europe 29
Kazakhstan 46.02 54 Upper-middle income Central and Southern Asia 1
Bulgaria 45.76 55 Upper-middle income Europe 30
Argentina 45.33 56 Upper-middle income Latin America and the Caribbean 5
Jamaica 44.00 57 Upper-middle income Latin America and the Caribbean 6
Serbia 43.80 58 Upper-middle income Europe 31
Croatia 43.53 59 High income Europe 32
Armenia 43.52 60 Upper-middle income Northern Africa and Western Asia 9
Jordan 43.48 61 Upper-middle income Northern Africa and Western Asia 10
Panama 43.14 62 High income Latin America and the Caribbean 7
Kuwait 42.65 63 High income Northern Africa and Western Asia 11
Romania 42.14 64 Upper-middle income Europe 33
Indonesia 41.81 65 Lower-middle income Eastern, Southeastern Asia and Oceania 10
Ukraine 41.47 66 Lower-middle income Europe 34
Thailand 41.30 67 Upper-middle income Eastern, Southeastern Asia and Oceania 11
Georgia 41.11 68 Upper-middle income Northern Africa and Western Asia 12
Mexico 41.03 69 Upper-middle income Latin America and the Caribbean 8
South Africa 40.85 70 Upper-middle income Sub-Saharan Africa 2
Botswana 40.71 71 Upper-middle income Sub-Saharan Africa 3
India 40.42 72 Lower-middle income Central and Southern Asia 2
Namibia 40.22 73 Upper-middle income Sub-Saharan Africa 4
Colombia 39.85 74 Upper-middle income Latin America and the Caribbean 9
Mongolia 39.62 75 Lower-middle income Eastern, Southeastern Asia and Oceania 12
Albania 38.94 76 Upper-middle income Europe 35
Peru 38.68 77 Upper-middle income Latin America and the Caribbean 10
Turkey 38.37 78 Upper-middle income Northern Africa and Western Asia 13
Tunisia 38.25 79 Lower-middle income Northern Africa and Western Asia 14
Brazil 38.14 80 Upper-middle income Latin America and the Caribbean 11
Dominican Republic 37.29 81 Upper-middle income Latin America and the Caribbean 12
Ecuador 37.22 82 Upper-middle income Latin America and the Caribbean 13
Sri Lanka 36.95 83 Upper-middle income Central and Southern Asia 3
Tajikistan 36.89 84 Low income Central and Southern Asia 4
Gambia 36.66 85 Low income Sub-Saharan Africa 5
Moldova, Rep. 36.64 86 Lower-middle income Europe 36
Ghana 36.45 87 Lower-middle income Sub-Saharan Africa 6
Kenya 36.42 88 Lower-middle income Sub-Saharan Africa 7
(continued on next page)
GLOBAL TALENT IN THE AGE OF ARTIFICIAL INTELLIGENCE
THE GLOBAL TALENT COMPETITIVENESS INDEX 2020 13
CHAPTER 1
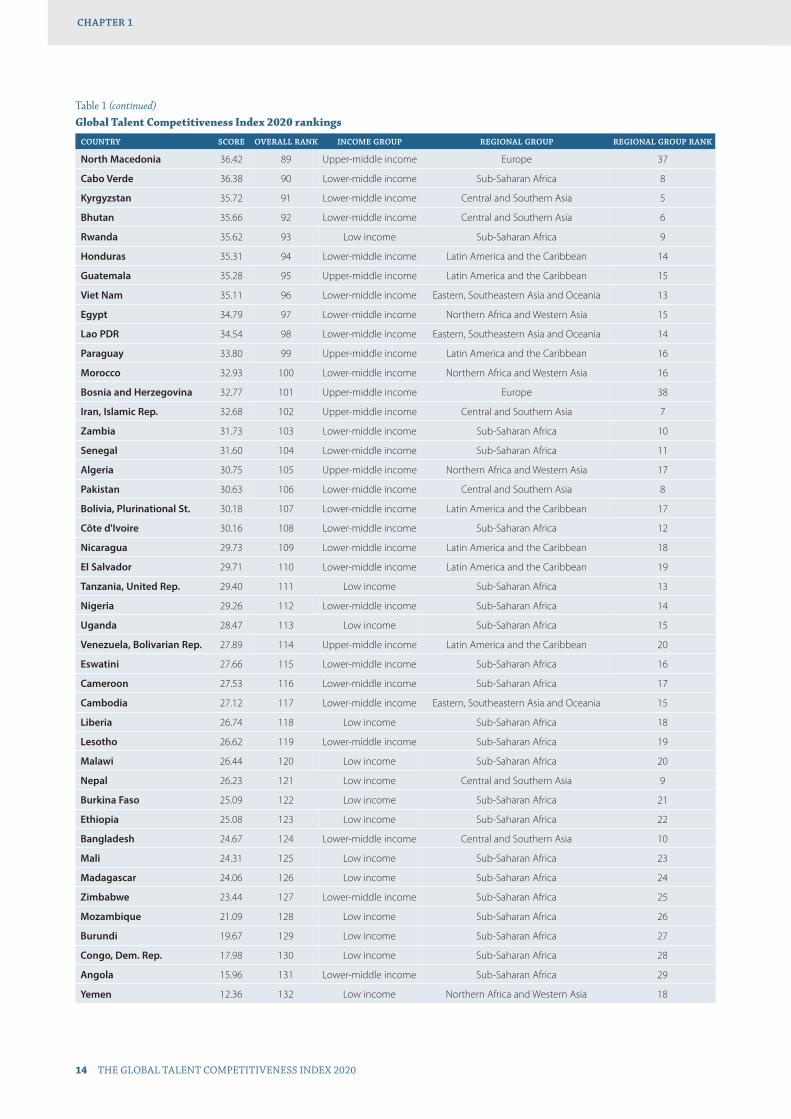
Table 1 (continued)Global Talent Competitiveness Index 2020 rankings
COUNTRY SCORE OVERALL RANK INCOME GROUP REGIONAL GROUP REGIONAL GROUP RANK
North Macedonia 36.42 89 Upper-middle income Europe 37
Cabo Verde 36.38 90 Lower-middle income Sub-Saharan Africa 8
Kyrgyzstan 35.72 91 Lower-middle income Central and Southern Asia 5
Bhutan 35.66 92 Lower-middle income Central and Southern Asia 6
Rwanda 35.62 93 Low income Sub-Saharan Africa 9
Honduras 35.31 94 Lower-middle income Latin America and the Caribbean 14
Guatemala 35.28 95 Upper-middle income Latin America and the Caribbean 15
Viet Nam 35.11 96 Lower-middle income Eastern, Southeastern Asia and Oceania 13
Egypt 34.79 97 Lower-middle income Northern Africa and Western Asia 15
Lao PDR 34.54 98 Lower-middle income Eastern, Southeastern Asia and Oceania 14
Paraguay 33.80 99 Upper-middle income Latin America and the Caribbean 16
Morocco 32.93 100 Lower-middle income Northern Africa and Western Asia 16
Bosnia and Herzegovina 32.77 101 Upper-middle income Europe 38
Iran, Islamic Rep. 32.68 102 Upper-middle income Central and Southern Asia 7
Zambia 31.73 103 Lower-middle income Sub-Saharan Africa 10
Senegal 31.60 104 Lower-middle income Sub-Saharan Africa 11
Algeria 30.75 105 Upper-middle income Northern Africa and Western Asia 17
Pakistan 30.63 106 Lower-middle income Central and Southern Asia 8
Bolivia, Plurinational St. 30.18 107 Lower-middle income Latin America and the Caribbean 17
Côte d'Ivoire 30.16 108 Lower-middle income Sub-Saharan Africa 12
Nicaragua 29.73 109 Lower-middle income Latin America and the Caribbean 18
El Salvador 29.71 110 Lower-middle income Latin America and the Caribbean 19
Tanzania, United Rep. 29.40 111 Low income Sub-Saharan Africa 13
Nigeria 29.26 112 Lower-middle income Sub-Saharan Africa 14
Uganda 28.47 113 Low income Sub-Saharan Africa 15
Venezuela, Bolivarian Rep. 27.89 114 Upper-middle income Latin America and the Caribbean 20
Eswatini 27.66 115 Lower-middle income Sub-Saharan Africa 16
Cameroon 27.53 116 Lower-middle income Sub-Saharan Africa 17
Cambodia 27.12 117 Lower-middle income Eastern, Southeastern Asia and Oceania 15
Liberia 26.74 118 Low income Sub-Saharan Africa 18
Lesotho 26.62 119 Lower-middle income Sub-Saharan Africa 19
Malawi 26.44 120 Low income Sub-Saharan Africa 20
Nepal 26.23 121 Low income Central and Southern Asia 9
Burkina Faso 25.09 122 Low income Sub-Saharan Africa 21
Ethiopia 25.08 123 Low income Sub-Saharan Africa 22
Bangladesh 24.67 124 Lower-middle income Central and Southern Asia 10
Mali 24.31 125 Low income Sub-Saharan Africa 23
Madagascar 24.06 126 Low income Sub-Saharan Africa 24
Zimbabwe 23.44 127 Lower-middle income Sub-Saharan Africa 25
Mozambique 21.09 128 Low income Sub-Saharan Africa 26
Burundi 19.67 129 Low income Sub-Saharan Africa 27
Congo, Dem. Rep. 17.98 130 Low income Sub-Saharan Africa 28
Angola 15.96 131 Lower-middle income Sub-Saharan Africa 29
Yemen 12.36 132 Low income Northern Africa and Western Asia 18
GLOBAL TALENT IN THE AGE OF ARTIFICIAL INTELLIGENCECHAPTER 1
14 THE GLOBAL TALENT COMPETITIVENESS INDEX 2020
GTC
I sco
re
High income
Upper-middle income
Lower-middle income
Low income
6.5 7.0 8.0 9.0 10.0 11.0 12.010
20
30
40
50
60
70
80
AE
AL
AM
AO
AR
BG
AT
AU
AZ
BA
BD
BE
BF
BH
BI
BN
BO
BR
BT
BW
CA
CD
CH
CI
CL
CM
CN
CO
CR
CV
CY
CZ
DE
DK
DO
DZ
EC
EE
EG
ES
ET
FI
FR
GB
GE
GHGM
GR
GTHN
HR
HU
ID
IE
IL
IN
IR
IS
IT
JM
JO
JP
KE KG
KH
KR
KW
KZ
LAVN
LK
LR LS
LT
LU
LV
MA
MD
ME
MG
MK
ML
MN
MT
MU
MW
MX
MY
MZ
NA
NGNI
NL
NO
NP
NZ
OM
PA
PE
PH
PK
PL
PT
PY
QA
RO
RS
RU
RW
SA
SE
SG
SI
SK
SN
SVSZ
TH
TJ TN TR
TT
TZ
UA
UG
US
UY
VE
YE
ZA
ZM
ZW
Figure 6GTCI scores versus GDP per capita
GDP per capita in PPP$ (natural logarithm)
Note: GDP per capita in PPP$ and population data (represented by the size of the bubbles) are for 2018 or the latest year available. The data are drawn from the World Bank’s World Development Indicators database. The trend line is a polynomial of degree two (R2 = 0.78).
GLO
BA
L TALEN
T IN T
HE A
GE O
F AR
TIFIC
IAL IN
TELLIG
ENC
E
TH
E GLO
BA
L TALEN
T CO
MPET
ITIV
ENESS IN
DE
X 2020 15
CH
AP
TER
1

Figure 6 (continued)GTCI scores versus GDP per capita: ISO-2 country codes
CODE COUNTRY
AE United Arab Emirates
AL Albania
AM Armenia
AO Angola
AR Argentina
AT Austria
AU Australia
AZ Azerbaijan
BA Bosnia and Herzegovina
BD Bangladesh
BE Belgium
BF Burkina Faso
BG Bulgaria
BH Bahrain
BI Burundi
BN Brunei Darussalam
BO Bolivia, Plurinational St.
BR Brazil
BT Bhutan
BW Botswana
CA Canada
CD Congo, Dem. Rep.
CH Switzerland
CI Côte d'Ivoire
CL Chile
CM Cameroon
CN China
CODE COUNTRY
CO Colombia
CR Costa Rica
CV Cabo Verde
CY Cyprus
CZ Czech Republic
DE Germany
DK Denmark
DO Dominican Republic
DZ Algeria
EC Ecuador
EE Estonia
EG Egypt
ES Spain
ET Ethiopia
FI Finland
FR France
GB United Kingdom
GE Georgia
GH Ghana
GM Gambia
GR Greece
GT Guatemala
HN Honduras
HR Croatia
HU Hungary
ID Indonesia
IE Ireland
CODE COUNTRY
IL Israel
IN India
IR Iran, Islamic Rep.
IS Iceland
IT Italy
JM Jamaica
JO Jordan
JP Japan
KE Kenya
KG Kyrgyzstan
KH Cambodia
KR Korea, Rep.
KW Kuwait
KZ Kazakhstan
LA Lao PDR
LK Sri Lanka
LR Liberia
LS Lesotho
LT Lithuania
LU Luxembourg
LV Latvia
MA Morocco
MD Moldova, Rep.
ME Montenegro
MG Madagascar
MK North Macedonia
ML Mali
CODE COUNTRY
MN Mongolia
MT Malta
MU Mauritius
MW Malawi
MX Mexico
MY Malaysia
MZ Mozambique
NA Namibia
NG Nigeria
NI Nicaragua
NL Netherlands
NO Norway
NP Nepal
NZ New Zealand
OM Oman
PA Panama
PE Peru
PH Philippines
PK Pakistan
PL Poland
PT Portugal
PY Paraguay
QA Qatar
RO Romania
RS Serbia
RU Russian Federation
RW Rwanda
CODE COUNTRY
SA Saudi Arabia
SE Sweden
SG Singapore
SI Slovenia
SK Slovakia
SN Senegal
SV El Salvador
SZ Eswatini
TH Thailand
TJ Tajikistan
TN Tunisia
TR Turkey
TT Trinidad and Tobago
TZ Tanzania, United Rep.
UA Ukraine
UG Uganda
US United States of America
UY Uruguay
VE Venezuela, Bolivarian Rep.
VN Viet Nam
YE Yemen
ZA South Africa
ZM Zambia
ZW Zimbabwe
GLO
BA
L TALEN
T IN T
HE A
GE O
F AR
TIFIC
IAL IN
TELLIG
ENC
EC
HA
PT
ER 1
16 T
HE G
LOB
AL TA
LENT C
OM
PETIT
IVEN
ESS IND
EX 2020

Focusing on these two averages leads to several advantages. For instance, it can make it easier to spot general trends that might be missed in a year-by-year analysis. In addition, it allows for some smoothing of annual fluctuations in the data that, in turn, results in more reliable conclusions. Related to this is that the aggregation absorbs year-to-year changes because of improve-ments in the methodology of GTCI.23
Only countries that feature in all of the most recent six GTCI reports are included in the analysis: all in all, 88 countries. Of these, 41 are high-income countries, 28 are upper-middle-income countries, 17 are lower-middle-income countries, and 2 are low-income countries. The regional breakdown, meanwhile, is the following: 7 are in Central and Southern Asia; 13 in Eastern, Southeastern Asia and Oceania; 33 in Europe; 16 in Latin America and the Caribbean; 11 in Northern Africa and Western Asia; 2 in Northern America; and 6 in Sub-Saharan Africa.
The calculation of the averages of the two three-year peri-ods is based on the GTCI scores that the countries have achieved. More specifically, the calculation comprises two simple steps: (1) averaging overall GTCI scores for 2015–2017 and 2018–2020, respectively, and (2) computing country rankings based on the resulting averages. The advantage of this approach is that it is straightforward and yields distinct rankings for each country. The drawback is that the scores are not necessarily fully comparable from one year to the next because of changes in data or meth-odological improvements. An alternative approach that does not suffer from this drawback would be to calculate the aver-ages based on relative rankings rather than absolute scores. That is, rankings for the 88 countries would first be computed for each single year before being averaged across the two three-year pe-riods. These averages would then form the basis for the rankings of 2015–2017 and 2018–2020, respectively.24 However, a problem with this approach is that it yields many ties (i.e., two or more countries with the same ranking), which makes the analysis less clear. In the end, therefore, the results presented in this section stem from an analysis based on the first approach, while the sec-ond approach is used to corroborate the findings.
Of Talent Champions, Movers, Limpers, and LaggardsFigure 7 depicts visually how the relative positions of countries in the GTCI have changed in the two periods 2015–2017 and 2018–2020. The left-hand and right-hand columns of the figure rank the countries according to their GTCI scores in the earlier and latter periods, respectively. Hence, an upward (downward) slope implies an improvement (deterioration) in the ranking over the two periods, which in turn suggests strengthening (weakening) talent competitiveness.
Each of the five top-ranked countries for the period 2018–2020 either retained its position or improved it over the earlier three-year period. The three countries that follow—Finland, Norway, and the Netherlands—appear to have strengthened their talent competitiveness, while the opposite seems to hold for the last two countries in the top 10, the United Kingdom and Luxembourg.
Figure 7GTCI rankings in 2015–2017 and 2018–2020
Note: Colours refer to income groups, which range from dark blue (high income) to light blue (upper-middle income), light brown (lower-middle income), and dark brown (low income).
2015–2017
Switzerland 1 Singapore 2 Luxembourg 3 United States 4 Sweden 5 UK 6 Denmark 7 Canada 8 Australia 9 Norway 10 Netherlands 11 Finland 12 Ireland 13 New Zealand 14 Germany 15 Austria 16 Iceland 17 Belgium 18 Japan 19 Estonia 20 Czechia 21 UAE 22 France 23 Qatar 24 Israel 25 Slovenia 26 Latvia 27 South Korea 28 Malaysia 29 Chile 30 Slovakia 31 Portugal 32 Spain 33 Lithuania 34 Hungary 35 Poland 36 Costa Rica 37 Italy 38 Saudi Arabia 39 Croatia 40 Bulgaria 41 Greece 42 Uruguay 43 Panama 44 China 45 Kazakhstan 46 Philippines 47 Russia 48 Romania 49 Armenia 50 South Africa 51 Turkey 52 Colombia 53 Argentina 54 Azerbaijan 55 Mexico 56 Mongolia 57 Brazil 58 Botswana 59 Thailand 60 Moldova 61 Ukraine 62 Tunisia 63 Peru 64 Ecuador 65Dominican Rep. 66 Namibia 67 Guatemala 68 Albania 69 Kyrgyzstan 70 Viet Nam 71 Sri Lanka 72 El Salvador 73 Nicaragua 74 Egypt 75 India 76 Paraguay 77 Indonesia 78 Morocco 79 Venezuela 80 Iran 81 Cambodia 82 Ghana 83 Uganda 84 Bangladesh 85 Pakistan 86 Algeria 87 Madagascar 88
2018–2020
1 Switzerland 2 Singapore 3 United States 4 Sweden 5 Denmark 6 Finland 7 Norway 8 Netherlands 9 UK10 Luxembourg11 Australia12 New Zealand13 Iceland14 Ireland15 Canada16 Germany17 Belgium18 Austria19 UAE20 Israel21 Japan22 France23 Estonia24 Czechia25 Qatar26 Malaysia27 South Korea28 Portugal29 Slovenia30 Spain31 Chile32 Lithuania33 Latvia34 Costa Rica35 Italy36 Slovakia37 Saudi Arabia38 Poland39 China40 Greece41 Uruguay42 Azerbaijan43 Russia44 Bulgaria45 Hungary46 Panama47 Philippines48 Kazakhstan49 Croatia50 Argentina51 Armenia52 Ukraine53 Botswana54 Romania55 South Africa56 Thailand57 Colombia58 Indonesia59 Mexico60 Turkey61 Brazil62 Mongolia63 Albania64 Namibia65 Peru66 India67 Tunisia68 Sri Lanka69 Dominican Rep.70 Ecuador71 Moldova72 Guatemala73 Viet Nam74 Ghana75 Kyrgyzstan76 Iran77 Paraguay78 Egypt79 Morocco80 Algeria81 El Salvador82 Nicaragua83 Pakistan84 Uganda85 Venezuela86 Cambodia87 Bangladesh88 Madagascar
GLOBAL TALENT IN THE AGE OF ARTIFICIAL INTELLIGENCE
THE GLOBAL TALENT COMPETITIVENESS INDEX 2020 17
CHAPTER 1

One of the two key messages last year was, as mentioned above, that countries’ positions over the two three-year peri-ods tend to fluctuate more at lower rankings. Indeed, as one’s eyes move from top to bottom of the slope graph in Figure 7, it seems as if the criss-crosses become increasingly pronounced. For instance, it can be seen that seven of the top 10 countries in 2015–2017 were also in the top 10 in 2018–2020, which is the high-est share of any of the following 10-country groups (i.e., 11–20, 21–30, etc.). This impression is corroborated by an analysis of the frequency and magnitudes of changes in rankings within vari-ous percentiles.
Figure 7 shows how relative positions over the two three-year periods have changed, but it does not provide any infor-mation about how scores have evolved. Figure 8 does so by showing two aspects of each country’s scores: (1) the change (in percent) of its average GTCI scores from 2015–2017 to 2018–2020 and (2) what score it achieved in this year’s ranking. Plotting this information shows how countries fare against a combined benchmark of zero change for the two three-year periods and of the average 2020 score (49.9) for this set of countries. The re-sulting four quadrants are meant to indicate whether a country
is primarily a talent champion (with an improved score over the two periods and a high score in the GTCI 2020), a talent mover (an improved score over time, but a low score this year), a talent limper (a worsened score over time, but a high score this year), or a talent laggard (a worsened score over time and a low score this year).
As can be seen in the scatter plot (Figure 8), most high-income countries are talent champions. Even countries such as Ireland and Luxembourg—which have fallen in the rankings over the two periods—have achieved improved GTCI scores, albeit at a lower rate than other leading countries. Most upper-middle-income countries are considered to be talent laggards even if a few of them are placed in the talent mover quadrant, and two—Malaysia and Costa Rica—are regarded as talent cham-pions. Similarly, the majority of lower-middle-income countries are found in the talent laggards’ quadrant. The two low-income countries—Madagascar and Uganda—are deemed talent lag-gards, although there are several countries from the other three income groups that have seen their scores worsen over the two three-year periods.
Figure 8Change in scores for 2015–2017 vs 2018–2020 and GTCI 2020 score
GTCI 2020 score
Chan
ge in
per
cent
20 30 40 50 60 70 80
Movers
Laggards
Champions
Limpers
20
15
10
5
0
–5
–10
–15
–20
–25
USCH
SG
CA
MY
CR
LV
SK
AZ
CN
RUAR
ID
INGH
DZ
PLPA
ZAHR
HUMD
NISV
BD
KHVE
UG
MG BR
High income Low income Lower-middle income Upper-middle income
Average GTCI 2020 score: 49.9
Note: A complete ISO-2 country code key can be found as part of Figure 6, page 16.
GLOBAL TALENT IN THE AGE OF ARTIFICIAL INTELLIGENCECHAPTER 1
18 THE GLOBAL TALENT COMPETITIVENESS INDEX 2020

Figure 9GTCI scores in 2015–2017 and 2018–2020 by income group
Note: Narrow bars indicate maximum and minimum values; wide bars indicate 25th, 50th, and 75th percentiles. Black bars indicate 2015–2017 values and blue bars indicate 2018–2020 values. There are only two low-income countries in the analysis, so that income group has been excluded.
0
20
40
60
80
100
High income Upper-middle income Lower-middle income
Minimum
Maximum
25th percentile
Median
75th percentile
■ 2015–2017■ 2018–2020
The pacesetter over the two periods is Indonesia, a lower-middle-income country that has seen improvements in all pillars but Global Knowledge Skills. Two other impressive lower-middle-income talent movers in the time period under discussion are Ghana and India, where the former country has benefited from improved showings in the pillars related to Attract and VT Skills and the latter has primarily enjoyed a boost in scores concerning the Grow, Retain, and VT Skills dimensions. Two lower-middle-income countries that stand in stark contrast to these talent movers are El Salvador and Nicaragua: They are talent laggards with average scores that are more than 20% lower in 2018–2020. Both countries experienced lower scores in each of the six pillars.
The two upper-middle-income countries that are regarded as talent champions—Costa Rica and Malaysia—have both im-proved their ability to retain talent and their pools of VT Skills. Malaysia has also strengthened its scores in the Attract pillar. China, which is almost as much a talent champion as a talent mover, has primarily been boosted by better showings in the Grow and Retain pillars. The worst-performing upper-middle-income country is Venezuela, which has primarily suffered from a worsening ability to enable and attract talent.
Most high-income countries are talent champions, includ-ing the top 3 of Switzerland, the United States, and Singapore, which saw their average scores over the two time periods grow by close to 10% or more. Four high-income countries fall into the talent laggards category: Croatia, Hungary, Panama, and Poland. They all have in common disappointing results in the Output-related pillars—that is, VT Skills and GK Skills. Hungary has seen the worst drop in overall scores (almost 14%), as performances have worsened in each pillar.
An Ever-Widening Gap between Talent Champions and the Rest?In view of Figure 8 and the way the GTCI scores of many high-income countries have improved over the years, while the oppo-site seems to hold for most lower-income countries, it is only to be expected to see this reflected in an analysis of performances by income group. Figures 9 and 10 show that this is indeed the case by depicting the distributions of GTCI scores for the two three-year periods by income group and region, respectively.
In both figures, it is the groups with higher scores that have primarily improved their scores—at least at the 50th, 75th, and 100th percentiles. This is clearly the case in terms of income group, where high-income countries have a greater median score in the latter period, while the upper-middle-income and lower-middle-income groups have lower median scores (the group of low-income countries has been excluded because it includes only two countries). Similarly, the three highest-scoring regions—Eastern, Southeastern Asia and Oceania, Europe, and Northern America—have improved their median scores over the two periods, whereas Central and Southern Asia, Latin America and the Caribbean, and Northern Asia and Western Africa have seen their corresponding values decline. Some encouragement can be had from the higher median of the group of countries from Sub-Saharan Africa, although the other displayed percen-tiles have all worsened.
The upshot is that the gap between the talent champions and the rest of the countries is significant and, more worryingly, it seems to be on the increase. This was already highlighted in last year’s report, which attributed the widening gap to two op-posing trends: talent competitiveness strengthening in groups
GLOBAL TALENT IN THE AGE OF ARTIFICIAL INTELLIGENCE
THE GLOBAL TALENT COMPETITIVENESS INDEX 2020 19
CHAPTER 1

of countries where it is already comparatively high and weaken-ing in those where it is relatively low. In order to effectively ad-dress this growing gap, it will be imperative to see whether this trend continues in the near future. The GTCI time-series analysis will be an important part of assessing this.
As the GTCI time series continue to grow, their analysis will offer additional possibilities to deepen the initial approach of-fered here. Considering ways in which individual countries and groups have changed along specific pillars and variables of the GTCI model appears to be a particularly promising way to iden-tify trends as well as to draw additional policy conclusions about how the various components of talent competitiveness can be better fostered. This will remain a key objective of the GTCI re-port in coming years.
ENDNOTES 1 Lanvin & Evans, eds. (2017)
2 J. McCarthy et al., 31 August 1955, Dartmouth AI Project Proposal, available at https://www.livinginternet.com/i/ii_ai.htm
3 See Lanvin & Miroux (2019).
4 Biases can be expected from AI, however. This is likely to be the case when the algorithms on which it is based have been programmed by a specific group that is less diverse (culturally, technically, or philosophically) than the general population. It has been underlined, for example, that the relatively small number of female programmers involved in AI projects might create such biases. See, for example, Cairns (2019).
5 This is amply demonstrated by Daniel Kahneman and Amos Tversky (see Kahneman & Tversky 1979).
6 See https://www.tengai-unbiased.com/ai-robot-tengai-unbiased-first-independent-job-interview/
7 See Greenfield (2018).
8 Dramatic estimates provided by Eric Brynjolfsson and Andrew McAfee of the number of jobs threatened by automation and AI—see Brynjolfsson & McAfee (2014)—have been later mitigated by the OECD and others; see OECD (2018). Kai-Fu Lee has criticised both approaches as underestimating some ‘organic adaptation mechanisms’; see Lee (2018). All agree, however, that, whatever the angle chosen, the anticipated effects of AI on jobs will be quantitatively and qualitatively massive.
9 Roose (2019).
10 See Daugherty & Wilson (2018).
11 Daugherty & Wilson (2018), p. 191.
12 See Financial Times (2019).
13 For the French approach, see Villani (2018); for the European approach see Servoz (2018).
14 See Dutton (2018), as well as the National and International AI Strategies portal of the Future of Life institute, available at https://futureoflife.org/national-international-ai-strategies/
15 Interview to the New York Times (2019), https://www.nytimes.com/paidpost/imda/singapores-governing-framework-for-artificial-intelligence.html
16 Idem.
17 See the Talent Development portal on the AI Singapore website at https://www.aisingapore.org/talentdevelopment/
18 See Element AI (2019).
19 See Lee (2019).
20 Lee (2019), p. 91.
21 See Cappelli & Keller (2014); Stahl et al. (2012).
22 The years 2015, 2016, and 2017 refer to the results reported in The Global Talent Competitiveness Index 2014, The Global Talent Competitiveness Index 2015–16, and The Global Talent Competitiveness Index 2017, respectively.
Figure 10GTCI scores in 2015–2017 and 2018–2020 by regional group
Note: Narrow bars indicate maximum and minimum values; wide bars indicate 25th, 50th, and 75th percentiles (the figure for Northern America has only two bars because it contains only two countries: Canada and the United States).
0
20
40
60
80
100
Sub-SaharanAfrica
NorthernAmerica
Northern Africaand
Western Asia
Latin Americaand the
Caribbean
Europe Eastern,Southeastern Asia
and Oceania
Central andSouthern Asia
Minimum
Maximum
25th percentile
Median75th percentile
GLOBAL TALENT IN THE AGE OF ARTIFICIAL INTELLIGENCECHAPTER 1
20 THE GLOBAL TALENT COMPETITIVENESS INDEX 2020
The reason for the apparent year discrepancy is as follows. The GTCI reports are always printed towards the end of the calendar year. The first two editions of the GTCI referred to this in their titles (The Global Talent Competitiveness Index 2013 and The Global Talent Competitiveness Index 2014). However, because the launch of the report is held in January, a change was made in the third edition, whereby the title would refer to the launch year. Thus, the third edition became The Global Talent Competitiveness Index 2015–16; the three subsequent editions were entitled The Global Talent Competitiveness Index 2017, The Global Talent Competitiveness Index 2018, and The Global Talent Competitiveness Index 2019.
23 One caveat to the results discussed in this section is that the GTCI model has evolved over the years, with the possible implication that a score that changes from one year to the next might primarily be a reflection of a methodological adjustment rather than new data. This is less of a concern from the second GTCI edition onwards (which is analysed here), since the model has been become increasingly stable over the years. Moreover, this potential problem is addressed by the averaging of scores across three years (as it implies some smoothing of modifications to the GTCI model) and by focusing the analysis on aggregate overall GTCI scores (which entails a degree of cancelling-out effects).
24 More concretely, the country with the best average rank for a three-year period would be ranked 1st, the country with the next-best rank would be ranked 2nd, and so on.
REFERENCES AND FURTHER READINGSAlexandre, L. (2019). La guerre des intelligences: Comment l’intelligence artificielle va
révolutionner l’éducation. Paris: le Livre de poche.
Baldwin, R. (2019). The globotics upheaval: Globalisation, robotics and the future of work. London: Weidenfeld & Nicolson.
Brynjolfsson, E., & McAfee, A. (2014). The second machine age: Work, progress, and prosperity in a time of brilliant technologies. New York: Norton & Co.
Cairns, A. (2019). Why AI is failing the next generation of women. World Economic Forum Annual Meeting, available at https://www.weforum.org/agenda/2019/01/ai-artificial-intelligence-failing-next-generation-women-bias/
Cappelli, P. & Keller, J. R. (2014). Talent management: Conceptual approaches and practical challenges. Annual Review of Organisational Psychology and Organisational Behaviour, 1, 305–331.
Daugherty, P. R., & Wilson, H. J. (2018). Human + machine: Reimagining work in the age of AI. Boston, MA: Harvard Business Review Press.
Dutton, T. (2018), ‘An overview of national AI strategies’, posted and updated on Medium.com, available at https://medium.com/politics-ai/an-overview-of-national-ai-strategies-2a70ec6edfd
Element AI. (2019). 2019 global talent AI report, available at https://www.elementai.com/news/2019/2019-global-ai-talent-report
Financial Times. (2019). AI brings opportunity and risk to healthcare. Financial Times, 21 June 2019, available at https://www.ft.com/content/15a5c066-92b4-11e9-aea1-2b1d33ac3271
Future of Life Institute. (2019). ‘National and International AI Strategies’, https://futureoflife.org/national-international-ai-strategies/
Greenfield, B. (2018). Your salary hike is now based on next year’s performance, India Times, 10 July 2018, available at https://economictimes.indiatimes.com/articleshow/64922936.cms?from=mdr&utm_source=contentofinterest&utm_medium=text&utm_campaign=cppst
Kahneman, D., & Tversky, A. (1979). Prospect theory: An analysis of decision under risk. Econometrica 47(2), 263–291.
Kruse, K. (2018). In 2023 your boss will be a robot (and you will love her), Forbes, 28 November 2018, available at https://www.forbes.com/sites/kevinkruse/2018/11/28/your-boss-will-be-a-robot-and-you-will-love-her/#19a176633264
Lanvin, B., & Evans, P. (eds.) (2017). The global talent competitiveness index 2017: Talent and technology. Fontainebleau: INSEAD.
———. (2018). The global talent competitiveness index 2018: Diversity for competitiveness. Fontainebleau: INSEAD.
Lanvin, B., & Miroux, A. (2019). Deep learning vs human learning: How Artificial Intelligence will change the way we acquire and grow skills. In Human learning in the digital era, Paris: UNESCO Publishing, pp. 96–103, available at https://unesdoc.unesco.org/ark:/48223/pf0000367761
Lanvin, B., & Monteiro, F. (eds.) (2019). The global talent competitiveness index 2019: Entrepreneurial talent and global competitiveness. Fontainebleau: INSEAD.
Lee, K.-F. (2018). AI superpowers: China, Silicon Valley, and the new world order. Boston: Houghton Mifflin Harcourt.
Miailhe, N. (2018). The geopolitics of artificial intelligence: The return of empires? Politique étrangère 83(3), Autumn 2018.
New York Times. (2019). Singapore’s governing framework for Artificial Intelligence, interview, available at https://www.nytimes.com/paidpost/imda/singapores-governing-framework-for-artificial-intelligence.html
OECD (Organisation for Economic Co-operation and Development). (2018). Putting faces to the jobs at risk of automation, Policy Brief, March 2018, available at https://www.oecd.org/employment/Automation-policy-brief-2018.pdf
———. (2019). OECD Principles on AI, available at https://www.oecd.org/going-digital/ai/principles/
Perlas, N. (2018). Humanity’s last stand: The challenge of artificial intelligence: A spiritual-scientific response. Forest Row: Temple Lodge.
Roose, K. (2019). A machine may not take your job, but one could become your boss. The New York Times 23 June 2019, available at https://www.nytimes.com/2019/06/23/technology/artificial-intelligence-ai-workplace.html
Sejnowski, T. J. (2018). The deep learning revolution. Cambridge, MA: The MIT Press.
Servoz, M. (2018). The future of work? Work for the future! On how artificial intelligence, robotics and automation are transforming jobs and the economy in Europe, Report to the European Commission, available at https://ec.europa.eu/digital-single-market/en/news/future-work-work-future
Stahl, G. K., Björkman, I., Farndale, E., Morris, S.S., Paauwe, J., Stiles, P. & Wright, P. (2012). Six principles of effective global talent management. MIT Sloan Management Review, 53, 25–32.
Villani, C. (2018). Donner un sens à l’intelligence artificielle: Pour une stratégie nationale européenne. Paris: Rapport au Président de la République.
———. (2019). Immersion: De la science au Parlement. Paris: Flammarion.
GLOBAL TALENT IN THE AGE OF ARTIFICIAL INTELLIGENCE
THE GLOBAL TALENT COMPETITIVENESS INDEX 2020 21
CHAPTER 1

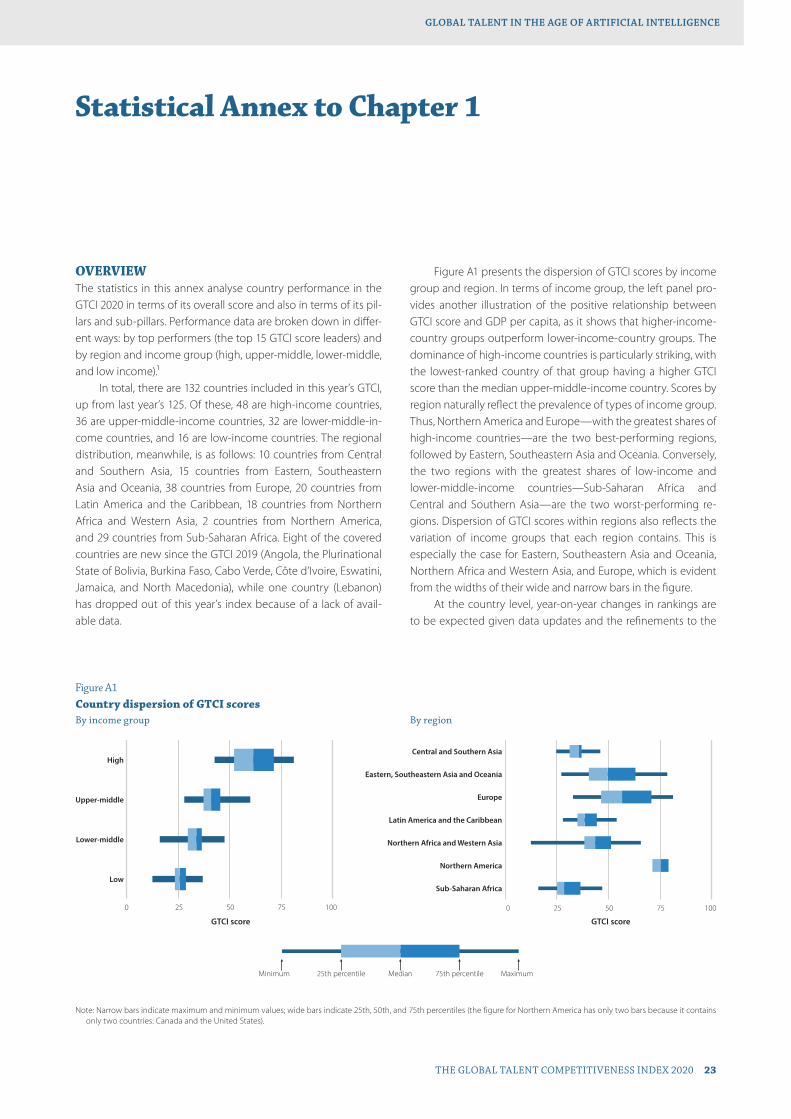
Statistical Annex to Chapter 1
OVERVIEWThe statistics in this annex analyse country performance in the GTCI 2020 in terms of its overall score and also in terms of its pil-lars and sub-pillars. Performance data are broken down in differ-ent ways: by top performers (the top 15 GTCI score leaders) and by region and income group (high, upper-middle, lower-middle, and low income).1
In total, there are 132 countries included in this year’s GTCI, up from last year’s 125. Of these, 48 are high-income countries, 36 are upper-middle-income countries, 32 are lower-middle-in-come countries, and 16 are low-income countries. The regional distribution, meanwhile, is as follows: 10 countries from Central and Southern Asia, 15 countries from Eastern, Southeastern Asia and Oceania, 38 countries from Europe, 20 countries from Latin America and the Caribbean, 18 countries from Northern Africa and Western Asia, 2 countries from Northern America, and 29 countries from Sub-Saharan Africa. Eight of the covered countries are new since the GTCI 2019 (Angola, the Plurinational State of Bolivia, Burkina Faso, Cabo Verde, Côte d’Ivoire, Eswatini, Jamaica, and North Macedonia), while one country (Lebanon) has dropped out of this year’s index because of a lack of avail-able data.
Figure A1 presents the dispersion of GTCI scores by income group and region. In terms of income group, the left panel pro-vides another illustration of the positive relationship between GTCI score and GDP per capita, as it shows that higher-income-country groups outperform lower-income-country groups. The dominance of high-income countries is particularly striking, with the lowest-ranked country of that group having a higher GTCI score than the median upper-middle-income country. Scores by region naturally reflect the prevalence of types of income group. Thus, Northern America and Europe—with the greatest shares of high-income countries—are the two best-performing regions, followed by Eastern, Southeastern Asia and Oceania. Conversely, the two regions with the greatest shares of low-income and lower-middle-income countries—Sub-Saharan Africa and Central and Southern Asia—are the two worst-performing re-gions. Dispersion of GTCI scores within regions also reflects the variation of income groups that each region contains. This is especially the case for Eastern, Southeastern Asia and Oceania, Northern Africa and Western Asia, and Europe, which is evident from the widths of their wide and narrow bars in the figure.
At the country level, year-on-year changes in rankings are to be expected given data updates and the refinements to the
Figure A1Country dispersion of GTCI scores
Note: Narrow bars indicate maximum and minimum values; wide bars indicate 25th, 50th, and 75th percentiles (the figure for Northern America has only two bars because it contains only two countries: Canada and the United States).
By income group By region
0 25 50 75 100
Sub-Saharan Africa
Northern America
Northern Africa and Western Asia
Latin America and the Caribbean
Europe
Eastern, Southeastern Asia and Oceania
Central and Southern Asia
0 25 50 75 100
Low
Lower-middle
Upper-middle
High
Minimum Median Maximum25th percentile 75th percentile
GTCI score GTCI score
GLOBAL TALENT IN THE AGE OF ARTIFICIAL INTELLIGENCE
THE GLOBAL TALENT COMPETITIVENESS INDEX 2020 23

GTCI model. On the whole, however, the changes are usually small and countries are often ranked in the same quartile as they were the previous year. For instance, although there have been permutations among the top-25 ranked countries, the list of countries within that group is almost identical to that of last year (Qatar has dropped out of it, while Malta has broken into it). Something similar could be said about the bottom-25 ranked countries, taking into account the countries that are new addi-tions to the index.
European countries continue to dominate the GTCI rank-ings, with 17 of them in the top 25 and Switzerland maintain-ing its position at the very top. Other top-scoring European countries include the Nordics (Sweden, 4th; Denmark, 5th; Finland, 7th; Norway, 9th; Iceland, 14th) and Western European countries such as the Netherlands (6th), Luxembourg (8th), and Germany (11th).
As for other regions, both Northern American countries are in the top 25 (United States of America, 2nd; Canada, 13th). Eastern and Southeastern Asia is represented by Singapore (3rd) and Japan (19th), while the two largest economies of Oceania (Australia, 10th; New Zealand, 16th) are also among the highest-scoring countries. The two remaining countries in the top 25 are Israel (20th) and the United Arab Emirates (22nd), both of which are located in Western Asia.
The discussion has so far focused on aggregate GTCI scores and rankings. Analysing scores by pillar sheds some light on what might be driving these overall results. Figure A2 therefore presents the dispersion of scores by pillar in terms of the five-number summary (the minimum, the lower quartile, the median, the upper quartile, and the maximum). As can be seen, there are clear differences in dispersion across the pillars. For instance, the dispersion of scores is largest in the Retain pil-lar (standard deviation = 20.3) and smallest in the Attract pillar
(standard deviation = 14.1), which suggests that the ability of countries to retain talent sets them apart more than their capac-ity to attract talent.
One might expect a certain degree of complementarity across pillars in that a strong performance in one dimension of talent has positive spillovers on other dimensions. Such a con-jecture is supported by the heatmap of Figure A3 on pages 25–26, which presents the overall rankings in the GTCI and those in each pillar, coloured by the quartile to which the rank-ings of each of the 132 countries belong. The complementari-ties across pillars are most evident at the top and bottom of the figure, where countries that are among the best and worst per-formers in the overall GTCI rankings are also among the best and worst performers in the six pillars. In fact, the difference between overall GTCI rank and pillar-level rank is no higher than 10 in abso-lute value in at least four pillars for more than half of all countries in this year’s index. To take a concrete example: Chile, which is ranked 34th overall, does not rank better than 26 or worse than 40 in any of the six pillars.
TOP 15 COUNTRIES IN THE GTCI 2020The group of top-performing countries in the GTCI remains sta-ble from year to year, notwithstanding some movement within the group. In fact, all countries but one in the top 15 of the GTCI 2020 were also in the top 15 in last year’s index. Ireland (15th, up from 16th) is the new country in the list, while New Zealand has dropped out of it (16th, down from 11th). A similar story applies to the top 25, with Malta (rising from 26th to 23rd) and Qatar (falling from 24th to 29th) being the exceptions.
That there might exist complementarities across pillars cer-tainly seems to be the case for the countries in the top 15, as they typically perform well in each of the six pillars of the GTCI model (Figure A3). More specifically, 5 of the 15 countries rank among
Figure A2Dispersion of country scores for each pillar
0
20
40
60
80
100
GK SkillsVT SkillsRetainGrowAttractEnable
Minimum
Maximum
25th percentile
Median
75th percentile
GTC
I sco
re
Note: Narrow bars indicate maximum and minimum values; wide bars indicate 25th, 50th, and 75th percentiles. GK Skills = Global Knowledge Skills; VT Skills = Vocational and Technical Skills.
GLOBAL TALENT IN THE AGE OF ARTIFICIAL INTELLIGENCECHAPTER 1
24 THE GLOBAL TALENT COMPETITIVENESS INDEX 2020
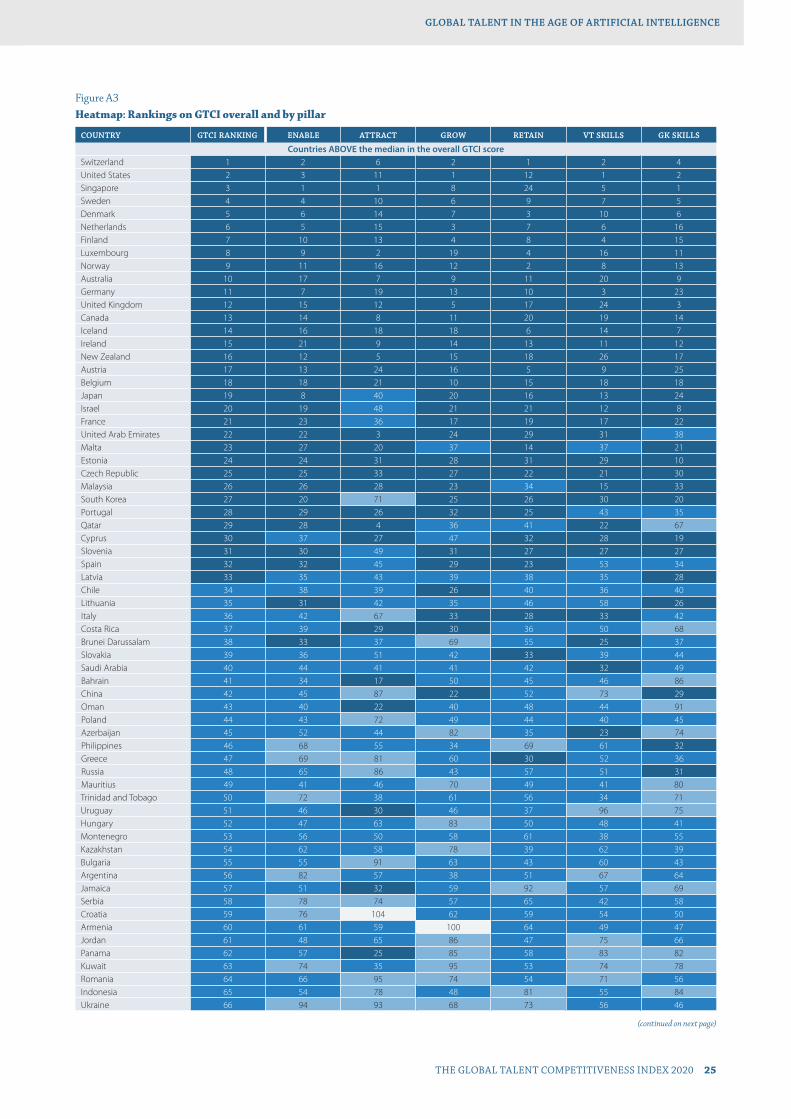
COUNTRY GTCI RANKING ENABLE ATTRACT GROW RETAIN VT SKILLS GK SKILLS
Countries ABOVE the median in the overall GTCI scoreSwitzerland 1 2 6 2 1 2 4United States 2 3 11 1 12 1 2Singapore 3 1 1 8 24 5 1Sweden 4 4 10 6 9 7 5Denmark 5 6 14 7 3 10 6Netherlands 6 5 15 3 7 6 16Finland 7 10 13 4 8 4 15Luxembourg 8 9 2 19 4 16 11Norway 9 11 16 12 2 8 13Australia 10 17 7 9 11 20 9Germany 11 7 19 13 10 3 23United Kingdom 12 15 12 5 17 24 3Canada 13 14 8 11 20 19 14Iceland 14 16 18 18 6 14 7Ireland 15 21 9 14 13 11 12New Zealand 16 12 5 15 18 26 17Austria 17 13 24 16 5 9 25Belgium 18 18 21 10 15 18 18Japan 19 8 40 20 16 13 24Israel 20 19 48 21 21 12 8France 21 23 36 17 19 17 22United Arab Emirates 22 22 3 24 29 31 38Malta 23 27 20 37 14 37 21Estonia 24 24 31 28 31 29 10Czech Republic 25 25 33 27 22 21 30Malaysia 26 26 28 23 34 15 33South Korea 27 20 71 25 26 30 20Portugal 28 29 26 32 25 43 35Qatar 29 28 4 36 41 22 67Cyprus 30 37 27 47 32 28 19Slovenia 31 30 49 31 27 27 27Spain 32 32 45 29 23 53 34Latvia 33 35 43 39 38 35 28Chile 34 38 39 26 40 36 40Lithuania 35 31 42 35 46 58 26Italy 36 42 67 33 28 33 42Costa Rica 37 39 29 30 36 50 68Brunei Darussalam 38 33 37 69 55 25 37Slovakia 39 36 51 42 33 39 44Saudi Arabia 40 44 41 41 42 32 49Bahrain 41 34 17 50 45 46 86China 42 45 87 22 52 73 29Oman 43 40 22 40 48 44 91Poland 44 43 72 49 44 40 45Azerbaijan 45 52 44 82 35 23 74Philippines 46 68 55 34 69 61 32Greece 47 69 81 60 30 52 36Russia 48 65 86 43 57 51 31Mauritius 49 41 46 70 49 41 80Trinidad and Tobago 50 72 38 61 56 34 71Uruguay 51 46 30 46 37 96 75Hungary 52 47 63 83 50 48 41Montenegro 53 56 50 58 61 38 55Kazakhstan 54 62 58 78 39 62 39Bulgaria 55 55 91 63 43 60 43Argentina 56 82 57 38 51 67 64Jamaica 57 51 32 59 92 57 69Serbia 58 78 74 57 65 42 58Croatia 59 76 104 62 59 54 50Armenia 60 61 59 100 64 49 47Jordan 61 48 65 86 47 75 66Panama 62 57 25 85 58 83 82Kuwait 63 74 35 95 53 74 78Romania 64 66 95 74 54 71 56Indonesia 65 54 78 48 81 55 84Ukraine 66 94 93 68 73 56 46
(continued on next page)
Figure A3Heatmap: Rankings on GTCI overall and by pillar
GLOBAL TALENT IN THE AGE OF ARTIFICIAL INTELLIGENCE
THE GLOBAL TALENT COMPETITIVENESS INDEX 2020 25
CHAPTER 1

COUNTRY GTCI RANKING ENABLE ATTRACT GROW RETAIN VT SKILLS GK SKILLS
Countries BELOW the median in the overall GTCI scoreThailand 67 50 60 72 76 86 61Georgia 68 58 69 103 68 68 54Mexico 69 70 90 45 79 81 62South Africa 70 64 52 54 106 63 60Botswana 71 53 47 51 93 98 72India 72 63 92 44 95 76 57Namibia 73 71 34 79 100 66 79Colombia 74 81 102 53 75 69 77Mongolia 75 84 83 84 63 87 51Albania 76 83 62 73 78 65 104Peru 77 87 75 76 89 72 73Turkey 78 77 114 67 62 97 63Tunisia 79 102 101 81 66 78 53Brazil 80 79 96 55 70 101 81Dominican Republic 81 67 53 96 86 93 92Ecuador 82 96 107 52 67 80 93Sri Lanka 83 85 112 92 77 47 96Tajikistan 84 107 89 115 71 45 87Gambia 85 75 23 88 99 85 131Moldova 86 91 103 80 80 94 70Ghana 87 60 61 71 103 84 99Kenya 88 80 80 75 104 64 103North Macedonia 89 86 117 107 60 79 76Cabo Verde 90 73 56 99 88 77 120Kyrgyzstan 91 113 94 110 72 59 89Bhutan 92 49 85 91 83 99 126Rwanda 93 59 66 77 91 112 107Honduras 94 93 68 65 94 92 109Guatemala 95 88 82 56 98 106 88Viet Nam 96 90 105 89 87 117 59Egypt 97 105 116 104 74 104 52Lao PDR 98 95 97 111 107 100 48Paraguay 99 101 64 94 90 109 102Morocco 100 89 111 97 85 116 95Bosnia and Herzegovina 101 106 121 87 96 70 98Iran 102 114 131 101 82 89 65Zambia 103 100 54 117 113 91 108Senegal 104 92 70 90 109 107 119Algeria 105 117 123 116 84 95 97Pakistan 106 111 118 105 108 82 90Bolivia 107 121 128 64 102 114 85Côte d'Ivoire 108 104 79 93 118 108 105Nicaragua 109 112 84 109 97 115 122El Salvador 110 98 115 98 105 105 114Tanzania 111 99 77 106 111 122 118Nigeria 112 115 99 108 123 88 94Uganda 113 103 76 114 122 113 111Venezuela 114 130 129 66 101 111 83Eswatini 115 109 88 123 110 121 123Cameroon 116 119 113 102 124 103 100Cambodia 117 97 100 124 116 125 112Liberia 118 116 73 113 120 120 129Lesotho 119 110 108 121 115 102 130Malawi 120 118 110 125 112 129 101Nepal 121 120 126 118 119 90 116Burkina Faso 122 124 106 120 121 126 110Ethiopia 123 125 122 119 114 128 106Bangladesh 124 108 127 128 125 118 115Mali 125 123 119 122 117 124 125Madagascar 126 122 98 127 129 123 121Zimbabwe 127 126 120 112 128 119 124Mozambique 128 127 109 129 126 131 127Burundi 129 129 125 126 127 127 132Congo, Dem. Rep. 130 131 130 130 132 110 128Angola 131 128 124 131 130 132 117Yemen 132 132 132 132 131 130 113
Note: The darkest blue means the country belongs to the 4th quartile (best performers); medium colour = 3rd quartile; pale colour = 2nd quartile; palest colour = 1st quartile (worst performers). GK Skills = Global Knowledge Skills; VT Skills = Vocational and Technical Skills.
Figure A3 (continued)Heatmap: Rankings on GTCI overall and by pillar
GLOBAL TALENT IN THE AGE OF ARTIFICIAL INTELLIGENCECHAPTER 1
26 THE GLOBAL TALENT COMPETITIVENESS INDEX 2020

the top 15 performers in every pillar, 4 countries do so in five of the six pillars, and 5 countries do so in four of the six pillars. In terms of pillars, 13 of the top 15 countries are also in the top 15 in the Grow and Global Knowledge Skills pillars; 12 are in the top 15 in the Enable, Attract, and Retain pillars; and 11 are in the top 15 in the Vocational and Technical Skills pillar.
Several countries outside the top 15 are among the top performers in specific pillars. For instance, New Zealand has the fifth-highest score when it comes to attracting talent, while Austria (17th overall) is one of the global leaders in terms of re-taining talent (5th) and in its pool of Vocational and Technical Skills (8th). Other countries that stand out in certain pillars are Japan (19th), which is a top performer in the Enable pillar (8th); and Israel (20th), which scores well in the Global Knowledge Skills pillar (6th). Both the United Arab Emirates (22nd) and Qatar (29th) are among the highest-scoring countries in terms of attracting talent (3rd and 4th, respectively).
The top 3 positions are in this year’s index are occupied by Switzerland, the United States, and Singapore. That the top spot is held by Switzerland is hardly surprising, since this has been the case ever since the first GTCI was launched in 2013. That the United States is placed 2nd is more noteworthy. For one thing, it is the country’s highest ranking in the GTCI so far. For another, it means that it overtakes Singapore, which has been in the runner-up position in the index since its inception. To be sure, there is not much separating the United States and Singapore, but the improved ranking of the United States is consistent with its upward trend since the launch of the GTCI.
Switzerland (1st) remains the outright leader in the GTCI by virtue of its strong performances in almost every dimension. At the pillar level, its lowest rank is 6th (Attract), while it is ranked 1st in Retain; 2nd in Enable, Grow, and Vocational and Technical Skills; and 4th in Global Knowledge Skills. At the level of the sub-pillar, it is the global leader with respect to Lifelong Learning and Sustainability. In fact, Switzerland ranks outside the top 10 in only one of 14 sub-pillars: Internal Openness (16th), where it has relatively low rankings in variables related to gender equality and tolerance of minorities and immigrants. Another manifestation of Switzerland’s strong talent competitiveness across the board is that it is placed in the top 10 in 42 variables, claiming the top spot in 14 of these.
The United States (2nd) makes it into the top 3 in four of the six pillars: Enable (3rd), Grow (1st), Vocational and Technical Skills (1st), and Global Knowledge Skills (2nd). The country’s supe-riority in growing talent stems from outstanding performances in all three sub-pillars: Formal Education (2nd), Lifelong Learning (2nd), and Access to Growth Opportunities (1st). Its strong pool of Vocational and Technical Skills is primarily due to its ability to match the skills of people with the needs of the economy (1st in Employability), while its Global Knowledge Skills benefits from strong High-Level Skills (3rd). As for enabling talent, the sub-pillars related to Market Landscape (3rd) and Business and Labour Landscape (2nd) are particularly strong. The United States’ lower ranking of 11th in Attract and 12th in Retain can be partly attrib-uted to a relatively weak level of Internal Openness (14th) in the former case and a below-par Lifestyle (36th) in the latter.
Singapore (3rd) is the highest-ranked country in three pillars—Enable, Attract, and Global Knowledge Skills—and is therefore the country with most top spots at the pillar level. The country performs well in all the sub-pillars related to the three pil-lars, ranking 1st with respect to Regulatory Landscape, Business and Labour Landscape, External Openness, and High-Level Skills; 2nd when it comes to Talent Impact; 4th in Market Landscape; and 7th in Internal Openness. Singapore has also high scores in the pillars related to growing (8th) talent—boosted by strong opportunities for Lifelong Learning (3rd)—and to its pool of Vocational and Technical Skills (5th)—mainly benefiting from strong Employability (4th). However, the city-state’s performance in the Retain (24th) pillar continues to be underwhelming, with scope for improvement in both sub-pillars (Sustainability, 24th, and Lifestyle, 28th).
Sweden (4th) is one of the most solid performers in the GTCI in that it scores well in almost every dimension. Tellingly, the country does not claim the top spot in a single indicator, but—in contrast to the top 3 countries—it ranks above the me-dian in each indicator. At the pillar level, Sweden’s lowest rank relates to attracting talent (10th), where relatively weak scores in attracting international business and people lead to a low de-gree of External Openness (21st) that is offset by a high degree of Internal Openness (3rd). Its highest rank is in the Enable pillar (4th), with strong performances in all three sub-pillars (Regulatory Landscape, 6th; Market Landscape, 5th; and Business and Labour Landscape, 8th).
Denmark (5th) performs particularly well in retaining talent (3rd), as a result of strong performances in both the Sustainability (5th) and Lifestyle (8th) sub-pillars. It has also an excellent pool of Global Knowledge Skills (6th), where a high degree of entrepre-neurship and innovation makes it the global leader in terms of Talent Impact. Denmark also ranks 6th with respect to enabling talent, with performances in the top 10 in all associated sub-pillars. The only pillar where the country ranks outside the top 10 is that related to attracting talent (14th), which has particular room for improvement in luring talented people from abroad and in strengthening gender equality.
The Netherlands (6th) is most impressive when it comes to growing talent (3rd), where it posts high scores in all three sub-pillars: Formal Education (5th), Lifelong Learning (4th), and
Table A1Countries with highest GTCI scores by pillar
PILLAR TOP 3 COUNTRIES
Enable Singapore, Switzerland, United States
Attract Singapore, Luxembourg, United Arab Emirates
Grow United States, Switzerland, Netherlands
Retain Switzerland, Norway, Denmark
Vocational and
Technical (VT) Skills
United States, Switzerland, Germany
Global Knowledge
(GK) Skills
Singapore, United States, United Kingdom
GLOBAL TALENT IN THE AGE OF ARTIFICIAL INTELLIGENCE
THE GLOBAL TALENT COMPETITIVENESS INDEX 2020 27
CHAPTER 1
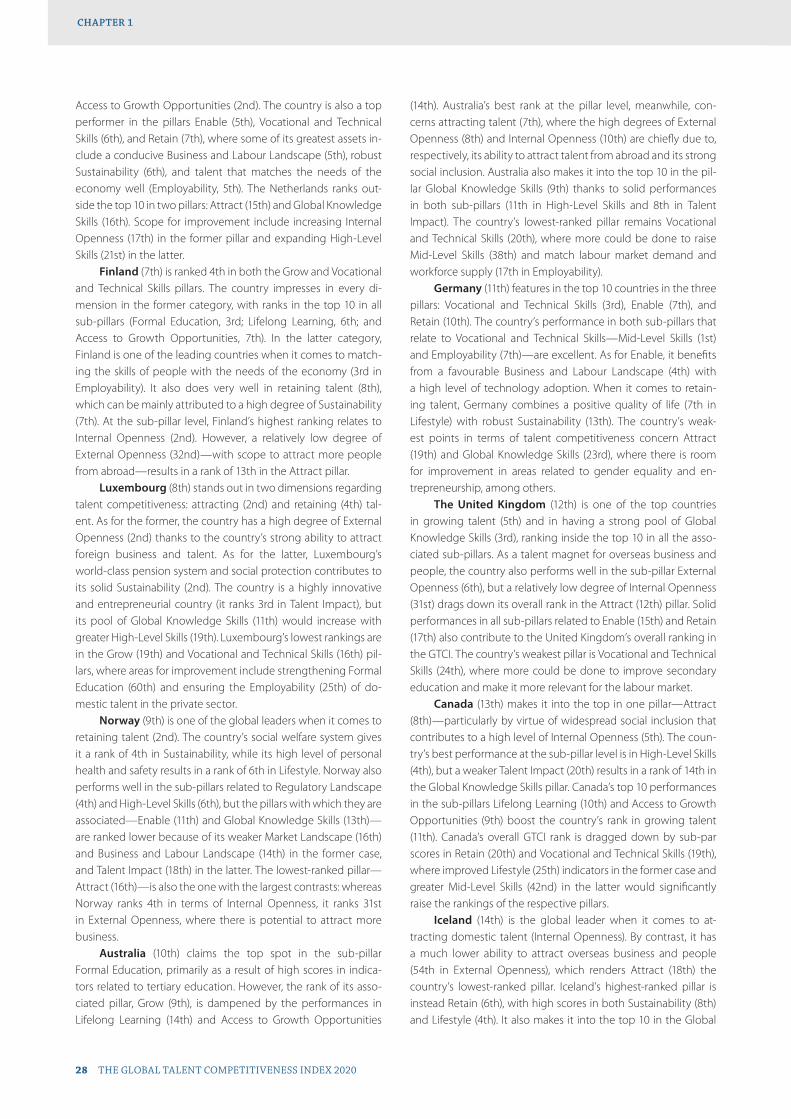
Access to Growth Opportunities (2nd). The country is also a top performer in the pillars Enable (5th), Vocational and Technical Skills (6th), and Retain (7th), where some of its greatest assets in-clude a conducive Business and Labour Landscape (5th), robust Sustainability (6th), and talent that matches the needs of the economy well (Employability, 5th). The Netherlands ranks out-side the top 10 in two pillars: Attract (15th) and Global Knowledge Skills (16th). Scope for improvement include increasing Internal Openness (17th) in the former pillar and expanding High-Level Skills (21st) in the latter.
Finland (7th) is ranked 4th in both the Grow and Vocational and Technical Skills pillars. The country impresses in every di-mension in the former category, with ranks in the top 10 in all sub-pillars (Formal Education, 3rd; Lifelong Learning, 6th; and Access to Growth Opportunities, 7th). In the latter category, Finland is one of the leading countries when it comes to match-ing the skills of people with the needs of the economy (3rd in Employability). It also does very well in retaining talent (8th), which can be mainly attributed to a high degree of Sustainability (7th). At the sub-pillar level, Finland’s highest ranking relates to Internal Openness (2nd). However, a relatively low degree of External Openness (32nd)—with scope to attract more people from abroad—results in a rank of 13th in the Attract pillar.
Luxembourg (8th) stands out in two dimensions regarding talent competitiveness: attracting (2nd) and retaining (4th) tal-ent. As for the former, the country has a high degree of External Openness (2nd) thanks to the country’s strong ability to attract foreign business and talent. As for the latter, Luxembourg’s world-class pension system and social protection contributes to its solid Sustainability (2nd). The country is a highly innovative and entrepreneurial country (it ranks 3rd in Talent Impact), but its pool of Global Knowledge Skills (11th) would increase with greater High-Level Skills (19th). Luxembourg’s lowest rankings are in the Grow (19th) and Vocational and Technical Skills (16th) pil-lars, where areas for improvement include strengthening Formal Education (60th) and ensuring the Employability (25th) of do-mestic talent in the private sector.
Norway (9th) is one of the global leaders when it comes to retaining talent (2nd). The country’s social welfare system gives it a rank of 4th in Sustainability, while its high level of personal health and safety results in a rank of 6th in Lifestyle. Norway also performs well in the sub-pillars related to Regulatory Landscape (4th) and High-Level Skills (6th), but the pillars with which they are associated—Enable (11th) and Global Knowledge Skills (13th)—are ranked lower because of its weaker Market Landscape (16th) and Business and Labour Landscape (14th) in the former case, and Talent Impact (18th) in the latter. The lowest-ranked pillar—Attract (16th)—is also the one with the largest contrasts: whereas Norway ranks 4th in terms of Internal Openness, it ranks 31st in External Openness, where there is potential to attract more business.
Australia (10th) claims the top spot in the sub-pillar Formal Education, primarily as a result of high scores in indica-tors related to tertiary education. However, the rank of its asso-ciated pillar, Grow (9th), is dampened by the performances in Lifelong Learning (14th) and Access to Growth Opportunities
(14th). Australia’s best rank at the pillar level, meanwhile, con-cerns attracting talent (7th), where the high degrees of External Openness (8th) and Internal Openness (10th) are chiefly due to, respectively, its ability to attract talent from abroad and its strong social inclusion. Australia also makes it into the top 10 in the pil-lar Global Knowledge Skills (9th) thanks to solid performances in both sub-pillars (11th in High-Level Skills and 8th in Talent Impact). The country’s lowest-ranked pillar remains Vocational and Technical Skills (20th), where more could be done to raise Mid-Level Skills (38th) and match labour market demand and workforce supply (17th in Employability).
Germany (11th) features in the top 10 countries in the three pillars: Vocational and Technical Skills (3rd), Enable (7th), and Retain (10th). The country’s performance in both sub-pillars that relate to Vocational and Technical Skills—Mid-Level Skills (1st) and Employability (7th)—are excellent. As for Enable, it benefits from a favourable Business and Labour Landscape (4th) with a high level of technology adoption. When it comes to retain-ing talent, Germany combines a positive quality of life (7th in Lifestyle) with robust Sustainability (13th). The country’s weak-est points in terms of talent competitiveness concern Attract (19th) and Global Knowledge Skills (23rd), where there is room for improvement in areas related to gender equality and en-trepreneurship, among others.
The United Kingdom (12th) is one of the top countries in growing talent (5th) and in having a strong pool of Global Knowledge Skills (3rd), ranking inside the top 10 in all the asso-ciated sub-pillars. As a talent magnet for overseas business and people, the country also performs well in the sub-pillar External Openness (6th), but a relatively low degree of Internal Openness (31st) drags down its overall rank in the Attract (12th) pillar. Solid performances in all sub-pillars related to Enable (15th) and Retain (17th) also contribute to the United Kingdom’s overall ranking in the GTCI. The country’s weakest pillar is Vocational and Technical Skills (24th), where more could be done to improve secondary education and make it more relevant for the labour market.
Canada (13th) makes it into the top in one pillar—Attract (8th)—particularly by virtue of widespread social inclusion that contributes to a high level of Internal Openness (5th). The coun-try’s best performance at the sub-pillar level is in High-Level Skills (4th), but a weaker Talent Impact (20th) results in a rank of 14th in the Global Knowledge Skills pillar. Canada’s top 10 performances in the sub-pillars Lifelong Learning (10th) and Access to Growth Opportunities (9th) boost the country’s rank in growing talent (11th). Canada’s overall GTCI rank is dragged down by sub-par scores in Retain (20th) and Vocational and Technical Skills (19th), where improved Lifestyle (25th) indicators in the former case and greater Mid-Level Skills (42nd) in the latter would significantly raise the rankings of the respective pillars.
Iceland (14th) is the global leader when it comes to at-tracting domestic talent (Internal Openness). By contrast, it has a much lower ability to attract overseas business and people (54th in External Openness), which renders Attract (18th) the country’s lowest-ranked pillar. Iceland’s highest-ranked pillar is instead Retain (6th), with high scores in both Sustainability (8th) and Lifestyle (4th). It also makes it into the top 10 in the Global
GLOBAL TALENT IN THE AGE OF ARTIFICIAL INTELLIGENCECHAPTER 1
28 THE GLOBAL TALENT COMPETITIVENESS INDEX 2020

Knowledge Skills (7th) pillar, where it primarily benefits from a strong pool of High-Level Skills (5th). Its pool of Mid-Level Skills (34th), however, is relatively weak, but is offset by an ability to match labour market demand and workforce supply (it ranks 11th in Employability). As a result, Iceland ranks 14th in terms of Vocational and Technical Skills.
Ireland (15th) returns to the top 15—at the expense of New Zealand—in the GTCI 2020. At the pillar level, it ranks in the top 10 with respect to Attract (9th), thanks to high scores in both External Openness (9th) and Internal Openness (13th). The coun-try is particularly successful in attracting overseas business. It also has a good pool of Vocational and Technical Skills (11th), where a key strength is how well it matches labour supply with market demand (8th in Employability). Solid performances in both High-Level Skills (13th) and Talent Impact (11th) mean that the country also has a good pool of Global Knowledge Skills (12th). There is most scope for improvement in areas related to enabling tal-ent (21st), where all three sub-pillars rank below Ireland’s overall rank (Regulatory Landscape, 17th; Market Landscape, 30th; and Business and Labour Landscape, 20th).
ANALYSIS BY INCOME AND REGIONAL GROUPSIt has already been seen that all the top 15 countries in the GTCI 2020 are high-income countries. In fact, all high-income coun-tries feature in the upper half of the rankings and, with one ex-ception, the top quartile of 33 countries is comprised of only high-income countries. The exception is Malaysia (26th)—the top-ranked upper-middle-income country (Table A2). Within its income group, Malaysia is followed by Costa Rica (37th) and China (42nd), with an additional 12 upper-middle-income coun-tries in the third quartile. Of the remaining upper-middle-income countries, 16 are ranked in the second quartile and 4 are placed in the bottom quartile. Only three lower-middle-income coun-tries—the Philippines (46th), Indonesia (65th), and Ukraine—make it into the third quartile, with 13 countries in the second quartile and 16 countries in the first quartile. As for the 16 low-income countries, the top 3—Tajikistan (84th), Gambia (85th), and Rwanda (93rd)—are the only ones ranked above the bot-tom quartile.
In terms of regional distribution, the top quartile is domi-nated by European countries (21 of the top 33 countries to be precise). Europe is a heterogeneous region, however, and there are several economies further down the rankings, mainly in the third quartile (13 countries). Similarly, the Eastern, Southeastern Asia and Oceania region includes countries with highly varied performances in the GTCI 2020, although—like Europe—most of them are in the upper half of the rankings (10 out of 15 countries). The third regional group with considerable variation is Northern Africa and Western Asia, where four countries are in the fourth quartile, seven countries are in the third quartile, four countries in the second quartile, and three countries in the first quartile. Latin America and the Caribbean is not represented in the top quartile (although Chile—ranked 34th—is just outside it), with most countries in the third and second quartiles (16 out of 20). Central and Southern Asia has only one country in the upper half of the GTCI 2020 (Kazakhstan, 54th), while there are five countries
in the second quartile and four in the first quartile. The worst-performing region, Sub-Saharan Africa, is also the one with the highest proportion of countries in the bottom quartile (20 out of 29), with an additional eight countries in the second quartile and one country (Mauritius, 49th) in the third quartile.
Income GroupsThe dominance of high-income countries in the overall ranking of the GTCI 2020 extends to the pillar level. A glance at Figure A4, which depicts the average score of each income group in each pillar, makes this all too clear. The gap in average scores between high-income counties and upper-middle-income countries ranges from about 18 (Vocational and Technical Skills, Attract, and Grow) to 24 (Retain). Thus, not only does the average high-income country outperform the averages of other income groups in all pillars, it does so by a significant margin.
It is also evident from Figure A4 that differences across countries from the other three income groups are not, gener-ally speaking, as large as the gaps with respect to high-income countries. Nevertheless, their relative performances in the GTCI against one another are usually in the expected order in five of the six pillars—that is, upper-middle-income countries generally outperform lower-middle-income countries that, in turn, typi-cally have higher scores than low-income countries.
The Attract pillar is the one pillar where there is not much separating the three income groups. Differences are not very large at when comparing scores for various types of summary statistics—for example, with respect to the mean or the 25th, 50th, and 75th percentiles. In fact, the group of low-income countries even outscores the group of lower-middle-income countries at certain percentiles.
It was mentioned earlier that there might be complemen-tarities across the various dimensions of talent competitiveness. Analysis of the top performances in each income group lends
Table A2Countries with highest GTCI scores by income and regional group
COMPARISON GROUP TOP 3 COUNTRIES
By region
Central and Southern Asia Kazakhstan, India, Sri Lanka
Eastern, Southeastern Asia and
Oceania
Singapore, Australia, New Zealand
Europe Switzerland, Sweden, Denmark
Latin America and the Caribbean Chile, Costa Rica, Trinidad and Tobago
Northern Africa and Western Asia Israel, United Arab Emirates, Qatar
Northern America United States, Canada
Sub-Saharan Africa Mauritius, South Africa, Botswana
By income group
High-income countries Switzerland, United States, Singapore
Upper-middle-income countries Malaysia, Costa Rica, China
Lower-middle-income countries Philippines, Indonesia, Ukraine
Low-income countries Tajikistan, Gambia, Rwanda
GLOBAL TALENT IN THE AGE OF ARTIFICIAL INTELLIGENCE
THE GLOBAL TALENT COMPETITIVENESS INDEX 2020 29
CHAPTER 1
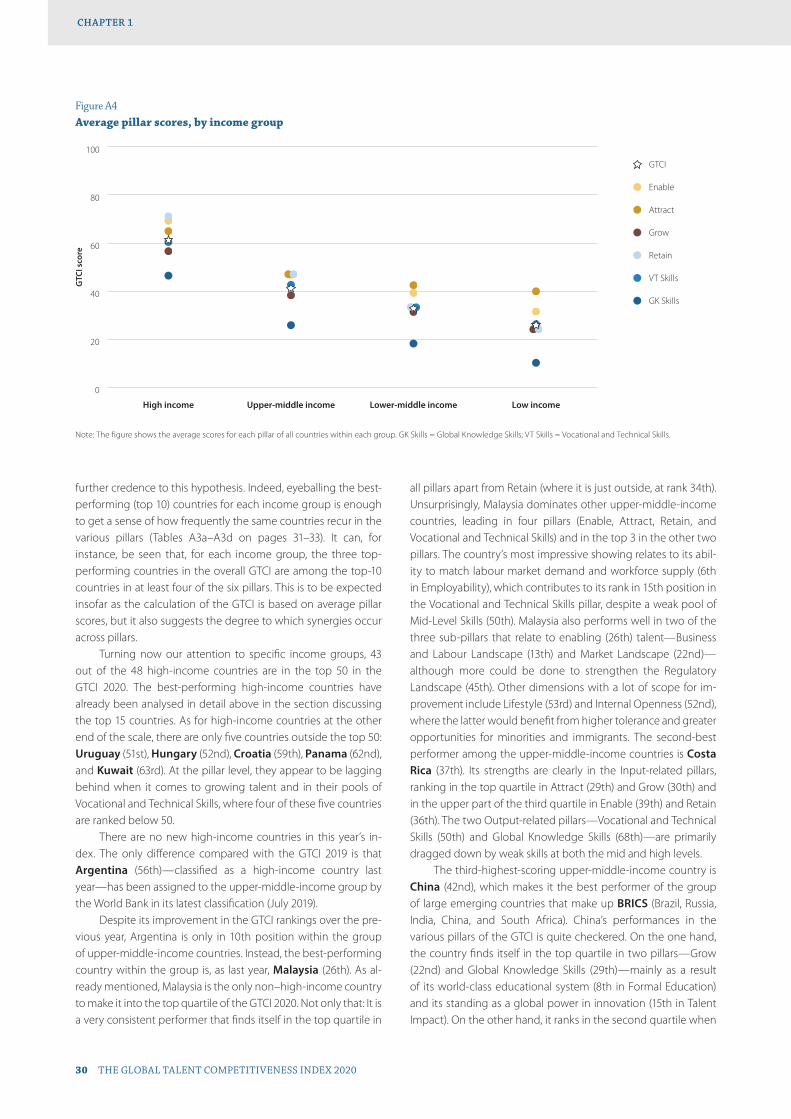
further credence to this hypothesis. Indeed, eyeballing the best-performing (top 10) countries for each income group is enough to get a sense of how frequently the same countries recur in the various pillars (Tables A3a–A3d on pages 31–33). It can, for instance, be seen that, for each income group, the three top-performing countries in the overall GTCI are among the top-10 countries in at least four of the six pillars. This is to be expected insofar as the calculation of the GTCI is based on average pillar scores, but it also suggests the degree to which synergies occur across pillars.
Turning now our attention to specific income groups, 43 out of the 48 high-income countries are in the top 50 in the GTCI 2020. The best-performing high-income countries have already been analysed in detail above in the section discussing the top 15 countries. As for high-income countries at the other end of the scale, there are only five countries outside the top 50: Uruguay (51st), Hungary (52nd), Croatia (59th), Panama (62nd), and Kuwait (63rd). At the pillar level, they appear to be lagging behind when it comes to growing talent and in their pools of Vocational and Technical Skills, where four of these five countries are ranked below 50.
There are no new high-income countries in this year’s in-dex. The only difference compared with the GTCI 2019 is that Argentina (56th)—classified as a high-income country last year—has been assigned to the upper-middle-income group by the World Bank in its latest classification (July 2019).
Despite its improvement in the GTCI rankings over the pre-vious year, Argentina is only in 10th position within the group of upper-middle-income countries. Instead, the best-performing country within the group is, as last year, Malaysia (26th). As al-ready mentioned, Malaysia is the only non–high-income country to make it into the top quartile of the GTCI 2020. Not only that: It is a very consistent performer that finds itself in the top quartile in
all pillars apart from Retain (where it is just outside, at rank 34th). Unsurprisingly, Malaysia dominates other upper-middle-income countries, leading in four pillars (Enable, Attract, Retain, and Vocational and Technical Skills) and in the top 3 in the other two pillars. The country’s most impressive showing relates to its abil-ity to match labour market demand and workforce supply (6th in Employability), which contributes to its rank in 15th position in the Vocational and Technical Skills pillar, despite a weak pool of Mid-Level Skills (50th). Malaysia also performs well in two of the three sub-pillars that relate to enabling (26th) talent—Business and Labour Landscape (13th) and Market Landscape (22nd)—although more could be done to strengthen the Regulatory Landscape (45th). Other dimensions with a lot of scope for im-provement include Lifestyle (53rd) and Internal Openness (52nd), where the latter would benefit from higher tolerance and greater opportunities for minorities and immigrants. The second-best performer among the upper-middle-income countries is Costa Rica (37th). Its strengths are clearly in the Input-related pillars, ranking in the top quartile in Attract (29th) and Grow (30th) and in the upper part of the third quartile in Enable (39th) and Retain (36th). The two Output-related pillars—Vocational and Technical Skills (50th) and Global Knowledge Skills (68th)—are primarily dragged down by weak skills at both the mid and high levels.
The third-highest-scoring upper-middle-income country is China (42nd), which makes it the best performer of the group of large emerging countries that make up BRICS (Brazil, Russia, India, China, and South Africa). China’s performances in the various pillars of the GTCI is quite checkered. On the one hand, the country finds itself in the top quartile in two pillars—Grow (22nd) and Global Knowledge Skills (29th)—mainly as a result of its world-class educational system (8th in Formal Education) and its standing as a global power in innovation (15th in Talent Impact). On the other hand, it ranks in the second quartile when
Figure A4Average pillar scores, by income group
0
20
40
60
80
100
GTCI
GK Skills
VT Skills
Retain
Grow
Attract
Enable
Low incomeLower-middle incomeUpper-middle incomeHigh income
GTCI
GK Skills
VT Skills
Retain
Attract
Enable
Grow
Note: The figure shows the average scores for each pillar of all countries within each group. GK Skills = Global Knowledge Skills; VT Skills = Vocational and Technical Skills.
GTC
I sco
re
GLOBAL TALENT IN THE AGE OF ARTIFICIAL INTELLIGENCECHAPTER 1
30 THE GLOBAL TALENT COMPETITIVENESS INDEX 2020
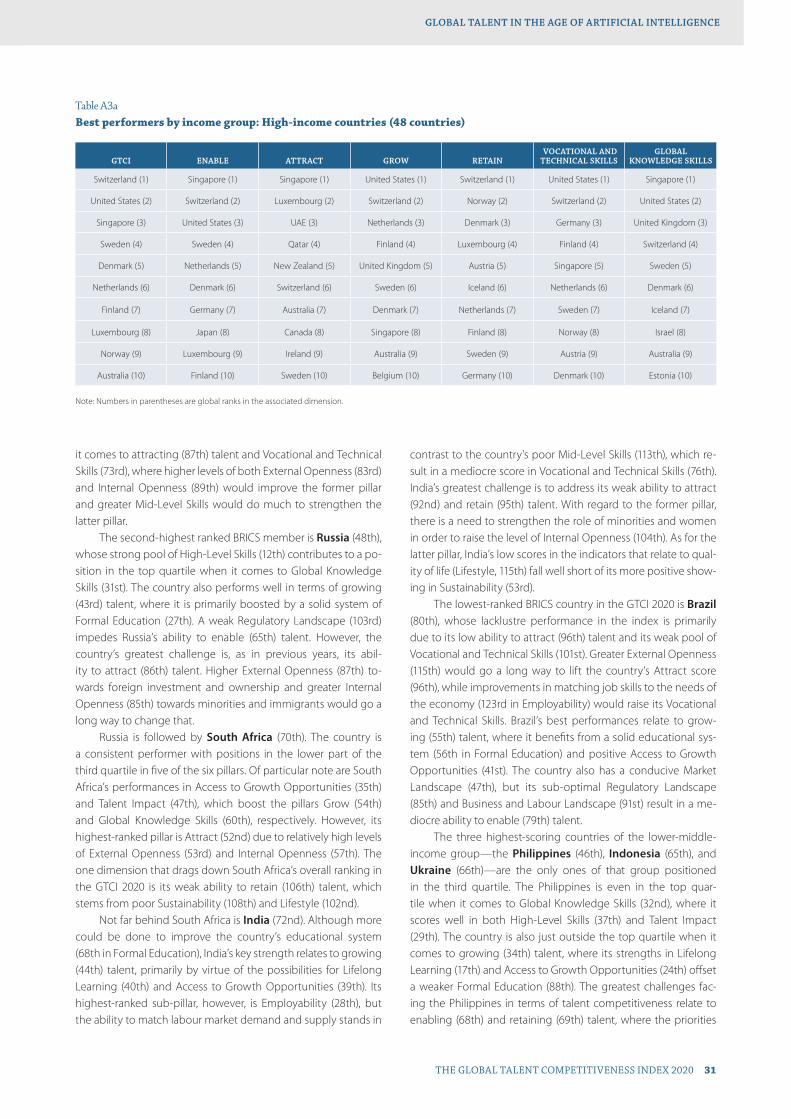
it comes to attracting (87th) talent and Vocational and Technical Skills (73rd), where higher levels of both External Openness (83rd) and Internal Openness (89th) would improve the former pillar and greater Mid-Level Skills would do much to strengthen the latter pillar.
The second-highest ranked BRICS member is Russia (48th), whose strong pool of High-Level Skills (12th) contributes to a po-sition in the top quartile when it comes to Global Knowledge Skills (31st). The country also performs well in terms of growing (43rd) talent, where it is primarily boosted by a solid system of Formal Education (27th). A weak Regulatory Landscape (103rd) impedes Russia’s ability to enable (65th) talent. However, the country’s greatest challenge is, as in previous years, its abil-ity to attract (86th) talent. Higher External Openness (87th) to-wards foreign investment and ownership and greater Internal Openness (85th) towards minorities and immigrants would go a long way to change that.
Russia is followed by South Africa (70th). The country is a consistent performer with positions in the lower part of the third quartile in five of the six pillars. Of particular note are South Africa’s performances in Access to Growth Opportunities (35th) and Talent Impact (47th), which boost the pillars Grow (54th) and Global Knowledge Skills (60th), respectively. However, its highest-ranked pillar is Attract (52nd) due to relatively high levels of External Openness (53rd) and Internal Openness (57th). The one dimension that drags down South Africa’s overall ranking in the GTCI 2020 is its weak ability to retain (106th) talent, which stems from poor Sustainability (108th) and Lifestyle (102nd).
Not far behind South Africa is India (72nd). Although more could be done to improve the country’s educational system (68th in Formal Education), India’s key strength relates to growing (44th) talent, primarily by virtue of the possibilities for Lifelong Learning (40th) and Access to Growth Opportunities (39th). Its highest-ranked sub-pillar, however, is Employability (28th), but the ability to match labour market demand and supply stands in
contrast to the country’s poor Mid-Level Skills (113th), which re-sult in a mediocre score in Vocational and Technical Skills (76th). India’s greatest challenge is to address its weak ability to attract (92nd) and retain (95th) talent. With regard to the former pillar, there is a need to strengthen the role of minorities and women in order to raise the level of Internal Openness (104th). As for the latter pillar, India’s low scores in the indicators that relate to qual-ity of life (Lifestyle, 115th) fall well short of its more positive show-ing in Sustainability (53rd).
The lowest-ranked BRICS country in the GTCI 2020 is Brazil (80th), whose lacklustre performance in the index is primarily due to its low ability to attract (96th) talent and its weak pool of Vocational and Technical Skills (101st). Greater External Openness (115th) would go a long way to lift the country’s Attract score (96th), while improvements in matching job skills to the needs of the economy (123rd in Employability) would raise its Vocational and Technical Skills. Brazil’s best performances relate to grow-ing (55th) talent, where it benefits from a solid educational sys-tem (56th in Formal Education) and positive Access to Growth Opportunities (41st). The country also has a conducive Market Landscape (47th), but its sub-optimal Regulatory Landscape (85th) and Business and Labour Landscape (91st) result in a me-diocre ability to enable (79th) talent.
The three highest-scoring countries of the lower-middle-income group—the Philippines (46th), Indonesia (65th), and Ukraine (66th)—are the only ones of that group positioned in the third quartile. The Philippines is even in the top quar-tile when it comes to Global Knowledge Skills (32nd), where it scores well in both High-Level Skills (37th) and Talent Impact (29th). The country is also just outside the top quartile when it comes to growing (34th) talent, where its strengths in Lifelong Learning (17th) and Access to Growth Opportunities (24th) offset a weaker Formal Education (88th). The greatest challenges fac-ing the Philippines in terms of talent competitiveness relate to enabling (68th) and retaining (69th) talent, where the priorities
Table A3aBest performers by income group: High-income countries (48 countries)
Note: Numbers in parentheses are global ranks in the associated dimension.
GTCI ENABLE ATTRACT GROW RETAIN VOCATIONAL AND TECHNICAL SKILLS
GLOBAL KNOWLEDGE SKILLS
Switzerland (1) Singapore (1) Singapore (1) United States (1) Switzerland (1) United States (1) Singapore (1)
United States (2) Switzerland (2) Luxembourg (2) Switzerland (2) Norway (2) Switzerland (2) United States (2)
Singapore (3) United States (3) UAE (3) Netherlands (3) Denmark (3) Germany (3) United Kingdom (3)
Sweden (4) Sweden (4) Qatar (4) Finland (4) Luxembourg (4) Finland (4) Switzerland (4)
Denmark (5) Netherlands (5) New Zealand (5) United Kingdom (5) Austria (5) Singapore (5) Sweden (5)
Netherlands (6) Denmark (6) Switzerland (6) Sweden (6) Iceland (6) Netherlands (6) Denmark (6)
Finland (7) Germany (7) Australia (7) Denmark (7) Netherlands (7) Sweden (7) Iceland (7)
Luxembourg (8) Japan (8) Canada (8) Singapore (8) Finland (8) Norway (8) Israel (8)
Norway (9) Luxembourg (9) Ireland (9) Australia (9) Sweden (9) Austria (9) Australia (9)
Australia (10) Finland (10) Sweden (10) Belgium (10) Germany (10) Denmark (10) Estonia (10)
GLOBAL TALENT IN THE AGE OF ARTIFICIAL INTELLIGENCE
THE GLOBAL TALENT COMPETITIVENESS INDEX 2020 31
CHAPTER 1
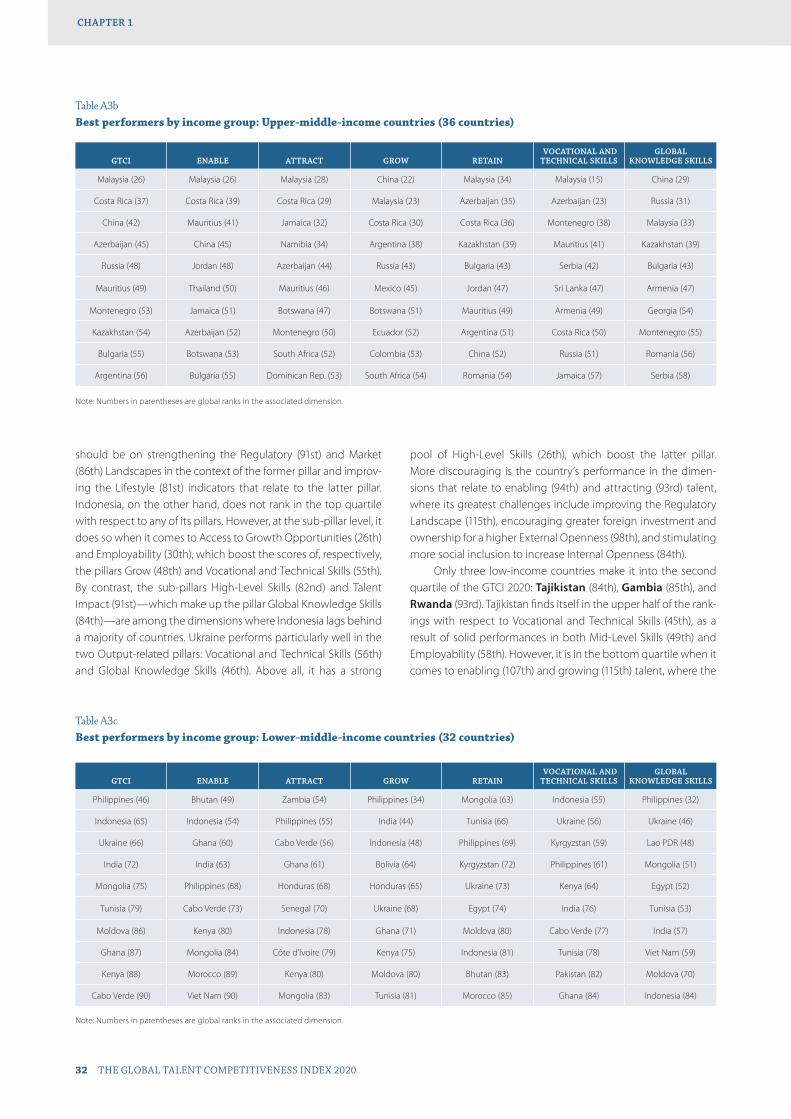
should be on strengthening the Regulatory (91st) and Market (86th) Landscapes in the context of the former pillar and improv-ing the Lifestyle (81st) indicators that relate to the latter pillar. Indonesia, on the other hand, does not rank in the top quartile with respect to any of its pillars. However, at the sub-pillar level, it does so when it comes to Access to Growth Opportunities (26th) and Employability (30th), which boost the scores of, respectively, the pillars Grow (48th) and Vocational and Technical Skills (55th). By contrast, the sub-pillars High-Level Skills (82nd) and Talent Impact (91st)—which make up the pillar Global Knowledge Skills (84th)—are among the dimensions where Indonesia lags behind a majority of countries. Ukraine performs particularly well in the two Output-related pillars: Vocational and Technical Skills (56th) and Global Knowledge Skills (46th). Above all, it has a strong
pool of High-Level Skills (26th), which boost the latter pillar. More discouraging is the country’s performance in the dimen-sions that relate to enabling (94th) and attracting (93rd) talent, where its greatest challenges include improving the Regulatory Landscape (115th), encouraging greater foreign investment and ownership for a higher External Openness (98th), and stimulating more social inclusion to increase Internal Openness (84th).
Only three low-income countries make it into the second quartile of the GTCI 2020: Tajikistan (84th), Gambia (85th), and Rwanda (93rd). Tajikistan finds itself in the upper half of the rank-ings with respect to Vocational and Technical Skills (45th), as a result of solid performances in both Mid-Level Skills (49th) and Employability (58th). However, it is in the bottom quartile when it comes to enabling (107th) and growing (115th) talent, where the
Table A3bBest performers by income group: Upper-middle-income countries (36 countries)
Note: Numbers in parentheses are global ranks in the associated dimension.
GTCI ENABLE ATTRACT GROW RETAIN VOCATIONAL AND TECHNICAL SKILLS
GLOBAL KNOWLEDGE SKILLS
Malaysia (26) Malaysia (26) Malaysia (28) China (22) Malaysia (34) Malaysia (15) China (29)
Costa Rica (37) Costa Rica (39) Costa Rica (29) Malaysia (23) Azerbaijan (35) Azerbaijan (23) Russia (31)
China (42) Mauritius (41) Jamaica (32) Costa Rica (30) Costa Rica (36) Montenegro (38) Malaysia (33)
Azerbaijan (45) China (45) Namibia (34) Argentina (38) Kazakhstan (39) Mauritius (41) Kazakhstan (39)
Russia (48) Jordan (48) Azerbaijan (44) Russia (43) Bulgaria (43) Serbia (42) Bulgaria (43)
Mauritius (49) Thailand (50) Mauritius (46) Mexico (45) Jordan (47) Sri Lanka (47) Armenia (47)
Montenegro (53) Jamaica (51) Botswana (47) Botswana (51) Mauritius (49) Armenia (49) Georgia (54)
Kazakhstan (54) Azerbaijan (52) Montenegro (50) Ecuador (52) Argentina (51) Costa Rica (50) Montenegro (55)
Bulgaria (55) Botswana (53) South Africa (52) Colombia (53) China (52) Russia (51) Romania (56)
Argentina (56) Bulgaria (55) Dominican Rep. (53) South Africa (54) Romania (54) Jamaica (57) Serbia (58)
Table A3cBest performers by income group: Lower-middle-income countries (32 countries)
Note: Numbers in parentheses are global ranks in the associated dimension.
GTCI ENABLE ATTRACT GROW RETAIN VOCATIONAL AND TECHNICAL SKILLS
GLOBAL KNOWLEDGE SKILLS
Philippines (46) Bhutan (49) Zambia (54) Philippines (34) Mongolia (63) Indonesia (55) Philippines (32)
Indonesia (65) Indonesia (54) Philippines (55) India (44) Tunisia (66) Ukraine (56) Ukraine (46)
Ukraine (66) Ghana (60) Cabo Verde (56) Indonesia (48) Philippines (69) Kyrgyzstan (59) Lao PDR (48)
India (72) India (63) Ghana (61) Bolivia (64) Kyrgyzstan (72) Philippines (61) Mongolia (51)
Mongolia (75) Philippines (68) Honduras (68) Honduras (65) Ukraine (73) Kenya (64) Egypt (52)
Tunisia (79) Cabo Verde (73) Senegal (70) Ukraine (68) Egypt (74) India (76) Tunisia (53)
Moldova (86) Kenya (80) Indonesia (78) Ghana (71) Moldova (80) Cabo Verde (77) India (57)
Ghana (87) Mongolia (84) Côte d'Ivoire (79) Kenya (75) Indonesia (81) Tunisia (78) Viet Nam (59)
Kenya (88) Morocco (89) Kenya (80) Moldova (80) Bhutan (83) Pakistan (82) Moldova (70)
Cabo Verde (90) Viet Nam (90) Mongolia (83) Tunisia (81) Morocco (85) Ghana (84) Indonesia (84)
GLOBAL TALENT IN THE AGE OF ARTIFICIAL INTELLIGENCECHAPTER 1
32 THE GLOBAL TALENT COMPETITIVENESS INDEX 2020
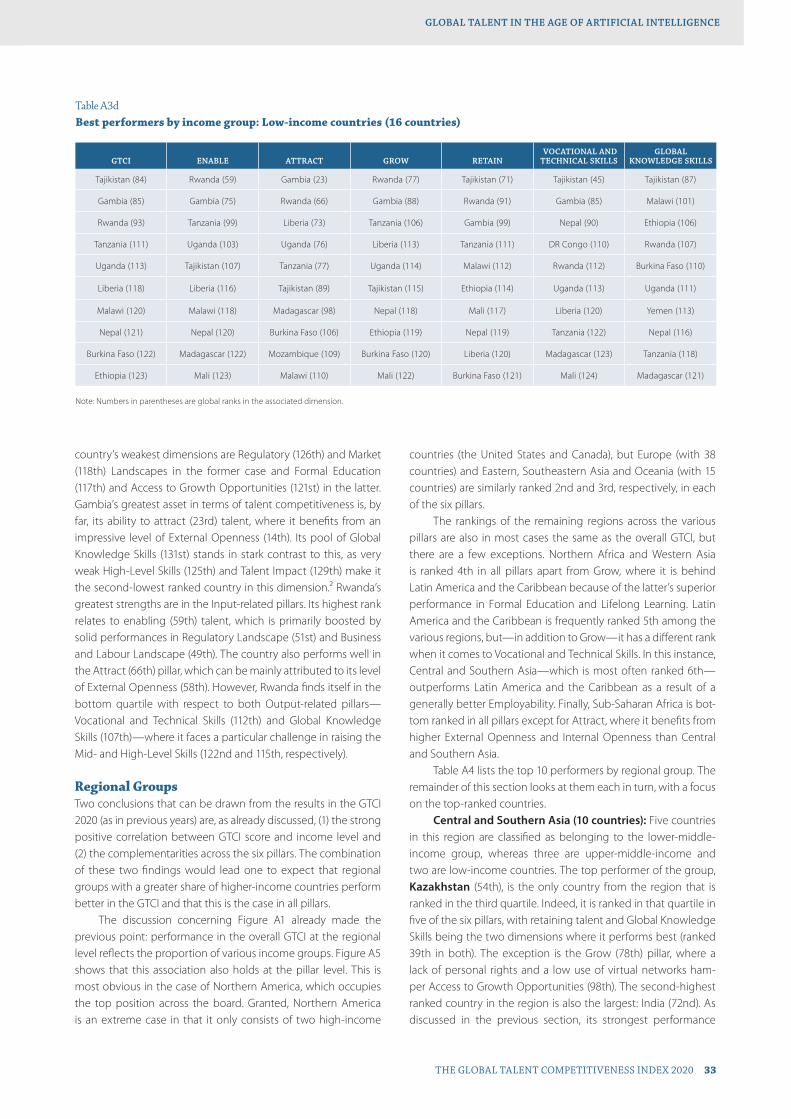
country’s weakest dimensions are Regulatory (126th) and Market (118th) Landscapes in the former case and Formal Education (117th) and Access to Growth Opportunities (121st) in the latter. Gambia’s greatest asset in terms of talent competitiveness is, by far, its ability to attract (23rd) talent, where it benefits from an impressive level of External Openness (14th). Its pool of Global Knowledge Skills (131st) stands in stark contrast to this, as very weak High-Level Skills (125th) and Talent Impact (129th) make it the second-lowest ranked country in this dimension.2 Rwanda’s greatest strengths are in the Input-related pillars. Its highest rank relates to enabling (59th) talent, which is primarily boosted by solid performances in Regulatory Landscape (51st) and Business and Labour Landscape (49th). The country also performs well in the Attract (66th) pillar, which can be mainly attributed to its level of External Openness (58th). However, Rwanda finds itself in the bottom quartile with respect to both Output-related pillars—Vocational and Technical Skills (112th) and Global Knowledge Skills (107th)—where it faces a particular challenge in raising the Mid- and High-Level Skills (122nd and 115th, respectively).
Regional GroupsTwo conclusions that can be drawn from the results in the GTCI 2020 (as in previous years) are, as already discussed, (1) the strong positive correlation between GTCI score and income level and (2) the complementarities across the six pillars. The combination of these two findings would lead one to expect that regional groups with a greater share of higher-income countries perform better in the GTCI and that this is the case in all pillars.
The discussion concerning Figure A1 already made the previous point: performance in the overall GTCI at the regional level reflects the proportion of various income groups. Figure A5 shows that this association also holds at the pillar level. This is most obvious in the case of Northern America, which occupies the top position across the board. Granted, Northern America is an extreme case in that it only consists of two high-income
countries (the United States and Canada), but Europe (with 38 countries) and Eastern, Southeastern Asia and Oceania (with 15 countries) are similarly ranked 2nd and 3rd, respectively, in each of the six pillars.
The rankings of the remaining regions across the various pillars are also in most cases the same as the overall GTCI, but there are a few exceptions. Northern Africa and Western Asia is ranked 4th in all pillars apart from Grow, where it is behind Latin America and the Caribbean because of the latter’s superior performance in Formal Education and Lifelong Learning. Latin America and the Caribbean is frequently ranked 5th among the various regions, but—in addition to Grow—it has a different rank when it comes to Vocational and Technical Skills. In this instance, Central and Southern Asia—which is most often ranked 6th—outperforms Latin America and the Caribbean as a result of a generally better Employability. Finally, Sub-Saharan Africa is bot-tom ranked in all pillars except for Attract, where it benefits from higher External Openness and Internal Openness than Central and Southern Asia.
Table A4 lists the top 10 performers by regional group. The remainder of this section looks at them each in turn, with a focus on the top-ranked countries.
Central and Southern Asia (10 countries): Five countries in this region are classified as belonging to the lower-middle-income group, whereas three are upper-middle-income and two are low-income countries. The top performer of the group, Kazakhstan (54th), is the only country from the region that is ranked in the third quartile. Indeed, it is ranked in that quartile in five of the six pillars, with retaining talent and Global Knowledge Skills being the two dimensions where it performs best (ranked 39th in both). The exception is the Grow (78th) pillar, where a lack of personal rights and a low use of virtual networks ham-per Access to Growth Opportunities (98th). The second-highest ranked country in the region is also the largest: India (72nd). As discussed in the previous section, its strongest performance
Table A3dBest performers by income group: Low-income countries (16 countries)
Note: Numbers in parentheses are global ranks in the associated dimension.
GTCI ENABLE ATTRACT GROW RETAIN VOCATIONAL AND TECHNICAL SKILLS
GLOBAL KNOWLEDGE SKILLS
Tajikistan (84) Rwanda (59) Gambia (23) Rwanda (77) Tajikistan (71) Tajikistan (45) Tajikistan (87)
Gambia (85) Gambia (75) Rwanda (66) Gambia (88) Rwanda (91) Gambia (85) Malawi (101)
Rwanda (93) Tanzania (99) Liberia (73) Tanzania (106) Gambia (99) Nepal (90) Ethiopia (106)
Tanzania (111) Uganda (103) Uganda (76) Liberia (113) Tanzania (111) DR Congo (110) Rwanda (107)
Uganda (113) Tajikistan (107) Tanzania (77) Uganda (114) Malawi (112) Rwanda (112) Burkina Faso (110)
Liberia (118) Liberia (116) Tajikistan (89) Tajikistan (115) Ethiopia (114) Uganda (113) Uganda (111)
Malawi (120) Malawi (118) Madagascar (98) Nepal (118) Mali (117) Liberia (120) Yemen (113)
Nepal (121) Nepal (120) Burkina Faso (106) Ethiopia (119) Nepal (119) Tanzania (122) Nepal (116)
Burkina Faso (122) Madagascar (122) Mozambique (109) Burkina Faso (120) Liberia (120) Madagascar (123) Tanzania (118)
Ethiopia (123) Mali (123) Malawi (110) Mali (122) Burkina Faso (121) Mali (124) Madagascar (121)
GLOBAL TALENT IN THE AGE OF ARTIFICIAL INTELLIGENCE
THE GLOBAL TALENT COMPETITIVENESS INDEX 2020 33
CHAPTER 1
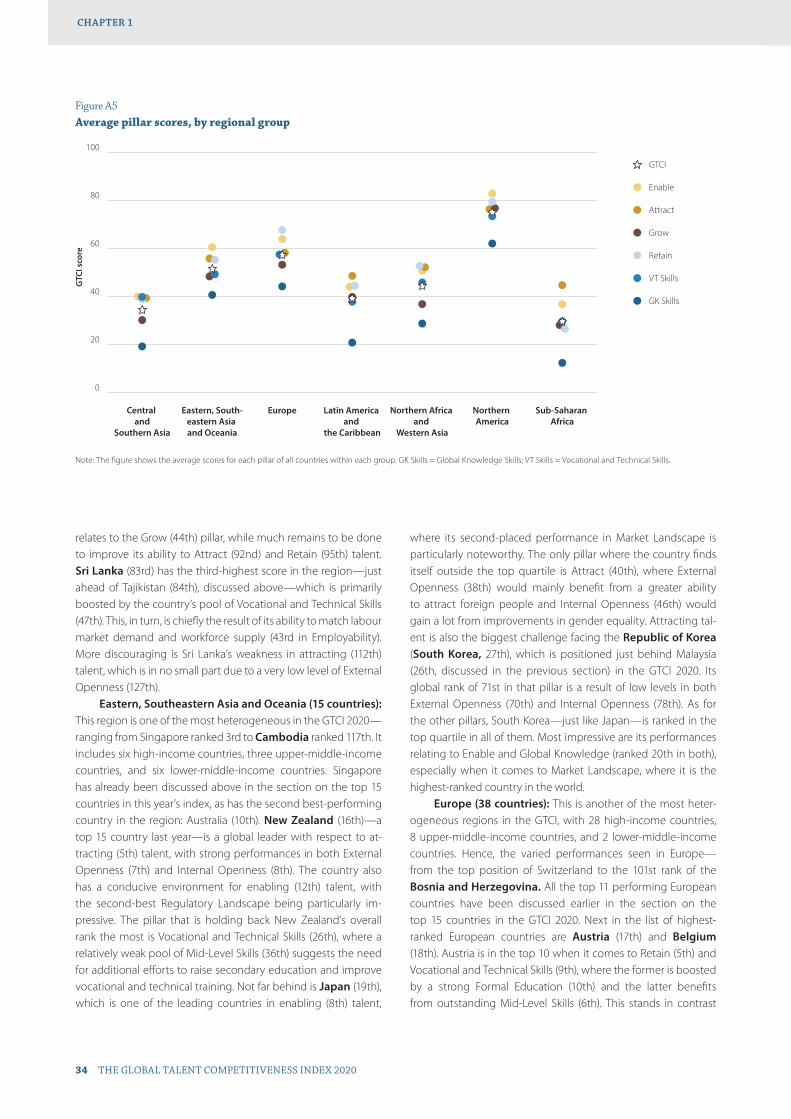
relates to the Grow (44th) pillar, while much remains to be done to improve its ability to Attract (92nd) and Retain (95th) talent. Sri Lanka (83rd) has the third-highest score in the region—just ahead of Tajikistan (84th), discussed above—which is primarily boosted by the country’s pool of Vocational and Technical Skills (47th). This, in turn, is chiefly the result of its ability to match labour market demand and workforce supply (43rd in Employability). More discouraging is Sri Lanka’s weakness in attracting (112th) talent, which is in no small part due to a very low level of External Openness (127th).
Eastern, Southeastern Asia and Oceania (15 countries): This region is one of the most heterogeneous in the GTCI 2020—ranging from Singapore ranked 3rd to Cambodia ranked 117th. It includes six high-income countries, three upper-middle-income countries, and six lower-middle-income countries. Singapore has already been discussed above in the section on the top 15 countries in this year’s index, as has the second best-performing country in the region: Australia (10th). New Zealand (16th)—a top 15 country last year—is a global leader with respect to at-tracting (5th) talent, with strong performances in both External Openness (7th) and Internal Openness (8th). The country also has a conducive environment for enabling (12th) talent, with the second-best Regulatory Landscape being particularly im-pressive. The pillar that is holding back New Zealand’s overall rank the most is Vocational and Technical Skills (26th), where a relatively weak pool of Mid-Level Skills (36th) suggests the need for additional efforts to raise secondary education and improve vocational and technical training. Not far behind is Japan (19th), which is one of the leading countries in enabling (8th) talent,
where its second-placed performance in Market Landscape is particularly noteworthy. The only pillar where the country finds itself outside the top quartile is Attract (40th), where External Openness (38th) would mainly benefit from a greater ability to attract foreign people and Internal Openness (46th) would gain a lot from improvements in gender equality. Attracting tal-ent is also the biggest challenge facing the Republic of Korea (South Korea, 27th), which is positioned just behind Malaysia (26th, discussed in the previous section) in the GTCI 2020. Its global rank of 71st in that pillar is a result of low levels in both External Openness (70th) and Internal Openness (78th). As for the other pillars, South Korea—just like Japan—is ranked in the top quartile in all of them. Most impressive are its performances relating to Enable and Global Knowledge (ranked 20th in both), especially when it comes to Market Landscape, where it is the highest-ranked country in the world.
Europe (38 countries): This is another of the most heter-ogeneous regions in the GTCI, with 28 high-income countries, 8 upper-middle-income countries, and 2 lower-middle-income countries. Hence, the varied performances seen in Europe—from the top position of Switzerland to the 101st rank of the Bosnia and Herzegovina. All the top 11 performing European countries have been discussed earlier in the section on the top 15 countries in the GTCI 2020. Next in the list of highest-ranked European countries are Austria (17th) and Belgium (18th). Austria is in the top 10 when it comes to Retain (5th) and Vocational and Technical Skills (9th), where the former is boosted by a strong Formal Education (10th) and the latter benefits from outstanding Mid-Level Skills (6th). This stands in contrast
Figure A5Average pillar scores, by regional group
0
20
40
60
80
100
GTCI
Sub-Saharan Africa
Northern America
Northern Africa and
Western Asia
Latin America and
the Caribbean
EuropeEastern, South-eastern Asia and Oceania
Central and
Southern Asia
GK Skills
VT Skills
Retain
Attract
Enable
Grow
Note: The figure shows the average scores for each pillar of all countries within each group. GK Skills = Global Knowledge Skills; VT Skills = Vocational and Technical Skills.
GTC
I sco
re
GLOBAL TALENT IN THE AGE OF ARTIFICIAL INTELLIGENCECHAPTER 1
34 THE GLOBAL TALENT COMPETITIVENESS INDEX 2020
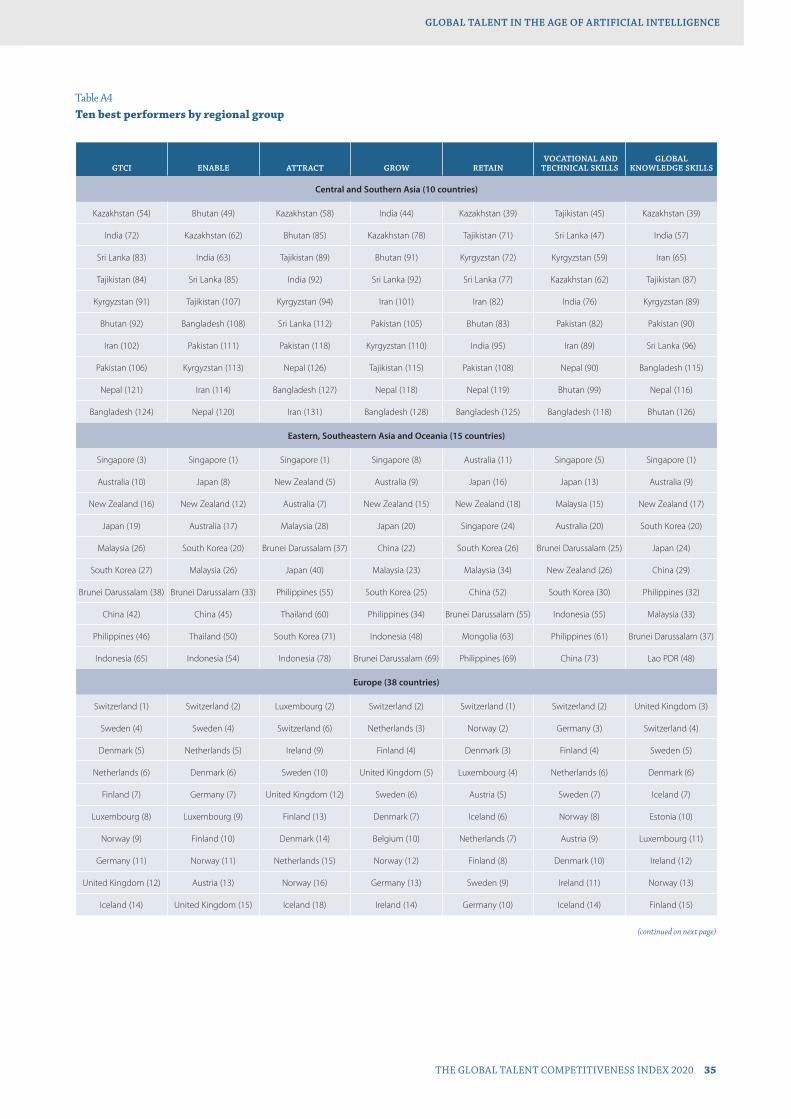
(continued on next page)
Table A4Ten best performers by regional group
GTCI ENABLE ATTRACT GROW RETAIN VOCATIONAL AND TECHNICAL SKILLS
GLOBAL KNOWLEDGE SKILLS
Central and Southern Asia (10 countries)
Kazakhstan (54) Bhutan (49) Kazakhstan (58) India (44) Kazakhstan (39) Tajikistan (45) Kazakhstan (39)
India (72) Kazakhstan (62) Bhutan (85) Kazakhstan (78) Tajikistan (71) Sri Lanka (47) India (57)
Sri Lanka (83) India (63) Tajikistan (89) Bhutan (91) Kyrgyzstan (72) Kyrgyzstan (59) Iran (65)
Tajikistan (84) Sri Lanka (85) India (92) Sri Lanka (92) Sri Lanka (77) Kazakhstan (62) Tajikistan (87)
Kyrgyzstan (91) Tajikistan (107) Kyrgyzstan (94) Iran (101) Iran (82) India (76) Kyrgyzstan (89)
Bhutan (92) Bangladesh (108) Sri Lanka (112) Pakistan (105) Bhutan (83) Pakistan (82) Pakistan (90)
Iran (102) Pakistan (111) Pakistan (118) Kyrgyzstan (110) India (95) Iran (89) Sri Lanka (96)
Pakistan (106) Kyrgyzstan (113) Nepal (126) Tajikistan (115) Pakistan (108) Nepal (90) Bangladesh (115)
Nepal (121) Iran (114) Bangladesh (127) Nepal (118) Nepal (119) Bhutan (99) Nepal (116)
Bangladesh (124) Nepal (120) Iran (131) Bangladesh (128) Bangladesh (125) Bangladesh (118) Bhutan (126)
Eastern, Southeastern Asia and Oceania (15 countries)
Singapore (3) Singapore (1) Singapore (1) Singapore (8) Australia (11) Singapore (5) Singapore (1)
Australia (10) Japan (8) New Zealand (5) Australia (9) Japan (16) Japan (13) Australia (9)
New Zealand (16) New Zealand (12) Australia (7) New Zealand (15) New Zealand (18) Malaysia (15) New Zealand (17)
Japan (19) Australia (17) Malaysia (28) Japan (20) Singapore (24) Australia (20) South Korea (20)
Malaysia (26) South Korea (20) Brunei Darussalam (37) China (22) South Korea (26) Brunei Darussalam (25) Japan (24)
South Korea (27) Malaysia (26) Japan (40) Malaysia (23) Malaysia (34) New Zealand (26) China (29)
Brunei Darussalam (38) Brunei Darussalam (33) Philippines (55) South Korea (25) China (52) South Korea (30) Philippines (32)
China (42) China (45) Thailand (60) Philippines (34) Brunei Darussalam (55) Indonesia (55) Malaysia (33)
Philippines (46) Thailand (50) South Korea (71) Indonesia (48) Mongolia (63) Philippines (61) Brunei Darussalam (37)
Indonesia (65) Indonesia (54) Indonesia (78) Brunei Darussalam (69) Philippines (69) China (73) Lao PDR (48)
Europe (38 countries)
Switzerland (1) Switzerland (2) Luxembourg (2) Switzerland (2) Switzerland (1) Switzerland (2) United Kingdom (3)
Sweden (4) Sweden (4) Switzerland (6) Netherlands (3) Norway (2) Germany (3) Switzerland (4)
Denmark (5) Netherlands (5) Ireland (9) Finland (4) Denmark (3) Finland (4) Sweden (5)
Netherlands (6) Denmark (6) Sweden (10) United Kingdom (5) Luxembourg (4) Netherlands (6) Denmark (6)
Finland (7) Germany (7) United Kingdom (12) Sweden (6) Austria (5) Sweden (7) Iceland (7)
Luxembourg (8) Luxembourg (9) Finland (13) Denmark (7) Iceland (6) Norway (8) Estonia (10)
Norway (9) Finland (10) Denmark (14) Belgium (10) Netherlands (7) Austria (9) Luxembourg (11)
Germany (11) Norway (11) Netherlands (15) Norway (12) Finland (8) Denmark (10) Ireland (12)
United Kingdom (12) Austria (13) Norway (16) Germany (13) Sweden (9) Ireland (11) Norway (13)
Iceland (14) United Kingdom (15) Iceland (18) Ireland (14) Germany (10) Iceland (14) Finland (15)
GLOBAL TALENT IN THE AGE OF ARTIFICIAL INTELLIGENCE
THE GLOBAL TALENT COMPETITIVENESS INDEX 2020 35
CHAPTER 1
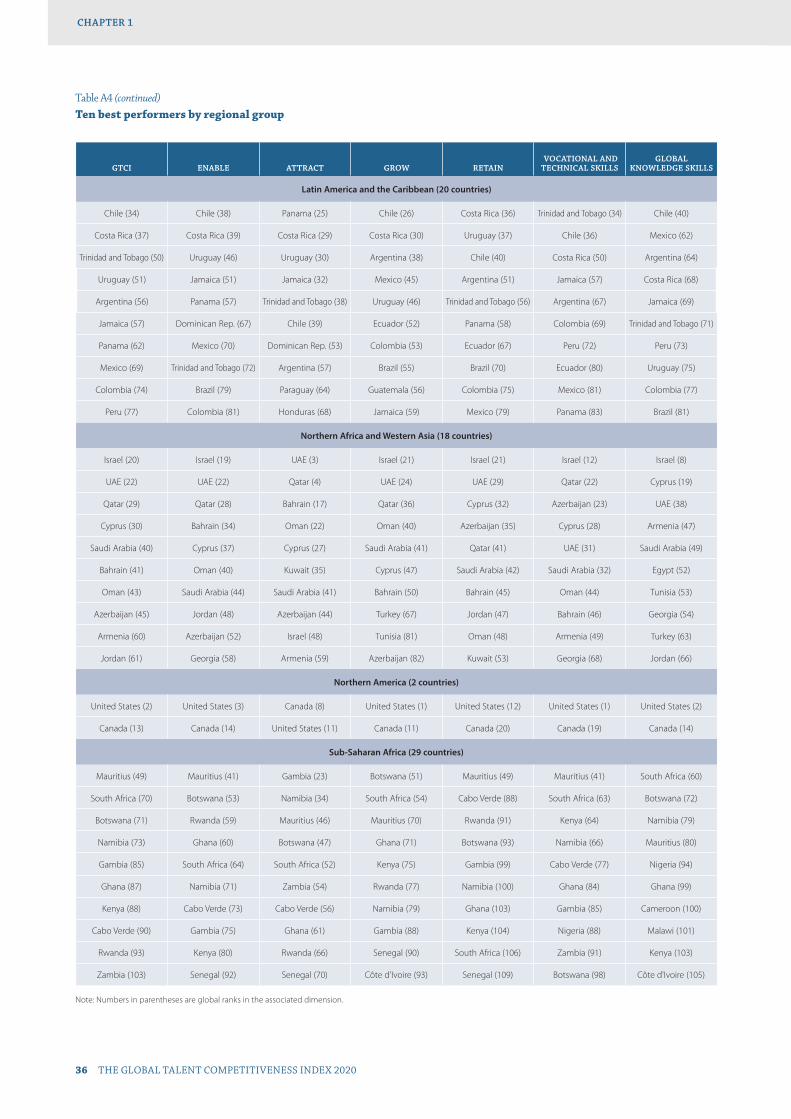
Table A4 (continued)Ten best performers by regional group
GTCI ENABLE ATTRACT GROW RETAIN VOCATIONAL AND TECHNICAL SKILLS
GLOBAL KNOWLEDGE SKILLS
Latin America and the Caribbean (20 countries)
Chile (34) Chile (38) Panama (25) Chile (26) Costa Rica (36) Trinidad and Tobago (34) Chile (40)
Costa Rica (37) Costa Rica (39) Costa Rica (29) Costa Rica (30) Uruguay (37) Chile (36) Mexico (62)
Trinidad and Tobago (50) Uruguay (46) Uruguay (30) Argentina (38) Chile (40) Costa Rica (50) Argentina (64)
Uruguay (51) Jamaica (51) Jamaica (32) Mexico (45) Argentina (51) Jamaica (57) Costa Rica (68)
Argentina (56) Panama (57) Trinidad and Tobago (38) Uruguay (46) Trinidad and Tobago (56) Argentina (67) Jamaica (69)
Jamaica (57) Dominican Rep. (67) Chile (39) Ecuador (52) Panama (58) Colombia (69) Trinidad and Tobago (71)
Panama (62) Mexico (70) Dominican Rep. (53) Colombia (53) Ecuador (67) Peru (72) Peru (73)
Mexico (69) Trinidad and Tobago (72) Argentina (57) Brazil (55) Brazil (70) Ecuador (80) Uruguay (75)
Colombia (74) Brazil (79) Paraguay (64) Guatemala (56) Colombia (75) Mexico (81) Colombia (77)
Peru (77) Colombia (81) Honduras (68) Jamaica (59) Mexico (79) Panama (83) Brazil (81)
Northern Africa and Western Asia (18 countries)
Israel (20) Israel (19) UAE (3) Israel (21) Israel (21) Israel (12) Israel (8)
UAE (22) UAE (22) Qatar (4) UAE (24) UAE (29) Qatar (22) Cyprus (19)
Qatar (29) Qatar (28) Bahrain (17) Qatar (36) Cyprus (32) Azerbaijan (23) UAE (38)
Cyprus (30) Bahrain (34) Oman (22) Oman (40) Azerbaijan (35) Cyprus (28) Armenia (47)
Saudi Arabia (40) Cyprus (37) Cyprus (27) Saudi Arabia (41) Qatar (41) UAE (31) Saudi Arabia (49)
Bahrain (41) Oman (40) Kuwait (35) Cyprus (47) Saudi Arabia (42) Saudi Arabia (32) Egypt (52)
Oman (43) Saudi Arabia (44) Saudi Arabia (41) Bahrain (50) Bahrain (45) Oman (44) Tunisia (53)
Azerbaijan (45) Jordan (48) Azerbaijan (44) Turkey (67) Jordan (47) Bahrain (46) Georgia (54)
Armenia (60) Azerbaijan (52) Israel (48) Tunisia (81) Oman (48) Armenia (49) Turkey (63)
Jordan (61) Georgia (58) Armenia (59) Azerbaijan (82) Kuwait (53) Georgia (68) Jordan (66)
Northern America (2 countries)
United States (2) United States (3) Canada (8) United States (1) United States (12) United States (1) United States (2)
Canada (13) Canada (14) United States (11) Canada (11) Canada (20) Canada (19) Canada (14)
Sub-Saharan Africa (29 countries)
Mauritius (49) Mauritius (41) Gambia (23) Botswana (51) Mauritius (49) Mauritius (41) South Africa (60)
South Africa (70) Botswana (53) Namibia (34) South Africa (54) Cabo Verde (88) South Africa (63) Botswana (72)
Botswana (71) Rwanda (59) Mauritius (46) Mauritius (70) Rwanda (91) Kenya (64) Namibia (79)
Namibia (73) Ghana (60) Botswana (47) Ghana (71) Botswana (93) Namibia (66) Mauritius (80)
Gambia (85) South Africa (64) South Africa (52) Kenya (75) Gambia (99) Cabo Verde (77) Nigeria (94)
Ghana (87) Namibia (71) Zambia (54) Rwanda (77) Namibia (100) Ghana (84) Ghana (99)
Kenya (88) Cabo Verde (73) Cabo Verde (56) Namibia (79) Ghana (103) Gambia (85) Cameroon (100)
Cabo Verde (90) Gambia (75) Ghana (61) Gambia (88) Kenya (104) Nigeria (88) Malawi (101)
Rwanda (93) Kenya (80) Rwanda (66) Senegal (90) South Africa (106) Zambia (91) Kenya (103)
Zambia (103) Senegal (92) Senegal (70) Côte d'Ivoire (93) Senegal (109) Botswana (98) Côte d'Ivoire (105)
Note: Numbers in parentheses are global ranks in the associated dimension.
GLOBAL TALENT IN THE AGE OF ARTIFICIAL INTELLIGENCECHAPTER 1
36 THE GLOBAL TALENT COMPETITIVENESS INDEX 2020

to the country’s weaker pool of High-Level Skills (30th), which impedes its Global Knowledge Skills (25th). Belgium, mean-while, is particularly strong in growing (10th) talent, with solid performances in all three sub-pillars. The dimension with most scope for improvement is Attract (21st), especially as it relates to Internal Openness (25th). The rankings of two of Europe’s largest economies—France (21st) and Italy (36th)—are also mainly im-peded by lacklustre performances in the Attract pillar (36th and 67th, respectively). In the case of France, the low level of Internal Openness (58th) presents the biggest challenge. In the case of Italy, both sub-pillars need to improve considerably (External Openness, 72nd; Internal Openness, 65th). On a more positive note, France finds itself in 17th position with respect to both Grow and Vocational and Technical Skills, while Italy’s showing in Lifestyle (18th) benefits the country’s ability to retain (28th) talent.
Latin America and the Caribbean (20 countries): This region consists primarily of upper-middle-income countries: 12 in total. The eight remaining countries are equally divided in the low- and high-income groups. None of the countries in the re-gion makes it into the top quartile at the global level, although Chile (34th) is as close as it gets. Chile stands out as one of the more consistent performers in the GTCI 2020, with rankings in all six pillars that are near its overall position. That said, the country only finds itself in the top quartile in one dimension, Grow (26th), as a result of solid performances in all associated sub-pillars. Although no particular pillar is much weaker than the others, the weaker performances in the sub-pillars High-Level Skills (64th), Lifestyle (59th), and Business and Labour Landscape (59th) sug-gest the main areas in need of improvement. Costa Rica (37th) is the next-highest performer in the region. Its strengths are pri-marily in the Input-related dimensions, where the ability to at-tract (29th) and grow (30th) talent place the country in the top quartile in those pillars. Of particular note is its relatively high level of Internal Openness (22nd). As for the Output-related pil-lars, Global and Knowledge Skills (68th) is the only one where Costa Rica finds itself below the median, with sub-par perfor-mances in both sub-pillars. When it comes to Vocational and Technical Skills (50th), a strong showing in Employability (23rd) is cancelled out by weak Mid-Level Skills (88th). Both economic powerhouses of the region, Brazil (80th) and Mexico (69th), are below the median in terms of GTCI score. Mexico, like Brazil (al-ready discussed above in the context of BRICS), performs rela-tively well in the Grow (45th) pillar, which is built on fairly solid performances in all three sub-pillars. Its greatest challenge re-lates to Internal Openness (102nd), which decreases the country’s ability to attract (90th) talent.
Northern Africa and Western Asia (18 countries): This is the only region that includes countries from all income groups: eight high-income economies, six upper-middle-in-come economies, three lower-middle-income economies, and one low-income economy. The top three regional countries—Israel (20th), the United Arab Emirates (UAE, 22nd), and Qatar (29th)—are all part of the top quartile in the global rankings. Israel is a top-10 country when it comes Global Knowledge
Skills (8th), where its second-best showing in High-Levels Skills is particularly impressive. The country also puts in a strong per-formance in the other Output-related pillar—Vocational and Technical Skills (12th)—where it is adept at matching labour mar-ket demands and job skills (9th in Employability). The one pillar where Israel is ranked outside the top quartile is Attract (48th), where a very low level of Internal Openness (105th) would pri-marily improve through greater tolerance of minorities and im-migrants. In contrast to Israel, both the UAE and Qatar are among the global leaders when it comes to attracting talent (3rd and 4th, respectively), as a result of impressive levels of both External Openness (3rd and 5th) and Internal Openness (9th and 6th). Whereas Attract is the greatest strength of both countries, they also share the same main weakness: Global Knowledge Skills (UAE, 38th; Qatar, 67th). In the case of the UAE, there is clear scope for improvement in innovation and entrepreneurship (61st in Talent Impact). In the case of Qatar, there is a need to strengthen both sub-pillars (High-Level Skills, 63rd; Talent Impact, 65th). As the table on the regional top 10 shows, Western Asian countries outshine Northern African countries in the GTCI 2020. Indeed, it is the Northern African countries that, together with Yemen (132nd), bring up the rear of the regional rankings. Yemen is the lowest-ranked country in all pillars within the region, but some encouragement can be had from how the country’s High-Level Skills (100th) boosts its pool of Global Knowledge Skills (113th).
Northern America (2 countries): Both Northern American economies—the United States (2nd) and Canada (13th)—feature in the top 15 high performers of this year’s GTCI. As can be seen in the table, the United States tops its neighbouring country in every pillar apart from Attract. It is also the more consistent per-former of the two, ranking inside the top 15 in all pillars. As their performances are extensively discussed in the section on the top 15 of the GTCI 2020, the reader is referred to that section for fur-ther analysis.
Sub-Saharan Africa (29 countries): It has already been seen that this region has the weakest average performance in the GTCI 2020. In fact, no fewer than 20 of the Sub-Saharan African countries are found at the bottom quartile of the index. This is not a surprising result given that 13 of the countries in the region belong to the low-income group, while the rest of Sub-Saharan Africa is represented by 12 lower-middle-income countries and 4 upper-middle-income ones. Mauritius (49th) is the only country in the region that has an overall score above the GTCI median. At the pillar level, this can primarily be attrib-uted to solid performances in enabling talent and Vocational and Technical Skills (41st in both), where the former pillar ben-efits from a strong Regulatory Landscape (35th) and the latter is lifted by the country’s Mid-Level Skills (44th). At the other end of the spectrum, the country’s main challenge is to improve its pool of Global Knowledge Skills (80th), particularly as they relate to High-Level Skills (86th). South Africa (70th) is the second-best-performing country in the region. As discussed in the previous section, the country performs relatively well in five of the six pil-lars but faces a significant challenge in strengthening its ability to retain (106th) talent. Just behind South Africa is Botswana (71st).
GLOBAL TALENT IN THE AGE OF ARTIFICIAL INTELLIGENCE
THE GLOBAL TALENT COMPETITIVENESS INDEX 2020 37
CHAPTER 1
Its main strengths relate to enabling (53rd), attracting (47th), and growing (51st) talent, with the best showings being in the sub-pillars Formal Education (37th), Regulatory Landscape (40th), and Internal Openness (47th). Botswana’s greatest scope for im-provement can be found in the Retain (93rd) and Vocational and Technical Skills (98th) pillars, with weak performances in all the associated sub-pillars.
ENDNOTES 1 Countries are grouped according to the World Bank Income
Classifications. Economies are divided based on their 2018 gross national income (GNI) per capita, calculated using the World Bank Atlas method (see https://blogs.worldbank.org/opendata/new-country-classifications-income-level-2019-2020). The groups are: low income; lower-middle income; upper-middle income; and high income. Regional groups are based on United Nations Regional Classifications: Central and Southern Asia; Eastern, Southeastern Asia and Oceania; Europe; Latin America and the Caribbean; Northern Africa and Western Asia; Northern America; and Sub-Saharan Africa.
2 However, as pointed out in the GTCI 2020 JRC Statistical Audit (Chapter 6), the results that relate to Gambia should be treated with caution in view of the wide range of the associated confidence intervals.
CHAPTER 1
38 THE GLOBAL TALENT COMPETITIVENESS INDEX 2020
Competitiveness Index report demonstrated that entrepreneurial activity in Latin America is very modest.1 The report highlights Chile and Mexico as having robust entrepreneurial talent, which aligns perfectly with the latest AI initiatives in the region, as dem-onstrated in the latest AI readiness rankings of the Government Artificial Intelligence Readiness Index 2019.
The index evaluates AI readiness globally, merging infor-mation from several sources such as the United Nations, World Economic Forum, Global Open Data Index, World Bank, Gartner, and others.2 The ranking system takes into account:
• Governance: Indicators include whether a country has privacy laws in place and a forthcoming AI strategy.
• Infrastructure and data: Indicators include the avail-ability of open-sourced data, data capability within the government, and the government’s procurement of ad-vanced technology products.
This chapter assesses the scope of Artificial Intelligence (AI) sci-ence and technology in Latin America, and Stefanini’s vision of current and future scenarios. The global challenges when it comes to AI are significant, and it’s no different in Latin America. There are a number of Latin American countries leading AI initia-tives—not only in the region but also globally—and these coun-tries are also well-ranked globally in terms of AI development. Finally, at Stefanini we genuinely believe that this unique mo-ment offers a historic opportunity for Latin America to become a global development and delivery leader for AI technology.
CURRENT LANDSCAPEAmong the many requirements and enablers necessary to evolve in the AI field today, entrepreneurship is vital. As technol-ogy advances, limited resources present a challenge; however, it is possible to become a player—and even challenge global lead-ers—with the right amount of creativity and hard work.
Regarding entrepreneurship, last year’s Global Talent
CHAPTER 2
Latin America: The Next Big AI Talent Pool?Fabio Caversan and Marco StefaniniStefanini
LATIN AMERICA: THE NEXT BIG AI TALENT POOL?
THE GLOBAL TALENT COMPETITIVENESS INDEX 2020 39
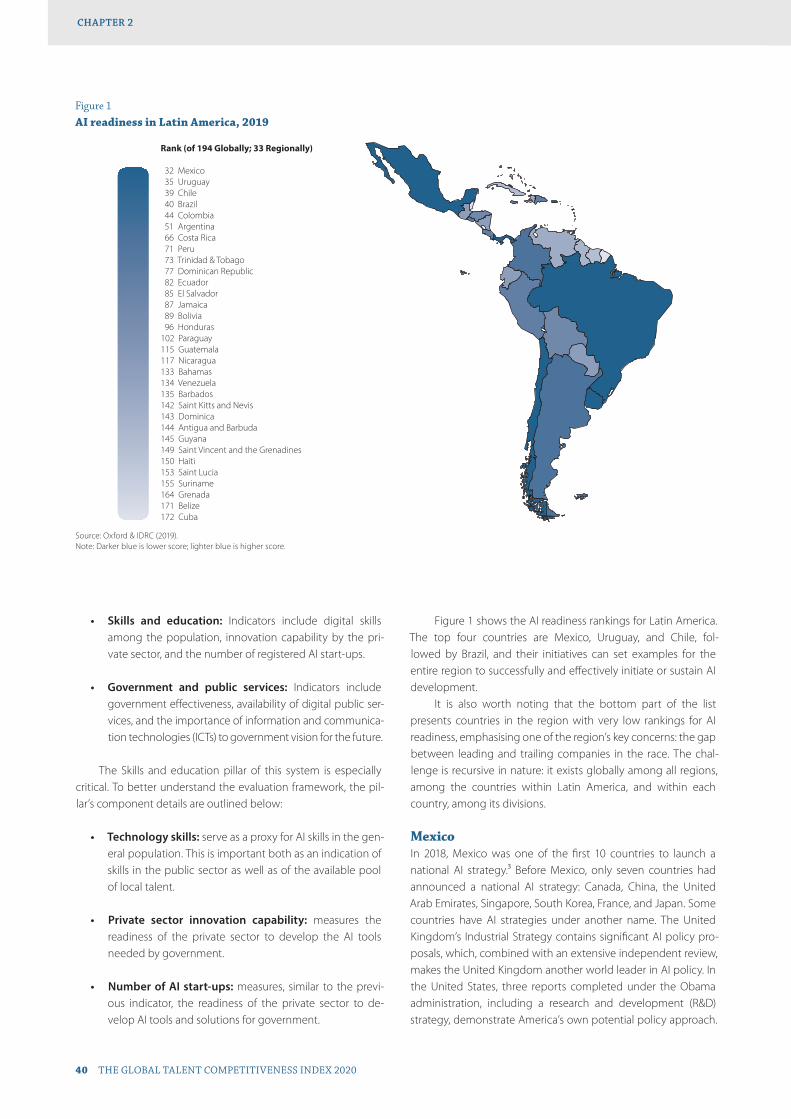
Figure 1 shows the AI readiness rankings for Latin America. The top four countries are Mexico, Uruguay, and Chile, fol-lowed by Brazil, and their initiatives can set examples for the entire region to successfully and effectively initiate or sustain AI development.
It is also worth noting that the bottom part of the list presents countries in the region with very low rankings for AI readiness, emphasising one of the region’s key concerns: the gap between leading and trailing companies in the race. The chal-lenge is recursive in nature: it exists globally among all regions, among the countries within Latin America, and within each country, among its divisions.
MexicoIn 2018, Mexico was one of the first 10 countries to launch a national AI strategy.3 Before Mexico, only seven countries had announced a national AI strategy: Canada, China, the United Arab Emirates, Singapore, South Korea, France, and Japan. Some countries have AI strategies under another name. The United Kingdom’s Industrial Strategy contains significant AI policy pro-posals, which, combined with an extensive independent review, makes the United Kingdom another world leader in AI policy. In the United States, three reports completed under the Obama administration, including a research and development (R&D) strategy, demonstrate America’s own potential policy approach.
• Skills and education: Indicators include digital skills among the population, innovation capability by the pri-vate sector, and the number of registered AI start-ups.
• Government and public services: Indicators include government effectiveness, availability of digital public ser-vices, and the importance of information and communica-tion technologies (ICTs) to government vision for the future.
The Skills and education pillar of this system is especially critical. To better understand the evaluation framework, the pil-lar’s component details are outlined below:
• Technology skills: serve as a proxy for AI skills in the gen-eral population. This is important both as an indication of skills in the public sector as well as of the available pool of local talent.
• Private sector innovation capability: measures the readiness of the private sector to develop the AI tools needed by government.
• Number of AI start-ups: measures, similar to the previ-ous indicator, the readiness of the private sector to de-velop AI tools and solutions for government.
Figure 1AI readiness in Latin America, 2019
Source: Oxford & IDRC (2019).Note: Darker blue is lower score; lighter blue is higher score.
Rank (of 194 Globally; 33 Regionally)
32 Mexico 35 Uruguay 39 Chile 40 Brazil 44 Colombia 51 Argentina 66 Costa Rica 71 Peru 73 Trinidad & Tobago 77 Dominican Republic 82 Ecuador 85 El Salvador 87 Jamaica 89 Bolivia 96 Honduras102 Paraguay115 Guatemala117 Nicaragua133 Bahamas134 Venezuela135 Barbados142 Saint Kitts and Nevis143 Dominica144 Antigua and Barbuda145 Guyana149 Saint Vincent and the Grenadines150 Haiti153 Saint Lucia155 Suriname164 Grenada171 Belize172 Cuba
LATIN AMERICA: THE NEXT BIG AI TALENT POOL?CHAPTER 2
40 THE GLOBAL TALENT COMPETITIVENESS INDEX 2020

Mexico was the first country in Latin America to publicly an-nounce a national AI strategy. Figure 2 shows the timeline of the various country strategies and policy statements.
See below the initial framework of Mexico’s national AI strategy:4
• Creation of a sub-commission for AI within the exist-ing Commission for Development of the Electronic Government
• Mapping use cases and needs of industry, and identifying best practices within government
• Promoting Mexico’s international leadership in digital policy, following Organisation for Economic Co-operation and Development (OECD) policies
• Opening up the recommendations of the report for pub-lic consultation
• Working with experts and citizens through the AI sub-committee to ensure the continuity of these efforts with future governments
Unlike the other countries, Mexico has focused on the social impacts of AI, with case studies using AI to achieve social goals, such as increasing financial inclusion, combating corruption, improving public health, and reducing crime. There is a unique vision among groups that focus on using AI ethically and respon-sibly to ensure that AI can promote benefits for all Mexican citi-zens.5 This focus, combined with the closeness to economy and cultures of both South and North America, places Mexico in an ideal spot to progress rapidly in AI.
UruguayFollowing Mexico, in April 2019 Uruguay established a public consultation to create an AI strategy for the digital government. It was divided into four phases, and at the time of publication,
the fourth phase of the consultation was already underway. Final documentation is expected to be ready by the end of 2019.6
Part of Uruguay’s strategy is that anyone—regardless of whether or not they are from Uruguay—can add comments and suggestions to the plan, to be submitted for revision. To date, the four pillars of the strategy are:
1. AI governance in public administration: Ensure princi-ples comply with the recommendations indicated in the AI strategy document. The main goals are to identify the existing AI ecosystem in Uruguay and define a governance model.
2. Development of AI capabilities: Foster the generation of the skills necessary to develop AI in public administration and knowledge exchange between public and private, and national and international AI initiatives.
3. Use and application of AI: Generate technical guides for the proper use of AI in public administration, promote transparency of used algorithms, and design specific action plans in strategic sectors.
4. AI and digital citizenship: Develop public awareness and trust as well as campaigns to inform citizens about AI and how is it being used by the public administration. Promote the development of digital intelligence to enhance involve-ment, participation, and apprehension in the development and application of AI solutions.
ChileStart-Up Chile (SUP) is a public start-up accelerator created by the Chilean government in 2010 to help entrepreneurs bootstrap their start-ups and use Chile as a foundation. Today, Start-Up Chile is the leading accelerator in Latin America, among the top 10 globally, and one of the biggest and most diverse start-up communities in the world.7 Businesses also receive mentoring, workshops, co-working office space, and access to
Figure 2Timeline of AI strategies and policy statements
Source: Martinho-Truswell et al. (2018).
2016 2017 2018
OCT NOV DEC JAN FEB MAR APR MAY JUN JUL AUG SEP OCT NOV DEC JAN FEB MAR APR MAY
USA AIReports
USA AIReports
France AIStrategy
Japan AIStrategy
Canada AIStrategy
Singapore AIStrategy
China AIStrategy
UAE AIStrategy
Mexico AIStrategy
UKIndustrialStrategy
South Korea AIStrategy
LATIN AMERICA: THE NEXT BIG AI TALENT POOL?
THE GLOBAL TALENT COMPETITIVENESS INDEX 2020 41
CHAPTER 2

investors. In return, they are asked to give something back to lo-cal society—such as taking part in hackathons or giving talks at universities.8
Entrepreneurs are encouraged and supported by govern-ment incentives and programmes, along with the proper tech-nical education. Currently, SUP has approximately 20 start-ups focusing mainly on AI, in addition to the start-ups that use AI indirectly in Aerospace, Robotics, Smart Factories, and other sectors.
Furthermore, in August 2019, Chile’s president announced a plan to enable Chile to participate successfully in the fourth industrial revolution. The Ministry of Science, Technology, and Innovation will be responsible for developing an AI strategic plan, which will entail innovations in various areas such as healthcare, education, and production. The process will happen in 2020 and will address three main areas:
• The elements required to enable AI, such as specialist human skills, fibre-optic networks, and computational infrastructure
• How AI should be developed and used in Chile• The ethics, standards, security, and regulations that should
apply to this technology
BrazilBrazil has defined a strategy for digital transformation that will include AI, among several other dimensions.9 The government already approved the document, which presents the vision and strategic actions it will execute to leverage a digital transforma-tion within institutions and throughout the entire economy. The plan is divided into seven main aspects: infrastructure, R&D, pri-vacy and security of digital data, education, international digi-tal relations, digital economy, and, finally, digital citizenship and government.
AI is included as part of R&D, but it can also be found in other directives. Brazil’s government recognises a need for a specific strategy addressing AI, and its Ministry of Science, Technology, Innovation and Communications (MCTIC) is engaged with UNESCO to start planning the process. One of the elements of the plan is to have a public consultation, similar to the one ex-ecuted by Uruguay, in late 2019 or early 2020.
Brazil is also engaged in international discussions about AI and has adopted the recommendations of the OECD’s Principles on Artificial Intelligence. Data available from MCTIC indicate there are already incentives from the institutions to around 60 start-ups focusing on AI in the country.
OPPORTUNITIES AND CHALLENGESAlthough Latin America is not entirely out of the AI game—and the region has good examples of AI initiatives among the top-ranked AI-ready countries—there are still a lot of challenges to positioning the region as a relevant global player. According to research by Endeavor, which surveyed more than 240 companies in Latin America, these major challenges include:
• Lack of specialised AI talent: This is not an exclusive Latin America problem, but a worldwide problem.
• Lack of data to use in AI systems: The region must start to think more about data gathering. This is a challenge that top-ranked AI countries realized a while ago and are working harder to improve.
• Insufficient or incorrect understanding of AI tech-nology in the marketplace: The belief that AI will solve a problem miraculously is fiction. Society must be edu-cated on the realities of the technology.
• Insufficient funding: Investments of this kind require a leap of faith and significant financial resources, which are hard to find in the region.
As illustrated in Figure 3, the two main challenges are tech-nology adoption, which is related to the lack of understanding of AI technology, and investment. The survey’s results are some-thing to keep in mind when thinking about opportunities for the region: lack of understanding and lack of investment walk hand in hand; given that this dichotomy exists in other regions, this might be a golden opportunity for Latin America.
When it comes to the availability and development of AI talent and skills, LinkedIn’s analysis presented in Figure 4 (evalu-ated by Perisic) demonstrates that AI skills and talent among the workforce in both Brazil (ranked 16th) and Mexico (ranked 21st) is sizable compared to the rest of the world, with a lot of room for improvement to approach the global leaders.10
The challenge here is that all of the countries ranked above Brazil and Mexico need more people. There is a war for talent among Google, Amazon, Microsoft, Facebook, Apple, Alibaba, Baidu, and other major firms, and they are recruiting and relocat-ing talent out of Latin America if they have the right skills.
From another perspective, if the challenge for Latin America is fostering and retaining skilled talent and entrepreneurs, there
Figure 3Main challenges to AI development in Latin America
Source: Endeavor (2018).Note: Survey respondents were asked to identify the biggest challenge to AI
development in Latin America.
0
10
20
30
40
DataInvestmentTechnologyadoption
Businessmodel
Talent
Perc
enta
ge o
f res
pond
ents
LATIN AMERICA: THE NEXT BIG AI TALENT POOL?CHAPTER 2
42 THE GLOBAL TALENT COMPETITIVENESS INDEX 2020

also need to be analyses of the activities of the majority of the workforce. McKinsey & Company, for example, has estimated the number of full-time equivalents (FTEs) that will be automated by 2030 in various countries and regions globally, including Latin America.11 Its research forecasts 15.7 million FTEs will be automated in Brazil, 8.8 million in Mexico, and just 0.2 million in Costa Rica. By contrast, estimates for China (111.2 million) and the United States (38.6 million) are much greater, illustrating further why Latin America must start to take action as soon as possible to align with advancements in AI.
AI automation is inevitable and is going to strike countries in Latin America hard. The region must immediately start the necessary and fundamental actions to shift the workforce to-wards the new roles and challenges required by this potentially large market.
Looking more deeply at what AI skills are currently most prevalent in the region, analyses from Endeavor reveal that the majority of the companies in Latin America that are applying AI technologies in their businesses are working primarily with clas-sification (58%), prediction (58%), and natural-language (52%) re-lated technologies. Interestingly, these technologies are on the fringes of the field at the moment.12
To build such applications, one concern is whether com-panies are working in basic or even applied research to expand
the boundaries of the AI field, or if they are leveraging current technologies to do so. Additional research from Endeavor dem-onstrates that, for now, Latin America is using, like most of the world, technology developed and made available from large AI technology enablers to build their AI applications. For example, 42% of companies analysed have purchased Microsoft AI ser-vices while 32% are using Google Tensorflow.13
The resources and talent required to expand the field of AI in Latin America today are certainly a huge challenge. Yet it is clear—when analysing the data presented in this chapter—that there are also a lot of opportunities in the region:
• A few countries in the region are well positioned in terms of governance, skills, and infrastructure in the AI field.
• Market adoption and investments are still low in terms of volume.
• Much of the region’s workforce could be replaced by AI systems.
• Talent already exists but, just like the rest of the world, is not enough to handle the need.
Although these can be viewed as challenges, together, they also present a historic opportunity to transform Latin America into a large AI talent pool. Opportunities can be evaluated for their short- and long-term effects and grouped into three as-pects: (1) people, (2) infrastructure, and (3) science, technology, and investments.
PeopleWhether in the short or long term, Latin America needs to heav-ily drive the workforce towards AI skills. People are the most im-portant aspect of the technological revolution. However, with the exponential advances of technology, the main challenge, as discussed in last year’s Global Talent Competitiveness Index, is how to prepare people for future jobs.14
In the coming decade, it’s likely that many professions will be extinct, and that several others will rise. This will require people who are well prepared for learning new skills. AI is a rich field not only for applications within AI; but AI also empowers advances in other fields, like autonomous vehicles, quantum computing, and brain-machine interfaces. What professions will emerge when highly theoretical research becomes a product that we use daily? Furthermore, how can Latin America prepare its workforce for that future?
Arguably the most important skill is the ability to learn and adapt. The ever-growing worldwide knowledge gap is also in-creasing in Latin America: people with more resources can ac-cess the best tools and education, leapfrogging them ahead of the overall population. Fortunately, technology has enabled al-ternatives that offer opportunities to more people as well.
Initiatives like the Khan Academy15 and Code.org16 are good examples of how knowledge can be available to everyone. Those were pioneers in the field, funded by large companies (also in search of talent). Today, there is a wide range of similar tools, and many are free or affordable. As more and more con-tent becomes available online—especially related to AI—it is
Figure 4AI skills penetration, by country
Source: Perisic (2018), https://economicgraph.linkedin.com/blog/how-artificial-intelligence-is-already-impacting-todays-jobs
Note: Country comparison is benchmarked by benching every country against the United States; thus, the country index reflects how much AI skills penetrate a country’s occupations relative to the United States over a three-year period. See https://economicgraph.linkedin.com/blog/how-artificial-intelligence-is-already-impacting-todays-jobs for more details.
0.0 0.2 0.4 0.6 0.8 1.0
Argentina
Mexico
South Africa
Belgium
Turkey
Italy
Brazil
Australia
Poland
Netherlands
United Kingdom
Sweden
Singapore
Spain
France
Canada
Switzerland
Germany
Israel
India
China
United States
LATIN AMERICA: THE NEXT BIG AI TALENT POOL?
THE GLOBAL TALENT COMPETITIVENESS INDEX 2020 43
CHAPTER 2
https://economicgraph.linkedin.com/blog/how-artificial-intelligence-is-already-impacting-todays-jobs
https://economicgraph.linkedin.com/blog/how-artificial-intelligence-is-already-impacting-todays-jobs
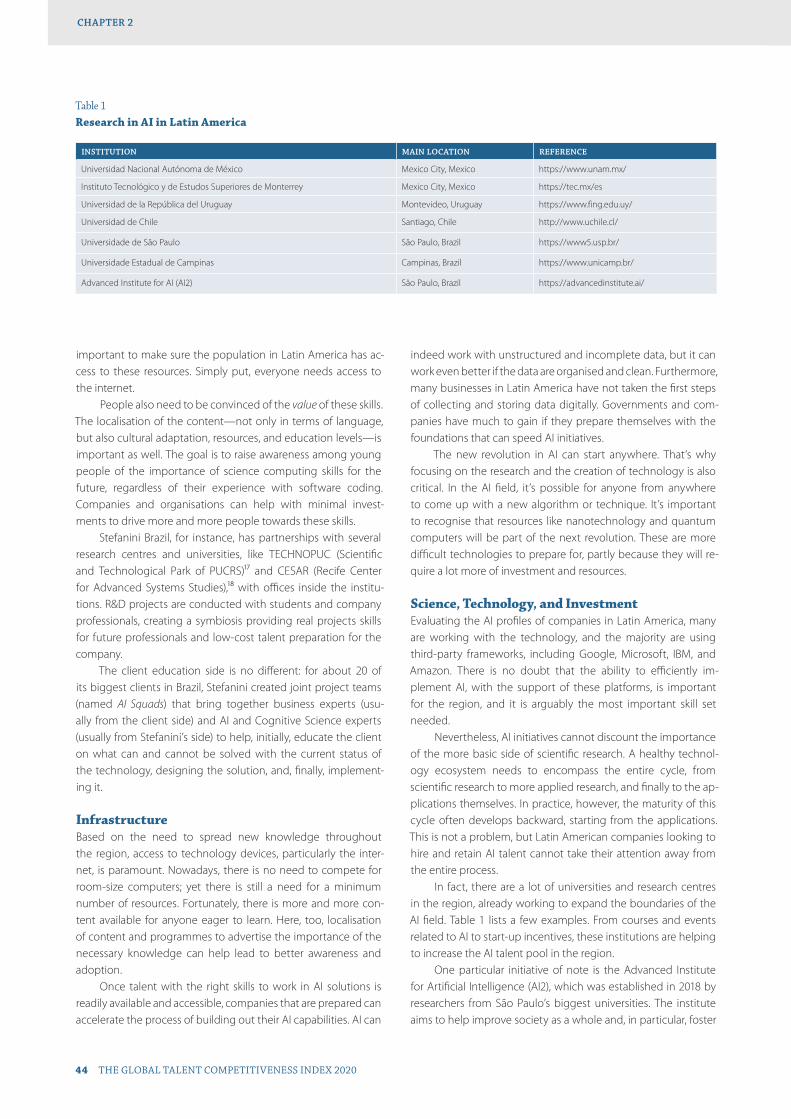
important to make sure the population in Latin America has ac-cess to these resources. Simply put, everyone needs access to the internet.
People also need to be convinced of the value of these skills. The localisation of the content—not only in terms of language, but also cultural adaptation, resources, and education levels—is important as well. The goal is to raise awareness among young people of the importance of science computing skills for the future, regardless of their experience with software coding. Companies and organisations can help with minimal invest-ments to drive more and more people towards these skills.
Stefanini Brazil, for instance, has partnerships with several research centres and universities, like TECHNOPUC (Scientific and Technological Park of PUCRS)17 and CESAR (Recife Center for Advanced Systems Studies),18 with offices inside the institu-tions. R&D projects are conducted with students and company professionals, creating a symbiosis providing real projects skills for future professionals and low-cost talent preparation for the company.
The client education side is no different: for about 20 of its biggest clients in Brazil, Stefanini created joint project teams (named AI Squads) that bring together business experts (usu-ally from the client side) and AI and Cognitive Science experts (usually from Stefanini’s side) to help, initially, educate the client on what can and cannot be solved with the current status of the technology, designing the solution, and, finally, implement-ing it.
InfrastructureBased on the need to spread new knowledge throughout the region, access to technology devices, particularly the inter-net, is paramount. Nowadays, there is no need to compete for room-size computers; yet there is still a need for a minimum number of resources. Fortunately, there is more and more con-tent available for anyone eager to learn. Here, too, localisation of content and programmes to advertise the importance of the necessary knowledge can help lead to better awareness and adoption.
Once talent with the right skills to work in AI solutions is readily available and accessible, companies that are prepared can accelerate the process of building out their AI capabilities. AI can
indeed work with unstructured and incomplete data, but it can work even better if the data are organised and clean. Furthermore, many businesses in Latin America have not taken the first steps of collecting and storing data digitally. Governments and com-panies have much to gain if they prepare themselves with the foundations that can speed AI initiatives.
The new revolution in AI can start anywhere. That’s why focusing on the research and the creation of technology is also critical. In the AI field, it’s possible for anyone from anywhere to come up with a new algorithm or technique. It’s important to recognise that resources like nanotechnology and quantum computers will be part of the next revolution. These are more difficult technologies to prepare for, partly because they will re-quire a lot more of investment and resources.
Science, Technology, and InvestmentEvaluating the AI profiles of companies in Latin America, many are working with the technology, and the majority are using third-party frameworks, including Google, Microsoft, IBM, and Amazon. There is no doubt that the ability to efficiently im-plement AI, with the support of these platforms, is important for the region, and it is arguably the most important skill set needed.
Nevertheless, AI initiatives cannot discount the importance of the more basic side of scientific research. A healthy technol-ogy ecosystem needs to encompass the entire cycle, from scientific research to more applied research, and finally to the ap-plications themselves. In practice, however, the maturity of this cycle often develops backward, starting from the applications. This is not a problem, but Latin American companies looking to hire and retain AI talent cannot take their attention away from the entire process.
In fact, there are a lot of universities and research centres in the region, already working to expand the boundaries of the AI field. Table 1 lists a few examples. From courses and events related to AI to start-up incentives, these institutions are helping to increase the AI talent pool in the region.
One particular initiative of note is the Advanced Institute for Artificial Intelligence (AI2), which was established in 2018 by researchers from São Paulo’s biggest universities. The institute aims to help improve society as a whole and, in particular, foster
Table 1Research in AI in Latin America
INSTITUTION MAIN LOCATION REFERENCE
Universidad Nacional Autónoma de México Mexico City, Mexico https://www.unam.mx/
Instituto Tecnológico y de Estudos Superiores de Monterrey Mexico City, Mexico https://tec.mx/es
Universidad de la República del Uruguay Montevideo, Uruguay https://www.fing.edu.uy/
Universidad de Chile Santiago, Chile http://www.uchile.cl/
Universidade de São Paulo São Paulo, Brazil https://www5.usp.br/
Universidade Estadual de Campinas Campinas, Brazil https://www.unicamp.br/
Advanced Institute for AI (AI2) São Paulo, Brazil https://advancedinstitute.ai/
LATIN AMERICA: THE NEXT BIG AI TALENT POOL?CHAPTER 2
44 THE GLOBAL TALENT COMPETITIVENESS INDEX 2020

growth in this area to help Brazil engage in the state-of-the-art advances in the field. AI2 is a good example of a partnership between academic and private institutions that brings cutting-edge scientific tools to Brazil that are not readily available in the region.
The path to successful AI development begins, at a mini-mum, with internet access that can enable the population to ob-tain the basic skills. A few countries in Latin America are already at this initial stage, although internet access does yet not reach the entire population. Beyond internet access, people will need access to devices or cloud services that provide access to proper AI-specific tools. The final stage is to work and research with state-of-the-art platforms and equipment. This final challenge can be addressed only when the first two are solved. Ongoing development of the region might enable access to more ad-vanced technology in the future.
CONCLUSIONThe AI revolution—like many revolutions in history—presents challenges, opportunities, and risks for governments, countries, and workers in Latin America. Opportunities and risks are alike, though at opposite ends of the spectrum: We can drastically either increase or decrease the growing gap that exists today between the population with access to resources and those without it. Technology can be a blessing, a curse, and—more often than not—both.
After analysing many countries’ strategies, it is clear there are a lot of similarities throughout the region: public consultations, a focus on the social aspects, and talent fostering. At Stefanini, we propose that Latin America countries try to gather and create a joint strategy for AI in the region. That would increase the poten-tial of the region to be an AI talent pool.
People must be educated and trained in the AI field. Short-term requirements include mathematics, computer science, and AI tools. For the long term, talent must develop skills in neuro-science, machine learning, and, especially, problem-solving, in addition to self-learning, adaptation, and mindset. There are also other job roles not necessarily threatened by automation but that are helpful for AI development: artists and designers, computer engineers and specialists, education professionals and support workers, and managers and executives.
We believe it is important for companies to invest in the AI field—preferably, joining or creating one of the AI centres in the region. This could be an opportunity to attract investment from the leading AI countries in Latin America since there is a war for talent in the area and talent is getting more expensive in the world’s leading AI countries.
Finally, we would like to restate that it is a truly golden op-portunity in Latin America to become a ‘global delivery centre’ for AI applications and projects. Doing so will help draw invest-ments from leading countries looking for talent. It’s worth not-ing that governments and companies must plan to retain the talent in the region. For example, approximately 20 years ago India positioned itself as a general Delivery Center of IT. Looking at how high the country is ranked in Figure 4, it is clear the strat-egy worked.
As the AI revolution takes off in Latin America, people will be driven towards the field. We believe that will help to reduce social inequalities and increase the likelihood of basic research flourishing throughout the region. If institutions take this oppor-tunity now, they will not only be able to apply the technology to properly develop the region, but also effectively participate in the creation of new science fields and technologies that will shape the future of humankind.
ENDNOTES 1 INSEAD (2019).
2 Oxford & IDRC (2019).
3 Martinho-Trusswell, et al. (2018).
4 For Mexico’s official AI strategy, see Zapata (2018): https://www.gob.mx/mexicodigital/articulos/estrategia-de-inteligencia-artificial-mx-2018
5 Armenta (2019).
6 AGESIC (2019). See the public consultation here: https://www.gub.uy/participacionciudadana/consultapublica/legislation_proposals
7 SUP (2019).
8 Larsson (2019).
9 E-Digital (2018).
10 Perisic (2018).
11 McKinsey & Company (2018).
12 Endeavor (2018).
13 Ibid.
14 INSEAD (2019).
15 Further information about Khan Academy is available at https://www.khanacademy.org/
16 Further information about Code.org is available at https://code.org
17 See http://www.pucrs.br/tecnopuc/ for more information.
18 Further information about CESAR is available at https://www.cesar.org.br/
REFERENCESAGESIC. (2019). Estrategia de IA para el Gobierno Digital, available at https://www.
gub.uy/participacionciudadana/consultapublica/legislation_proposals/ 3-consulta-publica-propuesta-de-la-estrategia-de-inteligencia-artificial-para-el-gobierno-digital
Armenta, M.H. (2019). Estrategia Nacional de Inteligencia Artificial va por sentido ético y responsible, available at https://www.forbes.com.mx/estrategia-nacional-de-inteligencia-artificial-va-por-sentido-etico-y-responsable/
E-Digital. (2018). Estratégia Brasileira para Transformação Digital, available at www.mctic.gov.br/estrategiadigital
Endeavor. (2018). El Impacto de la Inteligencia Artificial en el Emprendimiento, available at http://contenido.endeavor.org.mx/inteligenciaartificial
Gob.cl. (2019). The Government announces an Artificial Intelligence Plan to be developed by the Science Ministry, available at https://www.gob.cl/en/news/government-announces-artificial-intelligence-plan-be-developed-science-ministry/
INSEAD. (2019). 2019 Global Talent Competitiveness Index: Nurturing entrepreneurial talent identified as key to the competitiveness of nations and cities, available at https://www.insead.edu/news/2019-global-talent-competitiveness-index-nurturing-entrepreneurial-talent-identified-as-key-to-competitiveness
Larsson, N. (2016). Welcome to Chilecon Valley: A startup hub with its own special charm. The Guardian, 22 December. Available at https://www.theguardian.com/small-business-network/2016/dec/22/chile-accelerator-startup-grants
LATIN AMERICA: THE NEXT BIG AI TALENT POOL?
THE GLOBAL TALENT COMPETITIVENESS INDEX 2020 45
CHAPTER 2

LATINX. (2019). LatinX in AI Coalition, available at http://www.latinxinai.org/
Martinho-Truswell, E., Miller, H., Asare, I. N., Petheram, A., Stirling, R., Gómez Mont., C., & Martinez, C. (2018). Towards an AI Strategy for Mexico: Harnessing the AI Revolution, White Paper, available at https://www.oxfordinsights.com/mexico/
Montoya, L. (2019). Latin American Government AI Readiness Meta-Analysis. Medium, 8 July. Available at https://medium.com/latinxinai/latin-american-government-ai-readiness-meta-analysis-ed66f114182f
McKinsey & Company. (2018). How will automation affect economies around the world?, available at https://www.mckinsey.com/featured-insights/future-of-work/how-will-automation-affect-economies-around-the-world
OECD (Organisation for Economic Co-operation and Development). (2019). OECD Principles on Artificial Intelligence, available at https://www.oecd.org/going-digital/ai/principles/
Oxford Insights & the IDRC (International Development Research Centre). (2019). Government Artificial Intelligence Readiness Index 2019, available at https://www.oxfordinsights.com/ai-readiness2019
Persic, I. (2018). How artificial intelligence is already impacting today’s jobs, available at https://economicgraph.linkedin.com/blog/how-artificial-intelligence-is-already-impacting-todays-jobs
SUP (Start-up Chile). (2019). Start-Up Chile, available at https://www.startupchile.org/
Zapata, E. (2018). Estrategia de Inteligencia Artificial MX 2018, available at https://datos.gob.mx/blog/estrategia-de-inteligencia-artificial-mx-2018 ?category=noticias&tag=nula
CHAPTER 2
46 THE GLOBAL TALENT COMPETITIVENESS INDEX 2020
https://economicgraph.linkedin.com/blog/how-artificial-intelligence-is-already-impacting-todays-jobs
In terms of AI and talent, a human-centric approach is generally considered necessary. Why do you think that is? Are smaller economies such as Luxembourg advantaged or disadvantaged in that context?
Nicolas Schmit:We are aware that Luxembourg’s future lies with being very high performing in new technologies, especially in ICT [information and communication technologies] and the development of these technologies and their application. I think it’s important for all countries and for all economies. But it’s even more impor-tant for a smaller country that is very much focused on services. First, we have to keep a very high level of good performance overall and specifically in ICT networks. So infrastructure and particularly information infrastructure is of utmost importance (i.e., there must be high-speed internet everywhere). To achieve this you need a strategy to implement that. The second element is the diffusion of new technologies in the economy and in the
The advance of Artificial Intelligence (AI) technologies is not only changing the nature of work but also forcing a re-evaluation of workplace practices, corporate structures, and innovation ecosys-tems. As machines and algorithms continue to absorb a multiplicity of tasks and responsibilities and almost every job gets reinvented, the right talent is required not only to adapt but also to capture value from this transformative technology. At this critical juncture, it is im-portant to understand how strategies for embedding AI in corporate settings and institutional frameworks compare in different countries.
In September, 2019, the GTCI team con-ducted an interview with Nicolas Schmit, before he became European Commissioner in charge of the ‘Jobs and Social Rights’ portfolio, to learn about how his native Luxembourg is approaching the opportunities and
changes brought about by AI as well as the prospects and chal-lenges for the European Union as a whole.
A SPECIAL GTCI INTERVIEW
AI and Talent Competitiveness: Luxembourg and the European UnionAn interview with Nicolas SchmitEuropean Union Commissioner for Jobs and Social Rights
AI AND TALENT COMPETITIVENESS: LUXEMBOURG AND THE EUROPEAN UNION
THE GLOBAL TALENT COMPETITIVENESS INDEX 2020 47

society. This might distinguish this new technological revolution from the previous ones. This is not a revolution affecting just the economic sector, but also the whole society. It is important that you favour a positive and open though also critical attitude towards this technological revolution. This means also that you have to provide guarantees in terms of data protection and pri-vacy, for example. Another point, which is very important for me, is the human aspect: It is crucial because when people talk about the fourth industrial revolution, they always think about AI. They think about robots and so they forget the most impor-tant, which is the human perspective. We need to keep control and command over technology to ensure that our values are not lost in the process. Establishing the required new relationship between humans and machines is a massive challenge.
We also need to master globalisation: Hypercompetitive wages and the massification of production in goods and ser-vices will be emphasised by the rise of AI. This should be of par-ticular concern to smaller economies. More generally, AI will also need to be embedded in corporate settings and institutional frameworks. The more intelligent the machines are, the more we can get out of them: They can be of tremendous help and trans-form our world of work. Certainly, this will change industrial pat-terns internationally. But we have to make sure that we still have control over the processes involved, as they will affect all dimen-sions of our lives: Data are the ‘new oil’ in all sectors from health to energy, from mobility to finance, and they are now usable in ways that could not be envisaged before. Now we start to have possibilities for really exploring and exploiting these data. This not only changes the economy, but also creates new economic possibilities. I think this is a great opportunity for everyone, re-gardless of whether we live in a large or a small country, because it transcends national borders.
As AI becomes the obvious liaison between data and society’s most valuable products and services, how can it become a concrete source of competitive advantage, and what opportunities do you see that AI will offer?
Nicolas Schmit:In the example of Luxembourg, we want to be a data hub. Therefore we have to encourage ways to own or share the re-ally big powerful computers that can handle big data. Such an approach will have a significant employment impact, as repeti-tive jobs vanish and new ones are created. Some sectors, like fi-nance—which is key to the economy of Luxembourg—will be deeply transformed: Tomorrow’s banks will be closer to fintech’s. This means that the changes to come will not be just techno-logical but also organisational. For a small economy like that of Luxembourg, this implies the ability to make strategic choices very swiftly.
* Luxembourg is the second-largest financial centre in the world and the first in Europe, with 144 banks, more than 3,800 investments funds, and 320 insurance and rein-surance and 10 payments institutions.
For many observers of talent worldwide, Luxembourg is a typical example of the consequences of brain gain; * the country has now reached the top 10 in GTCI rankings. How replicable is such a strategy? More generally, how can countries produce, attract, grow, and retain talent in the age of AI?
Nicolas Schmit:Well, our world is a world of competition where no country should rest on its laurels. Winners are the ones who are perma-nently proactive (as opposed to reactive) and have an ambitious digital strategy that they can reinvent every day. This is what in-novation is about. But we also have to promote cultural and so-cial innovation. This implies huge investments in education, and in the required continuous up-skilling of the workforce. We have to adopt the frameworks legally but also financially, to make a country all the more attractive to the outside world. I believe that’s what Luxembourg, at the country level, has been good at, and this helped us retain our talent (born and educated here), not to mention our capacity to develop in fields such as medical sciences and health, where research is being conducted thor-oughly via the use of AI.
What makes a country attractive for global talents? I would say having good living conditions, safety, social protection and social services, good education, good jobs, interesting cultural offerings, a clean environment, a good pension system, and finally connectivity to other European cities are all crucially im-portant. All the above create a very positive and sustainable eco-system (sustainability being highly regarded by highly educated talents) that benefits from technology and AI. Simultaneously, countries also need to work on their weaknesses (for example, in Luxembourg housing is expensive—both for locals and ex-pats—but the fact that public transportation will be free as of 2020 is seen very positively). The goal is for the citizens to feel as though they’re contributing to the country’s success, while man-aging to be even more successful themselves! As such, they offer their knowledge and competencies in exchange for recognition. Overall, countries should meticulously choose which are the areas where they can really develop excellence, as this creates a positive dynamic. This circles back to the importance of talents in a globalised economy. In such a complex world, Luxembourg made some efforts to be a bit less complex—that is, making things easier for start-ups and individuals (i.e., immigration, wel-coming culture and being cosmopolitan, for example), simply because technology is more or less the same everywhere, so at the end of the day, what really makes a difference are the soft skills. A creative branding of the country—based on realities and not just dreams—is therefore a must.
AI AND TALENT COMPETITIVENESS: LUXEMBOURG AND THE EUROPEAN UNIONA SPECIAL GTCI INTERVIEW
48 THE GLOBAL TALENT COMPETITIVENESS INDEX 2020
How can we aim to include AI skills in European governments’ talent strategies and modernise Europe’s education and training systems?
Nicolas Schmit:One of the big challenges that some countries may have is to figure out how to deal with all the anxiety around AI potentially cancelling the need for certain jobs. People get afraid of what’s going to happen to their roles and to their companies. I didn’t have really the feeling that in Luxembourg people are so scared about that aspect. Why? Because, globally speaking, the labour market is still good. So the people who are worried might be the ones already facing certain levels of unemployment, coupled with some resistance to work in a field that’s different from the one in which they studied or specialised. Hence the importance of up-skilling and re-skilling. As a Minister, I contributed to the creation of a special school, Fit4Coding, * teaching people from different areas how to code over a four-month period. The suc-cess is very encouraging (after three months, 80% of them found a job). I’m not a pessimist regarding the future of AI and jobs, as I believe this future depends on us, on how we organise the world of work—probably we have to totally change the way people work. This can translate into greater opportunities.
All in all, I believe workforces must be re-skilled much more often, whether this process touches on hard, soft, or technical skills. There will therefore be a greater overlap between educa-tion and professional lives. As technology becomes more and more autonomous, the idea behind the notion of a ‘skills bridge’ is that first we want to encourage companies to develop their own digital strategies as fast and as efficiently as possible, and to anticipate what kind of new technological change they will have to adapt to. Only then can they start working on reducing and filling the identified skills gaps, collaborating with social partners as needed. Along with re-skilling the workforce, we have to up-skill and create programmes to do so (promoting mobility be-tween firms and even between sectors). I would imagine that governments would support that, and individuals would keep their salaries during a hybrid work/training professional transi-tion. Looking for alternative jobs when one is made redundant is another challenge, and we shall have to reduce the periods of unemployment during transitions. However, re-skilling is only second best: Up-skilling remains the optimal solution. We should always fight for a win-win situation. Lifelong training and vocational training are therefore crucial resources and should be expanded to all kinds of jobs. More and more universities are tak-ing this approach because individuals are more and more keen on learning during their entire lives—this undoubtedly benefits society!
* For information about the Fit4Coding initiative, see http://luxembourg.public.lu/en/actualites/2016/10/17-fit4coding/index.html
As a European Commissioner in charge of the Jobs and Social Rights portfolio, what is your plan of action to harness digitalisation as a tool for positive transformation in the long run, and to leverage AI and innovation to ensure global competitiveness?
Nicolas Schmit:Personally, I believe that in such complex endeavours, col-laboration is key. I look forward to collaborating with other Commissioners—mainly with Margrethe Vestager, who over-sees the digital portfolio, because I think employment and digital are undeniably intertwined. I am also looking forward to working with Frans Timmermans, the Commissioner in charge of Sustainable Development & Climate, because this also has a very strong impact on employment. We really have to make sure that there is good coordination between those who are in charge of such key areas and what happens on the employment front, and how job transfers can be organised in a harmonious and sus-tainable fashion. Moreover, we should learn from each other as the increasing need of AI mostly translates into a social transition, which is key to an efficient technological transition involving skilling, social protection, and social cohesion. As AI will trans-form everything—from the way we produce to how we con-sume and how we drive our cars, for example—we should really put the right resources into development, into research, into at-tracting talents, and into placing Europe at the highest level of this technological development, to better position Europe as a technological frontrunner on the global stage. With the current United States–China duopoly, this sense of urgency needs to be communicated. There is also, in parallel, a productivity debate as productivity gains seem to have slowed down, possibly since we are creating a lot of jobs where productivity is low (i.e., certain services), and also partly as a result of our slowing demographic evolution. Could this challenge be somewhat compensated for by AI and more sustainable technologies? This, for me, is one of the key challenges for Europe in the coming decade.
Can we hope for a narrative able to explain the challenges and the opportunities of AI to a broad and diverse population such as the European one?
Nicolas Schmit:Indeed, the risk is that one can be afraid of the AI revolution, in the same way that there were risks in previous industrial revolu-tions. This is a narrative we have to work on. Technology should not be discriminatory. We need to make it open to as many people as possible. Particular attention should be paid to ad-dressing the gender gap, for example. Macroeconomics is the responsibility of governments. But the most immediate effects
AI AND TALENT COMPETITIVENESS: LUXEMBOURG AND THE EUROPEAN UNION
THE GLOBAL TALENT COMPETITIVENESS INDEX 2020 49
A SPECIAL GTCI INTERVIEW
of AI will be felt at the micro-level—that is, the organisation level. Hence, we need to enhance the narrative at that level. As I men-tioned before, we need to keep the ‘broader picture’ in mind, and to consider sustainability, climate change, and the need for a human-centric approach to technological change. Hence the need to redesign the way companies function and how we produce, and which criteria should be used to define success-ful companies. This is a big challenge because it goes to the core of our economic system. This is particularly important for younger generation, for whom values and meaning are key; this is why I plan on collaborating with the new Commissioner for Innovation and Youth, Mariya Gabriel. I personally believe in the power of dreamers and in the wisdom of the next generation of leaders, and all that we can all learn from their fears—but also from their hopes. There is clearly a worldwide need for a stronger Europe, leading towards the notion of a more ethical AI model, that should be somewhere between government-controlled models (such as China’s) on one hand and the highly capitalistic hypercompetitive approaches that prevail in countries such as the United States. Europe can and should insist on giving the highest priority to values and ethics. AI may be one of the key areas in which Ursula von der Leyen’s Commission will carry a visible and operational value. Such an ethical approach is highly valuable: It should not make things impossible, but it should also put clear limitations when necessary. As such, technology should be a tool to promote democracy through AI, and to measure its impact in our global, hyper-connected world.
As so many jobs are being reinvented and increasingly automated, which jobs are, in your opinion, the most exposed to competition from AI? Which soft and hard skills do you believe should be developed as a priority in such a context?
Nicolas Schmit:First off, all jobs will be transformed at some point or another, hence the re-skilling imperative. Second, the more repetitive a job is, the less creative it is, and the less room for initiative there is in it, the more easily it can be replaced by machines. So the challenge will be to improve living conditions and the environ-ment, to care for the elderly and children, and so on and so forth. So, we have to rethink in that way, which means that we have to organise the transfer for very highly performing sectors through these activities. For example, why do we need a radiologist when machines can work on conducting exams and compare millions of X-rays and MRIs [magnetic resonance imaging scans]? The radiologist will still be important in the end because the ma-chine will provide only the analyses—the radiologist still needs to make the final decision, communicate it, and take the patient through a human-to-human conversation. Therefore, the soft skills (communication, empathy) will remain crucial, and need to be emphasised in our education systems.
Now, certainly some jobs will disappear. But there will also be jobs created. We do not know which ones exactly—yet!—but we need to be prepared. In Europe, there are hundreds of
thousands of vacancies in the ICT sector that we cannot fill. This shows that our system that produces talent is lagging far behind current and future needs. This is due to the inadequacy of our education system, but also to a lack of awareness among many young people, who have difficulties envisaging their future and the training they should aim for. These gaps have been reduced and there is going to somehow be a competition that is going to be even more acute in AI to identify and address those gaps. For any minister of labour, this is a very difficult equation to resolve over the course of a few years’ mandate. I believe we should be more creative in thinking about fundamental changes and not just looking at typologies and employment slots. Business for good, as they say, also should be good for business. In a time of major disruptions, like climate change and deep technological transformation, companies have to rethink their organisational model. It cannot be focused on the short term and on maximisa-tion of profit. Their purposes should be much larger. This is also a revolution we need if we want to be up to the vital challenges of our time. To miss this could have disastrous consequences. This is an area where Europe can make its mark, and it will be also one of my key objectives as EU Commissioner for Jobs and Social Rights.
A SPECIAL GTCI INTERVIEW
50 THE GLOBAL TALENT COMPETITIVENESS INDEX 2020

CHAPTER 3
Preparing for Economic Transformation through Human-Centred AIKarine Perset, Andrew Wyckoff, and Alistair NolanOrganisation for Economic Co-operation and Development (OECD)
Artificial Intelligence (AI) is an emerging general-purpose tech-nology with the potential to improve prediction and enable better decision-making—leading to enhanced productivity and improved well-being—and address complex scientific and soci-etal challenges.
As it diffuses across the economy, AI is expected to change the nature of work, complementing humans in some tasks, re-placing them in others, and generating entirely new types of work. Apart from routine manual and cognitive tasks, AI technol-ogies are beginning to perform a range of non-routine and hard-to-codify tasks across the skills spectrum. AI has the potential to augment labour productivity, raising demand for workers and creating job opportunities. Profound changes in labour markets associated with AI will require policies that help workers in all functions and all sectors of the economy to adjust.
As jobs change, so will the skills required of workers. AI is expected to increase demand for three broad types of skills:
(1) specialist skills to programme and develop AI applications, such as skills for fundamental research, engineering, AI applica-tions, data science, and computational thinking; (2) generic skills, which form the basis for continuous acquisition of new techni-cal skills in a world where technological change is rapid; and (3) skills that are complementary to AI, such as critical thinking and creativity. Education and training policies will have to adjust to strengthen skills development. Also needed will be new edu-cational initiatives, changes to curricula, better and more com-prehensive systems of lifelong learning, and the use of advanced digital technologies to deliver skills.
In addition to its impact on the workforce, AI could widen economic divides between people, companies of different sizes, and countries and continents. That’s why policies and programmes should work to minimise negative outcomes and broaden access to AI for individuals, companies, and sectors in danger of being left behind—while also addressing issues of AI
Note: Avi Goldfarb, University of Toronto, and Mario Cervantes, Senior Policy Analyst for the OECD, collaborated on the development of this chapter.
PREPARING FOR ECONOMIC TRANSFORMATION THROUGH HUMAN-CENTRED AI
THE GLOBAL TALENT COMPETITIVENESS INDEX 2020 51

AI AND THE FUTURE OF WORKAs it diffuses across sectors, AI is widely expected to change the nature of work —complementing humans in some tasks, replac-ing them in others, and generating new types of work.
AI Is Expected to Improve Productivity in a Number of WaysSome activities previously carried out by people will be auto-mated. AI can also make previously automated tasks better and faster. Machine autonomy enables systems to operate and adapt to circumstances with reduced or no human control.1 And AI systems will augment human capabilities directly—for instance, through AI coaches (research on 12 developed economies esti-mated that AI could increase labour productivity by up to 40% by 2035 compared to expected baseline levels).2 For example, IBM’s Watson assists client advisors at Crédit Mutuel, a French bank, to field client questions 60% faster.3 Alibaba’s chatbot handled more than 95% of customer inquiries during a 2017 sale, allowing human customer representatives to handle more complicated or personal issues.4
Human-AI teams could be more productive than either AI or workers alone through better coordination and circulation of information. For example, human-AI teams in BMW factories in-creased manufacturing productivity by 85% compared to non-integrated teams. And when a human radiologist worked with AI models to screen chest X-rays for tuberculosis, net accuracy reached 100%—higher than AI or human methods alone.5
AI techniques, coupled with big data, could help compa-nies identify suitable roles for workers or match people to jobs. IBM uses AI to optimise employee training, recommending train-ing modules to employees based on their past performance, ca-reer goals, and IBM skills needs. Companies such as KeenCorp and Vibe have developed text analytics techniques to help com-panies parse employee communications to help assess metrics such as morale, worker productivity, and network effects.
Increasing worker productivity could result in higher wages, since each individual employee produces more value-added, higher profits, or lower prices of goods and services for con-sumers, or a combination of all three. All of these results can sup-port job creation through different channels.
AI is Expected to Change—Perhaps Accelerate—the Tasks that Can Be AutomatedComputers have tended to reduce employment in middle-skill occupations involving many routine tasks. However, AI-powered applications can increasingly perform relatively complex tasks that involve prediction, including transcription, translation, driving vehicles, diagnosing illness, and answering customer inquiries.
AI’s Impact on Jobs Will Depend on Its Speed of Diffusion across Different SectorsAutonomous vehicles, for instance, are widely expected to dis-rupt driving and delivery service jobs. Established truck com-panies such as Volvo and Daimler are competing with start-ups like Kodiak and Einride to develop and test driverless trucks.
safety and privacy. Given the possible scale of AI’s impacts on the labour market, and the likelihood that many in the workforce will need to adapt, up-skill and re-skill, and other concerns raised by AI, stakeholders across all sectors of government, industry, and policymaking will need to develop human-centred approaches to AI.
ECONOMIC CHARACTERISTICS OF AI
AI Enables Prediction for Decision-MakingRecent advances in AI can either decrease the cost of prediction or improve the quality of predictions available at the same cost. Better prediction can generate new knowledge used to create new products and services, improve labour productivity, and decrease the material inputs used per unit of production, such as energy, which can contribute to sustainable development objectives.
Machine Prediction Can Substitute for Human PredictionAs machine prediction becomes less expensive, machines will begin to substitute for humans in prediction tasks. For example, AI applications can predict the risk of loan default more accu-rately than bankers. And AI is already quicker and more accurate than most humans in performing transcription, filling in missing information on the set of symbols that match spoken words.
Data, Action, and Judgement Complement Machine PredictionWhile prediction is a key input into decision-making, a pre-diction is not a decision. Decisions require data, actions, and judgement, which can be considered complements to AI. Data comprise the information that goes into a prediction. Some ac-tions are inherently more valuable when performed by a human (e.g., actions by professional athletes, child carers, or salespeople). Perhaps even more important to decision-making is judgement: the process of determining the reward to a particular action in a particular environment.
AI Requires Complementary Investments and Process ChangesAI requires investments in data collection and curation, talent to use the data and engineer essential digital hardware, and pro-cess changes to take advantage of new opportunities arising from reduced uncertainty. The scope of opportunities offered by better predictions will vary. For example, Google, Baidu, and other large digital platform companies are well-positioned to benefit from major investments in AI. They already have systems in place to collect data and enough customers to justify the fixed costs of investment in the necessary technology. However, most other businesses have not fully digitised their workflows and cannot yet apply AI tools directly to existing processes. As the costs of implementing AI fall over time, these businesses will recognise the opportunities made possible by reducing a range of uncertainties.
PREPARING FOR ECONOMIC TRANSFORMATION THROUGH HUMAN-CENTRED AICHAPTER 3
52 THE GLOBAL TALENT COMPETITIVENESS INDEX 2020

Some 50% to 70% of the 6.4 million professional trucking jobs in the United States and Europe could be eliminated by 2030.6 However, new jobs will be created in parallel, for instance, to provide support services for the increased number of driverless trucks.
AI Technologies Are Also Likely to Impact Higher-Skilled TasksAI technologies are already performing prediction tasks tradi-tionally performed by higher-skilled workers. For instance, a ro-botic lawyer has successfully appealed over $12 million worth of traffic tickets.7 In 2016, IBM’s Watson and DeepMind Health out-performed human doctors in diagnosing rare cancers.
AI also has the potential to transform science. For example, AI systems can assist human scientists by extracting information from millions of scientific papers. They can automate, reduce error rates, and improve reproducibility in certain experimental processes. It is already possible to physically implement a labora-tory automation system that exploits techniques from AI—com-bined with robotics—to execute closed-loop cycles of scientific experimentation. Figure 1 illustrates how iterative cycles of hypothesis-driven experimentation allow for the autonomous generation of new scientific knowledge.8
AI Can Create New Types of WorkAbilities in critical thinking, creativity, and empathy can comple-ment AI-enabled prediction and increase demand for occupa-tions that leverage those abilities.9
• Data and machine learning (ML) experts. Specialists are needed to create and clean data and to program and de-velop AI applications (though they are unlikely to gener-ate large numbers of new tasks for workers).
• Personal services. Humans will increasingly perform work to improve each other’s lives, such as physical coaching and care for the terminally ill. But even in personal services, machines will likely play a complementary role.
• Roles requiring judgement to determine what to predict. When AI is used for prediction, a human must decide what to predict and what to do with the predictions. Posing dilemmas, interpreting situations, and extracting meaning from text requires people with judgement and qualities such as fairness.
• Roles requiring judgement to decide what to do with a predic-tion. A decision cannot be made with a prediction alone; it also requires considerations of individual preferences, for instance.
Predictions Regarding AI’s Net Impact on the Quantity of Work Vary WidelyOver the past five years, widely varying estimates have been made of the overall impacts of automation on job loss.10 Frey and Osborne (2017) predict that 47% of US jobs are at risk of displace-ment in the next 10 to 15 years.11 The McKinsey Global Institute
Figure 1Hypothesis-driven, closed-loop learning
Source: OECD (2018c).
System model and knowledge base
Execution of experiments on an automated robotic system
Experiment generation and design
Update the system model
Execution of experiments on an automated robotic system
New knowledgeAnalysis of results
by statistics and machine learning
Collection of experimental
observations and other meta-data
Combined human-machine
cognition
Cycles of automated hypotheses generation
and experimentation
PREPARING FOR ECONOMIC TRANSFORMATION THROUGH HUMAN-CENTRED AI
THE GLOBAL TALENT COMPETITIVENESS INDEX 2020 53
CHAPTER 3

found in 2017 that about one-third of activities in 60% of jobs are automatable.12
Based on existing technologies, 14% of jobs in OECD mem-ber countries are at high risk of automation, and another 32% of workers could see substantial change in how their jobs are carried out.13 Recent OECD analysis finds employment decline in occupations classified as ‘highly automatable’ in 82% of regions across 16 European countries. At the same time, the analysis identifies an increase in ‘low automation’ jobs in 60% of regions sufficient to offset job loss. This research supports the idea that automation may be shifting the mix of jobs, without driving down overall employment.14 Anticipating future job creation in new areas is challenging. One study estimated that AI would lead to a net job creation of 2 million by 2025.15
AI Will Change the Nature of WorkAI may also help make work more intellectually stimulating by automating routine tasks, allowing more flexible work and possibly a better work-life balance. The diffusion of AI in the workplace also further modifies the duration of work by ena-bling 24/7 cycles across the globe, and by requiring or enabling greater flexibility in human work hours. AI will enable more auto-mation of dangerous tasks. For example, the current renaissance in space exploration is being enabled by AI-enabled robotic sys-tems that allow machines to carry out tasks too dangerous for humans.
Parameters for Organisational Change Will Need to Be SetThe imperative is growing for new or revised industry stand-ards and technological agreements between management and workers to promote reliable, safe, and productive workplaces. The European Economic and Social Committee (EESC) recom-mended that ‘stakeholders to work together on complementary AI systems and their co-creation in the workplace’.16 Workplaces also need flexibility, while safeguarding workers’ autonomy and job quality. The recent collective agreement between the German sector union IG Metall and employers (Gesamtmetall) provides an economic case for variable working times.17
Using AI to Support Labour Market Functions—with Safeguards—Is Also PromisingAI and other digital technologies could improve innovative and personalised approaches to job-search and hiring processes, and enhance the efficiency of labour supply-and-demand matching. LinkedIn uses AI to help recruiters find the right can-didates for the right jobs. It draws on the profiles and activities of the platform’s 650 million registered users. And projects to de-velop labour market information using AI are already underway in Finland, the Czech Republic, and Latvia.
Governing the Use of Workers’ DataWhile AI requires large data sets to be productive, there are some potential risks for individual workers. Agreements on the use of workers’ data are emerging in some countries. France’s Orange France Telecom and five trade union centres were among the
first to settle on commitments to protect employee data. Future provisions could include establishing data governance bodies—ensuring accountability with respect to (personal) data use—and agreements on data portability, explanation, and deletion rights.18
Policies for Managing the AI Transition, Including Social Protection, Are CriticalLabour markets could be disrupted as technology outpaces or-ganisational adaptation. Some sectors are likely to grow, while others decline. Existing jobs may disappear, while new ones are created. Policies for managing the transition include social safety nets, health insurance, progressive taxation of labour and capi-tal, and education and training. Attention should also be paid to competition policies and other policies that might affect con-centration, market power, and income distribution.19
BUILDING THE TALENT BASE TO BENEFIT FROM AI
As Jobs Change, so Will the Skills Required of WorkersAs jobs change, so will the talents and skills required of workers. Education policy is expected to require adjustments to expand lifelong learning, training, and skills development. AI is expected to generate demand in three skills areas. Specialist skills will be needed to programme and develop AI applications. These could include skills for AI-related fundamental research, engineering, and applications, as well as data science and computational thinking. Generic skills will be needed to acquire more special-ised skills as technology evolves. AI will also need complemen-tary skills, such as critical thinking, creativity, and know-how relating to entrepreneurship.20
Initiatives to Build and Develop AI Skills Are Required to Address Growing AI Talent ShortagesSmall and medium-sized enterprises (SMEs), universities, and re-search centres already compete with dominant firms for talent. Initiatives to build and develop AI skills are emerging in the pub-lic, private, and academic sectors. For instance, the Singaporean government has set up a five-year research programme on governance of AI and data use at the Singapore Management University.21 The Massachusetts Institute of Technology (MIT) has committed $1 billion to create the Schwarzman College of Computing, which aims to equip students and research-ers in all disciplines to use computing and AI to advance their disciplines.
Some countries have begun streamlining immigration pro-cesses for high-skilled experts. For example, the United Kingdom doubled the number of its Tier 1 (Exceptional Talent) visas to 2,000 a year and streamlined the process for top students and researchers to work there.22 Similarly, Canada introduced two-week processing times for visa applications from high-skilled workers as well as visa exemptions for short-term research
PREPARING FOR ECONOMIC TRANSFORMATION THROUGH HUMAN-CENTRED AICHAPTER 3
54 THE GLOBAL TALENT COMPETITIVENESS INDEX 2020
assignments—part of its 2017 Global Skills Strategy to attract tal-ented workers and researchers from abroad.23
All OECD countries assess skills needs over the medium and long term. For example, Finland proposed the Artificial Intelligence Programme, which includes a skills account or voucher-based lifelong learning programme to create demand for education and training.24 The United Kingdom is promoting a diverse AI workforce and investing about £406 million ($530 mil-lion) in skills focusing on science, technology, engineering and mathematics, and computer science teachers.25
Skills for AI: Logic, Data Analysis, and Computer ScienceThree traditional subjects can provide learners and workers with a fundamental understanding of AI: logic, data analysis (statistics), and computer science. Logic is currently not taught in schools in many countries—and is almost not taught at all in universities outside of specialised courses in computer science, philosophy, and law. This means that few students are trained to understand the fundamental role of logic in AI.26 Data analysis is as funda-mental as logic but is also seldom taught in schools. Most data analysis taught to non-specialists is based on classical statistics developed in the early 20th century and deals with such top-ics as hypothesis testing, confidence intervals, and simple opti-misation methods, which present philosophical and technical problems.27
Complementary SkillsAI practitioners must now be multi-disciplinary—specialised in one area such as economics, biology, or law, but also skilled in AI techniques such as machine learning (ML). In this vein, in October 2018 MIT announced the most significant change to its structure in 50 years: a new school of computing that will sit outside the engineering discipline and intertwine with all other academic departments. ‘Soft’ skills are also important: critical judgement, analysis, and interpersonal communication.28 In 2021, the OECD will include a module in the Programme for International Student Assessment (PISA) to test creative and criti-cal thinking skills.
CREATING AN ENABLING ENVIRONMENT FOR INCLUSIVE INNOVATION IN AI
Ensuring that AI Development Is Equitable Is a Growing PriorityCurrently, technology, skills, data sets, and computing power are concentrated in just a few companies and nations. AI could also perpetuate biases and have a particularly unfavour-able impact on vulnerable and under-represented populations.29 Canada’s International Development Research Centre recently recommended the formation of a global AI for Development fund to ensure the benefits of AI are well distributed and lead to more egalitarian societies. Inclusive and sustainable AI is also an area of focus for companies such as Microsoft, as well as academic groups such as the Berkman Klein Center at Harvard University.
Long-Term Investment in Public Research Can Help Shape AI InnovationPolicymakers will need to reconsider the appropriate level of government involvement in AI research to address societal challenges.30 In addition, research institutions in all areas will re-quire capable AI systems to remain competitive, particularly in biomedical science and the life sciences, which may call for new investments. Japan, for example, invests more than $120 million annually in high-performance computing infrastructure for uni-versities and public research centres.
AI Will Require Greater Technology InfrastructureMany of the existing tools to manage and use AI—such as TensorFlow (Google), Michelangelo (Uber), and Cognitive Toolkit (Microsoft)—are open-source, and some companies and research-ers share curated training data sets and training tools publicly.
However, as AI projects move from concept to commercial application, specialised and expensive cloud computing and graphic-processing units are often needed. In addition, AI sys-tems depend on extraordinary growth in computational power. The gaming software AlphaGo Zero, for example, required 300,000 times the computing power needed for the largest ex-periment just six years earlier.31
Data Access and Sharing Can Accelerate or Hinder Progress in AICurrent technologies require curated and accurate data to train and evolve. Access to high-quality data sets is critical and hinges on a number of factors, including (1) standards on interoper-ability, usage, access, and searchability; (2) costs of collection, access, sharing, usage, curation, storage, processing, and secu-rity; (3) commercial incentives; (4) user empowerment, including AI-powered agents; (5) trusted third parties, such as certifica-tion authorities, data-sharing platforms, and institutional review boards; (6) data representativeness that ensure data sets are in-clusive and diverse; (7) risks involving confidentiality and privacy breaches, intellectual property rights (IPRs), commercial interests, and security; and (8) uncertainties about data ownership.
Possible policy approaches to enhance data access and sharing include providing access to public-sector data, facilitat-ing data sharing in the private sector, developing statistical/data analytic capacities, and developing national data strategies.
Technical approaches are also emerging to address data constraints and shortages: deep reinforcement learning,32 trans-fer learning or pre-training,33 augmented data, or data ‘syntheti-sation’, and cryptographic advances, that let AI systems operate without collecting or accessing sensitive data.34
Policy Environments for AI InnovationChanges are clearly needed to improve the adaptability, reactivity, and versatility of policy instruments and experiments designed to foster AI and other digital innovations.35 Governments can experiment with controlled environments—such as regulatory sandboxes, innovation centres, and policy labs. Governments can also encourage self-regulatory mechanisms—such as
PREPARING FOR ECONOMIC TRANSFORMATION THROUGH HUMAN-CENTRED AI
THE GLOBAL TALENT COMPETITIVENESS INDEX 2020 55
CHAPTER 3
codes of conduct, voluntary standards, and best practices—or establish and encourage public- and private-sector oversight mechanisms such as compliance reviews, audits, conformity as-sessments, and certification schemes.
NEXT STEPS FOR HUMAN-CENTRED AIAs AI advances and diffuses, the potential impacts of the tech-nology’s predictions, recommendations, and decisions increase. Technical, business, and policy communities are actively explor-ing how best to make AI human-centred and trustworthy to max-imise benefits, minimise risks, and promote social acceptance.
The OECD—building on the work of the AI Group of Experts at the OECD (AIGO)—has identified key priorities for human-centred AI (The OECD AI Principles). The OECD’s Principles on AI promote innovative, trustworthy AI that respects human rights and democratic values. They were adopted in May 2019 by OECD countries and partner economies, and provide the basis for the G20 AI Principles endorsed by leaders in June 2019 (see Box 1).
The OECD’s AI Policy Observatory (OECD.AI) is the next major endeavour at the OECD to move from the AI principles to concrete policy action. An inclusive and multi-stakeholder hub, OECD.AI facilitates information and knowledge-sharing, pro-vides evidence, and facilitates collaboration to promote human-centred, trustworthy AI systems.36
POLICY CONCLUSIONSAI is a general-purpose technology that is set to usher in a uniquely broad set of economic and societal changes. AI tech-nologies are rapidly evolving and transforming economic and social sectors deeper and faster than expected. Policymakers must move quickly, and the policies they adopt must be agile and flexible, as the nature of future AI applications and their im-plications is hard to foresee.
Not only are AI’s impacts cross-cutting, they could be ex-ceptionally disruptive, economically and socially, in some ways that are beneficial and in other ways that are problematic. AI can improve welfare and well-being, contribute to sustainable global economic activity, increase innovation and productivity, and help respond to key global challenges. At the same time, these transformations may have disparate effects within and between societies and economies—regarding economic shifts, competition, transitions in the labour market, inequalities, and implications for democracy and human rights, privacy and data protection, and digital security.
That’s why policymakers must be ready to address a broad set of policy concerns—skills development, data access, and safety in machine-based systems—and policies on privacy, re-search and development (R&D), infrastructure, entrepreneur-ship, technology diffusion, and social safety nets. This requires coordinated efforts at the highest levels, technical expertise, and understanding in government, international cooperation and knowledge-sharing, active public-private engagement, and well-developed foresight capabilities. Finally, budget allocations in a number of fields must secure the best that AI has to offer and ensure inclusive AI so that benefits are broadly shared and improve well-being for all.
BOX 1: THE OECD AI PRINCIPLES1
The first intergovernmental standards on AI were adopted by OECD countries and partner economies in May 2019. The Recommendation of the OECD’s Council on Artificial Intelligence identifies five com-plementary values-based principles for the responsi-ble stewardship of trustworthy AI:
1. AI should benefit people and the planet by driv-ing inclusive growth, sustainable development, and well-being.
2. AI systems should be designed in a way that respects the rule of law, human rights, democratic values, and diversity, and they should include appropriate safe-guards—for example, enabling human intervention where necessary—to ensure a fair and just society.
3. There should be transparency and responsible disclo-sure around AI systems to ensure that people under-stand AI-based outcomes and can challenge them.
4. AI systems must function in a robust, secure, and safe way throughout their life cycles and potential risks should be continually assessed and managed.
5. Organisations and individuals developing, deploying, or operating AI systems should be held accountable for their proper functioning in line with the above principles.
Consistent with these value-based principles, the OECD also provides five recommendations to governments:
1. Facilitate public and private investment in research and development to spur innovation in trustworthy AI.
2. Foster accessible AI ecosystems with digital infrastruc-ture, technologies, and mechanisms to share data and knowledge.
3. Ensure a policy environment that will open the way to deployment of trustworthy AI systems.
4. Empower people with the skills for AI and support workers for a fair transition.
5. Cooperate across borders and sectors to progress on responsible stewardship of trustworthy AI.
Note 1. For further information see https://legalinstruments.oecd.org/en/
instruments/OECD-LEGAL-0449
PREPARING FOR ECONOMIC TRANSFORMATION THROUGH HUMAN-CENTRED AICHAPTER 3
56 THE GLOBAL TALENT COMPETITIVENESS INDEX 2020
ENDNOTES 1 OECD (2017d).
2 Purdy & Daugherty (2016).
3 For more information, see https://www.ibm.com/watson/stories/creditmutuel/
4 Zeng (2018).
5 Lakhani & Sundaram (2017).
6 ITF (2017).
7 Dormehl (2018).
8 OECD (2018c).
9 Executive Office of the President, Government of the United States (2016).
10 Winick (2018), MGI (2017) & Frey & Osborne (2017).
11 Frey & Osborne (2017).
12 MGI (2017).
13 Nedelkoska & Quintini (2018).
14 OECD (2018d).
15 Gartner (2017).
16 EESC (2017).
17 Byhovskaya (2018).
18 UNI (2018).
19 OECD (2019b).
20 EOP (2016).
21 For further information see https://caidg.smu.edu.sg/
22 Government of the United Kingdom (2017b).
23 Canada (2017).
24 Ministry of Economic Affairs and Employment of Finland (2017).
25 UK (2017b).
26 OECD (2018c).
27 Ibid.
28 Agrawal et al. (2018b).
29 Smith & Neupane (2018).
30 OECD (2018a).
31 OpenAI (2018).
32 Among others, this technique has been used to train autonomous vehicles in doing complex manoeuvres, to train the AlphaGo programme, and to treat cancer patients—determining the smallest doses and administration frequency that still shrink brain tumours (Matheson [2018]).
33 Jain (2017).
34 Technologies such as full homomorphic encryption, in combination with neural networks, have been successfully tested and employed (Dowlin [2016]).
35 OECD (2018c).
36 See http://www.oecd.ai
REFERENCES AND FURTHER READINGSAbrams, M., Abrams, J., Cullen, P., & Goldstein, L. (2017). Artificial intelligence, ethics
and enhanced data stewardship. Plano, TX: The Information Accountability Foundation.
Acemoglu, D. & Restrepo, P. (2018). Artificial intelligence, automation and work, NBER Working Paper, No. 24196, available at http://dx.doi.org/10.3386/w24196
Agrawal, A., Gans, J., & Goldfarb, A. (2018a). Economic policy for artificial intelligence, NBER Working Paper, No. 24690, available at http://dx.doi.org/10.3386/w24690
———. (2018b). Prediction machines: The simple economics of artificial intelligence. Boston, MA: Harvard Business School Press.
Bajari, P., Chernozhukov, V., Hortaçsu, A., & Suzuki, J. (2018). The impact of big data on firm performance: An empirical investigation, NBER Working Paper, No. 24334, available at http://dx.doi.org/10.3386/w24334
Barocas, S. & Selbst, A. (2016). Big data’s disparate impact. California Law Review, 104: 671–729, available at http://www.californialawreview.org/wp-content/uploads/2016/06/2Barocas-Selbst.pdf
Berk, R. & Hyatt, J. (2015). Machine learning forecasts of risk to inform sentencing decisions, Federal Sentencing Reporter, 27(4):222–228, available at http://dx.doi.org/10.1525/fsr.2015.27.4.222
Borges, G. (2017). Liability for Machine-Made Decisions: Gaps and Potential Solutions, presentation at the ‘AI: Intelligent Machines, Smart Policies’ conference, Paris, 26–27 October, available at http://www.oecd.org/going-digital/ai-intelligent-machines-smart-policies/conference-agenda/ai-intelligent-machines-smart-policies-borges.pdf
Bresnahan, T. & Trajtenberg, M. (1992). General purpose technologies: ‘Engines of growth?’, NBER Working Paper, No. 4148, available at http://dx.doi.org/10.3386/w4148
Brundage, M., Avin, S., Clark, J., Toner, H., Eckersley, P., Garfinkel, B., Dafoe, A., Scharre, P., Zeitzoff, T., Filar, B., Anderson, H., Roff, H., Allen, G.C., Steinhardt, J., Flynn, C., ÓhÉigeartaigh, S., Beard, S., Belfield, H., Farquhar, S., Lyle, C., Crootof, R., Evans, O., Page, M., Bryson, J., Yampolskiy, R., & Amodei, D. (2018). The malicious use of artificial intelligence: Forecasting, prevention, and mitigation, Future of Humanity Institute, University of Oxford, Centre for the Study of Existential Risk, University of Cambridge, Centre for a New American Security, Electronic Frontier Foundation and Open AI, available at https://arxiv.org/ftp/arxiv/papers/1802/1802.07228.pdf
Brynjolfsson, E., Rock, D. & Syverson, C. (2017). Artificial intelligence and the modern productivity paradox: A clash of expectations and statistics, NBER Working Paper, No. 24001, available at http://dx.doi.org/10.3386/w24001
Burgess, M. (2016). Holding AI to account: Will algorithms ever be free of bias if they are created by humans? WIRED, 11 January, available at https://www.wired.co.uk/article/creating-transparent-ai-algorithms-machine-learning
Byhovskaya, A. (2018). Overview of the National Strategies on Work 4.0: A Coherent Analysis of the Role of the Social Partners, European Economic and Social Committee, available at https://www.eesc.europa.eu/sites/default/files/files/qe-02-18-923-en-n.pdf
Canada (2017). Government of Canada launches the Global Skills Strategy, Press Release, Immigration, Refugees and Citizenship Canada, 12 June, available at https://www.canada.ca/en/immigration-refugees-citizenship/news/2017/06/government_of_canadalaunchestheglobalskillsstrategy.html
Cellarius, M. (2017). Artificial Intelligence and the Right to Informational Self-determination, The OECD Forum, available at https://www.oecd-forum.org/users/75927-mathias-cellarius/posts/28608-artificial-intelligence-and-the-right-to-informational-self-determination
Chouldechova, A. (2016). Fair prediction with disparate impact: A study of bias in recidivism prediction instruments, arXiv, 07524, available at https://arxiv.org/abs/1610.07524
Citron, D. & Pasquale, F. (2014). The scored society: Due process for automated predictions, Washington Law Review, 89, available at https://papers.ssrn.com/sol3/papers.cfm?abstract_id=2376209
Cockburn, I., Henderson, R. & Stern, S. (2018). The impact of artificial intelligence on innovation, NBER Working Paper, No. 24449, available at http://dx.doi.org/10.3386/w24449
Crawford, K. (2016). Artificial intelligence’s white guy problem, The New York Times, 26 June, available at https://www.nytimes.com/2016/06/26/opinion/sunday/artificial-intelligences-white-guy-problem.html?_r=0
PREPARING FOR ECONOMIC TRANSFORMATION THROUGH HUMAN-CENTRED AI
THE GLOBAL TALENT COMPETITIVENESS INDEX 2020 57
CHAPTER 3

Dormehl, L. (2018). Meet the British whiz kid who fights for justice with robo-lawyer sidekick, Digital Trends, 3 March, available at https://www.digitaltrends.com/cool-tech/robot-lawyer-free-acess-justice/
Doshi-Velez, F. & Kortz, M. (2017). Accountability of AI under the law: The role of explanation Berkman Klein Center Working Group on Explanation and the Law, Berkman Klein Center for Internet & Society working paper. arXiv, 21 November, available at https://arxiv.org/pdf/1711.01134.pdf
Dowlin, N. (2016). CryptoNets: Applying neural networks to encrypted data with high throughput and accuracy, Microsoft Research, available at https://www.microsoft.com/en-us/research/wp-content/uploads/2016/04/CryptonetsTechReport.pdf
Dressel, J. & Farid, H. (2018). The accuracy, fairness and limits of predicting recidivism, Science Advances, 4(1), available at http://advances.sciencemag.org/content/4/1/eaao5580
EESC (European Economic and Social Committee). (2017). Artificial Intelligence – The Consequences of Artificial Intelligence on the (Digital) Single Market, Production, Consumption, Employment and Society, available at https://www.eesc.europa.eu/en/our-work/opinions-information-reports/opinions/artificial-intelligence
Elliott, S. (2017). Computers and the future of skill demand, educational research and innovation. Paris: OECD Publishing, available at http://dx.doi.org/10.1787/9789264284395-en
EOP (Executive Office of the President, Government of the United States). (2016). Artificial Intelligence, Automation and the Economy, available at https://obamawhitehouse.archives.gov/sites/whitehouse.gov/files/documents/Artificial-Intelligence-Automation-Economy.PDF
European Patent Office. (2018). Patenting artificial intelligence - conference summary, Munich, 30 May, available at http://documents.epo.org/projects/babylon/acad.nsf/0/D9F20464038C0753C125829E0031B814/$FILE/summary_conference_artificial_intelligence_en.pdf
Flanagan, M., Howe, D., & Nissenbaum, H. (2008). Embodying values in technology: Theory and practice. In van den Hoven, J. & Weckert, J. (eds.). Information technology and moral philosophy. Cambridge: Cambridge University Press, available at http://dx.doi.org/10.1017/cbo9780511498725.017
Freeman, R. (2017). Evolution or revolution? The future of regulation and liability for AI, presentation at the AI: Intelligent Machines, Smart Policies conference, Paris, 26–27 October, available at http://www.oecd.org/going-digital/ai-intelligent-machines-smart-policies/conference-agenda/ai-intelligent-machines-smart-policies-freeman.pdf
Frey, C. & Osborne, M. (2017). The future of employment: How susceptible are jobs to computerisation? Technological Forecasting and Social Change, 114: 254–280, available at http://dx.doi.org/10.1016/j.techfore.2016.08.019
Gartner (2017). Gartner says by 2020, artificial intelligence will create more jobs than it eliminates, Gartner, Press Release, 13 December, available at https://www.gartner.com/en/newsroom/press-releases/2017-12-13-gartner-says-by-2020-artificial-intelligence-will-create-more-jobs-than-it-eliminates
Germany (2018). Key points for a federal government strategy on artificial intelligence, Press Release, 18 July, BMWI, available at https://www.bmwi.de/Redaktion/EN/Pressemitteilungen/2018/20180718-key-points-for-federal-government-strategy-on-artificial-intelligence.html
Golson, J. (2016). Google’s self-driving cars rack up 3 million simulated miles every day, The Verge, 1 February, available at https://www.theverge.com/2016/2/1/10892020/google-self-driving-simulator-3-million-miles
Goodfellow, I., Shlens, J. & Szegedy, C. (2015). Explaining and harnessing adversarial examples, arXiv, 1412.6572, available at https://arxiv.org/pdf/1412.6572.pdf
Government of the United Kingdom (2017a). UK digital strategy, available at https://www.gov.uk/government/publications/uk-digital-strategy/uk-digital-strategy
——— (2017b). UK industrial strategy: A leading destination to invest and grow, Great Britain and Northern Ireland, available at https://assets.publishing.service.gov.uk/government/uploads/system/uploads/attachment_data/file/668161/uk-industrial-strategy-international-brochure.pdf
Harkous, H. (2018). Polisis: Automated analysis and presentation of privacy policies using deep learning, arXiv, 29 June, available at https://arxiv.org/pdf/1802.02561.pdf
Heiner, D. & Nguyen, C. (2018). Amplify human ingenuity with intelligent technology, shaping human-centered artificial intelligence, A.Ideas Series, The Forum Network, OECD, available at https://www.oecd-forum.org/users/86008-david-heiner-and-carolyn-nguyen/posts/30653-shaping-human-centered-artificial-intelligence
Helgason, S. (1997). Towards performance-based accountability: Issues for discussion, Public Management Service, OECD, available at http://www.oecd.org/governance/budgeting/1902720.pdf
Ingels, H. (2017). Artificial intelligence and EU product liability law, presentation at the AI: Intelligent Machines, Smart Policies conference, Paris, 26–27 October, available at http://www.oecd.org/going-digital/ai-intelligent-machines-smart-policies/conference-agenda/ai-intelligent-machines-smart-policies-ingels.pdf
ITF (International Transport Forum). (2017). Driverless trucks: New report maps out global action on driver jobs and legal issues, International Transport Forum, available at https://www.itf-oecd.org/driverless-trucks-new-report-maps-out-global-action-driver-jobs-and-legal-issues
Jain, S. (2017). NanoNets: How to use deep learning when you have limited data, part 2: Building object detection models with almost no hardware, Medium, 30 January, available at https://medium.com/nanonets/nanonets-how-to-use-deep-learning-when-you-have-limited-data-f68c0b512cab
Kasparov, G. (2018). Deep thinking: Where machine intelligence ends and human creativity begins. New York: Public Affairs.
Kendall, A. Deep learning is not good enough, we need Bayesian deep learning for safe AI, Blog post, 23 May 2017, available at https://alexgkendall.com/computer_vision/bayesian_deep_learning_for_safe_ai/
Knight, W. (2017). The financial world wants to open AI’s black boxes, MIT Technology Review, 13 April, available at https://www.technologyreview.com/s/604122/the-financial-world-wants-to-open-ais-black-boxes/
Kosack, S. & Fung, A. (2014). Does transparency improve governance? Annual Review of Political Science, 17: 65–87, available at https://www.annualreviews.org/doi/pdf/10.1146/annurev-polisci-032210-144356
Kosinski, M., Stillwell, D. & Graepel, T. (2013). Private traits and attributes are predictable from digital records of human behavior, PNAS, 11 March, available at http://www.pnas.org/content/pnas/early/2013/03/06/1218772110.full.pdf
Kurakin, A., Goodfellow, I. & Bengio, S. (2017). Adversarial examples in the physical world, arXiv, 02533, available at https://arxiv.org/abs/1607.02533
Lakhani, P. & Sundaram, B. (2017). Deep learning at chest radiography: Automated classification of pulmonary tuberculosis by using convolutional neural networks. Radiology, 284(2) 574–582, available at http://dx.doi.org/10.1148/radiol.2017162326
Matheson, R. (2018). Artificial intelligence model ‘learns’ from patient data to make cancer treatment less toxic, MIT News, available at http://news.mit.edu/2018/artificial-intelligence-model-learns-patient-data-cancer-treatment-less-toxic-0810
MGI (McKinsey Global Institute). (2017). Jobs lost, jobs gained: Workforce transitions in a time of automation. New York: McKinsey Global Institute.
Mims, C. (2010). AI that picks stocks better than the pros. MIT Technology Review, 10 June, https://www.technologyreview.com/s/419341/ai-that-picks-stocks-better-than-the-pros/
Ministry of Economic Affairs and Employment of Finland (2017). Finland’s age of artificial intelligence - turning Finland into a leader in the application of AI, available at https://tem.fi/en/artificial-intelligence-programme
MIT (2018). Cybersecurity’s insidious new threat: Workforce stress. MIT Technology Review, 7 August, available at https://www.technologyreview.com/s/611727/cybersecuritys-insidious-new-threat-workforce-stress/
Mousave, S., Schukat, M. & Howley, E. (2018). Deep reinforcement learning: An overview, arXiv, 1806.08894, available at https://arxiv.org/abs/1806.08894
Narayanan, A. (2018). Tutorial: 21 fairness definitions and their politics, available at https://www.youtube.com/watch?v=jIXIuYdnyyk
PREPARING FOR ECONOMIC TRANSFORMATION THROUGH HUMAN-CENTRED AICHAPTER 3
58 THE GLOBAL TALENT COMPETITIVENESS INDEX 2020
https://www.eesc.europa.eu/en/our-work/opinions-information-reports/opinions/artificial-intelligence
Nedelkoska, L. & Quintini, G. (2018). Automation, skills use and training, OECD Social, Employment and Migration Working Papers, No. 202, OECD Publishing, Paris, available at https://dx.doi.org/10.1787/2e2f4eea-en
Neppel, C. (2017). AI: intelligent machines, smart policies, presentation at the AI: Intelligent Machines, Smart Policies conference, Paris, 26–27 October, available at http://oe.cd/ai2017
NITI (2018). National strategy for artificial intelligence #AIforall, NITI Aayog, June, available at http://niti.gov.in/writereaddata/files/document_publication/NationalStrategy-for-AI-Discussion-Paper.pdf
OECD (Organisation for Economic Co-operation and Development). (2011). OECD guidelines for multinational enterprises, 2011 edition. Paris: OECD, available at https://dx.doi.org/10.1787/9789264115415-en
——— (2013). Recommendation of the council concerning guidelines governing the protection of privacy and transborder flows of personal data, available at http://www.oecd.org/sti/ieconomy/2013-oecd-privacy-guidelines.pdf
——— (2016). Big data: Bringing competition policy to the digital era (executive summary), OECD DAF Competition Committee, available at https://one.oecd.org/document/DAF/COMP/M(2016)2/ANN4/FINAL/en/pdf
——— (2017a). Algorithms and collusion: Competition policy in the digital age. Paris: OECD Publishing, available at https://www.oecd.org/competition/algorithms-collusion-competition-policy-in-the-digital-age.htm
——— (2017b). Getting skills right: Skills for jobs indicators. Paris: OECD Publishing, available at https://dx.doi.org/10.1787/9789264277878-en
——— (2017c). OECD digital economy outlook 2017. Paris: OECD Publishing, available at http://dx.doi.org/10.1787/9789264276284-en
——— (2017d). The next production revolution: Implications for governments and business. Paris: OECD Publishing, available at https://dx.doi.org/10.1787/9789264271036-en
——— (2018a). AI: Intelligent machines, smart policies: conference summary, OECD Digital Economy Papers, No. 270, available at http://dx.doi.org/10.1787/f1a650d9-en
——— (2018b). Job creation and local economic development 2018: Preparing for the future of work. Paris: OECD Publishing, available at https://dx.doi.org/10.1787/9789264305342-en
——— (2018c). OECD science, technology and innovation outlook 2018: Adapting to technological and societal disruption. Paris: OECD Publishing, available at https://dx.doi.org/10.1787/sti_in_outlook-2018-en
——— (2018d). Perspectives on innovation policies in the digital age, in OECD science, technology and innovation outlook 2018: Adapting to technological and societal disruption. Paris: OECD Publishing, available at https://dx.doi.org/10.1787/sti_in_outlook-2018-8-en
——— (2019a). An introduction to online platforms and their role in the digital transformation. Paris: OECD Publishing, available at https://dx.doi.org/10.1787/53e5f593-en
——— (2019b). Going digital: Shaping policies, improving lives. Paris: OECD Publishing, available at https://dx.doi.org/10.1787/9789264312012-en
——— (2019c). Recommendation of the Council on Artificial Intelligence. Paris: OECD Publishing.
——— (2019d). Scoping principles to foster trust in and adoption of AI – proposal by the expert group on artificial intelligence at the OECD (AIGO). Paris: OECD Publishing, available at http://oe.cd/ai
——— (forthcoming). Enhanced access to and sharing of data: Reconciling risks and benefits for data re-use across societies. Paris: OECD Publishing.
OHCHR (Office of the United Nations High Commissioner for Human Rights). (2011). Guiding Principles on Business and Human Rights, available at https://www.ohchr.org/Documents/Publications/GuidingPrinciplesBusinessHR_EN.pdf
O’Neil, C. (2016). Weapons of math destruction: How big data increases inequality and threatens democracy. New York: Broadway Books.
OpenAI. AI and compute, Blog post, 16 May 2018, available at https://blog.openai.com/ai-and-compute/
Paper, I. (ed.) (2018). Artificial intelligence and privacy, June, Office of the Victorian Information Commissioner, available at https://ovic.vic.gov.au/wp-content/uploads/2018/08/AI-Issues-Paper-V1.1.pdf
Patki, N., Wedge, R. & Veeramachaneni, K. (2016). The synthetic data vault, 2016 IEEE International Conference on Data Science and Advanced Analytics (DSAA), available at http://dx.doi.org/10.1109/dsaa.2016.49
Privacy International and Article 19 (2018). Privacy and freedom of expression in the age of artificial intelligence, available at https://www.article19.org/wp-content/uploads/2018/04/Privacy-and-Freedom-of-Expression-In-the-Age-of-Artificial-Intelligence-1.pdf
Purdy, M. & Daugherty, P. (2016). Artificial intelligence poised to double annual economic growth rate in 12 developed economies and boost labor productivity by up to 40 percent by 2035, according to new research by Accenture, Accenture, Press Release, 28 September, available at http://www.accenture.com/futureofAI
Selbst, A. (2017). Disparate impact in big data policing, Georgia Law Review, 52 (109), available at http://dx.doi.org/10.2139/ssrn.2819182
Simonite, T. (2018). Probing the dark side of Google’s ad-targeting system, MIT Technology Review, 6 July, available at https://www.technologyreview.com/s/539021/probing-the-dark-side-of-googles-ad-targeting-system/
Slusallek, P. (2018). Artificial intelligence and digital reality: Do we need a CERN for AI?, The Forum Network, available at https://www.oecd-forum.org/channels/722-digitalisation/posts/28452-artificial-intelligence-and-digital-reality-do-we-need-a-cern-for-ai
Smith, M. & Neupane, S. (2018). Artificial intelligence and human development: Toward a research agenda, International Development Research Centre, available at https://idl-bnc-idrc.dspacedirect.org/handle/10625/56949
UNI Global Union (2018). 10 principles for workers’ data rights and privacy, available at http://www.thefutureworldofwork.org/docs/10-principles-for-workers-data-rights-and-privacy/
Varian, H. (2018). Artificial intelligence, economics and industrial organization, NBER Working Paper, No. 24839, available at http://dx.doi.org/10.3386/w24839
Wachter, S., Mittelstadt, B. & Floridi, L. (2017). Transparent, explainable and accountable AI for robotics, Science Robotics, 31 May, available at http://robotics.sciencemag.org/content/2/6/eaan6080
Wachter, S., Mittelstadt, B. & Russell, C. (2017). Counterfactual explanations without opening the black box: automated decisions and the GDPR, arXiv, 00399, available at https://arxiv.org/pdf/1711.00399.pdf
Weinberger, D. (2018). Optimization over explanation - Maximizing the benefits of machine learning without sacrificing its intelligence, Medium, 28 January, available at https://medium.com/@dweinberger/optimization-over-explanation-maximizing-the-benefits-we-want-from-machine-learning-without-347ccd9f3a66
Weinberger, D. (2018). Playing with AI fairness, Google PAIR, 17 September, available at https://pair-code.github.io/what-if-tool/ai-fairness.html
Winick, E. (2018). Every study we could find on what automation will do to jobs, in one chart, MIT Technology Review, 25 January, available at https://www.technologyreview.com/s/610005/every-study-we-could-find-on-what-automation-will-do-to-jobs-in-one-chart/
Yona, G. (2017). A gentle introduction to the discussion on algorithmic fairness, Towards Data Science, 5 October, available at https://towardsdatascience.com/a-gentle-introduction-to-the-discussion-on-algorithmic-fairness-740bbb469b6
Zeng, M. (2018). Alibaba and the future of business, Harvard Business Review, September-October, available at https://hbr.org/2018/09/alibaba-and-the-future-of-business
PREPARING FOR ECONOMIC TRANSFORMATION THROUGH HUMAN-CENTRED AI
THE GLOBAL TALENT COMPETITIVENESS INDEX 2020 59
CHAPTER 3

unfamiliar with digital technologies) from leveraging the tech-nology to improve their quality of life. For example, according to the 2017 World Bank Global Findex Database, about 1.7 billion adults remain unbanked—that is, without access to an account or services at a financial institution.1 A majority of the world’s unbanked population lives in developing economies and tends to be concentrated among poorer households, skew dispropor-tionately young, and have low educational attainment. AI can be used to improve digital financial services and have the most ef-fective positive outcomes for these underserved communities. Yet they must also navigate factors such as weak digital infra-structure, inaccessible financial institutions, and lack of enough money, which can limit the efficacy of AI-enabled applications. These considerations should inform the ways AI can enable digi-tal financial inclusion with relevant data collection and equitable access to services.
The United Nations Sustainable Development Goals (SDGs) are a critical component for leaders and experts from business, government, civil society, public policy, and science to examine
Since the term was first coined in 1956, the definition of Artificial Intelligence (AI) has evolved over time to refer to the theories, methods, technologies, and applications that can simulate and extend human intelligence. The aim of AI is to develop intelligent machines that can discover, contextualise, and act on data in a manner that reflects human perception and behaviour. Ideally, AI-enabled applications can augment our perception, experi-ences, and capacity for knowledge discovery at both a macro- and microscale.
As AI moves out of the realm of science fiction and is viewed as more of a general-purpose technology, it is set to have a broad spectrum of use and impact across industries and sec-tors. However, the rapid progress of innovation and the race to capture value from the technology is challenging pre-existing economic, social, and political structures.
OVERVIEWDigital, knowledge, and resource gaps related to AI can disen-franchise non-digital natives (individuals who are generally
CHAPTER 4
Artificial Intelligence and the SDGs: Harnessing AI for Sustainable DevelopmentHoulin ZhaoInternational Telecommunication Union (ITU)
ARTIFICIAL INTELLIGENCE AND THE SDGS: HARNESSING AI FOR SUSTAINABLE DEVELOPMENT
THE GLOBAL TALENT COMPETITIVENESS INDEX 2020 61
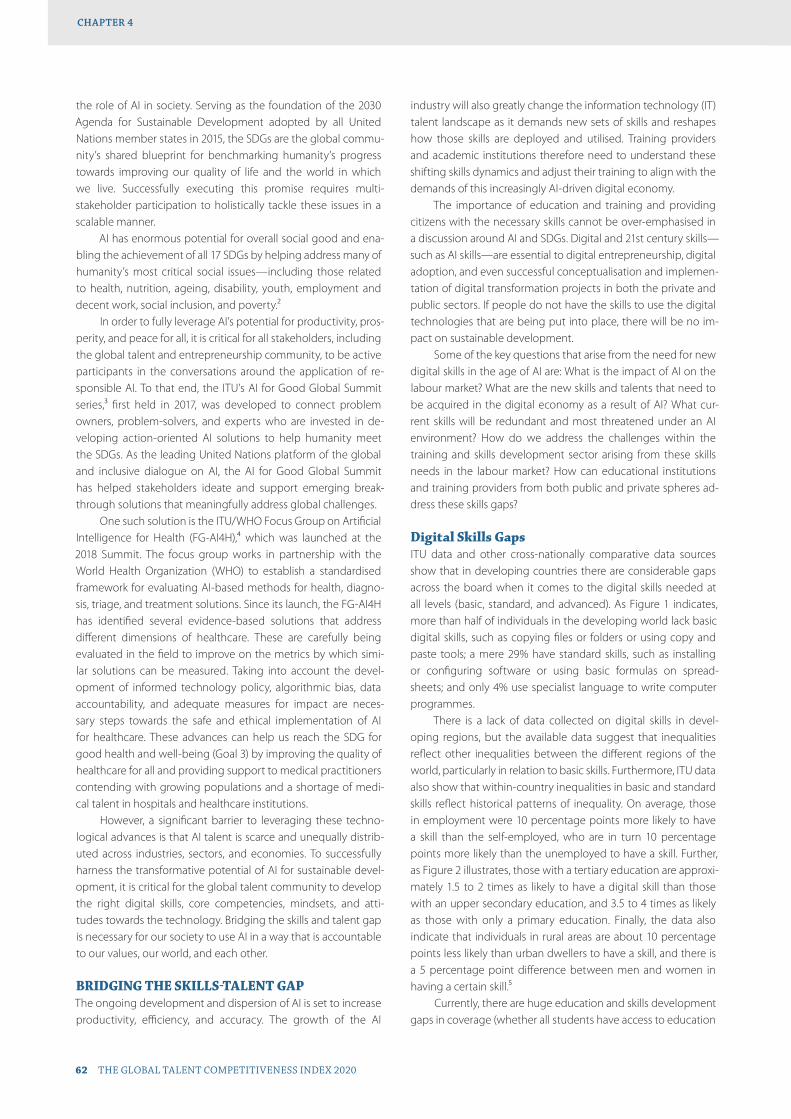
industry will also greatly change the information technology (IT) talent landscape as it demands new sets of skills and reshapes how those skills are deployed and utilised. Training providers and academic institutions therefore need to understand these shifting skills dynamics and adjust their training to align with the demands of this increasingly AI-driven digital economy.
The importance of education and training and providing citizens with the necessary skills cannot be over-emphasised in a discussion around AI and SDGs. Digital and 21st century skills—such as AI skills—are essential to digital entrepreneurship, digital adoption, and even successful conceptualisation and implemen-tation of digital transformation projects in both the private and public sectors. If people do not have the skills to use the digital technologies that are being put into place, there will be no im-pact on sustainable development.
Some of the key questions that arise from the need for new digital skills in the age of AI are: What is the impact of AI on the labour market? What are the new skills and talents that need to be acquired in the digital economy as a result of AI? What cur-rent skills will be redundant and most threatened under an AI environment? How do we address the challenges within the training and skills development sector arising from these skills needs in the labour market? How can educational institutions and training providers from both public and private spheres ad-dress these skills gaps?
Digital Skills GapsITU data and other cross-nationally comparative data sources show that in developing countries there are considerable gaps across the board when it comes to the digital skills needed at all levels (basic, standard, and advanced). As Figure 1 indicates, more than half of individuals in the developing world lack basic digital skills, such as copying files or folders or using copy and paste tools; a mere 29% have standard skills, such as installing or configuring software or using basic formulas on spread-sheets; and only 4% use specialist language to write computer programmes.
There is a lack of data collected on digital skills in devel-oping regions, but the available data suggest that inequalities reflect other inequalities between the different regions of the world, particularly in relation to basic skills. Furthermore, ITU data also show that within-country inequalities in basic and standard skills reflect historical patterns of inequality. On average, those in employment were 10 percentage points more likely to have a skill than the self-employed, who are in turn 10 percentage points more likely than the unemployed to have a skill. Further, as Figure 2 illustrates, those with a tertiary education are approxi-mately 1.5 to 2 times as likely to have a digital skill than those with an upper secondary education, and 3.5 to 4 times as likely as those with only a primary education. Finally, the data also indicate that individuals in rural areas are about 10 percentage points less likely than urban dwellers to have a skill, and there is a 5 percentage point difference between men and women in having a certain skill.5
Currently, there are huge education and skills development gaps in coverage (whether all students have access to education
the role of AI in society. Serving as the foundation of the 2030 Agenda for Sustainable Development adopted by all United Nations member states in 2015, the SDGs are the global commu-nity’s shared blueprint for benchmarking humanity’s progress towards improving our quality of life and the world in which we live. Successfully executing this promise requires multi-stakeholder participation to holistically tackle these issues in a scalable manner.
AI has enormous potential for overall social good and ena-bling the achievement of all 17 SDGs by helping address many of humanity’s most critical social issues—including those related to health, nutrition, ageing, disability, youth, employment and decent work, social inclusion, and poverty.2
In order to fully leverage AI’s potential for productivity, pros-perity, and peace for all, it is critical for all stakeholders, including the global talent and entrepreneurship community, to be active participants in the conversations around the application of re-sponsible AI. To that end, the ITU’s AI for Good Global Summit series,3 first held in 2017, was developed to connect problem owners, problem-solvers, and experts who are invested in de-veloping action-oriented AI solutions to help humanity meet the SDGs. As the leading United Nations platform of the global and inclusive dialogue on AI, the AI for Good Global Summit has helped stakeholders ideate and support emerging break-through solutions that meaningfully address global challenges.
One such solution is the ITU/WHO Focus Group on Artificial Intelligence for Health (FG-AI4H),4 which was launched at the 2018 Summit. The focus group works in partnership with the World Health Organization (WHO) to establish a standardised framework for evaluating AI-based methods for health, diagno-sis, triage, and treatment solutions. Since its launch, the FG-AI4H has identified several evidence-based solutions that address different dimensions of healthcare. These are carefully being evaluated in the field to improve on the metrics by which simi-lar solutions can be measured. Taking into account the devel-opment of informed technology policy, algorithmic bias, data accountability, and adequate measures for impact are neces-sary steps towards the safe and ethical implementation of AI for healthcare. These advances can help us reach the SDG for good health and well-being (Goal 3) by improving the quality of healthcare for all and providing support to medical practitioners contending with growing populations and a shortage of medi-cal talent in hospitals and healthcare institutions.
However, a significant barrier to leveraging these techno-logical advances is that AI talent is scarce and unequally distrib-uted across industries, sectors, and economies. To successfully harness the transformative potential of AI for sustainable devel-opment, it is critical for the global talent community to develop the right digital skills, core competencies, mindsets, and atti-tudes towards the technology. Bridging the skills and talent gap is necessary for our society to use AI in a way that is accountable to our values, our world, and each other.
BRIDGING THE SKILLS-TALENT GAPThe ongoing development and dispersion of AI is set to increase productivity, efficiency, and accuracy. The growth of the AI
ARTIFICIAL INTELLIGENCE AND THE SDGS: HARNESSING AI FOR SUSTAINABLE DEVELOPMENTCHAPTER 4
62 THE GLOBAL TALENT COMPETITIVENESS INDEX 2020
and skills) and quality across the developing world. Although there is growing evidence on the need to include digital skills as a core competency in education programmes at all levels and across disciplines, very few countries include topics such as com-putational thinking or coding skills in their secondary school cur-riculum, and few secondary school teachers have been trained to teach these skills.
Furthermore, employers all over the world claim they are unable to match available talent with unfilled jobs. As technol-ogy continues impacting jobs across all skill levels, all workers will need training on core skills, such as adaptability, social in-telligence, communication, and problem-solving. As a basis for lifelong learning, young people will need these skills to foster creativity, imagination, and openness to new ideas.
Clearly, there is an overall mismatch between what the market is demanding and what institutions of learning—formal and informal—are providing. Schools and other training insti-tutions are challenged to keep pace with rapid technological changes and many are stuck in old methods of instruction that are ill-suited to ways in which information and communication technologies (ICT) skills can be acquired. In addition, employers argue that the limited number of students who graduate with computer science degrees often lack job-ready skills.6 Modern
programming languages are often not a part of a university cur-riculum where traditional languages are taught with a focus on theory.
At the same time, many jobs of today and tomorrow re-quire workers who are fluent in technology and are equipped with the digital skills needed to use technology on a daily basis. Key growth areas alone have created demand for tens of millions of jobs around the world. These jobs often go unfilled because of skills shortages. The lack of digital skills also shrinks the op-portunities for young entrepreneurs seeking to leverage the growing digital economy and hampers their growth potential. For instance, unbanked people cannot process transactions or paychecks if they lack know-how on digital financial services.
Different levels of digital skills will open various employ-ment pathways. Basic digital skills are generic ICT skills required for nearly all jobs. They relate to the effective use of technology, which is necessary in most professions and include web research, online communication, use of professional online platforms, and digital financial services.
The digital skills divide is widening even further in the age of AI in that some countries are making fast progress while most of the developing world is being left behind. Regardless of industry, sector, or job type, AI technologies will significantly impact the
Figure 1Distribution of digital skills in developed and developing countries, 2017
Source: ITU (2018b).Notes: Data from 52 countries (30 developed and 22 developing countries) are included. Not all countries submitted data for all skill types, and for some countries data were used
from previous years because no data were available for 2017.*Writing a computer programme is the only advanced skill measured.†Basic skills are measured by the highest proportion on the following skills within a country: Copying or moving a file or folder; Sending e-mails with attached files; Using copy-and-
paste tools; and Transferring files between a computer and other devices.‡Standard skills are made up of the highest proportion on the following skills within a country: Finding, downloading, installing, and configuring software; Connecting and installing
devices; Using basic arithmetic formulas in a spreadsheet; and Creating electronic presentations.
0%
20%
40%
60%
80%
Stan
dard
skill
s‡
Basic
skill
s†
Writ
ing
a co
mpu
ter p
rogr
am*
Crea
ting
elec
tron
ic p
rese
ntat
ions
Usin
g ba
sic a
rithm
etic
form
ulas
in a
spre
adsh
eet
Conn
ectin
g an
d in
stal
ling
new
dev
ices
Find
ing,
dow
nloa
ding
, ins
talli
ng,
and
con�
gurin
g so
ftwar
e
Tran
sfer
ring
�les
bet
wee
na
com
pute
r and
oth
er d
evic
es
Usin
g co
py-a
nd-p
aste
tool
s
Send
ing
e-m
ails
with
att
ache
d �l
es
Copy
ing
or m
ovin
ga
�le
or fo
lder
Ave
rage
pro
port
ion
of in
divi
dual
s
Basic skills, developed countries
Basic skills, developing countries
Standard skills, developed countries
Standard skills, developing countries
Advanced skills, developed countries
Advanced skills, developing countries
ARTIFICIAL INTELLIGENCE AND THE SDGS: HARNESSING AI FOR SUSTAINABLE DEVELOPMENT
THE GLOBAL TALENT COMPETITIVENESS INDEX 2020 63
CHAPTER 4

labour market and the skills required by different industries and sectors. Re-skilling and up-skilling is already taking place in many sectors and this needs to be complemented by adult learning programmes and other professional training.
ITU research has shown that a widening gap may also un-fold at the level of individual workers. Demand for jobs could shift away from repetitive tasks towards those that are socially and cognitively driven and others that involve activities that are hard to automate and require more digital skills. Job profiles characterised by repetitive tasks and activities that require low digital skills may experience the largest decline as a share of total employment, from some 40% to near 30% by 2030. The largest gain in share may be in non-repetitive activities and those that require high digital skills, rising from some 40% to more than 50%. These shifts in employment will undoubtedly have an im-pact on wages. ITU research has shown that around 13% of the total wage bill could shift to categories requiring non-repetitive and high digital skills, where incomes could rise, while workers in the repetitive and low digital skills categories may potentially experience stagnation or even a cut in their wages.7
Gender imbalances are also a challenge. It is estimated that women represent just 7.6% of software developers,8 and only 15% of ICT patents are filed by women.9
The Skills coalition of EQUALS, The Global Partnership for Gender Equality in the Digital Age, released a report that is call-ing for the need for policymakers to address gender bias in AI;
teams developing AI technology must commit to greater gender equality—in hiring, training, and advancement.10
What Needs to Be DoneIn order to address these many challenges related to the mis-match between skills demand and supply, many countries and development organisations are now focusing strongly on strengthening digital skills, including in the context of sustain-able development and the achievement of the SDGs.
Digital skills strategy frameworks need to be part of any national digital policy. In this context, it is essential to make ef-fective digital skills policies that address gaps in the labour market and concerns about widening social inequalities. This can be done by (1) collecting higher-quality and more reliable data on the full range of digital skills in different sectors; (2) tar-geting specific groups depending on need and outcomes to be achieved, rather than following a one-size-fits-all approach; and (3) stimulating multisectoral stakeholder partnerships with a continuous exchange of lessons learned and improvements made.11
Closing the skills gap will require having a solid understand-ing of the existing skills base and the skills needed to thrive in the digital environments that include AI technology applications of the future. National skills assessments should be carried out in order to make informed decisions on national digital skills strate-gies, projects, and initiatives.
Figure 2Level of education and digital skills, 2017
Source: ITU (2018b).Notes: Thirty-seven countries provided data on skills for different education level groups. Not all countries submitted data for all skill types, and for some countries data from
previous years were used because no data were available for 2017. Proportions are based on country averages for individuals with a certain education level that have that skill.
0%
20%
40%
60%
80%
Writ
ing
a co
mpu
ter p
rogr
am
Crea
ting
elec
tron
ic p
rese
ntat
ions
Conn
ectin
g an
d in
stal
ling
new
dev
ices
Find
ing,
dow
nloa
ding
, ins
talli
ng,
and
con�
gurin
g so
ftwar
e
Usin
g ba
sic a
rithm
etic
form
ulas
in a
spre
adsh
eet
Usin
g co
py-a
nd-p
aste
tool
s
Tran
sfer
ring
�les
bet
wee
na
com
pute
r and
oth
er d
evic
es
Send
ing
e-m
ails
with
att
ache
d �l
es
Copy
ing
or m
ovin
ga
�le
or fo
lder
Prop
orti
on o
f gro
up w
ith
skill
Primary education
Lower-secondary education
Upper-secondary education
Tertiary education
ARTIFICIAL INTELLIGENCE AND THE SDGS: HARNESSING AI FOR SUSTAINABLE DEVELOPMENTCHAPTER 4
64 THE GLOBAL TALENT COMPETITIVENESS INDEX 2020
Developing capacities in the field of telecommunication and digital technologies is one of the core mandates of the ITU, in particular through its Development Sector. The ITU Academy, the flagship initiative that integrates all of ITU’s capacity devel-opment activities under one umbrella, was established to assist countries to develop capacities on emerging technology topics of priority to them.12 Through the ITU Academy, ITU organises and delivers training through various channels, in particular the ITU network of Centres of Excellence.
The year 2019 marked the beginning of a new four-year cycle of the ITU Centres of Excellence network. Twenty-nine cen-tres were selected across six regions to provide training in 15 pri-ority areas, including: artificial intelligence, big data, the internet of things, broadband, cybersecurity, spectrum management, the digital economy and smart cities and communities, and others.13
As a member-driven organisation, ITU works in close col-laboration with a variety of stakeholders—from governments to the private sector, academia, and international agencies—to address the challenges in capacity and skills development in the digital age.
In 2017, the International Labour Organization (ILO) and ITU launched the Digital Skills for Jobs Campaign to equip young people with job-ready digital skills and connect them to job opportunities.14 The campaign seeks to advance the objective of the ILO Global Initiative on Decent Jobs for Youth, which has as its mission to scale up action and impact on youth employ-ment at country and regional levels.15 Decent Jobs for Youth is the first United Nations system-wide effort for the promotion of youth employment worldwide. It represents a unique collabo-ration platform to join hands—within and beyond the UN sys-tem—to tackle the youth employment challenge and assist UN member states in targeting a crucial goal of the 2030 Agenda for Sustainable Development.
The goal of the ITU-ILO Digital Skills for Jobs Campaign is to mobilise investments from a range of stakeholders to equip 5 million youths with job-ready digital skills globally by 2030. This ambitious goal will be achieved by forging action-oriented partnerships to extend and optimise digital investments for young people in the education system and on the job, across sectors and within and between countries. Recognising that there is more to achieving decent jobs than enhancing and accumulating skills, the campaign invites job creators in the public and private sectors to realise the potential of the ICT and other digitally driven sectors to employ youth with decent jobs and foster an enabling environment for sustainable digital entrepreneurship.
CONCLUSIONAI technologies and applications are rapidly transforming so-ciety—bringing with them not only unprecedented opportu-nities for driving sustainable development but also profound challenges. With the potential to accelerate progress in line with each and every one of the SDGs, AI holds great promise to de-liver digital dividends for people every where, but also significant implications of risk for widening digital divides in many different facets, including the availability of skills and talent.
This leads to the question: Are new ways of working to-gether needed to harness the potential of AI for good? And if so, who should be involved?
One of the key issues with AI technologies and its applica-tions is that their development, access, and impacts are unevenly distributed, both in terms of the pace of change as well as the geographies and demographics of where those impacts are real-ised. Operating in different cultural, social, economic, and politi-cal contexts requires tailored policies and actions that have the potential to dramatically shape the ways in which the impacts from AI’s development and deployment will be felt. However, the technological changes driven by these initiatives are rarely restricted to a local or sectoral impact; they cut uniquely across international boundaries, policy silos, and professional domains.
Given the scale, spread, and speed of this change, there-fore, divergent approaches and ad-hoc responses will not suf-fice. Cooperation across domains and across borders is going to be critical to realise the full socioeconomic potential of AI technologies, as well as for mitigating the risks they pose and curtailing any unintended consequences. Effective cooperation for sustainable growth and innovation will also require universal grounding in common human values—such as inclusiveness, respect, human-centredness, human rights, transparency, and sustainability.
This is particularly critical when addressing the issue of hu-man capacity building—including education and re-skilling—for AI. Multi-stakeholder cooperation is essential to tackle AI in an ambitious and holistic manner and to promote its use for the im-plementation of the SDGs. Concerted effort and frameworks will be required to directly support economic and social inclusion; ensure that traditionally marginalised groups (such as women, youth, indigenous people, rural populations, and older people) are empowered; strengthen multi-stakeholder partnerships on capacity building; encourage governments to take evidence-based action; make investments in both human capital and infrastructure; address environmental concerns; develop smart regulatory environments; and assist those facing disruption from the impact of AI on their livelihoods.
Society is at a critical point in understanding AI, and how we—collectively—approach this process will affect the human impact of AI-based applications. It is essential, therefore, that cur-rent and future generations are equipped with the tools neces-sary to harness AI for sustainable development and to build an innovation ecosystem that fosters the development of an ethical and human-centered technology.
ENDNOTES 1 World Bank Group (2017).
2 ITU (2017).
3 Further information about the AI for Good Global Summit series is available at https://aiforgood.itu.int/
4 ITU/World Health Organization (2018).
5 ITU (2018b).
6 ITU (2014).
7 ITU (2018a).
ARTIFICIAL INTELLIGENCE AND THE SDGS: HARNESSING AI FOR SUSTAINABLE DEVELOPMENT
THE GLOBAL TALENT COMPETITIVENESS INDEX 2020 65
CHAPTER 4

8 Stacks Overflow (2017).
9 Jensen, et al. (2018).
10 Further information about EQUALS is available at https://www.equals.org/
11 ITU (2018b).
12 See https://academy.itu.int/home for more information on the ITU Academy.
13 ITU (2014).
14 For more on the Digital Skills for Jobs Campaign, see https://www.itu.int/en/ITU-D/Digital-Inclusion/Youth-and-Children/Pages/Digital-Skills.aspx
15 More details on the ILO’s Global Initiative on Decent Jobs for Youth is available here: https://www.ilo.org/global/topics/youth-employment/databases-platforms/global-initiative-decent-jobs/lang--en/index.htm
REFERENCESITU (International Telecommunication Union). (2014). Digital opportunities:
Innovative ICT solutions for youth employment, available at https://www.itu.int/en/ITU-D/Digital-Inclusion/Youth-and-Children/Documents/YouthReport_2014.pdf
———. (2017). Fast-forward progress: Leveraging tech to achieve the global goal, available at http://www.itu.int/en/sustainable-world/Documents/Fast-forward_progress_report_414709%20FINAL.pdf
———. (2018a). Assessing the economic impact of Artificial Intelligence, available at https://www.itu.int/pub/S-GEN-ISSUEPAPER-2018-1
———. (2018b). Measuring the Information Society Report 2018, available at https://www.itu.int/en/ITU-D/Statistics/Pages/publications/misr2018.aspx
ITU/World Health Organization. (2018). Focus Group on ‘Artificial Intelligence for Health’, available at https://www.itu.int/en/ITU-T/focusgroups/ai4h/Pages/default.aspx
Jensen, K., Kovacs, B., & Sorenson, O. (2018). Gender differences in obtaining and maintaining patent rights. Nature Biotechnology, 36(4):307–309, available at https://www.researchgate.net/publication/324250172_Gender_differences_in_obtaining_and_maintaining_patent_rights
Stack Overflow. (2017). Developer Survey Results 2017, available at https://insights.stackoverflow.com/survey/2017?utm_medium=email&utm_campaign=dev-survey-2017&utm_content=em-features&utm_source=so-owned#overview
World Bank Group. (2017). The Global Findex Database 2017, available at https://globalfindex.worldbank.org/
CHAPTER 4
66 THE GLOBAL TALENT COMPETITIVENESS INDEX 2020
augmentation using AI. However, to achieve these promises, we will need new skills and possibly transform our education and lifelong training systems. What are the main skill gaps we need to fill in the coming years? What new skills do managers and executives need to best leverage the opportunities AI enables for their jobs and organisations while minimising potential new risks? How should education evolve to better prepare the future workforce as AI and other technologies transform jobs? What are the implications of AI for professional jobs, particularly in the healthcare and legal professions? We will close with summaries of how two educational institutions, MIT and INSEAD, have re-sponded so far to the rising needs for new skills.
NEW SKILLS FOR ORGANISATIONSAfter almost half a century of growing investments in enterprise IT—from mainframes to enterprise resource planning (ERP) software, to internet technologies, to customer relationship management (CRM) and other knowledge and relationship management systems—we know that unless investments in
From the replacement of physical work by machines to the support of business processes and decisions using information technology (IT), technology has increasingly been transforming jobs—and in the process economies and societies. Unlike many previous technologies, Artificial Intelligence (AI) promises to fur-ther transform jobs that rely on what has always been consid-ered an ability only humans, and not machines, have: judgment and decision-making. While many technologies have supported decision-making, or automated simple decision-making, AI has the capability to automate (‘make’) increasingly complex deci-sions for people and professionals from all walks of life: from financial investments to medical diagnoses and treatments, to procurement and sales, to legal and strategic decisions, among others.
Although such technological capabilities might create fears of job losses, they also create enormous opportunities to aug-ment jobs and improve job performance. While a lot has been said about technological substitution of jobs, we will focus in this chapter on what we believe is a far bigger opportunity: job
CHAPTER 5
New Skills for Augmenting Jobs and Enhancing Performance with AIDimitris BertsimasMIT Sloan School of Management
Theodoros EvgeniouINSEAD
NEW SKILLS FOR AUGMENTING JOBS AND ENHANCING PERFORMANCE WITH AI
THE GLOBAL TALENT COMPETITIVENESS INDEX 2020 67
development, and retention of necessary talent, such as data scientists. They possess domain knowledge, understanding of business needs to prioritise decisions and guide analytics teams, and understanding of AI in order to better communicate busi-ness needs to data professionals. In fact, the McKinsey Global Institute (2016) estimates that by 2026 demand for translators in the United States alone may reach 2–4 million.3 While these roles may be new, experience with what makes translators successful provides insights on what skills middle managers generally need.
Henke et al. (2018) suggest that the wide range of respon-sibilities—leader, communicator, project manager, industry ex-pert—inherent in the translator’s role makes the following four skills essential.4 These are the key skills middle managers need to focus on—and all are necessary if they are to be involved in or make decisions about AI initiatives:
• Domain knowledge. Understanding the context where an-alytics and AI will be applied is perhaps the most crucial skill—in particular, an understanding of key operational metrics and their financial implications so that AI is ap-plied in the most impactful ways. Business process exper-tise is also necessary to identify how AI can best optimise processes and decisions, and eventually create value for an organisation.
• General technical fluency. Translators need to also have strong acumen in analytics and structured problem-solving, ideally with a science, technology, engineering, and mathematics (STEM) background. And while they do not need to be able to build analytics models, they do need to understand the types of models that are available and the business problems they can be applied to. Finally, interpreting solutions in the business context and under-standing the limitations of the models is an important skill. Having some programming skills can enable middle man-agers to fully leverage AI capabilities; for example, by al-lowing easier experimentation, prototyping, analysis, and fast learning of how to best apply AI in a given business case.
• AI project management skills. Translators should be able to lead an analytics project from the idea phase through ex-ecution and, finally, to adoption. AI projects share charac-teristics with basic IT projects as well as with fundamental concepts of innovation and entrepreneurship. As such, middle managers need to understand the importance of fast, iterative development and experimentation, as well as the fact that once AI is developed it needs to be contin-uously monitored for it is always evolving, and can make any recently adopted AI technology obsolete.
• Entrepreneurial spirit. A can-do attitude and a willingness to explore ideas and problems that have not yet been explored is also important. This behaviour is often not taught, but a company’s culture can nurture and affect its development. Given the endless innovation opportunities
technology are coupled with necessary organisational changes, the productivity benefits of technology cannot be fully achieved. Decades-long research is conclusive on this point.1 A key dimen-sion of organisational change has always been training and de-veloping new skills and roles. As the latest and potentially most transformative of information technologies, AI will follow the same pattern—and possibly require even more resources to suc-cessfully prepare the workforce.
Given the unique decision-making capabilities, techno-logical complexity, and potential impact of AI, it is necessary to consider a very diverse and holistic set of skills that organi-sations need to look for in the labour pool/among workers in order to facilitate AI’s adoption and maintain a positive impact while managing any new risks that can result. These skills range from engineering and statistical capabilities to an understand-ing of management, philosophical, and ethical principles. They are necessary at all levels throughout an organisation, although the relative balance may differ depending on specific jobs and roles. While seniority may not be an accurate dimension to dif-ferentiate jobs, it is a factor in the analysis here as a way to dis-cuss possible differences in the balance of skills for different roles. Such an analysis may also help organisations better manage how to best integrate a new generation of graduates—many from recently developed university-level programmes in data science or machine learning—with current senior management teams that may have been trained in very different paradigms. Indeed, one of the most common challenges and questions voiced by senior executives and directors of boards is simply ‘What do I need to know to better position myself and my organisation in the AI era?’
Skills for the Middle ManagerOrganisations have been increasingly turning to analytics and AI to improve decision-making across business processes—from research and design to supply chain and risk management. Certainly, data scientists are required to build the analytics models, often with machine learning and deep learning, that are capable of turning vast amounts of data into insights. They also need to be supported by other new roles such as data engi-neers, data architects, and data visualization experts. More recently, however, companies have recognized that aligning AI with business requires new hybrid roles—what are often called translators.2 Translators play an increasingly important role for the success of AI in an organisation as they facilitate the sourcing,
Consider a very diverse, holistic set of skills . . . in the labour pool.
NEW SKILLS FOR AUGMENTING JOBS AND ENHANCING PERFORMANCE WITH AICHAPTER 5
68 THE GLOBAL TALENT COMPETITIVENESS INDEX 2020
AI can enable, translators also require not only good pro-cess management aptitude, but also creativity, out-of-the-box thinking, and a willingness to take risks and pivot as needed.
Given the urgent need for people with such a combination of skills, hiring externally might seem the quickest solution. However, new hires frequently lack the most important quality: deep organisational knowledge. As a result, training existing em-ployees for new AI-enabled roles often proves to be the best op-tion. This can be achieved through programmes such as Masters in Business Analytics, MBA programmes that embrace analytics and AI, or executive education opportunities (which often in-clude some online education options).
What Skills do the C-Suites Need?Senior managers, executives, and board directors often find themselves perplexed by how to keep up with the accelerating pace of technological progress, or by how to best leverage these new developments while minimising potential new risks and li-abilities. They typically ask, ‘What can we do in our organisation to improve our AI capabilities and manage risks?’ or, on a more personal level, ‘What do I need to learn to do my job as a leader better?’
Given the growing pervasiveness of AI/Machine Learning (ML)/Data Science (DS) in college education and early career stages, future senior managers will be forced to become increas-ingly experienced with the more technical aspects of AI/ML over time. In the short term, today’s senior managers may need to rely on translators for more technical-related business decisions. However, in order to make better decisions regarding resource allocation, investments in AI technologies, and talent reten-tion at all levels of their organisation, it is important that senior managers and executives have some appreciation of the issues, concepts, capabilities, and limitations of these technologies. For top executives, the following skills are essential to better manage business opportunities and risks related to AI development and innovation:
• Understanding the ‘art of the possible’ to continuously assess the transformational impact of AI and the opportunities it
Senior executives . . . ask ‘What do I need to know to better position myself and my organisation in the AI era?’
enables. Such opportunities may exist at different levels: from optimising specific business processes and enhanc-ing decision-making to developing new products and services or enhancing existing ones, to transforming busi-ness models or making current ones obsolete (much like major technological innovations have done in the past). Executives must also understand how AI might transform their industry in the mid- and long term in order to make appropriate strategic decisions. However, it is important to balance hype with reality; this requires a broad under-standing of how AI works, its capabilities, as well as its limitations.
• Managing new AI-driven business risks to gain a firm un-derstanding of the risks associated with ML and AI. Unlike other technologies, AI has the ability to make in-creasingly complex decisions. However, with advanced decision-making comes liability, which machines do not have. In essence, machines decide while humans bear all risks. Executives need to manage new AI risks such as unfair, biased, and possibly discriminatory decisions their AI-embedded products or services may make; finan-cial losses when faulty resource-allocation decisions are made or driven by computers; and even health-related risks that AI-embedded medical devices or autonomous devices and vehicles may give rise to. Organisations may need to develop processes to audit their AI products and services—such as AI ethics governance committees—and ways to monitor the behaviour of all AI they develop.
One option for executives is to learn the process of red teaming—the practice of rigorously challenging plans, policies, systems, and assumptions by adopting an adver-sarial approach—to prevent or minimise all possible risks, such as financial risk, data risk, software/algorithm risk, third-party integration risk, intellectual property (IP) risk, and legal risk. They then seek to leverage data to quantify the knowable risks and monitor the unknowable ones.
• Understanding regulatory changes, as well as the social and macro/political impact of AI. It is increasingly clear that AI can transform the social fabric and even affect the bal-ance of power across geographies. Organisations such as the Organisation for Economic Co-operation and Development (OECD) have already drafted principles that governments and—eventually—businesses may need to follow when pursuing their AI strategies.5 The IEEE Standards Association is developing processes for certify-ing AI products and services;6 and regulators have created regulatory frameworks for approving AI products—such as medical devices in the case of the United States Food and Drug Administration (FDA). Executives and directors need to consider and contribute to the development of such principles, standards, and regulations as those will affect not only their business and industry, but society overall.
NEW SKILLS FOR AUGMENTING JOBS AND ENHANCING PERFORMANCE WITH AI
THE GLOBAL TALENT COMPETITIVENESS INDEX 2020 69
CHAPTER 5
How can executives and directors stay up-to-date with the necessary knowledge and skills? While there is an abundance of reports on the business implications of AI, developing a broader view of technology trends and their macro impacts requires awareness not only of business but also of technological and scientific innovations. Executive training programmes, in-house events with external experts and workshops, partnerships with technology companies, and involvement of advisors who have a deep understanding of both technology and business can provide a more focused complement to the broad-based knowledge.
HIGHER EDUCATION FOR THE FUTURE AI WORKFORCEGiven the need for the skills outlined above, how should higher education systems evolve to better prepare the future work-force? At the university level, training should cover both skills that are drastically different as well as skills that are structurally similar to those of the past few decades. These drastically different skills might include:
• The definition of foundational knowledge. In the majority of higher education institutions today, basic calculus and physics courses are obligatory. It is now expected that introductory AI/ML/DS courses will be added as obliga-tory for all majors—possibly replacing the requirements of calculus and physics that exist today. These introduc-tory courses would, ideally, span a wide range of areas of knowledge, including the humanities and the law, where, for example, natural language processing can improve our understanding of comparative literature and con-tracts, respectively; medicine, where electronic medical records, images, reports, and genomic information pro-cessed via AI/ML/DS can materially improve outcomes for patients; as well as science and engineering disciplines. To encourage the development of this type of coursework, MIT announced the Stephen A. Schwarzman College of Computing as a bold initiative to accelerate pioneering research and innovation in computing, build a profound awareness of the ethical implications and societal impact of advanced technologies such as AI, and, above all, edu-cate leaders for the algorithmic future.
• Communicating with data and ethical AI. The art of com-munication, both orally and in writing, has always been central in education. What is new is the need to develop an ability to communicate with data effectively. In addi-tion, AI often masks systematic biases, like giving priority to people of a particular gender or race in college admis-sions or medical treatments. This necessitates the need to expose students to interpretable AI, and to introduce ethics and related philosophical topics involving AI into the classroom as early as possible.
Structurally similar skills include:
• Conceptually defining a problem statement. Students must learn to assess an ambiguous situation, conceptually define the problem, and outline a structure to solve the problem. The mechanism to teach this has existed for centuries and well-designed mathematics, science, and engineering courses cover it. What is new is the need to collaborate using technology. Curriculum designers should consider including not only group technical as-signments, but also—and equally important—up-front scoping and communication as a monitored and as-sessed activity.
• Using computational software to derive an answer. While the acquisition of this skill is well established in a university curriculum, there are, however, two aspects that are new:
» Students must become adept at scanning the techno-logical environment for new data sources. With the rise of publicly available application programming inter-faces (APIs), there is more data and more opportunity for creativity.
» Students must not assume that they have to build a model from scratch, but rather gain the skills to search existing open-source software libraries (e.g., R / Python) for solutions, as well as search crowd-sourced platforms for answers (e.g., the internet, Github, and Stack Overflow).
• Acquiring depth in a given coding language. This will en-sure that a student not only understands the limits and capabilities of software, but also understands the ‘art of learning’. Proficiency in a given coding language dem-onstrates that a student has learned to leverage existing code libraries and open-source resources to reuse code and methodologies. The point is in both the actual cod-ing as well as the learning process: Software languages will come and go, but coding processes and techniques will remain the same.
NEW JOB OPPORTUNITIES FOR PROFESSIONALS: SOME EXAMPLESAdvances in AI open exciting new opportunities to enhance nu-merous professional jobs and roles across different sectors. For example, with the availability of electronic data records, imaging data, radiology reports, doctor notes, and genomic information there is great opportunity to more accurately diagnose diseases and personalise treatments based on AI and the available data. Bertsimas et al. (2018) have developed a calculator (POTTER) that is designed to assess the probability of mortality and morbidity for emergency care patients based on electronic medical re-cords.7 The calculator is currently in use at the Massachusetts General Hospital (MGH). In addition, early detection of breast cancer based on images using deep learning has become stronger than human detection by radiologists and is also cur-rently in use at the MGH. In medical education, new curricula are
NEW SKILLS FOR AUGMENTING JOBS AND ENHANCING PERFORMANCE WITH AICHAPTER 5
70 THE GLOBAL TALENT COMPETITIVENESS INDEX 2020

expected to be developed that involve the use of AI in medicine, introducing healthcare professionals to these technologies early on. For example, a class on Machine Learning in Health Care will be offered at MIT in the academic year 2020–2021.
There are also substantial opportunities in the legal pro-fession. As noted earlier in this chapter, contracts often involve hundreds of pages, and natural language processing can be used to check several aspects of contracts and generate initial versions given specific characteristics. Success in this direction could introduce new teaching opportunities in law schools—for example, incorporating/adopting relevant AI tools in courses and exposing future legal professionals to the capabilities and limitations of AI technologies more broadly. Data and machine learning can also be used to support decision-making. For ex-ample, recent work shows how AI may be able to predict as well as human judges whether defendants may recommit crimes if released, providing important input to the judges’ decision-making.8 It seems clear from these examples that AI could be a valuable collaborator—especially when it comes to decision-making—and that learning to work with AI may prove to be a key skill across the legal profession.
ADDRESSING THE SKILLS NEEDS: EXAMPLES FROM MIT AND INSEADHow should higher education institutions—from colleges to business schools—adapt to support the development of both the current and future workforces? The need to provide train-ing that spans the wide range of necessary skills outlined earlier in this chapter demonstrates that these educational institutions may need to develop new and deeper connections across dis-ciplines—including analytical and technical training in fields that have not traditionally encompassed such training—and to develop new courses and also possibly new programmes and degrees. Described below are some initiatives that have recently been adopted to attempt to fulfill these new needs.
The MIT WayIn 2016, MIT Sloan School of Management created a 12-month Master of Business Analytics (MBAn) programme that prepares students for careers that apply and manage modern data sci-ence to solve critical business challenges. Established in conjunc-tion with MIT's Operations Research Center—an interdisciplinary
Educational institutions may need to develop new and deeper connections across disciplines.
research center established in 1953—the MBAn programme is for current students or recent graduates who plan to pursue a career in the data science industry, as well as those seeking ca-reer advancement or change, especially engineers, mathemati-cians, physicists, computer programmers, and other high-tech professionals.9 Graduates of the programme have joined con-sulting, healthcare, technology, and start-up companies as well as data science groups of more traditional industries, often com-manding salaries at par with MBA graduates, who are typically six years older. The Sloan School also offers a Business Analytics Certificate to address the increasing demand for professionals who want to understand business analytics either as a data scien-tist or as an analytics translator.10 Typically, about one-third of the school’s entire student body elects to earn this certificate. Finally, a massive open online course (MOOC) non-degree course, The Analytics Edge, offered annually since 2013, has been attracting tens of thousands of students every year,11 and a new undergrad-uate major in Business Analytics was established in 2017.12
In addition, the MIT Stephen A. Schwarzman College of Computing, launched in September 2019 and mentioned ear-lier in this chapter, is designed to accelerate pioneering research and innovation in computing, build a profound awareness of the ethical implications and societal impact of new comput-ing technologies, and, above all, educate leaders for the algo-rithmic future. For nearly 70 years, MIT has been comprised of five schools: Engineering, Science, Management, Urban Studies, and Humanities. This new college is a new structure that con-nects with the traditional five schools, emphasising the concept/ approach that today’s students must be educated in AI/ML/DS as these new and evolving technologies will affect all aspects of human knowledge.
The Case for a Global Business School: INSEADINSEAD has followed a more incremental approach to integrat-ing AI-related topics into its educational programmes. While no Business Analytics degree has yet been launched, a num-ber of analytics courses have been incorporated into MBA and Executive MBA curricula in recent years, covering skills ranging from understanding machine learning tools to managing data science projects, using analytics and AI for business process op-timisation, and understanding the impact of AI on organisations and industries as well as what it means for business strategy. Some of these courses are designed to develop general skills for managing data science projects, while others combine analytics with specific business topics such as supply chain, marketing, or human resources. While there are no pure coding courses, programming has been introduced as a component of some courses. In fact, INSEAD has been an early adopter of program-ming coursework among business schools. However, the focus is on combining data analytics and AI with business training—for example, how these technologies can be used to optimise busi-ness processes. In addition, INSEAD is launching a new Master in Management programme that will have significantly more focus on how to apply AI and data science to business problems, as well as programming courses.
NEW SKILLS FOR AUGMENTING JOBS AND ENHANCING PERFORMANCE WITH AI
THE GLOBAL TALENT COMPETITIVENESS INDEX 2020 71
CHAPTER 5
The Executive Education programme, AI for Business launched in 2019, is designed to give managers an understand-ing of what AI can and cannot do for their organisation. It also provides templates to guide managers and executives on how to identify AI business opportunities, manage AI projects, and work with data scientists in their organisations. Other executive programmes have also started incorporating AI into the topics and areas of study that they cover. For example, a popular five-week online course, Strategies for an Age of Digital Disruption, added an AI track with weekly supplemental lectures and a spe-cialised action learning project for AI.
Finally, INSEAD has developed partnerships with other organisations to complement its AI training offerings and ex-pand its reach. For example, a partnership with Microsoft, the AI Business School,13 features a series of online sessions covering topics ranging from how to define an AI strategy to develop-ing principles and governance processes for responsible AI. In the summer of 2019, INSEAD also initiated a partnership with Singularity University to develop joint executive training pro-grammes globally; the first such offering is The Future of AI: Seizing the Opportunity.14
CONCLUSIONUnlike other technologies, AI has the ability to not just support decision-making but actually make decisions. This capability cre-ates new opportunities to transform jobs by augmenting them, not necessarily replacing them. Given how human-like AI can be—organisations may wish to consider that they are ‘hiring’ AI rather than ‘buying’ AI—understanding its impact on organisa-tions and jobs, and leveraging the positive transformative poten-tial of AI while also minimising its risks, requires a very diverse and holistic set of skills. The skills highlighted in this chapter differ across roles within organisations, whether at the middle manager, executive, or director level. While the mix of skills may differ, one thing is increasingly clear: succeeding in the AI era re-quires not only an understanding of how this technology can affect business, but also an awareness of its capabilities and limi-tations and of the potential for new technical training for many jobs including professional ones, and, as important, a broader understanding of how AI may affect societies. In order to suc-cessfully accomplish this, a diverse set of skills spanning technical, business, ethical, and broadly philosophical topics are necessary.
ENDNOTES 1 Brynjolfsson & Hitt (2000).
2 Henke et al. (2018).
3 McKinsey Global Institute (2016).
4 Henke et al. (2018).
5 OECD (2019).
6 IEEE Standards Association (2019).
7 Bertsimas et al. (2018).
8 Kleinberg et al. (2018).
9 For further information see https://orc.mit.edu/academics/master-business-analytics
10 See https://mitsloan.mit.edu/business-analytics-certificate for further information.
11 For further details see https://ocw.mit.edu/courses/sloan-school-of-management/15-071-the-analytics-edge-spring-2017/
12 See https://mitsloan.mit.edu/undergrad#15-2-business-analytics
13 For further information see https://www.microsoft.com/en-us/ai/ai-business-school
14 See https://su.org/executive-education/the-future-of-ai/
REFERENCESArdila, D., Kiraly, A. P., Bharadwaj, S., Choi, B., Reicher, J. J., et al. (2019). End-to-end
lung cancer screening with three-dimensional deep learning on low-dose chest computed tomography. Nature Medicine, 25(6), 954–961.
Bertsimas, D., Dunn, J., Velmahos, G. C., & Kaafarani, H. M. A. (2018). Surgical risk is not linear: Derivation and validation of a novel, user-friendly, and machine-learning-based Predictive OpTimal Trees in Emergency Surgery Risk (POTTER) calculator. Annals of Surgery, 268(4), 574–583.
Brynjolfsson, E. & Hitt, L. M. (2000). Beyond computation: Information technology, organizational transformation and business performance. Journal of Economic Perspectives, 14(4), 23–48.
DeepMind. (2019). AlphaStar: Mastering the Real-Time Strategy Game StarCraft II, Blog post, 24 January, available at https://deepmind.com/blog/article/alphastar-mastering-real-time-strategy-game-starcraft-ii
Henke, N., Levine, J., & McInerney, P. (2018). You don't have to be a data scientist to fill this must-have analytics role. Harvard Business Review, available at https://hbr.org/2018/02/you-dont-have-to-be-a-data-scientist-to-fill-this-must-have-analytics-role
IEEE Standards Association. (2019). The IEEE Global Initiative on Ethics of Autonomous and Intelligent Systems, available at https://standards.ieee.org/industry-connections/ec/autonomous-systems.html
Kleinberg, J. H., Lakkaraju, J., Leskovec, J., Ludwig, S., & Mullainathan, S. (2018). Human decisions and machine predictions, The Quarterly Journal of Economics, 133(1), 237–293.
McKinsey Global Institute. (2016). The age of analytics: Competing in a data-driven world. Executive Summary, available at https://www.mckinsey.com/~/media/mckinsey/business functions/mckinsey analytics/our insights/the age of analytics competing in a data driven world/mgi-the-age-of-analytics-executive-summary.ashx
OECD (Organisation for Economic Co-operation and Development). (2019). OECD Principles on Artificial Intelligence, available at https://www.oecd.org/going-digital/ai/principles/
CHAPTER 5
72 THE GLOBAL TALENT COMPETITIVENESS INDEX 2020

the countries). The added value of the GTCI lies in its ability to summarise different aspects of talent competitiveness in a more efficient and parsimonious manner than is possible with the vari-ables and pillars taken separately. In fact, the overall ranking dif-fers from any of the six pillar rankings by 10 positions or more in at least 30% of the countries included in this year’s GTCI.
The European Commission’s Competence Centre on Composite Indicators and Scoreboards at the Joint Research Centre (JRC) has been invited to assess the statistical properties of the GTCI each year since its first release in 2013. Thus this audit represents the seventh analysis of the GTCI performed by the JRC. Overall, the JRC concluded that the GTCI 2020 is robust and reliable, with a statistically coherent and balanced multi-level structure. The analysis has been performed in order to ensure the transparency and reliability of the GTCI and thus to enable policymakers to derive more accurate and meaningful conclu-sions about human capital and national competitiveness, and potentially to guide their choices on priority setting and policy formulation.
Individual skills and talents, more than capital, are the driv-ing forces that guide human beings towards the future. Since 2013, the business school INSEAD has developed the Global Talent Competitiveness Index (GTCI), which aims to summarise complex and versatile concepts related to human capital and talent competitiveness at the national scale worldwide. In so doing, it raises conceptual and practical challenges, which are discussed in the GTCI 2020 report. This chapter focuses on the practical challenges related to the data quality and the meth-odological choices made in the grouping of 70 variables into 14 sub-pillars, six pillars, two sub-indices, and an overall index for 132 countries.
The GTCI 2020 has a very high statistical reliability (it has a Cronbach’s alpha value of 0.97) and captures the single latent phenomenon underlying the six main dimensions of the GTCI conceptual framework. Country ranks are also robust to meth-odological choices related to the treatment of missing values, weighting, and aggregation rule (with a shift less than or equal to ±2 positions with respect to the simulated median in 90% of
CHAPTER 6
JRC Statistical Audit of the Global Talent Competitiveness Index 2020Michaela Saisana, Hedvig Norlén, Giulio Caperna, and Valentina MontaltoEuropean Commission Joint Research Centre
JRC STATISTICAL AUDIT OF THE GLOBAL TALENT COMPETITIVENESS INDEX 2020
THE GLOBAL TALENT COMPETITIVENESS INDEX 2020 73
Landscape (1.3), which also contains Technology utilisation (moved from 1.2.6 last year to 1.3.6).
Following the iterative process during which the index has been fine-tuned, the current assessment of the statistical coher-ence in this final version of the GTCI 2020 followed four steps:
Step 1: RelevanceVariables were selected for their relevance to a specific pillar on the basis of the literature review, expert opinion, country cover-age, and timeliness. To represent a fair picture of country differ-ences, variables were scaled either at the source or by the GTCI team as appropriate and where needed.
Step 2: Data ChecksThe data used are the most recently released. The cut-off year was set to 2008. Countries were included if data availability was at least 80% at the index level and at least 40% at the sub-pillar level. As a result, the GTCI 2020 data set comprises 132 countries and 70 variables.3 Consequently, data availability is at least 84% at the Input sub-index level and 63% at the Output sub-index level. Potentially problematic variables that could bias the overall results were identified by the GTCI development team as those having absolute skewness greater than 2 and kurtosis greater than 3.5,4 and were treated either by winsorisation or by taking the natural logarithm (in the case of five or more outliers). In total, six indicators were treated: 1.3.8 Robot density, 2.1.3 Migrant stock, 2.1.4 International students, 2.2.5 Gender development gap, 6.1.5 Senior officials and managers, and 6.2.2 High-value exports (see Appendix I, Technical Notes, for details). In the case of Robot density, a larger share of missing data is observed. This variable is one of this year’s new ones, so an improvement in its coverage in the next edition can be expected. These criteria follow the WIPO-INSEAD Global Innovation Index practice (for-mulated with the JRC in 2011). The variable Rule of law (1.1.2) is highly correlated with three out of four of the other variables of the Regulatory Landscape sub-pillar; this is not a critical issue, but the elimination of one of these variables should not damage the structure of the sub-pillar.
Step 3: Statistical CoherenceThis section presents the JRC’s analysis of the statistical coher-ence of the GTCI 2020, which consists of a principal component analysis to study the structure of the data, a multi-level analysis of the correlations of variables, and a comparison of GTCI rank-ings with its pillars and with other similar indices. This latter inves-tigation demonstrates the added value of the GTCI both against its component pillars and vis-à-vis other relevant indices on com-petitiveness, innovation, and human capital.
1. Principal Component Analysis and Reliability Item AnalysisPrincipal component analysis (PCA) was used to assess the ex-tent to which the conceptual framework is compatible with statistical properties of the data. PCA confirms the presence of a single statistical dimension (i.e., no more than one principal component with an eigenvalue significantly greater than 1.0)
As in the previous audits, the present JRC assessment of the GTCI 2020 focuses on two main issues: (1) the statistical co-herence of the structure and (2) the impact of key modelling assumptions on the GTCI scores and ranks.1 The JRC analysis complements the reported country rankings for the GTCI, and for the Input and Output sub-indices, with confidence intervals in order to better appreciate the robustness of these ranks to the computation methodology (in particular, the missing data estimation, weights, and aggregation formula). Furthermore, the JRC analysis includes an assessment of the added value of the GTCI and a comparison with other global measures of human capital, competitiveness, and innovation. The version of the GTCI model presented in 2020 has many aspects in common with these other global measures. Nevertheless, compared with the other indices, the GTCI 2020 is proven to offer additional insights into nations’ human capital and competitiveness.
The practical items addressed in this chapter relate to the statistical soundness of the GTCI, which should be considered to be a necessary (though not necessarily sufficient) condition for a sound index. Given that the present statistical analysis of the GTCI will mostly, though not exclusively, be based on cor-relations, the correspondence of the GTCI to a real-world phe-nomenon needs to be critically addressed because ‘correlations do not necessarily represent the real influence of the individual indi-cators on the phenomenon being measured’.2 The point is that the validity of the GTCI relies on the combination of both statistical and conceptual soundness. In this respect, the GTCI has been de-veloped following an iterative process that went back and forth between the theoretical understanding of human capital and talent competitiveness on the one hand, and empirical observa-tions on the other.
STATISTICAL COHERENCE IN THE GTCI FRAMEWORKThe JRC undertook an initial assessment of the GTCI 2020 data set in September 2019. The latest GTCI model provided by the de-velopment team largely incorporated the issues identified and discussed in previous editions—in particular, the substitution of variables previously determined to be not influential on the final values of the index. No critical issues were identified in the 2020 model during this preliminary phase of the audit.
The underlying concepts and framework used to describe global talent competitiveness in the GTCI 2020 have remained essentially the same as those in the GTCI 2019, although there are some minor adjustments in this year’s edition. Three vari-ables have been excluded from the framework in the 2020 edi-tion: Ease of hiring and Ease of redundancy (1.3.1 and 1.3.2) and Gender earnings gap (2.2.5).
On the other hand, six new variables have been included: Urban population (1.2.6), Tertiary-educated unemployment (1.3.1), and the Gender development gap (2.2.5) are inserted as an update of the excluded variables, and Rule of law (1.1.2) is an external index included in the Regulatory Landscape sub-pillar. Furthermore, Investment in emerging technologies (1.3.7) and Robot density (1.3.8) are used to form a new component, called Technology Adoption, of sub-pillar Business and Labour
JRC STATISTICAL AUDIT OF THE GLOBAL TALENT COMPETITIVENESS INDEX 2020CHAPTER 6
74 THE GLOBAL TALENT COMPETITIVENESS INDEX 2020
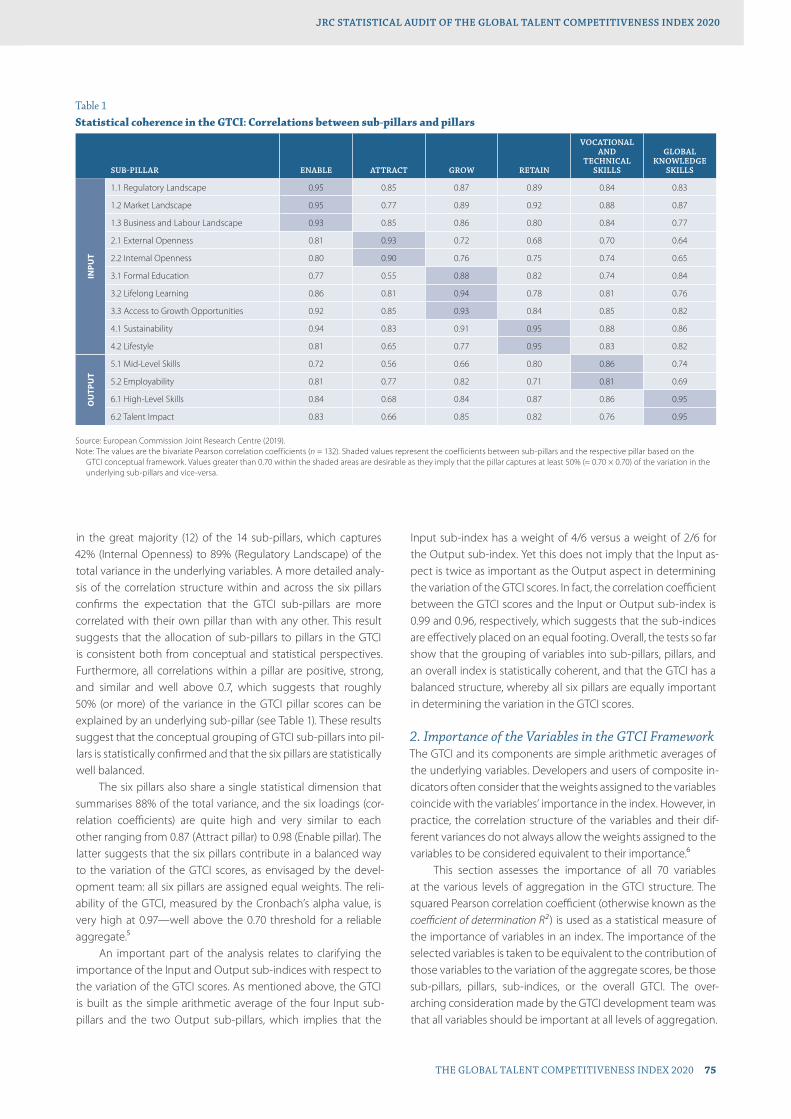
in the great majority (12) of the 14 sub-pillars, which captures 42% (Internal Openness) to 89% (Regulatory Landscape) of the total variance in the underlying variables. A more detailed analy-sis of the correlation structure within and across the six pillars confirms the expectation that the GTCI sub-pillars are more correlated with their own pillar than with any other. This result suggests that the allocation of sub-pillars to pillars in the GTCI is consistent both from conceptual and statistical perspectives. Furthermore, all correlations within a pillar are positive, strong, and similar and well above 0.7, which suggests that roughly 50% (or more) of the variance in the GTCI pillar scores can be explained by an underlying sub-pillar (see Table 1). These results suggest that the conceptual grouping of GTCI sub-pillars into pil-lars is statistically confirmed and that the six pillars are statistically well balanced.
The six pillars also share a single statistical dimension that summarises 88% of the total variance, and the six loadings (cor-relation coefficients) are quite high and very similar to each other ranging from 0.87 (Attract pillar) to 0.98 (Enable pillar). The latter suggests that the six pillars contribute in a balanced way to the variation of the GTCI scores, as envisaged by the devel-opment team: all six pillars are assigned equal weights. The reli-ability of the GTCI, measured by the Cronbach’s alpha value, is very high at 0.97—well above the 0.70 threshold for a reliable aggregate.5
An important part of the analysis relates to clarifying the importance of the Input and Output sub-indices with respect to the variation of the GTCI scores. As mentioned above, the GTCI is built as the simple arithmetic average of the four Input sub-pillars and the two Output sub-pillars, which implies that the
Input sub-index has a weight of 4/6 versus a weight of 2/6 for the Output sub-index. Yet this does not imply that the Input as-pect is twice as important as the Output aspect in determining the variation of the GTCI scores. In fact, the correlation coefficient between the GTCI scores and the Input or Output sub-index is 0.99 and 0.96, respectively, which suggests that the sub-indices are effectively placed on an equal footing. Overall, the tests so far show that the grouping of variables into sub-pillars, pillars, and an overall index is statistically coherent, and that the GTCI has a balanced structure, whereby all six pillars are equally important in determining the variation in the GTCI scores.
2. Importance of the Variables in the GTCI FrameworkThe GTCI and its components are simple arithmetic averages of the underlying variables. Developers and users of composite in-dicators often consider that the weights assigned to the variables coincide with the variables’ importance in the index. However, in practice, the correlation structure of the variables and their dif-ferent variances do not always allow the weights assigned to the variables to be considered equivalent to their importance.6
This section assesses the importance of all 70 variables at the various levels of aggregation in the GTCI structure. The squared Pearson correlation coefficient (otherwise known as the coefficient of determination R2 ) is used as a statistical measure of the importance of variables in an index. The importance of the selected variables is taken to be equivalent to the contribution of those variables to the variation of the aggregate scores, be those sub-pillars, pillars, sub-indices, or the overall GTCI. The over-arching consideration made by the GTCI development team was that all variables should be important at all levels of aggregation.
Table 1Statistical coherence in the GTCI: Correlations between sub-pillars and pillars
Source: European Commission Joint Research Centre (2019).Note: The values are the bivariate Pearson correlation coefficients (n = 132). Shaded values represent the coefficients between sub-pillars and the respective pillar based on the
GTCI conceptual framework. Values greater than 0.70 within the shaded areas are desirable as they imply that the pillar captures at least 50% (≈ 0.70 × 0.70) of the variation in the underlying sub-pillars and vice-versa.
SUB-PILLAR ENABLE ATTRACT GROW RETAIN
VOCATIONAL AND
TECHNICAL SKILLS
GLOBAL KNOWLEDGE
SKILLS
INPU
T
1.1 Regulatory Landscape 0.95 0.85 0.87 0.89 0.84 0.83
1.2 Market Landscape 0.95 0.77 0.89 0.92 0.88 0.87
1.3 Business and Labour Landscape 0.93 0.85 0.86 0.80 0.84 0.77
2.1 External Openness 0.81 0.93 0.72 0.68 0.70 0.64
2.2 Internal Openness 0.80 0.90 0.76 0.75 0.74 0.65
3.1 Formal Education 0.77 0.55 0.88 0.82 0.74 0.84
3.2 Lifelong Learning 0.86 0.81 0.94 0.78 0.81 0.76
3.3 Access to Growth Opportunities 0.92 0.85 0.93 0.84 0.85 0.82
4.1 Sustainability 0.94 0.83 0.91 0.95 0.88 0.86
4.2 Lifestyle 0.81 0.65 0.77 0.95 0.83 0.82
OU
TPU
T
5.1 Mid-Level Skills 0.72 0.56 0.66 0.80 0.86 0.74
5.2 Employability 0.81 0.77 0.82 0.71 0.81 0.69
6.1 High-Level Skills 0.84 0.68 0.84 0.87 0.86 0.95
6.2 Talent Impact 0.83 0.66 0.85 0.82 0.76 0.95
JRC STATISTICAL AUDIT OF THE GLOBAL TALENT COMPETITIVENESS INDEX 2020
THE GLOBAL TALENT COMPETITIVENESS INDEX 2020 75
CHAPTER 6
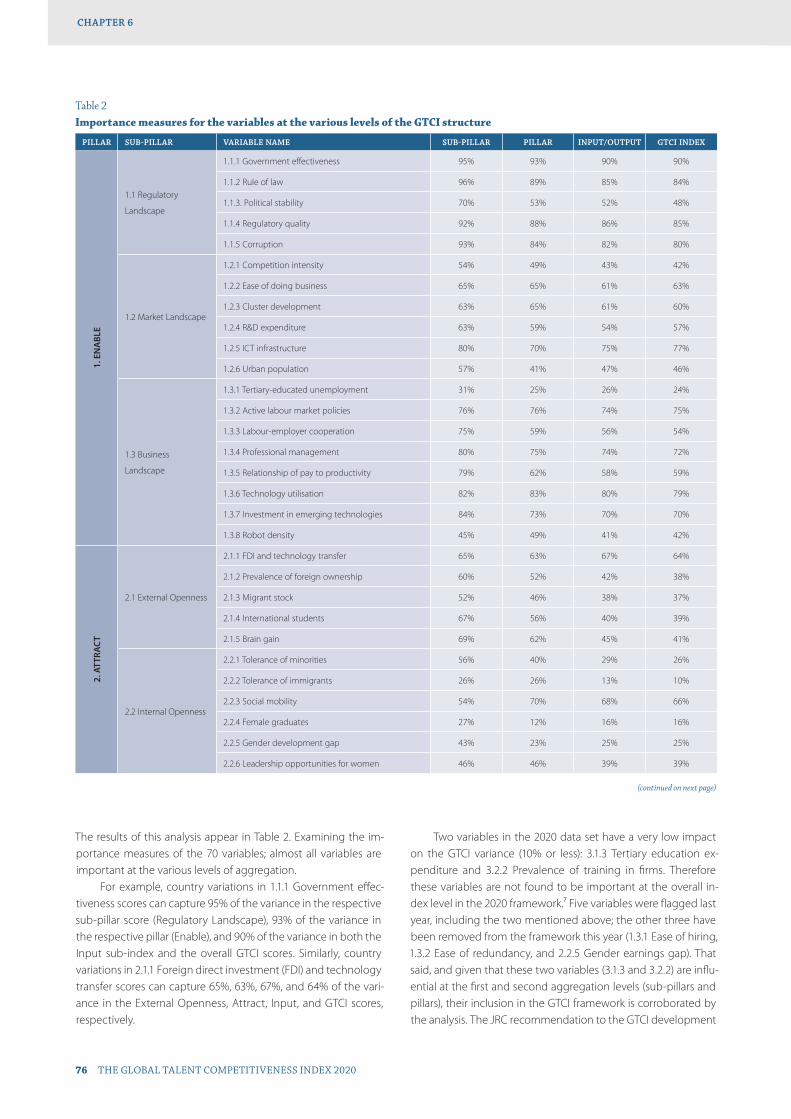
The results of this analysis appear in Table 2. Examining the im-portance measures of the 70 variables; almost all variables are important at the various levels of aggregation.
For example, country variations in 1.1.1 Government effec-tiveness scores can capture 95% of the variance in the respective sub-pillar score (Regulatory Landscape), 93% of the variance in the respective pillar (Enable), and 90% of the variance in both the Input sub-index and the overall GTCI scores. Similarly, country variations in 2.1.1 Foreign direct investment (FDI) and technology transfer scores can capture 65%, 63%, 67%, and 64% of the vari-ance in the External Openness, Attract, Input, and GTCI scores, respectively.
Two variables in the 2020 data set have a very low impact on the GTCI variance (10% or less): 3.1.3 Tertiary education ex-penditure and 3.2.2 Prevalence of training in firms. Therefore these variables are not found to be important at the overall in-dex level in the 2020 framework.7 Five variables were flagged last year, including the two mentioned above; the other three have been removed from the framework this year (1.3.1 Ease of hiring, 1.3.2 Ease of redundancy, and 2.2.5 Gender earnings gap). That said, and given that these two variables (3.1.3 and 3.2.2) are influ-ential at the first and second aggregation levels (sub-pillars and pillars), their inclusion in the GTCI framework is corroborated by the analysis. The JRC recommendation to the GTCI development
Table 2Importance measures for the variables at the various levels of the GTCI structure
PILLAR SUB-PILLAR VARIABLE NAME SUB-PILLAR PILLAR INPUT/OUTPUT GTCI INDEX
1. E
NA
BLE
1.1 Regulatory
Landscape
1.1.1 Government effectiveness 95% 93% 90% 90%
1.1.2 Rule of law 96% 89% 85% 84%
1.1.3. Political stability 70% 53% 52% 48%
1.1.4 Regulatory quality 92% 88% 86% 85%
1.1.5 Corruption 93% 84% 82% 80%
1.2 Market Landscape
1.2.1 Competition intensity 54% 49% 43% 42%
1.2.2 Ease of doing business 65% 65% 61% 63%
1.2.3 Cluster development 63% 65% 61% 60%
1.2.4 R&D expenditure 63% 59% 54% 57%
1.2.5 ICT infrastructure 80% 70% 75% 77%
1.2.6 Urban population 57% 41% 47% 46%
1.3 Business
Landscape
1.3.1 Tertiary-educated unemployment 31% 25% 26% 24%
1.3.2 Active labour market policies 76% 76% 74% 75%
1.3.3 Labour-employer cooperation 75% 59% 56% 54%
1.3.4 Professional management 80% 75% 74% 72%
1.3.5 Relationship of pay to productivity 79% 62% 58% 59%
1.3.6 Technology utilisation 82% 83% 80% 79%
1.3.7 Investment in emerging technologies 84% 73% 70% 70%
1.3.8 Robot density 45% 49% 41% 42%
2. A
TTRA
CT
2.1 External Openness
2.1.1 FDI and technology transfer 65% 63% 67% 64%
2.1.2 Prevalence of foreign ownership 60% 52% 42% 38%
2.1.3 Migrant stock 52% 46% 38% 37%
2.1.4 International students 67% 56% 40% 39%
2.1.5 Brain gain 69% 62% 45% 41%
2.2 Internal Openness
2.2.1 Tolerance of minorities 56% 40% 29% 26%
2.2.2 Tolerance of immigrants 26% 26% 13% 10%
2.2.3 Social mobility 54% 70% 68% 66%
2.2.4 Female graduates 27% 12% 16% 16%
2.2.5 Gender development gap 43% 23% 25% 25%
2.2.6 Leadership opportunities for women 46% 46% 39% 39%
(continued on next page)
JRC STATISTICAL AUDIT OF THE GLOBAL TALENT COMPETITIVENESS INDEX 2020CHAPTER 6
76 THE GLOBAL TALENT COMPETITIVENESS INDEX 2020
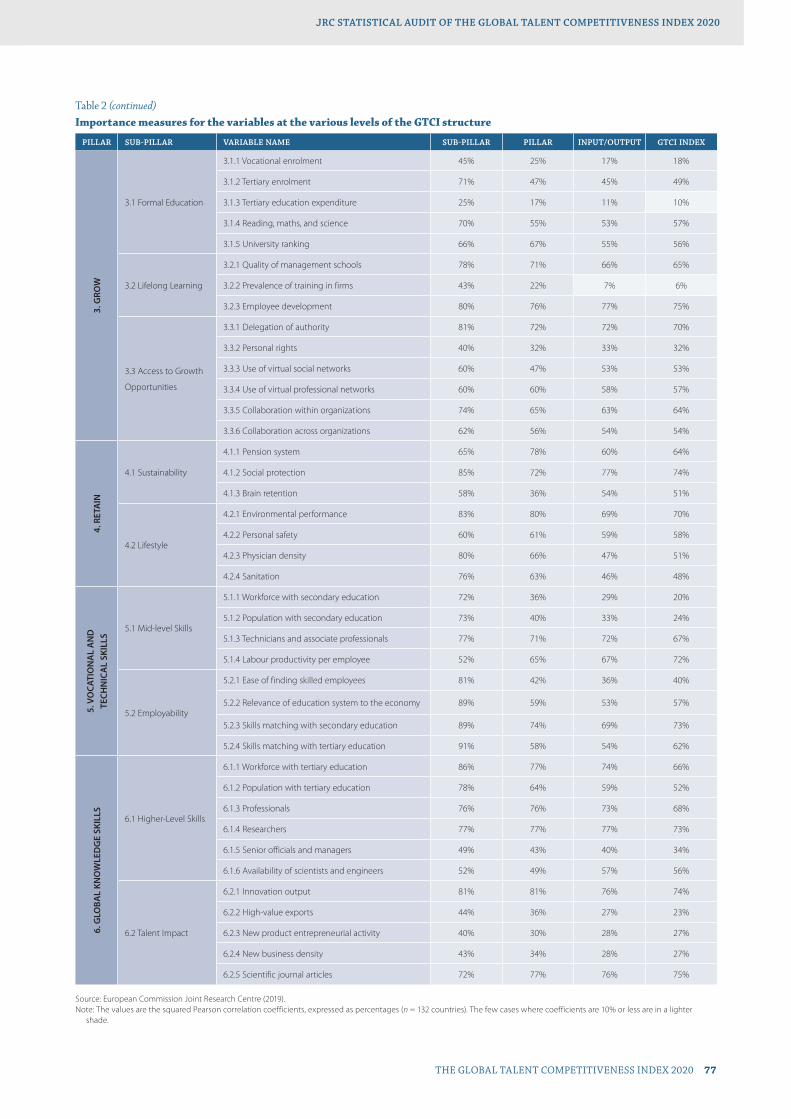
PILLAR SUB-PILLAR VARIABLE NAME SUB-PILLAR PILLAR INPUT/OUTPUT GTCI INDEX
3. G
ROW
3.1 Formal Education
3.1.1 Vocational enrolment 45% 25% 17% 18%
3.1.2 Tertiary enrolment 71% 47% 45% 49%
3.1.3 Tertiary education expenditure 25% 17% 11% 10%
3.1.4 Reading, maths, and science 70% 55% 53% 57%
3.1.5 University ranking 66% 67% 55% 56%
3.2 Lifelong Learning
3.2.1 Quality of management schools 78% 71% 66% 65%
3.2.2 Prevalence of training in firms 43% 22% 7% 6%
3.2.3 Employee development 80% 76% 77% 75%
3.3 Access to Growth
Opportunities
3.3.1 Delegation of authority 81% 72% 72% 70%
3.3.2 Personal rights 40% 32% 33% 32%
3.3.3 Use of virtual social networks 60% 47% 53% 53%
3.3.4 Use of virtual professional networks 60% 60% 58% 57%
3.3.5 Collaboration within organizations 74% 65% 63% 64%
3.3.6 Collaboration across organizations 62% 56% 54% 54%
4. R
ETA
IN
4.1 Sustainability
4.1.1 Pension system 65% 78% 60% 64%
4.1.2 Social protection 85% 72% 77% 74%
4.1.3 Brain retention 58% 36% 54% 51%
4.2 Lifestyle
4.2.1 Environmental performance 83% 80% 69% 70%
4.2.2 Personal safety 60% 61% 59% 58%
4.2.3 Physician density 80% 66% 47% 51%
4.2.4 Sanitation 76% 63% 46% 48%
5. V
OCA
TIO
NA
L A
ND
TE
CHN
ICA
L SK
ILLS
5.1 Mid-level Skills
5.1.1 Workforce with secondary education 72% 36% 29% 20%
5.1.2 Population with secondary education 73% 40% 33% 24%
5.1.3 Technicians and associate professionals 77% 71% 72% 67%
5.1.4 Labour productivity per employee 52% 65% 67% 72%
5.2 Employability
5.2.1 Ease of finding skilled employees 81% 42% 36% 40%
5.2.2 Relevance of education system to the economy 89% 59% 53% 57%
5.2.3 Skills matching with secondary education 89% 74% 69% 73%
5.2.4 Skills matching with tertiary education 91% 58% 54% 62%
6. G
LOBA
L KN
OW
LED
GE
SKIL
LS 6.1 Higher-Level Skills
6.1.1 Workforce with tertiary education 86% 77% 74% 66%
6.1.2 Population with tertiary education 78% 64% 59% 52%
6.1.3 Professionals 76% 76% 73% 68%
6.1.4 Researchers 77% 77% 77% 73%
6.1.5 Senior officials and managers 49% 43% 40% 34%
6.1.6 Availability of scientists and engineers 52% 49% 57% 56%
6.2 Talent Impact
6.2.1 Innovation output 81% 81% 76% 74%
6.2.2 High-value exports 44% 36% 27% 23%
6.2.3 New product entrepreneurial activity 40% 30% 28% 27%
6.2.4 New business density 43% 34% 28% 27%
6.2.5 Scientific journal articles 72% 77% 76% 75%
Source: European Commission Joint Research Centre (2019).Note: The values are the squared Pearson correlation coefficients, expressed as percentages (n = 132 countries). The few cases where coefficients are 10% or less are in a lighter
shade.
Table 2 (continued)Importance measures for the variables at the various levels of the GTCI structure
JRC STATISTICAL AUDIT OF THE GLOBAL TALENT COMPETITIVENESS INDEX 2020
THE GLOBAL TALENT COMPETITIVENESS INDEX 2020 77
CHAPTER 6
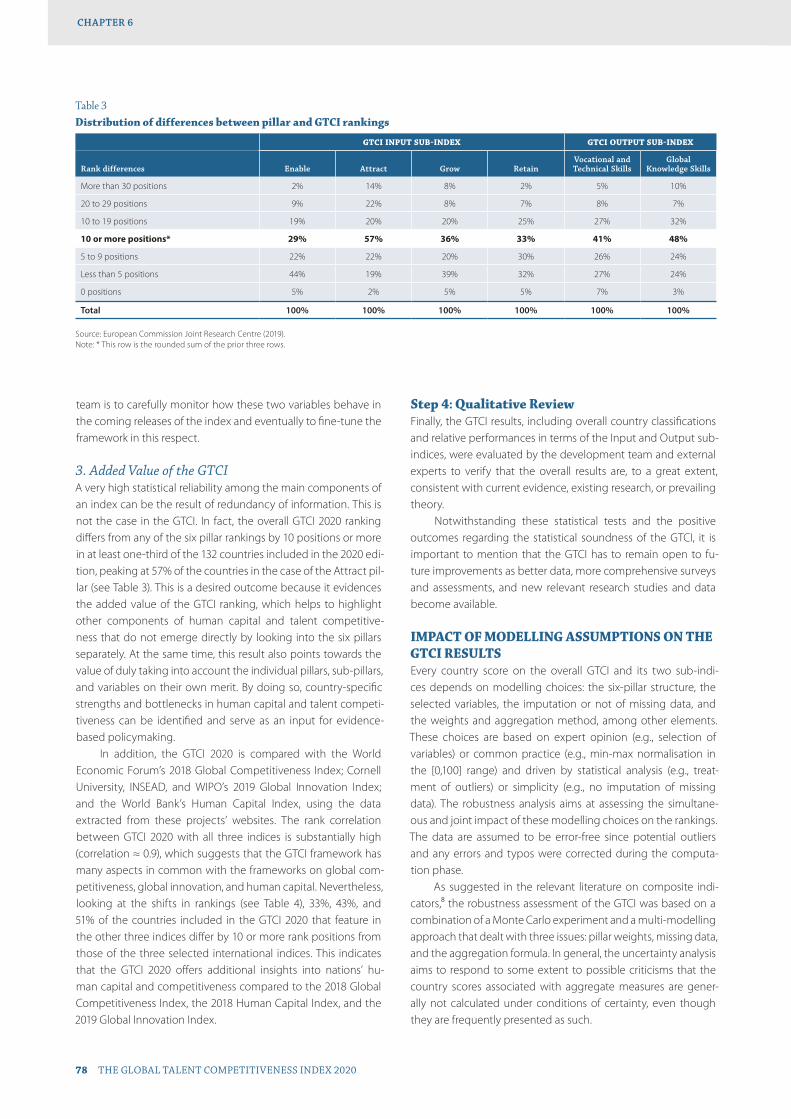
team is to carefully monitor how these two variables behave in the coming releases of the index and eventually to fine-tune the framework in this respect.
3. Added Value of the GTCIA very high statistical reliability among the main components of an index can be the result of redundancy of information. This is not the case in the GTCI. In fact, the overall GTCI 2020 ranking differs from any of the six pillar rankings by 10 positions or more in at least one-third of the 132 countries included in the 2020 edi-tion, peaking at 57% of the countries in the case of the Attract pil-lar (see Table 3). This is a desired outcome because it evidences the added value of the GTCI ranking, which helps to highlight other components of human capital and talent competitive-ness that do not emerge directly by looking into the six pillars separately. At the same time, this result also points towards the value of duly taking into account the individual pillars, sub-pillars, and variables on their own merit. By doing so, country-specific strengths and bottlenecks in human capital and talent competi-tiveness can be identified and serve as an input for evidence-based policymaking.
In addition, the GTCI 2020 is compared with the World Economic Forum’s 2018 Global Competitiveness Index; Cornell University, INSEAD, and WIPO’s 2019 Global Innovation Index; and the World Bank’s Human Capital Index, using the data extracted from these projects’ websites. The rank correlation between GTCI 2020 with all three indices is substantially high (correlation ≈ 0.9), which suggests that the GTCI framework has many aspects in common with the frameworks on global com-petitiveness, global innovation, and human capital. Nevertheless, looking at the shifts in rankings (see Table 4), 33%, 43%, and 51% of the countries included in the GTCI 2020 that feature in the other three indices differ by 10 or more rank positions from those of the three selected international indices. This indicates that the GTCI 2020 offers additional insights into nations’ hu-man capital and competitiveness compared to the 2018 Global Competitiveness Index, the 2018 Human Capital Index, and the 2019 Global Innovation Index.
Step 4: Qualitative Review Finally, the GTCI results, including overall country classifications and relative performances in terms of the Input and Output sub-indices, were evaluated by the development team and external experts to verify that the overall results are, to a great extent, consistent with current evidence, existing research, or prevailing theory.
Notwithstanding these statistical tests and the positive outcomes regarding the statistical soundness of the GTCI, it is important to mention that the GTCI has to remain open to fu-ture improvements as better data, more comprehensive surveys and assessments, and new relevant research studies and data become available.
IMPACT OF MODELLING ASSUMPTIONS ON THE GTCI RESULTSEvery country score on the overall GTCI and its two sub-indi-ces depends on modelling choices: the six-pillar structure, the selected variables, the imputation or not of missing data, and the weights and aggregation method, among other elements. These choices are based on expert opinion (e.g., selection of variables) or common practice (e.g., min-max normalisation in the [0,100] range) and driven by statistical analysis (e.g., treat-ment of outliers) or simplicity (e.g., no imputation of missing data). The robustness analysis aims at assessing the simultane-ous and joint impact of these modelling choices on the rankings. The data are assumed to be error-free since potential outliers and any errors and typos were corrected during the computa-tion phase.
As suggested in the relevant literature on composite indi-cators,8 the robustness assessment of the GTCI was based on a combination of a Monte Carlo experiment and a multi-modelling approach that dealt with three issues: pillar weights, missing data, and the aggregation formula. In general, the uncertainty analysis aims to respond to some extent to possible criticisms that the country scores associated with aggregate measures are gener-ally not calculated under conditions of certainty, even though they are frequently presented as such.
Source: European Commission Joint Research Centre (2019).Note: * This row is the rounded sum of the prior three rows.
Table 3Distribution of differences between pillar and GTCI rankings
GTCI INPUT SUB-INDEX GTCI OUTPUT SUB-INDEX
Rank differences Enable Attract Grow RetainVocational and Technical Skills
Global Knowledge Skills
More than 30 positions 2% 14% 8% 2% 5% 10%
20 to 29 positions 9% 22% 8% 7% 8% 7%
10 to 19 positions 19% 20% 20% 25% 27% 32%
10 or more positions* 29% 57% 36% 33% 41% 48%
5 to 9 positions 22% 22% 20% 30% 26% 24%
Less than 5 positions 44% 19% 39% 32% 27% 24%
0 positions 5% 2% 5% 5% 7% 3%
Total 100% 100% 100% 100% 100% 100%
JRC STATISTICAL AUDIT OF THE GLOBAL TALENT COMPETITIVENESS INDEX 2020CHAPTER 6
78 THE GLOBAL TALENT COMPETITIVENESS INDEX 2020

While the term multi-modelling refers to testing alterna-tive assumptions—that is, alternative aggregation methods and missing data estimation methods—the Monte Carlo simulation explored the issue of weighting and comprised 1,000 runs, each corresponding to a different set of weights for the six pillars, ran-domly sampled from uniform continuous distributions centred in the reference values. The choice of the range for the weights’ variation was driven by two opposite needs: to ensure a wide enough interval to have meaningful robustness checks, and to respect the rationale of the GTCI that places equal importance on all six pillars. Given these considerations, the limit values of uncertainty intervals for the pillar weights are 15% to 35% for the four Input pillars for the calculation of the Input sub-index, and 40% to 60% for the two Output pillars for the calculation of the Output sub-index (see Table 5). For the calculation of the GTCI, the limit values of uncertainty intervals for all six pillar weights are 12% to 20%. In all simulations, sampled weights are rescaled so that they always sum to 1.
The GTCI development team, for transparency and replica-bility, opted not to estimate the missing data (only 5.3% of data were missing in the data set of 132 countries for all 70 variables). The ‘no imputation’ choice, which is common in similar contexts, might encourage countries not to report low data values. The consequence of the ‘no imputation’ choice in an arithmetic av-erage is that it is equivalent to replacing an indicator’s missing value for a given country with the respective mean of the other indicators that are being aggregated. Hence the available data (indicators) in the incomplete pillar may dominate, sometimes biasing the ranks up or down. To test the impact of this assump-tion, the JRC also estimated missing data using the Expectation Maximisation (EM) algorithm.9
Regarding the aggregation formula, decision-theory prac-titioners have challenged the use of simple arithmetic averages because of their fully compensatory nature, in which a com-paratively high advantage for a few variables can compensate for a comparative disadvantage for many variables.10 Despite the
Source: European Commission Joint Research Centre (2019).Notes: The comparison between the GTCI and the other indices was based on the common set of countries. *This row is the rounded sum of the prior three rows.
Rank differences with respect to the GTCI 2020
2018 Global Competitiveness Index (World Economic Forum)
2019 Global Innovation Index (Cornell, INSEAD, WIPO)
2018 Global Human Capital Index (World Bank)
More than 30 positions 2% 9% 7%
20 to 29 positions 9% 13% 16%
10 to 19 positions 22% 20% 29%
10 or more positions* 33% 43% 51%
5 to 9 positions 23% 21% 20%
Less than 5 positions 36% 31% 25%
0 positions 8% 6% 4%
Total 100% 100% 100%
Pearson correlation coefficient with the GTCI 0.96 0.93 0.88
Spearman rank correlation coefficient with the GTCI 0.96 0.90 0.90
Countries in common with the GTCI 129 120 122
Table 4Distribution of differences between the GTCI 2020 and other international rankings
Table 5Uncertainty analysis for the GTCI 2020: Missing data, aggregation, and pillar weights
REFERENCE ALTERNATIVE
I. Uncertainty in the treatment of missing values No estimation of missing data Expectation Maximisation (EM)
II. Uncertainty in the aggregation formula at pillar level Arithmetic average Geometric average
III. Uncertainty in the weightsReference value for the weight
(within the sub-index)Distribution assigned for robustness analysis
(within the sub-index)GTCI sub-index Pillar
Input Enable 0.25 U[0.15,0.35]
Attract 0.25 U[0.15,0.35]
Grow 0.25 U[0.15,0.35]
Retain 0.25 U[0.15,0.35]
Output Vocational and Technical Skills 0.50 U[0.40,0.60]
Global Knowledge Skills 0.50 U[0.40,0.60]
Source: European Commission Joint Research Centre (2019).
JRC STATISTICAL AUDIT OF THE GLOBAL TALENT COMPETITIVENESS INDEX 2020
THE GLOBAL TALENT COMPETITIVENESS INDEX 2020 79
CHAPTER 6
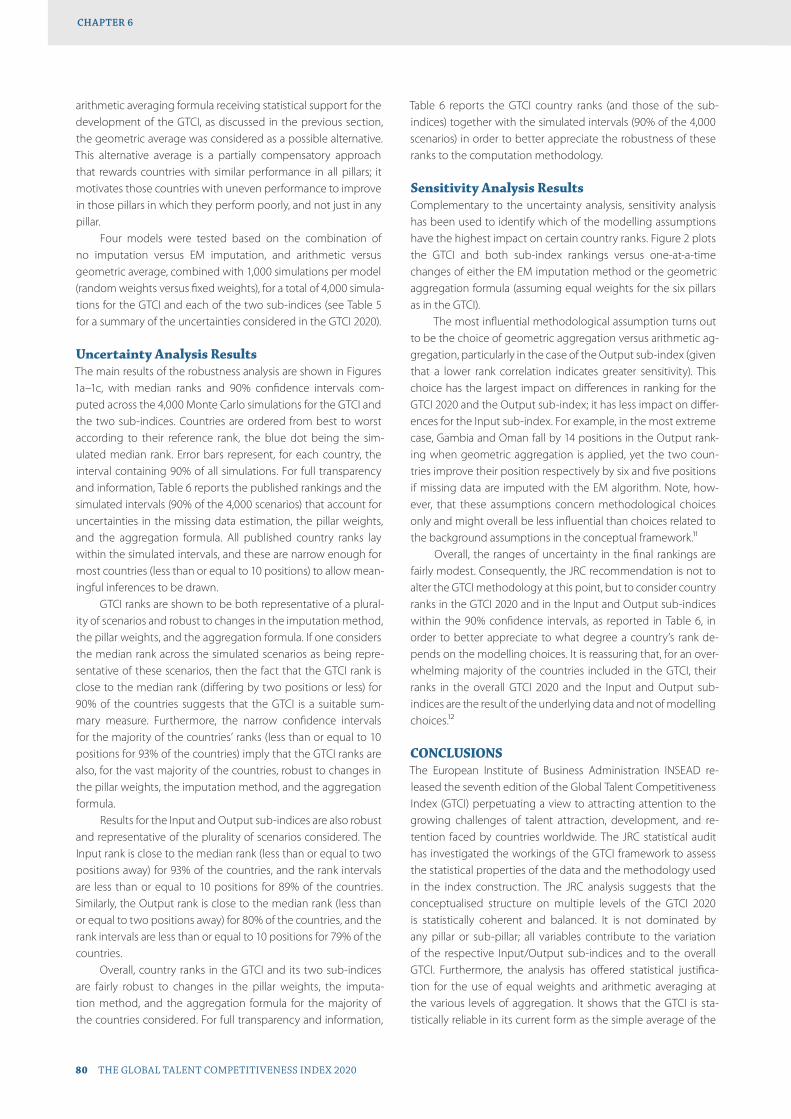
arithmetic averaging formula receiving statistical support for the development of the GTCI, as discussed in the previous section, the geometric average was considered as a possible alternative. This alternative average is a partially compensatory approach that rewards countries with similar performance in all pillars; it motivates those countries with uneven performance to improve in those pillars in which they perform poorly, and not just in any pillar.
Four models were tested based on the combination of no imputation versus EM imputation, and arithmetic versus geometric average, combined with 1,000 simulations per model (random weights versus fixed weights), for a total of 4,000 simula-tions for the GTCI and each of the two sub-indices (see Table 5 for a summary of the uncertainties considered in the GTCI 2020).
Uncertainty Analysis ResultsThe main results of the robustness analysis are shown in Figures 1a–1c, with median ranks and 90% confidence intervals com-puted across the 4,000 Monte Carlo simulations for the GTCI and the two sub-indices. Countries are ordered from best to worst according to their reference rank, the blue dot being the sim-ulated median rank. Error bars represent, for each country, the interval containing 90% of all simulations. For full transparency and information, Table 6 reports the published rankings and the simulated intervals (90% of the 4,000 scenarios) that account for uncertainties in the missing data estimation, the pillar weights, and the aggregation formula. All published country ranks lay within the simulated intervals, and these are narrow enough for most countries (less than or equal to 10 positions) to allow mean-ingful inferences to be drawn.
GTCI ranks are shown to be both representative of a plural-ity of scenarios and robust to changes in the imputation method, the pillar weights, and the aggregation formula. If one considers the median rank across the simulated scenarios as being repre-sentative of these scenarios, then the fact that the GTCI rank is close to the median rank (differing by two positions or less) for 90% of the countries suggests that the GTCI is a suitable sum-mary measure. Furthermore, the narrow confidence intervals for the majority of the countries’ ranks (less than or equal to 10 positions for 93% of the countries) imply that the GTCI ranks are also, for the vast majority of the countries, robust to changes in the pillar weights, the imputation method, and the aggregation formula.
Results for the Input and Output sub-indices are also robust and representative of the plurality of scenarios considered. The Input rank is close to the median rank (less than or equal to two positions away) for 93% of the countries, and the rank intervals are less than or equal to 10 positions for 89% of the countries. Similarly, the Output rank is close to the median rank (less than or equal to two positions away) for 80% of the countries, and the rank intervals are less than or equal to 10 positions for 79% of the countries.
Overall, country ranks in the GTCI and its two sub-indices are fairly robust to changes in the pillar weights, the imputa-tion method, and the aggregation formula for the majority of the countries considered. For full transparency and information,
Table 6 reports the GTCI country ranks (and those of the sub-indices) together with the simulated intervals (90% of the 4,000 scenarios) in order to better appreciate the robustness of these ranks to the computation methodology.
Sensitivity Analysis ResultsComplementary to the uncertainty analysis, sensitivity analysis has been used to identify which of the modelling assumptions have the highest impact on certain country ranks. Figure 2 plots the GTCI and both sub-index rankings versus one-at-a-time changes of either the EM imputation method or the geometric aggregation formula (assuming equal weights for the six pillars as in the GTCI).
The most influential methodological assumption turns out to be the choice of geometric aggregation versus arithmetic ag-gregation, particularly in the case of the Output sub-index (given that a lower rank correlation indicates greater sensitivity). This choice has the largest impact on differences in ranking for the GTCI 2020 and the Output sub-index; it has less impact on differ-ences for the Input sub-index. For example, in the most extreme case, Gambia and Oman fall by 14 positions in the Output rank-ing when geometric aggregation is applied, yet the two coun-tries improve their position respectively by six and five positions if missing data are imputed with the EM algorithm. Note, how-ever, that these assumptions concern methodological choices only and might overall be less influential than choices related to the background assumptions in the conceptual framework.11
Overall, the ranges of uncertainty in the final rankings are fairly modest. Consequently, the JRC recommendation is not to alter the GTCI methodology at this point, but to consider country ranks in the GTCI 2020 and in the Input and Output sub-indices within the 90% confidence intervals, as reported in Table 6, in order to better appreciate to what degree a country’s rank de-pends on the modelling choices. It is reassuring that, for an over-whelming majority of the countries included in the GTCI, their ranks in the overall GTCI 2020 and the Input and Output sub-indices are the result of the underlying data and not of modelling choices.12
CONCLUSIONSThe European Institute of Business Administration INSEAD re-leased the seventh edition of the Global Talent Competitiveness Index (GTCI) perpetuating a view to attracting attention to the growing challenges of talent attraction, development, and re-tention faced by countries worldwide. The JRC statistical audit has investigated the workings of the GTCI framework to assess the statistical properties of the data and the methodology used in the index construction. The JRC analysis suggests that the conceptualised structure on multiple levels of the GTCI 2020 is statistically coherent and balanced. It is not dominated by any pillar or sub-pillar; all variables contribute to the variation of the respective Input/Output sub-indices and to the overall GTCI. Furthermore, the analysis has offered statistical justifica-tion for the use of equal weights and arithmetic averaging at the various levels of aggregation. It shows that the GTCI is sta-tistically reliable in its current form as the simple average of the
JRC STATISTICAL AUDIT OF THE GLOBAL TALENT COMPETITIVENESS INDEX 2020CHAPTER 6
80 THE GLOBAL TALENT COMPETITIVENESS INDEX 2020
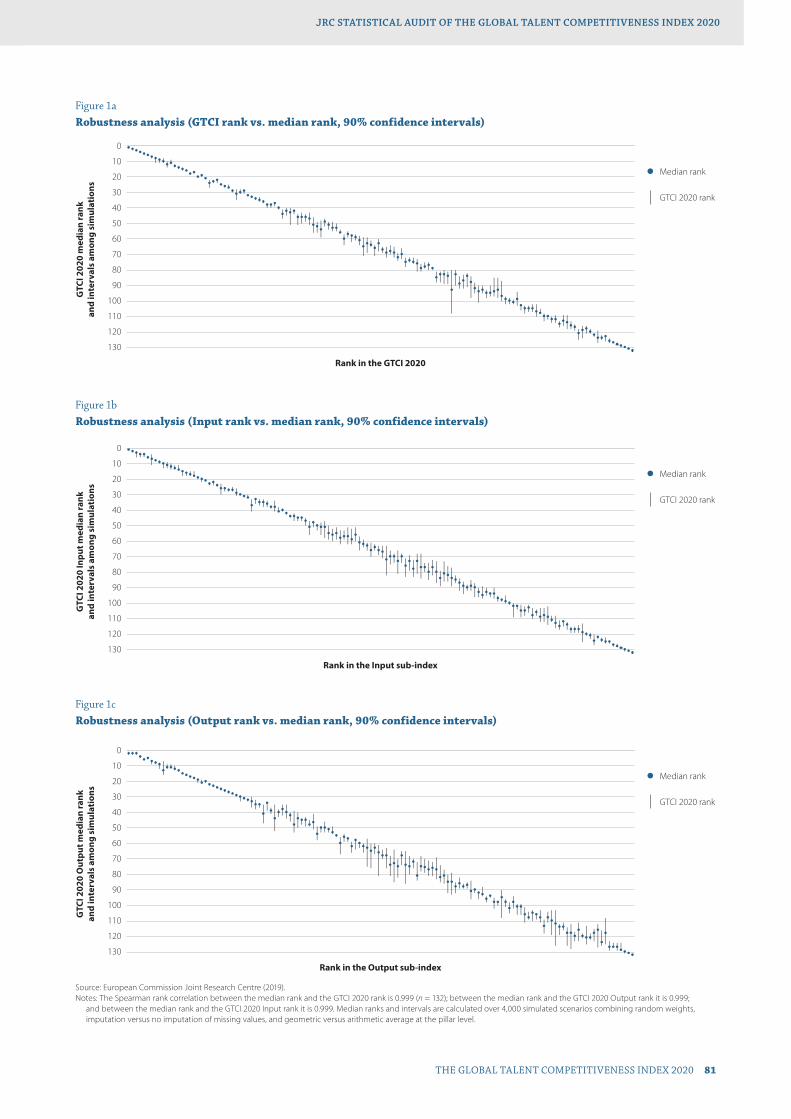
Figure 1aRobustness analysis (GTCI rank vs. median rank, 90% confidence intervals)
GTC
I 202
0 m
edia
n ra
nkan
d in
terv
als
amon
g si
mul
atio
ns
Median rank
GTCI 2020 rank
Rank in the GTCI 2020
130
120
110
100
90
80
70
60
50
40
30
20
10
0
Figure 1bRobustness analysis (Input rank vs. median rank, 90% confidence intervals)
GTC
I 202
0 In
put m
edia
n ra
nkan
d in
terv
als
amon
g si
mul
atio
ns
Median rank
GTCI 2020 rank
Rank in the Input sub-index
130
120
110
100
90
80
70
60
50
40
30
20
10
0
Source: European Commission Joint Research Centre (2019).Notes: The Spearman rank correlation between the median rank and the GTCI 2020 rank is 0.999 (n = 132); between the median rank and the GTCI 2020 Output rank it is 0.999;
and between the median rank and the GTCI 2020 Input rank it is 0.999. Median ranks and intervals are calculated over 4,000 simulated scenarios combining random weights, imputation versus no imputation of missing values, and geometric versus arithmetic average at the pillar level.
Figure 1cRobustness analysis (Output rank vs. median rank, 90% confidence intervals)
GTC
I 202
0 O
utpu
t med
ian
rank
and
inte
rval
s am
ong
sim
ulat
ions
Median rank
GTCI 2020 rank
Rank in the Output sub-index
130
120
110
100
90
80
70
60
50
40
30
20
10
0
JRC STATISTICAL AUDIT OF THE GLOBAL TALENT COMPETITIVENESS INDEX 2020
THE GLOBAL TALENT COMPETITIVENESS INDEX 2020 81
CHAPTER 6

Table 6Country ranks and 90% confidence intervals for the GTCI 2020 and its Input/Output sub-indices
GTCI 2020 INPUT SUB-INDEX OUTPUT SUB-INDEX
COUNTRY RANK INTERVAL RANK INTERVAL RANK INTERVAL
Switzerland 1 [1,1] 1 [1,1] 2 [1,3]
United States of America 2 [2,3] 2 [2,3] 1 [1,3]
Singapore 3 [2,3] 3 [2,6] 3 [1,3]
Sweden 4 [4,4] 5 [3,6] 4 [4,4]
Denmark 5 [5,6] 6 [5,7] 6 [5,6]
Netherlands 6 [5,6] 4 [3,6] 11 [9,12]
Finland 7 [7,8] 8 [7,8] 5 [5,6]
Luxembourg 8 [7,11] 7 [4,11] 14 [13,14]
Norway 9 [8,11] 10 [9,13] 8 [7,9]
Australia 10 [8,11] 9 [8,10] 15 [14,15]
Germany 11 [10,14] 12 [10,14] 10 [7,16]
United Kingdom 12 [9,12] 11 [9,13] 13 [10,13]
Canada 13 [12,14] 13 [11,14] 16 [15,16]
Iceland 14 [13,15] 16 [16,18] 9 [8,12]
Ireland 15 [14,16] 18 [15,18] 12 [9,12]
New Zealand 16 [15,16] 14 [11,14] 19 [19,21]
Austria 17 [17,18] 15 [15,18] 20 [19,21]
Belgium 18 [17,18] 17 [15,18] 18 [17,18]
Japan 19 [19,20] 19 [19,20] 22 [22,23]
Israel 20 [19,20] 23 [21,24] 7 [7,9]
France 21 [21,21] 21 [20,21] 21 [20,21]
United Arab Emirates 22 [22,27] 20 [19,22] 31 [30,32]
Malta 23 [22,24] 22 [22,24] 26 [25,27]
Estonia 24 [22,24] 27 [26,28] 17 [17,18]
Czech Republic 25 [24,25] 24 [23,25] 27 [26,28]
Malaysia 26 [26,27] 28 [25,28] 25 [24,26]
Korea, Rep. 27 [25,27] 29 [26,31] 24 [24,25]
Portugal 28 [28,30] 26 [25,28] 32 [32,33]
Qatar 29 [28,35] 25 [23,30] 39 [35,52]
Cyprus 30 [28,31] 35 [33,37] 23 [22,23]
Slovenia 31 [28,31] 31 [31,32] 28 [27,28]
Spain 32 [31,32] 30 [29,30] 41 [35,42]
Latvia 33 [32,33] 38 [37,39] 29 [29,30]
Chile 34 [33,35] 34 [33,36] 35 [34,37]
Lithuania 35 [33,36] 37 [34,38] 33 [30,37]
Italy 36 [35,37] 39 [34,41] 34 [32,38]
Costa Rica 37 [37,40] 32 [30,32] 55 [54,56]
Brunei Darussalam 38 [37,40] 43 [43,45] 30 [29,33]
Slovakia 39 [37,39] 41 [39,41] 38 [37,41]
Saudi Arabia 40 [39,41] 42 [42,43] 36 [35,47]
Bahrain 41 [41,47] 33 [33,41] 63 [57,75]
China 42 [40,45] 44 [42,47] 45 [40,50]
Oman 43 [40,51] 36 [33,38] 66 [61,81]
Poland 44 [41,44] 46 [44,47] 40 [38,43]
(continued on next page)
JRC STATISTICAL AUDIT OF THE GLOBAL TALENT COMPETITIVENESS INDEX 2020CHAPTER 6
82 THE GLOBAL TALENT COMPETITIVENESS INDEX 2020
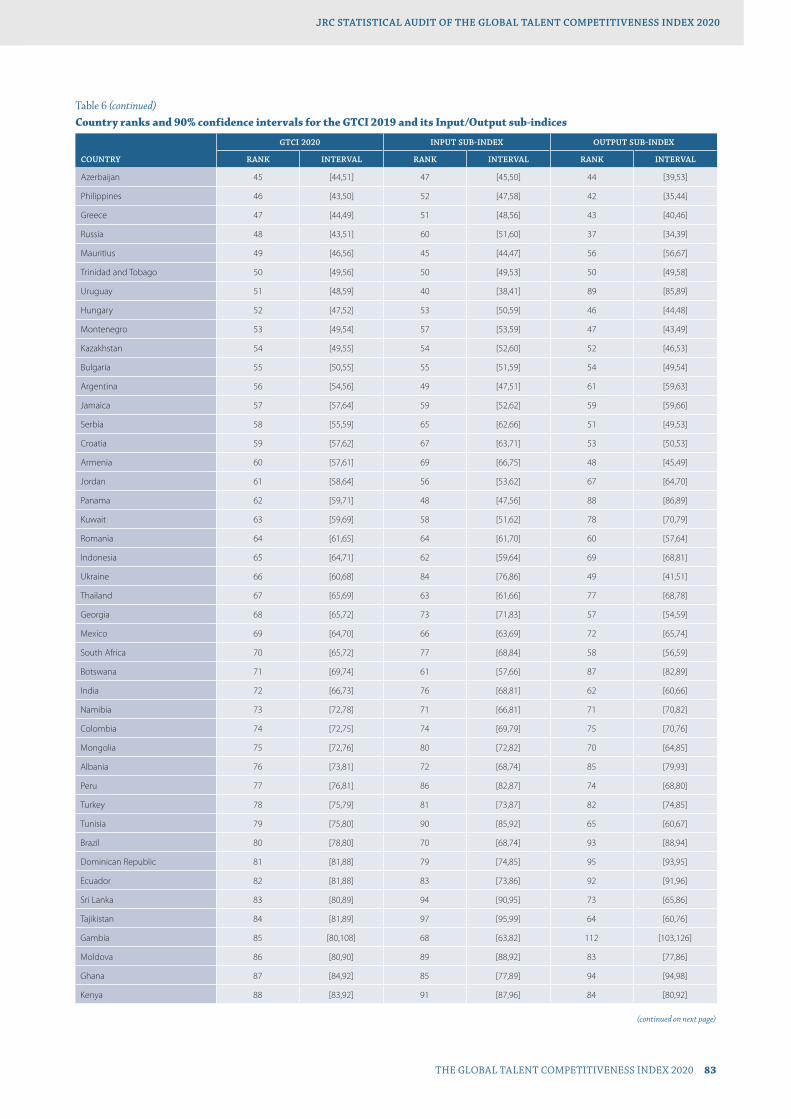
Table 6 (continued)Country ranks and 90% confidence intervals for the GTCI 2019 and its Input/Output sub-indices
GTCI 2020 INPUT SUB-INDEX OUTPUT SUB-INDEX
COUNTRY RANK INTERVAL RANK INTERVAL RANK INTERVAL
Azerbaijan 45 [44,51] 47 [45,50] 44 [39,53]
Philippines 46 [43,50] 52 [47,58] 42 [35,44]
Greece 47 [44,49] 51 [48,56] 43 [40,46]
Russia 48 [43,51] 60 [51,60] 37 [34,39]
Mauritius 49 [46,56] 45 [44,47] 56 [56,67]
Trinidad and Tobago 50 [49,56] 50 [49,53] 50 [49,58]
Uruguay 51 [48,59] 40 [38,41] 89 [85,89]
Hungary 52 [47,52] 53 [50,59] 46 [44,48]
Montenegro 53 [49,54] 57 [53,59] 47 [43,49]
Kazakhstan 54 [49,55] 54 [52,60] 52 [46,53]
Bulgaria 55 [50,55] 55 [51,59] 54 [49,54]
Argentina 56 [54,56] 49 [47,51] 61 [59,63]
Jamaica 57 [57,64] 59 [52,62] 59 [59,66]
Serbia 58 [55,59] 65 [62,66] 51 [49,53]
Croatia 59 [57,62] 67 [63,71] 53 [50,53]
Armenia 60 [57,61] 69 [66,75] 48 [45,49]
Jordan 61 [58,64] 56 [53,62] 67 [64,70]
Panama 62 [59,71] 48 [47,56] 88 [86,89]
Kuwait 63 [59,69] 58 [51,62] 78 [70,79]
Romania 64 [61,65] 64 [61,70] 60 [57,64]
Indonesia 65 [64,71] 62 [59,64] 69 [68,81]
Ukraine 66 [60,68] 84 [76,86] 49 [41,51]
Thailand 67 [65,69] 63 [61,66] 77 [68,78]
Georgia 68 [65,72] 73 [71,83] 57 [54,59]
Mexico 69 [64,70] 66 [63,69] 72 [65,74]
South Africa 70 [65,72] 77 [68,84] 58 [56,59]
Botswana 71 [69,74] 61 [57,66] 87 [82,89]
India 72 [66,73] 76 [68,81] 62 [60,66]
Namibia 73 [72,78] 71 [66,81] 71 [70,82]
Colombia 74 [72,75] 74 [69,79] 75 [70,76]
Mongolia 75 [72,76] 80 [72,82] 70 [64,85]
Albania 76 [73,81] 72 [68,74] 85 [79,93]
Peru 77 [76,81] 86 [82,87] 74 [68,80]
Turkey 78 [75,79] 81 [73,87] 82 [74,85]
Tunisia 79 [75,80] 90 [85,92] 65 [60,67]
Brazil 80 [78,80] 70 [68,74] 93 [88,94]
Dominican Republic 81 [81,88] 79 [74,85] 95 [93,95]
Ecuador 82 [81,88] 83 [73,86] 92 [91,96]
Sri Lanka 83 [80,89] 94 [90,95] 73 [65,86]
Tajikistan 84 [81,89] 97 [95,99] 64 [60,76]
Gambia 85 [80,108] 68 [63,82] 112 [103,126]
Moldova 86 [80,90] 89 [88,92] 83 [77,86]
Ghana 87 [84,92] 85 [77,89] 94 [94,98]
Kenya 88 [83,92] 91 [87,96] 84 [80,92]
(continued on next page)
JRC STATISTICAL AUDIT OF THE GLOBAL TALENT COMPETITIVENESS INDEX 2020
THE GLOBAL TALENT COMPETITIVENESS INDEX 2020 83
CHAPTER 6

Source: European Commission Joint Research Centre (2019).
Table 6 (continued)Country ranks and 90% confidence intervals for the GTCI 2019 and its Input/Output sub-indices
GTCI 2020 INPUT SUB-INDEX OUTPUT SUB-INDEX
COUNTRY RANK INTERVAL RANK INTERVAL RANK INTERVAL
North Macedonia 89 [82,91] 93 [89,97] 80 [72,81]
Cabo Verde 90 [84,98] 82 [79,89] 98 [90,108]
Kyrgyzstan 91 [88,95] 98 [97,99] 76 [72,84]
Bhutan 92 [90,101] 75 [72,83] 111 [103,119]
Rwanda 93 [90,95] 78 [74,80] 110 [104,111]
Honduras 94 [93,98] 87 [84,92] 102 [99,106]
Guatemala 95 [90,97] 88 [86,94] 99 [96,101]
Viet Nam 96 [85,97] 95 [93,96] 90 [84,96]
Egypt 97 [85,98] 100 [99,101] 81 [69,83]
Lao PDR 98 [87,100] 104 [102,108] 68 [63,76]
Paraguay 99 [97,102] 92 [90,96] 106 [103,110]
Morocco 100 [98,102] 96 [90,97] 108 [103,111]
Bosnia and Herzegovina 101 [99,102] 105 [101,106] 86 [85,92]
Iran, Islamic Rep. 102 [94,103] 110 [102,114] 79 [71,81]
Zambia 103 [102,106] 101 [100,109] 100 [98,105]
Senegal 104 [103,108] 99 [95,100] 113 [112,119]
Algeria 105 [103,107] 109 [103,112] 97 [97,100]
Pakistan 106 [102,107] 114 [111,115] 91 [89,92]
Bolivia 107 [102,110] 108 [103,112] 103 [99,106]
Côte d'Ivoire 108 [105,108] 106 [103,110] 107 [105,109]
Nicaragua 109 [108,113] 102 [101,104] 117 [117,123]
El Salvador 110 [109,112] 107 [104,108] 109 [109,118]
Tanzania 111 [110,114] 103 [101,109] 119 [118,121]
Nigeria 112 [109,114] 116 [115,119] 96 [95,102]
Uganda 113 [113,117] 112 [108,116] 114 [111,116]
Venezuela, Bolivarian Rep. 114 [109,116] 119 [113,125] 101 [94,102]
Eswatini 115 [109,118] 111 [108,112] 125 [108,125]
Cameroon 116 [113,118] 120 [119,121] 104 [101,111]
Cambodia 117 [115,119] 115 [112,117] 122 [115,123]
Liberia 118 [118,125] 113 [111,117] 128 [124,129]
Lesotho 119 [116,124] 117 [115,119] 116 [112,128]
Malawi 120 [116,121] 118 [114,119] 118 [111,123]
Nepal 121 [118,121] 124 [122,125] 105 [104,109]
Burkina Faso 122 [121,123] 121 [119,123] 124 [116,126]
Ethiopia 123 [119,127] 122 [120,127] 120 [113,125]
Bangladesh 124 [122,125] 126 [124,126] 115 [114,126]
Mali 125 [123,126] 123 [121,123] 127 [124,127]
Madagascar 126 [124,127] 125 [122,126] 126 [123,129]
Zimbabwe 127 [126,127] 127 [126,128] 121 [118,122]
Mozambique 128 [128,128] 128 [126,128] 131 [130,131]
Burundi 129 [129,130] 129 [129,129] 130 [130,131]
Congo, Dem. Rep. 130 [129,130] 131 [130,131] 123 [112,127]
Angola 131 [131,131] 130 [130,131] 132 [132,132]
Yemen 132 [132,132] 132 [132,132] 129 [124,129]
JRC STATISTICAL AUDIT OF THE GLOBAL TALENT COMPETITIVENESS INDEX 2020CHAPTER 6
84 THE GLOBAL TALENT COMPETITIVENESS INDEX 2020
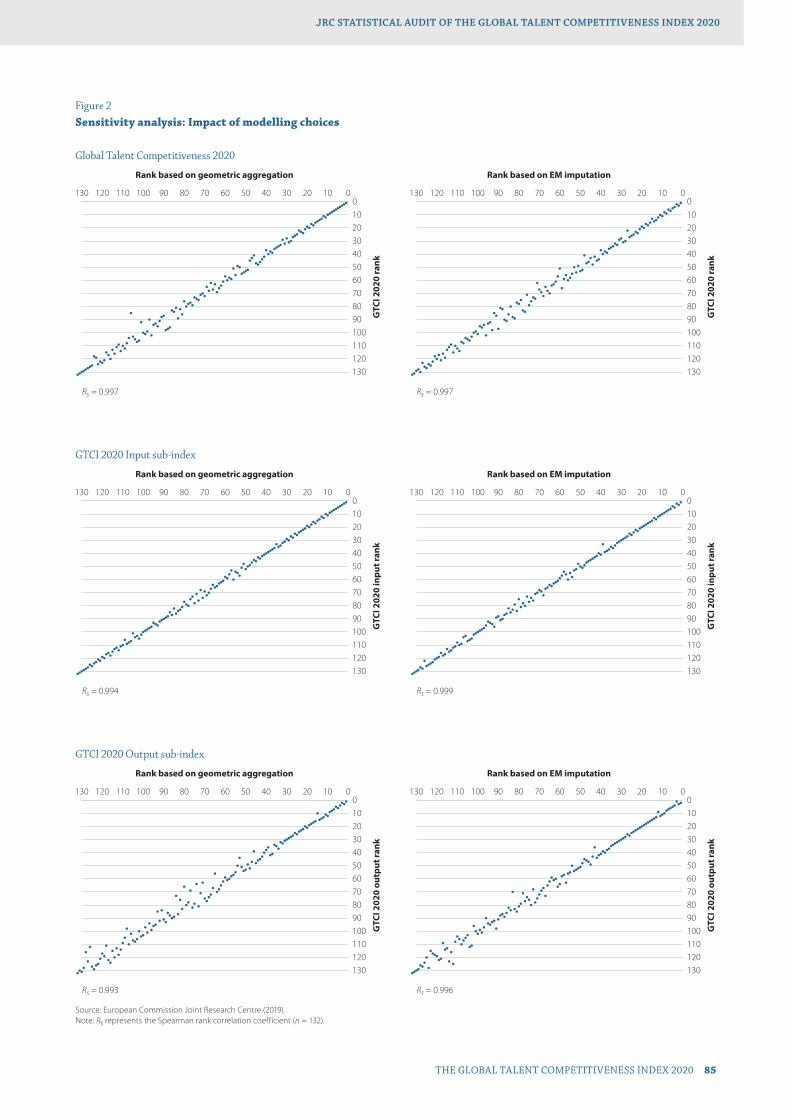
130 120 110 100 90 80 70 60 50 40 30 20 10 0
1301201101009080706050403020100
Rank based on geometric aggregation
GTC
I 202
0 ou
tput
rank
Rs = 0.993
130 120 110 100 90 80 70 60 50 40 30 20 10 0
1301201101009080706050403020100
Rank based on EM imputation
GTC
I 202
0 ou
tput
rank
Rs = 0.996
Source: European Commission Joint Research Centre (2019).Note: Rs represents the Spearman rank correlation coefficient (n = 132).
GTCI 2020 Output sub-index
Figure 2Sensitivity analysis: Impact of modelling choices
130 120 110 100 90 80 70 60 50 40 30 20 10 0
1301201101009080706050403020100
Rank based on geometric aggregation
GTC
I 202
0 ra
nk
Rs = 0.997
130 120 110 100 90 80 70 60 50 40 30 20 10 0
1301201101009080706050403020100
Rank based on EM imputation
GTC
I 202
0 ra
nk
Rs = 0.997
Global Talent Competitiveness 2020
130 120 110 100 90 80 70 60 50 40 30 20 10 0
1301201101009080706050403020100
Rank based on geometric aggregation
GTC
I 202
0 in
put r
ank
Rs = 0.994
130 120 110 100 90 80 70 60 50 40 30 20 10 0
1301201101009080706050403020100
Rank based on EM imputation
GTC
I 202
0 in
put r
ank
Rs = 0.999
GTCI 2020 Input sub-index
JRC STATISTICAL AUDIT OF THE GLOBAL TALENT COMPETITIVENESS INDEX 2020
THE GLOBAL TALENT COMPETITIVENESS INDEX 2020 85
CHAPTER 6
six pillars (as measured by a very high Cronbach’s alpha value of 0.97, well above the recommended 0.70 threshold for a reliable aggregate).
Points that call for possible refinements of the GTCI frame-work were also identified. These refinements mainly concern two out of the 70 variables, namely 3.1.3 Tertiary education expenditure and 3.2.2 Prevalence of training in firms. Although conceptually enriching the GTCI framework—in most cases the statistical impact of these variables reaches the second aggrega-tion level (the GTCI pillars)—their impact on the GTCI ranking is low and can explain only a small (negligible) amount of variation in the GTCI scores. It is recommended that the GTCI develop-ment team delves into the formulation of these two indicators and carefully monitor how they behave in the coming releases of the index, eventually fine-tuning the GTCI framework in this respect. Although the GTCI index shows reliable robustness to the imputation of missing data, it is suggested that particular at-tention be paid to the data coverage of three variables (i.e., 1.3.8 Robot density, 3.1.4 Reading, maths, and science, and 6.2.3 New product entrepreneurial activity).
On the whole, the analysis of the correlations at the sub-pillar level reveals that the statistical structure of the GTCI is coherent with its conceptual framework, given that sub-pillars correlate strongly with their respective pillars. Furthermore, all pillars correlate strongly and fairly evenly with the GTCI itself, which indicates that the framework is well balanced.
The GTCI and both sub-index country ranks are relatively robust to methodological assumptions related to the estimation of missing data, weighting, and aggregation formula. It is reassur-ing that for a large majority of the countries included in the GTCI, the overall rank and those in the Input and Output sub-indices are the result of the underlying data and not of the modelling choices. Consequently, inferences can be drawn for most coun-tries in the GTCI, although some caution may be needed for a few countries.13 Note that perfect robustness would have been undesirable because this would have implied that the GTCI com-ponents are perfectly correlated and hence redundant, which is not the case for the GTCI 2020. In fact, one way in which the GTCI helps to highlight other components of human capital and tal-ent competitiveness is by pinpointing the differences in rankings that emerge from a comparison between the GTCI and each of the six pillars. In the analysis, the GTCI ranking differs from any of the six pillar rankings by 10 positions or more for at least 29% (up to almost 60%) of the countries. This outcome both evidences the added value of the GTCI ranking and points to the impor-tance of taking into account the individual pillars, sub-pillars, and variables on their own merit. By doing so, country-specific strengths and bottlenecks in human capital and talent competi-tiveness can be identified and serve as an input for evidence-based policymaking.
The auditing conducted herein has shown the potential of the Global Talent Competitiveness Index 2020, subject to some minor hints for future releases, for reliably identifying weaknesses and best practices and ultimately monitoring national perfor-mance in human capital and competitiveness issues around the
world. Readers and policy analysts should also go beyond the overall GTCI scores and ranks and duly consider the individual indicators and pillars on their own merit. By doing so, country-specific strengths and challenges in attracting, developing, and retaining talent can be identified and serve as an input for data-informed policy analysis. The Global Talent Competitiveness Index cannot possibly serve as the ultimate and definitive yard-stick of monitoring progress and performance on talent and competitiveness. Instead, the GTCI best represents an ongoing attempt by INSEAD to contribute to policy discussions on the very many challenges that national systems face in a world that is increasingly dependent on talent, continuously adapting the GTCI framework to reflect improved and new data sources and the theoretical advances on how to leverage talent as a tool for competitiveness.
ENDNOTES 1 The JRC analysis was based on the recommendations of the OECD & EC
JRC (2008) Handbook on Constructing Composite Indicators and on more recent research from the JRC. The JRC auditing studies of composite indicators are available at http://composite-indicators.jrc.ec.europa.eu/ (all audits were carried out upon request of the index developers).
2 OECD & EC JRC (2008).
3 Compared to last year, eight new countries were added in the GTCI 2020: Angola, Bolivia, Burkina Faso, Cabo Verde, Côte d'Ivoire, Eswatini, Jamaica, and North Macedonia, while Lebanon is not included this year.
4 Groeneveld & Meeden (1984) set the criteria for absolute skewness above 1 and kurtosis above 3.5. The skewness criterion was relaxed herein to account for the small sample (132 countries).
5 See Nunnally (1978).
6 See Becker et al. (2017) and Paruolo et al. (2013) for discussions on why the weights assigned to the variables do not necessarily coincide with the variables’ importance in an index.
7 3.2.2 Prevalence of training in firms is not found to be important at the Input sub-index.
8 Saisana et al. (2005), (2011); Saisana & Saltelli (2011); Saltelli et al. (2008); Vértesy (2016); Vértesy & Deiss (2016).
9 The Expectation-Maximization (EM) algorithm (Little & Rubin, 2002) is an iterative procedure that finds the maximum likelihood estimates of the parameter vector by repeating two steps: (1) The expectation E-step: Given a set of parameter estimates, such as a mean vector and covariance matrix for a multivariate normal distribution, the E-step calculates the conditional expectation of the complete-data log likelihood given the observed data and the parameter estimates. (2) The maximization M-step: Given a complete-data log likelihood, the M-step finds the parameter estimates to maximize the complete-data log likelihood from the E-step. The two steps are iterated until the iterations converge.
10 Munda (2008).
11 Saltelli & Funtowicz (2014).
12 As already mentioned in the uncertainty analysis, about 89% of the simulated median ranks for the GTCI and 97% for the Input sub-index are less than two positions away from the reported 2019 rank—this percentage drops only to 84% in the Output sub-index.
13 Caution is needed when drawing inference on the relative standing of the following countries vis-a-vis other countries because of the very wide range of the confidence intervals, of almost 30 positions or more: Gambia’s rank in the GTCI—with a rank confidence interval range of [80, 108], and in the Input and Output sub-indices with a confidence interval range of [63, 82] and [103, 126], respectively—and Mongolia’s rank in the Output sub-index [64, 85].
JRC STATISTICAL AUDIT OF THE GLOBAL TALENT COMPETITIVENESS INDEX 2020CHAPTER 6
86 THE GLOBAL TALENT COMPETITIVENESS INDEX 2020
REFERENCESBecker, W., Saisana, M., Paruolo, P., & Vandecasteele, I. (2017). Weights and
importance in composite indicators: Closing the gap. Ecological Indicators 80: 12–22.
Cornell University, INSEAD, & WIPO. (2019). The global innovation index 2019: Creating healthy lives – The future of medical innovation. Ithaca, Fontainebleau, and Geneva: Cornell University, INSEAD, & WIPO. Available at https://www.globalinnovationindex.org/
Groeneveld, R. A. & Meeden, G. (1984). Measuring skewness and kurtosis. Journal of the Royal Statistical Society, Series D (The Statistician), 33, 391–399.
Little, R. J. A. & Rubin, D. B. (2002). Statistical analysis with missing data (2nd ed.). New York: John Wiley & Sons.
Munda, G. (2008). Social multi-criteria evaluation for a sustainable economy. Berlin Heidelberg: Springer-Verlag.
Nunnally, J. (1978). Psychometric theory. New York: McGraw-Hill.
OECD & EC JRC (Organisation for Economic Co-operation and Development and European Commission Joint Research Centre). (2008). Handbook on constructing composite indicators: Methodology and user guide. Paris: OECD. Available at http://www.oecd.org/std/42495745.pdf
Paruolo, P., Saisana, M., & and Saltelli, A. (2013). Ratings and rankings: Voodoo or science? Journal of the Royal Statistical Society, A 176 (3), 609–34.
Saisana, M., D’Hombres, B., & Saltelli, A. (2011). Rickety numbers: Volatility of university rankings and policy implications. Research Policy, 40 (1): 165–177.
Saisana, M. & Saltelli, A. (2011). Rankings and ratings: Instructions for use. Hague Journal on the Rule of Law, 3 (2), 247–268.
Saisana, M., Saltelli, A., & Tarantola, S. (2005). Uncertainty and sensitivity analysis techniques as tools for the analysis and validation of composite indicators. Journal of the Royal Statistical Society: Series A (Statistics in Society), 168 (2), 307–323.
Saltelli, A. & Funtowicz, S. (2014). When all models are wrong. Issues in Science and Technology, Winter 2014, 79–85.
Saltelli, A., Ratto, M., Andres, T., Campolongo, F., Cariboni, J., Gatelli, D., Saisana, M., & Tarantola, S. (2008). Global sensitivity analysis: The primer. Chichester, England: John Wiley & Sons.
Vértesy, D. (2016, July). A Critical Assessment of Quality and Validity of Composite Indicators of Innovation. Paper presented at the OECD Blue Sky III Forum on Science and Innovation Indicators. Ghent, 19–21 September 2016.
Vertesy, D. & Deiss, R. 2016. The Innovation Output Indicator 2016. Methodology Update. EUR 27880. European Commission, Joint Research Centre.
World Bank. (2018). The human capital project. Washington, DC: World Bank.
World Economic Forum. (2018). The global competitiveness report 2018. Geneva: World Economic Forum.
JRC STATISTICAL AUDIT OF THE GLOBAL TALENT COMPETITIVENESS INDEX 2020
THE GLOBAL TALENT COMPETITIVENESS INDEX 2020 87
CHAPTER 6


Special Section Cities and Regions

challenges of AI disruption, they generally agree that Asian cities, including a large number of Chinese cities, are ahead of the pack.2
AI IS REINFORCING THE ROLE OF CITIES AS TALENT HUBSIn this frontier area, cities have become a gigantic set of testbeds for AI-based solutions. Sometimes against the background of insufficient or limited regulatory guidelines, face-recognition video-surveillance equipment has been deployed and data have been collected about the consumption patterns, moves, and sometimes moods of citizens. Opinions and acceptance levels of this degree of surveillance have differed widely among cities in different continents and contexts. The growing appeal of ‘smart cities’ will continue to feed that trend.3
As cities continue to develop their own strategies to be-come talent hubs, they will leverage AI as a tool to increase their competitive advantages on both the supply and the demand sides identified in Chapter 1 of this report. On the demand side, they will strive to grow, attract, and retain key AI-related
In 2020, the role of cities continues to grow in importance on multiple different fronts. As some large nation-states continue to withdraw from international disciplines (multilateralism) and agreements (such as the Paris Agreement on climate change), cities take on additional responsibilities by weaving new ties across borders and adopting innovative solutions to address some of the dominant issues of the day: environmental sustain-ability and inequalities, but also health and education, to name a few. Hence it is no surprise to see cities among the early adopters of Artificial Intelligence (AI)–based solutions.
Combined with the trends detected and assessed in previ-ous editions of the Global Talent Competitiveness Index (GTCI), the emergence of AI in city strategies points to an acceleration of the significance of the role of cities on the front of global talent competitiveness. As underlined by international AI figure Cédric Villani, the city of Tianjin announced investments of US$15 bil-lion in AI—six times the total amount devoted by France’s public investment authorities to the same issue.1 Although recent stud-ies have shown that no major city is fully prepared to face the
CHAPTER 7
Cities’ Talent Competitiveness in 2020: How AI Is Making a Difference at the Local LevelBruno Lanvin and Michael BrattINSEAD
CITIES AND REGIONS
THE GLOBAL TALENT COMPETITIVENESS INDEX 2020 91

talents—those who can conceptualise and program the under-lying algorithms and develop the related AI applications and services. On the supply side, they will associate AI with their branding strategies and use available AI tools to target and at-tract internationally mobile talents for all sectors relevant to their development and strategies (see Box 1).
At the city level, too, the geo-strategic mapping of AI iden-tified in Chapter 1 prevails: Northern American cities are ahead in various areas, including governance and maturity vis-à-vis the adoption of AI-based solutions; Chinese cities clearly lead in terms of the adoption and deployment of such solutions. However, in all parts of the world cities of all sizes and types are adopting original approaches.4 The example of Bilbao is remark-able in that context, as it incarnates some of the ways in which a medium-sized city (Bilbao has fewer than 350,000 inhabitants) can develop a successful AI-based talent strategy through agility, imagination, and political will. This approach is further described in the chapter by Ivan Jiménez Aira and Leire Lagunilla Ramos (see Chapter 8 below).
Large companies are accompanying and reinforcing such city strategies. As AI becomes an increasing part of their strategies
and priorities, businesses of all sizes (from start-ups to large mul-tinationals) become more sensitive to the comparative talent advantages of cities, as well as to their AI positioning (which is evident in smart cities). The establishment of Google’s research centre in Zurich, for instance, can be seen as an example of this synergy. So is the choice made by Porsche to establish its Digital Lab in Berlin,5 illustrated by an interview with Anja Hendel, its director (see the GTCI Special Interview at the end of this section).
WHAT DO THE DATA TELL US?This year’s version of the GCTCI model is in many ways a continu-ation of the structure and methodology used in previous years. At the same time, there are several important new features to the GCTCI 2020, as efforts have been made to improve its archi-tecture, the variables/data used, and the city coverage. Some of these improvements are in no small part the result of feedback provided by the European Commission Joint Research Centre on the GCTCI 2019. The most significant changes include:
• A greater number of cities covered: 155 cities, up from 114 cities last year
BOX 1: HOW CITIES COMPETE FOR AI TALENT: THE EXAMPLES OF MONTREAL AND SINGAPORE
Even if Silicon Valley remains the place most people will think of when Artificial Intelligence (AI) is mentioned, a number of cities and regions around the world have adopted strategies to compete in this strategic sector. Not all of them enjoy the concentration of high-level universities, start-ups, and infor-mation technology (IT) giants that is typical of the West Coast of the United States. Hence, they have adopted aggressive and imaginative talent initiatives as core elements of their AI strategies. Montreal and Singapore are remarkable examples on that front, although their approaches differ in several im-portant ways.
• Montreal has adopted a strategy to become an AI hub by devoting significant efforts to attract national and for-eign investment: Since 2016, several high-tech giants—in-cluding Facebook, Google, Microsoft, DeepMind, Stradigi AI, and Element AI—have set up AI labs in the city. City officials explain this success by pointing not only to the excellent collaborative environment between researchers and companies, as well as to the presence of a large (and growing) community of AI researchers with competitive financial expectations, but also to the quality of life of-fered by the city. Most recently, Montreal’s Yoshua Bengio won the Turing Award, along with Canadians Geoffrey Hinton and Yann LeCun, for their work on artificial neural networks. Other Canadian cities (e.g., Toronto and Ottawa) are following similar paths.
• Singapore has identified three priority pillars for becom-ing an AI hub: AI research, AI technology, and AI innova-tion. These pillars form the core of AI Singapore (https://www.aisingapore.org), a government entity whose mis-sion is ‘to anchor deep national capabilities in Artificial Intelligence, thereby creating social and economic impacts, grow local talent, build an AI ecosystem and put Singapore on the world map’. To achieve this, AI Singapore has developed a specific website for that purpose. Subtitled ‘Growing our own timber’, the AI Singapore Talent Portal (reserved for Singapore-based companies) aims to connect potential employers looking for AI talent to apprentices from the AI Apprenticeship Programme (AIAP, https://www.ai singa-pore.org/industryinnovation/aiap/). Employers may post their AI-related job opportunities on this portal where interested apprentice(s) can apply directly. The AIAP aims to groom local AI talent by enhancing their technical ca-reers as well as their skills. Over a nine-month intensive pe-riod (two months of AI coursework in areas such as Deep Learning and Machine Learning applications, followed by seven months of on-the-job training in a real-world AI problem), the apprentices gain exposure to and work on real-world industry projects from scoping problem statements to deploying models. After this they return to industry. During their nine months of apprenticeship, suc-cessful candidates receive a monthly stipend of between 3,500 and 5,500 Singapore dollars (about US$2,500 to US$4,000) from the government of Singapore.
CITIES AND REGIONSSPECIAL SECTION
92 THE GLOBAL TALENT COMPETITIVENESS INDEX 2020
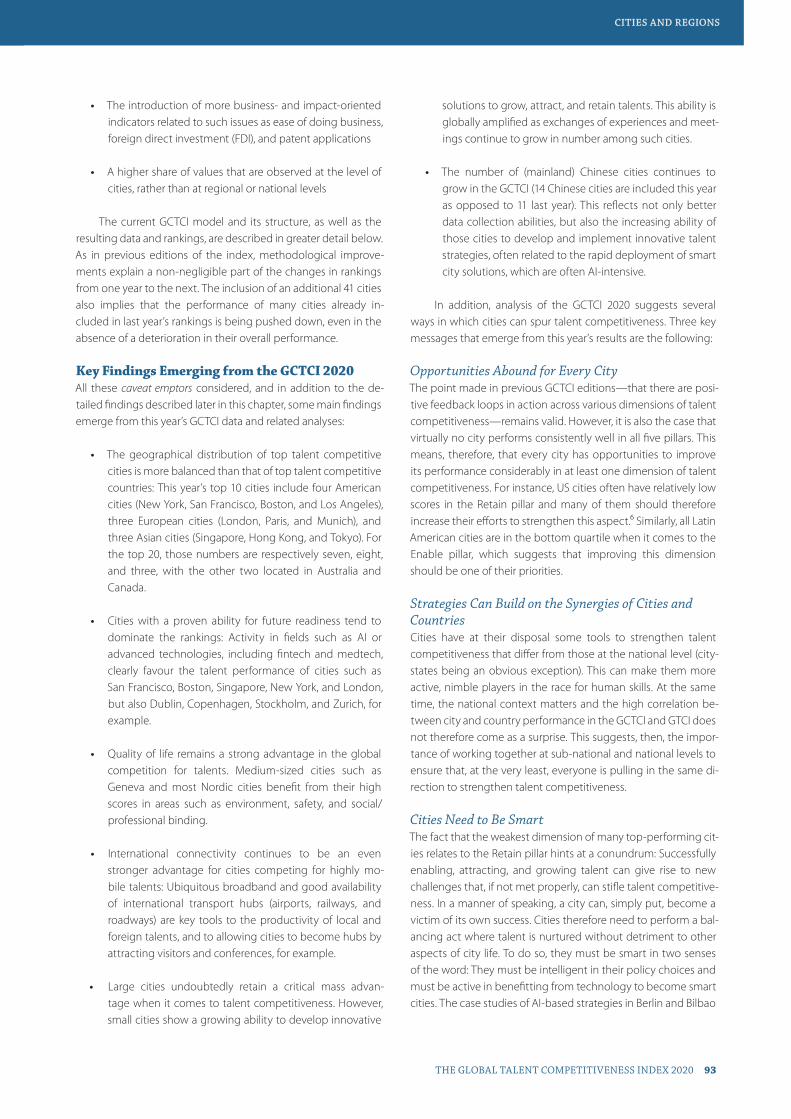
• The introduction of more business- and impact-oriented indicators related to such issues as ease of doing business, foreign direct investment (FDI), and patent applications
• A higher share of values that are observed at the level of cities, rather than at regional or national levels
The current GCTCI model and its structure, as well as the resulting data and rankings, are described in greater detail below. As in previous editions of the index, methodological improve-ments explain a non-negligible part of the changes in rankings from one year to the next. The inclusion of an additional 41 cities also implies that the performance of many cities already in-cluded in last year’s rankings is being pushed down, even in the absence of a deterioration in their overall performance.
Key Findings Emerging from the GCTCI 2020All these caveat emptors considered, and in addition to the de-tailed findings described later in this chapter, some main findings emerge from this year’s GCTCI data and related analyses:
• The geographical distribution of top talent competitive cities is more balanced than that of top talent competitive countries: This year’s top 10 cities include four American cities (New York, San Francisco, Boston, and Los Angeles), three European cities (London, Paris, and Munich), and three Asian cities (Singapore, Hong Kong, and Tokyo). For the top 20, those numbers are respectively seven, eight, and three, with the other two located in Australia and Canada.
• Cities with a proven ability for future readiness tend to dominate the rankings: Activity in fields such as AI or advanced technologies, including fintech and medtech, clearly favour the talent performance of cities such as San Francisco, Boston, Singapore, New York, and London, but also Dublin, Copenhagen, Stockholm, and Zurich, for example.
• Quality of life remains a strong advantage in the global competition for talents. Medium-sized cities such as Geneva and most Nordic cities benefit from their high scores in areas such as environment, safety, and social/professional binding.
• International connectivity continues to be an even stronger advantage for cities competing for highly mo-bile talents: Ubiquitous broadband and good availability of international transport hubs (airports, railways, and roadways) are key tools to the productivity of local and foreign talents, and to allowing cities to become hubs by attracting visitors and conferences, for example.
• Large cities undoubtedly retain a critical mass advan-tage when it comes to talent competitiveness. However, small cities show a growing ability to develop innovative
solutions to grow, attract, and retain talents. This ability is globally amplified as exchanges of experiences and meet-ings continue to grow in number among such cities.
• The number of (mainland) Chinese cities continues to grow in the GCTCI (14 Chinese cities are included this year as opposed to 11 last year). This reflects not only better data collection abilities, but also the increasing ability of those cities to develop and implement innovative talent strategies, often related to the rapid deployment of smart city solutions, which are often AI-intensive.
In addition, analysis of the GCTCI 2020 suggests several ways in which cities can spur talent competitiveness. Three key messages that emerge from this year’s results are the following:
Opportunities Abound for Every CityThe point made in previous GCTCI editions—that there are posi-tive feedback loops in action across various dimensions of talent competitiveness—remains valid. However, it is also the case that virtually no city performs consistently well in all five pillars. This means, therefore, that every city has opportunities to improve its performance considerably in at least one dimension of talent competitiveness. For instance, US cities often have relatively low scores in the Retain pillar and many of them should therefore increase their efforts to strengthen this aspect.6 Similarly, all Latin American cities are in the bottom quartile when it comes to the Enable pillar, which suggests that improving this dimension should be one of their priorities.
Strategies Can Build on the Synergies of Cities and CountriesCities have at their disposal some tools to strengthen talent competitiveness that differ from those at the national level (city-states being an obvious exception). This can make them more active, nimble players in the race for human skills. At the same time, the national context matters and the high correlation be-tween city and country performance in the GCTCI and GTCI does not therefore come as a surprise. This suggests, then, the impor-tance of working together at sub-national and national levels to ensure that, at the very least, everyone is pulling in the same di-rection to strengthen talent competitiveness.
Cities Need to Be SmartThe fact that the weakest dimension of many top-performing cit-ies relates to the Retain pillar hints at a conundrum: Successfully enabling, attracting, and growing talent can give rise to new challenges that, if not met properly, can stifle talent competitive-ness. In a manner of speaking, a city can, simply put, become a victim of its own success. Cities therefore need to perform a bal-ancing act where talent is nurtured without detriment to other aspects of city life. To do so, they must be smart in two senses of the word: They must be intelligent in their policy choices and must be active in benefitting from technology to become smart cities. The case studies of AI-based strategies in Berlin and Bilbao
CITIES AND REGIONS
THE GLOBAL TALENT COMPETITIVENESS INDEX 2020 93
SPECIAL SECTION

that are discussed in the remainder of this Special Section pro-vide two poignant examples on how this can be achieved.
Architecture of the GCTCI ModelThe five pillars of last year’s GCTCI model have been largely re-tained this year. The first four pillars are completely unchanged and continue to follow the same logic as the input-related pillars of the GTCI model by analysing how cities (1) Enable, (2) Attract, (3) Grow, and (4) Retain talent. The one slight modification to the model concerns the fifth pillar. The last couple of editions have referred to this pillar as Be Global, with the rationale that it should give a sense of the flows of talent to and from cities. The pillar has been renamed Global Knowledge Skills this year in order to emphasise a focus on talent impact as well as the degree of inter-nationalisation of cities. In addition, this change in terminology is in keeping with the GTCI model.
The GCTCI model contains 16 indicators in total, with each pillar including at least three variables (the Retain pillar has four). Nine of these variables are the same as before or refer to the same concept. One of the seven new variables relates to patent appli-cations and has been placed in the renamed Global Knowledge Skills pillar, as a measure of talent impact. Two indicators con-cerned with FDI have been introduced: the number of FDI pro-jects in Attract and the number of jobs created by FDI in Grow, where the former captures a dimension of external openness and the latter is a reflection of multinational companies’ (MNCs) contribution to building skills. One of the other changes to the GCTCI model is that, in contrast to previous years, indicators
that relate to quality of life and environment have been moved from Attract to Retain. The indicator Presence of Forbes Global 2000 HQs has switched from Enable to Attract, while the GDP per capita variable has been moved in the opposite direction. Figure 1 presents the architecture of the GCTCI 2020 model and the indicators populating it.
Data sources for populating the GCTCI 2020 include the following:7
• Eurostat has been frequently used for European Union (EU) countries.
• The American Community Survey has been frequently sourced for the United States.
• Publicly available global rankings and data sets have been used for all cities for certain variables or to obtain specific values (e.g., UN-Habitat, Forbes Global 2000, fDi Markets, and the TomTom Traffic Index).
• Local sources, including government agency websites, re-ports, and related press releases, have been consulted to obtain and/or verify specific values.
Usually, missing values have been denoted ‘n/a’. For three indicators, it has been deemed that proxied estimates were the better option. In the case of indicator 1.3 Ease of doing busi-ness, which itself is based on the largest cities, the values have
Figure 1GCTCI 2020 model and indicators
Global Cities Talent Competitiveness Index (GCTCI) 2020
1.1 GDP per capita
1.2 Internet speed
2.1 Presence of Forbes Global
2000 companies (HQ presence)
2.2 Foreign-born population
2.3 FDI projects
3.1 Major universities
3.2 Tertiary enrolment
3.3 FDI jobs created
5.1 Population with tertiary education
5.2 Patent applications
5.3 Airport connectivity
4.1 Safety
4.2 Environmental quality
4.3 Traffic travel times
4.4 Affordability
1.3 Ease of doing business
5. Global Knowledge Skills1. Enable 2. Attract 3. Grow 4. Retain
CITIES AND REGIONSSPECIAL SECTION
94 THE GLOBAL TALENT COMPETITIVENESS INDEX 2020
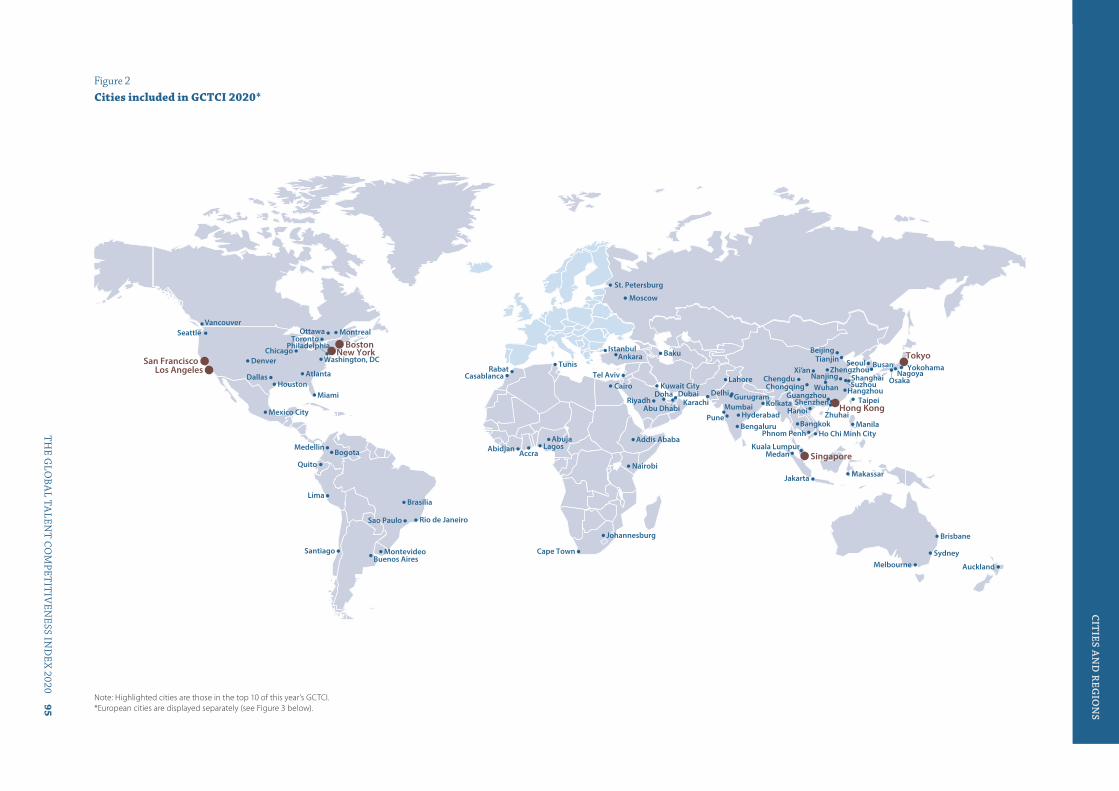
Figure 2Cities included in GCTCI 2020 *
Note: Highlighted cities are those in the top 10 of this year’s GCTCI.*European cities are displayed separately (see Figure 3 below).
Los Angeles
Sydney
Brasilia
Tunis
Istanbul
Ottawa
Bogota
Chicago
Delhi
Seoul
Kuala Lumpur
Hanoi
Bangkok
Hangzhou
Tianjin
Cairo Kuwait City Doha Dubai
New York Boston
Washington, DC
Santiago
Lima
Quito
Mexico City
Rio de JaneiroSao Paulo
Buenos Aires Montevideo
Mumbai
Singapore
Auckland
Nairobi
Casablanca Shanghai
Melbourne
HoustonDallas
Seattle
Tel Aviv
TorontoMontreal
Cape Town
AtlantaChengdu
Jakarta
Manila
Taipei
Chongqing Wuhan
Xi’an Zhengzhou
Miami
Hong KongGuangzhou
Shenzhen
BeijingTokyo
NagoyaOsaka
Bengaluru
Johannesburg
Abu Dhabi
St. Petersburg
Moscow
San Francisco
AbidjanAbuja
Accra
Addis Ababa
Ankara Baku
Brisbane
BusanDenver
Gurugram
Hyderabad
Karachi KolkataZhuhai
Yokohama
Suzhou
Ho Chi Minh City
Nanjing
Phnom Penh
Lagos
Pune
Lahore
Vancouver
Riyadh
Makassar
MedanMedellin
Philadelphia
Rabat
CIT
IES AN
D R
EGIO
NS
TH
E GLO
BA
L TALEN
T CO
MPET
ITIV
ENESS IN
DE
X 2020 95
SPECIA
L SECT
ION
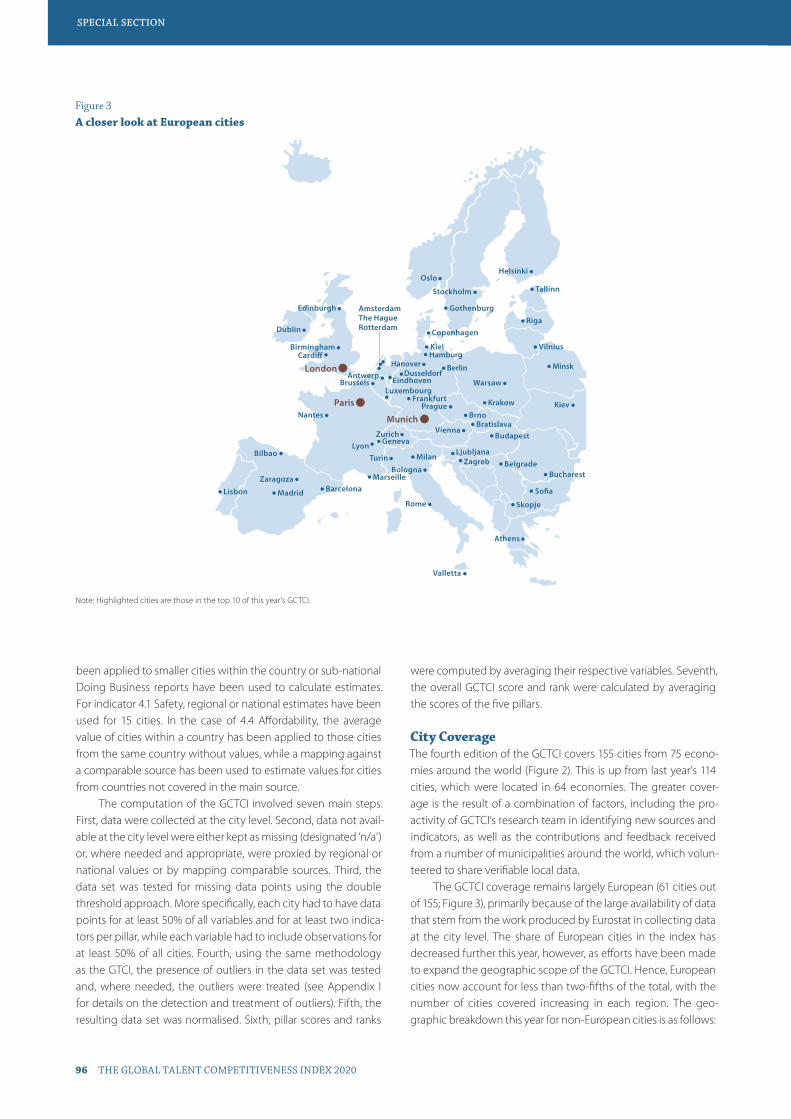
Note: Highlighted cities are those in the top 10 of this year’s GCTCI.
Figure 3A closer look at European cities
Madrid Barcelona Zaragoza
Bilbao
Lisbon
Nantes
London Cardi�
Birmingham
Athens
AmsterdamThe HagueRotterdam
Kiel
Eindhoven
Brno
Luxembourg
Prague
BratislavaVienna
Belgrade
Budapest
LjubljanaZagreb
Bucharest
So�a
Gothenburg
Milan
Rome
Turin Bologna
Valletta
Riga
Vilnius
Warsaw
Geneva
Tallinn
Berlin Hanover
Krakow Frankfurt
Munich
Stockholm
Paris
Brussels
Dublin Copenhagen
Zurich
OsloHelsinki
Antwerp Dusseldorf
Edinburgh
Hamburg
Kiev
Minsk
Skopje
Lyon
Marseille
been applied to smaller cities within the country or sub-national Doing Business reports have been used to calculate estimates. For indicator 4.1 Safety, regional or national estimates have been used for 15 cities. In the case of 4.4 Affordability, the average value of cities within a country has been applied to those cities from the same country without values, while a mapping against a comparable source has been used to estimate values for cities from countries not covered in the main source.
The computation of the GCTCI involved seven main steps. First, data were collected at the city level. Second, data not avail-able at the city level were either kept as missing (designated ‘n/a’) or, where needed and appropriate, were proxied by regional or national values or by mapping comparable sources. Third, the data set was tested for missing data points using the double threshold approach. More specifically, each city had to have data points for at least 50% of all variables and for at least two indica-tors per pillar, while each variable had to include observations for at least 50% of all cities. Fourth, using the same methodology as the GTCI, the presence of outliers in the data set was tested and, where needed, the outliers were treated (see Appendix I for details on the detection and treatment of outliers). Fifth, the resulting data set was normalised. Sixth, pillar scores and ranks
were computed by averaging their respective variables. Seventh, the overall GCTCI score and rank were calculated by averaging the scores of the five pillars.
City CoverageThe fourth edition of the GCTCI covers 155 cities from 75 econo-mies around the world (Figure 2). This is up from last year’s 114 cities, which were located in 64 economies. The greater cover-age is the result of a combination of factors, including the pro-activity of GCTCI’s research team in identifying new sources and indicators, as well as the contributions and feedback received from a number of municipalities around the world, which volun-teered to share verifiable local data.
The GCTCI coverage remains largely European (61 cities out of 155; Figure 3), primarily because of the large availability of data that stem from the work produced by Eurostat in collecting data at the city level. The share of European cities in the index has decreased further this year, however, as efforts have been made to expand the geographic scope of the GCTCI. Hence, European cities now account for less than two-fifths of the total, with the number of cities covered increasing in each region. The geo-graphic breakdown this year for non-European cities is as follows:
CITIES AND REGIONSSPECIAL SECTION
96 THE GLOBAL TALENT COMPETITIVENESS INDEX 2020
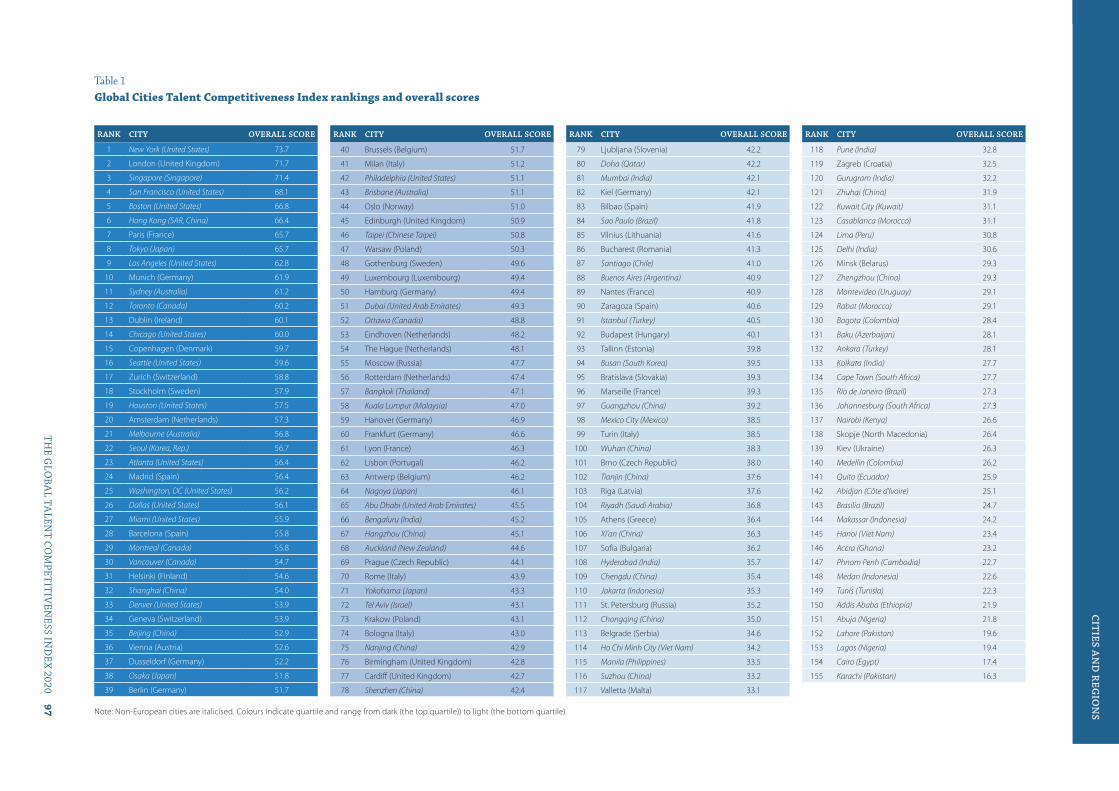
Table 1Global Cities Talent Competitiveness Index rankings and overall scores
RANK CITY OVERALL SCORE
1 New York (United States) 73.7
2 London (United Kingdom) 71.7
3 Singapore (Singapore) 71.4
4 San Francisco (United States) 68.1
5 Boston (United States) 66.8
6 Hong Kong (SAR, China) 66.4
7 Paris (France) 65.7
8 Tokyo (Japan) 65.7
9 Los Angeles (United States) 62.8
10 Munich (Germany) 61.9
11 Sydney (Australia) 61.2
12 Toronto (Canada) 60.2
13 Dublin (Ireland) 60.1
14 Chicago (United States) 60.0
15 Copenhagen (Denmark) 59.7
16 Seattle (United States) 59.6
17 Zurich (Switzerland) 58.8
18 Stockholm (Sweden) 57.9
19 Houston (United States) 57.5
20 Amsterdam (Netherlands) 57.3
21 Melbourne (Australia) 56.8
22 Seoul (Korea, Rep.) 56.7
23 Atlanta (United States) 56.4
24 Madrid (Spain) 56.4
25 Washington, DC (United States) 56.2
26 Dallas (United States) 56.1
27 Miami (United States) 55.9
28 Barcelona (Spain) 55.8
29 Montreal (Canada) 55.8
30 Vancouver (Canada) 54.7
31 Helsinki (Finland) 54.6
32 Shanghai (China) 54.0
33 Denver (United States) 53.9
34 Geneva (Switzerland) 53.9
35 Beijing (China) 52.9
36 Vienna (Austria) 52.6
37 Dusseldorf (Germany) 52.2
38 Osaka (Japan) 51.8
39 Berlin (Germany) 51.7
RANK CITY OVERALL SCORE
40 Brussels (Belgium) 51.7
41 Milan (Italy) 51.2
42 Philadelphia (United States) 51.1
43 Brisbane (Australia) 51.1
44 Oslo (Norway) 51.0
45 Edinburgh (United Kingdom) 50.9
46 Taipei (Chinese Taipei) 50.8
47 Warsaw (Poland) 50.3
48 Gothenburg (Sweden) 49.6
49 Luxembourg (Luxembourg) 49.4
50 Hamburg (Germany) 49.4
51 Dubai (United Arab Emirates) 49.3
52 Ottawa (Canada) 48.8
53 Eindhoven (Netherlands) 48.2
54 The Hague (Netherlands) 48.1
55 Moscow (Russia) 47.7
56 Rotterdam (Netherlands) 47.4
57 Bangkok (Thailand) 47.1
58 Kuala Lumpur (Malaysia) 47.0
59 Hanover (Germany) 46.9
60 Frankfurt (Germany) 46.6
61 Lyon (France) 46.3
62 Lisbon (Portugal) 46.2
63 Antwerp (Belgium) 46.2
64 Nagoya (Japan) 46.1
65 Abu Dhabi (United Arab Emirates) 45.5
66 Bengaluru (India) 45.2
67 Hangzhou (China) 45.1
68 Auckland (New Zealand) 44.6
69 Prague (Czech Republic) 44.1
70 Rome (Italy) 43.9
71 Yokohama (Japan) 43.3
72 Tel Aviv (Israel) 43.1
73 Krakow (Poland) 43.1
74 Bologna (Italy) 43.0
75 Nanjing (China) 42.9
76 Birmingham (United Kingdom) 42.8
77 Cardiff (United Kingdom) 42.7
78 Shenzhen (China) 42.4
RANK CITY OVERALL SCORE
79 Ljubljana (Slovenia) 42.2
80 Doha (Qatar) 42.2
81 Mumbai (India) 42.1
82 Kiel (Germany) 42.1
83 Bilbao (Spain) 41.9
84 Sao Paulo (Brazil) 41.8
85 Vilnius (Lithuania) 41.6
86 Bucharest (Romania) 41.3
87 Santiago (Chile) 41.0
88 Buenos Aires (Argentina) 40.9
89 Nantes (France) 40.9
90 Zaragoza (Spain) 40.6
91 Istanbul (Turkey) 40.5
92 Budapest (Hungary) 40.1
93 Tallinn (Estonia) 39.8
94 Busan (South Korea) 39.5
95 Bratislava (Slovakia) 39.3
96 Marseille (France) 39.3
97 Guangzhou (China) 39.2
98 Mexico City (Mexico) 38.5
99 Turin (Italy) 38.5
100 Wuhan (China) 38.3
101 Brno (Czech Republic) 38.0
102 Tianjin (China) 37.6
103 Riga (Latvia) 37.6
104 Riyadh (Saudi Arabia) 36.8
105 Athens (Greece) 36.4
106 Xi'an (China) 36.3
107 Sofia (Bulgaria) 36.2
108 Hyderabad (India) 35.7
109 Chengdu (China) 35.4
110 Jakarta (Indonesia) 35.3
111 St. Petersburg (Russia) 35.2
112 Chongqing (China) 35.0
113 Belgrade (Serbia) 34.6
114 Ho Chi Minh City (Viet Nam) 34.2
115 Manila (Philippines) 33.5
116 Suzhou (China) 33.2
117 Valletta (Malta) 33.1
RANK CITY OVERALL SCORE
118 Pune (India) 32.8
119 Zagreb (Croatia) 32.5
120 Gurugram (India) 32.2
121 Zhuhai (China) 31.9
122 Kuwait City (Kuwait) 31.1
123 Casablanca (Morocco) 31.1
124 Lima (Peru) 30.8
125 Delhi (India) 30.6
126 Minsk (Belarus) 29.3
127 Zhengzhou (China) 29.3
128 Montevideo (Uruguay) 29.1
129 Rabat (Morocco) 29.1
130 Bogota (Colombia) 28.4
131 Baku (Azerbaijan) 28.1
132 Ankara (Turkey) 28.1
133 Kolkata (India) 27.7
134 Cape Town (South Africa) 27.7
135 Rio de Janeiro (Brazil) 27.3
136 Johannesburg (South Africa) 27.3
137 Nairobi (Kenya) 26.6
138 Skopje (North Macedonia) 26.4
139 Kiev (Ukraine) 26.3
140 Medellin (Colombia) 26.2
141 Quito (Ecuador) 25.9
142 Abidjan (Côte d'Ivoire) 25.1
143 Brasilia (Brazil) 24.7
144 Makassar (Indonesia) 24.2
145 Hanoi (Viet Nam) 23.4
146 Accra (Ghana) 23.2
147 Phnom Penh (Cambodia) 22.7
148 Medan (Indonesia) 22.6
149 Tunis (Tunisia) 22.3
150 Addis Ababa (Ethiopia) 21.9
151 Abuja (Nigeria) 21.8
152 Lahore (Pakistan) 19.6
153 Lagos (Nigeria) 19.4
154 Cairo (Egypt) 17.4
155 Karachi (Pakistan) 16.3
Note: Non-European cities are italicised. Colours indicate quartile and range from dark (the top quartile)) to light (the bottom quartile).
CIT
IES AN
D R
EGIO
NS
TH
E GLO
BA
L TALEN
T CO
MPET
ITIV
ENESS IN
DE
X 2020 97
SPECIA
L SECT
ION
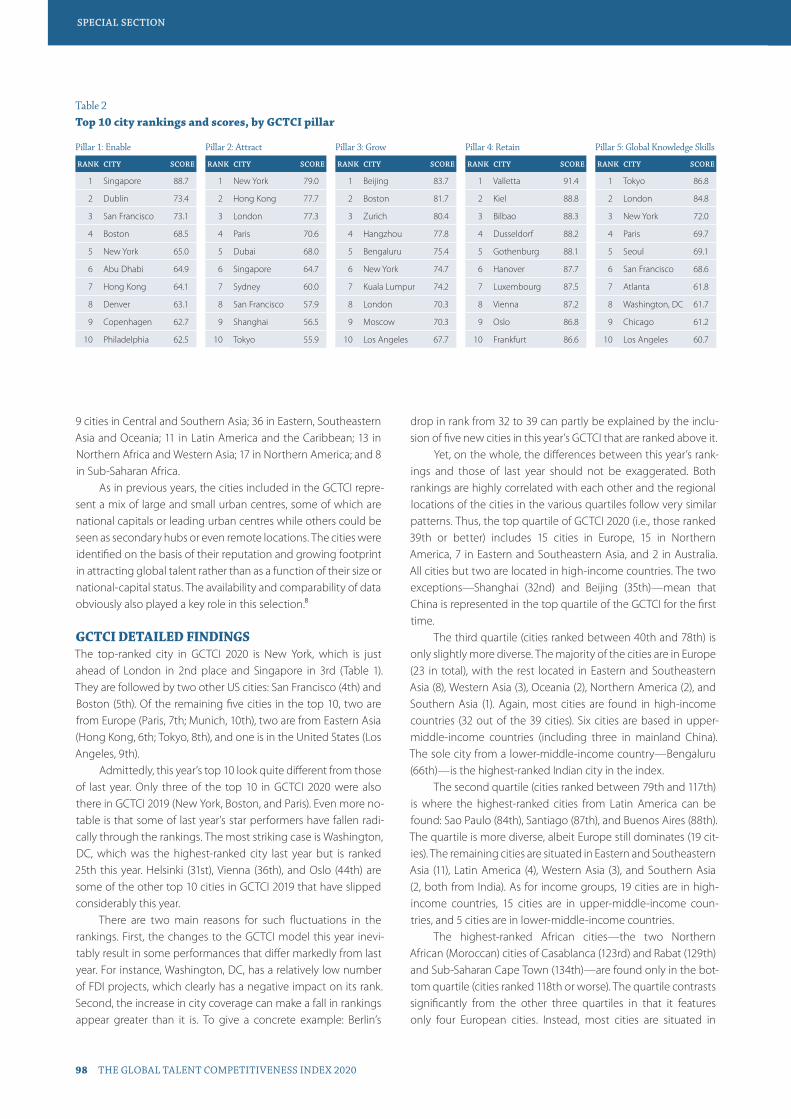
9 cities in Central and Southern Asia; 36 in Eastern, Southeastern Asia and Oceania; 11 in Latin America and the Caribbean; 13 in Northern Africa and Western Asia; 17 in Northern America; and 8 in Sub-Saharan Africa.
As in previous years, the cities included in the GCTCI repre-sent a mix of large and small urban centres, some of which are national capitals or leading urban centres while others could be seen as secondary hubs or even remote locations. The cities were identified on the basis of their reputation and growing footprint in attracting global talent rather than as a function of their size or national-capital status. The availability and comparability of data obviously also played a key role in this selection.8
GCTCI DETAILED FINDINGSThe top-ranked city in GCTCI 2020 is New York, which is just ahead of London in 2nd place and Singapore in 3rd (Table 1). They are followed by two other US cities: San Francisco (4th) and Boston (5th). Of the remaining five cities in the top 10, two are from Europe (Paris, 7th; Munich, 10th), two are from Eastern Asia (Hong Kong, 6th; Tokyo, 8th), and one is in the United States (Los Angeles, 9th).
Admittedly, this year’s top 10 look quite different from those of last year. Only three of the top 10 in GCTCI 2020 were also there in GCTCI 2019 (New York, Boston, and Paris). Even more no-table is that some of last year’s star performers have fallen radi-cally through the rankings. The most striking case is Washington, DC, which was the highest-ranked city last year but is ranked 25th this year. Helsinki (31st), Vienna (36th), and Oslo (44th) are some of the other top 10 cities in GCTCI 2019 that have slipped considerably this year.
There are two main reasons for such fluctuations in the rankings. First, the changes to the GCTCI model this year inevi-tably result in some performances that differ markedly from last year. For instance, Washington, DC, has a relatively low number of FDI projects, which clearly has a negative impact on its rank. Second, the increase in city coverage can make a fall in rankings appear greater than it is. To give a concrete example: Berlin’s
drop in rank from 32 to 39 can partly be explained by the inclu-sion of five new cities in this year’s GCTCI that are ranked above it.
Yet, on the whole, the differences between this year’s rank-ings and those of last year should not be exaggerated. Both rankings are highly correlated with each other and the regional locations of the cities in the various quartiles follow very similar patterns. Thus, the top quartile of GCTCI 2020 (i.e., those ranked 39th or better) includes 15 cities in Europe, 15 in Northern America, 7 in Eastern and Southeastern Asia, and 2 in Australia. All cities but two are located in high-income countries. The two exceptions—Shanghai (32nd) and Beijing (35th)—mean that China is represented in the top quartile of the GCTCI for the first time.
The third quartile (cities ranked between 40th and 78th) is only slightly more diverse. The majority of the cities are in Europe (23 in total), with the rest located in Eastern and Southeastern Asia (8), Western Asia (3), Oceania (2), Northern America (2), and Southern Asia (1). Again, most cities are found in high-income countries (32 out of the 39 cities). Six cities are based in upper-middle-income countries (including three in mainland China). The sole city from a lower-middle-income country—Bengaluru (66th)—is the highest-ranked Indian city in the index.
The second quartile (cities ranked between 79th and 117th) is where the highest-ranked cities from Latin America can be found: Sao Paulo (84th), Santiago (87th), and Buenos Aires (88th). The quartile is more diverse, albeit Europe still dominates (19 cit-ies). The remaining cities are situated in Eastern and Southeastern Asia (11), Latin America (4), Western Asia (3), and Southern Asia (2, both from India). As for income groups, 19 cities are in high-income countries, 15 cities are in upper-middle-income coun-tries, and 5 cities are in lower-middle-income countries.
The highest-ranked African cities—the two Northern African (Moroccan) cities of Casablanca (123rd) and Rabat (129th) and Sub-Saharan Cape Town (134th)—are found only in the bot-tom quartile (cities ranked 118th or worse). The quartile contrasts significantly from the other three quartiles in that it features only four European cities. Instead, most cities are situated in
Pillar 1: Enable
RANK CITY SCORE
1 Singapore 88.7
2 Dublin 73.4
3 San Francisco 73.1
4 Boston 68.5
5 New York 65.0
6 Abu Dhabi 64.9
7 Hong Kong 64.1
8 Denver 63.1
9 Copenhagen 62.7
10 Philadelphia 62.5
Pillar 2: Attract
RANK CITY SCORE
1 New York 79.0
2 Hong Kong 77.7
3 London 77.3
4 Paris 70.6
5 Dubai 68.0
6 Singapore 64.7
7 Sydney 60.0
8 San Francisco 57.9
9 Shanghai 56.5
10 Tokyo 55.9
Pillar 3: Grow
RANK CITY SCORE
1 Beijing 83.7
2 Boston 81.7
3 Zurich 80.4
4 Hangzhou 77.8
5 Bengaluru 75.4
6 New York 74.7
7 Kuala Lumpur 74.2
8 London 70.3
9 Moscow 70.3
10 Los Angeles 67.7
Pillar 4: Retain
RANK CITY SCORE
1 Valletta 91.4
2 Kiel 88.8
3 Bilbao 88.3
4 Dusseldorf 88.2
5 Gothenburg 88.1
6 Hanover 87.7
7 Luxembourg 87.5
8 Vienna 87.2
9 Oslo 86.8
10 Frankfurt 86.6
Pillar 5: Global Knowledge Skills
RANK CITY SCORE
1 Tokyo 86.8
2 London 84.8
3 New York 72.0
4 Paris 69.7
5 Seoul 69.1
6 San Francisco 68.6
7 Atlanta 61.8
8 Washington, DC 61.7
9 Chicago 61.2
10 Los Angeles 60.7
Table 2Top 10 city rankings and scores, by GCTCI pillar
CITIES AND REGIONSSPECIAL SECTION
98 THE GLOBAL TALENT COMPETITIVENESS INDEX 2020

Sub-Saharan Africa (8), with the rest in Latin America (7), Eastern and Southeastern Asia (6th), Southern Asia (6), Northern Africa (4), and Western Asia (3). Most cities are found in lower-middle-income countries (20) and upper-middle-income countries (14). In addition, there are three cities in high-income countries and one in a low-income country (Addis Ababa, 150th).
One of the key messages discussed in last year’s report was that there are complementarities across the pillars whereby dif-ferent dimensions of talent competitiveness mutually reinforce one another. This is still the case, as can be seen by observing how frequently top-performing cities feature in the top 10 in each pillar (Table 2). For instance, New York makes it into the top 10 in four of the five pillars and London and San Francisco are ranked in the top 10 in three of them. By the same token, seven of the top 10 cities in the overall GCTCI rankings are in the top 10 in the Attract pillar, while there are several of them also in the Global Knowledge Skills (6), Enable (5), and Grow (4) pillars. Retain is the one pillar that stands out in this regard, as it does not in-clude a single city that is also in the top 10 overall.
It will not have escaped the reader that the top-performing cities in the GCTCI are located in countries that have high ranks in the GTCI. That there are no fewer than four US cities in the top 10 of the city index is in line with the 2nd position of the United States in the country index. Similarly, Singapore is in the top 3 in both rankings. In view of this—and that a better GCTCI rank seems to be associated with a higher income level—one would
Figure 4Derived country scores from GCTCI vs GTCI scores
20 30 40 50 60 70 8010
20
30
40
50
60
70
GTCI 2020 score
Coun
try
scor
e ba
sed
on G
CTCI
202
0
expect there to be a link between performances in the two indi-ces. Figure 4 corroborates such a connection by plotting country scores derived from the GCTCI against GTCI scores. The former scores are estimated by computing average city scores by coun-try. The figure clearly shows that cities that do well in the GCTCI tend to be located in countries that do well in the GTCI (ρ = 0.90). From a methodological viewpoint this is encouraging, as it lends credence to the GCTCI model and, at the same time, shows the value-added of the city index.
Details about the GCTCI rankings overall and by variable are presented in Annex 2 at the end of the Special Section.
ENDNOTES 1 See Villani (2019).
2 For example, the index released in September 2019 by the Oliver Wyman Forum ranks 105 cities in terms of ‘AI readiness’: Singapore tops this ranking, and out of the top 20 cities, 14 are Asian, including Shenzhen, Beijing, and Guangzhou. See https://www.oliverwymanforum.com/city-readiness/global-cities-ai-readiness-index-2019.html#
3 On the way in which citizens perceive such development, see the recently launched Smart City Index, available at https://www.imd.org/smart-city-observatory/smart-city-index/
4 See Bris et al. (2019).
5 At the time when this report goes to print (late November 2019), Tesla just announced that they had chosen Berlin as the site of their new
‘mega-factory’ (https://www.nytimes.com/2019/11/13/business/tesla-elon-musk-berlin.html), while Audi confirmed plans to shed some 9,500 jobs by 2025 as a result of its continued transition towards electric cars
CITIES AND REGIONS
THE GLOBAL TALENT COMPETITIVENESS INDEX 2020 99
SPECIAL SECTION

(https://www.dw.com/en/german-carmaker-audi-to-slash-9500-jobs-by-2025/a-51424743). Strategies in the automobile sector are clearly a sector in which skills, talent, and city-based consideration are key.
6 The relatively weak performances of US cities in the Retain pillar is similar to the way they fare in The Global Liveability Index produced by The Economist Intelligence Unit (http://www.eiu.com/topic/liveability).
7 A complete list of sources is provided in Annex 1 at the end of the Special Section.
8 As underlined in the Cities Section of the GTCI 2017, the definition of what constitutes a city is obviously a critical element here. To an extent, this is guided by data availability, with some data available only at the metropolitan or regional level. The general approach in the GCTCI this year is to primarily define cities at the level of the municipality. However, for those indicators where larger urban areas are more appropriate (e.g., on the number of airport passengers for indicator 5.3 Airport connectivity), the metropolitan area is treated instead.
REFERENCES AND FURTHER READINGSBatty, M. (2013). The new science of cities. Cambridge, MA: MIT Press.
Bris, A., Cabolis, C., Chan, H.C., & Lanvin, B. (2019). Sixteen shades of smart: How cities can shape their own future. IMD.
Dobbs, R., Smit, S., Remes, J., Manyika, J., Roxburgh, C., & Restrepo, A. (2011). Urban world: Mapping the economic power of cities, McKinsey Global Institute, available at https://www.mckinsey.com/global-themes/urbanization/urban-world-mapping-the-economic-power-of-cities
Florida, R. (2005). Cities and the creative class. New York and London: Routledge.
Forbes (2011). Global diversity and inclusion: Fostering innovation through a diverse workforce. Forbes Insights, available at https://www.forbes.com/forbesinsights/innovation_diversity/
Khanna, P. (2016). Connectography: Mapping the future of global civilization. New York: Random House.
Lanvin, B. & Evans, P. (eds.) (2017). The global talent competitiveness index 2017: Talent and technology. Fontainebleau, France: INSEAD, Adecco, and HCLI.
———. (2018). The global talent competitiveness index 2018: Diversity for competitiveness. Fontainebleau France: INSEAD, the Adecco Group, and Tata Communications.
Villani, C. (2019). Immersion: De la science au Parlement. Flammarion, Paris.
SPECIAL SECTION
100 THE GLOBAL TALENT COMPETITIVENESS INDEX 2020
https://www.mckinsey.com/global-themes/urbanization/urban-world-mapping-the-economic-power-of-cities

CHAPTER 8
How Cities Use AI to Be Talent Competitive: The Example of BilbaoIvan Jiménez Aira and Leire Lagunilla RamosBizkaia Talent
rejuvenation came from the ‘Guggenheim Effect’,1 which made it possible to transform itself from a grey industrial city into a cultural and service-based one—a clear example of this is that Airbnb has placed Bilbao in second place worldwide out of 20 places to visit in 20202—then the concentration of innovative digital services aimed at industry will lead the city’s future path. Two main projects will lead this transformation.
First, the International Entrepreneurship Centre, slated to open in mid-2020 in the renewed Bizkaia Tower,3 was conceived as ‘one of the best-connected entrepreneurship hubs in the world to become an entrepreneurship reference in Southern Europe’ as part of the Biscay Startup Bay strategy.4 This entrepreneurship hub aspires to be one of the most powerful innovation and entre-preneurship ecosystems in the world. It will be focused on three vertical accelerators (energy, mobility, and food tech—all stra-tegic sectors that are part of the DNA of the Basque Country) and two horizontal accelerators (deep learning and blockchain, which clearly address two of the exponential technologies that will shape the future).
Despite being something that seems distant and futuristic, Artificial Intelligence (AI) is already among us. And it is here not only to change the ways we perform in certain sectors of activ-ity, but also to revolutionise the reality of the cities in which we live. Since recruitment and performance evaluation have been radically affected by AI, it is necessary to analyse which jobs and skills are the most exposed to competition from it. Consequently, a re-evaluation of workplace practices and corporate structures will be needed. Based on Bilbao and the Basque Country, this chapter sets out to do precisely that—to present in a few strokes some concrete projects making use of AI, and to explain how this is generating different talent needs from those that have existed until now and how a territory can respond to the needs that this new reality brings.
THE CITY’S TRANSFORMATION AND TALENT PROJECTSThe city of Bilbao in the Basque Country is an example of self- reinvention. If 20 years ago the first big step of the city’s
CITIES AND REGIONS
THE GLOBAL TALENT COMPETITIVENESS INDEX 2020 101

The second is the Zorrotzaurre project.5 This once heavy industrial peninsula will be converted into a knowledge island and will become a hot spot for attracting talent thanks to its universities, professional training schools, affordable housing, environmentally friendly business areas, and social and cultural installations, as well as spacious green areas available for peo-ple’s enjoyment.
It is already well known that the competition for the best global talent is nowadays led by some medium and big cities or metropolitan areas.6 These all share common points, includ-ing well-ranked universities, numerous international companies, an active start-up scene, good international connections, high-quality public services, and high safety rates. Finally, tourism, foreign investment, and talent management are each part of the triangle needed for a successful place branding, so having a strategy that connects these three axes is a must. The Basque Country, with Bilbao at its head, is betting on adding inclusive prosperity as another ingredient to that formula,7 seeing it as the key solution to a well-distributed economic wealth that drives talent attraction and retention—the main players of innovative ecosystems.
In fact, the regional start-up and innovation ecosystem in general, and the International Entrepreneurship Centre in par-ticular, will be the new focus point in an area that is looking to-wards being the reference in the Atlantic axis in Southern Europe to attract the best talent—not only for the start-ups, but also for small and medium enterprises (SMEs) and big companies that will take advantage of the open innovation emerging from this hub.8
From Start-Ups to Big Corporations, AI Has Come to StayIn pursuing these projects, the city of Bilbao has several key areas in mind. One of them is AI. Sherpa.ai,9 the leading AI-based conversational and predictive digital assistant, is probably the best example of how this sector is evolving in the Bilbao area. According to Fortune,10 Sherpa.ai is ‘one of the leading Artificial Intelligence companies globally.’ This Basque company, with of-fices also in Silicon Valley, is endorsed by the AI Breakthrough Awards 2019, which designated it the best intelligent personal assistant. But, of course, a company cannot reach those excel-lence levels without the best talent within its ranks. The com-pany, led by its founder and CEO Xabier Uribe-Etxebarria, has surrounded itself with a team of experts and advisors. Among them, for instance, is the co-founder and former CTO of Siri, Tom Gruber,11 who has recently been hired with exclusivity when it comes to AI Strategic Advising after working for Apple for the last eight years.
Other interesting examples of what is brewing in the Basque start-up field can be seen in AI.Power,12 a start-up pro-ducer for talented entrepreneurial people who create disruptive solutions to problems by applying AI and deep tech; in Finanhub, which is a company that is undergoing all the R&D and techno-logical development for an automated portfolio manager that invests in investment funds using AI;13 and in the disruptive start-up Tormesh,14 which for its part is transforming the internet of
things (IoT) scenario. Focused on wireless communications ef-ficiency, Tormesh enables individuals to join together to build a community-owned, decentralised, secure, robust, and afford-able network that makes it possible for low-power machines to transfer data across long distances. In yet another example, TAD – The Art of Discovery,15 is a drug discovery company com-mitted to discovering medicines to treat ageing and catastrophic human diseases by in vivo PK/PD screening of drugs in human-ised mouse models (mice transplanted with human tissue).16 The company, which has been supported by the Bill & Melinda Gates Foundation because of its work on the development of new medicines for malaria eradication, is currently developing a pro-ject together with the Medicines for Malaria Venture, where AI is essential for testing the efficacy of new combinations of anti-malarials to prevent the development of resistance in the clinic. Another example is WorldPats17—a platform and associated ap-plication that, within the framework of a business-to-business-to-customer (B2B2C) model, improves the whole experience of expatriates having to move to a new city. Once in the country, workers have in the app all the updated information related to their new destination (useful information about the city, health insurance coverage, expatriate forums of the same nationality, events of interest, etc.), a 24/7 virtual concierge service and, de-pending on the contracted license, even a physical concierge.
But it is not only the entrepreneurial projects that are setting the pace. Larger companies are also betting hard. One of the most graphic examples of how synergies are being sought and potentialities are being exploited is the entry in May 2016 of the wind turbine manufacturer Gamesa—now SiemensGamesa—into NEM Solutions’ capital,18 a Basque com-pany with offices in Philadelphia (United States) and Coventry (United Kingdom), which develops technological applications for predictive maintenance management in the wind and rail sector. NEM Solutions, awarded in 2017 as the most innovative company by the Global Brands Magazine,19 has its own analytical technology and platform named AURA, recognised in the mo-bility and energy markets as a highly sophisticated technology in terms of anticipating failures and business control. It is note-worthy that its greatest innovation compared to its competitors, even above the level of its highly advanced products, is in the business model.
AI Supporting the Place Branding StrategyAs noted earlier, tourism plays a key role within place branding. In this context, Bilbao is immersed in a 6-million-euro project co- financed by the European Fund for Regional Development called BIOTIP-Smart Tourism that will end by October 2021. The project aims to use big data analysis and AI when it comes to advising and supporting the growing number of tourists in the city.20
The BIOTIP-Smart Tourism project will implement actions such as replacing more than 500 antennas with last-generation ones, expanding the municipal optical fibre network, installing new Wi-Fi access points,21 implementing a virtual assistant, and generating relevant tourist digital content.
This platform will analyse the behaviour of each individual visitor—who wants to use the tool—and will propose to him
CITIES AND REGIONSSPECIAL SECTION
102 THE GLOBAL TALENT COMPETITIVENESS INDEX 2020
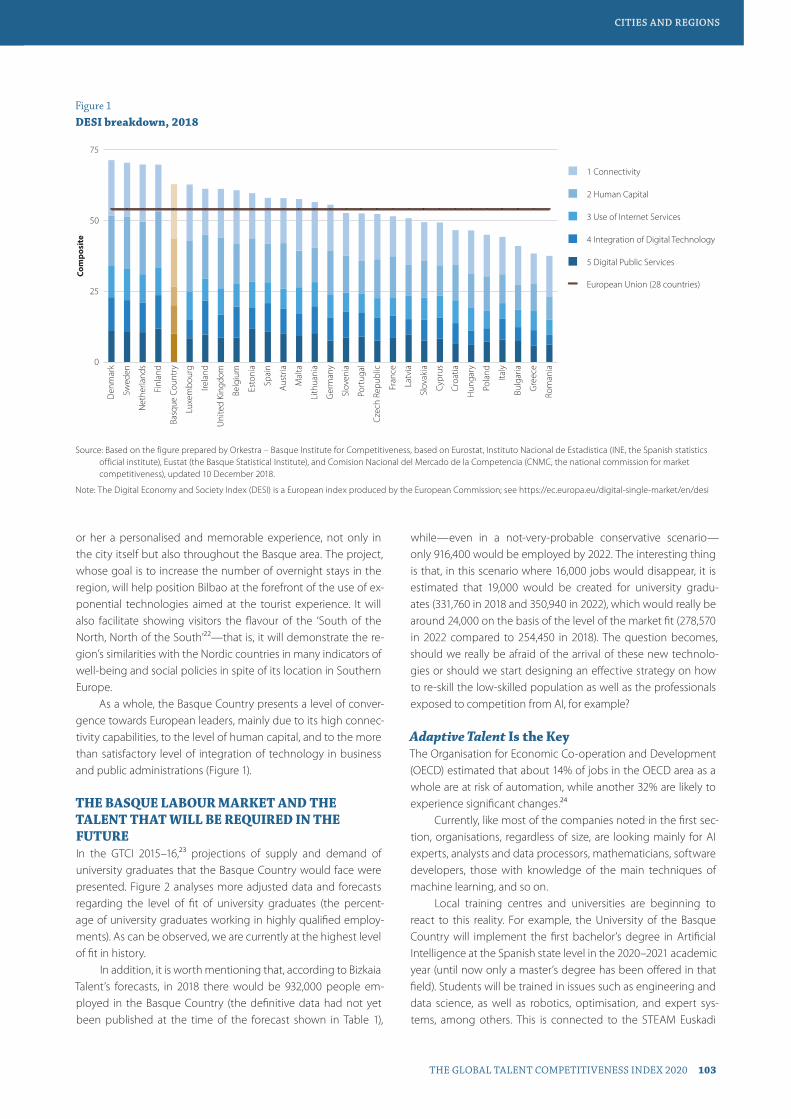
or her a personalised and memorable experience, not only in the city itself but also throughout the Basque area. The project, whose goal is to increase the number of overnight stays in the region, will help position Bilbao at the forefront of the use of ex-ponential technologies aimed at the tourist experience. It will also facilitate showing visitors the flavour of the ‘South of the North, North of the South’22—that is, it will demonstrate the re-gion’s similarities with the Nordic countries in many indicators of well-being and social policies in spite of its location in Southern Europe.
As a whole, the Basque Country presents a level of conver-gence towards European leaders, mainly due to its high connec-tivity capabilities, to the level of human capital, and to the more than satisfactory level of integration of technology in business and public administrations (Figure 1).
THE BASQUE LABOUR MARKET AND THE TALENT THAT WILL BE REQUIRED IN THE FUTUREIn the GTCI 2015–16,23 projections of supply and demand of university graduates that the Basque Country would face were presented. Figure 2 analyses more adjusted data and forecasts regarding the level of fit of university graduates (the percent-age of university graduates working in highly qualified employ-ments). As can be observed, we are currently at the highest level of fit in history.
In addition, it is worth mentioning that, according to Bizkaia Talent’s forecasts, in 2018 there would be 932,000 people em-ployed in the Basque Country (the definitive data had not yet been published at the time of the forecast shown in Table 1),
while—even in a not-very-probable conservative scenario—only 916,400 would be employed by 2022. The interesting thing is that, in this scenario where 16,000 jobs would disappear, it is estimated that 19,000 would be created for university gradu-ates (331,760 in 2018 and 350,940 in 2022), which would really be around 24,000 on the basis of the level of the market fit (278,570 in 2022 compared to 254,450 in 2018). The question becomes, should we really be afraid of the arrival of these new technolo-gies or should we start designing an effective strategy on how to re-skill the low-skilled population as well as the professionals exposed to competition from AI, for example?
Adaptive Talent Is the KeyThe Organisation for Economic Co-operation and Development (OECD) estimated that about 14% of jobs in the OECD area as a whole are at risk of automation, while another 32% are likely to experience significant changes.24
Currently, like most of the companies noted in the first sec-tion, organisations, regardless of size, are looking mainly for AI experts, analysts and data processors, mathematicians, software developers, those with knowledge of the main techniques of machine learning, and so on.
Local training centres and universities are beginning to react to this reality. For example, the University of the Basque Country will implement the first bachelor’s degree in Artificial Intelligence at the Spanish state level in the 2020–2021 academic year (until now only a master’s degree has been offered in that field). Students will be trained in issues such as engineering and data science, as well as robotics, optimisation, and expert sys-tems, among others. This is connected to the STEAM Euskadi
Figure 1DESI breakdown, 2018
Source: Based on the figure prepared by Orkestra – Basque Institute for Competitiveness, based on Eurostat, Instituto Nacional de Estadistica (INE, the Spanish statistics official institute), Eustat (the Basque Statistical Institute), and Comision Nacional del Mercado de la Competencia (CNMC, the national commission for market competitiveness), updated 10 December 2018.
Note: The Digital Economy and Society Index (DESI) is a European index produced by the European Commission; see https://ec.europa.eu/digital-single-market/en/desi
0
25
50
75
Rom
ania
Gre
ece
Bulg
aria
Italy
Pola
nd
Hun
gary
Croa
tia
Cypr
us
Slov
akia
Latv
ia
Fran
ce
Czec
h Re
publ
ic
Port
ugal
Slov
enia
Ger
man
y
Lith
uani
a
Mal
ta
Aust
ria
Spai
n
Esto
nia
Belg
ium
Uni
ted
King
dom
Irela
nd
Luxe
mbo
urg
Basq
ue C
ount
ry
Finl
and
Net
herla
nds
Swed
en
Den
mar
k
Com
posi
te
European Union (28 countries)
1 Connectivity
2 Human Capital
3 Use of Internet Services
4 Integration of Digital Technology
5 Digital Public Services
CITIES AND REGIONS
THE GLOBAL TALENT COMPETITIVENESS INDEX 2020 103
SPECIAL SECTION
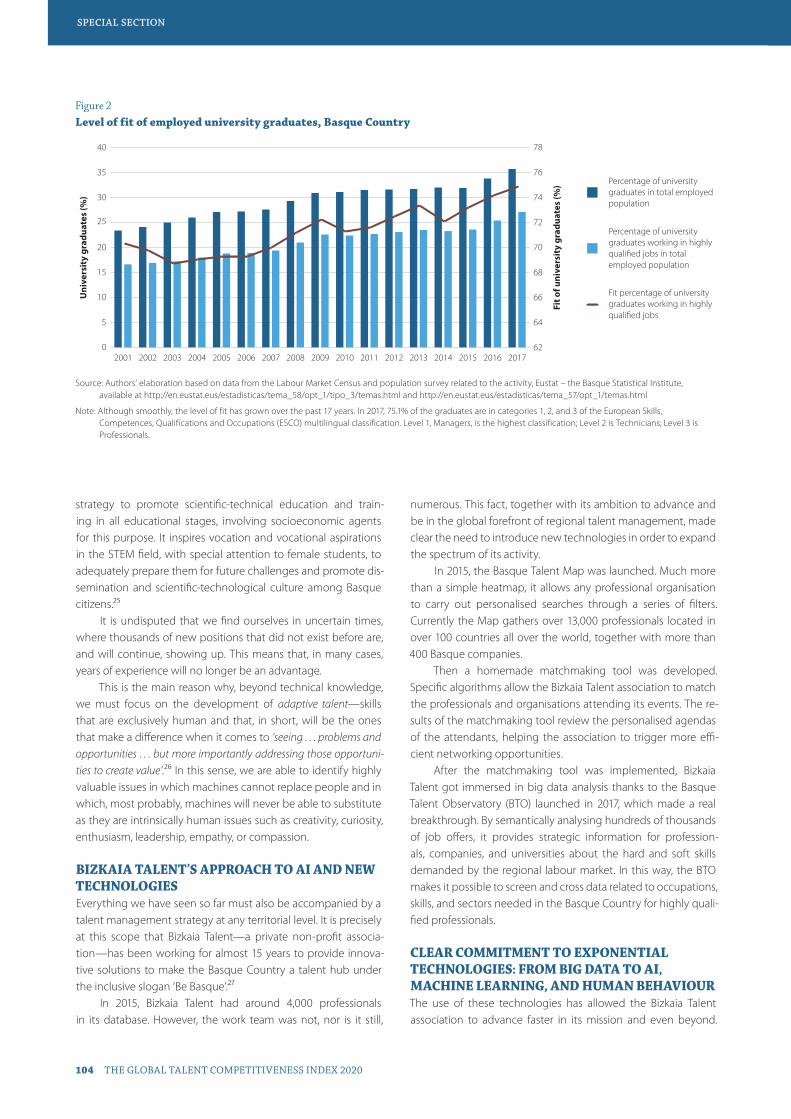
strategy to promote scientific-technical education and train-ing in all educational stages, involving socioeconomic agents for this purpose. It inspires vocation and vocational aspirations in the STEM field, with special attention to female students, to adequately prepare them for future challenges and promote dis-semination and scientific-technological culture among Basque citizens.25
It is undisputed that we find ourselves in uncertain times, where thousands of new positions that did not exist before are, and will continue, showing up. This means that, in many cases, years of experience will no longer be an advantage.
This is the main reason why, beyond technical knowledge, we must focus on the development of adaptive talent—skills that are exclusively human and that, in short, will be the ones that make a difference when it comes to ‘seeing . . . problems and opportunities . . . but more importantly addressing those opportuni-ties to create value’.26 In this sense, we are able to identify highly valuable issues in which machines cannot replace people and in which, most probably, machines will never be able to substitute as they are intrinsically human issues such as creativity, curiosity, enthusiasm, leadership, empathy, or compassion.
BIZKAIA TALENT’S APPROACH TO AI AND NEW TECHNOLOGIESEverything we have seen so far must also be accompanied by a talent management strategy at any territorial level. It is precisely at this scope that Bizkaia Talent—a private non-profit associa-tion—has been working for almost 15 years to provide innova-tive solutions to make the Basque Country a talent hub under the inclusive slogan ‘Be Basque’.27
In 2015, Bizkaia Talent had around 4,000 professionals in its database. However, the work team was not, nor is it still,
numerous. This fact, together with its ambition to advance and be in the global forefront of regional talent management, made clear the need to introduce new technologies in order to expand the spectrum of its activity.
In 2015, the Basque Talent Map was launched. Much more than a simple heatmap, it allows any professional organisation to carry out personalised searches through a series of filters. Currently the Map gathers over 13,000 professionals located in over 100 countries all over the world, together with more than 400 Basque companies.
Then a homemade matchmaking tool was developed. Specific algorithms allow the Bizkaia Talent association to match the professionals and organisations attending its events. The re-sults of the matchmaking tool review the personalised agendas of the attendants, helping the association to trigger more effi-cient networking opportunities.
After the matchmaking tool was implemented, Bizkaia Talent got immersed in big data analysis thanks to the Basque Talent Observatory (BTO) launched in 2017, which made a real breakthrough. By semantically analysing hundreds of thousands of job offers, it provides strategic information for profession-als, companies, and universities about the hard and soft skills demanded by the regional labour market. In this way, the BTO makes it possible to screen and cross data related to occupations, skills, and sectors needed in the Basque Country for highly quali-fied professionals.
CLEAR COMMITMENT TO EXPONENTIAL TECHNOLOGIES: FROM BIG DATA TO AI, MACHINE LEARNING, AND HUMAN BEHAVIOURThe use of these technologies has allowed the Bizkaia Talent association to advance faster in its mission and even beyond.
Figure 2Level of fit of employed university graduates, Basque Country
Source: Authors’ elaboration based on data from the Labour Market Census and population survey related to the activity, Eustat – the Basque Statistical Institute, available at http://en.eustat.eus/estadisticas/tema_58/opt_1/tipo_3/temas.html and http://en.eustat.eus/estadisticas/tema_57/opt_1/temas.html
Note: Although smoothly, the level of fit has grown over the past 17 years. In 2017, 75.1% of the graduates are in categories 1, 2, and 3 of the European Skills, Competences, Qualifications and Occupations (ESCO) multilingual classification. Level 1, Managers, is the highest classification; Level 2 is Technicians; Level 3 is Professionals.
0
5
10
15
20
25
30
35
40
20172016201520142013201220112010200920082007200620052004200320022001
78
76
74
72
70
68
66
64
62
Fit percentage of university graduates working in highly quali�ed jobs
Percentage of university graduates working in highly quali�ed jobs in total employed population
Percentage of university graduates in total employed population
Uni
vers
ity
grad
uate
s (%
)
Fit o
f uni
vers
ity
grad
uate
s (%
)
CITIES AND REGIONSSPECIAL SECTION
104 THE GLOBAL TALENT COMPETITIVENESS INDEX 2020
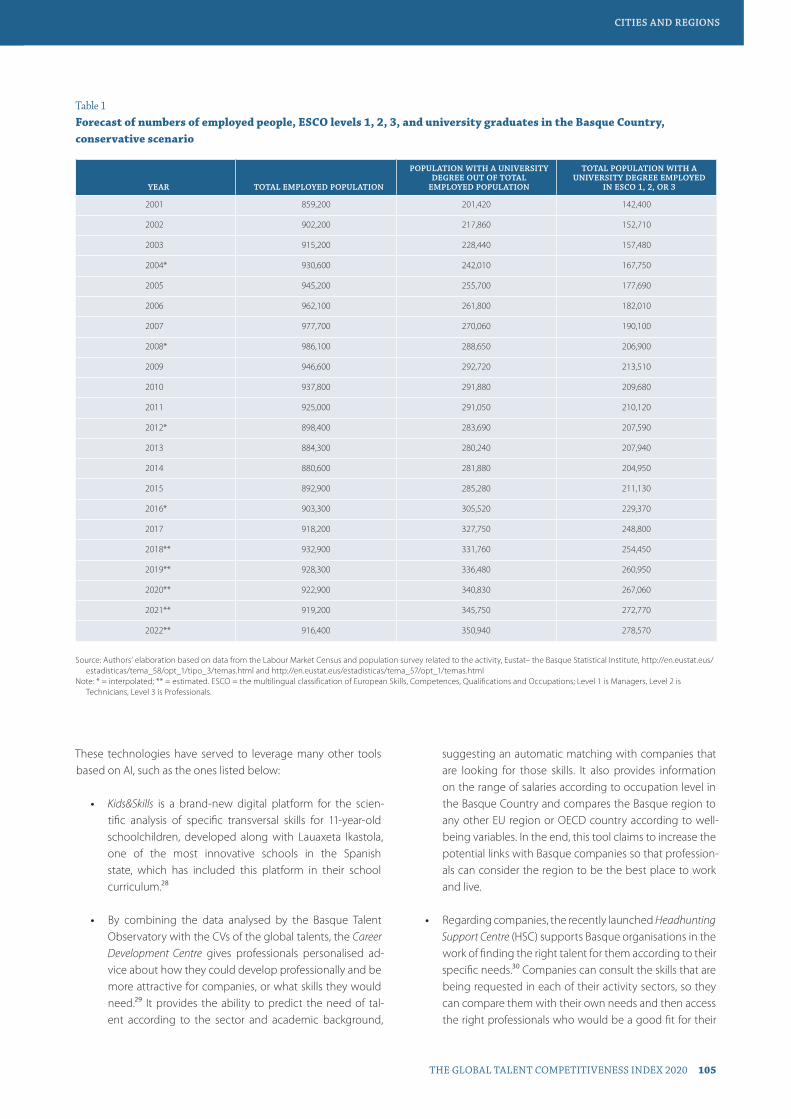
These technologies have served to leverage many other tools based on AI, such as the ones listed below:
• Kids&Skills is a brand-new digital platform for the scien-tific analysis of specific transversal skills for 11-year-old schoolchildren, developed along with Lauaxeta Ikastola, one of the most innovative schools in the Spanish state, which has included this platform in their school curriculum.28
• By combining the data analysed by the Basque Talent Observatory with the CVs of the global talents, the Career Development Centre gives professionals personalised ad-vice about how they could develop professionally and be more attractive for companies, or what skills they would need.29 It provides the ability to predict the need of tal-ent according to the sector and academic background,
suggesting an automatic matching with companies that are looking for those skills. It also provides information on the range of salaries according to occupation level in the Basque Country and compares the Basque region to any other EU region or OECD country according to well-being variables. In the end, this tool claims to increase the potential links with Basque companies so that profession-als can consider the region to be the best place to work and live.
• Regarding companies, the recently launched Headhunting Support Centre (HSC) supports Basque organisations in the work of finding the right talent for them according to their specific needs.30 Companies can consult the skills that are being requested in each of their activity sectors, so they can compare them with their own needs and then access the right professionals who would be a good fit for their
Table 1Forecast of numbers of employed people, ESCO levels 1, 2, 3, and university graduates in the Basque Country, conservative scenario
YEAR TOTAL EMPLOYED POPULATION
POPULATION WITH A UNIVERSITY DEGREE OUT OF TOTAL
EMPLOYED POPULATION
TOTAL POPULATION WITH A UNIVERSITY DEGREE EMPLOYED
IN ESCO 1, 2, OR 3
2001 859,200 201,420 142,400
2002 902,200 217,860 152,710
2003 915,200 228,440 157,480
2004* 930,600 242,010 167,750
2005 945,200 255,700 177,690
2006 962,100 261,800 182,010
2007 977,700 270,060 190,100
2008* 986,100 288,650 206,900
2009 946,600 292,720 213,510
2010 937,800 291,880 209,680
2011 925,000 291,050 210,120
2012* 898,400 283,690 207,590
2013 884,300 280,240 207,940
2014 880,600 281,880 204,950
2015 892,900 285,280 211,130
2016* 903,300 305,520 229,370
2017 918,200 327,750 248,800
2018** 932,900 331,760 254,450
2019** 928,300 336,480 260,950
2020** 922,900 340,830 267,060
2021** 919,200 345,750 272,770
2022** 916,400 350,940 278,570
Source: Authors’ elaboration based on data from the Labour Market Census and population survey related to the activity, Eustat– the Basque Statistical Institute, http://en.eustat.eus/estadisticas/tema_58/opt_1/tipo_3/temas.html and http://en.eustat.eus/estadisticas/tema_57/opt_1/temas.html
Note: * = interpolated; ** = estimated. ESCO = the multilingual classification of European Skills, Competences, Qualifications and Occupations; Level 1 is Managers, Level 2 is Technicians, Level 3 is Professionals.
CITIES AND REGIONS
THE GLOBAL TALENT COMPETITIVENESS INDEX 2020 105
SPECIAL SECTION

future challenges. The HSC also has a super-fast searching database capable of making complex searches in milli-seconds. All in all, the speed provided by AI increases the probability of a successful match between professionals and organisations.
Moreover, this system will soon create groups of interest according to the behavioural trends of the professionals in the database. This will represent a great improvement as it will provide much more accurate matchings between companies and professionals than if a ‘simple’ data analy-sis is used. This platform also provides strategic informa-tion about salaries, standards of living, and taxation issues to the Basque organisations.
• As noted earlier, a re-evaluation of workplace practices and corporate structures will be needed because AI will dis-rupt the traditional human resources processes. So, more than ever, companies and society as a whole will seek the uniquely human skills, the new—and permanent—gold.
• In the near future, Bizkaia Talent’s Be Basque Employer Branding Centre will be developed to respond to this de-mand. The underlying idea is to help Basque organisa-tions improve their talent attraction and retention policies by analysing their (potential) employees’ perceptions and expectations.
LOOKING FORWARD: CITIES AND AI TO BENEFIT HUMANSIn Bilbao, steps are being taken in technology centres, compa-nies, universities, and some start-ups to develop projects and ex-plore ways to correctly integrate AI into their usual practices, but there is still a long way to go. In general, more business-oriented AI products must be created. On the other hand, it seems im-portant to design an environment where all these stakeholders working in the field of AI can share experiences and knowledge, because it seems logical to think that joining them will bring competitive advantages.
Open innovation will be key for the competitiveness of industry and therefore of regions. Setting up a comprehensive plan that aligns the Basque Industry 4.0 Industry strategy to-gether with the International Entrepreneurship Centre in the city of Bilbao, supported by the ‘Be Basque’ strategy as the catalyst of talent attraction and development, is a major issue.31 Equally, in the next era of human-machine partnership, orchestration between the human touch and AI will be decisive, maximising technology as the tool that exponentially amplifies creativity, in-spiration, intelligence, and curiosity.
Taking into account that industrial activity represents 24.2% of the Basque GDP,32 and that the Basque automotive supply in-dustry represents more than 50% of the sector in Spain (which is the second automaker country in Europe), various institutions—such as the Basque government and the Basque business de-velopment agency SPRI33—have shown interest in extending
business measures that can accelerate the fulfilment of the United Nations (UN) Sustainable Development Goals, as well as establish mechanisms for measuring the indicators associated with these objectives.
Related to this, the United Nations, through the forthcom-ing UNIDO 2020 report,34 will examine the future of manufac-turing production and the impact that new technologies linked to industry 4.0 are having on the industrialisation process of the more developed countries. A chapter of that report will specifi-cally focus on the Basque Country because it has a strategy of interest to the UN, and it can serve as an example to be imple-mented in other countries.35
Finally, we must not forget that normally the most far-reaching challenges tend to turn into the most extraordinary opportunities. Along the same lines, it will probably not be so much about preventing or regulating technology as such, but rather about becoming better managers of the human kind, be-ing clear about why and for what we want to develop certain technologies, and, above all, about ensuring the ethical founda-tions as well as the necessary underlying regulations and legal framework of our society. In other words, we must make sure that any future development contributes to building a more just and inclusive society.
ENDNOTES 1 More information about the Guggenheim Effect can be found at http://
www.mascontext.com/issues/30-31-bilbao/the-many-effects-of-the-guggenheim-effect/
2 Bilbao came in second place worldwide among Airbnb’s 20 destinations to visit in 2020; see Airbnb Newsroom, available at https://news.airbnb.com/20-for-2020/
3 The Bizkaia Tower, formerly the Banco de Vizcaya Tower and later the Torre BBVA Tower, is a building located in the city centre of Bilbao. Designed by architects Enrique Casanueva, Jaime Torres, and José María Chapa, its inauguration took place on 22 April 1969. At 88 metres, it has 21 floors. After its construction, it was the tallest building in the city until the construction of the Iberdrola Tower (165 metres) in 2009.
4 See the official website of the Provincial Government of Biscay at http://web.bizkaia.eus/es/web/area-de-prensa/noticias/-/news/detailView/19174 [authors’ translation].
5 The Zorrotzaurre project is the latest major urban regeneration project to be implemented in Bilbao. Zorrotzaurre is an area that has shown constant social and industrial decline since the 1970s; today, scarcely 500 people live there. The Zorrotzaurre project is an integral and sustainable plan to recover a currently derelict site and convert it into a new quarter that is well connected to the rest of the city, with affordable housing, environmentally friendly business areas, and social and cultural installations as well as spacious green areas for people’s enjoyment. The Master Plan for the project was designed by the prestigious architect Zaha Hadid. It includes the conversion of the current Zorrotzaurre peninsula into an island by opening up the Deusto Canal—an island for living, working, and pleasure. For further details, see http://www.zorrotzaurre.com/en/
6 Although a big city’s size continues to come with many advantages in terms of jobs and connectivity, these advantages are partially outweighed by the ability of higher-level talents to operate from smaller locations, provided that those locations are not synonymous with isolation: Physical and technical connectivity (transportation and communications) contribute to mitigate this traditional disadvantage of smaller cities, where quality of life is often seen as higher than in environmentally challenged metropolises. See Lanvin & Evans (2016).
CITIES AND REGIONSSPECIAL SECTION
106 THE GLOBAL TALENT COMPETITIVENESS INDEX 2020

7 Bilbao is the main city and metropolitan area of the Basque Country, which is the region with the best quality of life (both in Spain and compared to the countries in the Organisation for Economic Co-operation and Development, or OECD) according to different indices (see https://www.oecdregionalwellbeing.org/). It has a low unemployment rate and the highest salaries, a high productivity rate (https://www.ine.es), and is considered the most innovative and ranked at the top of the Social Progress Index (https://ec.europa.eu/regional_policy/en/information/maps/social_progress) thanks also to its top position when it comes to social differences (Gini Index, https://www.census.gov/topics/income-poverty/income-inequality/about/metrics/gini-index.html). Everything based in the inclusive prosperity strategy can be distilled in the slogan
‘North of the South, South of the North’—a slogan that highlights the region’s similarities with Nordic countries in many of the aforementioned indicators and social policies together with a good combination with a southern Europe lifestyle.
8 Bilbao has jumped 121 positions since 2017—the third largest progression among all European Union cities in the Startup Ecosystem Ranking. See https://report.startupblink.com/
9 Further information about Sherpa.ai can be found at https://sherpa.ai/
10 Rapp & O’Keefe (2018).
11 Tom Gruber is a researcher, designer, and entrepreneur with a focus on technology to augment human intelligence. He was cofounder, CTO, and VP Design for Siri, which created the first intelligent assistant for everyone. A conversation about conversational AI is available at https://tomgruber.org/
12 Further information about AiPower is available at http://aipower.ai/
13 Finanhub is a start-up created by the Madrid-based company Finanbest, which will deal with the R&D and technological development of the group from the Basque Country.
14 Further information about Tormesh is available at https://tormesh.com/
15 The company has already defined a new project to combine AI with previous experimental tests of drugs and vaccines in humanised mice in order to predict the efficacy of new treatments and vaccines in human clinical trials. See https://www.theartofdiscoverysl.com/ for further details.
16 PK/PD is a technique that combines the two classical pharmacologic disciplines of pharmacokinetics and pharmacodynamics.
17 Further information about WorldPats is available at https://worldpats.com/
18 Further information about NEM Solutions is available at https://www.nemsolutions.com
19 NEM Solutions was selected as the most innovative company in Europe 2017 in the Technology Awards category for its unique commitment to an innovative culture and in continuous development since 2007. The jury has determined that its products are unique and take innovation to the business model itself in comparison to similar companies. Innovation, quality, unique and memorable projects, proven reliability with the clients consulted, and a strong commitment to the values of the company are the aspects that have been highlighted by the jury, together with inspiration and care for the needs of the staff since the beginning of the company.
20 Last year the city received almost 1 million visitors and figures are increasing year by year (http://www.bilbaoturismo.net/BilbaoTurismo/en/comunicados-de-prensa?idNoticia=1364335422942&anio=2019&pagina=1, in Spanish). The city also came in second at the European Best Destination Award 2018 (see https://www.europeanbestdestinations.com/european-best-destinations-2018/) and was named European City of the Year at the 2018 Urbanism Awards (see Academy of Urbanism, 2017).
21 It must be taken into consideration that the Wi-Fi system of Bilbao is the most used one in Spain, with more than 120,000 unique users every day; 20,000 of them are university students connected through a network of more than 1,400 antennas (half of them owned by the municipality).
22 This claim is used to reinforce the branding of the Basque Country as the region with one of the best quality-of-life rankings according to the different indices (both in Spain and by the OECD), with a lower unemployment rate and the highest salaries and productivity; it is ranked as the most innovative and at the top of the social development index
thanks also the top position when it comes to social differences (GINI Index), everything based in Inclusive Prosperity Society; see https://www.oecdregionalwellbeing.org/ES21.html
23 Supply and demand projections for the 2015–2020 period showed that, despite initial surpluses of tertiary educated people, the number of university graduates entering the labour force will be lower than needed to cover demand. See Lagunilla & Jiménez (2015).
24 OECD (2018).
25 For further details about the STEAM Euskadi strategy, see http://steam.eus/es/estrategia-euskadi/
26 Hagel (2019); see https://www.youtube.com/watch?time_continue =2&v=a7yb-sbKT_I at 2:45.
27 The ‘Bilbao Bizkaia, Be Basque’ brand was launched in 2013 by the City Council of Bilbao and the Country Council of Biscay. Its main objective is to promote a positive, coherent, and stable image of the territory—within the framework of a comprehensive strategy that is key for attracting visitors, investments, events, and talent. See Lanvin & Evans (2017).
28 For details about Kids&Skills, see https://kidsandskills.eus
29 More information about the Career Development Centre can be found at https://www.bizkaiatalent.eus/en/te-ofrecemos/career-development-centre/
30 For more details, see https://www.bizkaiatalent.eus/en/te-ofrecemos/headhunting-support-centre/
31 Further information about the Basque Industry 4.0 Industry strategy can be found at https://basqueindustry.spri.eus/en/
32 The goal set for 2020 is that industry will provide 25% of GDP; in May 2018 the data confirmed that 24.2% had been reached, while in 2016 the sector represented 23.9%. For more details, see http://www.euskadi.eus/noticia/2018/tapia-el-peso-de-la-industria-en-euskadi-alcanza-ya-el-24-2/web01-s2ekono/es/
33 Information about SPRI can be found at https://www.spri.eus/en/
34 The forthcoming United Nations Industrial Development Organization (UNIDO) 2020 report will identify as good practice the Basque Industry 4.0 strategy of the Basque government. See Grupo SPRI (2019) at https://www.spri.eus/es/basque-industry-comunicacion/unido-organismo-industrial-de-la-onu-elige-la-estrategia-basque-industry-4-0-como-practica-recomendable-para-el-desarrollo-industrial/
35 Public-private collaboration is the basis of the Basque Industry 4.0.
REFERENCESAcademy of Urbanism. (2017). Bilbao wins European City of the Year at 2018
Urbanism Awards, Academy of Urbanism Press Release, 9 November 2017, available at https://www.academyofurbanism.org.uk/bilbao-wins-european-city-of-the-year-at-2018-urbanism-awards/
Airbnb Newsroom. (2019). 20 for 2020: Airbnb reveals the 20 destinations to visit next year. Airbnb Newsroom Press Release, 09 October 2019, available at https://news.airbnb.com/20-for-2020/
Grupo SPRI. (2019). UNIDO, organismo industrial de la ONU, elige la estrategia Basque Industry 4.0 como práctica recomendable para el desarrollo industrial (in Spanish), 18 July 2019. 2020 report, available at https://www.spri.eus/es/basque-industry-comunicacion/unido-organismo-industrial-de-la-onu-elige-la-estrategia-basque-industry-4-0-como-practica-recomendable-para-el-desarrollo-industrial/
Hagel, J. (2019). The untapped opportunity: Rethinking learning in the work environment. Public Policy Forum, Brave New Work Conference, 29 June 2019 [video file], available at https://www.youtube.com/watch?time_continue=2&v=a7yb-sbKT_I
Lagunilla, L. & Jiménez, I. (2015). Talent mobility for regional competitiveness: The case of the Basque Country. In Lanvin, B. & Evans, P. (eds.). The global talent competitiveness index 2015–16: Talent attraction and international mobility. Fontainebleau, France: INSEAD, Adecco, and HCLI, 81–90.
CITIES AND REGIONS
THE GLOBAL TALENT COMPETITIVENESS INDEX 2020 107
SPECIAL SECTION

Lanvin, B. & Evans, P. (eds.) (2015). The global talent competitiveness index 2015–16: Talent attraction and international mobility. Fontainebleau, France: INSEAD, Adecco, and HCLI.
———. (eds). (2016). The global talent competitiveness index 2017: Talent and technology. Fontainebleau, France: INSEAD, Adecco, and HCLI.
———. (2017). The global talent competitiveness index 2018: Diversity and competitiveness. Fontainebleau, France: INSEAD, the Adecco Group, and Tata Communications.
OECD (Organisation for Economic Co-operation and Development). (2018). Job creation and local economic development 2018: Preparing for the future of work. Paris: OECD Publishing, available at https://doi.org/10.1787/9789264305342-en
Rapp, N. & O’Keefe, B. (2018). These 100 companies are leading the way in A.I. Fortune, 8 January, available at https://fortune.com/2018/01/08/artificial-intelligence-ai-companies-invest-startups/
SPECIAL SECTION
108 THE GLOBAL TALENT COMPETITIVENESS INDEX 2020
A SPECIAL GTCI INTERVIEW
Porsche, AI, and Talent: Why Berlin Rather Than Stuttgart?An interview with Anja HendelDirector, Porsche Digital Lab
Porsche Headquarters have always been in Stuttgart. What was so attractive in Berlin’s talent pool that Porsche decided to establish its Digital Lab there?
Anja Hendel:As an organisation, we were struggling to get well-qualified people for IT [information technology], since Stuttgart is filled with organisations from a lot of different industries and has a high demand. We therefore started to look for another location; and in terms of this we decided that Berlin was very interesting especially for tech talents as it is a renowned, attractive, and cos-mopolitan city.
Furthermore, talents are primarily interested in exciting work, excellent teamwork, and the opportunity to learn, so we decided to build with our location a platform that offers all of these aspects. We want to attract international people with skills everyone uses now (i.e., GAFA [Google Amazon Facebook Alibaba]) and of course, we have to deal with a fierce competition.
The competition among cities to attract investment through talent and to enhance their own talent competitiveness is well illustrated by the choice made by Porsche to set up its Digital Lab in Berlin, rather than in Stuttgart, where the company’s headquarters are located.
Since 2017, Anja Hendel has been Director of Innovation Management and Digital Transformation for Finance at Porsche AG. She also works alongside Dr Mahdi Manesh to head up the Porsche Digital Lab in Berlin. This tech-nical laboratory is a platform for collab-
orating with technology companies, start-ups, and scientific institutions, and it deals with the practical application of con-cepts such as blockchain, Artificial Intelligence (AI), and the inter-net of things at Porsche. In October 2019 Anja Hendel was interviewed by the GTCI team, responding to questions about talent competitiveness and the impact of AI on a company like Porsche in particular, and the automobile sector in general.
CITIES AND REGIONS
THE GLOBAL TALENT COMPETITIVENESS INDEX 2020 109
Having attracted global talent to its own innovation laboratory, how did Porsche translate that into gearing its innovations to big data, machine learning, cloud services, Industry 4.0, and the internet of things and turn those innovations into practical solutions?
Anja Hendel:There are two main tasks when it comes to turning innovation into practical solutions, which is undeniably a challenging pro-cess. The first task is to inspire the Porsche organisation to de-termine what can be done through technology (e.g., using AI, business intelligence, quantum computing); the second one is to develop domains where experts can offer solutions to a given problem. For example, AI is currently being used in our lab to detect and analyse sounds—so engineers can make use of it by analysing the sound of a car door when it opens and closes and so to become aware of possible malfunctions. The later a problem is raised, the higher the cost to fix it, so it’s really thanks to 24/7 machine detection work that the sound engineers can perform their work in a technology-facilitated way. We also have regular brainstorming sessions to identify what technology can do for our organisation.
What are the greatest talent challenges and hurdles a digital lab like yours is facing?
Anja Hendel:In the beginning, the first challenge we had to face was indeed to bring people in and find them a first successful project. Another set of challenges relates to the ‘outside world’. For instance, we don’t control the price of housing in Berlin, so apartments can be expensive from time to time. Other challenges are how to diversify our workforce, and how to satisfy our new talents’ need to learn continuously.
AI is not only about self-driven cars; it’s also about keeping drivers (customers) connected, on schedule, and safe even when they are driving themselves. The value of AI in automotive manufacturing and cloud services will exceed US$10.73 billion by 2024. * What opportunities do you see AI will offer in your industry?
Anja Hendel:AI is one of the biggest opportunities for the automotive sector. I see that AI is changing everything, so it’s important for us to look at the impact of this technology, though it might be hard
* See Novosilska, L. (2018). 5 ways artificial intelligence is impacting the automotive industry, Ignite, 30 November 2018, available at https://igniteoutsourcing.com/automotive/artificial-intelligence-in-automotive-industry/
† See Porsche Newsroom. (2019). Porsche Digital opens second location in the US, Press Release, 08 June 2019, available at https://newsroom.porsche.com/en/2019/digital/porsche-digital-second-location-atlanta-georgia-cars-north-america-18306.html
to foresee at times. I strongly believe that to shape the future we need, we first have to understand the technology and build organisations that adapt to new technologies as much as pos-sible, while focusing on constant learning and aiming to develop permanently.
Another opportunity we see is in the following question: How can Porsche continue to develop new products using history, but combining its traditional heritage with innovative technologies? The answer is to effectively implement the best combination possible of the latest technologies with our branded traditions. That being said, the security and protection of our drivers and passengers are always our main priority.
Automation is provoking a rethinking of processes and production in radically new ways. More and more often, robots work with their human counterparts rather than just at their side. In your opinion, what will the talent impact of AI be in the automobile/transport sector? Do you see more jobs being created or—on the contrary—more skills becoming redundant?
Anja Hendel:Automation is much more than just introducing more robots! We need to rethink the work of all sectors affected by AI. The work of machines and humans can—and should—be com-bined. We believe that automation will always be used to make things better and support the workers in making their tasks easier, hence improving the overall process. But we also believe that part of our comparative advantage will remain in the ‘hand-crafted’ dimension of our products. It’s a matter of combining the resources of humans and those of machines in order to make the best of both worlds. Looking at the fourth industrial revolu-tion, I would say that, so far, more jobs have been created than ever (not the other way around). It is an ongoing learning op-portunity to expand the organisation and improve on our ex-pertise. Growing companies like Porsche employ more and more workers, and technology is now an important ally—it certainly does not compete with engineers.
Worldwide, Porsche has now reached more than 32,000 employees and continues to grow fast. How does Porsche attract new talent?
Anja Hendel:We at Porsche Digital opened a second location in the United States during the summer, † and we also have offices in Israel and China. A key motivation in choosing these locations has been
CITIES AND REGIONSSPECIAL SECTION
110 THE GLOBAL TALENT COMPETITIVENESS INDEX 2020

the availability of local talent. Globally speaking, attracting tal-ent remains a key challenge for us, but we are well equipped to face it. First, we offer the possibility of growing within the organisation and developing new skills. Second, we understand that great people want to work on great projects, so we make our employees’ responsibilities as interesting as possible. Last but not least, we promote mobility and offer different work lo-cations such as those mentioned above. At Porsche, talents are now seeking more than an engineer role: they’ve broadened their research to the AI and ICT [information and communica-tion technology] fields as well, and this means they’re exploring more locations altogether.
Do you think that innovation and digital transformation require a human-centric approach? In other words, how can organisations produce, grow, and retain talent while the needs for AI and global competitiveness increase exponentially?
Anja Hendel:The human factor is critical. AI should not only be human-centric [considering human skills and activities first] but also human-centred [focused on human well-being]. What’s more, univer-sities are no longer the only ones producing talent: It is now a lifelong commitment that needs to be offered and produced by employers as well. The quality of the work and the excitement for the company are also important to keep in mind as organisa-tions develop and increase their workforce. It is believed that the automotive industry will change more in the next 5 years than it has in the last 50 years! This pivotal moment presents a great opportunity for companies to change and develop by using in-novative technologies, including AI. As a successful company, we at Porsche need to work hard and focus on constant learning and opening new paths for our organisation to work moving forward. Also, we should ensure that the organisation welcomes change and is able to adapt quickly—and even anticipate the change to come.
Regulatory approval today is a critical step that must be in place before a company can put AI in the driver’s seat. What legal and ethical issues do you foresee might arise (such as data protection and issues of liability and privacy, for example)?
Anja Hendel:The role of regulators and ethics certainly needs to be addressed, and this is an area that has newly opened up. We need to pay close attention to what technology can do and what we need
* Note from the GTCI team: This point is clearly aligned with the one made by Commissioner Nicolas Schmit about the importance of pursuing ‘core values’ in the age of global AI. See the Special GTCI Interview on AI and Talent Competitiveness: Luxembourg and the European Union with Nicolas Schmit in this report.
to do with it—or what we need to leave alone. We now rely on experts who work on ethical topics and practical case studies that deal with aspects like this. We see this as a real opportu-nity to check where AI is being used intensely and ensure that, in such efforts, there is enough diversity to arrive at optimal decision-making.
Nevertheless, safety is still our number one priority. When it comes to ethics, sometimes there is no obvious right answer, so we’re constantly challenging ourselves. Porsche needs to con-sider different levels, including a European level, to ensure con-sistency around a set of commonly accepted values. *
CITIES AND REGIONS
THE GLOBAL TALENT COMPETITIVENESS INDEX 2020 111
SPECIAL SECTION

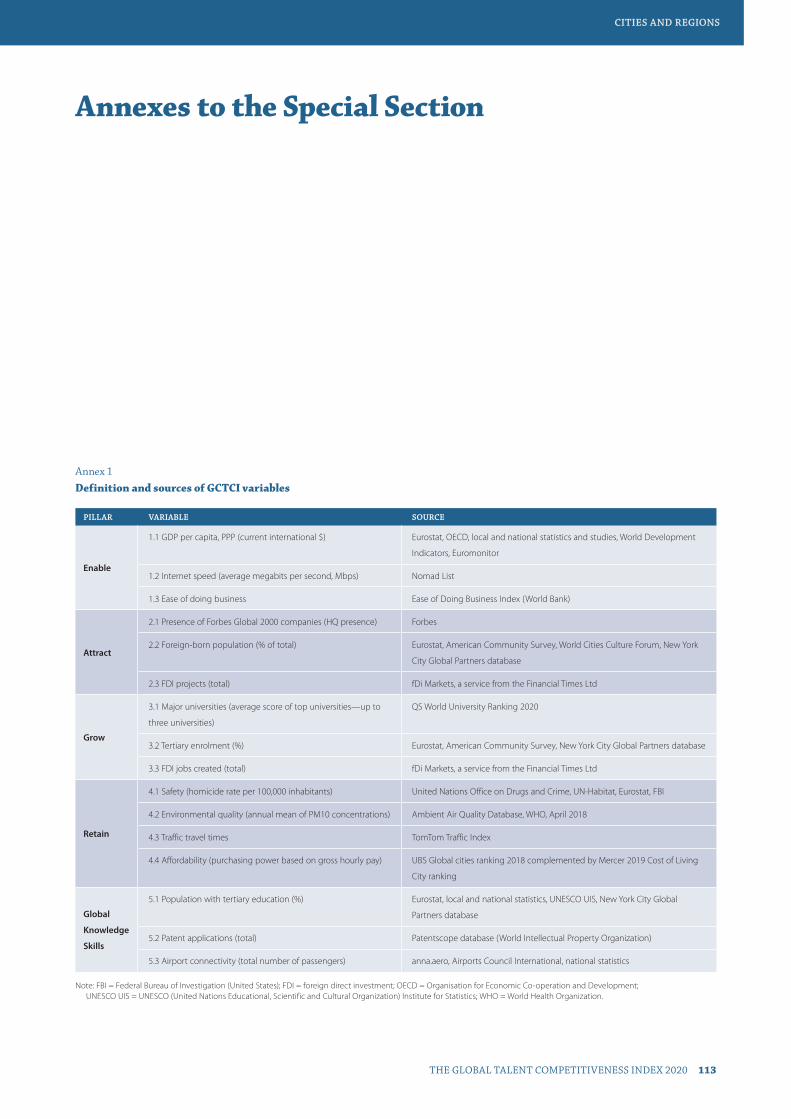
Annexes to the Special Section
Annex 1Definition and sources of GCTCI variables
PILLAR VARIABLE SOURCE
Enable
1.1 GDP per capita, PPP (current international $) Eurostat, OECD, local and national statistics and studies, World Development
Indicators, Euromonitor
1.2 Internet speed (average megabits per second, Mbps) Nomad List
1.3 Ease of doing business Ease of Doing Business Index (World Bank)
Attract
2.1 Presence of Forbes Global 2000 companies (HQ presence) Forbes
2.2 Foreign-born population (% of total) Eurostat, American Community Survey, World Cities Culture Forum, New York
City Global Partners database
2.3 FDI projects (total) fDi Markets, a service from the Financial Times Ltd
Grow
3.1 Major universities (average score of top universities—up to
three universities)
QS World University Ranking 2020
3.2 Tertiary enrolment (%) Eurostat, American Community Survey, New York City Global Partners database
3.3 FDI jobs created (total) fDi Markets, a service from the Financial Times Ltd
Retain
4.1 Safety (homicide rate per 100,000 inhabitants) United Nations Office on Drugs and Crime, UN-Habitat, Eurostat, FBI
4.2 Environmental quality (annual mean of PM10 concentrations) Ambient Air Quality Database, WHO, April 2018
4.3 Traffic travel times TomTom Traffic Index
4.4 Affordability (purchasing power based on gross hourly pay) UBS Global cities ranking 2018 complemented by Mercer 2019 Cost of Living
City ranking
Global
Knowledge
Skills
5.1 Population with tertiary education (%) Eurostat, local and national statistics, UNESCO UIS, New York City Global
Partners database
5.2 Patent applications (total) Patentscope database (World Intellectual Property Organization)
5.3 Airport connectivity (total number of passengers) anna.aero, Airports Council International, national statistics
Note: FBI = Federal Bureau of Investigation (United States); FDI = foreign direct investment; OECD = Organisation for Economic Co-operation and Development; UNESCO UIS = UNESCO (United Nations Educational, Scientific and Cultural Organization) Institute for Statistics; WHO = World Health Organization.
CITIES AND REGIONS
THE GLOBAL TALENT COMPETITIVENESS INDEX 2020 113

1. ENABLE 2. ATTRACT 3. GROW 4. RETAIN 5. GLOBAL KNOWLEDGE SKILLS
Rank City
GCTCI
OVERALL1.1
GDP per capita1.2
Internet speed
1.3 Ease of doing
business
2.1 Presence of
Forbes Global 2000 companies
2.2 Foreign-born
population2.3
FDI projects
3.1 Major
universities
3.2 Tertiary
enrolment
3.3 FDI jobs created
4.1 Safety
4.2 Environmental
quality
4.3 Traffic travel
times4.4
Affordability
5.1 Tertiary educated
population
5.2 Patent
applications
5.3 Airport
connectivity
1 New York 73.7 60.4 38.8 95.9 90.3 46.8 100.0 99.3 28.7 96.1 79.3 98.4 53.7 78.4 64.2 74.7 77.3
2 London 71.7 45.3 20.0 91.5 85.2 46.7 100.0 100.0 15.2 95.7 93.9 93.6 51.9 55.7 84.8 69.6 100.0
3 Singapore 71.4 67.5 100.0 98.5 57.0 37.1 100.0 77.4 13.0 100.0 99.0 89.8 63.0 n/a 68.8 64.4 36.3
4 San Francisco 68.1 72.8 53.8 92.8 81.3 42.4 50.0 71.5 33.9 82.0 73.7 97.3 57.4 85.1 80.5 77.7 47.5
5 Boston 66.8 62.8 50.0 92.8 55.7 35.4 40.7 99.8 65.5 79.9 59.1 98.4 74.1 85.1 77.4 78.4 25.8
6 Hong Kong 66.4 42.4 53.8 96.1 82.7 50.5 100.0 89.2 15.2 95.4 98.0 87.7 61.1 60.2 34.2 63.6 42.5
7 Paris 65.7 50.4 30.0 74.2 80.6 31.3 100.0 77.5 26.7 86.3 90.4 90.9 53.7 56.9 74.8 72.9 61.4
8 Tokyo 65.7 51.0 27.5 76.8 100.0 4.0 63.7 73.9 22.0 87.9 98.5 86.6 44.4 60.8 n/a 100.0 73.6
9 Los Angeles 62.8 54.5 33.8 88.1 57.0 47.3 52.0 85.5 35.6 81.8 64.1 92.5 44.4 97.5 53.5 71.5 57.0
10 Munich 61.9 57.8 31.3 81.7 48.2 34.4 57.4 79.0 33.5 77.8 94.9 95.2 64.8 81.9 73.1 75.3 25.9
11 Sydney 61.2 38.9 18.8 85.6 63.0 54.6 62.3 76.5 28.7 85.3 94.4 96.8 57.4 68.0 94.6 47.7 25.2
12 Toronto 60.2 36.1 36.3 81.4 61.2 59.9 42.2 43.4 28.7 84.3 92.9 97.3 61.1 84.5 92.4 58.4 27.4
13 Dublin 60.1 65.0 73.8 81.4 60.2 27.8 56.4 48.6 22.5 87.5 89.9 98.9 37.0 68.7 85.3 55.4 17.2
14 Chicago 60.0 50.0 38.8 92.8 73.2 25.3 54.4 79.2 30.4 84.9 11.6 94.1 68.5 75.5 59.9 63.8 59.7
15 Copenhagen 59.7 44.5 47.5 96.1 49.9 n/a 27.0 67.5 51.0 70.8 96.0 93.0 81.5 74.6 80.2 47.1 16.9
16 Seattle 59.6 61.8 32.5 92.8 48.2 24.9 26.0 75.6 41.7 75.2 78.3 99.5 63.0 85.1 68.3 75.2 27.3
17 Zurich 58.8 52.6 31.3 73.7 63.0 52.3 17.2 90.0 83.8 67.2 94.9 97.3 63.0 88.0 n/a 45.6 17.0
18 Stockholm 57.9 48.8 47.5 87.6 65.5 31.3 15.7 59.7 24.2 66.5 96.5 95.2 72.2 75.3 82.2 66.3 18.2
19 Houston 57.5 50.1 42.5 92.8 63.9 37.7 43.1 44.9 28.1 80.6 40.4 92.5 77.8 85.1 51.0 74.3 31.5
20 Amsterdam 57.3 45.7 23.8 72.4 48.2 37.2 58.8 61.4 26.7 82.5 88.9 94.7 75.9 69.9 68.2 46.9 40.0
21 Melbourne 56.8 29.1 16.3 85.6 49.9 43.2 46.6 70.4 16.5 88.8 94.4 95.7 66.7 68.0 97.7 44.1 20.7
22 Seoul 56.7 30.4 20.0 92.8 82.7 4.9 30.4 75.7 17.0 82.1 96.5 80.2 n/a 31.2 n/a 87.4 50.9
23 Atlanta 56.4 44.3 36.3 92.8 53.0 9.6 44.6 48.5 49.4 86.3 10.6 93.6 72.2 85.1 61.4 63.2 60.7
24 Madrid 56.4 35.1 35.0 77.1 54.4 26.7 58.3 45.3 28.0 85.1 97.0 95.7 79.6 58.6 74.3 47.6 31.1
25 Washington, DC 56.2 59.1 32.5 92.8 61.2 17.4 25.5 65.4 42.1 73.0 0.0 97.9 68.5 85.1 81.5 60.8 42.7
26 Dallas 56.1 48.7 41.3 92.8 63.9 31.3 37.7 22.1 20.9 80.9 42.4 96.8 87.0 85.1 55.0 64.5 48.3
27 Miami 55.9 38.0 32.5 92.8 49.9 73.7 34.3 23.1 27.4 81.3 51.0 97.3 64.8 88.9 51.0 59.2 48.4
28 Barcelona 55.8 30.7 46.3 74.2 39.1 30.6 55.9 47.5 48.0 87.5 96.5 93.0 66.7 63.9 67.7 42.5 27.5
29 Montreal 55.8 28.2 33.8 81.4 53.0 42.2 18.1 58.5 32.7 76.5 93.9 97.9 70.4 77.9 96.7 49.8 10.5
30 Vancouver 54.7 30.6 27.5 81.4 32.3 60.0 12.7 59.9 40.1 76.0 90.4 99.5 50.0 81.2 91.9 53.7 14.0
31 Helsinki 54.6 40.6 31.3 83.0 46.3 17.6 35.3 61.7 42.1 71.5 92.9 94.7 83.3 62.9 82.2 46.9 10.9
32 Shanghai 54.0 25.0 1.3 76.5 70.3 0.5 98.5 69.0 13.3 97.9 99.2 74.3 59.3 17.6 32.5 71.3 65.4
33 Denver 53.9 49.0 47.5 92.8 48.2 17.8 29.4 25.6 27.8 76.3 54.5 96.8 79.6 85.1 70.3 50.8 35.8
34 Geneva 53.9 55.8 41.3 73.7 36.0 73.3 9.8 64.7 48.9 62.8 94.9 96.3 59.3 92.2 n/a 46.5 10.0
35 Beijing 52.9 25.5 1.3 77.8 84.6 0.2 43.6 77.4 n/a 89.9 99.2 56.7 46.3 16.3 4.5 81.3 59.4
36 Vienna 52.6 39.1 46.3 79.1 39.1 40.9 20.6 52.2 39.9 73.7 97.5 95.7 70.4 85.4 n/a 50.3 14.1
37 Dusseldorf 52.2 51.9 28.8 81.7 39.1 37.8 43.6 16.3 34.8 73.0 97.1 94.1 81.5 80.3 51.8 45.2 14.3
38 Osaka 51.8 49.2 25.0 78.4 63.9 2.7 4.9 39.2 n/a 68.8 98.5 86.1 53.7 60.8 n/a 85.9 25.4
39 Berlin 51.7 29.9 32.5 81.7 27.8 18.3 52.9 58.7 19.9 79.1 92.9 93.6 63.0 75.7 59.8 51.9 19.4
40 Brussels 51.7 45.4 42.5 69.6 41.8 57.7 17.6 45.7 36.5 71.4 83.8 92.0 51.9 54.2 73.3 43.2 18.9
41 Milan 51.2 44.8 17.5 64.2 48.2 41.0 29.9 40.0 59.1 80.7 95.5 86.6 64.8 51.0 40.3 53.0 25.6
42 Philadelphia 51.1 51.0 43.8 92.8 57.0 18.5 15.2 49.9 33.4 70.1 0.0 95.2 75.9 85.1 59.3 66.9 17.2
43 Brisbane 51.1 29.5 17.5 85.6 22.0 n/a 13.2 55.5 n/a 75.7 n/a 97.9 74.1 68.0 96.5 34.2 13.4
44 Oslo 51.0 48.0 42.5 89.2 41.8 31.3 6.9 60.9 30.6 61.4 97.0 96.3 81.5 72.7 n/a 44.9 15.9
45 Edinburgh 50.9 36.4 23.8 91.5 22.0 26.4 14.7 66.6 44.6 71.4 96.0 100.0 46.3 55.7 88.8 46.1 7.7
46 Taipei 50.8 41.6 25.0 84.8 70.9 1.8 17.6 51.9 41.3 78.0 n/a 90.9 57.4 47.6 79.2 44.1 29.6
47 Warsaw 50.3 44.0 35.0 73.2 39.1 2.3 40.2 24.2 70.2 93.1 97.5 88.2 48.1 32.7 88.5 35.6 9.8
48 Gothenburg 49.6 34.9 40.0 87.6 27.8 33.1 3.4 50.8 30.1 59.7 93.7 96.3 87.0 75.3 67.0 41.6 3.8
49 Luxembourg 49.4 74.9 37.5 55.7 41.8 n/a 12.3 0.0 n/a 67.4 95.5 95.2 59.3 100.0 69.2 57.6 1.9
50 Hamburg 49.4 43.4 27.5 81.7 22.0 30.3 36.8 44.5 22.5 74.0 96.5 95.7 59.3 80.3 48.5 50.7 10.2
51 Dubai 49.3 42.5 10.0 84.8 36.0 n/a 100.0 22.9 3.9 93.2 95.5 25.7 77.8 40.3 14.6 32.5 51.5
52 Ottawa 48.8 32.3 27.5 81.4 0.0 27.8 3.9 29.4 70.8 63.5 n/a 99.5 70.4 81.2 100.0 41.6 2.7
Annex 2GCTCI rankings and scores: Overall and by variable
CITIES AND REGIONSSPECIAL SECTION
114 THE GLOBAL TALENT COMPETITIVENESS INDEX 2020

(continued on next page)
1. ENABLE 2. ATTRACT 3. GROW 4. RETAIN 5. GLOBAL KNOWLEDGE SKILLS
Rank City
GCTCI
OVERALL1.1
GDP per capita1.2
Internet speed
1.3 Ease of doing
business
2.1 Presence of
Forbes Global 2000 companies
2.2 Foreign-born
population2.3
FDI projects
3.1 Major
universities
3.2 Tertiary
enrolment
3.3 FDI jobs created
4.1 Safety
4.2 Environmental
quality
4.3 Traffic travel
times4.4
Affordability
5.1 Tertiary educated
population
5.2 Patent
applications
5.3 Airport
connectivity
1 New York 73.7 60.4 38.8 95.9 90.3 46.8 100.0 99.3 28.7 96.1 79.3 98.4 53.7 78.4 64.2 74.7 77.3
2 London 71.7 45.3 20.0 91.5 85.2 46.7 100.0 100.0 15.2 95.7 93.9 93.6 51.9 55.7 84.8 69.6 100.0
3 Singapore 71.4 67.5 100.0 98.5 57.0 37.1 100.0 77.4 13.0 100.0 99.0 89.8 63.0 n/a 68.8 64.4 36.3
4 San Francisco 68.1 72.8 53.8 92.8 81.3 42.4 50.0 71.5 33.9 82.0 73.7 97.3 57.4 85.1 80.5 77.7 47.5
5 Boston 66.8 62.8 50.0 92.8 55.7 35.4 40.7 99.8 65.5 79.9 59.1 98.4 74.1 85.1 77.4 78.4 25.8
6 Hong Kong 66.4 42.4 53.8 96.1 82.7 50.5 100.0 89.2 15.2 95.4 98.0 87.7 61.1 60.2 34.2 63.6 42.5
7 Paris 65.7 50.4 30.0 74.2 80.6 31.3 100.0 77.5 26.7 86.3 90.4 90.9 53.7 56.9 74.8 72.9 61.4
8 Tokyo 65.7 51.0 27.5 76.8 100.0 4.0 63.7 73.9 22.0 87.9 98.5 86.6 44.4 60.8 n/a 100.0 73.6
9 Los Angeles 62.8 54.5 33.8 88.1 57.0 47.3 52.0 85.5 35.6 81.8 64.1 92.5 44.4 97.5 53.5 71.5 57.0
10 Munich 61.9 57.8 31.3 81.7 48.2 34.4 57.4 79.0 33.5 77.8 94.9 95.2 64.8 81.9 73.1 75.3 25.9
11 Sydney 61.2 38.9 18.8 85.6 63.0 54.6 62.3 76.5 28.7 85.3 94.4 96.8 57.4 68.0 94.6 47.7 25.2
12 Toronto 60.2 36.1 36.3 81.4 61.2 59.9 42.2 43.4 28.7 84.3 92.9 97.3 61.1 84.5 92.4 58.4 27.4
13 Dublin 60.1 65.0 73.8 81.4 60.2 27.8 56.4 48.6 22.5 87.5 89.9 98.9 37.0 68.7 85.3 55.4 17.2
14 Chicago 60.0 50.0 38.8 92.8 73.2 25.3 54.4 79.2 30.4 84.9 11.6 94.1 68.5 75.5 59.9 63.8 59.7
15 Copenhagen 59.7 44.5 47.5 96.1 49.9 n/a 27.0 67.5 51.0 70.8 96.0 93.0 81.5 74.6 80.2 47.1 16.9
16 Seattle 59.6 61.8 32.5 92.8 48.2 24.9 26.0 75.6 41.7 75.2 78.3 99.5 63.0 85.1 68.3 75.2 27.3
17 Zurich 58.8 52.6 31.3 73.7 63.0 52.3 17.2 90.0 83.8 67.2 94.9 97.3 63.0 88.0 n/a 45.6 17.0
18 Stockholm 57.9 48.8 47.5 87.6 65.5 31.3 15.7 59.7 24.2 66.5 96.5 95.2 72.2 75.3 82.2 66.3 18.2
19 Houston 57.5 50.1 42.5 92.8 63.9 37.7 43.1 44.9 28.1 80.6 40.4 92.5 77.8 85.1 51.0 74.3 31.5
20 Amsterdam 57.3 45.7 23.8 72.4 48.2 37.2 58.8 61.4 26.7 82.5 88.9 94.7 75.9 69.9 68.2 46.9 40.0
21 Melbourne 56.8 29.1 16.3 85.6 49.9 43.2 46.6 70.4 16.5 88.8 94.4 95.7 66.7 68.0 97.7 44.1 20.7
22 Seoul 56.7 30.4 20.0 92.8 82.7 4.9 30.4 75.7 17.0 82.1 96.5 80.2 n/a 31.2 n/a 87.4 50.9
23 Atlanta 56.4 44.3 36.3 92.8 53.0 9.6 44.6 48.5 49.4 86.3 10.6 93.6 72.2 85.1 61.4 63.2 60.7
24 Madrid 56.4 35.1 35.0 77.1 54.4 26.7 58.3 45.3 28.0 85.1 97.0 95.7 79.6 58.6 74.3 47.6 31.1
25 Washington, DC 56.2 59.1 32.5 92.8 61.2 17.4 25.5 65.4 42.1 73.0 0.0 97.9 68.5 85.1 81.5 60.8 42.7
26 Dallas 56.1 48.7 41.3 92.8 63.9 31.3 37.7 22.1 20.9 80.9 42.4 96.8 87.0 85.1 55.0 64.5 48.3
27 Miami 55.9 38.0 32.5 92.8 49.9 73.7 34.3 23.1 27.4 81.3 51.0 97.3 64.8 88.9 51.0 59.2 48.4
28 Barcelona 55.8 30.7 46.3 74.2 39.1 30.6 55.9 47.5 48.0 87.5 96.5 93.0 66.7 63.9 67.7 42.5 27.5
29 Montreal 55.8 28.2 33.8 81.4 53.0 42.2 18.1 58.5 32.7 76.5 93.9 97.9 70.4 77.9 96.7 49.8 10.5
30 Vancouver 54.7 30.6 27.5 81.4 32.3 60.0 12.7 59.9 40.1 76.0 90.4 99.5 50.0 81.2 91.9 53.7 14.0
31 Helsinki 54.6 40.6 31.3 83.0 46.3 17.6 35.3 61.7 42.1 71.5 92.9 94.7 83.3 62.9 82.2 46.9 10.9
32 Shanghai 54.0 25.0 1.3 76.5 70.3 0.5 98.5 69.0 13.3 97.9 99.2 74.3 59.3 17.6 32.5 71.3 65.4
33 Denver 53.9 49.0 47.5 92.8 48.2 17.8 29.4 25.6 27.8 76.3 54.5 96.8 79.6 85.1 70.3 50.8 35.8
34 Geneva 53.9 55.8 41.3 73.7 36.0 73.3 9.8 64.7 48.9 62.8 94.9 96.3 59.3 92.2 n/a 46.5 10.0
35 Beijing 52.9 25.5 1.3 77.8 84.6 0.2 43.6 77.4 n/a 89.9 99.2 56.7 46.3 16.3 4.5 81.3 59.4
36 Vienna 52.6 39.1 46.3 79.1 39.1 40.9 20.6 52.2 39.9 73.7 97.5 95.7 70.4 85.4 n/a 50.3 14.1
37 Dusseldorf 52.2 51.9 28.8 81.7 39.1 37.8 43.6 16.3 34.8 73.0 97.1 94.1 81.5 80.3 51.8 45.2 14.3
38 Osaka 51.8 49.2 25.0 78.4 63.9 2.7 4.9 39.2 n/a 68.8 98.5 86.1 53.7 60.8 n/a 85.9 25.4
39 Berlin 51.7 29.9 32.5 81.7 27.8 18.3 52.9 58.7 19.9 79.1 92.9 93.6 63.0 75.7 59.8 51.9 19.4
40 Brussels 51.7 45.4 42.5 69.6 41.8 57.7 17.6 45.7 36.5 71.4 83.8 92.0 51.9 54.2 73.3 43.2 18.9
41 Milan 51.2 44.8 17.5 64.2 48.2 41.0 29.9 40.0 59.1 80.7 95.5 86.6 64.8 51.0 40.3 53.0 25.6
42 Philadelphia 51.1 51.0 43.8 92.8 57.0 18.5 15.2 49.9 33.4 70.1 0.0 95.2 75.9 85.1 59.3 66.9 17.2
43 Brisbane 51.1 29.5 17.5 85.6 22.0 n/a 13.2 55.5 n/a 75.7 n/a 97.9 74.1 68.0 96.5 34.2 13.4
44 Oslo 51.0 48.0 42.5 89.2 41.8 31.3 6.9 60.9 30.6 61.4 97.0 96.3 81.5 72.7 n/a 44.9 15.9
45 Edinburgh 50.9 36.4 23.8 91.5 22.0 26.4 14.7 66.6 44.6 71.4 96.0 100.0 46.3 55.7 88.8 46.1 7.7
46 Taipei 50.8 41.6 25.0 84.8 70.9 1.8 17.6 51.9 41.3 78.0 n/a 90.9 57.4 47.6 79.2 44.1 29.6
47 Warsaw 50.3 44.0 35.0 73.2 39.1 2.3 40.2 24.2 70.2 93.1 97.5 88.2 48.1 32.7 88.5 35.6 9.8
48 Gothenburg 49.6 34.9 40.0 87.6 27.8 33.1 3.4 50.8 30.1 59.7 93.7 96.3 87.0 75.3 67.0 41.6 3.8
49 Luxembourg 49.4 74.9 37.5 55.7 41.8 n/a 12.3 0.0 n/a 67.4 95.5 95.2 59.3 100.0 69.2 57.6 1.9
50 Hamburg 49.4 43.4 27.5 81.7 22.0 30.3 36.8 44.5 22.5 74.0 96.5 95.7 59.3 80.3 48.5 50.7 10.2
51 Dubai 49.3 42.5 10.0 84.8 36.0 n/a 100.0 22.9 3.9 93.2 95.5 25.7 77.8 40.3 14.6 32.5 51.5
52 Ottawa 48.8 32.3 27.5 81.4 0.0 27.8 3.9 29.4 70.8 63.5 n/a 99.5 70.4 81.2 100.0 41.6 2.7
CITIES AND REGIONS
THE GLOBAL TALENT COMPETITIVENESS INDEX 2020 115
SPECIAL SECTION
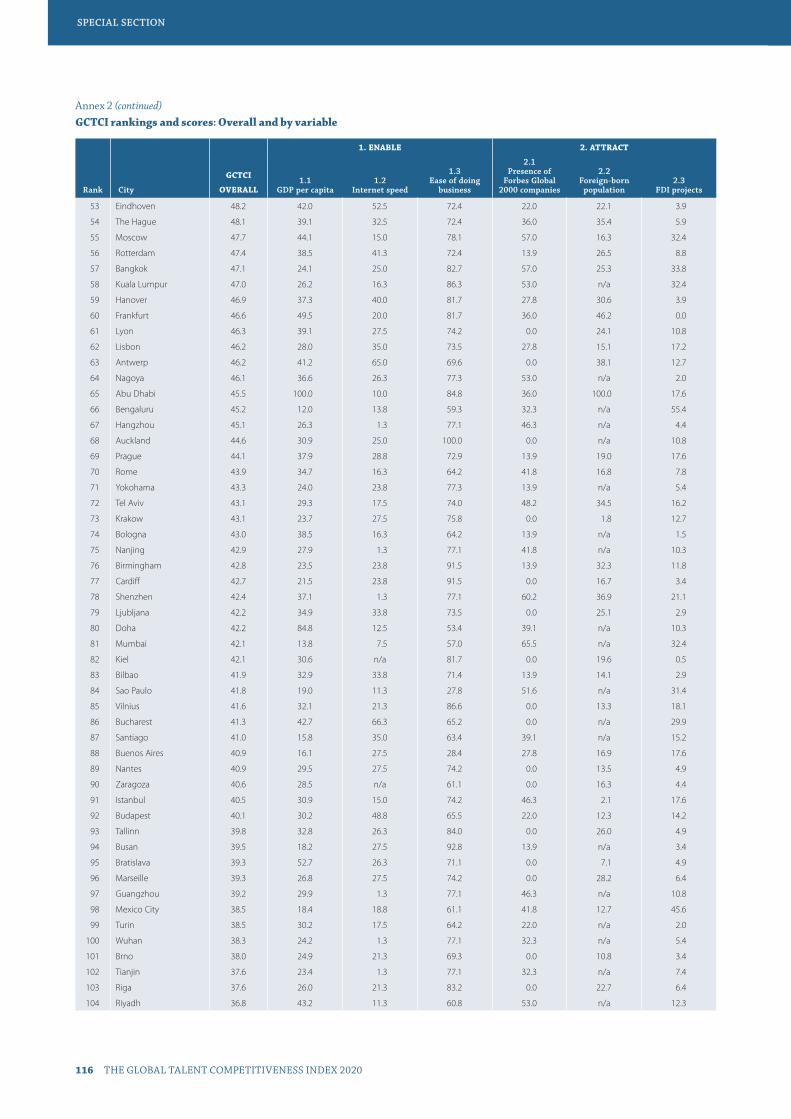
1. ENABLE 2. ATTRACT 3. GROW 4. RETAIN 5. GLOBAL KNOWLEDGE SKILLS
Rank City
GCTCI
OVERALL1.1
GDP per capita1.2
Internet speed
1.3 Ease of doing
business
2.1 Presence of
Forbes Global 2000 companies
2.2 Foreign-born
population2.3
FDI projects
3.1 Major
universities
3.2 Tertiary
enrolment
3.3 FDI jobs created
4.1 Safety
4.2 Environmental
quality
4.3 Traffic travel
times4.4
Affordability
5.1 Tertiary educated
population
5.2 Patent
applications
5.3 Airport
connectivity
53 Eindhoven 48.2 42.0 52.5 72.4 22.0 22.1 3.9 49.3 25.0 56.0 n/a 95.7 81.5 69.9 59.8 67.6 3.2
54 The Hague 48.1 39.1 32.5 72.4 36.0 35.4 5.9 61.7 17.4 58.1 93.9 95.2 68.5 69.9 69.2 48.0 0.5
55 Moscow 47.7 44.1 15.0 78.1 57.0 16.3 32.4 49.2 n/a 91.4 73.7 90.9 16.7 17.7 19.5 46.1 47.0
56 Rotterdam 47.4 38.5 41.3 72.4 13.9 26.5 8.8 67.0 20.3 64.8 93.4 95.2 77.8 69.9 54.3 50.0 0.5
57 Bangkok 47.1 24.1 25.0 82.7 57.0 25.3 33.8 33.8 47.1 91.1 86.4 84.0 22.2 18.1 n/a 27.5 57.9
58 Kuala Lumpur 47.0 26.2 16.3 86.3 53.0 n/a 32.4 60.8 n/a 87.5 77.8 80.7 53.7 23.0 n/a 24.3 8.1
59 Hanover 46.9 37.3 40.0 81.7 27.8 30.6 3.9 19.5 35.2 60.6 95.0 95.7 79.6 80.3 46.9 53.7 3.3
60 Frankfurt 46.6 49.5 20.0 81.7 36.0 46.2 0.0 40.0 36.1 0.0 95.7 95.2 72.2 83.2 53.2 39.3 37.6
61 Lyon 46.3 39.1 27.5 74.2 0.0 24.1 10.8 33.3 60.4 63.9 94.9 94.1 66.7 64.3 72.5 42.8 5.9
62 Lisbon 46.2 28.0 35.0 73.5 27.8 15.1 17.2 26.3 96.6 76.8 97.5 92.0 61.1 31.6 50.5 19.8 15.5
63 Antwerp 46.2 41.2 65.0 69.6 0.0 38.1 12.7 45.5 41.2 67.9 89.4 93.6 63.0 54.2 61.4 25.4 0.0
64 Nagoya 46.1 36.6 26.3 77.3 53.0 n/a 2.0 37.5 n/a 68.3 n/a 87.7 61.1 60.8 n/a 60.3 6.6
65 Abu Dhabi 45.5 100.0 10.0 84.8 36.0 100.0 17.6 26.0 14.4 78.6 n/a 25.7 100.0 40.3 22.7 15.3 11.4
66 Bengaluru 45.2 12.0 13.8 59.3 32.3 n/a 55.4 51.1 n/a 99.7 83.8 54.5 n/a 4.1 n/a 46.8 14.5
67 Hangzhou 45.1 26.3 1.3 77.1 46.3 n/a 4.4 80.6 n/a 74.9 n/a 49.7 70.4 16.9 n/a 62.6 20.7
68 Auckland 44.6 30.9 25.0 100.0 0.0 n/a 10.8 49.8 n/a 71.6 96.5 98.4 66.7 56.9 n/a 39.6 11.3
69 Prague 44.1 37.9 28.8 72.9 13.9 19.0 17.6 33.3 38.7 81.4 96.5 93.6 70.4 28.5 54.2 38.3 8.9
70 Rome 43.9 34.7 16.3 64.2 41.8 16.8 7.8 29.0 29.3 71.3 96.5 91.4 48.1 69.0 44.1 46.8 27.5
71 Yokohama 43.3 24.0 23.8 77.3 13.9 n/a 5.4 22.1 n/a 65.8 98.5 87.2 n/a 60.8 n/a 64.4 13.5
72 Tel Aviv 43.1 29.3 17.5 74.0 48.2 34.5 16.2 35.0 18.8 73.0 76.8 71.7 42.6 48.2 57.5 50.9 12.0
73 Krakow 43.1 23.7 27.5 75.8 0.0 1.8 12.7 20.4 100.0 81.5 98.5 83.4 46.3 32.7 75.1 28.3 3.3
74 Bologna 43.0 38.5 16.3 64.2 13.9 n/a 1.5 51.9 69.8 58.5 n/a 93.0 74.1 60.0 45.3 45.6 4.6
75 Nanjing 42.9 27.9 1.3 77.1 41.8 n/a 10.3 43.6 n/a 87.2 n/a 60.4 64.8 16.9 n/a 63.6 16.6
76 Birmingham 42.8 23.5 23.8 91.5 13.9 32.3 11.8 37.7 28.0 71.4 n/a 97.3 68.5 55.7 49.5 29.9 7.4
77 Cardiff 42.7 21.5 23.8 91.5 0.0 16.7 3.4 54.6 49.3 65.9 n/a 98.4 68.5 55.7 64.4 26.5 0.7
78 Shenzhen 42.4 37.1 1.3 77.1 60.2 36.9 21.1 17.7 4.7 84.9 n/a 83.4 53.7 16.9 24.8 89.8 26.6
79 Ljubljana 42.2 34.9 33.8 73.5 0.0 25.1 2.9 22.7 62.5 56.9 98.0 92.0 77.8 42.8 66.0 21.5 0.8
80 Doha 42.2 84.8 12.5 53.4 39.1 n/a 10.3 39.9 n/a 71.8 97.5 47.1 n/a 35.4 n/a 19.8 20.5
81 Mumbai 42.1 13.8 7.5 57.0 65.5 n/a 32.4 33.9 n/a 88.9 95.5 50.3 0.0 3.3 n/a 46.6 27.5
82 Kiel 42.1 30.6 n/a 81.7 0.0 19.6 0.5 27.6 57.0 19.1 97.7 95.7 81.5 80.3 48.2 0.0 n/a
83 Bilbao 41.9 32.9 33.8 71.4 13.9 14.1 2.9 19.5 23.7 55.8 97.8 97.9 96.3 61.3 77.6 15.3 2.8
84 Sao Paulo 41.8 19.0 11.3 27.8 51.6 n/a 31.4 46.0 32.6 82.2 62.6 90.9 42.6 33.9 n/a 40.5 33.5
85 Vilnius 41.6 32.1 21.3 86.6 0.0 13.3 18.1 25.6 40.8 79.8 80.3 91.4 64.8 26.7 86.6 19.8 2.0
86 Bucharest 41.3 42.7 66.3 65.2 0.0 n/a 29.9 12.9 32.7 97.1 96.0 89.3 31.5 25.8 56.6 12.1 7.3
87 Santiago 41.0 15.8 35.0 63.4 39.1 n/a 15.2 45.6 n/a 73.9 80.3 70.1 46.3 31.4 n/a 33.6 12.4
88 Buenos Aires 40.9 16.1 27.5 28.4 27.8 16.9 17.6 47.0 68.5 79.6 76.3 91.4 53.7 23.3 54.2 33.6 13.3
89 Nantes 40.9 29.5 27.5 74.2 0.0 13.5 4.9 12.9 54.8 55.5 97.9 96.3 72.2 60.6 63.4 29.2 3.1
90 Zaragoza 40.6 28.5 n/a 61.1 0.0 16.3 4.4 29.7 19.9 61.6 95.3 95.2 94.4 61.3 62.6 19.8 0.1
91 Istanbul 40.5 30.9 15.0 74.2 46.3 2.1 17.6 24.4 n/a 73.1 85.9 85.6 22.2 15.4 11.6 50.9 55.5
92 Budapest 40.1 30.2 48.8 65.5 22.0 12.3 14.2 15.1 23.3 80.4 88.9 90.9 55.6 22.4 55.1 33.6 7.5
93 Tallinn 39.8 32.8 26.3 84.0 0.0 26.0 4.9 17.2 23.7 64.1 86.9 99.5 64.8 29.6 81.7 24.3 1.4
94 Busan 39.5 18.2 27.5 92.8 13.9 n/a 3.4 25.2 n/a 63.9 97.5 82.4 n/a 31.2 n/a 46.1 9.4
95 Bratislava 39.3 52.7 26.3 71.1 0.0 7.1 4.9 16.3 51.0 76.7 82.3 93.6 59.3 19.8 68.7 23.0 1.0
96 Marseille 39.3 26.8 27.5 74.2 0.0 28.2 6.4 27.1 24.2 58.3 82.3 92.0 55.6 60.6 56.1 37.9 5.1
97 Guangzhou 39.2 29.9 1.3 77.1 46.3 n/a 10.8 33.2 38.2 84.7 n/a 75.9 42.6 16.9 0.0 64.7 38.4
98 Mexico City 38.5 18.4 18.8 61.1 41.8 12.7 45.6 36.9 n/a 85.1 38.4 85.0 24.1 6.0 n/a 28.3 26.0
99 Turin 38.5 30.2 17.5 64.2 22.0 n/a 2.0 29.5 43.3 55.2 n/a 87.7 75.9 60.0 32.7 42.5 2.3
100 Wuhan 38.3 24.2 1.3 77.1 32.3 n/a 5.4 28.6 n/a 82.2 n/a 56.7 61.1 16.9 n/a 63.1 13.4
101 Brno 38.0 24.9 21.3 69.3 0.0 10.8 3.4 21.8 68.5 65.9 96.2 93.6 70.4 28.5 43.3 24.3 0.1
102 Tianjin 37.6 23.4 1.3 77.1 32.3 n/a 7.4 31.6 n/a 85.5 n/a 50.8 70.4 16.9 n/a 47.3 12.1
103 Riga 37.6 26.0 21.3 83.2 0.0 22.7 6.4 14.5 42.9 74.4 75.8 92.0 75.9 19.8 63.6 7.7 3.4
104 Riyadh 36.8 43.2 11.3 60.8 53.0 n/a 12.3 39.2 n/a 74.0 n/a 0.0 77.8 43.5 n/a 21.5 10.7
Annex 2 (continued)GCTCI rankings and scores: Overall and by variable
CITIES AND REGIONSSPECIAL SECTION
116 THE GLOBAL TALENT COMPETITIVENESS INDEX 2020
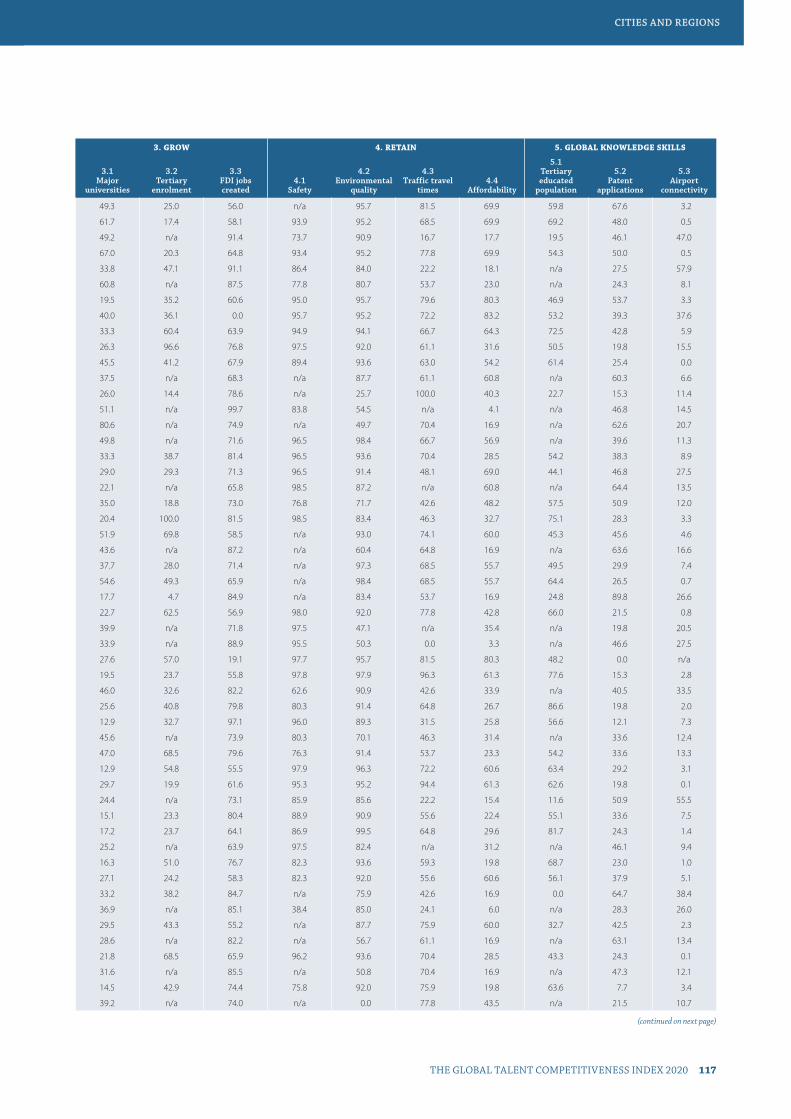
1. ENABLE 2. ATTRACT 3. GROW 4. RETAIN 5. GLOBAL KNOWLEDGE SKILLS
Rank City
GCTCI
OVERALL1.1
GDP per capita1.2
Internet speed
1.3 Ease of doing
business
2.1 Presence of
Forbes Global 2000 companies
2.2 Foreign-born
population2.3
FDI projects
3.1 Major
universities
3.2 Tertiary
enrolment
3.3 FDI jobs created
4.1 Safety
4.2 Environmental
quality
4.3 Traffic travel
times4.4
Affordability
5.1 Tertiary educated
population
5.2 Patent
applications
5.3 Airport
connectivity
53 Eindhoven 48.2 42.0 52.5 72.4 22.0 22.1 3.9 49.3 25.0 56.0 n/a 95.7 81.5 69.9 59.8 67.6 3.2
54 The Hague 48.1 39.1 32.5 72.4 36.0 35.4 5.9 61.7 17.4 58.1 93.9 95.2 68.5 69.9 69.2 48.0 0.5
55 Moscow 47.7 44.1 15.0 78.1 57.0 16.3 32.4 49.2 n/a 91.4 73.7 90.9 16.7 17.7 19.5 46.1 47.0
56 Rotterdam 47.4 38.5 41.3 72.4 13.9 26.5 8.8 67.0 20.3 64.8 93.4 95.2 77.8 69.9 54.3 50.0 0.5
57 Bangkok 47.1 24.1 25.0 82.7 57.0 25.3 33.8 33.8 47.1 91.1 86.4 84.0 22.2 18.1 n/a 27.5 57.9
58 Kuala Lumpur 47.0 26.2 16.3 86.3 53.0 n/a 32.4 60.8 n/a 87.5 77.8 80.7 53.7 23.0 n/a 24.3 8.1
59 Hanover 46.9 37.3 40.0 81.7 27.8 30.6 3.9 19.5 35.2 60.6 95.0 95.7 79.6 80.3 46.9 53.7 3.3
60 Frankfurt 46.6 49.5 20.0 81.7 36.0 46.2 0.0 40.0 36.1 0.0 95.7 95.2 72.2 83.2 53.2 39.3 37.6
61 Lyon 46.3 39.1 27.5 74.2 0.0 24.1 10.8 33.3 60.4 63.9 94.9 94.1 66.7 64.3 72.5 42.8 5.9
62 Lisbon 46.2 28.0 35.0 73.5 27.8 15.1 17.2 26.3 96.6 76.8 97.5 92.0 61.1 31.6 50.5 19.8 15.5
63 Antwerp 46.2 41.2 65.0 69.6 0.0 38.1 12.7 45.5 41.2 67.9 89.4 93.6 63.0 54.2 61.4 25.4 0.0
64 Nagoya 46.1 36.6 26.3 77.3 53.0 n/a 2.0 37.5 n/a 68.3 n/a 87.7 61.1 60.8 n/a 60.3 6.6
65 Abu Dhabi 45.5 100.0 10.0 84.8 36.0 100.0 17.6 26.0 14.4 78.6 n/a 25.7 100.0 40.3 22.7 15.3 11.4
66 Bengaluru 45.2 12.0 13.8 59.3 32.3 n/a 55.4 51.1 n/a 99.7 83.8 54.5 n/a 4.1 n/a 46.8 14.5
67 Hangzhou 45.1 26.3 1.3 77.1 46.3 n/a 4.4 80.6 n/a 74.9 n/a 49.7 70.4 16.9 n/a 62.6 20.7
68 Auckland 44.6 30.9 25.0 100.0 0.0 n/a 10.8 49.8 n/a 71.6 96.5 98.4 66.7 56.9 n/a 39.6 11.3
69 Prague 44.1 37.9 28.8 72.9 13.9 19.0 17.6 33.3 38.7 81.4 96.5 93.6 70.4 28.5 54.2 38.3 8.9
70 Rome 43.9 34.7 16.3 64.2 41.8 16.8 7.8 29.0 29.3 71.3 96.5 91.4 48.1 69.0 44.1 46.8 27.5
71 Yokohama 43.3 24.0 23.8 77.3 13.9 n/a 5.4 22.1 n/a 65.8 98.5 87.2 n/a 60.8 n/a 64.4 13.5
72 Tel Aviv 43.1 29.3 17.5 74.0 48.2 34.5 16.2 35.0 18.8 73.0 76.8 71.7 42.6 48.2 57.5 50.9 12.0
73 Krakow 43.1 23.7 27.5 75.8 0.0 1.8 12.7 20.4 100.0 81.5 98.5 83.4 46.3 32.7 75.1 28.3 3.3
74 Bologna 43.0 38.5 16.3 64.2 13.9 n/a 1.5 51.9 69.8 58.5 n/a 93.0 74.1 60.0 45.3 45.6 4.6
75 Nanjing 42.9 27.9 1.3 77.1 41.8 n/a 10.3 43.6 n/a 87.2 n/a 60.4 64.8 16.9 n/a 63.6 16.6
76 Birmingham 42.8 23.5 23.8 91.5 13.9 32.3 11.8 37.7 28.0 71.4 n/a 97.3 68.5 55.7 49.5 29.9 7.4
77 Cardiff 42.7 21.5 23.8 91.5 0.0 16.7 3.4 54.6 49.3 65.9 n/a 98.4 68.5 55.7 64.4 26.5 0.7
78 Shenzhen 42.4 37.1 1.3 77.1 60.2 36.9 21.1 17.7 4.7 84.9 n/a 83.4 53.7 16.9 24.8 89.8 26.6
79 Ljubljana 42.2 34.9 33.8 73.5 0.0 25.1 2.9 22.7 62.5 56.9 98.0 92.0 77.8 42.8 66.0 21.5 0.8
80 Doha 42.2 84.8 12.5 53.4 39.1 n/a 10.3 39.9 n/a 71.8 97.5 47.1 n/a 35.4 n/a 19.8 20.5
81 Mumbai 42.1 13.8 7.5 57.0 65.5 n/a 32.4 33.9 n/a 88.9 95.5 50.3 0.0 3.3 n/a 46.6 27.5
82 Kiel 42.1 30.6 n/a 81.7 0.0 19.6 0.5 27.6 57.0 19.1 97.7 95.7 81.5 80.3 48.2 0.0 n/a
83 Bilbao 41.9 32.9 33.8 71.4 13.9 14.1 2.9 19.5 23.7 55.8 97.8 97.9 96.3 61.3 77.6 15.3 2.8
84 Sao Paulo 41.8 19.0 11.3 27.8 51.6 n/a 31.4 46.0 32.6 82.2 62.6 90.9 42.6 33.9 n/a 40.5 33.5
85 Vilnius 41.6 32.1 21.3 86.6 0.0 13.3 18.1 25.6 40.8 79.8 80.3 91.4 64.8 26.7 86.6 19.8 2.0
86 Bucharest 41.3 42.7 66.3 65.2 0.0 n/a 29.9 12.9 32.7 97.1 96.0 89.3 31.5 25.8 56.6 12.1 7.3
87 Santiago 41.0 15.8 35.0 63.4 39.1 n/a 15.2 45.6 n/a 73.9 80.3 70.1 46.3 31.4 n/a 33.6 12.4
88 Buenos Aires 40.9 16.1 27.5 28.4 27.8 16.9 17.6 47.0 68.5 79.6 76.3 91.4 53.7 23.3 54.2 33.6 13.3
89 Nantes 40.9 29.5 27.5 74.2 0.0 13.5 4.9 12.9 54.8 55.5 97.9 96.3 72.2 60.6 63.4 29.2 3.1
90 Zaragoza 40.6 28.5 n/a 61.1 0.0 16.3 4.4 29.7 19.9 61.6 95.3 95.2 94.4 61.3 62.6 19.8 0.1
91 Istanbul 40.5 30.9 15.0 74.2 46.3 2.1 17.6 24.4 n/a 73.1 85.9 85.6 22.2 15.4 11.6 50.9 55.5
92 Budapest 40.1 30.2 48.8 65.5 22.0 12.3 14.2 15.1 23.3 80.4 88.9 90.9 55.6 22.4 55.1 33.6 7.5
93 Tallinn 39.8 32.8 26.3 84.0 0.0 26.0 4.9 17.2 23.7 64.1 86.9 99.5 64.8 29.6 81.7 24.3 1.4
94 Busan 39.5 18.2 27.5 92.8 13.9 n/a 3.4 25.2 n/a 63.9 97.5 82.4 n/a 31.2 n/a 46.1 9.4
95 Bratislava 39.3 52.7 26.3 71.1 0.0 7.1 4.9 16.3 51.0 76.7 82.3 93.6 59.3 19.8 68.7 23.0 1.0
96 Marseille 39.3 26.8 27.5 74.2 0.0 28.2 6.4 27.1 24.2 58.3 82.3 92.0 55.6 60.6 56.1 37.9 5.1
97 Guangzhou 39.2 29.9 1.3 77.1 46.3 n/a 10.8 33.2 38.2 84.7 n/a 75.9 42.6 16.9 0.0 64.7 38.4
98 Mexico City 38.5 18.4 18.8 61.1 41.8 12.7 45.6 36.9 n/a 85.1 38.4 85.0 24.1 6.0 n/a 28.3 26.0
99 Turin 38.5 30.2 17.5 64.2 22.0 n/a 2.0 29.5 43.3 55.2 n/a 87.7 75.9 60.0 32.7 42.5 2.3
100 Wuhan 38.3 24.2 1.3 77.1 32.3 n/a 5.4 28.6 n/a 82.2 n/a 56.7 61.1 16.9 n/a 63.1 13.4
101 Brno 38.0 24.9 21.3 69.3 0.0 10.8 3.4 21.8 68.5 65.9 96.2 93.6 70.4 28.5 43.3 24.3 0.1
102 Tianjin 37.6 23.4 1.3 77.1 32.3 n/a 7.4 31.6 n/a 85.5 n/a 50.8 70.4 16.9 n/a 47.3 12.1
103 Riga 37.6 26.0 21.3 83.2 0.0 22.7 6.4 14.5 42.9 74.4 75.8 92.0 75.9 19.8 63.6 7.7 3.4
104 Riyadh 36.8 43.2 11.3 60.8 53.0 n/a 12.3 39.2 n/a 74.0 n/a 0.0 77.8 43.5 n/a 21.5 10.7
(continued on next page)
CITIES AND REGIONS
THE GLOBAL TALENT COMPETITIVENESS INDEX 2020 117
SPECIAL SECTION

1. ENABLE 2. ATTRACT 3. GROW 4. RETAIN 5. GLOBAL KNOWLEDGE SKILLS
Rank City
GCTCI
OVERALL1.1
GDP per capita1.2
Internet speed
1.3 Ease of doing
business
2.1 Presence of
Forbes Global 2000 companies
2.2 Foreign-born
population2.3
FDI projects
3.1 Major
universities
3.2 Tertiary
enrolment
3.3 FDI jobs created
4.1 Safety
4.2 Environmental
quality
4.3 Traffic travel
times4.4
Affordability
5.1 Tertiary educated
population
5.2 Patent
applications
5.3 Airport
connectivity
105 Athens 36.4 25.9 12.5 52.6 39.1 31.0 4.4 20.3 19.9 52.8 96.5 84.0 46.3 27.7 63.1 21.5 12.5
106 Xi'an 36.3 14.7 1.3 77.1 22.0 n/a 5.4 25.4 n/a 80.4 94.9 32.6 n/a 16.9 n/a 46.8 24.4
107 Sofia 36.2 25.9 27.5 61.9 0.0 4.0 17.2 16.3 33.1 79.8 91.0 87.7 55.6 21.5 69.8 12.1 3.6
108 Hyderabad 35.7 3.7 7.5 59.3 13.9 n/a 25.5 21.5 n/a 92.4 83.8 61.0 n/a 4.1 n/a 47.9 9.9
109 Chengdu 35.4 16.6 1.3 77.1 13.9 n/a 9.8 21.5 n/a 81.7 n/a 49.7 48.1 16.9 n/a 58.7 29.0
110 Jakarta 35.3 18.3 10.0 56.2 32.3 n/a 18.6 24.4 n/a 80.1 98.5 62.0 22.2 4.0 n/a 7.7 40.0
111 St. Petersburg 35.2 24.2 15.0 77.1 27.8 n/a 11.8 34.2 26.8 83.2 75.3 n/a 33.3 12.1 65.7 12.1 9.3
112 Chongqing 35.0 11.7 1.3 77.1 27.8 n/a 6.9 16.3 n/a 83.4 n/a 64.7 38.9 16.9 n/a 52.3 22.5
113 Belgrade 34.6 19.3 27.5 71.4 0.0 n/a 15.2 12.9 n/a 84.5 94.9 88.2 n/a 25.7 n/a 12.1 3.0
114 Ho Chi Minh City 34.2 12.0 27.5 56.2 0.0 n/a 39.7 17.7 20.5 95.8 93.4 57.8 n/a 20.8 n/a 12.1 22.4
115 Manila 33.5 16.5 18.8 38.1 39.1 n/a 14.2 22.9 n/a 79.7 71.2 42.8 n/a 13.3 22.3 21.5 24.5
116 Suzhou 33.2 3.8 1.3 77.1 0.0 n/a 14.7 0.0 n/a 83.3 n/a 67.4 83.3 16.9 n/a 63.2 4.1
117 Valletta 33.1 28.7 n/a 46.6 0.0 n/a 0.0 0.0 24.6 26.6 100.0 82.9 n/a n/a 40.0 15.3 3.4
118 Pune 32.8 1.1 6.3 59.3 22.0 n/a 21.1 12.9 n/a 91.1 83.8 58.3 n/a 4.1 n/a 34.6 4.4
119 Zagreb 32.5 24.0 23.8 66.0 0.0 22.3 6.9 16.3 38.2 68.4 93.4 86.6 n/a 21.4 n/a 12.1 1.6
120 Gurugram 32.2 30.0 7.5 59.3 22.0 n/a 16.2 0.0 n/a 84.3 83.8 39.6 n/a 4.1 30.0 19.8 n/a
121 Zhuhai 31.9 30.7 1.3 77.1 13.9 n/a 2.0 0.0 n/a 70.1 n/a 84.0 42.6 16.9 n/a 58.4 6.4
122 Kuwait City 31.1 48.7 6.3 50.0 27.8 n/a 3.9 12.9 10.2 62.5 93.9 39.0 75.9 n/a 12.1 0.0 7.9
123 Casablanca 31.1 8.0 6.3 65.5 27.8 n/a 12.3 0.0 n/a 76.7 89.9 82.9 n/a 23.8 n/a 7.7 2.0
124 Lima 30.8 12.5 11.3 53.4 22.0 n/a 13.7 17.9 17.3 82.6 61.1 74.9 13.0 20.2 67.3 7.7 12.3
125 Delhi 30.6 14.1 8.8 61.6 49.9 n/a 22.5 31.9 10.1 84.9 n/a 0.0 13.0 4.9 n/a 44.1 37.0
126 Minsk 29.3 16.4 23.8 67.8 0.0 n/a 4.9 23.7 n/a 64.0 83.8 92.5 n/a 3.1 n/a 7.7 0.9
127 Zhengzhou 29.3 17.9 1.3 77.1 22.0 n/a 1.5 0.0 n/a 59.9 94.9 29.4 n/a 16.9 n/a 36.8 14.1
128 Montevideo 29.1 18.4 13.8 34.8 0.0 n/a 3.9 20.0 n/a 67.4 46.5 92.0 n/a n/a n/a 15.3 1.1
129 Rabat 29.1 5.8 7.5 65.5 13.9 n/a 2.0 0.0 n/a 59.6 89.4 73.3 n/a n/a n/a 0.0 0.1
130 Bogota 28.4 15.0 7.5 57.0 32.3 0.3 30.9 37.9 6.0 85.8 13.1 85.6 3.7 14.1 31.1 17.8 16.3
131 Baku 28.1 38.6 5.0 74.0 0.0 n/a 6.9 12.9 n/a 63.6 83.8 71.1 n/a 20.5 n/a 0.0 2.4
132 Ankara 28.1 24.1 12.5 74.2 0.0 n/a 4.9 20.7 11.3 59.6 n/a 69.5 63.0 15.4 28.3 26.5 9.1
133 Kolkata 27.7 5.6 6.3 59.3 32.3 n/a 3.4 16.2 n/a 64.2 83.8 33.2 n/a 4.1 n/a 21.5 10.9
134 Cape Town 27.7 11.2 7.5 58.5 27.8 n/a 9.8 31.0 n/a 66.4 0.0 n/a 63.0 26.7 n/a 24.3 6.1
135 Rio de Janeiro 27.3 16.5 10.0 29.6 32.3 0.0 7.8 22.8 16.3 73.7 20.2 83.4 42.6 28.1 n/a 31.9 14.8
136 Johannesburg 27.3 15.8 7.5 49.0 39.1 8.2 17.2 29.0 6.0 70.6 0.0 60.4 64.8 26.7 19.5 21.5 12.2
137 Nairobi 26.6 4.7 10.0 64.9 13.9 n/a 17.2 0.0 7.6 74.7 69.2 88.2 n/a 8.5 n/a 12.1 4.0
138 Skopje 26.4 14.3 13.8 84.3 0.0 n/a 3.4 0.0 n/a 75.6 92.4 69.0 n/a 2.1 n/a 0.0 0.9
139 Kiev 26.3 19.5 30.0 57.2 0.0 n/a 0.0 21.0 78.2 0.0 83.8 87.2 35.2 7.8 n/a 12.1 6.0
140 Medellin 26.2 9.4 15.0 55.7 22.0 n/a 5.9 24.1 n/a 74.0 2.5 73.8 n/a 14.1 n/a 17.8 4.2
141 Quito 25.9 11.3 7.5 25.0 0.0 n/a 2.5 14.0 n/a 59.7 65.7 85.6 n/a n/a n/a 0.0 2.7
142 Abidjan 25.1 3.7 1.3 32.7 0.0 38.1 9.8 0.0 0.0 73.6 40.4 95.7 n/a n/a n/a 7.7 1.1
143 Brasilia 24.7 27.3 12.5 28.6 13.9 n/a 1.5 12.9 n/a 52.7 n/a 42.8 81.5 31.0 n/a 7.7 9.7
144 Makassar 24.2 17.9 8.8 55.7 0.0 n/a 0.5 0.0 n/a 47.8 96.1 96.3 n/a 4.0 n/a 0.0 7.8
145 Hanoi 23.4 7.2 8.8 56.2 32.3 n/a 0.0 12.9 28.9 0.0 96.9 51.3 n/a 20.8 n/a 0.0 13.3
146 Accra 23.2 0.0 3.8 30.9 0.0 n/a 6.9 0.0 n/a 61.8 93.4 46.0 n/a n/a n/a 0.0 1.2
147 Phnom Penh 22.7 5.2 6.3 14.9 0.0 n/a 9.3 0.0 n/a 79.3 90.9 80.7 n/a 8.7 n/a 0.0 0.4
148 Medan 22.6 14.6 8.8 55.7 0.0 n/a 0.5 0.0 n/a 43.3 96.7 84.5 n/a 4.0 n/a 0.0 5.7
149 Tunis 22.3 9.9 6.3 53.4 0.0 n/a 2.9 0.0 n/a 59.8 84.8 57.8 n/a 0.0 n/a 15.3 3.2
150 Addis Ababa 21.9 2.4 0.0 0.0 0.0 n/a 2.9 0.0 n/a 70.2 61.6 75.4 n/a n/a n/a 0.0 7.0
151 Abuja 21.8 3.3 3.8 35.1 0.0 n/a 2.0 0.0 n/a 63.8 84.8 85.0 n/a 12.1 n/a 0.0 2.7
152 Lahore 19.6 6.7 3.8 40.2 0.0 n/a 3.4 14.5 n/a 62.6 78.8 0.0 n/a n/a n/a 0.0 2.5
153 Lagos 19.4 6.4 3.8 21.9 22.0 n/a 8.8 0.0 n/a 74.5 0.0 82.9 n/a 12.1 n/a 0.0 4.1
154 Cairo 17.4 10.3 3.8 31.2 0.0 n/a 9.3 23.2 9.3 70.1 87.9 0.0 38.9 3.8 n/a 0.0 0.9
155 Karachi 16.3 8.4 3.8 29.6 0.0 n/a 5.9 0.0 n/a 72.7 78.8 0.0 n/a 1.0 n/a 0.0 3.5
Annex 2 (continued)GCTCI rankings and scores: Overall and by variable
CITIES AND REGIONSSPECIAL SECTION
118 THE GLOBAL TALENT COMPETITIVENESS INDEX 2020
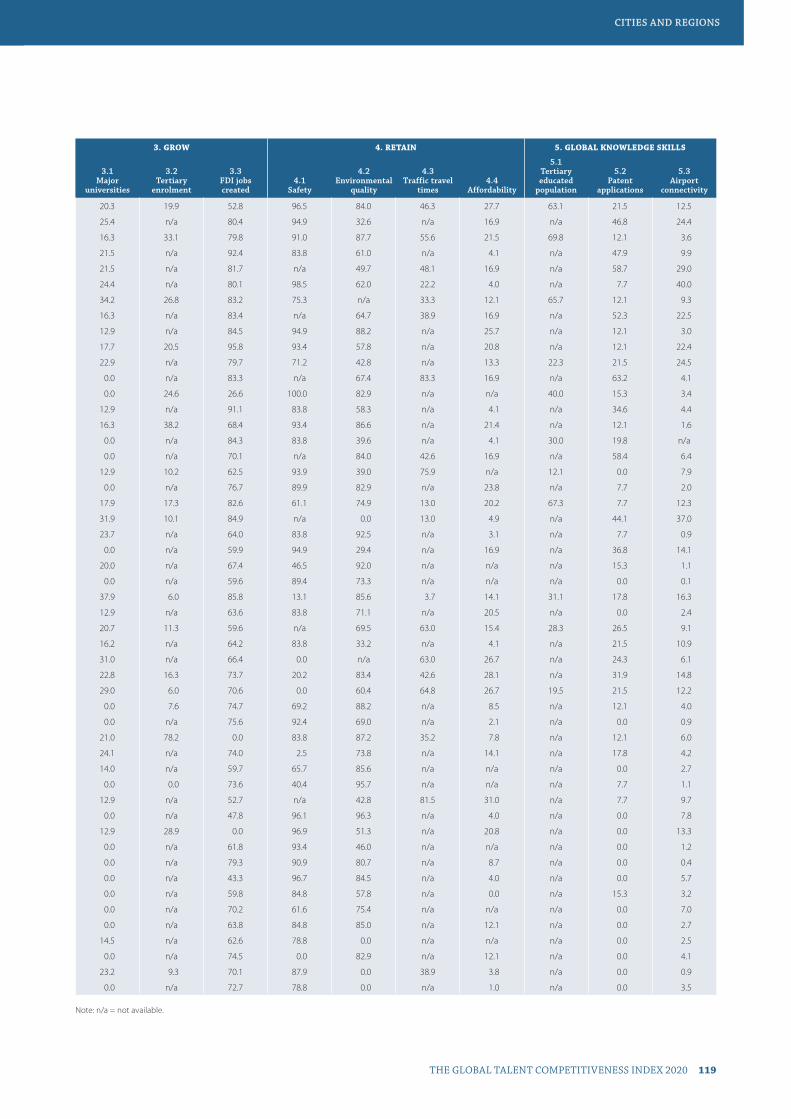
Note: n/a = not available.
1. ENABLE 2. ATTRACT 3. GROW 4. RETAIN 5. GLOBAL KNOWLEDGE SKILLS
Rank City
GCTCI
OVERALL1.1
GDP per capita1.2
Internet speed
1.3 Ease of doing
business
2.1 Presence of
Forbes Global 2000 companies
2.2 Foreign-born
population2.3
FDI projects
3.1 Major
universities
3.2 Tertiary
enrolment
3.3 FDI jobs created
4.1 Safety
4.2 Environmental
quality
4.3 Traffic travel
times4.4
Affordability
5.1 Tertiary educated
population
5.2 Patent
applications
5.3 Airport
connectivity
105 Athens 36.4 25.9 12.5 52.6 39.1 31.0 4.4 20.3 19.9 52.8 96.5 84.0 46.3 27.7 63.1 21.5 12.5
106 Xi'an 36.3 14.7 1.3 77.1 22.0 n/a 5.4 25.4 n/a 80.4 94.9 32.6 n/a 16.9 n/a 46.8 24.4
107 Sofia 36.2 25.9 27.5 61.9 0.0 4.0 17.2 16.3 33.1 79.8 91.0 87.7 55.6 21.5 69.8 12.1 3.6
108 Hyderabad 35.7 3.7 7.5 59.3 13.9 n/a 25.5 21.5 n/a 92.4 83.8 61.0 n/a 4.1 n/a 47.9 9.9
109 Chengdu 35.4 16.6 1.3 77.1 13.9 n/a 9.8 21.5 n/a 81.7 n/a 49.7 48.1 16.9 n/a 58.7 29.0
110 Jakarta 35.3 18.3 10.0 56.2 32.3 n/a 18.6 24.4 n/a 80.1 98.5 62.0 22.2 4.0 n/a 7.7 40.0
111 St. Petersburg 35.2 24.2 15.0 77.1 27.8 n/a 11.8 34.2 26.8 83.2 75.3 n/a 33.3 12.1 65.7 12.1 9.3
112 Chongqing 35.0 11.7 1.3 77.1 27.8 n/a 6.9 16.3 n/a 83.4 n/a 64.7 38.9 16.9 n/a 52.3 22.5
113 Belgrade 34.6 19.3 27.5 71.4 0.0 n/a 15.2 12.9 n/a 84.5 94.9 88.2 n/a 25.7 n/a 12.1 3.0
114 Ho Chi Minh City 34.2 12.0 27.5 56.2 0.0 n/a 39.7 17.7 20.5 95.8 93.4 57.8 n/a 20.8 n/a 12.1 22.4
115 Manila 33.5 16.5 18.8 38.1 39.1 n/a 14.2 22.9 n/a 79.7 71.2 42.8 n/a 13.3 22.3 21.5 24.5
116 Suzhou 33.2 3.8 1.3 77.1 0.0 n/a 14.7 0.0 n/a 83.3 n/a 67.4 83.3 16.9 n/a 63.2 4.1
117 Valletta 33.1 28.7 n/a 46.6 0.0 n/a 0.0 0.0 24.6 26.6 100.0 82.9 n/a n/a 40.0 15.3 3.4
118 Pune 32.8 1.1 6.3 59.3 22.0 n/a 21.1 12.9 n/a 91.1 83.8 58.3 n/a 4.1 n/a 34.6 4.4
119 Zagreb 32.5 24.0 23.8 66.0 0.0 22.3 6.9 16.3 38.2 68.4 93.4 86.6 n/a 21.4 n/a 12.1 1.6
120 Gurugram 32.2 30.0 7.5 59.3 22.0 n/a 16.2 0.0 n/a 84.3 83.8 39.6 n/a 4.1 30.0 19.8 n/a
121 Zhuhai 31.9 30.7 1.3 77.1 13.9 n/a 2.0 0.0 n/a 70.1 n/a 84.0 42.6 16.9 n/a 58.4 6.4
122 Kuwait City 31.1 48.7 6.3 50.0 27.8 n/a 3.9 12.9 10.2 62.5 93.9 39.0 75.9 n/a 12.1 0.0 7.9
123 Casablanca 31.1 8.0 6.3 65.5 27.8 n/a 12.3 0.0 n/a 76.7 89.9 82.9 n/a 23.8 n/a 7.7 2.0
124 Lima 30.8 12.5 11.3 53.4 22.0 n/a 13.7 17.9 17.3 82.6 61.1 74.9 13.0 20.2 67.3 7.7 12.3
125 Delhi 30.6 14.1 8.8 61.6 49.9 n/a 22.5 31.9 10.1 84.9 n/a 0.0 13.0 4.9 n/a 44.1 37.0
126 Minsk 29.3 16.4 23.8 67.8 0.0 n/a 4.9 23.7 n/a 64.0 83.8 92.5 n/a 3.1 n/a 7.7 0.9
127 Zhengzhou 29.3 17.9 1.3 77.1 22.0 n/a 1.5 0.0 n/a 59.9 94.9 29.4 n/a 16.9 n/a 36.8 14.1
128 Montevideo 29.1 18.4 13.8 34.8 0.0 n/a 3.9 20.0 n/a 67.4 46.5 92.0 n/a n/a n/a 15.3 1.1
129 Rabat 29.1 5.8 7.5 65.5 13.9 n/a 2.0 0.0 n/a 59.6 89.4 73.3 n/a n/a n/a 0.0 0.1
130 Bogota 28.4 15.0 7.5 57.0 32.3 0.3 30.9 37.9 6.0 85.8 13.1 85.6 3.7 14.1 31.1 17.8 16.3
131 Baku 28.1 38.6 5.0 74.0 0.0 n/a 6.9 12.9 n/a 63.6 83.8 71.1 n/a 20.5 n/a 0.0 2.4
132 Ankara 28.1 24.1 12.5 74.2 0.0 n/a 4.9 20.7 11.3 59.6 n/a 69.5 63.0 15.4 28.3 26.5 9.1
133 Kolkata 27.7 5.6 6.3 59.3 32.3 n/a 3.4 16.2 n/a 64.2 83.8 33.2 n/a 4.1 n/a 21.5 10.9
134 Cape Town 27.7 11.2 7.5 58.5 27.8 n/a 9.8 31.0 n/a 66.4 0.0 n/a 63.0 26.7 n/a 24.3 6.1
135 Rio de Janeiro 27.3 16.5 10.0 29.6 32.3 0.0 7.8 22.8 16.3 73.7 20.2 83.4 42.6 28.1 n/a 31.9 14.8
136 Johannesburg 27.3 15.8 7.5 49.0 39.1 8.2 17.2 29.0 6.0 70.6 0.0 60.4 64.8 26.7 19.5 21.5 12.2
137 Nairobi 26.6 4.7 10.0 64.9 13.9 n/a 17.2 0.0 7.6 74.7 69.2 88.2 n/a 8.5 n/a 12.1 4.0
138 Skopje 26.4 14.3 13.8 84.3 0.0 n/a 3.4 0.0 n/a 75.6 92.4 69.0 n/a 2.1 n/a 0.0 0.9
139 Kiev 26.3 19.5 30.0 57.2 0.0 n/a 0.0 21.0 78.2 0.0 83.8 87.2 35.2 7.8 n/a 12.1 6.0
140 Medellin 26.2 9.4 15.0 55.7 22.0 n/a 5.9 24.1 n/a 74.0 2.5 73.8 n/a 14.1 n/a 17.8 4.2
141 Quito 25.9 11.3 7.5 25.0 0.0 n/a 2.5 14.0 n/a 59.7 65.7 85.6 n/a n/a n/a 0.0 2.7
142 Abidjan 25.1 3.7 1.3 32.7 0.0 38.1 9.8 0.0 0.0 73.6 40.4 95.7 n/a n/a n/a 7.7 1.1
143 Brasilia 24.7 27.3 12.5 28.6 13.9 n/a 1.5 12.9 n/a 52.7 n/a 42.8 81.5 31.0 n/a 7.7 9.7
144 Makassar 24.2 17.9 8.8 55.7 0.0 n/a 0.5 0.0 n/a 47.8 96.1 96.3 n/a 4.0 n/a 0.0 7.8
145 Hanoi 23.4 7.2 8.8 56.2 32.3 n/a 0.0 12.9 28.9 0.0 96.9 51.3 n/a 20.8 n/a 0.0 13.3
146 Accra 23.2 0.0 3.8 30.9 0.0 n/a 6.9 0.0 n/a 61.8 93.4 46.0 n/a n/a n/a 0.0 1.2
147 Phnom Penh 22.7 5.2 6.3 14.9 0.0 n/a 9.3 0.0 n/a 79.3 90.9 80.7 n/a 8.7 n/a 0.0 0.4
148 Medan 22.6 14.6 8.8 55.7 0.0 n/a 0.5 0.0 n/a 43.3 96.7 84.5 n/a 4.0 n/a 0.0 5.7
149 Tunis 22.3 9.9 6.3 53.4 0.0 n/a 2.9 0.0 n/a 59.8 84.8 57.8 n/a 0.0 n/a 15.3 3.2
150 Addis Ababa 21.9 2.4 0.0 0.0 0.0 n/a 2.9 0.0 n/a 70.2 61.6 75.4 n/a n/a n/a 0.0 7.0
151 Abuja 21.8 3.3 3.8 35.1 0.0 n/a 2.0 0.0 n/a 63.8 84.8 85.0 n/a 12.1 n/a 0.0 2.7
152 Lahore 19.6 6.7 3.8 40.2 0.0 n/a 3.4 14.5 n/a 62.6 78.8 0.0 n/a n/a n/a 0.0 2.5
153 Lagos 19.4 6.4 3.8 21.9 22.0 n/a 8.8 0.0 n/a 74.5 0.0 82.9 n/a 12.1 n/a 0.0 4.1
154 Cairo 17.4 10.3 3.8 31.2 0.0 n/a 9.3 23.2 9.3 70.1 87.9 0.0 38.9 3.8 n/a 0.0 0.9
155 Karachi 16.3 8.4 3.8 29.6 0.0 n/a 5.9 0.0 n/a 72.7 78.8 0.0 n/a 1.0 n/a 0.0 3.5
CITIES AND REGIONS
THE GLOBAL TALENT COMPETITIVENESS INDEX 2020 119
SPECIAL SECTION


Country Profiles


1
2
3
COUNTRY PROFILES
GTCI 2020 Country Profile by Pillar
THE GLOBAL TALENT COMPETITIVENESS INDEX 2020 127
102030405060708090100
Global knowledge skills
Vocational andtechnical skills
Retain
Grow
Attract
Enable
1020304040
ALBANIAKey Indicators
Rank (out of 132) . . . . . . . . . . . . . . . . . . . . . . . . . . . . . . . . . . . . . . . 76Income group . . . . . . . . . . . . . . . . . . . . . . . . . . . Upper-middle incomeRegional group . . . . . . . . . . . . . . . . . . . . . . . . . . . . . . . . . . . . . . . . .EuropePopulation (millions) . . . . . . . . . . . . . . . . . . . . . . . . . . . . . . . . . . . . . 2.87
GDP per capita (PPP US$) . . . . . . . . . . . . . . . . . . . . . . . . . . . .12,930.07GDP (US$ billions) . . . . . . . . . . . . . . . . . . . . . . . . . . . . . . . . . . . . . . 15.06GTCI score . . . . . . . . . . . . . . . . . . . . . . . . . . . . . . . . . . . . . . . . . . . . . . 38.94GTCI score (income group average) . . . . . . . . . . . . . . . . . . . . . . . . 41.25
Score Rank
1 ENABLE . . . . . . . . . . . . . . . . . . . . . . . . . . . . . . . . . . . . . . . . . . 44.98 831.1 Regulatory Landscape . . . . . . . . . . . . . . . . . . . . . . . . . . . . . . . . . . . . . . 49.74 631.1.1 Government effectiveness . . . . . . . . . . . . . . . . . . . . . . . . . . . . . . . . . . . .48.37 671.1.2 Rule of law . . . . . . . . . . . . . . . . . . . . . . . . . . . . . . . . . . . . . . . . . . . . . . . . . . . .43.28 881.1.3 Political stability . . . . . . . . . . . . . . . . . . . . . . . . . . . . . . . . . . . . . . . . . . . . . . . 73.74 431.1.4 Regulatory quality. . . . . . . . . . . . . . . . . . . . . . . . . . . . . . . . . . . . . . . . . . . . .53.56 591.1.5 Corruption . . . . . . . . . . . . . . . . . . . . . . . . . . . . . . . . . . . . . . . . . . . . . . . . . . . .29.73 811.2 Market Landscape . . . . . . . . . . . . . . . . . . . . . . . . . . . . . . . . . . . . . . . . . . 42.64 881.2.1 Competition intensity . . . . . . . . . . . . . . . . . . . . . . . . . . . . . . . . . . . . . . . . 66.84 711.2.2 Ease of doing business . . . . . . . . . . . . . . . . . . . . . . . . . . . . . . . . . . . . . . . .69.49 591.2.3 Cluster development . . . . . . . . . . . . . . . . . . . . . . . . . . . . . . . . . . . . . . . . . .22.40 1161.2.4 R&D expenditure . . . . . . . . . . . . . . . . . . . . . . . . . . . . . . . . . . . . . . . . . . . . . . . 3.06 941.2.5 ICT infrastructure. . . . . . . . . . . . . . . . . . . . . . . . . . . . . . . . . . . . . . . . . . . . . .39.69 871.2.6 Urban population . . . . . . . . . . . . . . . . . . . . . . . . . . . . . . . . . . . . . . . . . . . . .54.37 731.3 Business and Labour Landscape . . . . . . . . . . . . . . . . . . . . . . . . . . . . 42.56 78
Labour Market1.3.1 Tertiary-educated unemployment . . . . . . . . . . . . . . . . . . . . . . . . . . . .36.90 1201.3.2 Active labour market policies . . . . . . . . . . . . . . . . . . . . . . . . . . . . . . . . . 27.24 981.3.3 Labour-employer cooperation . . . . . . . . . . . . . . . . . . . . . . . . . . . . . . . .55.56 33
Management Practice1.3.4 Professional management . . . . . . . . . . . . . . . . . . . . . . . . . . . . . . . . . . . . 47.62 701.3.5 Relationship of pay to productivity . . . . . . . . . . . . . . . . . . . . . . . . . . . .63.88 36
Technology Adoption1.3.6 Technology utilisation. . . . . . . . . . . . . . . . . . . . . . . . . . . . . . . . . . . . . . . . .44.87 811.3.7 Investment in emerging technologies . . . . . . . . . . . . . . . . . . . . . . . . 21.88 1161.3.8 Robot density . . . . . . . . . . . . . . . . . . . . . . . . . . . . . . . . . . . . . . . . . . . . . . . . . . .n/a n/a
2 ATTRACT . . . . . . . . . . . . . . . . . . . . . . . . . . . . . . . . . . . . . . . . . .49.58 622.1 External Openness . . . . . . . . . . . . . . . . . . . . . . . . . . . . . . . . . . . . . . . . . 32.50 102
Attract Business2.1.1 FDI and technology transfer . . . . . . . . . . . . . . . . . . . . . . . . . . . . . . . . . .73.48 282.1.2 Prevalence of foreign ownership . . . . . . . . . . . . . . . . . . . . . . . . . . . . . .50.71 93
Attract People2.1.3 Migrant stock . . . . . . . . . . . . . . . . . . . . . . . . . . . . . . . . . . . . . . . . . . . . . . . . . 15.50 1062.1.4 International students . . . . . . . . . . . . . . . . . . . . . . . . . . . . . . . . . . . . . . . . . . 5.47 762.1.5 Brain gain . . . . . . . . . . . . . . . . . . . . . . . . . . . . . . . . . . . . . . . . . . . . . . . . . . . . . 17.32 1232.2 Internal Openness . . . . . . . . . . . . . . . . . . . . . . . . . . . . . . . . . . . . . . . . . . 66.67 34
Social Inclusion2.2.1 Tolerance of minorities . . . . . . . . . . . . . . . . . . . . . . . . . . . . . . . . . . . . . . . .63.33 382.2.2 Tolerance of immigrants . . . . . . . . . . . . . . . . . . . . . . . . . . . . . . . . . . . . . . 45.21 912.2.3 Social mobility . . . . . . . . . . . . . . . . . . . . . . . . . . . . . . . . . . . . . . . . . . . . . . . . 43.41 109
Gender Equality2.2.4 Female graduates . . . . . . . . . . . . . . . . . . . . . . . . . . . . . . . . . . . . . . . . . . . . .91.00 122.2.5 Gender development gap . . . . . . . . . . . . . . . . . . . . . . . . . . . . . . . . . . . .78.38 622.2.6 Leadership opportunities for women . . . . . . . . . . . . . . . . . . . . . . . . .78.67 14
Score Rank
3 GROW . . . . . . . . . . . . . . . . . . . . . . . . . . . . . . . . . . . . . . . . . . . . 36.54 733.1 Formal Education . . . . . . . . . . . . . . . . . . . . . . . . . . . . . . . . . . . . . . . . . . . 22.13 74
Enrolment3.1.1 Vocational enrolment . . . . . . . . . . . . . . . . . . . . . . . . . . . . . . . . . . . . . . . . .13.80 753.1.2 Tertiary enrolment . . . . . . . . . . . . . . . . . . . . . . . . . . . . . . . . . . . . . . . . . . . .44.74 50
Quality3.1.3 Tertiary education expenditure . . . . . . . . . . . . . . . . . . . . . . . . . . . . . . .16.27 783.1.4 Reading, maths, and science . . . . . . . . . . . . . . . . . . . . . . . . . . . . . . . . . .35.84 563.1.5 University ranking . . . . . . . . . . . . . . . . . . . . . . . . . . . . . . . . . . . . . . . . . . . . . . 0.00 753.2 Lifelong Learning . . . . . . . . . . . . . . . . . . . . . . . . . . . . . . . . . . . . . . . . . . . 39.24 763.2.1 Quality of management schools . . . . . . . . . . . . . . . . . . . . . . . . . . . . . .45.05 753.2.2 Prevalence of training in firms . . . . . . . . . . . . . . . . . . . . . . . . . . . . . . . . . 31.27 573.2.3 Employee development . . . . . . . . . . . . . . . . . . . . . . . . . . . . . . . . . . . . . . 41.39 593.3 Access to Growth Opportunities . . . . . . . . . . . . . . . . . . . . . . . . . . . 48.27 61
Empowerment3.3.1 Delegation of authority . . . . . . . . . . . . . . . . . . . . . . . . . . . . . . . . . . . . . . .38.47 883.3.2 Personal rights . . . . . . . . . . . . . . . . . . . . . . . . . . . . . . . . . . . . . . . . . . . . . . . .80.36 52
Collaboration3.3.3 Use of virtual social networks . . . . . . . . . . . . . . . . . . . . . . . . . . . . . . . . .73.45 693.3.4 Use of virtual professional networks . . . . . . . . . . . . . . . . . . . . . . . . . . . 8.86 663.3.5 Collaboration within organisations . . . . . . . . . . . . . . . . . . . . . . . . . . . . 47.97 633.3.6 Collaboration across organisations . . . . . . . . . . . . . . . . . . . . . . . . . . . .40.49 61
4 RETAIN . . . . . . . . . . . . . . . . . . . . . . . . . . . . . . . . . . . . . . . . . . . .43.91 784.1 Sustainability . . . . . . . . . . . . . . . . . . . . . . . . . . . . . . . . . . . . . . . . . . . . . . . 27.75 1044.1.1 Pension system . . . . . . . . . . . . . . . . . . . . . . . . . . . . . . . . . . . . . . . . . . . . . . . . .n/a n/a4.1.2 Social protection . . . . . . . . . . . . . . . . . . . . . . . . . . . . . . . . . . . . . . . . . . . . . .33.21 854.1.3 Brain retention . . . . . . . . . . . . . . . . . . . . . . . . . . . . . . . . . . . . . . . . . . . . . . . .22.29 1114.2 Lifestyle . . . . . . . . . . . . . . . . . . . . . . . . . . . . . . . . . . . . . . . . . . . . . . . . . . . . 60.07 544.2.1 Environmental performance . . . . . . . . . . . . . . . . . . . . . . . . . . . . . . . . . .63.39 364.2.2 Personal safety . . . . . . . . . . . . . . . . . . . . . . . . . . . . . . . . . . . . . . . . . . . . . . . .59.05 574.2.3 Physician density . . . . . . . . . . . . . . . . . . . . . . . . . . . . . . . . . . . . . . . . . . . . . .20.32 774.2.4 Sanitation . . . . . . . . . . . . . . . . . . . . . . . . . . . . . . . . . . . . . . . . . . . . . . . . . . . . . 97.51 42
5 VOCATIONAL AND TECHNICAL SKILLS . . . . . . . . . . . . 44.22 655.1 Mid-Level Skills . . . . . . . . . . . . . . . . . . . . . . . . . . . . . . . . . . . . . . . . . . . . . 33.37 775.1.1 Workforce with secondary education . . . . . . . . . . . . . . . . . . . . . . . . .48.51 625.1.2 Population with secondary education . . . . . . . . . . . . . . . . . . . . . . . .45.02 555.1.3 Technicians and associate professionals . . . . . . . . . . . . . . . . . . . . . . .20.84 895.1.4 Labour productivity per employee . . . . . . . . . . . . . . . . . . . . . . . . . . . . 19.10 715.2 Employability . . . . . . . . . . . . . . . . . . . . . . . . . . . . . . . . . . . . . . . . . . . . . . . 55.06 495.2.1 Ease of finding skilled employees . . . . . . . . . . . . . . . . . . . . . . . . . . . . .53.07 705.2.2 Relevance of education system to the economy . . . . . . . . . . . . . . 61.66 365.2.3 Skills matching with secondary education . . . . . . . . . . . . . . . . . . . . 51.24 465.2.4 Skills matching with tertiary education . . . . . . . . . . . . . . . . . . . . . . . .54.28 67
6 GLOBAL KNOWLEDGE SKILLS . . . . . . . . . . . . . . . . . . . . .14.41 1046.1 High-Level Skills . . . . . . . . . . . . . . . . . . . . . . . . . . . . . . . . . . . . . . . . . . . . 21.28 896.1.1 Workforce with tertiary education . . . . . . . . . . . . . . . . . . . . . . . . . . . . 28.16 696.1.2 Population with tertiary education . . . . . . . . . . . . . . . . . . . . . . . . . . . . 19.41 746.1.3 Professionals . . . . . . . . . . . . . . . . . . . . . . . . . . . . . . . . . . . . . . . . . . . . . . . . . . 29.17 596.1.4 Researchers . . . . . . . . . . . . . . . . . . . . . . . . . . . . . . . . . . . . . . . . . . . . . . . . . . . . 1.77 836.1.5 Senior officials and managers . . . . . . . . . . . . . . . . . . . . . . . . . . . . . . . . . . 5.61 1116.1.6 Availability of scientists and engineers . . . . . . . . . . . . . . . . . . . . . . . .43.55 776.2 Talent Impact . . . . . . . . . . . . . . . . . . . . . . . . . . . . . . . . . . . . . . . . . . . . . . . . 7.54 1166.2.1 Innovation output . . . . . . . . . . . . . . . . . . . . . . . . . . . . . . . . . . . . . . . . . . . .20.84 906.2.2 High-value exports . . . . . . . . . . . . . . . . . . . . . . . . . . . . . . . . . . . . . . . . . . . . . 0.25 1246.2.3 New product entrepreneurial activity . . . . . . . . . . . . . . . . . . . . . . . . . . .n/a n/a6.2.4 New business density . . . . . . . . . . . . . . . . . . . . . . . . . . . . . . . . . . . . . . . . . . 6.47 626.2.5 Scientific journal articles . . . . . . . . . . . . . . . . . . . . . . . . . . . . . . . . . . . . . . . 2.60 79
l Albania l Income group average
1 The first section introduces the country’s key indi-cators. It comprises its rank within the GTCI (out of 132 countries), its income group (based on the World Bank’s Income Group Classification as of July 2019), and its re-gional group (based on the United Nations’ sub-regional groups). Additionally, basic country statistics are presented. These include population (in millions), GDP per capita (PPP US$), and GDP (current US$ in billions) from the World Bank’s World Development Indicators. Finally, the section presents the country’s GTCI score and income group aver-age GTCI score.
2 The second section presents a radar chart that outlines the respective country’s performance along the six pillars of the GTCI and its position with respect to its income group peers. The dark blue line plots the country’s score on each of the six pillars, while the shaded area represents the average scores for its corresponding income group.
3 The third section lays out the country’s normalised scores and ranks across all pillars, sub-pillars, and variables. The pillars are identified by a bold single digit notation (e.g., 1 ENABLE) and sub-pillars by a two-digit notation (e.g., 1.2 Market Landscape). Under selected sub-pillars, compo-nents are provided in grey. There are no values attached to the components, as they only contextualise the theoreti-cal framework. The 70 variables are indicated by a three-digit notation (e.g., 1.2.3 Cluster development).
For more information about the method of calcula-tion and variable definitions, please refer to Appendix I: Technical Notes and Appendix II: Sources and Definitions, respectively.
How to Read the Country Profiles
The country profiles provide more granular information on how each of the 132 countries performs in the various dimensions of the Global Talent Competitiveness Index (GTCI).
Each country profile consists of three parts:1 Key indicators,2 Radar chart, and3 Scores and Ranks.
THE GLOBAL TALENT COMPETITIVENESS INDEX 2020 123
COUNTRY PROFILES

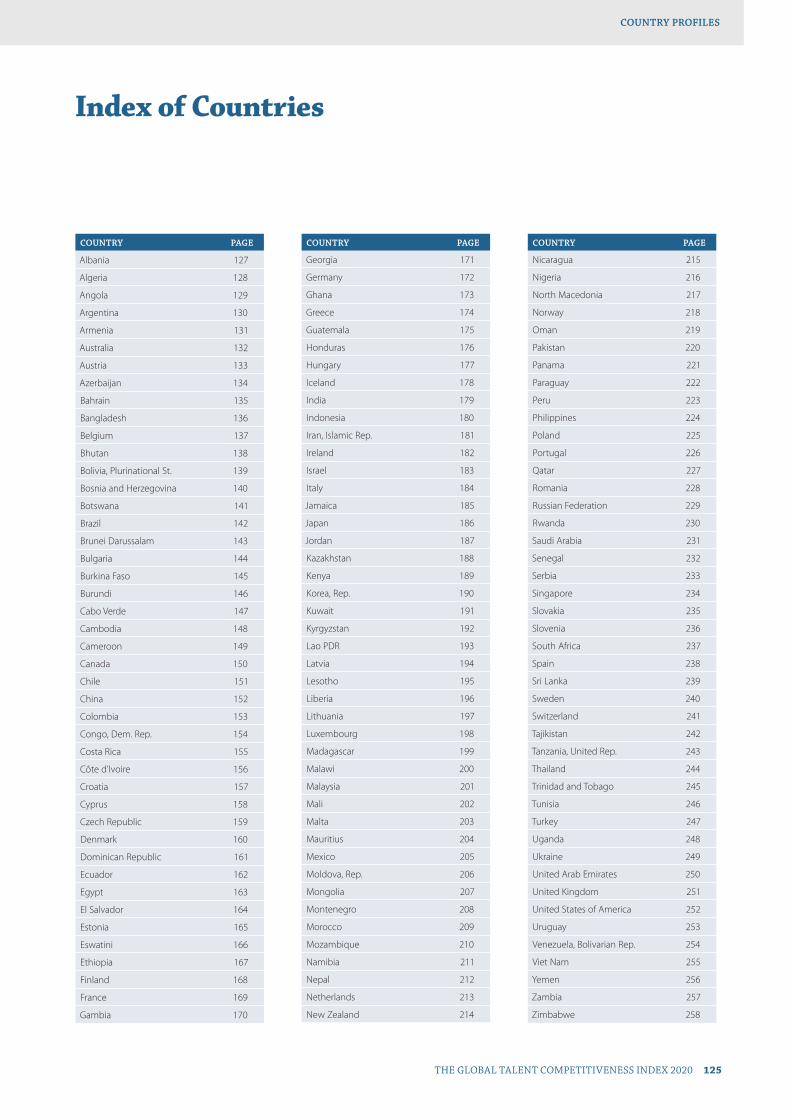
Index of Countries
COUNTRY PAGE
Albania 127
Algeria 128
Angola 129
Argentina 130
Armenia 131
Australia 132
Austria 133
Azerbaijan 134
Bahrain 135
Bangladesh 136
Belgium 137
Bhutan 138
Bolivia, Plurinational St. 139
Bosnia and Herzegovina 140
Botswana 141
Brazil 142
Brunei Darussalam 143
Bulgaria 144
Burkina Faso 145
Burundi 146
Cabo Verde 147
Cambodia 148
Cameroon 149
Canada 150
Chile 151
China 152
Colombia 153
Congo, Dem. Rep. 154
Costa Rica 155
Côte d’Ivoire 156
Croatia 157
Cyprus 158
Czech Republic 159
Denmark 160
Dominican Republic 161
Ecuador 162
Egypt 163
El Salvador 164
Estonia 165
Eswatini 166
Ethiopia 167
Finland 168
France 169
Gambia 170
COUNTRY PAGE
Georgia 171
Germany 172
Ghana 173
Greece 174
Guatemala 175
Honduras 176
Hungary 177
Iceland 178
India 179
Indonesia 180
Iran, Islamic Rep. 181
Ireland 182
Israel 183
Italy 184
Jamaica 185
Japan 186
Jordan 187
Kazakhstan 188
Kenya 189
Korea, Rep. 190
Kuwait 191
Kyrgyzstan 192
Lao PDR 193
Latvia 194
Lesotho 195
Liberia 196
Lithuania 197
Luxembourg 198
Madagascar 199
Malawi 200
Malaysia 201
Mali 202
Malta 203
Mauritius 204
Mexico 205
Moldova, Rep. 206
Mongolia 207
Montenegro 208
Morocco 209
Mozambique 210
Namibia 211
Nepal 212
Netherlands 213
New Zealand 214
COUNTRY PAGE
Nicaragua 215
Nigeria 216
North Macedonia 217
Norway 218
Oman 219
Pakistan 220
Panama 221
Paraguay 222
Peru 223
Philippines 224
Poland 225
Portugal 226
Qatar 227
Romania 228
Russian Federation 229
Rwanda 230
Saudi Arabia 231
Senegal 232
Serbia 233
Singapore 234
Slovakia 235
Slovenia 236
South Africa 237
Spain 238
Sri Lanka 239
Sweden 240
Switzerland 241
Tajikistan 242
Tanzania, United Rep. 243
Thailand 244
Trinidad and Tobago 245
Tunisia 246
Turkey 247
Uganda 248
Ukraine 249
United Arab Emirates 250
United Kingdom 251
United States of America 252
Uruguay 253
Venezuela, Bolivarian Rep. 254
Viet Nam 255
Yemen 256
Zambia 257
Zimbabwe 258
THE GLOBAL TALENT COMPETITIVENESS INDEX 2020 125
COUNTRY PROFILES

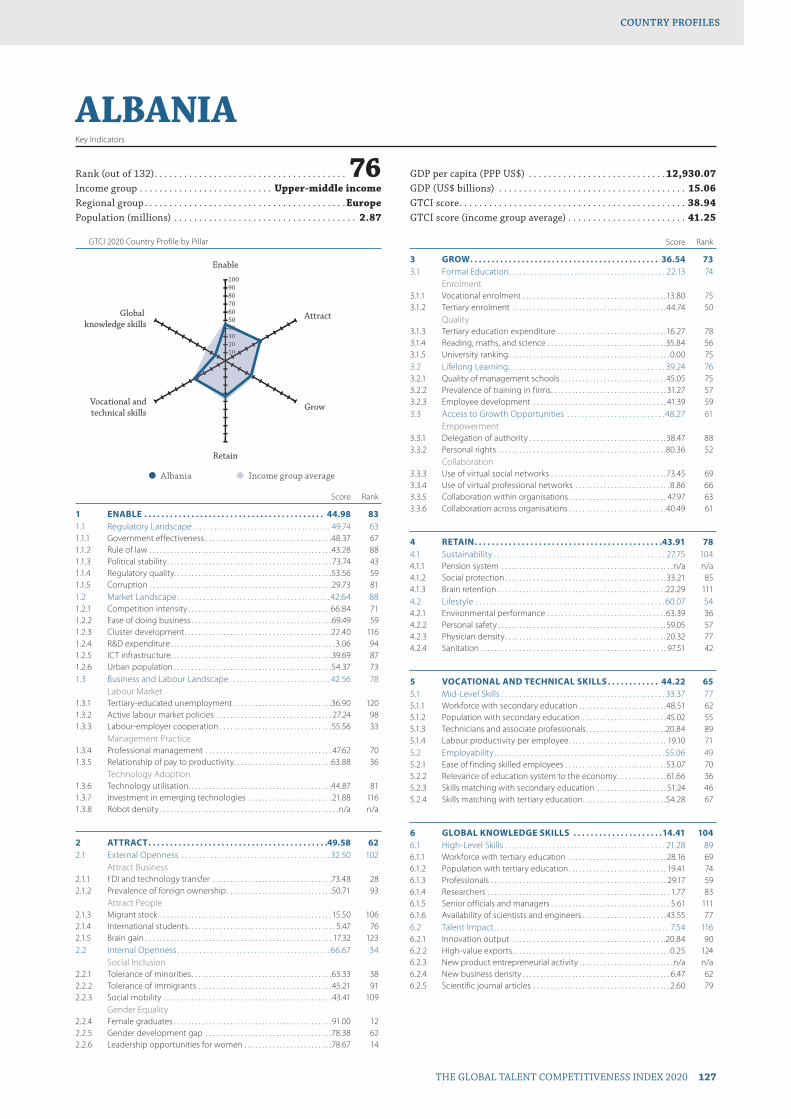
GTCI 2020 Country Profile by Pillar
THE GLOBAL TALENT COMPETITIVENESS INDEX 2020 127
COUNTRY PROFILES
102030405060708090100
Global knowledge skills
Vocational andtechnical skills
Retain
Grow
Attract
Enable
1020304040
ALBANIAKey Indicators
Rank (out of 132) . . . . . . . . . . . . . . . . . . . . . . . . . . . . . . . . . . . . . . . 76Income group . . . . . . . . . . . . . . . . . . . . . . . . . . . Upper-middle incomeRegional group . . . . . . . . . . . . . . . . . . . . . . . . . . . . . . . . . . . . . . . . .EuropePopulation (millions) . . . . . . . . . . . . . . . . . . . . . . . . . . . . . . . . . . . . . 2.87
GDP per capita (PPP US$) . . . . . . . . . . . . . . . . . . . . . . . . . . . .12,930.07GDP (US$ billions) . . . . . . . . . . . . . . . . . . . . . . . . . . . . . . . . . . . . . . 15.06GTCI score . . . . . . . . . . . . . . . . . . . . . . . . . . . . . . . . . . . . . . . . . . . . . . 38.94GTCI score (income group average) . . . . . . . . . . . . . . . . . . . . . . . . 41.25
Score Rank
1 ENABLE . . . . . . . . . . . . . . . . . . . . . . . . . . . . . . . . . . . . . . . . . . 44.98 831.1 Regulatory Landscape . . . . . . . . . . . . . . . . . . . . . . . . . . . . . . . . . . . . . . 49.74 631.1.1 Government effectiveness . . . . . . . . . . . . . . . . . . . . . . . . . . . . . . . . . . . .48.37 671.1.2 Rule of law . . . . . . . . . . . . . . . . . . . . . . . . . . . . . . . . . . . . . . . . . . . . . . . . . . . .43.28 881.1.3 Political stability . . . . . . . . . . . . . . . . . . . . . . . . . . . . . . . . . . . . . . . . . . . . . . . 73.74 431.1.4 Regulatory quality. . . . . . . . . . . . . . . . . . . . . . . . . . . . . . . . . . . . . . . . . . . . .53.56 591.1.5 Corruption . . . . . . . . . . . . . . . . . . . . . . . . . . . . . . . . . . . . . . . . . . . . . . . . . . . .29.73 811.2 Market Landscape . . . . . . . . . . . . . . . . . . . . . . . . . . . . . . . . . . . . . . . . . . 42.64 881.2.1 Competition intensity . . . . . . . . . . . . . . . . . . . . . . . . . . . . . . . . . . . . . . . . 66.84 711.2.2 Ease of doing business . . . . . . . . . . . . . . . . . . . . . . . . . . . . . . . . . . . . . . . .69.49 591.2.3 Cluster development . . . . . . . . . . . . . . . . . . . . . . . . . . . . . . . . . . . . . . . . . .22.40 1161.2.4 R&D expenditure . . . . . . . . . . . . . . . . . . . . . . . . . . . . . . . . . . . . . . . . . . . . . . . 3.06 941.2.5 ICT infrastructure. . . . . . . . . . . . . . . . . . . . . . . . . . . . . . . . . . . . . . . . . . . . . .39.69 871.2.6 Urban population . . . . . . . . . . . . . . . . . . . . . . . . . . . . . . . . . . . . . . . . . . . . .54.37 731.3 Business and Labour Landscape . . . . . . . . . . . . . . . . . . . . . . . . . . . . 42.56 78
Labour Market1.3.1 Tertiary-educated unemployment . . . . . . . . . . . . . . . . . . . . . . . . . . . .36.90 1201.3.2 Active labour market policies . . . . . . . . . . . . . . . . . . . . . . . . . . . . . . . . . 27.24 981.3.3 Labour-employer cooperation . . . . . . . . . . . . . . . . . . . . . . . . . . . . . . . .55.56 33
Management Practice1.3.4 Professional management . . . . . . . . . . . . . . . . . . . . . . . . . . . . . . . . . . . . 47.62 701.3.5 Relationship of pay to productivity . . . . . . . . . . . . . . . . . . . . . . . . . . . .63.88 36
Technology Adoption1.3.6 Technology utilisation. . . . . . . . . . . . . . . . . . . . . . . . . . . . . . . . . . . . . . . . .44.87 811.3.7 Investment in emerging technologies . . . . . . . . . . . . . . . . . . . . . . . . 21.88 1161.3.8 Robot density . . . . . . . . . . . . . . . . . . . . . . . . . . . . . . . . . . . . . . . . . . . . . . . . . . .n/a n/a
2 ATTRACT . . . . . . . . . . . . . . . . . . . . . . . . . . . . . . . . . . . . . . . . . .49.58 622.1 External Openness . . . . . . . . . . . . . . . . . . . . . . . . . . . . . . . . . . . . . . . . . 32.50 102
Attract Business2.1.1 FDI and technology transfer . . . . . . . . . . . . . . . . . . . . . . . . . . . . . . . . . .73.48 282.1.2 Prevalence of foreign ownership . . . . . . . . . . . . . . . . . . . . . . . . . . . . . .50.71 93
Attract People2.1.3 Migrant stock . . . . . . . . . . . . . . . . . . . . . . . . . . . . . . . . . . . . . . . . . . . . . . . . . 15.50 1062.1.4 International students . . . . . . . . . . . . . . . . . . . . . . . . . . . . . . . . . . . . . . . . . . 5.47 762.1.5 Brain gain . . . . . . . . . . . . . . . . . . . . . . . . . . . . . . . . . . . . . . . . . . . . . . . . . . . . . 17.32 1232.2 Internal Openness . . . . . . . . . . . . . . . . . . . . . . . . . . . . . . . . . . . . . . . . . . 66.67 34
Social Inclusion2.2.1 Tolerance of minorities . . . . . . . . . . . . . . . . . . . . . . . . . . . . . . . . . . . . . . . .63.33 382.2.2 Tolerance of immigrants . . . . . . . . . . . . . . . . . . . . . . . . . . . . . . . . . . . . . . 45.21 912.2.3 Social mobility . . . . . . . . . . . . . . . . . . . . . . . . . . . . . . . . . . . . . . . . . . . . . . . . 43.41 109
Gender Equality2.2.4 Female graduates . . . . . . . . . . . . . . . . . . . . . . . . . . . . . . . . . . . . . . . . . . . . .91.00 122.2.5 Gender development gap . . . . . . . . . . . . . . . . . . . . . . . . . . . . . . . . . . . .78.38 622.2.6 Leadership opportunities for women . . . . . . . . . . . . . . . . . . . . . . . . .78.67 14
Score Rank
3 GROW . . . . . . . . . . . . . . . . . . . . . . . . . . . . . . . . . . . . . . . . . . . . 36.54 733.1 Formal Education . . . . . . . . . . . . . . . . . . . . . . . . . . . . . . . . . . . . . . . . . . . 22.13 74
Enrolment3.1.1 Vocational enrolment . . . . . . . . . . . . . . . . . . . . . . . . . . . . . . . . . . . . . . . . .13.80 753.1.2 Tertiary enrolment . . . . . . . . . . . . . . . . . . . . . . . . . . . . . . . . . . . . . . . . . . . .44.74 50
Quality3.1.3 Tertiary education expenditure . . . . . . . . . . . . . . . . . . . . . . . . . . . . . . .16.27 783.1.4 Reading, maths, and science . . . . . . . . . . . . . . . . . . . . . . . . . . . . . . . . . .35.84 563.1.5 University ranking . . . . . . . . . . . . . . . . . . . . . . . . . . . . . . . . . . . . . . . . . . . . . . 0.00 753.2 Lifelong Learning . . . . . . . . . . . . . . . . . . . . . . . . . . . . . . . . . . . . . . . . . . . 39.24 763.2.1 Quality of management schools . . . . . . . . . . . . . . . . . . . . . . . . . . . . . .45.05 753.2.2 Prevalence of training in firms . . . . . . . . . . . . . . . . . . . . . . . . . . . . . . . . . 31.27 573.2.3 Employee development . . . . . . . . . . . . . . . . . . . . . . . . . . . . . . . . . . . . . . 41.39 593.3 Access to Growth Opportunities . . . . . . . . . . . . . . . . . . . . . . . . . . . 48.27 61
Empowerment3.3.1 Delegation of authority . . . . . . . . . . . . . . . . . . . . . . . . . . . . . . . . . . . . . . .38.47 883.3.2 Personal rights . . . . . . . . . . . . . . . . . . . . . . . . . . . . . . . . . . . . . . . . . . . . . . . .80.36 52
Collaboration3.3.3 Use of virtual social networks . . . . . . . . . . . . . . . . . . . . . . . . . . . . . . . . .73.45 693.3.4 Use of virtual professional networks . . . . . . . . . . . . . . . . . . . . . . . . . . . 8.86 663.3.5 Collaboration within organisations . . . . . . . . . . . . . . . . . . . . . . . . . . . . 47.97 633.3.6 Collaboration across organisations . . . . . . . . . . . . . . . . . . . . . . . . . . . .40.49 61
4 RETAIN . . . . . . . . . . . . . . . . . . . . . . . . . . . . . . . . . . . . . . . . . . . .43.91 784.1 Sustainability . . . . . . . . . . . . . . . . . . . . . . . . . . . . . . . . . . . . . . . . . . . . . . . 27.75 1044.1.1 Pension system . . . . . . . . . . . . . . . . . . . . . . . . . . . . . . . . . . . . . . . . . . . . . . . . .n/a n/a4.1.2 Social protection . . . . . . . . . . . . . . . . . . . . . . . . . . . . . . . . . . . . . . . . . . . . . .33.21 854.1.3 Brain retention . . . . . . . . . . . . . . . . . . . . . . . . . . . . . . . . . . . . . . . . . . . . . . . .22.29 1114.2 Lifestyle . . . . . . . . . . . . . . . . . . . . . . . . . . . . . . . . . . . . . . . . . . . . . . . . . . . . 60.07 544.2.1 Environmental performance . . . . . . . . . . . . . . . . . . . . . . . . . . . . . . . . . .63.39 364.2.2 Personal safety . . . . . . . . . . . . . . . . . . . . . . . . . . . . . . . . . . . . . . . . . . . . . . . .59.05 574.2.3 Physician density . . . . . . . . . . . . . . . . . . . . . . . . . . . . . . . . . . . . . . . . . . . . . .20.32 774.2.4 Sanitation . . . . . . . . . . . . . . . . . . . . . . . . . . . . . . . . . . . . . . . . . . . . . . . . . . . . . 97.51 42
5 VOCATIONAL AND TECHNICAL SKILLS . . . . . . . . . . . . 44.22 655.1 Mid-Level Skills . . . . . . . . . . . . . . . . . . . . . . . . . . . . . . . . . . . . . . . . . . . . . 33.37 775.1.1 Workforce with secondary education . . . . . . . . . . . . . . . . . . . . . . . . .48.51 625.1.2 Population with secondary education . . . . . . . . . . . . . . . . . . . . . . . .45.02 555.1.3 Technicians and associate professionals . . . . . . . . . . . . . . . . . . . . . . .20.84 895.1.4 Labour productivity per employee . . . . . . . . . . . . . . . . . . . . . . . . . . . . 19.10 715.2 Employability . . . . . . . . . . . . . . . . . . . . . . . . . . . . . . . . . . . . . . . . . . . . . . . 55.06 495.2.1 Ease of finding skilled employees . . . . . . . . . . . . . . . . . . . . . . . . . . . . .53.07 705.2.2 Relevance of education system to the economy . . . . . . . . . . . . . . 61.66 365.2.3 Skills matching with secondary education . . . . . . . . . . . . . . . . . . . . 51.24 465.2.4 Skills matching with tertiary education . . . . . . . . . . . . . . . . . . . . . . . .54.28 67
6 GLOBAL KNOWLEDGE SKILLS . . . . . . . . . . . . . . . . . . . . .14.41 1046.1 High-Level Skills . . . . . . . . . . . . . . . . . . . . . . . . . . . . . . . . . . . . . . . . . . . . 21.28 896.1.1 Workforce with tertiary education . . . . . . . . . . . . . . . . . . . . . . . . . . . . 28.16 696.1.2 Population with tertiary education . . . . . . . . . . . . . . . . . . . . . . . . . . . . 19.41 746.1.3 Professionals . . . . . . . . . . . . . . . . . . . . . . . . . . . . . . . . . . . . . . . . . . . . . . . . . . 29.17 596.1.4 Researchers . . . . . . . . . . . . . . . . . . . . . . . . . . . . . . . . . . . . . . . . . . . . . . . . . . . . 1.77 836.1.5 Senior officials and managers . . . . . . . . . . . . . . . . . . . . . . . . . . . . . . . . . . 5.61 1116.1.6 Availability of scientists and engineers . . . . . . . . . . . . . . . . . . . . . . . .43.55 776.2 Talent Impact . . . . . . . . . . . . . . . . . . . . . . . . . . . . . . . . . . . . . . . . . . . . . . . . 7.54 1166.2.1 Innovation output . . . . . . . . . . . . . . . . . . . . . . . . . . . . . . . . . . . . . . . . . . . .20.84 906.2.2 High-value exports . . . . . . . . . . . . . . . . . . . . . . . . . . . . . . . . . . . . . . . . . . . . . 0.25 1246.2.3 New product entrepreneurial activity . . . . . . . . . . . . . . . . . . . . . . . . . . .n/a n/a6.2.4 New business density . . . . . . . . . . . . . . . . . . . . . . . . . . . . . . . . . . . . . . . . . . 6.47 626.2.5 Scientific journal articles . . . . . . . . . . . . . . . . . . . . . . . . . . . . . . . . . . . . . . . 2.60 79
l Albania l Income group average

GTCI 2020 Country Profile by Pillar
128 THE GLOBAL TALENT COMPETITIVENESS INDEX 2020
COUNTRY PROFILESCOUNTRY PROFILES
102030405060708090100
Global knowledge skills
Vocational andtechnical skills
Retain
Grow
Attract
Enable
1020304040
ALGERIAKey Indicators
Rank (out of 132) . . . . . . . . . . . . . . . . . . . . . . . . . . . . . . . . . . . .105Income group . . . . . . . . . . . . . . . . . . . . . . . . . . . Upper-middle incomeRegional group . . . . . . . . . . . . . .Northern Africa and Western AsiaPopulation (millions) . . . . . . . . . . . . . . . . . . . . . . . . . . . . . . . . . . . . 42.23
GDP per capita (PPP US$) . . . . . . . . . . . . . . . . . . . . . . . . . . . . 15,621.86GDP (US$ billions) . . . . . . . . . . . . . . . . . . . . . . . . . . . . . . . . . . . . . 180.69GTCI score . . . . . . . . . . . . . . . . . . . . . . . . . . . . . . . . . . . . . . . . . . . . . . 30.75GTCI score (income group average) . . . . . . . . . . . . . . . . . . . . . . . . 41.25
Score Rank
1 ENABLE . . . . . . . . . . . . . . . . . . . . . . . . . . . . . . . . . . . . . . . . . . . 33.14 1171.1 Regulatory Landscape . . . . . . . . . . . . . . . . . . . . . . . . . . . . . . . . . . . . . . 31.12 1161.1.1 Government effectiveness . . . . . . . . . . . . . . . . . . . . . . . . . . . . . . . . . . . .32.08 1041.1.2 Rule of law . . . . . . . . . . . . . . . . . . . . . . . . . . . . . . . . . . . . . . . . . . . . . . . . . . . . 32.47 1151.1.3 Political stability . . . . . . . . . . . . . . . . . . . . . . . . . . . . . . . . . . . . . . . . . . . . . . . 43.93 1141.1.4 Regulatory quality. . . . . . . . . . . . . . . . . . . . . . . . . . . . . . . . . . . . . . . . . . . . .18.72 1271.1.5 Corruption . . . . . . . . . . . . . . . . . . . . . . . . . . . . . . . . . . . . . . . . . . . . . . . . . . . .28.38 871.2 Market Landscape . . . . . . . . . . . . . . . . . . . . . . . . . . . . . . . . . . . . . . . . . . 39.53 971.2.1 Competition intensity . . . . . . . . . . . . . . . . . . . . . . . . . . . . . . . . . . . . . . . . . 46.13 1231.2.2 Ease of doing business . . . . . . . . . . . . . . . . . . . . . . . . . . . . . . . . . . . . . . . .34.01 1221.2.3 Cluster development . . . . . . . . . . . . . . . . . . . . . . . . . . . . . . . . . . . . . . . . . . 33.12 931.2.4 R&D expenditure . . . . . . . . . . . . . . . . . . . . . . . . . . . . . . . . . . . . . . . . . . . . . . 11.38 581.2.5 ICT infrastructure. . . . . . . . . . . . . . . . . . . . . . . . . . . . . . . . . . . . . . . . . . . . . .44.02 801.2.6 Urban population . . . . . . . . . . . . . . . . . . . . . . . . . . . . . . . . . . . . . . . . . . . . .68.53 481.3 Business and Labour Landscape . . . . . . . . . . . . . . . . . . . . . . . . . . . . 28.78 120
Labour Market1.3.1 Tertiary-educated unemployment . . . . . . . . . . . . . . . . . . . . . . . . . . . . . .n/a n/a1.3.2 Active labour market policies . . . . . . . . . . . . . . . . . . . . . . . . . . . . . . . . . 33.18 801.3.3 Labour-employer cooperation . . . . . . . . . . . . . . . . . . . . . . . . . . . . . . . . 27.93 96
Management Practice1.3.4 Professional management . . . . . . . . . . . . . . . . . . . . . . . . . . . . . . . . . . . . 15.97 1301.3.5 Relationship of pay to productivity . . . . . . . . . . . . . . . . . . . . . . . . . . . .35.33 106
Technology Adoption1.3.6 Technology utilisation. . . . . . . . . . . . . . . . . . . . . . . . . . . . . . . . . . . . . . . . .26.37 1181.3.7 Investment in emerging technologies . . . . . . . . . . . . . . . . . . . . . . . . 33.92 841.3.8 Robot density . . . . . . . . . . . . . . . . . . . . . . . . . . . . . . . . . . . . . . . . . . . . . . . . . . .n/a n/a
2 ATTRACT . . . . . . . . . . . . . . . . . . . . . . . . . . . . . . . . . . . . . . . . . 34.08 1232.1 External Openness . . . . . . . . . . . . . . . . . . . . . . . . . . . . . . . . . . . . . . . . . 19.40 129
Attract Business2.1.1 FDI and technology transfer . . . . . . . . . . . . . . . . . . . . . . . . . . . . . . . . . . 37.96 1142.1.2 Prevalence of foreign ownership . . . . . . . . . . . . . . . . . . . . . . . . . . . . . .28.23 124
Attract People2.1.3 Migrant stock . . . . . . . . . . . . . . . . . . . . . . . . . . . . . . . . . . . . . . . . . . . . . . . . .12.00 1122.1.4 International students . . . . . . . . . . . . . . . . . . . . . . . . . . . . . . . . . . . . . . . . . . 1.93 892.1.5 Brain gain . . . . . . . . . . . . . . . . . . . . . . . . . . . . . . . . . . . . . . . . . . . . . . . . . . . . .16.88 1242.2 Internal Openness . . . . . . . . . . . . . . . . . . . . . . . . . . . . . . . . . . . . . . . . . . 48.76 99
Social Inclusion2.2.1 Tolerance of minorities . . . . . . . . . . . . . . . . . . . . . . . . . . . . . . . . . . . . . . . .28.89 942.2.2 Tolerance of immigrants . . . . . . . . . . . . . . . . . . . . . . . . . . . . . . . . . . . . . .26.03 1112.2.3 Social mobility . . . . . . . . . . . . . . . . . . . . . . . . . . . . . . . . . . . . . . . . . . . . . . . .43.05 110
Gender Equality2.2.4 Female graduates . . . . . . . . . . . . . . . . . . . . . . . . . . . . . . . . . . . . . . . . . . . . .90.97 132.2.5 Gender development gap . . . . . . . . . . . . . . . . . . . . . . . . . . . . . . . . . . . .39.26 1212.2.6 Leadership opportunities for women . . . . . . . . . . . . . . . . . . . . . . . . .64.35 33
Score Rank
3 GROW . . . . . . . . . . . . . . . . . . . . . . . . . . . . . . . . . . . . . . . . . . . . 24.98 1163.1 Formal Education . . . . . . . . . . . . . . . . . . . . . . . . . . . . . . . . . . . . . . . . . . . 17.57 84
Enrolment3.1.1 Vocational enrolment . . . . . . . . . . . . . . . . . . . . . . . . . . . . . . . . . . . . . . . . . 12.83 763.1.2 Tertiary enrolment . . . . . . . . . . . . . . . . . . . . . . . . . . . . . . . . . . . . . . . . . . . . 37.38 61
Quality3.1.3 Tertiary education expenditure . . . . . . . . . . . . . . . . . . . . . . . . . . . . . . .26.97 423.1.4 Reading, maths, and science . . . . . . . . . . . . . . . . . . . . . . . . . . . . . . . . . .10.68 663.1.5 University ranking . . . . . . . . . . . . . . . . . . . . . . . . . . . . . . . . . . . . . . . . . . . . . . 0.00 753.2 Lifelong Learning . . . . . . . . . . . . . . . . . . . . . . . . . . . . . . . . . . . . . . . . . . . 26.62 1243.2.1 Quality of management schools . . . . . . . . . . . . . . . . . . . . . . . . . . . . . .29.29 1163.2.2 Prevalence of training in firms . . . . . . . . . . . . . . . . . . . . . . . . . . . . . . . . . . .n/a n/a3.2.3 Employee development . . . . . . . . . . . . . . . . . . . . . . . . . . . . . . . . . . . . . .23.94 1163.3 Access to Growth Opportunities . . . . . . . . . . . . . . . . . . . . . . . . . . . 30.77 122
Empowerment3.3.1 Delegation of authority . . . . . . . . . . . . . . . . . . . . . . . . . . . . . . . . . . . . . . .10.00 1303.3.2 Personal rights . . . . . . . . . . . . . . . . . . . . . . . . . . . . . . . . . . . . . . . . . . . . . . . . 45.92 104
Collaboration3.3.3 Use of virtual social networks . . . . . . . . . . . . . . . . . . . . . . . . . . . . . . . . .65.49 933.3.4 Use of virtual professional networks . . . . . . . . . . . . . . . . . . . . . . . . . . . 4.14 903.3.5 Collaboration within organisations . . . . . . . . . . . . . . . . . . . . . . . . . . . .25.65 1283.3.6 Collaboration across organisations . . . . . . . . . . . . . . . . . . . . . . . . . . . .33.39 82
4 RETAIN . . . . . . . . . . . . . . . . . . . . . . . . . . . . . . . . . . . . . . . . . . . .42.15 844.1 Sustainability . . . . . . . . . . . . . . . . . . . . . . . . . . . . . . . . . . . . . . . . . . . . . . . 33.81 904.1.1 Pension system . . . . . . . . . . . . . . . . . . . . . . . . . . . . . . . . . . . . . . . . . . . . . . . 41.03 614.1.2 Social protection . . . . . . . . . . . . . . . . . . . . . . . . . . . . . . . . . . . . . . . . . . . . . .40.86 714.1.3 Brain retention . . . . . . . . . . . . . . . . . . . . . . . . . . . . . . . . . . . . . . . . . . . . . . . . 19.53 1174.2 Lifestyle . . . . . . . . . . . . . . . . . . . . . . . . . . . . . . . . . . . . . . . . . . . . . . . . . . . . 50.50 804.2.1 Environmental performance . . . . . . . . . . . . . . . . . . . . . . . . . . . . . . . . . . 49.59 764.2.2 Personal safety . . . . . . . . . . . . . . . . . . . . . . . . . . . . . . . . . . . . . . . . . . . . . . . .46.82 834.2.3 Physician density . . . . . . . . . . . . . . . . . . . . . . . . . . . . . . . . . . . . . . . . . . . . . . 19.05 794.2.4 Sanitation . . . . . . . . . . . . . . . . . . . . . . . . . . . . . . . . . . . . . . . . . . . . . . . . . . . . .86.53 75
5 VOCATIONAL AND TECHNICAL SKILLS . . . . . . . . . . . . 34.29 955.1 Mid-Level Skills . . . . . . . . . . . . . . . . . . . . . . . . . . . . . . . . . . . . . . . . . . . . . 31.77 815.1.1 Workforce with secondary education . . . . . . . . . . . . . . . . . . . . . . . . .48.78 615.1.2 Population with secondary education . . . . . . . . . . . . . . . . . . . . . . . .23.35 915.1.3 Technicians and associate professionals . . . . . . . . . . . . . . . . . . . . . . .20.05 925.1.4 Labour productivity per employee . . . . . . . . . . . . . . . . . . . . . . . . . . . .34.90 495.2 Employability . . . . . . . . . . . . . . . . . . . . . . . . . . . . . . . . . . . . . . . . . . . . . . . 36.82 1025.2.1 Ease of finding skilled employees . . . . . . . . . . . . . . . . . . . . . . . . . . . . . 47.97 895.2.2 Relevance of education system to the economy . . . . . . . . . . . . . .33.72 935.2.3 Skills matching with secondary education . . . . . . . . . . . . . . . . . . . .28.95 1095.2.4 Skills matching with tertiary education . . . . . . . . . . . . . . . . . . . . . . . .36.64 115
6 GLOBAL KNOWLEDGE SKILLS . . . . . . . . . . . . . . . . . . . . .15.83 976.1 High-Level Skills . . . . . . . . . . . . . . . . . . . . . . . . . . . . . . . . . . . . . . . . . . . . 24.00 836.1.1 Workforce with tertiary education . . . . . . . . . . . . . . . . . . . . . . . . . . . .33.85 576.1.2 Population with tertiary education . . . . . . . . . . . . . . . . . . . . . . . . . . . . 11.40 906.1.3 Professionals . . . . . . . . . . . . . . . . . . . . . . . . . . . . . . . . . . . . . . . . . . . . . . . . . .25.49 686.1.4 Researchers . . . . . . . . . . . . . . . . . . . . . . . . . . . . . . . . . . . . . . . . . . . . . . . . . . . . 9.83 536.1.5 Senior officials and managers . . . . . . . . . . . . . . . . . . . . . . . . . . . . . . . . . 18.17 726.1.6 Availability of scientists and engineers . . . . . . . . . . . . . . . . . . . . . . . .45.29 736.2 Talent Impact . . . . . . . . . . . . . . . . . . . . . . . . . . . . . . . . . . . . . . . . . . . . . . . . 7.66 1156.2.1 Innovation output . . . . . . . . . . . . . . . . . . . . . . . . . . . . . . . . . . . . . . . . . . . .12.08 1156.2.2 High-value exports . . . . . . . . . . . . . . . . . . . . . . . . . . . . . . . . . . . . . . . . . . . . . 1.61 1156.2.3 New product entrepreneurial activity . . . . . . . . . . . . . . . . . . . . . . . . . 17.57 826.2.4 New business density . . . . . . . . . . . . . . . . . . . . . . . . . . . . . . . . . . . . . . . . . . 2.74 816.2.5 Scientific journal articles . . . . . . . . . . . . . . . . . . . . . . . . . . . . . . . . . . . . . . . 4.31 73
l Algeria l Income group average
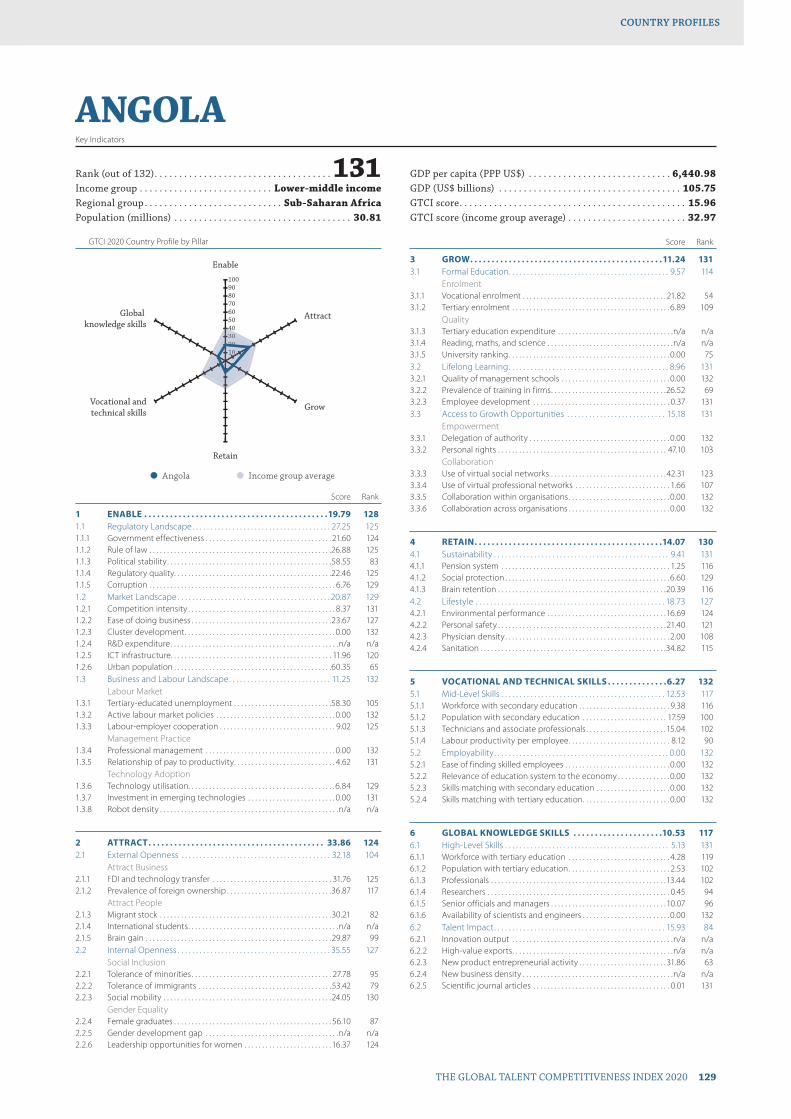
GTCI 2020 Country Profile by Pillar
THE GLOBAL TALENT COMPETITIVENESS INDEX 2020 129
COUNTRY PROFILESCOUNTRY PROFILES
102030405060708090100
Global knowledge skills
Vocational andtechnical skills
Retain
Grow
Attract
Enable
10203004
ANGOLAKey Indicators
Rank (out of 132) . . . . . . . . . . . . . . . . . . . . . . . . . . . . . . . . . . . . 131Income group . . . . . . . . . . . . . . . . . . . . . . . . . . . Lower-middle incomeRegional group . . . . . . . . . . . . . . . . . . . . . . . . . . . . Sub-Saharan AfricaPopulation (millions) . . . . . . . . . . . . . . . . . . . . . . . . . . . . . . . . . . . . 30.81
GDP per capita (PPP US$) . . . . . . . . . . . . . . . . . . . . . . . . . . . . . 6,440.98GDP (US$ billions) . . . . . . . . . . . . . . . . . . . . . . . . . . . . . . . . . . . . . 105.75GTCI score . . . . . . . . . . . . . . . . . . . . . . . . . . . . . . . . . . . . . . . . . . . . . . 15.96GTCI score (income group average) . . . . . . . . . . . . . . . . . . . . . . . . 32.97
Score Rank
1 ENABLE . . . . . . . . . . . . . . . . . . . . . . . . . . . . . . . . . . . . . . . . . . .19.79 1281.1 Regulatory Landscape . . . . . . . . . . . . . . . . . . . . . . . . . . . . . . . . . . . . . . 27.25 1251.1.1 Government effectiveness . . . . . . . . . . . . . . . . . . . . . . . . . . . . . . . . . . . . 21.60 1241.1.2 Rule of law . . . . . . . . . . . . . . . . . . . . . . . . . . . . . . . . . . . . . . . . . . . . . . . . . . . .26.88 1251.1.3 Political stability . . . . . . . . . . . . . . . . . . . . . . . . . . . . . . . . . . . . . . . . . . . . . . .58.55 831.1.4 Regulatory quality. . . . . . . . . . . . . . . . . . . . . . . . . . . . . . . . . . . . . . . . . . . . .22.46 1251.1.5 Corruption . . . . . . . . . . . . . . . . . . . . . . . . . . . . . . . . . . . . . . . . . . . . . . . . . . . . . 6.76 1291.2 Market Landscape . . . . . . . . . . . . . . . . . . . . . . . . . . . . . . . . . . . . . . . . . . 20.87 1291.2.1 Competition intensity . . . . . . . . . . . . . . . . . . . . . . . . . . . . . . . . . . . . . . . . . . 8.37 1311.2.2 Ease of doing business . . . . . . . . . . . . . . . . . . . . . . . . . . . . . . . . . . . . . . . .23.67 1271.2.3 Cluster development . . . . . . . . . . . . . . . . . . . . . . . . . . . . . . . . . . . . . . . . . . . 0.00 1321.2.4 R&D expenditure . . . . . . . . . . . . . . . . . . . . . . . . . . . . . . . . . . . . . . . . . . . . . . . .n/a n/a1.2.5 ICT infrastructure. . . . . . . . . . . . . . . . . . . . . . . . . . . . . . . . . . . . . . . . . . . . . . 11.96 1201.2.6 Urban population . . . . . . . . . . . . . . . . . . . . . . . . . . . . . . . . . . . . . . . . . . . . .60.35 651.3 Business and Labour Landscape . . . . . . . . . . . . . . . . . . . . . . . . . . . . 11.25 132
Labour Market1.3.1 Tertiary-educated unemployment . . . . . . . . . . . . . . . . . . . . . . . . . . . .58.30 1051.3.2 Active labour market policies . . . . . . . . . . . . . . . . . . . . . . . . . . . . . . . . . . 0.00 1321.3.3 Labour-employer cooperation . . . . . . . . . . . . . . . . . . . . . . . . . . . . . . . . . 9.02 125
Management Practice1.3.4 Professional management . . . . . . . . . . . . . . . . . . . . . . . . . . . . . . . . . . . . . 0.00 1321.3.5 Relationship of pay to productivity . . . . . . . . . . . . . . . . . . . . . . . . . . . . . 4.62 131
Technology Adoption1.3.6 Technology utilisation. . . . . . . . . . . . . . . . . . . . . . . . . . . . . . . . . . . . . . . . . .6.84 1291.3.7 Investment in emerging technologies . . . . . . . . . . . . . . . . . . . . . . . . . 0.00 1311.3.8 Robot density . . . . . . . . . . . . . . . . . . . . . . . . . . . . . . . . . . . . . . . . . . . . . . . . . . .n/a n/a
2 ATTRACT . . . . . . . . . . . . . . . . . . . . . . . . . . . . . . . . . . . . . . . . . 33.86 1242.1 External Openness . . . . . . . . . . . . . . . . . . . . . . . . . . . . . . . . . . . . . . . . . 32.18 104
Attract Business2.1.1 FDI and technology transfer . . . . . . . . . . . . . . . . . . . . . . . . . . . . . . . . . . 31.76 1252.1.2 Prevalence of foreign ownership . . . . . . . . . . . . . . . . . . . . . . . . . . . . . .36.87 117
Attract People2.1.3 Migrant stock . . . . . . . . . . . . . . . . . . . . . . . . . . . . . . . . . . . . . . . . . . . . . . . . .30.21 822.1.4 International students . . . . . . . . . . . . . . . . . . . . . . . . . . . . . . . . . . . . . . . . . . .n/a n/a2.1.5 Brain gain . . . . . . . . . . . . . . . . . . . . . . . . . . . . . . . . . . . . . . . . . . . . . . . . . . . . .29.87 992.2 Internal Openness . . . . . . . . . . . . . . . . . . . . . . . . . . . . . . . . . . . . . . . . . . 35.55 127
Social Inclusion2.2.1 Tolerance of minorities . . . . . . . . . . . . . . . . . . . . . . . . . . . . . . . . . . . . . . . . 27.78 952.2.2 Tolerance of immigrants . . . . . . . . . . . . . . . . . . . . . . . . . . . . . . . . . . . . . .53.42 792.2.3 Social mobility . . . . . . . . . . . . . . . . . . . . . . . . . . . . . . . . . . . . . . . . . . . . . . . .24.05 130
Gender Equality2.2.4 Female graduates . . . . . . . . . . . . . . . . . . . . . . . . . . . . . . . . . . . . . . . . . . . . . 56.10 872.2.5 Gender development gap . . . . . . . . . . . . . . . . . . . . . . . . . . . . . . . . . . . . . .n/a n/a2.2.6 Leadership opportunities for women . . . . . . . . . . . . . . . . . . . . . . . . . 16.37 124
Score Rank
3 GROW . . . . . . . . . . . . . . . . . . . . . . . . . . . . . . . . . . . . . . . . . . . . .11.24 1313.1 Formal Education . . . . . . . . . . . . . . . . . . . . . . . . . . . . . . . . . . . . . . . . . . . . 9.57 114
Enrolment3.1.1 Vocational enrolment . . . . . . . . . . . . . . . . . . . . . . . . . . . . . . . . . . . . . . . . . 21.82 543.1.2 Tertiary enrolment . . . . . . . . . . . . . . . . . . . . . . . . . . . . . . . . . . . . . . . . . . . . . 6.89 109
Quality3.1.3 Tertiary education expenditure . . . . . . . . . . . . . . . . . . . . . . . . . . . . . . . . .n/a n/a3.1.4 Reading, maths, and science . . . . . . . . . . . . . . . . . . . . . . . . . . . . . . . . . . . .n/a n/a3.1.5 University ranking . . . . . . . . . . . . . . . . . . . . . . . . . . . . . . . . . . . . . . . . . . . . . . 0.00 753.2 Lifelong Learning . . . . . . . . . . . . . . . . . . . . . . . . . . . . . . . . . . . . . . . . . . . . 8.96 1313.2.1 Quality of management schools . . . . . . . . . . . . . . . . . . . . . . . . . . . . . . . 0.00 1323.2.2 Prevalence of training in firms . . . . . . . . . . . . . . . . . . . . . . . . . . . . . . . . .26.52 693.2.3 Employee development . . . . . . . . . . . . . . . . . . . . . . . . . . . . . . . . . . . . . . . 0.37 1313.3 Access to Growth Opportunities . . . . . . . . . . . . . . . . . . . . . . . . . . . 15.18 131
Empowerment3.3.1 Delegation of authority . . . . . . . . . . . . . . . . . . . . . . . . . . . . . . . . . . . . . . . . 0.00 1323.3.2 Personal rights . . . . . . . . . . . . . . . . . . . . . . . . . . . . . . . . . . . . . . . . . . . . . . . . 47.10 103
Collaboration3.3.3 Use of virtual social networks . . . . . . . . . . . . . . . . . . . . . . . . . . . . . . . . . 42.31 1233.3.4 Use of virtual professional networks . . . . . . . . . . . . . . . . . . . . . . . . . . . 1.66 1073.3.5 Collaboration within organisations . . . . . . . . . . . . . . . . . . . . . . . . . . . . . 0.00 1323.3.6 Collaboration across organisations . . . . . . . . . . . . . . . . . . . . . . . . . . . . . 0.00 132
4 RETAIN . . . . . . . . . . . . . . . . . . . . . . . . . . . . . . . . . . . . . . . . . . . .14.07 1304.1 Sustainability . . . . . . . . . . . . . . . . . . . . . . . . . . . . . . . . . . . . . . . . . . . . . . . . 9.41 1314.1.1 Pension system . . . . . . . . . . . . . . . . . . . . . . . . . . . . . . . . . . . . . . . . . . . . . . . . 1.25 1164.1.2 Social protection . . . . . . . . . . . . . . . . . . . . . . . . . . . . . . . . . . . . . . . . . . . . . . . 6.60 1294.1.3 Brain retention . . . . . . . . . . . . . . . . . . . . . . . . . . . . . . . . . . . . . . . . . . . . . . . .20.39 1164.2 Lifestyle . . . . . . . . . . . . . . . . . . . . . . . . . . . . . . . . . . . . . . . . . . . . . . . . . . . . 18.73 1274.2.1 Environmental performance . . . . . . . . . . . . . . . . . . . . . . . . . . . . . . . . . .16.69 1244.2.2 Personal safety . . . . . . . . . . . . . . . . . . . . . . . . . . . . . . . . . . . . . . . . . . . . . . . . 21.40 1214.2.3 Physician density . . . . . . . . . . . . . . . . . . . . . . . . . . . . . . . . . . . . . . . . . . . . . . . 2.00 1084.2.4 Sanitation . . . . . . . . . . . . . . . . . . . . . . . . . . . . . . . . . . . . . . . . . . . . . . . . . . . . .34.82 115
5 VOCATIONAL AND TECHNICAL SKILLS . . . . . . . . . . . . . .6.27 1325.1 Mid-Level Skills . . . . . . . . . . . . . . . . . . . . . . . . . . . . . . . . . . . . . . . . . . . . . 12.53 1175.1.1 Workforce with secondary education . . . . . . . . . . . . . . . . . . . . . . . . . . 9.38 1165.1.2 Population with secondary education . . . . . . . . . . . . . . . . . . . . . . . . 17.59 1005.1.3 Technicians and associate professionals . . . . . . . . . . . . . . . . . . . . . . .15.04 1025.1.4 Labour productivity per employee . . . . . . . . . . . . . . . . . . . . . . . . . . . . . 8.12 905.2 Employability . . . . . . . . . . . . . . . . . . . . . . . . . . . . . . . . . . . . . . . . . . . . . . . . 0.00 1325.2.1 Ease of finding skilled employees . . . . . . . . . . . . . . . . . . . . . . . . . . . . . . 0.00 1325.2.2 Relevance of education system to the economy . . . . . . . . . . . . . . . 0.00 1325.2.3 Skills matching with secondary education . . . . . . . . . . . . . . . . . . . . . 0.00 1325.2.4 Skills matching with tertiary education . . . . . . . . . . . . . . . . . . . . . . . . . 0.00 132
6 GLOBAL KNOWLEDGE SKILLS . . . . . . . . . . . . . . . . . . . . .10.53 1176.1 High-Level Skills . . . . . . . . . . . . . . . . . . . . . . . . . . . . . . . . . . . . . . . . . . . . . 5.13 1316.1.1 Workforce with tertiary education . . . . . . . . . . . . . . . . . . . . . . . . . . . . . 4.28 1196.1.2 Population with tertiary education . . . . . . . . . . . . . . . . . . . . . . . . . . . . . 2.53 1026.1.3 Professionals . . . . . . . . . . . . . . . . . . . . . . . . . . . . . . . . . . . . . . . . . . . . . . . . . .13.44 1026.1.4 Researchers . . . . . . . . . . . . . . . . . . . . . . . . . . . . . . . . . . . . . . . . . . . . . . . . . . . . 0.45 946.1.5 Senior officials and managers . . . . . . . . . . . . . . . . . . . . . . . . . . . . . . . . . 10.07 966.1.6 Availability of scientists and engineers . . . . . . . . . . . . . . . . . . . . . . . . . 0.00 1326.2 Talent Impact . . . . . . . . . . . . . . . . . . . . . . . . . . . . . . . . . . . . . . . . . . . . . . . 15.93 846.2.1 Innovation output . . . . . . . . . . . . . . . . . . . . . . . . . . . . . . . . . . . . . . . . . . . . . .n/a n/a6.2.2 High-value exports . . . . . . . . . . . . . . . . . . . . . . . . . . . . . . . . . . . . . . . . . . . . . .n/a n/a6.2.3 New product entrepreneurial activity . . . . . . . . . . . . . . . . . . . . . . . . . 31.86 636.2.4 New business density . . . . . . . . . . . . . . . . . . . . . . . . . . . . . . . . . . . . . . . . . . .n/a n/a6.2.5 Scientific journal articles . . . . . . . . . . . . . . . . . . . . . . . . . . . . . . . . . . . . . . . 0.01 131
l Angola l Income group average
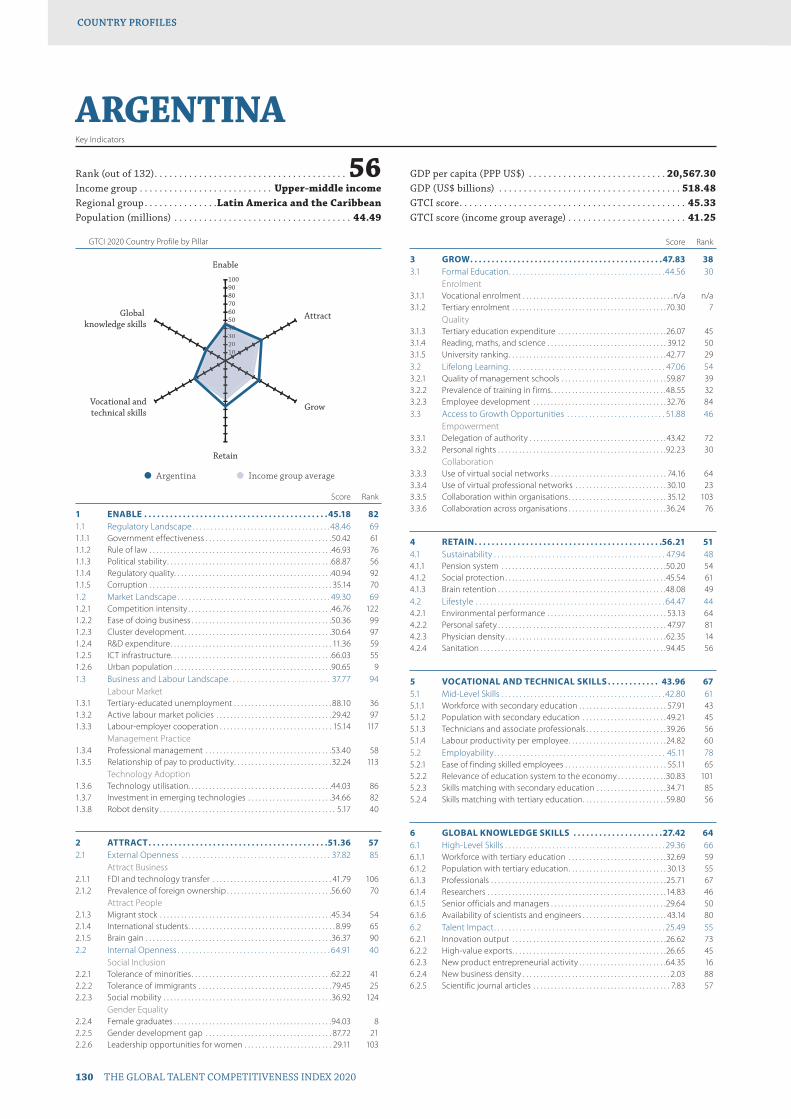
GTCI 2020 Country Profile by Pillar
130 THE GLOBAL TALENT COMPETITIVENESS INDEX 2020
COUNTRY PROFILESCOUNTRY PROFILES
102030405060708090100
Global knowledge skills
Vocational andtechnical skills
Retain
Grow
Attract
Enable
1020304040
ARGENTINAKey Indicators
Rank (out of 132) . . . . . . . . . . . . . . . . . . . . . . . . . . . . . . . . . . . . . . . 56Income group . . . . . . . . . . . . . . . . . . . . . . . . . . . Upper-middle incomeRegional group . . . . . . . . . . . . . . .Latin America and the CaribbeanPopulation (millions) . . . . . . . . . . . . . . . . . . . . . . . . . . . . . . . . . . . . 44.49
GDP per capita (PPP US$) . . . . . . . . . . . . . . . . . . . . . . . . . . . . 20,567.30GDP (US$ billions) . . . . . . . . . . . . . . . . . . . . . . . . . . . . . . . . . . . . . 518.48GTCI score . . . . . . . . . . . . . . . . . . . . . . . . . . . . . . . . . . . . . . . . . . . . . . 45.33GTCI score (income group average) . . . . . . . . . . . . . . . . . . . . . . . . 41.25
Score Rank
1 ENABLE . . . . . . . . . . . . . . . . . . . . . . . . . . . . . . . . . . . . . . . . . . .45.18 821.1 Regulatory Landscape . . . . . . . . . . . . . . . . . . . . . . . . . . . . . . . . . . . . . .48.46 691.1.1 Government effectiveness . . . . . . . . . . . . . . . . . . . . . . . . . . . . . . . . . . . .50.42 611.1.2 Rule of law . . . . . . . . . . . . . . . . . . . . . . . . . . . . . . . . . . . . . . . . . . . . . . . . . . . .46.93 761.1.3 Political stability . . . . . . . . . . . . . . . . . . . . . . . . . . . . . . . . . . . . . . . . . . . . . . .68.87 561.1.4 Regulatory quality. . . . . . . . . . . . . . . . . . . . . . . . . . . . . . . . . . . . . . . . . . . . .40.94 921.1.5 Corruption . . . . . . . . . . . . . . . . . . . . . . . . . . . . . . . . . . . . . . . . . . . . . . . . . . . . 35.14 701.2 Market Landscape . . . . . . . . . . . . . . . . . . . . . . . . . . . . . . . . . . . . . . . . . . 49.30 691.2.1 Competition intensity . . . . . . . . . . . . . . . . . . . . . . . . . . . . . . . . . . . . . . . . .46.76 1221.2.2 Ease of doing business . . . . . . . . . . . . . . . . . . . . . . . . . . . . . . . . . . . . . . . .50.36 991.2.3 Cluster development . . . . . . . . . . . . . . . . . . . . . . . . . . . . . . . . . . . . . . . . . .30.64 971.2.4 R&D expenditure . . . . . . . . . . . . . . . . . . . . . . . . . . . . . . . . . . . . . . . . . . . . . . 11.36 591.2.5 ICT infrastructure. . . . . . . . . . . . . . . . . . . . . . . . . . . . . . . . . . . . . . . . . . . . . .66.03 551.2.6 Urban population . . . . . . . . . . . . . . . . . . . . . . . . . . . . . . . . . . . . . . . . . . . . .90.65 91.3 Business and Labour Landscape . . . . . . . . . . . . . . . . . . . . . . . . . . . . 37.77 94
Labour Market1.3.1 Tertiary-educated unemployment . . . . . . . . . . . . . . . . . . . . . . . . . . . . 88.10 361.3.2 Active labour market policies . . . . . . . . . . . . . . . . . . . . . . . . . . . . . . . . . 29.42 971.3.3 Labour-employer cooperation . . . . . . . . . . . . . . . . . . . . . . . . . . . . . . . . 15.14 117
Management Practice1.3.4 Professional management . . . . . . . . . . . . . . . . . . . . . . . . . . . . . . . . . . . .53.40 581.3.5 Relationship of pay to productivity . . . . . . . . . . . . . . . . . . . . . . . . . . . .32.24 113
Technology Adoption1.3.6 Technology utilisation. . . . . . . . . . . . . . . . . . . . . . . . . . . . . . . . . . . . . . . . .44.03 861.3.7 Investment in emerging technologies . . . . . . . . . . . . . . . . . . . . . . . .34.66 821.3.8 Robot density . . . . . . . . . . . . . . . . . . . . . . . . . . . . . . . . . . . . . . . . . . . . . . . . . . 5.17 40
2 ATTRACT . . . . . . . . . . . . . . . . . . . . . . . . . . . . . . . . . . . . . . . . . .51.36 572.1 External Openness . . . . . . . . . . . . . . . . . . . . . . . . . . . . . . . . . . . . . . . . . 37.82 85
Attract Business2.1.1 FDI and technology transfer . . . . . . . . . . . . . . . . . . . . . . . . . . . . . . . . . . 41.79 1062.1.2 Prevalence of foreign ownership . . . . . . . . . . . . . . . . . . . . . . . . . . . . . .56.60 70
Attract People2.1.3 Migrant stock . . . . . . . . . . . . . . . . . . . . . . . . . . . . . . . . . . . . . . . . . . . . . . . . .45.34 542.1.4 International students . . . . . . . . . . . . . . . . . . . . . . . . . . . . . . . . . . . . . . . . . . 8.99 652.1.5 Brain gain . . . . . . . . . . . . . . . . . . . . . . . . . . . . . . . . . . . . . . . . . . . . . . . . . . . . .36.37 902.2 Internal Openness . . . . . . . . . . . . . . . . . . . . . . . . . . . . . . . . . . . . . . . . . . 64.91 40
Social Inclusion2.2.1 Tolerance of minorities . . . . . . . . . . . . . . . . . . . . . . . . . . . . . . . . . . . . . . . .62.22 412.2.2 Tolerance of immigrants . . . . . . . . . . . . . . . . . . . . . . . . . . . . . . . . . . . . . . 79.45 252.2.3 Social mobility . . . . . . . . . . . . . . . . . . . . . . . . . . . . . . . . . . . . . . . . . . . . . . . .36.92 124
Gender Equality2.2.4 Female graduates . . . . . . . . . . . . . . . . . . . . . . . . . . . . . . . . . . . . . . . . . . . . .94.03 82.2.5 Gender development gap . . . . . . . . . . . . . . . . . . . . . . . . . . . . . . . . . . . . 87.72 212.2.6 Leadership opportunities for women . . . . . . . . . . . . . . . . . . . . . . . . . 29.11 103
Score Rank
3 GROW . . . . . . . . . . . . . . . . . . . . . . . . . . . . . . . . . . . . . . . . . . . . .47.83 383.1 Formal Education . . . . . . . . . . . . . . . . . . . . . . . . . . . . . . . . . . . . . . . . . . .44.56 30
Enrolment3.1.1 Vocational enrolment . . . . . . . . . . . . . . . . . . . . . . . . . . . . . . . . . . . . . . . . . . .n/a n/a3.1.2 Tertiary enrolment . . . . . . . . . . . . . . . . . . . . . . . . . . . . . . . . . . . . . . . . . . . .70.30 7
Quality3.1.3 Tertiary education expenditure . . . . . . . . . . . . . . . . . . . . . . . . . . . . . . .26.07 453.1.4 Reading, maths, and science . . . . . . . . . . . . . . . . . . . . . . . . . . . . . . . . . . 39.12 503.1.5 University ranking . . . . . . . . . . . . . . . . . . . . . . . . . . . . . . . . . . . . . . . . . . . . .42.77 293.2 Lifelong Learning . . . . . . . . . . . . . . . . . . . . . . . . . . . . . . . . . . . . . . . . . . . 47.06 543.2.1 Quality of management schools . . . . . . . . . . . . . . . . . . . . . . . . . . . . . . 59.87 393.2.2 Prevalence of training in firms . . . . . . . . . . . . . . . . . . . . . . . . . . . . . . . . .48.55 323.2.3 Employee development . . . . . . . . . . . . . . . . . . . . . . . . . . . . . . . . . . . . . . 32.76 843.3 Access to Growth Opportunities . . . . . . . . . . . . . . . . . . . . . . . . . . . 51.88 46
Empowerment3.3.1 Delegation of authority . . . . . . . . . . . . . . . . . . . . . . . . . . . . . . . . . . . . . . . 43.42 723.3.2 Personal rights . . . . . . . . . . . . . . . . . . . . . . . . . . . . . . . . . . . . . . . . . . . . . . . .92.23 30
Collaboration3.3.3 Use of virtual social networks . . . . . . . . . . . . . . . . . . . . . . . . . . . . . . . . . 74.16 643.3.4 Use of virtual professional networks . . . . . . . . . . . . . . . . . . . . . . . . . . 30.10 233.3.5 Collaboration within organisations . . . . . . . . . . . . . . . . . . . . . . . . . . . . 35.12 1033.3.6 Collaboration across organisations . . . . . . . . . . . . . . . . . . . . . . . . . . . .36.24 76
4 RETAIN . . . . . . . . . . . . . . . . . . . . . . . . . . . . . . . . . . . . . . . . . . . .56.21 514.1 Sustainability . . . . . . . . . . . . . . . . . . . . . . . . . . . . . . . . . . . . . . . . . . . . . . . 47.94 484.1.1 Pension system . . . . . . . . . . . . . . . . . . . . . . . . . . . . . . . . . . . . . . . . . . . . . . .50.20 544.1.2 Social protection . . . . . . . . . . . . . . . . . . . . . . . . . . . . . . . . . . . . . . . . . . . . . .45.54 614.1.3 Brain retention . . . . . . . . . . . . . . . . . . . . . . . . . . . . . . . . . . . . . . . . . . . . . . . .48.08 494.2 Lifestyle . . . . . . . . . . . . . . . . . . . . . . . . . . . . . . . . . . . . . . . . . . . . . . . . . . . . 64.47 444.2.1 Environmental performance . . . . . . . . . . . . . . . . . . . . . . . . . . . . . . . . . . 53.13 644.2.2 Personal safety . . . . . . . . . . . . . . . . . . . . . . . . . . . . . . . . . . . . . . . . . . . . . . . . 47.97 814.2.3 Physician density . . . . . . . . . . . . . . . . . . . . . . . . . . . . . . . . . . . . . . . . . . . . . .62.35 144.2.4 Sanitation . . . . . . . . . . . . . . . . . . . . . . . . . . . . . . . . . . . . . . . . . . . . . . . . . . . . .94.45 56
5 VOCATIONAL AND TECHNICAL SKILLS . . . . . . . . . . . . 43.96 675.1 Mid-Level Skills . . . . . . . . . . . . . . . . . . . . . . . . . . . . . . . . . . . . . . . . . . . . . 42.80 615.1.1 Workforce with secondary education . . . . . . . . . . . . . . . . . . . . . . . . . 57.91 435.1.2 Population with secondary education . . . . . . . . . . . . . . . . . . . . . . . . 49.21 455.1.3 Technicians and associate professionals . . . . . . . . . . . . . . . . . . . . . . .39.26 565.1.4 Labour productivity per employee . . . . . . . . . . . . . . . . . . . . . . . . . . . .24.82 605.2 Employability . . . . . . . . . . . . . . . . . . . . . . . . . . . . . . . . . . . . . . . . . . . . . . . 45.11 785.2.1 Ease of finding skilled employees . . . . . . . . . . . . . . . . . . . . . . . . . . . . . 55.11 655.2.2 Relevance of education system to the economy . . . . . . . . . . . . . .30.83 1015.2.3 Skills matching with secondary education . . . . . . . . . . . . . . . . . . . .34.71 855.2.4 Skills matching with tertiary education . . . . . . . . . . . . . . . . . . . . . . . .59.80 56
6 GLOBAL KNOWLEDGE SKILLS . . . . . . . . . . . . . . . . . . . . .27.42 646.1 High-Level Skills . . . . . . . . . . . . . . . . . . . . . . . . . . . . . . . . . . . . . . . . . . . . 29.36 666.1.1 Workforce with tertiary education . . . . . . . . . . . . . . . . . . . . . . . . . . . .32.69 596.1.2 Population with tertiary education . . . . . . . . . . . . . . . . . . . . . . . . . . . . 30.13 556.1.3 Professionals . . . . . . . . . . . . . . . . . . . . . . . . . . . . . . . . . . . . . . . . . . . . . . . . . .25.71 676.1.4 Researchers . . . . . . . . . . . . . . . . . . . . . . . . . . . . . . . . . . . . . . . . . . . . . . . . . . .14.83 466.1.5 Senior officials and managers . . . . . . . . . . . . . . . . . . . . . . . . . . . . . . . . .29.64 506.1.6 Availability of scientists and engineers . . . . . . . . . . . . . . . . . . . . . . . . 43.14 806.2 Talent Impact . . . . . . . . . . . . . . . . . . . . . . . . . . . . . . . . . . . . . . . . . . . . . . . 25.49 556.2.1 Innovation output . . . . . . . . . . . . . . . . . . . . . . . . . . . . . . . . . . . . . . . . . . . .26.62 736.2.2 High-value exports . . . . . . . . . . . . . . . . . . . . . . . . . . . . . . . . . . . . . . . . . . . .26.65 456.2.3 New product entrepreneurial activity . . . . . . . . . . . . . . . . . . . . . . . . .64.35 166.2.4 New business density . . . . . . . . . . . . . . . . . . . . . . . . . . . . . . . . . . . . . . . . . . 2.03 886.2.5 Scientific journal articles . . . . . . . . . . . . . . . . . . . . . . . . . . . . . . . . . . . . . . . 7.83 57
l Argentina l Income group average

GTCI 2020 Country Profile by Pillar
THE GLOBAL TALENT COMPETITIVENESS INDEX 2020 131
COUNTRY PROFILESCOUNTRY PROFILES
102030405060708090100
Global knowledge skills
Vocational andtechnical skills
Retain
Grow
Attract
Enable
1020304040
ARMENIAKey Indicators
Rank (out of 132) . . . . . . . . . . . . . . . . . . . . . . . . . . . . . . . . . . . . . . . 60Income group . . . . . . . . . . . . . . . . . . . . . . . . . . . Upper-middle incomeRegional group . . . . . . . . . . . . . .Northern Africa and Western AsiaPopulation (millions) . . . . . . . . . . . . . . . . . . . . . . . . . . . . . . . . . . . . . 2.95
GDP per capita (PPP US$) . . . . . . . . . . . . . . . . . . . . . . . . . . . . 10,324.94GDP (US$ billions) . . . . . . . . . . . . . . . . . . . . . . . . . . . . . . . . . . . . . . 12.43GTCI score . . . . . . . . . . . . . . . . . . . . . . . . . . . . . . . . . . . . . . . . . . . . . . 43.52GTCI score (income group average) . . . . . . . . . . . . . . . . . . . . . . . . 41.25
Score Rank
1 ENABLE . . . . . . . . . . . . . . . . . . . . . . . . . . . . . . . . . . . . . . . . . . 48.78 611.1 Regulatory Landscape . . . . . . . . . . . . . . . . . . . . . . . . . . . . . . . . . . . . . . 45.22 791.1.1 Government effectiveness . . . . . . . . . . . . . . . . . . . . . . . . . . . . . . . . . . . .44.20 781.1.2 Rule of law . . . . . . . . . . . . . . . . . . . . . . . . . . . . . . . . . . . . . . . . . . . . . . . . . . . . 49.03 701.1.3 Political stability . . . . . . . . . . . . . . . . . . . . . . . . . . . . . . . . . . . . . . . . . . . . . . .49.53 1041.1.4 Regulatory quality. . . . . . . . . . . . . . . . . . . . . . . . . . . . . . . . . . . . . . . . . . . . .54.97 561.1.5 Corruption . . . . . . . . . . . . . . . . . . . . . . . . . . . . . . . . . . . . . . . . . . . . . . . . . . . .28.38 871.2 Market Landscape . . . . . . . . . . . . . . . . . . . . . . . . . . . . . . . . . . . . . . . . . . 53.92 581.2.1 Competition intensity . . . . . . . . . . . . . . . . . . . . . . . . . . . . . . . . . . . . . . . . . 77.26 351.2.2 Ease of doing business . . . . . . . . . . . . . . . . . . . . . . . . . . . . . . . . . . . . . . . .79.96 381.2.3 Cluster development . . . . . . . . . . . . . . . . . . . . . . . . . . . . . . . . . . . . . . . . . .42.40 681.2.4 R&D expenditure . . . . . . . . . . . . . . . . . . . . . . . . . . . . . . . . . . . . . . . . . . . . . . . 4.67 881.2.5 ICT infrastructure. . . . . . . . . . . . . . . . . . . . . . . . . . . . . . . . . . . . . . . . . . . . . . 61.58 621.2.6 Urban population . . . . . . . . . . . . . . . . . . . . . . . . . . . . . . . . . . . . . . . . . . . . . 57.63 691.3 Business and Labour Landscape . . . . . . . . . . . . . . . . . . . . . . . . . . . . 47.21 66
Labour Market1.3.1 Tertiary-educated unemployment . . . . . . . . . . . . . . . . . . . . . . . . . . . . 41.15 1141.3.2 Active labour market policies . . . . . . . . . . . . . . . . . . . . . . . . . . . . . . . . .38.86 681.3.3 Labour-employer cooperation . . . . . . . . . . . . . . . . . . . . . . . . . . . . . . . . 51.65 40
Management Practice1.3.4 Professional management . . . . . . . . . . . . . . . . . . . . . . . . . . . . . . . . . . . .49.86 631.3.5 Relationship of pay to productivity . . . . . . . . . . . . . . . . . . . . . . . . . . . . 54.13 55
Technology Adoption1.3.6 Technology utilisation. . . . . . . . . . . . . . . . . . . . . . . . . . . . . . . . . . . . . . . . .48.58 691.3.7 Investment in emerging technologies . . . . . . . . . . . . . . . . . . . . . . . .46.26 511.3.8 Robot density . . . . . . . . . . . . . . . . . . . . . . . . . . . . . . . . . . . . . . . . . . . . . . . . . . .n/a n/a
2 ATTRACT . . . . . . . . . . . . . . . . . . . . . . . . . . . . . . . . . . . . . . . . . 50.68 592.1 External Openness . . . . . . . . . . . . . . . . . . . . . . . . . . . . . . . . . . . . . . . . . 39.27 80
Attract Business2.1.1 FDI and technology transfer . . . . . . . . . . . . . . . . . . . . . . . . . . . . . . . . . . 51.72 832.1.2 Prevalence of foreign ownership . . . . . . . . . . . . . . . . . . . . . . . . . . . . . .43.29 104
Attract People2.1.3 Migrant stock . . . . . . . . . . . . . . . . . . . . . . . . . . . . . . . . . . . . . . . . . . . . . . . . . 49.43 502.1.4 International students . . . . . . . . . . . . . . . . . . . . . . . . . . . . . . . . . . . . . . . . . 15.72 442.1.5 Brain gain . . . . . . . . . . . . . . . . . . . . . . . . . . . . . . . . . . . . . . . . . . . . . . . . . . . . . 36.19 912.2 Internal Openness . . . . . . . . . . . . . . . . . . . . . . . . . . . . . . . . . . . . . . . . . . 62.08 49
Social Inclusion2.2.1 Tolerance of minorities . . . . . . . . . . . . . . . . . . . . . . . . . . . . . . . . . . . . . . . .50.00 592.2.2 Tolerance of immigrants . . . . . . . . . . . . . . . . . . . . . . . . . . . . . . . . . . . . . .60.27 602.2.3 Social mobility . . . . . . . . . . . . . . . . . . . . . . . . . . . . . . . . . . . . . . . . . . . . . . . .49.94 89
Gender Equality2.2.4 Female graduates . . . . . . . . . . . . . . . . . . . . . . . . . . . . . . . . . . . . . . . . . . . . . 74.45 572.2.5 Gender development gap . . . . . . . . . . . . . . . . . . . . . . . . . . . . . . . . . . . . 77.99 642.2.6 Leadership opportunities for women . . . . . . . . . . . . . . . . . . . . . . . . .59.86 43
Score Rank
3 GROW . . . . . . . . . . . . . . . . . . . . . . . . . . . . . . . . . . . . . . . . . . . . .29.93 1003.1 Formal Education . . . . . . . . . . . . . . . . . . . . . . . . . . . . . . . . . . . . . . . . . . . 15.84 90
Enrolment3.1.1 Vocational enrolment . . . . . . . . . . . . . . . . . . . . . . . . . . . . . . . . . . . . . . . . .16.22 643.1.2 Tertiary enrolment . . . . . . . . . . . . . . . . . . . . . . . . . . . . . . . . . . . . . . . . . . . .40.97 53
Quality3.1.3 Tertiary education expenditure . . . . . . . . . . . . . . . . . . . . . . . . . . . . . . . . 6.16 1073.1.4 Reading, maths, and science . . . . . . . . . . . . . . . . . . . . . . . . . . . . . . . . . . . .n/a n/a3.1.5 University ranking . . . . . . . . . . . . . . . . . . . . . . . . . . . . . . . . . . . . . . . . . . . . . . 0.00 753.2 Lifelong Learning . . . . . . . . . . . . . . . . . . . . . . . . . . . . . . . . . . . . . . . . . . . 27.98 1223.2.1 Quality of management schools . . . . . . . . . . . . . . . . . . . . . . . . . . . . . .36.47 973.2.2 Prevalence of training in firms . . . . . . . . . . . . . . . . . . . . . . . . . . . . . . . . .16.89 883.2.3 Employee development . . . . . . . . . . . . . . . . . . . . . . . . . . . . . . . . . . . . . .30.59 933.3 Access to Growth Opportunities . . . . . . . . . . . . . . . . . . . . . . . . . . . 45.97 68
Empowerment3.3.1 Delegation of authority . . . . . . . . . . . . . . . . . . . . . . . . . . . . . . . . . . . . . . .39.89 833.3.2 Personal rights . . . . . . . . . . . . . . . . . . . . . . . . . . . . . . . . . . . . . . . . . . . . . . . .71.22 72
Collaboration3.3.3 Use of virtual social networks . . . . . . . . . . . . . . . . . . . . . . . . . . . . . . . . .70.55 773.3.4 Use of virtual professional networks . . . . . . . . . . . . . . . . . . . . . . . . . . . 4.62 873.3.5 Collaboration within organisations . . . . . . . . . . . . . . . . . . . . . . . . . . . .50.26 553.3.6 Collaboration across organisations . . . . . . . . . . . . . . . . . . . . . . . . . . . .39.29 68
4 RETAIN . . . . . . . . . . . . . . . . . . . . . . . . . . . . . . . . . . . . . . . . . . . 48.30 644.1 Sustainability . . . . . . . . . . . . . . . . . . . . . . . . . . . . . . . . . . . . . . . . . . . . . . . 33.83 894.1.1 Pension system . . . . . . . . . . . . . . . . . . . . . . . . . . . . . . . . . . . . . . . . . . . . . . .36.92 634.1.2 Social protection . . . . . . . . . . . . . . . . . . . . . . . . . . . . . . . . . . . . . . . . . . . . . . 31.72 924.1.3 Brain retention . . . . . . . . . . . . . . . . . . . . . . . . . . . . . . . . . . . . . . . . . . . . . . . .32.85 884.2 Lifestyle . . . . . . . . . . . . . . . . . . . . . . . . . . . . . . . . . . . . . . . . . . . . . . . . . . . . 62.76 464.2.1 Environmental performance . . . . . . . . . . . . . . . . . . . . . . . . . . . . . . . . . . 57.74 564.2.2 Personal safety . . . . . . . . . . . . . . . . . . . . . . . . . . . . . . . . . . . . . . . . . . . . . . . . 57.73 624.2.3 Physician density . . . . . . . . . . . . . . . . . . . . . . . . . . . . . . . . . . . . . . . . . . . . . 44.64 434.2.4 Sanitation . . . . . . . . . . . . . . . . . . . . . . . . . . . . . . . . . . . . . . . . . . . . . . . . . . . . .90.94 67
5 VOCATIONAL AND TECHNICAL SKILLS . . . . . . . . . . . . 48.95 495.1 Mid-Level Skills . . . . . . . . . . . . . . . . . . . . . . . . . . . . . . . . . . . . . . . . . . . . . 51.64 455.1.1 Workforce with secondary education . . . . . . . . . . . . . . . . . . . . . . . . . 89.31 65.1.2 Population with secondary education . . . . . . . . . . . . . . . . . . . . . . . . 62.41 295.1.3 Technicians and associate professionals . . . . . . . . . . . . . . . . . . . . . . . 37.95 575.1.4 Labour productivity per employee . . . . . . . . . . . . . . . . . . . . . . . . . . . .16.89 745.2 Employability . . . . . . . . . . . . . . . . . . . . . . . . . . . . . . . . . . . . . . . . . . . . . . . 46.27 745.2.1 Ease of finding skilled employees . . . . . . . . . . . . . . . . . . . . . . . . . . . . .48.67 855.2.2 Relevance of education system to the economy . . . . . . . . . . . . . .50.80 535.2.3 Skills matching with secondary education . . . . . . . . . . . . . . . . . . . . 42.61 655.2.4 Skills matching with tertiary education . . . . . . . . . . . . . . . . . . . . . . . .42.98 98
6 GLOBAL KNOWLEDGE SKILLS . . . . . . . . . . . . . . . . . . . . 34.49 476.1 High-Level Skills . . . . . . . . . . . . . . . . . . . . . . . . . . . . . . . . . . . . . . . . . . . . 50.62 256.1.1 Workforce with tertiary education . . . . . . . . . . . . . . . . . . . . . . . . . . . .44.49 406.1.2 Population with tertiary education . . . . . . . . . . . . . . . . . . . . . . . . . . . .75.99 46.1.3 Professionals . . . . . . . . . . . . . . . . . . . . . . . . . . . . . . . . . . . . . . . . . . . . . . . . . . 37.66 466.1.4 Researchers . . . . . . . . . . . . . . . . . . . . . . . . . . . . . . . . . . . . . . . . . . . . . . . . . . . . .n/a n/a6.1.5 Senior officials and managers . . . . . . . . . . . . . . . . . . . . . . . . . . . . . . . . .36.77 396.1.6 Availability of scientists and engineers . . . . . . . . . . . . . . . . . . . . . . . . 58.18 476.2 Talent Impact . . . . . . . . . . . . . . . . . . . . . . . . . . . . . . . . . . . . . . . . . . . . . . . 18.36 776.2.1 Innovation output . . . . . . . . . . . . . . . . . . . . . . . . . . . . . . . . . . . . . . . . . . . .38.88 486.2.2 High-value exports . . . . . . . . . . . . . . . . . . . . . . . . . . . . . . . . . . . . . . . . . . . . 19.27 616.2.3 New product entrepreneurial activity . . . . . . . . . . . . . . . . . . . . . . . . . . .n/a n/a6.2.4 New business density . . . . . . . . . . . . . . . . . . . . . . . . . . . . . . . . . . . . . . . . . . 8.32 546.2.5 Scientific journal articles . . . . . . . . . . . . . . . . . . . . . . . . . . . . . . . . . . . . . . . 6.99 60
l Armenia l Income group average
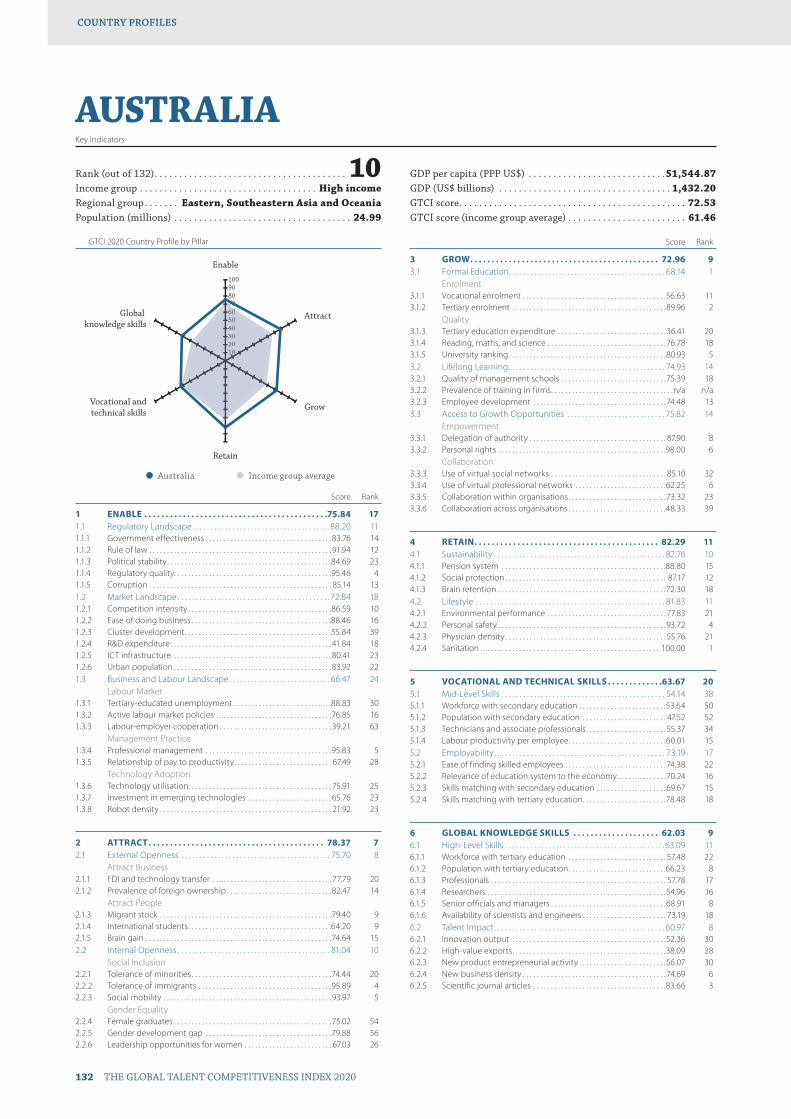
GTCI 2020 Country Profile by Pillar
132 THE GLOBAL TALENT COMPETITIVENESS INDEX 2020
COUNTRY PROFILESCOUNTRY PROFILES
102030405060708090100
Global knowledge skills
Vocational andtechnical skills
Retain
Grow
Attract
Enable
102030405060607
AUSTRALIAKey Indicators
Rank (out of 132) . . . . . . . . . . . . . . . . . . . . . . . . . . . . . . . . . . . . . . . 10Income group . . . . . . . . . . . . . . . . . . . . . . . . . . . . . . . . . . . . High incomeRegional group . . . . . . . Eastern, Southeastern Asia and OceaniaPopulation (millions) . . . . . . . . . . . . . . . . . . . . . . . . . . . . . . . . . . . . 24.99
GDP per capita (PPP US$) . . . . . . . . . . . . . . . . . . . . . . . . . . . .51,544.87GDP (US$ billions) . . . . . . . . . . . . . . . . . . . . . . . . . . . . . . . . . . . 1,432.20GTCI score . . . . . . . . . . . . . . . . . . . . . . . . . . . . . . . . . . . . . . . . . . . . . . 72.53GTCI score (income group average) . . . . . . . . . . . . . . . . . . . . . . . . 61.46
Score Rank
1 ENABLE . . . . . . . . . . . . . . . . . . . . . . . . . . . . . . . . . . . . . . . . . . .75.84 171.1 Regulatory Landscape . . . . . . . . . . . . . . . . . . . . . . . . . . . . . . . . . . . . . .88.20 111.1.1 Government effectiveness . . . . . . . . . . . . . . . . . . . . . . . . . . . . . . . . . . . .83.76 141.1.2 Rule of law . . . . . . . . . . . . . . . . . . . . . . . . . . . . . . . . . . . . . . . . . . . . . . . . . . . . 91.94 121.1.3 Political stability . . . . . . . . . . . . . . . . . . . . . . . . . . . . . . . . . . . . . . . . . . . . . . .84.69 231.1.4 Regulatory quality. . . . . . . . . . . . . . . . . . . . . . . . . . . . . . . . . . . . . . . . . . . . .95.46 41.1.5 Corruption . . . . . . . . . . . . . . . . . . . . . . . . . . . . . . . . . . . . . . . . . . . . . . . . . . . . 85.14 131.2 Market Landscape . . . . . . . . . . . . . . . . . . . . . . . . . . . . . . . . . . . . . . . . . .72.84 181.2.1 Competition intensity . . . . . . . . . . . . . . . . . . . . . . . . . . . . . . . . . . . . . . . . .86.59 101.2.2 Ease of doing business . . . . . . . . . . . . . . . . . . . . . . . . . . . . . . . . . . . . . . . .88.46 161.2.3 Cluster development . . . . . . . . . . . . . . . . . . . . . . . . . . . . . . . . . . . . . . . . . .55.84 391.2.4 R&D expenditure . . . . . . . . . . . . . . . . . . . . . . . . . . . . . . . . . . . . . . . . . . . . . . 41.84 181.2.5 ICT infrastructure. . . . . . . . . . . . . . . . . . . . . . . . . . . . . . . . . . . . . . . . . . . . . .80.41 231.2.6 Urban population . . . . . . . . . . . . . . . . . . . . . . . . . . . . . . . . . . . . . . . . . . . . .83.92 221.3 Business and Labour Landscape . . . . . . . . . . . . . . . . . . . . . . . . . . . . 66.47 24
Labour Market1.3.1 Tertiary-educated unemployment . . . . . . . . . . . . . . . . . . . . . . . . . . . .88.83 301.3.2 Active labour market policies . . . . . . . . . . . . . . . . . . . . . . . . . . . . . . . . .76.85 161.3.3 Labour-employer cooperation . . . . . . . . . . . . . . . . . . . . . . . . . . . . . . . . 39.21 63
Management Practice1.3.4 Professional management . . . . . . . . . . . . . . . . . . . . . . . . . . . . . . . . . . . .95.83 51.3.5 Relationship of pay to productivity . . . . . . . . . . . . . . . . . . . . . . . . . . . . 67.49 28
Technology Adoption1.3.6 Technology utilisation. . . . . . . . . . . . . . . . . . . . . . . . . . . . . . . . . . . . . . . . . 75.91 251.3.7 Investment in emerging technologies . . . . . . . . . . . . . . . . . . . . . . . . 65.76 231.3.8 Robot density . . . . . . . . . . . . . . . . . . . . . . . . . . . . . . . . . . . . . . . . . . . . . . . . . 21.92 23
2 ATTRACT . . . . . . . . . . . . . . . . . . . . . . . . . . . . . . . . . . . . . . . . . 78.37 72.1 External Openness . . . . . . . . . . . . . . . . . . . . . . . . . . . . . . . . . . . . . . . . . 75.70 8
Attract Business2.1.1 FDI and technology transfer . . . . . . . . . . . . . . . . . . . . . . . . . . . . . . . . . . 77.79 202.1.2 Prevalence of foreign ownership . . . . . . . . . . . . . . . . . . . . . . . . . . . . . .82.47 14
Attract People2.1.3 Migrant stock . . . . . . . . . . . . . . . . . . . . . . . . . . . . . . . . . . . . . . . . . . . . . . . . .79.40 92.1.4 International students . . . . . . . . . . . . . . . . . . . . . . . . . . . . . . . . . . . . . . . . .64.20 92.1.5 Brain gain . . . . . . . . . . . . . . . . . . . . . . . . . . . . . . . . . . . . . . . . . . . . . . . . . . . . .74.64 152.2 Internal Openness . . . . . . . . . . . . . . . . . . . . . . . . . . . . . . . . . . . . . . . . . . 81.04 10
Social Inclusion2.2.1 Tolerance of minorities . . . . . . . . . . . . . . . . . . . . . . . . . . . . . . . . . . . . . . . .74.44 202.2.2 Tolerance of immigrants . . . . . . . . . . . . . . . . . . . . . . . . . . . . . . . . . . . . . .95.89 42.2.3 Social mobility . . . . . . . . . . . . . . . . . . . . . . . . . . . . . . . . . . . . . . . . . . . . . . . . 93.97 5
Gender Equality2.2.4 Female graduates . . . . . . . . . . . . . . . . . . . . . . . . . . . . . . . . . . . . . . . . . . . . .75.02 542.2.5 Gender development gap . . . . . . . . . . . . . . . . . . . . . . . . . . . . . . . . . . . .79.88 562.2.6 Leadership opportunities for women . . . . . . . . . . . . . . . . . . . . . . . . . 67.03 26
Score Rank
3 GROW . . . . . . . . . . . . . . . . . . . . . . . . . . . . . . . . . . . . . . . . . . . . 72.96 93.1 Formal Education . . . . . . . . . . . . . . . . . . . . . . . . . . . . . . . . . . . . . . . . . . . 68.14 1
Enrolment3.1.1 Vocational enrolment . . . . . . . . . . . . . . . . . . . . . . . . . . . . . . . . . . . . . . . . .56.63 113.1.2 Tertiary enrolment . . . . . . . . . . . . . . . . . . . . . . . . . . . . . . . . . . . . . . . . . . . .89.96 2
Quality3.1.3 Tertiary education expenditure . . . . . . . . . . . . . . . . . . . . . . . . . . . . . . .36.41 203.1.4 Reading, maths, and science . . . . . . . . . . . . . . . . . . . . . . . . . . . . . . . . . .76.78 183.1.5 University ranking . . . . . . . . . . . . . . . . . . . . . . . . . . . . . . . . . . . . . . . . . . . . .80.93 53.2 Lifelong Learning . . . . . . . . . . . . . . . . . . . . . . . . . . . . . . . . . . . . . . . . . . . 74.93 143.2.1 Quality of management schools . . . . . . . . . . . . . . . . . . . . . . . . . . . . . .75.39 183.2.2 Prevalence of training in firms . . . . . . . . . . . . . . . . . . . . . . . . . . . . . . . . . . .n/a n/a3.2.3 Employee development . . . . . . . . . . . . . . . . . . . . . . . . . . . . . . . . . . . . . .74.48 133.3 Access to Growth Opportunities . . . . . . . . . . . . . . . . . . . . . . . . . . . 75.82 14
Empowerment3.3.1 Delegation of authority . . . . . . . . . . . . . . . . . . . . . . . . . . . . . . . . . . . . . . . 87.90 83.3.2 Personal rights . . . . . . . . . . . . . . . . . . . . . . . . . . . . . . . . . . . . . . . . . . . . . . . .98.00 6
Collaboration3.3.3 Use of virtual social networks . . . . . . . . . . . . . . . . . . . . . . . . . . . . . . . . . 85.10 323.3.4 Use of virtual professional networks . . . . . . . . . . . . . . . . . . . . . . . . . .62.25 63.3.5 Collaboration within organisations . . . . . . . . . . . . . . . . . . . . . . . . . . . .73.32 233.3.6 Collaboration across organisations . . . . . . . . . . . . . . . . . . . . . . . . . . . .48.33 39
4 RETAIN . . . . . . . . . . . . . . . . . . . . . . . . . . . . . . . . . . . . . . . . . . . 82.29 114.1 Sustainability . . . . . . . . . . . . . . . . . . . . . . . . . . . . . . . . . . . . . . . . . . . . . . . 82.76 104.1.1 Pension system . . . . . . . . . . . . . . . . . . . . . . . . . . . . . . . . . . . . . . . . . . . . . . .88.80 154.1.2 Social protection . . . . . . . . . . . . . . . . . . . . . . . . . . . . . . . . . . . . . . . . . . . . . . 87.17 124.1.3 Brain retention . . . . . . . . . . . . . . . . . . . . . . . . . . . . . . . . . . . . . . . . . . . . . . . .72.30 184.2 Lifestyle . . . . . . . . . . . . . . . . . . . . . . . . . . . . . . . . . . . . . . . . . . . . . . . . . . . . 81.83 114.2.1 Environmental performance . . . . . . . . . . . . . . . . . . . . . . . . . . . . . . . . . . 77.83 214.2.2 Personal safety . . . . . . . . . . . . . . . . . . . . . . . . . . . . . . . . . . . . . . . . . . . . . . . .93.72 44.2.3 Physician density . . . . . . . . . . . . . . . . . . . . . . . . . . . . . . . . . . . . . . . . . . . . . . 55.76 214.2.4 Sanitation . . . . . . . . . . . . . . . . . . . . . . . . . . . . . . . . . . . . . . . . . . . . . . . . . . . 100.00 1
5 VOCATIONAL AND TECHNICAL SKILLS . . . . . . . . . . . . .63.67 205.1 Mid-Level Skills . . . . . . . . . . . . . . . . . . . . . . . . . . . . . . . . . . . . . . . . . . . . . 54.14 385.1.1 Workforce with secondary education . . . . . . . . . . . . . . . . . . . . . . . . .53.64 505.1.2 Population with secondary education . . . . . . . . . . . . . . . . . . . . . . . . 47.52 525.1.3 Technicians and associate professionals . . . . . . . . . . . . . . . . . . . . . . . 55.37 345.1.4 Labour productivity per employee . . . . . . . . . . . . . . . . . . . . . . . . . . . .60.01 155.2 Employability . . . . . . . . . . . . . . . . . . . . . . . . . . . . . . . . . . . . . . . . . . . . . . . 73.19 175.2.1 Ease of finding skilled employees . . . . . . . . . . . . . . . . . . . . . . . . . . . . .74.38 225.2.2 Relevance of education system to the economy . . . . . . . . . . . . . .70.24 165.2.3 Skills matching with secondary education . . . . . . . . . . . . . . . . . . . .69.67 155.2.4 Skills matching with tertiary education . . . . . . . . . . . . . . . . . . . . . . . .78.48 18
6 GLOBAL KNOWLEDGE SKILLS . . . . . . . . . . . . . . . . . . . . 62.03 96.1 High-Level Skills . . . . . . . . . . . . . . . . . . . . . . . . . . . . . . . . . . . . . . . . . . . . 63.09 116.1.1 Workforce with tertiary education . . . . . . . . . . . . . . . . . . . . . . . . . . . . 57.48 226.1.2 Population with tertiary education . . . . . . . . . . . . . . . . . . . . . . . . . . . .66.23 86.1.3 Professionals . . . . . . . . . . . . . . . . . . . . . . . . . . . . . . . . . . . . . . . . . . . . . . . . . . 57.78 176.1.4 Researchers . . . . . . . . . . . . . . . . . . . . . . . . . . . . . . . . . . . . . . . . . . . . . . . . . . .54.96 166.1.5 Senior officials and managers . . . . . . . . . . . . . . . . . . . . . . . . . . . . . . . . .68.91 86.1.6 Availability of scientists and engineers . . . . . . . . . . . . . . . . . . . . . . . . 73.19 186.2 Talent Impact . . . . . . . . . . . . . . . . . . . . . . . . . . . . . . . . . . . . . . . . . . . . . . . 60.97 86.2.1 Innovation output . . . . . . . . . . . . . . . . . . . . . . . . . . . . . . . . . . . . . . . . . . . .52.36 306.2.2 High-value exports . . . . . . . . . . . . . . . . . . . . . . . . . . . . . . . . . . . . . . . . . . . .38.09 286.2.3 New product entrepreneurial activity . . . . . . . . . . . . . . . . . . . . . . . . .56.07 306.2.4 New business density . . . . . . . . . . . . . . . . . . . . . . . . . . . . . . . . . . . . . . . . . 74.69 66.2.5 Scientific journal articles . . . . . . . . . . . . . . . . . . . . . . . . . . . . . . . . . . . . . .83.66 3
l Australia l Income group average

GTCI 2020 Country Profile by Pillar
THE GLOBAL TALENT COMPETITIVENESS INDEX 2020 133
COUNTRY PROFILESCOUNTRY PROFILES
102030405060708090100
Global knowledge skills
Vocational andtechnical skills
Retain
Grow
Attract
Enable
102030405060607
AUSTRIAKey Indicators
Rank (out of 132) . . . . . . . . . . . . . . . . . . . . . . . . . . . . . . . . . . . . . . . .17Income group . . . . . . . . . . . . . . . . . . . . . . . . . . . . . . . . . . . . High incomeRegional group . . . . . . . . . . . . . . . . . . . . . . . . . . . . . . . . . . . . . . . . .EuropePopulation (millions) . . . . . . . . . . . . . . . . . . . . . . . . . . . . . . . . . . . . . 8.85
GDP per capita (PPP US$) . . . . . . . . . . . . . . . . . . . . . . . . . . . .56,253.09GDP (US$ billions) . . . . . . . . . . . . . . . . . . . . . . . . . . . . . . . . . . . . . 455.74GTCI score . . . . . . . . . . . . . . . . . . . . . . . . . . . . . . . . . . . . . . . . . . . . . . 68.87GTCI score (income group average) . . . . . . . . . . . . . . . . . . . . . . . . 61.46
Score Rank
1 ENABLE . . . . . . . . . . . . . . . . . . . . . . . . . . . . . . . . . . . . . . . . . . .79.41 131.1 Regulatory Landscape . . . . . . . . . . . . . . . . . . . . . . . . . . . . . . . . . . . . . . 86.37 141.1.1 Government effectiveness . . . . . . . . . . . . . . . . . . . . . . . . . . . . . . . . . . . . 81.97 151.1.2 Rule of law . . . . . . . . . . . . . . . . . . . . . . . . . . . . . . . . . . . . . . . . . . . . . . . . . . . .94.99 91.1.3 Political stability . . . . . . . . . . . . . . . . . . . . . . . . . . . . . . . . . . . . . . . . . . . . . . . 87.77 151.1.4 Regulatory quality. . . . . . . . . . . . . . . . . . . . . . . . . . . . . . . . . . . . . . . . . . . . .83.37 171.1.5 Corruption . . . . . . . . . . . . . . . . . . . . . . . . . . . . . . . . . . . . . . . . . . . . . . . . . . . .83.78 141.2 Market Landscape . . . . . . . . . . . . . . . . . . . . . . . . . . . . . . . . . . . . . . . . . . 75.99 141.2.1 Competition intensity . . . . . . . . . . . . . . . . . . . . . . . . . . . . . . . . . . . . . . . . .85.96 111.2.2 Ease of doing business . . . . . . . . . . . . . . . . . . . . . . . . . . . . . . . . . . . . . . . .85.67 241.2.3 Cluster development . . . . . . . . . . . . . . . . . . . . . . . . . . . . . . . . . . . . . . . . . .78.08 131.2.4 R&D expenditure . . . . . . . . . . . . . . . . . . . . . . . . . . . . . . . . . . . . . . . . . . . . . .68.94 61.2.5 ICT infrastructure. . . . . . . . . . . . . . . . . . . . . . . . . . . . . . . . . . . . . . . . . . . . . .85.24 141.2.6 Urban population . . . . . . . . . . . . . . . . . . . . . . . . . . . . . . . . . . . . . . . . . . . . .52.05 781.3 Business and Labour Landscape . . . . . . . . . . . . . . . . . . . . . . . . . . . . 75.86 11
Labour Market1.3.1 Tertiary-educated unemployment . . . . . . . . . . . . . . . . . . . . . . . . . . . .89.49 281.3.2 Active labour market policies . . . . . . . . . . . . . . . . . . . . . . . . . . . . . . . . . 97.59 31.3.3 Labour-employer cooperation . . . . . . . . . . . . . . . . . . . . . . . . . . . . . . . . 77.42 10
Management Practice1.3.4 Professional management . . . . . . . . . . . . . . . . . . . . . . . . . . . . . . . . . . . . 81.47 201.3.5 Relationship of pay to productivity . . . . . . . . . . . . . . . . . . . . . . . . . . . . 67.55 27
Technology Adoption1.3.6 Technology utilisation. . . . . . . . . . . . . . . . . . . . . . . . . . . . . . . . . . . . . . . . . 77.21 201.3.7 Investment in emerging technologies . . . . . . . . . . . . . . . . . . . . . . . .64.42 251.3.8 Robot density . . . . . . . . . . . . . . . . . . . . . . . . . . . . . . . . . . . . . . . . . . . . . . . . . 51.73 11
2 ATTRACT . . . . . . . . . . . . . . . . . . . . . . . . . . . . . . . . . . . . . . . . . .66.71 242.1 External Openness . . . . . . . . . . . . . . . . . . . . . . . . . . . . . . . . . . . . . . . . . 64.55 22
Attract Business2.1.1 FDI and technology transfer . . . . . . . . . . . . . . . . . . . . . . . . . . . . . . . . . .66.28 462.1.2 Prevalence of foreign ownership . . . . . . . . . . . . . . . . . . . . . . . . . . . . . .68.97 43
Attract People2.1.3 Migrant stock . . . . . . . . . . . . . . . . . . . . . . . . . . . . . . . . . . . . . . . . . . . . . . . . .69.95 172.1.4 International students . . . . . . . . . . . . . . . . . . . . . . . . . . . . . . . . . . . . . . . . .60.01 102.1.5 Brain gain . . . . . . . . . . . . . . . . . . . . . . . . . . . . . . . . . . . . . . . . . . . . . . . . . . . . . 57.55 342.2 Internal Openness . . . . . . . . . . . . . . . . . . . . . . . . . . . . . . . . . . . . . . . . . .68.86 28
Social Inclusion2.2.1 Tolerance of minorities . . . . . . . . . . . . . . . . . . . . . . . . . . . . . . . . . . . . . . . . 61.11 422.2.2 Tolerance of immigrants . . . . . . . . . . . . . . . . . . . . . . . . . . . . . . . . . . . . . .68.49 452.2.3 Social mobility . . . . . . . . . . . . . . . . . . . . . . . . . . . . . . . . . . . . . . . . . . . . . . . .86.35 13
Gender Equality2.2.4 Female graduates . . . . . . . . . . . . . . . . . . . . . . . . . . . . . . . . . . . . . . . . . . . . . 67.57 742.2.5 Gender development gap . . . . . . . . . . . . . . . . . . . . . . . . . . . . . . . . . . . .78.51 612.2.6 Leadership opportunities for women . . . . . . . . . . . . . . . . . . . . . . . . . 51.12 57
Score Rank
3 GROW . . . . . . . . . . . . . . . . . . . . . . . . . . . . . . . . . . . . . . . . . . . . 64.52 163.1 Formal Education . . . . . . . . . . . . . . . . . . . . . . . . . . . . . . . . . . . . . . . . . . . 56.10 10
Enrolment3.1.1 Vocational enrolment . . . . . . . . . . . . . . . . . . . . . . . . . . . . . . . . . . . . . . . . .53.57 143.1.2 Tertiary enrolment . . . . . . . . . . . . . . . . . . . . . . . . . . . . . . . . . . . . . . . . . . . . 68.10 11
Quality3.1.3 Tertiary education expenditure . . . . . . . . . . . . . . . . . . . . . . . . . . . . . . . 42.71 113.1.4 Reading, maths, and science . . . . . . . . . . . . . . . . . . . . . . . . . . . . . . . . . .72.06 243.1.5 University ranking . . . . . . . . . . . . . . . . . . . . . . . . . . . . . . . . . . . . . . . . . . . . .44.05 253.2 Lifelong Learning . . . . . . . . . . . . . . . . . . . . . . . . . . . . . . . . . . . . . . . . . . . 71.47 193.2.1 Quality of management schools . . . . . . . . . . . . . . . . . . . . . . . . . . . . . .68.94 273.2.2 Prevalence of training in firms . . . . . . . . . . . . . . . . . . . . . . . . . . . . . . . . . . .n/a n/a3.2.3 Employee development . . . . . . . . . . . . . . . . . . . . . . . . . . . . . . . . . . . . . .74.00 153.3 Access to Growth Opportunities . . . . . . . . . . . . . . . . . . . . . . . . . . . 65.98 22
Empowerment3.3.1 Delegation of authority . . . . . . . . . . . . . . . . . . . . . . . . . . . . . . . . . . . . . . .76.80 193.3.2 Personal rights . . . . . . . . . . . . . . . . . . . . . . . . . . . . . . . . . . . . . . . . . . . . . . . . 91.40 33
Collaboration3.3.3 Use of virtual social networks . . . . . . . . . . . . . . . . . . . . . . . . . . . . . . . . . 71.35 723.3.4 Use of virtual professional networks . . . . . . . . . . . . . . . . . . . . . . . . . . 11.36 563.3.5 Collaboration within organisations . . . . . . . . . . . . . . . . . . . . . . . . . . . .84.00 123.3.6 Collaboration across organisations . . . . . . . . . . . . . . . . . . . . . . . . . . . .60.99 24
4 RETAIN . . . . . . . . . . . . . . . . . . . . . . . . . . . . . . . . . . . . . . . . . . . .85.95 54.1 Sustainability . . . . . . . . . . . . . . . . . . . . . . . . . . . . . . . . . . . . . . . . . . . . . . . 82.85 94.1.1 Pension system . . . . . . . . . . . . . . . . . . . . . . . . . . . . . . . . . . . . . . . . . . . . . . .88.56 164.1.2 Social protection . . . . . . . . . . . . . . . . . . . . . . . . . . . . . . . . . . . . . . . . . . . . . .99.05 44.1.3 Brain retention . . . . . . . . . . . . . . . . . . . . . . . . . . . . . . . . . . . . . . . . . . . . . . . .60.94 344.2 Lifestyle . . . . . . . . . . . . . . . . . . . . . . . . . . . . . . . . . . . . . . . . . . . . . . . . . . . . 89.05 24.2.1 Environmental performance . . . . . . . . . . . . . . . . . . . . . . . . . . . . . . . . . . 85.91 84.2.2 Personal safety . . . . . . . . . . . . . . . . . . . . . . . . . . . . . . . . . . . . . . . . . . . . . . . .86.75 144.2.3 Physician density . . . . . . . . . . . . . . . . . . . . . . . . . . . . . . . . . . . . . . . . . . . . . .83.56 24.2.4 Sanitation . . . . . . . . . . . . . . . . . . . . . . . . . . . . . . . . . . . . . . . . . . . . . . . . . . . . .99.97 11
5 VOCATIONAL AND TECHNICAL SKILLS . . . . . . . . . . . . .69.95 95.1 Mid-Level Skills . . . . . . . . . . . . . . . . . . . . . . . . . . . . . . . . . . . . . . . . . . . . . 69.44 65.1.1 Workforce with secondary education . . . . . . . . . . . . . . . . . . . . . . . . .70.22 265.1.2 Population with secondary education . . . . . . . . . . . . . . . . . . . . . . . .72.80 185.1.3 Technicians and associate professionals . . . . . . . . . . . . . . . . . . . . . . .75.32 135.1.4 Labour productivity per employee . . . . . . . . . . . . . . . . . . . . . . . . . . . . 59.42 165.2 Employability . . . . . . . . . . . . . . . . . . . . . . . . . . . . . . . . . . . . . . . . . . . . . . . 70.46 215.2.1 Ease of finding skilled employees . . . . . . . . . . . . . . . . . . . . . . . . . . . . .70.04 325.2.2 Relevance of education system to the economy . . . . . . . . . . . . . .58.99 395.2.3 Skills matching with secondary education . . . . . . . . . . . . . . . . . . . . 71.30 125.2.4 Skills matching with tertiary education . . . . . . . . . . . . . . . . . . . . . . . . 81.53 14
6 GLOBAL KNOWLEDGE SKILLS . . . . . . . . . . . . . . . . . . . . .46.71 256.1 High-Level Skills . . . . . . . . . . . . . . . . . . . . . . . . . . . . . . . . . . . . . . . . . . . . 49.31 306.1.1 Workforce with tertiary education . . . . . . . . . . . . . . . . . . . . . . . . . . . . 51.54 326.1.2 Population with tertiary education . . . . . . . . . . . . . . . . . . . . . . . . . . . .43.32 326.1.3 Professionals . . . . . . . . . . . . . . . . . . . . . . . . . . . . . . . . . . . . . . . . . . . . . . . . . .52.23 216.1.4 Researchers . . . . . . . . . . . . . . . . . . . . . . . . . . . . . . . . . . . . . . . . . . . . . . . . . . .62.46 116.1.5 Senior officials and managers . . . . . . . . . . . . . . . . . . . . . . . . . . . . . . . . . 27.66 546.1.6 Availability of scientists and engineers . . . . . . . . . . . . . . . . . . . . . . . .58.63 466.2 Talent Impact . . . . . . . . . . . . . . . . . . . . . . . . . . . . . . . . . . . . . . . . . . . . . . . 44.12 286.2.1 Innovation output . . . . . . . . . . . . . . . . . . . . . . . . . . . . . . . . . . . . . . . . . . . . 57.27 246.2.2 High-value exports . . . . . . . . . . . . . . . . . . . . . . . . . . . . . . . . . . . . . . . . . . . . 29.13 416.2.3 New product entrepreneurial activity . . . . . . . . . . . . . . . . . . . . . . . . . 75.31 106.2.4 New business density . . . . . . . . . . . . . . . . . . . . . . . . . . . . . . . . . . . . . . . . . . 2.82 806.2.5 Scientific journal articles . . . . . . . . . . . . . . . . . . . . . . . . . . . . . . . . . . . . . .56.08 17
l Austria l Income group average

GTCI 2020 Country Profile by Pillar
134 THE GLOBAL TALENT COMPETITIVENESS INDEX 2020
COUNTRY PROFILESCOUNTRY PROFILES
102030405060708090100
Global knowledge skills
Vocational andtechnical skills
Retain
Grow
Attract
Enable
1020304040
AZERBAIJANKey Indicators
Rank (out of 132) . . . . . . . . . . . . . . . . . . . . . . . . . . . . . . . . . . . . . . . 45Income group . . . . . . . . . . . . . . . . . . . . . . . . . . . Upper-middle incomeRegional group . . . . . . . . . . . . . .Northern Africa and Western AsiaPopulation (millions) . . . . . . . . . . . . . . . . . . . . . . . . . . . . . . . . . . . . . 9.94
GDP per capita (PPP US$) . . . . . . . . . . . . . . . . . . . . . . . . . . . .18,012.32GDP (US$ billions) . . . . . . . . . . . . . . . . . . . . . . . . . . . . . . . . . . . . . . 46.94GTCI score . . . . . . . . . . . . . . . . . . . . . . . . . . . . . . . . . . . . . . . . . . . . . . 48.57GTCI score (income group average) . . . . . . . . . . . . . . . . . . . . . . . . 41.25
Score Rank
1 ENABLE . . . . . . . . . . . . . . . . . . . . . . . . . . . . . . . . . . . . . . . . . . 52.22 521.1 Regulatory Landscape . . . . . . . . . . . . . . . . . . . . . . . . . . . . . . . . . . . . . . 37.51 1011.1.1 Government effectiveness . . . . . . . . . . . . . . . . . . . . . . . . . . . . . . . . . . . .42.62 831.1.2 Rule of law . . . . . . . . . . . . . . . . . . . . . . . . . . . . . . . . . . . . . . . . . . . . . . . . . . . .39.69 1001.1.3 Political stability . . . . . . . . . . . . . . . . . . . . . . . . . . . . . . . . . . . . . . . . . . . . . . .48.32 1061.1.4 Regulatory quality. . . . . . . . . . . . . . . . . . . . . . . . . . . . . . . . . . . . . . . . . . . . .42.06 891.1.5 Corruption . . . . . . . . . . . . . . . . . . . . . . . . . . . . . . . . . . . . . . . . . . . . . . . . . . . .14.86 1201.2 Market Landscape . . . . . . . . . . . . . . . . . . . . . . . . . . . . . . . . . . . . . . . . . . 52.85 611.2.1 Competition intensity . . . . . . . . . . . . . . . . . . . . . . . . . . . . . . . . . . . . . . . . .56.63 1011.2.2 Ease of doing business . . . . . . . . . . . . . . . . . . . . . . . . . . . . . . . . . . . . . . . .85.80 231.2.3 Cluster development . . . . . . . . . . . . . . . . . . . . . . . . . . . . . . . . . . . . . . . . . . 59.07 321.2.4 R&D expenditure . . . . . . . . . . . . . . . . . . . . . . . . . . . . . . . . . . . . . . . . . . . . . . . 3.74 911.2.5 ICT infrastructure. . . . . . . . . . . . . . . . . . . . . . . . . . . . . . . . . . . . . . . . . . . . . .62.85 601.2.6 Urban population . . . . . . . . . . . . . . . . . . . . . . . . . . . . . . . . . . . . . . . . . . . . .49.04 861.3 Business and Labour Landscape . . . . . . . . . . . . . . . . . . . . . . . . . . . . 66.31 26
Labour Market1.3.1 Tertiary-educated unemployment . . . . . . . . . . . . . . . . . . . . . . . . . . . .80.98 631.3.2 Active labour market policies . . . . . . . . . . . . . . . . . . . . . . . . . . . . . . . . .62.98 351.3.3 Labour-employer cooperation . . . . . . . . . . . . . . . . . . . . . . . . . . . . . . . . 57.35 31
Management Practice1.3.4 Professional management . . . . . . . . . . . . . . . . . . . . . . . . . . . . . . . . . . . .58.06 431.3.5 Relationship of pay to productivity . . . . . . . . . . . . . . . . . . . . . . . . . . . .73.56 14
Technology Adoption1.3.6 Technology utilisation. . . . . . . . . . . . . . . . . . . . . . . . . . . . . . . . . . . . . . . . .64.06 441.3.7 Investment in emerging technologies . . . . . . . . . . . . . . . . . . . . . . . . 67.18 221.3.8 Robot density . . . . . . . . . . . . . . . . . . . . . . . . . . . . . . . . . . . . . . . . . . . . . . . . . . .n/a n/a
2 ATTRACT . . . . . . . . . . . . . . . . . . . . . . . . . . . . . . . . . . . . . . . . . .55.83 442.1 External Openness . . . . . . . . . . . . . . . . . . . . . . . . . . . . . . . . . . . . . . . . . 49.93 42
Attract Business2.1.1 FDI and technology transfer . . . . . . . . . . . . . . . . . . . . . . . . . . . . . . . . . .72.44 302.1.2 Prevalence of foreign ownership . . . . . . . . . . . . . . . . . . . . . . . . . . . . . . 66.12 49
Attract People2.1.3 Migrant stock . . . . . . . . . . . . . . . . . . . . . . . . . . . . . . . . . . . . . . . . . . . . . . . . .32.78 752.1.4 International students . . . . . . . . . . . . . . . . . . . . . . . . . . . . . . . . . . . . . . . . . . 7.52 692.1.5 Brain gain . . . . . . . . . . . . . . . . . . . . . . . . . . . . . . . . . . . . . . . . . . . . . . . . . . . . .70.78 182.2 Internal Openness . . . . . . . . . . . . . . . . . . . . . . . . . . . . . . . . . . . . . . . . . . 61.73 50
Social Inclusion2.2.1 Tolerance of minorities . . . . . . . . . . . . . . . . . . . . . . . . . . . . . . . . . . . . . . . .45.56 652.2.2 Tolerance of immigrants . . . . . . . . . . . . . . . . . . . . . . . . . . . . . . . . . . . . . .58.90 652.2.3 Social mobility . . . . . . . . . . . . . . . . . . . . . . . . . . . . . . . . . . . . . . . . . . . . . . . .58.64 59
Gender Equality2.2.4 Female graduates . . . . . . . . . . . . . . . . . . . . . . . . . . . . . . . . . . . . . . . . . . . . . 74.98 552.2.5 Gender development gap . . . . . . . . . . . . . . . . . . . . . . . . . . . . . . . . . . . .70.87 842.2.6 Leadership opportunities for women . . . . . . . . . . . . . . . . . . . . . . . . . 61.41 38
Score Rank
3 GROW . . . . . . . . . . . . . . . . . . . . . . . . . . . . . . . . . . . . . . . . . . . . .33.92 823.1 Formal Education . . . . . . . . . . . . . . . . . . . . . . . . . . . . . . . . . . . . . . . . . . . 14.07 94
Enrolment3.1.1 Vocational enrolment . . . . . . . . . . . . . . . . . . . . . . . . . . . . . . . . . . . . . . . . . . .n/a n/a3.1.2 Tertiary enrolment . . . . . . . . . . . . . . . . . . . . . . . . . . . . . . . . . . . . . . . . . . . .20.93 85
Quality3.1.3 Tertiary education expenditure . . . . . . . . . . . . . . . . . . . . . . . . . . . . . . . . 9.58 983.1.4 Reading, maths, and science . . . . . . . . . . . . . . . . . . . . . . . . . . . . . . . . . . . .n/a n/a3.1.5 University ranking . . . . . . . . . . . . . . . . . . . . . . . . . . . . . . . . . . . . . . . . . . . . . 11.71 663.2 Lifelong Learning . . . . . . . . . . . . . . . . . . . . . . . . . . . . . . . . . . . . . . . . . . . 38.76 803.2.1 Quality of management schools . . . . . . . . . . . . . . . . . . . . . . . . . . . . . . 47.07 653.2.2 Prevalence of training in firms . . . . . . . . . . . . . . . . . . . . . . . . . . . . . . . . . 22.16 793.2.3 Employee development . . . . . . . . . . . . . . . . . . . . . . . . . . . . . . . . . . . . . . 47.06 523.3 Access to Growth Opportunities . . . . . . . . . . . . . . . . . . . . . . . . . . . 48.93 57
Empowerment3.3.1 Delegation of authority . . . . . . . . . . . . . . . . . . . . . . . . . . . . . . . . . . . . . . . 51.44 543.3.2 Personal rights . . . . . . . . . . . . . . . . . . . . . . . . . . . . . . . . . . . . . . . . . . . . . . . .23.21 122
Collaboration3.3.3 Use of virtual social networks . . . . . . . . . . . . . . . . . . . . . . . . . . . . . . . . . 87.54 223.3.4 Use of virtual professional networks . . . . . . . . . . . . . . . . . . . . . . . . . . . 2.08 1013.3.5 Collaboration within organisations . . . . . . . . . . . . . . . . . . . . . . . . . . . .64.09 293.3.6 Collaboration across organisations . . . . . . . . . . . . . . . . . . . . . . . . . . . .65.25 18
4 RETAIN . . . . . . . . . . . . . . . . . . . . . . . . . . . . . . . . . . . . . . . . . . . . 63.12 354.1 Sustainability . . . . . . . . . . . . . . . . . . . . . . . . . . . . . . . . . . . . . . . . . . . . . . . 63.71 314.1.1 Pension system . . . . . . . . . . . . . . . . . . . . . . . . . . . . . . . . . . . . . . . . . . . . . . . . .n/a n/a4.1.2 Social protection . . . . . . . . . . . . . . . . . . . . . . . . . . . . . . . . . . . . . . . . . . . . . .59.90 384.1.3 Brain retention . . . . . . . . . . . . . . . . . . . . . . . . . . . . . . . . . . . . . . . . . . . . . . . . 67.52 264.2 Lifestyle . . . . . . . . . . . . . . . . . . . . . . . . . . . . . . . . . . . . . . . . . . . . . . . . . . . . 62.53 484.2.1 Environmental performance . . . . . . . . . . . . . . . . . . . . . . . . . . . . . . . . . . 58.18 524.2.2 Personal safety . . . . . . . . . . . . . . . . . . . . . . . . . . . . . . . . . . . . . . . . . . . . . . . . 49.14 744.2.3 Physician density . . . . . . . . . . . . . . . . . . . . . . . . . . . . . . . . . . . . . . . . . . . . . .54.25 264.2.4 Sanitation . . . . . . . . . . . . . . . . . . . . . . . . . . . . . . . . . . . . . . . . . . . . . . . . . . . . .88.54 71
5 VOCATIONAL AND TECHNICAL SKILLS . . . . . . . . . . . . . 63.11 235.1 Mid-Level Skills . . . . . . . . . . . . . . . . . . . . . . . . . . . . . . . . . . . . . . . . . . . . . 59.94 245.1.1 Workforce with secondary education . . . . . . . . . . . . . . . . . . . . . . . . . 89.47 55.1.2 Population with secondary education . . . . . . . . . . . . . . . . . . . . . . . . 89.18 45.1.3 Technicians and associate professionals . . . . . . . . . . . . . . . . . . . . . . .40.37 545.1.4 Labour productivity per employee . . . . . . . . . . . . . . . . . . . . . . . . . . . .20.73 665.2 Employability . . . . . . . . . . . . . . . . . . . . . . . . . . . . . . . . . . . . . . . . . . . . . . .66.28 295.2.1 Ease of finding skilled employees . . . . . . . . . . . . . . . . . . . . . . . . . . . . . 71.87 275.2.2 Relevance of education system to the economy . . . . . . . . . . . . . . 61.19 375.2.3 Skills matching with secondary education . . . . . . . . . . . . . . . . . . . .66.05 245.2.4 Skills matching with tertiary education . . . . . . . . . . . . . . . . . . . . . . . .66.03 37
6 GLOBAL KNOWLEDGE SKILLS . . . . . . . . . . . . . . . . . . . . .23.21 746.1 High-Level Skills . . . . . . . . . . . . . . . . . . . . . . . . . . . . . . . . . . . . . . . . . . . . 37.83 456.1.1 Workforce with tertiary education . . . . . . . . . . . . . . . . . . . . . . . . . . . .40.01 466.1.2 Population with tertiary education . . . . . . . . . . . . . . . . . . . . . . . . . . . .40.06 366.1.3 Professionals . . . . . . . . . . . . . . . . . . . . . . . . . . . . . . . . . . . . . . . . . . . . . . . . . .32.72 516.1.4 Researchers . . . . . . . . . . . . . . . . . . . . . . . . . . . . . . . . . . . . . . . . . . . . . . . . . . . . .n/a n/a6.1.5 Senior officials and managers . . . . . . . . . . . . . . . . . . . . . . . . . . . . . . . . . . 5.93 1086.1.6 Availability of scientists and engineers . . . . . . . . . . . . . . . . . . . . . . . .70.43 246.2 Talent Impact . . . . . . . . . . . . . . . . . . . . . . . . . . . . . . . . . . . . . . . . . . . . . . . . 8.59 1096.2.1 Innovation output . . . . . . . . . . . . . . . . . . . . . . . . . . . . . . . . . . . . . . . . . . . . 21.72 886.2.2 High-value exports . . . . . . . . . . . . . . . . . . . . . . . . . . . . . . . . . . . . . . . . . . . . . 5.81 996.2.3 New product entrepreneurial activity . . . . . . . . . . . . . . . . . . . . . . . . . . .n/a n/a6.2.4 New business density . . . . . . . . . . . . . . . . . . . . . . . . . . . . . . . . . . . . . . . . . . 4.92 706.2.5 Scientific journal articles . . . . . . . . . . . . . . . . . . . . . . . . . . . . . . . . . . . . . . . 1.91 82
l Azerbaijan l Income group average
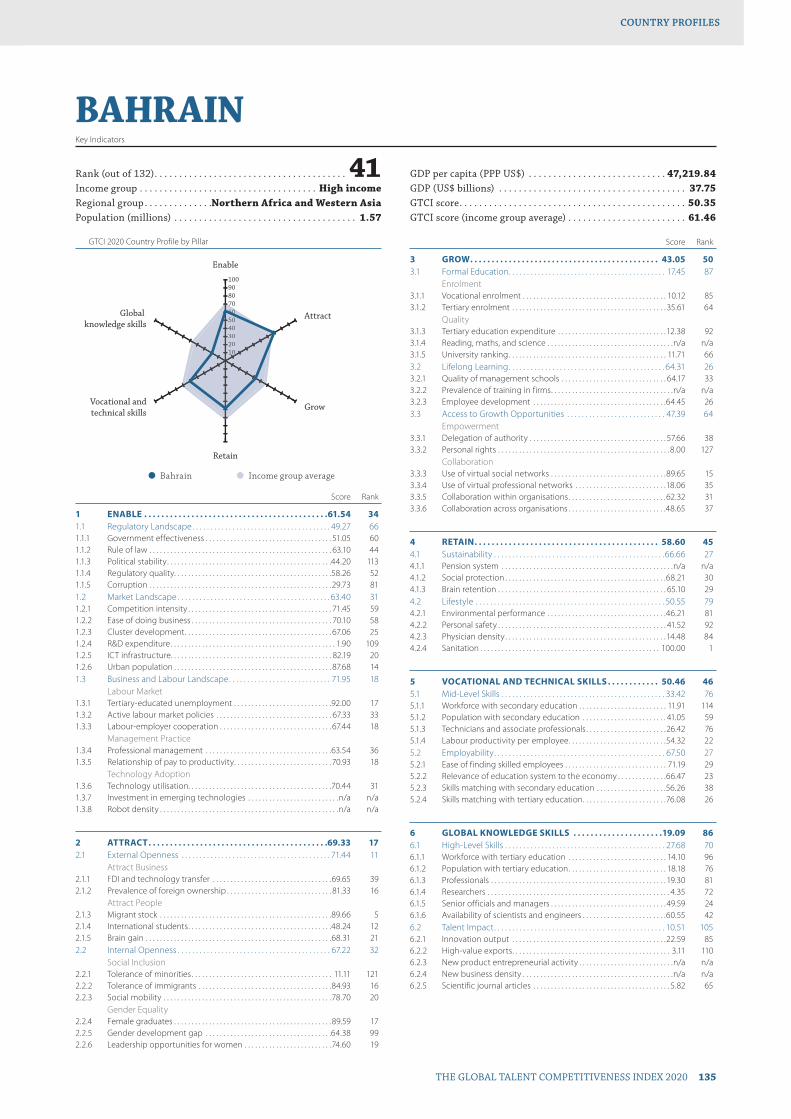
GTCI 2020 Country Profile by Pillar
THE GLOBAL TALENT COMPETITIVENESS INDEX 2020 135
COUNTRY PROFILESCOUNTRY PROFILES
102030405060708090100
Global knowledge skills
Vocational andtechnical skills
Retain
Grow
Attract
Enable
102030405060607
BAHRAINKey Indicators
Rank (out of 132) . . . . . . . . . . . . . . . . . . . . . . . . . . . . . . . . . . . . . . . 41Income group . . . . . . . . . . . . . . . . . . . . . . . . . . . . . . . . . . . . High incomeRegional group . . . . . . . . . . . . . .Northern Africa and Western AsiaPopulation (millions) . . . . . . . . . . . . . . . . . . . . . . . . . . . . . . . . . . . . . 1.57
GDP per capita (PPP US$) . . . . . . . . . . . . . . . . . . . . . . . . . . . . 47,219.84GDP (US$ billions) . . . . . . . . . . . . . . . . . . . . . . . . . . . . . . . . . . . . . . 37.75GTCI score . . . . . . . . . . . . . . . . . . . . . . . . . . . . . . . . . . . . . . . . . . . . . . 50.35GTCI score (income group average) . . . . . . . . . . . . . . . . . . . . . . . . 61.46
Score Rank
1 ENABLE . . . . . . . . . . . . . . . . . . . . . . . . . . . . . . . . . . . . . . . . . . .61.54 341.1 Regulatory Landscape . . . . . . . . . . . . . . . . . . . . . . . . . . . . . . . . . . . . . . 49.27 661.1.1 Government effectiveness . . . . . . . . . . . . . . . . . . . . . . . . . . . . . . . . . . . . 51.05 601.1.2 Rule of law . . . . . . . . . . . . . . . . . . . . . . . . . . . . . . . . . . . . . . . . . . . . . . . . . . . . 63.10 441.1.3 Political stability . . . . . . . . . . . . . . . . . . . . . . . . . . . . . . . . . . . . . . . . . . . . . . .44.20 1131.1.4 Regulatory quality. . . . . . . . . . . . . . . . . . . . . . . . . . . . . . . . . . . . . . . . . . . . .58.26 521.1.5 Corruption . . . . . . . . . . . . . . . . . . . . . . . . . . . . . . . . . . . . . . . . . . . . . . . . . . . .29.73 811.2 Market Landscape . . . . . . . . . . . . . . . . . . . . . . . . . . . . . . . . . . . . . . . . . . 63.40 311.2.1 Competition intensity . . . . . . . . . . . . . . . . . . . . . . . . . . . . . . . . . . . . . . . . . 71.45 591.2.2 Ease of doing business . . . . . . . . . . . . . . . . . . . . . . . . . . . . . . . . . . . . . . . . 70.10 581.2.3 Cluster development . . . . . . . . . . . . . . . . . . . . . . . . . . . . . . . . . . . . . . . . . . 67.06 251.2.4 R&D expenditure . . . . . . . . . . . . . . . . . . . . . . . . . . . . . . . . . . . . . . . . . . . . . . . 1.90 1091.2.5 ICT infrastructure. . . . . . . . . . . . . . . . . . . . . . . . . . . . . . . . . . . . . . . . . . . . . . 82.19 201.2.6 Urban population . . . . . . . . . . . . . . . . . . . . . . . . . . . . . . . . . . . . . . . . . . . . . 87.68 141.3 Business and Labour Landscape . . . . . . . . . . . . . . . . . . . . . . . . . . . . 71.95 18
Labour Market1.3.1 Tertiary-educated unemployment . . . . . . . . . . . . . . . . . . . . . . . . . . . .92.00 171.3.2 Active labour market policies . . . . . . . . . . . . . . . . . . . . . . . . . . . . . . . . . 67.33 331.3.3 Labour-employer cooperation . . . . . . . . . . . . . . . . . . . . . . . . . . . . . . . . 67.44 18
Management Practice1.3.4 Professional management . . . . . . . . . . . . . . . . . . . . . . . . . . . . . . . . . . . .63.54 361.3.5 Relationship of pay to productivity . . . . . . . . . . . . . . . . . . . . . . . . . . . . 70.93 18
Technology Adoption1.3.6 Technology utilisation. . . . . . . . . . . . . . . . . . . . . . . . . . . . . . . . . . . . . . . . .70.44 311.3.7 Investment in emerging technologies . . . . . . . . . . . . . . . . . . . . . . . . . .n/a n/a1.3.8 Robot density . . . . . . . . . . . . . . . . . . . . . . . . . . . . . . . . . . . . . . . . . . . . . . . . . . .n/a n/a
2 ATTRACT . . . . . . . . . . . . . . . . . . . . . . . . . . . . . . . . . . . . . . . . . .69.33 172.1 External Openness . . . . . . . . . . . . . . . . . . . . . . . . . . . . . . . . . . . . . . . . . 71.44 11
Attract Business2.1.1 FDI and technology transfer . . . . . . . . . . . . . . . . . . . . . . . . . . . . . . . . . .69.65 392.1.2 Prevalence of foreign ownership . . . . . . . . . . . . . . . . . . . . . . . . . . . . . . 81.33 16
Attract People2.1.3 Migrant stock . . . . . . . . . . . . . . . . . . . . . . . . . . . . . . . . . . . . . . . . . . . . . . . . .89.66 52.1.4 International students . . . . . . . . . . . . . . . . . . . . . . . . . . . . . . . . . . . . . . . . .48.24 122.1.5 Brain gain . . . . . . . . . . . . . . . . . . . . . . . . . . . . . . . . . . . . . . . . . . . . . . . . . . . . .68.31 212.2 Internal Openness . . . . . . . . . . . . . . . . . . . . . . . . . . . . . . . . . . . . . . . . . . 67.22 32
Social Inclusion2.2.1 Tolerance of minorities . . . . . . . . . . . . . . . . . . . . . . . . . . . . . . . . . . . . . . . . 11.11 1212.2.2 Tolerance of immigrants . . . . . . . . . . . . . . . . . . . . . . . . . . . . . . . . . . . . . .84.93 162.2.3 Social mobility . . . . . . . . . . . . . . . . . . . . . . . . . . . . . . . . . . . . . . . . . . . . . . . .78.70 20
Gender Equality2.2.4 Female graduates . . . . . . . . . . . . . . . . . . . . . . . . . . . . . . . . . . . . . . . . . . . . .89.59 172.2.5 Gender development gap . . . . . . . . . . . . . . . . . . . . . . . . . . . . . . . . . . . .64.38 992.2.6 Leadership opportunities for women . . . . . . . . . . . . . . . . . . . . . . . . .74.60 19
Score Rank
3 GROW . . . . . . . . . . . . . . . . . . . . . . . . . . . . . . . . . . . . . . . . . . . . 43.05 503.1 Formal Education . . . . . . . . . . . . . . . . . . . . . . . . . . . . . . . . . . . . . . . . . . . 17.45 87
Enrolment3.1.1 Vocational enrolment . . . . . . . . . . . . . . . . . . . . . . . . . . . . . . . . . . . . . . . . . 10.12 853.1.2 Tertiary enrolment . . . . . . . . . . . . . . . . . . . . . . . . . . . . . . . . . . . . . . . . . . . . 35.61 64
Quality3.1.3 Tertiary education expenditure . . . . . . . . . . . . . . . . . . . . . . . . . . . . . . . 12.38 923.1.4 Reading, maths, and science . . . . . . . . . . . . . . . . . . . . . . . . . . . . . . . . . . . .n/a n/a3.1.5 University ranking . . . . . . . . . . . . . . . . . . . . . . . . . . . . . . . . . . . . . . . . . . . . . 11.71 663.2 Lifelong Learning . . . . . . . . . . . . . . . . . . . . . . . . . . . . . . . . . . . . . . . . . . . 64.31 263.2.1 Quality of management schools . . . . . . . . . . . . . . . . . . . . . . . . . . . . . . 64.17 333.2.2 Prevalence of training in firms . . . . . . . . . . . . . . . . . . . . . . . . . . . . . . . . . . .n/a n/a3.2.3 Employee development . . . . . . . . . . . . . . . . . . . . . . . . . . . . . . . . . . . . . .64.45 263.3 Access to Growth Opportunities . . . . . . . . . . . . . . . . . . . . . . . . . . . 47.39 64
Empowerment3.3.1 Delegation of authority . . . . . . . . . . . . . . . . . . . . . . . . . . . . . . . . . . . . . . . 57.66 383.3.2 Personal rights . . . . . . . . . . . . . . . . . . . . . . . . . . . . . . . . . . . . . . . . . . . . . . . . . 8.00 127
Collaboration3.3.3 Use of virtual social networks . . . . . . . . . . . . . . . . . . . . . . . . . . . . . . . . .89.65 153.3.4 Use of virtual professional networks . . . . . . . . . . . . . . . . . . . . . . . . . .18.06 353.3.5 Collaboration within organisations . . . . . . . . . . . . . . . . . . . . . . . . . . . .62.32 313.3.6 Collaboration across organisations . . . . . . . . . . . . . . . . . . . . . . . . . . . .48.65 37
4 RETAIN . . . . . . . . . . . . . . . . . . . . . . . . . . . . . . . . . . . . . . . . . . . 58.60 454.1 Sustainability . . . . . . . . . . . . . . . . . . . . . . . . . . . . . . . . . . . . . . . . . . . . . . .66.66 274.1.1 Pension system . . . . . . . . . . . . . . . . . . . . . . . . . . . . . . . . . . . . . . . . . . . . . . . . .n/a n/a4.1.2 Social protection . . . . . . . . . . . . . . . . . . . . . . . . . . . . . . . . . . . . . . . . . . . . . .68.21 304.1.3 Brain retention . . . . . . . . . . . . . . . . . . . . . . . . . . . . . . . . . . . . . . . . . . . . . . . . 65.10 294.2 Lifestyle . . . . . . . . . . . . . . . . . . . . . . . . . . . . . . . . . . . . . . . . . . . . . . . . . . . . 50.55 794.2.1 Environmental performance . . . . . . . . . . . . . . . . . . . . . . . . . . . . . . . . . .46.21 814.2.2 Personal safety . . . . . . . . . . . . . . . . . . . . . . . . . . . . . . . . . . . . . . . . . . . . . . . . 41.52 924.2.3 Physician density . . . . . . . . . . . . . . . . . . . . . . . . . . . . . . . . . . . . . . . . . . . . . .14.48 844.2.4 Sanitation . . . . . . . . . . . . . . . . . . . . . . . . . . . . . . . . . . . . . . . . . . . . . . . . . . . 100.00 1
5 VOCATIONAL AND TECHNICAL SKILLS . . . . . . . . . . . . 50.46 465.1 Mid-Level Skills . . . . . . . . . . . . . . . . . . . . . . . . . . . . . . . . . . . . . . . . . . . . . 33.42 765.1.1 Workforce with secondary education . . . . . . . . . . . . . . . . . . . . . . . . . 11.91 1145.1.2 Population with secondary education . . . . . . . . . . . . . . . . . . . . . . . . 41.05 595.1.3 Technicians and associate professionals . . . . . . . . . . . . . . . . . . . . . . .26.42 765.1.4 Labour productivity per employee . . . . . . . . . . . . . . . . . . . . . . . . . . . .54.32 225.2 Employability . . . . . . . . . . . . . . . . . . . . . . . . . . . . . . . . . . . . . . . . . . . . . . . 67.50 275.2.1 Ease of finding skilled employees . . . . . . . . . . . . . . . . . . . . . . . . . . . . . 71.19 295.2.2 Relevance of education system to the economy . . . . . . . . . . . . . .66.47 235.2.3 Skills matching with secondary education . . . . . . . . . . . . . . . . . . . .56.26 385.2.4 Skills matching with tertiary education . . . . . . . . . . . . . . . . . . . . . . . .76.08 26
6 GLOBAL KNOWLEDGE SKILLS . . . . . . . . . . . . . . . . . . . . .19.09 866.1 High-Level Skills . . . . . . . . . . . . . . . . . . . . . . . . . . . . . . . . . . . . . . . . . . . . 27.68 706.1.1 Workforce with tertiary education . . . . . . . . . . . . . . . . . . . . . . . . . . . . 14.10 966.1.2 Population with tertiary education . . . . . . . . . . . . . . . . . . . . . . . . . . . . 18.18 766.1.3 Professionals . . . . . . . . . . . . . . . . . . . . . . . . . . . . . . . . . . . . . . . . . . . . . . . . . . 19.30 816.1.4 Researchers . . . . . . . . . . . . . . . . . . . . . . . . . . . . . . . . . . . . . . . . . . . . . . . . . . . . 4.35 726.1.5 Senior officials and managers . . . . . . . . . . . . . . . . . . . . . . . . . . . . . . . . . 49.59 246.1.6 Availability of scientists and engineers . . . . . . . . . . . . . . . . . . . . . . . .60.55 426.2 Talent Impact . . . . . . . . . . . . . . . . . . . . . . . . . . . . . . . . . . . . . . . . . . . . . . . 10.51 1056.2.1 Innovation output . . . . . . . . . . . . . . . . . . . . . . . . . . . . . . . . . . . . . . . . . . . .22.59 856.2.2 High-value exports . . . . . . . . . . . . . . . . . . . . . . . . . . . . . . . . . . . . . . . . . . . . . 3.11 1106.2.3 New product entrepreneurial activity . . . . . . . . . . . . . . . . . . . . . . . . . . .n/a n/a6.2.4 New business density . . . . . . . . . . . . . . . . . . . . . . . . . . . . . . . . . . . . . . . . . . .n/a n/a6.2.5 Scientific journal articles . . . . . . . . . . . . . . . . . . . . . . . . . . . . . . . . . . . . . . . 5.82 65
l Bahrain l Income group average
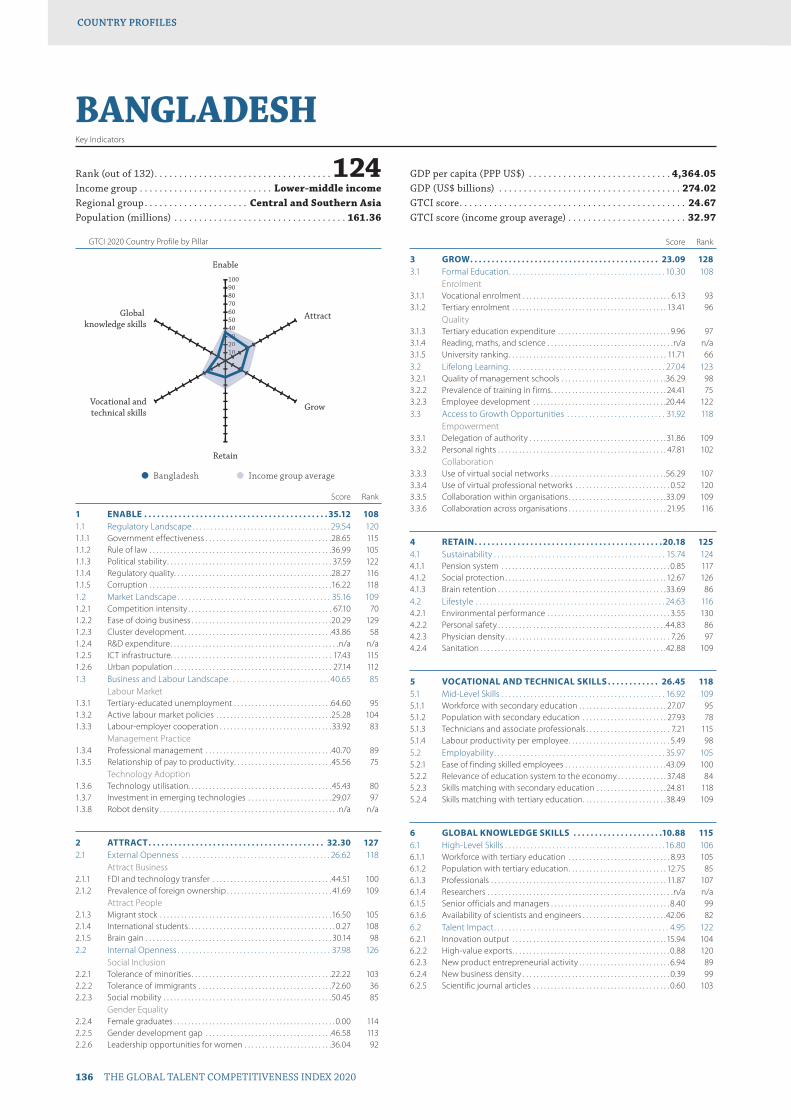
GTCI 2020 Country Profile by Pillar
136 THE GLOBAL TALENT COMPETITIVENESS INDEX 2020
COUNTRY PROFILESCOUNTRY PROFILES
102030405060708090100
Global knowledge skills
Vocational andtechnical skills
Retain
Grow
Attract
Enable
10203004
BANGLADESHKey Indicators
Rank (out of 132) . . . . . . . . . . . . . . . . . . . . . . . . . . . . . . . . . . . .124Income group . . . . . . . . . . . . . . . . . . . . . . . . . . . Lower-middle incomeRegional group . . . . . . . . . . . . . . . . . . . . . Central and Southern AsiaPopulation (millions) . . . . . . . . . . . . . . . . . . . . . . . . . . . . . . . . . . . 161.36
GDP per capita (PPP US$) . . . . . . . . . . . . . . . . . . . . . . . . . . . . . 4,364.05GDP (US$ billions) . . . . . . . . . . . . . . . . . . . . . . . . . . . . . . . . . . . . . 274.02GTCI score . . . . . . . . . . . . . . . . . . . . . . . . . . . . . . . . . . . . . . . . . . . . . . 24.67GTCI score (income group average) . . . . . . . . . . . . . . . . . . . . . . . . 32.97
Score Rank
1 ENABLE . . . . . . . . . . . . . . . . . . . . . . . . . . . . . . . . . . . . . . . . . . . 35.12 1081.1 Regulatory Landscape . . . . . . . . . . . . . . . . . . . . . . . . . . . . . . . . . . . . . . 29.54 1201.1.1 Government effectiveness . . . . . . . . . . . . . . . . . . . . . . . . . . . . . . . . . . . .28.65 1151.1.2 Rule of law . . . . . . . . . . . . . . . . . . . . . . . . . . . . . . . . . . . . . . . . . . . . . . . . . . . .36.99 1051.1.3 Political stability . . . . . . . . . . . . . . . . . . . . . . . . . . . . . . . . . . . . . . . . . . . . . . . 37.59 1221.1.4 Regulatory quality. . . . . . . . . . . . . . . . . . . . . . . . . . . . . . . . . . . . . . . . . . . . .28.27 1161.1.5 Corruption . . . . . . . . . . . . . . . . . . . . . . . . . . . . . . . . . . . . . . . . . . . . . . . . . . . .16.22 1181.2 Market Landscape . . . . . . . . . . . . . . . . . . . . . . . . . . . . . . . . . . . . . . . . . . 35.16 1091.2.1 Competition intensity . . . . . . . . . . . . . . . . . . . . . . . . . . . . . . . . . . . . . . . . . 67.10 701.2.2 Ease of doing business . . . . . . . . . . . . . . . . . . . . . . . . . . . . . . . . . . . . . . . .20.29 1291.2.3 Cluster development . . . . . . . . . . . . . . . . . . . . . . . . . . . . . . . . . . . . . . . . . .43.86 581.2.4 R&D expenditure . . . . . . . . . . . . . . . . . . . . . . . . . . . . . . . . . . . . . . . . . . . . . . . .n/a n/a1.2.5 ICT infrastructure. . . . . . . . . . . . . . . . . . . . . . . . . . . . . . . . . . . . . . . . . . . . . . 17.43 1151.2.6 Urban population . . . . . . . . . . . . . . . . . . . . . . . . . . . . . . . . . . . . . . . . . . . . . 27.14 1121.3 Business and Labour Landscape . . . . . . . . . . . . . . . . . . . . . . . . . . . . 40.65 85
Labour Market1.3.1 Tertiary-educated unemployment . . . . . . . . . . . . . . . . . . . . . . . . . . . .64.60 951.3.2 Active labour market policies . . . . . . . . . . . . . . . . . . . . . . . . . . . . . . . . .25.28 1041.3.3 Labour-employer cooperation . . . . . . . . . . . . . . . . . . . . . . . . . . . . . . . . 33.92 83
Management Practice1.3.4 Professional management . . . . . . . . . . . . . . . . . . . . . . . . . . . . . . . . . . . .40.70 891.3.5 Relationship of pay to productivity . . . . . . . . . . . . . . . . . . . . . . . . . . . .45.56 75
Technology Adoption1.3.6 Technology utilisation. . . . . . . . . . . . . . . . . . . . . . . . . . . . . . . . . . . . . . . . . 45.43 801.3.7 Investment in emerging technologies . . . . . . . . . . . . . . . . . . . . . . . .29.07 971.3.8 Robot density . . . . . . . . . . . . . . . . . . . . . . . . . . . . . . . . . . . . . . . . . . . . . . . . . . .n/a n/a
2 ATTRACT . . . . . . . . . . . . . . . . . . . . . . . . . . . . . . . . . . . . . . . . . 32.30 1272.1 External Openness . . . . . . . . . . . . . . . . . . . . . . . . . . . . . . . . . . . . . . . . . 26.62 118
Attract Business2.1.1 FDI and technology transfer . . . . . . . . . . . . . . . . . . . . . . . . . . . . . . . . . .44.51 1002.1.2 Prevalence of foreign ownership . . . . . . . . . . . . . . . . . . . . . . . . . . . . . . 41.69 109
Attract People2.1.3 Migrant stock . . . . . . . . . . . . . . . . . . . . . . . . . . . . . . . . . . . . . . . . . . . . . . . . .16.50 1052.1.4 International students . . . . . . . . . . . . . . . . . . . . . . . . . . . . . . . . . . . . . . . . . . 0.27 1082.1.5 Brain gain . . . . . . . . . . . . . . . . . . . . . . . . . . . . . . . . . . . . . . . . . . . . . . . . . . . . . 30.14 982.2 Internal Openness . . . . . . . . . . . . . . . . . . . . . . . . . . . . . . . . . . . . . . . . . . 37.98 126
Social Inclusion2.2.1 Tolerance of minorities . . . . . . . . . . . . . . . . . . . . . . . . . . . . . . . . . . . . . . . .22.22 1032.2.2 Tolerance of immigrants . . . . . . . . . . . . . . . . . . . . . . . . . . . . . . . . . . . . . .72.60 362.2.3 Social mobility . . . . . . . . . . . . . . . . . . . . . . . . . . . . . . . . . . . . . . . . . . . . . . . .50.45 85
Gender Equality2.2.4 Female graduates . . . . . . . . . . . . . . . . . . . . . . . . . . . . . . . . . . . . . . . . . . . . . . 0.00 1142.2.5 Gender development gap . . . . . . . . . . . . . . . . . . . . . . . . . . . . . . . . . . . .46.58 1132.2.6 Leadership opportunities for women . . . . . . . . . . . . . . . . . . . . . . . . .36.04 92
Score Rank
3 GROW . . . . . . . . . . . . . . . . . . . . . . . . . . . . . . . . . . . . . . . . . . . . 23.09 1283.1 Formal Education . . . . . . . . . . . . . . . . . . . . . . . . . . . . . . . . . . . . . . . . . . . 10.30 108
Enrolment3.1.1 Vocational enrolment . . . . . . . . . . . . . . . . . . . . . . . . . . . . . . . . . . . . . . . . . . 6.13 933.1.2 Tertiary enrolment . . . . . . . . . . . . . . . . . . . . . . . . . . . . . . . . . . . . . . . . . . . . 13.41 96
Quality3.1.3 Tertiary education expenditure . . . . . . . . . . . . . . . . . . . . . . . . . . . . . . . . 9.96 973.1.4 Reading, maths, and science . . . . . . . . . . . . . . . . . . . . . . . . . . . . . . . . . . . .n/a n/a3.1.5 University ranking . . . . . . . . . . . . . . . . . . . . . . . . . . . . . . . . . . . . . . . . . . . . . 11.71 663.2 Lifelong Learning . . . . . . . . . . . . . . . . . . . . . . . . . . . . . . . . . . . . . . . . . . . 27.04 1233.2.1 Quality of management schools . . . . . . . . . . . . . . . . . . . . . . . . . . . . . .36.29 983.2.2 Prevalence of training in firms . . . . . . . . . . . . . . . . . . . . . . . . . . . . . . . . . 24.41 753.2.3 Employee development . . . . . . . . . . . . . . . . . . . . . . . . . . . . . . . . . . . . . .20.44 1223.3 Access to Growth Opportunities . . . . . . . . . . . . . . . . . . . . . . . . . . . 31.92 118
Empowerment3.3.1 Delegation of authority . . . . . . . . . . . . . . . . . . . . . . . . . . . . . . . . . . . . . . . 31.86 1093.3.2 Personal rights . . . . . . . . . . . . . . . . . . . . . . . . . . . . . . . . . . . . . . . . . . . . . . . . 47.81 102
Collaboration3.3.3 Use of virtual social networks . . . . . . . . . . . . . . . . . . . . . . . . . . . . . . . . .56.29 1073.3.4 Use of virtual professional networks . . . . . . . . . . . . . . . . . . . . . . . . . . . 0.52 1203.3.5 Collaboration within organisations . . . . . . . . . . . . . . . . . . . . . . . . . . . .33.09 1093.3.6 Collaboration across organisations . . . . . . . . . . . . . . . . . . . . . . . . . . . . 21.95 116
4 RETAIN . . . . . . . . . . . . . . . . . . . . . . . . . . . . . . . . . . . . . . . . . . . .20.18 1254.1 Sustainability . . . . . . . . . . . . . . . . . . . . . . . . . . . . . . . . . . . . . . . . . . . . . . . 15.74 1244.1.1 Pension system . . . . . . . . . . . . . . . . . . . . . . . . . . . . . . . . . . . . . . . . . . . . . . . . 0.85 1174.1.2 Social protection . . . . . . . . . . . . . . . . . . . . . . . . . . . . . . . . . . . . . . . . . . . . . . 12.67 1264.1.3 Brain retention . . . . . . . . . . . . . . . . . . . . . . . . . . . . . . . . . . . . . . . . . . . . . . . .33.69 864.2 Lifestyle . . . . . . . . . . . . . . . . . . . . . . . . . . . . . . . . . . . . . . . . . . . . . . . . . . . . 24.63 1164.2.1 Environmental performance . . . . . . . . . . . . . . . . . . . . . . . . . . . . . . . . . . . 3.55 1304.2.2 Personal safety . . . . . . . . . . . . . . . . . . . . . . . . . . . . . . . . . . . . . . . . . . . . . . . .44.83 864.2.3 Physician density . . . . . . . . . . . . . . . . . . . . . . . . . . . . . . . . . . . . . . . . . . . . . . . 7.26 974.2.4 Sanitation . . . . . . . . . . . . . . . . . . . . . . . . . . . . . . . . . . . . . . . . . . . . . . . . . . . . .42.88 109
5 VOCATIONAL AND TECHNICAL SKILLS . . . . . . . . . . . . 26.45 1185.1 Mid-Level Skills . . . . . . . . . . . . . . . . . . . . . . . . . . . . . . . . . . . . . . . . . . . . . 16.92 1095.1.1 Workforce with secondary education . . . . . . . . . . . . . . . . . . . . . . . . . 27.07 955.1.2 Population with secondary education . . . . . . . . . . . . . . . . . . . . . . . . 27.93 785.1.3 Technicians and associate professionals . . . . . . . . . . . . . . . . . . . . . . . . 7.21 1155.1.4 Labour productivity per employee . . . . . . . . . . . . . . . . . . . . . . . . . . . . . 5.49 985.2 Employability . . . . . . . . . . . . . . . . . . . . . . . . . . . . . . . . . . . . . . . . . . . . . . . 35.97 1055.2.1 Ease of finding skilled employees . . . . . . . . . . . . . . . . . . . . . . . . . . . . .43.09 1005.2.2 Relevance of education system to the economy . . . . . . . . . . . . . . 37.48 845.2.3 Skills matching with secondary education . . . . . . . . . . . . . . . . . . . . 24.81 1185.2.4 Skills matching with tertiary education . . . . . . . . . . . . . . . . . . . . . . . .38.49 109
6 GLOBAL KNOWLEDGE SKILLS . . . . . . . . . . . . . . . . . . . . .10.88 1156.1 High-Level Skills . . . . . . . . . . . . . . . . . . . . . . . . . . . . . . . . . . . . . . . . . . . . 16.80 1066.1.1 Workforce with tertiary education . . . . . . . . . . . . . . . . . . . . . . . . . . . . . 8.93 1056.1.2 Population with tertiary education . . . . . . . . . . . . . . . . . . . . . . . . . . . . 12.75 856.1.3 Professionals . . . . . . . . . . . . . . . . . . . . . . . . . . . . . . . . . . . . . . . . . . . . . . . . . . 11.87 1076.1.4 Researchers . . . . . . . . . . . . . . . . . . . . . . . . . . . . . . . . . . . . . . . . . . . . . . . . . . . . .n/a n/a6.1.5 Senior officials and managers . . . . . . . . . . . . . . . . . . . . . . . . . . . . . . . . . . 8.40 996.1.6 Availability of scientists and engineers . . . . . . . . . . . . . . . . . . . . . . . .42.06 826.2 Talent Impact . . . . . . . . . . . . . . . . . . . . . . . . . . . . . . . . . . . . . . . . . . . . . . . . 4.95 1226.2.1 Innovation output . . . . . . . . . . . . . . . . . . . . . . . . . . . . . . . . . . . . . . . . . . . . 15.94 1046.2.2 High-value exports . . . . . . . . . . . . . . . . . . . . . . . . . . . . . . . . . . . . . . . . . . . . . 0.88 1206.2.3 New product entrepreneurial activity . . . . . . . . . . . . . . . . . . . . . . . . . . 6.94 896.2.4 New business density . . . . . . . . . . . . . . . . . . . . . . . . . . . . . . . . . . . . . . . . . . 0.39 996.2.5 Scientific journal articles . . . . . . . . . . . . . . . . . . . . . . . . . . . . . . . . . . . . . . . 0.60 103
l Bangladesh l Income group average

GTCI 2020 Country Profile by Pillar
THE GLOBAL TALENT COMPETITIVENESS INDEX 2020 137
COUNTRY PROFILESCOUNTRY PROFILES
102030405060708090100
Global knowledge skills
Vocational andtechnical skills
Retain
Grow
Attract
Enable
102030405060607
BELGIUMKey Indicators
Rank (out of 132) . . . . . . . . . . . . . . . . . . . . . . . . . . . . . . . . . . . . . . . 18Income group . . . . . . . . . . . . . . . . . . . . . . . . . . . . . . . . . . . . High incomeRegional group . . . . . . . . . . . . . . . . . . . . . . . . . . . . . . . . . . . . . . . . .EuropePopulation (millions) . . . . . . . . . . . . . . . . . . . . . . . . . . . . . . . . . . . . 11.42
GDP per capita (PPP US$) . . . . . . . . . . . . . . . . . . . . . . . . . . . . 50,774.91GDP (US$ billions) . . . . . . . . . . . . . . . . . . . . . . . . . . . . . . . . . . . . . 531.77GTCI score . . . . . . . . . . . . . . . . . . . . . . . . . . . . . . . . . . . . . . . . . . . . . . 68.87GTCI score (income group average) . . . . . . . . . . . . . . . . . . . . . . . . 61.46
Score Rank
1 ENABLE . . . . . . . . . . . . . . . . . . . . . . . . . . . . . . . . . . . . . . . . . . .75.80 181.1 Regulatory Landscape . . . . . . . . . . . . . . . . . . . . . . . . . . . . . . . . . . . . . . 78.92 201.1.1 Government effectiveness . . . . . . . . . . . . . . . . . . . . . . . . . . . . . . . . . . . . 75.19 231.1.2 Rule of law . . . . . . . . . . . . . . . . . . . . . . . . . . . . . . . . . . . . . . . . . . . . . . . . . . . .84.04 201.1.3 Political stability . . . . . . . . . . . . . . . . . . . . . . . . . . . . . . . . . . . . . . . . . . . . . . . 74.32 421.1.4 Regulatory quality. . . . . . . . . . . . . . . . . . . . . . . . . . . . . . . . . . . . . . . . . . . . .78.63 231.1.5 Corruption . . . . . . . . . . . . . . . . . . . . . . . . . . . . . . . . . . . . . . . . . . . . . . . . . . . .82.43 161.2 Market Landscape . . . . . . . . . . . . . . . . . . . . . . . . . . . . . . . . . . . . . . . . . . 79.14 121.2.1 Competition intensity . . . . . . . . . . . . . . . . . . . . . . . . . . . . . . . . . . . . . . . . .85.64 121.2.2 Ease of doing business . . . . . . . . . . . . . . . . . . . . . . . . . . . . . . . . . . . . . . . . 77.42 411.2.3 Cluster development . . . . . . . . . . . . . . . . . . . . . . . . . . . . . . . . . . . . . . . . . . 74.96 151.2.4 R&D expenditure . . . . . . . . . . . . . . . . . . . . . . . . . . . . . . . . . . . . . . . . . . . . . .56.81 111.2.5 ICT infrastructure. . . . . . . . . . . . . . . . . . . . . . . . . . . . . . . . . . . . . . . . . . . . . .82.32 191.2.6 Urban population . . . . . . . . . . . . . . . . . . . . . . . . . . . . . . . . . . . . . . . . . . . . . 97.70 41.3 Business and Labour Landscape . . . . . . . . . . . . . . . . . . . . . . . . . . . . 69.32 21
Labour Market1.3.1 Tertiary-educated unemployment . . . . . . . . . . . . . . . . . . . . . . . . . . . .88.73 311.3.2 Active labour market policies . . . . . . . . . . . . . . . . . . . . . . . . . . . . . . . . . 71.48 241.3.3 Labour-employer cooperation . . . . . . . . . . . . . . . . . . . . . . . . . . . . . . . . 47.88 46
Management Practice1.3.4 Professional management . . . . . . . . . . . . . . . . . . . . . . . . . . . . . . . . . . . . 87.20 141.3.5 Relationship of pay to productivity . . . . . . . . . . . . . . . . . . . . . . . . . . . .62.32 43
Technology Adoption1.3.6 Technology utilisation. . . . . . . . . . . . . . . . . . . . . . . . . . . . . . . . . . . . . . . . .73.73 281.3.7 Investment in emerging technologies . . . . . . . . . . . . . . . . . . . . . . . . 67.50 201.3.8 Robot density . . . . . . . . . . . . . . . . . . . . . . . . . . . . . . . . . . . . . . . . . . . . . . . . . 55.75 9
2 ATTRACT . . . . . . . . . . . . . . . . . . . . . . . . . . . . . . . . . . . . . . . . . .68.14 212.1 External Openness . . . . . . . . . . . . . . . . . . . . . . . . . . . . . . . . . . . . . . . . . 65.19 17
Attract Business2.1.1 FDI and technology transfer . . . . . . . . . . . . . . . . . . . . . . . . . . . . . . . . . .76.58 232.1.2 Prevalence of foreign ownership . . . . . . . . . . . . . . . . . . . . . . . . . . . . . .90.39 6
Attract People2.1.3 Migrant stock . . . . . . . . . . . . . . . . . . . . . . . . . . . . . . . . . . . . . . . . . . . . . . . . . 55.55 422.1.4 International students . . . . . . . . . . . . . . . . . . . . . . . . . . . . . . . . . . . . . . . . . 44.10 132.1.5 Brain gain . . . . . . . . . . . . . . . . . . . . . . . . . . . . . . . . . . . . . . . . . . . . . . . . . . . . .59.34 312.2 Internal Openness . . . . . . . . . . . . . . . . . . . . . . . . . . . . . . . . . . . . . . . . . . 71.10 25
Social Inclusion2.2.1 Tolerance of minorities . . . . . . . . . . . . . . . . . . . . . . . . . . . . . . . . . . . . . . . .58.89 442.2.2 Tolerance of immigrants . . . . . . . . . . . . . . . . . . . . . . . . . . . . . . . . . . . . . .69.86 432.2.3 Social mobility . . . . . . . . . . . . . . . . . . . . . . . . . . . . . . . . . . . . . . . . . . . . . . . .82.65 16
Gender Equality2.2.4 Female graduates . . . . . . . . . . . . . . . . . . . . . . . . . . . . . . . . . . . . . . . . . . . . .79.53 362.2.5 Gender development gap . . . . . . . . . . . . . . . . . . . . . . . . . . . . . . . . . . . .78.52 602.2.6 Leadership opportunities for women . . . . . . . . . . . . . . . . . . . . . . . . . 57.13 47
Score Rank
3 GROW . . . . . . . . . . . . . . . . . . . . . . . . . . . . . . . . . . . . . . . . . . . . .71.51 103.1 Formal Education . . . . . . . . . . . . . . . . . . . . . . . . . . . . . . . . . . . . . . . . . . . 59.42 7
Enrolment3.1.1 Vocational enrolment . . . . . . . . . . . . . . . . . . . . . . . . . . . . . . . . . . . . . . . . .70.49 43.1.2 Tertiary enrolment . . . . . . . . . . . . . . . . . . . . . . . . . . . . . . . . . . . . . . . . . . . .59.80 22
Quality3.1.3 Tertiary education expenditure . . . . . . . . . . . . . . . . . . . . . . . . . . . . . . .34.20 243.1.4 Reading, maths, and science . . . . . . . . . . . . . . . . . . . . . . . . . . . . . . . . . .76.90 173.1.5 University ranking . . . . . . . . . . . . . . . . . . . . . . . . . . . . . . . . . . . . . . . . . . . . . 55.71 153.2 Lifelong Learning . . . . . . . . . . . . . . . . . . . . . . . . . . . . . . . . . . . . . . . . . . . 78.51 83.2.1 Quality of management schools . . . . . . . . . . . . . . . . . . . . . . . . . . . . . .83.77 73.2.2 Prevalence of training in firms . . . . . . . . . . . . . . . . . . . . . . . . . . . . . . . . . . .n/a n/a3.2.3 Employee development . . . . . . . . . . . . . . . . . . . . . . . . . . . . . . . . . . . . . .73.24 163.3 Access to Growth Opportunities . . . . . . . . . . . . . . . . . . . . . . . . . . . 76.62 12
Empowerment3.3.1 Delegation of authority . . . . . . . . . . . . . . . . . . . . . . . . . . . . . . . . . . . . . . .83.52 133.3.2 Personal rights . . . . . . . . . . . . . . . . . . . . . . . . . . . . . . . . . . . . . . . . . . . . . . . . 97.44 9
Collaboration3.3.3 Use of virtual social networks . . . . . . . . . . . . . . . . . . . . . . . . . . . . . . . . .88.79 163.3.4 Use of virtual professional networks . . . . . . . . . . . . . . . . . . . . . . . . . . 51.25 103.3.5 Collaboration within organisations . . . . . . . . . . . . . . . . . . . . . . . . . . . .79.54 153.3.6 Collaboration across organisations . . . . . . . . . . . . . . . . . . . . . . . . . . . . 59.17 28
4 RETAIN . . . . . . . . . . . . . . . . . . . . . . . . . . . . . . . . . . . . . . . . . . . . 79.14 154.1 Sustainability . . . . . . . . . . . . . . . . . . . . . . . . . . . . . . . . . . . . . . . . . . . . . . . 82.73 114.1.1 Pension system . . . . . . . . . . . . . . . . . . . . . . . . . . . . . . . . . . . . . . . . . . . . . . . 91.99 134.1.2 Social protection . . . . . . . . . . . . . . . . . . . . . . . . . . . . . . . . . . . . . . . . . . . . . .98.78 54.1.3 Brain retention . . . . . . . . . . . . . . . . . . . . . . . . . . . . . . . . . . . . . . . . . . . . . . . . 57.41 364.2 Lifestyle . . . . . . . . . . . . . . . . . . . . . . . . . . . . . . . . . . . . . . . . . . . . . . . . . . . . 75.55 264.2.1 Environmental performance . . . . . . . . . . . . . . . . . . . . . . . . . . . . . . . . . .83.26 154.2.2 Personal safety . . . . . . . . . . . . . . . . . . . . . . . . . . . . . . . . . . . . . . . . . . . . . . . . 71.51 324.2.3 Physician density . . . . . . . . . . . . . . . . . . . . . . . . . . . . . . . . . . . . . . . . . . . . . . 47.98 364.2.4 Sanitation . . . . . . . . . . . . . . . . . . . . . . . . . . . . . . . . . . . . . . . . . . . . . . . . . . . . .99.45 21
5 VOCATIONAL AND TECHNICAL SKILLS . . . . . . . . . . . . 65.00 185.1 Mid-Level Skills . . . . . . . . . . . . . . . . . . . . . . . . . . . . . . . . . . . . . . . . . . . . . 57.20 305.1.1 Workforce with secondary education . . . . . . . . . . . . . . . . . . . . . . . . .52.02 565.1.2 Population with secondary education . . . . . . . . . . . . . . . . . . . . . . . . 48.12 505.1.3 Technicians and associate professionals . . . . . . . . . . . . . . . . . . . . . . .62.05 225.1.4 Labour productivity per employee . . . . . . . . . . . . . . . . . . . . . . . . . . . .66.60 95.2 Employability . . . . . . . . . . . . . . . . . . . . . . . . . . . . . . . . . . . . . . . . . . . . . . . 72.81 185.2.1 Ease of finding skilled employees . . . . . . . . . . . . . . . . . . . . . . . . . . . . .72.02 265.2.2 Relevance of education system to the economy . . . . . . . . . . . . . . 69.31 175.2.3 Skills matching with secondary education . . . . . . . . . . . . . . . . . . . .65.68 255.2.4 Skills matching with tertiary education . . . . . . . . . . . . . . . . . . . . . . . .84.23 8
6 GLOBAL KNOWLEDGE SKILLS . . . . . . . . . . . . . . . . . . . . .53.65 186.1 High-Level Skills . . . . . . . . . . . . . . . . . . . . . . . . . . . . . . . . . . . . . . . . . . . . 58.69 176.1.1 Workforce with tertiary education . . . . . . . . . . . . . . . . . . . . . . . . . . . .68.50 106.1.2 Population with tertiary education . . . . . . . . . . . . . . . . . . . . . . . . . . . . 51.69 256.1.3 Professionals . . . . . . . . . . . . . . . . . . . . . . . . . . . . . . . . . . . . . . . . . . . . . . . . . . 65.93 116.1.4 Researchers . . . . . . . . . . . . . . . . . . . . . . . . . . . . . . . . . . . . . . . . . . . . . . . . . . .59.85 146.1.5 Senior officials and managers . . . . . . . . . . . . . . . . . . . . . . . . . . . . . . . . .48.66 266.1.6 Availability of scientists and engineers . . . . . . . . . . . . . . . . . . . . . . . . 57.53 486.2 Talent Impact . . . . . . . . . . . . . . . . . . . . . . . . . . . . . . . . . . . . . . . . . . . . . . .48.60 216.2.1 Innovation output . . . . . . . . . . . . . . . . . . . . . . . . . . . . . . . . . . . . . . . . . . . . 58.14 236.2.2 High-value exports . . . . . . . . . . . . . . . . . . . . . . . . . . . . . . . . . . . . . . . . . . . .28.24 436.2.3 New product entrepreneurial activity . . . . . . . . . . . . . . . . . . . . . . . . . 81.42 76.2.4 New business density . . . . . . . . . . . . . . . . . . . . . . . . . . . . . . . . . . . . . . . . . 17.88 336.2.5 Scientific journal articles . . . . . . . . . . . . . . . . . . . . . . . . . . . . . . . . . . . . . . 57.32 15
l Belgium l Income group average

GTCI 2020 Country Profile by Pillar
138 THE GLOBAL TALENT COMPETITIVENESS INDEX 2020
COUNTRY PROFILESCOUNTRY PROFILES
102030405060708090100
Global knowledge skills
Vocational andtechnical skills
Retain
Grow
Attract
Enable
10203004
BHUTANKey Indicators
Rank (out of 132) . . . . . . . . . . . . . . . . . . . . . . . . . . . . . . . . . . . . . . . 92Income group . . . . . . . . . . . . . . . . . . . . . . . . . . . Lower-middle incomeRegional group . . . . . . . . . . . . . . . . . . . . . Central and Southern AsiaPopulation (millions) . . . . . . . . . . . . . . . . . . . . . . . . . . . . . . . . . . . . . .0.75
GDP per capita (PPP US$) . . . . . . . . . . . . . . . . . . . . . . . . . . . . 10,516.28GDP (US$ billions) . . . . . . . . . . . . . . . . . . . . . . . . . . . . . . . . . . . . . . . 2.53GTCI score . . . . . . . . . . . . . . . . . . . . . . . . . . . . . . . . . . . . . . . . . . . . . . 35.66GTCI score (income group average) . . . . . . . . . . . . . . . . . . . . . . . . 32.97
Score Rank
1 ENABLE . . . . . . . . . . . . . . . . . . . . . . . . . . . . . . . . . . . . . . . . . . .53.71 491.1 Regulatory Landscape . . . . . . . . . . . . . . . . . . . . . . . . . . . . . . . . . . . . . . 66.01 411.1.1 Government effectiveness . . . . . . . . . . . . . . . . . . . . . . . . . . . . . . . . . . . .60.06 421.1.2 Rule of law . . . . . . . . . . . . . . . . . . . . . . . . . . . . . . . . . . . . . . . . . . . . . . . . . . . . 67.32 371.1.3 Political stability . . . . . . . . . . . . . . . . . . . . . . . . . . . . . . . . . . . . . . . . . . . . . . .89.77 91.1.4 Regulatory quality. . . . . . . . . . . . . . . . . . . . . . . . . . . . . . . . . . . . . . . . . . . . . 39.93 951.1.5 Corruption . . . . . . . . . . . . . . . . . . . . . . . . . . . . . . . . . . . . . . . . . . . . . . . . . . . .72.97 241.2 Market Landscape . . . . . . . . . . . . . . . . . . . . . . . . . . . . . . . . . . . . . . . . . . 44.39 791.2.1 Competition intensity . . . . . . . . . . . . . . . . . . . . . . . . . . . . . . . . . . . . . . . . .56.51 1031.2.2 Ease of doing business . . . . . . . . . . . . . . . . . . . . . . . . . . . . . . . . . . . . . . . .63.36 751.2.3 Cluster development . . . . . . . . . . . . . . . . . . . . . . . . . . . . . . . . . . . . . . . . . .39.38 761.2.4 R&D expenditure . . . . . . . . . . . . . . . . . . . . . . . . . . . . . . . . . . . . . . . . . . . . . . . .n/a n/a1.2.5 ICT infrastructure. . . . . . . . . . . . . . . . . . . . . . . . . . . . . . . . . . . . . . . . . . . . . .30.66 1011.2.6 Urban population . . . . . . . . . . . . . . . . . . . . . . . . . . . . . . . . . . . . . . . . . . . . .32.04 1071.3 Business and Labour Landscape . . . . . . . . . . . . . . . . . . . . . . . . . . . . 50.73 52
Labour Market1.3.1 Tertiary-educated unemployment . . . . . . . . . . . . . . . . . . . . . . . . . . . .39.65 1171.3.2 Active labour market policies . . . . . . . . . . . . . . . . . . . . . . . . . . . . . . . . . 61.90 371.3.3 Labour-employer cooperation . . . . . . . . . . . . . . . . . . . . . . . . . . . . . . . .62.37 28
Management Practice1.3.4 Professional management . . . . . . . . . . . . . . . . . . . . . . . . . . . . . . . . . . . . 55.07 531.3.5 Relationship of pay to productivity . . . . . . . . . . . . . . . . . . . . . . . . . . . . 59.41 45
Technology Adoption1.3.6 Technology utilisation. . . . . . . . . . . . . . . . . . . . . . . . . . . . . . . . . . . . . . . . .40.89 961.3.7 Investment in emerging technologies . . . . . . . . . . . . . . . . . . . . . . . .35.83 771.3.8 Robot density . . . . . . . . . . . . . . . . . . . . . . . . . . . . . . . . . . . . . . . . . . . . . . . . . . .n/a n/a
2 ATTRACT . . . . . . . . . . . . . . . . . . . . . . . . . . . . . . . . . . . . . . . . . .45.15 852.1 External Openness . . . . . . . . . . . . . . . . . . . . . . . . . . . . . . . . . . . . . . . . .40.89 73
Attract Business2.1.1 FDI and technology transfer . . . . . . . . . . . . . . . . . . . . . . . . . . . . . . . . . .40.76 1082.1.2 Prevalence of foreign ownership . . . . . . . . . . . . . . . . . . . . . . . . . . . . . .22.20 129
Attract People2.1.3 Migrant stock . . . . . . . . . . . . . . . . . . . . . . . . . . . . . . . . . . . . . . . . . . . . . . . . . 51.17 492.1.4 International students . . . . . . . . . . . . . . . . . . . . . . . . . . . . . . . . . . . . . . . . . . .n/a n/a2.1.5 Brain gain . . . . . . . . . . . . . . . . . . . . . . . . . . . . . . . . . . . . . . . . . . . . . . . . . . . . . 49.45 482.2 Internal Openness . . . . . . . . . . . . . . . . . . . . . . . . . . . . . . . . . . . . . . . . . . 49.41 97
Social Inclusion2.2.1 Tolerance of minorities . . . . . . . . . . . . . . . . . . . . . . . . . . . . . . . . . . . . . . . .16.67 1112.2.2 Tolerance of immigrants . . . . . . . . . . . . . . . . . . . . . . . . . . . . . . . . . . . . . .58.90 652.2.3 Social mobility . . . . . . . . . . . . . . . . . . . . . . . . . . . . . . . . . . . . . . . . . . . . . . . .72.27 30
Gender Equality2.2.4 Female graduates . . . . . . . . . . . . . . . . . . . . . . . . . . . . . . . . . . . . . . . . . . . . . 14.93 1102.2.5 Gender development gap . . . . . . . . . . . . . . . . . . . . . . . . . . . . . . . . . . . .50.65 1112.2.6 Leadership opportunities for women . . . . . . . . . . . . . . . . . . . . . . . . .83.03 8
Score Rank
3 GROW . . . . . . . . . . . . . . . . . . . . . . . . . . . . . . . . . . . . . . . . . . . . . 31.74 913.1 Formal Education . . . . . . . . . . . . . . . . . . . . . . . . . . . . . . . . . . . . . . . . . . . . 5.84 122
Enrolment3.1.1 Vocational enrolment . . . . . . . . . . . . . . . . . . . . . . . . . . . . . . . . . . . . . . . . . . 3.09 1063.1.2 Tertiary enrolment . . . . . . . . . . . . . . . . . . . . . . . . . . . . . . . . . . . . . . . . . . . . . 7.75 105
Quality3.1.3 Tertiary education expenditure . . . . . . . . . . . . . . . . . . . . . . . . . . . . . . . 12.51 913.1.4 Reading, maths, and science . . . . . . . . . . . . . . . . . . . . . . . . . . . . . . . . . . . .n/a n/a3.1.5 University ranking . . . . . . . . . . . . . . . . . . . . . . . . . . . . . . . . . . . . . . . . . . . . . . 0.00 753.2 Lifelong Learning . . . . . . . . . . . . . . . . . . . . . . . . . . . . . . . . . . . . . . . . . . . 42.55 683.2.1 Quality of management schools . . . . . . . . . . . . . . . . . . . . . . . . . . . . . . 51.85 553.2.2 Prevalence of training in firms . . . . . . . . . . . . . . . . . . . . . . . . . . . . . . . . .29.82 603.2.3 Employee development . . . . . . . . . . . . . . . . . . . . . . . . . . . . . . . . . . . . . .45.98 553.3 Access to Growth Opportunities . . . . . . . . . . . . . . . . . . . . . . . . . . .46.85 67
Empowerment3.3.1 Delegation of authority . . . . . . . . . . . . . . . . . . . . . . . . . . . . . . . . . . . . . . .52.21 513.3.2 Personal rights . . . . . . . . . . . . . . . . . . . . . . . . . . . . . . . . . . . . . . . . . . . . . . . .72.30 70
Collaboration3.3.3 Use of virtual social networks . . . . . . . . . . . . . . . . . . . . . . . . . . . . . . . . . 59.18 1033.3.4 Use of virtual professional networks . . . . . . . . . . . . . . . . . . . . . . . . . . . 5.53 773.3.5 Collaboration within organisations . . . . . . . . . . . . . . . . . . . . . . . . . . . .48.28 623.3.6 Collaboration across organisations . . . . . . . . . . . . . . . . . . . . . . . . . . . .43.58 52
4 RETAIN . . . . . . . . . . . . . . . . . . . . . . . . . . . . . . . . . . . . . . . . . . . 42.27 834.1 Sustainability . . . . . . . . . . . . . . . . . . . . . . . . . . . . . . . . . . . . . . . . . . . . . . . 39.54 704.1.1 Pension system . . . . . . . . . . . . . . . . . . . . . . . . . . . . . . . . . . . . . . . . . . . . . . . 12.10 944.1.2 Social protection . . . . . . . . . . . . . . . . . . . . . . . . . . . . . . . . . . . . . . . . . . . . . . 49.74 494.1.3 Brain retention . . . . . . . . . . . . . . . . . . . . . . . . . . . . . . . . . . . . . . . . . . . . . . . .56.78 374.2 Lifestyle . . . . . . . . . . . . . . . . . . . . . . . . . . . . . . . . . . . . . . . . . . . . . . . . . . . . 45.01 904.2.1 Environmental performance . . . . . . . . . . . . . . . . . . . . . . . . . . . . . . . . . .32.99 1044.2.2 Personal safety . . . . . . . . . . . . . . . . . . . . . . . . . . . . . . . . . . . . . . . . . . . . . . . . 81.19 214.2.3 Physician density . . . . . . . . . . . . . . . . . . . . . . . . . . . . . . . . . . . . . . . . . . . . . . . 5.81 1024.2.4 Sanitation . . . . . . . . . . . . . . . . . . . . . . . . . . . . . . . . . . . . . . . . . . . . . . . . . . . . .60.04 98
5 VOCATIONAL AND TECHNICAL SKILLS . . . . . . . . . . . . . 33.14 995.1 Mid-Level Skills . . . . . . . . . . . . . . . . . . . . . . . . . . . . . . . . . . . . . . . . . . . . . 11.77 1185.1.1 Workforce with secondary education . . . . . . . . . . . . . . . . . . . . . . . . . 20.61 1055.1.2 Population with secondary education . . . . . . . . . . . . . . . . . . . . . . . . . 0.00 1155.1.3 Technicians and associate professionals . . . . . . . . . . . . . . . . . . . . . . .14.69 1045.1.4 Labour productivity per employee . . . . . . . . . . . . . . . . . . . . . . . . . . . . . .n/a n/a5.2 Employability . . . . . . . . . . . . . . . . . . . . . . . . . . . . . . . . . . . . . . . . . . . . . . . 54.52 505.2.1 Ease of finding skilled employees . . . . . . . . . . . . . . . . . . . . . . . . . . . . .46.89 945.2.2 Relevance of education system to the economy . . . . . . . . . . . . . .63.40 285.2.3 Skills matching with secondary education . . . . . . . . . . . . . . . . . . . . 47.79 525.2.4 Skills matching with tertiary education . . . . . . . . . . . . . . . . . . . . . . . .60.00 55
6 GLOBAL KNOWLEDGE SKILLS . . . . . . . . . . . . . . . . . . . . . . 7.97 1266.1 High-Level Skills . . . . . . . . . . . . . . . . . . . . . . . . . . . . . . . . . . . . . . . . . . . . 15.08 1126.1.1 Workforce with tertiary education . . . . . . . . . . . . . . . . . . . . . . . . . . . . . 6.82 1136.1.2 Population with tertiary education . . . . . . . . . . . . . . . . . . . . . . . . . . . . . 5.68 976.1.3 Professionals . . . . . . . . . . . . . . . . . . . . . . . . . . . . . . . . . . . . . . . . . . . . . . . . . . 22.16 756.1.4 Researchers . . . . . . . . . . . . . . . . . . . . . . . . . . . . . . . . . . . . . . . . . . . . . . . . . . . . .n/a n/a6.1.5 Senior officials and managers . . . . . . . . . . . . . . . . . . . . . . . . . . . . . . . . .10.84 906.1.6 Availability of scientists and engineers . . . . . . . . . . . . . . . . . . . . . . . . 29.92 1156.2 Talent Impact . . . . . . . . . . . . . . . . . . . . . . . . . . . . . . . . . . . . . . . . . . . . . . . . 0.85 1286.2.1 Innovation output . . . . . . . . . . . . . . . . . . . . . . . . . . . . . . . . . . . . . . . . . . . . . .n/a n/a6.2.2 High-value exports . . . . . . . . . . . . . . . . . . . . . . . . . . . . . . . . . . . . . . . . . . . . . 0.06 1266.2.3 New product entrepreneurial activity . . . . . . . . . . . . . . . . . . . . . . . . . . .n/a n/a6.2.4 New business density . . . . . . . . . . . . . . . . . . . . . . . . . . . . . . . . . . . . . . . . . . 0.37 1006.2.5 Scientific journal articles . . . . . . . . . . . . . . . . . . . . . . . . . . . . . . . . . . . . . . . 2.12 81
l Bhutan l Income group average
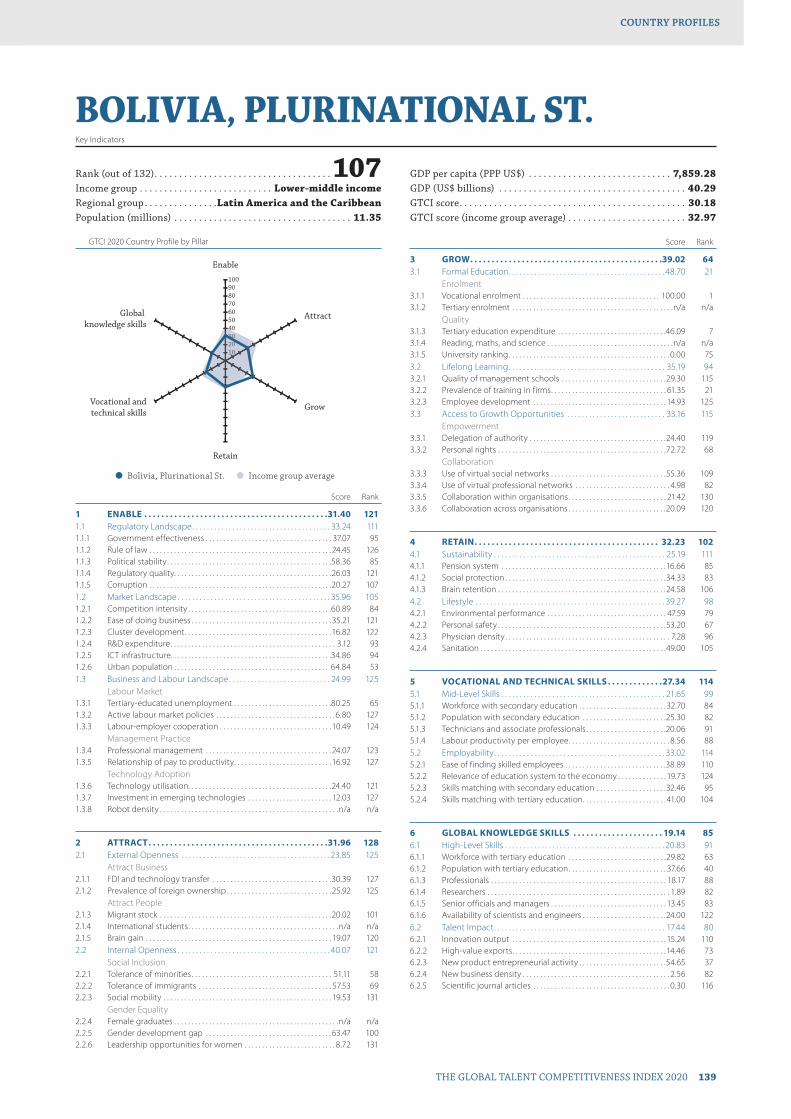
GTCI 2020 Country Profile by Pillar
THE GLOBAL TALENT COMPETITIVENESS INDEX 2020 139
COUNTRY PROFILESCOUNTRY PROFILES
102030405060708090100
Global knowledge skills
Vocational andtechnical skills
Retain
Grow
Attract
Enable
10203004
BOLIVIA, PLURINATIONAL ST.Key Indicators
Rank (out of 132) . . . . . . . . . . . . . . . . . . . . . . . . . . . . . . . . . . . . 107Income group . . . . . . . . . . . . . . . . . . . . . . . . . . . Lower-middle incomeRegional group . . . . . . . . . . . . . . .Latin America and the CaribbeanPopulation (millions) . . . . . . . . . . . . . . . . . . . . . . . . . . . . . . . . . . . . 11.35
GDP per capita (PPP US$) . . . . . . . . . . . . . . . . . . . . . . . . . . . . . 7,859.28GDP (US$ billions) . . . . . . . . . . . . . . . . . . . . . . . . . . . . . . . . . . . . . . 40.29GTCI score . . . . . . . . . . . . . . . . . . . . . . . . . . . . . . . . . . . . . . . . . . . . . . 30.18GTCI score (income group average) . . . . . . . . . . . . . . . . . . . . . . . . 32.97
Score Rank
1 ENABLE . . . . . . . . . . . . . . . . . . . . . . . . . . . . . . . . . . . . . . . . . . .31.40 1211.1 Regulatory Landscape . . . . . . . . . . . . . . . . . . . . . . . . . . . . . . . . . . . . . . 33.24 1111.1.1 Government effectiveness . . . . . . . . . . . . . . . . . . . . . . . . . . . . . . . . . . . . 37.07 951.1.2 Rule of law . . . . . . . . . . . . . . . . . . . . . . . . . . . . . . . . . . . . . . . . . . . . . . . . . . . . 24.45 1261.1.3 Political stability . . . . . . . . . . . . . . . . . . . . . . . . . . . . . . . . . . . . . . . . . . . . . . .58.36 851.1.4 Regulatory quality. . . . . . . . . . . . . . . . . . . . . . . . . . . . . . . . . . . . . . . . . . . . .26.03 1211.1.5 Corruption . . . . . . . . . . . . . . . . . . . . . . . . . . . . . . . . . . . . . . . . . . . . . . . . . . . .20.27 1071.2 Market Landscape . . . . . . . . . . . . . . . . . . . . . . . . . . . . . . . . . . . . . . . . . . 35.96 1051.2.1 Competition intensity . . . . . . . . . . . . . . . . . . . . . . . . . . . . . . . . . . . . . . . . .60.89 841.2.2 Ease of doing business . . . . . . . . . . . . . . . . . . . . . . . . . . . . . . . . . . . . . . . .35.21 1211.2.3 Cluster development . . . . . . . . . . . . . . . . . . . . . . . . . . . . . . . . . . . . . . . . . .16.82 1221.2.4 R&D expenditure . . . . . . . . . . . . . . . . . . . . . . . . . . . . . . . . . . . . . . . . . . . . . . . 3.12 931.2.5 ICT infrastructure. . . . . . . . . . . . . . . . . . . . . . . . . . . . . . . . . . . . . . . . . . . . . .34.86 941.2.6 Urban population . . . . . . . . . . . . . . . . . . . . . . . . . . . . . . . . . . . . . . . . . . . . 64.84 531.3 Business and Labour Landscape . . . . . . . . . . . . . . . . . . . . . . . . . . . . 24.99 125
Labour Market1.3.1 Tertiary-educated unemployment . . . . . . . . . . . . . . . . . . . . . . . . . . . .80.25 651.3.2 Active labour market policies . . . . . . . . . . . . . . . . . . . . . . . . . . . . . . . . . . 6.80 1271.3.3 Labour-employer cooperation . . . . . . . . . . . . . . . . . . . . . . . . . . . . . . . . 10.49 124
Management Practice1.3.4 Professional management . . . . . . . . . . . . . . . . . . . . . . . . . . . . . . . . . . . . 24.07 1231.3.5 Relationship of pay to productivity . . . . . . . . . . . . . . . . . . . . . . . . . . . . 16.92 127
Technology Adoption1.3.6 Technology utilisation. . . . . . . . . . . . . . . . . . . . . . . . . . . . . . . . . . . . . . . . .24.40 1211.3.7 Investment in emerging technologies . . . . . . . . . . . . . . . . . . . . . . . . 12.03 1271.3.8 Robot density . . . . . . . . . . . . . . . . . . . . . . . . . . . . . . . . . . . . . . . . . . . . . . . . . . .n/a n/a
2 ATTRACT . . . . . . . . . . . . . . . . . . . . . . . . . . . . . . . . . . . . . . . . . .31.96 1282.1 External Openness . . . . . . . . . . . . . . . . . . . . . . . . . . . . . . . . . . . . . . . . . 23.85 125
Attract Business2.1.1 FDI and technology transfer . . . . . . . . . . . . . . . . . . . . . . . . . . . . . . . . . .30.39 1272.1.2 Prevalence of foreign ownership . . . . . . . . . . . . . . . . . . . . . . . . . . . . . .25.92 125
Attract People2.1.3 Migrant stock . . . . . . . . . . . . . . . . . . . . . . . . . . . . . . . . . . . . . . . . . . . . . . . . .20.02 1012.1.4 International students . . . . . . . . . . . . . . . . . . . . . . . . . . . . . . . . . . . . . . . . . . .n/a n/a2.1.5 Brain gain . . . . . . . . . . . . . . . . . . . . . . . . . . . . . . . . . . . . . . . . . . . . . . . . . . . . . 19.07 1202.2 Internal Openness . . . . . . . . . . . . . . . . . . . . . . . . . . . . . . . . . . . . . . . . . . 40.07 121
Social Inclusion2.2.1 Tolerance of minorities . . . . . . . . . . . . . . . . . . . . . . . . . . . . . . . . . . . . . . . . 51.11 582.2.2 Tolerance of immigrants . . . . . . . . . . . . . . . . . . . . . . . . . . . . . . . . . . . . . . 57.53 692.2.3 Social mobility . . . . . . . . . . . . . . . . . . . . . . . . . . . . . . . . . . . . . . . . . . . . . . . . 19.53 131
Gender Equality2.2.4 Female graduates . . . . . . . . . . . . . . . . . . . . . . . . . . . . . . . . . . . . . . . . . . . . . . .n/a n/a2.2.5 Gender development gap . . . . . . . . . . . . . . . . . . . . . . . . . . . . . . . . . . . .63.47 1002.2.6 Leadership opportunities for women . . . . . . . . . . . . . . . . . . . . . . . . . . 8.72 131
Score Rank
3 GROW . . . . . . . . . . . . . . . . . . . . . . . . . . . . . . . . . . . . . . . . . . . . .39.02 643.1 Formal Education . . . . . . . . . . . . . . . . . . . . . . . . . . . . . . . . . . . . . . . . . . . 48.70 21
Enrolment3.1.1 Vocational enrolment . . . . . . . . . . . . . . . . . . . . . . . . . . . . . . . . . . . . . . . 100.00 13.1.2 Tertiary enrolment . . . . . . . . . . . . . . . . . . . . . . . . . . . . . . . . . . . . . . . . . . . . . .n/a n/a
Quality3.1.3 Tertiary education expenditure . . . . . . . . . . . . . . . . . . . . . . . . . . . . . . .46.09 73.1.4 Reading, maths, and science . . . . . . . . . . . . . . . . . . . . . . . . . . . . . . . . . . . .n/a n/a3.1.5 University ranking . . . . . . . . . . . . . . . . . . . . . . . . . . . . . . . . . . . . . . . . . . . . . . 0.00 753.2 Lifelong Learning . . . . . . . . . . . . . . . . . . . . . . . . . . . . . . . . . . . . . . . . . . . 35.19 943.2.1 Quality of management schools . . . . . . . . . . . . . . . . . . . . . . . . . . . . . .29.30 1153.2.2 Prevalence of training in firms . . . . . . . . . . . . . . . . . . . . . . . . . . . . . . . . . 61.35 213.2.3 Employee development . . . . . . . . . . . . . . . . . . . . . . . . . . . . . . . . . . . . . . 14.93 1253.3 Access to Growth Opportunities . . . . . . . . . . . . . . . . . . . . . . . . . . . 33.16 115
Empowerment3.3.1 Delegation of authority . . . . . . . . . . . . . . . . . . . . . . . . . . . . . . . . . . . . . . .24.40 1193.3.2 Personal rights . . . . . . . . . . . . . . . . . . . . . . . . . . . . . . . . . . . . . . . . . . . . . . . .72.72 68
Collaboration3.3.3 Use of virtual social networks . . . . . . . . . . . . . . . . . . . . . . . . . . . . . . . . .55.36 1093.3.4 Use of virtual professional networks . . . . . . . . . . . . . . . . . . . . . . . . . . . 4.98 823.3.5 Collaboration within organisations . . . . . . . . . . . . . . . . . . . . . . . . . . . . 21.42 1303.3.6 Collaboration across organisations . . . . . . . . . . . . . . . . . . . . . . . . . . . .20.09 120
4 RETAIN . . . . . . . . . . . . . . . . . . . . . . . . . . . . . . . . . . . . . . . . . . . 32.23 1024.1 Sustainability . . . . . . . . . . . . . . . . . . . . . . . . . . . . . . . . . . . . . . . . . . . . . . . 25.19 1114.1.1 Pension system . . . . . . . . . . . . . . . . . . . . . . . . . . . . . . . . . . . . . . . . . . . . . . .16.66 854.1.2 Social protection . . . . . . . . . . . . . . . . . . . . . . . . . . . . . . . . . . . . . . . . . . . . . .34.33 834.1.3 Brain retention . . . . . . . . . . . . . . . . . . . . . . . . . . . . . . . . . . . . . . . . . . . . . . . .24.58 1064.2 Lifestyle . . . . . . . . . . . . . . . . . . . . . . . . . . . . . . . . . . . . . . . . . . . . . . . . . . . . 39.27 984.2.1 Environmental performance . . . . . . . . . . . . . . . . . . . . . . . . . . . . . . . . . . 47.59 794.2.2 Personal safety . . . . . . . . . . . . . . . . . . . . . . . . . . . . . . . . . . . . . . . . . . . . . . . .53.20 674.2.3 Physician density . . . . . . . . . . . . . . . . . . . . . . . . . . . . . . . . . . . . . . . . . . . . . . . 7.28 964.2.4 Sanitation . . . . . . . . . . . . . . . . . . . . . . . . . . . . . . . . . . . . . . . . . . . . . . . . . . . . .49.00 105
5 VOCATIONAL AND TECHNICAL SKILLS . . . . . . . . . . . . .27.34 1145.1 Mid-Level Skills . . . . . . . . . . . . . . . . . . . . . . . . . . . . . . . . . . . . . . . . . . . . . 21.65 995.1.1 Workforce with secondary education . . . . . . . . . . . . . . . . . . . . . . . . . 32.70 845.1.2 Population with secondary education . . . . . . . . . . . . . . . . . . . . . . . .25.30 825.1.3 Technicians and associate professionals . . . . . . . . . . . . . . . . . . . . . . .20.06 915.1.4 Labour productivity per employee . . . . . . . . . . . . . . . . . . . . . . . . . . . . . 8.56 885.2 Employability . . . . . . . . . . . . . . . . . . . . . . . . . . . . . . . . . . . . . . . . . . . . . . . 33.02 1145.2.1 Ease of finding skilled employees . . . . . . . . . . . . . . . . . . . . . . . . . . . . .38.89 1105.2.2 Relevance of education system to the economy . . . . . . . . . . . . . . 19.73 1245.2.3 Skills matching with secondary education . . . . . . . . . . . . . . . . . . . .32.46 955.2.4 Skills matching with tertiary education . . . . . . . . . . . . . . . . . . . . . . . . 41.00 104
6 GLOBAL KNOWLEDGE SKILLS . . . . . . . . . . . . . . . . . . . . . 19.14 856.1 High-Level Skills . . . . . . . . . . . . . . . . . . . . . . . . . . . . . . . . . . . . . . . . . . . . 20.83 916.1.1 Workforce with tertiary education . . . . . . . . . . . . . . . . . . . . . . . . . . . .29.82 636.1.2 Population with tertiary education . . . . . . . . . . . . . . . . . . . . . . . . . . . . 37.66 406.1.3 Professionals . . . . . . . . . . . . . . . . . . . . . . . . . . . . . . . . . . . . . . . . . . . . . . . . . . 18.17 886.1.4 Researchers . . . . . . . . . . . . . . . . . . . . . . . . . . . . . . . . . . . . . . . . . . . . . . . . . . . . 1.89 826.1.5 Senior officials and managers . . . . . . . . . . . . . . . . . . . . . . . . . . . . . . . . . 13.45 836.1.6 Availability of scientists and engineers . . . . . . . . . . . . . . . . . . . . . . . .24.00 1226.2 Talent Impact . . . . . . . . . . . . . . . . . . . . . . . . . . . . . . . . . . . . . . . . . . . . . . . 17.44 806.2.1 Innovation output . . . . . . . . . . . . . . . . . . . . . . . . . . . . . . . . . . . . . . . . . . . . 15.24 1106.2.2 High-value exports . . . . . . . . . . . . . . . . . . . . . . . . . . . . . . . . . . . . . . . . . . . .14.46 736.2.3 New product entrepreneurial activity . . . . . . . . . . . . . . . . . . . . . . . . .54.65 376.2.4 New business density . . . . . . . . . . . . . . . . . . . . . . . . . . . . . . . . . . . . . . . . . . 2.56 826.2.5 Scientific journal articles . . . . . . . . . . . . . . . . . . . . . . . . . . . . . . . . . . . . . . . 0.30 116
l Bolivia, Plurinational St. l Income group average

GTCI 2020 Country Profile by Pillar
140 THE GLOBAL TALENT COMPETITIVENESS INDEX 2020
COUNTRY PROFILESCOUNTRY PROFILES
102030405060708090100
Global knowledge skills
Vocational andtechnical skills
Retain
Grow
Attract
Enable
1020304040
BOSNIA AND HERZEGOVINAKey Indicators
Rank (out of 132) . . . . . . . . . . . . . . . . . . . . . . . . . . . . . . . . . . . . 101Income group . . . . . . . . . . . . . . . . . . . . . . . . . . . Upper-middle incomeRegional group . . . . . . . . . . . . . . . . . . . . . . . . . . . . . . . . . . . . . . . . .EuropePopulation (millions) . . . . . . . . . . . . . . . . . . . . . . . . . . . . . . . . . . . . . 3.32
GDP per capita (PPP US$) . . . . . . . . . . . . . . . . . . . . . . . . . . . . 13,735.03GDP (US$ billions) . . . . . . . . . . . . . . . . . . . . . . . . . . . . . . . . . . . . . . 19.78GTCI score . . . . . . . . . . . . . . . . . . . . . . . . . . . . . . . . . . . . . . . . . . . . . . 32.77GTCI score (income group average) . . . . . . . . . . . . . . . . . . . . . . . . 41.25
Score Rank
1 ENABLE . . . . . . . . . . . . . . . . . . . . . . . . . . . . . . . . . . . . . . . . . . 35.58 1061.1 Regulatory Landscape . . . . . . . . . . . . . . . . . . . . . . . . . . . . . . . . . . . . . . 43.21 841.1.1 Government effectiveness . . . . . . . . . . . . . . . . . . . . . . . . . . . . . . . . . . . .34.85 971.1.2 Rule of law . . . . . . . . . . . . . . . . . . . . . . . . . . . . . . . . . . . . . . . . . . . . . . . . . . . . 47.73 741.1.3 Political stability . . . . . . . . . . . . . . . . . . . . . . . . . . . . . . . . . . . . . . . . . . . . . . .56.63 881.1.4 Regulatory quality. . . . . . . . . . . . . . . . . . . . . . . . . . . . . . . . . . . . . . . . . . . . .44.41 811.1.5 Corruption . . . . . . . . . . . . . . . . . . . . . . . . . . . . . . . . . . . . . . . . . . . . . . . . . . . . 32.43 731.2 Market Landscape . . . . . . . . . . . . . . . . . . . . . . . . . . . . . . . . . . . . . . . . . . 40.35 951.2.1 Competition intensity . . . . . . . . . . . . . . . . . . . . . . . . . . . . . . . . . . . . . . . . . 57.68 961.2.2 Ease of doing business . . . . . . . . . . . . . . . . . . . . . . . . . . . . . . . . . . . . . . . . 59.32 821.2.3 Cluster development . . . . . . . . . . . . . . . . . . . . . . . . . . . . . . . . . . . . . . . . . . 27.61 1001.2.4 R&D expenditure . . . . . . . . . . . . . . . . . . . . . . . . . . . . . . . . . . . . . . . . . . . . . . . 4.05 901.2.5 ICT infrastructure. . . . . . . . . . . . . . . . . . . . . . . . . . . . . . . . . . . . . . . . . . . . . . 52.93 711.2.6 Urban population . . . . . . . . . . . . . . . . . . . . . . . . . . . . . . . . . . . . . . . . . . . . .40.49 991.3 Business and Labour Landscape . . . . . . . . . . . . . . . . . . . . . . . . . . . . 23.20 128
Labour Market1.3.1 Tertiary-educated unemployment . . . . . . . . . . . . . . . . . . . . . . . . . . . .49.26 1121.3.2 Active labour market policies . . . . . . . . . . . . . . . . . . . . . . . . . . . . . . . . . 27.03 991.3.3 Labour-employer cooperation . . . . . . . . . . . . . . . . . . . . . . . . . . . . . . . .10.86 121
Management Practice1.3.4 Professional management . . . . . . . . . . . . . . . . . . . . . . . . . . . . . . . . . . . .20.46 1271.3.5 Relationship of pay to productivity . . . . . . . . . . . . . . . . . . . . . . . . . . . .23.57 126
Technology Adoption1.3.6 Technology utilisation. . . . . . . . . . . . . . . . . . . . . . . . . . . . . . . . . . . . . . . . .36.85 1051.3.7 Investment in emerging technologies . . . . . . . . . . . . . . . . . . . . . . . .16.99 1241.3.8 Robot density . . . . . . . . . . . . . . . . . . . . . . . . . . . . . . . . . . . . . . . . . . . . . . . . . . 0.55 57
2 ATTRACT . . . . . . . . . . . . . . . . . . . . . . . . . . . . . . . . . . . . . . . . . 34.56 1212.1 External Openness . . . . . . . . . . . . . . . . . . . . . . . . . . . . . . . . . . . . . . . . . 24.81 122
Attract Business2.1.1 FDI and technology transfer . . . . . . . . . . . . . . . . . . . . . . . . . . . . . . . . . . 37.96 1152.1.2 Prevalence of foreign ownership . . . . . . . . . . . . . . . . . . . . . . . . . . . . . .40.49 112
Attract People2.1.3 Migrant stock . . . . . . . . . . . . . . . . . . . . . . . . . . . . . . . . . . . . . . . . . . . . . . . . .15.34 1072.1.4 International students . . . . . . . . . . . . . . . . . . . . . . . . . . . . . . . . . . . . . . . . .26.06 282.1.5 Brain gain . . . . . . . . . . . . . . . . . . . . . . . . . . . . . . . . . . . . . . . . . . . . . . . . . . . . . . 4.21 1312.2 Internal Openness . . . . . . . . . . . . . . . . . . . . . . . . . . . . . . . . . . . . . . . . . . 44.31 112
Social Inclusion2.2.1 Tolerance of minorities . . . . . . . . . . . . . . . . . . . . . . . . . . . . . . . . . . . . . . . . 31.11 902.2.2 Tolerance of immigrants . . . . . . . . . . . . . . . . . . . . . . . . . . . . . . . . . . . . . . 31.51 1072.2.3 Social mobility . . . . . . . . . . . . . . . . . . . . . . . . . . . . . . . . . . . . . . . . . . . . . . . .32.22 126
Gender Equality2.2.4 Female graduates . . . . . . . . . . . . . . . . . . . . . . . . . . . . . . . . . . . . . . . . . . . . . 77.85 432.2.5 Gender development gap . . . . . . . . . . . . . . . . . . . . . . . . . . . . . . . . . . . . 61.77 1042.2.6 Leadership opportunities for women . . . . . . . . . . . . . . . . . . . . . . . . . 31.38 101
Score Rank
3 GROW . . . . . . . . . . . . . . . . . . . . . . . . . . . . . . . . . . . . . . . . . . . . 32.60 873.1 Formal Education . . . . . . . . . . . . . . . . . . . . . . . . . . . . . . . . . . . . . . . . . . . 29.39 57
Enrolment3.1.1 Vocational enrolment . . . . . . . . . . . . . . . . . . . . . . . . . . . . . . . . . . . . . . . . .58.78 83.1.2 Tertiary enrolment . . . . . . . . . . . . . . . . . . . . . . . . . . . . . . . . . . . . . . . . . . . . . .n/a n/a
Quality3.1.3 Tertiary education expenditure . . . . . . . . . . . . . . . . . . . . . . . . . . . . . . . . .n/a n/a3.1.4 Reading, maths, and science . . . . . . . . . . . . . . . . . . . . . . . . . . . . . . . . . . . .n/a n/a3.1.5 University ranking . . . . . . . . . . . . . . . . . . . . . . . . . . . . . . . . . . . . . . . . . . . . . . 0.00 753.2 Lifelong Learning . . . . . . . . . . . . . . . . . . . . . . . . . . . . . . . . . . . . . . . . . . .34.06 1013.2.1 Quality of management schools . . . . . . . . . . . . . . . . . . . . . . . . . . . . . .25.33 1213.2.2 Prevalence of training in firms . . . . . . . . . . . . . . . . . . . . . . . . . . . . . . . . 64.64 183.2.3 Employee development . . . . . . . . . . . . . . . . . . . . . . . . . . . . . . . . . . . . . . 12.19 1273.3 Access to Growth Opportunities . . . . . . . . . . . . . . . . . . . . . . . . . . . 34.37 111
Empowerment3.3.1 Delegation of authority . . . . . . . . . . . . . . . . . . . . . . . . . . . . . . . . . . . . . . . 19.55 1233.3.2 Personal rights . . . . . . . . . . . . . . . . . . . . . . . . . . . . . . . . . . . . . . . . . . . . . . . .65.54 83
Collaboration3.3.3 Use of virtual social networks . . . . . . . . . . . . . . . . . . . . . . . . . . . . . . . . . 67.07 883.3.4 Use of virtual professional networks . . . . . . . . . . . . . . . . . . . . . . . . . . . 6.07 753.3.5 Collaboration within organisations . . . . . . . . . . . . . . . . . . . . . . . . . . . .30.75 1143.3.6 Collaboration across organisations . . . . . . . . . . . . . . . . . . . . . . . . . . . . 17.22 126
4 RETAIN . . . . . . . . . . . . . . . . . . . . . . . . . . . . . . . . . . . . . . . . . . . .35.55 964.1 Sustainability . . . . . . . . . . . . . . . . . . . . . . . . . . . . . . . . . . . . . . . . . . . . . . . 19.34 1214.1.1 Pension system . . . . . . . . . . . . . . . . . . . . . . . . . . . . . . . . . . . . . . . . . . . . . . .44.60 584.1.2 Social protection . . . . . . . . . . . . . . . . . . . . . . . . . . . . . . . . . . . . . . . . . . . . . . 11.87 1274.1.3 Brain retention . . . . . . . . . . . . . . . . . . . . . . . . . . . . . . . . . . . . . . . . . . . . . . . . . 1.55 1314.2 Lifestyle . . . . . . . . . . . . . . . . . . . . . . . . . . . . . . . . . . . . . . . . . . . . . . . . . . . . 51.75 724.2.1 Environmental performance . . . . . . . . . . . . . . . . . . . . . . . . . . . . . . . . . . 24.02 1194.2.2 Personal safety . . . . . . . . . . . . . . . . . . . . . . . . . . . . . . . . . . . . . . . . . . . . . . . .58.66 584.2.3 Physician density . . . . . . . . . . . . . . . . . . . . . . . . . . . . . . . . . . . . . . . . . . . . . .29.94 604.2.4 Sanitation . . . . . . . . . . . . . . . . . . . . . . . . . . . . . . . . . . . . . . . . . . . . . . . . . . . . .94.38 57
5 VOCATIONAL AND TECHNICAL SKILLS . . . . . . . . . . . . 42.69 705.1 Mid-Level Skills . . . . . . . . . . . . . . . . . . . . . . . . . . . . . . . . . . . . . . . . . . . . . 60.62 225.1.1 Workforce with secondary education . . . . . . . . . . . . . . . . . . . . . . . . . 97.52 25.1.2 Population with secondary education . . . . . . . . . . . . . . . . . . . . . . . . 72.12 195.1.3 Technicians and associate professionals . . . . . . . . . . . . . . . . . . . . . . .39.83 555.1.4 Labour productivity per employee . . . . . . . . . . . . . . . . . . . . . . . . . . . .32.99 535.2 Employability . . . . . . . . . . . . . . . . . . . . . . . . . . . . . . . . . . . . . . . . . . . . . . . 24.76 1295.2.1 Ease of finding skilled employees . . . . . . . . . . . . . . . . . . . . . . . . . . . . . 32.75 1245.2.2 Relevance of education system to the economy . . . . . . . . . . . . . . 15.79 1275.2.3 Skills matching with secondary education . . . . . . . . . . . . . . . . . . . .23.75 1195.2.4 Skills matching with tertiary education . . . . . . . . . . . . . . . . . . . . . . . .26.76 126
6 GLOBAL KNOWLEDGE SKILLS . . . . . . . . . . . . . . . . . . . . .15.64 986.1 High-Level Skills . . . . . . . . . . . . . . . . . . . . . . . . . . . . . . . . . . . . . . . . . . . . 19.11 956.1.1 Workforce with tertiary education . . . . . . . . . . . . . . . . . . . . . . . . . . . .18.63 886.1.2 Population with tertiary education . . . . . . . . . . . . . . . . . . . . . . . . . . . . 16.42 776.1.3 Professionals . . . . . . . . . . . . . . . . . . . . . . . . . . . . . . . . . . . . . . . . . . . . . . . . . .29.56 586.1.4 Researchers . . . . . . . . . . . . . . . . . . . . . . . . . . . . . . . . . . . . . . . . . . . . . . . . . . . . 5.50 706.1.5 Senior officials and managers . . . . . . . . . . . . . . . . . . . . . . . . . . . . . . . . .13.68 826.1.6 Availability of scientists and engineers . . . . . . . . . . . . . . . . . . . . . . . .30.85 1136.2 Talent Impact . . . . . . . . . . . . . . . . . . . . . . . . . . . . . . . . . . . . . . . . . . . . . . . 12.18 976.2.1 Innovation output . . . . . . . . . . . . . . . . . . . . . . . . . . . . . . . . . . . . . . . . . . . .24.52 786.2.2 High-value exports . . . . . . . . . . . . . . . . . . . . . . . . . . . . . . . . . . . . . . . . . . . . . 8.71 886.2.3 New product entrepreneurial activity . . . . . . . . . . . . . . . . . . . . . . . . .16.32 836.2.4 New business density . . . . . . . . . . . . . . . . . . . . . . . . . . . . . . . . . . . . . . . . . . 5.41 676.2.5 Scientific journal articles . . . . . . . . . . . . . . . . . . . . . . . . . . . . . . . . . . . . . . . 5.91 64
l Bosnia and Herzegovina l Income group average
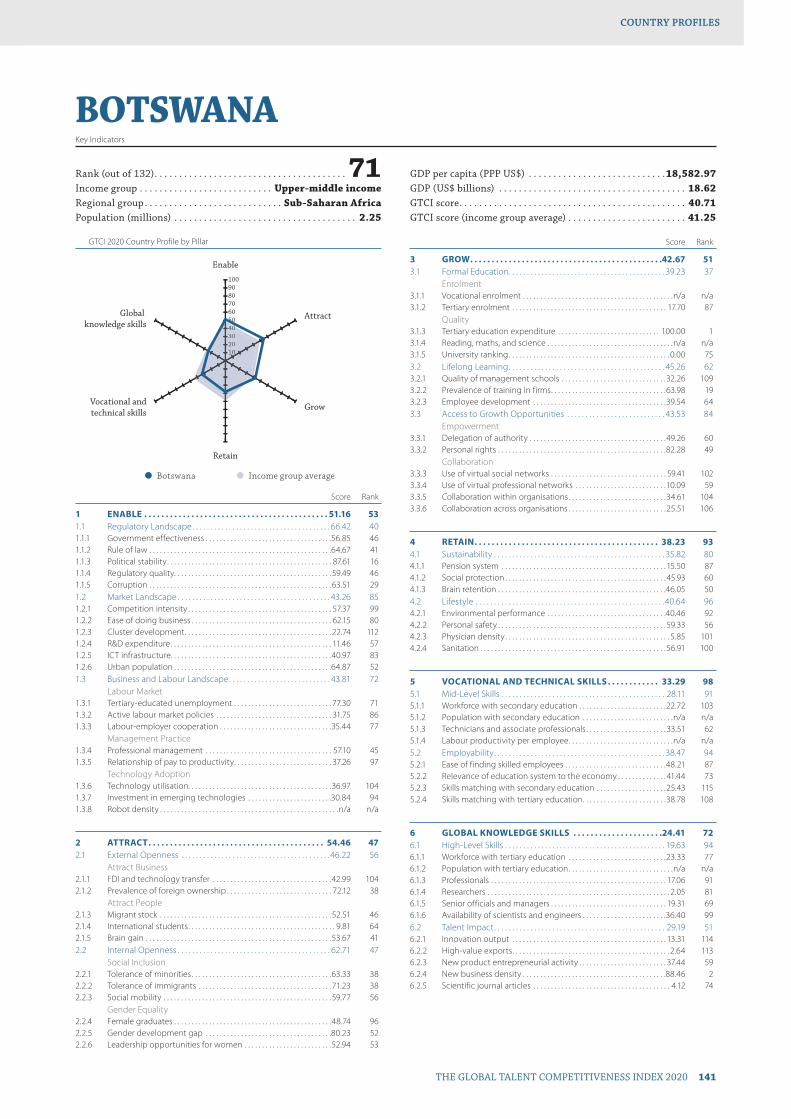
GTCI 2020 Country Profile by Pillar
THE GLOBAL TALENT COMPETITIVENESS INDEX 2020 141
COUNTRY PROFILESCOUNTRY PROFILES
102030405060708090100
Global knowledge skills
Vocational andtechnical skills
Retain
Grow
Attract
Enable
1020304040
BOTSWANAKey Indicators
Rank (out of 132) . . . . . . . . . . . . . . . . . . . . . . . . . . . . . . . . . . . . . . . 71Income group . . . . . . . . . . . . . . . . . . . . . . . . . . . Upper-middle incomeRegional group . . . . . . . . . . . . . . . . . . . . . . . . . . . . Sub-Saharan AfricaPopulation (millions) . . . . . . . . . . . . . . . . . . . . . . . . . . . . . . . . . . . . . 2.25
GDP per capita (PPP US$) . . . . . . . . . . . . . . . . . . . . . . . . . . . .18,582.97GDP (US$ billions) . . . . . . . . . . . . . . . . . . . . . . . . . . . . . . . . . . . . . . 18.62GTCI score . . . . . . . . . . . . . . . . . . . . . . . . . . . . . . . . . . . . . . . . . . . . . . 40.71GTCI score (income group average) . . . . . . . . . . . . . . . . . . . . . . . . 41.25
Score Rank
1 ENABLE . . . . . . . . . . . . . . . . . . . . . . . . . . . . . . . . . . . . . . . . . . . 51.16 531.1 Regulatory Landscape . . . . . . . . . . . . . . . . . . . . . . . . . . . . . . . . . . . . . . 66.42 401.1.1 Government effectiveness . . . . . . . . . . . . . . . . . . . . . . . . . . . . . . . . . . . .56.85 461.1.2 Rule of law . . . . . . . . . . . . . . . . . . . . . . . . . . . . . . . . . . . . . . . . . . . . . . . . . . . .64.67 411.1.3 Political stability . . . . . . . . . . . . . . . . . . . . . . . . . . . . . . . . . . . . . . . . . . . . . . . 87.61 161.1.4 Regulatory quality. . . . . . . . . . . . . . . . . . . . . . . . . . . . . . . . . . . . . . . . . . . . . 59.49 461.1.5 Corruption . . . . . . . . . . . . . . . . . . . . . . . . . . . . . . . . . . . . . . . . . . . . . . . . . . . .63.51 291.2 Market Landscape . . . . . . . . . . . . . . . . . . . . . . . . . . . . . . . . . . . . . . . . . . 43.26 851.2.1 Competition intensity . . . . . . . . . . . . . . . . . . . . . . . . . . . . . . . . . . . . . . . . . 57.37 991.2.2 Ease of doing business . . . . . . . . . . . . . . . . . . . . . . . . . . . . . . . . . . . . . . . . 62.15 801.2.3 Cluster development . . . . . . . . . . . . . . . . . . . . . . . . . . . . . . . . . . . . . . . . . . 22.74 1121.2.4 R&D expenditure . . . . . . . . . . . . . . . . . . . . . . . . . . . . . . . . . . . . . . . . . . . . . . 11.46 571.2.5 ICT infrastructure. . . . . . . . . . . . . . . . . . . . . . . . . . . . . . . . . . . . . . . . . . . . . .40.97 831.2.6 Urban population . . . . . . . . . . . . . . . . . . . . . . . . . . . . . . . . . . . . . . . . . . . . .64.87 521.3 Business and Labour Landscape . . . . . . . . . . . . . . . . . . . . . . . . . . . . 43.81 72
Labour Market1.3.1 Tertiary-educated unemployment . . . . . . . . . . . . . . . . . . . . . . . . . . . . 77.30 711.3.2 Active labour market policies . . . . . . . . . . . . . . . . . . . . . . . . . . . . . . . . . 31.75 861.3.3 Labour-employer cooperation . . . . . . . . . . . . . . . . . . . . . . . . . . . . . . . .35.44 77
Management Practice1.3.4 Professional management . . . . . . . . . . . . . . . . . . . . . . . . . . . . . . . . . . . . 57.10 451.3.5 Relationship of pay to productivity . . . . . . . . . . . . . . . . . . . . . . . . . . . . 37.26 97
Technology Adoption1.3.6 Technology utilisation. . . . . . . . . . . . . . . . . . . . . . . . . . . . . . . . . . . . . . . . .36.97 1041.3.7 Investment in emerging technologies . . . . . . . . . . . . . . . . . . . . . . . .30.84 941.3.8 Robot density . . . . . . . . . . . . . . . . . . . . . . . . . . . . . . . . . . . . . . . . . . . . . . . . . . .n/a n/a
2 ATTRACT . . . . . . . . . . . . . . . . . . . . . . . . . . . . . . . . . . . . . . . . . 54.46 472.1 External Openness . . . . . . . . . . . . . . . . . . . . . . . . . . . . . . . . . . . . . . . . .46.22 56
Attract Business2.1.1 FDI and technology transfer . . . . . . . . . . . . . . . . . . . . . . . . . . . . . . . . . .42.99 1042.1.2 Prevalence of foreign ownership . . . . . . . . . . . . . . . . . . . . . . . . . . . . . . 72.12 38
Attract People2.1.3 Migrant stock . . . . . . . . . . . . . . . . . . . . . . . . . . . . . . . . . . . . . . . . . . . . . . . . . 52.51 462.1.4 International students . . . . . . . . . . . . . . . . . . . . . . . . . . . . . . . . . . . . . . . . . . 9.81 642.1.5 Brain gain . . . . . . . . . . . . . . . . . . . . . . . . . . . . . . . . . . . . . . . . . . . . . . . . . . . . .53.67 412.2 Internal Openness . . . . . . . . . . . . . . . . . . . . . . . . . . . . . . . . . . . . . . . . . . 62.71 47
Social Inclusion2.2.1 Tolerance of minorities . . . . . . . . . . . . . . . . . . . . . . . . . . . . . . . . . . . . . . . .63.33 382.2.2 Tolerance of immigrants . . . . . . . . . . . . . . . . . . . . . . . . . . . . . . . . . . . . . .71.23 382.2.3 Social mobility . . . . . . . . . . . . . . . . . . . . . . . . . . . . . . . . . . . . . . . . . . . . . . . . 59.77 56
Gender Equality2.2.4 Female graduates . . . . . . . . . . . . . . . . . . . . . . . . . . . . . . . . . . . . . . . . . . . . .48.74 962.2.5 Gender development gap . . . . . . . . . . . . . . . . . . . . . . . . . . . . . . . . . . . .80.23 522.2.6 Leadership opportunities for women . . . . . . . . . . . . . . . . . . . . . . . . .52.94 53
Score Rank
3 GROW . . . . . . . . . . . . . . . . . . . . . . . . . . . . . . . . . . . . . . . . . . . . .42.67 513.1 Formal Education . . . . . . . . . . . . . . . . . . . . . . . . . . . . . . . . . . . . . . . . . . . 39.23 37
Enrolment3.1.1 Vocational enrolment . . . . . . . . . . . . . . . . . . . . . . . . . . . . . . . . . . . . . . . . . . .n/a n/a3.1.2 Tertiary enrolment . . . . . . . . . . . . . . . . . . . . . . . . . . . . . . . . . . . . . . . . . . . . 17.70 87
Quality3.1.3 Tertiary education expenditure . . . . . . . . . . . . . . . . . . . . . . . . . . . . . 100.00 13.1.4 Reading, maths, and science . . . . . . . . . . . . . . . . . . . . . . . . . . . . . . . . . . . .n/a n/a3.1.5 University ranking . . . . . . . . . . . . . . . . . . . . . . . . . . . . . . . . . . . . . . . . . . . . . . 0.00 753.2 Lifelong Learning . . . . . . . . . . . . . . . . . . . . . . . . . . . . . . . . . . . . . . . . . . . 45.26 623.2.1 Quality of management schools . . . . . . . . . . . . . . . . . . . . . . . . . . . . . .32.26 1093.2.2 Prevalence of training in firms . . . . . . . . . . . . . . . . . . . . . . . . . . . . . . . . .63.98 193.2.3 Employee development . . . . . . . . . . . . . . . . . . . . . . . . . . . . . . . . . . . . . .39.54 643.3 Access to Growth Opportunities . . . . . . . . . . . . . . . . . . . . . . . . . . . 43.53 84
Empowerment3.3.1 Delegation of authority . . . . . . . . . . . . . . . . . . . . . . . . . . . . . . . . . . . . . . .49.26 603.3.2 Personal rights . . . . . . . . . . . . . . . . . . . . . . . . . . . . . . . . . . . . . . . . . . . . . . . .82.28 49
Collaboration3.3.3 Use of virtual social networks . . . . . . . . . . . . . . . . . . . . . . . . . . . . . . . . . 59.41 1023.3.4 Use of virtual professional networks . . . . . . . . . . . . . . . . . . . . . . . . . .10.09 593.3.5 Collaboration within organisations . . . . . . . . . . . . . . . . . . . . . . . . . . . .34.61 1043.3.6 Collaboration across organisations . . . . . . . . . . . . . . . . . . . . . . . . . . . .25.51 106
4 RETAIN . . . . . . . . . . . . . . . . . . . . . . . . . . . . . . . . . . . . . . . . . . . 38.23 934.1 Sustainability . . . . . . . . . . . . . . . . . . . . . . . . . . . . . . . . . . . . . . . . . . . . . . . 35.82 804.1.1 Pension system . . . . . . . . . . . . . . . . . . . . . . . . . . . . . . . . . . . . . . . . . . . . . . . 15.50 874.1.2 Social protection . . . . . . . . . . . . . . . . . . . . . . . . . . . . . . . . . . . . . . . . . . . . . . 45.93 604.1.3 Brain retention . . . . . . . . . . . . . . . . . . . . . . . . . . . . . . . . . . . . . . . . . . . . . . . .46.05 504.2 Lifestyle . . . . . . . . . . . . . . . . . . . . . . . . . . . . . . . . . . . . . . . . . . . . . . . . . . . .40.64 964.2.1 Environmental performance . . . . . . . . . . . . . . . . . . . . . . . . . . . . . . . . . .40.46 924.2.2 Personal safety . . . . . . . . . . . . . . . . . . . . . . . . . . . . . . . . . . . . . . . . . . . . . . . . 59.33 564.2.3 Physician density . . . . . . . . . . . . . . . . . . . . . . . . . . . . . . . . . . . . . . . . . . . . . . . 5.85 1014.2.4 Sanitation . . . . . . . . . . . . . . . . . . . . . . . . . . . . . . . . . . . . . . . . . . . . . . . . . . . . .56.91 100
5 VOCATIONAL AND TECHNICAL SKILLS . . . . . . . . . . . . 33.29 985.1 Mid-Level Skills . . . . . . . . . . . . . . . . . . . . . . . . . . . . . . . . . . . . . . . . . . . . . 28.11 915.1.1 Workforce with secondary education . . . . . . . . . . . . . . . . . . . . . . . . .22.72 1035.1.2 Population with secondary education . . . . . . . . . . . . . . . . . . . . . . . . . .n/a n/a5.1.3 Technicians and associate professionals . . . . . . . . . . . . . . . . . . . . . . . 33.51 625.1.4 Labour productivity per employee . . . . . . . . . . . . . . . . . . . . . . . . . . . . . .n/a n/a5.2 Employability . . . . . . . . . . . . . . . . . . . . . . . . . . . . . . . . . . . . . . . . . . . . . . . 38.47 945.2.1 Ease of finding skilled employees . . . . . . . . . . . . . . . . . . . . . . . . . . . . .48.21 875.2.2 Relevance of education system to the economy . . . . . . . . . . . . . . 41.44 735.2.3 Skills matching with secondary education . . . . . . . . . . . . . . . . . . . .25.43 1155.2.4 Skills matching with tertiary education . . . . . . . . . . . . . . . . . . . . . . . .38.78 108
6 GLOBAL KNOWLEDGE SKILLS . . . . . . . . . . . . . . . . . . . . .24.41 726.1 High-Level Skills . . . . . . . . . . . . . . . . . . . . . . . . . . . . . . . . . . . . . . . . . . . . 19.63 946.1.1 Workforce with tertiary education . . . . . . . . . . . . . . . . . . . . . . . . . . . .23.33 776.1.2 Population with tertiary education . . . . . . . . . . . . . . . . . . . . . . . . . . . . . .n/a n/a6.1.3 Professionals . . . . . . . . . . . . . . . . . . . . . . . . . . . . . . . . . . . . . . . . . . . . . . . . . . 17.06 916.1.4 Researchers . . . . . . . . . . . . . . . . . . . . . . . . . . . . . . . . . . . . . . . . . . . . . . . . . . . . 2.05 816.1.5 Senior officials and managers . . . . . . . . . . . . . . . . . . . . . . . . . . . . . . . . . 19.31 696.1.6 Availability of scientists and engineers . . . . . . . . . . . . . . . . . . . . . . . .36.40 996.2 Talent Impact . . . . . . . . . . . . . . . . . . . . . . . . . . . . . . . . . . . . . . . . . . . . . . . 29.19 516.2.1 Innovation output . . . . . . . . . . . . . . . . . . . . . . . . . . . . . . . . . . . . . . . . . . . . 13.31 1146.2.2 High-value exports . . . . . . . . . . . . . . . . . . . . . . . . . . . . . . . . . . . . . . . . . . . . . 2.64 1136.2.3 New product entrepreneurial activity . . . . . . . . . . . . . . . . . . . . . . . . . 37.44 596.2.4 New business density . . . . . . . . . . . . . . . . . . . . . . . . . . . . . . . . . . . . . . . . .88.46 26.2.5 Scientific journal articles . . . . . . . . . . . . . . . . . . . . . . . . . . . . . . . . . . . . . . . 4.12 74
l Botswana l Income group average

GTCI 2020 Country Profile by Pillar
142 THE GLOBAL TALENT COMPETITIVENESS INDEX 2020
COUNTRY PROFILESCOUNTRY PROFILES
102030405060708090100
Global knowledge skills
Vocational andtechnical skills
Retain
Grow
Attract
Enable
1020304040
BRAZILKey Indicators
Rank (out of 132) . . . . . . . . . . . . . . . . . . . . . . . . . . . . . . . . . . . . . . . 80Income group . . . . . . . . . . . . . . . . . . . . . . . . . . . Upper-middle incomeRegional group . . . . . . . . . . . . . . .Latin America and the CaribbeanPopulation (millions) . . . . . . . . . . . . . . . . . . . . . . . . . . . . . . . . . . . 209.47
GDP per capita (PPP US$) . . . . . . . . . . . . . . . . . . . . . . . . . . . . 16,068.02GDP (US$ billions) . . . . . . . . . . . . . . . . . . . . . . . . . . . . . . . . . . . 1,868.63GTCI score . . . . . . . . . . . . . . . . . . . . . . . . . . . . . . . . . . . . . . . . . . . . . . 38.14GTCI score (income group average) . . . . . . . . . . . . . . . . . . . . . . . . 41.25
Score Rank
1 ENABLE . . . . . . . . . . . . . . . . . . . . . . . . . . . . . . . . . . . . . . . . . . .46.01 791.1 Regulatory Landscape . . . . . . . . . . . . . . . . . . . . . . . . . . . . . . . . . . . . . . 43.07 851.1.1 Government effectiveness . . . . . . . . . . . . . . . . . . . . . . . . . . . . . . . . . . . .39.56 881.1.2 Rule of law . . . . . . . . . . . . . . . . . . . . . . . . . . . . . . . . . . . . . . . . . . . . . . . . . . . .46.02 801.1.3 Political stability . . . . . . . . . . . . . . . . . . . . . . . . . . . . . . . . . . . . . . . . . . . . . . . 56.12 891.1.4 Regulatory quality. . . . . . . . . . . . . . . . . . . . . . . . . . . . . . . . . . . . . . . . . . . . .45.28 751.1.5 Corruption . . . . . . . . . . . . . . . . . . . . . . . . . . . . . . . . . . . . . . . . . . . . . . . . . . . .28.38 871.2 Market Landscape . . . . . . . . . . . . . . . . . . . . . . . . . . . . . . . . . . . . . . . . . . 56.63 471.2.1 Competition intensity . . . . . . . . . . . . . . . . . . . . . . . . . . . . . . . . . . . . . . . . .68.26 661.2.2 Ease of doing business . . . . . . . . . . . . . . . . . . . . . . . . . . . . . . . . . . . . . . . .52.52 931.2.3 Cluster development . . . . . . . . . . . . . . . . . . . . . . . . . . . . . . . . . . . . . . . . . .48.85 481.2.4 R&D expenditure . . . . . . . . . . . . . . . . . . . . . . . . . . . . . . . . . . . . . . . . . . . . . . 27.43 281.2.5 ICT infrastructure. . . . . . . . . . . . . . . . . . . . . . . . . . . . . . . . . . . . . . . . . . . . . . 58.14 661.2.6 Urban population . . . . . . . . . . . . . . . . . . . . . . . . . . . . . . . . . . . . . . . . . . . . .84.56 191.3 Business and Labour Landscape . . . . . . . . . . . . . . . . . . . . . . . . . . . . 38.32 91
Labour Market1.3.1 Tertiary-educated unemployment . . . . . . . . . . . . . . . . . . . . . . . . . . . . 77.44 701.3.2 Active labour market policies . . . . . . . . . . . . . . . . . . . . . . . . . . . . . . . . .26.54 1021.3.3 Labour-employer cooperation . . . . . . . . . . . . . . . . . . . . . . . . . . . . . . . . 19.32 112
Management Practice1.3.4 Professional management . . . . . . . . . . . . . . . . . . . . . . . . . . . . . . . . . . . .53.56 571.3.5 Relationship of pay to productivity . . . . . . . . . . . . . . . . . . . . . . . . . . . .33.33 110
Technology Adoption1.3.6 Technology utilisation. . . . . . . . . . . . . . . . . . . . . . . . . . . . . . . . . . . . . . . . .53.43 571.3.7 Investment in emerging technologies . . . . . . . . . . . . . . . . . . . . . . . .38.96 631.3.8 Robot density . . . . . . . . . . . . . . . . . . . . . . . . . . . . . . . . . . . . . . . . . . . . . . . . . . 4.01 42
2 ATTRACT . . . . . . . . . . . . . . . . . . . . . . . . . . . . . . . . . . . . . . . . . 42.56 962.1 External Openness . . . . . . . . . . . . . . . . . . . . . . . . . . . . . . . . . . . . . . . . . 28.93 115
Attract Business2.1.1 FDI and technology transfer . . . . . . . . . . . . . . . . . . . . . . . . . . . . . . . . . . 61.16 572.1.2 Prevalence of foreign ownership . . . . . . . . . . . . . . . . . . . . . . . . . . . . . .48.57 95
Attract People2.1.3 Migrant stock . . . . . . . . . . . . . . . . . . . . . . . . . . . . . . . . . . . . . . . . . . . . . . . . . . 7.04 1232.1.4 International students . . . . . . . . . . . . . . . . . . . . . . . . . . . . . . . . . . . . . . . . . . 0.78 1042.1.5 Brain gain . . . . . . . . . . . . . . . . . . . . . . . . . . . . . . . . . . . . . . . . . . . . . . . . . . . . . 27.12 1052.2 Internal Openness . . . . . . . . . . . . . . . . . . . . . . . . . . . . . . . . . . . . . . . . . . 56.18 64
Social Inclusion2.2.1 Tolerance of minorities . . . . . . . . . . . . . . . . . . . . . . . . . . . . . . . . . . . . . . . .33.33 852.2.2 Tolerance of immigrants . . . . . . . . . . . . . . . . . . . . . . . . . . . . . . . . . . . . . .69.86 432.2.3 Social mobility . . . . . . . . . . . . . . . . . . . . . . . . . . . . . . . . . . . . . . . . . . . . . . . .48.62 93
Gender Equality2.2.4 Female graduates . . . . . . . . . . . . . . . . . . . . . . . . . . . . . . . . . . . . . . . . . . . . .82.25 302.2.5 Gender development gap . . . . . . . . . . . . . . . . . . . . . . . . . . . . . . . . . . . . 86.13 242.2.6 Leadership opportunities for women . . . . . . . . . . . . . . . . . . . . . . . . .16.88 123
Score Rank
3 GROW . . . . . . . . . . . . . . . . . . . . . . . . . . . . . . . . . . . . . . . . . . . . .41.22 553.1 Formal Education . . . . . . . . . . . . . . . . . . . . . . . . . . . . . . . . . . . . . . . . . . . 29.39 56
Enrolment3.1.1 Vocational enrolment . . . . . . . . . . . . . . . . . . . . . . . . . . . . . . . . . . . . . . . . . . 6.37 923.1.2 Tertiary enrolment . . . . . . . . . . . . . . . . . . . . . . . . . . . . . . . . . . . . . . . . . . . .39.58 55
Quality3.1.3 Tertiary education expenditure . . . . . . . . . . . . . . . . . . . . . . . . . . . . . . . 31.34 303.1.4 Reading, maths, and science . . . . . . . . . . . . . . . . . . . . . . . . . . . . . . . . . .26.34 623.1.5 University ranking . . . . . . . . . . . . . . . . . . . . . . . . . . . . . . . . . . . . . . . . . . . . .43.34 273.2 Lifelong Learning . . . . . . . . . . . . . . . . . . . . . . . . . . . . . . . . . . . . . . . . . . .40.68 743.2.1 Quality of management schools . . . . . . . . . . . . . . . . . . . . . . . . . . . . . .35.04 1053.2.2 Prevalence of training in firms . . . . . . . . . . . . . . . . . . . . . . . . . . . . . . . . . 51.19 283.2.3 Employee development . . . . . . . . . . . . . . . . . . . . . . . . . . . . . . . . . . . . . .35.81 733.3 Access to Growth Opportunities . . . . . . . . . . . . . . . . . . . . . . . . . . . 53.58 41
Empowerment3.3.1 Delegation of authority . . . . . . . . . . . . . . . . . . . . . . . . . . . . . . . . . . . . . . .49.34 593.3.2 Personal rights . . . . . . . . . . . . . . . . . . . . . . . . . . . . . . . . . . . . . . . . . . . . . . . . 78.16 58
Collaboration3.3.3 Use of virtual social networks . . . . . . . . . . . . . . . . . . . . . . . . . . . . . . . . .80.99 443.3.4 Use of virtual professional networks . . . . . . . . . . . . . . . . . . . . . . . . . . 27.15 263.3.5 Collaboration within organisations . . . . . . . . . . . . . . . . . . . . . . . . . . . .44.48 783.3.6 Collaboration across organisations . . . . . . . . . . . . . . . . . . . . . . . . . . . . 41.34 58
4 RETAIN . . . . . . . . . . . . . . . . . . . . . . . . . . . . . . . . . . . . . . . . . . . .46.12 704.1 Sustainability . . . . . . . . . . . . . . . . . . . . . . . . . . . . . . . . . . . . . . . . . . . . . . . 43.21 614.1.1 Pension system . . . . . . . . . . . . . . . . . . . . . . . . . . . . . . . . . . . . . . . . . . . . . . .52.48 504.1.2 Social protection . . . . . . . . . . . . . . . . . . . . . . . . . . . . . . . . . . . . . . . . . . . . . . 37.42 794.1.3 Brain retention . . . . . . . . . . . . . . . . . . . . . . . . . . . . . . . . . . . . . . . . . . . . . . . .39.72 704.2 Lifestyle . . . . . . . . . . . . . . . . . . . . . . . . . . . . . . . . . . . . . . . . . . . . . . . . . . . . 49.04 844.2.1 Environmental performance . . . . . . . . . . . . . . . . . . . . . . . . . . . . . . . . . .55.46 614.2.2 Personal safety . . . . . . . . . . . . . . . . . . . . . . . . . . . . . . . . . . . . . . . . . . . . . . . .26.22 1194.2.3 Physician density . . . . . . . . . . . . . . . . . . . . . . . . . . . . . . . . . . . . . . . . . . . . . .29.39 624.2.4 Sanitation . . . . . . . . . . . . . . . . . . . . . . . . . . . . . . . . . . . . . . . . . . . . . . . . . . . . .85.09 76
5 VOCATIONAL AND TECHNICAL SKILLS . . . . . . . . . . . . .32.74 1015.1 Mid-Level Skills . . . . . . . . . . . . . . . . . . . . . . . . . . . . . . . . . . . . . . . . . . . . . 37.58 695.1.1 Workforce with secondary education . . . . . . . . . . . . . . . . . . . . . . . . . 57.62 455.1.2 Population with secondary education . . . . . . . . . . . . . . . . . . . . . . . . 41.89 585.1.3 Technicians and associate professionals . . . . . . . . . . . . . . . . . . . . . . .32.73 645.1.4 Labour productivity per employee . . . . . . . . . . . . . . . . . . . . . . . . . . . .18.08 735.2 Employability . . . . . . . . . . . . . . . . . . . . . . . . . . . . . . . . . . . . . . . . . . . . . . . 27.91 1235.2.1 Ease of finding skilled employees . . . . . . . . . . . . . . . . . . . . . . . . . . . . .33.59 1215.2.2 Relevance of education system to the economy . . . . . . . . . . . . . .15.86 1265.2.3 Skills matching with secondary education . . . . . . . . . . . . . . . . . . . .29.60 1055.2.4 Skills matching with tertiary education . . . . . . . . . . . . . . . . . . . . . . . .32.58 123
6 GLOBAL KNOWLEDGE SKILLS . . . . . . . . . . . . . . . . . . . . .20.18 816.1 High-Level Skills . . . . . . . . . . . . . . . . . . . . . . . . . . . . . . . . . . . . . . . . . . . . 25.10 796.1.1 Workforce with tertiary education . . . . . . . . . . . . . . . . . . . . . . . . . . . .30.75 626.1.2 Population with tertiary education . . . . . . . . . . . . . . . . . . . . . . . . . . . .20.49 726.1.3 Professionals . . . . . . . . . . . . . . . . . . . . . . . . . . . . . . . . . . . . . . . . . . . . . . . . . .28.35 626.1.4 Researchers . . . . . . . . . . . . . . . . . . . . . . . . . . . . . . . . . . . . . . . . . . . . . . . . . . .10.57 526.1.5 Senior officials and managers . . . . . . . . . . . . . . . . . . . . . . . . . . . . . . . . .26.49 576.1.6 Availability of scientists and engineers . . . . . . . . . . . . . . . . . . . . . . . .33.96 1096.2 Talent Impact . . . . . . . . . . . . . . . . . . . . . . . . . . . . . . . . . . . . . . . . . . . . . . . 15.26 866.2.1 Innovation output . . . . . . . . . . . . . . . . . . . . . . . . . . . . . . . . . . . . . . . . . . . .28.90 666.2.2 High-value exports . . . . . . . . . . . . . . . . . . . . . . . . . . . . . . . . . . . . . . . . . . . .36.57 316.2.3 New product entrepreneurial activity . . . . . . . . . . . . . . . . . . . . . . . . . . 0.00 906.2.4 New business density . . . . . . . . . . . . . . . . . . . . . . . . . . . . . . . . . . . . . . . . . . 0.57 976.2.5 Scientific journal articles . . . . . . . . . . . . . . . . . . . . . . . . . . . . . . . . . . . . . .10.27 52
l Brazil l Income group average
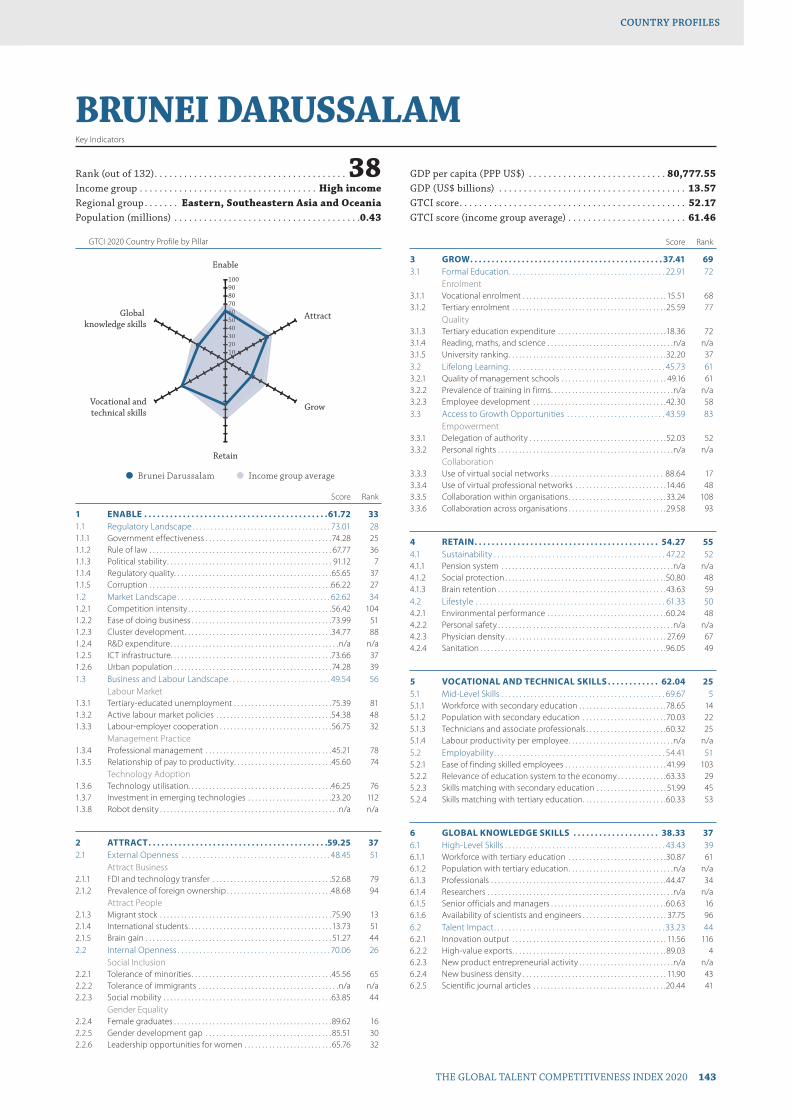
GTCI 2020 Country Profile by Pillar
THE GLOBAL TALENT COMPETITIVENESS INDEX 2020 143
COUNTRY PROFILESCOUNTRY PROFILES
102030405060708090100
Global knowledge skills
Vocational andtechnical skills
Retain
Grow
Attract
Enable
102030405060607
BRUNEI DARUSSALAMKey Indicators
Rank (out of 132) . . . . . . . . . . . . . . . . . . . . . . . . . . . . . . . . . . . . . . . 38Income group . . . . . . . . . . . . . . . . . . . . . . . . . . . . . . . . . . . . High incomeRegional group . . . . . . . Eastern, Southeastern Asia and OceaniaPopulation (millions) . . . . . . . . . . . . . . . . . . . . . . . . . . . . . . . . . . . . . .0.43
GDP per capita (PPP US$) . . . . . . . . . . . . . . . . . . . . . . . . . . . . 80,777.55GDP (US$ billions) . . . . . . . . . . . . . . . . . . . . . . . . . . . . . . . . . . . . . . 13.57GTCI score . . . . . . . . . . . . . . . . . . . . . . . . . . . . . . . . . . . . . . . . . . . . . . 52.17GTCI score (income group average) . . . . . . . . . . . . . . . . . . . . . . . . 61.46
Score Rank
1 ENABLE . . . . . . . . . . . . . . . . . . . . . . . . . . . . . . . . . . . . . . . . . . .61.72 331.1 Regulatory Landscape . . . . . . . . . . . . . . . . . . . . . . . . . . . . . . . . . . . . . . 73.01 281.1.1 Government effectiveness . . . . . . . . . . . . . . . . . . . . . . . . . . . . . . . . . . . .74.28 251.1.2 Rule of law . . . . . . . . . . . . . . . . . . . . . . . . . . . . . . . . . . . . . . . . . . . . . . . . . . . . 67.77 361.1.3 Political stability . . . . . . . . . . . . . . . . . . . . . . . . . . . . . . . . . . . . . . . . . . . . . . . 91.12 71.1.4 Regulatory quality. . . . . . . . . . . . . . . . . . . . . . . . . . . . . . . . . . . . . . . . . . . . .65.65 371.1.5 Corruption . . . . . . . . . . . . . . . . . . . . . . . . . . . . . . . . . . . . . . . . . . . . . . . . . . . .66.22 271.2 Market Landscape . . . . . . . . . . . . . . . . . . . . . . . . . . . . . . . . . . . . . . . . . . 62.62 341.2.1 Competition intensity . . . . . . . . . . . . . . . . . . . . . . . . . . . . . . . . . . . . . . . . .56.42 1041.2.2 Ease of doing business . . . . . . . . . . . . . . . . . . . . . . . . . . . . . . . . . . . . . . . .73.99 511.2.3 Cluster development . . . . . . . . . . . . . . . . . . . . . . . . . . . . . . . . . . . . . . . . . .34.77 881.2.4 R&D expenditure . . . . . . . . . . . . . . . . . . . . . . . . . . . . . . . . . . . . . . . . . . . . . . . .n/a n/a1.2.5 ICT infrastructure. . . . . . . . . . . . . . . . . . . . . . . . . . . . . . . . . . . . . . . . . . . . . .73.66 371.2.6 Urban population . . . . . . . . . . . . . . . . . . . . . . . . . . . . . . . . . . . . . . . . . . . . .74.28 391.3 Business and Labour Landscape . . . . . . . . . . . . . . . . . . . . . . . . . . . . 49.54 56
Labour Market1.3.1 Tertiary-educated unemployment . . . . . . . . . . . . . . . . . . . . . . . . . . . .75.39 811.3.2 Active labour market policies . . . . . . . . . . . . . . . . . . . . . . . . . . . . . . . . .54.38 481.3.3 Labour-employer cooperation . . . . . . . . . . . . . . . . . . . . . . . . . . . . . . . .56.75 32
Management Practice1.3.4 Professional management . . . . . . . . . . . . . . . . . . . . . . . . . . . . . . . . . . . . 45.21 781.3.5 Relationship of pay to productivity . . . . . . . . . . . . . . . . . . . . . . . . . . . .45.60 74
Technology Adoption1.3.6 Technology utilisation. . . . . . . . . . . . . . . . . . . . . . . . . . . . . . . . . . . . . . . . .46.25 761.3.7 Investment in emerging technologies . . . . . . . . . . . . . . . . . . . . . . . .23.20 1121.3.8 Robot density . . . . . . . . . . . . . . . . . . . . . . . . . . . . . . . . . . . . . . . . . . . . . . . . . . .n/a n/a
2 ATTRACT . . . . . . . . . . . . . . . . . . . . . . . . . . . . . . . . . . . . . . . . . .59.25 372.1 External Openness . . . . . . . . . . . . . . . . . . . . . . . . . . . . . . . . . . . . . . . . . 48.45 51
Attract Business2.1.1 FDI and technology transfer . . . . . . . . . . . . . . . . . . . . . . . . . . . . . . . . . .52.68 792.1.2 Prevalence of foreign ownership . . . . . . . . . . . . . . . . . . . . . . . . . . . . . .48.68 94
Attract People2.1.3 Migrant stock . . . . . . . . . . . . . . . . . . . . . . . . . . . . . . . . . . . . . . . . . . . . . . . . .75.90 132.1.4 International students . . . . . . . . . . . . . . . . . . . . . . . . . . . . . . . . . . . . . . . . . 13.73 512.1.5 Brain gain . . . . . . . . . . . . . . . . . . . . . . . . . . . . . . . . . . . . . . . . . . . . . . . . . . . . . 51.27 442.2 Internal Openness . . . . . . . . . . . . . . . . . . . . . . . . . . . . . . . . . . . . . . . . . . 70.06 26
Social Inclusion2.2.1 Tolerance of minorities . . . . . . . . . . . . . . . . . . . . . . . . . . . . . . . . . . . . . . . .45.56 652.2.2 Tolerance of immigrants . . . . . . . . . . . . . . . . . . . . . . . . . . . . . . . . . . . . . . . .n/a n/a2.2.3 Social mobility . . . . . . . . . . . . . . . . . . . . . . . . . . . . . . . . . . . . . . . . . . . . . . . .63.85 44
Gender Equality2.2.4 Female graduates . . . . . . . . . . . . . . . . . . . . . . . . . . . . . . . . . . . . . . . . . . . . .89.62 162.2.5 Gender development gap . . . . . . . . . . . . . . . . . . . . . . . . . . . . . . . . . . . . 85.51 302.2.6 Leadership opportunities for women . . . . . . . . . . . . . . . . . . . . . . . . . 65.76 32
Score Rank
3 GROW . . . . . . . . . . . . . . . . . . . . . . . . . . . . . . . . . . . . . . . . . . . . . 37.41 693.1 Formal Education . . . . . . . . . . . . . . . . . . . . . . . . . . . . . . . . . . . . . . . . . . . 22.91 72
Enrolment3.1.1 Vocational enrolment . . . . . . . . . . . . . . . . . . . . . . . . . . . . . . . . . . . . . . . . . 15.51 683.1.2 Tertiary enrolment . . . . . . . . . . . . . . . . . . . . . . . . . . . . . . . . . . . . . . . . . . . .25.59 77
Quality3.1.3 Tertiary education expenditure . . . . . . . . . . . . . . . . . . . . . . . . . . . . . . .18.36 723.1.4 Reading, maths, and science . . . . . . . . . . . . . . . . . . . . . . . . . . . . . . . . . . . .n/a n/a3.1.5 University ranking . . . . . . . . . . . . . . . . . . . . . . . . . . . . . . . . . . . . . . . . . . . . .32.20 373.2 Lifelong Learning . . . . . . . . . . . . . . . . . . . . . . . . . . . . . . . . . . . . . . . . . . . 45.73 613.2.1 Quality of management schools . . . . . . . . . . . . . . . . . . . . . . . . . . . . . . 49.16 613.2.2 Prevalence of training in firms . . . . . . . . . . . . . . . . . . . . . . . . . . . . . . . . . . .n/a n/a3.2.3 Employee development . . . . . . . . . . . . . . . . . . . . . . . . . . . . . . . . . . . . . .42.30 583.3 Access to Growth Opportunities . . . . . . . . . . . . . . . . . . . . . . . . . . . 43.59 83
Empowerment3.3.1 Delegation of authority . . . . . . . . . . . . . . . . . . . . . . . . . . . . . . . . . . . . . . .52.03 523.3.2 Personal rights . . . . . . . . . . . . . . . . . . . . . . . . . . . . . . . . . . . . . . . . . . . . . . . . . .n/a n/a
Collaboration3.3.3 Use of virtual social networks . . . . . . . . . . . . . . . . . . . . . . . . . . . . . . . . 88.64 173.3.4 Use of virtual professional networks . . . . . . . . . . . . . . . . . . . . . . . . . .14.46 483.3.5 Collaboration within organisations . . . . . . . . . . . . . . . . . . . . . . . . . . . .33.24 1083.3.6 Collaboration across organisations . . . . . . . . . . . . . . . . . . . . . . . . . . . .29.58 93
4 RETAIN . . . . . . . . . . . . . . . . . . . . . . . . . . . . . . . . . . . . . . . . . . . 54.27 554.1 Sustainability . . . . . . . . . . . . . . . . . . . . . . . . . . . . . . . . . . . . . . . . . . . . . . . 47.22 524.1.1 Pension system . . . . . . . . . . . . . . . . . . . . . . . . . . . . . . . . . . . . . . . . . . . . . . . . .n/a n/a4.1.2 Social protection . . . . . . . . . . . . . . . . . . . . . . . . . . . . . . . . . . . . . . . . . . . . . .50.80 484.1.3 Brain retention . . . . . . . . . . . . . . . . . . . . . . . . . . . . . . . . . . . . . . . . . . . . . . . .43.63 594.2 Lifestyle . . . . . . . . . . . . . . . . . . . . . . . . . . . . . . . . . . . . . . . . . . . . . . . . . . . . 61.33 504.2.1 Environmental performance . . . . . . . . . . . . . . . . . . . . . . . . . . . . . . . . . .60.24 484.2.2 Personal safety . . . . . . . . . . . . . . . . . . . . . . . . . . . . . . . . . . . . . . . . . . . . . . . . . .n/a n/a4.2.3 Physician density . . . . . . . . . . . . . . . . . . . . . . . . . . . . . . . . . . . . . . . . . . . . . . 27.69 674.2.4 Sanitation . . . . . . . . . . . . . . . . . . . . . . . . . . . . . . . . . . . . . . . . . . . . . . . . . . . . .96.05 49
5 VOCATIONAL AND TECHNICAL SKILLS . . . . . . . . . . . . 62.04 255.1 Mid-Level Skills . . . . . . . . . . . . . . . . . . . . . . . . . . . . . . . . . . . . . . . . . . . . . 69.67 55.1.1 Workforce with secondary education . . . . . . . . . . . . . . . . . . . . . . . . .78.65 145.1.2 Population with secondary education . . . . . . . . . . . . . . . . . . . . . . . .70.03 225.1.3 Technicians and associate professionals . . . . . . . . . . . . . . . . . . . . . . .60.32 255.1.4 Labour productivity per employee . . . . . . . . . . . . . . . . . . . . . . . . . . . . . .n/a n/a5.2 Employability . . . . . . . . . . . . . . . . . . . . . . . . . . . . . . . . . . . . . . . . . . . . . . . 54.41 515.2.1 Ease of finding skilled employees . . . . . . . . . . . . . . . . . . . . . . . . . . . . . 41.99 1035.2.2 Relevance of education system to the economy . . . . . . . . . . . . . .63.33 295.2.3 Skills matching with secondary education . . . . . . . . . . . . . . . . . . . . 51.99 455.2.4 Skills matching with tertiary education . . . . . . . . . . . . . . . . . . . . . . . .60.33 53
6 GLOBAL KNOWLEDGE SKILLS . . . . . . . . . . . . . . . . . . . . 38.33 376.1 High-Level Skills . . . . . . . . . . . . . . . . . . . . . . . . . . . . . . . . . . . . . . . . . . . . 43.43 396.1.1 Workforce with tertiary education . . . . . . . . . . . . . . . . . . . . . . . . . . . .30.87 616.1.2 Population with tertiary education . . . . . . . . . . . . . . . . . . . . . . . . . . . . . .n/a n/a6.1.3 Professionals . . . . . . . . . . . . . . . . . . . . . . . . . . . . . . . . . . . . . . . . . . . . . . . . . .44.47 346.1.4 Researchers . . . . . . . . . . . . . . . . . . . . . . . . . . . . . . . . . . . . . . . . . . . . . . . . . . . . .n/a n/a6.1.5 Senior officials and managers . . . . . . . . . . . . . . . . . . . . . . . . . . . . . . . . .60.63 166.1.6 Availability of scientists and engineers . . . . . . . . . . . . . . . . . . . . . . . . 37.75 966.2 Talent Impact . . . . . . . . . . . . . . . . . . . . . . . . . . . . . . . . . . . . . . . . . . . . . . . 33.23 446.2.1 Innovation output . . . . . . . . . . . . . . . . . . . . . . . . . . . . . . . . . . . . . . . . . . . . 11.56 1166.2.2 High-value exports . . . . . . . . . . . . . . . . . . . . . . . . . . . . . . . . . . . . . . . . . . . .89.03 46.2.3 New product entrepreneurial activity . . . . . . . . . . . . . . . . . . . . . . . . . . .n/a n/a6.2.4 New business density . . . . . . . . . . . . . . . . . . . . . . . . . . . . . . . . . . . . . . . . . 11.90 436.2.5 Scientific journal articles . . . . . . . . . . . . . . . . . . . . . . . . . . . . . . . . . . . . . .20.44 41
l Brunei Darussalam l Income group average
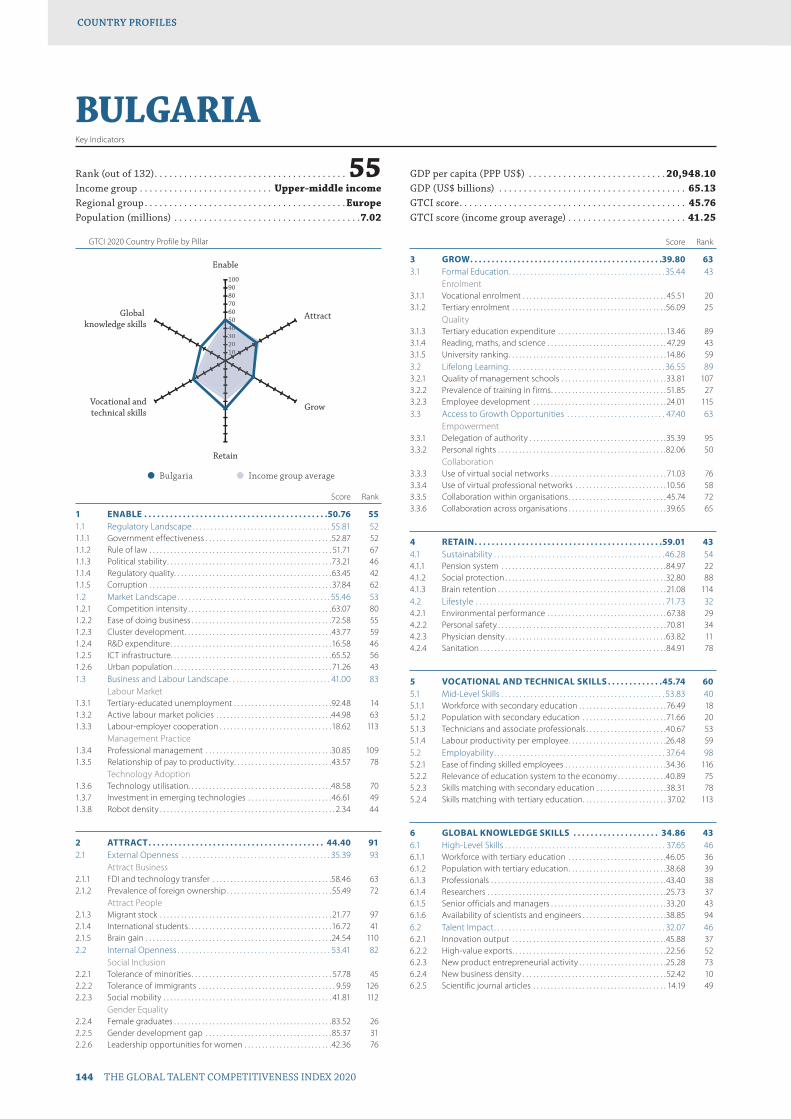
GTCI 2020 Country Profile by Pillar
144 THE GLOBAL TALENT COMPETITIVENESS INDEX 2020
COUNTRY PROFILESCOUNTRY PROFILES
102030405060708090100
Global knowledge skills
Vocational andtechnical skills
Retain
Grow
Attract
Enable
1020304040
BULGARIAKey Indicators
Rank (out of 132) . . . . . . . . . . . . . . . . . . . . . . . . . . . . . . . . . . . . . . . 55Income group . . . . . . . . . . . . . . . . . . . . . . . . . . . Upper-middle incomeRegional group . . . . . . . . . . . . . . . . . . . . . . . . . . . . . . . . . . . . . . . . .EuropePopulation (millions) . . . . . . . . . . . . . . . . . . . . . . . . . . . . . . . . . . . . . .7.02
GDP per capita (PPP US$) . . . . . . . . . . . . . . . . . . . . . . . . . . . . 20,948.10GDP (US$ billions) . . . . . . . . . . . . . . . . . . . . . . . . . . . . . . . . . . . . . . 65.13GTCI score . . . . . . . . . . . . . . . . . . . . . . . . . . . . . . . . . . . . . . . . . . . . . . 45.76GTCI score (income group average) . . . . . . . . . . . . . . . . . . . . . . . . 41.25
Score Rank
1 ENABLE . . . . . . . . . . . . . . . . . . . . . . . . . . . . . . . . . . . . . . . . . . .50.76 551.1 Regulatory Landscape . . . . . . . . . . . . . . . . . . . . . . . . . . . . . . . . . . . . . . 55.81 521.1.1 Government effectiveness . . . . . . . . . . . . . . . . . . . . . . . . . . . . . . . . . . . .52.87 521.1.2 Rule of law . . . . . . . . . . . . . . . . . . . . . . . . . . . . . . . . . . . . . . . . . . . . . . . . . . . . 51.71 671.1.3 Political stability . . . . . . . . . . . . . . . . . . . . . . . . . . . . . . . . . . . . . . . . . . . . . . .73.21 461.1.4 Regulatory quality. . . . . . . . . . . . . . . . . . . . . . . . . . . . . . . . . . . . . . . . . . . . .63.45 421.1.5 Corruption . . . . . . . . . . . . . . . . . . . . . . . . . . . . . . . . . . . . . . . . . . . . . . . . . . . . 37.84 621.2 Market Landscape . . . . . . . . . . . . . . . . . . . . . . . . . . . . . . . . . . . . . . . . . . 55.46 531.2.1 Competition intensity . . . . . . . . . . . . . . . . . . . . . . . . . . . . . . . . . . . . . . . . .63.07 801.2.2 Ease of doing business . . . . . . . . . . . . . . . . . . . . . . . . . . . . . . . . . . . . . . . .72.58 551.2.3 Cluster development . . . . . . . . . . . . . . . . . . . . . . . . . . . . . . . . . . . . . . . . . .43.77 591.2.4 R&D expenditure . . . . . . . . . . . . . . . . . . . . . . . . . . . . . . . . . . . . . . . . . . . . . .16.58 461.2.5 ICT infrastructure. . . . . . . . . . . . . . . . . . . . . . . . . . . . . . . . . . . . . . . . . . . . . .65.52 561.2.6 Urban population . . . . . . . . . . . . . . . . . . . . . . . . . . . . . . . . . . . . . . . . . . . . . 71.26 431.3 Business and Labour Landscape . . . . . . . . . . . . . . . . . . . . . . . . . . . . 41.00 83
Labour Market1.3.1 Tertiary-educated unemployment . . . . . . . . . . . . . . . . . . . . . . . . . . . .92.48 141.3.2 Active labour market policies . . . . . . . . . . . . . . . . . . . . . . . . . . . . . . . . .44.98 631.3.3 Labour-employer cooperation . . . . . . . . . . . . . . . . . . . . . . . . . . . . . . . .18.62 113
Management Practice1.3.4 Professional management . . . . . . . . . . . . . . . . . . . . . . . . . . . . . . . . . . . .30.85 1091.3.5 Relationship of pay to productivity . . . . . . . . . . . . . . . . . . . . . . . . . . . .43.57 78
Technology Adoption1.3.6 Technology utilisation. . . . . . . . . . . . . . . . . . . . . . . . . . . . . . . . . . . . . . . . .48.58 701.3.7 Investment in emerging technologies . . . . . . . . . . . . . . . . . . . . . . . .46.61 491.3.8 Robot density . . . . . . . . . . . . . . . . . . . . . . . . . . . . . . . . . . . . . . . . . . . . . . . . . . 2.34 44
2 ATTRACT . . . . . . . . . . . . . . . . . . . . . . . . . . . . . . . . . . . . . . . . . 44.40 912.1 External Openness . . . . . . . . . . . . . . . . . . . . . . . . . . . . . . . . . . . . . . . . . 35.39 93
Attract Business2.1.1 FDI and technology transfer . . . . . . . . . . . . . . . . . . . . . . . . . . . . . . . . . .58.46 632.1.2 Prevalence of foreign ownership . . . . . . . . . . . . . . . . . . . . . . . . . . . . . . 55.49 72
Attract People2.1.3 Migrant stock . . . . . . . . . . . . . . . . . . . . . . . . . . . . . . . . . . . . . . . . . . . . . . . . . 21.77 972.1.4 International students . . . . . . . . . . . . . . . . . . . . . . . . . . . . . . . . . . . . . . . . .16.72 412.1.5 Brain gain . . . . . . . . . . . . . . . . . . . . . . . . . . . . . . . . . . . . . . . . . . . . . . . . . . . . .24.54 1102.2 Internal Openness . . . . . . . . . . . . . . . . . . . . . . . . . . . . . . . . . . . . . . . . . . 53.41 82
Social Inclusion2.2.1 Tolerance of minorities . . . . . . . . . . . . . . . . . . . . . . . . . . . . . . . . . . . . . . . . 57.78 452.2.2 Tolerance of immigrants . . . . . . . . . . . . . . . . . . . . . . . . . . . . . . . . . . . . . . . 9.59 1262.2.3 Social mobility . . . . . . . . . . . . . . . . . . . . . . . . . . . . . . . . . . . . . . . . . . . . . . . . 41.81 112
Gender Equality2.2.4 Female graduates . . . . . . . . . . . . . . . . . . . . . . . . . . . . . . . . . . . . . . . . . . . . .83.52 262.2.5 Gender development gap . . . . . . . . . . . . . . . . . . . . . . . . . . . . . . . . . . . .85.37 312.2.6 Leadership opportunities for women . . . . . . . . . . . . . . . . . . . . . . . . .42.36 76
Score Rank
3 GROW . . . . . . . . . . . . . . . . . . . . . . . . . . . . . . . . . . . . . . . . . . . . .39.80 633.1 Formal Education . . . . . . . . . . . . . . . . . . . . . . . . . . . . . . . . . . . . . . . . . . . 35.44 43
Enrolment3.1.1 Vocational enrolment . . . . . . . . . . . . . . . . . . . . . . . . . . . . . . . . . . . . . . . . . 45.51 203.1.2 Tertiary enrolment . . . . . . . . . . . . . . . . . . . . . . . . . . . . . . . . . . . . . . . . . . . .56.09 25
Quality3.1.3 Tertiary education expenditure . . . . . . . . . . . . . . . . . . . . . . . . . . . . . . .13.46 893.1.4 Reading, maths, and science . . . . . . . . . . . . . . . . . . . . . . . . . . . . . . . . . . 47.29 433.1.5 University ranking . . . . . . . . . . . . . . . . . . . . . . . . . . . . . . . . . . . . . . . . . . . . .14.86 593.2 Lifelong Learning . . . . . . . . . . . . . . . . . . . . . . . . . . . . . . . . . . . . . . . . . . . 36.55 893.2.1 Quality of management schools . . . . . . . . . . . . . . . . . . . . . . . . . . . . . .33.81 1073.2.2 Prevalence of training in firms . . . . . . . . . . . . . . . . . . . . . . . . . . . . . . . . . 51.85 273.2.3 Employee development . . . . . . . . . . . . . . . . . . . . . . . . . . . . . . . . . . . . . . 24.01 1153.3 Access to Growth Opportunities . . . . . . . . . . . . . . . . . . . . . . . . . . . 47.40 63
Empowerment3.3.1 Delegation of authority . . . . . . . . . . . . . . . . . . . . . . . . . . . . . . . . . . . . . . .35.39 953.3.2 Personal rights . . . . . . . . . . . . . . . . . . . . . . . . . . . . . . . . . . . . . . . . . . . . . . . .82.06 50
Collaboration3.3.3 Use of virtual social networks . . . . . . . . . . . . . . . . . . . . . . . . . . . . . . . . . 71.03 763.3.4 Use of virtual professional networks . . . . . . . . . . . . . . . . . . . . . . . . . .10.56 583.3.5 Collaboration within organisations . . . . . . . . . . . . . . . . . . . . . . . . . . . . 45.74 723.3.6 Collaboration across organisations . . . . . . . . . . . . . . . . . . . . . . . . . . . .39.65 65
4 RETAIN . . . . . . . . . . . . . . . . . . . . . . . . . . . . . . . . . . . . . . . . . . . .59.01 434.1 Sustainability . . . . . . . . . . . . . . . . . . . . . . . . . . . . . . . . . . . . . . . . . . . . . . .46.28 544.1.1 Pension system . . . . . . . . . . . . . . . . . . . . . . . . . . . . . . . . . . . . . . . . . . . . . . .84.97 224.1.2 Social protection . . . . . . . . . . . . . . . . . . . . . . . . . . . . . . . . . . . . . . . . . . . . . .32.80 884.1.3 Brain retention . . . . . . . . . . . . . . . . . . . . . . . . . . . . . . . . . . . . . . . . . . . . . . . . 21.08 1144.2 Lifestyle . . . . . . . . . . . . . . . . . . . . . . . . . . . . . . . . . . . . . . . . . . . . . . . . . . . . 71.73 324.2.1 Environmental performance . . . . . . . . . . . . . . . . . . . . . . . . . . . . . . . . . . 67.38 294.2.2 Personal safety . . . . . . . . . . . . . . . . . . . . . . . . . . . . . . . . . . . . . . . . . . . . . . . .70.81 344.2.3 Physician density . . . . . . . . . . . . . . . . . . . . . . . . . . . . . . . . . . . . . . . . . . . . . .63.82 114.2.4 Sanitation . . . . . . . . . . . . . . . . . . . . . . . . . . . . . . . . . . . . . . . . . . . . . . . . . . . . .84.91 78
5 VOCATIONAL AND TECHNICAL SKILLS . . . . . . . . . . . . .45.74 605.1 Mid-Level Skills . . . . . . . . . . . . . . . . . . . . . . . . . . . . . . . . . . . . . . . . . . . . . 53.83 405.1.1 Workforce with secondary education . . . . . . . . . . . . . . . . . . . . . . . . .76.49 185.1.2 Population with secondary education . . . . . . . . . . . . . . . . . . . . . . . .71.66 205.1.3 Technicians and associate professionals . . . . . . . . . . . . . . . . . . . . . . .40.67 535.1.4 Labour productivity per employee . . . . . . . . . . . . . . . . . . . . . . . . . . . .26.48 595.2 Employability . . . . . . . . . . . . . . . . . . . . . . . . . . . . . . . . . . . . . . . . . . . . . . . 37.64 985.2.1 Ease of finding skilled employees . . . . . . . . . . . . . . . . . . . . . . . . . . . . .34.36 1165.2.2 Relevance of education system to the economy . . . . . . . . . . . . . .40.89 755.2.3 Skills matching with secondary education . . . . . . . . . . . . . . . . . . . .38.31 785.2.4 Skills matching with tertiary education . . . . . . . . . . . . . . . . . . . . . . . . 37.02 113
6 GLOBAL KNOWLEDGE SKILLS . . . . . . . . . . . . . . . . . . . . 34.86 436.1 High-Level Skills . . . . . . . . . . . . . . . . . . . . . . . . . . . . . . . . . . . . . . . . . . . . 37.65 466.1.1 Workforce with tertiary education . . . . . . . . . . . . . . . . . . . . . . . . . . . .46.05 366.1.2 Population with tertiary education . . . . . . . . . . . . . . . . . . . . . . . . . . . .38.68 396.1.3 Professionals . . . . . . . . . . . . . . . . . . . . . . . . . . . . . . . . . . . . . . . . . . . . . . . . . .43.40 386.1.4 Researchers . . . . . . . . . . . . . . . . . . . . . . . . . . . . . . . . . . . . . . . . . . . . . . . . . . .25.73 376.1.5 Senior officials and managers . . . . . . . . . . . . . . . . . . . . . . . . . . . . . . . . .33.20 436.1.6 Availability of scientists and engineers . . . . . . . . . . . . . . . . . . . . . . . .38.85 946.2 Talent Impact . . . . . . . . . . . . . . . . . . . . . . . . . . . . . . . . . . . . . . . . . . . . . . . 32.07 466.2.1 Innovation output . . . . . . . . . . . . . . . . . . . . . . . . . . . . . . . . . . . . . . . . . . . .45.88 376.2.2 High-value exports . . . . . . . . . . . . . . . . . . . . . . . . . . . . . . . . . . . . . . . . . . . .22.56 526.2.3 New product entrepreneurial activity . . . . . . . . . . . . . . . . . . . . . . . . .25.28 736.2.4 New business density . . . . . . . . . . . . . . . . . . . . . . . . . . . . . . . . . . . . . . . . .52.42 106.2.5 Scientific journal articles . . . . . . . . . . . . . . . . . . . . . . . . . . . . . . . . . . . . . . 14.19 49
l Bulgaria l Income group average

GTCI 2020 Country Profile by Pillar
THE GLOBAL TALENT COMPETITIVENESS INDEX 2020 145
COUNTRY PROFILESCOUNTRY PROFILES
102030405060708090100
Global knowledge skills
Vocational andtechnical skills
Retain
Grow
Attract
Enable
1020330
BURKINA FASOKey Indicators
Rank (out of 132) . . . . . . . . . . . . . . . . . . . . . . . . . . . . . . . . . . . .122Income group . . . . . . . . . . . . . . . . . . . . . . . . . . . . . . . . . . . . . Low incomeRegional group . . . . . . . . . . . . . . . . . . . . . . . . . . . . Sub-Saharan AfricaPopulation (millions) . . . . . . . . . . . . . . . . . . . . . . . . . . . . . . . . . . . . 19.75
GDP per capita (PPP US$) . . . . . . . . . . . . . . . . . . . . . . . . . . . . . 1,975.04GDP (US$ billions) . . . . . . . . . . . . . . . . . . . . . . . . . . . . . . . . . . . . . . 14.44GTCI score . . . . . . . . . . . . . . . . . . . . . . . . . . . . . . . . . . . . . . . . . . . . . . 25.09GTCI score (income group average) . . . . . . . . . . . . . . . . . . . . . . . . 26.01
Score Rank
1 ENABLE . . . . . . . . . . . . . . . . . . . . . . . . . . . . . . . . . . . . . . . . . . .30.16 1241.1 Regulatory Landscape . . . . . . . . . . . . . . . . . . . . . . . . . . . . . . . . . . . . . . 38.78 971.1.1 Government effectiveness . . . . . . . . . . . . . . . . . . . . . . . . . . . . . . . . . . . .32.27 1031.1.2 Rule of law . . . . . . . . . . . . . . . . . . . . . . . . . . . . . . . . . . . . . . . . . . . . . . . . . . . .43.22 891.1.3 Political stability . . . . . . . . . . . . . . . . . . . . . . . . . . . . . . . . . . . . . . . . . . . . . . .44.71 1111.1.4 Regulatory quality. . . . . . . . . . . . . . . . . . . . . . . . . . . . . . . . . . . . . . . . . . . . . 37.20 1011.1.5 Corruption . . . . . . . . . . . . . . . . . . . . . . . . . . . . . . . . . . . . . . . . . . . . . . . . . . . .36.49 631.2 Market Landscape . . . . . . . . . . . . . . . . . . . . . . . . . . . . . . . . . . . . . . . . . . 26.07 1251.2.1 Competition intensity . . . . . . . . . . . . . . . . . . . . . . . . . . . . . . . . . . . . . . . . .50.63 1161.2.2 Ease of doing business . . . . . . . . . . . . . . . . . . . . . . . . . . . . . . . . . . . . . . . . 37.44 1181.2.3 Cluster development . . . . . . . . . . . . . . . . . . . . . . . . . . . . . . . . . . . . . . . . . .20.67 1191.2.4 R&D expenditure . . . . . . . . . . . . . . . . . . . . . . . . . . . . . . . . . . . . . . . . . . . . . .14.38 501.2.5 ICT infrastructure. . . . . . . . . . . . . . . . . . . . . . . . . . . . . . . . . . . . . . . . . . . . . .14.50 1181.2.6 Urban population . . . . . . . . . . . . . . . . . . . . . . . . . . . . . . . . . . . . . . . . . . . . .18.77 1201.3 Business and Labour Landscape . . . . . . . . . . . . . . . . . . . . . . . . . . . . 25.65 123
Labour Market1.3.1 Tertiary-educated unemployment . . . . . . . . . . . . . . . . . . . . . . . . . . . . 62.11 991.3.2 Active labour market policies . . . . . . . . . . . . . . . . . . . . . . . . . . . . . . . . . . 8.12 1241.3.3 Labour-employer cooperation . . . . . . . . . . . . . . . . . . . . . . . . . . . . . . . .26.81 98
Management Practice1.3.4 Professional management . . . . . . . . . . . . . . . . . . . . . . . . . . . . . . . . . . . . 16.14 1291.3.5 Relationship of pay to productivity . . . . . . . . . . . . . . . . . . . . . . . . . . . .16.65 128
Technology Adoption1.3.6 Technology utilisation. . . . . . . . . . . . . . . . . . . . . . . . . . . . . . . . . . . . . . . . .25.79 1191.3.7 Investment in emerging technologies . . . . . . . . . . . . . . . . . . . . . . . .23.92 1081.3.8 Robot density . . . . . . . . . . . . . . . . . . . . . . . . . . . . . . . . . . . . . . . . . . . . . . . . . . .n/a n/a
2 ATTRACT . . . . . . . . . . . . . . . . . . . . . . . . . . . . . . . . . . . . . . . . . 40.35 1062.1 External Openness . . . . . . . . . . . . . . . . . . . . . . . . . . . . . . . . . . . . . . . . . 35.04 94
Attract Business2.1.1 FDI and technology transfer . . . . . . . . . . . . . . . . . . . . . . . . . . . . . . . . . . 41.08 1072.1.2 Prevalence of foreign ownership . . . . . . . . . . . . . . . . . . . . . . . . . . . . . .46.50 99
Attract People2.1.3 Migrant stock . . . . . . . . . . . . . . . . . . . . . . . . . . . . . . . . . . . . . . . . . . . . . . . . .45.40 532.1.4 International students . . . . . . . . . . . . . . . . . . . . . . . . . . . . . . . . . . . . . . . . .10.56 602.1.5 Brain gain . . . . . . . . . . . . . . . . . . . . . . . . . . . . . . . . . . . . . . . . . . . . . . . . . . . . . 31.64 962.2 Internal Openness . . . . . . . . . . . . . . . . . . . . . . . . . . . . . . . . . . . . . . . . . . 45.67 107
Social Inclusion2.2.1 Tolerance of minorities . . . . . . . . . . . . . . . . . . . . . . . . . . . . . . . . . . . . . . . . 67.78 322.2.2 Tolerance of immigrants . . . . . . . . . . . . . . . . . . . . . . . . . . . . . . . . . . . . . .75.34 302.2.3 Social mobility . . . . . . . . . . . . . . . . . . . . . . . . . . . . . . . . . . . . . . . . . . . . . . . .60.68 52
Gender Equality2.2.4 Female graduates . . . . . . . . . . . . . . . . . . . . . . . . . . . . . . . . . . . . . . . . . . . . . 13.12 1122.2.5 Gender development gap . . . . . . . . . . . . . . . . . . . . . . . . . . . . . . . . . . . . 42.70 1172.2.6 Leadership opportunities for women . . . . . . . . . . . . . . . . . . . . . . . . .14.38 127
Score Rank
3 GROW . . . . . . . . . . . . . . . . . . . . . . . . . . . . . . . . . . . . . . . . . . . . 24.33 1203.1 Formal Education . . . . . . . . . . . . . . . . . . . . . . . . . . . . . . . . . . . . . . . . . . . 12.17 101
Enrolment3.1.1 Vocational enrolment . . . . . . . . . . . . . . . . . . . . . . . . . . . . . . . . . . . . . . . . . . 3.93 1013.1.2 Tertiary enrolment . . . . . . . . . . . . . . . . . . . . . . . . . . . . . . . . . . . . . . . . . . . . . 4.16 118
Quality3.1.3 Tertiary education expenditure . . . . . . . . . . . . . . . . . . . . . . . . . . . . . . .40.60 133.1.4 Reading, maths, and science . . . . . . . . . . . . . . . . . . . . . . . . . . . . . . . . . . . .n/a n/a3.1.5 University ranking . . . . . . . . . . . . . . . . . . . . . . . . . . . . . . . . . . . . . . . . . . . . . . 0.00 753.2 Lifelong Learning . . . . . . . . . . . . . . . . . . . . . . . . . . . . . . . . . . . . . . . . . . . 28.11 1213.2.1 Quality of management schools . . . . . . . . . . . . . . . . . . . . . . . . . . . . . .40.32 873.2.2 Prevalence of training in firms . . . . . . . . . . . . . . . . . . . . . . . . . . . . . . . . .28.23 663.2.3 Employee development . . . . . . . . . . . . . . . . . . . . . . . . . . . . . . . . . . . . . . 15.79 1243.3 Access to Growth Opportunities . . . . . . . . . . . . . . . . . . . . . . . . . . . 32.69 117
Empowerment3.3.1 Delegation of authority . . . . . . . . . . . . . . . . . . . . . . . . . . . . . . . . . . . . . . . 16.17 1283.3.2 Personal rights . . . . . . . . . . . . . . . . . . . . . . . . . . . . . . . . . . . . . . . . . . . . . . . . 67.50 80
Collaboration3.3.3 Use of virtual social networks . . . . . . . . . . . . . . . . . . . . . . . . . . . . . . . . . 44.13 1203.3.4 Use of virtual professional networks . . . . . . . . . . . . . . . . . . . . . . . . . . . 0.59 1183.3.5 Collaboration within organisations . . . . . . . . . . . . . . . . . . . . . . . . . . . 44.44 803.3.6 Collaboration across organisations . . . . . . . . . . . . . . . . . . . . . . . . . . . .23.34 111
4 RETAIN . . . . . . . . . . . . . . . . . . . . . . . . . . . . . . . . . . . . . . . . . . . .21.51 1214.1 Sustainability . . . . . . . . . . . . . . . . . . . . . . . . . . . . . . . . . . . . . . . . . . . . . . . 19.49 1204.1.1 Pension system . . . . . . . . . . . . . . . . . . . . . . . . . . . . . . . . . . . . . . . . . . . . . . . . 2.26 1144.1.2 Social protection . . . . . . . . . . . . . . . . . . . . . . . . . . . . . . . . . . . . . . . . . . . . . .26.57 1064.1.3 Brain retention . . . . . . . . . . . . . . . . . . . . . . . . . . . . . . . . . . . . . . . . . . . . . . . .29.63 984.2 Lifestyle . . . . . . . . . . . . . . . . . . . . . . . . . . . . . . . . . . . . . . . . . . . . . . . . . . . . 23.54 1194.2.1 Environmental performance . . . . . . . . . . . . . . . . . . . . . . . . . . . . . . . . . .25.67 1174.2.2 Personal safety . . . . . . . . . . . . . . . . . . . . . . . . . . . . . . . . . . . . . . . . . . . . . . . . 51.40 704.2.3 Physician density . . . . . . . . . . . . . . . . . . . . . . . . . . . . . . . . . . . . . . . . . . . . . . . 0.45 1234.2.4 Sanitation . . . . . . . . . . . . . . . . . . . . . . . . . . . . . . . . . . . . . . . . . . . . . . . . . . . . .16.63 126
5 VOCATIONAL AND TECHNICAL SKILLS . . . . . . . . . . . . 22.34 1265.1 Mid-Level Skills . . . . . . . . . . . . . . . . . . . . . . . . . . . . . . . . . . . . . . . . . . . . . . 1.93 1325.1.1 Workforce with secondary education . . . . . . . . . . . . . . . . . . . . . . . . . . 1.90 1255.1.2 Population with secondary education . . . . . . . . . . . . . . . . . . . . . . . . . 2.65 1105.1.3 Technicians and associate professionals . . . . . . . . . . . . . . . . . . . . . . . . .n/a n/a5.1.4 Labour productivity per employee . . . . . . . . . . . . . . . . . . . . . . . . . . . . . 1.25 1075.2 Employability . . . . . . . . . . . . . . . . . . . . . . . . . . . . . . . . . . . . . . . . . . . . . . . 42.75 835.2.1 Ease of finding skilled employees . . . . . . . . . . . . . . . . . . . . . . . . . . . . .56.04 645.2.2 Relevance of education system to the economy . . . . . . . . . . . . . .29.24 1045.2.3 Skills matching with secondary education . . . . . . . . . . . . . . . . . . . .40.30 755.2.4 Skills matching with tertiary education . . . . . . . . . . . . . . . . . . . . . . . . 45.42 92
6 GLOBAL KNOWLEDGE SKILLS . . . . . . . . . . . . . . . . . . . . .11.87 1106.1 High-Level Skills . . . . . . . . . . . . . . . . . . . . . . . . . . . . . . . . . . . . . . . . . . . . . .9.17 1266.1.1 Workforce with tertiary education . . . . . . . . . . . . . . . . . . . . . . . . . . . . . 1.67 1226.1.2 Population with tertiary education . . . . . . . . . . . . . . . . . . . . . . . . . . . . . .n/a n/a6.1.3 Professionals . . . . . . . . . . . . . . . . . . . . . . . . . . . . . . . . . . . . . . . . . . . . . . . . . . . .n/a n/a6.1.4 Researchers . . . . . . . . . . . . . . . . . . . . . . . . . . . . . . . . . . . . . . . . . . . . . . . . . . . . 0.45 936.1.5 Senior officials and managers . . . . . . . . . . . . . . . . . . . . . . . . . . . . . . . . . . .n/a n/a6.1.6 Availability of scientists and engineers . . . . . . . . . . . . . . . . . . . . . . . .25.39 1206.2 Talent Impact . . . . . . . . . . . . . . . . . . . . . . . . . . . . . . . . . . . . . . . . . . . . . . . 14.57 906.2.1 Innovation output . . . . . . . . . . . . . . . . . . . . . . . . . . . . . . . . . . . . . . . . . . . .13.84 1126.2.2 High-value exports . . . . . . . . . . . . . . . . . . . . . . . . . . . . . . . . . . . . . . . . . . . . 15.42 686.2.3 New product entrepreneurial activity . . . . . . . . . . . . . . . . . . . . . . . . .42.48 516.2.4 New business density . . . . . . . . . . . . . . . . . . . . . . . . . . . . . . . . . . . . . . . . . . 0.67 956.2.5 Scientific journal articles . . . . . . . . . . . . . . . . . . . . . . . . . . . . . . . . . . . . . . . 0.43 109
l Burkina Faso l Income group average
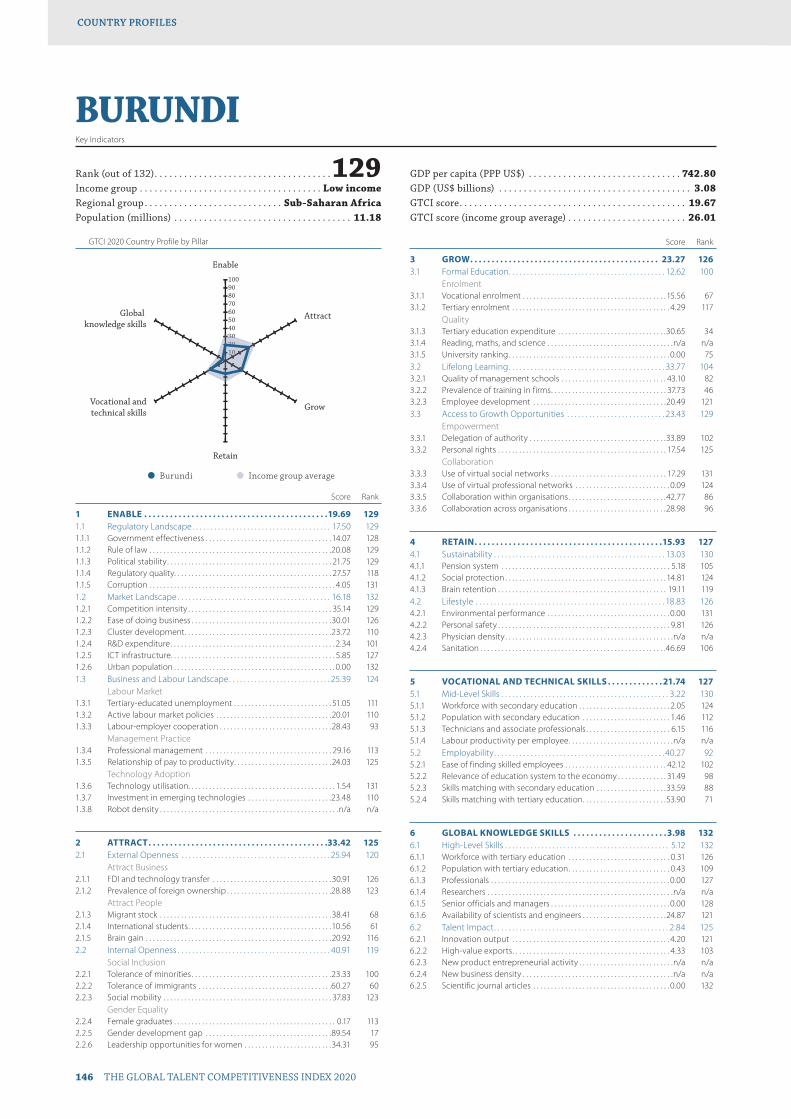
GTCI 2020 Country Profile by Pillar
146 THE GLOBAL TALENT COMPETITIVENESS INDEX 2020
COUNTRY PROFILESCOUNTRY PROFILES
102030405060708090100
Global knowledge skills
Vocational andtechnical skills
Retain
Grow
Attract
Enable
1020330
BURUNDIKey Indicators
Rank (out of 132) . . . . . . . . . . . . . . . . . . . . . . . . . . . . . . . . . . . .129Income group . . . . . . . . . . . . . . . . . . . . . . . . . . . . . . . . . . . . . Low incomeRegional group . . . . . . . . . . . . . . . . . . . . . . . . . . . . Sub-Saharan AfricaPopulation (millions) . . . . . . . . . . . . . . . . . . . . . . . . . . . . . . . . . . . . 11.18
GDP per capita (PPP US$) . . . . . . . . . . . . . . . . . . . . . . . . . . . . . . . 742.80GDP (US$ billions) . . . . . . . . . . . . . . . . . . . . . . . . . . . . . . . . . . . . . . . 3.08GTCI score . . . . . . . . . . . . . . . . . . . . . . . . . . . . . . . . . . . . . . . . . . . . . . 19.67GTCI score (income group average) . . . . . . . . . . . . . . . . . . . . . . . . 26.01
Score Rank
1 ENABLE . . . . . . . . . . . . . . . . . . . . . . . . . . . . . . . . . . . . . . . . . . .19.69 1291.1 Regulatory Landscape . . . . . . . . . . . . . . . . . . . . . . . . . . . . . . . . . . . . . . 17.50 1291.1.1 Government effectiveness . . . . . . . . . . . . . . . . . . . . . . . . . . . . . . . . . . . . 14.07 1281.1.2 Rule of law . . . . . . . . . . . . . . . . . . . . . . . . . . . . . . . . . . . . . . . . . . . . . . . . . . . .20.08 1291.1.3 Political stability . . . . . . . . . . . . . . . . . . . . . . . . . . . . . . . . . . . . . . . . . . . . . . . 21.75 1291.1.4 Regulatory quality. . . . . . . . . . . . . . . . . . . . . . . . . . . . . . . . . . . . . . . . . . . . . 27.57 1181.1.5 Corruption . . . . . . . . . . . . . . . . . . . . . . . . . . . . . . . . . . . . . . . . . . . . . . . . . . . . . 4.05 1311.2 Market Landscape . . . . . . . . . . . . . . . . . . . . . . . . . . . . . . . . . . . . . . . . . . 16.18 1321.2.1 Competition intensity . . . . . . . . . . . . . . . . . . . . . . . . . . . . . . . . . . . . . . . . . 35.14 1291.2.2 Ease of doing business . . . . . . . . . . . . . . . . . . . . . . . . . . . . . . . . . . . . . . . .30.01 1261.2.3 Cluster development . . . . . . . . . . . . . . . . . . . . . . . . . . . . . . . . . . . . . . . . . .23.72 1101.2.4 R&D expenditure . . . . . . . . . . . . . . . . . . . . . . . . . . . . . . . . . . . . . . . . . . . . . . . 2.34 1011.2.5 ICT infrastructure. . . . . . . . . . . . . . . . . . . . . . . . . . . . . . . . . . . . . . . . . . . . . . . 5.85 1271.2.6 Urban population . . . . . . . . . . . . . . . . . . . . . . . . . . . . . . . . . . . . . . . . . . . . . . 0.00 1321.3 Business and Labour Landscape . . . . . . . . . . . . . . . . . . . . . . . . . . . . 25.39 124
Labour Market1.3.1 Tertiary-educated unemployment . . . . . . . . . . . . . . . . . . . . . . . . . . . . 51.05 1111.3.2 Active labour market policies . . . . . . . . . . . . . . . . . . . . . . . . . . . . . . . . .20.01 1101.3.3 Labour-employer cooperation . . . . . . . . . . . . . . . . . . . . . . . . . . . . . . . .28.43 93
Management Practice1.3.4 Professional management . . . . . . . . . . . . . . . . . . . . . . . . . . . . . . . . . . . . 29.16 1131.3.5 Relationship of pay to productivity . . . . . . . . . . . . . . . . . . . . . . . . . . . .24.03 125
Technology Adoption1.3.6 Technology utilisation. . . . . . . . . . . . . . . . . . . . . . . . . . . . . . . . . . . . . . . . . . 1.54 1311.3.7 Investment in emerging technologies . . . . . . . . . . . . . . . . . . . . . . . .23.48 1101.3.8 Robot density . . . . . . . . . . . . . . . . . . . . . . . . . . . . . . . . . . . . . . . . . . . . . . . . . . .n/a n/a
2 ATTRACT . . . . . . . . . . . . . . . . . . . . . . . . . . . . . . . . . . . . . . . . . .33.42 1252.1 External Openness . . . . . . . . . . . . . . . . . . . . . . . . . . . . . . . . . . . . . . . . . 25.94 120
Attract Business2.1.1 FDI and technology transfer . . . . . . . . . . . . . . . . . . . . . . . . . . . . . . . . . .30.91 1262.1.2 Prevalence of foreign ownership . . . . . . . . . . . . . . . . . . . . . . . . . . . . . .28.88 123
Attract People2.1.3 Migrant stock . . . . . . . . . . . . . . . . . . . . . . . . . . . . . . . . . . . . . . . . . . . . . . . . .38.41 682.1.4 International students . . . . . . . . . . . . . . . . . . . . . . . . . . . . . . . . . . . . . . . . .10.56 612.1.5 Brain gain . . . . . . . . . . . . . . . . . . . . . . . . . . . . . . . . . . . . . . . . . . . . . . . . . . . . .20.92 1162.2 Internal Openness . . . . . . . . . . . . . . . . . . . . . . . . . . . . . . . . . . . . . . . . . . 40.91 119
Social Inclusion2.2.1 Tolerance of minorities . . . . . . . . . . . . . . . . . . . . . . . . . . . . . . . . . . . . . . . .23.33 1002.2.2 Tolerance of immigrants . . . . . . . . . . . . . . . . . . . . . . . . . . . . . . . . . . . . . .60.27 602.2.3 Social mobility . . . . . . . . . . . . . . . . . . . . . . . . . . . . . . . . . . . . . . . . . . . . . . . . 37.83 123
Gender Equality2.2.4 Female graduates . . . . . . . . . . . . . . . . . . . . . . . . . . . . . . . . . . . . . . . . . . . . . . 0.17 1132.2.5 Gender development gap . . . . . . . . . . . . . . . . . . . . . . . . . . . . . . . . . . . .89.54 172.2.6 Leadership opportunities for women . . . . . . . . . . . . . . . . . . . . . . . . .34.31 95
Score Rank
3 GROW . . . . . . . . . . . . . . . . . . . . . . . . . . . . . . . . . . . . . . . . . . . . 23.27 1263.1 Formal Education . . . . . . . . . . . . . . . . . . . . . . . . . . . . . . . . . . . . . . . . . . . 12.62 100
Enrolment3.1.1 Vocational enrolment . . . . . . . . . . . . . . . . . . . . . . . . . . . . . . . . . . . . . . . . . 15.56 673.1.2 Tertiary enrolment . . . . . . . . . . . . . . . . . . . . . . . . . . . . . . . . . . . . . . . . . . . . . 4.29 117
Quality3.1.3 Tertiary education expenditure . . . . . . . . . . . . . . . . . . . . . . . . . . . . . . .30.65 343.1.4 Reading, maths, and science . . . . . . . . . . . . . . . . . . . . . . . . . . . . . . . . . . . .n/a n/a3.1.5 University ranking . . . . . . . . . . . . . . . . . . . . . . . . . . . . . . . . . . . . . . . . . . . . . . 0.00 753.2 Lifelong Learning . . . . . . . . . . . . . . . . . . . . . . . . . . . . . . . . . . . . . . . . . . . 33.77 1043.2.1 Quality of management schools . . . . . . . . . . . . . . . . . . . . . . . . . . . . . . 43.10 823.2.2 Prevalence of training in firms . . . . . . . . . . . . . . . . . . . . . . . . . . . . . . . . . 37.73 463.2.3 Employee development . . . . . . . . . . . . . . . . . . . . . . . . . . . . . . . . . . . . . .20.49 1213.3 Access to Growth Opportunities . . . . . . . . . . . . . . . . . . . . . . . . . . . 23.43 129
Empowerment3.3.1 Delegation of authority . . . . . . . . . . . . . . . . . . . . . . . . . . . . . . . . . . . . . . .33.89 1023.3.2 Personal rights . . . . . . . . . . . . . . . . . . . . . . . . . . . . . . . . . . . . . . . . . . . . . . . . 17.54 125
Collaboration3.3.3 Use of virtual social networks . . . . . . . . . . . . . . . . . . . . . . . . . . . . . . . . . 17.29 1313.3.4 Use of virtual professional networks . . . . . . . . . . . . . . . . . . . . . . . . . . . 0.09 1243.3.5 Collaboration within organisations . . . . . . . . . . . . . . . . . . . . . . . . . . . .42.77 863.3.6 Collaboration across organisations . . . . . . . . . . . . . . . . . . . . . . . . . . . .28.98 96
4 RETAIN . . . . . . . . . . . . . . . . . . . . . . . . . . . . . . . . . . . . . . . . . . . .15.93 1274.1 Sustainability . . . . . . . . . . . . . . . . . . . . . . . . . . . . . . . . . . . . . . . . . . . . . . . 13.03 1304.1.1 Pension system . . . . . . . . . . . . . . . . . . . . . . . . . . . . . . . . . . . . . . . . . . . . . . . . 5.18 1054.1.2 Social protection . . . . . . . . . . . . . . . . . . . . . . . . . . . . . . . . . . . . . . . . . . . . . . 14.81 1244.1.3 Brain retention . . . . . . . . . . . . . . . . . . . . . . . . . . . . . . . . . . . . . . . . . . . . . . . . 19.11 1194.2 Lifestyle . . . . . . . . . . . . . . . . . . . . . . . . . . . . . . . . . . . . . . . . . . . . . . . . . . . . 18.83 1264.2.1 Environmental performance . . . . . . . . . . . . . . . . . . . . . . . . . . . . . . . . . . . 0.00 1314.2.2 Personal safety . . . . . . . . . . . . . . . . . . . . . . . . . . . . . . . . . . . . . . . . . . . . . . . . . 9.81 1264.2.3 Physician density . . . . . . . . . . . . . . . . . . . . . . . . . . . . . . . . . . . . . . . . . . . . . . . .n/a n/a4.2.4 Sanitation . . . . . . . . . . . . . . . . . . . . . . . . . . . . . . . . . . . . . . . . . . . . . . . . . . . . .46.69 106
5 VOCATIONAL AND TECHNICAL SKILLS . . . . . . . . . . . . . 21.74 1275.1 Mid-Level Skills . . . . . . . . . . . . . . . . . . . . . . . . . . . . . . . . . . . . . . . . . . . . . . 3.22 1305.1.1 Workforce with secondary education . . . . . . . . . . . . . . . . . . . . . . . . . . 2.05 1245.1.2 Population with secondary education . . . . . . . . . . . . . . . . . . . . . . . . . 1.46 1125.1.3 Technicians and associate professionals . . . . . . . . . . . . . . . . . . . . . . . . 6.15 1165.1.4 Labour productivity per employee . . . . . . . . . . . . . . . . . . . . . . . . . . . . . .n/a n/a5.2 Employability . . . . . . . . . . . . . . . . . . . . . . . . . . . . . . . . . . . . . . . . . . . . . . . 40.27 925.2.1 Ease of finding skilled employees . . . . . . . . . . . . . . . . . . . . . . . . . . . . . 42.12 1025.2.2 Relevance of education system to the economy . . . . . . . . . . . . . . 31.49 985.2.3 Skills matching with secondary education . . . . . . . . . . . . . . . . . . . .33.59 885.2.4 Skills matching with tertiary education . . . . . . . . . . . . . . . . . . . . . . . .53.90 71
6 GLOBAL KNOWLEDGE SKILLS . . . . . . . . . . . . . . . . . . . . . .3.98 1326.1 High-Level Skills . . . . . . . . . . . . . . . . . . . . . . . . . . . . . . . . . . . . . . . . . . . . . 5.12 1326.1.1 Workforce with tertiary education . . . . . . . . . . . . . . . . . . . . . . . . . . . . . 0.31 1266.1.2 Population with tertiary education . . . . . . . . . . . . . . . . . . . . . . . . . . . . . 0.43 1096.1.3 Professionals . . . . . . . . . . . . . . . . . . . . . . . . . . . . . . . . . . . . . . . . . . . . . . . . . . . 0.00 1276.1.4 Researchers . . . . . . . . . . . . . . . . . . . . . . . . . . . . . . . . . . . . . . . . . . . . . . . . . . . . .n/a n/a6.1.5 Senior officials and managers . . . . . . . . . . . . . . . . . . . . . . . . . . . . . . . . . . 0.00 1286.1.6 Availability of scientists and engineers . . . . . . . . . . . . . . . . . . . . . . . .24.87 1216.2 Talent Impact . . . . . . . . . . . . . . . . . . . . . . . . . . . . . . . . . . . . . . . . . . . . . . . . 2.84 1256.2.1 Innovation output . . . . . . . . . . . . . . . . . . . . . . . . . . . . . . . . . . . . . . . . . . . . . 4.20 1216.2.2 High-value exports . . . . . . . . . . . . . . . . . . . . . . . . . . . . . . . . . . . . . . . . . . . . . 4.33 1036.2.3 New product entrepreneurial activity . . . . . . . . . . . . . . . . . . . . . . . . . . .n/a n/a6.2.4 New business density . . . . . . . . . . . . . . . . . . . . . . . . . . . . . . . . . . . . . . . . . . .n/a n/a6.2.5 Scientific journal articles . . . . . . . . . . . . . . . . . . . . . . . . . . . . . . . . . . . . . . . 0.00 132
l Burundi l Income group average
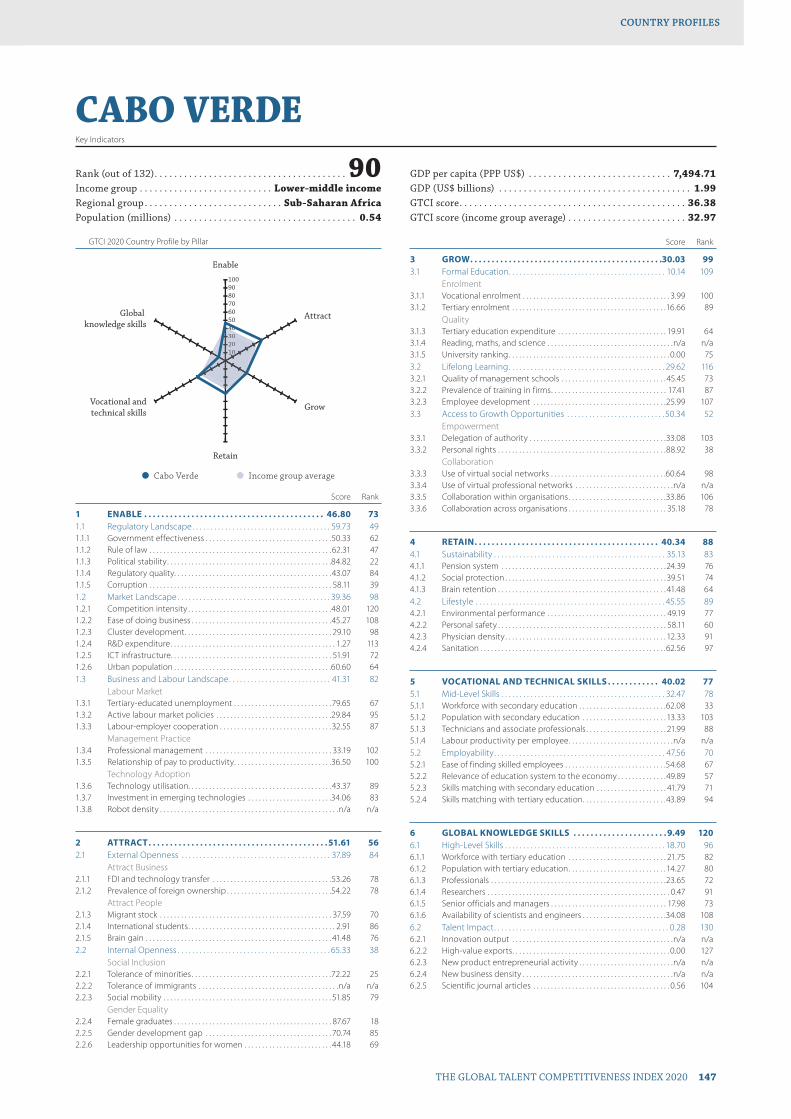
GTCI 2020 Country Profile by Pillar
THE GLOBAL TALENT COMPETITIVENESS INDEX 2020 147
COUNTRY PROFILESCOUNTRY PROFILES
102030405060708090100
Global knowledge skills
Vocational andtechnical skills
Retain
Grow
Attract
Enable
10203004
CABO VERDEKey Indicators
Rank (out of 132) . . . . . . . . . . . . . . . . . . . . . . . . . . . . . . . . . . . . . . . 90Income group . . . . . . . . . . . . . . . . . . . . . . . . . . . Lower-middle incomeRegional group . . . . . . . . . . . . . . . . . . . . . . . . . . . . Sub-Saharan AfricaPopulation (millions) . . . . . . . . . . . . . . . . . . . . . . . . . . . . . . . . . . . . . 0.54
GDP per capita (PPP US$) . . . . . . . . . . . . . . . . . . . . . . . . . . . . . 7,494.71GDP (US$ billions) . . . . . . . . . . . . . . . . . . . . . . . . . . . . . . . . . . . . . . . 1.99GTCI score . . . . . . . . . . . . . . . . . . . . . . . . . . . . . . . . . . . . . . . . . . . . . . 36.38GTCI score (income group average) . . . . . . . . . . . . . . . . . . . . . . . . 32.97
Score Rank
1 ENABLE . . . . . . . . . . . . . . . . . . . . . . . . . . . . . . . . . . . . . . . . . . 46.80 731.1 Regulatory Landscape . . . . . . . . . . . . . . . . . . . . . . . . . . . . . . . . . . . . . . 59.73 491.1.1 Government effectiveness . . . . . . . . . . . . . . . . . . . . . . . . . . . . . . . . . . . .50.33 621.1.2 Rule of law . . . . . . . . . . . . . . . . . . . . . . . . . . . . . . . . . . . . . . . . . . . . . . . . . . . . 62.31 471.1.3 Political stability . . . . . . . . . . . . . . . . . . . . . . . . . . . . . . . . . . . . . . . . . . . . . . .84.82 221.1.4 Regulatory quality. . . . . . . . . . . . . . . . . . . . . . . . . . . . . . . . . . . . . . . . . . . . .43.07 841.1.5 Corruption . . . . . . . . . . . . . . . . . . . . . . . . . . . . . . . . . . . . . . . . . . . . . . . . . . . . 58.11 391.2 Market Landscape . . . . . . . . . . . . . . . . . . . . . . . . . . . . . . . . . . . . . . . . . . 39.36 981.2.1 Competition intensity . . . . . . . . . . . . . . . . . . . . . . . . . . . . . . . . . . . . . . . . .48.01 1201.2.2 Ease of doing business . . . . . . . . . . . . . . . . . . . . . . . . . . . . . . . . . . . . . . . .45.27 1081.2.3 Cluster development . . . . . . . . . . . . . . . . . . . . . . . . . . . . . . . . . . . . . . . . . . 29.10 981.2.4 R&D expenditure . . . . . . . . . . . . . . . . . . . . . . . . . . . . . . . . . . . . . . . . . . . . . . . 1.27 1131.2.5 ICT infrastructure. . . . . . . . . . . . . . . . . . . . . . . . . . . . . . . . . . . . . . . . . . . . . . 51.91 721.2.6 Urban population . . . . . . . . . . . . . . . . . . . . . . . . . . . . . . . . . . . . . . . . . . . . .60.60 641.3 Business and Labour Landscape . . . . . . . . . . . . . . . . . . . . . . . . . . . . 41.31 82
Labour Market1.3.1 Tertiary-educated unemployment . . . . . . . . . . . . . . . . . . . . . . . . . . . .79.65 671.3.2 Active labour market policies . . . . . . . . . . . . . . . . . . . . . . . . . . . . . . . . .29.84 951.3.3 Labour-employer cooperation . . . . . . . . . . . . . . . . . . . . . . . . . . . . . . . .32.55 87
Management Practice1.3.4 Professional management . . . . . . . . . . . . . . . . . . . . . . . . . . . . . . . . . . . . 33.19 1021.3.5 Relationship of pay to productivity . . . . . . . . . . . . . . . . . . . . . . . . . . . .36.50 100
Technology Adoption1.3.6 Technology utilisation. . . . . . . . . . . . . . . . . . . . . . . . . . . . . . . . . . . . . . . . .43.37 891.3.7 Investment in emerging technologies . . . . . . . . . . . . . . . . . . . . . . . .34.06 831.3.8 Robot density . . . . . . . . . . . . . . . . . . . . . . . . . . . . . . . . . . . . . . . . . . . . . . . . . . .n/a n/a
2 ATTRACT . . . . . . . . . . . . . . . . . . . . . . . . . . . . . . . . . . . . . . . . . .51.61 562.1 External Openness . . . . . . . . . . . . . . . . . . . . . . . . . . . . . . . . . . . . . . . . . 37.89 84
Attract Business2.1.1 FDI and technology transfer . . . . . . . . . . . . . . . . . . . . . . . . . . . . . . . . . .53.26 782.1.2 Prevalence of foreign ownership . . . . . . . . . . . . . . . . . . . . . . . . . . . . . .54.22 78
Attract People2.1.3 Migrant stock . . . . . . . . . . . . . . . . . . . . . . . . . . . . . . . . . . . . . . . . . . . . . . . . . 37.59 702.1.4 International students . . . . . . . . . . . . . . . . . . . . . . . . . . . . . . . . . . . . . . . . . . 2.91 862.1.5 Brain gain . . . . . . . . . . . . . . . . . . . . . . . . . . . . . . . . . . . . . . . . . . . . . . . . . . . . . 41.48 762.2 Internal Openness . . . . . . . . . . . . . . . . . . . . . . . . . . . . . . . . . . . . . . . . . . 65.33 38
Social Inclusion2.2.1 Tolerance of minorities . . . . . . . . . . . . . . . . . . . . . . . . . . . . . . . . . . . . . . . .72.22 252.2.2 Tolerance of immigrants . . . . . . . . . . . . . . . . . . . . . . . . . . . . . . . . . . . . . . . .n/a n/a2.2.3 Social mobility . . . . . . . . . . . . . . . . . . . . . . . . . . . . . . . . . . . . . . . . . . . . . . . . 51.85 79
Gender Equality2.2.4 Female graduates . . . . . . . . . . . . . . . . . . . . . . . . . . . . . . . . . . . . . . . . . . . . . 87.67 182.2.5 Gender development gap . . . . . . . . . . . . . . . . . . . . . . . . . . . . . . . . . . . . 70.74 852.2.6 Leadership opportunities for women . . . . . . . . . . . . . . . . . . . . . . . . . 44.18 69
Score Rank
3 GROW . . . . . . . . . . . . . . . . . . . . . . . . . . . . . . . . . . . . . . . . . . . . .30.03 993.1 Formal Education . . . . . . . . . . . . . . . . . . . . . . . . . . . . . . . . . . . . . . . . . . . 10.14 109
Enrolment3.1.1 Vocational enrolment . . . . . . . . . . . . . . . . . . . . . . . . . . . . . . . . . . . . . . . . . . 3.99 1003.1.2 Tertiary enrolment . . . . . . . . . . . . . . . . . . . . . . . . . . . . . . . . . . . . . . . . . . . .16.66 89
Quality3.1.3 Tertiary education expenditure . . . . . . . . . . . . . . . . . . . . . . . . . . . . . . . 19.91 643.1.4 Reading, maths, and science . . . . . . . . . . . . . . . . . . . . . . . . . . . . . . . . . . . .n/a n/a3.1.5 University ranking . . . . . . . . . . . . . . . . . . . . . . . . . . . . . . . . . . . . . . . . . . . . . . 0.00 753.2 Lifelong Learning . . . . . . . . . . . . . . . . . . . . . . . . . . . . . . . . . . . . . . . . . . . 29.62 1163.2.1 Quality of management schools . . . . . . . . . . . . . . . . . . . . . . . . . . . . . . 45.45 733.2.2 Prevalence of training in firms . . . . . . . . . . . . . . . . . . . . . . . . . . . . . . . . . 17.41 873.2.3 Employee development . . . . . . . . . . . . . . . . . . . . . . . . . . . . . . . . . . . . . .25.99 1073.3 Access to Growth Opportunities . . . . . . . . . . . . . . . . . . . . . . . . . . . 50.34 52
Empowerment3.3.1 Delegation of authority . . . . . . . . . . . . . . . . . . . . . . . . . . . . . . . . . . . . . . .33.08 1033.3.2 Personal rights . . . . . . . . . . . . . . . . . . . . . . . . . . . . . . . . . . . . . . . . . . . . . . . .88.92 38
Collaboration3.3.3 Use of virtual social networks . . . . . . . . . . . . . . . . . . . . . . . . . . . . . . . . .60.64 983.3.4 Use of virtual professional networks . . . . . . . . . . . . . . . . . . . . . . . . . . . .n/a n/a3.3.5 Collaboration within organisations . . . . . . . . . . . . . . . . . . . . . . . . . . . .33.86 1063.3.6 Collaboration across organisations . . . . . . . . . . . . . . . . . . . . . . . . . . . . 35.18 78
4 RETAIN . . . . . . . . . . . . . . . . . . . . . . . . . . . . . . . . . . . . . . . . . . . 40.34 884.1 Sustainability . . . . . . . . . . . . . . . . . . . . . . . . . . . . . . . . . . . . . . . . . . . . . . . 35.13 834.1.1 Pension system . . . . . . . . . . . . . . . . . . . . . . . . . . . . . . . . . . . . . . . . . . . . . . .24.39 764.1.2 Social protection . . . . . . . . . . . . . . . . . . . . . . . . . . . . . . . . . . . . . . . . . . . . . . 39.51 744.1.3 Brain retention . . . . . . . . . . . . . . . . . . . . . . . . . . . . . . . . . . . . . . . . . . . . . . . . 41.48 644.2 Lifestyle . . . . . . . . . . . . . . . . . . . . . . . . . . . . . . . . . . . . . . . . . . . . . . . . . . . . 45.55 894.2.1 Environmental performance . . . . . . . . . . . . . . . . . . . . . . . . . . . . . . . . . . 49.19 774.2.2 Personal safety . . . . . . . . . . . . . . . . . . . . . . . . . . . . . . . . . . . . . . . . . . . . . . . . 58.11 604.2.3 Physician density . . . . . . . . . . . . . . . . . . . . . . . . . . . . . . . . . . . . . . . . . . . . . . 12.33 914.2.4 Sanitation . . . . . . . . . . . . . . . . . . . . . . . . . . . . . . . . . . . . . . . . . . . . . . . . . . . . .62.56 97
5 VOCATIONAL AND TECHNICAL SKILLS . . . . . . . . . . . . 40.02 775.1 Mid-Level Skills . . . . . . . . . . . . . . . . . . . . . . . . . . . . . . . . . . . . . . . . . . . . . 32.47 785.1.1 Workforce with secondary education . . . . . . . . . . . . . . . . . . . . . . . . .62.08 335.1.2 Population with secondary education . . . . . . . . . . . . . . . . . . . . . . . . 13.33 1035.1.3 Technicians and associate professionals . . . . . . . . . . . . . . . . . . . . . . . 21.99 885.1.4 Labour productivity per employee . . . . . . . . . . . . . . . . . . . . . . . . . . . . . .n/a n/a5.2 Employability . . . . . . . . . . . . . . . . . . . . . . . . . . . . . . . . . . . . . . . . . . . . . . . 47.56 705.2.1 Ease of finding skilled employees . . . . . . . . . . . . . . . . . . . . . . . . . . . . .54.68 675.2.2 Relevance of education system to the economy . . . . . . . . . . . . . .49.89 575.2.3 Skills matching with secondary education . . . . . . . . . . . . . . . . . . . . 41.79 715.2.4 Skills matching with tertiary education . . . . . . . . . . . . . . . . . . . . . . . .43.89 94
6 GLOBAL KNOWLEDGE SKILLS . . . . . . . . . . . . . . . . . . . . . . 9.49 1206.1 High-Level Skills . . . . . . . . . . . . . . . . . . . . . . . . . . . . . . . . . . . . . . . . . . . . 18.70 966.1.1 Workforce with tertiary education . . . . . . . . . . . . . . . . . . . . . . . . . . . . 21.75 826.1.2 Population with tertiary education . . . . . . . . . . . . . . . . . . . . . . . . . . . .14.27 806.1.3 Professionals . . . . . . . . . . . . . . . . . . . . . . . . . . . . . . . . . . . . . . . . . . . . . . . . . .23.65 726.1.4 Researchers . . . . . . . . . . . . . . . . . . . . . . . . . . . . . . . . . . . . . . . . . . . . . . . . . . . . 0.47 916.1.5 Senior officials and managers . . . . . . . . . . . . . . . . . . . . . . . . . . . . . . . . . 17.98 736.1.6 Availability of scientists and engineers . . . . . . . . . . . . . . . . . . . . . . . .34.08 1086.2 Talent Impact . . . . . . . . . . . . . . . . . . . . . . . . . . . . . . . . . . . . . . . . . . . . . . . . 0.28 1306.2.1 Innovation output . . . . . . . . . . . . . . . . . . . . . . . . . . . . . . . . . . . . . . . . . . . . . .n/a n/a6.2.2 High-value exports . . . . . . . . . . . . . . . . . . . . . . . . . . . . . . . . . . . . . . . . . . . . . 0.00 1276.2.3 New product entrepreneurial activity . . . . . . . . . . . . . . . . . . . . . . . . . . .n/a n/a6.2.4 New business density . . . . . . . . . . . . . . . . . . . . . . . . . . . . . . . . . . . . . . . . . . .n/a n/a6.2.5 Scientific journal articles . . . . . . . . . . . . . . . . . . . . . . . . . . . . . . . . . . . . . . . 0.56 104
l Cabo Verde l Income group average
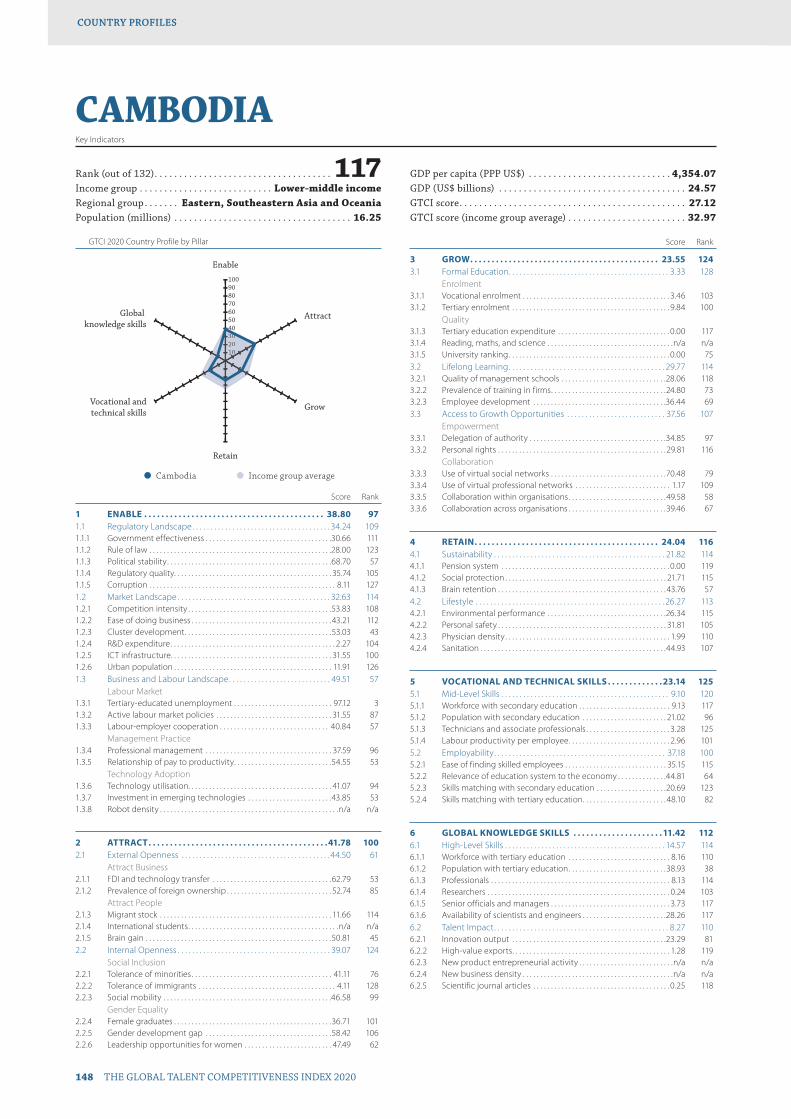
GTCI 2020 Country Profile by Pillar
148 THE GLOBAL TALENT COMPETITIVENESS INDEX 2020
COUNTRY PROFILESCOUNTRY PROFILES
102030405060708090100
Global knowledge skills
Vocational andtechnical skills
Retain
Grow
Attract
Enable
10203004
CAMBODIAKey Indicators
Rank (out of 132) . . . . . . . . . . . . . . . . . . . . . . . . . . . . . . . . . . . . 117Income group . . . . . . . . . . . . . . . . . . . . . . . . . . . Lower-middle incomeRegional group . . . . . . . Eastern, Southeastern Asia and OceaniaPopulation (millions) . . . . . . . . . . . . . . . . . . . . . . . . . . . . . . . . . . . . 16.25
GDP per capita (PPP US$) . . . . . . . . . . . . . . . . . . . . . . . . . . . . . 4,354.07GDP (US$ billions) . . . . . . . . . . . . . . . . . . . . . . . . . . . . . . . . . . . . . . 24.57GTCI score . . . . . . . . . . . . . . . . . . . . . . . . . . . . . . . . . . . . . . . . . . . . . . 27.12GTCI score (income group average) . . . . . . . . . . . . . . . . . . . . . . . . 32.97
Score Rank
1 ENABLE . . . . . . . . . . . . . . . . . . . . . . . . . . . . . . . . . . . . . . . . . . 38.80 971.1 Regulatory Landscape . . . . . . . . . . . . . . . . . . . . . . . . . . . . . . . . . . . . . . 34.24 1091.1.1 Government effectiveness . . . . . . . . . . . . . . . . . . . . . . . . . . . . . . . . . . . .30.66 1111.1.2 Rule of law . . . . . . . . . . . . . . . . . . . . . . . . . . . . . . . . . . . . . . . . . . . . . . . . . . . .28.00 1231.1.3 Political stability . . . . . . . . . . . . . . . . . . . . . . . . . . . . . . . . . . . . . . . . . . . . . . .68.70 571.1.4 Regulatory quality. . . . . . . . . . . . . . . . . . . . . . . . . . . . . . . . . . . . . . . . . . . . . 35.74 1051.1.5 Corruption . . . . . . . . . . . . . . . . . . . . . . . . . . . . . . . . . . . . . . . . . . . . . . . . . . . . . 8.11 1271.2 Market Landscape . . . . . . . . . . . . . . . . . . . . . . . . . . . . . . . . . . . . . . . . . . 32.63 1141.2.1 Competition intensity . . . . . . . . . . . . . . . . . . . . . . . . . . . . . . . . . . . . . . . . .53.83 1081.2.2 Ease of doing business . . . . . . . . . . . . . . . . . . . . . . . . . . . . . . . . . . . . . . . .43.21 1121.2.3 Cluster development . . . . . . . . . . . . . . . . . . . . . . . . . . . . . . . . . . . . . . . . . .53.03 431.2.4 R&D expenditure . . . . . . . . . . . . . . . . . . . . . . . . . . . . . . . . . . . . . . . . . . . . . . . 2.27 1041.2.5 ICT infrastructure. . . . . . . . . . . . . . . . . . . . . . . . . . . . . . . . . . . . . . . . . . . . . . 31.55 1001.2.6 Urban population . . . . . . . . . . . . . . . . . . . . . . . . . . . . . . . . . . . . . . . . . . . . . 11.91 1261.3 Business and Labour Landscape . . . . . . . . . . . . . . . . . . . . . . . . . . . . 49.51 57
Labour Market1.3.1 Tertiary-educated unemployment . . . . . . . . . . . . . . . . . . . . . . . . . . . . 97.12 31.3.2 Active labour market policies . . . . . . . . . . . . . . . . . . . . . . . . . . . . . . . . . 31.55 871.3.3 Labour-employer cooperation . . . . . . . . . . . . . . . . . . . . . . . . . . . . . . . 40.84 57
Management Practice1.3.4 Professional management . . . . . . . . . . . . . . . . . . . . . . . . . . . . . . . . . . . . 37.59 961.3.5 Relationship of pay to productivity . . . . . . . . . . . . . . . . . . . . . . . . . . . .54.55 53
Technology Adoption1.3.6 Technology utilisation. . . . . . . . . . . . . . . . . . . . . . . . . . . . . . . . . . . . . . . . . 41.07 941.3.7 Investment in emerging technologies . . . . . . . . . . . . . . . . . . . . . . . .43.85 531.3.8 Robot density . . . . . . . . . . . . . . . . . . . . . . . . . . . . . . . . . . . . . . . . . . . . . . . . . . .n/a n/a
2 ATTRACT . . . . . . . . . . . . . . . . . . . . . . . . . . . . . . . . . . . . . . . . . .41.78 1002.1 External Openness . . . . . . . . . . . . . . . . . . . . . . . . . . . . . . . . . . . . . . . . .44.50 61
Attract Business2.1.1 FDI and technology transfer . . . . . . . . . . . . . . . . . . . . . . . . . . . . . . . . . .62.79 532.1.2 Prevalence of foreign ownership . . . . . . . . . . . . . . . . . . . . . . . . . . . . . . 52.74 85
Attract People2.1.3 Migrant stock . . . . . . . . . . . . . . . . . . . . . . . . . . . . . . . . . . . . . . . . . . . . . . . . . 11.66 1142.1.4 International students . . . . . . . . . . . . . . . . . . . . . . . . . . . . . . . . . . . . . . . . . . .n/a n/a2.1.5 Brain gain . . . . . . . . . . . . . . . . . . . . . . . . . . . . . . . . . . . . . . . . . . . . . . . . . . . . .50.81 452.2 Internal Openness . . . . . . . . . . . . . . . . . . . . . . . . . . . . . . . . . . . . . . . . . . 39.07 124
Social Inclusion2.2.1 Tolerance of minorities . . . . . . . . . . . . . . . . . . . . . . . . . . . . . . . . . . . . . . . . 41.11 762.2.2 Tolerance of immigrants . . . . . . . . . . . . . . . . . . . . . . . . . . . . . . . . . . . . . . . 4.11 1282.2.3 Social mobility . . . . . . . . . . . . . . . . . . . . . . . . . . . . . . . . . . . . . . . . . . . . . . . .46.58 99
Gender Equality2.2.4 Female graduates . . . . . . . . . . . . . . . . . . . . . . . . . . . . . . . . . . . . . . . . . . . . .36.71 1012.2.5 Gender development gap . . . . . . . . . . . . . . . . . . . . . . . . . . . . . . . . . . . .58.42 1062.2.6 Leadership opportunities for women . . . . . . . . . . . . . . . . . . . . . . . . . 47.49 62
Score Rank
3 GROW . . . . . . . . . . . . . . . . . . . . . . . . . . . . . . . . . . . . . . . . . . . . 23.55 1243.1 Formal Education . . . . . . . . . . . . . . . . . . . . . . . . . . . . . . . . . . . . . . . . . . . . 3.33 128
Enrolment3.1.1 Vocational enrolment . . . . . . . . . . . . . . . . . . . . . . . . . . . . . . . . . . . . . . . . . . 3.46 1033.1.2 Tertiary enrolment . . . . . . . . . . . . . . . . . . . . . . . . . . . . . . . . . . . . . . . . . . . . . 9.84 100
Quality3.1.3 Tertiary education expenditure . . . . . . . . . . . . . . . . . . . . . . . . . . . . . . . . 0.00 1173.1.4 Reading, maths, and science . . . . . . . . . . . . . . . . . . . . . . . . . . . . . . . . . . . .n/a n/a3.1.5 University ranking . . . . . . . . . . . . . . . . . . . . . . . . . . . . . . . . . . . . . . . . . . . . . . 0.00 753.2 Lifelong Learning . . . . . . . . . . . . . . . . . . . . . . . . . . . . . . . . . . . . . . . . . . . 29.77 1143.2.1 Quality of management schools . . . . . . . . . . . . . . . . . . . . . . . . . . . . . .28.06 1183.2.2 Prevalence of training in firms . . . . . . . . . . . . . . . . . . . . . . . . . . . . . . . . .24.80 733.2.3 Employee development . . . . . . . . . . . . . . . . . . . . . . . . . . . . . . . . . . . . . .36.44 693.3 Access to Growth Opportunities . . . . . . . . . . . . . . . . . . . . . . . . . . . 37.56 107
Empowerment3.3.1 Delegation of authority . . . . . . . . . . . . . . . . . . . . . . . . . . . . . . . . . . . . . . .34.85 973.3.2 Personal rights . . . . . . . . . . . . . . . . . . . . . . . . . . . . . . . . . . . . . . . . . . . . . . . .29.81 116
Collaboration3.3.3 Use of virtual social networks . . . . . . . . . . . . . . . . . . . . . . . . . . . . . . . . .70.48 793.3.4 Use of virtual professional networks . . . . . . . . . . . . . . . . . . . . . . . . . . . 1.17 1093.3.5 Collaboration within organisations . . . . . . . . . . . . . . . . . . . . . . . . . . . .49.58 583.3.6 Collaboration across organisations . . . . . . . . . . . . . . . . . . . . . . . . . . . .39.46 67
4 RETAIN . . . . . . . . . . . . . . . . . . . . . . . . . . . . . . . . . . . . . . . . . . . 24.04 1164.1 Sustainability . . . . . . . . . . . . . . . . . . . . . . . . . . . . . . . . . . . . . . . . . . . . . . . 21.82 1144.1.1 Pension system . . . . . . . . . . . . . . . . . . . . . . . . . . . . . . . . . . . . . . . . . . . . . . . . 0.00 1194.1.2 Social protection . . . . . . . . . . . . . . . . . . . . . . . . . . . . . . . . . . . . . . . . . . . . . . 21.71 1154.1.3 Brain retention . . . . . . . . . . . . . . . . . . . . . . . . . . . . . . . . . . . . . . . . . . . . . . . . 43.76 574.2 Lifestyle . . . . . . . . . . . . . . . . . . . . . . . . . . . . . . . . . . . . . . . . . . . . . . . . . . . . 26.27 1134.2.1 Environmental performance . . . . . . . . . . . . . . . . . . . . . . . . . . . . . . . . . .26.34 1154.2.2 Personal safety . . . . . . . . . . . . . . . . . . . . . . . . . . . . . . . . . . . . . . . . . . . . . . . . 31.81 1054.2.3 Physician density . . . . . . . . . . . . . . . . . . . . . . . . . . . . . . . . . . . . . . . . . . . . . . . 1.99 1104.2.4 Sanitation . . . . . . . . . . . . . . . . . . . . . . . . . . . . . . . . . . . . . . . . . . . . . . . . . . . . .44.93 107
5 VOCATIONAL AND TECHNICAL SKILLS . . . . . . . . . . . . .23.14 1255.1 Mid-Level Skills . . . . . . . . . . . . . . . . . . . . . . . . . . . . . . . . . . . . . . . . . . . . . . 9.10 1205.1.1 Workforce with secondary education . . . . . . . . . . . . . . . . . . . . . . . . . . 9.13 1175.1.2 Population with secondary education . . . . . . . . . . . . . . . . . . . . . . . . 21.02 965.1.3 Technicians and associate professionals . . . . . . . . . . . . . . . . . . . . . . . . 3.28 1255.1.4 Labour productivity per employee . . . . . . . . . . . . . . . . . . . . . . . . . . . . . 2.96 1015.2 Employability . . . . . . . . . . . . . . . . . . . . . . . . . . . . . . . . . . . . . . . . . . . . . . . 37.18 1005.2.1 Ease of finding skilled employees . . . . . . . . . . . . . . . . . . . . . . . . . . . . . 35.15 1155.2.2 Relevance of education system to the economy . . . . . . . . . . . . . .44.81 645.2.3 Skills matching with secondary education . . . . . . . . . . . . . . . . . . . .20.69 1235.2.4 Skills matching with tertiary education . . . . . . . . . . . . . . . . . . . . . . . . 48.10 82
6 GLOBAL KNOWLEDGE SKILLS . . . . . . . . . . . . . . . . . . . . .11.42 1126.1 High-Level Skills . . . . . . . . . . . . . . . . . . . . . . . . . . . . . . . . . . . . . . . . . . . . 14.57 1146.1.1 Workforce with tertiary education . . . . . . . . . . . . . . . . . . . . . . . . . . . . . 8.16 1106.1.2 Population with tertiary education . . . . . . . . . . . . . . . . . . . . . . . . . . . .38.93 386.1.3 Professionals . . . . . . . . . . . . . . . . . . . . . . . . . . . . . . . . . . . . . . . . . . . . . . . . . . . 8.13 1146.1.4 Researchers . . . . . . . . . . . . . . . . . . . . . . . . . . . . . . . . . . . . . . . . . . . . . . . . . . . . 0.24 1036.1.5 Senior officials and managers . . . . . . . . . . . . . . . . . . . . . . . . . . . . . . . . . . 3.73 1176.1.6 Availability of scientists and engineers . . . . . . . . . . . . . . . . . . . . . . . .28.26 1176.2 Talent Impact . . . . . . . . . . . . . . . . . . . . . . . . . . . . . . . . . . . . . . . . . . . . . . . . 8.27 1106.2.1 Innovation output . . . . . . . . . . . . . . . . . . . . . . . . . . . . . . . . . . . . . . . . . . . .23.29 816.2.2 High-value exports . . . . . . . . . . . . . . . . . . . . . . . . . . . . . . . . . . . . . . . . . . . . . 1.28 1196.2.3 New product entrepreneurial activity . . . . . . . . . . . . . . . . . . . . . . . . . . .n/a n/a6.2.4 New business density . . . . . . . . . . . . . . . . . . . . . . . . . . . . . . . . . . . . . . . . . . .n/a n/a6.2.5 Scientific journal articles . . . . . . . . . . . . . . . . . . . . . . . . . . . . . . . . . . . . . . . 0.25 118
l Cambodia l Income group average

GTCI 2020 Country Profile by Pillar
THE GLOBAL TALENT COMPETITIVENESS INDEX 2020 149
COUNTRY PROFILESCOUNTRY PROFILES
102030405060708090100
Global knowledge skills
Vocational andtechnical skills
Retain
Grow
Attract
Enable
10203004
CAMEROONKey Indicators
Rank (out of 132) . . . . . . . . . . . . . . . . . . . . . . . . . . . . . . . . . . . . 116Income group . . . . . . . . . . . . . . . . . . . . . . . . . . . Lower-middle incomeRegional group . . . . . . . . . . . . . . . . . . . . . . . . . . . . Sub-Saharan AfricaPopulation (millions) . . . . . . . . . . . . . . . . . . . . . . . . . . . . . . . . . . . . 25.22
GDP per capita (PPP US$) . . . . . . . . . . . . . . . . . . . . . . . . . . . . . 3,771.05GDP (US$ billions) . . . . . . . . . . . . . . . . . . . . . . . . . . . . . . . . . . . . . . 38.50GTCI score . . . . . . . . . . . . . . . . . . . . . . . . . . . . . . . . . . . . . . . . . . . . . . 27.53GTCI score (income group average) . . . . . . . . . . . . . . . . . . . . . . . . 32.97
Score Rank
1 ENABLE . . . . . . . . . . . . . . . . . . . . . . . . . . . . . . . . . . . . . . . . . . . 32.17 1191.1 Regulatory Landscape . . . . . . . . . . . . . . . . . . . . . . . . . . . . . . . . . . . . . . 27.88 1241.1.1 Government effectiveness . . . . . . . . . . . . . . . . . . . . . . . . . . . . . . . . . . . .26.67 1181.1.2 Rule of law . . . . . . . . . . . . . . . . . . . . . . . . . . . . . . . . . . . . . . . . . . . . . . . . . . . .28.76 1211.1.3 Political stability . . . . . . . . . . . . . . . . . . . . . . . . . . . . . . . . . . . . . . . . . . . . . . . 41.20 1181.1.4 Regulatory quality. . . . . . . . . . . . . . . . . . . . . . . . . . . . . . . . . . . . . . . . . . . . . 27.89 1171.1.5 Corruption . . . . . . . . . . . . . . . . . . . . . . . . . . . . . . . . . . . . . . . . . . . . . . . . . . . .14.86 1201.2 Market Landscape . . . . . . . . . . . . . . . . . . . . . . . . . . . . . . . . . . . . . . . . . . 35.82 1061.2.1 Competition intensity . . . . . . . . . . . . . . . . . . . . . . . . . . . . . . . . . . . . . . . . . 59.81 881.2.2 Ease of doing business . . . . . . . . . . . . . . . . . . . . . . . . . . . . . . . . . . . . . . . .30.67 1251.2.3 Cluster development . . . . . . . . . . . . . . . . . . . . . . . . . . . . . . . . . . . . . . . . . .24.05 1081.2.4 R&D expenditure . . . . . . . . . . . . . . . . . . . . . . . . . . . . . . . . . . . . . . . . . . . . . . . .n/a n/a1.2.5 ICT infrastructure. . . . . . . . . . . . . . . . . . . . . . . . . . . . . . . . . . . . . . . . . . . . . . 14.76 1171.2.6 Urban population . . . . . . . . . . . . . . . . . . . . . . . . . . . . . . . . . . . . . . . . . . . . .49.84 831.3 Business and Labour Landscape . . . . . . . . . . . . . . . . . . . . . . . . . . . . 32.82 112
Labour Market1.3.1 Tertiary-educated unemployment . . . . . . . . . . . . . . . . . . . . . . . . . . . . 56.12 1061.3.2 Active labour market policies . . . . . . . . . . . . . . . . . . . . . . . . . . . . . . . . .23.97 1051.3.3 Labour-employer cooperation . . . . . . . . . . . . . . . . . . . . . . . . . . . . . . . .24.40 102
Management Practice1.3.4 Professional management . . . . . . . . . . . . . . . . . . . . . . . . . . . . . . . . . . . . 29.91 1111.3.5 Relationship of pay to productivity . . . . . . . . . . . . . . . . . . . . . . . . . . . .30.29 119
Technology Adoption1.3.6 Technology utilisation. . . . . . . . . . . . . . . . . . . . . . . . . . . . . . . . . . . . . . . . . 31.79 1121.3.7 Investment in emerging technologies . . . . . . . . . . . . . . . . . . . . . . . .33.24 871.3.8 Robot density . . . . . . . . . . . . . . . . . . . . . . . . . . . . . . . . . . . . . . . . . . . . . . . . . . .n/a n/a
2 ATTRACT . . . . . . . . . . . . . . . . . . . . . . . . . . . . . . . . . . . . . . . . . .36.79 1132.1 External Openness . . . . . . . . . . . . . . . . . . . . . . . . . . . . . . . . . . . . . . . . . 32.20 103
Attract Business2.1.1 FDI and technology transfer . . . . . . . . . . . . . . . . . . . . . . . . . . . . . . . . . .38.05 1132.1.2 Prevalence of foreign ownership . . . . . . . . . . . . . . . . . . . . . . . . . . . . . . 57.17 69
Attract People2.1.3 Migrant stock . . . . . . . . . . . . . . . . . . . . . . . . . . . . . . . . . . . . . . . . . . . . . . . . . 32.31 772.1.4 International students . . . . . . . . . . . . . . . . . . . . . . . . . . . . . . . . . . . . . . . . . . 4.06 812.1.5 Brain gain . . . . . . . . . . . . . . . . . . . . . . . . . . . . . . . . . . . . . . . . . . . . . . . . . . . . .29.40 1032.2 Internal Openness . . . . . . . . . . . . . . . . . . . . . . . . . . . . . . . . . . . . . . . . . . 41.38 118
Social Inclusion2.2.1 Tolerance of minorities . . . . . . . . . . . . . . . . . . . . . . . . . . . . . . . . . . . . . . . .16.67 1112.2.2 Tolerance of immigrants . . . . . . . . . . . . . . . . . . . . . . . . . . . . . . . . . . . . . . 67.12 462.2.3 Social mobility . . . . . . . . . . . . . . . . . . . . . . . . . . . . . . . . . . . . . . . . . . . . . . . . 47.78 95
Gender Equality2.2.4 Female graduates . . . . . . . . . . . . . . . . . . . . . . . . . . . . . . . . . . . . . . . . . . . . . . .n/a n/a2.2.5 Gender development gap . . . . . . . . . . . . . . . . . . . . . . . . . . . . . . . . . . . . 41.12 1192.2.6 Leadership opportunities for women . . . . . . . . . . . . . . . . . . . . . . . . . 34.19 96
Score Rank
3 GROW . . . . . . . . . . . . . . . . . . . . . . . . . . . . . . . . . . . . . . . . . . . . 29.46 1023.1 Formal Education . . . . . . . . . . . . . . . . . . . . . . . . . . . . . . . . . . . . . . . . . . . 13.03 99
Enrolment3.1.1 Vocational enrolment . . . . . . . . . . . . . . . . . . . . . . . . . . . . . . . . . . . . . . . . . 33.41 333.1.2 Tertiary enrolment . . . . . . . . . . . . . . . . . . . . . . . . . . . . . . . . . . . . . . . . . . . .14.65 94
Quality3.1.3 Tertiary education expenditure . . . . . . . . . . . . . . . . . . . . . . . . . . . . . . . . 4.07 1123.1.4 Reading, maths, and science . . . . . . . . . . . . . . . . . . . . . . . . . . . . . . . . . . . .n/a n/a3.1.5 University ranking . . . . . . . . . . . . . . . . . . . . . . . . . . . . . . . . . . . . . . . . . . . . . . 0.00 753.2 Lifelong Learning . . . . . . . . . . . . . . . . . . . . . . . . . . . . . . . . . . . . . . . . . . . 42.07 703.2.1 Quality of management schools . . . . . . . . . . . . . . . . . . . . . . . . . . . . . .52.29 543.2.2 Prevalence of training in firms . . . . . . . . . . . . . . . . . . . . . . . . . . . . . . . . . 45.12 353.2.3 Employee development . . . . . . . . . . . . . . . . . . . . . . . . . . . . . . . . . . . . . .28.79 983.3 Access to Growth Opportunities . . . . . . . . . . . . . . . . . . . . . . . . . . . 33.29 114
Empowerment3.3.1 Delegation of authority . . . . . . . . . . . . . . . . . . . . . . . . . . . . . . . . . . . . . . .26.50 1153.3.2 Personal rights . . . . . . . . . . . . . . . . . . . . . . . . . . . . . . . . . . . . . . . . . . . . . . . .45.46 105
Collaboration3.3.3 Use of virtual social networks . . . . . . . . . . . . . . . . . . . . . . . . . . . . . . . . .52.28 1133.3.4 Use of virtual professional networks . . . . . . . . . . . . . . . . . . . . . . . . . . . 2.08 1023.3.5 Collaboration within organisations . . . . . . . . . . . . . . . . . . . . . . . . . . . .46.40 693.3.6 Collaboration across organisations . . . . . . . . . . . . . . . . . . . . . . . . . . . . 27.03 102
4 RETAIN . . . . . . . . . . . . . . . . . . . . . . . . . . . . . . . . . . . . . . . . . . . 20.50 1244.1 Sustainability . . . . . . . . . . . . . . . . . . . . . . . . . . . . . . . . . . . . . . . . . . . . . . . 18.91 1224.1.1 Pension system . . . . . . . . . . . . . . . . . . . . . . . . . . . . . . . . . . . . . . . . . . . . . . . . 8.74 984.1.2 Social protection . . . . . . . . . . . . . . . . . . . . . . . . . . . . . . . . . . . . . . . . . . . . . .23.31 1124.1.3 Brain retention . . . . . . . . . . . . . . . . . . . . . . . . . . . . . . . . . . . . . . . . . . . . . . . .24.68 1054.2 Lifestyle . . . . . . . . . . . . . . . . . . . . . . . . . . . . . . . . . . . . . . . . . . . . . . . . . . . . 22.08 1214.2.1 Environmental performance . . . . . . . . . . . . . . . . . . . . . . . . . . . . . . . . . .22.30 1214.2.2 Personal safety . . . . . . . . . . . . . . . . . . . . . . . . . . . . . . . . . . . . . . . . . . . . . . . .30.83 1094.2.3 Physician density . . . . . . . . . . . . . . . . . . . . . . . . . . . . . . . . . . . . . . . . . . . . . . . 1.03 1184.2.4 Sanitation . . . . . . . . . . . . . . . . . . . . . . . . . . . . . . . . . . . . . . . . . . . . . . . . . . . . . 34.18 116
5 VOCATIONAL AND TECHNICAL SKILLS . . . . . . . . . . . . .31.07 1035.1 Mid-Level Skills . . . . . . . . . . . . . . . . . . . . . . . . . . . . . . . . . . . . . . . . . . . . . 13.97 1155.1.1 Workforce with secondary education . . . . . . . . . . . . . . . . . . . . . . . . . 19.10 1065.1.2 Population with secondary education . . . . . . . . . . . . . . . . . . . . . . . .22.59 955.1.3 Technicians and associate professionals . . . . . . . . . . . . . . . . . . . . . . . 11.76 1095.1.4 Labour productivity per employee . . . . . . . . . . . . . . . . . . . . . . . . . . . . . 2.43 1055.2 Employability . . . . . . . . . . . . . . . . . . . . . . . . . . . . . . . . . . . . . . . . . . . . . . . 48.16 675.2.1 Ease of finding skilled employees . . . . . . . . . . . . . . . . . . . . . . . . . . . . . 62.31 515.2.2 Relevance of education system to the economy . . . . . . . . . . . . . .39.67 805.2.3 Skills matching with secondary education . . . . . . . . . . . . . . . . . . . . 43.01 635.2.4 Skills matching with tertiary education . . . . . . . . . . . . . . . . . . . . . . . . 47.66 84
6 GLOBAL KNOWLEDGE SKILLS . . . . . . . . . . . . . . . . . . . . .15.21 1006.1 High-Level Skills . . . . . . . . . . . . . . . . . . . . . . . . . . . . . . . . . . . . . . . . . . . . 15.55 1106.1.1 Workforce with tertiary education . . . . . . . . . . . . . . . . . . . . . . . . . . . . .8.64 1086.1.2 Population with tertiary education . . . . . . . . . . . . . . . . . . . . . . . . . . . . . 0.58 1086.1.3 Professionals . . . . . . . . . . . . . . . . . . . . . . . . . . . . . . . . . . . . . . . . . . . . . . . . . .12.44 1066.1.4 Researchers . . . . . . . . . . . . . . . . . . . . . . . . . . . . . . . . . . . . . . . . . . . . . . . . . . . . .n/a n/a6.1.5 Senior officials and managers . . . . . . . . . . . . . . . . . . . . . . . . . . . . . . . . .16.73 766.1.6 Availability of scientists and engineers . . . . . . . . . . . . . . . . . . . . . . . . 39.37 916.2 Talent Impact . . . . . . . . . . . . . . . . . . . . . . . . . . . . . . . . . . . . . . . . . . . . . . . 14.88 886.2.1 Innovation output . . . . . . . . . . . . . . . . . . . . . . . . . . . . . . . . . . . . . . . . . . . .16.99 1036.2.2 High-value exports . . . . . . . . . . . . . . . . . . . . . . . . . . . . . . . . . . . . . . . . . . . .13.89 756.2.3 New product entrepreneurial activity . . . . . . . . . . . . . . . . . . . . . . . . . 27.56 696.2.4 New business density . . . . . . . . . . . . . . . . . . . . . . . . . . . . . . . . . . . . . . . . . . .n/a n/a6.2.5 Scientific journal articles . . . . . . . . . . . . . . . . . . . . . . . . . . . . . . . . . . . . . . . 1.07 94
l Cameroon l Income group average
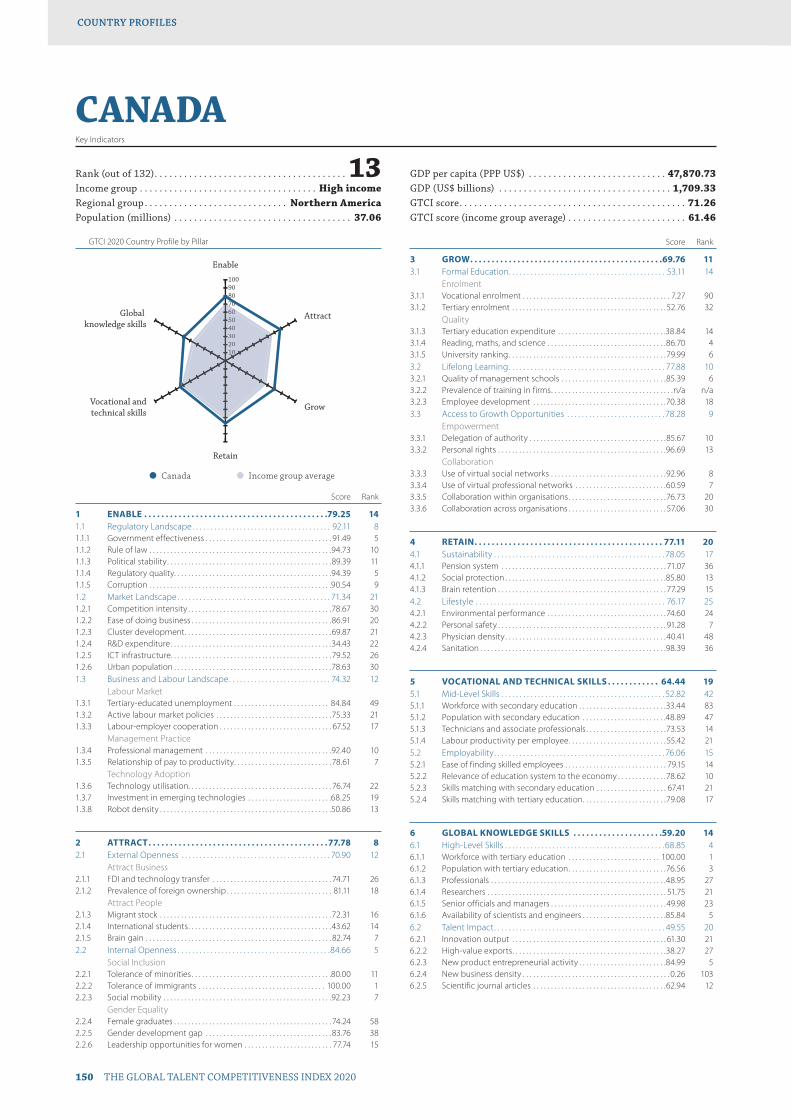
GTCI 2020 Country Profile by Pillar
150 THE GLOBAL TALENT COMPETITIVENESS INDEX 2020
COUNTRY PROFILESCOUNTRY PROFILES
102030405060708090100
Global knowledge skills
Vocational andtechnical skills
Retain
Grow
Attract
Enable
102030405060607
CANADAKey Indicators
Rank (out of 132) . . . . . . . . . . . . . . . . . . . . . . . . . . . . . . . . . . . . . . . 13Income group . . . . . . . . . . . . . . . . . . . . . . . . . . . . . . . . . . . . High incomeRegional group . . . . . . . . . . . . . . . . . . . . . . . . . . . . . Northern AmericaPopulation (millions) . . . . . . . . . . . . . . . . . . . . . . . . . . . . . . . . . . . . 37.06
GDP per capita (PPP US$) . . . . . . . . . . . . . . . . . . . . . . . . . . . . 47,870.73GDP (US$ billions) . . . . . . . . . . . . . . . . . . . . . . . . . . . . . . . . . . . 1,709.33GTCI score . . . . . . . . . . . . . . . . . . . . . . . . . . . . . . . . . . . . . . . . . . . . . . 71.26GTCI score (income group average) . . . . . . . . . . . . . . . . . . . . . . . . 61.46
Score Rank
1 ENABLE . . . . . . . . . . . . . . . . . . . . . . . . . . . . . . . . . . . . . . . . . . .79.25 141.1 Regulatory Landscape . . . . . . . . . . . . . . . . . . . . . . . . . . . . . . . . . . . . . . 92.11 81.1.1 Government effectiveness . . . . . . . . . . . . . . . . . . . . . . . . . . . . . . . . . . . . 91.49 51.1.2 Rule of law . . . . . . . . . . . . . . . . . . . . . . . . . . . . . . . . . . . . . . . . . . . . . . . . . . . .94.73 101.1.3 Political stability . . . . . . . . . . . . . . . . . . . . . . . . . . . . . . . . . . . . . . . . . . . . . . .89.39 111.1.4 Regulatory quality. . . . . . . . . . . . . . . . . . . . . . . . . . . . . . . . . . . . . . . . . . . . .94.39 51.1.5 Corruption . . . . . . . . . . . . . . . . . . . . . . . . . . . . . . . . . . . . . . . . . . . . . . . . . . . .90.54 91.2 Market Landscape . . . . . . . . . . . . . . . . . . . . . . . . . . . . . . . . . . . . . . . . . . 71.34 211.2.1 Competition intensity . . . . . . . . . . . . . . . . . . . . . . . . . . . . . . . . . . . . . . . . .78.67 301.2.2 Ease of doing business . . . . . . . . . . . . . . . . . . . . . . . . . . . . . . . . . . . . . . . .86.91 201.2.3 Cluster development . . . . . . . . . . . . . . . . . . . . . . . . . . . . . . . . . . . . . . . . . .69.87 211.2.4 R&D expenditure . . . . . . . . . . . . . . . . . . . . . . . . . . . . . . . . . . . . . . . . . . . . . .34.43 221.2.5 ICT infrastructure. . . . . . . . . . . . . . . . . . . . . . . . . . . . . . . . . . . . . . . . . . . . . .79.52 261.2.6 Urban population . . . . . . . . . . . . . . . . . . . . . . . . . . . . . . . . . . . . . . . . . . . . .78.63 301.3 Business and Labour Landscape . . . . . . . . . . . . . . . . . . . . . . . . . . . . 74.32 12
Labour Market1.3.1 Tertiary-educated unemployment . . . . . . . . . . . . . . . . . . . . . . . . . . . 84.84 491.3.2 Active labour market policies . . . . . . . . . . . . . . . . . . . . . . . . . . . . . . . . .75.33 211.3.3 Labour-employer cooperation . . . . . . . . . . . . . . . . . . . . . . . . . . . . . . . . 67.52 17
Management Practice1.3.4 Professional management . . . . . . . . . . . . . . . . . . . . . . . . . . . . . . . . . . . .92.40 101.3.5 Relationship of pay to productivity . . . . . . . . . . . . . . . . . . . . . . . . . . . .78.61 7
Technology Adoption1.3.6 Technology utilisation. . . . . . . . . . . . . . . . . . . . . . . . . . . . . . . . . . . . . . . . . 76.74 221.3.7 Investment in emerging technologies . . . . . . . . . . . . . . . . . . . . . . . .68.25 191.3.8 Robot density . . . . . . . . . . . . . . . . . . . . . . . . . . . . . . . . . . . . . . . . . . . . . . . . .50.86 13
2 ATTRACT . . . . . . . . . . . . . . . . . . . . . . . . . . . . . . . . . . . . . . . . . .77.78 82.1 External Openness . . . . . . . . . . . . . . . . . . . . . . . . . . . . . . . . . . . . . . . . . 70.90 12
Attract Business2.1.1 FDI and technology transfer . . . . . . . . . . . . . . . . . . . . . . . . . . . . . . . . . . 74.71 262.1.2 Prevalence of foreign ownership . . . . . . . . . . . . . . . . . . . . . . . . . . . . . . 81.11 18
Attract People2.1.3 Migrant stock . . . . . . . . . . . . . . . . . . . . . . . . . . . . . . . . . . . . . . . . . . . . . . . . .72.31 162.1.4 International students . . . . . . . . . . . . . . . . . . . . . . . . . . . . . . . . . . . . . . . . .43.62 142.1.5 Brain gain . . . . . . . . . . . . . . . . . . . . . . . . . . . . . . . . . . . . . . . . . . . . . . . . . . . . . 82.74 72.2 Internal Openness . . . . . . . . . . . . . . . . . . . . . . . . . . . . . . . . . . . . . . . . . .84.66 5
Social Inclusion2.2.1 Tolerance of minorities . . . . . . . . . . . . . . . . . . . . . . . . . . . . . . . . . . . . . . . .80.00 112.2.2 Tolerance of immigrants . . . . . . . . . . . . . . . . . . . . . . . . . . . . . . . . . . . . 100.00 12.2.3 Social mobility . . . . . . . . . . . . . . . . . . . . . . . . . . . . . . . . . . . . . . . . . . . . . . . .92.23 7
Gender Equality2.2.4 Female graduates . . . . . . . . . . . . . . . . . . . . . . . . . . . . . . . . . . . . . . . . . . . . . 74.24 582.2.5 Gender development gap . . . . . . . . . . . . . . . . . . . . . . . . . . . . . . . . . . . .83.76 382.2.6 Leadership opportunities for women . . . . . . . . . . . . . . . . . . . . . . . . . 77.74 15
Score Rank
3 GROW . . . . . . . . . . . . . . . . . . . . . . . . . . . . . . . . . . . . . . . . . . . . .69.76 113.1 Formal Education . . . . . . . . . . . . . . . . . . . . . . . . . . . . . . . . . . . . . . . . . . . 53.11 14
Enrolment3.1.1 Vocational enrolment . . . . . . . . . . . . . . . . . . . . . . . . . . . . . . . . . . . . . . . . . . 7.27 903.1.2 Tertiary enrolment . . . . . . . . . . . . . . . . . . . . . . . . . . . . . . . . . . . . . . . . . . . . 52.76 32
Quality3.1.3 Tertiary education expenditure . . . . . . . . . . . . . . . . . . . . . . . . . . . . . . .38.84 143.1.4 Reading, maths, and science . . . . . . . . . . . . . . . . . . . . . . . . . . . . . . . . . .86.70 43.1.5 University ranking . . . . . . . . . . . . . . . . . . . . . . . . . . . . . . . . . . . . . . . . . . . . .79.99 63.2 Lifelong Learning . . . . . . . . . . . . . . . . . . . . . . . . . . . . . . . . . . . . . . . . . . . 77.88 103.2.1 Quality of management schools . . . . . . . . . . . . . . . . . . . . . . . . . . . . . .85.39 63.2.2 Prevalence of training in firms . . . . . . . . . . . . . . . . . . . . . . . . . . . . . . . . . . .n/a n/a3.2.3 Employee development . . . . . . . . . . . . . . . . . . . . . . . . . . . . . . . . . . . . . .70.38 183.3 Access to Growth Opportunities . . . . . . . . . . . . . . . . . . . . . . . . . . . 78.28 9
Empowerment3.3.1 Delegation of authority . . . . . . . . . . . . . . . . . . . . . . . . . . . . . . . . . . . . . . .85.67 103.3.2 Personal rights . . . . . . . . . . . . . . . . . . . . . . . . . . . . . . . . . . . . . . . . . . . . . . . .96.69 13
Collaboration3.3.3 Use of virtual social networks . . . . . . . . . . . . . . . . . . . . . . . . . . . . . . . . .92.96 83.3.4 Use of virtual professional networks . . . . . . . . . . . . . . . . . . . . . . . . . .60.59 73.3.5 Collaboration within organisations . . . . . . . . . . . . . . . . . . . . . . . . . . . .76.73 203.3.6 Collaboration across organisations . . . . . . . . . . . . . . . . . . . . . . . . . . . . 57.06 30
4 RETAIN . . . . . . . . . . . . . . . . . . . . . . . . . . . . . . . . . . . . . . . . . . . . 77.11 204.1 Sustainability . . . . . . . . . . . . . . . . . . . . . . . . . . . . . . . . . . . . . . . . . . . . . . . 78.05 174.1.1 Pension system . . . . . . . . . . . . . . . . . . . . . . . . . . . . . . . . . . . . . . . . . . . . . . . 71.07 364.1.2 Social protection . . . . . . . . . . . . . . . . . . . . . . . . . . . . . . . . . . . . . . . . . . . . . .85.80 134.1.3 Brain retention . . . . . . . . . . . . . . . . . . . . . . . . . . . . . . . . . . . . . . . . . . . . . . . . 77.29 154.2 Lifestyle . . . . . . . . . . . . . . . . . . . . . . . . . . . . . . . . . . . . . . . . . . . . . . . . . . . . 76.17 254.2.1 Environmental performance . . . . . . . . . . . . . . . . . . . . . . . . . . . . . . . . . .74.60 244.2.2 Personal safety . . . . . . . . . . . . . . . . . . . . . . . . . . . . . . . . . . . . . . . . . . . . . . . . 91.28 74.2.3 Physician density . . . . . . . . . . . . . . . . . . . . . . . . . . . . . . . . . . . . . . . . . . . . . .40.41 484.2.4 Sanitation . . . . . . . . . . . . . . . . . . . . . . . . . . . . . . . . . . . . . . . . . . . . . . . . . . . . .98.39 36
5 VOCATIONAL AND TECHNICAL SKILLS . . . . . . . . . . . . 64.44 195.1 Mid-Level Skills . . . . . . . . . . . . . . . . . . . . . . . . . . . . . . . . . . . . . . . . . . . . . 52.82 425.1.1 Workforce with secondary education . . . . . . . . . . . . . . . . . . . . . . . . .33.44 835.1.2 Population with secondary education . . . . . . . . . . . . . . . . . . . . . . . .48.89 475.1.3 Technicians and associate professionals . . . . . . . . . . . . . . . . . . . . . . .73.53 145.1.4 Labour productivity per employee . . . . . . . . . . . . . . . . . . . . . . . . . . . . 55.42 215.2 Employability . . . . . . . . . . . . . . . . . . . . . . . . . . . . . . . . . . . . . . . . . . . . . . . 76.06 155.2.1 Ease of finding skilled employees . . . . . . . . . . . . . . . . . . . . . . . . . . . . . 79.15 145.2.2 Relevance of education system to the economy . . . . . . . . . . . . . .78.62 105.2.3 Skills matching with secondary education . . . . . . . . . . . . . . . . . . . . 67.41 215.2.4 Skills matching with tertiary education . . . . . . . . . . . . . . . . . . . . . . . .79.08 17
6 GLOBAL KNOWLEDGE SKILLS . . . . . . . . . . . . . . . . . . . . .59.20 146.1 High-Level Skills . . . . . . . . . . . . . . . . . . . . . . . . . . . . . . . . . . . . . . . . . . . .68.85 46.1.1 Workforce with tertiary education . . . . . . . . . . . . . . . . . . . . . . . . . . 100.00 16.1.2 Population with tertiary education . . . . . . . . . . . . . . . . . . . . . . . . . . . .76.56 36.1.3 Professionals . . . . . . . . . . . . . . . . . . . . . . . . . . . . . . . . . . . . . . . . . . . . . . . . . .48.95 276.1.4 Researchers . . . . . . . . . . . . . . . . . . . . . . . . . . . . . . . . . . . . . . . . . . . . . . . . . . . 51.75 216.1.5 Senior officials and managers . . . . . . . . . . . . . . . . . . . . . . . . . . . . . . . . .49.98 236.1.6 Availability of scientists and engineers . . . . . . . . . . . . . . . . . . . . . . . .85.84 56.2 Talent Impact . . . . . . . . . . . . . . . . . . . . . . . . . . . . . . . . . . . . . . . . . . . . . . . 49.55 206.2.1 Innovation output . . . . . . . . . . . . . . . . . . . . . . . . . . . . . . . . . . . . . . . . . . . . 61.30 216.2.2 High-value exports . . . . . . . . . . . . . . . . . . . . . . . . . . . . . . . . . . . . . . . . . . . .38.27 276.2.3 New product entrepreneurial activity . . . . . . . . . . . . . . . . . . . . . . . . .84.99 56.2.4 New business density . . . . . . . . . . . . . . . . . . . . . . . . . . . . . . . . . . . . . . . . . . 0.26 1036.2.5 Scientific journal articles . . . . . . . . . . . . . . . . . . . . . . . . . . . . . . . . . . . . . .62.94 12
l Canada l Income group average
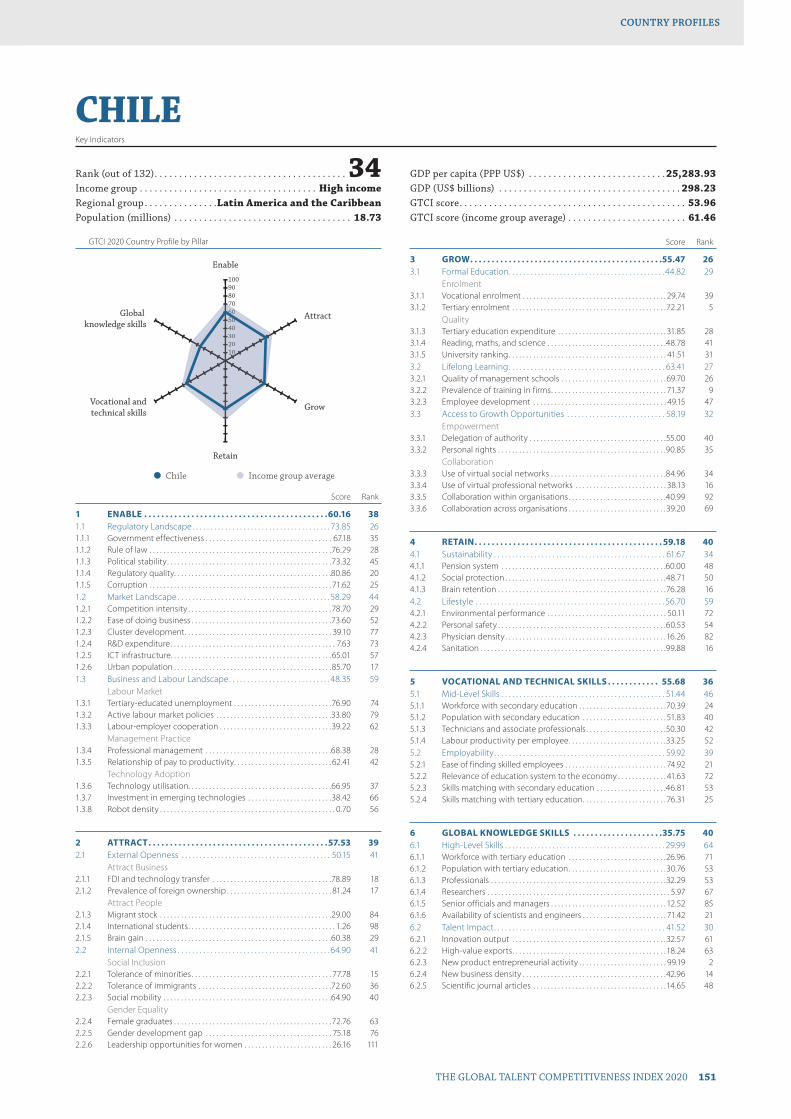
GTCI 2020 Country Profile by Pillar
THE GLOBAL TALENT COMPETITIVENESS INDEX 2020 151
COUNTRY PROFILESCOUNTRY PROFILES
102030405060708090100
Global knowledge skills
Vocational andtechnical skills
Retain
Grow
Attract
Enable
102030405060607
CHILEKey Indicators
Rank (out of 132) . . . . . . . . . . . . . . . . . . . . . . . . . . . . . . . . . . . . . . . 34Income group . . . . . . . . . . . . . . . . . . . . . . . . . . . . . . . . . . . . High incomeRegional group . . . . . . . . . . . . . . .Latin America and the CaribbeanPopulation (millions) . . . . . . . . . . . . . . . . . . . . . . . . . . . . . . . . . . . . 18.73
GDP per capita (PPP US$) . . . . . . . . . . . . . . . . . . . . . . . . . . . .25,283.93GDP (US$ billions) . . . . . . . . . . . . . . . . . . . . . . . . . . . . . . . . . . . . . 298.23GTCI score . . . . . . . . . . . . . . . . . . . . . . . . . . . . . . . . . . . . . . . . . . . . . . 53.96GTCI score (income group average) . . . . . . . . . . . . . . . . . . . . . . . . 61.46
Score Rank
1 ENABLE . . . . . . . . . . . . . . . . . . . . . . . . . . . . . . . . . . . . . . . . . . .60.16 381.1 Regulatory Landscape . . . . . . . . . . . . . . . . . . . . . . . . . . . . . . . . . . . . . . 73.85 261.1.1 Government effectiveness . . . . . . . . . . . . . . . . . . . . . . . . . . . . . . . . . . . . 67.18 351.1.2 Rule of law . . . . . . . . . . . . . . . . . . . . . . . . . . . . . . . . . . . . . . . . . . . . . . . . . . . .76.29 281.1.3 Political stability . . . . . . . . . . . . . . . . . . . . . . . . . . . . . . . . . . . . . . . . . . . . . . .73.32 451.1.4 Regulatory quality. . . . . . . . . . . . . . . . . . . . . . . . . . . . . . . . . . . . . . . . . . . . .80.86 201.1.5 Corruption . . . . . . . . . . . . . . . . . . . . . . . . . . . . . . . . . . . . . . . . . . . . . . . . . . . . 71.62 251.2 Market Landscape . . . . . . . . . . . . . . . . . . . . . . . . . . . . . . . . . . . . . . . . . . 58.29 441.2.1 Competition intensity . . . . . . . . . . . . . . . . . . . . . . . . . . . . . . . . . . . . . . . . .78.70 291.2.2 Ease of doing business . . . . . . . . . . . . . . . . . . . . . . . . . . . . . . . . . . . . . . . .73.60 521.2.3 Cluster development . . . . . . . . . . . . . . . . . . . . . . . . . . . . . . . . . . . . . . . . . . 39.10 771.2.4 R&D expenditure . . . . . . . . . . . . . . . . . . . . . . . . . . . . . . . . . . . . . . . . . . . . . . . 7.63 731.2.5 ICT infrastructure. . . . . . . . . . . . . . . . . . . . . . . . . . . . . . . . . . . . . . . . . . . . . .65.01 571.2.6 Urban population . . . . . . . . . . . . . . . . . . . . . . . . . . . . . . . . . . . . . . . . . . . . .85.70 171.3 Business and Labour Landscape . . . . . . . . . . . . . . . . . . . . . . . . . . . . 48.35 59
Labour Market1.3.1 Tertiary-educated unemployment . . . . . . . . . . . . . . . . . . . . . . . . . . . .76.90 741.3.2 Active labour market policies . . . . . . . . . . . . . . . . . . . . . . . . . . . . . . . . .33.80 791.3.3 Labour-employer cooperation . . . . . . . . . . . . . . . . . . . . . . . . . . . . . . . .39.22 62
Management Practice1.3.4 Professional management . . . . . . . . . . . . . . . . . . . . . . . . . . . . . . . . . . . .68.38 281.3.5 Relationship of pay to productivity . . . . . . . . . . . . . . . . . . . . . . . . . . . . 62.41 42
Technology Adoption1.3.6 Technology utilisation. . . . . . . . . . . . . . . . . . . . . . . . . . . . . . . . . . . . . . . . .66.95 371.3.7 Investment in emerging technologies . . . . . . . . . . . . . . . . . . . . . . . .38.42 661.3.8 Robot density . . . . . . . . . . . . . . . . . . . . . . . . . . . . . . . . . . . . . . . . . . . . . . . . . . 0.70 56
2 ATTRACT . . . . . . . . . . . . . . . . . . . . . . . . . . . . . . . . . . . . . . . . . .57.53 392.1 External Openness . . . . . . . . . . . . . . . . . . . . . . . . . . . . . . . . . . . . . . . . . 50.15 41
Attract Business2.1.1 FDI and technology transfer . . . . . . . . . . . . . . . . . . . . . . . . . . . . . . . . . .78.89 182.1.2 Prevalence of foreign ownership . . . . . . . . . . . . . . . . . . . . . . . . . . . . . . 81.24 17
Attract People2.1.3 Migrant stock . . . . . . . . . . . . . . . . . . . . . . . . . . . . . . . . . . . . . . . . . . . . . . . . .29.00 842.1.4 International students . . . . . . . . . . . . . . . . . . . . . . . . . . . . . . . . . . . . . . . . . . 1.26 982.1.5 Brain gain . . . . . . . . . . . . . . . . . . . . . . . . . . . . . . . . . . . . . . . . . . . . . . . . . . . . .60.38 292.2 Internal Openness . . . . . . . . . . . . . . . . . . . . . . . . . . . . . . . . . . . . . . . . . . 64.90 41
Social Inclusion2.2.1 Tolerance of minorities . . . . . . . . . . . . . . . . . . . . . . . . . . . . . . . . . . . . . . . . 77.78 152.2.2 Tolerance of immigrants . . . . . . . . . . . . . . . . . . . . . . . . . . . . . . . . . . . . . .72.60 362.2.3 Social mobility . . . . . . . . . . . . . . . . . . . . . . . . . . . . . . . . . . . . . . . . . . . . . . . .64.90 40
Gender Equality2.2.4 Female graduates . . . . . . . . . . . . . . . . . . . . . . . . . . . . . . . . . . . . . . . . . . . . .72.76 632.2.5 Gender development gap . . . . . . . . . . . . . . . . . . . . . . . . . . . . . . . . . . . . 75.18 762.2.6 Leadership opportunities for women . . . . . . . . . . . . . . . . . . . . . . . . . 26.16 111
Score Rank
3 GROW . . . . . . . . . . . . . . . . . . . . . . . . . . . . . . . . . . . . . . . . . . . . .55.47 263.1 Formal Education . . . . . . . . . . . . . . . . . . . . . . . . . . . . . . . . . . . . . . . . . . .44.82 29
Enrolment3.1.1 Vocational enrolment . . . . . . . . . . . . . . . . . . . . . . . . . . . . . . . . . . . . . . . . . 29.74 393.1.2 Tertiary enrolment . . . . . . . . . . . . . . . . . . . . . . . . . . . . . . . . . . . . . . . . . . . .72.21 5
Quality3.1.3 Tertiary education expenditure . . . . . . . . . . . . . . . . . . . . . . . . . . . . . . . 31.85 283.1.4 Reading, maths, and science . . . . . . . . . . . . . . . . . . . . . . . . . . . . . . . . . .48.78 413.1.5 University ranking . . . . . . . . . . . . . . . . . . . . . . . . . . . . . . . . . . . . . . . . . . . . . 41.51 313.2 Lifelong Learning . . . . . . . . . . . . . . . . . . . . . . . . . . . . . . . . . . . . . . . . . . . 63.41 273.2.1 Quality of management schools . . . . . . . . . . . . . . . . . . . . . . . . . . . . . . 69.70 263.2.2 Prevalence of training in firms . . . . . . . . . . . . . . . . . . . . . . . . . . . . . . . . . 71.37 93.2.3 Employee development . . . . . . . . . . . . . . . . . . . . . . . . . . . . . . . . . . . . . . 49.15 473.3 Access to Growth Opportunities . . . . . . . . . . . . . . . . . . . . . . . . . . . 58.19 32
Empowerment3.3.1 Delegation of authority . . . . . . . . . . . . . . . . . . . . . . . . . . . . . . . . . . . . . . .55.00 403.3.2 Personal rights . . . . . . . . . . . . . . . . . . . . . . . . . . . . . . . . . . . . . . . . . . . . . . . .90.85 35
Collaboration3.3.3 Use of virtual social networks . . . . . . . . . . . . . . . . . . . . . . . . . . . . . . . . .84.96 343.3.4 Use of virtual professional networks . . . . . . . . . . . . . . . . . . . . . . . . . . 38.13 163.3.5 Collaboration within organisations . . . . . . . . . . . . . . . . . . . . . . . . . . . .40.99 923.3.6 Collaboration across organisations . . . . . . . . . . . . . . . . . . . . . . . . . . . .39.20 69
4 RETAIN . . . . . . . . . . . . . . . . . . . . . . . . . . . . . . . . . . . . . . . . . . . . 59.18 404.1 Sustainability . . . . . . . . . . . . . . . . . . . . . . . . . . . . . . . . . . . . . . . . . . . . . . . 61.67 344.1.1 Pension system . . . . . . . . . . . . . . . . . . . . . . . . . . . . . . . . . . . . . . . . . . . . . . .60.00 484.1.2 Social protection . . . . . . . . . . . . . . . . . . . . . . . . . . . . . . . . . . . . . . . . . . . . . .48.71 504.1.3 Brain retention . . . . . . . . . . . . . . . . . . . . . . . . . . . . . . . . . . . . . . . . . . . . . . . .76.28 164.2 Lifestyle . . . . . . . . . . . . . . . . . . . . . . . . . . . . . . . . . . . . . . . . . . . . . . . . . . . . 56.70 594.2.1 Environmental performance . . . . . . . . . . . . . . . . . . . . . . . . . . . . . . . . . . 50.11 724.2.2 Personal safety . . . . . . . . . . . . . . . . . . . . . . . . . . . . . . . . . . . . . . . . . . . . . . . .60.53 544.2.3 Physician density . . . . . . . . . . . . . . . . . . . . . . . . . . . . . . . . . . . . . . . . . . . . . .16.26 824.2.4 Sanitation . . . . . . . . . . . . . . . . . . . . . . . . . . . . . . . . . . . . . . . . . . . . . . . . . . . . .99.88 16
5 VOCATIONAL AND TECHNICAL SKILLS . . . . . . . . . . . . 55.68 365.1 Mid-Level Skills . . . . . . . . . . . . . . . . . . . . . . . . . . . . . . . . . . . . . . . . . . . . . 51.44 465.1.1 Workforce with secondary education . . . . . . . . . . . . . . . . . . . . . . . . .70.39 245.1.2 Population with secondary education . . . . . . . . . . . . . . . . . . . . . . . . 51.83 405.1.3 Technicians and associate professionals . . . . . . . . . . . . . . . . . . . . . . .50.30 425.1.4 Labour productivity per employee . . . . . . . . . . . . . . . . . . . . . . . . . . . .33.25 525.2 Employability . . . . . . . . . . . . . . . . . . . . . . . . . . . . . . . . . . . . . . . . . . . . . . . 59.92 395.2.1 Ease of finding skilled employees . . . . . . . . . . . . . . . . . . . . . . . . . . . . . 74.92 215.2.2 Relevance of education system to the economy . . . . . . . . . . . . . . 41.63 725.2.3 Skills matching with secondary education . . . . . . . . . . . . . . . . . . . .46.81 535.2.4 Skills matching with tertiary education . . . . . . . . . . . . . . . . . . . . . . . . 76.31 25
6 GLOBAL KNOWLEDGE SKILLS . . . . . . . . . . . . . . . . . . . . .35.75 406.1 High-Level Skills . . . . . . . . . . . . . . . . . . . . . . . . . . . . . . . . . . . . . . . . . . . . 29.99 646.1.1 Workforce with tertiary education . . . . . . . . . . . . . . . . . . . . . . . . . . . .26.96 716.1.2 Population with tertiary education . . . . . . . . . . . . . . . . . . . . . . . . . . . .30.76 536.1.3 Professionals . . . . . . . . . . . . . . . . . . . . . . . . . . . . . . . . . . . . . . . . . . . . . . . . . .32.29 536.1.4 Researchers . . . . . . . . . . . . . . . . . . . . . . . . . . . . . . . . . . . . . . . . . . . . . . . . . . . . 5.97 676.1.5 Senior officials and managers . . . . . . . . . . . . . . . . . . . . . . . . . . . . . . . . . 12.52 856.1.6 Availability of scientists and engineers . . . . . . . . . . . . . . . . . . . . . . . . 71.42 216.2 Talent Impact . . . . . . . . . . . . . . . . . . . . . . . . . . . . . . . . . . . . . . . . . . . . . . . 41.52 306.2.1 Innovation output . . . . . . . . . . . . . . . . . . . . . . . . . . . . . . . . . . . . . . . . . . . .32.57 616.2.2 High-value exports . . . . . . . . . . . . . . . . . . . . . . . . . . . . . . . . . . . . . . . . . . . . 18.24 636.2.3 New product entrepreneurial activity . . . . . . . . . . . . . . . . . . . . . . . . . 99.19 26.2.4 New business density . . . . . . . . . . . . . . . . . . . . . . . . . . . . . . . . . . . . . . . . .42.96 146.2.5 Scientific journal articles . . . . . . . . . . . . . . . . . . . . . . . . . . . . . . . . . . . . . .14.65 48
l Chile l Income group average
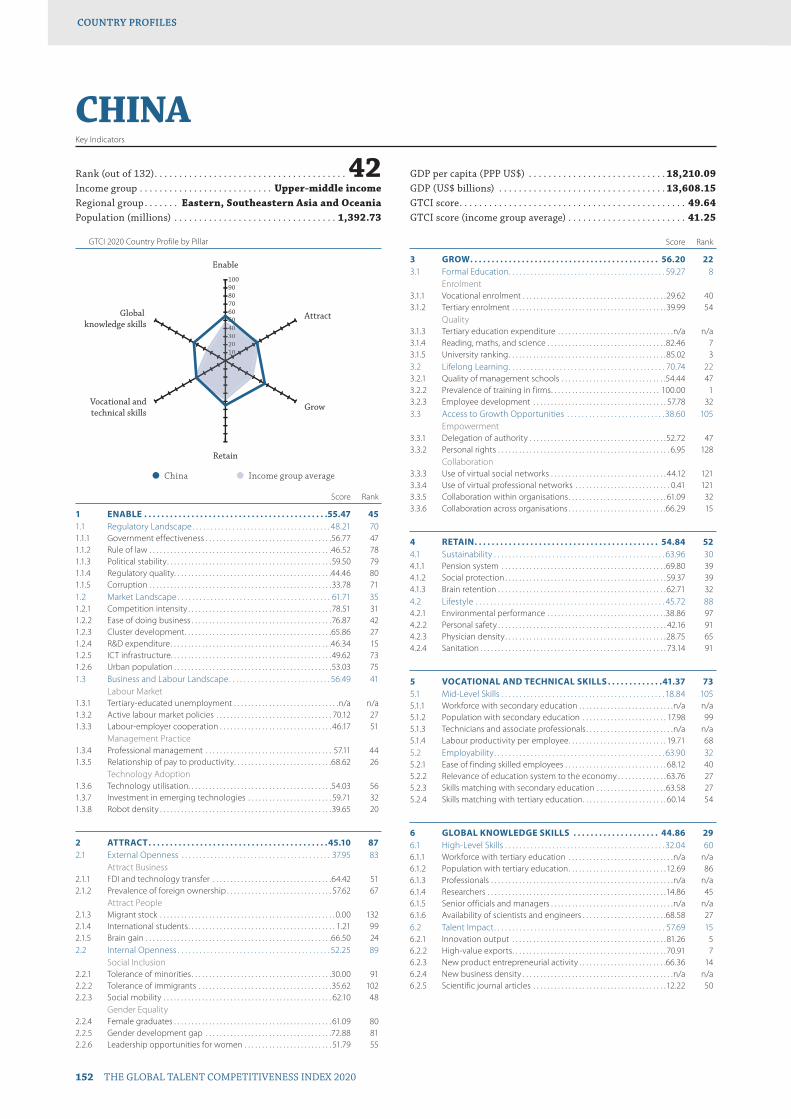
GTCI 2020 Country Profile by Pillar
152 THE GLOBAL TALENT COMPETITIVENESS INDEX 2020
COUNTRY PROFILESCOUNTRY PROFILES
102030405060708090100
Global knowledge skills
Vocational andtechnical skills
Retain
Grow
Attract
Enable
1020304040
CHINAKey Indicators
Rank (out of 132) . . . . . . . . . . . . . . . . . . . . . . . . . . . . . . . . . . . . . . . 42Income group . . . . . . . . . . . . . . . . . . . . . . . . . . . Upper-middle incomeRegional group . . . . . . . Eastern, Southeastern Asia and OceaniaPopulation (millions) . . . . . . . . . . . . . . . . . . . . . . . . . . . . . . . . . 1,392.73
GDP per capita (PPP US$) . . . . . . . . . . . . . . . . . . . . . . . . . . . . 18,210.09GDP (US$ billions) . . . . . . . . . . . . . . . . . . . . . . . . . . . . . . . . . . 13,608.15GTCI score . . . . . . . . . . . . . . . . . . . . . . . . . . . . . . . . . . . . . . . . . . . . . . 49.64GTCI score (income group average) . . . . . . . . . . . . . . . . . . . . . . . . 41.25
Score Rank
1 ENABLE . . . . . . . . . . . . . . . . . . . . . . . . . . . . . . . . . . . . . . . . . . .55.47 451.1 Regulatory Landscape . . . . . . . . . . . . . . . . . . . . . . . . . . . . . . . . . . . . . . 48.21 701.1.1 Government effectiveness . . . . . . . . . . . . . . . . . . . . . . . . . . . . . . . . . . . .56.77 471.1.2 Rule of law . . . . . . . . . . . . . . . . . . . . . . . . . . . . . . . . . . . . . . . . . . . . . . . . . . . .46.52 781.1.3 Political stability . . . . . . . . . . . . . . . . . . . . . . . . . . . . . . . . . . . . . . . . . . . . . . .59.50 791.1.4 Regulatory quality. . . . . . . . . . . . . . . . . . . . . . . . . . . . . . . . . . . . . . . . . . . . .44.46 801.1.5 Corruption . . . . . . . . . . . . . . . . . . . . . . . . . . . . . . . . . . . . . . . . . . . . . . . . . . . .33.78 711.2 Market Landscape . . . . . . . . . . . . . . . . . . . . . . . . . . . . . . . . . . . . . . . . . . 61.71 351.2.1 Competition intensity . . . . . . . . . . . . . . . . . . . . . . . . . . . . . . . . . . . . . . . . .78.51 311.2.2 Ease of doing business . . . . . . . . . . . . . . . . . . . . . . . . . . . . . . . . . . . . . . . .76.87 421.2.3 Cluster development . . . . . . . . . . . . . . . . . . . . . . . . . . . . . . . . . . . . . . . . . .65.86 271.2.4 R&D expenditure . . . . . . . . . . . . . . . . . . . . . . . . . . . . . . . . . . . . . . . . . . . . . .46.34 151.2.5 ICT infrastructure. . . . . . . . . . . . . . . . . . . . . . . . . . . . . . . . . . . . . . . . . . . . . .49.62 731.2.6 Urban population . . . . . . . . . . . . . . . . . . . . . . . . . . . . . . . . . . . . . . . . . . . . .53.03 751.3 Business and Labour Landscape . . . . . . . . . . . . . . . . . . . . . . . . . . . . 56.49 41
Labour Market1.3.1 Tertiary-educated unemployment . . . . . . . . . . . . . . . . . . . . . . . . . . . . . .n/a n/a1.3.2 Active labour market policies . . . . . . . . . . . . . . . . . . . . . . . . . . . . . . . . . 70.12 271.3.3 Labour-employer cooperation . . . . . . . . . . . . . . . . . . . . . . . . . . . . . . . . 46.17 51
Management Practice1.3.4 Professional management . . . . . . . . . . . . . . . . . . . . . . . . . . . . . . . . . . . . 57.11 441.3.5 Relationship of pay to productivity . . . . . . . . . . . . . . . . . . . . . . . . . . . .68.62 26
Technology Adoption1.3.6 Technology utilisation. . . . . . . . . . . . . . . . . . . . . . . . . . . . . . . . . . . . . . . . .54.03 561.3.7 Investment in emerging technologies . . . . . . . . . . . . . . . . . . . . . . . . 59.71 321.3.8 Robot density . . . . . . . . . . . . . . . . . . . . . . . . . . . . . . . . . . . . . . . . . . . . . . . . .39.65 20
2 ATTRACT . . . . . . . . . . . . . . . . . . . . . . . . . . . . . . . . . . . . . . . . . .45.10 872.1 External Openness . . . . . . . . . . . . . . . . . . . . . . . . . . . . . . . . . . . . . . . . . 37.95 83
Attract Business2.1.1 FDI and technology transfer . . . . . . . . . . . . . . . . . . . . . . . . . . . . . . . . . .64.42 512.1.2 Prevalence of foreign ownership . . . . . . . . . . . . . . . . . . . . . . . . . . . . . . 57.62 67
Attract People2.1.3 Migrant stock . . . . . . . . . . . . . . . . . . . . . . . . . . . . . . . . . . . . . . . . . . . . . . . . . . 0.00 1322.1.4 International students . . . . . . . . . . . . . . . . . . . . . . . . . . . . . . . . . . . . . . . . . . 1.21 992.1.5 Brain gain . . . . . . . . . . . . . . . . . . . . . . . . . . . . . . . . . . . . . . . . . . . . . . . . . . . . .66.50 242.2 Internal Openness . . . . . . . . . . . . . . . . . . . . . . . . . . . . . . . . . . . . . . . . . . 52.25 89
Social Inclusion2.2.1 Tolerance of minorities . . . . . . . . . . . . . . . . . . . . . . . . . . . . . . . . . . . . . . . .30.00 912.2.2 Tolerance of immigrants . . . . . . . . . . . . . . . . . . . . . . . . . . . . . . . . . . . . . .35.62 1022.2.3 Social mobility . . . . . . . . . . . . . . . . . . . . . . . . . . . . . . . . . . . . . . . . . . . . . . . . 62.10 48
Gender Equality2.2.4 Female graduates . . . . . . . . . . . . . . . . . . . . . . . . . . . . . . . . . . . . . . . . . . . . . 61.09 802.2.5 Gender development gap . . . . . . . . . . . . . . . . . . . . . . . . . . . . . . . . . . . .72.88 812.2.6 Leadership opportunities for women . . . . . . . . . . . . . . . . . . . . . . . . . 51.79 55
Score Rank
3 GROW . . . . . . . . . . . . . . . . . . . . . . . . . . . . . . . . . . . . . . . . . . . . 56.20 223.1 Formal Education . . . . . . . . . . . . . . . . . . . . . . . . . . . . . . . . . . . . . . . . . . . 59.27 8
Enrolment3.1.1 Vocational enrolment . . . . . . . . . . . . . . . . . . . . . . . . . . . . . . . . . . . . . . . . .29.62 403.1.2 Tertiary enrolment . . . . . . . . . . . . . . . . . . . . . . . . . . . . . . . . . . . . . . . . . . . .39.99 54
Quality3.1.3 Tertiary education expenditure . . . . . . . . . . . . . . . . . . . . . . . . . . . . . . . . .n/a n/a3.1.4 Reading, maths, and science . . . . . . . . . . . . . . . . . . . . . . . . . . . . . . . . . .82.46 73.1.5 University ranking . . . . . . . . . . . . . . . . . . . . . . . . . . . . . . . . . . . . . . . . . . . . .85.02 33.2 Lifelong Learning . . . . . . . . . . . . . . . . . . . . . . . . . . . . . . . . . . . . . . . . . . . 70.74 223.2.1 Quality of management schools . . . . . . . . . . . . . . . . . . . . . . . . . . . . . .54.44 473.2.2 Prevalence of training in firms . . . . . . . . . . . . . . . . . . . . . . . . . . . . . . . 100.00 13.2.3 Employee development . . . . . . . . . . . . . . . . . . . . . . . . . . . . . . . . . . . . . . 57.78 323.3 Access to Growth Opportunities . . . . . . . . . . . . . . . . . . . . . . . . . . .38.60 105
Empowerment3.3.1 Delegation of authority . . . . . . . . . . . . . . . . . . . . . . . . . . . . . . . . . . . . . . .52.72 473.3.2 Personal rights . . . . . . . . . . . . . . . . . . . . . . . . . . . . . . . . . . . . . . . . . . . . . . . . . 6.95 128
Collaboration3.3.3 Use of virtual social networks . . . . . . . . . . . . . . . . . . . . . . . . . . . . . . . . . 44.12 1213.3.4 Use of virtual professional networks . . . . . . . . . . . . . . . . . . . . . . . . . . . 0.41 1213.3.5 Collaboration within organisations . . . . . . . . . . . . . . . . . . . . . . . . . . . . 61.09 323.3.6 Collaboration across organisations . . . . . . . . . . . . . . . . . . . . . . . . . . . .66.29 15
4 RETAIN . . . . . . . . . . . . . . . . . . . . . . . . . . . . . . . . . . . . . . . . . . . 54.84 524.1 Sustainability . . . . . . . . . . . . . . . . . . . . . . . . . . . . . . . . . . . . . . . . . . . . . . . 63.96 304.1.1 Pension system . . . . . . . . . . . . . . . . . . . . . . . . . . . . . . . . . . . . . . . . . . . . . . .69.80 394.1.2 Social protection . . . . . . . . . . . . . . . . . . . . . . . . . . . . . . . . . . . . . . . . . . . . . . 59.37 394.1.3 Brain retention . . . . . . . . . . . . . . . . . . . . . . . . . . . . . . . . . . . . . . . . . . . . . . . .62.71 324.2 Lifestyle . . . . . . . . . . . . . . . . . . . . . . . . . . . . . . . . . . . . . . . . . . . . . . . . . . . . 45.72 884.2.1 Environmental performance . . . . . . . . . . . . . . . . . . . . . . . . . . . . . . . . . .38.86 974.2.2 Personal safety . . . . . . . . . . . . . . . . . . . . . . . . . . . . . . . . . . . . . . . . . . . . . . . . 42.16 914.2.3 Physician density . . . . . . . . . . . . . . . . . . . . . . . . . . . . . . . . . . . . . . . . . . . . . .28.75 654.2.4 Sanitation . . . . . . . . . . . . . . . . . . . . . . . . . . . . . . . . . . . . . . . . . . . . . . . . . . . . . 73.14 91
5 VOCATIONAL AND TECHNICAL SKILLS . . . . . . . . . . . . .41.37 735.1 Mid-Level Skills . . . . . . . . . . . . . . . . . . . . . . . . . . . . . . . . . . . . . . . . . . . . . 18.84 1055.1.1 Workforce with secondary education . . . . . . . . . . . . . . . . . . . . . . . . . . .n/a n/a5.1.2 Population with secondary education . . . . . . . . . . . . . . . . . . . . . . . . 17.98 995.1.3 Technicians and associate professionals . . . . . . . . . . . . . . . . . . . . . . . . .n/a n/a5.1.4 Labour productivity per employee . . . . . . . . . . . . . . . . . . . . . . . . . . . . 19.71 685.2 Employability . . . . . . . . . . . . . . . . . . . . . . . . . . . . . . . . . . . . . . . . . . . . . . . 63.90 325.2.1 Ease of finding skilled employees . . . . . . . . . . . . . . . . . . . . . . . . . . . . . 68.12 405.2.2 Relevance of education system to the economy . . . . . . . . . . . . . .63.76 275.2.3 Skills matching with secondary education . . . . . . . . . . . . . . . . . . . .63.58 275.2.4 Skills matching with tertiary education . . . . . . . . . . . . . . . . . . . . . . . . 60.14 54
6 GLOBAL KNOWLEDGE SKILLS . . . . . . . . . . . . . . . . . . . . 44.86 296.1 High-Level Skills . . . . . . . . . . . . . . . . . . . . . . . . . . . . . . . . . . . . . . . . . . . . 32.04 606.1.1 Workforce with tertiary education . . . . . . . . . . . . . . . . . . . . . . . . . . . . . .n/a n/a6.1.2 Population with tertiary education . . . . . . . . . . . . . . . . . . . . . . . . . . . . 12.69 866.1.3 Professionals . . . . . . . . . . . . . . . . . . . . . . . . . . . . . . . . . . . . . . . . . . . . . . . . . . . .n/a n/a6.1.4 Researchers . . . . . . . . . . . . . . . . . . . . . . . . . . . . . . . . . . . . . . . . . . . . . . . . . . .14.86 456.1.5 Senior officials and managers . . . . . . . . . . . . . . . . . . . . . . . . . . . . . . . . . . .n/a n/a6.1.6 Availability of scientists and engineers . . . . . . . . . . . . . . . . . . . . . . . .68.58 276.2 Talent Impact . . . . . . . . . . . . . . . . . . . . . . . . . . . . . . . . . . . . . . . . . . . . . . . 57.69 156.2.1 Innovation output . . . . . . . . . . . . . . . . . . . . . . . . . . . . . . . . . . . . . . . . . . . . 81.26 56.2.2 High-value exports . . . . . . . . . . . . . . . . . . . . . . . . . . . . . . . . . . . . . . . . . . . . 70.91 76.2.3 New product entrepreneurial activity . . . . . . . . . . . . . . . . . . . . . . . . .66.36 146.2.4 New business density . . . . . . . . . . . . . . . . . . . . . . . . . . . . . . . . . . . . . . . . . . .n/a n/a6.2.5 Scientific journal articles . . . . . . . . . . . . . . . . . . . . . . . . . . . . . . . . . . . . . .12.22 50
l China l Income group average
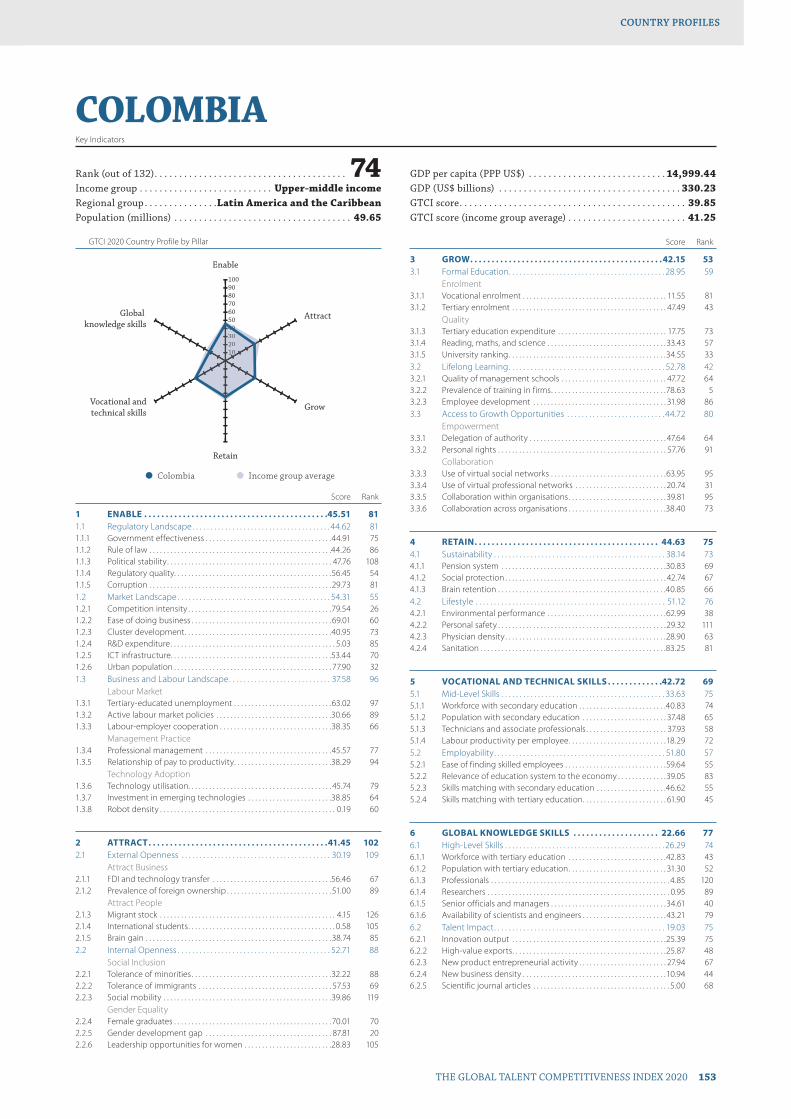
GTCI 2020 Country Profile by Pillar
THE GLOBAL TALENT COMPETITIVENESS INDEX 2020 153
COUNTRY PROFILESCOUNTRY PROFILES
102030405060708090100
Global knowledge skills
Vocational andtechnical skills
Retain
Grow
Attract
Enable
1020304040
COLOMBIAKey Indicators
Rank (out of 132) . . . . . . . . . . . . . . . . . . . . . . . . . . . . . . . . . . . . . . . 74Income group . . . . . . . . . . . . . . . . . . . . . . . . . . . Upper-middle incomeRegional group . . . . . . . . . . . . . . .Latin America and the CaribbeanPopulation (millions) . . . . . . . . . . . . . . . . . . . . . . . . . . . . . . . . . . . . 49.65
GDP per capita (PPP US$) . . . . . . . . . . . . . . . . . . . . . . . . . . . . 14,999.44GDP (US$ billions) . . . . . . . . . . . . . . . . . . . . . . . . . . . . . . . . . . . . . 330.23GTCI score . . . . . . . . . . . . . . . . . . . . . . . . . . . . . . . . . . . . . . . . . . . . . . 39.85GTCI score (income group average) . . . . . . . . . . . . . . . . . . . . . . . . 41.25
Score Rank
1 ENABLE . . . . . . . . . . . . . . . . . . . . . . . . . . . . . . . . . . . . . . . . . . .45.51 811.1 Regulatory Landscape . . . . . . . . . . . . . . . . . . . . . . . . . . . . . . . . . . . . . . 44.62 811.1.1 Government effectiveness . . . . . . . . . . . . . . . . . . . . . . . . . . . . . . . . . . . .44.91 751.1.2 Rule of law . . . . . . . . . . . . . . . . . . . . . . . . . . . . . . . . . . . . . . . . . . . . . . . . . . . .44.26 861.1.3 Political stability . . . . . . . . . . . . . . . . . . . . . . . . . . . . . . . . . . . . . . . . . . . . . . . 47.76 1081.1.4 Regulatory quality. . . . . . . . . . . . . . . . . . . . . . . . . . . . . . . . . . . . . . . . . . . . .56.45 541.1.5 Corruption . . . . . . . . . . . . . . . . . . . . . . . . . . . . . . . . . . . . . . . . . . . . . . . . . . . .29.73 811.2 Market Landscape . . . . . . . . . . . . . . . . . . . . . . . . . . . . . . . . . . . . . . . . . . 54.31 551.2.1 Competition intensity . . . . . . . . . . . . . . . . . . . . . . . . . . . . . . . . . . . . . . . . .79.54 261.2.2 Ease of doing business . . . . . . . . . . . . . . . . . . . . . . . . . . . . . . . . . . . . . . . . 69.01 601.2.3 Cluster development . . . . . . . . . . . . . . . . . . . . . . . . . . . . . . . . . . . . . . . . . .40.95 731.2.4 R&D expenditure . . . . . . . . . . . . . . . . . . . . . . . . . . . . . . . . . . . . . . . . . . . . . . . 5.03 851.2.5 ICT infrastructure. . . . . . . . . . . . . . . . . . . . . . . . . . . . . . . . . . . . . . . . . . . . . .53.44 701.2.6 Urban population . . . . . . . . . . . . . . . . . . . . . . . . . . . . . . . . . . . . . . . . . . . . . 77.90 321.3 Business and Labour Landscape . . . . . . . . . . . . . . . . . . . . . . . . . . . . 37.58 96
Labour Market1.3.1 Tertiary-educated unemployment . . . . . . . . . . . . . . . . . . . . . . . . . . . .63.02 971.3.2 Active labour market policies . . . . . . . . . . . . . . . . . . . . . . . . . . . . . . . . .30.66 891.3.3 Labour-employer cooperation . . . . . . . . . . . . . . . . . . . . . . . . . . . . . . . .38.35 66
Management Practice1.3.4 Professional management . . . . . . . . . . . . . . . . . . . . . . . . . . . . . . . . . . . .45.57 771.3.5 Relationship of pay to productivity . . . . . . . . . . . . . . . . . . . . . . . . . . . .38.29 94
Technology Adoption1.3.6 Technology utilisation. . . . . . . . . . . . . . . . . . . . . . . . . . . . . . . . . . . . . . . . . 45.74 791.3.7 Investment in emerging technologies . . . . . . . . . . . . . . . . . . . . . . . .38.85 641.3.8 Robot density . . . . . . . . . . . . . . . . . . . . . . . . . . . . . . . . . . . . . . . . . . . . . . . . . . 0.19 60
2 ATTRACT . . . . . . . . . . . . . . . . . . . . . . . . . . . . . . . . . . . . . . . . . .41.45 1022.1 External Openness . . . . . . . . . . . . . . . . . . . . . . . . . . . . . . . . . . . . . . . . . 30.19 109
Attract Business2.1.1 FDI and technology transfer . . . . . . . . . . . . . . . . . . . . . . . . . . . . . . . . . .56.46 672.1.2 Prevalence of foreign ownership . . . . . . . . . . . . . . . . . . . . . . . . . . . . . . 51.00 89
Attract People2.1.3 Migrant stock . . . . . . . . . . . . . . . . . . . . . . . . . . . . . . . . . . . . . . . . . . . . . . . . . . 4.15 1262.1.4 International students . . . . . . . . . . . . . . . . . . . . . . . . . . . . . . . . . . . . . . . . . . 0.58 1052.1.5 Brain gain . . . . . . . . . . . . . . . . . . . . . . . . . . . . . . . . . . . . . . . . . . . . . . . . . . . . .38.74 852.2 Internal Openness . . . . . . . . . . . . . . . . . . . . . . . . . . . . . . . . . . . . . . . . . . 52.71 88
Social Inclusion2.2.1 Tolerance of minorities . . . . . . . . . . . . . . . . . . . . . . . . . . . . . . . . . . . . . . . .32.22 882.2.2 Tolerance of immigrants . . . . . . . . . . . . . . . . . . . . . . . . . . . . . . . . . . . . . . 57.53 692.2.3 Social mobility . . . . . . . . . . . . . . . . . . . . . . . . . . . . . . . . . . . . . . . . . . . . . . . .39.86 119
Gender Equality2.2.4 Female graduates . . . . . . . . . . . . . . . . . . . . . . . . . . . . . . . . . . . . . . . . . . . . .70.01 702.2.5 Gender development gap . . . . . . . . . . . . . . . . . . . . . . . . . . . . . . . . . . . . 87.81 202.2.6 Leadership opportunities for women . . . . . . . . . . . . . . . . . . . . . . . . .28.83 105
Score Rank
3 GROW . . . . . . . . . . . . . . . . . . . . . . . . . . . . . . . . . . . . . . . . . . . . .42.15 533.1 Formal Education . . . . . . . . . . . . . . . . . . . . . . . . . . . . . . . . . . . . . . . . . . . 28.95 59
Enrolment3.1.1 Vocational enrolment . . . . . . . . . . . . . . . . . . . . . . . . . . . . . . . . . . . . . . . . . 11.55 813.1.2 Tertiary enrolment . . . . . . . . . . . . . . . . . . . . . . . . . . . . . . . . . . . . . . . . . . . . 47.49 43
Quality3.1.3 Tertiary education expenditure . . . . . . . . . . . . . . . . . . . . . . . . . . . . . . . 17.75 733.1.4 Reading, maths, and science . . . . . . . . . . . . . . . . . . . . . . . . . . . . . . . . . .33.43 573.1.5 University ranking . . . . . . . . . . . . . . . . . . . . . . . . . . . . . . . . . . . . . . . . . . . . .34.55 333.2 Lifelong Learning . . . . . . . . . . . . . . . . . . . . . . . . . . . . . . . . . . . . . . . . . . . 52.78 423.2.1 Quality of management schools . . . . . . . . . . . . . . . . . . . . . . . . . . . . . . 47.72 643.2.2 Prevalence of training in firms . . . . . . . . . . . . . . . . . . . . . . . . . . . . . . . . .78.63 53.2.3 Employee development . . . . . . . . . . . . . . . . . . . . . . . . . . . . . . . . . . . . . . 31.98 863.3 Access to Growth Opportunities . . . . . . . . . . . . . . . . . . . . . . . . . . . 44.72 80
Empowerment3.3.1 Delegation of authority . . . . . . . . . . . . . . . . . . . . . . . . . . . . . . . . . . . . . . . 47.64 643.3.2 Personal rights . . . . . . . . . . . . . . . . . . . . . . . . . . . . . . . . . . . . . . . . . . . . . . . . 57.76 91
Collaboration3.3.3 Use of virtual social networks . . . . . . . . . . . . . . . . . . . . . . . . . . . . . . . . .63.95 953.3.4 Use of virtual professional networks . . . . . . . . . . . . . . . . . . . . . . . . . . 20.74 313.3.5 Collaboration within organisations . . . . . . . . . . . . . . . . . . . . . . . . . . . . 39.81 953.3.6 Collaboration across organisations . . . . . . . . . . . . . . . . . . . . . . . . . . . .38.40 73
4 RETAIN . . . . . . . . . . . . . . . . . . . . . . . . . . . . . . . . . . . . . . . . . . . 44.63 754.1 Sustainability . . . . . . . . . . . . . . . . . . . . . . . . . . . . . . . . . . . . . . . . . . . . . . . 38.14 734.1.1 Pension system . . . . . . . . . . . . . . . . . . . . . . . . . . . . . . . . . . . . . . . . . . . . . . .30.83 694.1.2 Social protection . . . . . . . . . . . . . . . . . . . . . . . . . . . . . . . . . . . . . . . . . . . . . . 42.74 674.1.3 Brain retention . . . . . . . . . . . . . . . . . . . . . . . . . . . . . . . . . . . . . . . . . . . . . . . .40.85 664.2 Lifestyle . . . . . . . . . . . . . . . . . . . . . . . . . . . . . . . . . . . . . . . . . . . . . . . . . . . . 51.12 764.2.1 Environmental performance . . . . . . . . . . . . . . . . . . . . . . . . . . . . . . . . . .62.99 384.2.2 Personal safety . . . . . . . . . . . . . . . . . . . . . . . . . . . . . . . . . . . . . . . . . . . . . . . .29.32 1114.2.3 Physician density . . . . . . . . . . . . . . . . . . . . . . . . . . . . . . . . . . . . . . . . . . . . . .28.90 634.2.4 Sanitation . . . . . . . . . . . . . . . . . . . . . . . . . . . . . . . . . . . . . . . . . . . . . . . . . . . . .83.25 81
5 VOCATIONAL AND TECHNICAL SKILLS . . . . . . . . . . . . .42.72 695.1 Mid-Level Skills . . . . . . . . . . . . . . . . . . . . . . . . . . . . . . . . . . . . . . . . . . . . . 33.63 755.1.1 Workforce with secondary education . . . . . . . . . . . . . . . . . . . . . . . . .40.83 745.1.2 Population with secondary education . . . . . . . . . . . . . . . . . . . . . . . . 37.48 655.1.3 Technicians and associate professionals . . . . . . . . . . . . . . . . . . . . . . . 37.93 585.1.4 Labour productivity per employee . . . . . . . . . . . . . . . . . . . . . . . . . . . .18.29 725.2 Employability . . . . . . . . . . . . . . . . . . . . . . . . . . . . . . . . . . . . . . . . . . . . . . . 51.80 575.2.1 Ease of finding skilled employees . . . . . . . . . . . . . . . . . . . . . . . . . . . . .59.64 555.2.2 Relevance of education system to the economy . . . . . . . . . . . . . .39.05 835.2.3 Skills matching with secondary education . . . . . . . . . . . . . . . . . . . .46.62 555.2.4 Skills matching with tertiary education . . . . . . . . . . . . . . . . . . . . . . . . 61.90 45
6 GLOBAL KNOWLEDGE SKILLS . . . . . . . . . . . . . . . . . . . . 22.66 776.1 High-Level Skills . . . . . . . . . . . . . . . . . . . . . . . . . . . . . . . . . . . . . . . . . . . . 26.29 746.1.1 Workforce with tertiary education . . . . . . . . . . . . . . . . . . . . . . . . . . . .42.83 436.1.2 Population with tertiary education . . . . . . . . . . . . . . . . . . . . . . . . . . . . 31.30 526.1.3 Professionals . . . . . . . . . . . . . . . . . . . . . . . . . . . . . . . . . . . . . . . . . . . . . . . . . . . 4.85 1206.1.4 Researchers . . . . . . . . . . . . . . . . . . . . . . . . . . . . . . . . . . . . . . . . . . . . . . . . . . . . 0.95 896.1.5 Senior officials and managers . . . . . . . . . . . . . . . . . . . . . . . . . . . . . . . . .34.61 406.1.6 Availability of scientists and engineers . . . . . . . . . . . . . . . . . . . . . . . .43.21 796.2 Talent Impact . . . . . . . . . . . . . . . . . . . . . . . . . . . . . . . . . . . . . . . . . . . . . . . 19.03 756.2.1 Innovation output . . . . . . . . . . . . . . . . . . . . . . . . . . . . . . . . . . . . . . . . . . . .25.39 756.2.2 High-value exports . . . . . . . . . . . . . . . . . . . . . . . . . . . . . . . . . . . . . . . . . . . .25.87 486.2.3 New product entrepreneurial activity . . . . . . . . . . . . . . . . . . . . . . . . . 27.94 676.2.4 New business density . . . . . . . . . . . . . . . . . . . . . . . . . . . . . . . . . . . . . . . . .10.94 446.2.5 Scientific journal articles . . . . . . . . . . . . . . . . . . . . . . . . . . . . . . . . . . . . . . . 5.00 68
l Colombia l Income group average
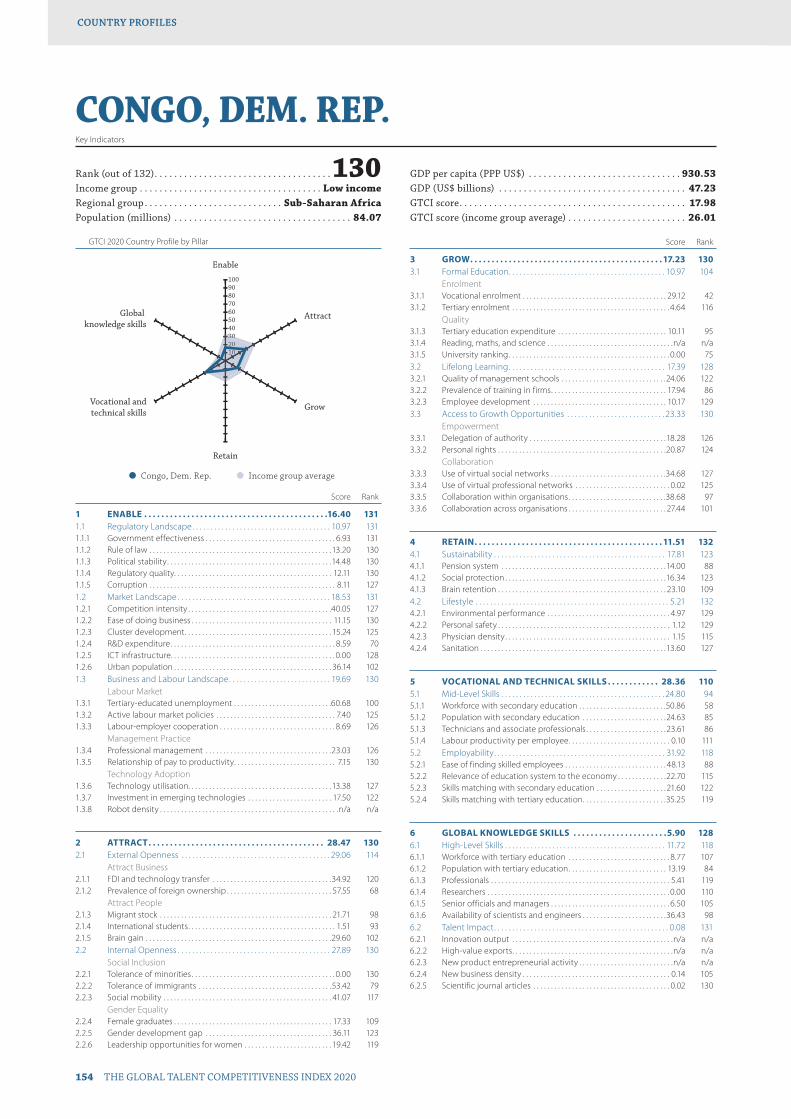
GTCI 2020 Country Profile by Pillar
154 THE GLOBAL TALENT COMPETITIVENESS INDEX 2020
COUNTRY PROFILESCOUNTRY PROFILES
102030405060708090100
Global knowledge skills
Vocational andtechnical skills
Retain
Grow
Attract
Enable
1020330
CONGO, DEM. REP.Key Indicators
Rank (out of 132) . . . . . . . . . . . . . . . . . . . . . . . . . . . . . . . . . . . .130Income group . . . . . . . . . . . . . . . . . . . . . . . . . . . . . . . . . . . . . Low incomeRegional group . . . . . . . . . . . . . . . . . . . . . . . . . . . . Sub-Saharan AfricaPopulation (millions) . . . . . . . . . . . . . . . . . . . . . . . . . . . . . . . . . . . . 84.07
GDP per capita (PPP US$) . . . . . . . . . . . . . . . . . . . . . . . . . . . . . . . 930.53GDP (US$ billions) . . . . . . . . . . . . . . . . . . . . . . . . . . . . . . . . . . . . . . 47.23GTCI score . . . . . . . . . . . . . . . . . . . . . . . . . . . . . . . . . . . . . . . . . . . . . . 17.98GTCI score (income group average) . . . . . . . . . . . . . . . . . . . . . . . . 26.01
Score Rank
1 ENABLE . . . . . . . . . . . . . . . . . . . . . . . . . . . . . . . . . . . . . . . . . . .16.40 1311.1 Regulatory Landscape . . . . . . . . . . . . . . . . . . . . . . . . . . . . . . . . . . . . . . 10.97 1311.1.1 Government effectiveness . . . . . . . . . . . . . . . . . . . . . . . . . . . . . . . . . . . . . 6.93 1311.1.2 Rule of law . . . . . . . . . . . . . . . . . . . . . . . . . . . . . . . . . . . . . . . . . . . . . . . . . . . .13.20 1301.1.3 Political stability . . . . . . . . . . . . . . . . . . . . . . . . . . . . . . . . . . . . . . . . . . . . . . .14.48 1301.1.4 Regulatory quality. . . . . . . . . . . . . . . . . . . . . . . . . . . . . . . . . . . . . . . . . . . . . 12.11 1301.1.5 Corruption . . . . . . . . . . . . . . . . . . . . . . . . . . . . . . . . . . . . . . . . . . . . . . . . . . . . . 8.11 1271.2 Market Landscape . . . . . . . . . . . . . . . . . . . . . . . . . . . . . . . . . . . . . . . . . . 18.53 1311.2.1 Competition intensity . . . . . . . . . . . . . . . . . . . . . . . . . . . . . . . . . . . . . . . . .40.05 1271.2.2 Ease of doing business . . . . . . . . . . . . . . . . . . . . . . . . . . . . . . . . . . . . . . . . 11.15 1301.2.3 Cluster development . . . . . . . . . . . . . . . . . . . . . . . . . . . . . . . . . . . . . . . . . . 15.24 1251.2.4 R&D expenditure . . . . . . . . . . . . . . . . . . . . . . . . . . . . . . . . . . . . . . . . . . . . . . . 8.59 701.2.5 ICT infrastructure. . . . . . . . . . . . . . . . . . . . . . . . . . . . . . . . . . . . . . . . . . . . . . . 0.00 1281.2.6 Urban population . . . . . . . . . . . . . . . . . . . . . . . . . . . . . . . . . . . . . . . . . . . . . 36.14 1021.3 Business and Labour Landscape . . . . . . . . . . . . . . . . . . . . . . . . . . . . 19.69 130
Labour Market1.3.1 Tertiary-educated unemployment . . . . . . . . . . . . . . . . . . . . . . . . . . . .60.68 1001.3.2 Active labour market policies . . . . . . . . . . . . . . . . . . . . . . . . . . . . . . . . . . 7.40 1251.3.3 Labour-employer cooperation . . . . . . . . . . . . . . . . . . . . . . . . . . . . . . . . . 8.69 126
Management Practice1.3.4 Professional management . . . . . . . . . . . . . . . . . . . . . . . . . . . . . . . . . . . .23.03 1261.3.5 Relationship of pay to productivity . . . . . . . . . . . . . . . . . . . . . . . . . . . . . 7.15 130
Technology Adoption1.3.6 Technology utilisation. . . . . . . . . . . . . . . . . . . . . . . . . . . . . . . . . . . . . . . . .13.38 1271.3.7 Investment in emerging technologies . . . . . . . . . . . . . . . . . . . . . . . . 17.50 1221.3.8 Robot density . . . . . . . . . . . . . . . . . . . . . . . . . . . . . . . . . . . . . . . . . . . . . . . . . . .n/a n/a
2 ATTRACT . . . . . . . . . . . . . . . . . . . . . . . . . . . . . . . . . . . . . . . . . 28.47 1302.1 External Openness . . . . . . . . . . . . . . . . . . . . . . . . . . . . . . . . . . . . . . . . . 29.06 114
Attract Business2.1.1 FDI and technology transfer . . . . . . . . . . . . . . . . . . . . . . . . . . . . . . . . . .34.92 1202.1.2 Prevalence of foreign ownership . . . . . . . . . . . . . . . . . . . . . . . . . . . . . . 57.55 68
Attract People2.1.3 Migrant stock . . . . . . . . . . . . . . . . . . . . . . . . . . . . . . . . . . . . . . . . . . . . . . . . . 21.71 982.1.4 International students . . . . . . . . . . . . . . . . . . . . . . . . . . . . . . . . . . . . . . . . . . 1.51 932.1.5 Brain gain . . . . . . . . . . . . . . . . . . . . . . . . . . . . . . . . . . . . . . . . . . . . . . . . . . . . .29.60 1022.2 Internal Openness . . . . . . . . . . . . . . . . . . . . . . . . . . . . . . . . . . . . . . . . . . 27.89 130
Social Inclusion2.2.1 Tolerance of minorities . . . . . . . . . . . . . . . . . . . . . . . . . . . . . . . . . . . . . . . . . 0.00 1302.2.2 Tolerance of immigrants . . . . . . . . . . . . . . . . . . . . . . . . . . . . . . . . . . . . . .53.42 792.2.3 Social mobility . . . . . . . . . . . . . . . . . . . . . . . . . . . . . . . . . . . . . . . . . . . . . . . . 41.07 117
Gender Equality2.2.4 Female graduates . . . . . . . . . . . . . . . . . . . . . . . . . . . . . . . . . . . . . . . . . . . . . 17.33 1092.2.5 Gender development gap . . . . . . . . . . . . . . . . . . . . . . . . . . . . . . . . . . . . 36.11 1232.2.6 Leadership opportunities for women . . . . . . . . . . . . . . . . . . . . . . . . . 19.42 119
Score Rank
3 GROW . . . . . . . . . . . . . . . . . . . . . . . . . . . . . . . . . . . . . . . . . . . . . 17.23 1303.1 Formal Education . . . . . . . . . . . . . . . . . . . . . . . . . . . . . . . . . . . . . . . . . . . 10.97 104
Enrolment3.1.1 Vocational enrolment . . . . . . . . . . . . . . . . . . . . . . . . . . . . . . . . . . . . . . . . . 29.12 423.1.2 Tertiary enrolment . . . . . . . . . . . . . . . . . . . . . . . . . . . . . . . . . . . . . . . . . . . . . 4.64 116
Quality3.1.3 Tertiary education expenditure . . . . . . . . . . . . . . . . . . . . . . . . . . . . . . . 10.11 953.1.4 Reading, maths, and science . . . . . . . . . . . . . . . . . . . . . . . . . . . . . . . . . . . .n/a n/a3.1.5 University ranking . . . . . . . . . . . . . . . . . . . . . . . . . . . . . . . . . . . . . . . . . . . . . . 0.00 753.2 Lifelong Learning . . . . . . . . . . . . . . . . . . . . . . . . . . . . . . . . . . . . . . . . . . . 17.39 1283.2.1 Quality of management schools . . . . . . . . . . . . . . . . . . . . . . . . . . . . . .24.06 1223.2.2 Prevalence of training in firms . . . . . . . . . . . . . . . . . . . . . . . . . . . . . . . . . 17.94 863.2.3 Employee development . . . . . . . . . . . . . . . . . . . . . . . . . . . . . . . . . . . . . . 10.17 1293.3 Access to Growth Opportunities . . . . . . . . . . . . . . . . . . . . . . . . . . . 23.33 130
Empowerment3.3.1 Delegation of authority . . . . . . . . . . . . . . . . . . . . . . . . . . . . . . . . . . . . . . .18.28 1263.3.2 Personal rights . . . . . . . . . . . . . . . . . . . . . . . . . . . . . . . . . . . . . . . . . . . . . . . .20.87 124
Collaboration3.3.3 Use of virtual social networks . . . . . . . . . . . . . . . . . . . . . . . . . . . . . . . . .34.68 1273.3.4 Use of virtual professional networks . . . . . . . . . . . . . . . . . . . . . . . . . . . 0.02 1253.3.5 Collaboration within organisations . . . . . . . . . . . . . . . . . . . . . . . . . . . .38.68 973.3.6 Collaboration across organisations . . . . . . . . . . . . . . . . . . . . . . . . . . . . 27.44 101
4 RETAIN . . . . . . . . . . . . . . . . . . . . . . . . . . . . . . . . . . . . . . . . . . . . 11.51 1324.1 Sustainability . . . . . . . . . . . . . . . . . . . . . . . . . . . . . . . . . . . . . . . . . . . . . . . 17.81 1234.1.1 Pension system . . . . . . . . . . . . . . . . . . . . . . . . . . . . . . . . . . . . . . . . . . . . . . .14.00 884.1.2 Social protection . . . . . . . . . . . . . . . . . . . . . . . . . . . . . . . . . . . . . . . . . . . . . .16.34 1234.1.3 Brain retention . . . . . . . . . . . . . . . . . . . . . . . . . . . . . . . . . . . . . . . . . . . . . . . . 23.10 1094.2 Lifestyle . . . . . . . . . . . . . . . . . . . . . . . . . . . . . . . . . . . . . . . . . . . . . . . . . . . . . 5.21 1324.2.1 Environmental performance . . . . . . . . . . . . . . . . . . . . . . . . . . . . . . . . . . . 4.97 1294.2.2 Personal safety . . . . . . . . . . . . . . . . . . . . . . . . . . . . . . . . . . . . . . . . . . . . . . . . . 1.12 1294.2.3 Physician density . . . . . . . . . . . . . . . . . . . . . . . . . . . . . . . . . . . . . . . . . . . . . . . 1.15 1154.2.4 Sanitation . . . . . . . . . . . . . . . . . . . . . . . . . . . . . . . . . . . . . . . . . . . . . . . . . . . . .13.60 127
5 VOCATIONAL AND TECHNICAL SKILLS . . . . . . . . . . . . 28.36 1105.1 Mid-Level Skills . . . . . . . . . . . . . . . . . . . . . . . . . . . . . . . . . . . . . . . . . . . . . 24.80 945.1.1 Workforce with secondary education . . . . . . . . . . . . . . . . . . . . . . . . .50.86 585.1.2 Population with secondary education . . . . . . . . . . . . . . . . . . . . . . . .24.63 855.1.3 Technicians and associate professionals . . . . . . . . . . . . . . . . . . . . . . .23.61 865.1.4 Labour productivity per employee . . . . . . . . . . . . . . . . . . . . . . . . . . . . . 0.10 1115.2 Employability . . . . . . . . . . . . . . . . . . . . . . . . . . . . . . . . . . . . . . . . . . . . . . . 31.92 1185.2.1 Ease of finding skilled employees . . . . . . . . . . . . . . . . . . . . . . . . . . . . . 48.13 885.2.2 Relevance of education system to the economy . . . . . . . . . . . . . .22.70 1155.2.3 Skills matching with secondary education . . . . . . . . . . . . . . . . . . . . 21.60 1225.2.4 Skills matching with tertiary education . . . . . . . . . . . . . . . . . . . . . . . .35.25 119
6 GLOBAL KNOWLEDGE SKILLS . . . . . . . . . . . . . . . . . . . . . .5.90 1286.1 High-Level Skills . . . . . . . . . . . . . . . . . . . . . . . . . . . . . . . . . . . . . . . . . . . . 11.72 1186.1.1 Workforce with tertiary education . . . . . . . . . . . . . . . . . . . . . . . . . . . . . 8.77 1076.1.2 Population with tertiary education . . . . . . . . . . . . . . . . . . . . . . . . . . . . 13.19 846.1.3 Professionals . . . . . . . . . . . . . . . . . . . . . . . . . . . . . . . . . . . . . . . . . . . . . . . . . . . 5.41 1196.1.4 Researchers . . . . . . . . . . . . . . . . . . . . . . . . . . . . . . . . . . . . . . . . . . . . . . . . . . . . 0.00 1106.1.5 Senior officials and managers . . . . . . . . . . . . . . . . . . . . . . . . . . . . . . . . . . 6.50 1056.1.6 Availability of scientists and engineers . . . . . . . . . . . . . . . . . . . . . . . .36.43 986.2 Talent Impact . . . . . . . . . . . . . . . . . . . . . . . . . . . . . . . . . . . . . . . . . . . . . . . . 0.08 1316.2.1 Innovation output . . . . . . . . . . . . . . . . . . . . . . . . . . . . . . . . . . . . . . . . . . . . . .n/a n/a6.2.2 High-value exports . . . . . . . . . . . . . . . . . . . . . . . . . . . . . . . . . . . . . . . . . . . . . .n/a n/a6.2.3 New product entrepreneurial activity . . . . . . . . . . . . . . . . . . . . . . . . . . .n/a n/a6.2.4 New business density . . . . . . . . . . . . . . . . . . . . . . . . . . . . . . . . . . . . . . . . . . 0.14 1056.2.5 Scientific journal articles . . . . . . . . . . . . . . . . . . . . . . . . . . . . . . . . . . . . . . . 0.02 130
l Congo, Dem. Rep. l Income group average
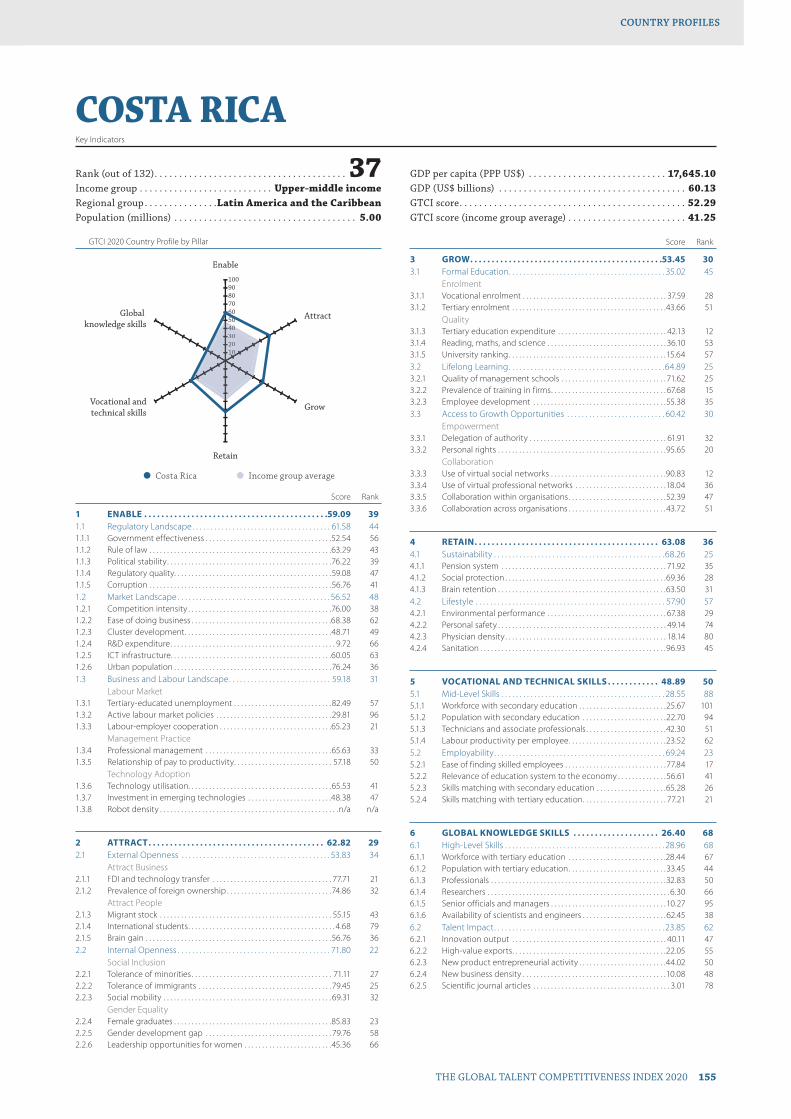
GTCI 2020 Country Profile by Pillar
THE GLOBAL TALENT COMPETITIVENESS INDEX 2020 155
COUNTRY PROFILESCOUNTRY PROFILES
102030405060708090100
Global knowledge skills
Vocational andtechnical skills
Retain
Grow
Attract
Enable
1020304040
COSTA RICAKey Indicators
Rank (out of 132) . . . . . . . . . . . . . . . . . . . . . . . . . . . . . . . . . . . . . . . 37Income group . . . . . . . . . . . . . . . . . . . . . . . . . . . Upper-middle incomeRegional group . . . . . . . . . . . . . . .Latin America and the CaribbeanPopulation (millions) . . . . . . . . . . . . . . . . . . . . . . . . . . . . . . . . . . . . . 5.00
GDP per capita (PPP US$) . . . . . . . . . . . . . . . . . . . . . . . . . . . . 17,645.10GDP (US$ billions) . . . . . . . . . . . . . . . . . . . . . . . . . . . . . . . . . . . . . . 60.13GTCI score . . . . . . . . . . . . . . . . . . . . . . . . . . . . . . . . . . . . . . . . . . . . . . 52.29GTCI score (income group average) . . . . . . . . . . . . . . . . . . . . . . . . 41.25
Score Rank
1 ENABLE . . . . . . . . . . . . . . . . . . . . . . . . . . . . . . . . . . . . . . . . . . .59.09 391.1 Regulatory Landscape . . . . . . . . . . . . . . . . . . . . . . . . . . . . . . . . . . . . . . 61.58 441.1.1 Government effectiveness . . . . . . . . . . . . . . . . . . . . . . . . . . . . . . . . . . . .52.54 561.1.2 Rule of law . . . . . . . . . . . . . . . . . . . . . . . . . . . . . . . . . . . . . . . . . . . . . . . . . . . .63.29 431.1.3 Political stability . . . . . . . . . . . . . . . . . . . . . . . . . . . . . . . . . . . . . . . . . . . . . . .76.22 391.1.4 Regulatory quality. . . . . . . . . . . . . . . . . . . . . . . . . . . . . . . . . . . . . . . . . . . . .59.08 471.1.5 Corruption . . . . . . . . . . . . . . . . . . . . . . . . . . . . . . . . . . . . . . . . . . . . . . . . . . . .56.76 411.2 Market Landscape . . . . . . . . . . . . . . . . . . . . . . . . . . . . . . . . . . . . . . . . . . 56.52 481.2.1 Competition intensity . . . . . . . . . . . . . . . . . . . . . . . . . . . . . . . . . . . . . . . . .76.00 381.2.2 Ease of doing business . . . . . . . . . . . . . . . . . . . . . . . . . . . . . . . . . . . . . . . .68.38 621.2.3 Cluster development . . . . . . . . . . . . . . . . . . . . . . . . . . . . . . . . . . . . . . . . . .48.71 491.2.4 R&D expenditure . . . . . . . . . . . . . . . . . . . . . . . . . . . . . . . . . . . . . . . . . . . . . . . 9.72 661.2.5 ICT infrastructure. . . . . . . . . . . . . . . . . . . . . . . . . . . . . . . . . . . . . . . . . . . . . .60.05 631.2.6 Urban population . . . . . . . . . . . . . . . . . . . . . . . . . . . . . . . . . . . . . . . . . . . . .76.24 361.3 Business and Labour Landscape . . . . . . . . . . . . . . . . . . . . . . . . . . . . 59.18 31
Labour Market1.3.1 Tertiary-educated unemployment . . . . . . . . . . . . . . . . . . . . . . . . . . . .82.49 571.3.2 Active labour market policies . . . . . . . . . . . . . . . . . . . . . . . . . . . . . . . . .29.81 961.3.3 Labour-employer cooperation . . . . . . . . . . . . . . . . . . . . . . . . . . . . . . . .65.23 21
Management Practice1.3.4 Professional management . . . . . . . . . . . . . . . . . . . . . . . . . . . . . . . . . . . .65.63 331.3.5 Relationship of pay to productivity . . . . . . . . . . . . . . . . . . . . . . . . . . . . 57.18 50
Technology Adoption1.3.6 Technology utilisation. . . . . . . . . . . . . . . . . . . . . . . . . . . . . . . . . . . . . . . . .65.53 411.3.7 Investment in emerging technologies . . . . . . . . . . . . . . . . . . . . . . . .48.38 471.3.8 Robot density . . . . . . . . . . . . . . . . . . . . . . . . . . . . . . . . . . . . . . . . . . . . . . . . . . .n/a n/a
2 ATTRACT . . . . . . . . . . . . . . . . . . . . . . . . . . . . . . . . . . . . . . . . . 62.82 292.1 External Openness . . . . . . . . . . . . . . . . . . . . . . . . . . . . . . . . . . . . . . . . . 53.83 34
Attract Business2.1.1 FDI and technology transfer . . . . . . . . . . . . . . . . . . . . . . . . . . . . . . . . . . 77.71 212.1.2 Prevalence of foreign ownership . . . . . . . . . . . . . . . . . . . . . . . . . . . . . .74.86 32
Attract People2.1.3 Migrant stock . . . . . . . . . . . . . . . . . . . . . . . . . . . . . . . . . . . . . . . . . . . . . . . . . 55.15 432.1.4 International students . . . . . . . . . . . . . . . . . . . . . . . . . . . . . . . . . . . . . . . . . . 4.68 792.1.5 Brain gain . . . . . . . . . . . . . . . . . . . . . . . . . . . . . . . . . . . . . . . . . . . . . . . . . . . . .56.76 362.2 Internal Openness . . . . . . . . . . . . . . . . . . . . . . . . . . . . . . . . . . . . . . . . . . 71.80 22
Social Inclusion2.2.1 Tolerance of minorities . . . . . . . . . . . . . . . . . . . . . . . . . . . . . . . . . . . . . . . . 71.11 272.2.2 Tolerance of immigrants . . . . . . . . . . . . . . . . . . . . . . . . . . . . . . . . . . . . . . 79.45 252.2.3 Social mobility . . . . . . . . . . . . . . . . . . . . . . . . . . . . . . . . . . . . . . . . . . . . . . . . 69.31 32
Gender Equality2.2.4 Female graduates . . . . . . . . . . . . . . . . . . . . . . . . . . . . . . . . . . . . . . . . . . . . .85.83 232.2.5 Gender development gap . . . . . . . . . . . . . . . . . . . . . . . . . . . . . . . . . . . . 79.76 582.2.6 Leadership opportunities for women . . . . . . . . . . . . . . . . . . . . . . . . .45.36 66
Score Rank
3 GROW . . . . . . . . . . . . . . . . . . . . . . . . . . . . . . . . . . . . . . . . . . . . .53.45 303.1 Formal Education . . . . . . . . . . . . . . . . . . . . . . . . . . . . . . . . . . . . . . . . . . . 35.02 45
Enrolment3.1.1 Vocational enrolment . . . . . . . . . . . . . . . . . . . . . . . . . . . . . . . . . . . . . . . . . 37.59 283.1.2 Tertiary enrolment . . . . . . . . . . . . . . . . . . . . . . . . . . . . . . . . . . . . . . . . . . . .43.66 51
Quality3.1.3 Tertiary education expenditure . . . . . . . . . . . . . . . . . . . . . . . . . . . . . . . 42.13 123.1.4 Reading, maths, and science . . . . . . . . . . . . . . . . . . . . . . . . . . . . . . . . . . 36.10 533.1.5 University ranking . . . . . . . . . . . . . . . . . . . . . . . . . . . . . . . . . . . . . . . . . . . . .15.64 573.2 Lifelong Learning . . . . . . . . . . . . . . . . . . . . . . . . . . . . . . . . . . . . . . . . . . .64.89 253.2.1 Quality of management schools . . . . . . . . . . . . . . . . . . . . . . . . . . . . . . 71.62 253.2.2 Prevalence of training in firms . . . . . . . . . . . . . . . . . . . . . . . . . . . . . . . . . 67.68 153.2.3 Employee development . . . . . . . . . . . . . . . . . . . . . . . . . . . . . . . . . . . . . .55.38 353.3 Access to Growth Opportunities . . . . . . . . . . . . . . . . . . . . . . . . . . . 60.42 30
Empowerment3.3.1 Delegation of authority . . . . . . . . . . . . . . . . . . . . . . . . . . . . . . . . . . . . . . . 61.91 323.3.2 Personal rights . . . . . . . . . . . . . . . . . . . . . . . . . . . . . . . . . . . . . . . . . . . . . . . .95.65 20
Collaboration3.3.3 Use of virtual social networks . . . . . . . . . . . . . . . . . . . . . . . . . . . . . . . . .90.83 123.3.4 Use of virtual professional networks . . . . . . . . . . . . . . . . . . . . . . . . . .18.04 363.3.5 Collaboration within organisations . . . . . . . . . . . . . . . . . . . . . . . . . . . .52.39 473.3.6 Collaboration across organisations . . . . . . . . . . . . . . . . . . . . . . . . . . . .43.72 51
4 RETAIN . . . . . . . . . . . . . . . . . . . . . . . . . . . . . . . . . . . . . . . . . . . 63.08 364.1 Sustainability . . . . . . . . . . . . . . . . . . . . . . . . . . . . . . . . . . . . . . . . . . . . . . . 68.26 254.1.1 Pension system . . . . . . . . . . . . . . . . . . . . . . . . . . . . . . . . . . . . . . . . . . . . . . . 71.92 354.1.2 Social protection . . . . . . . . . . . . . . . . . . . . . . . . . . . . . . . . . . . . . . . . . . . . . .69.36 284.1.3 Brain retention . . . . . . . . . . . . . . . . . . . . . . . . . . . . . . . . . . . . . . . . . . . . . . . .63.50 314.2 Lifestyle . . . . . . . . . . . . . . . . . . . . . . . . . . . . . . . . . . . . . . . . . . . . . . . . . . . . 57.90 574.2.1 Environmental performance . . . . . . . . . . . . . . . . . . . . . . . . . . . . . . . . . . 67.38 294.2.2 Personal safety . . . . . . . . . . . . . . . . . . . . . . . . . . . . . . . . . . . . . . . . . . . . . . . . 49.14 744.2.3 Physician density . . . . . . . . . . . . . . . . . . . . . . . . . . . . . . . . . . . . . . . . . . . . . . 18.14 804.2.4 Sanitation . . . . . . . . . . . . . . . . . . . . . . . . . . . . . . . . . . . . . . . . . . . . . . . . . . . . .96.93 45
5 VOCATIONAL AND TECHNICAL SKILLS . . . . . . . . . . . . 48.89 505.1 Mid-Level Skills . . . . . . . . . . . . . . . . . . . . . . . . . . . . . . . . . . . . . . . . . . . . . 28.55 885.1.1 Workforce with secondary education . . . . . . . . . . . . . . . . . . . . . . . . .25.67 1015.1.2 Population with secondary education . . . . . . . . . . . . . . . . . . . . . . . .22.70 945.1.3 Technicians and associate professionals . . . . . . . . . . . . . . . . . . . . . . .42.30 515.1.4 Labour productivity per employee . . . . . . . . . . . . . . . . . . . . . . . . . . . .23.52 625.2 Employability . . . . . . . . . . . . . . . . . . . . . . . . . . . . . . . . . . . . . . . . . . . . . . . 69.24 235.2.1 Ease of finding skilled employees . . . . . . . . . . . . . . . . . . . . . . . . . . . . .77.84 175.2.2 Relevance of education system to the economy . . . . . . . . . . . . . .56.61 415.2.3 Skills matching with secondary education . . . . . . . . . . . . . . . . . . . .65.28 265.2.4 Skills matching with tertiary education . . . . . . . . . . . . . . . . . . . . . . . . 77.21 21
6 GLOBAL KNOWLEDGE SKILLS . . . . . . . . . . . . . . . . . . . . 26.40 686.1 High-Level Skills . . . . . . . . . . . . . . . . . . . . . . . . . . . . . . . . . . . . . . . . . . . . 28.96 686.1.1 Workforce with tertiary education . . . . . . . . . . . . . . . . . . . . . . . . . . . .28.44 676.1.2 Population with tertiary education . . . . . . . . . . . . . . . . . . . . . . . . . . . .33.45 446.1.3 Professionals . . . . . . . . . . . . . . . . . . . . . . . . . . . . . . . . . . . . . . . . . . . . . . . . . .32.83 506.1.4 Researchers . . . . . . . . . . . . . . . . . . . . . . . . . . . . . . . . . . . . . . . . . . . . . . . . . . . . 6.30 666.1.5 Senior officials and managers . . . . . . . . . . . . . . . . . . . . . . . . . . . . . . . . .10.27 956.1.6 Availability of scientists and engineers . . . . . . . . . . . . . . . . . . . . . . . .62.45 386.2 Talent Impact . . . . . . . . . . . . . . . . . . . . . . . . . . . . . . . . . . . . . . . . . . . . . . . 23.85 626.2.1 Innovation output . . . . . . . . . . . . . . . . . . . . . . . . . . . . . . . . . . . . . . . . . . . . 40.11 476.2.2 High-value exports . . . . . . . . . . . . . . . . . . . . . . . . . . . . . . . . . . . . . . . . . . . .22.05 556.2.3 New product entrepreneurial activity . . . . . . . . . . . . . . . . . . . . . . . . .44.02 506.2.4 New business density . . . . . . . . . . . . . . . . . . . . . . . . . . . . . . . . . . . . . . . . .10.08 486.2.5 Scientific journal articles . . . . . . . . . . . . . . . . . . . . . . . . . . . . . . . . . . . . . . . 3.01 78
l Costa Rica l Income group average
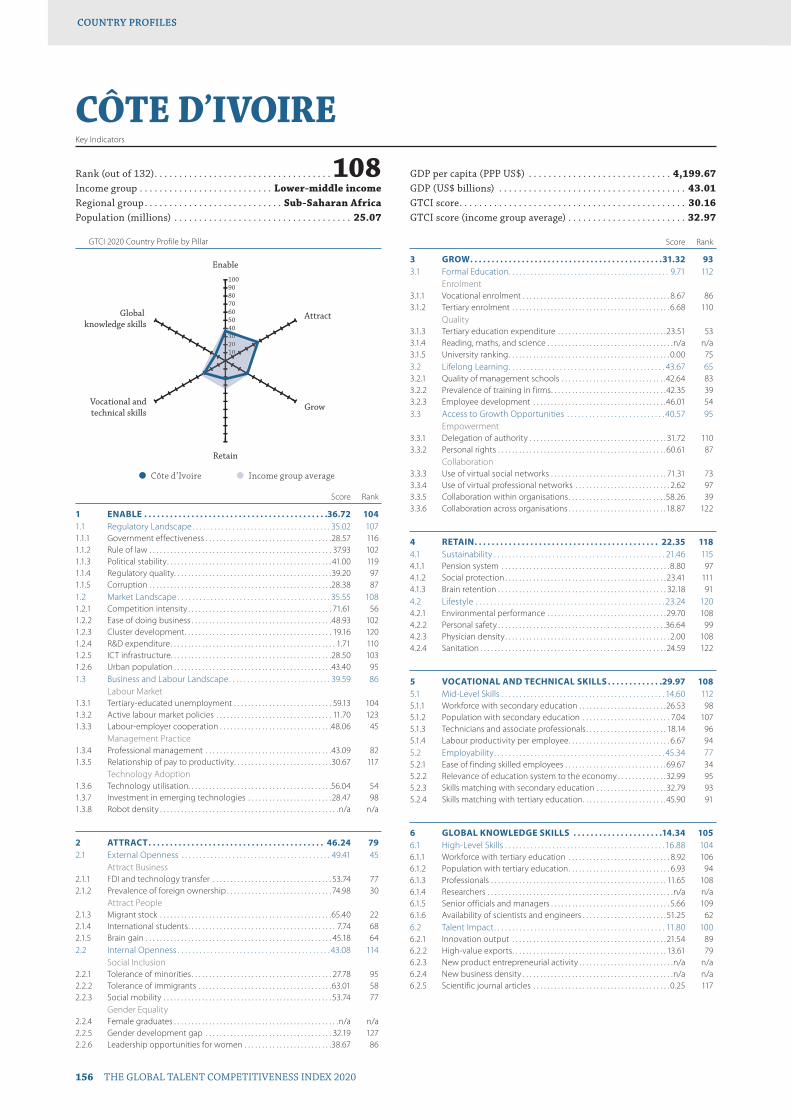
GTCI 2020 Country Profile by Pillar
156 THE GLOBAL TALENT COMPETITIVENESS INDEX 2020
COUNTRY PROFILESCOUNTRY PROFILES
102030405060708090100
Global knowledge skills
Vocational andtechnical skills
Retain
Grow
Attract
Enable
10203004
CÔTE D’IVOIREKey Indicators
Rank (out of 132) . . . . . . . . . . . . . . . . . . . . . . . . . . . . . . . . . . . .108Income group . . . . . . . . . . . . . . . . . . . . . . . . . . . Lower-middle incomeRegional group . . . . . . . . . . . . . . . . . . . . . . . . . . . . Sub-Saharan AfricaPopulation (millions) . . . . . . . . . . . . . . . . . . . . . . . . . . . . . . . . . . . . 25.07
GDP per capita (PPP US$) . . . . . . . . . . . . . . . . . . . . . . . . . . . . . 4,199.67GDP (US$ billions) . . . . . . . . . . . . . . . . . . . . . . . . . . . . . . . . . . . . . . 43.01GTCI score . . . . . . . . . . . . . . . . . . . . . . . . . . . . . . . . . . . . . . . . . . . . . . 30.16GTCI score (income group average) . . . . . . . . . . . . . . . . . . . . . . . . 32.97
Score Rank
1 ENABLE . . . . . . . . . . . . . . . . . . . . . . . . . . . . . . . . . . . . . . . . . . .36.72 1041.1 Regulatory Landscape . . . . . . . . . . . . . . . . . . . . . . . . . . . . . . . . . . . . . . 35.02 1071.1.1 Government effectiveness . . . . . . . . . . . . . . . . . . . . . . . . . . . . . . . . . . . .28.57 1161.1.2 Rule of law . . . . . . . . . . . . . . . . . . . . . . . . . . . . . . . . . . . . . . . . . . . . . . . . . . . . 37.93 1021.1.3 Political stability . . . . . . . . . . . . . . . . . . . . . . . . . . . . . . . . . . . . . . . . . . . . . . . 41.00 1191.1.4 Regulatory quality. . . . . . . . . . . . . . . . . . . . . . . . . . . . . . . . . . . . . . . . . . . . .39.20 971.1.5 Corruption . . . . . . . . . . . . . . . . . . . . . . . . . . . . . . . . . . . . . . . . . . . . . . . . . . . .28.38 871.2 Market Landscape . . . . . . . . . . . . . . . . . . . . . . . . . . . . . . . . . . . . . . . . . . 35.55 1081.2.1 Competition intensity . . . . . . . . . . . . . . . . . . . . . . . . . . . . . . . . . . . . . . . . . 71.61 561.2.2 Ease of doing business . . . . . . . . . . . . . . . . . . . . . . . . . . . . . . . . . . . . . . . .48.93 1021.2.3 Cluster development . . . . . . . . . . . . . . . . . . . . . . . . . . . . . . . . . . . . . . . . . . 19.16 1201.2.4 R&D expenditure . . . . . . . . . . . . . . . . . . . . . . . . . . . . . . . . . . . . . . . . . . . . . . . 1.71 1101.2.5 ICT infrastructure. . . . . . . . . . . . . . . . . . . . . . . . . . . . . . . . . . . . . . . . . . . . . .28.50 1031.2.6 Urban population . . . . . . . . . . . . . . . . . . . . . . . . . . . . . . . . . . . . . . . . . . . . .43.40 951.3 Business and Labour Landscape . . . . . . . . . . . . . . . . . . . . . . . . . . . . 39.59 86
Labour Market1.3.1 Tertiary-educated unemployment . . . . . . . . . . . . . . . . . . . . . . . . . . . . 59.13 1041.3.2 Active labour market policies . . . . . . . . . . . . . . . . . . . . . . . . . . . . . . . . . 11.70 1231.3.3 Labour-employer cooperation . . . . . . . . . . . . . . . . . . . . . . . . . . . . . . . .48.06 45
Management Practice1.3.4 Professional management . . . . . . . . . . . . . . . . . . . . . . . . . . . . . . . . . . . .43.09 821.3.5 Relationship of pay to productivity . . . . . . . . . . . . . . . . . . . . . . . . . . . .30.67 117
Technology Adoption1.3.6 Technology utilisation. . . . . . . . . . . . . . . . . . . . . . . . . . . . . . . . . . . . . . . . .56.04 541.3.7 Investment in emerging technologies . . . . . . . . . . . . . . . . . . . . . . . .28.47 981.3.8 Robot density . . . . . . . . . . . . . . . . . . . . . . . . . . . . . . . . . . . . . . . . . . . . . . . . . . .n/a n/a
2 ATTRACT . . . . . . . . . . . . . . . . . . . . . . . . . . . . . . . . . . . . . . . . . 46.24 792.1 External Openness . . . . . . . . . . . . . . . . . . . . . . . . . . . . . . . . . . . . . . . . . 49.41 45
Attract Business2.1.1 FDI and technology transfer . . . . . . . . . . . . . . . . . . . . . . . . . . . . . . . . . . 53.74 772.1.2 Prevalence of foreign ownership . . . . . . . . . . . . . . . . . . . . . . . . . . . . . . 74.98 30
Attract People2.1.3 Migrant stock . . . . . . . . . . . . . . . . . . . . . . . . . . . . . . . . . . . . . . . . . . . . . . . . .65.40 222.1.4 International students . . . . . . . . . . . . . . . . . . . . . . . . . . . . . . . . . . . . . . . . . . 7.74 682.1.5 Brain gain . . . . . . . . . . . . . . . . . . . . . . . . . . . . . . . . . . . . . . . . . . . . . . . . . . . . . 45.18 642.2 Internal Openness . . . . . . . . . . . . . . . . . . . . . . . . . . . . . . . . . . . . . . . . . . 43.08 114
Social Inclusion2.2.1 Tolerance of minorities . . . . . . . . . . . . . . . . . . . . . . . . . . . . . . . . . . . . . . . . 27.78 952.2.2 Tolerance of immigrants . . . . . . . . . . . . . . . . . . . . . . . . . . . . . . . . . . . . . .63.01 582.2.3 Social mobility . . . . . . . . . . . . . . . . . . . . . . . . . . . . . . . . . . . . . . . . . . . . . . . . 53.74 77
Gender Equality2.2.4 Female graduates . . . . . . . . . . . . . . . . . . . . . . . . . . . . . . . . . . . . . . . . . . . . . . .n/a n/a2.2.5 Gender development gap . . . . . . . . . . . . . . . . . . . . . . . . . . . . . . . . . . . . 32.19 1272.2.6 Leadership opportunities for women . . . . . . . . . . . . . . . . . . . . . . . . .38.67 86
Score Rank
3 GROW . . . . . . . . . . . . . . . . . . . . . . . . . . . . . . . . . . . . . . . . . . . . .31.32 933.1 Formal Education . . . . . . . . . . . . . . . . . . . . . . . . . . . . . . . . . . . . . . . . . . . . 9.71 112
Enrolment3.1.1 Vocational enrolment . . . . . . . . . . . . . . . . . . . . . . . . . . . . . . . . . . . . . . . . . . 8.67 863.1.2 Tertiary enrolment . . . . . . . . . . . . . . . . . . . . . . . . . . . . . . . . . . . . . . . . . . . . . 6.68 110
Quality3.1.3 Tertiary education expenditure . . . . . . . . . . . . . . . . . . . . . . . . . . . . . . .23.51 533.1.4 Reading, maths, and science . . . . . . . . . . . . . . . . . . . . . . . . . . . . . . . . . . . .n/a n/a3.1.5 University ranking . . . . . . . . . . . . . . . . . . . . . . . . . . . . . . . . . . . . . . . . . . . . . . 0.00 753.2 Lifelong Learning . . . . . . . . . . . . . . . . . . . . . . . . . . . . . . . . . . . . . . . . . . . 43.67 653.2.1 Quality of management schools . . . . . . . . . . . . . . . . . . . . . . . . . . . . . .42.64 833.2.2 Prevalence of training in firms . . . . . . . . . . . . . . . . . . . . . . . . . . . . . . . . .42.35 393.2.3 Employee development . . . . . . . . . . . . . . . . . . . . . . . . . . . . . . . . . . . . . .46.01 543.3 Access to Growth Opportunities . . . . . . . . . . . . . . . . . . . . . . . . . . . 40.57 95
Empowerment3.3.1 Delegation of authority . . . . . . . . . . . . . . . . . . . . . . . . . . . . . . . . . . . . . . . 31.72 1103.3.2 Personal rights . . . . . . . . . . . . . . . . . . . . . . . . . . . . . . . . . . . . . . . . . . . . . . . .60.61 87
Collaboration3.3.3 Use of virtual social networks . . . . . . . . . . . . . . . . . . . . . . . . . . . . . . . . . 71.31 733.3.4 Use of virtual professional networks . . . . . . . . . . . . . . . . . . . . . . . . . . . 2.62 973.3.5 Collaboration within organisations . . . . . . . . . . . . . . . . . . . . . . . . . . . .58.26 393.3.6 Collaboration across organisations . . . . . . . . . . . . . . . . . . . . . . . . . . . .18.87 122
4 RETAIN . . . . . . . . . . . . . . . . . . . . . . . . . . . . . . . . . . . . . . . . . . . 22.35 1184.1 Sustainability . . . . . . . . . . . . . . . . . . . . . . . . . . . . . . . . . . . . . . . . . . . . . . . 21.46 1154.1.1 Pension system . . . . . . . . . . . . . . . . . . . . . . . . . . . . . . . . . . . . . . . . . . . . . . . . 8.80 974.1.2 Social protection . . . . . . . . . . . . . . . . . . . . . . . . . . . . . . . . . . . . . . . . . . . . . . 23.41 1114.1.3 Brain retention . . . . . . . . . . . . . . . . . . . . . . . . . . . . . . . . . . . . . . . . . . . . . . . . 32.18 914.2 Lifestyle . . . . . . . . . . . . . . . . . . . . . . . . . . . . . . . . . . . . . . . . . . . . . . . . . . . . 23.24 1204.2.1 Environmental performance . . . . . . . . . . . . . . . . . . . . . . . . . . . . . . . . . . 29.70 1084.2.2 Personal safety . . . . . . . . . . . . . . . . . . . . . . . . . . . . . . . . . . . . . . . . . . . . . . . .36.64 994.2.3 Physician density . . . . . . . . . . . . . . . . . . . . . . . . . . . . . . . . . . . . . . . . . . . . . . . 2.00 1084.2.4 Sanitation . . . . . . . . . . . . . . . . . . . . . . . . . . . . . . . . . . . . . . . . . . . . . . . . . . . . . 24.59 122
5 VOCATIONAL AND TECHNICAL SKILLS . . . . . . . . . . . . .29.97 1085.1 Mid-Level Skills . . . . . . . . . . . . . . . . . . . . . . . . . . . . . . . . . . . . . . . . . . . . . 14.60 1125.1.1 Workforce with secondary education . . . . . . . . . . . . . . . . . . . . . . . . .26.53 985.1.2 Population with secondary education . . . . . . . . . . . . . . . . . . . . . . . . . 7.04 1075.1.3 Technicians and associate professionals . . . . . . . . . . . . . . . . . . . . . . . 18.14 965.1.4 Labour productivity per employee . . . . . . . . . . . . . . . . . . . . . . . . . . . . . 6.67 945.2 Employability . . . . . . . . . . . . . . . . . . . . . . . . . . . . . . . . . . . . . . . . . . . . . . . 45.34 775.2.1 Ease of finding skilled employees . . . . . . . . . . . . . . . . . . . . . . . . . . . . .69.67 345.2.2 Relevance of education system to the economy . . . . . . . . . . . . . .32.99 955.2.3 Skills matching with secondary education . . . . . . . . . . . . . . . . . . . .32.79 935.2.4 Skills matching with tertiary education . . . . . . . . . . . . . . . . . . . . . . . .45.90 91
6 GLOBAL KNOWLEDGE SKILLS . . . . . . . . . . . . . . . . . . . . .14.34 1056.1 High-Level Skills . . . . . . . . . . . . . . . . . . . . . . . . . . . . . . . . . . . . . . . . . . . . 16.88 1046.1.1 Workforce with tertiary education . . . . . . . . . . . . . . . . . . . . . . . . . . . . . 8.92 1066.1.2 Population with tertiary education . . . . . . . . . . . . . . . . . . . . . . . . . . . . . 6.93 946.1.3 Professionals . . . . . . . . . . . . . . . . . . . . . . . . . . . . . . . . . . . . . . . . . . . . . . . . . . 11.65 1086.1.4 Researchers . . . . . . . . . . . . . . . . . . . . . . . . . . . . . . . . . . . . . . . . . . . . . . . . . . . . .n/a n/a6.1.5 Senior officials and managers . . . . . . . . . . . . . . . . . . . . . . . . . . . . . . . . . . 5.66 1096.1.6 Availability of scientists and engineers . . . . . . . . . . . . . . . . . . . . . . . . 51.25 626.2 Talent Impact . . . . . . . . . . . . . . . . . . . . . . . . . . . . . . . . . . . . . . . . . . . . . . . 11.80 1006.2.1 Innovation output . . . . . . . . . . . . . . . . . . . . . . . . . . . . . . . . . . . . . . . . . . . . 21.54 896.2.2 High-value exports . . . . . . . . . . . . . . . . . . . . . . . . . . . . . . . . . . . . . . . . . . . . 13.61 796.2.3 New product entrepreneurial activity . . . . . . . . . . . . . . . . . . . . . . . . . . .n/a n/a6.2.4 New business density . . . . . . . . . . . . . . . . . . . . . . . . . . . . . . . . . . . . . . . . . . .n/a n/a6.2.5 Scientific journal articles . . . . . . . . . . . . . . . . . . . . . . . . . . . . . . . . . . . . . . . 0.25 117
l Côte d’Ivoire l Income group average
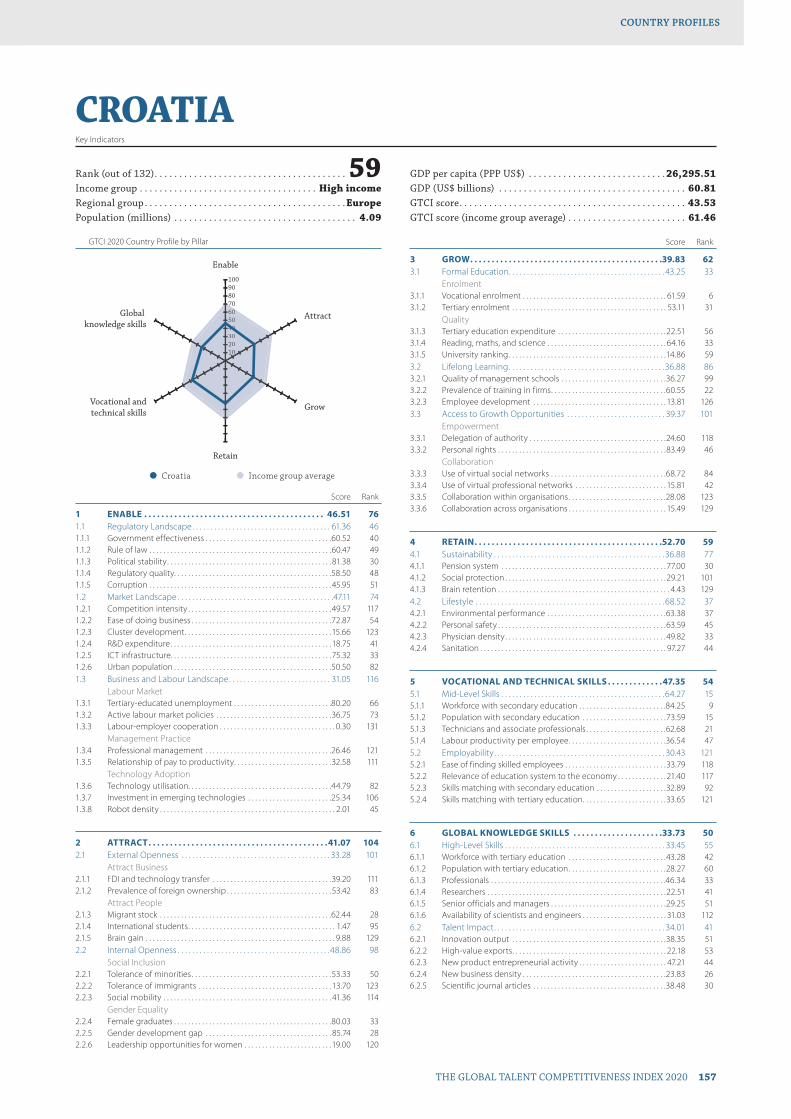
GTCI 2020 Country Profile by Pillar
THE GLOBAL TALENT COMPETITIVENESS INDEX 2020 157
COUNTRY PROFILESCOUNTRY PROFILES
102030405060708090100
Global knowledge skills
Vocational andtechnical skills
Retain
Grow
Attract
Enable
102030405060607
CROATIAKey Indicators
Rank (out of 132) . . . . . . . . . . . . . . . . . . . . . . . . . . . . . . . . . . . . . . . 59Income group . . . . . . . . . . . . . . . . . . . . . . . . . . . . . . . . . . . . High incomeRegional group . . . . . . . . . . . . . . . . . . . . . . . . . . . . . . . . . . . . . . . . .EuropePopulation (millions) . . . . . . . . . . . . . . . . . . . . . . . . . . . . . . . . . . . . . 4.09
GDP per capita (PPP US$) . . . . . . . . . . . . . . . . . . . . . . . . . . . . 26,295.51GDP (US$ billions) . . . . . . . . . . . . . . . . . . . . . . . . . . . . . . . . . . . . . . 60.81GTCI score . . . . . . . . . . . . . . . . . . . . . . . . . . . . . . . . . . . . . . . . . . . . . . 43.53GTCI score (income group average) . . . . . . . . . . . . . . . . . . . . . . . . 61.46
Score Rank
1 ENABLE . . . . . . . . . . . . . . . . . . . . . . . . . . . . . . . . . . . . . . . . . . 46.51 761.1 Regulatory Landscape . . . . . . . . . . . . . . . . . . . . . . . . . . . . . . . . . . . . . . 61.36 461.1.1 Government effectiveness . . . . . . . . . . . . . . . . . . . . . . . . . . . . . . . . . . . .60.52 401.1.2 Rule of law . . . . . . . . . . . . . . . . . . . . . . . . . . . . . . . . . . . . . . . . . . . . . . . . . . . .60.47 491.1.3 Political stability . . . . . . . . . . . . . . . . . . . . . . . . . . . . . . . . . . . . . . . . . . . . . . . 81.38 301.1.4 Regulatory quality. . . . . . . . . . . . . . . . . . . . . . . . . . . . . . . . . . . . . . . . . . . . .58.50 481.1.5 Corruption . . . . . . . . . . . . . . . . . . . . . . . . . . . . . . . . . . . . . . . . . . . . . . . . . . . . 45.95 511.2 Market Landscape . . . . . . . . . . . . . . . . . . . . . . . . . . . . . . . . . . . . . . . . . . .47.11 741.2.1 Competition intensity . . . . . . . . . . . . . . . . . . . . . . . . . . . . . . . . . . . . . . . . .49.57 1171.2.2 Ease of doing business . . . . . . . . . . . . . . . . . . . . . . . . . . . . . . . . . . . . . . . .72.87 541.2.3 Cluster development . . . . . . . . . . . . . . . . . . . . . . . . . . . . . . . . . . . . . . . . . .15.66 1231.2.4 R&D expenditure . . . . . . . . . . . . . . . . . . . . . . . . . . . . . . . . . . . . . . . . . . . . . . 18.75 411.2.5 ICT infrastructure. . . . . . . . . . . . . . . . . . . . . . . . . . . . . . . . . . . . . . . . . . . . . .75.32 331.2.6 Urban population . . . . . . . . . . . . . . . . . . . . . . . . . . . . . . . . . . . . . . . . . . . . .50.50 821.3 Business and Labour Landscape . . . . . . . . . . . . . . . . . . . . . . . . . . . . 31.05 116
Labour Market1.3.1 Tertiary-educated unemployment . . . . . . . . . . . . . . . . . . . . . . . . . . . .80.20 661.3.2 Active labour market policies . . . . . . . . . . . . . . . . . . . . . . . . . . . . . . . . .36.75 731.3.3 Labour-employer cooperation . . . . . . . . . . . . . . . . . . . . . . . . . . . . . . . . . 0.30 131
Management Practice1.3.4 Professional management . . . . . . . . . . . . . . . . . . . . . . . . . . . . . . . . . . . .26.46 1211.3.5 Relationship of pay to productivity . . . . . . . . . . . . . . . . . . . . . . . . . . . .32.58 111
Technology Adoption1.3.6 Technology utilisation. . . . . . . . . . . . . . . . . . . . . . . . . . . . . . . . . . . . . . . . .44.79 821.3.7 Investment in emerging technologies . . . . . . . . . . . . . . . . . . . . . . . .25.34 1061.3.8 Robot density . . . . . . . . . . . . . . . . . . . . . . . . . . . . . . . . . . . . . . . . . . . . . . . . . . 2.01 45
2 ATTRACT . . . . . . . . . . . . . . . . . . . . . . . . . . . . . . . . . . . . . . . . . .41.07 1042.1 External Openness . . . . . . . . . . . . . . . . . . . . . . . . . . . . . . . . . . . . . . . . . 33.28 101
Attract Business2.1.1 FDI and technology transfer . . . . . . . . . . . . . . . . . . . . . . . . . . . . . . . . . .39.20 1112.1.2 Prevalence of foreign ownership . . . . . . . . . . . . . . . . . . . . . . . . . . . . . .53.42 83
Attract People2.1.3 Migrant stock . . . . . . . . . . . . . . . . . . . . . . . . . . . . . . . . . . . . . . . . . . . . . . . . .62.44 282.1.4 International students . . . . . . . . . . . . . . . . . . . . . . . . . . . . . . . . . . . . . . . . . . 1.47 952.1.5 Brain gain . . . . . . . . . . . . . . . . . . . . . . . . . . . . . . . . . . . . . . . . . . . . . . . . . . . . . . 9.88 1292.2 Internal Openness . . . . . . . . . . . . . . . . . . . . . . . . . . . . . . . . . . . . . . . . . .48.86 98
Social Inclusion2.2.1 Tolerance of minorities . . . . . . . . . . . . . . . . . . . . . . . . . . . . . . . . . . . . . . . .53.33 502.2.2 Tolerance of immigrants . . . . . . . . . . . . . . . . . . . . . . . . . . . . . . . . . . . . . . 13.70 1232.2.3 Social mobility . . . . . . . . . . . . . . . . . . . . . . . . . . . . . . . . . . . . . . . . . . . . . . . . 41.36 114
Gender Equality2.2.4 Female graduates . . . . . . . . . . . . . . . . . . . . . . . . . . . . . . . . . . . . . . . . . . . . .80.03 332.2.5 Gender development gap . . . . . . . . . . . . . . . . . . . . . . . . . . . . . . . . . . . . 85.74 282.2.6 Leadership opportunities for women . . . . . . . . . . . . . . . . . . . . . . . . .19.00 120
Score Rank
3 GROW . . . . . . . . . . . . . . . . . . . . . . . . . . . . . . . . . . . . . . . . . . . . .39.83 623.1 Formal Education . . . . . . . . . . . . . . . . . . . . . . . . . . . . . . . . . . . . . . . . . . . 43.25 33
Enrolment3.1.1 Vocational enrolment . . . . . . . . . . . . . . . . . . . . . . . . . . . . . . . . . . . . . . . . . 61.59 63.1.2 Tertiary enrolment . . . . . . . . . . . . . . . . . . . . . . . . . . . . . . . . . . . . . . . . . . . . 53.11 31
Quality3.1.3 Tertiary education expenditure . . . . . . . . . . . . . . . . . . . . . . . . . . . . . . .22.51 563.1.4 Reading, maths, and science . . . . . . . . . . . . . . . . . . . . . . . . . . . . . . . . . . 64.16 333.1.5 University ranking . . . . . . . . . . . . . . . . . . . . . . . . . . . . . . . . . . . . . . . . . . . . .14.86 593.2 Lifelong Learning . . . . . . . . . . . . . . . . . . . . . . . . . . . . . . . . . . . . . . . . . . .36.88 863.2.1 Quality of management schools . . . . . . . . . . . . . . . . . . . . . . . . . . . . . .36.27 993.2.2 Prevalence of training in firms . . . . . . . . . . . . . . . . . . . . . . . . . . . . . . . . .60.55 223.2.3 Employee development . . . . . . . . . . . . . . . . . . . . . . . . . . . . . . . . . . . . . . 13.81 1263.3 Access to Growth Opportunities . . . . . . . . . . . . . . . . . . . . . . . . . . . 39.37 101
Empowerment3.3.1 Delegation of authority . . . . . . . . . . . . . . . . . . . . . . . . . . . . . . . . . . . . . . .24.60 1183.3.2 Personal rights . . . . . . . . . . . . . . . . . . . . . . . . . . . . . . . . . . . . . . . . . . . . . . . .83.49 46
Collaboration3.3.3 Use of virtual social networks . . . . . . . . . . . . . . . . . . . . . . . . . . . . . . . . .68.72 843.3.4 Use of virtual professional networks . . . . . . . . . . . . . . . . . . . . . . . . . . 15.81 423.3.5 Collaboration within organisations . . . . . . . . . . . . . . . . . . . . . . . . . . . .28.08 1233.3.6 Collaboration across organisations . . . . . . . . . . . . . . . . . . . . . . . . . . . . 15.49 129
4 RETAIN . . . . . . . . . . . . . . . . . . . . . . . . . . . . . . . . . . . . . . . . . . . .52.70 594.1 Sustainability . . . . . . . . . . . . . . . . . . . . . . . . . . . . . . . . . . . . . . . . . . . . . . .36.88 774.1.1 Pension system . . . . . . . . . . . . . . . . . . . . . . . . . . . . . . . . . . . . . . . . . . . . . . . 77.00 304.1.2 Social protection . . . . . . . . . . . . . . . . . . . . . . . . . . . . . . . . . . . . . . . . . . . . . .29.21 1014.1.3 Brain retention . . . . . . . . . . . . . . . . . . . . . . . . . . . . . . . . . . . . . . . . . . . . . . . . . 4.43 1294.2 Lifestyle . . . . . . . . . . . . . . . . . . . . . . . . . . . . . . . . . . . . . . . . . . . . . . . . . . . . 68.52 374.2.1 Environmental performance . . . . . . . . . . . . . . . . . . . . . . . . . . . . . . . . . .63.38 374.2.2 Personal safety . . . . . . . . . . . . . . . . . . . . . . . . . . . . . . . . . . . . . . . . . . . . . . . .63.59 454.2.3 Physician density . . . . . . . . . . . . . . . . . . . . . . . . . . . . . . . . . . . . . . . . . . . . . .49.82 334.2.4 Sanitation . . . . . . . . . . . . . . . . . . . . . . . . . . . . . . . . . . . . . . . . . . . . . . . . . . . . . 97.27 44
5 VOCATIONAL AND TECHNICAL SKILLS . . . . . . . . . . . . .47.35 545.1 Mid-Level Skills . . . . . . . . . . . . . . . . . . . . . . . . . . . . . . . . . . . . . . . . . . . . . 64.27 155.1.1 Workforce with secondary education . . . . . . . . . . . . . . . . . . . . . . . . .84.25 95.1.2 Population with secondary education . . . . . . . . . . . . . . . . . . . . . . . .73.59 155.1.3 Technicians and associate professionals . . . . . . . . . . . . . . . . . . . . . . .62.68 215.1.4 Labour productivity per employee . . . . . . . . . . . . . . . . . . . . . . . . . . . .36.54 475.2 Employability . . . . . . . . . . . . . . . . . . . . . . . . . . . . . . . . . . . . . . . . . . . . . . . 30.43 1215.2.1 Ease of finding skilled employees . . . . . . . . . . . . . . . . . . . . . . . . . . . . .33.79 1185.2.2 Relevance of education system to the economy . . . . . . . . . . . . . . 21.40 1175.2.3 Skills matching with secondary education . . . . . . . . . . . . . . . . . . . .32.89 925.2.4 Skills matching with tertiary education . . . . . . . . . . . . . . . . . . . . . . . .33.65 121
6 GLOBAL KNOWLEDGE SKILLS . . . . . . . . . . . . . . . . . . . . .33.73 506.1 High-Level Skills . . . . . . . . . . . . . . . . . . . . . . . . . . . . . . . . . . . . . . . . . . . . 33.45 556.1.1 Workforce with tertiary education . . . . . . . . . . . . . . . . . . . . . . . . . . . .43.28 426.1.2 Population with tertiary education . . . . . . . . . . . . . . . . . . . . . . . . . . . .28.27 606.1.3 Professionals . . . . . . . . . . . . . . . . . . . . . . . . . . . . . . . . . . . . . . . . . . . . . . . . . .46.34 336.1.4 Researchers . . . . . . . . . . . . . . . . . . . . . . . . . . . . . . . . . . . . . . . . . . . . . . . . . . .22.51 416.1.5 Senior officials and managers . . . . . . . . . . . . . . . . . . . . . . . . . . . . . . . . .29.25 516.1.6 Availability of scientists and engineers . . . . . . . . . . . . . . . . . . . . . . . . 31.03 1126.2 Talent Impact . . . . . . . . . . . . . . . . . . . . . . . . . . . . . . . . . . . . . . . . . . . . . . . 34.01 416.2.1 Innovation output . . . . . . . . . . . . . . . . . . . . . . . . . . . . . . . . . . . . . . . . . . . .38.35 516.2.2 High-value exports . . . . . . . . . . . . . . . . . . . . . . . . . . . . . . . . . . . . . . . . . . . . 22.18 536.2.3 New product entrepreneurial activity . . . . . . . . . . . . . . . . . . . . . . . . . 47.21 446.2.4 New business density . . . . . . . . . . . . . . . . . . . . . . . . . . . . . . . . . . . . . . . . .23.83 266.2.5 Scientific journal articles . . . . . . . . . . . . . . . . . . . . . . . . . . . . . . . . . . . . . .38.48 30
l Croatia l Income group average

GTCI 2020 Country Profile by Pillar
158 THE GLOBAL TALENT COMPETITIVENESS INDEX 2020
COUNTRY PROFILESCOUNTRY PROFILES
102030405060708090100
Global knowledge skills
Vocational andtechnical skills
Retain
Grow
Attract
Enable
102030405060607
CYPRUSKey Indicators
Rank (out of 132) . . . . . . . . . . . . . . . . . . . . . . . . . . . . . . . . . . . . . . . 30Income group . . . . . . . . . . . . . . . . . . . . . . . . . . . . . . . . . . . . High incomeRegional group . . . . . . . . . . . . . .Northern Africa and Western AsiaPopulation (millions) . . . . . . . . . . . . . . . . . . . . . . . . . . . . . . . . . . . . . .1.19
GDP per capita (PPP US$) . . . . . . . . . . . . . . . . . . . . . . . . . . . . 36,155.48GDP (US$ billions) . . . . . . . . . . . . . . . . . . . . . . . . . . . . . . . . . . . . . . 24.47GTCI score . . . . . . . . . . . . . . . . . . . . . . . . . . . . . . . . . . . . . . . . . . . . . . 57.47GTCI score (income group average) . . . . . . . . . . . . . . . . . . . . . . . . 61.46
Score Rank
1 ENABLE . . . . . . . . . . . . . . . . . . . . . . . . . . . . . . . . . . . . . . . . . . .60.21 371.1 Regulatory Landscape . . . . . . . . . . . . . . . . . . . . . . . . . . . . . . . . . . . . . . 70.91 311.1.1 Government effectiveness . . . . . . . . . . . . . . . . . . . . . . . . . . . . . . . . . . . .68.85 321.1.2 Rule of law . . . . . . . . . . . . . . . . . . . . . . . . . . . . . . . . . . . . . . . . . . . . . . . . . . . .73.33 321.1.3 Political stability . . . . . . . . . . . . . . . . . . . . . . . . . . . . . . . . . . . . . . . . . . . . . . .78.20 351.1.4 Regulatory quality. . . . . . . . . . . . . . . . . . . . . . . . . . . . . . . . . . . . . . . . . . . . .73.37 301.1.5 Corruption . . . . . . . . . . . . . . . . . . . . . . . . . . . . . . . . . . . . . . . . . . . . . . . . . . . .60.81 331.2 Market Landscape . . . . . . . . . . . . . . . . . . . . . . . . . . . . . . . . . . . . . . . . . . 58.37 431.2.1 Competition intensity . . . . . . . . . . . . . . . . . . . . . . . . . . . . . . . . . . . . . . . . . 81.32 191.2.2 Ease of doing business . . . . . . . . . . . . . . . . . . . . . . . . . . . . . . . . . . . . . . . .73.42 531.2.3 Cluster development . . . . . . . . . . . . . . . . . . . . . . . . . . . . . . . . . . . . . . . . . .42.95 651.2.4 R&D expenditure . . . . . . . . . . . . . . . . . . . . . . . . . . . . . . . . . . . . . . . . . . . . . .12.08 551.2.5 ICT infrastructure. . . . . . . . . . . . . . . . . . . . . . . . . . . . . . . . . . . . . . . . . . . . . .78.63 301.2.6 Urban population . . . . . . . . . . . . . . . . . . . . . . . . . . . . . . . . . . . . . . . . . . . . . 61.84 621.3 Business and Labour Landscape . . . . . . . . . . . . . . . . . . . . . . . . . . . . 51.33 51
Labour Market1.3.1 Tertiary-educated unemployment . . . . . . . . . . . . . . . . . . . . . . . . . . . .75.06 831.3.2 Active labour market policies . . . . . . . . . . . . . . . . . . . . . . . . . . . . . . . . . 58.15 431.3.3 Labour-employer cooperation . . . . . . . . . . . . . . . . . . . . . . . . . . . . . . . . 53.71 35
Management Practice1.3.4 Professional management . . . . . . . . . . . . . . . . . . . . . . . . . . . . . . . . . . . .36.22 981.3.5 Relationship of pay to productivity . . . . . . . . . . . . . . . . . . . . . . . . . . . .46.46 70
Technology Adoption1.3.6 Technology utilisation. . . . . . . . . . . . . . . . . . . . . . . . . . . . . . . . . . . . . . . . .58.34 511.3.7 Investment in emerging technologies . . . . . . . . . . . . . . . . . . . . . . . . 31.37 911.3.8 Robot density . . . . . . . . . . . . . . . . . . . . . . . . . . . . . . . . . . . . . . . . . . . . . . . . . . .n/a n/a
2 ATTRACT . . . . . . . . . . . . . . . . . . . . . . . . . . . . . . . . . . . . . . . . . 63.25 272.1 External Openness . . . . . . . . . . . . . . . . . . . . . . . . . . . . . . . . . . . . . . . . .60.60 24
Attract Business2.1.1 FDI and technology transfer . . . . . . . . . . . . . . . . . . . . . . . . . . . . . . . . . . 57.07 642.1.2 Prevalence of foreign ownership . . . . . . . . . . . . . . . . . . . . . . . . . . . . . . 71.33 39
Attract People2.1.3 Migrant stock . . . . . . . . . . . . . . . . . . . . . . . . . . . . . . . . . . . . . . . . . . . . . . . . .64.69 232.1.4 International students . . . . . . . . . . . . . . . . . . . . . . . . . . . . . . . . . . . . . . . . .64.36 82.1.5 Brain gain . . . . . . . . . . . . . . . . . . . . . . . . . . . . . . . . . . . . . . . . . . . . . . . . . . . . .45.57 622.2 Internal Openness . . . . . . . . . . . . . . . . . . . . . . . . . . . . . . . . . . . . . . . . . . 65.89 37
Social Inclusion2.2.1 Tolerance of minorities . . . . . . . . . . . . . . . . . . . . . . . . . . . . . . . . . . . . . . . . 47.78 622.2.2 Tolerance of immigrants . . . . . . . . . . . . . . . . . . . . . . . . . . . . . . . . . . . . . . 67.12 462.2.3 Social mobility . . . . . . . . . . . . . . . . . . . . . . . . . . . . . . . . . . . . . . . . . . . . . . . . 61.48 50
Gender Equality2.2.4 Female graduates . . . . . . . . . . . . . . . . . . . . . . . . . . . . . . . . . . . . . . . . . . . . .91.88 92.2.5 Gender development gap . . . . . . . . . . . . . . . . . . . . . . . . . . . . . . . . . . . .83.06 422.2.6 Leadership opportunities for women . . . . . . . . . . . . . . . . . . . . . . . . .44.01 71
Score Rank
3 GROW . . . . . . . . . . . . . . . . . . . . . . . . . . . . . . . . . . . . . . . . . . . . 44.28 473.1 Formal Education . . . . . . . . . . . . . . . . . . . . . . . . . . . . . . . . . . . . . . . . . . . 27.41 63
Enrolment3.1.1 Vocational enrolment . . . . . . . . . . . . . . . . . . . . . . . . . . . . . . . . . . . . . . . . . 12.62 773.1.2 Tertiary enrolment . . . . . . . . . . . . . . . . . . . . . . . . . . . . . . . . . . . . . . . . . . . . 47.23 44
Quality3.1.3 Tertiary education expenditure . . . . . . . . . . . . . . . . . . . . . . . . . . . . . . .30.86 333.1.4 Reading, maths, and science . . . . . . . . . . . . . . . . . . . . . . . . . . . . . . . . . .46.33 443.1.5 University ranking . . . . . . . . . . . . . . . . . . . . . . . . . . . . . . . . . . . . . . . . . . . . . . 0.00 753.2 Lifelong Learning . . . . . . . . . . . . . . . . . . . . . . . . . . . . . . . . . . . . . . . . . . . 53.99 413.2.1 Quality of management schools . . . . . . . . . . . . . . . . . . . . . . . . . . . . . .58.65 443.2.2 Prevalence of training in firms . . . . . . . . . . . . . . . . . . . . . . . . . . . . . . . . . . .n/a n/a3.2.3 Employee development . . . . . . . . . . . . . . . . . . . . . . . . . . . . . . . . . . . . . . 49.32 463.3 Access to Growth Opportunities . . . . . . . . . . . . . . . . . . . . . . . . . . . 51.44 49
Empowerment3.3.1 Delegation of authority . . . . . . . . . . . . . . . . . . . . . . . . . . . . . . . . . . . . . . . 41.02 793.3.2 Personal rights . . . . . . . . . . . . . . . . . . . . . . . . . . . . . . . . . . . . . . . . . . . . . . . .93.54 28
Collaboration3.3.3 Use of virtual social networks . . . . . . . . . . . . . . . . . . . . . . . . . . . . . . . . .76.58 583.3.4 Use of virtual professional networks . . . . . . . . . . . . . . . . . . . . . . . . . . 21.86 303.3.5 Collaboration within organisations . . . . . . . . . . . . . . . . . . . . . . . . . . . .46.66 683.3.6 Collaboration across organisations . . . . . . . . . . . . . . . . . . . . . . . . . . . .28.99 95
4 RETAIN . . . . . . . . . . . . . . . . . . . . . . . . . . . . . . . . . . . . . . . . . . . 64.58 324.1 Sustainability . . . . . . . . . . . . . . . . . . . . . . . . . . . . . . . . . . . . . . . . . . . . . . . 57.35 414.1.1 Pension system . . . . . . . . . . . . . . . . . . . . . . . . . . . . . . . . . . . . . . . . . . . . . . . 67.36 414.1.2 Social protection . . . . . . . . . . . . . . . . . . . . . . . . . . . . . . . . . . . . . . . . . . . . . . 52.93 444.1.3 Brain retention . . . . . . . . . . . . . . . . . . . . . . . . . . . . . . . . . . . . . . . . . . . . . . . . 51.75 444.2 Lifestyle . . . . . . . . . . . . . . . . . . . . . . . . . . . . . . . . . . . . . . . . . . . . . . . . . . . . 71.81 314.2.1 Environmental performance . . . . . . . . . . . . . . . . . . . . . . . . . . . . . . . . . .75.30 234.2.2 Personal safety . . . . . . . . . . . . . . . . . . . . . . . . . . . . . . . . . . . . . . . . . . . . . . . .72.92 304.2.3 Physician density . . . . . . . . . . . . . . . . . . . . . . . . . . . . . . . . . . . . . . . . . . . . . .39.72 494.2.4 Sanitation . . . . . . . . . . . . . . . . . . . . . . . . . . . . . . . . . . . . . . . . . . . . . . . . . . . . .99.32 24
5 VOCATIONAL AND TECHNICAL SKILLS . . . . . . . . . . . . .59.58 285.1 Mid-Level Skills . . . . . . . . . . . . . . . . . . . . . . . . . . . . . . . . . . . . . . . . . . . . . 50.93 475.1.1 Workforce with secondary education . . . . . . . . . . . . . . . . . . . . . . . . .52.44 535.1.2 Population with secondary education . . . . . . . . . . . . . . . . . . . . . . . .48.30 495.1.3 Technicians and associate professionals . . . . . . . . . . . . . . . . . . . . . . .55.60 335.1.4 Labour productivity per employee . . . . . . . . . . . . . . . . . . . . . . . . . . . . 47.36 285.2 Employability . . . . . . . . . . . . . . . . . . . . . . . . . . . . . . . . . . . . . . . . . . . . . . .68.23 245.2.1 Ease of finding skilled employees . . . . . . . . . . . . . . . . . . . . . . . . . . . . .73.49 255.2.2 Relevance of education system to the economy . . . . . . . . . . . . . .56.26 425.2.3 Skills matching with secondary education . . . . . . . . . . . . . . . . . . . .69.30 165.2.4 Skills matching with tertiary education . . . . . . . . . . . . . . . . . . . . . . . .73.87 28
6 GLOBAL KNOWLEDGE SKILLS . . . . . . . . . . . . . . . . . . . . .52.95 196.1 High-Level Skills . . . . . . . . . . . . . . . . . . . . . . . . . . . . . . . . . . . . . . . . . . . . 47.83 316.1.1 Workforce with tertiary education . . . . . . . . . . . . . . . . . . . . . . . . . . . .69.05 86.1.2 Population with tertiary education . . . . . . . . . . . . . . . . . . . . . . . . . . . . 58.19 156.1.3 Professionals . . . . . . . . . . . . . . . . . . . . . . . . . . . . . . . . . . . . . . . . . . . . . . . . . .49.44 256.1.4 Researchers . . . . . . . . . . . . . . . . . . . . . . . . . . . . . . . . . . . . . . . . . . . . . . . . . . . 14.12 486.1.5 Senior officials and managers . . . . . . . . . . . . . . . . . . . . . . . . . . . . . . . . .22.89 636.1.6 Availability of scientists and engineers . . . . . . . . . . . . . . . . . . . . . . . .73.29 176.2 Talent Impact . . . . . . . . . . . . . . . . . . . . . . . . . . . . . . . . . . . . . . . . . . . . . . . 58.06 136.2.1 Innovation output . . . . . . . . . . . . . . . . . . . . . . . . . . . . . . . . . . . . . . . . . . . .60.77 226.2.2 High-value exports . . . . . . . . . . . . . . . . . . . . . . . . . . . . . . . . . . . . . . . . . . . . 37.91 296.2.3 New product entrepreneurial activity . . . . . . . . . . . . . . . . . . . . . . . . .78.95 96.2.4 New business density . . . . . . . . . . . . . . . . . . . . . . . . . . . . . . . . . . . . . . . . . 79.75 46.2.5 Scientific journal articles . . . . . . . . . . . . . . . . . . . . . . . . . . . . . . . . . . . . . . 32.92 32
l Cyprus l Income group average

GTCI 2020 Country Profile by Pillar
THE GLOBAL TALENT COMPETITIVENESS INDEX 2020 159
COUNTRY PROFILESCOUNTRY PROFILES
102030405060708090100
Global knowledge skills
Vocational andtechnical skills
Retain
Grow
Attract
Enable
102030405060607
CZECH REPUBLICKey Indicators
Rank (out of 132) . . . . . . . . . . . . . . . . . . . . . . . . . . . . . . . . . . . . . . . 25Income group . . . . . . . . . . . . . . . . . . . . . . . . . . . . . . . . . . . . High incomeRegional group . . . . . . . . . . . . . . . . . . . . . . . . . . . . . . . . . . . . . . . . .EuropePopulation (millions) . . . . . . . . . . . . . . . . . . . . . . . . . . . . . . . . . . . . 10.63
GDP per capita (PPP US$) . . . . . . . . . . . . . . . . . . . . . . . . . . . . 39,998.43GDP (US$ billions) . . . . . . . . . . . . . . . . . . . . . . . . . . . . . . . . . . . . . 244.11GTCI score . . . . . . . . . . . . . . . . . . . . . . . . . . . . . . . . . . . . . . . . . . . . . . 60.91GTCI score (income group average) . . . . . . . . . . . . . . . . . . . . . . . . 61.46
Score Rank
1 ENABLE . . . . . . . . . . . . . . . . . . . . . . . . . . . . . . . . . . . . . . . . . . .69.23 251.1 Regulatory Landscape . . . . . . . . . . . . . . . . . . . . . . . . . . . . . . . . . . . . . . 75.31 251.1.1 Government effectiveness . . . . . . . . . . . . . . . . . . . . . . . . . . . . . . . . . . . .71.34 291.1.2 Rule of law . . . . . . . . . . . . . . . . . . . . . . . . . . . . . . . . . . . . . . . . . . . . . . . . . . . . 78.74 251.1.3 Political stability . . . . . . . . . . . . . . . . . . . . . . . . . . . . . . . . . . . . . . . . . . . . . . . 87.31 181.1.4 Regulatory quality. . . . . . . . . . . . . . . . . . . . . . . . . . . . . . . . . . . . . . . . . . . . .78.34 241.1.5 Corruption . . . . . . . . . . . . . . . . . . . . . . . . . . . . . . . . . . . . . . . . . . . . . . . . . . . .60.81 331.2 Market Landscape . . . . . . . . . . . . . . . . . . . . . . . . . . . . . . . . . . . . . . . . . . 65.79 271.2.1 Competition intensity . . . . . . . . . . . . . . . . . . . . . . . . . . . . . . . . . . . . . . . . .84.98 141.2.2 Ease of doing business . . . . . . . . . . . . . . . . . . . . . . . . . . . . . . . . . . . . . . . . 81.26 331.2.3 Cluster development . . . . . . . . . . . . . . . . . . . . . . . . . . . . . . . . . . . . . . . . . .50.22 451.2.4 R&D expenditure . . . . . . . . . . . . . . . . . . . . . . . . . . . . . . . . . . . . . . . . . . . . . .38.97 201.2.5 ICT infrastructure. . . . . . . . . . . . . . . . . . . . . . . . . . . . . . . . . . . . . . . . . . . . . . 69.47 481.2.6 Urban population . . . . . . . . . . . . . . . . . . . . . . . . . . . . . . . . . . . . . . . . . . . . .69.86 471.3 Business and Labour Landscape . . . . . . . . . . . . . . . . . . . . . . . . . . . . 66.59 23
Labour Market1.3.1 Tertiary-educated unemployment . . . . . . . . . . . . . . . . . . . . . . . . . . . .96.23 41.3.2 Active labour market policies . . . . . . . . . . . . . . . . . . . . . . . . . . . . . . . . .76.80 171.3.3 Labour-employer cooperation . . . . . . . . . . . . . . . . . . . . . . . . . . . . . . . .52.30 37
Management Practice1.3.4 Professional management . . . . . . . . . . . . . . . . . . . . . . . . . . . . . . . . . . . .78.63 221.3.5 Relationship of pay to productivity . . . . . . . . . . . . . . . . . . . . . . . . . . . .65.77 32
Technology Adoption1.3.6 Technology utilisation. . . . . . . . . . . . . . . . . . . . . . . . . . . . . . . . . . . . . . . . . 67.76 341.3.7 Investment in emerging technologies . . . . . . . . . . . . . . . . . . . . . . . . 55.17 351.3.8 Robot density . . . . . . . . . . . . . . . . . . . . . . . . . . . . . . . . . . . . . . . . . . . . . . . . .40.05 19
2 ATTRACT . . . . . . . . . . . . . . . . . . . . . . . . . . . . . . . . . . . . . . . . . 60.59 332.1 External Openness . . . . . . . . . . . . . . . . . . . . . . . . . . . . . . . . . . . . . . . . . 57.62 28
Attract Business2.1.1 FDI and technology transfer . . . . . . . . . . . . . . . . . . . . . . . . . . . . . . . . . .70.25 382.1.2 Prevalence of foreign ownership . . . . . . . . . . . . . . . . . . . . . . . . . . . . . .94.05 5
Attract People2.1.3 Migrant stock . . . . . . . . . . . . . . . . . . . . . . . . . . . . . . . . . . . . . . . . . . . . . . . . .38.31 692.1.4 International students . . . . . . . . . . . . . . . . . . . . . . . . . . . . . . . . . . . . . . . . .42.22 152.1.5 Brain gain . . . . . . . . . . . . . . . . . . . . . . . . . . . . . . . . . . . . . . . . . . . . . . . . . . . . .43.27 682.2 Internal Openness . . . . . . . . . . . . . . . . . . . . . . . . . . . . . . . . . . . . . . . . . . 63.56 45
Social Inclusion2.2.1 Tolerance of minorities . . . . . . . . . . . . . . . . . . . . . . . . . . . . . . . . . . . . . . . . 57.78 452.2.2 Tolerance of immigrants . . . . . . . . . . . . . . . . . . . . . . . . . . . . . . . . . . . . . . 15.07 1212.2.3 Social mobility . . . . . . . . . . . . . . . . . . . . . . . . . . . . . . . . . . . . . . . . . . . . . . . . 77.50 22
Gender Equality2.2.4 Female graduates . . . . . . . . . . . . . . . . . . . . . . . . . . . . . . . . . . . . . . . . . . . . . 84.16 242.2.5 Gender development gap . . . . . . . . . . . . . . . . . . . . . . . . . . . . . . . . . . . . 83.74 392.2.6 Leadership opportunities for women . . . . . . . . . . . . . . . . . . . . . . . . . 63.12 34
Score Rank
3 GROW . . . . . . . . . . . . . . . . . . . . . . . . . . . . . . . . . . . . . . . . . . . . 55.04 273.1 Formal Education . . . . . . . . . . . . . . . . . . . . . . . . . . . . . . . . . . . . . . . . . . . 45.29 28
Enrolment3.1.1 Vocational enrolment . . . . . . . . . . . . . . . . . . . . . . . . . . . . . . . . . . . . . . . . . 57.87 103.1.2 Tertiary enrolment . . . . . . . . . . . . . . . . . . . . . . . . . . . . . . . . . . . . . . . . . . . . 50.13 37
Quality3.1.3 Tertiary education expenditure . . . . . . . . . . . . . . . . . . . . . . . . . . . . . . .16.69 763.1.4 Reading, maths, and science . . . . . . . . . . . . . . . . . . . . . . . . . . . . . . . . . . 71.39 273.1.5 University ranking . . . . . . . . . . . . . . . . . . . . . . . . . . . . . . . . . . . . . . . . . . . . .30.36 403.2 Lifelong Learning . . . . . . . . . . . . . . . . . . . . . . . . . . . . . . . . . . . . . . . . . . .58.88 303.2.1 Quality of management schools . . . . . . . . . . . . . . . . . . . . . . . . . . . . . .49.69 583.2.2 Prevalence of training in firms . . . . . . . . . . . . . . . . . . . . . . . . . . . . . . . . .68.21 143.2.3 Employee development . . . . . . . . . . . . . . . . . . . . . . . . . . . . . . . . . . . . . . 58.74 313.3 Access to Growth Opportunities . . . . . . . . . . . . . . . . . . . . . . . . . . . 60.94 29
Empowerment3.3.1 Delegation of authority . . . . . . . . . . . . . . . . . . . . . . . . . . . . . . . . . . . . . . .66.57 263.3.2 Personal rights . . . . . . . . . . . . . . . . . . . . . . . . . . . . . . . . . . . . . . . . . . . . . . . .92.98 29
Collaboration3.3.3 Use of virtual social networks . . . . . . . . . . . . . . . . . . . . . . . . . . . . . . . . .85.87 283.3.4 Use of virtual professional networks . . . . . . . . . . . . . . . . . . . . . . . . . . 15.63 433.3.5 Collaboration within organisations . . . . . . . . . . . . . . . . . . . . . . . . . . . . 61.09 333.3.6 Collaboration across organisations . . . . . . . . . . . . . . . . . . . . . . . . . . . .43.50 53
4 RETAIN . . . . . . . . . . . . . . . . . . . . . . . . . . . . . . . . . . . . . . . . . . . . 74.10 224.1 Sustainability . . . . . . . . . . . . . . . . . . . . . . . . . . . . . . . . . . . . . . . . . . . . . . . 70.50 234.1.1 Pension system . . . . . . . . . . . . . . . . . . . . . . . . . . . . . . . . . . . . . . . . . . . . . . .92.00 124.1.2 Social protection . . . . . . . . . . . . . . . . . . . . . . . . . . . . . . . . . . . . . . . . . . . . . .70.38 264.1.3 Brain retention . . . . . . . . . . . . . . . . . . . . . . . . . . . . . . . . . . . . . . . . . . . . . . . . 49.12 484.2 Lifestyle . . . . . . . . . . . . . . . . . . . . . . . . . . . . . . . . . . . . . . . . . . . . . . . . . . . . 77.70 194.2.1 Environmental performance . . . . . . . . . . . . . . . . . . . . . . . . . . . . . . . . . . 67.09 324.2.2 Personal safety . . . . . . . . . . . . . . . . . . . . . . . . . . . . . . . . . . . . . . . . . . . . . . . .85.98 164.2.3 Physician density . . . . . . . . . . . . . . . . . . . . . . . . . . . . . . . . . . . . . . . . . . . . . .58.66 184.2.4 Sanitation . . . . . . . . . . . . . . . . . . . . . . . . . . . . . . . . . . . . . . . . . . . . . . . . . . . . .99.07 29
5 VOCATIONAL AND TECHNICAL SKILLS . . . . . . . . . . . . 63.49 215.1 Mid-Level Skills . . . . . . . . . . . . . . . . . . . . . . . . . . . . . . . . . . . . . . . . . . . . . 78.06 25.1.1 Workforce with secondary education . . . . . . . . . . . . . . . . . . . . . . . . .95.36 35.1.2 Population with secondary education . . . . . . . . . . . . . . . . . . . . . . . .98.90 25.1.3 Technicians and associate professionals . . . . . . . . . . . . . . . . . . . . . . . 75.49 125.1.4 Labour productivity per employee . . . . . . . . . . . . . . . . . . . . . . . . . . . . 42.47 375.2 Employability . . . . . . . . . . . . . . . . . . . . . . . . . . . . . . . . . . . . . . . . . . . . . . . 48.93 665.2.1 Ease of finding skilled employees . . . . . . . . . . . . . . . . . . . . . . . . . . . . .33.67 1195.2.2 Relevance of education system to the economy . . . . . . . . . . . . . .43.21 685.2.3 Skills matching with secondary education . . . . . . . . . . . . . . . . . . . . 57.09 365.2.4 Skills matching with tertiary education . . . . . . . . . . . . . . . . . . . . . . . . 61.74 47
6 GLOBAL KNOWLEDGE SKILLS . . . . . . . . . . . . . . . . . . . . 43.00 306.1 High-Level Skills . . . . . . . . . . . . . . . . . . . . . . . . . . . . . . . . . . . . . . . . . . . . 38.54 446.1.1 Workforce with tertiary education . . . . . . . . . . . . . . . . . . . . . . . . . . . .36.94 526.1.2 Population with tertiary education . . . . . . . . . . . . . . . . . . . . . . . . . . . . 31.47 516.1.3 Professionals . . . . . . . . . . . . . . . . . . . . . . . . . . . . . . . . . . . . . . . . . . . . . . . . . . 41.90 396.1.4 Researchers . . . . . . . . . . . . . . . . . . . . . . . . . . . . . . . . . . . . . . . . . . . . . . . . . . .44.65 256.1.5 Senior officials and managers . . . . . . . . . . . . . . . . . . . . . . . . . . . . . . . . . 27.46 566.1.6 Availability of scientists and engineers . . . . . . . . . . . . . . . . . . . . . . . .48.81 676.2 Talent Impact . . . . . . . . . . . . . . . . . . . . . . . . . . . . . . . . . . . . . . . . . . . . . . . 47.47 236.2.1 Innovation output . . . . . . . . . . . . . . . . . . . . . . . . . . . . . . . . . . . . . . . . . . . .64.80 196.2.2 High-value exports . . . . . . . . . . . . . . . . . . . . . . . . . . . . . . . . . . . . . . . . . . . .39.73 266.2.3 New product entrepreneurial activity . . . . . . . . . . . . . . . . . . . . . . . . .53.81 406.2.4 New business density . . . . . . . . . . . . . . . . . . . . . . . . . . . . . . . . . . . . . . . . . 19.15 306.2.5 Scientific journal articles . . . . . . . . . . . . . . . . . . . . . . . . . . . . . . . . . . . . . .59.86 13
l Czech Republic l Income group average

GTCI 2020 Country Profile by Pillar
160 THE GLOBAL TALENT COMPETITIVENESS INDEX 2020
COUNTRY PROFILESCOUNTRY PROFILES
102030405060708090100
Global knowledge skills
Vocational andtechnical skills
Retain
Grow
Attract
Enable
102030405060607
DENMARKKey Indicators
Rank (out of 132) . . . . . . . . . . . . . . . . . . . . . . . . . . . . . . . . . . . . . . . . . . .5Income group . . . . . . . . . . . . . . . . . . . . . . . . . . . . . . . . . . . . High incomeRegional group . . . . . . . . . . . . . . . . . . . . . . . . . . . . . . . . . . . . . . . . .EuropePopulation (millions) . . . . . . . . . . . . . . . . . . . . . . . . . . . . . . . . . . . . . 5.80
GDP per capita (PPP US$) . . . . . . . . . . . . . . . . . . . . . . . . . . . . 56,120.13GDP (US$ billions) . . . . . . . . . . . . . . . . . . . . . . . . . . . . . . . . . . . . . 351.30GTCI score . . . . . . . . . . . . . . . . . . . . . . . . . . . . . . . . . . . . . . . . . . . . . . 75.18GTCI score (income group average) . . . . . . . . . . . . . . . . . . . . . . . . 61.46
Score Rank
1 ENABLE . . . . . . . . . . . . . . . . . . . . . . . . . . . . . . . . . . . . . . . . . . 85.45 61.1 Regulatory Landscape . . . . . . . . . . . . . . . . . . . . . . . . . . . . . . . . . . . . . . 91.64 91.1.1 Government effectiveness . . . . . . . . . . . . . . . . . . . . . . . . . . . . . . . . . . . . 90.10 81.1.2 Rule of law . . . . . . . . . . . . . . . . . . . . . . . . . . . . . . . . . . . . . . . . . . . . . . . . . . . . 96.19 61.1.3 Political stability . . . . . . . . . . . . . . . . . . . . . . . . . . . . . . . . . . . . . . . . . . . . . . .84.02 261.1.4 Regulatory quality. . . . . . . . . . . . . . . . . . . . . . . . . . . . . . . . . . . . . . . . . . . . . 87.88 151.1.5 Corruption . . . . . . . . . . . . . . . . . . . . . . . . . . . . . . . . . . . . . . . . . . . . . . . . . . 100.00 11.2 Market Landscape . . . . . . . . . . . . . . . . . . . . . . . . . . . . . . . . . . . . . . . . . . 80.27 91.2.1 Competition intensity . . . . . . . . . . . . . . . . . . . . . . . . . . . . . . . . . . . . . . . . .72.71 491.2.2 Ease of doing business . . . . . . . . . . . . . . . . . . . . . . . . . . . . . . . . . . . . . . . .96.52 31.2.3 Cluster development . . . . . . . . . . . . . . . . . . . . . . . . . . . . . . . . . . . . . . . . . .73.27 181.2.4 R&D expenditure . . . . . . . . . . . . . . . . . . . . . . . . . . . . . . . . . . . . . . . . . . . . . . 67.70 71.2.5 ICT infrastructure. . . . . . . . . . . . . . . . . . . . . . . . . . . . . . . . . . . . . . . . . . . . . .85.37 131.2.6 Urban population . . . . . . . . . . . . . . . . . . . . . . . . . . . . . . . . . . . . . . . . . . . . .86.06 161.3 Business and Labour Landscape . . . . . . . . . . . . . . . . . . . . . . . . . . . .84.44 6
Labour Market1.3.1 Tertiary-educated unemployment . . . . . . . . . . . . . . . . . . . . . . . . . . . .86.73 421.3.2 Active labour market policies . . . . . . . . . . . . . . . . . . . . . . . . . . . . . . . . .88.94 71.3.3 Labour-employer cooperation . . . . . . . . . . . . . . . . . . . . . . . . . . . . . . . .89.37 4
Management Practice1.3.4 Professional management . . . . . . . . . . . . . . . . . . . . . . . . . . . . . . . . . . . .92.99 91.3.5 Relationship of pay to productivity . . . . . . . . . . . . . . . . . . . . . . . . . . . . 77.95 8
Technology Adoption1.3.6 Technology utilisation. . . . . . . . . . . . . . . . . . . . . . . . . . . . . . . . . . . . . . . . . 91.77 81.3.7 Investment in emerging technologies . . . . . . . . . . . . . . . . . . . . . . . . 76.91 141.3.8 Robot density . . . . . . . . . . . . . . . . . . . . . . . . . . . . . . . . . . . . . . . . . . . . . . . . .70.85 6
2 ATTRACT . . . . . . . . . . . . . . . . . . . . . . . . . . . . . . . . . . . . . . . . . 72.55 142.1 External Openness . . . . . . . . . . . . . . . . . . . . . . . . . . . . . . . . . . . . . . . . . 65.12 18
Attract Business2.1.1 FDI and technology transfer . . . . . . . . . . . . . . . . . . . . . . . . . . . . . . . . . .82.89 132.1.2 Prevalence of foreign ownership . . . . . . . . . . . . . . . . . . . . . . . . . . . . . . 84.12 11
Attract People2.1.3 Migrant stock . . . . . . . . . . . . . . . . . . . . . . . . . . . . . . . . . . . . . . . . . . . . . . . . . 57.92 372.1.4 International students . . . . . . . . . . . . . . . . . . . . . . . . . . . . . . . . . . . . . . . . .39.65 162.1.5 Brain gain . . . . . . . . . . . . . . . . . . . . . . . . . . . . . . . . . . . . . . . . . . . . . . . . . . . . . 61.06 282.2 Internal Openness . . . . . . . . . . . . . . . . . . . . . . . . . . . . . . . . . . . . . . . . . . 79.97 11
Social Inclusion2.2.1 Tolerance of minorities . . . . . . . . . . . . . . . . . . . . . . . . . . . . . . . . . . . . . . . .63.33 382.2.2 Tolerance of immigrants . . . . . . . . . . . . . . . . . . . . . . . . . . . . . . . . . . . . . . 91.78 82.2.3 Social mobility . . . . . . . . . . . . . . . . . . . . . . . . . . . . . . . . . . . . . . . . . . . . . . . . 91.36 8
Gender Equality2.2.4 Female graduates . . . . . . . . . . . . . . . . . . . . . . . . . . . . . . . . . . . . . . . . . . . . . 71.21 662.2.5 Gender development gap . . . . . . . . . . . . . . . . . . . . . . . . . . . . . . . . . . . . 81.67 462.2.6 Leadership opportunities for women . . . . . . . . . . . . . . . . . . . . . . . . .80.45 12
Score Rank
3 GROW . . . . . . . . . . . . . . . . . . . . . . . . . . . . . . . . . . . . . . . . . . . . 73.60 73.1 Formal Education . . . . . . . . . . . . . . . . . . . . . . . . . . . . . . . . . . . . . . . . . . . 58.40 9
Enrolment3.1.1 Vocational enrolment . . . . . . . . . . . . . . . . . . . . . . . . . . . . . . . . . . . . . . . . .34.89 293.1.2 Tertiary enrolment . . . . . . . . . . . . . . . . . . . . . . . . . . . . . . . . . . . . . . . . . . . . 63.91 17
Quality3.1.3 Tertiary education expenditure . . . . . . . . . . . . . . . . . . . . . . . . . . . . . . . 57.25 23.1.4 Reading, maths, and science . . . . . . . . . . . . . . . . . . . . . . . . . . . . . . . . . . 77.73 153.1.5 University ranking . . . . . . . . . . . . . . . . . . . . . . . . . . . . . . . . . . . . . . . . . . . . .58.22 143.2 Lifelong Learning . . . . . . . . . . . . . . . . . . . . . . . . . . . . . . . . . . . . . . . . . . . 80.47 73.2.1 Quality of management schools . . . . . . . . . . . . . . . . . . . . . . . . . . . . . .78.87 113.2.2 Prevalence of training in firms . . . . . . . . . . . . . . . . . . . . . . . . . . . . . . . . . . .n/a n/a3.2.3 Employee development . . . . . . . . . . . . . . . . . . . . . . . . . . . . . . . . . . . . . .82.06 83.3 Access to Growth Opportunities . . . . . . . . . . . . . . . . . . . . . . . . . . . 81.94 4
Empowerment3.3.1 Delegation of authority . . . . . . . . . . . . . . . . . . . . . . . . . . . . . . . . . . . . . 100.00 13.3.2 Personal rights . . . . . . . . . . . . . . . . . . . . . . . . . . . . . . . . . . . . . . . . . . . . . . . .96.57 14
Collaboration3.3.3 Use of virtual social networks . . . . . . . . . . . . . . . . . . . . . . . . . . . . . . . . .83.86 373.3.4 Use of virtual professional networks . . . . . . . . . . . . . . . . . . . . . . . . . .56.94 83.3.5 Collaboration within organisations . . . . . . . . . . . . . . . . . . . . . . . . . . . .88.36 73.3.6 Collaboration across organisations . . . . . . . . . . . . . . . . . . . . . . . . . . . .65.89 17
4 RETAIN . . . . . . . . . . . . . . . . . . . . . . . . . . . . . . . . . . . . . . . . . . . 86.47 34.1 Sustainability . . . . . . . . . . . . . . . . . . . . . . . . . . . . . . . . . . . . . . . . . . . . . . . 89.21 54.1.1 Pension system . . . . . . . . . . . . . . . . . . . . . . . . . . . . . . . . . . . . . . . . . . . . . . .96.60 74.1.2 Social protection . . . . . . . . . . . . . . . . . . . . . . . . . . . . . . . . . . . . . . . . . . . . . .99.20 24.1.3 Brain retention . . . . . . . . . . . . . . . . . . . . . . . . . . . . . . . . . . . . . . . . . . . . . . . . 71.85 214.2 Lifestyle . . . . . . . . . . . . . . . . . . . . . . . . . . . . . . . . . . . . . . . . . . . . . . . . . . . . 83.72 84.2.1 Environmental performance . . . . . . . . . . . . . . . . . . . . . . . . . . . . . . . . . .90.30 34.2.2 Personal safety . . . . . . . . . . . . . . . . . . . . . . . . . . . . . . . . . . . . . . . . . . . . . . . .86.70 154.2.3 Physician density . . . . . . . . . . . . . . . . . . . . . . . . . . . . . . . . . . . . . . . . . . . . . .58.31 194.2.4 Sanitation . . . . . . . . . . . . . . . . . . . . . . . . . . . . . . . . . . . . . . . . . . . . . . . . . . . . .99.57 19
5 VOCATIONAL AND TECHNICAL SKILLS . . . . . . . . . . . . .69.20 105.1 Mid-Level Skills . . . . . . . . . . . . . . . . . . . . . . . . . . . . . . . . . . . . . . . . . . . . . 62.18 205.1.1 Workforce with secondary education . . . . . . . . . . . . . . . . . . . . . . . . .56.02 465.1.2 Population with secondary education . . . . . . . . . . . . . . . . . . . . . . . . 57.83 335.1.3 Technicians and associate professionals . . . . . . . . . . . . . . . . . . . . . . .76.22 115.1.4 Labour productivity per employee . . . . . . . . . . . . . . . . . . . . . . . . . . . .58.66 175.2 Employability . . . . . . . . . . . . . . . . . . . . . . . . . . . . . . . . . . . . . . . . . . . . . . . 76.21 145.2.1 Ease of finding skilled employees . . . . . . . . . . . . . . . . . . . . . . . . . . . . .75.58 205.2.2 Relevance of education system to the economy . . . . . . . . . . . . . . 74.07 125.2.3 Skills matching with secondary education . . . . . . . . . . . . . . . . . . . . 71.58 115.2.4 Skills matching with tertiary education . . . . . . . . . . . . . . . . . . . . . . . . 83.61 11
6 GLOBAL KNOWLEDGE SKILLS . . . . . . . . . . . . . . . . . . . . 63.82 66.1 High-Level Skills . . . . . . . . . . . . . . . . . . . . . . . . . . . . . . . . . . . . . . . . . . . . 59.09 156.1.1 Workforce with tertiary education . . . . . . . . . . . . . . . . . . . . . . . . . . . .54.23 256.1.2 Population with tertiary education . . . . . . . . . . . . . . . . . . . . . . . . . . . .56.42 166.1.3 Professionals . . . . . . . . . . . . . . . . . . . . . . . . . . . . . . . . . . . . . . . . . . . . . . . . . . 70.74 46.1.4 Researchers . . . . . . . . . . . . . . . . . . . . . . . . . . . . . . . . . . . . . . . . . . . . . . . . . . .95.71 26.1.5 Senior officials and managers . . . . . . . . . . . . . . . . . . . . . . . . . . . . . . . . .15.04 806.1.6 Availability of scientists and engineers . . . . . . . . . . . . . . . . . . . . . . . .62.43 396.2 Talent Impact . . . . . . . . . . . . . . . . . . . . . . . . . . . . . . . . . . . . . . . . . . . . . . . 68.55 16.2.1 Innovation output . . . . . . . . . . . . . . . . . . . . . . . . . . . . . . . . . . . . . . . . . . . . 71.98 126.2.2 High-value exports . . . . . . . . . . . . . . . . . . . . . . . . . . . . . . . . . . . . . . . . . . . . 33.47 356.2.3 New product entrepreneurial activity . . . . . . . . . . . . . . . . . . . . . . . . .96.38 46.2.4 New business density . . . . . . . . . . . . . . . . . . . . . . . . . . . . . . . . . . . . . . . . . 47.73 126.2.5 Scientific journal articles . . . . . . . . . . . . . . . . . . . . . . . . . . . . . . . . . . . . . .93.20 2
l Denmark l Income group average
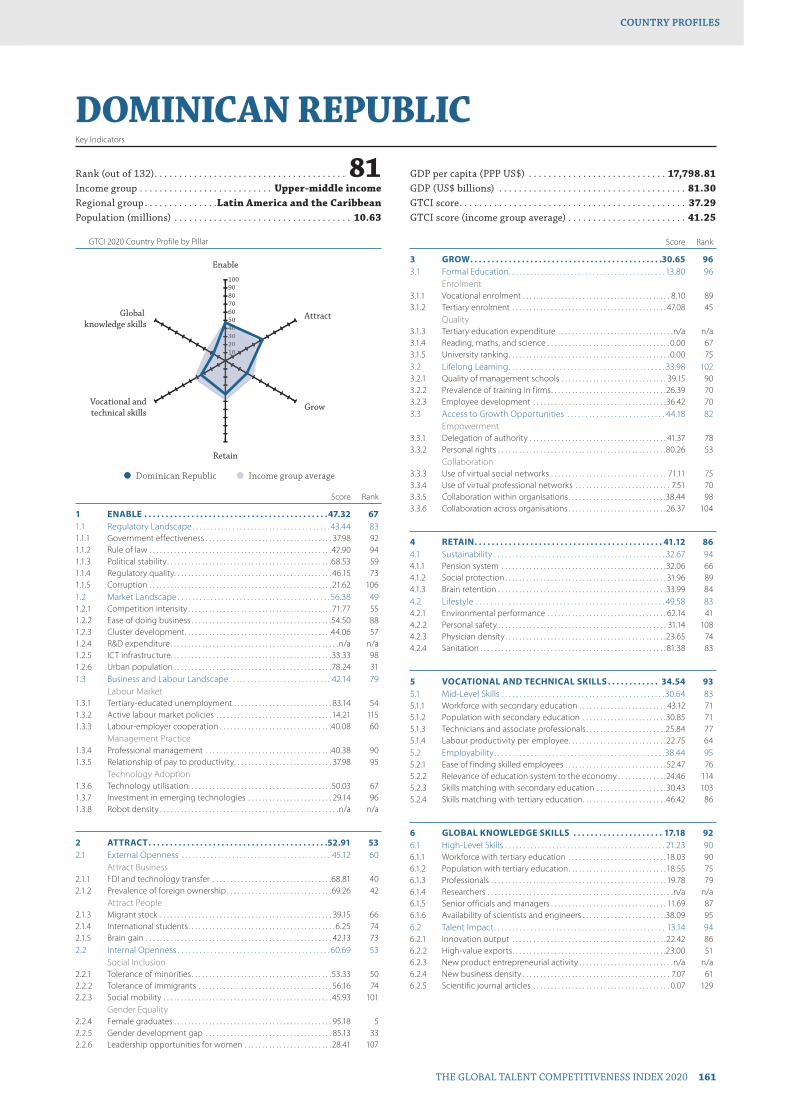
GTCI 2020 Country Profile by Pillar
THE GLOBAL TALENT COMPETITIVENESS INDEX 2020 161
COUNTRY PROFILESCOUNTRY PROFILES
102030405060708090100
Global knowledge skills
Vocational andtechnical skills
Retain
Grow
Attract
Enable
1020304040
DOMINICAN REPUBLICKey Indicators
Rank (out of 132) . . . . . . . . . . . . . . . . . . . . . . . . . . . . . . . . . . . . . . . 81Income group . . . . . . . . . . . . . . . . . . . . . . . . . . . Upper-middle incomeRegional group . . . . . . . . . . . . . . .Latin America and the CaribbeanPopulation (millions) . . . . . . . . . . . . . . . . . . . . . . . . . . . . . . . . . . . . 10.63
GDP per capita (PPP US$) . . . . . . . . . . . . . . . . . . . . . . . . . . . . 17,798.81GDP (US$ billions) . . . . . . . . . . . . . . . . . . . . . . . . . . . . . . . . . . . . . . 81.30GTCI score . . . . . . . . . . . . . . . . . . . . . . . . . . . . . . . . . . . . . . . . . . . . . . 37.29GTCI score (income group average) . . . . . . . . . . . . . . . . . . . . . . . . 41.25
Score Rank
1 ENABLE . . . . . . . . . . . . . . . . . . . . . . . . . . . . . . . . . . . . . . . . . . .47.32 671.1 Regulatory Landscape . . . . . . . . . . . . . . . . . . . . . . . . . . . . . . . . . . . . . . 43.44 831.1.1 Government effectiveness . . . . . . . . . . . . . . . . . . . . . . . . . . . . . . . . . . . . 37.98 921.1.2 Rule of law . . . . . . . . . . . . . . . . . . . . . . . . . . . . . . . . . . . . . . . . . . . . . . . . . . . .42.90 941.1.3 Political stability . . . . . . . . . . . . . . . . . . . . . . . . . . . . . . . . . . . . . . . . . . . . . . .68.53 591.1.4 Regulatory quality. . . . . . . . . . . . . . . . . . . . . . . . . . . . . . . . . . . . . . . . . . . . . 46.15 731.1.5 Corruption . . . . . . . . . . . . . . . . . . . . . . . . . . . . . . . . . . . . . . . . . . . . . . . . . . . . 21.62 1061.2 Market Landscape . . . . . . . . . . . . . . . . . . . . . . . . . . . . . . . . . . . . . . . . . . 56.38 491.2.1 Competition intensity . . . . . . . . . . . . . . . . . . . . . . . . . . . . . . . . . . . . . . . . . 71.77 551.2.2 Ease of doing business . . . . . . . . . . . . . . . . . . . . . . . . . . . . . . . . . . . . . . . .54.50 881.2.3 Cluster development . . . . . . . . . . . . . . . . . . . . . . . . . . . . . . . . . . . . . . . . . .44.06 571.2.4 R&D expenditure . . . . . . . . . . . . . . . . . . . . . . . . . . . . . . . . . . . . . . . . . . . . . . . .n/a n/a1.2.5 ICT infrastructure. . . . . . . . . . . . . . . . . . . . . . . . . . . . . . . . . . . . . . . . . . . . . .33.33 981.2.6 Urban population . . . . . . . . . . . . . . . . . . . . . . . . . . . . . . . . . . . . . . . . . . . . .78.24 311.3 Business and Labour Landscape . . . . . . . . . . . . . . . . . . . . . . . . . . . . 42.14 79
Labour Market1.3.1 Tertiary-educated unemployment . . . . . . . . . . . . . . . . . . . . . . . . . . . . 83.14 541.3.2 Active labour market policies . . . . . . . . . . . . . . . . . . . . . . . . . . . . . . . . . 14.21 1151.3.3 Labour-employer cooperation . . . . . . . . . . . . . . . . . . . . . . . . . . . . . . . .40.08 60
Management Practice1.3.4 Professional management . . . . . . . . . . . . . . . . . . . . . . . . . . . . . . . . . . . .40.38 901.3.5 Relationship of pay to productivity . . . . . . . . . . . . . . . . . . . . . . . . . . . . 37.98 95
Technology Adoption1.3.6 Technology utilisation. . . . . . . . . . . . . . . . . . . . . . . . . . . . . . . . . . . . . . . . .50.03 671.3.7 Investment in emerging technologies . . . . . . . . . . . . . . . . . . . . . . . . 29.14 961.3.8 Robot density . . . . . . . . . . . . . . . . . . . . . . . . . . . . . . . . . . . . . . . . . . . . . . . . . . .n/a n/a
2 ATTRACT . . . . . . . . . . . . . . . . . . . . . . . . . . . . . . . . . . . . . . . . . .52.91 532.1 External Openness . . . . . . . . . . . . . . . . . . . . . . . . . . . . . . . . . . . . . . . . . 45.12 60
Attract Business2.1.1 FDI and technology transfer . . . . . . . . . . . . . . . . . . . . . . . . . . . . . . . . . .68.81 402.1.2 Prevalence of foreign ownership . . . . . . . . . . . . . . . . . . . . . . . . . . . . . .69.26 42
Attract People2.1.3 Migrant stock . . . . . . . . . . . . . . . . . . . . . . . . . . . . . . . . . . . . . . . . . . . . . . . . . 39.15 662.1.4 International students . . . . . . . . . . . . . . . . . . . . . . . . . . . . . . . . . . . . . . . . . . 6.25 742.1.5 Brain gain . . . . . . . . . . . . . . . . . . . . . . . . . . . . . . . . . . . . . . . . . . . . . . . . . . . . . 42.13 732.2 Internal Openness . . . . . . . . . . . . . . . . . . . . . . . . . . . . . . . . . . . . . . . . . . 60.69 53
Social Inclusion2.2.1 Tolerance of minorities . . . . . . . . . . . . . . . . . . . . . . . . . . . . . . . . . . . . . . . .53.33 502.2.2 Tolerance of immigrants . . . . . . . . . . . . . . . . . . . . . . . . . . . . . . . . . . . . . . 56.16 742.2.3 Social mobility . . . . . . . . . . . . . . . . . . . . . . . . . . . . . . . . . . . . . . . . . . . . . . . . 45.93 101
Gender Equality2.2.4 Female graduates . . . . . . . . . . . . . . . . . . . . . . . . . . . . . . . . . . . . . . . . . . . . . 95.18 52.2.5 Gender development gap . . . . . . . . . . . . . . . . . . . . . . . . . . . . . . . . . . . . 85.13 332.2.6 Leadership opportunities for women . . . . . . . . . . . . . . . . . . . . . . . . . 28.41 107
Score Rank
3 GROW . . . . . . . . . . . . . . . . . . . . . . . . . . . . . . . . . . . . . . . . . . . . .30.65 963.1 Formal Education . . . . . . . . . . . . . . . . . . . . . . . . . . . . . . . . . . . . . . . . . . . 13.80 96
Enrolment3.1.1 Vocational enrolment . . . . . . . . . . . . . . . . . . . . . . . . . . . . . . . . . . . . . . . . . . 8.10 893.1.2 Tertiary enrolment . . . . . . . . . . . . . . . . . . . . . . . . . . . . . . . . . . . . . . . . . . . . 47.08 45
Quality3.1.3 Tertiary education expenditure . . . . . . . . . . . . . . . . . . . . . . . . . . . . . . . . .n/a n/a3.1.4 Reading, maths, and science . . . . . . . . . . . . . . . . . . . . . . . . . . . . . . . . . . . 0.00 673.1.5 University ranking . . . . . . . . . . . . . . . . . . . . . . . . . . . . . . . . . . . . . . . . . . . . . . 0.00 753.2 Lifelong Learning . . . . . . . . . . . . . . . . . . . . . . . . . . . . . . . . . . . . . . . . . . . 33.98 1023.2.1 Quality of management schools . . . . . . . . . . . . . . . . . . . . . . . . . . . . . . 39.15 903.2.2 Prevalence of training in firms . . . . . . . . . . . . . . . . . . . . . . . . . . . . . . . . .26.39 703.2.3 Employee development . . . . . . . . . . . . . . . . . . . . . . . . . . . . . . . . . . . . . .36.42 703.3 Access to Growth Opportunities . . . . . . . . . . . . . . . . . . . . . . . . . . . 44.18 82
Empowerment3.3.1 Delegation of authority . . . . . . . . . . . . . . . . . . . . . . . . . . . . . . . . . . . . . . . 41.37 783.3.2 Personal rights . . . . . . . . . . . . . . . . . . . . . . . . . . . . . . . . . . . . . . . . . . . . . . . .80.26 53
Collaboration3.3.3 Use of virtual social networks . . . . . . . . . . . . . . . . . . . . . . . . . . . . . . . . . 71.11 753.3.4 Use of virtual professional networks . . . . . . . . . . . . . . . . . . . . . . . . . . . 7.51 703.3.5 Collaboration within organisations . . . . . . . . . . . . . . . . . . . . . . . . . . . .38.44 983.3.6 Collaboration across organisations . . . . . . . . . . . . . . . . . . . . . . . . . . . .26.37 104
4 RETAIN . . . . . . . . . . . . . . . . . . . . . . . . . . . . . . . . . . . . . . . . . . . . 41.12 864.1 Sustainability . . . . . . . . . . . . . . . . . . . . . . . . . . . . . . . . . . . . . . . . . . . . . . . 32.67 944.1.1 Pension system . . . . . . . . . . . . . . . . . . . . . . . . . . . . . . . . . . . . . . . . . . . . . . .32.06 664.1.2 Social protection . . . . . . . . . . . . . . . . . . . . . . . . . . . . . . . . . . . . . . . . . . . . . . 31.96 894.1.3 Brain retention . . . . . . . . . . . . . . . . . . . . . . . . . . . . . . . . . . . . . . . . . . . . . . . .33.99 844.2 Lifestyle . . . . . . . . . . . . . . . . . . . . . . . . . . . . . . . . . . . . . . . . . . . . . . . . . . . . 49.58 834.2.1 Environmental performance . . . . . . . . . . . . . . . . . . . . . . . . . . . . . . . . . . 62.14 414.2.2 Personal safety . . . . . . . . . . . . . . . . . . . . . . . . . . . . . . . . . . . . . . . . . . . . . . . . 31.14 1084.2.3 Physician density . . . . . . . . . . . . . . . . . . . . . . . . . . . . . . . . . . . . . . . . . . . . . .23.65 744.2.4 Sanitation . . . . . . . . . . . . . . . . . . . . . . . . . . . . . . . . . . . . . . . . . . . . . . . . . . . . . 81.38 83
5 VOCATIONAL AND TECHNICAL SKILLS . . . . . . . . . . . . 34.54 935.1 Mid-Level Skills . . . . . . . . . . . . . . . . . . . . . . . . . . . . . . . . . . . . . . . . . . . . .30.64 835.1.1 Workforce with secondary education . . . . . . . . . . . . . . . . . . . . . . . . . 43.12 715.1.2 Population with secondary education . . . . . . . . . . . . . . . . . . . . . . . .30.85 715.1.3 Technicians and associate professionals . . . . . . . . . . . . . . . . . . . . . . .25.84 775.1.4 Labour productivity per employee . . . . . . . . . . . . . . . . . . . . . . . . . . . .22.75 645.2 Employability . . . . . . . . . . . . . . . . . . . . . . . . . . . . . . . . . . . . . . . . . . . . . . .38.44 955.2.1 Ease of finding skilled employees . . . . . . . . . . . . . . . . . . . . . . . . . . . . . 52.47 765.2.2 Relevance of education system to the economy . . . . . . . . . . . . . .24.46 1145.2.3 Skills matching with secondary education . . . . . . . . . . . . . . . . . . . .30.43 1035.2.4 Skills matching with tertiary education . . . . . . . . . . . . . . . . . . . . . . . .46.42 86
6 GLOBAL KNOWLEDGE SKILLS . . . . . . . . . . . . . . . . . . . . . 17.18 926.1 High-Level Skills . . . . . . . . . . . . . . . . . . . . . . . . . . . . . . . . . . . . . . . . . . . . 21.23 906.1.1 Workforce with tertiary education . . . . . . . . . . . . . . . . . . . . . . . . . . . .18.03 906.1.2 Population with tertiary education . . . . . . . . . . . . . . . . . . . . . . . . . . . . 18.55 756.1.3 Professionals . . . . . . . . . . . . . . . . . . . . . . . . . . . . . . . . . . . . . . . . . . . . . . . . . . 19.78 796.1.4 Researchers . . . . . . . . . . . . . . . . . . . . . . . . . . . . . . . . . . . . . . . . . . . . . . . . . . . . .n/a n/a6.1.5 Senior officials and managers . . . . . . . . . . . . . . . . . . . . . . . . . . . . . . . . . 11.69 876.1.6 Availability of scientists and engineers . . . . . . . . . . . . . . . . . . . . . . . .38.09 956.2 Talent Impact . . . . . . . . . . . . . . . . . . . . . . . . . . . . . . . . . . . . . . . . . . . . . . . 13.14 946.2.1 Innovation output . . . . . . . . . . . . . . . . . . . . . . . . . . . . . . . . . . . . . . . . . . . .22.42 866.2.2 High-value exports . . . . . . . . . . . . . . . . . . . . . . . . . . . . . . . . . . . . . . . . . . . .23.00 516.2.3 New product entrepreneurial activity . . . . . . . . . . . . . . . . . . . . . . . . . . .n/a n/a6.2.4 New business density . . . . . . . . . . . . . . . . . . . . . . . . . . . . . . . . . . . . . . . . . . 7.07 616.2.5 Scientific journal articles . . . . . . . . . . . . . . . . . . . . . . . . . . . . . . . . . . . . . . . 0.07 129
l Dominican Republic l Income group average
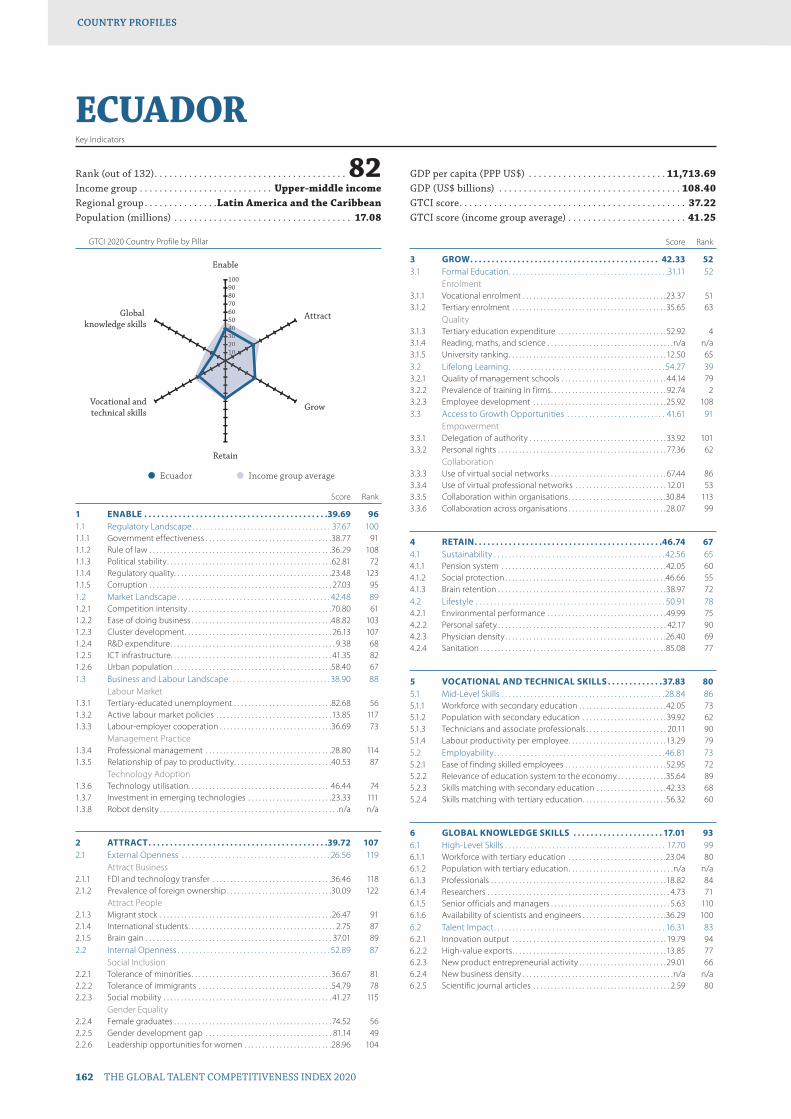
GTCI 2020 Country Profile by Pillar
162 THE GLOBAL TALENT COMPETITIVENESS INDEX 2020
COUNTRY PROFILESCOUNTRY PROFILES
102030405060708090100
Global knowledge skills
Vocational andtechnical skills
Retain
Grow
Attract
Enable
1020304040
ECUADORKey Indicators
Rank (out of 132) . . . . . . . . . . . . . . . . . . . . . . . . . . . . . . . . . . . . . . . 82Income group . . . . . . . . . . . . . . . . . . . . . . . . . . . Upper-middle incomeRegional group . . . . . . . . . . . . . . .Latin America and the CaribbeanPopulation (millions) . . . . . . . . . . . . . . . . . . . . . . . . . . . . . . . . . . . . 17.08
GDP per capita (PPP US$) . . . . . . . . . . . . . . . . . . . . . . . . . . . . 11,713.69GDP (US$ billions) . . . . . . . . . . . . . . . . . . . . . . . . . . . . . . . . . . . . . 108.40GTCI score . . . . . . . . . . . . . . . . . . . . . . . . . . . . . . . . . . . . . . . . . . . . . . 37.22GTCI score (income group average) . . . . . . . . . . . . . . . . . . . . . . . . 41.25
Score Rank
1 ENABLE . . . . . . . . . . . . . . . . . . . . . . . . . . . . . . . . . . . . . . . . . . .39.69 961.1 Regulatory Landscape . . . . . . . . . . . . . . . . . . . . . . . . . . . . . . . . . . . . . . 37.67 1001.1.1 Government effectiveness . . . . . . . . . . . . . . . . . . . . . . . . . . . . . . . . . . . .38.77 911.1.2 Rule of law . . . . . . . . . . . . . . . . . . . . . . . . . . . . . . . . . . . . . . . . . . . . . . . . . . . .36.29 1081.1.3 Political stability . . . . . . . . . . . . . . . . . . . . . . . . . . . . . . . . . . . . . . . . . . . . . . .62.81 721.1.4 Regulatory quality. . . . . . . . . . . . . . . . . . . . . . . . . . . . . . . . . . . . . . . . . . . . .23.48 1231.1.5 Corruption . . . . . . . . . . . . . . . . . . . . . . . . . . . . . . . . . . . . . . . . . . . . . . . . . . . . 27.03 951.2 Market Landscape . . . . . . . . . . . . . . . . . . . . . . . . . . . . . . . . . . . . . . . . . . 42.48 891.2.1 Competition intensity . . . . . . . . . . . . . . . . . . . . . . . . . . . . . . . . . . . . . . . . .70.80 611.2.2 Ease of doing business . . . . . . . . . . . . . . . . . . . . . . . . . . . . . . . . . . . . . . . .48.82 1031.2.3 Cluster development . . . . . . . . . . . . . . . . . . . . . . . . . . . . . . . . . . . . . . . . . . 26.13 1071.2.4 R&D expenditure . . . . . . . . . . . . . . . . . . . . . . . . . . . . . . . . . . . . . . . . . . . . . . . 9.38 681.2.5 ICT infrastructure. . . . . . . . . . . . . . . . . . . . . . . . . . . . . . . . . . . . . . . . . . . . . . 41.35 821.2.6 Urban population . . . . . . . . . . . . . . . . . . . . . . . . . . . . . . . . . . . . . . . . . . . . .58.40 671.3 Business and Labour Landscape . . . . . . . . . . . . . . . . . . . . . . . . . . . . 38.90 88
Labour Market1.3.1 Tertiary-educated unemployment . . . . . . . . . . . . . . . . . . . . . . . . . . . .82.68 561.3.2 Active labour market policies . . . . . . . . . . . . . . . . . . . . . . . . . . . . . . . . . 13.85 1171.3.3 Labour-employer cooperation . . . . . . . . . . . . . . . . . . . . . . . . . . . . . . . .36.69 73
Management Practice1.3.4 Professional management . . . . . . . . . . . . . . . . . . . . . . . . . . . . . . . . . . . .28.80 1141.3.5 Relationship of pay to productivity . . . . . . . . . . . . . . . . . . . . . . . . . . . .40.53 87
Technology Adoption1.3.6 Technology utilisation. . . . . . . . . . . . . . . . . . . . . . . . . . . . . . . . . . . . . . . . 46.44 741.3.7 Investment in emerging technologies . . . . . . . . . . . . . . . . . . . . . . . .23.33 1111.3.8 Robot density . . . . . . . . . . . . . . . . . . . . . . . . . . . . . . . . . . . . . . . . . . . . . . . . . . .n/a n/a
2 ATTRACT . . . . . . . . . . . . . . . . . . . . . . . . . . . . . . . . . . . . . . . . . .39.72 1072.1 External Openness . . . . . . . . . . . . . . . . . . . . . . . . . . . . . . . . . . . . . . . . . 26.56 119
Attract Business2.1.1 FDI and technology transfer . . . . . . . . . . . . . . . . . . . . . . . . . . . . . . . . . .36.46 1182.1.2 Prevalence of foreign ownership . . . . . . . . . . . . . . . . . . . . . . . . . . . . . .30.09 122
Attract People2.1.3 Migrant stock . . . . . . . . . . . . . . . . . . . . . . . . . . . . . . . . . . . . . . . . . . . . . . . . .26.47 912.1.4 International students . . . . . . . . . . . . . . . . . . . . . . . . . . . . . . . . . . . . . . . . . . 2.75 872.1.5 Brain gain . . . . . . . . . . . . . . . . . . . . . . . . . . . . . . . . . . . . . . . . . . . . . . . . . . . . . 37.01 892.2 Internal Openness . . . . . . . . . . . . . . . . . . . . . . . . . . . . . . . . . . . . . . . . . . 52.89 87
Social Inclusion2.2.1 Tolerance of minorities . . . . . . . . . . . . . . . . . . . . . . . . . . . . . . . . . . . . . . . .36.67 812.2.2 Tolerance of immigrants . . . . . . . . . . . . . . . . . . . . . . . . . . . . . . . . . . . . . .54.79 782.2.3 Social mobility . . . . . . . . . . . . . . . . . . . . . . . . . . . . . . . . . . . . . . . . . . . . . . . . 41.27 115
Gender Equality2.2.4 Female graduates . . . . . . . . . . . . . . . . . . . . . . . . . . . . . . . . . . . . . . . . . . . . . 74.52 562.2.5 Gender development gap . . . . . . . . . . . . . . . . . . . . . . . . . . . . . . . . . . . . 81.14 492.2.6 Leadership opportunities for women . . . . . . . . . . . . . . . . . . . . . . . . .28.96 104
Score Rank
3 GROW . . . . . . . . . . . . . . . . . . . . . . . . . . . . . . . . . . . . . . . . . . . . 42.33 523.1 Formal Education . . . . . . . . . . . . . . . . . . . . . . . . . . . . . . . . . . . . . . . . . . . .31.11 52
Enrolment3.1.1 Vocational enrolment . . . . . . . . . . . . . . . . . . . . . . . . . . . . . . . . . . . . . . . . .23.37 513.1.2 Tertiary enrolment . . . . . . . . . . . . . . . . . . . . . . . . . . . . . . . . . . . . . . . . . . . .35.65 63
Quality3.1.3 Tertiary education expenditure . . . . . . . . . . . . . . . . . . . . . . . . . . . . . . . 52.92 43.1.4 Reading, maths, and science . . . . . . . . . . . . . . . . . . . . . . . . . . . . . . . . . . . .n/a n/a3.1.5 University ranking . . . . . . . . . . . . . . . . . . . . . . . . . . . . . . . . . . . . . . . . . . . . . 12.50 653.2 Lifelong Learning . . . . . . . . . . . . . . . . . . . . . . . . . . . . . . . . . . . . . . . . . . . 54.27 393.2.1 Quality of management schools . . . . . . . . . . . . . . . . . . . . . . . . . . . . . . 44.14 793.2.2 Prevalence of training in firms . . . . . . . . . . . . . . . . . . . . . . . . . . . . . . . . . 92.74 23.2.3 Employee development . . . . . . . . . . . . . . . . . . . . . . . . . . . . . . . . . . . . . .25.92 1083.3 Access to Growth Opportunities . . . . . . . . . . . . . . . . . . . . . . . . . . . 41.61 91
Empowerment3.3.1 Delegation of authority . . . . . . . . . . . . . . . . . . . . . . . . . . . . . . . . . . . . . . . 33.92 1013.3.2 Personal rights . . . . . . . . . . . . . . . . . . . . . . . . . . . . . . . . . . . . . . . . . . . . . . . . 77.36 62
Collaboration3.3.3 Use of virtual social networks . . . . . . . . . . . . . . . . . . . . . . . . . . . . . . . . . 67.44 863.3.4 Use of virtual professional networks . . . . . . . . . . . . . . . . . . . . . . . . . . 12.01 533.3.5 Collaboration within organisations . . . . . . . . . . . . . . . . . . . . . . . . . . . .30.84 1133.3.6 Collaboration across organisations . . . . . . . . . . . . . . . . . . . . . . . . . . . .28.07 99
4 RETAIN . . . . . . . . . . . . . . . . . . . . . . . . . . . . . . . . . . . . . . . . . . . .46.74 674.1 Sustainability . . . . . . . . . . . . . . . . . . . . . . . . . . . . . . . . . . . . . . . . . . . . . . . 42.56 654.1.1 Pension system . . . . . . . . . . . . . . . . . . . . . . . . . . . . . . . . . . . . . . . . . . . . . . .42.05 604.1.2 Social protection . . . . . . . . . . . . . . . . . . . . . . . . . . . . . . . . . . . . . . . . . . . . . .46.66 554.1.3 Brain retention . . . . . . . . . . . . . . . . . . . . . . . . . . . . . . . . . . . . . . . . . . . . . . . .38.97 724.2 Lifestyle . . . . . . . . . . . . . . . . . . . . . . . . . . . . . . . . . . . . . . . . . . . . . . . . . . . . 50.91 784.2.1 Environmental performance . . . . . . . . . . . . . . . . . . . . . . . . . . . . . . . . . .49.99 754.2.2 Personal safety . . . . . . . . . . . . . . . . . . . . . . . . . . . . . . . . . . . . . . . . . . . . . . . . 42.17 904.2.3 Physician density . . . . . . . . . . . . . . . . . . . . . . . . . . . . . . . . . . . . . . . . . . . . . .26.40 694.2.4 Sanitation . . . . . . . . . . . . . . . . . . . . . . . . . . . . . . . . . . . . . . . . . . . . . . . . . . . . .85.08 77
5 VOCATIONAL AND TECHNICAL SKILLS . . . . . . . . . . . . .37.83 805.1 Mid-Level Skills . . . . . . . . . . . . . . . . . . . . . . . . . . . . . . . . . . . . . . . . . . . . .28.84 865.1.1 Workforce with secondary education . . . . . . . . . . . . . . . . . . . . . . . . .42.05 735.1.2 Population with secondary education . . . . . . . . . . . . . . . . . . . . . . . . 39.92 625.1.3 Technicians and associate professionals . . . . . . . . . . . . . . . . . . . . . . . 20.11 905.1.4 Labour productivity per employee . . . . . . . . . . . . . . . . . . . . . . . . . . . .13.29 795.2 Employability . . . . . . . . . . . . . . . . . . . . . . . . . . . . . . . . . . . . . . . . . . . . . . . 46.81 735.2.1 Ease of finding skilled employees . . . . . . . . . . . . . . . . . . . . . . . . . . . . .52.95 725.2.2 Relevance of education system to the economy . . . . . . . . . . . . . .35.64 895.2.3 Skills matching with secondary education . . . . . . . . . . . . . . . . . . . .42.33 685.2.4 Skills matching with tertiary education . . . . . . . . . . . . . . . . . . . . . . . .56.32 60
6 GLOBAL KNOWLEDGE SKILLS . . . . . . . . . . . . . . . . . . . . . 17.01 936.1 High-Level Skills . . . . . . . . . . . . . . . . . . . . . . . . . . . . . . . . . . . . . . . . . . . . 17.70 996.1.1 Workforce with tertiary education . . . . . . . . . . . . . . . . . . . . . . . . . . . .23.04 806.1.2 Population with tertiary education . . . . . . . . . . . . . . . . . . . . . . . . . . . . . .n/a n/a6.1.3 Professionals . . . . . . . . . . . . . . . . . . . . . . . . . . . . . . . . . . . . . . . . . . . . . . . . . .18.82 846.1.4 Researchers . . . . . . . . . . . . . . . . . . . . . . . . . . . . . . . . . . . . . . . . . . . . . . . . . . . . 4.73 716.1.5 Senior officials and managers . . . . . . . . . . . . . . . . . . . . . . . . . . . . . . . . . . 5.63 1106.1.6 Availability of scientists and engineers . . . . . . . . . . . . . . . . . . . . . . . .36.29 1006.2 Talent Impact . . . . . . . . . . . . . . . . . . . . . . . . . . . . . . . . . . . . . . . . . . . . . . . 16.31 836.2.1 Innovation output . . . . . . . . . . . . . . . . . . . . . . . . . . . . . . . . . . . . . . . . . . . . 19.79 946.2.2 High-value exports . . . . . . . . . . . . . . . . . . . . . . . . . . . . . . . . . . . . . . . . . . . . 13.85 776.2.3 New product entrepreneurial activity . . . . . . . . . . . . . . . . . . . . . . . . . 29.01 666.2.4 New business density . . . . . . . . . . . . . . . . . . . . . . . . . . . . . . . . . . . . . . . . . . .n/a n/a6.2.5 Scientific journal articles . . . . . . . . . . . . . . . . . . . . . . . . . . . . . . . . . . . . . . . 2.59 80
l Ecuador l Income group average

GTCI 2020 Country Profile by Pillar
THE GLOBAL TALENT COMPETITIVENESS INDEX 2020 163
COUNTRY PROFILESCOUNTRY PROFILES
102030405060708090100
Global knowledge skills
Vocational andtechnical skills
Retain
Grow
Attract
Enable
10203004
EGYPTKey Indicators
Rank (out of 132) . . . . . . . . . . . . . . . . . . . . . . . . . . . . . . . . . . . . . . . 97Income group . . . . . . . . . . . . . . . . . . . . . . . . . . . Lower-middle incomeRegional group . . . . . . . . . . . . . .Northern Africa and Western AsiaPopulation (millions) . . . . . . . . . . . . . . . . . . . . . . . . . . . . . . . . . . . . 98.42
GDP per capita (PPP US$) . . . . . . . . . . . . . . . . . . . . . . . . . . . .12,390.42GDP (US$ billions) . . . . . . . . . . . . . . . . . . . . . . . . . . . . . . . . . . . . . 250.90GTCI score . . . . . . . . . . . . . . . . . . . . . . . . . . . . . . . . . . . . . . . . . . . . . . 34.79GTCI score (income group average) . . . . . . . . . . . . . . . . . . . . . . . . 32.97
Score Rank
1 ENABLE . . . . . . . . . . . . . . . . . . . . . . . . . . . . . . . . . . . . . . . . . . 36.66 1051.1 Regulatory Landscape . . . . . . . . . . . . . . . . . . . . . . . . . . . . . . . . . . . . . . 32.19 1131.1.1 Government effectiveness . . . . . . . . . . . . . . . . . . . . . . . . . . . . . . . . . . . . 31.53 1051.1.2 Rule of law . . . . . . . . . . . . . . . . . . . . . . . . . . . . . . . . . . . . . . . . . . . . . . . . . . . . 40.17 991.1.3 Political stability . . . . . . . . . . . . . . . . . . . . . . . . . . . . . . . . . . . . . . . . . . . . . . .33.94 1231.1.4 Regulatory quality. . . . . . . . . . . . . . . . . . . . . . . . . . . . . . . . . . . . . . . . . . . . .26.93 1191.1.5 Corruption . . . . . . . . . . . . . . . . . . . . . . . . . . . . . . . . . . . . . . . . . . . . . . . . . . . .28.38 871.2 Market Landscape . . . . . . . . . . . . . . . . . . . . . . . . . . . . . . . . . . . . . . . . . .44.08 811.2.1 Competition intensity . . . . . . . . . . . . . . . . . . . . . . . . . . . . . . . . . . . . . . . . .64.09 771.2.2 Ease of doing business . . . . . . . . . . . . . . . . . . . . . . . . . . . . . . . . . . . . . . . . 49.93 1001.2.3 Cluster development . . . . . . . . . . . . . . . . . . . . . . . . . . . . . . . . . . . . . . . . . .56.04 371.2.4 R&D expenditure . . . . . . . . . . . . . . . . . . . . . . . . . . . . . . . . . . . . . . . . . . . . . . 12.96 521.2.5 ICT infrastructure. . . . . . . . . . . . . . . . . . . . . . . . . . . . . . . . . . . . . . . . . . . . . . 47.33 761.2.6 Urban population . . . . . . . . . . . . . . . . . . . . . . . . . . . . . . . . . . . . . . . . . . . . . 34.12 1041.3 Business and Labour Landscape . . . . . . . . . . . . . . . . . . . . . . . . . . . . 33.72 109
Labour Market1.3.1 Tertiary-educated unemployment . . . . . . . . . . . . . . . . . . . . . . . . . . . . 31.45 1221.3.2 Active labour market policies . . . . . . . . . . . . . . . . . . . . . . . . . . . . . . . . .26.86 1001.3.3 Labour-employer cooperation . . . . . . . . . . . . . . . . . . . . . . . . . . . . . . . . 37.52 70
Management Practice1.3.4 Professional management . . . . . . . . . . . . . . . . . . . . . . . . . . . . . . . . . . . .44.38 811.3.5 Relationship of pay to productivity . . . . . . . . . . . . . . . . . . . . . . . . . . . . 46.16 72
Technology Adoption1.3.6 Technology utilisation. . . . . . . . . . . . . . . . . . . . . . . . . . . . . . . . . . . . . . . . .46.09 781.3.7 Investment in emerging technologies . . . . . . . . . . . . . . . . . . . . . . . . 37.05 711.3.8 Robot density . . . . . . . . . . . . . . . . . . . . . . . . . . . . . . . . . . . . . . . . . . . . . . . . . . 0.22 59
2 ATTRACT . . . . . . . . . . . . . . . . . . . . . . . . . . . . . . . . . . . . . . . . . 36.36 1162.1 External Openness . . . . . . . . . . . . . . . . . . . . . . . . . . . . . . . . . . . . . . . . . 30.28 108
Attract Business2.1.1 FDI and technology transfer . . . . . . . . . . . . . . . . . . . . . . . . . . . . . . . . . . 57.05 652.1.2 Prevalence of foreign ownership . . . . . . . . . . . . . . . . . . . . . . . . . . . . . . 41.73 108
Attract People2.1.3 Migrant stock . . . . . . . . . . . . . . . . . . . . . . . . . . . . . . . . . . . . . . . . . . . . . . . . .10.99 1162.1.4 International students . . . . . . . . . . . . . . . . . . . . . . . . . . . . . . . . . . . . . . . . . .6.64 722.1.5 Brain gain . . . . . . . . . . . . . . . . . . . . . . . . . . . . . . . . . . . . . . . . . . . . . . . . . . . . .34.97 922.2 Internal Openness . . . . . . . . . . . . . . . . . . . . . . . . . . . . . . . . . . . . . . . . . . 42.44 116
Social Inclusion2.2.1 Tolerance of minorities . . . . . . . . . . . . . . . . . . . . . . . . . . . . . . . . . . . . . . . .12.22 1202.2.2 Tolerance of immigrants . . . . . . . . . . . . . . . . . . . . . . . . . . . . . . . . . . . . . . 31.51 1072.2.3 Social mobility . . . . . . . . . . . . . . . . . . . . . . . . . . . . . . . . . . . . . . . . . . . . . . . .50.05 88
Gender Equality2.2.4 Female graduates . . . . . . . . . . . . . . . . . . . . . . . . . . . . . . . . . . . . . . . . . . . . .64.29 762.2.5 Gender development gap . . . . . . . . . . . . . . . . . . . . . . . . . . . . . . . . . . . . 43.31 1152.2.6 Leadership opportunities for women . . . . . . . . . . . . . . . . . . . . . . . . .53.29 52
Score Rank
3 GROW . . . . . . . . . . . . . . . . . . . . . . . . . . . . . . . . . . . . . . . . . . . . 28.89 1043.1 Formal Education . . . . . . . . . . . . . . . . . . . . . . . . . . . . . . . . . . . . . . . . . . . 25.94 67
Enrolment3.1.1 Vocational enrolment . . . . . . . . . . . . . . . . . . . . . . . . . . . . . . . . . . . . . . . . .33.66 313.1.2 Tertiary enrolment . . . . . . . . . . . . . . . . . . . . . . . . . . . . . . . . . . . . . . . . . . . .26.80 75
Quality3.1.3 Tertiary education expenditure . . . . . . . . . . . . . . . . . . . . . . . . . . . . . . . . .n/a n/a3.1.4 Reading, maths, and science . . . . . . . . . . . . . . . . . . . . . . . . . . . . . . . . . . . .n/a n/a3.1.5 University ranking . . . . . . . . . . . . . . . . . . . . . . . . . . . . . . . . . . . . . . . . . . . . . 17.37 553.2 Lifelong Learning . . . . . . . . . . . . . . . . . . . . . . . . . . . . . . . . . . . . . . . . . . . 20.28 1273.2.1 Quality of management schools . . . . . . . . . . . . . . . . . . . . . . . . . . . . . .23.88 1233.2.2 Prevalence of training in firms . . . . . . . . . . . . . . . . . . . . . . . . . . . . . . . . . . 8.71 943.2.3 Employee development . . . . . . . . . . . . . . . . . . . . . . . . . . . . . . . . . . . . . .28.26 1013.3 Access to Growth Opportunities . . . . . . . . . . . . . . . . . . . . . . . . . . . 40.45 96
Empowerment3.3.1 Delegation of authority . . . . . . . . . . . . . . . . . . . . . . . . . . . . . . . . . . . . . . .34.32 983.3.2 Personal rights . . . . . . . . . . . . . . . . . . . . . . . . . . . . . . . . . . . . . . . . . . . . . . . .26.56 117
Collaboration3.3.3 Use of virtual social networks . . . . . . . . . . . . . . . . . . . . . . . . . . . . . . . . .85.28 313.3.4 Use of virtual professional networks . . . . . . . . . . . . . . . . . . . . . . . . . . . 8.50 673.3.5 Collaboration within organisations . . . . . . . . . . . . . . . . . . . . . . . . . . . .40.91 943.3.6 Collaboration across organisations . . . . . . . . . . . . . . . . . . . . . . . . . . . . 47.13 45
4 RETAIN . . . . . . . . . . . . . . . . . . . . . . . . . . . . . . . . . . . . . . . . . . . .45.02 744.1 Sustainability . . . . . . . . . . . . . . . . . . . . . . . . . . . . . . . . . . . . . . . . . . . . . . . 42.17 674.1.1 Pension system . . . . . . . . . . . . . . . . . . . . . . . . . . . . . . . . . . . . . . . . . . . . . . .53.60 494.1.2 Social protection . . . . . . . . . . . . . . . . . . . . . . . . . . . . . . . . . . . . . . . . . . . . . .42.06 684.1.3 Brain retention . . . . . . . . . . . . . . . . . . . . . . . . . . . . . . . . . . . . . . . . . . . . . . . .30.86 954.2 Lifestyle . . . . . . . . . . . . . . . . . . . . . . . . . . . . . . . . . . . . . . . . . . . . . . . . . . . . 47.87 864.2.1 Environmental performance . . . . . . . . . . . . . . . . . . . . . . . . . . . . . . . . . .56.31 594.2.2 Personal safety . . . . . . . . . . . . . . . . . . . . . . . . . . . . . . . . . . . . . . . . . . . . . . . .29.77 1104.2.3 Physician density . . . . . . . . . . . . . . . . . . . . . . . . . . . . . . . . . . . . . . . . . . . . . . 12.75 904.2.4 Sanitation . . . . . . . . . . . . . . . . . . . . . . . . . . . . . . . . . . . . . . . . . . . . . . . . . . . . .92.65 61
5 VOCATIONAL AND TECHNICAL SKILLS . . . . . . . . . . . . .30.97 1045.1 Mid-Level Skills . . . . . . . . . . . . . . . . . . . . . . . . . . . . . . . . . . . . . . . . . . . . . .37.13 715.1.1 Workforce with secondary education . . . . . . . . . . . . . . . . . . . . . . . . .52.69 525.1.2 Population with secondary education . . . . . . . . . . . . . . . . . . . . . . . . . .n/a n/a5.1.3 Technicians and associate professionals . . . . . . . . . . . . . . . . . . . . . . .30.97 715.1.4 Labour productivity per employee . . . . . . . . . . . . . . . . . . . . . . . . . . . . 27.74 565.2 Employability . . . . . . . . . . . . . . . . . . . . . . . . . . . . . . . . . . . . . . . . . . . . . . . 24.80 1285.2.1 Ease of finding skilled employees . . . . . . . . . . . . . . . . . . . . . . . . . . . . . 41.93 1045.2.2 Relevance of education system to the economy . . . . . . . . . . . . . . 19.98 1235.2.3 Skills matching with secondary education . . . . . . . . . . . . . . . . . . . . 12.77 1295.2.4 Skills matching with tertiary education . . . . . . . . . . . . . . . . . . . . . . . .24.54 127
6 GLOBAL KNOWLEDGE SKILLS . . . . . . . . . . . . . . . . . . . . 30.83 526.1 High-Level Skills . . . . . . . . . . . . . . . . . . . . . . . . . . . . . . . . . . . . . . . . . . . . 39.77 436.1.1 Workforce with tertiary education . . . . . . . . . . . . . . . . . . . . . . . . . . . .28.47 666.1.2 Population with tertiary education . . . . . . . . . . . . . . . . . . . . . . . . . . . . . .n/a n/a6.1.3 Professionals . . . . . . . . . . . . . . . . . . . . . . . . . . . . . . . . . . . . . . . . . . . . . . . . . .29.07 606.1.4 Researchers . . . . . . . . . . . . . . . . . . . . . . . . . . . . . . . . . . . . . . . . . . . . . . . . . . . . 8.00 606.1.5 Senior officials and managers . . . . . . . . . . . . . . . . . . . . . . . . . . . . . . . . . 73.10 66.1.6 Availability of scientists and engineers . . . . . . . . . . . . . . . . . . . . . . . .60.21 446.2 Talent Impact . . . . . . . . . . . . . . . . . . . . . . . . . . . . . . . . . . . . . . . . . . . . . . . 21.88 676.2.1 Innovation output . . . . . . . . . . . . . . . . . . . . . . . . . . . . . . . . . . . . . . . . . . . .26.62 736.2.2 High-value exports . . . . . . . . . . . . . . . . . . . . . . . . . . . . . . . . . . . . . . . . . . . . . 2.57 1146.2.3 New product entrepreneurial activity . . . . . . . . . . . . . . . . . . . . . . . . .53.83 396.2.4 New business density . . . . . . . . . . . . . . . . . . . . . . . . . . . . . . . . . . . . . . . . . . .n/a n/a6.2.5 Scientific journal articles . . . . . . . . . . . . . . . . . . . . . . . . . . . . . . . . . . . . . . . 4.50 72
l Egypt l Income group average

GTCI 2020 Country Profile by Pillar
164 THE GLOBAL TALENT COMPETITIVENESS INDEX 2020
COUNTRY PROFILESCOUNTRY PROFILES
102030405060708090100
Global knowledge skills
Vocational andtechnical skills
Retain
Grow
Attract
Enable
10203004
EL SALVADORKey Indicators
Rank (out of 132) . . . . . . . . . . . . . . . . . . . . . . . . . . . . . . . . . . . . 110Income group . . . . . . . . . . . . . . . . . . . . . . . . . . . Lower-middle incomeRegional group . . . . . . . . . . . . . . .Latin America and the CaribbeanPopulation (millions) . . . . . . . . . . . . . . . . . . . . . . . . . . . . . . . . . . . . . 6.42
GDP per capita (PPP US$) . . . . . . . . . . . . . . . . . . . . . . . . . . . . . 8,316.99GDP (US$ billions) . . . . . . . . . . . . . . . . . . . . . . . . . . . . . . . . . . . . . . 26.06GTCI score . . . . . . . . . . . . . . . . . . . . . . . . . . . . . . . . . . . . . . . . . . . . . . 29.71GTCI score (income group average) . . . . . . . . . . . . . . . . . . . . . . . . 32.97
Score Rank
1 ENABLE . . . . . . . . . . . . . . . . . . . . . . . . . . . . . . . . . . . . . . . . . . .38.79 981.1 Regulatory Landscape . . . . . . . . . . . . . . . . . . . . . . . . . . . . . . . . . . . . . . 40.53 931.1.1 Government effectiveness . . . . . . . . . . . . . . . . . . . . . . . . . . . . . . . . . . . . 37.68 941.1.2 Rule of law . . . . . . . . . . . . . . . . . . . . . . . . . . . . . . . . . . . . . . . . . . . . . . . . . . . .32.68 1131.1.3 Political stability . . . . . . . . . . . . . . . . . . . . . . . . . . . . . . . . . . . . . . . . . . . . . . . 59.59 761.1.4 Regulatory quality. . . . . . . . . . . . . . . . . . . . . . . . . . . . . . . . . . . . . . . . . . . . .44.34 821.1.5 Corruption . . . . . . . . . . . . . . . . . . . . . . . . . . . . . . . . . . . . . . . . . . . . . . . . . . . .28.38 871.2 Market Landscape . . . . . . . . . . . . . . . . . . . . . . . . . . . . . . . . . . . . . . . . . . 43.70 821.2.1 Competition intensity . . . . . . . . . . . . . . . . . . . . . . . . . . . . . . . . . . . . . . . . .75.89 391.2.2 Ease of doing business . . . . . . . . . . . . . . . . . . . . . . . . . . . . . . . . . . . . . . . . 62.17 791.2.3 Cluster development . . . . . . . . . . . . . . . . . . . . . . . . . . . . . . . . . . . . . . . . . . 14.37 1271.2.4 R&D expenditure . . . . . . . . . . . . . . . . . . . . . . . . . . . . . . . . . . . . . . . . . . . . . . . 2.89 961.2.5 ICT infrastructure. . . . . . . . . . . . . . . . . . . . . . . . . . . . . . . . . . . . . . . . . . . . . .39.06 881.2.6 Urban population . . . . . . . . . . . . . . . . . . . . . . . . . . . . . . . . . . . . . . . . . . . . . 67.83 491.3 Business and Labour Landscape . . . . . . . . . . . . . . . . . . . . . . . . . . . . 32.13 114
Labour Market1.3.1 Tertiary-educated unemployment . . . . . . . . . . . . . . . . . . . . . . . . . . . .83.65 521.3.2 Active labour market policies . . . . . . . . . . . . . . . . . . . . . . . . . . . . . . . . . . 2.07 1311.3.3 Labour-employer cooperation . . . . . . . . . . . . . . . . . . . . . . . . . . . . . . . .26.70 99
Management Practice1.3.4 Professional management . . . . . . . . . . . . . . . . . . . . . . . . . . . . . . . . . . . . 31.50 1081.3.5 Relationship of pay to productivity . . . . . . . . . . . . . . . . . . . . . . . . . . . .26.20 123
Technology Adoption1.3.6 Technology utilisation. . . . . . . . . . . . . . . . . . . . . . . . . . . . . . . . . . . . . . . . .35.90 1081.3.7 Investment in emerging technologies . . . . . . . . . . . . . . . . . . . . . . . .18.90 1211.3.8 Robot density . . . . . . . . . . . . . . . . . . . . . . . . . . . . . . . . . . . . . . . . . . . . . . . . . . .n/a n/a
2 ATTRACT . . . . . . . . . . . . . . . . . . . . . . . . . . . . . . . . . . . . . . . . . 36.64 1152.1 External Openness . . . . . . . . . . . . . . . . . . . . . . . . . . . . . . . . . . . . . . . . . 24.78 123
Attract Business2.1.1 FDI and technology transfer . . . . . . . . . . . . . . . . . . . . . . . . . . . . . . . . . .36.83 1172.1.2 Prevalence of foreign ownership . . . . . . . . . . . . . . . . . . . . . . . . . . . . . .52.26 86
Attract People2.1.3 Migrant stock . . . . . . . . . . . . . . . . . . . . . . . . . . . . . . . . . . . . . . . . . . . . . . . . . 13.47 1092.1.4 International students . . . . . . . . . . . . . . . . . . . . . . . . . . . . . . . . . . . . . . . . . . 1.34 972.1.5 Brain gain . . . . . . . . . . . . . . . . . . . . . . . . . . . . . . . . . . . . . . . . . . . . . . . . . . . . .20.03 1172.2 Internal Openness . . . . . . . . . . . . . . . . . . . . . . . . . . . . . . . . . . . . . . . . . . 48.49 100
Social Inclusion2.2.1 Tolerance of minorities . . . . . . . . . . . . . . . . . . . . . . . . . . . . . . . . . . . . . . . .43.33 692.2.2 Tolerance of immigrants . . . . . . . . . . . . . . . . . . . . . . . . . . . . . . . . . . . . . .64.38 552.2.3 Social mobility . . . . . . . . . . . . . . . . . . . . . . . . . . . . . . . . . . . . . . . . . . . . . . . .25.35 129
Gender Equality2.2.4 Female graduates . . . . . . . . . . . . . . . . . . . . . . . . . . . . . . . . . . . . . . . . . . . . .69.40 712.2.5 Gender development gap . . . . . . . . . . . . . . . . . . . . . . . . . . . . . . . . . . . . 77.73 652.2.6 Leadership opportunities for women . . . . . . . . . . . . . . . . . . . . . . . . . 10.75 130
Score Rank
3 GROW . . . . . . . . . . . . . . . . . . . . . . . . . . . . . . . . . . . . . . . . . . . . 30.04 983.1 Formal Education . . . . . . . . . . . . . . . . . . . . . . . . . . . . . . . . . . . . . . . . . . . 13.82 95
Enrolment3.1.1 Vocational enrolment . . . . . . . . . . . . . . . . . . . . . . . . . . . . . . . . . . . . . . . . . 27.23 453.1.2 Tertiary enrolment . . . . . . . . . . . . . . . . . . . . . . . . . . . . . . . . . . . . . . . . . . . .22.23 82
Quality3.1.3 Tertiary education expenditure . . . . . . . . . . . . . . . . . . . . . . . . . . . . . . . . 5.85 1083.1.4 Reading, maths, and science . . . . . . . . . . . . . . . . . . . . . . . . . . . . . . . . . . . .n/a n/a3.1.5 University ranking . . . . . . . . . . . . . . . . . . . . . . . . . . . . . . . . . . . . . . . . . . . . . . 0.00 753.2 Lifelong Learning . . . . . . . . . . . . . . . . . . . . . . . . . . . . . . . . . . . . . . . . . . . 41.08 723.2.1 Quality of management schools . . . . . . . . . . . . . . . . . . . . . . . . . . . . . . 31.72 1103.2.2 Prevalence of training in firms . . . . . . . . . . . . . . . . . . . . . . . . . . . . . . . . .66.49 163.2.3 Employee development . . . . . . . . . . . . . . . . . . . . . . . . . . . . . . . . . . . . . .25.01 1113.3 Access to Growth Opportunities . . . . . . . . . . . . . . . . . . . . . . . . . . . 35.21 110
Empowerment3.3.1 Delegation of authority . . . . . . . . . . . . . . . . . . . . . . . . . . . . . . . . . . . . . . . 32.15 1083.3.2 Personal rights . . . . . . . . . . . . . . . . . . . . . . . . . . . . . . . . . . . . . . . . . . . . . . . .70.36 74
Collaboration3.3.3 Use of virtual social networks . . . . . . . . . . . . . . . . . . . . . . . . . . . . . . . . .66.06 913.3.4 Use of virtual professional networks . . . . . . . . . . . . . . . . . . . . . . . . . . . 7.26 713.3.5 Collaboration within organisations . . . . . . . . . . . . . . . . . . . . . . . . . . . .21.84 1293.3.6 Collaboration across organisations . . . . . . . . . . . . . . . . . . . . . . . . . . . . 13.56 131
4 RETAIN . . . . . . . . . . . . . . . . . . . . . . . . . . . . . . . . . . . . . . . . . . . 30.96 1054.1 Sustainability . . . . . . . . . . . . . . . . . . . . . . . . . . . . . . . . . . . . . . . . . . . . . . . 20.44 1184.1.1 Pension system . . . . . . . . . . . . . . . . . . . . . . . . . . . . . . . . . . . . . . . . . . . . . . . 29.31 724.1.2 Social protection . . . . . . . . . . . . . . . . . . . . . . . . . . . . . . . . . . . . . . . . . . . . . . 16.37 1224.1.3 Brain retention . . . . . . . . . . . . . . . . . . . . . . . . . . . . . . . . . . . . . . . . . . . . . . . .15.64 1244.2 Lifestyle . . . . . . . . . . . . . . . . . . . . . . . . . . . . . . . . . . . . . . . . . . . . . . . . . . . . 41.49 954.2.1 Environmental performance . . . . . . . . . . . . . . . . . . . . . . . . . . . . . . . . . . 44.14 874.2.2 Personal safety . . . . . . . . . . . . . . . . . . . . . . . . . . . . . . . . . . . . . . . . . . . . . . . . . 6.08 1284.2.3 Physician density . . . . . . . . . . . . . . . . . . . . . . . . . . . . . . . . . . . . . . . . . . . . . .25.29 704.2.4 Sanitation . . . . . . . . . . . . . . . . . . . . . . . . . . . . . . . . . . . . . . . . . . . . . . . . . . . . .90.45 69
5 VOCATIONAL AND TECHNICAL SKILLS . . . . . . . . . . . . 30.87 1055.1 Mid-Level Skills . . . . . . . . . . . . . . . . . . . . . . . . . . . . . . . . . . . . . . . . . . . . . 30.66 825.1.1 Workforce with secondary education . . . . . . . . . . . . . . . . . . . . . . . . .44.67 665.1.2 Population with secondary education . . . . . . . . . . . . . . . . . . . . . . . .29.67 745.1.3 Technicians and associate professionals . . . . . . . . . . . . . . . . . . . . . . . 17.64 975.1.4 Labour productivity per employee . . . . . . . . . . . . . . . . . . . . . . . . . . . . . .n/a n/a5.2 Employability . . . . . . . . . . . . . . . . . . . . . . . . . . . . . . . . . . . . . . . . . . . . . . . 31.08 1205.2.1 Ease of finding skilled employees . . . . . . . . . . . . . . . . . . . . . . . . . . . . . 41.63 1055.2.2 Relevance of education system to the economy . . . . . . . . . . . . . . 11.81 1305.2.3 Skills matching with secondary education . . . . . . . . . . . . . . . . . . . . 31.68 965.2.4 Skills matching with tertiary education . . . . . . . . . . . . . . . . . . . . . . . . 39.18 107
6 GLOBAL KNOWLEDGE SKILLS . . . . . . . . . . . . . . . . . . . . .10.96 1146.1 High-Level Skills . . . . . . . . . . . . . . . . . . . . . . . . . . . . . . . . . . . . . . . . . . . . 10.61 1206.1.1 Workforce with tertiary education . . . . . . . . . . . . . . . . . . . . . . . . . . . .10.89 1046.1.2 Population with tertiary education . . . . . . . . . . . . . . . . . . . . . . . . . . . . 11.27 916.1.3 Professionals . . . . . . . . . . . . . . . . . . . . . . . . . . . . . . . . . . . . . . . . . . . . . . . . . . 17.35 896.1.4 Researchers . . . . . . . . . . . . . . . . . . . . . . . . . . . . . . . . . . . . . . . . . . . . . . . . . . . . 0.67 906.1.5 Senior officials and managers . . . . . . . . . . . . . . . . . . . . . . . . . . . . . . . . . . 8.96 986.1.6 Availability of scientists and engineers . . . . . . . . . . . . . . . . . . . . . . . .14.50 1316.2 Talent Impact . . . . . . . . . . . . . . . . . . . . . . . . . . . . . . . . . . . . . . . . . . . . . . . 11.32 1036.2.1 Innovation output . . . . . . . . . . . . . . . . . . . . . . . . . . . . . . . . . . . . . . . . . . . .13.66 1136.2.2 High-value exports . . . . . . . . . . . . . . . . . . . . . . . . . . . . . . . . . . . . . . . . . . . .15.00 716.2.3 New product entrepreneurial activity . . . . . . . . . . . . . . . . . . . . . . . . .25.30 726.2.4 New business density . . . . . . . . . . . . . . . . . . . . . . . . . . . . . . . . . . . . . . . . . . 2.52 856.2.5 Scientific journal articles . . . . . . . . . . . . . . . . . . . . . . . . . . . . . . . . . . . . . . . 0.14 123
l El Salvador l Income group average

GTCI 2020 Country Profile by Pillar
THE GLOBAL TALENT COMPETITIVENESS INDEX 2020 165
COUNTRY PROFILESCOUNTRY PROFILES
102030405060708090100
Global knowledge skills
Vocational andtechnical skills
Retain
Grow
Attract
Enable
102030405060607
ESTONIAKey Indicators
Rank (out of 132) . . . . . . . . . . . . . . . . . . . . . . . . . . . . . . . . . . . . . . . 24Income group . . . . . . . . . . . . . . . . . . . . . . . . . . . . . . . . . . . . High incomeRegional group . . . . . . . . . . . . . . . . . . . . . . . . . . . . . . . . . . . . . . . . .EuropePopulation (millions) . . . . . . . . . . . . . . . . . . . . . . . . . . . . . . . . . . . . . 1.32
GDP per capita (PPP US$) . . . . . . . . . . . . . . . . . . . . . . . . . . . . 35,747.41GDP (US$ billions) . . . . . . . . . . . . . . . . . . . . . . . . . . . . . . . . . . . . . . 30.28GTCI score . . . . . . . . . . . . . . . . . . . . . . . . . . . . . . . . . . . . . . . . . . . . . . 61.97GTCI score (income group average) . . . . . . . . . . . . . . . . . . . . . . . . 61.46
Score Rank
1 ENABLE . . . . . . . . . . . . . . . . . . . . . . . . . . . . . . . . . . . . . . . . . . 70.38 241.1 Regulatory Landscape . . . . . . . . . . . . . . . . . . . . . . . . . . . . . . . . . . . . . . 80.77 191.1.1 Government effectiveness . . . . . . . . . . . . . . . . . . . . . . . . . . . . . . . . . . . .73.60 261.1.2 Rule of law . . . . . . . . . . . . . . . . . . . . . . . . . . . . . . . . . . . . . . . . . . . . . . . . . . . .82.60 211.1.3 Political stability . . . . . . . . . . . . . . . . . . . . . . . . . . . . . . . . . . . . . . . . . . . . . . .79.52 321.1.4 Regulatory quality. . . . . . . . . . . . . . . . . . . . . . . . . . . . . . . . . . . . . . . . . . . . .88.39 131.1.5 Corruption . . . . . . . . . . . . . . . . . . . . . . . . . . . . . . . . . . . . . . . . . . . . . . . . . . . .79.73 171.2 Market Landscape . . . . . . . . . . . . . . . . . . . . . . . . . . . . . . . . . . . . . . . . . . 65.61 281.2.1 Competition intensity . . . . . . . . . . . . . . . . . . . . . . . . . . . . . . . . . . . . . . . . . 87.54 91.2.2 Ease of doing business . . . . . . . . . . . . . . . . . . . . . . . . . . . . . . . . . . . . . . . . 89.12 141.2.3 Cluster development . . . . . . . . . . . . . . . . . . . . . . . . . . . . . . . . . . . . . . . . . . 41.67 711.2.4 R&D expenditure . . . . . . . . . . . . . . . . . . . . . . . . . . . . . . . . . . . . . . . . . . . . . .28.68 271.2.5 ICT infrastructure. . . . . . . . . . . . . . . . . . . . . . . . . . . . . . . . . . . . . . . . . . . . . .82.44 181.2.6 Urban population . . . . . . . . . . . . . . . . . . . . . . . . . . . . . . . . . . . . . . . . . . . . .64.22 561.3 Business and Labour Landscape . . . . . . . . . . . . . . . . . . . . . . . . . . . . 64.75 27
Labour Market1.3.1 Tertiary-educated unemployment . . . . . . . . . . . . . . . . . . . . . . . . . . . .88.36 331.3.2 Active labour market policies . . . . . . . . . . . . . . . . . . . . . . . . . . . . . . . . .79.65 131.3.3 Labour-employer cooperation . . . . . . . . . . . . . . . . . . . . . . . . . . . . . . . .64.67 23
Management Practice1.3.4 Professional management . . . . . . . . . . . . . . . . . . . . . . . . . . . . . . . . . . . . 74.37 261.3.5 Relationship of pay to productivity . . . . . . . . . . . . . . . . . . . . . . . . . . . .69.81 20
Technology Adoption1.3.6 Technology utilisation. . . . . . . . . . . . . . . . . . . . . . . . . . . . . . . . . . . . . . . . .76.64 231.3.7 Investment in emerging technologies . . . . . . . . . . . . . . . . . . . . . . . .58.91 341.3.8 Robot density . . . . . . . . . . . . . . . . . . . . . . . . . . . . . . . . . . . . . . . . . . . . . . . . . . 5.63 39
2 ATTRACT . . . . . . . . . . . . . . . . . . . . . . . . . . . . . . . . . . . . . . . . . .61.32 312.1 External Openness . . . . . . . . . . . . . . . . . . . . . . . . . . . . . . . . . . . . . . . . . 58.26 26
Attract Business2.1.1 FDI and technology transfer . . . . . . . . . . . . . . . . . . . . . . . . . . . . . . . . . . 67.67 422.1.2 Prevalence of foreign ownership . . . . . . . . . . . . . . . . . . . . . . . . . . . . . .86.50 8
Attract People2.1.3 Migrant stock . . . . . . . . . . . . . . . . . . . . . . . . . . . . . . . . . . . . . . . . . . . . . . . . .65.75 212.1.4 International students . . . . . . . . . . . . . . . . . . . . . . . . . . . . . . . . . . . . . . . . . 24.91 302.1.5 Brain gain . . . . . . . . . . . . . . . . . . . . . . . . . . . . . . . . . . . . . . . . . . . . . . . . . . . . .46.46 582.2 Internal Openness . . . . . . . . . . . . . . . . . . . . . . . . . . . . . . . . . . . . . . . . . .64.38 43
Social Inclusion2.2.1 Tolerance of minorities . . . . . . . . . . . . . . . . . . . . . . . . . . . . . . . . . . . . . . . .26.67 972.2.2 Tolerance of immigrants . . . . . . . . . . . . . . . . . . . . . . . . . . . . . . . . . . . . . . 15.07 1212.2.3 Social mobility . . . . . . . . . . . . . . . . . . . . . . . . . . . . . . . . . . . . . . . . . . . . . . . .85.64 14
Gender Equality2.2.4 Female graduates . . . . . . . . . . . . . . . . . . . . . . . . . . . . . . . . . . . . . . . . . . . . .90.64 152.2.5 Gender development gap . . . . . . . . . . . . . . . . . . . . . . . . . . . . . . . . . . . .95.64 62.2.6 Leadership opportunities for women . . . . . . . . . . . . . . . . . . . . . . . . .72.63 22
Score Rank
3 GROW . . . . . . . . . . . . . . . . . . . . . . . . . . . . . . . . . . . . . . . . . . . . 54.88 283.1 Formal Education . . . . . . . . . . . . . . . . . . . . . . . . . . . . . . . . . . . . . . . . . . .46.34 25
Enrolment3.1.1 Vocational enrolment . . . . . . . . . . . . . . . . . . . . . . . . . . . . . . . . . . . . . . . . .33.08 343.1.2 Tertiary enrolment . . . . . . . . . . . . . . . . . . . . . . . . . . . . . . . . . . . . . . . . . . . .56.22 24
Quality3.1.3 Tertiary education expenditure . . . . . . . . . . . . . . . . . . . . . . . . . . . . . . . 33.19 253.1.4 Reading, maths, and science . . . . . . . . . . . . . . . . . . . . . . . . . . . . . . . . . . 87.14 33.1.5 University ranking . . . . . . . . . . . . . . . . . . . . . . . . . . . . . . . . . . . . . . . . . . . . .22.08 473.2 Lifelong Learning . . . . . . . . . . . . . . . . . . . . . . . . . . . . . . . . . . . . . . . . . . . 56.14 343.2.1 Quality of management schools . . . . . . . . . . . . . . . . . . . . . . . . . . . . . .66.02 313.2.2 Prevalence of training in firms . . . . . . . . . . . . . . . . . . . . . . . . . . . . . . . . . 41.95 403.2.3 Employee development . . . . . . . . . . . . . . . . . . . . . . . . . . . . . . . . . . . . . .60.46 293.3 Access to Growth Opportunities . . . . . . . . . . . . . . . . . . . . . . . . . . . 62.15 27
Empowerment3.3.1 Delegation of authority . . . . . . . . . . . . . . . . . . . . . . . . . . . . . . . . . . . . . . .66.55 273.3.2 Personal rights . . . . . . . . . . . . . . . . . . . . . . . . . . . . . . . . . . . . . . . . . . . . . . . . 97.29 10
Collaboration3.3.3 Use of virtual social networks . . . . . . . . . . . . . . . . . . . . . . . . . . . . . . . . . 85.93 263.3.4 Use of virtual professional networks . . . . . . . . . . . . . . . . . . . . . . . . . . 15.39 453.3.5 Collaboration within organisations . . . . . . . . . . . . . . . . . . . . . . . . . . . .62.78 303.3.6 Collaboration across organisations . . . . . . . . . . . . . . . . . . . . . . . . . . . .44.95 48
4 RETAIN . . . . . . . . . . . . . . . . . . . . . . . . . . . . . . . . . . . . . . . . . . . 65.00 314.1 Sustainability . . . . . . . . . . . . . . . . . . . . . . . . . . . . . . . . . . . . . . . . . . . . . . . 58.77 384.1.1 Pension system . . . . . . . . . . . . . . . . . . . . . . . . . . . . . . . . . . . . . . . . . . . . . . .82.30 264.1.2 Social protection . . . . . . . . . . . . . . . . . . . . . . . . . . . . . . . . . . . . . . . . . . . . . .52.28 454.1.3 Brain retention . . . . . . . . . . . . . . . . . . . . . . . . . . . . . . . . . . . . . . . . . . . . . . . . 41.74 624.2 Lifestyle . . . . . . . . . . . . . . . . . . . . . . . . . . . . . . . . . . . . . . . . . . . . . . . . . . . . 71.23 334.2.1 Environmental performance . . . . . . . . . . . . . . . . . . . . . . . . . . . . . . . . . . 61.48 434.2.2 Personal safety . . . . . . . . . . . . . . . . . . . . . . . . . . . . . . . . . . . . . . . . . . . . . . . . 69.16 374.2.3 Physician density . . . . . . . . . . . . . . . . . . . . . . . . . . . . . . . . . . . . . . . . . . . . . .54.70 244.2.4 Sanitation . . . . . . . . . . . . . . . . . . . . . . . . . . . . . . . . . . . . . . . . . . . . . . . . . . . . .99.58 18
5 VOCATIONAL AND TECHNICAL SKILLS . . . . . . . . . . . . .58.78 295.1 Mid-Level Skills . . . . . . . . . . . . . . . . . . . . . . . . . . . . . . . . . . . . . . . . . . . . . 58.60 275.1.1 Workforce with secondary education . . . . . . . . . . . . . . . . . . . . . . . . .65.56 305.1.2 Population with secondary education . . . . . . . . . . . . . . . . . . . . . . . .68.97 235.1.3 Technicians and associate professionals . . . . . . . . . . . . . . . . . . . . . . .59.68 265.1.4 Labour productivity per employee . . . . . . . . . . . . . . . . . . . . . . . . . . . .40.20 405.2 Employability . . . . . . . . . . . . . . . . . . . . . . . . . . . . . . . . . . . . . . . . . . . . . . . 58.96 425.2.1 Ease of finding skilled employees . . . . . . . . . . . . . . . . . . . . . . . . . . . . .40.05 1075.2.2 Relevance of education system to the economy . . . . . . . . . . . . . .62.53 315.2.3 Skills matching with secondary education . . . . . . . . . . . . . . . . . . . .63.49 285.2.4 Skills matching with tertiary education . . . . . . . . . . . . . . . . . . . . . . . .69.79 32
6 GLOBAL KNOWLEDGE SKILLS . . . . . . . . . . . . . . . . . . . . .61.45 106.1 High-Level Skills . . . . . . . . . . . . . . . . . . . . . . . . . . . . . . . . . . . . . . . . . . . . 59.51 146.1.1 Workforce with tertiary education . . . . . . . . . . . . . . . . . . . . . . . . . . . . 61.12 186.1.2 Population with tertiary education . . . . . . . . . . . . . . . . . . . . . . . . . . . .60.33 116.1.3 Professionals . . . . . . . . . . . . . . . . . . . . . . . . . . . . . . . . . . . . . . . . . . . . . . . . . .54.57 186.1.4 Researchers . . . . . . . . . . . . . . . . . . . . . . . . . . . . . . . . . . . . . . . . . . . . . . . . . . . 43.18 266.1.5 Senior officials and managers . . . . . . . . . . . . . . . . . . . . . . . . . . . . . . . . . 77.36 56.1.6 Availability of scientists and engineers . . . . . . . . . . . . . . . . . . . . . . . .60.51 436.2 Talent Impact . . . . . . . . . . . . . . . . . . . . . . . . . . . . . . . . . . . . . . . . . . . . . . . 63.39 56.2.1 Innovation output . . . . . . . . . . . . . . . . . . . . . . . . . . . . . . . . . . . . . . . . . . . .65.50 186.2.2 High-value exports . . . . . . . . . . . . . . . . . . . . . . . . . . . . . . . . . . . . . . . . . . . .46.95 196.2.3 New product entrepreneurial activity . . . . . . . . . . . . . . . . . . . . . . . . .59.89 236.2.4 New business density . . . . . . . . . . . . . . . . . . . . . . . . . . . . . . . . . . . . . . . 100.00 16.2.5 Scientific journal articles . . . . . . . . . . . . . . . . . . . . . . . . . . . . . . . . . . . . . .44.61 26
l Estonia l Income group average

GTCI 2020 Country Profile by Pillar
166 THE GLOBAL TALENT COMPETITIVENESS INDEX 2020
COUNTRY PROFILESCOUNTRY PROFILES
102030405060708090100
Global knowledge skills
Vocational andtechnical skills
Retain
Grow
Attract
Enable
10203004
ESWATINIKey Indicators
Rank (out of 132) . . . . . . . . . . . . . . . . . . . . . . . . . . . . . . . . . . . . 115Income group . . . . . . . . . . . . . . . . . . . . . . . . . . . Lower-middle incomeRegional group . . . . . . . . . . . . . . . . . . . . . . . . . . . . Sub-Saharan AfricaPopulation (millions) . . . . . . . . . . . . . . . . . . . . . . . . . . . . . . . . . . . . . .1.14
GDP per capita (PPP US$) . . . . . . . . . . . . . . . . . . . . . . . . . . . . 10,721.64GDP (US$ billions) . . . . . . . . . . . . . . . . . . . . . . . . . . . . . . . . . . . . . . . .4.70GTCI score . . . . . . . . . . . . . . . . . . . . . . . . . . . . . . . . . . . . . . . . . . . . . . 27.66GTCI score (income group average) . . . . . . . . . . . . . . . . . . . . . . . . 32.97
Score Rank
1 ENABLE . . . . . . . . . . . . . . . . . . . . . . . . . . . . . . . . . . . . . . . . . . .34.70 1091.1 Regulatory Landscape . . . . . . . . . . . . . . . . . . . . . . . . . . . . . . . . . . . . . . 40.72 921.1.1 Government effectiveness . . . . . . . . . . . . . . . . . . . . . . . . . . . . . . . . . . . .32.55 1001.1.2 Rule of law . . . . . . . . . . . . . . . . . . . . . . . . . . . . . . . . . . . . . . . . . . . . . . . . . . . .45.90 811.1.3 Political stability . . . . . . . . . . . . . . . . . . . . . . . . . . . . . . . . . . . . . . . . . . . . . . .58.43 841.1.4 Regulatory quality. . . . . . . . . . . . . . . . . . . . . . . . . . . . . . . . . . . . . . . . . . . . .34.31 1061.1.5 Corruption . . . . . . . . . . . . . . . . . . . . . . . . . . . . . . . . . . . . . . . . . . . . . . . . . . . . 32.43 731.2 Market Landscape . . . . . . . . . . . . . . . . . . . . . . . . . . . . . . . . . . . . . . . . . . 28.81 1211.2.1 Competition intensity . . . . . . . . . . . . . . . . . . . . . . . . . . . . . . . . . . . . . . . . 48.04 1191.2.2 Ease of doing business . . . . . . . . . . . . . . . . . . . . . . . . . . . . . . . . . . . . . . . .50.63 981.2.3 Cluster development . . . . . . . . . . . . . . . . . . . . . . . . . . . . . . . . . . . . . . . . . . 27.41 1021.2.4 R&D expenditure . . . . . . . . . . . . . . . . . . . . . . . . . . . . . . . . . . . . . . . . . . . . . . . 5.60 831.2.5 ICT infrastructure. . . . . . . . . . . . . . . . . . . . . . . . . . . . . . . . . . . . . . . . . . . . . . . .n/a n/a1.2.6 Urban population . . . . . . . . . . . . . . . . . . . . . . . . . . . . . . . . . . . . . . . . . . . . . 12.38 1241.3 Business and Labour Landscape . . . . . . . . . . . . . . . . . . . . . . . . . . . . 34.58 106
Labour Market1.3.1 Tertiary-educated unemployment . . . . . . . . . . . . . . . . . . . . . . . . . . . .62.59 981.3.2 Active labour market policies . . . . . . . . . . . . . . . . . . . . . . . . . . . . . . . . . 20.18 1091.3.3 Labour-employer cooperation . . . . . . . . . . . . . . . . . . . . . . . . . . . . . . . .23.47 105
Management Practice1.3.4 Professional management . . . . . . . . . . . . . . . . . . . . . . . . . . . . . . . . . . . . 56.15 501.3.5 Relationship of pay to productivity . . . . . . . . . . . . . . . . . . . . . . . . . . . 44.44 77
Technology Adoption1.3.6 Technology utilisation. . . . . . . . . . . . . . . . . . . . . . . . . . . . . . . . . . . . . . . . .23.43 1221.3.7 Investment in emerging technologies . . . . . . . . . . . . . . . . . . . . . . . . 11.76 1281.3.8 Robot density . . . . . . . . . . . . . . . . . . . . . . . . . . . . . . . . . . . . . . . . . . . . . . . . . . .n/a n/a
2 ATTRACT . . . . . . . . . . . . . . . . . . . . . . . . . . . . . . . . . . . . . . . . . 45.09 882.1 External Openness . . . . . . . . . . . . . . . . . . . . . . . . . . . . . . . . . . . . . . . . . 35.97 90
Attract Business2.1.1 FDI and technology transfer . . . . . . . . . . . . . . . . . . . . . . . . . . . . . . . . . .33.23 1222.1.2 Prevalence of foreign ownership . . . . . . . . . . . . . . . . . . . . . . . . . . . . . .70.48 40
Attract People2.1.3 Migrant stock . . . . . . . . . . . . . . . . . . . . . . . . . . . . . . . . . . . . . . . . . . . . . . . . . 36.14 712.1.4 International students . . . . . . . . . . . . . . . . . . . . . . . . . . . . . . . . . . . . . . . . . . 1.77 902.1.5 Brain gain . . . . . . . . . . . . . . . . . . . . . . . . . . . . . . . . . . . . . . . . . . . . . . . . . . . . .38.25 862.2 Internal Openness . . . . . . . . . . . . . . . . . . . . . . . . . . . . . . . . . . . . . . . . . . 54.21 75
Social Inclusion2.2.1 Tolerance of minorities . . . . . . . . . . . . . . . . . . . . . . . . . . . . . . . . . . . . . . . .80.00 112.2.2 Tolerance of immigrants . . . . . . . . . . . . . . . . . . . . . . . . . . . . . . . . . . . . . . 67.12 462.2.3 Social mobility . . . . . . . . . . . . . . . . . . . . . . . . . . . . . . . . . . . . . . . . . . . . . . . .50.37 86
Gender Equality2.2.4 Female graduates . . . . . . . . . . . . . . . . . . . . . . . . . . . . . . . . . . . . . . . . . . . . .26.55 1062.2.5 Gender development gap . . . . . . . . . . . . . . . . . . . . . . . . . . . . . . . . . . . .68.44 882.2.6 Leadership opportunities for women . . . . . . . . . . . . . . . . . . . . . . . . .32.79 99
Score Rank
3 GROW . . . . . . . . . . . . . . . . . . . . . . . . . . . . . . . . . . . . . . . . . . . . 23.84 1233.1 Formal Education . . . . . . . . . . . . . . . . . . . . . . . . . . . . . . . . . . . . . . . . . . . . .7.74 119
Enrolment3.1.1 Vocational enrolment . . . . . . . . . . . . . . . . . . . . . . . . . . . . . . . . . . . . . . . . . . 5.98 943.1.2 Tertiary enrolment . . . . . . . . . . . . . . . . . . . . . . . . . . . . . . . . . . . . . . . . . . . . . 3.67 120
Quality3.1.3 Tertiary education expenditure . . . . . . . . . . . . . . . . . . . . . . . . . . . . . . . 21.30 633.1.4 Reading, maths, and science . . . . . . . . . . . . . . . . . . . . . . . . . . . . . . . . . . . .n/a n/a3.1.5 University ranking . . . . . . . . . . . . . . . . . . . . . . . . . . . . . . . . . . . . . . . . . . . . . . 0.00 753.2 Lifelong Learning . . . . . . . . . . . . . . . . . . . . . . . . . . . . . . . . . . . . . . . . . . . 35.01 953.2.1 Quality of management schools . . . . . . . . . . . . . . . . . . . . . . . . . . . . . .20.73 1253.2.2 Prevalence of training in firms . . . . . . . . . . . . . . . . . . . . . . . . . . . . . . . . . 43.14 373.2.3 Employee development . . . . . . . . . . . . . . . . . . . . . . . . . . . . . . . . . . . . . . 41.16 603.3 Access to Growth Opportunities . . . . . . . . . . . . . . . . . . . . . . . . . . . 28.79 124
Empowerment3.3.1 Delegation of authority . . . . . . . . . . . . . . . . . . . . . . . . . . . . . . . . . . . . . . .52.67 483.3.2 Personal rights . . . . . . . . . . . . . . . . . . . . . . . . . . . . . . . . . . . . . . . . . . . . . . . . 24.16 120
Collaboration3.3.3 Use of virtual social networks . . . . . . . . . . . . . . . . . . . . . . . . . . . . . . . . .34.83 1263.3.4 Use of virtual professional networks . . . . . . . . . . . . . . . . . . . . . . . . . . . 4.76 833.3.5 Collaboration within organisations . . . . . . . . . . . . . . . . . . . . . . . . . . . .33.82 1073.3.6 Collaboration across organisations . . . . . . . . . . . . . . . . . . . . . . . . . . . .22.48 115
4 RETAIN . . . . . . . . . . . . . . . . . . . . . . . . . . . . . . . . . . . . . . . . . . . 28.24 1104.1 Sustainability . . . . . . . . . . . . . . . . . . . . . . . . . . . . . . . . . . . . . . . . . . . . . . . 28.95 1014.1.1 Pension system . . . . . . . . . . . . . . . . . . . . . . . . . . . . . . . . . . . . . . . . . . . . . . .25.50 754.1.2 Social protection . . . . . . . . . . . . . . . . . . . . . . . . . . . . . . . . . . . . . . . . . . . . . . 29.51 994.1.3 Brain retention . . . . . . . . . . . . . . . . . . . . . . . . . . . . . . . . . . . . . . . . . . . . . . . . 31.82 934.2 Lifestyle . . . . . . . . . . . . . . . . . . . . . . . . . . . . . . . . . . . . . . . . . . . . . . . . . . . . 27.53 1094.2.1 Environmental performance . . . . . . . . . . . . . . . . . . . . . . . . . . . . . . . . . . 21.49 1224.2.2 Personal safety . . . . . . . . . . . . . . . . . . . . . . . . . . . . . . . . . . . . . . . . . . . . . . . . 31.76 1064.2.3 Physician density . . . . . . . . . . . . . . . . . . . . . . . . . . . . . . . . . . . . . . . . . . . . . . . 2.05 1074.2.4 Sanitation . . . . . . . . . . . . . . . . . . . . . . . . . . . . . . . . . . . . . . . . . . . . . . . . . . . . .54.83 104
5 VOCATIONAL AND TECHNICAL SKILLS . . . . . . . . . . . . 24.98 1215.1 Mid-Level Skills . . . . . . . . . . . . . . . . . . . . . . . . . . . . . . . . . . . . . . . . . . . . . . 8.48 1215.1.1 Workforce with secondary education . . . . . . . . . . . . . . . . . . . . . . . . . . 0.00 1275.1.2 Population with secondary education . . . . . . . . . . . . . . . . . . . . . . . . . .n/a n/a5.1.3 Technicians and associate professionals . . . . . . . . . . . . . . . . . . . . . . .16.96 995.1.4 Labour productivity per employee . . . . . . . . . . . . . . . . . . . . . . . . . . . . . .n/a n/a5.2 Employability . . . . . . . . . . . . . . . . . . . . . . . . . . . . . . . . . . . . . . . . . . . . . . . 41.48 895.2.1 Ease of finding skilled employees . . . . . . . . . . . . . . . . . . . . . . . . . . . . . 51.21 805.2.2 Relevance of education system to the economy . . . . . . . . . . . . . . 39.79 795.2.3 Skills matching with secondary education . . . . . . . . . . . . . . . . . . . .32.90 915.2.4 Skills matching with tertiary education . . . . . . . . . . . . . . . . . . . . . . . .42.02 102
6 GLOBAL KNOWLEDGE SKILLS . . . . . . . . . . . . . . . . . . . . . .9.08 1236.1 High-Level Skills . . . . . . . . . . . . . . . . . . . . . . . . . . . . . . . . . . . . . . . . . . . . 17.20 1036.1.1 Workforce with tertiary education . . . . . . . . . . . . . . . . . . . . . . . . . . . .21.84 816.1.2 Population with tertiary education . . . . . . . . . . . . . . . . . . . . . . . . . . . . . .n/a n/a6.1.3 Professionals . . . . . . . . . . . . . . . . . . . . . . . . . . . . . . . . . . . . . . . . . . . . . . . . . .30.84 576.1.4 Researchers . . . . . . . . . . . . . . . . . . . . . . . . . . . . . . . . . . . . . . . . . . . . . . . . . . . . 1.32 866.1.5 Senior officials and managers . . . . . . . . . . . . . . . . . . . . . . . . . . . . . . . . .10.64 946.1.6 Availability of scientists and engineers . . . . . . . . . . . . . . . . . . . . . . . . 21.35 1276.2 Talent Impact . . . . . . . . . . . . . . . . . . . . . . . . . . . . . . . . . . . . . . . . . . . . . . . . 0.96 1276.2.1 Innovation output . . . . . . . . . . . . . . . . . . . . . . . . . . . . . . . . . . . . . . . . . . . . . .n/a n/a6.2.2 High-value exports . . . . . . . . . . . . . . . . . . . . . . . . . . . . . . . . . . . . . . . . . . . . . 0.85 1216.2.3 New product entrepreneurial activity . . . . . . . . . . . . . . . . . . . . . . . . . . .n/a n/a6.2.4 New business density . . . . . . . . . . . . . . . . . . . . . . . . . . . . . . . . . . . . . . . . . . .n/a n/a6.2.5 Scientific journal articles . . . . . . . . . . . . . . . . . . . . . . . . . . . . . . . . . . . . . . . 1.06 95
l Eswatini l Income group average
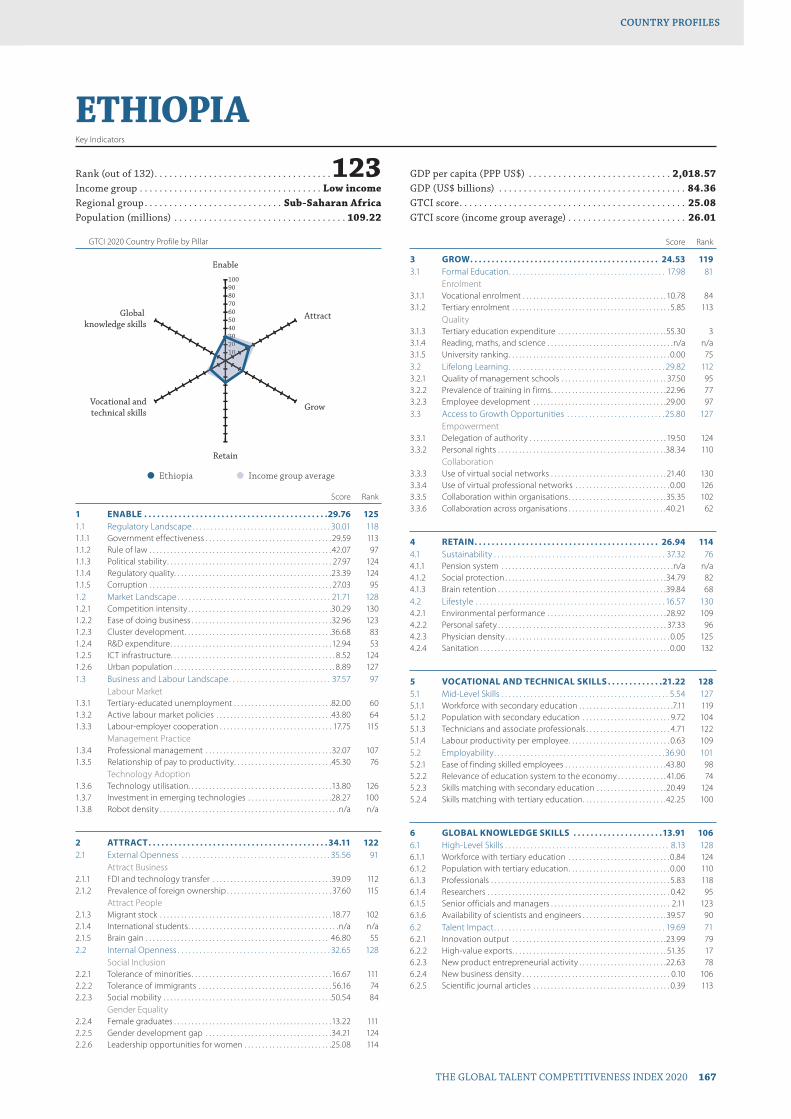
GTCI 2020 Country Profile by Pillar
THE GLOBAL TALENT COMPETITIVENESS INDEX 2020 167
COUNTRY PROFILESCOUNTRY PROFILES
102030405060708090100
Global knowledge skills
Vocational andtechnical skills
Retain
Grow
Attract
Enable
1020330
ETHIOPIAKey Indicators
Rank (out of 132) . . . . . . . . . . . . . . . . . . . . . . . . . . . . . . . . . . . .123Income group . . . . . . . . . . . . . . . . . . . . . . . . . . . . . . . . . . . . . Low incomeRegional group . . . . . . . . . . . . . . . . . . . . . . . . . . . . Sub-Saharan AfricaPopulation (millions) . . . . . . . . . . . . . . . . . . . . . . . . . . . . . . . . . . . 109.22
GDP per capita (PPP US$) . . . . . . . . . . . . . . . . . . . . . . . . . . . . . 2,018.57GDP (US$ billions) . . . . . . . . . . . . . . . . . . . . . . . . . . . . . . . . . . . . . . 84.36GTCI score . . . . . . . . . . . . . . . . . . . . . . . . . . . . . . . . . . . . . . . . . . . . . . 25.08GTCI score (income group average) . . . . . . . . . . . . . . . . . . . . . . . . 26.01
Score Rank
1 ENABLE . . . . . . . . . . . . . . . . . . . . . . . . . . . . . . . . . . . . . . . . . . .29.76 1251.1 Regulatory Landscape . . . . . . . . . . . . . . . . . . . . . . . . . . . . . . . . . . . . . . 30.01 1181.1.1 Government effectiveness . . . . . . . . . . . . . . . . . . . . . . . . . . . . . . . . . . . .29.59 1131.1.2 Rule of law . . . . . . . . . . . . . . . . . . . . . . . . . . . . . . . . . . . . . . . . . . . . . . . . . . . .42.07 971.1.3 Political stability . . . . . . . . . . . . . . . . . . . . . . . . . . . . . . . . . . . . . . . . . . . . . . . 27.97 1241.1.4 Regulatory quality. . . . . . . . . . . . . . . . . . . . . . . . . . . . . . . . . . . . . . . . . . . . .23.39 1241.1.5 Corruption . . . . . . . . . . . . . . . . . . . . . . . . . . . . . . . . . . . . . . . . . . . . . . . . . . . . 27.03 951.2 Market Landscape . . . . . . . . . . . . . . . . . . . . . . . . . . . . . . . . . . . . . . . . . . 21.71 1281.2.1 Competition intensity . . . . . . . . . . . . . . . . . . . . . . . . . . . . . . . . . . . . . . . . .30.29 1301.2.2 Ease of doing business . . . . . . . . . . . . . . . . . . . . . . . . . . . . . . . . . . . . . . . .32.96 1231.2.3 Cluster development . . . . . . . . . . . . . . . . . . . . . . . . . . . . . . . . . . . . . . . . . .36.68 831.2.4 R&D expenditure . . . . . . . . . . . . . . . . . . . . . . . . . . . . . . . . . . . . . . . . . . . . . . 12.94 531.2.5 ICT infrastructure. . . . . . . . . . . . . . . . . . . . . . . . . . . . . . . . . . . . . . . . . . . . . . . 8.52 1241.2.6 Urban population . . . . . . . . . . . . . . . . . . . . . . . . . . . . . . . . . . . . . . . . . . . . . . 8.89 1271.3 Business and Labour Landscape . . . . . . . . . . . . . . . . . . . . . . . . . . . . 37.57 97
Labour Market1.3.1 Tertiary-educated unemployment . . . . . . . . . . . . . . . . . . . . . . . . . . . .82.00 601.3.2 Active labour market policies . . . . . . . . . . . . . . . . . . . . . . . . . . . . . . . . .43.80 641.3.3 Labour-employer cooperation . . . . . . . . . . . . . . . . . . . . . . . . . . . . . . . . 17.75 115
Management Practice1.3.4 Professional management . . . . . . . . . . . . . . . . . . . . . . . . . . . . . . . . . . . .32.07 1071.3.5 Relationship of pay to productivity . . . . . . . . . . . . . . . . . . . . . . . . . . . .45.30 76
Technology Adoption1.3.6 Technology utilisation. . . . . . . . . . . . . . . . . . . . . . . . . . . . . . . . . . . . . . . . .13.80 1261.3.7 Investment in emerging technologies . . . . . . . . . . . . . . . . . . . . . . . .28.27 1001.3.8 Robot density . . . . . . . . . . . . . . . . . . . . . . . . . . . . . . . . . . . . . . . . . . . . . . . . . . .n/a n/a
2 ATTRACT . . . . . . . . . . . . . . . . . . . . . . . . . . . . . . . . . . . . . . . . . . 34.11 1222.1 External Openness . . . . . . . . . . . . . . . . . . . . . . . . . . . . . . . . . . . . . . . . . 35.56 91
Attract Business2.1.1 FDI and technology transfer . . . . . . . . . . . . . . . . . . . . . . . . . . . . . . . . . .39.09 1122.1.2 Prevalence of foreign ownership . . . . . . . . . . . . . . . . . . . . . . . . . . . . . . 37.60 115
Attract People2.1.3 Migrant stock . . . . . . . . . . . . . . . . . . . . . . . . . . . . . . . . . . . . . . . . . . . . . . . . .18.77 1022.1.4 International students . . . . . . . . . . . . . . . . . . . . . . . . . . . . . . . . . . . . . . . . . . .n/a n/a2.1.5 Brain gain . . . . . . . . . . . . . . . . . . . . . . . . . . . . . . . . . . . . . . . . . . . . . . . . . . . . 46.80 552.2 Internal Openness . . . . . . . . . . . . . . . . . . . . . . . . . . . . . . . . . . . . . . . . . . 32.65 128
Social Inclusion2.2.1 Tolerance of minorities . . . . . . . . . . . . . . . . . . . . . . . . . . . . . . . . . . . . . . . .16.67 1112.2.2 Tolerance of immigrants . . . . . . . . . . . . . . . . . . . . . . . . . . . . . . . . . . . . . . 56.16 742.2.3 Social mobility . . . . . . . . . . . . . . . . . . . . . . . . . . . . . . . . . . . . . . . . . . . . . . . .50.54 84
Gender Equality2.2.4 Female graduates . . . . . . . . . . . . . . . . . . . . . . . . . . . . . . . . . . . . . . . . . . . . .13.22 1112.2.5 Gender development gap . . . . . . . . . . . . . . . . . . . . . . . . . . . . . . . . . . . .34.21 1242.2.6 Leadership opportunities for women . . . . . . . . . . . . . . . . . . . . . . . . .25.08 114
Score Rank
3 GROW . . . . . . . . . . . . . . . . . . . . . . . . . . . . . . . . . . . . . . . . . . . . 24.53 1193.1 Formal Education . . . . . . . . . . . . . . . . . . . . . . . . . . . . . . . . . . . . . . . . . . . 17.98 81
Enrolment3.1.1 Vocational enrolment . . . . . . . . . . . . . . . . . . . . . . . . . . . . . . . . . . . . . . . . . 10.78 843.1.2 Tertiary enrolment . . . . . . . . . . . . . . . . . . . . . . . . . . . . . . . . . . . . . . . . . . . . . 5.85 113
Quality3.1.3 Tertiary education expenditure . . . . . . . . . . . . . . . . . . . . . . . . . . . . . . .55.30 33.1.4 Reading, maths, and science . . . . . . . . . . . . . . . . . . . . . . . . . . . . . . . . . . . .n/a n/a3.1.5 University ranking . . . . . . . . . . . . . . . . . . . . . . . . . . . . . . . . . . . . . . . . . . . . . . 0.00 753.2 Lifelong Learning . . . . . . . . . . . . . . . . . . . . . . . . . . . . . . . . . . . . . . . . . . . 29.82 1123.2.1 Quality of management schools . . . . . . . . . . . . . . . . . . . . . . . . . . . . . . 37.50 953.2.2 Prevalence of training in firms . . . . . . . . . . . . . . . . . . . . . . . . . . . . . . . . .22.96 773.2.3 Employee development . . . . . . . . . . . . . . . . . . . . . . . . . . . . . . . . . . . . . .29.00 973.3 Access to Growth Opportunities . . . . . . . . . . . . . . . . . . . . . . . . . . . 25.80 127
Empowerment3.3.1 Delegation of authority . . . . . . . . . . . . . . . . . . . . . . . . . . . . . . . . . . . . . . . 19.50 1243.3.2 Personal rights . . . . . . . . . . . . . . . . . . . . . . . . . . . . . . . . . . . . . . . . . . . . . . . .38.34 110
Collaboration3.3.3 Use of virtual social networks . . . . . . . . . . . . . . . . . . . . . . . . . . . . . . . . . 21.40 1303.3.4 Use of virtual professional networks . . . . . . . . . . . . . . . . . . . . . . . . . . . 0.00 1263.3.5 Collaboration within organisations . . . . . . . . . . . . . . . . . . . . . . . . . . . .35.35 1023.3.6 Collaboration across organisations . . . . . . . . . . . . . . . . . . . . . . . . . . . .40.21 62
4 RETAIN . . . . . . . . . . . . . . . . . . . . . . . . . . . . . . . . . . . . . . . . . . . 26.94 1144.1 Sustainability . . . . . . . . . . . . . . . . . . . . . . . . . . . . . . . . . . . . . . . . . . . . . . . 37.32 764.1.1 Pension system . . . . . . . . . . . . . . . . . . . . . . . . . . . . . . . . . . . . . . . . . . . . . . . . .n/a n/a4.1.2 Social protection . . . . . . . . . . . . . . . . . . . . . . . . . . . . . . . . . . . . . . . . . . . . . .34.79 824.1.3 Brain retention . . . . . . . . . . . . . . . . . . . . . . . . . . . . . . . . . . . . . . . . . . . . . . . .39.84 684.2 Lifestyle . . . . . . . . . . . . . . . . . . . . . . . . . . . . . . . . . . . . . . . . . . . . . . . . . . . . 16.57 1304.2.1 Environmental performance . . . . . . . . . . . . . . . . . . . . . . . . . . . . . . . . . .28.92 1094.2.2 Personal safety . . . . . . . . . . . . . . . . . . . . . . . . . . . . . . . . . . . . . . . . . . . . . . . . 37.33 964.2.3 Physician density . . . . . . . . . . . . . . . . . . . . . . . . . . . . . . . . . . . . . . . . . . . . . . . 0.05 1254.2.4 Sanitation . . . . . . . . . . . . . . . . . . . . . . . . . . . . . . . . . . . . . . . . . . . . . . . . . . . . . . 0.00 132
5 VOCATIONAL AND TECHNICAL SKILLS . . . . . . . . . . . . .21.22 1285.1 Mid-Level Skills . . . . . . . . . . . . . . . . . . . . . . . . . . . . . . . . . . . . . . . . . . . . . . 5.54 1275.1.1 Workforce with secondary education . . . . . . . . . . . . . . . . . . . . . . . . . . .7.11 1195.1.2 Population with secondary education . . . . . . . . . . . . . . . . . . . . . . . . . 9.72 1045.1.3 Technicians and associate professionals . . . . . . . . . . . . . . . . . . . . . . . . 4.71 1225.1.4 Labour productivity per employee . . . . . . . . . . . . . . . . . . . . . . . . . . . . . 0.63 1095.2 Employability . . . . . . . . . . . . . . . . . . . . . . . . . . . . . . . . . . . . . . . . . . . . . . . 36.90 1015.2.1 Ease of finding skilled employees . . . . . . . . . . . . . . . . . . . . . . . . . . . . .43.80 985.2.2 Relevance of education system to the economy . . . . . . . . . . . . . . 41.06 745.2.3 Skills matching with secondary education . . . . . . . . . . . . . . . . . . . .20.49 1245.2.4 Skills matching with tertiary education . . . . . . . . . . . . . . . . . . . . . . . .42.25 100
6 GLOBAL KNOWLEDGE SKILLS . . . . . . . . . . . . . . . . . . . . .13.91 1066.1 High-Level Skills . . . . . . . . . . . . . . . . . . . . . . . . . . . . . . . . . . . . . . . . . . . . . 8.13 1286.1.1 Workforce with tertiary education . . . . . . . . . . . . . . . . . . . . . . . . . . . . . 0.84 1246.1.2 Population with tertiary education . . . . . . . . . . . . . . . . . . . . . . . . . . . . . 0.00 1106.1.3 Professionals . . . . . . . . . . . . . . . . . . . . . . . . . . . . . . . . . . . . . . . . . . . . . . . . . . . 5.83 1186.1.4 Researchers . . . . . . . . . . . . . . . . . . . . . . . . . . . . . . . . . . . . . . . . . . . . . . . . . . . . 0.42 956.1.5 Senior officials and managers . . . . . . . . . . . . . . . . . . . . . . . . . . . . . . . . . . 2.11 1236.1.6 Availability of scientists and engineers . . . . . . . . . . . . . . . . . . . . . . . .39.57 906.2 Talent Impact . . . . . . . . . . . . . . . . . . . . . . . . . . . . . . . . . . . . . . . . . . . . . . . 19.69 716.2.1 Innovation output . . . . . . . . . . . . . . . . . . . . . . . . . . . . . . . . . . . . . . . . . . . .23.99 796.2.2 High-value exports . . . . . . . . . . . . . . . . . . . . . . . . . . . . . . . . . . . . . . . . . . . . 51.35 176.2.3 New product entrepreneurial activity . . . . . . . . . . . . . . . . . . . . . . . . .22.63 786.2.4 New business density . . . . . . . . . . . . . . . . . . . . . . . . . . . . . . . . . . . . . . . . . . 0.10 1066.2.5 Scientific journal articles . . . . . . . . . . . . . . . . . . . . . . . . . . . . . . . . . . . . . . . 0.39 113
l Ethiopia l Income group average
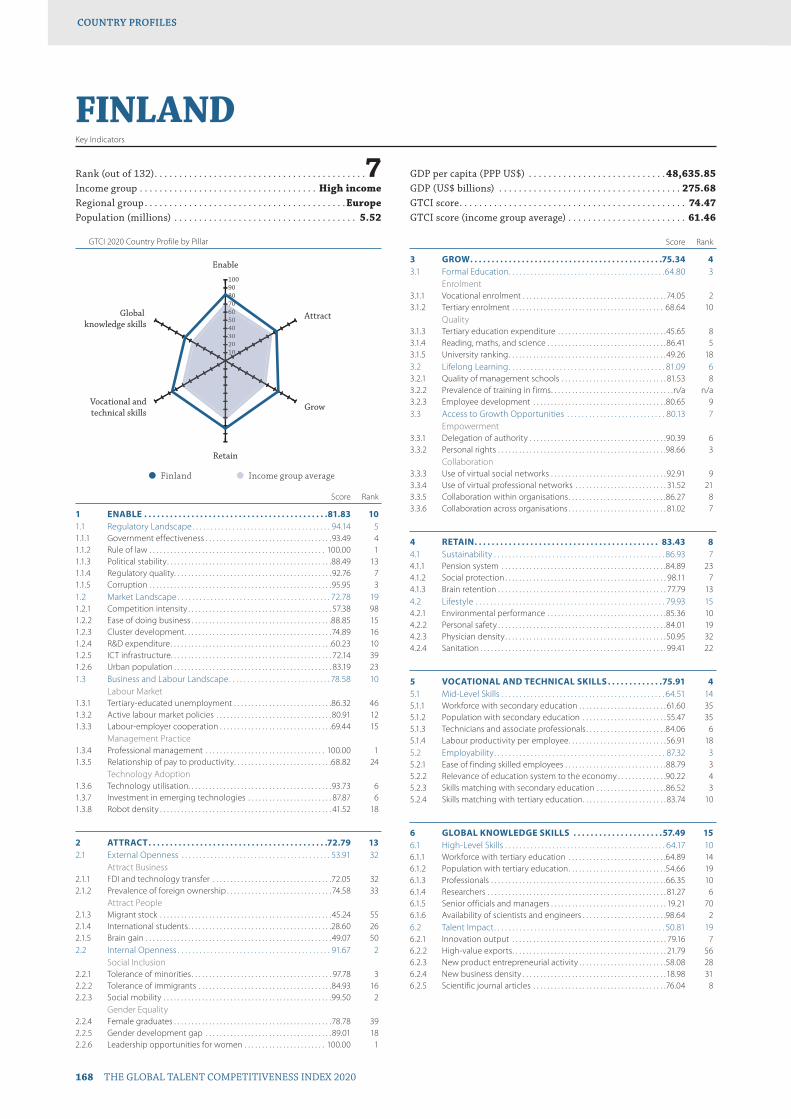
GTCI 2020 Country Profile by Pillar
168 THE GLOBAL TALENT COMPETITIVENESS INDEX 2020
COUNTRY PROFILESCOUNTRY PROFILES
102030405060708090100
Global knowledge skills
Vocational andtechnical skills
Retain
Grow
Attract
Enable
102030405060607
FINLANDKey Indicators
Rank (out of 132) . . . . . . . . . . . . . . . . . . . . . . . . . . . . . . . . . . . . . . . . . . .7Income group . . . . . . . . . . . . . . . . . . . . . . . . . . . . . . . . . . . . High incomeRegional group . . . . . . . . . . . . . . . . . . . . . . . . . . . . . . . . . . . . . . . . .EuropePopulation (millions) . . . . . . . . . . . . . . . . . . . . . . . . . . . . . . . . . . . . . 5.52
GDP per capita (PPP US$) . . . . . . . . . . . . . . . . . . . . . . . . . . . .48,635.85GDP (US$ billions) . . . . . . . . . . . . . . . . . . . . . . . . . . . . . . . . . . . . . 275.68GTCI score . . . . . . . . . . . . . . . . . . . . . . . . . . . . . . . . . . . . . . . . . . . . . . 74.47GTCI score (income group average) . . . . . . . . . . . . . . . . . . . . . . . . 61.46
Score Rank
1 ENABLE . . . . . . . . . . . . . . . . . . . . . . . . . . . . . . . . . . . . . . . . . . .81.83 101.1 Regulatory Landscape . . . . . . . . . . . . . . . . . . . . . . . . . . . . . . . . . . . . . . 94.14 51.1.1 Government effectiveness . . . . . . . . . . . . . . . . . . . . . . . . . . . . . . . . . . . .93.49 41.1.2 Rule of law . . . . . . . . . . . . . . . . . . . . . . . . . . . . . . . . . . . . . . . . . . . . . . . . . . 100.00 11.1.3 Political stability . . . . . . . . . . . . . . . . . . . . . . . . . . . . . . . . . . . . . . . . . . . . . . .88.49 131.1.4 Regulatory quality. . . . . . . . . . . . . . . . . . . . . . . . . . . . . . . . . . . . . . . . . . . . . 92.76 71.1.5 Corruption . . . . . . . . . . . . . . . . . . . . . . . . . . . . . . . . . . . . . . . . . . . . . . . . . . . .95.95 31.2 Market Landscape . . . . . . . . . . . . . . . . . . . . . . . . . . . . . . . . . . . . . . . . . . 72.78 191.2.1 Competition intensity . . . . . . . . . . . . . . . . . . . . . . . . . . . . . . . . . . . . . . . . . 57.38 981.2.2 Ease of doing business . . . . . . . . . . . . . . . . . . . . . . . . . . . . . . . . . . . . . . . .88.85 151.2.3 Cluster development . . . . . . . . . . . . . . . . . . . . . . . . . . . . . . . . . . . . . . . . . .74.89 161.2.4 R&D expenditure . . . . . . . . . . . . . . . . . . . . . . . . . . . . . . . . . . . . . . . . . . . . . .60.23 101.2.5 ICT infrastructure. . . . . . . . . . . . . . . . . . . . . . . . . . . . . . . . . . . . . . . . . . . . . . 72.14 391.2.6 Urban population . . . . . . . . . . . . . . . . . . . . . . . . . . . . . . . . . . . . . . . . . . . . . 83.19 231.3 Business and Labour Landscape . . . . . . . . . . . . . . . . . . . . . . . . . . . . 78.58 10
Labour Market1.3.1 Tertiary-educated unemployment . . . . . . . . . . . . . . . . . . . . . . . . . . . .86.32 461.3.2 Active labour market policies . . . . . . . . . . . . . . . . . . . . . . . . . . . . . . . . .80.91 121.3.3 Labour-employer cooperation . . . . . . . . . . . . . . . . . . . . . . . . . . . . . . . .69.44 15
Management Practice1.3.4 Professional management . . . . . . . . . . . . . . . . . . . . . . . . . . . . . . . . . . 100.00 11.3.5 Relationship of pay to productivity . . . . . . . . . . . . . . . . . . . . . . . . . . . .68.82 24
Technology Adoption1.3.6 Technology utilisation. . . . . . . . . . . . . . . . . . . . . . . . . . . . . . . . . . . . . . . . .93.73 61.3.7 Investment in emerging technologies . . . . . . . . . . . . . . . . . . . . . . . . 87.87 61.3.8 Robot density . . . . . . . . . . . . . . . . . . . . . . . . . . . . . . . . . . . . . . . . . . . . . . . . . 41.52 18
2 ATTRACT . . . . . . . . . . . . . . . . . . . . . . . . . . . . . . . . . . . . . . . . . .72.79 132.1 External Openness . . . . . . . . . . . . . . . . . . . . . . . . . . . . . . . . . . . . . . . . . 53.91 32
Attract Business2.1.1 FDI and technology transfer . . . . . . . . . . . . . . . . . . . . . . . . . . . . . . . . . .72.05 322.1.2 Prevalence of foreign ownership . . . . . . . . . . . . . . . . . . . . . . . . . . . . . .74.58 33
Attract People2.1.3 Migrant stock . . . . . . . . . . . . . . . . . . . . . . . . . . . . . . . . . . . . . . . . . . . . . . . . .45.24 552.1.4 International students . . . . . . . . . . . . . . . . . . . . . . . . . . . . . . . . . . . . . . . . .28.60 262.1.5 Brain gain . . . . . . . . . . . . . . . . . . . . . . . . . . . . . . . . . . . . . . . . . . . . . . . . . . . . . 49.07 502.2 Internal Openness . . . . . . . . . . . . . . . . . . . . . . . . . . . . . . . . . . . . . . . . . . 91.67 2
Social Inclusion2.2.1 Tolerance of minorities . . . . . . . . . . . . . . . . . . . . . . . . . . . . . . . . . . . . . . . . 97.78 32.2.2 Tolerance of immigrants . . . . . . . . . . . . . . . . . . . . . . . . . . . . . . . . . . . . . .84.93 162.2.3 Social mobility . . . . . . . . . . . . . . . . . . . . . . . . . . . . . . . . . . . . . . . . . . . . . . . .99.50 2
Gender Equality2.2.4 Female graduates . . . . . . . . . . . . . . . . . . . . . . . . . . . . . . . . . . . . . . . . . . . . .78.78 392.2.5 Gender development gap . . . . . . . . . . . . . . . . . . . . . . . . . . . . . . . . . . . . 89.01 182.2.6 Leadership opportunities for women . . . . . . . . . . . . . . . . . . . . . . . 100.00 1
Score Rank
3 GROW . . . . . . . . . . . . . . . . . . . . . . . . . . . . . . . . . . . . . . . . . . . . .75.34 43.1 Formal Education . . . . . . . . . . . . . . . . . . . . . . . . . . . . . . . . . . . . . . . . . . .64.80 3
Enrolment3.1.1 Vocational enrolment . . . . . . . . . . . . . . . . . . . . . . . . . . . . . . . . . . . . . . . . . 74.05 23.1.2 Tertiary enrolment . . . . . . . . . . . . . . . . . . . . . . . . . . . . . . . . . . . . . . . . . . . 68.64 10
Quality3.1.3 Tertiary education expenditure . . . . . . . . . . . . . . . . . . . . . . . . . . . . . . .45.65 83.1.4 Reading, maths, and science . . . . . . . . . . . . . . . . . . . . . . . . . . . . . . . . . .86.41 53.1.5 University ranking . . . . . . . . . . . . . . . . . . . . . . . . . . . . . . . . . . . . . . . . . . . . .49.26 183.2 Lifelong Learning . . . . . . . . . . . . . . . . . . . . . . . . . . . . . . . . . . . . . . . . . . . 81.09 63.2.1 Quality of management schools . . . . . . . . . . . . . . . . . . . . . . . . . . . . . . 81.53 83.2.2 Prevalence of training in firms . . . . . . . . . . . . . . . . . . . . . . . . . . . . . . . . . . .n/a n/a3.2.3 Employee development . . . . . . . . . . . . . . . . . . . . . . . . . . . . . . . . . . . . . .80.65 93.3 Access to Growth Opportunities . . . . . . . . . . . . . . . . . . . . . . . . . . . 80.13 7
Empowerment3.3.1 Delegation of authority . . . . . . . . . . . . . . . . . . . . . . . . . . . . . . . . . . . . . . .90.39 63.3.2 Personal rights . . . . . . . . . . . . . . . . . . . . . . . . . . . . . . . . . . . . . . . . . . . . . . . .98.66 3
Collaboration3.3.3 Use of virtual social networks . . . . . . . . . . . . . . . . . . . . . . . . . . . . . . . . . 92.91 93.3.4 Use of virtual professional networks . . . . . . . . . . . . . . . . . . . . . . . . . . 31.52 213.3.5 Collaboration within organisations . . . . . . . . . . . . . . . . . . . . . . . . . . . .86.27 83.3.6 Collaboration across organisations . . . . . . . . . . . . . . . . . . . . . . . . . . . . 81.02 7
4 RETAIN . . . . . . . . . . . . . . . . . . . . . . . . . . . . . . . . . . . . . . . . . . . 83.43 84.1 Sustainability . . . . . . . . . . . . . . . . . . . . . . . . . . . . . . . . . . . . . . . . . . . . . . . 86.93 74.1.1 Pension system . . . . . . . . . . . . . . . . . . . . . . . . . . . . . . . . . . . . . . . . . . . . . . .84.89 234.1.2 Social protection . . . . . . . . . . . . . . . . . . . . . . . . . . . . . . . . . . . . . . . . . . . . . . 98.11 74.1.3 Brain retention . . . . . . . . . . . . . . . . . . . . . . . . . . . . . . . . . . . . . . . . . . . . . . . . 77.79 134.2 Lifestyle . . . . . . . . . . . . . . . . . . . . . . . . . . . . . . . . . . . . . . . . . . . . . . . . . . . . 79.93 154.2.1 Environmental performance . . . . . . . . . . . . . . . . . . . . . . . . . . . . . . . . . .85.36 104.2.2 Personal safety . . . . . . . . . . . . . . . . . . . . . . . . . . . . . . . . . . . . . . . . . . . . . . . .84.01 194.2.3 Physician density . . . . . . . . . . . . . . . . . . . . . . . . . . . . . . . . . . . . . . . . . . . . . .50.95 324.2.4 Sanitation . . . . . . . . . . . . . . . . . . . . . . . . . . . . . . . . . . . . . . . . . . . . . . . . . . . . . 99.41 22
5 VOCATIONAL AND TECHNICAL SKILLS . . . . . . . . . . . . .75.91 45.1 Mid-Level Skills . . . . . . . . . . . . . . . . . . . . . . . . . . . . . . . . . . . . . . . . . . . . . 64.51 145.1.1 Workforce with secondary education . . . . . . . . . . . . . . . . . . . . . . . . . 61.60 355.1.2 Population with secondary education . . . . . . . . . . . . . . . . . . . . . . . . 55.47 355.1.3 Technicians and associate professionals . . . . . . . . . . . . . . . . . . . . . . .84.06 65.1.4 Labour productivity per employee . . . . . . . . . . . . . . . . . . . . . . . . . . . .56.91 185.2 Employability . . . . . . . . . . . . . . . . . . . . . . . . . . . . . . . . . . . . . . . . . . . . . . . 87.32 35.2.1 Ease of finding skilled employees . . . . . . . . . . . . . . . . . . . . . . . . . . . . .88.79 35.2.2 Relevance of education system to the economy . . . . . . . . . . . . . .90.22 45.2.3 Skills matching with secondary education . . . . . . . . . . . . . . . . . . . .86.52 35.2.4 Skills matching with tertiary education . . . . . . . . . . . . . . . . . . . . . . . . 83.74 10
6 GLOBAL KNOWLEDGE SKILLS . . . . . . . . . . . . . . . . . . . . .57.49 156.1 High-Level Skills . . . . . . . . . . . . . . . . . . . . . . . . . . . . . . . . . . . . . . . . . . . . 64.17 106.1.1 Workforce with tertiary education . . . . . . . . . . . . . . . . . . . . . . . . . . . .64.89 146.1.2 Population with tertiary education . . . . . . . . . . . . . . . . . . . . . . . . . . . .54.66 196.1.3 Professionals . . . . . . . . . . . . . . . . . . . . . . . . . . . . . . . . . . . . . . . . . . . . . . . . . .66.35 106.1.4 Researchers . . . . . . . . . . . . . . . . . . . . . . . . . . . . . . . . . . . . . . . . . . . . . . . . . . . 81.27 66.1.5 Senior officials and managers . . . . . . . . . . . . . . . . . . . . . . . . . . . . . . . . . 19.21 706.1.6 Availability of scientists and engineers . . . . . . . . . . . . . . . . . . . . . . . .98.64 26.2 Talent Impact . . . . . . . . . . . . . . . . . . . . . . . . . . . . . . . . . . . . . . . . . . . . . . . 50.81 196.2.1 Innovation output . . . . . . . . . . . . . . . . . . . . . . . . . . . . . . . . . . . . . . . . . . . . 79.16 76.2.2 High-value exports . . . . . . . . . . . . . . . . . . . . . . . . . . . . . . . . . . . . . . . . . . . . 21.79 566.2.3 New product entrepreneurial activity . . . . . . . . . . . . . . . . . . . . . . . . .58.08 286.2.4 New business density . . . . . . . . . . . . . . . . . . . . . . . . . . . . . . . . . . . . . . . . .18.98 316.2.5 Scientific journal articles . . . . . . . . . . . . . . . . . . . . . . . . . . . . . . . . . . . . . .76.04 8
l Finland l Income group average
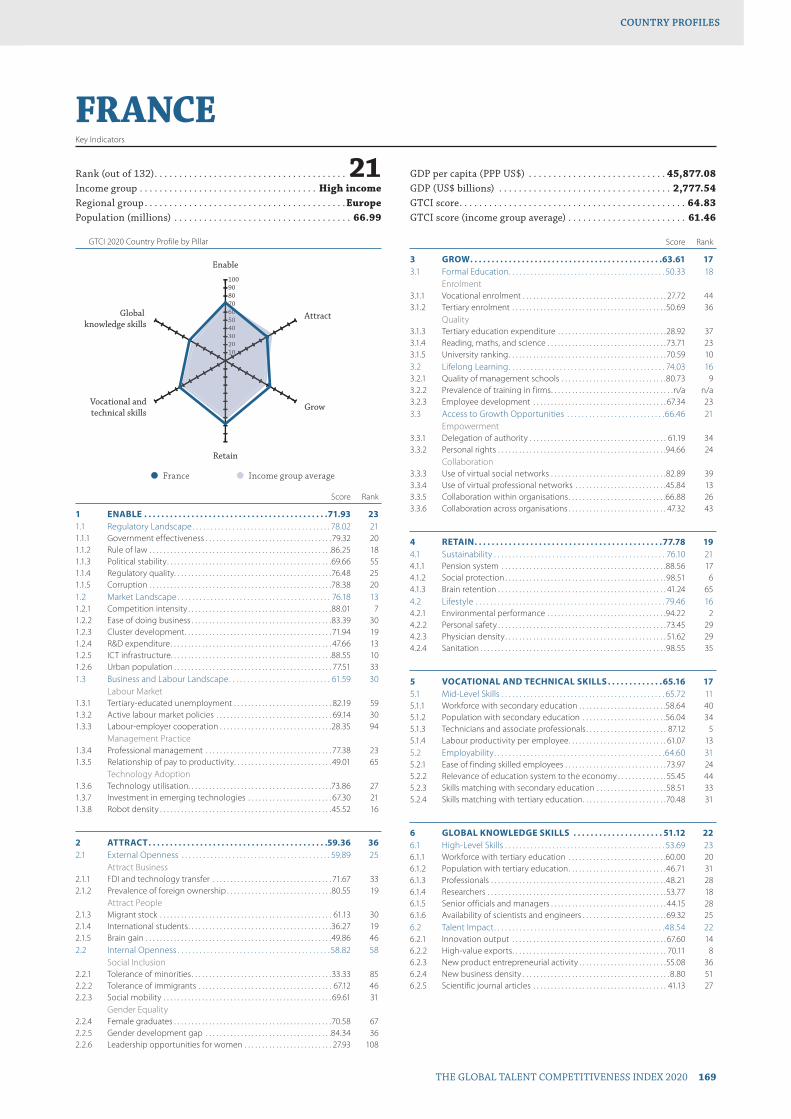
GTCI 2020 Country Profile by Pillar
THE GLOBAL TALENT COMPETITIVENESS INDEX 2020 169
COUNTRY PROFILESCOUNTRY PROFILES
102030405060708090100
Global knowledge skills
Vocational andtechnical skills
Retain
Grow
Attract
Enable
102030405060607
FRANCEKey Indicators
Rank (out of 132) . . . . . . . . . . . . . . . . . . . . . . . . . . . . . . . . . . . . . . . 21Income group . . . . . . . . . . . . . . . . . . . . . . . . . . . . . . . . . . . . High incomeRegional group . . . . . . . . . . . . . . . . . . . . . . . . . . . . . . . . . . . . . . . . .EuropePopulation (millions) . . . . . . . . . . . . . . . . . . . . . . . . . . . . . . . . . . . . 66.99
GDP per capita (PPP US$) . . . . . . . . . . . . . . . . . . . . . . . . . . . . 45,877.08GDP (US$ billions) . . . . . . . . . . . . . . . . . . . . . . . . . . . . . . . . . . . 2,777.54GTCI score . . . . . . . . . . . . . . . . . . . . . . . . . . . . . . . . . . . . . . . . . . . . . . 64.83GTCI score (income group average) . . . . . . . . . . . . . . . . . . . . . . . . 61.46
Score Rank
1 ENABLE . . . . . . . . . . . . . . . . . . . . . . . . . . . . . . . . . . . . . . . . . . .71.93 231.1 Regulatory Landscape . . . . . . . . . . . . . . . . . . . . . . . . . . . . . . . . . . . . . . 78.02 211.1.1 Government effectiveness . . . . . . . . . . . . . . . . . . . . . . . . . . . . . . . . . . . .79.32 201.1.2 Rule of law . . . . . . . . . . . . . . . . . . . . . . . . . . . . . . . . . . . . . . . . . . . . . . . . . . . .86.25 181.1.3 Political stability . . . . . . . . . . . . . . . . . . . . . . . . . . . . . . . . . . . . . . . . . . . . . . .69.66 551.1.4 Regulatory quality. . . . . . . . . . . . . . . . . . . . . . . . . . . . . . . . . . . . . . . . . . . . .76.48 251.1.5 Corruption . . . . . . . . . . . . . . . . . . . . . . . . . . . . . . . . . . . . . . . . . . . . . . . . . . . .78.38 201.2 Market Landscape . . . . . . . . . . . . . . . . . . . . . . . . . . . . . . . . . . . . . . . . . . 76.18 131.2.1 Competition intensity . . . . . . . . . . . . . . . . . . . . . . . . . . . . . . . . . . . . . . . . .88.01 71.2.2 Ease of doing business . . . . . . . . . . . . . . . . . . . . . . . . . . . . . . . . . . . . . . . .83.39 301.2.3 Cluster development . . . . . . . . . . . . . . . . . . . . . . . . . . . . . . . . . . . . . . . . . . 71.94 191.2.4 R&D expenditure . . . . . . . . . . . . . . . . . . . . . . . . . . . . . . . . . . . . . . . . . . . . . . 47.66 131.2.5 ICT infrastructure. . . . . . . . . . . . . . . . . . . . . . . . . . . . . . . . . . . . . . . . . . . . . .88.55 101.2.6 Urban population . . . . . . . . . . . . . . . . . . . . . . . . . . . . . . . . . . . . . . . . . . . . . 77.51 331.3 Business and Labour Landscape . . . . . . . . . . . . . . . . . . . . . . . . . . . . 61.59 30
Labour Market1.3.1 Tertiary-educated unemployment . . . . . . . . . . . . . . . . . . . . . . . . . . . . 82.19 591.3.2 Active labour market policies . . . . . . . . . . . . . . . . . . . . . . . . . . . . . . . . . 69.14 301.3.3 Labour-employer cooperation . . . . . . . . . . . . . . . . . . . . . . . . . . . . . . . .28.35 94
Management Practice1.3.4 Professional management . . . . . . . . . . . . . . . . . . . . . . . . . . . . . . . . . . . . 77.38 231.3.5 Relationship of pay to productivity . . . . . . . . . . . . . . . . . . . . . . . . . . . . 49.01 65
Technology Adoption1.3.6 Technology utilisation. . . . . . . . . . . . . . . . . . . . . . . . . . . . . . . . . . . . . . . . .73.86 271.3.7 Investment in emerging technologies . . . . . . . . . . . . . . . . . . . . . . . . 67.30 211.3.8 Robot density . . . . . . . . . . . . . . . . . . . . . . . . . . . . . . . . . . . . . . . . . . . . . . . . .45.52 16
2 ATTRACT . . . . . . . . . . . . . . . . . . . . . . . . . . . . . . . . . . . . . . . . . .59.36 362.1 External Openness . . . . . . . . . . . . . . . . . . . . . . . . . . . . . . . . . . . . . . . . . 59.89 25
Attract Business2.1.1 FDI and technology transfer . . . . . . . . . . . . . . . . . . . . . . . . . . . . . . . . . . 71.67 332.1.2 Prevalence of foreign ownership . . . . . . . . . . . . . . . . . . . . . . . . . . . . . .80.55 19
Attract People2.1.3 Migrant stock . . . . . . . . . . . . . . . . . . . . . . . . . . . . . . . . . . . . . . . . . . . . . . . . . 61.13 302.1.4 International students . . . . . . . . . . . . . . . . . . . . . . . . . . . . . . . . . . . . . . . . .36.27 192.1.5 Brain gain . . . . . . . . . . . . . . . . . . . . . . . . . . . . . . . . . . . . . . . . . . . . . . . . . . . . .49.86 462.2 Internal Openness . . . . . . . . . . . . . . . . . . . . . . . . . . . . . . . . . . . . . . . . . . 58.82 58
Social Inclusion2.2.1 Tolerance of minorities . . . . . . . . . . . . . . . . . . . . . . . . . . . . . . . . . . . . . . . .33.33 852.2.2 Tolerance of immigrants . . . . . . . . . . . . . . . . . . . . . . . . . . . . . . . . . . . . . . 67.12 462.2.3 Social mobility . . . . . . . . . . . . . . . . . . . . . . . . . . . . . . . . . . . . . . . . . . . . . . . . 69.61 31
Gender Equality2.2.4 Female graduates . . . . . . . . . . . . . . . . . . . . . . . . . . . . . . . . . . . . . . . . . . . . .70.58 672.2.5 Gender development gap . . . . . . . . . . . . . . . . . . . . . . . . . . . . . . . . . . . .84.34 362.2.6 Leadership opportunities for women . . . . . . . . . . . . . . . . . . . . . . . . . 27.93 108
Score Rank
3 GROW . . . . . . . . . . . . . . . . . . . . . . . . . . . . . . . . . . . . . . . . . . . . .63.61 173.1 Formal Education . . . . . . . . . . . . . . . . . . . . . . . . . . . . . . . . . . . . . . . . . . . 50.33 18
Enrolment3.1.1 Vocational enrolment . . . . . . . . . . . . . . . . . . . . . . . . . . . . . . . . . . . . . . . . . 27.72 443.1.2 Tertiary enrolment . . . . . . . . . . . . . . . . . . . . . . . . . . . . . . . . . . . . . . . . . . . .50.69 36
Quality3.1.3 Tertiary education expenditure . . . . . . . . . . . . . . . . . . . . . . . . . . . . . . .28.92 373.1.4 Reading, maths, and science . . . . . . . . . . . . . . . . . . . . . . . . . . . . . . . . . .73.71 233.1.5 University ranking . . . . . . . . . . . . . . . . . . . . . . . . . . . . . . . . . . . . . . . . . . . . .70.59 103.2 Lifelong Learning . . . . . . . . . . . . . . . . . . . . . . . . . . . . . . . . . . . . . . . . . . . 74.03 163.2.1 Quality of management schools . . . . . . . . . . . . . . . . . . . . . . . . . . . . . .80.73 93.2.2 Prevalence of training in firms . . . . . . . . . . . . . . . . . . . . . . . . . . . . . . . . . . .n/a n/a3.2.3 Employee development . . . . . . . . . . . . . . . . . . . . . . . . . . . . . . . . . . . . . . 67.34 233.3 Access to Growth Opportunities . . . . . . . . . . . . . . . . . . . . . . . . . . .66.46 21
Empowerment3.3.1 Delegation of authority . . . . . . . . . . . . . . . . . . . . . . . . . . . . . . . . . . . . . . . 61.19 343.3.2 Personal rights . . . . . . . . . . . . . . . . . . . . . . . . . . . . . . . . . . . . . . . . . . . . . . . .94.66 24
Collaboration3.3.3 Use of virtual social networks . . . . . . . . . . . . . . . . . . . . . . . . . . . . . . . . .82.89 393.3.4 Use of virtual professional networks . . . . . . . . . . . . . . . . . . . . . . . . . .45.84 133.3.5 Collaboration within organisations . . . . . . . . . . . . . . . . . . . . . . . . . . . .66.88 263.3.6 Collaboration across organisations . . . . . . . . . . . . . . . . . . . . . . . . . . . . 47.32 43
4 RETAIN . . . . . . . . . . . . . . . . . . . . . . . . . . . . . . . . . . . . . . . . . . . .77.78 194.1 Sustainability . . . . . . . . . . . . . . . . . . . . . . . . . . . . . . . . . . . . . . . . . . . . . . . 76.10 214.1.1 Pension system . . . . . . . . . . . . . . . . . . . . . . . . . . . . . . . . . . . . . . . . . . . . . . .88.56 174.1.2 Social protection . . . . . . . . . . . . . . . . . . . . . . . . . . . . . . . . . . . . . . . . . . . . . .98.51 64.1.3 Brain retention . . . . . . . . . . . . . . . . . . . . . . . . . . . . . . . . . . . . . . . . . . . . . . . . 41.24 654.2 Lifestyle . . . . . . . . . . . . . . . . . . . . . . . . . . . . . . . . . . . . . . . . . . . . . . . . . . . . 79.46 164.2.1 Environmental performance . . . . . . . . . . . . . . . . . . . . . . . . . . . . . . . . . .94.22 24.2.2 Personal safety . . . . . . . . . . . . . . . . . . . . . . . . . . . . . . . . . . . . . . . . . . . . . . . .73.45 294.2.3 Physician density . . . . . . . . . . . . . . . . . . . . . . . . . . . . . . . . . . . . . . . . . . . . . . 51.62 294.2.4 Sanitation . . . . . . . . . . . . . . . . . . . . . . . . . . . . . . . . . . . . . . . . . . . . . . . . . . . . .98.55 35
5 VOCATIONAL AND TECHNICAL SKILLS . . . . . . . . . . . . .65.16 175.1 Mid-Level Skills . . . . . . . . . . . . . . . . . . . . . . . . . . . . . . . . . . . . . . . . . . . . . 65.72 115.1.1 Workforce with secondary education . . . . . . . . . . . . . . . . . . . . . . . . .58.64 405.1.2 Population with secondary education . . . . . . . . . . . . . . . . . . . . . . . .56.04 345.1.3 Technicians and associate professionals . . . . . . . . . . . . . . . . . . . . . . . 87.12 55.1.4 Labour productivity per employee . . . . . . . . . . . . . . . . . . . . . . . . . . . . 61.07 135.2 Employability . . . . . . . . . . . . . . . . . . . . . . . . . . . . . . . . . . . . . . . . . . . . . . .64.60 315.2.1 Ease of finding skilled employees . . . . . . . . . . . . . . . . . . . . . . . . . . . . .73.97 245.2.2 Relevance of education system to the economy . . . . . . . . . . . . . . 55.45 445.2.3 Skills matching with secondary education . . . . . . . . . . . . . . . . . . . .58.51 335.2.4 Skills matching with tertiary education . . . . . . . . . . . . . . . . . . . . . . . .70.48 31
6 GLOBAL KNOWLEDGE SKILLS . . . . . . . . . . . . . . . . . . . . . 51.12 226.1 High-Level Skills . . . . . . . . . . . . . . . . . . . . . . . . . . . . . . . . . . . . . . . . . . . . 53.69 236.1.1 Workforce with tertiary education . . . . . . . . . . . . . . . . . . . . . . . . . . . .60.00 206.1.2 Population with tertiary education . . . . . . . . . . . . . . . . . . . . . . . . . . . .46.71 316.1.3 Professionals . . . . . . . . . . . . . . . . . . . . . . . . . . . . . . . . . . . . . . . . . . . . . . . . . .48.21 286.1.4 Researchers . . . . . . . . . . . . . . . . . . . . . . . . . . . . . . . . . . . . . . . . . . . . . . . . . . .53.77 186.1.5 Senior officials and managers . . . . . . . . . . . . . . . . . . . . . . . . . . . . . . . . . 44.15 286.1.6 Availability of scientists and engineers . . . . . . . . . . . . . . . . . . . . . . . .69.32 256.2 Talent Impact . . . . . . . . . . . . . . . . . . . . . . . . . . . . . . . . . . . . . . . . . . . . . . .48.54 226.2.1 Innovation output . . . . . . . . . . . . . . . . . . . . . . . . . . . . . . . . . . . . . . . . . . . . 67.60 146.2.2 High-value exports . . . . . . . . . . . . . . . . . . . . . . . . . . . . . . . . . . . . . . . . . . . . 70.11 86.2.3 New product entrepreneurial activity . . . . . . . . . . . . . . . . . . . . . . . . .55.08 366.2.4 New business density . . . . . . . . . . . . . . . . . . . . . . . . . . . . . . . . . . . . . . . . . . 8.80 516.2.5 Scientific journal articles . . . . . . . . . . . . . . . . . . . . . . . . . . . . . . . . . . . . . . 41.13 27
l France l Income group average

GTCI 2020 Country Profile by Pillar
170 THE GLOBAL TALENT COMPETITIVENESS INDEX 2020
COUNTRY PROFILESCOUNTRY PROFILES
102030405060708090100
Global knowledge skills
Vocational andtechnical skills
Retain
Grow
Attract
Enable
1020330
GAMBIAKey Indicators
Rank (out of 132) . . . . . . . . . . . . . . . . . . . . . . . . . . . . . . . . . . . . . . . 85Income group . . . . . . . . . . . . . . . . . . . . . . . . . . . . . . . . . . . . . Low incomeRegional group . . . . . . . . . . . . . . . . . . . . . . . . . . . . Sub-Saharan AfricaPopulation (millions) . . . . . . . . . . . . . . . . . . . . . . . . . . . . . . . . . . . . . 2.28
GDP per capita (PPP US$) . . . . . . . . . . . . . . . . . . . . . . . . . . . . . 1,706.27GDP (US$ billions) . . . . . . . . . . . . . . . . . . . . . . . . . . . . . . . . . . . . . . . 1.62GTCI score . . . . . . . . . . . . . . . . . . . . . . . . . . . . . . . . . . . . . . . . . . . . . . 36.66GTCI score (income group average) . . . . . . . . . . . . . . . . . . . . . . . . 26.01
Score Rank
1 ENABLE . . . . . . . . . . . . . . . . . . . . . . . . . . . . . . . . . . . . . . . . . . 46.52 751.1 Regulatory Landscape . . . . . . . . . . . . . . . . . . . . . . . . . . . . . . . . . . . . . . 40.33 941.1.1 Government effectiveness . . . . . . . . . . . . . . . . . . . . . . . . . . . . . . . . . . . .30.84 1101.1.2 Rule of law . . . . . . . . . . . . . . . . . . . . . . . . . . . . . . . . . . . . . . . . . . . . . . . . . . . . 42.18 961.1.3 Political stability . . . . . . . . . . . . . . . . . . . . . . . . . . . . . . . . . . . . . . . . . . . . . . .60.44 741.1.4 Regulatory quality. . . . . . . . . . . . . . . . . . . . . . . . . . . . . . . . . . . . . . . . . . . . . 37.09 1021.1.5 Corruption . . . . . . . . . . . . . . . . . . . . . . . . . . . . . . . . . . . . . . . . . . . . . . . . . . . . 31.08 771.2 Market Landscape . . . . . . . . . . . . . . . . . . . . . . . . . . . . . . . . . . . . . . . . . .40.34 961.2.1 Competition intensity . . . . . . . . . . . . . . . . . . . . . . . . . . . . . . . . . . . . . . . . .78.79 281.2.2 Ease of doing business . . . . . . . . . . . . . . . . . . . . . . . . . . . . . . . . . . . . . . . . 37.71 1171.2.3 Cluster development . . . . . . . . . . . . . . . . . . . . . . . . . . . . . . . . . . . . . . . . . .40.89 741.2.4 R&D expenditure . . . . . . . . . . . . . . . . . . . . . . . . . . . . . . . . . . . . . . . . . . . . . . . 2.60 991.2.5 ICT infrastructure. . . . . . . . . . . . . . . . . . . . . . . . . . . . . . . . . . . . . . . . . . . . . .26.59 1041.2.6 Urban population . . . . . . . . . . . . . . . . . . . . . . . . . . . . . . . . . . . . . . . . . . . . . 55.47 721.3 Business and Labour Landscape . . . . . . . . . . . . . . . . . . . . . . . . . . . . 58.90 33
Labour Market1.3.1 Tertiary-educated unemployment . . . . . . . . . . . . . . . . . . . . . . . . . . 100.00 11.3.2 Active labour market policies . . . . . . . . . . . . . . . . . . . . . . . . . . . . . . . . .42.85 651.3.3 Labour-employer cooperation . . . . . . . . . . . . . . . . . . . . . . . . . . . . . . . .52.38 36
Management Practice1.3.4 Professional management . . . . . . . . . . . . . . . . . . . . . . . . . . . . . . . . . . . . 66.14 321.3.5 Relationship of pay to productivity . . . . . . . . . . . . . . . . . . . . . . . . . . . .63.06 40
Technology Adoption1.3.6 Technology utilisation. . . . . . . . . . . . . . . . . . . . . . . . . . . . . . . . . . . . . . . . . 51.64 661.3.7 Investment in emerging technologies . . . . . . . . . . . . . . . . . . . . . . . .36.20 731.3.8 Robot density . . . . . . . . . . . . . . . . . . . . . . . . . . . . . . . . . . . . . . . . . . . . . . . . . . .n/a n/a
2 ATTRACT . . . . . . . . . . . . . . . . . . . . . . . . . . . . . . . . . . . . . . . . . 66.81 232.1 External Openness . . . . . . . . . . . . . . . . . . . . . . . . . . . . . . . . . . . . . . . . . 68.39 14
Attract Business2.1.1 FDI and technology transfer . . . . . . . . . . . . . . . . . . . . . . . . . . . . . . . . . .62.34 542.1.2 Prevalence of foreign ownership . . . . . . . . . . . . . . . . . . . . . . . . . . . . . . 81.36 15
Attract People2.1.3 Migrant stock . . . . . . . . . . . . . . . . . . . . . . . . . . . . . . . . . . . . . . . . . . . . . . . . .64.49 242.1.4 International students . . . . . . . . . . . . . . . . . . . . . . . . . . . . . . . . . . . . . . . . . . .n/a n/a2.1.5 Brain gain . . . . . . . . . . . . . . . . . . . . . . . . . . . . . . . . . . . . . . . . . . . . . . . . . . . . .65.36 252.2 Internal Openness . . . . . . . . . . . . . . . . . . . . . . . . . . . . . . . . . . . . . . . . . . 65.22 39
Social Inclusion2.2.1 Tolerance of minorities . . . . . . . . . . . . . . . . . . . . . . . . . . . . . . . . . . . . . . . .75.56 172.2.2 Tolerance of immigrants . . . . . . . . . . . . . . . . . . . . . . . . . . . . . . . . . . . . . . 87.67 122.2.3 Social mobility . . . . . . . . . . . . . . . . . . . . . . . . . . . . . . . . . . . . . . . . . . . . . . . . 57.19 67
Gender Equality2.2.4 Female graduates . . . . . . . . . . . . . . . . . . . . . . . . . . . . . . . . . . . . . . . . . . . . .48.51 972.2.5 Gender development gap . . . . . . . . . . . . . . . . . . . . . . . . . . . . . . . . . . . . 49.79 1122.2.6 Leadership opportunities for women . . . . . . . . . . . . . . . . . . . . . . . . .72.61 23
Score Rank
3 GROW . . . . . . . . . . . . . . . . . . . . . . . . . . . . . . . . . . . . . . . . . . . . 32.42 883.1 Formal Education . . . . . . . . . . . . . . . . . . . . . . . . . . . . . . . . . . . . . . . . . . . . 6.45 120
Enrolment3.1.1 Vocational enrolment . . . . . . . . . . . . . . . . . . . . . . . . . . . . . . . . . . . . . . . . .14.82 703.1.2 Tertiary enrolment . . . . . . . . . . . . . . . . . . . . . . . . . . . . . . . . . . . . . . . . . . . . . 1.85 125
Quality3.1.3 Tertiary education expenditure . . . . . . . . . . . . . . . . . . . . . . . . . . . . . . . . 9.15 993.1.4 Reading, maths, and science . . . . . . . . . . . . . . . . . . . . . . . . . . . . . . . . . . . .n/a n/a3.1.5 University ranking . . . . . . . . . . . . . . . . . . . . . . . . . . . . . . . . . . . . . . . . . . . . . . 0.00 753.2 Lifelong Learning . . . . . . . . . . . . . . . . . . . . . . . . . . . . . . . . . . . . . . . . . . . 38.24 833.2.1 Quality of management schools . . . . . . . . . . . . . . . . . . . . . . . . . . . . . .49.84 573.2.2 Prevalence of training in firms . . . . . . . . . . . . . . . . . . . . . . . . . . . . . . . . .28.76 643.2.3 Employee development . . . . . . . . . . . . . . . . . . . . . . . . . . . . . . . . . . . . . . 36.11 713.3 Access to Growth Opportunities . . . . . . . . . . . . . . . . . . . . . . . . . . . 52.57 44
Empowerment3.3.1 Delegation of authority . . . . . . . . . . . . . . . . . . . . . . . . . . . . . . . . . . . . . . . 74.93 213.3.2 Personal rights . . . . . . . . . . . . . . . . . . . . . . . . . . . . . . . . . . . . . . . . . . . . . . . .78.85 57
Collaboration3.3.3 Use of virtual social networks . . . . . . . . . . . . . . . . . . . . . . . . . . . . . . . . . 77.00 573.3.4 Use of virtual professional networks . . . . . . . . . . . . . . . . . . . . . . . . . . . 2.56 983.3.5 Collaboration within organisations . . . . . . . . . . . . . . . . . . . . . . . . . . . . 52.13 493.3.6 Collaboration across organisations . . . . . . . . . . . . . . . . . . . . . . . . . . . .29.95 91
4 RETAIN . . . . . . . . . . . . . . . . . . . . . . . . . . . . . . . . . . . . . . . . . . . .33.79 994.1 Sustainability . . . . . . . . . . . . . . . . . . . . . . . . . . . . . . . . . . . . . . . . . . . . . . . 39.13 714.1.1 Pension system . . . . . . . . . . . . . . . . . . . . . . . . . . . . . . . . . . . . . . . . . . . . . . . 12.49 924.1.2 Social protection . . . . . . . . . . . . . . . . . . . . . . . . . . . . . . . . . . . . . . . . . . . . . . 46.17 594.1.3 Brain retention . . . . . . . . . . . . . . . . . . . . . . . . . . . . . . . . . . . . . . . . . . . . . . . .58.73 354.2 Lifestyle . . . . . . . . . . . . . . . . . . . . . . . . . . . . . . . . . . . . . . . . . . . . . . . . . . . . 28.45 1074.2.1 Environmental performance . . . . . . . . . . . . . . . . . . . . . . . . . . . . . . . . . .24.99 1184.2.2 Personal safety . . . . . . . . . . . . . . . . . . . . . . . . . . . . . . . . . . . . . . . . . . . . . . . . 50.14 724.2.3 Physician density . . . . . . . . . . . . . . . . . . . . . . . . . . . . . . . . . . . . . . . . . . . . . . . 1.41 1124.2.4 Sanitation . . . . . . . . . . . . . . . . . . . . . . . . . . . . . . . . . . . . . . . . . . . . . . . . . . . . . 37.25 114
5 VOCATIONAL AND TECHNICAL SKILLS . . . . . . . . . . . . 35.58 855.1 Mid-Level Skills . . . . . . . . . . . . . . . . . . . . . . . . . . . . . . . . . . . . . . . . . . . . . 10.60 1195.1.1 Workforce with secondary education . . . . . . . . . . . . . . . . . . . . . . . . .15.60 1115.1.2 Population with secondary education . . . . . . . . . . . . . . . . . . . . . . . . . .n/a n/a5.1.3 Technicians and associate professionals . . . . . . . . . . . . . . . . . . . . . . . . 5.59 1185.1.4 Labour productivity per employee . . . . . . . . . . . . . . . . . . . . . . . . . . . . . .n/a n/a5.2 Employability . . . . . . . . . . . . . . . . . . . . . . . . . . . . . . . . . . . . . . . . . . . . . . . 60.57 385.2.1 Ease of finding skilled employees . . . . . . . . . . . . . . . . . . . . . . . . . . . . .66.86 415.2.2 Relevance of education system to the economy . . . . . . . . . . . . . .60.04 385.2.3 Skills matching with secondary education . . . . . . . . . . . . . . . . . . . .46.65 545.2.4 Skills matching with tertiary education . . . . . . . . . . . . . . . . . . . . . . . .68.72 34
6 GLOBAL KNOWLEDGE SKILLS . . . . . . . . . . . . . . . . . . . . . .4.86 1316.1 High-Level Skills . . . . . . . . . . . . . . . . . . . . . . . . . . . . . . . . . . . . . . . . . . . . . 9.19 1256.1.1 Workforce with tertiary education . . . . . . . . . . . . . . . . . . . . . . . . . . . . . 0.00 1276.1.2 Population with tertiary education . . . . . . . . . . . . . . . . . . . . . . . . . . . . . .n/a n/a6.1.3 Professionals . . . . . . . . . . . . . . . . . . . . . . . . . . . . . . . . . . . . . . . . . . . . . . . . . . . 9.04 1116.1.4 Researchers . . . . . . . . . . . . . . . . . . . . . . . . . . . . . . . . . . . . . . . . . . . . . . . . . . . . 0.28 1006.1.5 Senior officials and managers . . . . . . . . . . . . . . . . . . . . . . . . . . . . . . . . . . 0.86 1256.1.6 Availability of scientists and engineers . . . . . . . . . . . . . . . . . . . . . . . .35.79 1026.2 Talent Impact . . . . . . . . . . . . . . . . . . . . . . . . . . . . . . . . . . . . . . . . . . . . . . . . 0.52 1296.2.1 Innovation output . . . . . . . . . . . . . . . . . . . . . . . . . . . . . . . . . . . . . . . . . . . . . .n/a n/a6.2.2 High-value exports . . . . . . . . . . . . . . . . . . . . . . . . . . . . . . . . . . . . . . . . . . . . . 0.23 1256.2.3 New product entrepreneurial activity . . . . . . . . . . . . . . . . . . . . . . . . . . .n/a n/a6.2.4 New business density . . . . . . . . . . . . . . . . . . . . . . . . . . . . . . . . . . . . . . . . . . .n/a n/a6.2.5 Scientific journal articles . . . . . . . . . . . . . . . . . . . . . . . . . . . . . . . . . . . . . . . 0.82 97
l Gambia l Income group average

GTCI 2020 Country Profile by Pillar
THE GLOBAL TALENT COMPETITIVENESS INDEX 2020 171
COUNTRY PROFILESCOUNTRY PROFILES
102030405060708090100
Global knowledge skills
Vocational andtechnical skills
Retain
Grow
Attract
Enable
1020304040
GEORGIAKey Indicators
Rank (out of 132) . . . . . . . . . . . . . . . . . . . . . . . . . . . . . . . . . . . . . . . 68Income group . . . . . . . . . . . . . . . . . . . . . . . . . . . Upper-middle incomeRegional group . . . . . . . . . . . . . .Northern Africa and Western AsiaPopulation (millions) . . . . . . . . . . . . . . . . . . . . . . . . . . . . . . . . . . . . . .3.73
GDP per capita (PPP US$) . . . . . . . . . . . . . . . . . . . . . . . . . . . . 11,420.63GDP (US$ billions) . . . . . . . . . . . . . . . . . . . . . . . . . . . . . . . . . . . . . . 16.21GTCI score . . . . . . . . . . . . . . . . . . . . . . . . . . . . . . . . . . . . . . . . . . . . . . 41.11GTCI score (income group average) . . . . . . . . . . . . . . . . . . . . . . . . 41.25
Score Rank
1 ENABLE . . . . . . . . . . . . . . . . . . . . . . . . . . . . . . . . . . . . . . . . . . .49.87 581.1 Regulatory Landscape . . . . . . . . . . . . . . . . . . . . . . . . . . . . . . . . . . . . . . 62.19 431.1.1 Government effectiveness . . . . . . . . . . . . . . . . . . . . . . . . . . . . . . . . . . . .60.37 411.1.2 Rule of law . . . . . . . . . . . . . . . . . . . . . . . . . . . . . . . . . . . . . . . . . . . . . . . . . . . .60.35 501.1.3 Political stability . . . . . . . . . . . . . . . . . . . . . . . . . . . . . . . . . . . . . . . . . . . . . . .56.87 871.1.4 Regulatory quality. . . . . . . . . . . . . . . . . . . . . . . . . . . . . . . . . . . . . . . . . . . . .73.94 291.1.5 Corruption . . . . . . . . . . . . . . . . . . . . . . . . . . . . . . . . . . . . . . . . . . . . . . . . . . . .59.46 361.2 Market Landscape . . . . . . . . . . . . . . . . . . . . . . . . . . . . . . . . . . . . . . . . . .48.82 711.2.1 Competition intensity . . . . . . . . . . . . . . . . . . . . . . . . . . . . . . . . . . . . . . . . .58.90 931.2.2 Ease of doing business . . . . . . . . . . . . . . . . . . . . . . . . . . . . . . . . . . . . . . . .94.09 51.2.3 Cluster development . . . . . . . . . . . . . . . . . . . . . . . . . . . . . . . . . . . . . . . . . .23.20 1111.2.4 R&D expenditure . . . . . . . . . . . . . . . . . . . . . . . . . . . . . . . . . . . . . . . . . . . . . . . 6.03 811.2.5 ICT infrastructure. . . . . . . . . . . . . . . . . . . . . . . . . . . . . . . . . . . . . . . . . . . . . .58.27 651.2.6 Urban population . . . . . . . . . . . . . . . . . . . . . . . . . . . . . . . . . . . . . . . . . . . . .52.43 761.3 Business and Labour Landscape . . . . . . . . . . . . . . . . . . . . . . . . . . . .38.60 89
Labour Market1.3.1 Tertiary-educated unemployment . . . . . . . . . . . . . . . . . . . . . . . . . . . . 49.01 1131.3.2 Active labour market policies . . . . . . . . . . . . . . . . . . . . . . . . . . . . . . . . . 31.18 881.3.3 Labour-employer cooperation . . . . . . . . . . . . . . . . . . . . . . . . . . . . . . . .33.38 86
Management Practice1.3.4 Professional management . . . . . . . . . . . . . . . . . . . . . . . . . . . . . . . . . . . . 48.12 681.3.5 Relationship of pay to productivity . . . . . . . . . . . . . . . . . . . . . . . . . . . . 41.96 82
Technology Adoption1.3.6 Technology utilisation. . . . . . . . . . . . . . . . . . . . . . . . . . . . . . . . . . . . . . . . .36.65 1061.3.7 Investment in emerging technologies . . . . . . . . . . . . . . . . . . . . . . . .29.90 951.3.8 Robot density . . . . . . . . . . . . . . . . . . . . . . . . . . . . . . . . . . . . . . . . . . . . . . . . . . .n/a n/a
2 ATTRACT . . . . . . . . . . . . . . . . . . . . . . . . . . . . . . . . . . . . . . . . . .47.97 692.1 External Openness . . . . . . . . . . . . . . . . . . . . . . . . . . . . . . . . . . . . . . . . . 36.91 88
Attract Business2.1.1 FDI and technology transfer . . . . . . . . . . . . . . . . . . . . . . . . . . . . . . . . . 48.64 892.1.2 Prevalence of foreign ownership . . . . . . . . . . . . . . . . . . . . . . . . . . . . . .54.69 75
Attract People2.1.3 Migrant stock . . . . . . . . . . . . . . . . . . . . . . . . . . . . . . . . . . . . . . . . . . . . . . . . .23.93 932.1.4 International students . . . . . . . . . . . . . . . . . . . . . . . . . . . . . . . . . . . . . . . . .20.31 352.1.5 Brain gain . . . . . . . . . . . . . . . . . . . . . . . . . . . . . . . . . . . . . . . . . . . . . . . . . . . . . 37.01 882.2 Internal Openness . . . . . . . . . . . . . . . . . . . . . . . . . . . . . . . . . . . . . . . . . . 59.04 56
Social Inclusion2.2.1 Tolerance of minorities . . . . . . . . . . . . . . . . . . . . . . . . . . . . . . . . . . . . . . . .30.00 912.2.2 Tolerance of immigrants . . . . . . . . . . . . . . . . . . . . . . . . . . . . . . . . . . . . . . 57.53 692.2.3 Social mobility . . . . . . . . . . . . . . . . . . . . . . . . . . . . . . . . . . . . . . . . . . . . . . . . 57.44 65
Gender Equality2.2.4 Female graduates . . . . . . . . . . . . . . . . . . . . . . . . . . . . . . . . . . . . . . . . . . . . . 81.65 312.2.5 Gender development gap . . . . . . . . . . . . . . . . . . . . . . . . . . . . . . . . . . . .80.00 552.2.6 Leadership opportunities for women . . . . . . . . . . . . . . . . . . . . . . . . . 47.58 61
Score Rank
3 GROW . . . . . . . . . . . . . . . . . . . . . . . . . . . . . . . . . . . . . . . . . . . . . 29.19 1033.1 Formal Education . . . . . . . . . . . . . . . . . . . . . . . . . . . . . . . . . . . . . . . . . . . 17.95 82
Enrolment3.1.1 Vocational enrolment . . . . . . . . . . . . . . . . . . . . . . . . . . . . . . . . . . . . . . . . . . 6.58 913.1.2 Tertiary enrolment . . . . . . . . . . . . . . . . . . . . . . . . . . . . . . . . . . . . . . . . . . . . 45.18 49
Quality3.1.3 Tertiary education expenditure . . . . . . . . . . . . . . . . . . . . . . . . . . . . . . . . 6.74 1033.1.4 Reading, maths, and science . . . . . . . . . . . . . . . . . . . . . . . . . . . . . . . . . . 31.23 593.1.5 University ranking . . . . . . . . . . . . . . . . . . . . . . . . . . . . . . . . . . . . . . . . . . . . . . 0.00 753.2 Lifelong Learning . . . . . . . . . . . . . . . . . . . . . . . . . . . . . . . . . . . . . . . . . . . 23.95 1263.2.1 Quality of management schools . . . . . . . . . . . . . . . . . . . . . . . . . . . . . .36.58 963.2.2 Prevalence of training in firms . . . . . . . . . . . . . . . . . . . . . . . . . . . . . . . . . . 9.37 933.2.3 Employee development . . . . . . . . . . . . . . . . . . . . . . . . . . . . . . . . . . . . . .25.90 1093.3 Access to Growth Opportunities . . . . . . . . . . . . . . . . . . . . . . . . . . . 45.68 70
Empowerment3.3.1 Delegation of authority . . . . . . . . . . . . . . . . . . . . . . . . . . . . . . . . . . . . . . .36.54 923.3.2 Personal rights . . . . . . . . . . . . . . . . . . . . . . . . . . . . . . . . . . . . . . . . . . . . . . . .80.01 54
Collaboration3.3.3 Use of virtual social networks . . . . . . . . . . . . . . . . . . . . . . . . . . . . . . . . .74.58 633.3.4 Use of virtual professional networks . . . . . . . . . . . . . . . . . . . . . . . . . . . 5.13 813.3.5 Collaboration within organisations . . . . . . . . . . . . . . . . . . . . . . . . . . . . 47.82 663.3.6 Collaboration across organisations . . . . . . . . . . . . . . . . . . . . . . . . . . . .29.99 90
4 RETAIN . . . . . . . . . . . . . . . . . . . . . . . . . . . . . . . . . . . . . . . . . . . .46.70 684.1 Sustainability . . . . . . . . . . . . . . . . . . . . . . . . . . . . . . . . . . . . . . . . . . . . . . . 27.73 1054.1.1 Pension system . . . . . . . . . . . . . . . . . . . . . . . . . . . . . . . . . . . . . . . . . . . . . . .29.50 714.1.2 Social protection . . . . . . . . . . . . . . . . . . . . . . . . . . . . . . . . . . . . . . . . . . . . . . 17.82 1214.1.3 Brain retention . . . . . . . . . . . . . . . . . . . . . . . . . . . . . . . . . . . . . . . . . . . . . . . .35.86 804.2 Lifestyle . . . . . . . . . . . . . . . . . . . . . . . . . . . . . . . . . . . . . . . . . . . . . . . . . . . . 65.67 434.2.1 Environmental performance . . . . . . . . . . . . . . . . . . . . . . . . . . . . . . . . . . 47.11 804.2.2 Personal safety . . . . . . . . . . . . . . . . . . . . . . . . . . . . . . . . . . . . . . . . . . . . . . . .55.57 654.2.3 Physician density . . . . . . . . . . . . . . . . . . . . . . . . . . . . . . . . . . . . . . . . . . . . . .76.28 34.2.4 Sanitation . . . . . . . . . . . . . . . . . . . . . . . . . . . . . . . . . . . . . . . . . . . . . . . . . . . . .83.72 80
5 VOCATIONAL AND TECHNICAL SKILLS . . . . . . . . . . . . .43.02 685.1 Mid-Level Skills . . . . . . . . . . . . . . . . . . . . . . . . . . . . . . . . . . . . . . . . . . . . . 52.51 435.1.1 Workforce with secondary education . . . . . . . . . . . . . . . . . . . . . . . . .78.97 135.1.2 Population with secondary education . . . . . . . . . . . . . . . . . . . . . . . .85.45 55.1.3 Technicians and associate professionals . . . . . . . . . . . . . . . . . . . . . . . 31.93 685.1.4 Labour productivity per employee . . . . . . . . . . . . . . . . . . . . . . . . . . . .13.68 785.2 Employability . . . . . . . . . . . . . . . . . . . . . . . . . . . . . . . . . . . . . . . . . . . . . . . 33.53 1135.2.1 Ease of finding skilled employees . . . . . . . . . . . . . . . . . . . . . . . . . . . . .40.37 1065.2.2 Relevance of education system to the economy . . . . . . . . . . . . . . 31.33 1005.2.3 Skills matching with secondary education . . . . . . . . . . . . . . . . . . . .25.62 1145.2.4 Skills matching with tertiary education . . . . . . . . . . . . . . . . . . . . . . . .36.81 114
6 GLOBAL KNOWLEDGE SKILLS . . . . . . . . . . . . . . . . . . . . .29.93 546.1 High-Level Skills . . . . . . . . . . . . . . . . . . . . . . . . . . . . . . . . . . . . . . . . . . . . 34.61 526.1.1 Workforce with tertiary education . . . . . . . . . . . . . . . . . . . . . . . . . . . . 51.42 336.1.2 Population with tertiary education . . . . . . . . . . . . . . . . . . . . . . . . . . . .52.21 246.1.3 Professionals . . . . . . . . . . . . . . . . . . . . . . . . . . . . . . . . . . . . . . . . . . . . . . . . . . 31.76 556.1.4 Researchers . . . . . . . . . . . . . . . . . . . . . . . . . . . . . . . . . . . . . . . . . . . . . . . . . . . 16.13 446.1.5 Senior officials and managers . . . . . . . . . . . . . . . . . . . . . . . . . . . . . . . . .33.44 426.1.6 Availability of scientists and engineers . . . . . . . . . . . . . . . . . . . . . . . .22.69 1256.2 Talent Impact . . . . . . . . . . . . . . . . . . . . . . . . . . . . . . . . . . . . . . . . . . . . . . . 25.26 566.2.1 Innovation output . . . . . . . . . . . . . . . . . . . . . . . . . . . . . . . . . . . . . . . . . . . .33.98 596.2.2 High-value exports . . . . . . . . . . . . . . . . . . . . . . . . . . . . . . . . . . . . . . . . . . . . .8.84 876.2.3 New product entrepreneurial activity . . . . . . . . . . . . . . . . . . . . . . . . . 37.06 606.2.4 New business density . . . . . . . . . . . . . . . . . . . . . . . . . . . . . . . . . . . . . . . . .40.29 166.2.5 Scientific journal articles . . . . . . . . . . . . . . . . . . . . . . . . . . . . . . . . . . . . . . . 6.12 63
l Georgia l Income group average
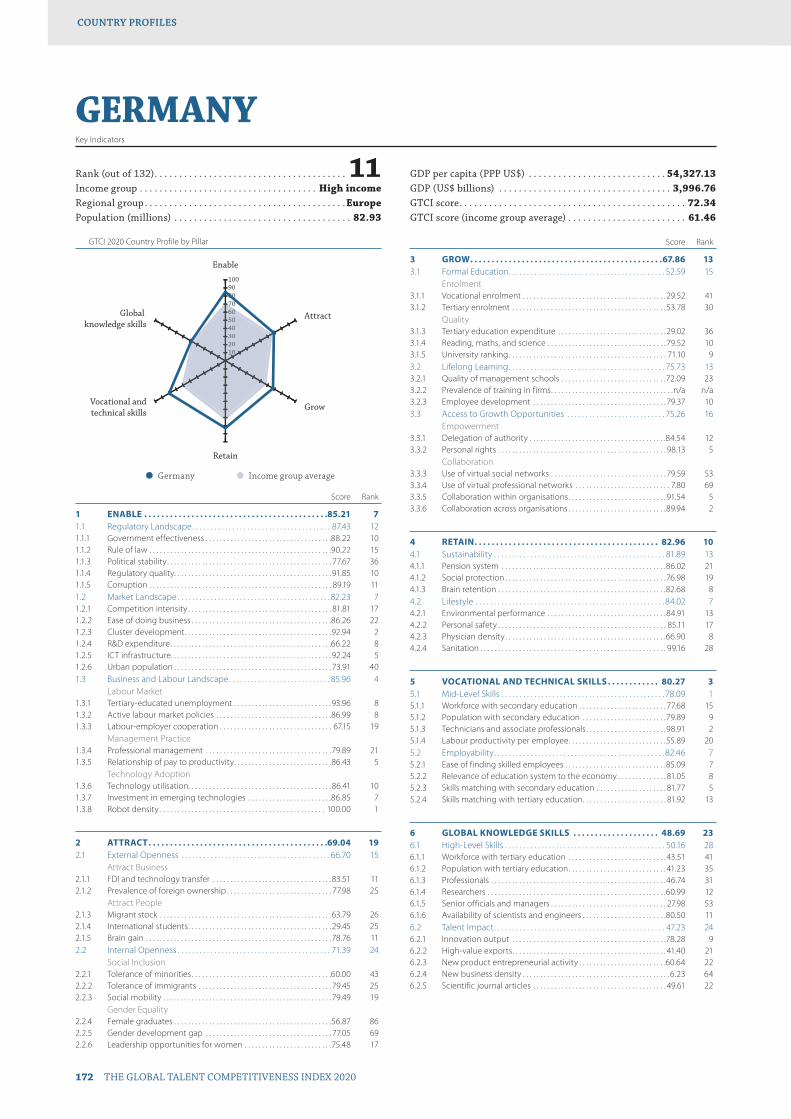
GTCI 2020 Country Profile by Pillar
172 THE GLOBAL TALENT COMPETITIVENESS INDEX 2020
COUNTRY PROFILESCOUNTRY PROFILES
102030405060708090100
Global knowledge skills
Vocational andtechnical skills
Retain
Grow
Attract
Enable
102030405060607
GERMANYKey Indicators
Rank (out of 132) . . . . . . . . . . . . . . . . . . . . . . . . . . . . . . . . . . . . . . . 11Income group . . . . . . . . . . . . . . . . . . . . . . . . . . . . . . . . . . . . High incomeRegional group . . . . . . . . . . . . . . . . . . . . . . . . . . . . . . . . . . . . . . . . .EuropePopulation (millions) . . . . . . . . . . . . . . . . . . . . . . . . . . . . . . . . . . . . 82.93
GDP per capita (PPP US$) . . . . . . . . . . . . . . . . . . . . . . . . . . . . 54,327.13GDP (US$ billions) . . . . . . . . . . . . . . . . . . . . . . . . . . . . . . . . . . . 3,996.76GTCI score . . . . . . . . . . . . . . . . . . . . . . . . . . . . . . . . . . . . . . . . . . . . . . 72.34GTCI score (income group average) . . . . . . . . . . . . . . . . . . . . . . . . 61.46
Score Rank
1 ENABLE . . . . . . . . . . . . . . . . . . . . . . . . . . . . . . . . . . . . . . . . . . .85.21 71.1 Regulatory Landscape . . . . . . . . . . . . . . . . . . . . . . . . . . . . . . . . . . . . . . 87.43 121.1.1 Government effectiveness . . . . . . . . . . . . . . . . . . . . . . . . . . . . . . . . . . . .88.22 101.1.2 Rule of law . . . . . . . . . . . . . . . . . . . . . . . . . . . . . . . . . . . . . . . . . . . . . . . . . . . .90.22 151.1.3 Political stability . . . . . . . . . . . . . . . . . . . . . . . . . . . . . . . . . . . . . . . . . . . . . . . 77.67 361.1.4 Regulatory quality. . . . . . . . . . . . . . . . . . . . . . . . . . . . . . . . . . . . . . . . . . . . . 91.85 101.1.5 Corruption . . . . . . . . . . . . . . . . . . . . . . . . . . . . . . . . . . . . . . . . . . . . . . . . . . . . 89.19 111.2 Market Landscape . . . . . . . . . . . . . . . . . . . . . . . . . . . . . . . . . . . . . . . . . . 82.23 71.2.1 Competition intensity . . . . . . . . . . . . . . . . . . . . . . . . . . . . . . . . . . . . . . . . . 81.81 171.2.2 Ease of doing business . . . . . . . . . . . . . . . . . . . . . . . . . . . . . . . . . . . . . . . .86.26 221.2.3 Cluster development . . . . . . . . . . . . . . . . . . . . . . . . . . . . . . . . . . . . . . . . . .92.94 21.2.4 R&D expenditure . . . . . . . . . . . . . . . . . . . . . . . . . . . . . . . . . . . . . . . . . . . . . .66.22 81.2.5 ICT infrastructure. . . . . . . . . . . . . . . . . . . . . . . . . . . . . . . . . . . . . . . . . . . . . .92.24 51.2.6 Urban population . . . . . . . . . . . . . . . . . . . . . . . . . . . . . . . . . . . . . . . . . . . . . 73.91 401.3 Business and Labour Landscape . . . . . . . . . . . . . . . . . . . . . . . . . . . . 85.96 4
Labour Market1.3.1 Tertiary-educated unemployment . . . . . . . . . . . . . . . . . . . . . . . . . . . .93.96 81.3.2 Active labour market policies . . . . . . . . . . . . . . . . . . . . . . . . . . . . . . . . .86.99 81.3.3 Labour-employer cooperation . . . . . . . . . . . . . . . . . . . . . . . . . . . . . . . . 67.15 19
Management Practice1.3.4 Professional management . . . . . . . . . . . . . . . . . . . . . . . . . . . . . . . . . . . .79.89 211.3.5 Relationship of pay to productivity . . . . . . . . . . . . . . . . . . . . . . . . . . . .86.43 5
Technology Adoption1.3.6 Technology utilisation. . . . . . . . . . . . . . . . . . . . . . . . . . . . . . . . . . . . . . . . .86.41 101.3.7 Investment in emerging technologies . . . . . . . . . . . . . . . . . . . . . . . .86.85 71.3.8 Robot density . . . . . . . . . . . . . . . . . . . . . . . . . . . . . . . . . . . . . . . . . . . . . . . 100.00 1
2 ATTRACT . . . . . . . . . . . . . . . . . . . . . . . . . . . . . . . . . . . . . . . . . .69.04 192.1 External Openness . . . . . . . . . . . . . . . . . . . . . . . . . . . . . . . . . . . . . . . . . 66.70 15
Attract Business2.1.1 FDI and technology transfer . . . . . . . . . . . . . . . . . . . . . . . . . . . . . . . . . .83.51 112.1.2 Prevalence of foreign ownership . . . . . . . . . . . . . . . . . . . . . . . . . . . . . . 77.98 25
Attract People2.1.3 Migrant stock . . . . . . . . . . . . . . . . . . . . . . . . . . . . . . . . . . . . . . . . . . . . . . . . .63.79 262.1.4 International students . . . . . . . . . . . . . . . . . . . . . . . . . . . . . . . . . . . . . . . . . 29.45 252.1.5 Brain gain . . . . . . . . . . . . . . . . . . . . . . . . . . . . . . . . . . . . . . . . . . . . . . . . . . . . .78.76 112.2 Internal Openness . . . . . . . . . . . . . . . . . . . . . . . . . . . . . . . . . . . . . . . . . . 71.39 24
Social Inclusion2.2.1 Tolerance of minorities . . . . . . . . . . . . . . . . . . . . . . . . . . . . . . . . . . . . . . . .60.00 432.2.2 Tolerance of immigrants . . . . . . . . . . . . . . . . . . . . . . . . . . . . . . . . . . . . . . 79.45 252.2.3 Social mobility . . . . . . . . . . . . . . . . . . . . . . . . . . . . . . . . . . . . . . . . . . . . . . . . 79.49 19
Gender Equality2.2.4 Female graduates . . . . . . . . . . . . . . . . . . . . . . . . . . . . . . . . . . . . . . . . . . . . .56.87 862.2.5 Gender development gap . . . . . . . . . . . . . . . . . . . . . . . . . . . . . . . . . . . . 77.05 692.2.6 Leadership opportunities for women . . . . . . . . . . . . . . . . . . . . . . . . .75.48 17
Score Rank
3 GROW . . . . . . . . . . . . . . . . . . . . . . . . . . . . . . . . . . . . . . . . . . . . .67.86 133.1 Formal Education . . . . . . . . . . . . . . . . . . . . . . . . . . . . . . . . . . . . . . . . . . . 52.59 15
Enrolment3.1.1 Vocational enrolment . . . . . . . . . . . . . . . . . . . . . . . . . . . . . . . . . . . . . . . . .29.52 413.1.2 Tertiary enrolment . . . . . . . . . . . . . . . . . . . . . . . . . . . . . . . . . . . . . . . . . . . .53.78 30
Quality3.1.3 Tertiary education expenditure . . . . . . . . . . . . . . . . . . . . . . . . . . . . . . .29.02 363.1.4 Reading, maths, and science . . . . . . . . . . . . . . . . . . . . . . . . . . . . . . . . . .79.52 103.1.5 University ranking . . . . . . . . . . . . . . . . . . . . . . . . . . . . . . . . . . . . . . . . . . . . . 71.10 93.2 Lifelong Learning . . . . . . . . . . . . . . . . . . . . . . . . . . . . . . . . . . . . . . . . . . . 75.73 133.2.1 Quality of management schools . . . . . . . . . . . . . . . . . . . . . . . . . . . . . .72.09 233.2.2 Prevalence of training in firms . . . . . . . . . . . . . . . . . . . . . . . . . . . . . . . . . . .n/a n/a3.2.3 Employee development . . . . . . . . . . . . . . . . . . . . . . . . . . . . . . . . . . . . . . 79.37 103.3 Access to Growth Opportunities . . . . . . . . . . . . . . . . . . . . . . . . . . . 75.26 16
Empowerment3.3.1 Delegation of authority . . . . . . . . . . . . . . . . . . . . . . . . . . . . . . . . . . . . . . .84.54 123.3.2 Personal rights . . . . . . . . . . . . . . . . . . . . . . . . . . . . . . . . . . . . . . . . . . . . . . . . 98.13 5
Collaboration3.3.3 Use of virtual social networks . . . . . . . . . . . . . . . . . . . . . . . . . . . . . . . . . 79.59 533.3.4 Use of virtual professional networks . . . . . . . . . . . . . . . . . . . . . . . . . . . 7.80 693.3.5 Collaboration within organisations . . . . . . . . . . . . . . . . . . . . . . . . . . . . 91.54 53.3.6 Collaboration across organisations . . . . . . . . . . . . . . . . . . . . . . . . . . . .89.94 2
4 RETAIN . . . . . . . . . . . . . . . . . . . . . . . . . . . . . . . . . . . . . . . . . . . 82.96 104.1 Sustainability . . . . . . . . . . . . . . . . . . . . . . . . . . . . . . . . . . . . . . . . . . . . . . . 81.89 134.1.1 Pension system . . . . . . . . . . . . . . . . . . . . . . . . . . . . . . . . . . . . . . . . . . . . . . .86.02 214.1.2 Social protection . . . . . . . . . . . . . . . . . . . . . . . . . . . . . . . . . . . . . . . . . . . . . .76.98 194.1.3 Brain retention . . . . . . . . . . . . . . . . . . . . . . . . . . . . . . . . . . . . . . . . . . . . . . . .82.68 84.2 Lifestyle . . . . . . . . . . . . . . . . . . . . . . . . . . . . . . . . . . . . . . . . . . . . . . . . . . . . 84.02 74.2.1 Environmental performance . . . . . . . . . . . . . . . . . . . . . . . . . . . . . . . . . .84.91 134.2.2 Personal safety . . . . . . . . . . . . . . . . . . . . . . . . . . . . . . . . . . . . . . . . . . . . . . . . 85.11 174.2.3 Physician density . . . . . . . . . . . . . . . . . . . . . . . . . . . . . . . . . . . . . . . . . . . . . .66.90 84.2.4 Sanitation . . . . . . . . . . . . . . . . . . . . . . . . . . . . . . . . . . . . . . . . . . . . . . . . . . . . . 99.16 28
5 VOCATIONAL AND TECHNICAL SKILLS . . . . . . . . . . . . 80.27 35.1 Mid-Level Skills . . . . . . . . . . . . . . . . . . . . . . . . . . . . . . . . . . . . . . . . . . . . . 78.09 15.1.1 Workforce with secondary education . . . . . . . . . . . . . . . . . . . . . . . . . 77.68 155.1.2 Population with secondary education . . . . . . . . . . . . . . . . . . . . . . . .79.89 95.1.3 Technicians and associate professionals . . . . . . . . . . . . . . . . . . . . . . .98.91 25.1.4 Labour productivity per employee . . . . . . . . . . . . . . . . . . . . . . . . . . . .55.89 205.2 Employability . . . . . . . . . . . . . . . . . . . . . . . . . . . . . . . . . . . . . . . . . . . . . . . 82.46 75.2.1 Ease of finding skilled employees . . . . . . . . . . . . . . . . . . . . . . . . . . . . .85.09 75.2.2 Relevance of education system to the economy . . . . . . . . . . . . . . 81.05 85.2.3 Skills matching with secondary education . . . . . . . . . . . . . . . . . . . . 81.77 55.2.4 Skills matching with tertiary education . . . . . . . . . . . . . . . . . . . . . . . . 81.92 13
6 GLOBAL KNOWLEDGE SKILLS . . . . . . . . . . . . . . . . . . . . 48.69 236.1 High-Level Skills . . . . . . . . . . . . . . . . . . . . . . . . . . . . . . . . . . . . . . . . . . . . 50.16 286.1.1 Workforce with tertiary education . . . . . . . . . . . . . . . . . . . . . . . . . . . . 43.51 416.1.2 Population with tertiary education . . . . . . . . . . . . . . . . . . . . . . . . . . . . 41.23 356.1.3 Professionals . . . . . . . . . . . . . . . . . . . . . . . . . . . . . . . . . . . . . . . . . . . . . . . . . .46.74 316.1.4 Researchers . . . . . . . . . . . . . . . . . . . . . . . . . . . . . . . . . . . . . . . . . . . . . . . . . . .60.99 126.1.5 Senior officials and managers . . . . . . . . . . . . . . . . . . . . . . . . . . . . . . . . . 27.98 536.1.6 Availability of scientists and engineers . . . . . . . . . . . . . . . . . . . . . . . .80.50 116.2 Talent Impact . . . . . . . . . . . . . . . . . . . . . . . . . . . . . . . . . . . . . . . . . . . . . . . 47.23 246.2.1 Innovation output . . . . . . . . . . . . . . . . . . . . . . . . . . . . . . . . . . . . . . . . . . . .78.28 96.2.2 High-value exports . . . . . . . . . . . . . . . . . . . . . . . . . . . . . . . . . . . . . . . . . . . . 41.40 216.2.3 New product entrepreneurial activity . . . . . . . . . . . . . . . . . . . . . . . . .60.64 226.2.4 New business density . . . . . . . . . . . . . . . . . . . . . . . . . . . . . . . . . . . . . . . . . . 6.23 646.2.5 Scientific journal articles . . . . . . . . . . . . . . . . . . . . . . . . . . . . . . . . . . . . . . 49.61 22
l Germany l Income group average
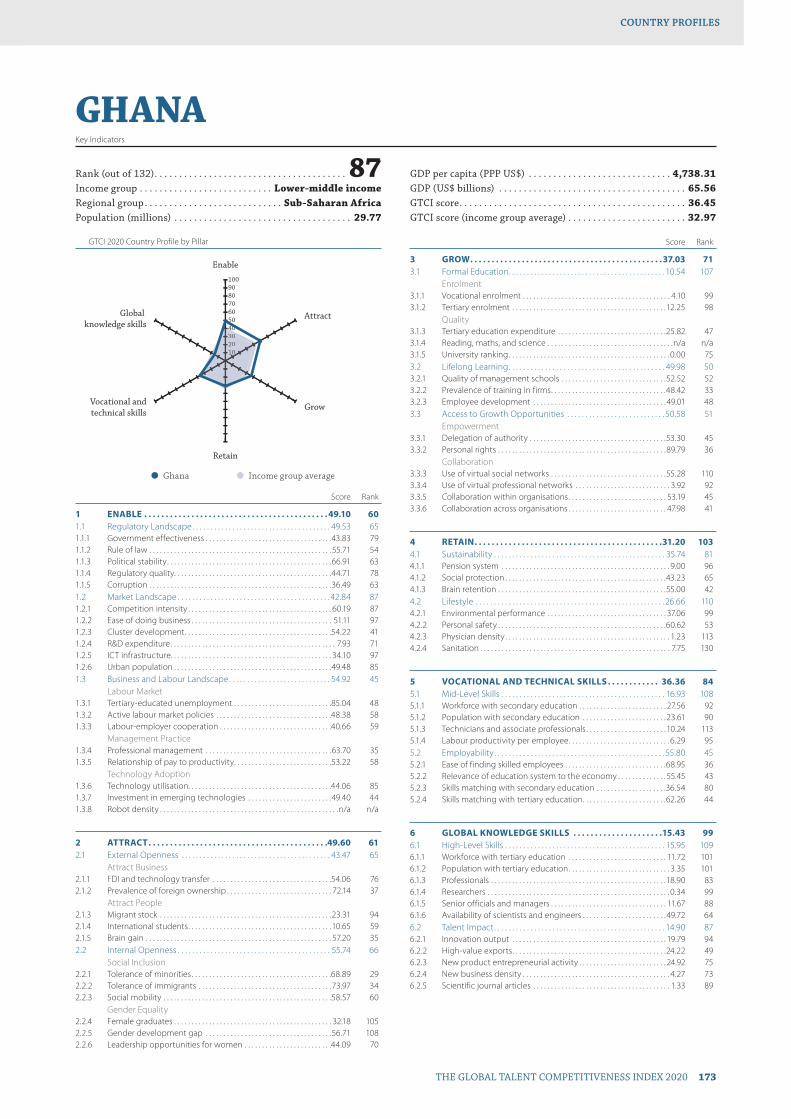
GTCI 2020 Country Profile by Pillar
THE GLOBAL TALENT COMPETITIVENESS INDEX 2020 173
COUNTRY PROFILESCOUNTRY PROFILES
102030405060708090100
Global knowledge skills
Vocational andtechnical skills
Retain
Grow
Attract
Enable
10203004
GHANAKey Indicators
Rank (out of 132) . . . . . . . . . . . . . . . . . . . . . . . . . . . . . . . . . . . . . . . 87Income group . . . . . . . . . . . . . . . . . . . . . . . . . . . Lower-middle incomeRegional group . . . . . . . . . . . . . . . . . . . . . . . . . . . . Sub-Saharan AfricaPopulation (millions) . . . . . . . . . . . . . . . . . . . . . . . . . . . . . . . . . . . . 29.77
GDP per capita (PPP US$) . . . . . . . . . . . . . . . . . . . . . . . . . . . . . 4,738.31GDP (US$ billions) . . . . . . . . . . . . . . . . . . . . . . . . . . . . . . . . . . . . . . 65.56GTCI score . . . . . . . . . . . . . . . . . . . . . . . . . . . . . . . . . . . . . . . . . . . . . . 36.45GTCI score (income group average) . . . . . . . . . . . . . . . . . . . . . . . . 32.97
Score Rank
1 ENABLE . . . . . . . . . . . . . . . . . . . . . . . . . . . . . . . . . . . . . . . . . . . 49.10 601.1 Regulatory Landscape . . . . . . . . . . . . . . . . . . . . . . . . . . . . . . . . . . . . . . 49.53 651.1.1 Government effectiveness . . . . . . . . . . . . . . . . . . . . . . . . . . . . . . . . . . . .43.83 791.1.2 Rule of law . . . . . . . . . . . . . . . . . . . . . . . . . . . . . . . . . . . . . . . . . . . . . . . . . . . . 55.71 541.1.3 Political stability . . . . . . . . . . . . . . . . . . . . . . . . . . . . . . . . . . . . . . . . . . . . . . .66.91 631.1.4 Regulatory quality. . . . . . . . . . . . . . . . . . . . . . . . . . . . . . . . . . . . . . . . . . . . .44.71 781.1.5 Corruption . . . . . . . . . . . . . . . . . . . . . . . . . . . . . . . . . . . . . . . . . . . . . . . . . . . .36.49 631.2 Market Landscape . . . . . . . . . . . . . . . . . . . . . . . . . . . . . . . . . . . . . . . . . . 42.84 871.2.1 Competition intensity . . . . . . . . . . . . . . . . . . . . . . . . . . . . . . . . . . . . . . . . . 60.19 871.2.2 Ease of doing business . . . . . . . . . . . . . . . . . . . . . . . . . . . . . . . . . . . . . . . . 51.11 971.2.3 Cluster development . . . . . . . . . . . . . . . . . . . . . . . . . . . . . . . . . . . . . . . . . .54.22 411.2.4 R&D expenditure . . . . . . . . . . . . . . . . . . . . . . . . . . . . . . . . . . . . . . . . . . . . . . . 7.93 711.2.5 ICT infrastructure. . . . . . . . . . . . . . . . . . . . . . . . . . . . . . . . . . . . . . . . . . . . . . 34.10 971.2.6 Urban population . . . . . . . . . . . . . . . . . . . . . . . . . . . . . . . . . . . . . . . . . . . . .49.48 851.3 Business and Labour Landscape . . . . . . . . . . . . . . . . . . . . . . . . . . . . 54.92 45
Labour Market1.3.1 Tertiary-educated unemployment . . . . . . . . . . . . . . . . . . . . . . . . . . . .85.04 481.3.2 Active labour market policies . . . . . . . . . . . . . . . . . . . . . . . . . . . . . . . . .48.38 581.3.3 Labour-employer cooperation . . . . . . . . . . . . . . . . . . . . . . . . . . . . . . . .40.66 59
Management Practice1.3.4 Professional management . . . . . . . . . . . . . . . . . . . . . . . . . . . . . . . . . . . .63.70 351.3.5 Relationship of pay to productivity . . . . . . . . . . . . . . . . . . . . . . . . . . . .53.22 58
Technology Adoption1.3.6 Technology utilisation. . . . . . . . . . . . . . . . . . . . . . . . . . . . . . . . . . . . . . . . .44.06 851.3.7 Investment in emerging technologies . . . . . . . . . . . . . . . . . . . . . . . .49.40 441.3.8 Robot density . . . . . . . . . . . . . . . . . . . . . . . . . . . . . . . . . . . . . . . . . . . . . . . . . . .n/a n/a
2 ATTRACT . . . . . . . . . . . . . . . . . . . . . . . . . . . . . . . . . . . . . . . . . .49.60 612.1 External Openness . . . . . . . . . . . . . . . . . . . . . . . . . . . . . . . . . . . . . . . . . 43.47 65
Attract Business2.1.1 FDI and technology transfer . . . . . . . . . . . . . . . . . . . . . . . . . . . . . . . . . .54.06 762.1.2 Prevalence of foreign ownership . . . . . . . . . . . . . . . . . . . . . . . . . . . . . . 72.14 37
Attract People2.1.3 Migrant stock . . . . . . . . . . . . . . . . . . . . . . . . . . . . . . . . . . . . . . . . . . . . . . . . .23.31 942.1.4 International students . . . . . . . . . . . . . . . . . . . . . . . . . . . . . . . . . . . . . . . . .10.65 592.1.5 Brain gain . . . . . . . . . . . . . . . . . . . . . . . . . . . . . . . . . . . . . . . . . . . . . . . . . . . . . 57.20 352.2 Internal Openness . . . . . . . . . . . . . . . . . . . . . . . . . . . . . . . . . . . . . . . . . . 55.74 66
Social Inclusion2.2.1 Tolerance of minorities . . . . . . . . . . . . . . . . . . . . . . . . . . . . . . . . . . . . . . . .68.89 292.2.2 Tolerance of immigrants . . . . . . . . . . . . . . . . . . . . . . . . . . . . . . . . . . . . . .73.97 342.2.3 Social mobility . . . . . . . . . . . . . . . . . . . . . . . . . . . . . . . . . . . . . . . . . . . . . . . .58.57 60
Gender Equality2.2.4 Female graduates . . . . . . . . . . . . . . . . . . . . . . . . . . . . . . . . . . . . . . . . . . . . . 32.18 1052.2.5 Gender development gap . . . . . . . . . . . . . . . . . . . . . . . . . . . . . . . . . . . .56.71 1082.2.6 Leadership opportunities for women . . . . . . . . . . . . . . . . . . . . . . . . .44.09 70
Score Rank
3 GROW . . . . . . . . . . . . . . . . . . . . . . . . . . . . . . . . . . . . . . . . . . . . .37.03 713.1 Formal Education . . . . . . . . . . . . . . . . . . . . . . . . . . . . . . . . . . . . . . . . . . . 10.54 107
Enrolment3.1.1 Vocational enrolment . . . . . . . . . . . . . . . . . . . . . . . . . . . . . . . . . . . . . . . . . . 4.10 993.1.2 Tertiary enrolment . . . . . . . . . . . . . . . . . . . . . . . . . . . . . . . . . . . . . . . . . . . .12.25 98
Quality3.1.3 Tertiary education expenditure . . . . . . . . . . . . . . . . . . . . . . . . . . . . . . .25.82 473.1.4 Reading, maths, and science . . . . . . . . . . . . . . . . . . . . . . . . . . . . . . . . . . . .n/a n/a3.1.5 University ranking . . . . . . . . . . . . . . . . . . . . . . . . . . . . . . . . . . . . . . . . . . . . . . 0.00 753.2 Lifelong Learning . . . . . . . . . . . . . . . . . . . . . . . . . . . . . . . . . . . . . . . . . . . 49.98 503.2.1 Quality of management schools . . . . . . . . . . . . . . . . . . . . . . . . . . . . . .52.52 523.2.2 Prevalence of training in firms . . . . . . . . . . . . . . . . . . . . . . . . . . . . . . . . .48.42 333.2.3 Employee development . . . . . . . . . . . . . . . . . . . . . . . . . . . . . . . . . . . . . . 49.01 483.3 Access to Growth Opportunities . . . . . . . . . . . . . . . . . . . . . . . . . . . 50.58 51
Empowerment3.3.1 Delegation of authority . . . . . . . . . . . . . . . . . . . . . . . . . . . . . . . . . . . . . . .53.30 453.3.2 Personal rights . . . . . . . . . . . . . . . . . . . . . . . . . . . . . . . . . . . . . . . . . . . . . . . .89.79 36
Collaboration3.3.3 Use of virtual social networks . . . . . . . . . . . . . . . . . . . . . . . . . . . . . . . . .55.28 1103.3.4 Use of virtual professional networks . . . . . . . . . . . . . . . . . . . . . . . . . . . 3.92 923.3.5 Collaboration within organisations . . . . . . . . . . . . . . . . . . . . . . . . . . . . 53.19 453.3.6 Collaboration across organisations . . . . . . . . . . . . . . . . . . . . . . . . . . . . 47.98 41
4 RETAIN . . . . . . . . . . . . . . . . . . . . . . . . . . . . . . . . . . . . . . . . . . . .31.20 1034.1 Sustainability . . . . . . . . . . . . . . . . . . . . . . . . . . . . . . . . . . . . . . . . . . . . . . . 35.74 814.1.1 Pension system . . . . . . . . . . . . . . . . . . . . . . . . . . . . . . . . . . . . . . . . . . . . . . . . 9.00 964.1.2 Social protection . . . . . . . . . . . . . . . . . . . . . . . . . . . . . . . . . . . . . . . . . . . . . .43.23 654.1.3 Brain retention . . . . . . . . . . . . . . . . . . . . . . . . . . . . . . . . . . . . . . . . . . . . . . . .55.00 424.2 Lifestyle . . . . . . . . . . . . . . . . . . . . . . . . . . . . . . . . . . . . . . . . . . . . . . . . . . . . 26.66 1104.2.1 Environmental performance . . . . . . . . . . . . . . . . . . . . . . . . . . . . . . . . . . 37.06 994.2.2 Personal safety . . . . . . . . . . . . . . . . . . . . . . . . . . . . . . . . . . . . . . . . . . . . . . . .60.62 534.2.3 Physician density . . . . . . . . . . . . . . . . . . . . . . . . . . . . . . . . . . . . . . . . . . . . . . . 1.23 1134.2.4 Sanitation . . . . . . . . . . . . . . . . . . . . . . . . . . . . . . . . . . . . . . . . . . . . . . . . . . . . . . 7.75 130
5 VOCATIONAL AND TECHNICAL SKILLS . . . . . . . . . . . . 36.36 845.1 Mid-Level Skills . . . . . . . . . . . . . . . . . . . . . . . . . . . . . . . . . . . . . . . . . . . . . 16.93 1085.1.1 Workforce with secondary education . . . . . . . . . . . . . . . . . . . . . . . . . 27.56 925.1.2 Population with secondary education . . . . . . . . . . . . . . . . . . . . . . . .23.61 905.1.3 Technicians and associate professionals . . . . . . . . . . . . . . . . . . . . . . . 10.24 1135.1.4 Labour productivity per employee . . . . . . . . . . . . . . . . . . . . . . . . . . . . . 6.29 955.2 Employability . . . . . . . . . . . . . . . . . . . . . . . . . . . . . . . . . . . . . . . . . . . . . . . 55.80 455.2.1 Ease of finding skilled employees . . . . . . . . . . . . . . . . . . . . . . . . . . . . .68.95 365.2.2 Relevance of education system to the economy . . . . . . . . . . . . . . 55.45 435.2.3 Skills matching with secondary education . . . . . . . . . . . . . . . . . . . .36.54 805.2.4 Skills matching with tertiary education . . . . . . . . . . . . . . . . . . . . . . . .62.26 44
6 GLOBAL KNOWLEDGE SKILLS . . . . . . . . . . . . . . . . . . . . .15.43 996.1 High-Level Skills . . . . . . . . . . . . . . . . . . . . . . . . . . . . . . . . . . . . . . . . . . . . 15.95 1096.1.1 Workforce with tertiary education . . . . . . . . . . . . . . . . . . . . . . . . . . . . 11.72 1016.1.2 Population with tertiary education . . . . . . . . . . . . . . . . . . . . . . . . . . . . . 3.35 1016.1.3 Professionals . . . . . . . . . . . . . . . . . . . . . . . . . . . . . . . . . . . . . . . . . . . . . . . . . .18.90 836.1.4 Researchers . . . . . . . . . . . . . . . . . . . . . . . . . . . . . . . . . . . . . . . . . . . . . . . . . . . . 0.34 996.1.5 Senior officials and managers . . . . . . . . . . . . . . . . . . . . . . . . . . . . . . . . . 11.67 886.1.6 Availability of scientists and engineers . . . . . . . . . . . . . . . . . . . . . . . .49.72 646.2 Talent Impact . . . . . . . . . . . . . . . . . . . . . . . . . . . . . . . . . . . . . . . . . . . . . . . 14.90 876.2.1 Innovation output . . . . . . . . . . . . . . . . . . . . . . . . . . . . . . . . . . . . . . . . . . . . 19.79 946.2.2 High-value exports . . . . . . . . . . . . . . . . . . . . . . . . . . . . . . . . . . . . . . . . . . . .24.22 496.2.3 New product entrepreneurial activity . . . . . . . . . . . . . . . . . . . . . . . . . 24.92 756.2.4 New business density . . . . . . . . . . . . . . . . . . . . . . . . . . . . . . . . . . . . . . . . . . 4.27 736.2.5 Scientific journal articles . . . . . . . . . . . . . . . . . . . . . . . . . . . . . . . . . . . . . . . 1.33 89
l Ghana l Income group average
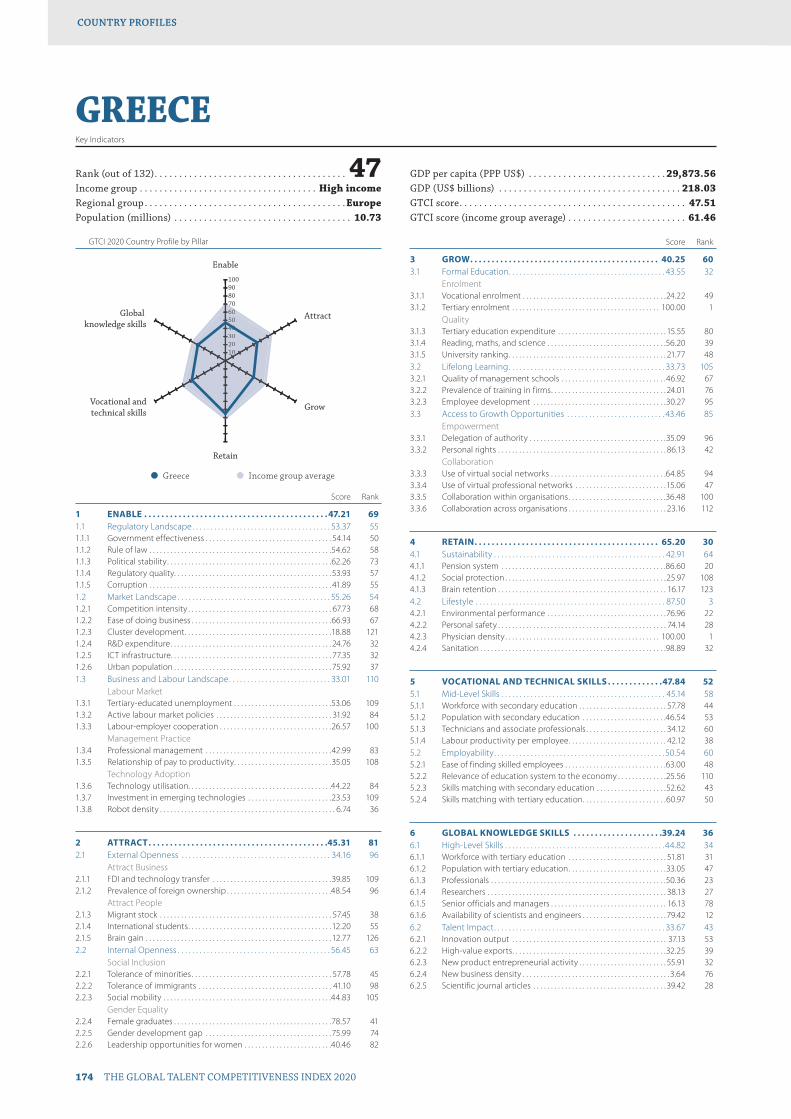
GTCI 2020 Country Profile by Pillar
174 THE GLOBAL TALENT COMPETITIVENESS INDEX 2020
COUNTRY PROFILESCOUNTRY PROFILES
102030405060708090100
Global knowledge skills
Vocational andtechnical skills
Retain
Grow
Attract
Enable
102030405060607
GREECEKey Indicators
Rank (out of 132) . . . . . . . . . . . . . . . . . . . . . . . . . . . . . . . . . . . . . . . 47Income group . . . . . . . . . . . . . . . . . . . . . . . . . . . . . . . . . . . . High incomeRegional group . . . . . . . . . . . . . . . . . . . . . . . . . . . . . . . . . . . . . . . . .EuropePopulation (millions) . . . . . . . . . . . . . . . . . . . . . . . . . . . . . . . . . . . . 10.73
GDP per capita (PPP US$) . . . . . . . . . . . . . . . . . . . . . . . . . . . . 29,873.56GDP (US$ billions) . . . . . . . . . . . . . . . . . . . . . . . . . . . . . . . . . . . . . 218.03GTCI score . . . . . . . . . . . . . . . . . . . . . . . . . . . . . . . . . . . . . . . . . . . . . . 47.51GTCI score (income group average) . . . . . . . . . . . . . . . . . . . . . . . . 61.46
Score Rank
1 ENABLE . . . . . . . . . . . . . . . . . . . . . . . . . . . . . . . . . . . . . . . . . . . 47.21 691.1 Regulatory Landscape . . . . . . . . . . . . . . . . . . . . . . . . . . . . . . . . . . . . . . 53.37 551.1.1 Government effectiveness . . . . . . . . . . . . . . . . . . . . . . . . . . . . . . . . . . . . 54.14 501.1.2 Rule of law . . . . . . . . . . . . . . . . . . . . . . . . . . . . . . . . . . . . . . . . . . . . . . . . . . . .54.62 581.1.3 Political stability . . . . . . . . . . . . . . . . . . . . . . . . . . . . . . . . . . . . . . . . . . . . . . .62.26 731.1.4 Regulatory quality. . . . . . . . . . . . . . . . . . . . . . . . . . . . . . . . . . . . . . . . . . . . . 53.93 571.1.5 Corruption . . . . . . . . . . . . . . . . . . . . . . . . . . . . . . . . . . . . . . . . . . . . . . . . . . . . 41.89 551.2 Market Landscape . . . . . . . . . . . . . . . . . . . . . . . . . . . . . . . . . . . . . . . . . . 55.26 541.2.1 Competition intensity . . . . . . . . . . . . . . . . . . . . . . . . . . . . . . . . . . . . . . . . . 67.73 681.2.2 Ease of doing business . . . . . . . . . . . . . . . . . . . . . . . . . . . . . . . . . . . . . . . .66.93 671.2.3 Cluster development . . . . . . . . . . . . . . . . . . . . . . . . . . . . . . . . . . . . . . . . . .18.88 1211.2.4 R&D expenditure . . . . . . . . . . . . . . . . . . . . . . . . . . . . . . . . . . . . . . . . . . . . . . 24.76 321.2.5 ICT infrastructure. . . . . . . . . . . . . . . . . . . . . . . . . . . . . . . . . . . . . . . . . . . . . . 77.35 321.2.6 Urban population . . . . . . . . . . . . . . . . . . . . . . . . . . . . . . . . . . . . . . . . . . . . . 75.92 371.3 Business and Labour Landscape . . . . . . . . . . . . . . . . . . . . . . . . . . . . 33.01 110
Labour Market1.3.1 Tertiary-educated unemployment . . . . . . . . . . . . . . . . . . . . . . . . . . . .53.06 1091.3.2 Active labour market policies . . . . . . . . . . . . . . . . . . . . . . . . . . . . . . . . . 31.92 841.3.3 Labour-employer cooperation . . . . . . . . . . . . . . . . . . . . . . . . . . . . . . . .26.57 100
Management Practice1.3.4 Professional management . . . . . . . . . . . . . . . . . . . . . . . . . . . . . . . . . . . .42.99 831.3.5 Relationship of pay to productivity . . . . . . . . . . . . . . . . . . . . . . . . . . . .35.05 108
Technology Adoption1.3.6 Technology utilisation. . . . . . . . . . . . . . . . . . . . . . . . . . . . . . . . . . . . . . . . .44.22 841.3.7 Investment in emerging technologies . . . . . . . . . . . . . . . . . . . . . . . .23.53 1091.3.8 Robot density . . . . . . . . . . . . . . . . . . . . . . . . . . . . . . . . . . . . . . . . . . . . . . . . . . 6.74 36
2 ATTRACT . . . . . . . . . . . . . . . . . . . . . . . . . . . . . . . . . . . . . . . . . .45.31 812.1 External Openness . . . . . . . . . . . . . . . . . . . . . . . . . . . . . . . . . . . . . . . . . 34.16 96
Attract Business2.1.1 FDI and technology transfer . . . . . . . . . . . . . . . . . . . . . . . . . . . . . . . . . .39.85 1092.1.2 Prevalence of foreign ownership . . . . . . . . . . . . . . . . . . . . . . . . . . . . . .48.54 96
Attract People2.1.3 Migrant stock . . . . . . . . . . . . . . . . . . . . . . . . . . . . . . . . . . . . . . . . . . . . . . . . . 57.45 382.1.4 International students . . . . . . . . . . . . . . . . . . . . . . . . . . . . . . . . . . . . . . . . .12.20 552.1.5 Brain gain . . . . . . . . . . . . . . . . . . . . . . . . . . . . . . . . . . . . . . . . . . . . . . . . . . . . . 12.77 1262.2 Internal Openness . . . . . . . . . . . . . . . . . . . . . . . . . . . . . . . . . . . . . . . . . . 56.45 63
Social Inclusion2.2.1 Tolerance of minorities . . . . . . . . . . . . . . . . . . . . . . . . . . . . . . . . . . . . . . . . 57.78 452.2.2 Tolerance of immigrants . . . . . . . . . . . . . . . . . . . . . . . . . . . . . . . . . . . . . . 41.10 982.2.3 Social mobility . . . . . . . . . . . . . . . . . . . . . . . . . . . . . . . . . . . . . . . . . . . . . . . .44.83 105
Gender Equality2.2.4 Female graduates . . . . . . . . . . . . . . . . . . . . . . . . . . . . . . . . . . . . . . . . . . . . .78.57 412.2.5 Gender development gap . . . . . . . . . . . . . . . . . . . . . . . . . . . . . . . . . . . .75.99 742.2.6 Leadership opportunities for women . . . . . . . . . . . . . . . . . . . . . . . . .40.46 82
Score Rank
3 GROW . . . . . . . . . . . . . . . . . . . . . . . . . . . . . . . . . . . . . . . . . . . . 40.25 603.1 Formal Education . . . . . . . . . . . . . . . . . . . . . . . . . . . . . . . . . . . . . . . . . . . 43.55 32
Enrolment3.1.1 Vocational enrolment . . . . . . . . . . . . . . . . . . . . . . . . . . . . . . . . . . . . . . . . .24.22 493.1.2 Tertiary enrolment . . . . . . . . . . . . . . . . . . . . . . . . . . . . . . . . . . . . . . . . . . 100.00 1
Quality3.1.3 Tertiary education expenditure . . . . . . . . . . . . . . . . . . . . . . . . . . . . . . . 15.55 803.1.4 Reading, maths, and science . . . . . . . . . . . . . . . . . . . . . . . . . . . . . . . . . .56.20 393.1.5 University ranking . . . . . . . . . . . . . . . . . . . . . . . . . . . . . . . . . . . . . . . . . . . . . 21.77 483.2 Lifelong Learning . . . . . . . . . . . . . . . . . . . . . . . . . . . . . . . . . . . . . . . . . . . 33.73 1053.2.1 Quality of management schools . . . . . . . . . . . . . . . . . . . . . . . . . . . . . .46.92 673.2.2 Prevalence of training in firms . . . . . . . . . . . . . . . . . . . . . . . . . . . . . . . . . 24.01 763.2.3 Employee development . . . . . . . . . . . . . . . . . . . . . . . . . . . . . . . . . . . . . .30.27 953.3 Access to Growth Opportunities . . . . . . . . . . . . . . . . . . . . . . . . . . . 43.46 85
Empowerment3.3.1 Delegation of authority . . . . . . . . . . . . . . . . . . . . . . . . . . . . . . . . . . . . . . .35.09 963.3.2 Personal rights . . . . . . . . . . . . . . . . . . . . . . . . . . . . . . . . . . . . . . . . . . . . . . . . 86.13 42
Collaboration3.3.3 Use of virtual social networks . . . . . . . . . . . . . . . . . . . . . . . . . . . . . . . . .64.85 943.3.4 Use of virtual professional networks . . . . . . . . . . . . . . . . . . . . . . . . . .15.06 473.3.5 Collaboration within organisations . . . . . . . . . . . . . . . . . . . . . . . . . . . .36.48 1003.3.6 Collaboration across organisations . . . . . . . . . . . . . . . . . . . . . . . . . . . . 23.16 112
4 RETAIN . . . . . . . . . . . . . . . . . . . . . . . . . . . . . . . . . . . . . . . . . . . 65.20 304.1 Sustainability . . . . . . . . . . . . . . . . . . . . . . . . . . . . . . . . . . . . . . . . . . . . . . . 42.91 644.1.1 Pension system . . . . . . . . . . . . . . . . . . . . . . . . . . . . . . . . . . . . . . . . . . . . . . .86.60 204.1.2 Social protection . . . . . . . . . . . . . . . . . . . . . . . . . . . . . . . . . . . . . . . . . . . . . .25.97 1084.1.3 Brain retention . . . . . . . . . . . . . . . . . . . . . . . . . . . . . . . . . . . . . . . . . . . . . . . . 16.17 1234.2 Lifestyle . . . . . . . . . . . . . . . . . . . . . . . . . . . . . . . . . . . . . . . . . . . . . . . . . . . . 87.50 34.2.1 Environmental performance . . . . . . . . . . . . . . . . . . . . . . . . . . . . . . . . . .76.96 224.2.2 Personal safety . . . . . . . . . . . . . . . . . . . . . . . . . . . . . . . . . . . . . . . . . . . . . . . . 74.14 284.2.3 Physician density . . . . . . . . . . . . . . . . . . . . . . . . . . . . . . . . . . . . . . . . . . . . 100.00 14.2.4 Sanitation . . . . . . . . . . . . . . . . . . . . . . . . . . . . . . . . . . . . . . . . . . . . . . . . . . . . .98.89 32
5 VOCATIONAL AND TECHNICAL SKILLS . . . . . . . . . . . . .47.84 525.1 Mid-Level Skills . . . . . . . . . . . . . . . . . . . . . . . . . . . . . . . . . . . . . . . . . . . . . 45.14 585.1.1 Workforce with secondary education . . . . . . . . . . . . . . . . . . . . . . . . . 57.78 445.1.2 Population with secondary education . . . . . . . . . . . . . . . . . . . . . . . .46.54 535.1.3 Technicians and associate professionals . . . . . . . . . . . . . . . . . . . . . . . 34.12 605.1.4 Labour productivity per employee . . . . . . . . . . . . . . . . . . . . . . . . . . . . 42.12 385.2 Employability . . . . . . . . . . . . . . . . . . . . . . . . . . . . . . . . . . . . . . . . . . . . . . . 50.54 605.2.1 Ease of finding skilled employees . . . . . . . . . . . . . . . . . . . . . . . . . . . . .63.00 485.2.2 Relevance of education system to the economy . . . . . . . . . . . . . .25.56 1105.2.3 Skills matching with secondary education . . . . . . . . . . . . . . . . . . . .52.62 435.2.4 Skills matching with tertiary education . . . . . . . . . . . . . . . . . . . . . . . .60.97 50
6 GLOBAL KNOWLEDGE SKILLS . . . . . . . . . . . . . . . . . . . . .39.24 366.1 High-Level Skills . . . . . . . . . . . . . . . . . . . . . . . . . . . . . . . . . . . . . . . . . . . .44.82 346.1.1 Workforce with tertiary education . . . . . . . . . . . . . . . . . . . . . . . . . . . . 51.81 316.1.2 Population with tertiary education . . . . . . . . . . . . . . . . . . . . . . . . . . . .33.05 476.1.3 Professionals . . . . . . . . . . . . . . . . . . . . . . . . . . . . . . . . . . . . . . . . . . . . . . . . . .50.36 236.1.4 Researchers . . . . . . . . . . . . . . . . . . . . . . . . . . . . . . . . . . . . . . . . . . . . . . . . . . . 38.13 276.1.5 Senior officials and managers . . . . . . . . . . . . . . . . . . . . . . . . . . . . . . . . . 16.13 786.1.6 Availability of scientists and engineers . . . . . . . . . . . . . . . . . . . . . . . . 79.42 126.2 Talent Impact . . . . . . . . . . . . . . . . . . . . . . . . . . . . . . . . . . . . . . . . . . . . . . . 33.67 436.2.1 Innovation output . . . . . . . . . . . . . . . . . . . . . . . . . . . . . . . . . . . . . . . . . . . . 37.13 536.2.2 High-value exports . . . . . . . . . . . . . . . . . . . . . . . . . . . . . . . . . . . . . . . . . . . .32.25 396.2.3 New product entrepreneurial activity . . . . . . . . . . . . . . . . . . . . . . . . . 55.91 326.2.4 New business density . . . . . . . . . . . . . . . . . . . . . . . . . . . . . . . . . . . . . . . . . . 3.64 766.2.5 Scientific journal articles . . . . . . . . . . . . . . . . . . . . . . . . . . . . . . . . . . . . . . 39.42 28
l Greece l Income group average
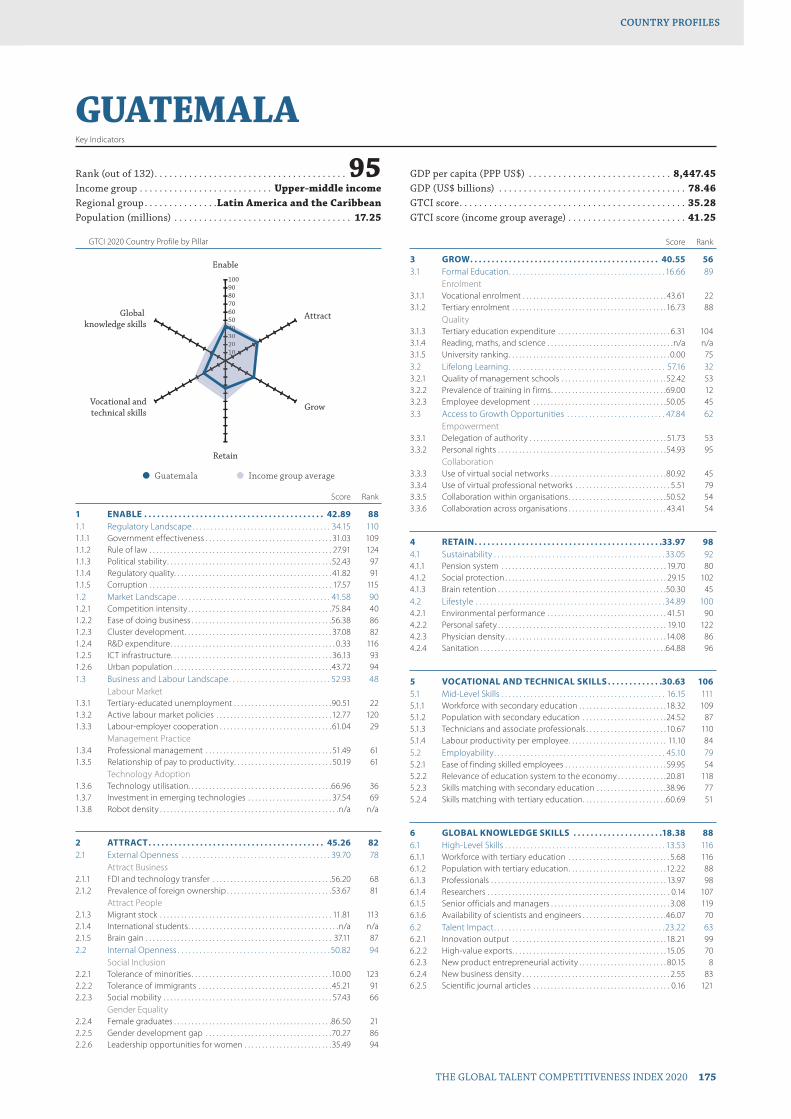
GTCI 2020 Country Profile by Pillar
THE GLOBAL TALENT COMPETITIVENESS INDEX 2020 175
COUNTRY PROFILESCOUNTRY PROFILES
102030405060708090100
Global knowledge skills
Vocational andtechnical skills
Retain
Grow
Attract
Enable
1020304040
GUATEMALAKey Indicators
Rank (out of 132) . . . . . . . . . . . . . . . . . . . . . . . . . . . . . . . . . . . . . . . 95Income group . . . . . . . . . . . . . . . . . . . . . . . . . . . Upper-middle incomeRegional group . . . . . . . . . . . . . . .Latin America and the CaribbeanPopulation (millions) . . . . . . . . . . . . . . . . . . . . . . . . . . . . . . . . . . . . 17.25
GDP per capita (PPP US$) . . . . . . . . . . . . . . . . . . . . . . . . . . . . . 8,447.45GDP (US$ billions) . . . . . . . . . . . . . . . . . . . . . . . . . . . . . . . . . . . . . . 78.46GTCI score . . . . . . . . . . . . . . . . . . . . . . . . . . . . . . . . . . . . . . . . . . . . . . 35.28GTCI score (income group average) . . . . . . . . . . . . . . . . . . . . . . . . 41.25
Score Rank
1 ENABLE . . . . . . . . . . . . . . . . . . . . . . . . . . . . . . . . . . . . . . . . . . 42.89 881.1 Regulatory Landscape . . . . . . . . . . . . . . . . . . . . . . . . . . . . . . . . . . . . . . 34.15 1101.1.1 Government effectiveness . . . . . . . . . . . . . . . . . . . . . . . . . . . . . . . . . . . . 31.03 1091.1.2 Rule of law . . . . . . . . . . . . . . . . . . . . . . . . . . . . . . . . . . . . . . . . . . . . . . . . . . . . 27.91 1241.1.3 Political stability . . . . . . . . . . . . . . . . . . . . . . . . . . . . . . . . . . . . . . . . . . . . . . .52.43 971.1.4 Regulatory quality. . . . . . . . . . . . . . . . . . . . . . . . . . . . . . . . . . . . . . . . . . . . . 41.82 911.1.5 Corruption . . . . . . . . . . . . . . . . . . . . . . . . . . . . . . . . . . . . . . . . . . . . . . . . . . . . 17.57 1151.2 Market Landscape . . . . . . . . . . . . . . . . . . . . . . . . . . . . . . . . . . . . . . . . . . 41.58 901.2.1 Competition intensity . . . . . . . . . . . . . . . . . . . . . . . . . . . . . . . . . . . . . . . . .75.84 401.2.2 Ease of doing business . . . . . . . . . . . . . . . . . . . . . . . . . . . . . . . . . . . . . . . .56.38 861.2.3 Cluster development . . . . . . . . . . . . . . . . . . . . . . . . . . . . . . . . . . . . . . . . . . 37.08 821.2.4 R&D expenditure . . . . . . . . . . . . . . . . . . . . . . . . . . . . . . . . . . . . . . . . . . . . . . . 0.33 1161.2.5 ICT infrastructure. . . . . . . . . . . . . . . . . . . . . . . . . . . . . . . . . . . . . . . . . . . . . . 36.13 931.2.6 Urban population . . . . . . . . . . . . . . . . . . . . . . . . . . . . . . . . . . . . . . . . . . . . .43.72 941.3 Business and Labour Landscape . . . . . . . . . . . . . . . . . . . . . . . . . . . . 52.93 48
Labour Market1.3.1 Tertiary-educated unemployment . . . . . . . . . . . . . . . . . . . . . . . . . . . .90.51 221.3.2 Active labour market policies . . . . . . . . . . . . . . . . . . . . . . . . . . . . . . . . . 12.77 1201.3.3 Labour-employer cooperation . . . . . . . . . . . . . . . . . . . . . . . . . . . . . . . . 61.04 29
Management Practice1.3.4 Professional management . . . . . . . . . . . . . . . . . . . . . . . . . . . . . . . . . . . . 51.49 611.3.5 Relationship of pay to productivity . . . . . . . . . . . . . . . . . . . . . . . . . . . . 50.19 61
Technology Adoption1.3.6 Technology utilisation. . . . . . . . . . . . . . . . . . . . . . . . . . . . . . . . . . . . . . . . .66.96 361.3.7 Investment in emerging technologies . . . . . . . . . . . . . . . . . . . . . . . . 37.54 691.3.8 Robot density . . . . . . . . . . . . . . . . . . . . . . . . . . . . . . . . . . . . . . . . . . . . . . . . . . .n/a n/a
2 ATTRACT . . . . . . . . . . . . . . . . . . . . . . . . . . . . . . . . . . . . . . . . . 45.26 822.1 External Openness . . . . . . . . . . . . . . . . . . . . . . . . . . . . . . . . . . . . . . . . . 39.70 78
Attract Business2.1.1 FDI and technology transfer . . . . . . . . . . . . . . . . . . . . . . . . . . . . . . . . . .56.20 682.1.2 Prevalence of foreign ownership . . . . . . . . . . . . . . . . . . . . . . . . . . . . . .53.67 81
Attract People2.1.3 Migrant stock . . . . . . . . . . . . . . . . . . . . . . . . . . . . . . . . . . . . . . . . . . . . . . . . . 11.81 1132.1.4 International students . . . . . . . . . . . . . . . . . . . . . . . . . . . . . . . . . . . . . . . . . . .n/a n/a2.1.5 Brain gain . . . . . . . . . . . . . . . . . . . . . . . . . . . . . . . . . . . . . . . . . . . . . . . . . . . . . 37.11 872.2 Internal Openness . . . . . . . . . . . . . . . . . . . . . . . . . . . . . . . . . . . . . . . . . . 50.82 94
Social Inclusion2.2.1 Tolerance of minorities . . . . . . . . . . . . . . . . . . . . . . . . . . . . . . . . . . . . . . . .10.00 1232.2.2 Tolerance of immigrants . . . . . . . . . . . . . . . . . . . . . . . . . . . . . . . . . . . . . . 45.21 912.2.3 Social mobility . . . . . . . . . . . . . . . . . . . . . . . . . . . . . . . . . . . . . . . . . . . . . . . . 57.43 66
Gender Equality2.2.4 Female graduates . . . . . . . . . . . . . . . . . . . . . . . . . . . . . . . . . . . . . . . . . . . . .86.50 212.2.5 Gender development gap . . . . . . . . . . . . . . . . . . . . . . . . . . . . . . . . . . . .70.27 862.2.6 Leadership opportunities for women . . . . . . . . . . . . . . . . . . . . . . . . .35.49 94
Score Rank
3 GROW . . . . . . . . . . . . . . . . . . . . . . . . . . . . . . . . . . . . . . . . . . . . 40.55 563.1 Formal Education . . . . . . . . . . . . . . . . . . . . . . . . . . . . . . . . . . . . . . . . . . . 16.66 89
Enrolment3.1.1 Vocational enrolment . . . . . . . . . . . . . . . . . . . . . . . . . . . . . . . . . . . . . . . . . 43.61 223.1.2 Tertiary enrolment . . . . . . . . . . . . . . . . . . . . . . . . . . . . . . . . . . . . . . . . . . . .16.73 88
Quality3.1.3 Tertiary education expenditure . . . . . . . . . . . . . . . . . . . . . . . . . . . . . . . . 6.31 1043.1.4 Reading, maths, and science . . . . . . . . . . . . . . . . . . . . . . . . . . . . . . . . . . . .n/a n/a3.1.5 University ranking . . . . . . . . . . . . . . . . . . . . . . . . . . . . . . . . . . . . . . . . . . . . . . 0.00 753.2 Lifelong Learning . . . . . . . . . . . . . . . . . . . . . . . . . . . . . . . . . . . . . . . . . . . 57.16 323.2.1 Quality of management schools . . . . . . . . . . . . . . . . . . . . . . . . . . . . . .52.42 533.2.2 Prevalence of training in firms . . . . . . . . . . . . . . . . . . . . . . . . . . . . . . . . .69.00 123.2.3 Employee development . . . . . . . . . . . . . . . . . . . . . . . . . . . . . . . . . . . . . .50.05 453.3 Access to Growth Opportunities . . . . . . . . . . . . . . . . . . . . . . . . . . . 47.84 62
Empowerment3.3.1 Delegation of authority . . . . . . . . . . . . . . . . . . . . . . . . . . . . . . . . . . . . . . . 51.73 533.3.2 Personal rights . . . . . . . . . . . . . . . . . . . . . . . . . . . . . . . . . . . . . . . . . . . . . . . .54.93 95
Collaboration3.3.3 Use of virtual social networks . . . . . . . . . . . . . . . . . . . . . . . . . . . . . . . . .80.92 453.3.4 Use of virtual professional networks . . . . . . . . . . . . . . . . . . . . . . . . . . . 5.51 793.3.5 Collaboration within organisations . . . . . . . . . . . . . . . . . . . . . . . . . . . .50.52 543.3.6 Collaboration across organisations . . . . . . . . . . . . . . . . . . . . . . . . . . . . 43.41 54
4 RETAIN . . . . . . . . . . . . . . . . . . . . . . . . . . . . . . . . . . . . . . . . . . . .33.97 984.1 Sustainability . . . . . . . . . . . . . . . . . . . . . . . . . . . . . . . . . . . . . . . . . . . . . . . 33.05 924.1.1 Pension system . . . . . . . . . . . . . . . . . . . . . . . . . . . . . . . . . . . . . . . . . . . . . . . 19.70 804.1.2 Social protection . . . . . . . . . . . . . . . . . . . . . . . . . . . . . . . . . . . . . . . . . . . . . . 29.15 1024.1.3 Brain retention . . . . . . . . . . . . . . . . . . . . . . . . . . . . . . . . . . . . . . . . . . . . . . . .50.30 454.2 Lifestyle . . . . . . . . . . . . . . . . . . . . . . . . . . . . . . . . . . . . . . . . . . . . . . . . . . . . 34.89 1004.2.1 Environmental performance . . . . . . . . . . . . . . . . . . . . . . . . . . . . . . . . . . 41.51 904.2.2 Personal safety . . . . . . . . . . . . . . . . . . . . . . . . . . . . . . . . . . . . . . . . . . . . . . . . 19.10 1224.2.3 Physician density . . . . . . . . . . . . . . . . . . . . . . . . . . . . . . . . . . . . . . . . . . . . . .14.08 864.2.4 Sanitation . . . . . . . . . . . . . . . . . . . . . . . . . . . . . . . . . . . . . . . . . . . . . . . . . . . . .64.88 96
5 VOCATIONAL AND TECHNICAL SKILLS . . . . . . . . . . . . .30.63 1065.1 Mid-Level Skills . . . . . . . . . . . . . . . . . . . . . . . . . . . . . . . . . . . . . . . . . . . . . 16.15 1115.1.1 Workforce with secondary education . . . . . . . . . . . . . . . . . . . . . . . . .18.32 1095.1.2 Population with secondary education . . . . . . . . . . . . . . . . . . . . . . . .24.52 875.1.3 Technicians and associate professionals . . . . . . . . . . . . . . . . . . . . . . . 10.67 1105.1.4 Labour productivity per employee . . . . . . . . . . . . . . . . . . . . . . . . . . . . 11.10 845.2 Employability . . . . . . . . . . . . . . . . . . . . . . . . . . . . . . . . . . . . . . . . . . . . . . . 45.10 795.2.1 Ease of finding skilled employees . . . . . . . . . . . . . . . . . . . . . . . . . . . . . 59.95 545.2.2 Relevance of education system to the economy . . . . . . . . . . . . . .20.81 1185.2.3 Skills matching with secondary education . . . . . . . . . . . . . . . . . . . .38.96 775.2.4 Skills matching with tertiary education . . . . . . . . . . . . . . . . . . . . . . . .60.69 51
6 GLOBAL KNOWLEDGE SKILLS . . . . . . . . . . . . . . . . . . . . .18.38 886.1 High-Level Skills . . . . . . . . . . . . . . . . . . . . . . . . . . . . . . . . . . . . . . . . . . . . 13.53 1166.1.1 Workforce with tertiary education . . . . . . . . . . . . . . . . . . . . . . . . . . . . . 5.68 1166.1.2 Population with tertiary education . . . . . . . . . . . . . . . . . . . . . . . . . . . .12.22 886.1.3 Professionals . . . . . . . . . . . . . . . . . . . . . . . . . . . . . . . . . . . . . . . . . . . . . . . . . . 13.97 986.1.4 Researchers . . . . . . . . . . . . . . . . . . . . . . . . . . . . . . . . . . . . . . . . . . . . . . . . . . . . 0.14 1076.1.5 Senior officials and managers . . . . . . . . . . . . . . . . . . . . . . . . . . . . . . . . . . 3.08 1196.1.6 Availability of scientists and engineers . . . . . . . . . . . . . . . . . . . . . . . .46.07 706.2 Talent Impact . . . . . . . . . . . . . . . . . . . . . . . . . . . . . . . . . . . . . . . . . . . . . . . 23.22 636.2.1 Innovation output . . . . . . . . . . . . . . . . . . . . . . . . . . . . . . . . . . . . . . . . . . . . 18.21 996.2.2 High-value exports . . . . . . . . . . . . . . . . . . . . . . . . . . . . . . . . . . . . . . . . . . . . 15.05 706.2.3 New product entrepreneurial activity . . . . . . . . . . . . . . . . . . . . . . . . . 80.15 86.2.4 New business density . . . . . . . . . . . . . . . . . . . . . . . . . . . . . . . . . . . . . . . . . . 2.55 836.2.5 Scientific journal articles . . . . . . . . . . . . . . . . . . . . . . . . . . . . . . . . . . . . . . . 0.16 121
l Guatemala l Income group average

GTCI 2020 Country Profile by Pillar
176 THE GLOBAL TALENT COMPETITIVENESS INDEX 2020
COUNTRY PROFILESCOUNTRY PROFILES
102030405060708090100
Global knowledge skills
Vocational andtechnical skills
Retain
Grow
Attract
Enable
10203004
HONDURASKey Indicators
Rank (out of 132) . . . . . . . . . . . . . . . . . . . . . . . . . . . . . . . . . . . . . . . 94Income group . . . . . . . . . . . . . . . . . . . . . . . . . . . Lower-middle incomeRegional group . . . . . . . . . . . . . . .Latin America and the CaribbeanPopulation (millions) . . . . . . . . . . . . . . . . . . . . . . . . . . . . . . . . . . . . . 9.59
GDP per capita (PPP US$) . . . . . . . . . . . . . . . . . . . . . . . . . . . . . 5,129.69GDP (US$ billions) . . . . . . . . . . . . . . . . . . . . . . . . . . . . . . . . . . . . . . 23.80GTCI score . . . . . . . . . . . . . . . . . . . . . . . . . . . . . . . . . . . . . . . . . . . . . . 35.31GTCI score (income group average) . . . . . . . . . . . . . . . . . . . . . . . . 32.97
Score Rank
1 ENABLE . . . . . . . . . . . . . . . . . . . . . . . . . . . . . . . . . . . . . . . . . . 40.90 931.1 Regulatory Landscape . . . . . . . . . . . . . . . . . . . . . . . . . . . . . . . . . . . . . . 34.58 1081.1.1 Government effectiveness . . . . . . . . . . . . . . . . . . . . . . . . . . . . . . . . . . . . 34.14 991.1.2 Rule of law . . . . . . . . . . . . . . . . . . . . . . . . . . . . . . . . . . . . . . . . . . . . . . . . . . . .28.23 1221.1.3 Political stability . . . . . . . . . . . . . . . . . . . . . . . . . . . . . . . . . . . . . . . . . . . . . . .52.89 951.1.4 Regulatory quality. . . . . . . . . . . . . . . . . . . . . . . . . . . . . . . . . . . . . . . . . . . . . 37.38 1001.1.5 Corruption . . . . . . . . . . . . . . . . . . . . . . . . . . . . . . . . . . . . . . . . . . . . . . . . . . . .20.27 1071.2 Market Landscape . . . . . . . . . . . . . . . . . . . . . . . . . . . . . . . . . . . . . . . . . . 40.56 941.2.1 Competition intensity . . . . . . . . . . . . . . . . . . . . . . . . . . . . . . . . . . . . . . . . . 70.31 621.2.2 Ease of doing business . . . . . . . . . . . . . . . . . . . . . . . . . . . . . . . . . . . . . . . . 49.32 1011.2.3 Cluster development . . . . . . . . . . . . . . . . . . . . . . . . . . . . . . . . . . . . . . . . . . 42.51 671.2.4 R&D expenditure . . . . . . . . . . . . . . . . . . . . . . . . . . . . . . . . . . . . . . . . . . . . . . . 0.01 1171.2.5 ICT infrastructure. . . . . . . . . . . . . . . . . . . . . . . . . . . . . . . . . . . . . . . . . . . . . .30.53 1021.2.6 Urban population . . . . . . . . . . . . . . . . . . . . . . . . . . . . . . . . . . . . . . . . . . . . .50.67 811.3 Business and Labour Landscape . . . . . . . . . . . . . . . . . . . . . . . . . . . . 47.56 61
Labour Market1.3.1 Tertiary-educated unemployment . . . . . . . . . . . . . . . . . . . . . . . . . . . .74.83 841.3.2 Active labour market policies . . . . . . . . . . . . . . . . . . . . . . . . . . . . . . . . . 21.29 1081.3.3 Labour-employer cooperation . . . . . . . . . . . . . . . . . . . . . . . . . . . . . . . . 51.02 42
Management Practice1.3.4 Professional management . . . . . . . . . . . . . . . . . . . . . . . . . . . . . . . . . . . . 47.60 711.3.5 Relationship of pay to productivity . . . . . . . . . . . . . . . . . . . . . . . . . . . .46.42 71
Technology Adoption1.3.6 Technology utilisation. . . . . . . . . . . . . . . . . . . . . . . . . . . . . . . . . . . . . . . . .55.87 551.3.7 Investment in emerging technologies . . . . . . . . . . . . . . . . . . . . . . . .35.90 751.3.8 Robot density . . . . . . . . . . . . . . . . . . . . . . . . . . . . . . . . . . . . . . . . . . . . . . . . . . .n/a n/a
2 ATTRACT . . . . . . . . . . . . . . . . . . . . . . . . . . . . . . . . . . . . . . . . . 48.22 682.1 External Openness . . . . . . . . . . . . . . . . . . . . . . . . . . . . . . . . . . . . . . . . . 34.79 95
Attract Business2.1.1 FDI and technology transfer . . . . . . . . . . . . . . . . . . . . . . . . . . . . . . . . . 64.64 492.1.2 Prevalence of foreign ownership . . . . . . . . . . . . . . . . . . . . . . . . . . . . . . 57.65 65
Attract People2.1.3 Migrant stock . . . . . . . . . . . . . . . . . . . . . . . . . . . . . . . . . . . . . . . . . . . . . . . . . . 9.76 1182.1.4 International students . . . . . . . . . . . . . . . . . . . . . . . . . . . . . . . . . . . . . . . . . . 2.71 882.1.5 Brain gain . . . . . . . . . . . . . . . . . . . . . . . . . . . . . . . . . . . . . . . . . . . . . . . . . . . . . 39.17 822.2 Internal Openness . . . . . . . . . . . . . . . . . . . . . . . . . . . . . . . . . . . . . . . . . . 61.65 51
Social Inclusion2.2.1 Tolerance of minorities . . . . . . . . . . . . . . . . . . . . . . . . . . . . . . . . . . . . . . . .52.22 552.2.2 Tolerance of immigrants . . . . . . . . . . . . . . . . . . . . . . . . . . . . . . . . . . . . . . 47.95 852.2.3 Social mobility . . . . . . . . . . . . . . . . . . . . . . . . . . . . . . . . . . . . . . . . . . . . . . . .56.23 69
Gender Equality2.2.4 Female graduates . . . . . . . . . . . . . . . . . . . . . . . . . . . . . . . . . . . . . . . . . . . . . 91.75 112.2.5 Gender development gap . . . . . . . . . . . . . . . . . . . . . . . . . . . . . . . . . . . .80.92 502.2.6 Leadership opportunities for women . . . . . . . . . . . . . . . . . . . . . . . . 40.84 81
Score Rank
3 GROW . . . . . . . . . . . . . . . . . . . . . . . . . . . . . . . . . . . . . . . . . . . . .38.77 653.1 Formal Education . . . . . . . . . . . . . . . . . . . . . . . . . . . . . . . . . . . . . . . . . . . 23.74 69
Enrolment3.1.1 Vocational enrolment . . . . . . . . . . . . . . . . . . . . . . . . . . . . . . . . . . . . . . . . .59.58 73.1.2 Tertiary enrolment . . . . . . . . . . . . . . . . . . . . . . . . . . . . . . . . . . . . . . . . . . . . 15.93 90
Quality3.1.3 Tertiary education expenditure . . . . . . . . . . . . . . . . . . . . . . . . . . . . . . .19.44 693.1.4 Reading, maths, and science . . . . . . . . . . . . . . . . . . . . . . . . . . . . . . . . . . . .n/a n/a3.1.5 University ranking . . . . . . . . . . . . . . . . . . . . . . . . . . . . . . . . . . . . . . . . . . . . . . 0.00 753.2 Lifelong Learning . . . . . . . . . . . . . . . . . . . . . . . . . . . . . . . . . . . . . . . . . . . 46.95 553.2.1 Quality of management schools . . . . . . . . . . . . . . . . . . . . . . . . . . . . . .36.06 1003.2.2 Prevalence of training in firms . . . . . . . . . . . . . . . . . . . . . . . . . . . . . . . . .58.44 233.2.3 Employee development . . . . . . . . . . . . . . . . . . . . . . . . . . . . . . . . . . . . . .46.34 533.3 Access to Growth Opportunities . . . . . . . . . . . . . . . . . . . . . . . . . . . 45.64 71
Empowerment3.3.1 Delegation of authority . . . . . . . . . . . . . . . . . . . . . . . . . . . . . . . . . . . . . . .48.27 623.3.2 Personal rights . . . . . . . . . . . . . . . . . . . . . . . . . . . . . . . . . . . . . . . . . . . . . . . .64.08 84
Collaboration3.3.3 Use of virtual social networks . . . . . . . . . . . . . . . . . . . . . . . . . . . . . . . . .70.28 803.3.4 Use of virtual professional networks . . . . . . . . . . . . . . . . . . . . . . . . . . . 4.69 863.3.5 Collaboration within organisations . . . . . . . . . . . . . . . . . . . . . . . . . . . . 47.92 643.3.6 Collaboration across organisations . . . . . . . . . . . . . . . . . . . . . . . . . . . .38.58 72
4 RETAIN . . . . . . . . . . . . . . . . . . . . . . . . . . . . . . . . . . . . . . . . . . . .37.27 944.1 Sustainability . . . . . . . . . . . . . . . . . . . . . . . . . . . . . . . . . . . . . . . . . . . . . . . 29.72 994.1.1 Pension system . . . . . . . . . . . . . . . . . . . . . . . . . . . . . . . . . . . . . . . . . . . . . . . 17.30 844.1.2 Social protection . . . . . . . . . . . . . . . . . . . . . . . . . . . . . . . . . . . . . . . . . . . . . .30.36 974.1.3 Brain retention . . . . . . . . . . . . . . . . . . . . . . . . . . . . . . . . . . . . . . . . . . . . . . . . 41.50 634.2 Lifestyle . . . . . . . . . . . . . . . . . . . . . . . . . . . . . . . . . . . . . . . . . . . . . . . . . . . .44.82 914.2.1 Environmental performance . . . . . . . . . . . . . . . . . . . . . . . . . . . . . . . . . . 40.14 934.2.2 Personal safety . . . . . . . . . . . . . . . . . . . . . . . . . . . . . . . . . . . . . . . . . . . . . . . .16.09 1244.2.3 Physician density . . . . . . . . . . . . . . . . . . . . . . . . . . . . . . . . . . . . . . . . . . . . . . . .n/a n/a4.2.4 Sanitation . . . . . . . . . . . . . . . . . . . . . . . . . . . . . . . . . . . . . . . . . . . . . . . . . . . . .78.24 85
5 VOCATIONAL AND TECHNICAL SKILLS . . . . . . . . . . . . 34.59 925.1 Mid-Level Skills . . . . . . . . . . . . . . . . . . . . . . . . . . . . . . . . . . . . . . . . . . . . . 23.41 965.1.1 Workforce with secondary education . . . . . . . . . . . . . . . . . . . . . . . . .26.92 965.1.2 Population with secondary education . . . . . . . . . . . . . . . . . . . . . . . . 18.43 975.1.3 Technicians and associate professionals . . . . . . . . . . . . . . . . . . . . . . .24.88 825.1.4 Labour productivity per employee . . . . . . . . . . . . . . . . . . . . . . . . . . . . . .n/a n/a5.2 Employability . . . . . . . . . . . . . . . . . . . . . . . . . . . . . . . . . . . . . . . . . . . . . . . 45.77 755.2.1 Ease of finding skilled employees . . . . . . . . . . . . . . . . . . . . . . . . . . . . . 53.10 695.2.2 Relevance of education system to the economy . . . . . . . . . . . . . .34.76 915.2.3 Skills matching with secondary education . . . . . . . . . . . . . . . . . . . .43.73 625.2.4 Skills matching with tertiary education . . . . . . . . . . . . . . . . . . . . . . . . 51.47 74
6 GLOBAL KNOWLEDGE SKILLS . . . . . . . . . . . . . . . . . . . . .12.08 1096.1 High-Level Skills . . . . . . . . . . . . . . . . . . . . . . . . . . . . . . . . . . . . . . . . . . . . 15.23 1116.1.1 Workforce with tertiary education . . . . . . . . . . . . . . . . . . . . . . . . . . . . . 8.22 1096.1.2 Population with tertiary education . . . . . . . . . . . . . . . . . . . . . . . . . . . . 15.94 786.1.3 Professionals . . . . . . . . . . . . . . . . . . . . . . . . . . . . . . . . . . . . . . . . . . . . . . . . . .10.30 1096.1.4 Researchers . . . . . . . . . . . . . . . . . . . . . . . . . . . . . . . . . . . . . . . . . . . . . . . . . . . . 0.15 1066.1.5 Senior officials and managers . . . . . . . . . . . . . . . . . . . . . . . . . . . . . . . . .16.77 756.1.6 Availability of scientists and engineers . . . . . . . . . . . . . . . . . . . . . . . .40.01 886.2 Talent Impact . . . . . . . . . . . . . . . . . . . . . . . . . . . . . . . . . . . . . . . . . . . . . . . . 8.92 1076.2.1 Innovation output . . . . . . . . . . . . . . . . . . . . . . . . . . . . . . . . . . . . . . . . . . . . 17.69 1016.2.2 High-value exports . . . . . . . . . . . . . . . . . . . . . . . . . . . . . . . . . . . . . . . . . . . . . 8.98 866.2.3 New product entrepreneurial activity . . . . . . . . . . . . . . . . . . . . . . . . . . .n/a n/a6.2.4 New business density . . . . . . . . . . . . . . . . . . . . . . . . . . . . . . . . . . . . . . . . . . .n/a n/a6.2.5 Scientific journal articles . . . . . . . . . . . . . . . . . . . . . . . . . . . . . . . . . . . . . . . 0.10 128
l Honduras l Income group average

GTCI 2020 Country Profile by Pillar
THE GLOBAL TALENT COMPETITIVENESS INDEX 2020 177
COUNTRY PROFILESCOUNTRY PROFILES
102030405060708090100
Global knowledge skills
Vocational andtechnical skills
Retain
Grow
Attract
Enable
102030405060607
HUNGARYKey Indicators
Rank (out of 132) . . . . . . . . . . . . . . . . . . . . . . . . . . . . . . . . . . . . . . . 52Income group . . . . . . . . . . . . . . . . . . . . . . . . . . . . . . . . . . . . High incomeRegional group . . . . . . . . . . . . . . . . . . . . . . . . . . . . . . . . . . . . . . . . .EuropePopulation (millions) . . . . . . . . . . . . . . . . . . . . . . . . . . . . . . . . . . . . . .9.77
GDP per capita (PPP US$) . . . . . . . . . . . . . . . . . . . . . . . . . . . .30,978.89GDP (US$ billions) . . . . . . . . . . . . . . . . . . . . . . . . . . . . . . . . . . . . . 155.70GTCI score . . . . . . . . . . . . . . . . . . . . . . . . . . . . . . . . . . . . . . . . . . . . . . 46.62GTCI score (income group average) . . . . . . . . . . . . . . . . . . . . . . . . 61.46
Score Rank
1 ENABLE . . . . . . . . . . . . . . . . . . . . . . . . . . . . . . . . . . . . . . . . . . .54.91 471.1 Regulatory Landscape . . . . . . . . . . . . . . . . . . . . . . . . . . . . . . . . . . . . . . 62.83 421.1.1 Government effectiveness . . . . . . . . . . . . . . . . . . . . . . . . . . . . . . . . . . . .58.99 431.1.2 Rule of law . . . . . . . . . . . . . . . . . . . . . . . . . . . . . . . . . . . . . . . . . . . . . . . . . . . .65.03 401.1.3 Political stability . . . . . . . . . . . . . . . . . . . . . . . . . . . . . . . . . . . . . . . . . . . . . . .82.87 281.1.4 Regulatory quality. . . . . . . . . . . . . . . . . . . . . . . . . . . . . . . . . . . . . . . . . . . . .64.04 411.1.5 Corruption . . . . . . . . . . . . . . . . . . . . . . . . . . . . . . . . . . . . . . . . . . . . . . . . . . . .43.24 541.2 Market Landscape . . . . . . . . . . . . . . . . . . . . . . . . . . . . . . . . . . . . . . . . . . 57.59 461.2.1 Competition intensity . . . . . . . . . . . . . . . . . . . . . . . . . . . . . . . . . . . . . . . . . 53.31 1101.2.2 Ease of doing business . . . . . . . . . . . . . . . . . . . . . . . . . . . . . . . . . . . . . . . .74.44 491.2.3 Cluster development . . . . . . . . . . . . . . . . . . . . . . . . . . . . . . . . . . . . . . . . . .43.77 601.2.4 R&D expenditure . . . . . . . . . . . . . . . . . . . . . . . . . . . . . . . . . . . . . . . . . . . . . .29.38 251.2.5 ICT infrastructure. . . . . . . . . . . . . . . . . . . . . . . . . . . . . . . . . . . . . . . . . . . . . . 77.61 311.2.6 Urban population . . . . . . . . . . . . . . . . . . . . . . . . . . . . . . . . . . . . . . . . . . . . . 67.06 501.3 Business and Labour Landscape . . . . . . . . . . . . . . . . . . . . . . . . . . . .44.29 70
Labour Market1.3.1 Tertiary-educated unemployment . . . . . . . . . . . . . . . . . . . . . . . . . . . .95.31 51.3.2 Active labour market policies . . . . . . . . . . . . . . . . . . . . . . . . . . . . . . . . . 46.15 611.3.3 Labour-employer cooperation . . . . . . . . . . . . . . . . . . . . . . . . . . . . . . . . 33.93 82
Management Practice1.3.4 Professional management . . . . . . . . . . . . . . . . . . . . . . . . . . . . . . . . . . . . 38.17 941.3.5 Relationship of pay to productivity . . . . . . . . . . . . . . . . . . . . . . . . . . . .38.67 90
Technology Adoption1.3.6 Technology utilisation. . . . . . . . . . . . . . . . . . . . . . . . . . . . . . . . . . . . . . . . .48.83 681.3.7 Investment in emerging technologies . . . . . . . . . . . . . . . . . . . . . . . .28.34 991.3.8 Robot density . . . . . . . . . . . . . . . . . . . . . . . . . . . . . . . . . . . . . . . . . . . . . . . . . 24.95 22
2 ATTRACT . . . . . . . . . . . . . . . . . . . . . . . . . . . . . . . . . . . . . . . . . .49.01 632.1 External Openness . . . . . . . . . . . . . . . . . . . . . . . . . . . . . . . . . . . . . . . . . 48.19 52
Attract Business2.1.1 FDI and technology transfer . . . . . . . . . . . . . . . . . . . . . . . . . . . . . . . . . .72.09 312.1.2 Prevalence of foreign ownership . . . . . . . . . . . . . . . . . . . . . . . . . . . . . . 63.17 55
Attract People2.1.3 Migrant stock . . . . . . . . . . . . . . . . . . . . . . . . . . . . . . . . . . . . . . . . . . . . . . . . . 41.48 622.1.4 International students . . . . . . . . . . . . . . . . . . . . . . . . . . . . . . . . . . . . . . . . .32.46 202.1.5 Brain gain . . . . . . . . . . . . . . . . . . . . . . . . . . . . . . . . . . . . . . . . . . . . . . . . . . . . . 31.75 952.2 Internal Openness . . . . . . . . . . . . . . . . . . . . . . . . . . . . . . . . . . . . . . . . . . 49.84 96
Social Inclusion2.2.1 Tolerance of minorities . . . . . . . . . . . . . . . . . . . . . . . . . . . . . . . . . . . . . . . .64.44 352.2.2 Tolerance of immigrants . . . . . . . . . . . . . . . . . . . . . . . . . . . . . . . . . . . . . . . 0.00 1292.2.3 Social mobility . . . . . . . . . . . . . . . . . . . . . . . . . . . . . . . . . . . . . . . . . . . . . . . .43.44 108
Gender Equality2.2.4 Female graduates . . . . . . . . . . . . . . . . . . . . . . . . . . . . . . . . . . . . . . . . . . . . .83.85 252.2.5 Gender development gap . . . . . . . . . . . . . . . . . . . . . . . . . . . . . . . . . . . . 83.61 402.2.6 Leadership opportunities for women . . . . . . . . . . . . . . . . . . . . . . . . .23.68 115
Score Rank
3 GROW . . . . . . . . . . . . . . . . . . . . . . . . . . . . . . . . . . . . . . . . . . . . .33.73 833.1 Formal Education . . . . . . . . . . . . . . . . . . . . . . . . . . . . . . . . . . . . . . . . . . . 30.55 53
Enrolment3.1.1 Vocational enrolment . . . . . . . . . . . . . . . . . . . . . . . . . . . . . . . . . . . . . . . . . 17.91 603.1.2 Tertiary enrolment . . . . . . . . . . . . . . . . . . . . . . . . . . . . . . . . . . . . . . . . . . . . 37.62 58
Quality3.1.3 Tertiary education expenditure . . . . . . . . . . . . . . . . . . . . . . . . . . . . . . . 13.72 863.1.4 Reading, maths, and science . . . . . . . . . . . . . . . . . . . . . . . . . . . . . . . . . .63.66 353.1.5 University ranking . . . . . . . . . . . . . . . . . . . . . . . . . . . . . . . . . . . . . . . . . . . . .19.84 513.2 Lifelong Learning . . . . . . . . . . . . . . . . . . . . . . . . . . . . . . . . . . . . . . . . . . . 30.20 1113.2.1 Quality of management schools . . . . . . . . . . . . . . . . . . . . . . . . . . . . . .44.96 773.2.2 Prevalence of training in firms . . . . . . . . . . . . . . . . . . . . . . . . . . . . . . . . .16.36 893.2.3 Employee development . . . . . . . . . . . . . . . . . . . . . . . . . . . . . . . . . . . . . .29.28 963.3 Access to Growth Opportunities . . . . . . . . . . . . . . . . . . . . . . . . . . . 40.43 97
Empowerment3.3.1 Delegation of authority . . . . . . . . . . . . . . . . . . . . . . . . . . . . . . . . . . . . . . .39.68 843.3.2 Personal rights . . . . . . . . . . . . . . . . . . . . . . . . . . . . . . . . . . . . . . . . . . . . . . . . 79.59 56
Collaboration3.3.3 Use of virtual social networks . . . . . . . . . . . . . . . . . . . . . . . . . . . . . . . . .65.78 923.3.4 Use of virtual professional networks . . . . . . . . . . . . . . . . . . . . . . . . . . . 9.90 613.3.5 Collaboration within organisations . . . . . . . . . . . . . . . . . . . . . . . . . . . .33.89 1053.3.6 Collaboration across organisations . . . . . . . . . . . . . . . . . . . . . . . . . . . . 13.71 130
4 RETAIN . . . . . . . . . . . . . . . . . . . . . . . . . . . . . . . . . . . . . . . . . . . .57.23 504.1 Sustainability . . . . . . . . . . . . . . . . . . . . . . . . . . . . . . . . . . . . . . . . . . . . . . . 44.13 604.1.1 Pension system . . . . . . . . . . . . . . . . . . . . . . . . . . . . . . . . . . . . . . . . . . . . . . . 87.52 194.1.2 Social protection . . . . . . . . . . . . . . . . . . . . . . . . . . . . . . . . . . . . . . . . . . . . . .22.61 1134.1.3 Brain retention . . . . . . . . . . . . . . . . . . . . . . . . . . . . . . . . . . . . . . . . . . . . . . . .22.26 1124.2 Lifestyle . . . . . . . . . . . . . . . . . . . . . . . . . . . . . . . . . . . . . . . . . . . . . . . . . . . . 70.32 344.2.1 Environmental performance . . . . . . . . . . . . . . . . . . . . . . . . . . . . . . . . . .62.64 394.2.2 Personal safety . . . . . . . . . . . . . . . . . . . . . . . . . . . . . . . . . . . . . . . . . . . . . . . . 71.51 324.2.3 Physician density . . . . . . . . . . . . . . . . . . . . . . . . . . . . . . . . . . . . . . . . . . . . . .49.29 344.2.4 Sanitation . . . . . . . . . . . . . . . . . . . . . . . . . . . . . . . . . . . . . . . . . . . . . . . . . . . . . 97.84 39
5 VOCATIONAL AND TECHNICAL SKILLS . . . . . . . . . . . . . 49.13 485.1 Mid-Level Skills . . . . . . . . . . . . . . . . . . . . . . . . . . . . . . . . . . . . . . . . . . . . . 65.77 105.1.1 Workforce with secondary education . . . . . . . . . . . . . . . . . . . . . . . . .82.94 105.1.2 Population with secondary education . . . . . . . . . . . . . . . . . . . . . . . .76.95 135.1.3 Technicians and associate professionals . . . . . . . . . . . . . . . . . . . . . . .63.78 205.1.4 Labour productivity per employee . . . . . . . . . . . . . . . . . . . . . . . . . . . . 39.43 415.2 Employability . . . . . . . . . . . . . . . . . . . . . . . . . . . . . . . . . . . . . . . . . . . . . . . 32.49 1175.2.1 Ease of finding skilled employees . . . . . . . . . . . . . . . . . . . . . . . . . . . . .23.56 1305.2.2 Relevance of education system to the economy . . . . . . . . . . . . . . 27.67 1085.2.3 Skills matching with secondary education . . . . . . . . . . . . . . . . . . . .34.86 845.2.4 Skills matching with tertiary education . . . . . . . . . . . . . . . . . . . . . . . .43.87 95
6 GLOBAL KNOWLEDGE SKILLS . . . . . . . . . . . . . . . . . . . . .35.74 416.1 High-Level Skills . . . . . . . . . . . . . . . . . . . . . . . . . . . . . . . . . . . . . . . . . . . . 36.14 496.1.1 Workforce with tertiary education . . . . . . . . . . . . . . . . . . . . . . . . . . . .39.25 486.1.2 Population with tertiary education . . . . . . . . . . . . . . . . . . . . . . . . . . . .33.37 456.1.3 Professionals . . . . . . . . . . . . . . . . . . . . . . . . . . . . . . . . . . . . . . . . . . . . . . . . . .39.96 416.1.4 Researchers . . . . . . . . . . . . . . . . . . . . . . . . . . . . . . . . . . . . . . . . . . . . . . . . . . .35.36 296.1.5 Senior officials and managers . . . . . . . . . . . . . . . . . . . . . . . . . . . . . . . . . 26.13 586.1.6 Availability of scientists and engineers . . . . . . . . . . . . . . . . . . . . . . . .42.80 816.2 Talent Impact . . . . . . . . . . . . . . . . . . . . . . . . . . . . . . . . . . . . . . . . . . . . . . . 35.33 396.2.1 Innovation output . . . . . . . . . . . . . . . . . . . . . . . . . . . . . . . . . . . . . . . . . . . .56.57 256.2.2 High-value exports . . . . . . . . . . . . . . . . . . . . . . . . . . . . . . . . . . . . . . . . . . . . 41.08 256.2.3 New product entrepreneurial activity . . . . . . . . . . . . . . . . . . . . . . . . . 37.73 586.2.4 New business density . . . . . . . . . . . . . . . . . . . . . . . . . . . . . . . . . . . . . . . . .16.25 366.2.5 Scientific journal articles . . . . . . . . . . . . . . . . . . . . . . . . . . . . . . . . . . . . . .25.04 39
l Hungary l Income group average
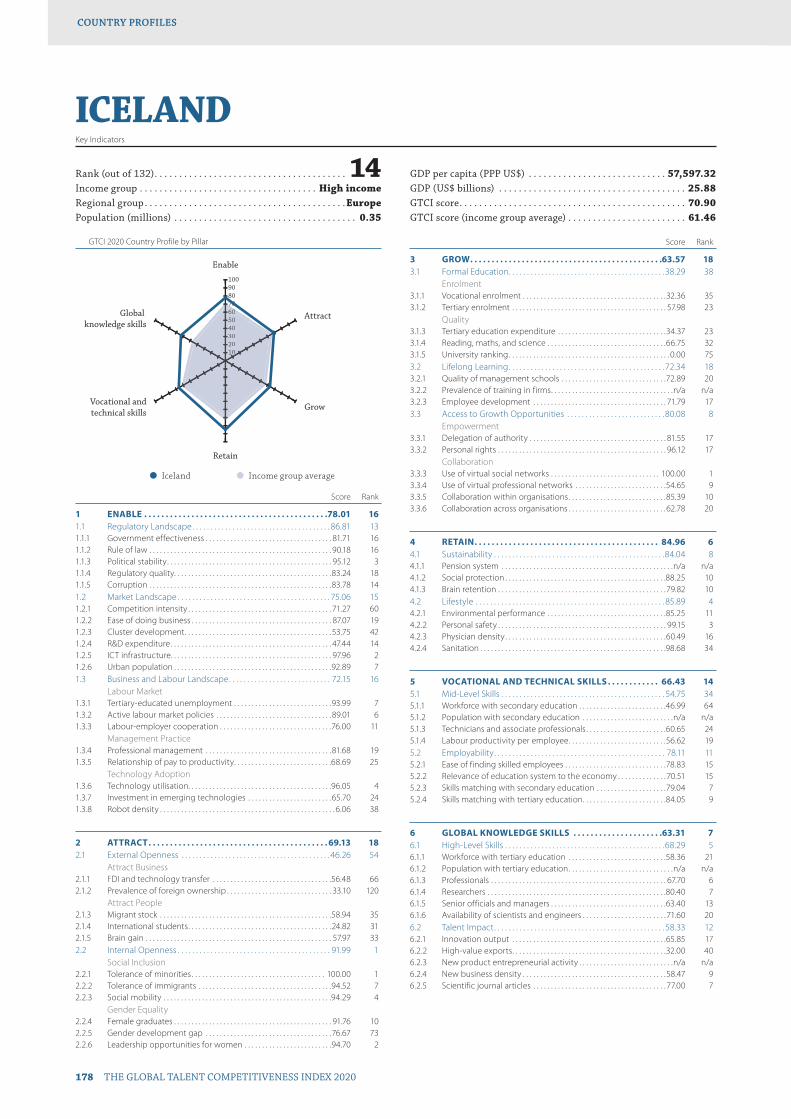
GTCI 2020 Country Profile by Pillar
178 THE GLOBAL TALENT COMPETITIVENESS INDEX 2020
COUNTRY PROFILESCOUNTRY PROFILES
102030405060708090100
Global knowledge skills
Vocational andtechnical skills
Retain
Grow
Attract
Enable
102030405060607
ICELANDKey Indicators
Rank (out of 132) . . . . . . . . . . . . . . . . . . . . . . . . . . . . . . . . . . . . . . . 14Income group . . . . . . . . . . . . . . . . . . . . . . . . . . . . . . . . . . . . High incomeRegional group . . . . . . . . . . . . . . . . . . . . . . . . . . . . . . . . . . . . . . . . .EuropePopulation (millions) . . . . . . . . . . . . . . . . . . . . . . . . . . . . . . . . . . . . . 0.35
GDP per capita (PPP US$) . . . . . . . . . . . . . . . . . . . . . . . . . . . . 57,597.32GDP (US$ billions) . . . . . . . . . . . . . . . . . . . . . . . . . . . . . . . . . . . . . . 25.88GTCI score . . . . . . . . . . . . . . . . . . . . . . . . . . . . . . . . . . . . . . . . . . . . . . 70.90GTCI score (income group average) . . . . . . . . . . . . . . . . . . . . . . . . 61.46
Score Rank
1 ENABLE . . . . . . . . . . . . . . . . . . . . . . . . . . . . . . . . . . . . . . . . . . .78.01 161.1 Regulatory Landscape . . . . . . . . . . . . . . . . . . . . . . . . . . . . . . . . . . . . . . 86.81 131.1.1 Government effectiveness . . . . . . . . . . . . . . . . . . . . . . . . . . . . . . . . . . . . 81.71 161.1.2 Rule of law . . . . . . . . . . . . . . . . . . . . . . . . . . . . . . . . . . . . . . . . . . . . . . . . . . . . 90.18 161.1.3 Political stability . . . . . . . . . . . . . . . . . . . . . . . . . . . . . . . . . . . . . . . . . . . . . . . 95.12 31.1.4 Regulatory quality. . . . . . . . . . . . . . . . . . . . . . . . . . . . . . . . . . . . . . . . . . . . .83.24 181.1.5 Corruption . . . . . . . . . . . . . . . . . . . . . . . . . . . . . . . . . . . . . . . . . . . . . . . . . . . .83.78 141.2 Market Landscape . . . . . . . . . . . . . . . . . . . . . . . . . . . . . . . . . . . . . . . . . . 75.06 151.2.1 Competition intensity . . . . . . . . . . . . . . . . . . . . . . . . . . . . . . . . . . . . . . . . . 71.27 601.2.2 Ease of doing business . . . . . . . . . . . . . . . . . . . . . . . . . . . . . . . . . . . . . . . . 87.07 191.2.3 Cluster development . . . . . . . . . . . . . . . . . . . . . . . . . . . . . . . . . . . . . . . . . .53.75 421.2.4 R&D expenditure . . . . . . . . . . . . . . . . . . . . . . . . . . . . . . . . . . . . . . . . . . . . . . 47.44 141.2.5 ICT infrastructure. . . . . . . . . . . . . . . . . . . . . . . . . . . . . . . . . . . . . . . . . . . . . . 97.96 21.2.6 Urban population . . . . . . . . . . . . . . . . . . . . . . . . . . . . . . . . . . . . . . . . . . . . .92.89 71.3 Business and Labour Landscape . . . . . . . . . . . . . . . . . . . . . . . . . . . . 72.15 16
Labour Market1.3.1 Tertiary-educated unemployment . . . . . . . . . . . . . . . . . . . . . . . . . . . .93.99 71.3.2 Active labour market policies . . . . . . . . . . . . . . . . . . . . . . . . . . . . . . . . . 89.01 61.3.3 Labour-employer cooperation . . . . . . . . . . . . . . . . . . . . . . . . . . . . . . . .76.00 11
Management Practice1.3.4 Professional management . . . . . . . . . . . . . . . . . . . . . . . . . . . . . . . . . . . . 81.68 191.3.5 Relationship of pay to productivity . . . . . . . . . . . . . . . . . . . . . . . . . . . .68.69 25
Technology Adoption1.3.6 Technology utilisation. . . . . . . . . . . . . . . . . . . . . . . . . . . . . . . . . . . . . . . . .96.05 41.3.7 Investment in emerging technologies . . . . . . . . . . . . . . . . . . . . . . . .65.70 241.3.8 Robot density . . . . . . . . . . . . . . . . . . . . . . . . . . . . . . . . . . . . . . . . . . . . . . . . . . 6.06 38
2 ATTRACT . . . . . . . . . . . . . . . . . . . . . . . . . . . . . . . . . . . . . . . . . . 69.13 182.1 External Openness . . . . . . . . . . . . . . . . . . . . . . . . . . . . . . . . . . . . . . . . .46.26 54
Attract Business2.1.1 FDI and technology transfer . . . . . . . . . . . . . . . . . . . . . . . . . . . . . . . . . .56.48 662.1.2 Prevalence of foreign ownership . . . . . . . . . . . . . . . . . . . . . . . . . . . . . . 33.10 120
Attract People2.1.3 Migrant stock . . . . . . . . . . . . . . . . . . . . . . . . . . . . . . . . . . . . . . . . . . . . . . . . .58.94 352.1.4 International students . . . . . . . . . . . . . . . . . . . . . . . . . . . . . . . . . . . . . . . . .24.82 312.1.5 Brain gain . . . . . . . . . . . . . . . . . . . . . . . . . . . . . . . . . . . . . . . . . . . . . . . . . . . . . 57.97 332.2 Internal Openness . . . . . . . . . . . . . . . . . . . . . . . . . . . . . . . . . . . . . . . . . . 91.99 1
Social Inclusion2.2.1 Tolerance of minorities . . . . . . . . . . . . . . . . . . . . . . . . . . . . . . . . . . . . . . 100.00 12.2.2 Tolerance of immigrants . . . . . . . . . . . . . . . . . . . . . . . . . . . . . . . . . . . . . .94.52 72.2.3 Social mobility . . . . . . . . . . . . . . . . . . . . . . . . . . . . . . . . . . . . . . . . . . . . . . . .94.29 4
Gender Equality2.2.4 Female graduates . . . . . . . . . . . . . . . . . . . . . . . . . . . . . . . . . . . . . . . . . . . . . 91.76 102.2.5 Gender development gap . . . . . . . . . . . . . . . . . . . . . . . . . . . . . . . . . . . .76.67 732.2.6 Leadership opportunities for women . . . . . . . . . . . . . . . . . . . . . . . . .94.70 2
Score Rank
3 GROW . . . . . . . . . . . . . . . . . . . . . . . . . . . . . . . . . . . . . . . . . . . . .63.57 183.1 Formal Education . . . . . . . . . . . . . . . . . . . . . . . . . . . . . . . . . . . . . . . . . . . 38.29 38
Enrolment3.1.1 Vocational enrolment . . . . . . . . . . . . . . . . . . . . . . . . . . . . . . . . . . . . . . . . .32.36 353.1.2 Tertiary enrolment . . . . . . . . . . . . . . . . . . . . . . . . . . . . . . . . . . . . . . . . . . . . 57.98 23
Quality3.1.3 Tertiary education expenditure . . . . . . . . . . . . . . . . . . . . . . . . . . . . . . .34.37 233.1.4 Reading, maths, and science . . . . . . . . . . . . . . . . . . . . . . . . . . . . . . . . . .66.75 323.1.5 University ranking . . . . . . . . . . . . . . . . . . . . . . . . . . . . . . . . . . . . . . . . . . . . . . 0.00 753.2 Lifelong Learning . . . . . . . . . . . . . . . . . . . . . . . . . . . . . . . . . . . . . . . . . . . 72.34 183.2.1 Quality of management schools . . . . . . . . . . . . . . . . . . . . . . . . . . . . . .72.89 203.2.2 Prevalence of training in firms . . . . . . . . . . . . . . . . . . . . . . . . . . . . . . . . . . .n/a n/a3.2.3 Employee development . . . . . . . . . . . . . . . . . . . . . . . . . . . . . . . . . . . . . . 71.79 173.3 Access to Growth Opportunities . . . . . . . . . . . . . . . . . . . . . . . . . . . 80.08 8
Empowerment3.3.1 Delegation of authority . . . . . . . . . . . . . . . . . . . . . . . . . . . . . . . . . . . . . . . 81.55 173.3.2 Personal rights . . . . . . . . . . . . . . . . . . . . . . . . . . . . . . . . . . . . . . . . . . . . . . . . 96.12 17
Collaboration3.3.3 Use of virtual social networks . . . . . . . . . . . . . . . . . . . . . . . . . . . . . . . 100.00 13.3.4 Use of virtual professional networks . . . . . . . . . . . . . . . . . . . . . . . . . .54.65 93.3.5 Collaboration within organisations . . . . . . . . . . . . . . . . . . . . . . . . . . . .85.39 103.3.6 Collaboration across organisations . . . . . . . . . . . . . . . . . . . . . . . . . . . .62.78 20
4 RETAIN . . . . . . . . . . . . . . . . . . . . . . . . . . . . . . . . . . . . . . . . . . . 84.96 64.1 Sustainability . . . . . . . . . . . . . . . . . . . . . . . . . . . . . . . . . . . . . . . . . . . . . . .84.04 84.1.1 Pension system . . . . . . . . . . . . . . . . . . . . . . . . . . . . . . . . . . . . . . . . . . . . . . . . .n/a n/a4.1.2 Social protection . . . . . . . . . . . . . . . . . . . . . . . . . . . . . . . . . . . . . . . . . . . . . .88.25 104.1.3 Brain retention . . . . . . . . . . . . . . . . . . . . . . . . . . . . . . . . . . . . . . . . . . . . . . . .79.82 104.2 Lifestyle . . . . . . . . . . . . . . . . . . . . . . . . . . . . . . . . . . . . . . . . . . . . . . . . . . . . 85.89 44.2.1 Environmental performance . . . . . . . . . . . . . . . . . . . . . . . . . . . . . . . . . .85.25 114.2.2 Personal safety . . . . . . . . . . . . . . . . . . . . . . . . . . . . . . . . . . . . . . . . . . . . . . . . 99.15 34.2.3 Physician density . . . . . . . . . . . . . . . . . . . . . . . . . . . . . . . . . . . . . . . . . . . . . .60.49 164.2.4 Sanitation . . . . . . . . . . . . . . . . . . . . . . . . . . . . . . . . . . . . . . . . . . . . . . . . . . . . .98.68 34
5 VOCATIONAL AND TECHNICAL SKILLS . . . . . . . . . . . . 66.43 145.1 Mid-Level Skills . . . . . . . . . . . . . . . . . . . . . . . . . . . . . . . . . . . . . . . . . . . . . 54.75 345.1.1 Workforce with secondary education . . . . . . . . . . . . . . . . . . . . . . . . .46.99 645.1.2 Population with secondary education . . . . . . . . . . . . . . . . . . . . . . . . . .n/a n/a5.1.3 Technicians and associate professionals . . . . . . . . . . . . . . . . . . . . . . .60.65 245.1.4 Labour productivity per employee . . . . . . . . . . . . . . . . . . . . . . . . . . . .56.62 195.2 Employability . . . . . . . . . . . . . . . . . . . . . . . . . . . . . . . . . . . . . . . . . . . . . . . 78.11 115.2.1 Ease of finding skilled employees . . . . . . . . . . . . . . . . . . . . . . . . . . . . .78.83 155.2.2 Relevance of education system to the economy . . . . . . . . . . . . . . 70.51 155.2.3 Skills matching with secondary education . . . . . . . . . . . . . . . . . . . .79.04 75.2.4 Skills matching with tertiary education . . . . . . . . . . . . . . . . . . . . . . . .84.05 9
6 GLOBAL KNOWLEDGE SKILLS . . . . . . . . . . . . . . . . . . . . .63.31 76.1 High-Level Skills . . . . . . . . . . . . . . . . . . . . . . . . . . . . . . . . . . . . . . . . . . . .68.29 56.1.1 Workforce with tertiary education . . . . . . . . . . . . . . . . . . . . . . . . . . . .58.36 216.1.2 Population with tertiary education . . . . . . . . . . . . . . . . . . . . . . . . . . . . . .n/a n/a6.1.3 Professionals . . . . . . . . . . . . . . . . . . . . . . . . . . . . . . . . . . . . . . . . . . . . . . . . . . 67.70 66.1.4 Researchers . . . . . . . . . . . . . . . . . . . . . . . . . . . . . . . . . . . . . . . . . . . . . . . . . . .80.40 76.1.5 Senior officials and managers . . . . . . . . . . . . . . . . . . . . . . . . . . . . . . . . .63.40 136.1.6 Availability of scientists and engineers . . . . . . . . . . . . . . . . . . . . . . . .71.60 206.2 Talent Impact . . . . . . . . . . . . . . . . . . . . . . . . . . . . . . . . . . . . . . . . . . . . . . . 58.33 126.2.1 Innovation output . . . . . . . . . . . . . . . . . . . . . . . . . . . . . . . . . . . . . . . . . . . .65.85 176.2.2 High-value exports . . . . . . . . . . . . . . . . . . . . . . . . . . . . . . . . . . . . . . . . . . . .32.00 406.2.3 New product entrepreneurial activity . . . . . . . . . . . . . . . . . . . . . . . . . . .n/a n/a6.2.4 New business density . . . . . . . . . . . . . . . . . . . . . . . . . . . . . . . . . . . . . . . . .58.47 96.2.5 Scientific journal articles . . . . . . . . . . . . . . . . . . . . . . . . . . . . . . . . . . . . . . 77.00 7
l Iceland l Income group average
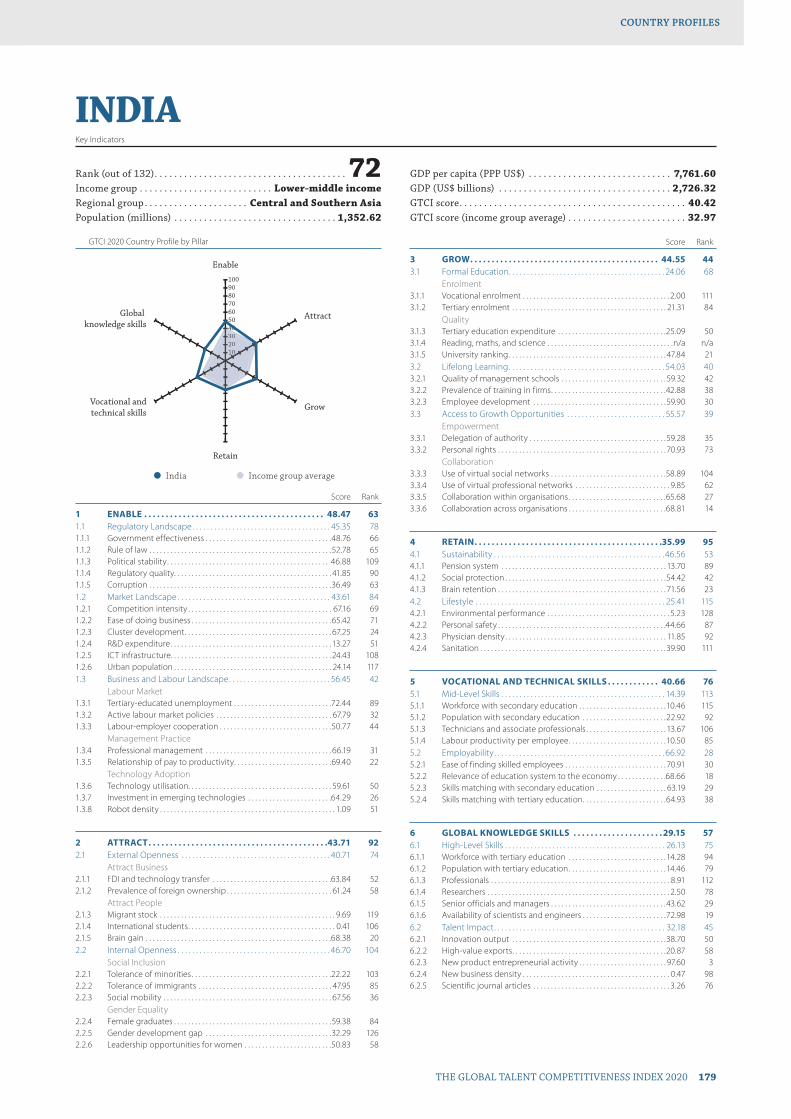
GTCI 2020 Country Profile by Pillar
THE GLOBAL TALENT COMPETITIVENESS INDEX 2020 179
COUNTRY PROFILESCOUNTRY PROFILES
102030405060708090100
Global knowledge skills
Vocational andtechnical skills
Retain
Grow
Attract
Enable
10203004
INDIAKey Indicators
Rank (out of 132) . . . . . . . . . . . . . . . . . . . . . . . . . . . . . . . . . . . . . . . 72Income group . . . . . . . . . . . . . . . . . . . . . . . . . . . Lower-middle incomeRegional group . . . . . . . . . . . . . . . . . . . . . Central and Southern AsiaPopulation (millions) . . . . . . . . . . . . . . . . . . . . . . . . . . . . . . . . . 1,352.62
GDP per capita (PPP US$) . . . . . . . . . . . . . . . . . . . . . . . . . . . . . 7,761.60GDP (US$ billions) . . . . . . . . . . . . . . . . . . . . . . . . . . . . . . . . . . . 2,726.32GTCI score . . . . . . . . . . . . . . . . . . . . . . . . . . . . . . . . . . . . . . . . . . . . . . 40.42GTCI score (income group average) . . . . . . . . . . . . . . . . . . . . . . . . 32.97
Score Rank
1 ENABLE . . . . . . . . . . . . . . . . . . . . . . . . . . . . . . . . . . . . . . . . . . 48.47 631.1 Regulatory Landscape . . . . . . . . . . . . . . . . . . . . . . . . . . . . . . . . . . . . . . 45.35 781.1.1 Government effectiveness . . . . . . . . . . . . . . . . . . . . . . . . . . . . . . . . . . . .48.76 661.1.2 Rule of law . . . . . . . . . . . . . . . . . . . . . . . . . . . . . . . . . . . . . . . . . . . . . . . . . . . .52.78 651.1.3 Political stability . . . . . . . . . . . . . . . . . . . . . . . . . . . . . . . . . . . . . . . . . . . . . . 46.88 1091.1.4 Regulatory quality. . . . . . . . . . . . . . . . . . . . . . . . . . . . . . . . . . . . . . . . . . . . . 41.85 901.1.5 Corruption . . . . . . . . . . . . . . . . . . . . . . . . . . . . . . . . . . . . . . . . . . . . . . . . . . . .36.49 631.2 Market Landscape . . . . . . . . . . . . . . . . . . . . . . . . . . . . . . . . . . . . . . . . . . 43.61 841.2.1 Competition intensity . . . . . . . . . . . . . . . . . . . . . . . . . . . . . . . . . . . . . . . . . 67.16 691.2.2 Ease of doing business . . . . . . . . . . . . . . . . . . . . . . . . . . . . . . . . . . . . . . . .65.42 711.2.3 Cluster development . . . . . . . . . . . . . . . . . . . . . . . . . . . . . . . . . . . . . . . . . . 67.25 241.2.4 R&D expenditure . . . . . . . . . . . . . . . . . . . . . . . . . . . . . . . . . . . . . . . . . . . . . . 13.27 511.2.5 ICT infrastructure. . . . . . . . . . . . . . . . . . . . . . . . . . . . . . . . . . . . . . . . . . . . . . 24.43 1081.2.6 Urban population . . . . . . . . . . . . . . . . . . . . . . . . . . . . . . . . . . . . . . . . . . . . . 24.14 1171.3 Business and Labour Landscape . . . . . . . . . . . . . . . . . . . . . . . . . . . . 56.45 42
Labour Market1.3.1 Tertiary-educated unemployment . . . . . . . . . . . . . . . . . . . . . . . . . . . .72.44 891.3.2 Active labour market policies . . . . . . . . . . . . . . . . . . . . . . . . . . . . . . . . . 67.79 321.3.3 Labour-employer cooperation . . . . . . . . . . . . . . . . . . . . . . . . . . . . . . . .50.77 44
Management Practice1.3.4 Professional management . . . . . . . . . . . . . . . . . . . . . . . . . . . . . . . . . . . . 66.19 311.3.5 Relationship of pay to productivity . . . . . . . . . . . . . . . . . . . . . . . . . . . .69.40 22
Technology Adoption1.3.6 Technology utilisation. . . . . . . . . . . . . . . . . . . . . . . . . . . . . . . . . . . . . . . . . 59.61 501.3.7 Investment in emerging technologies . . . . . . . . . . . . . . . . . . . . . . . .64.29 261.3.8 Robot density . . . . . . . . . . . . . . . . . . . . . . . . . . . . . . . . . . . . . . . . . . . . . . . . . . 1.09 51
2 ATTRACT . . . . . . . . . . . . . . . . . . . . . . . . . . . . . . . . . . . . . . . . . .43.71 922.1 External Openness . . . . . . . . . . . . . . . . . . . . . . . . . . . . . . . . . . . . . . . . . 40.71 74
Attract Business2.1.1 FDI and technology transfer . . . . . . . . . . . . . . . . . . . . . . . . . . . . . . . . . .63.84 522.1.2 Prevalence of foreign ownership . . . . . . . . . . . . . . . . . . . . . . . . . . . . . . 61.24 58
Attract People2.1.3 Migrant stock . . . . . . . . . . . . . . . . . . . . . . . . . . . . . . . . . . . . . . . . . . . . . . . . . . 9.69 1192.1.4 International students . . . . . . . . . . . . . . . . . . . . . . . . . . . . . . . . . . . . . . . . . . 0.41 1062.1.5 Brain gain . . . . . . . . . . . . . . . . . . . . . . . . . . . . . . . . . . . . . . . . . . . . . . . . . . . . .68.38 202.2 Internal Openness . . . . . . . . . . . . . . . . . . . . . . . . . . . . . . . . . . . . . . . . . . 46.70 104
Social Inclusion2.2.1 Tolerance of minorities . . . . . . . . . . . . . . . . . . . . . . . . . . . . . . . . . . . . . . . .22.22 1032.2.2 Tolerance of immigrants . . . . . . . . . . . . . . . . . . . . . . . . . . . . . . . . . . . . . . 47.95 852.2.3 Social mobility . . . . . . . . . . . . . . . . . . . . . . . . . . . . . . . . . . . . . . . . . . . . . . . . 67.56 36
Gender Equality2.2.4 Female graduates . . . . . . . . . . . . . . . . . . . . . . . . . . . . . . . . . . . . . . . . . . . . .59.38 842.2.5 Gender development gap . . . . . . . . . . . . . . . . . . . . . . . . . . . . . . . . . . . .32.29 1262.2.6 Leadership opportunities for women . . . . . . . . . . . . . . . . . . . . . . . . .50.83 58
Score Rank
3 GROW . . . . . . . . . . . . . . . . . . . . . . . . . . . . . . . . . . . . . . . . . . . . 44.55 443.1 Formal Education . . . . . . . . . . . . . . . . . . . . . . . . . . . . . . . . . . . . . . . . . . . 24.06 68
Enrolment3.1.1 Vocational enrolment . . . . . . . . . . . . . . . . . . . . . . . . . . . . . . . . . . . . . . . . . . 2.00 1113.1.2 Tertiary enrolment . . . . . . . . . . . . . . . . . . . . . . . . . . . . . . . . . . . . . . . . . . . . 21.31 84
Quality3.1.3 Tertiary education expenditure . . . . . . . . . . . . . . . . . . . . . . . . . . . . . . .25.09 503.1.4 Reading, maths, and science . . . . . . . . . . . . . . . . . . . . . . . . . . . . . . . . . . . .n/a n/a3.1.5 University ranking . . . . . . . . . . . . . . . . . . . . . . . . . . . . . . . . . . . . . . . . . . . . . 47.84 213.2 Lifelong Learning . . . . . . . . . . . . . . . . . . . . . . . . . . . . . . . . . . . . . . . . . . . 54.03 403.2.1 Quality of management schools . . . . . . . . . . . . . . . . . . . . . . . . . . . . . . 59.32 423.2.2 Prevalence of training in firms . . . . . . . . . . . . . . . . . . . . . . . . . . . . . . . . .42.88 383.2.3 Employee development . . . . . . . . . . . . . . . . . . . . . . . . . . . . . . . . . . . . . .59.90 303.3 Access to Growth Opportunities . . . . . . . . . . . . . . . . . . . . . . . . . . . 55.57 39
Empowerment3.3.1 Delegation of authority . . . . . . . . . . . . . . . . . . . . . . . . . . . . . . . . . . . . . . .59.28 353.3.2 Personal rights . . . . . . . . . . . . . . . . . . . . . . . . . . . . . . . . . . . . . . . . . . . . . . . . 70.93 73
Collaboration3.3.3 Use of virtual social networks . . . . . . . . . . . . . . . . . . . . . . . . . . . . . . . . .58.89 1043.3.4 Use of virtual professional networks . . . . . . . . . . . . . . . . . . . . . . . . . . . 9.85 623.3.5 Collaboration within organisations . . . . . . . . . . . . . . . . . . . . . . . . . . . .65.68 273.3.6 Collaboration across organisations . . . . . . . . . . . . . . . . . . . . . . . . . . . .68.81 14
4 RETAIN . . . . . . . . . . . . . . . . . . . . . . . . . . . . . . . . . . . . . . . . . . . .35.99 954.1 Sustainability . . . . . . . . . . . . . . . . . . . . . . . . . . . . . . . . . . . . . . . . . . . . . . .46.56 534.1.1 Pension system . . . . . . . . . . . . . . . . . . . . . . . . . . . . . . . . . . . . . . . . . . . . . . . 13.70 894.1.2 Social protection . . . . . . . . . . . . . . . . . . . . . . . . . . . . . . . . . . . . . . . . . . . . . .54.42 424.1.3 Brain retention . . . . . . . . . . . . . . . . . . . . . . . . . . . . . . . . . . . . . . . . . . . . . . . . 71.56 234.2 Lifestyle . . . . . . . . . . . . . . . . . . . . . . . . . . . . . . . . . . . . . . . . . . . . . . . . . . . . 25.41 1154.2.1 Environmental performance . . . . . . . . . . . . . . . . . . . . . . . . . . . . . . . . . . . 5.23 1284.2.2 Personal safety . . . . . . . . . . . . . . . . . . . . . . . . . . . . . . . . . . . . . . . . . . . . . . . .44.66 874.2.3 Physician density . . . . . . . . . . . . . . . . . . . . . . . . . . . . . . . . . . . . . . . . . . . . . . 11.85 924.2.4 Sanitation . . . . . . . . . . . . . . . . . . . . . . . . . . . . . . . . . . . . . . . . . . . . . . . . . . . . .39.90 111
5 VOCATIONAL AND TECHNICAL SKILLS . . . . . . . . . . . . 40.66 765.1 Mid-Level Skills . . . . . . . . . . . . . . . . . . . . . . . . . . . . . . . . . . . . . . . . . . . . . 14.39 1135.1.1 Workforce with secondary education . . . . . . . . . . . . . . . . . . . . . . . . .10.46 1155.1.2 Population with secondary education . . . . . . . . . . . . . . . . . . . . . . . .22.92 925.1.3 Technicians and associate professionals . . . . . . . . . . . . . . . . . . . . . . . 13.67 1065.1.4 Labour productivity per employee . . . . . . . . . . . . . . . . . . . . . . . . . . . .10.50 855.2 Employability . . . . . . . . . . . . . . . . . . . . . . . . . . . . . . . . . . . . . . . . . . . . . . . 66.92 285.2.1 Ease of finding skilled employees . . . . . . . . . . . . . . . . . . . . . . . . . . . . . 70.91 305.2.2 Relevance of education system to the economy . . . . . . . . . . . . . .68.66 185.2.3 Skills matching with secondary education . . . . . . . . . . . . . . . . . . . . 63.19 295.2.4 Skills matching with tertiary education . . . . . . . . . . . . . . . . . . . . . . . .64.93 38
6 GLOBAL KNOWLEDGE SKILLS . . . . . . . . . . . . . . . . . . . . . 29.15 576.1 High-Level Skills . . . . . . . . . . . . . . . . . . . . . . . . . . . . . . . . . . . . . . . . . . . . 26.13 756.1.1 Workforce with tertiary education . . . . . . . . . . . . . . . . . . . . . . . . . . . .14.28 946.1.2 Population with tertiary education . . . . . . . . . . . . . . . . . . . . . . . . . . . .14.46 796.1.3 Professionals . . . . . . . . . . . . . . . . . . . . . . . . . . . . . . . . . . . . . . . . . . . . . . . . . . . 8.91 1126.1.4 Researchers . . . . . . . . . . . . . . . . . . . . . . . . . . . . . . . . . . . . . . . . . . . . . . . . . . . . 2.50 786.1.5 Senior officials and managers . . . . . . . . . . . . . . . . . . . . . . . . . . . . . . . . .43.62 296.1.6 Availability of scientists and engineers . . . . . . . . . . . . . . . . . . . . . . . .72.98 196.2 Talent Impact . . . . . . . . . . . . . . . . . . . . . . . . . . . . . . . . . . . . . . . . . . . . . . . 32.18 456.2.1 Innovation output . . . . . . . . . . . . . . . . . . . . . . . . . . . . . . . . . . . . . . . . . . . .38.70 506.2.2 High-value exports . . . . . . . . . . . . . . . . . . . . . . . . . . . . . . . . . . . . . . . . . . . .20.87 586.2.3 New product entrepreneurial activity . . . . . . . . . . . . . . . . . . . . . . . . . 97.60 36.2.4 New business density . . . . . . . . . . . . . . . . . . . . . . . . . . . . . . . . . . . . . . . . . . 0.47 986.2.5 Scientific journal articles . . . . . . . . . . . . . . . . . . . . . . . . . . . . . . . . . . . . . . . 3.26 76
l India l Income group average

GTCI 2020 Country Profile by Pillar
180 THE GLOBAL TALENT COMPETITIVENESS INDEX 2020
COUNTRY PROFILESCOUNTRY PROFILES
102030405060708090100
Global knowledge skills
Vocational andtechnical skills
Retain
Grow
Attract
Enable
10203004
INDONESIAKey Indicators
Rank (out of 132) . . . . . . . . . . . . . . . . . . . . . . . . . . . . . . . . . . . . . . . 65Income group . . . . . . . . . . . . . . . . . . . . . . . . . . . Lower-middle incomeRegional group . . . . . . . Eastern, Southeastern Asia and OceaniaPopulation (millions) . . . . . . . . . . . . . . . . . . . . . . . . . . . . . . . . . . . 267.66
GDP per capita (PPP US$) . . . . . . . . . . . . . . . . . . . . . . . . . . . . 13,056.55GDP (US$ billions) . . . . . . . . . . . . . . . . . . . . . . . . . . . . . . . . . . . 1,042.17GTCI score . . . . . . . . . . . . . . . . . . . . . . . . . . . . . . . . . . . . . . . . . . . . . . 41.81GTCI score (income group average) . . . . . . . . . . . . . . . . . . . . . . . . 32.97
Score Rank
1 ENABLE . . . . . . . . . . . . . . . . . . . . . . . . . . . . . . . . . . . . . . . . . . .50.92 541.1 Regulatory Landscape . . . . . . . . . . . . . . . . . . . . . . . . . . . . . . . . . . . . . . 44.76 801.1.1 Government effectiveness . . . . . . . . . . . . . . . . . . . . . . . . . . . . . . . . . . . . 47.53 691.1.2 Rule of law . . . . . . . . . . . . . . . . . . . . . . . . . . . . . . . . . . . . . . . . . . . . . . . . . . . .44.57 851.1.3 Political stability . . . . . . . . . . . . . . . . . . . . . . . . . . . . . . . . . . . . . . . . . . . . . . .53.78 931.1.4 Regulatory quality. . . . . . . . . . . . . . . . . . . . . . . . . . . . . . . . . . . . . . . . . . . . .45.48 741.1.5 Corruption . . . . . . . . . . . . . . . . . . . . . . . . . . . . . . . . . . . . . . . . . . . . . . . . . . . . 32.43 731.2 Market Landscape . . . . . . . . . . . . . . . . . . . . . . . . . . . . . . . . . . . . . . . . . . 50.59 661.2.1 Competition intensity . . . . . . . . . . . . . . . . . . . . . . . . . . . . . . . . . . . . . . . . .76.50 361.2.2 Ease of doing business . . . . . . . . . . . . . . . . . . . . . . . . . . . . . . . . . . . . . . . .66.72 681.2.3 Cluster development . . . . . . . . . . . . . . . . . . . . . . . . . . . . . . . . . . . . . . . . . .66.44 261.2.4 R&D expenditure . . . . . . . . . . . . . . . . . . . . . . . . . . . . . . . . . . . . . . . . . . . . . . . 4.90 861.2.5 ICT infrastructure. . . . . . . . . . . . . . . . . . . . . . . . . . . . . . . . . . . . . . . . . . . . . .40.33 861.2.6 Urban population . . . . . . . . . . . . . . . . . . . . . . . . . . . . . . . . . . . . . . . . . . . . .48.63 881.3 Business and Labour Landscape . . . . . . . . . . . . . . . . . . . . . . . . . . . . 57.41 37
Labour Market1.3.1 Tertiary-educated unemployment . . . . . . . . . . . . . . . . . . . . . . . . . . . . 81.95 611.3.2 Active labour market policies . . . . . . . . . . . . . . . . . . . . . . . . . . . . . . . . .60.64 381.3.3 Labour-employer cooperation . . . . . . . . . . . . . . . . . . . . . . . . . . . . . . . . 47.21 49
Management Practice1.3.4 Professional management . . . . . . . . . . . . . . . . . . . . . . . . . . . . . . . . . . . . 59.72 401.3.5 Relationship of pay to productivity . . . . . . . . . . . . . . . . . . . . . . . . . . . . 71.76 17
Technology Adoption1.3.6 Technology utilisation. . . . . . . . . . . . . . . . . . . . . . . . . . . . . . . . . . . . . . . . .73.64 291.3.7 Investment in emerging technologies . . . . . . . . . . . . . . . . . . . . . . . .62.78 271.3.8 Robot density . . . . . . . . . . . . . . . . . . . . . . . . . . . . . . . . . . . . . . . . . . . . . . . . . . 1.56 46
2 ATTRACT . . . . . . . . . . . . . . . . . . . . . . . . . . . . . . . . . . . . . . . . . 46.39 782.1 External Openness . . . . . . . . . . . . . . . . . . . . . . . . . . . . . . . . . . . . . . . . . 38.29 82
Attract Business2.1.1 FDI and technology transfer . . . . . . . . . . . . . . . . . . . . . . . . . . . . . . . . . .66.69 442.1.2 Prevalence of foreign ownership . . . . . . . . . . . . . . . . . . . . . . . . . . . . . .58.61 64
Attract People2.1.3 Migrant stock . . . . . . . . . . . . . . . . . . . . . . . . . . . . . . . . . . . . . . . . . . . . . . . . . . 1.52 1302.1.4 International students . . . . . . . . . . . . . . . . . . . . . . . . . . . . . . . . . . . . . . . . . . 0.17 1102.1.5 Brain gain . . . . . . . . . . . . . . . . . . . . . . . . . . . . . . . . . . . . . . . . . . . . . . . . . . . . .64.48 272.2 Internal Openness . . . . . . . . . . . . . . . . . . . . . . . . . . . . . . . . . . . . . . . . . . 54.49 72
Social Inclusion2.2.1 Tolerance of minorities . . . . . . . . . . . . . . . . . . . . . . . . . . . . . . . . . . . . . . . .30.00 912.2.2 Tolerance of immigrants . . . . . . . . . . . . . . . . . . . . . . . . . . . . . . . . . . . . . .20.55 1182.2.3 Social mobility . . . . . . . . . . . . . . . . . . . . . . . . . . . . . . . . . . . . . . . . . . . . . . . . 67.13 38
Gender Equality2.2.4 Female graduates . . . . . . . . . . . . . . . . . . . . . . . . . . . . . . . . . . . . . . . . . . . . . 77.58 442.2.5 Gender development gap . . . . . . . . . . . . . . . . . . . . . . . . . . . . . . . . . . . .64.75 962.2.6 Leadership opportunities for women . . . . . . . . . . . . . . . . . . . . . . . . .66.94 27
Score Rank
3 GROW . . . . . . . . . . . . . . . . . . . . . . . . . . . . . . . . . . . . . . . . . . . . 44.03 483.1 Formal Education . . . . . . . . . . . . . . . . . . . . . . . . . . . . . . . . . . . . . . . . . . . 25.97 66
Enrolment3.1.1 Vocational enrolment . . . . . . . . . . . . . . . . . . . . . . . . . . . . . . . . . . . . . . . . . 29.74 383.1.2 Tertiary enrolment . . . . . . . . . . . . . . . . . . . . . . . . . . . . . . . . . . . . . . . . . . . .28.26 72
Quality3.1.3 Tertiary education expenditure . . . . . . . . . . . . . . . . . . . . . . . . . . . . . . . 11.39 933.1.4 Reading, maths, and science . . . . . . . . . . . . . . . . . . . . . . . . . . . . . . . . . .26.56 613.1.5 University ranking . . . . . . . . . . . . . . . . . . . . . . . . . . . . . . . . . . . . . . . . . . . . .33.87 343.2 Lifelong Learning . . . . . . . . . . . . . . . . . . . . . . . . . . . . . . . . . . . . . . . . . . . 43.15 673.2.1 Quality of management schools . . . . . . . . . . . . . . . . . . . . . . . . . . . . . . 59.42 413.2.2 Prevalence of training in firms . . . . . . . . . . . . . . . . . . . . . . . . . . . . . . . . . . 5.67 953.2.3 Employee development . . . . . . . . . . . . . . . . . . . . . . . . . . . . . . . . . . . . . .64.35 273.3 Access to Growth Opportunities . . . . . . . . . . . . . . . . . . . . . . . . . . . 62.98 26
Empowerment3.3.1 Delegation of authority . . . . . . . . . . . . . . . . . . . . . . . . . . . . . . . . . . . . . . .66.93 253.3.2 Personal rights . . . . . . . . . . . . . . . . . . . . . . . . . . . . . . . . . . . . . . . . . . . . . . . . 74.47 65
Collaboration3.3.3 Use of virtual social networks . . . . . . . . . . . . . . . . . . . . . . . . . . . . . . . . .83.36 383.3.4 Use of virtual professional networks . . . . . . . . . . . . . . . . . . . . . . . . . . . 6.31 743.3.5 Collaboration within organisations . . . . . . . . . . . . . . . . . . . . . . . . . . . . 71.27 243.3.6 Collaboration across organisations . . . . . . . . . . . . . . . . . . . . . . . . . . . .75.52 10
4 RETAIN . . . . . . . . . . . . . . . . . . . . . . . . . . . . . . . . . . . . . . . . . . . 43.04 814.1 Sustainability . . . . . . . . . . . . . . . . . . . . . . . . . . . . . . . . . . . . . . . . . . . . . . . 44.14 594.1.1 Pension system . . . . . . . . . . . . . . . . . . . . . . . . . . . . . . . . . . . . . . . . . . . . . . .10.50 954.1.2 Social protection . . . . . . . . . . . . . . . . . . . . . . . . . . . . . . . . . . . . . . . . . . . . . . 56.11 404.1.3 Brain retention . . . . . . . . . . . . . . . . . . . . . . . . . . . . . . . . . . . . . . . . . . . . . . . .65.81 274.2 Lifestyle . . . . . . . . . . . . . . . . . . . . . . . . . . . . . . . . . . . . . . . . . . . . . . . . . . . . 41.94 944.2.1 Environmental performance . . . . . . . . . . . . . . . . . . . . . . . . . . . . . . . . . .32.49 1064.2.2 Personal safety . . . . . . . . . . . . . . . . . . . . . . . . . . . . . . . . . . . . . . . . . . . . . . . .66.92 394.2.3 Physician density . . . . . . . . . . . . . . . . . . . . . . . . . . . . . . . . . . . . . . . . . . . . . . . 2.92 1064.2.4 Sanitation . . . . . . . . . . . . . . . . . . . . . . . . . . . . . . . . . . . . . . . . . . . . . . . . . . . . .65.44 95
5 VOCATIONAL AND TECHNICAL SKILLS . . . . . . . . . . . . . 47.01 555.1 Mid-Level Skills . . . . . . . . . . . . . . . . . . . . . . . . . . . . . . . . . . . . . . . . . . . . . 28.55 875.1.1 Workforce with secondary education . . . . . . . . . . . . . . . . . . . . . . . . . 39.41 755.1.2 Population with secondary education . . . . . . . . . . . . . . . . . . . . . . . .33.50 695.1.3 Technicians and associate professionals . . . . . . . . . . . . . . . . . . . . . . .25.70 785.1.4 Labour productivity per employee . . . . . . . . . . . . . . . . . . . . . . . . . . . .15.60 755.2 Employability . . . . . . . . . . . . . . . . . . . . . . . . . . . . . . . . . . . . . . . . . . . . . . . 65.46 305.2.1 Ease of finding skilled employees . . . . . . . . . . . . . . . . . . . . . . . . . . . . . 70.47 315.2.2 Relevance of education system to the economy . . . . . . . . . . . . . . 61.73 355.2.3 Skills matching with secondary education . . . . . . . . . . . . . . . . . . . . 57.22 355.2.4 Skills matching with tertiary education . . . . . . . . . . . . . . . . . . . . . . . .72.42 29
6 GLOBAL KNOWLEDGE SKILLS . . . . . . . . . . . . . . . . . . . . .19.47 846.1 High-Level Skills . . . . . . . . . . . . . . . . . . . . . . . . . . . . . . . . . . . . . . . . . . . . 24.71 826.1.1 Workforce with tertiary education . . . . . . . . . . . . . . . . . . . . . . . . . . . . 17.72 916.1.2 Population with tertiary education . . . . . . . . . . . . . . . . . . . . . . . . . . . . 13.65 836.1.3 Professionals . . . . . . . . . . . . . . . . . . . . . . . . . . . . . . . . . . . . . . . . . . . . . . . . . . . 2.40 1246.1.4 Researchers . . . . . . . . . . . . . . . . . . . . . . . . . . . . . . . . . . . . . . . . . . . . . . . . . . . . 2.49 796.1.5 Senior officials and managers . . . . . . . . . . . . . . . . . . . . . . . . . . . . . . . . .43.59 306.1.6 Availability of scientists and engineers . . . . . . . . . . . . . . . . . . . . . . . .68.42 286.2 Talent Impact . . . . . . . . . . . . . . . . . . . . . . . . . . . . . . . . . . . . . . . . . . . . . . . 14.24 916.2.1 Innovation output . . . . . . . . . . . . . . . . . . . . . . . . . . . . . . . . . . . . . . . . . . . .25.22 766.2.2 High-value exports . . . . . . . . . . . . . . . . . . . . . . . . . . . . . . . . . . . . . . . . . . . . 16.93 656.2.3 New product entrepreneurial activity . . . . . . . . . . . . . . . . . . . . . . . . .26.34 716.2.4 New business density . . . . . . . . . . . . . . . . . . . . . . . . . . . . . . . . . . . . . . . . . . 1.56 906.2.5 Scientific journal articles . . . . . . . . . . . . . . . . . . . . . . . . . . . . . . . . . . . . . . . 1.13 92
l Indonesia l Income group average
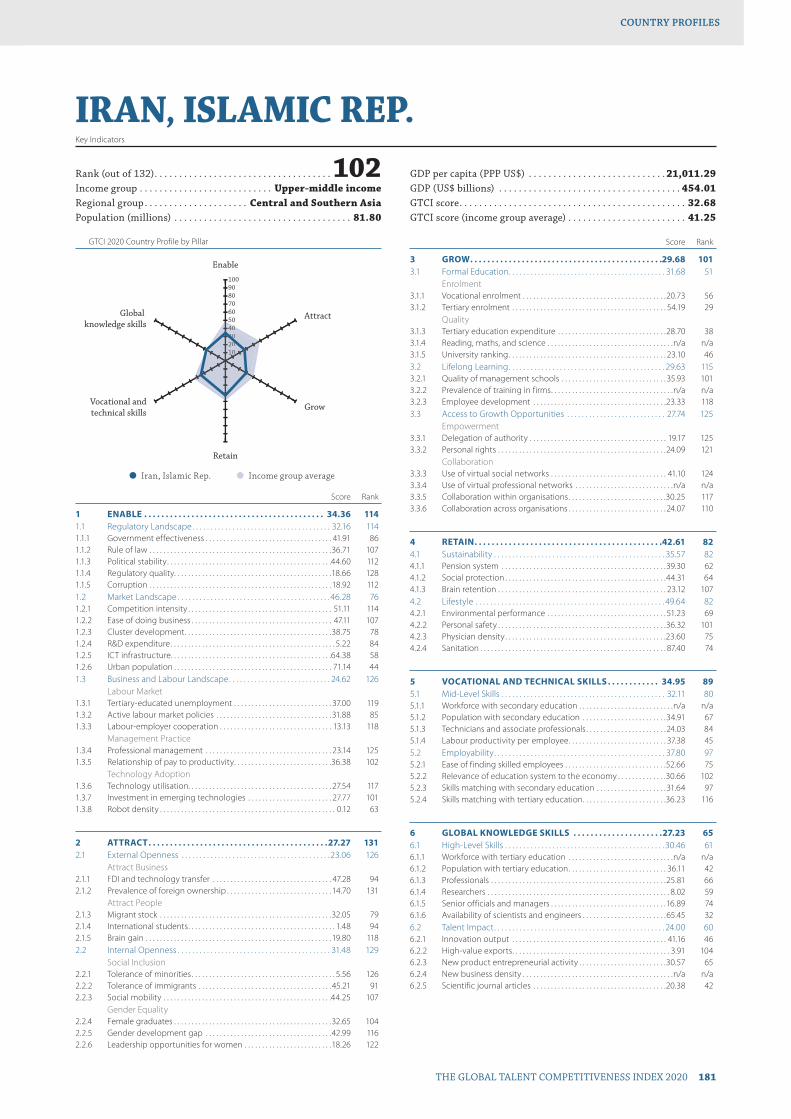
GTCI 2020 Country Profile by Pillar
THE GLOBAL TALENT COMPETITIVENESS INDEX 2020 181
COUNTRY PROFILESCOUNTRY PROFILES
102030405060708090100
Global knowledge skills
Vocational andtechnical skills
Retain
Grow
Attract
Enable
1020304040
IRAN, ISLAMIC REP.Key Indicators
Rank (out of 132) . . . . . . . . . . . . . . . . . . . . . . . . . . . . . . . . . . . . 102Income group . . . . . . . . . . . . . . . . . . . . . . . . . . . Upper-middle incomeRegional group . . . . . . . . . . . . . . . . . . . . . Central and Southern AsiaPopulation (millions) . . . . . . . . . . . . . . . . . . . . . . . . . . . . . . . . . . . . 81.80
GDP per capita (PPP US$) . . . . . . . . . . . . . . . . . . . . . . . . . . . . 21,011.29GDP (US$ billions) . . . . . . . . . . . . . . . . . . . . . . . . . . . . . . . . . . . . . 454.01GTCI score . . . . . . . . . . . . . . . . . . . . . . . . . . . . . . . . . . . . . . . . . . . . . . 32.68GTCI score (income group average) . . . . . . . . . . . . . . . . . . . . . . . . 41.25
Score Rank
1 ENABLE . . . . . . . . . . . . . . . . . . . . . . . . . . . . . . . . . . . . . . . . . . 34.36 1141.1 Regulatory Landscape . . . . . . . . . . . . . . . . . . . . . . . . . . . . . . . . . . . . . . 32.16 1141.1.1 Government effectiveness . . . . . . . . . . . . . . . . . . . . . . . . . . . . . . . . . . . . 41.91 861.1.2 Rule of law . . . . . . . . . . . . . . . . . . . . . . . . . . . . . . . . . . . . . . . . . . . . . . . . . . . .36.71 1071.1.3 Political stability . . . . . . . . . . . . . . . . . . . . . . . . . . . . . . . . . . . . . . . . . . . . . . .44.60 1121.1.4 Regulatory quality. . . . . . . . . . . . . . . . . . . . . . . . . . . . . . . . . . . . . . . . . . . . .18.66 1281.1.5 Corruption . . . . . . . . . . . . . . . . . . . . . . . . . . . . . . . . . . . . . . . . . . . . . . . . . . . . 18.92 1121.2 Market Landscape . . . . . . . . . . . . . . . . . . . . . . . . . . . . . . . . . . . . . . . . . .46.28 761.2.1 Competition intensity . . . . . . . . . . . . . . . . . . . . . . . . . . . . . . . . . . . . . . . . . 51.11 1141.2.2 Ease of doing business . . . . . . . . . . . . . . . . . . . . . . . . . . . . . . . . . . . . . . . . 47.11 1071.2.3 Cluster development . . . . . . . . . . . . . . . . . . . . . . . . . . . . . . . . . . . . . . . . . .38.75 781.2.4 R&D expenditure . . . . . . . . . . . . . . . . . . . . . . . . . . . . . . . . . . . . . . . . . . . . . . . 5.22 841.2.5 ICT infrastructure. . . . . . . . . . . . . . . . . . . . . . . . . . . . . . . . . . . . . . . . . . . . . .64.38 581.2.6 Urban population . . . . . . . . . . . . . . . . . . . . . . . . . . . . . . . . . . . . . . . . . . . . . 71.14 441.3 Business and Labour Landscape . . . . . . . . . . . . . . . . . . . . . . . . . . . . 24.62 126
Labour Market1.3.1 Tertiary-educated unemployment . . . . . . . . . . . . . . . . . . . . . . . . . . . . 37.00 1191.3.2 Active labour market policies . . . . . . . . . . . . . . . . . . . . . . . . . . . . . . . . . 31.88 851.3.3 Labour-employer cooperation . . . . . . . . . . . . . . . . . . . . . . . . . . . . . . . . 13.13 118
Management Practice1.3.4 Professional management . . . . . . . . . . . . . . . . . . . . . . . . . . . . . . . . . . . . 23.14 1251.3.5 Relationship of pay to productivity . . . . . . . . . . . . . . . . . . . . . . . . . . . .36.38 102
Technology Adoption1.3.6 Technology utilisation. . . . . . . . . . . . . . . . . . . . . . . . . . . . . . . . . . . . . . . . . 27.54 1171.3.7 Investment in emerging technologies . . . . . . . . . . . . . . . . . . . . . . . . 27.77 1011.3.8 Robot density . . . . . . . . . . . . . . . . . . . . . . . . . . . . . . . . . . . . . . . . . . . . . . . . . . 0.12 63
2 ATTRACT . . . . . . . . . . . . . . . . . . . . . . . . . . . . . . . . . . . . . . . . . .27.27 1312.1 External Openness . . . . . . . . . . . . . . . . . . . . . . . . . . . . . . . . . . . . . . . . . 23.06 126
Attract Business2.1.1 FDI and technology transfer . . . . . . . . . . . . . . . . . . . . . . . . . . . . . . . . . . 47.28 942.1.2 Prevalence of foreign ownership . . . . . . . . . . . . . . . . . . . . . . . . . . . . . . 14.70 131
Attract People2.1.3 Migrant stock . . . . . . . . . . . . . . . . . . . . . . . . . . . . . . . . . . . . . . . . . . . . . . . . .32.05 792.1.4 International students . . . . . . . . . . . . . . . . . . . . . . . . . . . . . . . . . . . . . . . . . . 1.48 942.1.5 Brain gain . . . . . . . . . . . . . . . . . . . . . . . . . . . . . . . . . . . . . . . . . . . . . . . . . . . . .19.80 1182.2 Internal Openness . . . . . . . . . . . . . . . . . . . . . . . . . . . . . . . . . . . . . . . . . . 31.48 129
Social Inclusion2.2.1 Tolerance of minorities . . . . . . . . . . . . . . . . . . . . . . . . . . . . . . . . . . . . . . . . . 5.56 1262.2.2 Tolerance of immigrants . . . . . . . . . . . . . . . . . . . . . . . . . . . . . . . . . . . . . . 45.21 912.2.3 Social mobility . . . . . . . . . . . . . . . . . . . . . . . . . . . . . . . . . . . . . . . . . . . . . . . .44.25 107
Gender Equality2.2.4 Female graduates . . . . . . . . . . . . . . . . . . . . . . . . . . . . . . . . . . . . . . . . . . . . .32.65 1042.2.5 Gender development gap . . . . . . . . . . . . . . . . . . . . . . . . . . . . . . . . . . . .42.99 1162.2.6 Leadership opportunities for women . . . . . . . . . . . . . . . . . . . . . . . . .18.26 122
Score Rank
3 GROW . . . . . . . . . . . . . . . . . . . . . . . . . . . . . . . . . . . . . . . . . . . . .29.68 1013.1 Formal Education . . . . . . . . . . . . . . . . . . . . . . . . . . . . . . . . . . . . . . . . . . . 31.68 51
Enrolment3.1.1 Vocational enrolment . . . . . . . . . . . . . . . . . . . . . . . . . . . . . . . . . . . . . . . . .20.73 563.1.2 Tertiary enrolment . . . . . . . . . . . . . . . . . . . . . . . . . . . . . . . . . . . . . . . . . . . . 54.19 29
Quality3.1.3 Tertiary education expenditure . . . . . . . . . . . . . . . . . . . . . . . . . . . . . . .28.70 383.1.4 Reading, maths, and science . . . . . . . . . . . . . . . . . . . . . . . . . . . . . . . . . . . .n/a n/a3.1.5 University ranking . . . . . . . . . . . . . . . . . . . . . . . . . . . . . . . . . . . . . . . . . . . . . 23.10 463.2 Lifelong Learning . . . . . . . . . . . . . . . . . . . . . . . . . . . . . . . . . . . . . . . . . . . 29.63 1153.2.1 Quality of management schools . . . . . . . . . . . . . . . . . . . . . . . . . . . . . . 35.93 1013.2.2 Prevalence of training in firms . . . . . . . . . . . . . . . . . . . . . . . . . . . . . . . . . . .n/a n/a3.2.3 Employee development . . . . . . . . . . . . . . . . . . . . . . . . . . . . . . . . . . . . . .23.33 1183.3 Access to Growth Opportunities . . . . . . . . . . . . . . . . . . . . . . . . . . . 27.74 125
Empowerment3.3.1 Delegation of authority . . . . . . . . . . . . . . . . . . . . . . . . . . . . . . . . . . . . . . . 19.17 1253.3.2 Personal rights . . . . . . . . . . . . . . . . . . . . . . . . . . . . . . . . . . . . . . . . . . . . . . . .24.09 121
Collaboration3.3.3 Use of virtual social networks . . . . . . . . . . . . . . . . . . . . . . . . . . . . . . . . . 41.10 1243.3.4 Use of virtual professional networks . . . . . . . . . . . . . . . . . . . . . . . . . . . .n/a n/a3.3.5 Collaboration within organisations . . . . . . . . . . . . . . . . . . . . . . . . . . . .30.25 1173.3.6 Collaboration across organisations . . . . . . . . . . . . . . . . . . . . . . . . . . . . 24.07 110
4 RETAIN . . . . . . . . . . . . . . . . . . . . . . . . . . . . . . . . . . . . . . . . . . . .42.61 824.1 Sustainability . . . . . . . . . . . . . . . . . . . . . . . . . . . . . . . . . . . . . . . . . . . . . . . 35.57 824.1.1 Pension system . . . . . . . . . . . . . . . . . . . . . . . . . . . . . . . . . . . . . . . . . . . . . . .39.30 624.1.2 Social protection . . . . . . . . . . . . . . . . . . . . . . . . . . . . . . . . . . . . . . . . . . . . . .44.31 644.1.3 Brain retention . . . . . . . . . . . . . . . . . . . . . . . . . . . . . . . . . . . . . . . . . . . . . . . . 23.12 1074.2 Lifestyle . . . . . . . . . . . . . . . . . . . . . . . . . . . . . . . . . . . . . . . . . . . . . . . . . . . . 49.64 824.2.1 Environmental performance . . . . . . . . . . . . . . . . . . . . . . . . . . . . . . . . . . 51.23 694.2.2 Personal safety . . . . . . . . . . . . . . . . . . . . . . . . . . . . . . . . . . . . . . . . . . . . . . . .36.32 1014.2.3 Physician density . . . . . . . . . . . . . . . . . . . . . . . . . . . . . . . . . . . . . . . . . . . . . .23.60 754.2.4 Sanitation . . . . . . . . . . . . . . . . . . . . . . . . . . . . . . . . . . . . . . . . . . . . . . . . . . . . . 87.40 74
5 VOCATIONAL AND TECHNICAL SKILLS . . . . . . . . . . . . 34.95 895.1 Mid-Level Skills . . . . . . . . . . . . . . . . . . . . . . . . . . . . . . . . . . . . . . . . . . . . . 32.11 805.1.1 Workforce with secondary education . . . . . . . . . . . . . . . . . . . . . . . . . . .n/a n/a5.1.2 Population with secondary education . . . . . . . . . . . . . . . . . . . . . . . .34.91 675.1.3 Technicians and associate professionals . . . . . . . . . . . . . . . . . . . . . . .24.03 845.1.4 Labour productivity per employee . . . . . . . . . . . . . . . . . . . . . . . . . . . . 37.38 455.2 Employability . . . . . . . . . . . . . . . . . . . . . . . . . . . . . . . . . . . . . . . . . . . . . . . 37.80 975.2.1 Ease of finding skilled employees . . . . . . . . . . . . . . . . . . . . . . . . . . . . .52.66 755.2.2 Relevance of education system to the economy . . . . . . . . . . . . . .30.66 1025.2.3 Skills matching with secondary education . . . . . . . . . . . . . . . . . . . . 31.64 975.2.4 Skills matching with tertiary education . . . . . . . . . . . . . . . . . . . . . . . .36.23 116
6 GLOBAL KNOWLEDGE SKILLS . . . . . . . . . . . . . . . . . . . . .27.23 656.1 High-Level Skills . . . . . . . . . . . . . . . . . . . . . . . . . . . . . . . . . . . . . . . . . . . . 30.46 616.1.1 Workforce with tertiary education . . . . . . . . . . . . . . . . . . . . . . . . . . . . . .n/a n/a6.1.2 Population with tertiary education . . . . . . . . . . . . . . . . . . . . . . . . . . . . 36.11 426.1.3 Professionals . . . . . . . . . . . . . . . . . . . . . . . . . . . . . . . . . . . . . . . . . . . . . . . . . .25.81 666.1.4 Researchers . . . . . . . . . . . . . . . . . . . . . . . . . . . . . . . . . . . . . . . . . . . . . . . . . . . . 8.02 596.1.5 Senior officials and managers . . . . . . . . . . . . . . . . . . . . . . . . . . . . . . . . .16.89 746.1.6 Availability of scientists and engineers . . . . . . . . . . . . . . . . . . . . . . . .65.45 326.2 Talent Impact . . . . . . . . . . . . . . . . . . . . . . . . . . . . . . . . . . . . . . . . . . . . . . . 24.00 606.2.1 Innovation output . . . . . . . . . . . . . . . . . . . . . . . . . . . . . . . . . . . . . . . . . . . . 41.16 466.2.2 High-value exports . . . . . . . . . . . . . . . . . . . . . . . . . . . . . . . . . . . . . . . . . . . . . 3.91 1046.2.3 New product entrepreneurial activity . . . . . . . . . . . . . . . . . . . . . . . . .30.57 656.2.4 New business density . . . . . . . . . . . . . . . . . . . . . . . . . . . . . . . . . . . . . . . . . . .n/a n/a6.2.5 Scientific journal articles . . . . . . . . . . . . . . . . . . . . . . . . . . . . . . . . . . . . . .20.38 42
l Iran, Islamic Rep. l Income group average

GTCI 2020 Country Profile by Pillar
182 THE GLOBAL TALENT COMPETITIVENESS INDEX 2020
COUNTRY PROFILESCOUNTRY PROFILES
102030405060708090100
Global knowledge skills
Vocational andtechnical skills
Retain
Grow
Attract
Enable
102030405060607
IRELANDKey Indicators
Rank (out of 132) . . . . . . . . . . . . . . . . . . . . . . . . . . . . . . . . . . . . . . . 15Income group . . . . . . . . . . . . . . . . . . . . . . . . . . . . . . . . . . . . High incomeRegional group . . . . . . . . . . . . . . . . . . . . . . . . . . . . . . . . . . . . . . . . .EuropePopulation (millions) . . . . . . . . . . . . . . . . . . . . . . . . . . . . . . . . . . . . . 4.85
GDP per capita (PPP US$) . . . . . . . . . . . . . . . . . . . . . . . . . . . .84,069.44GDP (US$ billions) . . . . . . . . . . . . . . . . . . . . . . . . . . . . . . . . . . . . . 375.90GTCI score . . . . . . . . . . . . . . . . . . . . . . . . . . . . . . . . . . . . . . . . . . . . . . 70.45GTCI score (income group average) . . . . . . . . . . . . . . . . . . . . . . . . 61.46
Score Rank
1 ENABLE . . . . . . . . . . . . . . . . . . . . . . . . . . . . . . . . . . . . . . . . . . 72.77 211.1 Regulatory Landscape . . . . . . . . . . . . . . . . . . . . . . . . . . . . . . . . . . . . . . 83.59 171.1.1 Government effectiveness . . . . . . . . . . . . . . . . . . . . . . . . . . . . . . . . . . . .77.84 221.1.2 Rule of law . . . . . . . . . . . . . . . . . . . . . . . . . . . . . . . . . . . . . . . . . . . . . . . . . . . .86.01 191.1.3 Political stability . . . . . . . . . . . . . . . . . . . . . . . . . . . . . . . . . . . . . . . . . . . . . . . 87.37 171.1.4 Regulatory quality. . . . . . . . . . . . . . . . . . . . . . . . . . . . . . . . . . . . . . . . . . . . .86.99 161.1.5 Corruption . . . . . . . . . . . . . . . . . . . . . . . . . . . . . . . . . . . . . . . . . . . . . . . . . . . .79.73 171.2 Market Landscape . . . . . . . . . . . . . . . . . . . . . . . . . . . . . . . . . . . . . . . . . . 64.45 301.2.1 Competition intensity . . . . . . . . . . . . . . . . . . . . . . . . . . . . . . . . . . . . . . . . . 70.19 631.2.2 Ease of doing business . . . . . . . . . . . . . . . . . . . . . . . . . . . . . . . . . . . . . . . .86.28 211.2.3 Cluster development . . . . . . . . . . . . . . . . . . . . . . . . . . . . . . . . . . . . . . . . . . 67.83 221.2.4 R&D expenditure . . . . . . . . . . . . . . . . . . . . . . . . . . . . . . . . . . . . . . . . . . . . . .22.56 341.2.5 ICT infrastructure. . . . . . . . . . . . . . . . . . . . . . . . . . . . . . . . . . . . . . . . . . . . . . 82.19 201.2.6 Urban population . . . . . . . . . . . . . . . . . . . . . . . . . . . . . . . . . . . . . . . . . . . . . 57.65 681.3 Business and Labour Landscape . . . . . . . . . . . . . . . . . . . . . . . . . . . . 70.26 20
Labour Market1.3.1 Tertiary-educated unemployment . . . . . . . . . . . . . . . . . . . . . . . . . . . . 87.53 391.3.2 Active labour market policies . . . . . . . . . . . . . . . . . . . . . . . . . . . . . . . . . 77.12 151.3.3 Labour-employer cooperation . . . . . . . . . . . . . . . . . . . . . . . . . . . . . . . . 66.15 20
Management Practice1.3.4 Professional management . . . . . . . . . . . . . . . . . . . . . . . . . . . . . . . . . . . . 93.42 81.3.5 Relationship of pay to productivity . . . . . . . . . . . . . . . . . . . . . . . . . . . .76.05 11
Technology Adoption1.3.6 Technology utilisation. . . . . . . . . . . . . . . . . . . . . . . . . . . . . . . . . . . . . . . . . 79.12 171.3.7 Investment in emerging technologies . . . . . . . . . . . . . . . . . . . . . . . .70.53 171.3.8 Robot density . . . . . . . . . . . . . . . . . . . . . . . . . . . . . . . . . . . . . . . . . . . . . . . . . 12.16 31
2 ATTRACT . . . . . . . . . . . . . . . . . . . . . . . . . . . . . . . . . . . . . . . . . .75.71 92.1 External Openness . . . . . . . . . . . . . . . . . . . . . . . . . . . . . . . . . . . . . . . . . 71.88 9
Attract Business2.1.1 FDI and technology transfer . . . . . . . . . . . . . . . . . . . . . . . . . . . . . . . . 100.00 12.1.2 Prevalence of foreign ownership . . . . . . . . . . . . . . . . . . . . . . . . . . . . . . 87.52 7
Attract People2.1.3 Migrant stock . . . . . . . . . . . . . . . . . . . . . . . . . . . . . . . . . . . . . . . . . . . . . . . . .66.23 202.1.4 International students . . . . . . . . . . . . . . . . . . . . . . . . . . . . . . . . . . . . . . . . .30.00 232.1.5 Brain gain . . . . . . . . . . . . . . . . . . . . . . . . . . . . . . . . . . . . . . . . . . . . . . . . . . . . .75.67 142.2 Internal Openness . . . . . . . . . . . . . . . . . . . . . . . . . . . . . . . . . . . . . . . . . . 79.53 13
Social Inclusion2.2.1 Tolerance of minorities . . . . . . . . . . . . . . . . . . . . . . . . . . . . . . . . . . . . . . 100.00 12.2.2 Tolerance of immigrants . . . . . . . . . . . . . . . . . . . . . . . . . . . . . . . . . . . . . . 91.78 82.2.3 Social mobility . . . . . . . . . . . . . . . . . . . . . . . . . . . . . . . . . . . . . . . . . . . . . . . .82.07 17
Gender Equality2.2.4 Female graduates . . . . . . . . . . . . . . . . . . . . . . . . . . . . . . . . . . . . . . . . . . . . .59.85 822.2.5 Gender development gap . . . . . . . . . . . . . . . . . . . . . . . . . . . . . . . . . . . . 81.59 472.2.6 Leadership opportunities for women . . . . . . . . . . . . . . . . . . . . . . . . . 61.92 37
Score Rank
3 GROW . . . . . . . . . . . . . . . . . . . . . . . . . . . . . . . . . . . . . . . . . . . . .65.72 143.1 Formal Education . . . . . . . . . . . . . . . . . . . . . . . . . . . . . . . . . . . . . . . . . . . 46.65 24
Enrolment3.1.1 Vocational enrolment . . . . . . . . . . . . . . . . . . . . . . . . . . . . . . . . . . . . . . . . .24.98 463.1.2 Tertiary enrolment . . . . . . . . . . . . . . . . . . . . . . . . . . . . . . . . . . . . . . . . . . . . 61.13 20
Quality3.1.3 Tertiary education expenditure . . . . . . . . . . . . . . . . . . . . . . . . . . . . . . . 19.49 673.1.4 Reading, maths, and science . . . . . . . . . . . . . . . . . . . . . . . . . . . . . . . . . . 79.97 93.1.5 University ranking . . . . . . . . . . . . . . . . . . . . . . . . . . . . . . . . . . . . . . . . . . . . . 47.67 223.2 Lifelong Learning . . . . . . . . . . . . . . . . . . . . . . . . . . . . . . . . . . . . . . . . . . . 76.40 123.2.1 Quality of management schools . . . . . . . . . . . . . . . . . . . . . . . . . . . . . .78.75 123.2.2 Prevalence of training in firms . . . . . . . . . . . . . . . . . . . . . . . . . . . . . . . . . . .n/a n/a3.2.3 Employee development . . . . . . . . . . . . . . . . . . . . . . . . . . . . . . . . . . . . . .74.04 143.3 Access to Growth Opportunities . . . . . . . . . . . . . . . . . . . . . . . . . . . 74.13 18
Empowerment3.3.1 Delegation of authority . . . . . . . . . . . . . . . . . . . . . . . . . . . . . . . . . . . . . . .85.02 113.3.2 Personal rights . . . . . . . . . . . . . . . . . . . . . . . . . . . . . . . . . . . . . . . . . . . . . . . .94.97 23
Collaboration3.3.3 Use of virtual social networks . . . . . . . . . . . . . . . . . . . . . . . . . . . . . . . . . 87.99 203.3.4 Use of virtual professional networks . . . . . . . . . . . . . . . . . . . . . . . . . .38.67 153.3.5 Collaboration within organisations . . . . . . . . . . . . . . . . . . . . . . . . . . . . 76.74 193.3.6 Collaboration across organisations . . . . . . . . . . . . . . . . . . . . . . . . . . . . 61.37 23
4 RETAIN . . . . . . . . . . . . . . . . . . . . . . . . . . . . . . . . . . . . . . . . . . . .79.67 134.1 Sustainability . . . . . . . . . . . . . . . . . . . . . . . . . . . . . . . . . . . . . . . . . . . . . . . 81.97 124.1.1 Pension system . . . . . . . . . . . . . . . . . . . . . . . . . . . . . . . . . . . . . . . . . . . . . 100.00 14.1.2 Social protection . . . . . . . . . . . . . . . . . . . . . . . . . . . . . . . . . . . . . . . . . . . . . .73.64 234.1.3 Brain retention . . . . . . . . . . . . . . . . . . . . . . . . . . . . . . . . . . . . . . . . . . . . . . . .72.27 194.2 Lifestyle . . . . . . . . . . . . . . . . . . . . . . . . . . . . . . . . . . . . . . . . . . . . . . . . . . . . 77.36 204.2.1 Environmental performance . . . . . . . . . . . . . . . . . . . . . . . . . . . . . . . . . .85.58 94.2.2 Personal safety . . . . . . . . . . . . . . . . . . . . . . . . . . . . . . . . . . . . . . . . . . . . . . . . 85.11 174.2.3 Physician density . . . . . . . . . . . . . . . . . . . . . . . . . . . . . . . . . . . . . . . . . . . . . . 47.18 384.2.4 Sanitation . . . . . . . . . . . . . . . . . . . . . . . . . . . . . . . . . . . . . . . . . . . . . . . . . . . . . 91.58 65
5 VOCATIONAL AND TECHNICAL SKILLS . . . . . . . . . . . . .69.07 115.1 Mid-Level Skills . . . . . . . . . . . . . . . . . . . . . . . . . . . . . . . . . . . . . . . . . . . . . 58.29 285.1.1 Workforce with secondary education . . . . . . . . . . . . . . . . . . . . . . . . .50.26 595.1.2 Population with secondary education . . . . . . . . . . . . . . . . . . . . . . . .44.49 565.1.3 Technicians and associate professionals . . . . . . . . . . . . . . . . . . . . . . . 49.37 435.1.4 Labour productivity per employee . . . . . . . . . . . . . . . . . . . . . . . . . . . .89.06 35.2 Employability . . . . . . . . . . . . . . . . . . . . . . . . . . . . . . . . . . . . . . . . . . . . . . . 79.85 85.2.1 Ease of finding skilled employees . . . . . . . . . . . . . . . . . . . . . . . . . . . . .80.65 125.2.2 Relevance of education system to the economy . . . . . . . . . . . . . .85.63 55.2.3 Skills matching with secondary education . . . . . . . . . . . . . . . . . . . . 68.10 195.2.4 Skills matching with tertiary education . . . . . . . . . . . . . . . . . . . . . . . .85.03 6
6 GLOBAL KNOWLEDGE SKILLS . . . . . . . . . . . . . . . . . . . . .59.73 126.1 High-Level Skills . . . . . . . . . . . . . . . . . . . . . . . . . . . . . . . . . . . . . . . . . . . . 60.40 136.1.1 Workforce with tertiary education . . . . . . . . . . . . . . . . . . . . . . . . . . . .70.77 76.1.2 Population with tertiary education . . . . . . . . . . . . . . . . . . . . . . . . . . . .58.45 136.1.3 Professionals . . . . . . . . . . . . . . . . . . . . . . . . . . . . . . . . . . . . . . . . . . . . . . . . . . 61.37 146.1.4 Researchers . . . . . . . . . . . . . . . . . . . . . . . . . . . . . . . . . . . . . . . . . . . . . . . . . . .49.72 236.1.5 Senior officials and managers . . . . . . . . . . . . . . . . . . . . . . . . . . . . . . . . . 53.10 226.1.6 Availability of scientists and engineers . . . . . . . . . . . . . . . . . . . . . . . .69.00 266.2 Talent Impact . . . . . . . . . . . . . . . . . . . . . . . . . . . . . . . . . . . . . . . . . . . . . . . 59.06 116.2.1 Innovation output . . . . . . . . . . . . . . . . . . . . . . . . . . . . . . . . . . . . . . . . . . . .76.53 106.2.2 High-value exports . . . . . . . . . . . . . . . . . . . . . . . . . . . . . . . . . . . . . . . . . . . . 57.09 136.2.3 New product entrepreneurial activity . . . . . . . . . . . . . . . . . . . . . . . . .72.44 116.2.4 New business density . . . . . . . . . . . . . . . . . . . . . . . . . . . . . . . . . . . . . . . . . 32.31 206.2.5 Scientific journal articles . . . . . . . . . . . . . . . . . . . . . . . . . . . . . . . . . . . . . .56.94 16
l Ireland l Income group average

GTCI 2020 Country Profile by Pillar
THE GLOBAL TALENT COMPETITIVENESS INDEX 2020 183
COUNTRY PROFILESCOUNTRY PROFILES
102030405060708090100
Global knowledge skills
Vocational andtechnical skills
Retain
Grow
Attract
Enable
102030405060607
ISRAELKey Indicators
Rank (out of 132) . . . . . . . . . . . . . . . . . . . . . . . . . . . . . . . . . . . . . . . 20Income group . . . . . . . . . . . . . . . . . . . . . . . . . . . . . . . . . . . . High incomeRegional group . . . . . . . . . . . . . .Northern Africa and Western AsiaPopulation (millions) . . . . . . . . . . . . . . . . . . . . . . . . . . . . . . . . . . . . . 8.88
GDP per capita (PPP US$) . . . . . . . . . . . . . . . . . . . . . . . . . . . . 40,786.28GDP (US$ billions) . . . . . . . . . . . . . . . . . . . . . . . . . . . . . . . . . . . . . 369.69GTCI score . . . . . . . . . . . . . . . . . . . . . . . . . . . . . . . . . . . . . . . . . . . . . . 65.66GTCI score (income group average) . . . . . . . . . . . . . . . . . . . . . . . . 61.46
Score Rank
1 ENABLE . . . . . . . . . . . . . . . . . . . . . . . . . . . . . . . . . . . . . . . . . . .74.62 191.1 Regulatory Landscape . . . . . . . . . . . . . . . . . . . . . . . . . . . . . . . . . . . . . . 69.04 361.1.1 Government effectiveness . . . . . . . . . . . . . . . . . . . . . . . . . . . . . . . . . . . . 80.13 191.1.2 Rule of law . . . . . . . . . . . . . . . . . . . . . . . . . . . . . . . . . . . . . . . . . . . . . . . . . . . .76.52 271.1.3 Political stability . . . . . . . . . . . . . . . . . . . . . . . . . . . . . . . . . . . . . . . . . . . . . . . 45.71 1101.1.4 Regulatory quality. . . . . . . . . . . . . . . . . . . . . . . . . . . . . . . . . . . . . . . . . . . . .79.30 221.1.5 Corruption . . . . . . . . . . . . . . . . . . . . . . . . . . . . . . . . . . . . . . . . . . . . . . . . . . . .63.51 291.2 Market Landscape . . . . . . . . . . . . . . . . . . . . . . . . . . . . . . . . . . . . . . . . . . 82.34 61.2.1 Competition intensity . . . . . . . . . . . . . . . . . . . . . . . . . . . . . . . . . . . . . . . . . 80.18 221.2.2 Ease of doing business . . . . . . . . . . . . . . . . . . . . . . . . . . . . . . . . . . . . . . . . 76.13 451.2.3 Cluster development . . . . . . . . . . . . . . . . . . . . . . . . . . . . . . . . . . . . . . . . . .63.87 291.2.4 R&D expenditure . . . . . . . . . . . . . . . . . . . . . . . . . . . . . . . . . . . . . . . . . . . . 100.00 11.2.5 ICT infrastructure. . . . . . . . . . . . . . . . . . . . . . . . . . . . . . . . . . . . . . . . . . . . . .82.57 171.2.6 Urban population . . . . . . . . . . . . . . . . . . . . . . . . . . . . . . . . . . . . . . . . . . . . . 91.28 81.3 Business and Labour Landscape . . . . . . . . . . . . . . . . . . . . . . . . . . . . 72.49 15
Labour Market1.3.1 Tertiary-educated unemployment . . . . . . . . . . . . . . . . . . . . . . . . . . . .90.47 231.3.2 Active labour market policies . . . . . . . . . . . . . . . . . . . . . . . . . . . . . . . . .68.30 311.3.3 Labour-employer cooperation . . . . . . . . . . . . . . . . . . . . . . . . . . . . . . . .64.00 25
Management Practice1.3.4 Professional management . . . . . . . . . . . . . . . . . . . . . . . . . . . . . . . . . . . . 81.97 181.3.5 Relationship of pay to productivity . . . . . . . . . . . . . . . . . . . . . . . . . . . .69.64 21
Technology Adoption1.3.6 Technology utilisation. . . . . . . . . . . . . . . . . . . . . . . . . . . . . . . . . . . . . . . . .95.65 51.3.7 Investment in emerging technologies . . . . . . . . . . . . . . . . . . . . . . . .96.21 21.3.8 Robot density . . . . . . . . . . . . . . . . . . . . . . . . . . . . . . . . . . . . . . . . . . . . . . . . . 13.65 29
2 ATTRACT . . . . . . . . . . . . . . . . . . . . . . . . . . . . . . . . . . . . . . . . . 54.38 482.1 External Openness . . . . . . . . . . . . . . . . . . . . . . . . . . . . . . . . . . . . . . . . . 62.36 23
Attract Business2.1.1 FDI and technology transfer . . . . . . . . . . . . . . . . . . . . . . . . . . . . . . . . . .88.72 52.1.2 Prevalence of foreign ownership . . . . . . . . . . . . . . . . . . . . . . . . . . . . . .75.26 29
Attract People2.1.3 Migrant stock . . . . . . . . . . . . . . . . . . . . . . . . . . . . . . . . . . . . . . . . . . . . . . . . .79.05 102.1.4 International students . . . . . . . . . . . . . . . . . . . . . . . . . . . . . . . . . . . . . . . . . 10.11 622.1.5 Brain gain . . . . . . . . . . . . . . . . . . . . . . . . . . . . . . . . . . . . . . . . . . . . . . . . . . . . .58.67 322.2 Internal Openness . . . . . . . . . . . . . . . . . . . . . . . . . . . . . . . . . . . . . . . . . .46.40 105
Social Inclusion2.2.1 Tolerance of minorities . . . . . . . . . . . . . . . . . . . . . . . . . . . . . . . . . . . . . . . . . 0.00 1302.2.2 Tolerance of immigrants . . . . . . . . . . . . . . . . . . . . . . . . . . . . . . . . . . . . . .20.55 1182.2.3 Social mobility . . . . . . . . . . . . . . . . . . . . . . . . . . . . . . . . . . . . . . . . . . . . . . . . 75.92 26
Gender Equality2.2.4 Female graduates . . . . . . . . . . . . . . . . . . . . . . . . . . . . . . . . . . . . . . . . . . . . . . .n/a n/a2.2.5 Gender development gap . . . . . . . . . . . . . . . . . . . . . . . . . . . . . . . . . . . .79.83 572.2.6 Leadership opportunities for women . . . . . . . . . . . . . . . . . . . . . . . . .55.72 49
Score Rank
3 GROW . . . . . . . . . . . . . . . . . . . . . . . . . . . . . . . . . . . . . . . . . . . . .57.56 213.1 Formal Education . . . . . . . . . . . . . . . . . . . . . . . . . . . . . . . . . . . . . . . . . . . 41.28 36
Enrolment3.1.1 Vocational enrolment . . . . . . . . . . . . . . . . . . . . . . . . . . . . . . . . . . . . . . . . .30.46 373.1.2 Tertiary enrolment . . . . . . . . . . . . . . . . . . . . . . . . . . . . . . . . . . . . . . . . . . . .49.26 41
Quality3.1.3 Tertiary education expenditure . . . . . . . . . . . . . . . . . . . . . . . . . . . . . . . 21.42 623.1.4 Reading, maths, and science . . . . . . . . . . . . . . . . . . . . . . . . . . . . . . . . . .62.42 363.1.5 University ranking . . . . . . . . . . . . . . . . . . . . . . . . . . . . . . . . . . . . . . . . . . . . .42.83 283.2 Lifelong Learning . . . . . . . . . . . . . . . . . . . . . . . . . . . . . . . . . . . . . . . . . . . 54.91 383.2.1 Quality of management schools . . . . . . . . . . . . . . . . . . . . . . . . . . . . . . 77.19 143.2.2 Prevalence of training in firms . . . . . . . . . . . . . . . . . . . . . . . . . . . . . . . . .20.05 803.2.3 Employee development . . . . . . . . . . . . . . . . . . . . . . . . . . . . . . . . . . . . . . 67.48 213.3 Access to Growth Opportunities . . . . . . . . . . . . . . . . . . . . . . . . . . . 76.48 13
Empowerment3.3.1 Delegation of authority . . . . . . . . . . . . . . . . . . . . . . . . . . . . . . . . . . . . . . .76.30 203.3.2 Personal rights . . . . . . . . . . . . . . . . . . . . . . . . . . . . . . . . . . . . . . . . . . . . . . . . 83.11 48
Collaboration3.3.3 Use of virtual social networks . . . . . . . . . . . . . . . . . . . . . . . . . . . . . . . . .99.07 23.3.4 Use of virtual professional networks . . . . . . . . . . . . . . . . . . . . . . . . . .22.91 283.3.5 Collaboration within organisations . . . . . . . . . . . . . . . . . . . . . . . . . . . . 93.92 33.3.6 Collaboration across organisations . . . . . . . . . . . . . . . . . . . . . . . . . . . .83.58 4
4 RETAIN . . . . . . . . . . . . . . . . . . . . . . . . . . . . . . . . . . . . . . . . . . . .77.07 214.1 Sustainability . . . . . . . . . . . . . . . . . . . . . . . . . . . . . . . . . . . . . . . . . . . . . . . 77.51 184.1.1 Pension system . . . . . . . . . . . . . . . . . . . . . . . . . . . . . . . . . . . . . . . . . . . . . 100.00 14.1.2 Social protection . . . . . . . . . . . . . . . . . . . . . . . . . . . . . . . . . . . . . . . . . . . . . .60.72 364.1.3 Brain retention . . . . . . . . . . . . . . . . . . . . . . . . . . . . . . . . . . . . . . . . . . . . . . . .71.80 224.2 Lifestyle . . . . . . . . . . . . . . . . . . . . . . . . . . . . . . . . . . . . . . . . . . . . . . . . . . . . 76.63 234.2.1 Environmental performance . . . . . . . . . . . . . . . . . . . . . . . . . . . . . . . . . . 79.31 194.2.2 Personal safety . . . . . . . . . . . . . . . . . . . . . . . . . . . . . . . . . . . . . . . . . . . . . . . . 70.18 354.2.3 Physician density . . . . . . . . . . . . . . . . . . . . . . . . . . . . . . . . . . . . . . . . . . . . . . 57.04 204.2.4 Sanitation . . . . . . . . . . . . . . . . . . . . . . . . . . . . . . . . . . . . . . . . . . . . . . . . . . . 100.00 1
5 VOCATIONAL AND TECHNICAL SKILLS . . . . . . . . . . . . .67.95 125.1 Mid-Level Skills . . . . . . . . . . . . . . . . . . . . . . . . . . . . . . . . . . . . . . . . . . . . . 56.23 325.1.1 Workforce with secondary education . . . . . . . . . . . . . . . . . . . . . . . . . 74.90 225.1.2 Population with secondary education . . . . . . . . . . . . . . . . . . . . . . . . 47.83 515.1.3 Technicians and associate professionals . . . . . . . . . . . . . . . . . . . . . . . 55.91 325.1.4 Labour productivity per employee . . . . . . . . . . . . . . . . . . . . . . . . . . . .46.30 315.2 Employability . . . . . . . . . . . . . . . . . . . . . . . . . . . . . . . . . . . . . . . . . . . . . . . 79.67 95.2.1 Ease of finding skilled employees . . . . . . . . . . . . . . . . . . . . . . . . . . . . .92.36 25.2.2 Relevance of education system to the economy . . . . . . . . . . . . . .64.76 255.2.3 Skills matching with secondary education . . . . . . . . . . . . . . . . . . . . 73.17 105.2.4 Skills matching with tertiary education . . . . . . . . . . . . . . . . . . . . . . . .88.40 3
6 GLOBAL KNOWLEDGE SKILLS . . . . . . . . . . . . . . . . . . . . 62.40 86.1 High-Level Skills . . . . . . . . . . . . . . . . . . . . . . . . . . . . . . . . . . . . . . . . . . . . 73.20 26.1.1 Workforce with tertiary education . . . . . . . . . . . . . . . . . . . . . . . . . . . . 51.98 306.1.2 Population with tertiary education . . . . . . . . . . . . . . . . . . . . . . . . . . . .75.58 56.1.3 Professionals . . . . . . . . . . . . . . . . . . . . . . . . . . . . . . . . . . . . . . . . . . . . . . . . . . 67.46 76.1.4 Researchers . . . . . . . . . . . . . . . . . . . . . . . . . . . . . . . . . . . . . . . . . . . . . . . . . 100.00 16.1.5 Senior officials and managers . . . . . . . . . . . . . . . . . . . . . . . . . . . . . . . . . 61.00 156.1.6 Availability of scientists and engineers . . . . . . . . . . . . . . . . . . . . . . . .83.20 66.2 Talent Impact . . . . . . . . . . . . . . . . . . . . . . . . . . . . . . . . . . . . . . . . . . . . . . . 51.60 176.2.1 Innovation output . . . . . . . . . . . . . . . . . . . . . . . . . . . . . . . . . . . . . . . . . . . . 79.16 76.2.2 High-value exports . . . . . . . . . . . . . . . . . . . . . . . . . . . . . . . . . . . . . . . . . . . . 41.22 226.2.3 New product entrepreneurial activity . . . . . . . . . . . . . . . . . . . . . . . . .66.00 156.2.4 New business density . . . . . . . . . . . . . . . . . . . . . . . . . . . . . . . . . . . . . . . . . 16.51 356.2.5 Scientific journal articles . . . . . . . . . . . . . . . . . . . . . . . . . . . . . . . . . . . . . . 55.13 19
l Israel l Income group average
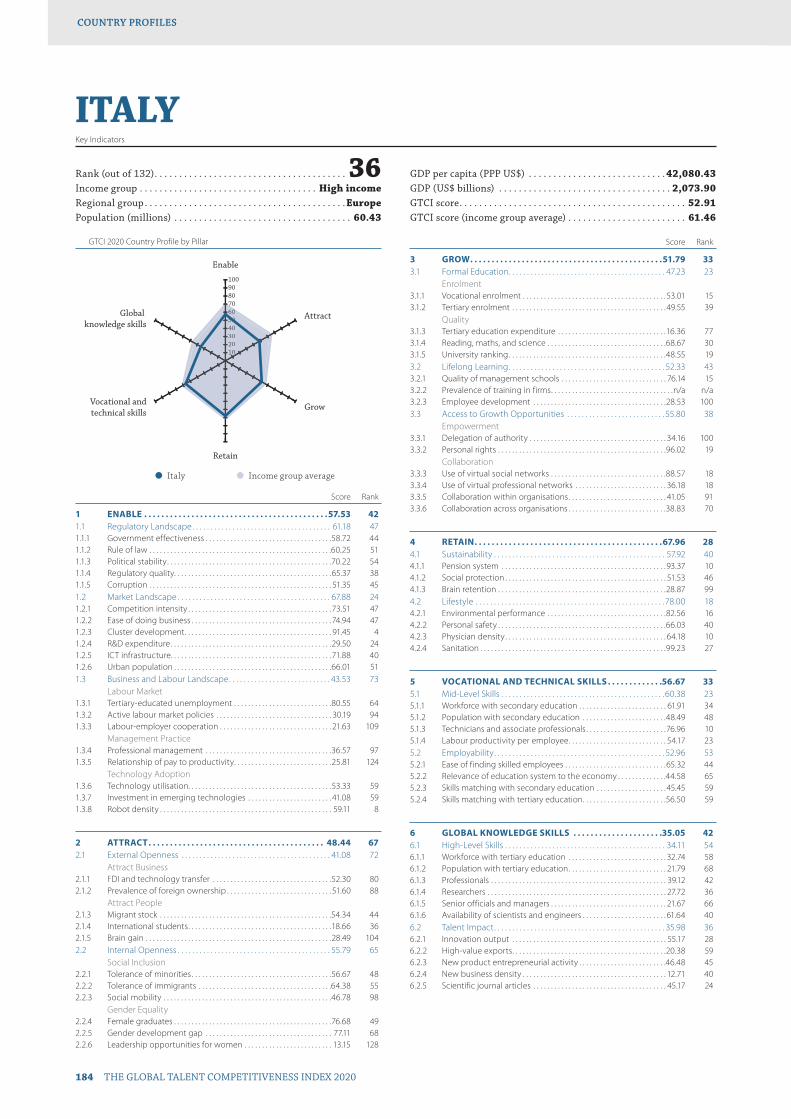
GTCI 2020 Country Profile by Pillar
184 THE GLOBAL TALENT COMPETITIVENESS INDEX 2020
COUNTRY PROFILESCOUNTRY PROFILES
102030405060708090100
Global knowledge skills
Vocational andtechnical skills
Retain
Grow
Attract
Enable
102030405060607
ITALYKey Indicators
Rank (out of 132) . . . . . . . . . . . . . . . . . . . . . . . . . . . . . . . . . . . . . . . 36Income group . . . . . . . . . . . . . . . . . . . . . . . . . . . . . . . . . . . . High incomeRegional group . . . . . . . . . . . . . . . . . . . . . . . . . . . . . . . . . . . . . . . . .EuropePopulation (millions) . . . . . . . . . . . . . . . . . . . . . . . . . . . . . . . . . . . . 60.43
GDP per capita (PPP US$) . . . . . . . . . . . . . . . . . . . . . . . . . . . . 42,080.43GDP (US$ billions) . . . . . . . . . . . . . . . . . . . . . . . . . . . . . . . . . . . 2,073.90GTCI score . . . . . . . . . . . . . . . . . . . . . . . . . . . . . . . . . . . . . . . . . . . . . . 52.91GTCI score (income group average) . . . . . . . . . . . . . . . . . . . . . . . . 61.46
Score Rank
1 ENABLE . . . . . . . . . . . . . . . . . . . . . . . . . . . . . . . . . . . . . . . . . . .57.53 421.1 Regulatory Landscape . . . . . . . . . . . . . . . . . . . . . . . . . . . . . . . . . . . . . . 61.18 471.1.1 Government effectiveness . . . . . . . . . . . . . . . . . . . . . . . . . . . . . . . . . . . .58.72 441.1.2 Rule of law . . . . . . . . . . . . . . . . . . . . . . . . . . . . . . . . . . . . . . . . . . . . . . . . . . . .60.25 511.1.3 Political stability . . . . . . . . . . . . . . . . . . . . . . . . . . . . . . . . . . . . . . . . . . . . . . .70.22 541.1.4 Regulatory quality. . . . . . . . . . . . . . . . . . . . . . . . . . . . . . . . . . . . . . . . . . . . .65.37 381.1.5 Corruption . . . . . . . . . . . . . . . . . . . . . . . . . . . . . . . . . . . . . . . . . . . . . . . . . . . . 51.35 451.2 Market Landscape . . . . . . . . . . . . . . . . . . . . . . . . . . . . . . . . . . . . . . . . . . 67.88 241.2.1 Competition intensity . . . . . . . . . . . . . . . . . . . . . . . . . . . . . . . . . . . . . . . . .73.51 471.2.2 Ease of doing business . . . . . . . . . . . . . . . . . . . . . . . . . . . . . . . . . . . . . . . . 74.94 471.2.3 Cluster development . . . . . . . . . . . . . . . . . . . . . . . . . . . . . . . . . . . . . . . . . . 91.45 41.2.4 R&D expenditure . . . . . . . . . . . . . . . . . . . . . . . . . . . . . . . . . . . . . . . . . . . . . .29.50 241.2.5 ICT infrastructure. . . . . . . . . . . . . . . . . . . . . . . . . . . . . . . . . . . . . . . . . . . . . .71.88 401.2.6 Urban population . . . . . . . . . . . . . . . . . . . . . . . . . . . . . . . . . . . . . . . . . . . . .66.01 511.3 Business and Labour Landscape . . . . . . . . . . . . . . . . . . . . . . . . . . . . 43.53 73
Labour Market1.3.1 Tertiary-educated unemployment . . . . . . . . . . . . . . . . . . . . . . . . . . . .80.55 641.3.2 Active labour market policies . . . . . . . . . . . . . . . . . . . . . . . . . . . . . . . . . 30.19 941.3.3 Labour-employer cooperation . . . . . . . . . . . . . . . . . . . . . . . . . . . . . . . . 21.63 109
Management Practice1.3.4 Professional management . . . . . . . . . . . . . . . . . . . . . . . . . . . . . . . . . . . .36.57 971.3.5 Relationship of pay to productivity . . . . . . . . . . . . . . . . . . . . . . . . . . . .25.81 124
Technology Adoption1.3.6 Technology utilisation. . . . . . . . . . . . . . . . . . . . . . . . . . . . . . . . . . . . . . . . .53.33 591.3.7 Investment in emerging technologies . . . . . . . . . . . . . . . . . . . . . . . . 41.08 591.3.8 Robot density . . . . . . . . . . . . . . . . . . . . . . . . . . . . . . . . . . . . . . . . . . . . . . . . . 59.11 8
2 ATTRACT . . . . . . . . . . . . . . . . . . . . . . . . . . . . . . . . . . . . . . . . . 48.44 672.1 External Openness . . . . . . . . . . . . . . . . . . . . . . . . . . . . . . . . . . . . . . . . . 41.08 72
Attract Business2.1.1 FDI and technology transfer . . . . . . . . . . . . . . . . . . . . . . . . . . . . . . . . . .52.30 802.1.2 Prevalence of foreign ownership . . . . . . . . . . . . . . . . . . . . . . . . . . . . . . 51.60 88
Attract People2.1.3 Migrant stock . . . . . . . . . . . . . . . . . . . . . . . . . . . . . . . . . . . . . . . . . . . . . . . . .54.34 442.1.4 International students . . . . . . . . . . . . . . . . . . . . . . . . . . . . . . . . . . . . . . . . .18.66 362.1.5 Brain gain . . . . . . . . . . . . . . . . . . . . . . . . . . . . . . . . . . . . . . . . . . . . . . . . . . . . .28.49 1042.2 Internal Openness . . . . . . . . . . . . . . . . . . . . . . . . . . . . . . . . . . . . . . . . . . 55.79 65
Social Inclusion2.2.1 Tolerance of minorities . . . . . . . . . . . . . . . . . . . . . . . . . . . . . . . . . . . . . . . .56.67 482.2.2 Tolerance of immigrants . . . . . . . . . . . . . . . . . . . . . . . . . . . . . . . . . . . . . .64.38 552.2.3 Social mobility . . . . . . . . . . . . . . . . . . . . . . . . . . . . . . . . . . . . . . . . . . . . . . . .46.78 98
Gender Equality2.2.4 Female graduates . . . . . . . . . . . . . . . . . . . . . . . . . . . . . . . . . . . . . . . . . . . . .76.68 492.2.5 Gender development gap . . . . . . . . . . . . . . . . . . . . . . . . . . . . . . . . . . . . 77.11 682.2.6 Leadership opportunities for women . . . . . . . . . . . . . . . . . . . . . . . . . 13.15 128
Score Rank
3 GROW . . . . . . . . . . . . . . . . . . . . . . . . . . . . . . . . . . . . . . . . . . . . .51.79 333.1 Formal Education . . . . . . . . . . . . . . . . . . . . . . . . . . . . . . . . . . . . . . . . . . . 47.23 23
Enrolment3.1.1 Vocational enrolment . . . . . . . . . . . . . . . . . . . . . . . . . . . . . . . . . . . . . . . . .53.01 153.1.2 Tertiary enrolment . . . . . . . . . . . . . . . . . . . . . . . . . . . . . . . . . . . . . . . . . . . . 49.55 39
Quality3.1.3 Tertiary education expenditure . . . . . . . . . . . . . . . . . . . . . . . . . . . . . . .16.36 773.1.4 Reading, maths, and science . . . . . . . . . . . . . . . . . . . . . . . . . . . . . . . . . .68.67 303.1.5 University ranking . . . . . . . . . . . . . . . . . . . . . . . . . . . . . . . . . . . . . . . . . . . . .48.55 193.2 Lifelong Learning . . . . . . . . . . . . . . . . . . . . . . . . . . . . . . . . . . . . . . . . . . . 52.33 433.2.1 Quality of management schools . . . . . . . . . . . . . . . . . . . . . . . . . . . . . . 76.14 153.2.2 Prevalence of training in firms . . . . . . . . . . . . . . . . . . . . . . . . . . . . . . . . . . .n/a n/a3.2.3 Employee development . . . . . . . . . . . . . . . . . . . . . . . . . . . . . . . . . . . . . .28.53 1003.3 Access to Growth Opportunities . . . . . . . . . . . . . . . . . . . . . . . . . . . 55.80 38
Empowerment3.3.1 Delegation of authority . . . . . . . . . . . . . . . . . . . . . . . . . . . . . . . . . . . . . . . 34.16 1003.3.2 Personal rights . . . . . . . . . . . . . . . . . . . . . . . . . . . . . . . . . . . . . . . . . . . . . . . .96.02 19
Collaboration3.3.3 Use of virtual social networks . . . . . . . . . . . . . . . . . . . . . . . . . . . . . . . . .88.57 183.3.4 Use of virtual professional networks . . . . . . . . . . . . . . . . . . . . . . . . . . 36.18 183.3.5 Collaboration within organisations . . . . . . . . . . . . . . . . . . . . . . . . . . . . 41.05 913.3.6 Collaboration across organisations . . . . . . . . . . . . . . . . . . . . . . . . . . . .38.83 70
4 RETAIN . . . . . . . . . . . . . . . . . . . . . . . . . . . . . . . . . . . . . . . . . . . .67.96 284.1 Sustainability . . . . . . . . . . . . . . . . . . . . . . . . . . . . . . . . . . . . . . . . . . . . . . . 57.92 404.1.1 Pension system . . . . . . . . . . . . . . . . . . . . . . . . . . . . . . . . . . . . . . . . . . . . . . .93.37 104.1.2 Social protection . . . . . . . . . . . . . . . . . . . . . . . . . . . . . . . . . . . . . . . . . . . . . . 51.53 464.1.3 Brain retention . . . . . . . . . . . . . . . . . . . . . . . . . . . . . . . . . . . . . . . . . . . . . . . .28.87 994.2 Lifestyle . . . . . . . . . . . . . . . . . . . . . . . . . . . . . . . . . . . . . . . . . . . . . . . . . . . . 78.00 184.2.1 Environmental performance . . . . . . . . . . . . . . . . . . . . . . . . . . . . . . . . . .82.56 164.2.2 Personal safety . . . . . . . . . . . . . . . . . . . . . . . . . . . . . . . . . . . . . . . . . . . . . . . .66.03 404.2.3 Physician density . . . . . . . . . . . . . . . . . . . . . . . . . . . . . . . . . . . . . . . . . . . . . . 64.18 104.2.4 Sanitation . . . . . . . . . . . . . . . . . . . . . . . . . . . . . . . . . . . . . . . . . . . . . . . . . . . . .99.23 27
5 VOCATIONAL AND TECHNICAL SKILLS . . . . . . . . . . . . .56.67 335.1 Mid-Level Skills . . . . . . . . . . . . . . . . . . . . . . . . . . . . . . . . . . . . . . . . . . . . . 60.38 235.1.1 Workforce with secondary education . . . . . . . . . . . . . . . . . . . . . . . . . 61.91 345.1.2 Population with secondary education . . . . . . . . . . . . . . . . . . . . . . . .48.49 485.1.3 Technicians and associate professionals . . . . . . . . . . . . . . . . . . . . . . .76.96 105.1.4 Labour productivity per employee . . . . . . . . . . . . . . . . . . . . . . . . . . . . 54.17 235.2 Employability . . . . . . . . . . . . . . . . . . . . . . . . . . . . . . . . . . . . . . . . . . . . . . . 52.96 535.2.1 Ease of finding skilled employees . . . . . . . . . . . . . . . . . . . . . . . . . . . . .65.32 445.2.2 Relevance of education system to the economy . . . . . . . . . . . . . .44.58 655.2.3 Skills matching with secondary education . . . . . . . . . . . . . . . . . . . . 45.45 595.2.4 Skills matching with tertiary education . . . . . . . . . . . . . . . . . . . . . . . .56.50 59
6 GLOBAL KNOWLEDGE SKILLS . . . . . . . . . . . . . . . . . . . . .35.05 426.1 High-Level Skills . . . . . . . . . . . . . . . . . . . . . . . . . . . . . . . . . . . . . . . . . . . . 34.11 546.1.1 Workforce with tertiary education . . . . . . . . . . . . . . . . . . . . . . . . . . . . 32.74 586.1.2 Population with tertiary education . . . . . . . . . . . . . . . . . . . . . . . . . . . . 21.79 686.1.3 Professionals . . . . . . . . . . . . . . . . . . . . . . . . . . . . . . . . . . . . . . . . . . . . . . . . . . 39.12 426.1.4 Researchers . . . . . . . . . . . . . . . . . . . . . . . . . . . . . . . . . . . . . . . . . . . . . . . . . . . 27.72 366.1.5 Senior officials and managers . . . . . . . . . . . . . . . . . . . . . . . . . . . . . . . . . 21.67 666.1.6 Availability of scientists and engineers . . . . . . . . . . . . . . . . . . . . . . . . 61.64 406.2 Talent Impact . . . . . . . . . . . . . . . . . . . . . . . . . . . . . . . . . . . . . . . . . . . . . . . 35.98 366.2.1 Innovation output . . . . . . . . . . . . . . . . . . . . . . . . . . . . . . . . . . . . . . . . . . . . 55.17 286.2.2 High-value exports . . . . . . . . . . . . . . . . . . . . . . . . . . . . . . . . . . . . . . . . . . . .20.38 596.2.3 New product entrepreneurial activity . . . . . . . . . . . . . . . . . . . . . . . . .46.48 456.2.4 New business density . . . . . . . . . . . . . . . . . . . . . . . . . . . . . . . . . . . . . . . . . 12.71 406.2.5 Scientific journal articles . . . . . . . . . . . . . . . . . . . . . . . . . . . . . . . . . . . . . . 45.17 24
l Italy l Income group average

GTCI 2020 Country Profile by Pillar
THE GLOBAL TALENT COMPETITIVENESS INDEX 2020 185
COUNTRY PROFILESCOUNTRY PROFILES
102030405060708090100
Global knowledge skills
Vocational andtechnical skills
Retain
Grow
Attract
Enable
1020304040
JAMAICAKey Indicators
Rank (out of 132) . . . . . . . . . . . . . . . . . . . . . . . . . . . . . . . . . . . . . . . 57Income group . . . . . . . . . . . . . . . . . . . . . . . . . . . Upper-middle incomeRegional group . . . . . . . . . . . . . . .Latin America and the CaribbeanPopulation (millions) . . . . . . . . . . . . . . . . . . . . . . . . . . . . . . . . . . . . . 2.93
GDP per capita (PPP US$) . . . . . . . . . . . . . . . . . . . . . . . . . . . . . 9,298.80GDP (US$ billions) . . . . . . . . . . . . . . . . . . . . . . . . . . . . . . . . . . . . . . 15.72GTCI score . . . . . . . . . . . . . . . . . . . . . . . . . . . . . . . . . . . . . . . . . . . . . . 44.00GTCI score (income group average) . . . . . . . . . . . . . . . . . . . . . . . . 41.25
Score Rank
1 ENABLE . . . . . . . . . . . . . . . . . . . . . . . . . . . . . . . . . . . . . . . . . . 52.29 511.1 Regulatory Landscape . . . . . . . . . . . . . . . . . . . . . . . . . . . . . . . . . . . . . .54.04 541.1.1 Government effectiveness . . . . . . . . . . . . . . . . . . . . . . . . . . . . . . . . . . . . 58.41 451.1.2 Rule of law . . . . . . . . . . . . . . . . . . . . . . . . . . . . . . . . . . . . . . . . . . . . . . . . . . . . 49.01 711.1.3 Political stability . . . . . . . . . . . . . . . . . . . . . . . . . . . . . . . . . . . . . . . . . . . . . . .70.60 531.1.4 Regulatory quality. . . . . . . . . . . . . . . . . . . . . . . . . . . . . . . . . . . . . . . . . . . . . 51.65 631.1.5 Corruption . . . . . . . . . . . . . . . . . . . . . . . . . . . . . . . . . . . . . . . . . . . . . . . . . . . .40.54 581.2 Market Landscape . . . . . . . . . . . . . . . . . . . . . . . . . . . . . . . . . . . . . . . . . . 56.33 501.2.1 Competition intensity . . . . . . . . . . . . . . . . . . . . . . . . . . . . . . . . . . . . . . . . .74.66 441.2.2 Ease of doing business . . . . . . . . . . . . . . . . . . . . . . . . . . . . . . . . . . . . . . . .65.84 701.2.3 Cluster development . . . . . . . . . . . . . . . . . . . . . . . . . . . . . . . . . . . . . . . . . .46.20 531.2.4 R&D expenditure . . . . . . . . . . . . . . . . . . . . . . . . . . . . . . . . . . . . . . . . . . . . . . . .n/a n/a1.2.5 ICT infrastructure. . . . . . . . . . . . . . . . . . . . . . . . . . . . . . . . . . . . . . . . . . . . . . 45.93 771.2.6 Urban population . . . . . . . . . . . . . . . . . . . . . . . . . . . . . . . . . . . . . . . . . . . . . 49.03 871.3 Business and Labour Landscape . . . . . . . . . . . . . . . . . . . . . . . . . . . . 46.51 67
Labour Market1.3.1 Tertiary-educated unemployment . . . . . . . . . . . . . . . . . . . . . . . . . . . . . .n/a n/a1.3.2 Active labour market policies . . . . . . . . . . . . . . . . . . . . . . . . . . . . . . . . . 36.74 741.3.3 Labour-employer cooperation . . . . . . . . . . . . . . . . . . . . . . . . . . . . . . . . 41.59 56
Management Practice1.3.4 Professional management . . . . . . . . . . . . . . . . . . . . . . . . . . . . . . . . . . . 66.84 301.3.5 Relationship of pay to productivity . . . . . . . . . . . . . . . . . . . . . . . . . . . .42.40 80
Technology Adoption1.3.6 Technology utilisation. . . . . . . . . . . . . . . . . . . . . . . . . . . . . . . . . . . . . . . . . 53.41 581.3.7 Investment in emerging technologies . . . . . . . . . . . . . . . . . . . . . . . .38.07 681.3.8 Robot density . . . . . . . . . . . . . . . . . . . . . . . . . . . . . . . . . . . . . . . . . . . . . . . . . . .n/a n/a
2 ATTRACT . . . . . . . . . . . . . . . . . . . . . . . . . . . . . . . . . . . . . . . . . 60.89 322.1 External Openness . . . . . . . . . . . . . . . . . . . . . . . . . . . . . . . . . . . . . . . . . 49.11 47
Attract Business2.1.1 FDI and technology transfer . . . . . . . . . . . . . . . . . . . . . . . . . . . . . . . . . .70.73 372.1.2 Prevalence of foreign ownership . . . . . . . . . . . . . . . . . . . . . . . . . . . . . .64.55 53
Attract People2.1.3 Migrant stock . . . . . . . . . . . . . . . . . . . . . . . . . . . . . . . . . . . . . . . . . . . . . . . . .12.64 1112.1.4 International students . . . . . . . . . . . . . . . . . . . . . . . . . . . . . . . . . . . . . . . . . . .n/a n/a2.1.5 Brain gain . . . . . . . . . . . . . . . . . . . . . . . . . . . . . . . . . . . . . . . . . . . . . . . . . . . . .48.50 522.2 Internal Openness . . . . . . . . . . . . . . . . . . . . . . . . . . . . . . . . . . . . . . . . . . 72.67 20
Social Inclusion2.2.1 Tolerance of minorities . . . . . . . . . . . . . . . . . . . . . . . . . . . . . . . . . . . . . . . .80.00 112.2.2 Tolerance of immigrants . . . . . . . . . . . . . . . . . . . . . . . . . . . . . . . . . . . . . .84.93 162.2.3 Social mobility . . . . . . . . . . . . . . . . . . . . . . . . . . . . . . . . . . . . . . . . . . . . . . . .63.06 46
Gender Equality2.2.4 Female graduates . . . . . . . . . . . . . . . . . . . . . . . . . . . . . . . . . . . . . . . . . . . . .71.25 652.2.5 Gender development gap . . . . . . . . . . . . . . . . . . . . . . . . . . . . . . . . . . . .84.65 352.2.6 Leadership opportunities for women . . . . . . . . . . . . . . . . . . . . . . . . . 52.16 54
Score Rank
3 GROW . . . . . . . . . . . . . . . . . . . . . . . . . . . . . . . . . . . . . . . . . . . . 40.25 593.1 Formal Education . . . . . . . . . . . . . . . . . . . . . . . . . . . . . . . . . . . . . . . . . . . 14.58 92
Enrolment3.1.1 Vocational enrolment . . . . . . . . . . . . . . . . . . . . . . . . . . . . . . . . . . . . . . . . . . .n/a n/a3.1.2 Tertiary enrolment . . . . . . . . . . . . . . . . . . . . . . . . . . . . . . . . . . . . . . . . . . . .20.78 86
Quality3.1.3 Tertiary education expenditure . . . . . . . . . . . . . . . . . . . . . . . . . . . . . . .22.96 543.1.4 Reading, maths, and science . . . . . . . . . . . . . . . . . . . . . . . . . . . . . . . . . . . .n/a n/a3.1.5 University ranking . . . . . . . . . . . . . . . . . . . . . . . . . . . . . . . . . . . . . . . . . . . . . . 0.00 753.2 Lifelong Learning . . . . . . . . . . . . . . . . . . . . . . . . . . . . . . . . . . . . . . . . . . . 49.45 513.2.1 Quality of management schools . . . . . . . . . . . . . . . . . . . . . . . . . . . . . .66.57 303.2.2 Prevalence of training in firms . . . . . . . . . . . . . . . . . . . . . . . . . . . . . . . . .29.68 613.2.3 Employee development . . . . . . . . . . . . . . . . . . . . . . . . . . . . . . . . . . . . . . 52.11 383.3 Access to Growth Opportunities . . . . . . . . . . . . . . . . . . . . . . . . . . . 56.72 36
Empowerment3.3.1 Delegation of authority . . . . . . . . . . . . . . . . . . . . . . . . . . . . . . . . . . . . . . .65.78 283.3.2 Personal rights . . . . . . . . . . . . . . . . . . . . . . . . . . . . . . . . . . . . . . . . . . . . . . . .89.52 37
Collaboration3.3.3 Use of virtual social networks . . . . . . . . . . . . . . . . . . . . . . . . . . . . . . . . .80.60 493.3.4 Use of virtual professional networks . . . . . . . . . . . . . . . . . . . . . . . . . .16.26 403.3.5 Collaboration within organisations . . . . . . . . . . . . . . . . . . . . . . . . . . . .50.03 563.3.6 Collaboration across organisations . . . . . . . . . . . . . . . . . . . . . . . . . . . . 38.11 74
4 RETAIN . . . . . . . . . . . . . . . . . . . . . . . . . . . . . . . . . . . . . . . . . . . 38.37 924.1 Sustainability . . . . . . . . . . . . . . . . . . . . . . . . . . . . . . . . . . . . . . . . . . . . . . . 32.65 954.1.1 Pension system . . . . . . . . . . . . . . . . . . . . . . . . . . . . . . . . . . . . . . . . . . . . . . . . .n/a n/a4.1.2 Social protection . . . . . . . . . . . . . . . . . . . . . . . . . . . . . . . . . . . . . . . . . . . . . .28.30 1044.1.3 Brain retention . . . . . . . . . . . . . . . . . . . . . . . . . . . . . . . . . . . . . . . . . . . . . . . .36.99 764.2 Lifestyle . . . . . . . . . . . . . . . . . . . . . . . . . . . . . . . . . . . . . . . . . . . . . . . . . . . . 44.10 924.2.1 Environmental performance . . . . . . . . . . . . . . . . . . . . . . . . . . . . . . . . . . 51.93 674.2.2 Personal safety . . . . . . . . . . . . . . . . . . . . . . . . . . . . . . . . . . . . . . . . . . . . . . . . 32.93 1034.2.3 Physician density . . . . . . . . . . . . . . . . . . . . . . . . . . . . . . . . . . . . . . . . . . . . . . . 7.26 974.2.4 Sanitation . . . . . . . . . . . . . . . . . . . . . . . . . . . . . . . . . . . . . . . . . . . . . . . . . . . . .84.26 79
5 VOCATIONAL AND TECHNICAL SKILLS . . . . . . . . . . . . 46.42 575.1 Mid-Level Skills . . . . . . . . . . . . . . . . . . . . . . . . . . . . . . . . . . . . . . . . . . . . . 32.26 795.1.1 Workforce with secondary education . . . . . . . . . . . . . . . . . . . . . . . . . . .n/a n/a5.1.2 Population with secondary education . . . . . . . . . . . . . . . . . . . . . . . .62.64 285.1.3 Technicians and associate professionals . . . . . . . . . . . . . . . . . . . . . . .23.81 855.1.4 Labour productivity per employee . . . . . . . . . . . . . . . . . . . . . . . . . . . .10.33 865.2 Employability . . . . . . . . . . . . . . . . . . . . . . . . . . . . . . . . . . . . . . . . . . . . . . . 60.57 375.2.1 Ease of finding skilled employees . . . . . . . . . . . . . . . . . . . . . . . . . . . . . 65.19 465.2.2 Relevance of education system to the economy . . . . . . . . . . . . . .58.46 405.2.3 Skills matching with secondary education . . . . . . . . . . . . . . . . . . . .49.85 495.2.4 Skills matching with tertiary education . . . . . . . . . . . . . . . . . . . . . . . .68.79 33
6 GLOBAL KNOWLEDGE SKILLS . . . . . . . . . . . . . . . . . . . . .25.79 696.1 High-Level Skills . . . . . . . . . . . . . . . . . . . . . . . . . . . . . . . . . . . . . . . . . . . . 36.79 476.1.1 Workforce with tertiary education . . . . . . . . . . . . . . . . . . . . . . . . . . . . . .n/a n/a6.1.2 Population with tertiary education . . . . . . . . . . . . . . . . . . . . . . . . . . . . . .n/a n/a6.1.3 Professionals . . . . . . . . . . . . . . . . . . . . . . . . . . . . . . . . . . . . . . . . . . . . . . . . . .22.77 746.1.4 Researchers . . . . . . . . . . . . . . . . . . . . . . . . . . . . . . . . . . . . . . . . . . . . . . . . . . . . .n/a n/a6.1.5 Senior officials and managers . . . . . . . . . . . . . . . . . . . . . . . . . . . . . . . . .43.35 316.1.6 Availability of scientists and engineers . . . . . . . . . . . . . . . . . . . . . . . .44.26 756.2 Talent Impact . . . . . . . . . . . . . . . . . . . . . . . . . . . . . . . . . . . . . . . . . . . . . . . 14.79 896.2.1 Innovation output . . . . . . . . . . . . . . . . . . . . . . . . . . . . . . . . . . . . . . . . . . . . 27.50 686.2.2 High-value exports . . . . . . . . . . . . . . . . . . . . . . . . . . . . . . . . . . . . . . . . . . . . . 1.33 1186.2.3 New product entrepreneurial activity . . . . . . . . . . . . . . . . . . . . . . . . . 37.06 606.2.4 New business density . . . . . . . . . . . . . . . . . . . . . . . . . . . . . . . . . . . . . . . . . . 6.25 636.2.5 Scientific journal articles . . . . . . . . . . . . . . . . . . . . . . . . . . . . . . . . . . . . . . . 1.80 84
l Jamaica l Income group average
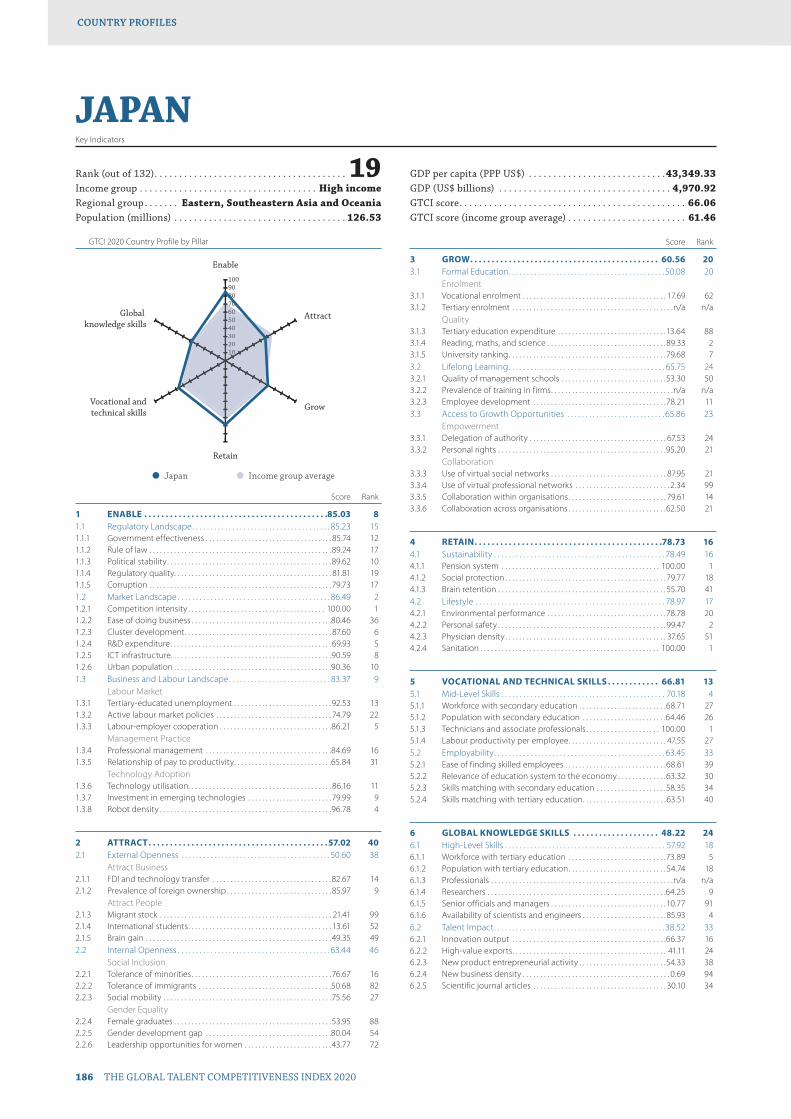
GTCI 2020 Country Profile by Pillar
186 THE GLOBAL TALENT COMPETITIVENESS INDEX 2020
COUNTRY PROFILESCOUNTRY PROFILES
102030405060708090100
Global knowledge skills
Vocational andtechnical skills
Retain
Grow
Attract
Enable
102030405060607
JAPANKey Indicators
Rank (out of 132) . . . . . . . . . . . . . . . . . . . . . . . . . . . . . . . . . . . . . . . 19Income group . . . . . . . . . . . . . . . . . . . . . . . . . . . . . . . . . . . . High incomeRegional group . . . . . . . Eastern, Southeastern Asia and OceaniaPopulation (millions) . . . . . . . . . . . . . . . . . . . . . . . . . . . . . . . . . . . 126.53
GDP per capita (PPP US$) . . . . . . . . . . . . . . . . . . . . . . . . . . . .43,349.33GDP (US$ billions) . . . . . . . . . . . . . . . . . . . . . . . . . . . . . . . . . . . 4,970.92GTCI score . . . . . . . . . . . . . . . . . . . . . . . . . . . . . . . . . . . . . . . . . . . . . . 66.06GTCI score (income group average) . . . . . . . . . . . . . . . . . . . . . . . . 61.46
Score Rank
1 ENABLE . . . . . . . . . . . . . . . . . . . . . . . . . . . . . . . . . . . . . . . . . . .85.03 81.1 Regulatory Landscape . . . . . . . . . . . . . . . . . . . . . . . . . . . . . . . . . . . . . . 85.23 151.1.1 Government effectiveness . . . . . . . . . . . . . . . . . . . . . . . . . . . . . . . . . . . . 85.74 121.1.2 Rule of law . . . . . . . . . . . . . . . . . . . . . . . . . . . . . . . . . . . . . . . . . . . . . . . . . . . .89.24 171.1.3 Political stability . . . . . . . . . . . . . . . . . . . . . . . . . . . . . . . . . . . . . . . . . . . . . . .89.62 101.1.4 Regulatory quality. . . . . . . . . . . . . . . . . . . . . . . . . . . . . . . . . . . . . . . . . . . . . 81.81 191.1.5 Corruption . . . . . . . . . . . . . . . . . . . . . . . . . . . . . . . . . . . . . . . . . . . . . . . . . . . .79.73 171.2 Market Landscape . . . . . . . . . . . . . . . . . . . . . . . . . . . . . . . . . . . . . . . . . . 86.49 21.2.1 Competition intensity . . . . . . . . . . . . . . . . . . . . . . . . . . . . . . . . . . . . . . . 100.00 11.2.2 Ease of doing business . . . . . . . . . . . . . . . . . . . . . . . . . . . . . . . . . . . . . . . .80.46 361.2.3 Cluster development . . . . . . . . . . . . . . . . . . . . . . . . . . . . . . . . . . . . . . . . . . 87.60 61.2.4 R&D expenditure . . . . . . . . . . . . . . . . . . . . . . . . . . . . . . . . . . . . . . . . . . . . . . 69.93 51.2.5 ICT infrastructure. . . . . . . . . . . . . . . . . . . . . . . . . . . . . . . . . . . . . . . . . . . . . .90.59 81.2.6 Urban population . . . . . . . . . . . . . . . . . . . . . . . . . . . . . . . . . . . . . . . . . . . . .90.36 101.3 Business and Labour Landscape . . . . . . . . . . . . . . . . . . . . . . . . . . . . 83.37 9
Labour Market1.3.1 Tertiary-educated unemployment . . . . . . . . . . . . . . . . . . . . . . . . . . . .92.53 131.3.2 Active labour market policies . . . . . . . . . . . . . . . . . . . . . . . . . . . . . . . . . 74.79 221.3.3 Labour-employer cooperation . . . . . . . . . . . . . . . . . . . . . . . . . . . . . . . .86.21 5
Management Practice1.3.4 Professional management . . . . . . . . . . . . . . . . . . . . . . . . . . . . . . . . . . . .84.69 161.3.5 Relationship of pay to productivity . . . . . . . . . . . . . . . . . . . . . . . . . . . .65.84 31
Technology Adoption1.3.6 Technology utilisation. . . . . . . . . . . . . . . . . . . . . . . . . . . . . . . . . . . . . . . . . 86.16 111.3.7 Investment in emerging technologies . . . . . . . . . . . . . . . . . . . . . . . .79.99 91.3.8 Robot density . . . . . . . . . . . . . . . . . . . . . . . . . . . . . . . . . . . . . . . . . . . . . . . . .96.78 4
2 ATTRACT . . . . . . . . . . . . . . . . . . . . . . . . . . . . . . . . . . . . . . . . . .57.02 402.1 External Openness . . . . . . . . . . . . . . . . . . . . . . . . . . . . . . . . . . . . . . . . . 50.60 38
Attract Business2.1.1 FDI and technology transfer . . . . . . . . . . . . . . . . . . . . . . . . . . . . . . . . . .82.67 142.1.2 Prevalence of foreign ownership . . . . . . . . . . . . . . . . . . . . . . . . . . . . . . 85.97 9
Attract People2.1.3 Migrant stock . . . . . . . . . . . . . . . . . . . . . . . . . . . . . . . . . . . . . . . . . . . . . . . . . 21.41 992.1.4 International students . . . . . . . . . . . . . . . . . . . . . . . . . . . . . . . . . . . . . . . . . 13.61 522.1.5 Brain gain . . . . . . . . . . . . . . . . . . . . . . . . . . . . . . . . . . . . . . . . . . . . . . . . . . . . .49.35 492.2 Internal Openness . . . . . . . . . . . . . . . . . . . . . . . . . . . . . . . . . . . . . . . . . . 63.44 46
Social Inclusion2.2.1 Tolerance of minorities . . . . . . . . . . . . . . . . . . . . . . . . . . . . . . . . . . . . . . . .76.67 162.2.2 Tolerance of immigrants . . . . . . . . . . . . . . . . . . . . . . . . . . . . . . . . . . . . . .50.68 822.2.3 Social mobility . . . . . . . . . . . . . . . . . . . . . . . . . . . . . . . . . . . . . . . . . . . . . . . .75.56 27
Gender Equality2.2.4 Female graduates . . . . . . . . . . . . . . . . . . . . . . . . . . . . . . . . . . . . . . . . . . . . .53.95 882.2.5 Gender development gap . . . . . . . . . . . . . . . . . . . . . . . . . . . . . . . . . . . .80.04 542.2.6 Leadership opportunities for women . . . . . . . . . . . . . . . . . . . . . . . . .43.77 72
Score Rank
3 GROW . . . . . . . . . . . . . . . . . . . . . . . . . . . . . . . . . . . . . . . . . . . . 60.56 203.1 Formal Education . . . . . . . . . . . . . . . . . . . . . . . . . . . . . . . . . . . . . . . . . . . 50.08 20
Enrolment3.1.1 Vocational enrolment . . . . . . . . . . . . . . . . . . . . . . . . . . . . . . . . . . . . . . . . . 17.69 623.1.2 Tertiary enrolment . . . . . . . . . . . . . . . . . . . . . . . . . . . . . . . . . . . . . . . . . . . . . .n/a n/a
Quality3.1.3 Tertiary education expenditure . . . . . . . . . . . . . . . . . . . . . . . . . . . . . . .13.64 883.1.4 Reading, maths, and science . . . . . . . . . . . . . . . . . . . . . . . . . . . . . . . . . .89.33 23.1.5 University ranking . . . . . . . . . . . . . . . . . . . . . . . . . . . . . . . . . . . . . . . . . . . . .79.68 73.2 Lifelong Learning . . . . . . . . . . . . . . . . . . . . . . . . . . . . . . . . . . . . . . . . . . . 65.75 243.2.1 Quality of management schools . . . . . . . . . . . . . . . . . . . . . . . . . . . . . .53.30 503.2.2 Prevalence of training in firms . . . . . . . . . . . . . . . . . . . . . . . . . . . . . . . . . . .n/a n/a3.2.3 Employee development . . . . . . . . . . . . . . . . . . . . . . . . . . . . . . . . . . . . . .78.21 113.3 Access to Growth Opportunities . . . . . . . . . . . . . . . . . . . . . . . . . . . 65.86 23
Empowerment3.3.1 Delegation of authority . . . . . . . . . . . . . . . . . . . . . . . . . . . . . . . . . . . . . . . 67.53 243.3.2 Personal rights . . . . . . . . . . . . . . . . . . . . . . . . . . . . . . . . . . . . . . . . . . . . . . . .95.20 21
Collaboration3.3.3 Use of virtual social networks . . . . . . . . . . . . . . . . . . . . . . . . . . . . . . . . . 87.95 213.3.4 Use of virtual professional networks . . . . . . . . . . . . . . . . . . . . . . . . . . . 2.34 993.3.5 Collaboration within organisations . . . . . . . . . . . . . . . . . . . . . . . . . . . . 79.61 143.3.6 Collaboration across organisations . . . . . . . . . . . . . . . . . . . . . . . . . . . .62.50 21
4 RETAIN . . . . . . . . . . . . . . . . . . . . . . . . . . . . . . . . . . . . . . . . . . . .78.73 164.1 Sustainability . . . . . . . . . . . . . . . . . . . . . . . . . . . . . . . . . . . . . . . . . . . . . . . 78.49 164.1.1 Pension system . . . . . . . . . . . . . . . . . . . . . . . . . . . . . . . . . . . . . . . . . . . . . 100.00 14.1.2 Social protection . . . . . . . . . . . . . . . . . . . . . . . . . . . . . . . . . . . . . . . . . . . . . .79.77 184.1.3 Brain retention . . . . . . . . . . . . . . . . . . . . . . . . . . . . . . . . . . . . . . . . . . . . . . . . 55.70 414.2 Lifestyle . . . . . . . . . . . . . . . . . . . . . . . . . . . . . . . . . . . . . . . . . . . . . . . . . . . . 78.97 174.2.1 Environmental performance . . . . . . . . . . . . . . . . . . . . . . . . . . . . . . . . . .78.78 204.2.2 Personal safety . . . . . . . . . . . . . . . . . . . . . . . . . . . . . . . . . . . . . . . . . . . . . . . .99.47 24.2.3 Physician density . . . . . . . . . . . . . . . . . . . . . . . . . . . . . . . . . . . . . . . . . . . . . . 37.65 514.2.4 Sanitation . . . . . . . . . . . . . . . . . . . . . . . . . . . . . . . . . . . . . . . . . . . . . . . . . . . 100.00 1
5 VOCATIONAL AND TECHNICAL SKILLS . . . . . . . . . . . . 66.81 135.1 Mid-Level Skills . . . . . . . . . . . . . . . . . . . . . . . . . . . . . . . . . . . . . . . . . . . . . 70.18 45.1.1 Workforce with secondary education . . . . . . . . . . . . . . . . . . . . . . . . .68.71 275.1.2 Population with secondary education . . . . . . . . . . . . . . . . . . . . . . . .64.46 265.1.3 Technicians and associate professionals . . . . . . . . . . . . . . . . . . . . . 100.00 15.1.4 Labour productivity per employee . . . . . . . . . . . . . . . . . . . . . . . . . . . . 47.55 275.2 Employability . . . . . . . . . . . . . . . . . . . . . . . . . . . . . . . . . . . . . . . . . . . . . . . 63.45 335.2.1 Ease of finding skilled employees . . . . . . . . . . . . . . . . . . . . . . . . . . . . .68.61 395.2.2 Relevance of education system to the economy . . . . . . . . . . . . . .63.32 305.2.3 Skills matching with secondary education . . . . . . . . . . . . . . . . . . . .58.35 345.2.4 Skills matching with tertiary education . . . . . . . . . . . . . . . . . . . . . . . .63.51 40
6 GLOBAL KNOWLEDGE SKILLS . . . . . . . . . . . . . . . . . . . . 48.22 246.1 High-Level Skills . . . . . . . . . . . . . . . . . . . . . . . . . . . . . . . . . . . . . . . . . . . . 57.92 186.1.1 Workforce with tertiary education . . . . . . . . . . . . . . . . . . . . . . . . . . . .73.89 56.1.2 Population with tertiary education . . . . . . . . . . . . . . . . . . . . . . . . . . . . 54.74 186.1.3 Professionals . . . . . . . . . . . . . . . . . . . . . . . . . . . . . . . . . . . . . . . . . . . . . . . . . . . .n/a n/a6.1.4 Researchers . . . . . . . . . . . . . . . . . . . . . . . . . . . . . . . . . . . . . . . . . . . . . . . . . . .64.25 96.1.5 Senior officials and managers . . . . . . . . . . . . . . . . . . . . . . . . . . . . . . . . .10.77 916.1.6 Availability of scientists and engineers . . . . . . . . . . . . . . . . . . . . . . . . 85.93 46.2 Talent Impact . . . . . . . . . . . . . . . . . . . . . . . . . . . . . . . . . . . . . . . . . . . . . . . 38.52 336.2.1 Innovation output . . . . . . . . . . . . . . . . . . . . . . . . . . . . . . . . . . . . . . . . . . . .66.37 166.2.2 High-value exports . . . . . . . . . . . . . . . . . . . . . . . . . . . . . . . . . . . . . . . . . . . . 41.11 246.2.3 New product entrepreneurial activity . . . . . . . . . . . . . . . . . . . . . . . . .54.33 386.2.4 New business density . . . . . . . . . . . . . . . . . . . . . . . . . . . . . . . . . . . . . . . . . . 0.69 946.2.5 Scientific journal articles . . . . . . . . . . . . . . . . . . . . . . . . . . . . . . . . . . . . . . 30.10 34
l Japan l Income group average

GTCI 2020 Country Profile by Pillar
THE GLOBAL TALENT COMPETITIVENESS INDEX 2020 187
COUNTRY PROFILESCOUNTRY PROFILES
102030405060708090100
Global knowledge skills
Vocational andtechnical skills
Retain
Grow
Attract
Enable
1020304040
JORDANKey Indicators
Rank (out of 132) . . . . . . . . . . . . . . . . . . . . . . . . . . . . . . . . . . . . . . . 61Income group . . . . . . . . . . . . . . . . . . . . . . . . . . . Upper-middle incomeRegional group . . . . . . . . . . . . . .Northern Africa and Western AsiaPopulation (millions) . . . . . . . . . . . . . . . . . . . . . . . . . . . . . . . . . . . . . 9.96
GDP per capita (PPP US$) . . . . . . . . . . . . . . . . . . . . . . . . . . . . . 9,347.94GDP (US$ billions) . . . . . . . . . . . . . . . . . . . . . . . . . . . . . . . . . . . . . . 42.29GTCI score . . . . . . . . . . . . . . . . . . . . . . . . . . . . . . . . . . . . . . . . . . . . . . 43.48GTCI score (income group average) . . . . . . . . . . . . . . . . . . . . . . . . 41.25
Score Rank
1 ENABLE . . . . . . . . . . . . . . . . . . . . . . . . . . . . . . . . . . . . . . . . . . .53.98 481.1 Regulatory Landscape . . . . . . . . . . . . . . . . . . . . . . . . . . . . . . . . . . . . . . 51.86 591.1.1 Government effectiveness . . . . . . . . . . . . . . . . . . . . . . . . . . . . . . . . . . . .49.36 651.1.2 Rule of law . . . . . . . . . . . . . . . . . . . . . . . . . . . . . . . . . . . . . . . . . . . . . . . . . . . .58.77 521.1.3 Political stability . . . . . . . . . . . . . . . . . . . . . . . . . . . . . . . . . . . . . . . . . . . . . . .53.42 941.1.4 Regulatory quality. . . . . . . . . . . . . . . . . . . . . . . . . . . . . . . . . . . . . . . . . . . . .50.45 651.1.5 Corruption . . . . . . . . . . . . . . . . . . . . . . . . . . . . . . . . . . . . . . . . . . . . . . . . . . . . 47.30 491.2 Market Landscape . . . . . . . . . . . . . . . . . . . . . . . . . . . . . . . . . . . . . . . . . . 59.75 371.2.1 Competition intensity . . . . . . . . . . . . . . . . . . . . . . . . . . . . . . . . . . . . . . . . . 81.34 181.2.2 Ease of doing business . . . . . . . . . . . . . . . . . . . . . . . . . . . . . . . . . . . . . . . .54.25 891.2.3 Cluster development . . . . . . . . . . . . . . . . . . . . . . . . . . . . . . . . . . . . . . . . . .62.52 301.2.4 R&D expenditure . . . . . . . . . . . . . . . . . . . . . . . . . . . . . . . . . . . . . . . . . . . . . . 15.41 481.2.5 ICT infrastructure. . . . . . . . . . . . . . . . . . . . . . . . . . . . . . . . . . . . . . . . . . . . . .55.34 681.2.6 Urban population . . . . . . . . . . . . . . . . . . . . . . . . . . . . . . . . . . . . . . . . . . . . .89.63 131.3 Business and Labour Landscape . . . . . . . . . . . . . . . . . . . . . . . . . . . . 50.34 53
Labour Market1.3.1 Tertiary-educated unemployment . . . . . . . . . . . . . . . . . . . . . . . . . . . . . .n/a n/a1.3.2 Active labour market policies . . . . . . . . . . . . . . . . . . . . . . . . . . . . . . . . . 37.83 701.3.3 Labour-employer cooperation . . . . . . . . . . . . . . . . . . . . . . . . . . . . . . . . 51.72 39
Management Practice1.3.4 Professional management . . . . . . . . . . . . . . . . . . . . . . . . . . . . . . . . . . . .42.06 851.3.5 Relationship of pay to productivity . . . . . . . . . . . . . . . . . . . . . . . . . . . . 57.21 49
Technology Adoption1.3.6 Technology utilisation. . . . . . . . . . . . . . . . . . . . . . . . . . . . . . . . . . . . . . . . .64.02 451.3.7 Investment in emerging technologies . . . . . . . . . . . . . . . . . . . . . . . .49.20 451.3.8 Robot density . . . . . . . . . . . . . . . . . . . . . . . . . . . . . . . . . . . . . . . . . . . . . . . . . . .n/a n/a
2 ATTRACT . . . . . . . . . . . . . . . . . . . . . . . . . . . . . . . . . . . . . . . . . .48.71 652.1 External Openness . . . . . . . . . . . . . . . . . . . . . . . . . . . . . . . . . . . . . . . . . 57.05 30
Attract Business2.1.1 FDI and technology transfer . . . . . . . . . . . . . . . . . . . . . . . . . . . . . . . . . . 60.14 592.1.2 Prevalence of foreign ownership . . . . . . . . . . . . . . . . . . . . . . . . . . . . . .54.54 76
Attract People2.1.3 Migrant stock . . . . . . . . . . . . . . . . . . . . . . . . . . . . . . . . . . . . . . . . . . . . . . . . . 77.69 122.1.4 International students . . . . . . . . . . . . . . . . . . . . . . . . . . . . . . . . . . . . . . . . . 51.15 112.1.5 Brain gain . . . . . . . . . . . . . . . . . . . . . . . . . . . . . . . . . . . . . . . . . . . . . . . . . . . . . 41.73 742.2 Internal Openness . . . . . . . . . . . . . . . . . . . . . . . . . . . . . . . . . . . . . . . . . . 40.36 120
Social Inclusion2.2.1 Tolerance of minorities . . . . . . . . . . . . . . . . . . . . . . . . . . . . . . . . . . . . . . . . 15.56 1172.2.2 Tolerance of immigrants . . . . . . . . . . . . . . . . . . . . . . . . . . . . . . . . . . . . . .43.84 962.2.3 Social mobility . . . . . . . . . . . . . . . . . . . . . . . . . . . . . . . . . . . . . . . . . . . . . . . . 49.11 91
Gender Equality2.2.4 Female graduates . . . . . . . . . . . . . . . . . . . . . . . . . . . . . . . . . . . . . . . . . . . . .46.93 992.2.5 Gender development gap . . . . . . . . . . . . . . . . . . . . . . . . . . . . . . . . . . . .38.01 1222.2.6 Leadership opportunities for women . . . . . . . . . . . . . . . . . . . . . . . . .48.71 60
Score Rank
3 GROW . . . . . . . . . . . . . . . . . . . . . . . . . . . . . . . . . . . . . . . . . . . . 32.69 863.1 Formal Education . . . . . . . . . . . . . . . . . . . . . . . . . . . . . . . . . . . . . . . . . . . 17.48 86
Enrolment3.1.1 Vocational enrolment . . . . . . . . . . . . . . . . . . . . . . . . . . . . . . . . . . . . . . . . . . 5.33 963.1.2 Tertiary enrolment . . . . . . . . . . . . . . . . . . . . . . . . . . . . . . . . . . . . . . . . . . . .24.62 80
Quality3.1.3 Tertiary education expenditure . . . . . . . . . . . . . . . . . . . . . . . . . . . . . . . 13.99 843.1.4 Reading, maths, and science . . . . . . . . . . . . . . . . . . . . . . . . . . . . . . . . . .28.22 603.1.5 University ranking . . . . . . . . . . . . . . . . . . . . . . . . . . . . . . . . . . . . . . . . . . . . . 15.21 583.2 Lifelong Learning . . . . . . . . . . . . . . . . . . . . . . . . . . . . . . . . . . . . . . . . . . . 31.59 1083.2.1 Quality of management schools . . . . . . . . . . . . . . . . . . . . . . . . . . . . . . 49.43 603.2.2 Prevalence of training in firms . . . . . . . . . . . . . . . . . . . . . . . . . . . . . . . . . . 0.00 963.2.3 Employee development . . . . . . . . . . . . . . . . . . . . . . . . . . . . . . . . . . . . . .45.34 573.3 Access to Growth Opportunities . . . . . . . . . . . . . . . . . . . . . . . . . . . 49.01 56
Empowerment3.3.1 Delegation of authority . . . . . . . . . . . . . . . . . . . . . . . . . . . . . . . . . . . . . . .42.56 753.3.2 Personal rights . . . . . . . . . . . . . . . . . . . . . . . . . . . . . . . . . . . . . . . . . . . . . . . .53.08 98
Collaboration3.3.3 Use of virtual social networks . . . . . . . . . . . . . . . . . . . . . . . . . . . . . . . . .85.90 273.3.4 Use of virtual professional networks . . . . . . . . . . . . . . . . . . . . . . . . . . 13.96 493.3.5 Collaboration within organisations . . . . . . . . . . . . . . . . . . . . . . . . . . . .48.65 613.3.6 Collaboration across organisations . . . . . . . . . . . . . . . . . . . . . . . . . . . .49.90 34
4 RETAIN . . . . . . . . . . . . . . . . . . . . . . . . . . . . . . . . . . . . . . . . . . . .57.90 474.1 Sustainability . . . . . . . . . . . . . . . . . . . . . . . . . . . . . . . . . . . . . . . . . . . . . . . 47.93 494.1.1 Pension system . . . . . . . . . . . . . . . . . . . . . . . . . . . . . . . . . . . . . . . . . . . . . . . 51.50 534.1.2 Social protection . . . . . . . . . . . . . . . . . . . . . . . . . . . . . . . . . . . . . . . . . . . . . . 48.16 524.1.3 Brain retention . . . . . . . . . . . . . . . . . . . . . . . . . . . . . . . . . . . . . . . . . . . . . . . . 44.12 554.2 Lifestyle . . . . . . . . . . . . . . . . . . . . . . . . . . . . . . . . . . . . . . . . . . . . . . . . . . . . 67.86 394.2.1 Environmental performance . . . . . . . . . . . . . . . . . . . . . . . . . . . . . . . . . . 57.96 554.2.2 Personal safety . . . . . . . . . . . . . . . . . . . . . . . . . . . . . . . . . . . . . . . . . . . . . . . . 62.41 484.2.3 Physician density . . . . . . . . . . . . . . . . . . . . . . . . . . . . . . . . . . . . . . . . . . . . . .54.63 254.2.4 Sanitation . . . . . . . . . . . . . . . . . . . . . . . . . . . . . . . . . . . . . . . . . . . . . . . . . . . . .96.46 46
5 VOCATIONAL AND TECHNICAL SKILLS . . . . . . . . . . . . 40.89 755.1 Mid-Level Skills . . . . . . . . . . . . . . . . . . . . . . . . . . . . . . . . . . . . . . . . . . . . . 29.47 855.1.1 Workforce with secondary education . . . . . . . . . . . . . . . . . . . . . . . . . . .n/a n/a5.1.2 Population with secondary education . . . . . . . . . . . . . . . . . . . . . . . .34.70 685.1.3 Technicians and associate professionals . . . . . . . . . . . . . . . . . . . . . . . . .n/a n/a5.1.4 Labour productivity per employee . . . . . . . . . . . . . . . . . . . . . . . . . . . . 24.24 615.2 Employability . . . . . . . . . . . . . . . . . . . . . . . . . . . . . . . . . . . . . . . . . . . . . . . 52.31 565.2.1 Ease of finding skilled employees . . . . . . . . . . . . . . . . . . . . . . . . . . . . . 66.11 435.2.2 Relevance of education system to the economy . . . . . . . . . . . . . .52.37 495.2.3 Skills matching with secondary education . . . . . . . . . . . . . . . . . . . .40.71 725.2.4 Skills matching with tertiary education . . . . . . . . . . . . . . . . . . . . . . . .50.07 76
6 GLOBAL KNOWLEDGE SKILLS . . . . . . . . . . . . . . . . . . . . .26.71 666.1 High-Level Skills . . . . . . . . . . . . . . . . . . . . . . . . . . . . . . . . . . . . . . . . . . . . 35.78 506.1.1 Workforce with tertiary education . . . . . . . . . . . . . . . . . . . . . . . . . . . . . .n/a n/a6.1.2 Population with tertiary education . . . . . . . . . . . . . . . . . . . . . . . . . . . .24.80 646.1.3 Professionals . . . . . . . . . . . . . . . . . . . . . . . . . . . . . . . . . . . . . . . . . . . . . . . . . . . .n/a n/a6.1.4 Researchers . . . . . . . . . . . . . . . . . . . . . . . . . . . . . . . . . . . . . . . . . . . . . . . . . . . . 7.17 646.1.5 Senior officials and managers . . . . . . . . . . . . . . . . . . . . . . . . . . . . . . . . . . .n/a n/a6.1.6 Availability of scientists and engineers . . . . . . . . . . . . . . . . . . . . . . . . 75.37 166.2 Talent Impact . . . . . . . . . . . . . . . . . . . . . . . . . . . . . . . . . . . . . . . . . . . . . . . 17.63 796.2.1 Innovation output . . . . . . . . . . . . . . . . . . . . . . . . . . . . . . . . . . . . . . . . . . . . 27.50 686.2.2 High-value exports . . . . . . . . . . . . . . . . . . . . . . . . . . . . . . . . . . . . . . . . . . . . . 5.36 1016.2.3 New product entrepreneurial activity . . . . . . . . . . . . . . . . . . . . . . . . .45.65 466.2.4 New business density . . . . . . . . . . . . . . . . . . . . . . . . . . . . . . . . . . . . . . . . . . 2.84 796.2.5 Scientific journal articles . . . . . . . . . . . . . . . . . . . . . . . . . . . . . . . . . . . . . . . 6.82 61
l Jordan l Income group average

GTCI 2020 Country Profile by Pillar
188 THE GLOBAL TALENT COMPETITIVENESS INDEX 2020
COUNTRY PROFILESCOUNTRY PROFILES
102030405060708090100
Global knowledge skills
Vocational andtechnical skills
Retain
Grow
Attract
Enable
1020304040
KAZAKHSTANKey Indicators
Rank (out of 132) . . . . . . . . . . . . . . . . . . . . . . . . . . . . . . . . . . . . . . . 54Income group . . . . . . . . . . . . . . . . . . . . . . . . . . . Upper-middle incomeRegional group . . . . . . . . . . . . . . . . . . . . . Central and Southern AsiaPopulation (millions) . . . . . . . . . . . . . . . . . . . . . . . . . . . . . . . . . . . . 18.28
GDP per capita (PPP US$) . . . . . . . . . . . . . . . . . . . . . . . . . . . . 27,830.59GDP (US$ billions) . . . . . . . . . . . . . . . . . . . . . . . . . . . . . . . . . . . . . 170.54GTCI score . . . . . . . . . . . . . . . . . . . . . . . . . . . . . . . . . . . . . . . . . . . . . . 46.02GTCI score (income group average) . . . . . . . . . . . . . . . . . . . . . . . . 41.25
Score Rank
1 ENABLE . . . . . . . . . . . . . . . . . . . . . . . . . . . . . . . . . . . . . . . . . . 48.59 621.1 Regulatory Landscape . . . . . . . . . . . . . . . . . . . . . . . . . . . . . . . . . . . . . .46.09 761.1.1 Government effectiveness . . . . . . . . . . . . . . . . . . . . . . . . . . . . . . . . . . . .46.76 701.1.2 Rule of law . . . . . . . . . . . . . . . . . . . . . . . . . . . . . . . . . . . . . . . . . . . . . . . . . . . .43.06 901.1.3 Political stability . . . . . . . . . . . . . . . . . . . . . . . . . . . . . . . . . . . . . . . . . . . . . . .65.37 661.1.4 Regulatory quality. . . . . . . . . . . . . . . . . . . . . . . . . . . . . . . . . . . . . . . . . . . . .52.27 611.1.5 Corruption . . . . . . . . . . . . . . . . . . . . . . . . . . . . . . . . . . . . . . . . . . . . . . . . . . . .22.97 1041.2 Market Landscape . . . . . . . . . . . . . . . . . . . . . . . . . . . . . . . . . . . . . . . . . .48.30 731.2.1 Competition intensity . . . . . . . . . . . . . . . . . . . . . . . . . . . . . . . . . . . . . . . . .54.51 1071.2.2 Ease of doing business . . . . . . . . . . . . . . . . . . . . . . . . . . . . . . . . . . . . . . . .84.46 261.2.3 Cluster development . . . . . . . . . . . . . . . . . . . . . . . . . . . . . . . . . . . . . . . . . .22.54 1141.2.4 R&D expenditure . . . . . . . . . . . . . . . . . . . . . . . . . . . . . . . . . . . . . . . . . . . . . . . 2.59 1001.2.5 ICT infrastructure. . . . . . . . . . . . . . . . . . . . . . . . . . . . . . . . . . . . . . . . . . . . . .74.68 361.2.6 Urban population . . . . . . . . . . . . . . . . . . . . . . . . . . . . . . . . . . . . . . . . . . . . . 51.05 801.3 Business and Labour Landscape . . . . . . . . . . . . . . . . . . . . . . . . . . . . 51.39 50
Labour Market1.3.1 Tertiary-educated unemployment . . . . . . . . . . . . . . . . . . . . . . . . . . . . 87.87 381.3.2 Active labour market policies . . . . . . . . . . . . . . . . . . . . . . . . . . . . . . . . .58.69 411.3.3 Labour-employer cooperation . . . . . . . . . . . . . . . . . . . . . . . . . . . . . . . .38.82 64
Management Practice1.3.4 Professional management . . . . . . . . . . . . . . . . . . . . . . . . . . . . . . . . . . . .35.84 991.3.5 Relationship of pay to productivity . . . . . . . . . . . . . . . . . . . . . . . . . . . .58.01 47
Technology Adoption1.3.6 Technology utilisation. . . . . . . . . . . . . . . . . . . . . . . . . . . . . . . . . . . . . . . . .43.48 871.3.7 Investment in emerging technologies . . . . . . . . . . . . . . . . . . . . . . . . 37.04 721.3.8 Robot density . . . . . . . . . . . . . . . . . . . . . . . . . . . . . . . . . . . . . . . . . . . . . . . . . . .n/a n/a
2 ATTRACT . . . . . . . . . . . . . . . . . . . . . . . . . . . . . . . . . . . . . . . . . .51.23 582.1 External Openness . . . . . . . . . . . . . . . . . . . . . . . . . . . . . . . . . . . . . . . . . 43.84 63
Attract Business2.1.1 FDI and technology transfer . . . . . . . . . . . . . . . . . . . . . . . . . . . . . . . . . .45.77 982.1.2 Prevalence of foreign ownership . . . . . . . . . . . . . . . . . . . . . . . . . . . . . .45.32 102
Attract People2.1.3 Migrant stock . . . . . . . . . . . . . . . . . . . . . . . . . . . . . . . . . . . . . . . . . . . . . . . . .73.47 152.1.4 International students . . . . . . . . . . . . . . . . . . . . . . . . . . . . . . . . . . . . . . . . . . 8.03 672.1.5 Brain gain . . . . . . . . . . . . . . . . . . . . . . . . . . . . . . . . . . . . . . . . . . . . . . . . . . . . .46.62 562.2 Internal Openness . . . . . . . . . . . . . . . . . . . . . . . . . . . . . . . . . . . . . . . . . . 58.61 59
Social Inclusion2.2.1 Tolerance of minorities . . . . . . . . . . . . . . . . . . . . . . . . . . . . . . . . . . . . . . . . 21.11 1062.2.2 Tolerance of immigrants . . . . . . . . . . . . . . . . . . . . . . . . . . . . . . . . . . . . . . 47.95 852.2.3 Social mobility . . . . . . . . . . . . . . . . . . . . . . . . . . . . . . . . . . . . . . . . . . . . . . . .60.08 53
Gender Equality2.2.4 Female graduates . . . . . . . . . . . . . . . . . . . . . . . . . . . . . . . . . . . . . . . . . . . . .68.58 722.2.5 Gender development gap . . . . . . . . . . . . . . . . . . . . . . . . . . . . . . . . . . . . 91.52 112.2.6 Leadership opportunities for women . . . . . . . . . . . . . . . . . . . . . . . . .62.43 36
Score Rank
3 GROW . . . . . . . . . . . . . . . . . . . . . . . . . . . . . . . . . . . . . . . . . . . . .35.08 783.1 Formal Education . . . . . . . . . . . . . . . . . . . . . . . . . . . . . . . . . . . . . . . . . . . 29.26 58
Enrolment3.1.1 Vocational enrolment . . . . . . . . . . . . . . . . . . . . . . . . . . . . . . . . . . . . . . . . .16.66 633.1.2 Tertiary enrolment . . . . . . . . . . . . . . . . . . . . . . . . . . . . . . . . . . . . . . . . . . . . 41.78 52
Quality3.1.3 Tertiary education expenditure . . . . . . . . . . . . . . . . . . . . . . . . . . . . . . . . 4.62 1103.1.4 Reading, maths, and science . . . . . . . . . . . . . . . . . . . . . . . . . . . . . . . . . . 51.17 403.1.5 University ranking . . . . . . . . . . . . . . . . . . . . . . . . . . . . . . . . . . . . . . . . . . . . .32.08 383.2 Lifelong Learning . . . . . . . . . . . . . . . . . . . . . . . . . . . . . . . . . . . . . . . . . . . 35.71 913.2.1 Quality of management schools . . . . . . . . . . . . . . . . . . . . . . . . . . . . . .38.55 913.2.2 Prevalence of training in firms . . . . . . . . . . . . . . . . . . . . . . . . . . . . . . . . .32.85 543.2.3 Employee development . . . . . . . . . . . . . . . . . . . . . . . . . . . . . . . . . . . . . .35.73 743.3 Access to Growth Opportunities . . . . . . . . . . . . . . . . . . . . . . . . . . . 40.27 98
Empowerment3.3.1 Delegation of authority . . . . . . . . . . . . . . . . . . . . . . . . . . . . . . . . . . . . . . .43.79 713.3.2 Personal rights . . . . . . . . . . . . . . . . . . . . . . . . . . . . . . . . . . . . . . . . . . . . . . . .40.20 108
Collaboration3.3.3 Use of virtual social networks . . . . . . . . . . . . . . . . . . . . . . . . . . . . . . . . . 59.96 993.3.4 Use of virtual professional networks . . . . . . . . . . . . . . . . . . . . . . . . . . . 3.55 933.3.5 Collaboration within organisations . . . . . . . . . . . . . . . . . . . . . . . . . . . .49.84 573.3.6 Collaboration across organisations . . . . . . . . . . . . . . . . . . . . . . . . . . . .44.29 49
4 RETAIN . . . . . . . . . . . . . . . . . . . . . . . . . . . . . . . . . . . . . . . . . . . .59.96 394.1 Sustainability . . . . . . . . . . . . . . . . . . . . . . . . . . . . . . . . . . . . . . . . . . . . . . . 59.05 364.1.1 Pension system . . . . . . . . . . . . . . . . . . . . . . . . . . . . . . . . . . . . . . . . . . . . . 100.00 14.1.2 Social protection . . . . . . . . . . . . . . . . . . . . . . . . . . . . . . . . . . . . . . . . . . . . . . 41.09 704.1.3 Brain retention . . . . . . . . . . . . . . . . . . . . . . . . . . . . . . . . . . . . . . . . . . . . . . . .36.05 794.2 Lifestyle . . . . . . . . . . . . . . . . . . . . . . . . . . . . . . . . . . . . . . . . . . . . . . . . . . . .60.88 514.2.1 Environmental performance . . . . . . . . . . . . . . . . . . . . . . . . . . . . . . . . . .45.22 854.2.2 Personal safety . . . . . . . . . . . . . . . . . . . . . . . . . . . . . . . . . . . . . . . . . . . . . . . .48.47 804.2.3 Physician density . . . . . . . . . . . . . . . . . . . . . . . . . . . . . . . . . . . . . . . . . . . . . .52.20 274.2.4 Sanitation . . . . . . . . . . . . . . . . . . . . . . . . . . . . . . . . . . . . . . . . . . . . . . . . . . . . . 97.64 40
5 VOCATIONAL AND TECHNICAL SKILLS . . . . . . . . . . . . 44.63 625.1 Mid-Level Skills . . . . . . . . . . . . . . . . . . . . . . . . . . . . . . . . . . . . . . . . . . . . . 46.33 565.1.1 Workforce with secondary education . . . . . . . . . . . . . . . . . . . . . . . . . 53.51 515.1.2 Population with secondary education . . . . . . . . . . . . . . . . . . . . . . . .45.56 545.1.3 Technicians and associate professionals . . . . . . . . . . . . . . . . . . . . . . . 52.10 405.1.4 Labour productivity per employee . . . . . . . . . . . . . . . . . . . . . . . . . . . . 34.16 505.2 Employability . . . . . . . . . . . . . . . . . . . . . . . . . . . . . . . . . . . . . . . . . . . . . . . 42.93 825.2.1 Ease of finding skilled employees . . . . . . . . . . . . . . . . . . . . . . . . . . . . .49.46 835.2.2 Relevance of education system to the economy . . . . . . . . . . . . . . 41.96 715.2.3 Skills matching with secondary education . . . . . . . . . . . . . . . . . . . . 41.93 695.2.4 Skills matching with tertiary education . . . . . . . . . . . . . . . . . . . . . . . .38.36 111
6 GLOBAL KNOWLEDGE SKILLS . . . . . . . . . . . . . . . . . . . . 36.63 396.1 High-Level Skills . . . . . . . . . . . . . . . . . . . . . . . . . . . . . . . . . . . . . . . . . . . . 43.77 386.1.1 Workforce with tertiary education . . . . . . . . . . . . . . . . . . . . . . . . . . . .52.78 276.1.2 Population with tertiary education . . . . . . . . . . . . . . . . . . . . . . . . . . . .84.30 26.1.3 Professionals . . . . . . . . . . . . . . . . . . . . . . . . . . . . . . . . . . . . . . . . . . . . . . . . . .44.39 356.1.4 Researchers . . . . . . . . . . . . . . . . . . . . . . . . . . . . . . . . . . . . . . . . . . . . . . . . . . . . 7.90 626.1.5 Senior officials and managers . . . . . . . . . . . . . . . . . . . . . . . . . . . . . . . . . 31.30 466.1.6 Availability of scientists and engineers . . . . . . . . . . . . . . . . . . . . . . . . 41.94 836.2 Talent Impact . . . . . . . . . . . . . . . . . . . . . . . . . . . . . . . . . . . . . . . . . . . . . . . 29.50 506.2.1 Innovation output . . . . . . . . . . . . . . . . . . . . . . . . . . . . . . . . . . . . . . . . . . . .20.84 906.2.2 High-value exports . . . . . . . . . . . . . . . . . . . . . . . . . . . . . . . . . . . . . . . . . . . . 67.60 96.2.3 New product entrepreneurial activity . . . . . . . . . . . . . . . . . . . . . . . . .44.83 486.2.4 New business density . . . . . . . . . . . . . . . . . . . . . . . . . . . . . . . . . . . . . . . . .10.77 466.2.5 Scientific journal articles . . . . . . . . . . . . . . . . . . . . . . . . . . . . . . . . . . . . . . . 3.44 75
l Kazakhstan l Income group average
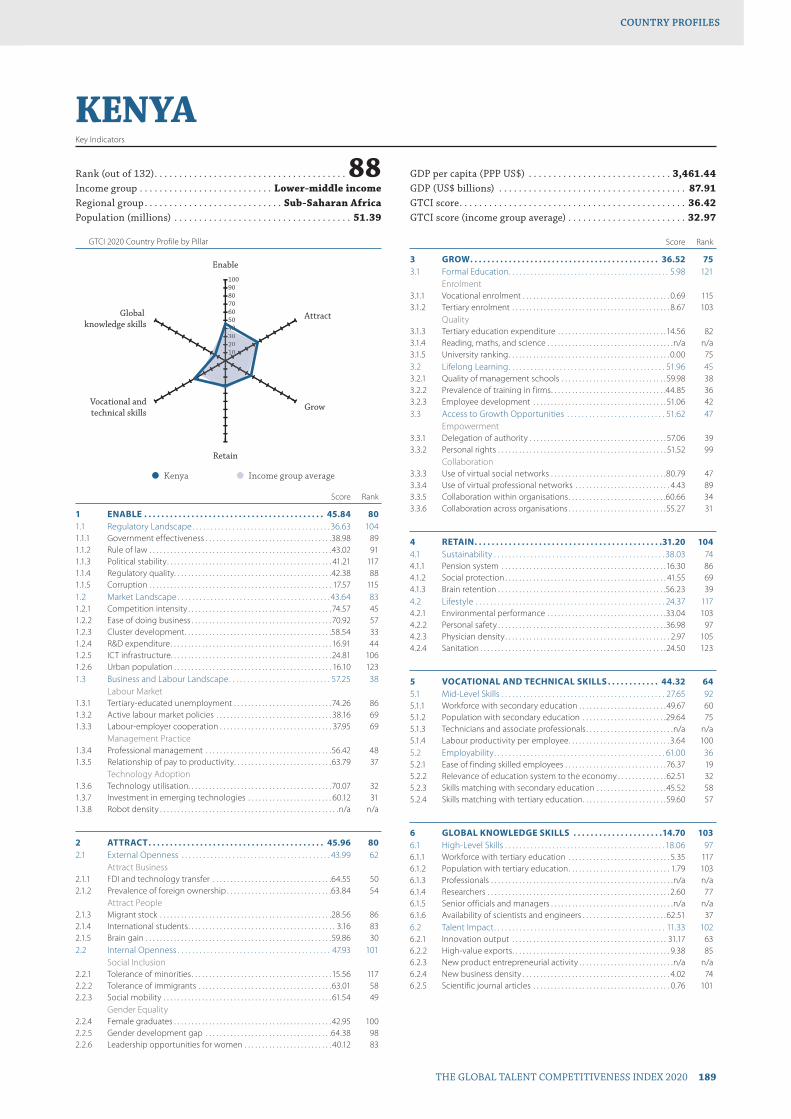
GTCI 2020 Country Profile by Pillar
THE GLOBAL TALENT COMPETITIVENESS INDEX 2020 189
COUNTRY PROFILESCOUNTRY PROFILES
102030405060708090100
Global knowledge skills
Vocational andtechnical skills
Retain
Grow
Attract
Enable
10203004
KENYAKey Indicators
Rank (out of 132) . . . . . . . . . . . . . . . . . . . . . . . . . . . . . . . . . . . . . . . 88Income group . . . . . . . . . . . . . . . . . . . . . . . . . . . Lower-middle incomeRegional group . . . . . . . . . . . . . . . . . . . . . . . . . . . . Sub-Saharan AfricaPopulation (millions) . . . . . . . . . . . . . . . . . . . . . . . . . . . . . . . . . . . . 51.39
GDP per capita (PPP US$) . . . . . . . . . . . . . . . . . . . . . . . . . . . . . 3,461.44GDP (US$ billions) . . . . . . . . . . . . . . . . . . . . . . . . . . . . . . . . . . . . . . 87.91GTCI score . . . . . . . . . . . . . . . . . . . . . . . . . . . . . . . . . . . . . . . . . . . . . . 36.42GTCI score (income group average) . . . . . . . . . . . . . . . . . . . . . . . . 32.97
Score Rank
1 ENABLE . . . . . . . . . . . . . . . . . . . . . . . . . . . . . . . . . . . . . . . . . . 45.84 801.1 Regulatory Landscape . . . . . . . . . . . . . . . . . . . . . . . . . . . . . . . . . . . . . . 36.63 1041.1.1 Government effectiveness . . . . . . . . . . . . . . . . . . . . . . . . . . . . . . . . . . . .38.98 891.1.2 Rule of law . . . . . . . . . . . . . . . . . . . . . . . . . . . . . . . . . . . . . . . . . . . . . . . . . . . .43.02 911.1.3 Political stability . . . . . . . . . . . . . . . . . . . . . . . . . . . . . . . . . . . . . . . . . . . . . . . 41.21 1171.1.4 Regulatory quality. . . . . . . . . . . . . . . . . . . . . . . . . . . . . . . . . . . . . . . . . . . . .42.38 881.1.5 Corruption . . . . . . . . . . . . . . . . . . . . . . . . . . . . . . . . . . . . . . . . . . . . . . . . . . . . 17.57 1151.2 Market Landscape . . . . . . . . . . . . . . . . . . . . . . . . . . . . . . . . . . . . . . . . . . 43.64 831.2.1 Competition intensity . . . . . . . . . . . . . . . . . . . . . . . . . . . . . . . . . . . . . . . . . 74.57 451.2.2 Ease of doing business . . . . . . . . . . . . . . . . . . . . . . . . . . . . . . . . . . . . . . . . 70.92 571.2.3 Cluster development . . . . . . . . . . . . . . . . . . . . . . . . . . . . . . . . . . . . . . . . . .58.54 331.2.4 R&D expenditure . . . . . . . . . . . . . . . . . . . . . . . . . . . . . . . . . . . . . . . . . . . . . . 16.91 441.2.5 ICT infrastructure. . . . . . . . . . . . . . . . . . . . . . . . . . . . . . . . . . . . . . . . . . . . . . 24.81 1061.2.6 Urban population . . . . . . . . . . . . . . . . . . . . . . . . . . . . . . . . . . . . . . . . . . . . . 16.10 1231.3 Business and Labour Landscape . . . . . . . . . . . . . . . . . . . . . . . . . . . . 57.25 38
Labour Market1.3.1 Tertiary-educated unemployment . . . . . . . . . . . . . . . . . . . . . . . . . . . .74.26 861.3.2 Active labour market policies . . . . . . . . . . . . . . . . . . . . . . . . . . . . . . . . . 38.16 691.3.3 Labour-employer cooperation . . . . . . . . . . . . . . . . . . . . . . . . . . . . . . . . 37.95 69
Management Practice1.3.4 Professional management . . . . . . . . . . . . . . . . . . . . . . . . . . . . . . . . . . . .56.42 481.3.5 Relationship of pay to productivity . . . . . . . . . . . . . . . . . . . . . . . . . . . .63.79 37
Technology Adoption1.3.6 Technology utilisation. . . . . . . . . . . . . . . . . . . . . . . . . . . . . . . . . . . . . . . . .70.07 321.3.7 Investment in emerging technologies . . . . . . . . . . . . . . . . . . . . . . . . 60.12 311.3.8 Robot density . . . . . . . . . . . . . . . . . . . . . . . . . . . . . . . . . . . . . . . . . . . . . . . . . . .n/a n/a
2 ATTRACT . . . . . . . . . . . . . . . . . . . . . . . . . . . . . . . . . . . . . . . . . 45.96 802.1 External Openness . . . . . . . . . . . . . . . . . . . . . . . . . . . . . . . . . . . . . . . . . 43.99 62
Attract Business2.1.1 FDI and technology transfer . . . . . . . . . . . . . . . . . . . . . . . . . . . . . . . . . .64.55 502.1.2 Prevalence of foreign ownership . . . . . . . . . . . . . . . . . . . . . . . . . . . . . .63.84 54
Attract People2.1.3 Migrant stock . . . . . . . . . . . . . . . . . . . . . . . . . . . . . . . . . . . . . . . . . . . . . . . . .28.56 862.1.4 International students . . . . . . . . . . . . . . . . . . . . . . . . . . . . . . . . . . . . . . . . . . 3.16 832.1.5 Brain gain . . . . . . . . . . . . . . . . . . . . . . . . . . . . . . . . . . . . . . . . . . . . . . . . . . . . .59.86 302.2 Internal Openness . . . . . . . . . . . . . . . . . . . . . . . . . . . . . . . . . . . . . . . . . . 47.93 101
Social Inclusion2.2.1 Tolerance of minorities . . . . . . . . . . . . . . . . . . . . . . . . . . . . . . . . . . . . . . . . 15.56 1172.2.2 Tolerance of immigrants . . . . . . . . . . . . . . . . . . . . . . . . . . . . . . . . . . . . . .63.01 582.2.3 Social mobility . . . . . . . . . . . . . . . . . . . . . . . . . . . . . . . . . . . . . . . . . . . . . . . . 61.54 49
Gender Equality2.2.4 Female graduates . . . . . . . . . . . . . . . . . . . . . . . . . . . . . . . . . . . . . . . . . . . . .42.95 1002.2.5 Gender development gap . . . . . . . . . . . . . . . . . . . . . . . . . . . . . . . . . . . .64.38 982.2.6 Leadership opportunities for women . . . . . . . . . . . . . . . . . . . . . . . . . 40.12 83
Score Rank
3 GROW . . . . . . . . . . . . . . . . . . . . . . . . . . . . . . . . . . . . . . . . . . . . 36.52 753.1 Formal Education . . . . . . . . . . . . . . . . . . . . . . . . . . . . . . . . . . . . . . . . . . . . 5.98 121
Enrolment3.1.1 Vocational enrolment . . . . . . . . . . . . . . . . . . . . . . . . . . . . . . . . . . . . . . . . . . 0.69 1153.1.2 Tertiary enrolment . . . . . . . . . . . . . . . . . . . . . . . . . . . . . . . . . . . . . . . . . . . . . 8.67 103
Quality3.1.3 Tertiary education expenditure . . . . . . . . . . . . . . . . . . . . . . . . . . . . . . .14.56 823.1.4 Reading, maths, and science . . . . . . . . . . . . . . . . . . . . . . . . . . . . . . . . . . . .n/a n/a3.1.5 University ranking . . . . . . . . . . . . . . . . . . . . . . . . . . . . . . . . . . . . . . . . . . . . . . 0.00 753.2 Lifelong Learning . . . . . . . . . . . . . . . . . . . . . . . . . . . . . . . . . . . . . . . . . . . 51.96 453.2.1 Quality of management schools . . . . . . . . . . . . . . . . . . . . . . . . . . . . . . 59.98 383.2.2 Prevalence of training in firms . . . . . . . . . . . . . . . . . . . . . . . . . . . . . . . . .44.85 363.2.3 Employee development . . . . . . . . . . . . . . . . . . . . . . . . . . . . . . . . . . . . . . 51.06 423.3 Access to Growth Opportunities . . . . . . . . . . . . . . . . . . . . . . . . . . . 51.62 47
Empowerment3.3.1 Delegation of authority . . . . . . . . . . . . . . . . . . . . . . . . . . . . . . . . . . . . . . . 57.06 393.3.2 Personal rights . . . . . . . . . . . . . . . . . . . . . . . . . . . . . . . . . . . . . . . . . . . . . . . . 51.52 99
Collaboration3.3.3 Use of virtual social networks . . . . . . . . . . . . . . . . . . . . . . . . . . . . . . . . .80.79 473.3.4 Use of virtual professional networks . . . . . . . . . . . . . . . . . . . . . . . . . . . 4.43 893.3.5 Collaboration within organisations . . . . . . . . . . . . . . . . . . . . . . . . . . . .60.66 343.3.6 Collaboration across organisations . . . . . . . . . . . . . . . . . . . . . . . . . . . .55.27 31
4 RETAIN . . . . . . . . . . . . . . . . . . . . . . . . . . . . . . . . . . . . . . . . . . . .31.20 1044.1 Sustainability . . . . . . . . . . . . . . . . . . . . . . . . . . . . . . . . . . . . . . . . . . . . . . . 38.03 744.1.1 Pension system . . . . . . . . . . . . . . . . . . . . . . . . . . . . . . . . . . . . . . . . . . . . . . .16.30 864.1.2 Social protection . . . . . . . . . . . . . . . . . . . . . . . . . . . . . . . . . . . . . . . . . . . . . . 41.55 694.1.3 Brain retention . . . . . . . . . . . . . . . . . . . . . . . . . . . . . . . . . . . . . . . . . . . . . . . .56.23 394.2 Lifestyle . . . . . . . . . . . . . . . . . . . . . . . . . . . . . . . . . . . . . . . . . . . . . . . . . . . . 24.37 1174.2.1 Environmental performance . . . . . . . . . . . . . . . . . . . . . . . . . . . . . . . . . .33.04 1034.2.2 Personal safety . . . . . . . . . . . . . . . . . . . . . . . . . . . . . . . . . . . . . . . . . . . . . . . .36.98 974.2.3 Physician density . . . . . . . . . . . . . . . . . . . . . . . . . . . . . . . . . . . . . . . . . . . . . . . 2.97 1054.2.4 Sanitation . . . . . . . . . . . . . . . . . . . . . . . . . . . . . . . . . . . . . . . . . . . . . . . . . . . . .24.50 123
5 VOCATIONAL AND TECHNICAL SKILLS . . . . . . . . . . . . 44.32 645.1 Mid-Level Skills . . . . . . . . . . . . . . . . . . . . . . . . . . . . . . . . . . . . . . . . . . . . . 27.65 925.1.1 Workforce with secondary education . . . . . . . . . . . . . . . . . . . . . . . . . 49.67 605.1.2 Population with secondary education . . . . . . . . . . . . . . . . . . . . . . . .29.64 755.1.3 Technicians and associate professionals . . . . . . . . . . . . . . . . . . . . . . . . .n/a n/a5.1.4 Labour productivity per employee . . . . . . . . . . . . . . . . . . . . . . . . . . . . . 3.64 1005.2 Employability . . . . . . . . . . . . . . . . . . . . . . . . . . . . . . . . . . . . . . . . . . . . . . . 61.00 365.2.1 Ease of finding skilled employees . . . . . . . . . . . . . . . . . . . . . . . . . . . . .76.37 195.2.2 Relevance of education system to the economy . . . . . . . . . . . . . . 62.51 325.2.3 Skills matching with secondary education . . . . . . . . . . . . . . . . . . . .45.52 585.2.4 Skills matching with tertiary education . . . . . . . . . . . . . . . . . . . . . . . .59.60 57
6 GLOBAL KNOWLEDGE SKILLS . . . . . . . . . . . . . . . . . . . . .14.70 1036.1 High-Level Skills . . . . . . . . . . . . . . . . . . . . . . . . . . . . . . . . . . . . . . . . . . . . 18.06 976.1.1 Workforce with tertiary education . . . . . . . . . . . . . . . . . . . . . . . . . . . . . 5.35 1176.1.2 Population with tertiary education . . . . . . . . . . . . . . . . . . . . . . . . . . . . . 1.79 1036.1.3 Professionals . . . . . . . . . . . . . . . . . . . . . . . . . . . . . . . . . . . . . . . . . . . . . . . . . . . .n/a n/a6.1.4 Researchers . . . . . . . . . . . . . . . . . . . . . . . . . . . . . . . . . . . . . . . . . . . . . . . . . . . . 2.60 776.1.5 Senior officials and managers . . . . . . . . . . . . . . . . . . . . . . . . . . . . . . . . . . .n/a n/a6.1.6 Availability of scientists and engineers . . . . . . . . . . . . . . . . . . . . . . . . 62.51 376.2 Talent Impact . . . . . . . . . . . . . . . . . . . . . . . . . . . . . . . . . . . . . . . . . . . . . . . 11.33 1026.2.1 Innovation output . . . . . . . . . . . . . . . . . . . . . . . . . . . . . . . . . . . . . . . . . . . . 31.17 636.2.2 High-value exports . . . . . . . . . . . . . . . . . . . . . . . . . . . . . . . . . . . . . . . . . . . . . 9.38 856.2.3 New product entrepreneurial activity . . . . . . . . . . . . . . . . . . . . . . . . . . .n/a n/a6.2.4 New business density . . . . . . . . . . . . . . . . . . . . . . . . . . . . . . . . . . . . . . . . . . 4.02 746.2.5 Scientific journal articles . . . . . . . . . . . . . . . . . . . . . . . . . . . . . . . . . . . . . . . 0.76 101
l Kenya l Income group average
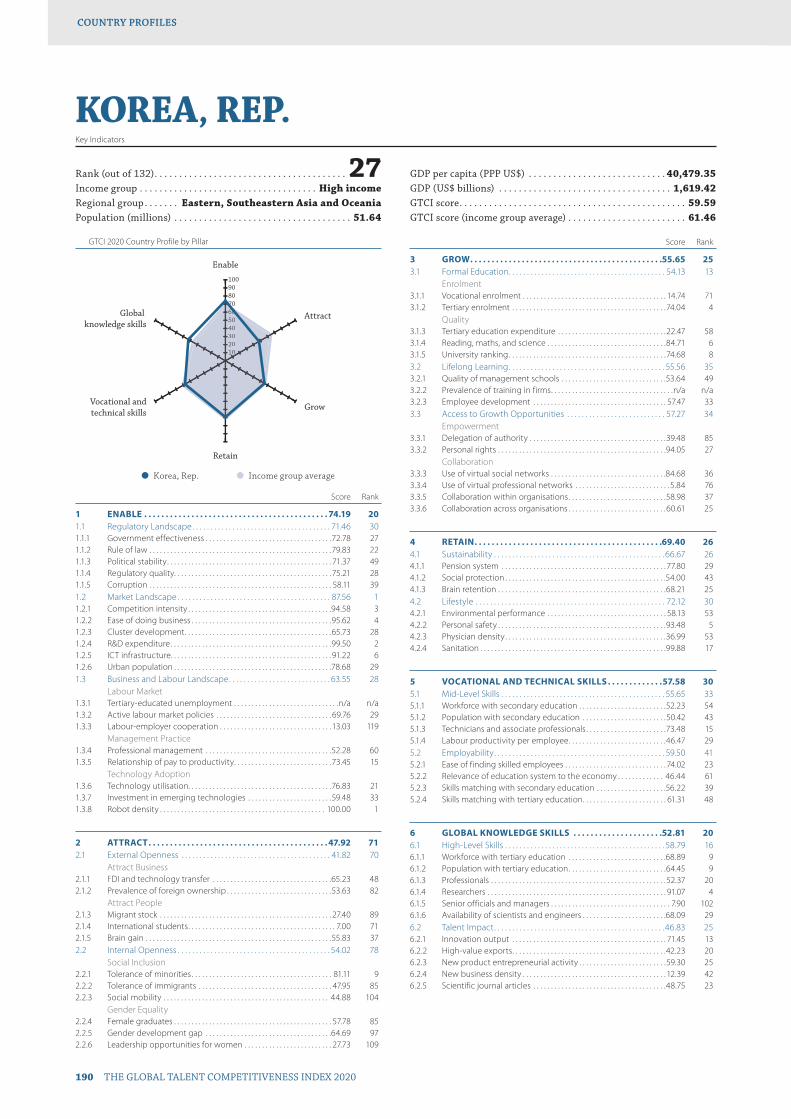
GTCI 2020 Country Profile by Pillar
190 THE GLOBAL TALENT COMPETITIVENESS INDEX 2020
COUNTRY PROFILESCOUNTRY PROFILES
102030405060708090100
Global knowledge skills
Vocational andtechnical skills
Retain
Grow
Attract
Enable
102030405060607
KOREA, REP.Key Indicators
Rank (out of 132) . . . . . . . . . . . . . . . . . . . . . . . . . . . . . . . . . . . . . . . 27Income group . . . . . . . . . . . . . . . . . . . . . . . . . . . . . . . . . . . . High incomeRegional group . . . . . . . Eastern, Southeastern Asia and OceaniaPopulation (millions) . . . . . . . . . . . . . . . . . . . . . . . . . . . . . . . . . . . . 51.64
GDP per capita (PPP US$) . . . . . . . . . . . . . . . . . . . . . . . . . . . . 40,479.35GDP (US$ billions) . . . . . . . . . . . . . . . . . . . . . . . . . . . . . . . . . . . 1,619.42GTCI score . . . . . . . . . . . . . . . . . . . . . . . . . . . . . . . . . . . . . . . . . . . . . . 59.59GTCI score (income group average) . . . . . . . . . . . . . . . . . . . . . . . . 61.46
Score Rank
1 ENABLE . . . . . . . . . . . . . . . . . . . . . . . . . . . . . . . . . . . . . . . . . . . 74.19 201.1 Regulatory Landscape . . . . . . . . . . . . . . . . . . . . . . . . . . . . . . . . . . . . . . 71.46 301.1.1 Government effectiveness . . . . . . . . . . . . . . . . . . . . . . . . . . . . . . . . . . . .72.78 271.1.2 Rule of law . . . . . . . . . . . . . . . . . . . . . . . . . . . . . . . . . . . . . . . . . . . . . . . . . . . .79.83 221.1.3 Political stability . . . . . . . . . . . . . . . . . . . . . . . . . . . . . . . . . . . . . . . . . . . . . . . 71.37 491.1.4 Regulatory quality. . . . . . . . . . . . . . . . . . . . . . . . . . . . . . . . . . . . . . . . . . . . . 75.21 281.1.5 Corruption . . . . . . . . . . . . . . . . . . . . . . . . . . . . . . . . . . . . . . . . . . . . . . . . . . . . 58.11 391.2 Market Landscape . . . . . . . . . . . . . . . . . . . . . . . . . . . . . . . . . . . . . . . . . . 87.56 11.2.1 Competition intensity . . . . . . . . . . . . . . . . . . . . . . . . . . . . . . . . . . . . . . . . .94.58 31.2.2 Ease of doing business . . . . . . . . . . . . . . . . . . . . . . . . . . . . . . . . . . . . . . . .95.62 41.2.3 Cluster development . . . . . . . . . . . . . . . . . . . . . . . . . . . . . . . . . . . . . . . . . .65.73 281.2.4 R&D expenditure . . . . . . . . . . . . . . . . . . . . . . . . . . . . . . . . . . . . . . . . . . . . . .99.50 21.2.5 ICT infrastructure. . . . . . . . . . . . . . . . . . . . . . . . . . . . . . . . . . . . . . . . . . . . . . 91.22 61.2.6 Urban population . . . . . . . . . . . . . . . . . . . . . . . . . . . . . . . . . . . . . . . . . . . . .78.68 291.3 Business and Labour Landscape . . . . . . . . . . . . . . . . . . . . . . . . . . . . 63.55 28
Labour Market1.3.1 Tertiary-educated unemployment . . . . . . . . . . . . . . . . . . . . . . . . . . . . . .n/a n/a1.3.2 Active labour market policies . . . . . . . . . . . . . . . . . . . . . . . . . . . . . . . . . 69.76 291.3.3 Labour-employer cooperation . . . . . . . . . . . . . . . . . . . . . . . . . . . . . . . . 13.03 119
Management Practice1.3.4 Professional management . . . . . . . . . . . . . . . . . . . . . . . . . . . . . . . . . . . .52.28 601.3.5 Relationship of pay to productivity . . . . . . . . . . . . . . . . . . . . . . . . . . . .73.45 15
Technology Adoption1.3.6 Technology utilisation. . . . . . . . . . . . . . . . . . . . . . . . . . . . . . . . . . . . . . . . .76.83 211.3.7 Investment in emerging technologies . . . . . . . . . . . . . . . . . . . . . . . .59.48 331.3.8 Robot density . . . . . . . . . . . . . . . . . . . . . . . . . . . . . . . . . . . . . . . . . . . . . . . 100.00 1
2 ATTRACT . . . . . . . . . . . . . . . . . . . . . . . . . . . . . . . . . . . . . . . . . . 47.92 712.1 External Openness . . . . . . . . . . . . . . . . . . . . . . . . . . . . . . . . . . . . . . . . . 41.82 70
Attract Business2.1.1 FDI and technology transfer . . . . . . . . . . . . . . . . . . . . . . . . . . . . . . . . . .65.23 482.1.2 Prevalence of foreign ownership . . . . . . . . . . . . . . . . . . . . . . . . . . . . . .53.63 82
Attract People2.1.3 Migrant stock . . . . . . . . . . . . . . . . . . . . . . . . . . . . . . . . . . . . . . . . . . . . . . . . . 27.40 892.1.4 International students . . . . . . . . . . . . . . . . . . . . . . . . . . . . . . . . . . . . . . . . . . 7.00 712.1.5 Brain gain . . . . . . . . . . . . . . . . . . . . . . . . . . . . . . . . . . . . . . . . . . . . . . . . . . . . .55.83 372.2 Internal Openness . . . . . . . . . . . . . . . . . . . . . . . . . . . . . . . . . . . . . . . . . . 54.02 78
Social Inclusion2.2.1 Tolerance of minorities . . . . . . . . . . . . . . . . . . . . . . . . . . . . . . . . . . . . . . . . 81.11 92.2.2 Tolerance of immigrants . . . . . . . . . . . . . . . . . . . . . . . . . . . . . . . . . . . . . . 47.95 852.2.3 Social mobility . . . . . . . . . . . . . . . . . . . . . . . . . . . . . . . . . . . . . . . . . . . . . . . 44.88 104
Gender Equality2.2.4 Female graduates . . . . . . . . . . . . . . . . . . . . . . . . . . . . . . . . . . . . . . . . . . . . . 57.78 852.2.5 Gender development gap . . . . . . . . . . . . . . . . . . . . . . . . . . . . . . . . . . . .64.69 972.2.6 Leadership opportunities for women . . . . . . . . . . . . . . . . . . . . . . . . . 27.73 109
Score Rank
3 GROW . . . . . . . . . . . . . . . . . . . . . . . . . . . . . . . . . . . . . . . . . . . . .55.65 253.1 Formal Education . . . . . . . . . . . . . . . . . . . . . . . . . . . . . . . . . . . . . . . . . . . 54.13 13
Enrolment3.1.1 Vocational enrolment . . . . . . . . . . . . . . . . . . . . . . . . . . . . . . . . . . . . . . . . . 14.74 713.1.2 Tertiary enrolment . . . . . . . . . . . . . . . . . . . . . . . . . . . . . . . . . . . . . . . . . . . .74.04 4
Quality3.1.3 Tertiary education expenditure . . . . . . . . . . . . . . . . . . . . . . . . . . . . . . .22.47 583.1.4 Reading, maths, and science . . . . . . . . . . . . . . . . . . . . . . . . . . . . . . . . . .84.71 63.1.5 University ranking . . . . . . . . . . . . . . . . . . . . . . . . . . . . . . . . . . . . . . . . . . . . .74.68 83.2 Lifelong Learning . . . . . . . . . . . . . . . . . . . . . . . . . . . . . . . . . . . . . . . . . . . 55.56 353.2.1 Quality of management schools . . . . . . . . . . . . . . . . . . . . . . . . . . . . . .53.64 493.2.2 Prevalence of training in firms . . . . . . . . . . . . . . . . . . . . . . . . . . . . . . . . . . .n/a n/a3.2.3 Employee development . . . . . . . . . . . . . . . . . . . . . . . . . . . . . . . . . . . . . . 57.47 333.3 Access to Growth Opportunities . . . . . . . . . . . . . . . . . . . . . . . . . . . 57.27 34
Empowerment3.3.1 Delegation of authority . . . . . . . . . . . . . . . . . . . . . . . . . . . . . . . . . . . . . . .39.48 853.3.2 Personal rights . . . . . . . . . . . . . . . . . . . . . . . . . . . . . . . . . . . . . . . . . . . . . . . .94.05 27
Collaboration3.3.3 Use of virtual social networks . . . . . . . . . . . . . . . . . . . . . . . . . . . . . . . . .84.68 363.3.4 Use of virtual professional networks . . . . . . . . . . . . . . . . . . . . . . . . . . . 5.84 763.3.5 Collaboration within organisations . . . . . . . . . . . . . . . . . . . . . . . . . . . .58.98 373.3.6 Collaboration across organisations . . . . . . . . . . . . . . . . . . . . . . . . . . . .60.61 25
4 RETAIN . . . . . . . . . . . . . . . . . . . . . . . . . . . . . . . . . . . . . . . . . . . .69.40 264.1 Sustainability . . . . . . . . . . . . . . . . . . . . . . . . . . . . . . . . . . . . . . . . . . . . . . . 66.67 264.1.1 Pension system . . . . . . . . . . . . . . . . . . . . . . . . . . . . . . . . . . . . . . . . . . . . . . . 77.80 294.1.2 Social protection . . . . . . . . . . . . . . . . . . . . . . . . . . . . . . . . . . . . . . . . . . . . . .54.00 434.1.3 Brain retention . . . . . . . . . . . . . . . . . . . . . . . . . . . . . . . . . . . . . . . . . . . . . . . .68.21 254.2 Lifestyle . . . . . . . . . . . . . . . . . . . . . . . . . . . . . . . . . . . . . . . . . . . . . . . . . . . . 72.12 304.2.1 Environmental performance . . . . . . . . . . . . . . . . . . . . . . . . . . . . . . . . . . 58.13 534.2.2 Personal safety . . . . . . . . . . . . . . . . . . . . . . . . . . . . . . . . . . . . . . . . . . . . . . . .93.48 54.2.3 Physician density . . . . . . . . . . . . . . . . . . . . . . . . . . . . . . . . . . . . . . . . . . . . . .36.99 534.2.4 Sanitation . . . . . . . . . . . . . . . . . . . . . . . . . . . . . . . . . . . . . . . . . . . . . . . . . . . . .99.88 17
5 VOCATIONAL AND TECHNICAL SKILLS . . . . . . . . . . . . .57.58 305.1 Mid-Level Skills . . . . . . . . . . . . . . . . . . . . . . . . . . . . . . . . . . . . . . . . . . . . . 55.65 335.1.1 Workforce with secondary education . . . . . . . . . . . . . . . . . . . . . . . . .52.23 545.1.2 Population with secondary education . . . . . . . . . . . . . . . . . . . . . . . .50.42 435.1.3 Technicians and associate professionals . . . . . . . . . . . . . . . . . . . . . . .73.48 155.1.4 Labour productivity per employee . . . . . . . . . . . . . . . . . . . . . . . . . . . .46.47 295.2 Employability . . . . . . . . . . . . . . . . . . . . . . . . . . . . . . . . . . . . . . . . . . . . . . . 59.50 415.2.1 Ease of finding skilled employees . . . . . . . . . . . . . . . . . . . . . . . . . . . . . 74.02 235.2.2 Relevance of education system to the economy . . . . . . . . . . . . . 46.44 615.2.3 Skills matching with secondary education . . . . . . . . . . . . . . . . . . . .56.22 395.2.4 Skills matching with tertiary education . . . . . . . . . . . . . . . . . . . . . . . . 61.31 48
6 GLOBAL KNOWLEDGE SKILLS . . . . . . . . . . . . . . . . . . . . .52.81 206.1 High-Level Skills . . . . . . . . . . . . . . . . . . . . . . . . . . . . . . . . . . . . . . . . . . . . 58.79 166.1.1 Workforce with tertiary education . . . . . . . . . . . . . . . . . . . . . . . . . . . .68.89 96.1.2 Population with tertiary education . . . . . . . . . . . . . . . . . . . . . . . . . . . .64.45 96.1.3 Professionals . . . . . . . . . . . . . . . . . . . . . . . . . . . . . . . . . . . . . . . . . . . . . . . . . .52.37 206.1.4 Researchers . . . . . . . . . . . . . . . . . . . . . . . . . . . . . . . . . . . . . . . . . . . . . . . . . . . 91.07 46.1.5 Senior officials and managers . . . . . . . . . . . . . . . . . . . . . . . . . . . . . . . . . . 7.90 1026.1.6 Availability of scientists and engineers . . . . . . . . . . . . . . . . . . . . . . . .68.09 296.2 Talent Impact . . . . . . . . . . . . . . . . . . . . . . . . . . . . . . . . . . . . . . . . . . . . . . .46.83 256.2.1 Innovation output . . . . . . . . . . . . . . . . . . . . . . . . . . . . . . . . . . . . . . . . . . . . 71.45 136.2.2 High-value exports . . . . . . . . . . . . . . . . . . . . . . . . . . . . . . . . . . . . . . . . . . . .42.23 206.2.3 New product entrepreneurial activity . . . . . . . . . . . . . . . . . . . . . . . . .59.30 256.2.4 New business density . . . . . . . . . . . . . . . . . . . . . . . . . . . . . . . . . . . . . . . . . 12.39 426.2.5 Scientific journal articles . . . . . . . . . . . . . . . . . . . . . . . . . . . . . . . . . . . . . .48.75 23
l Korea, Rep. l Income group average
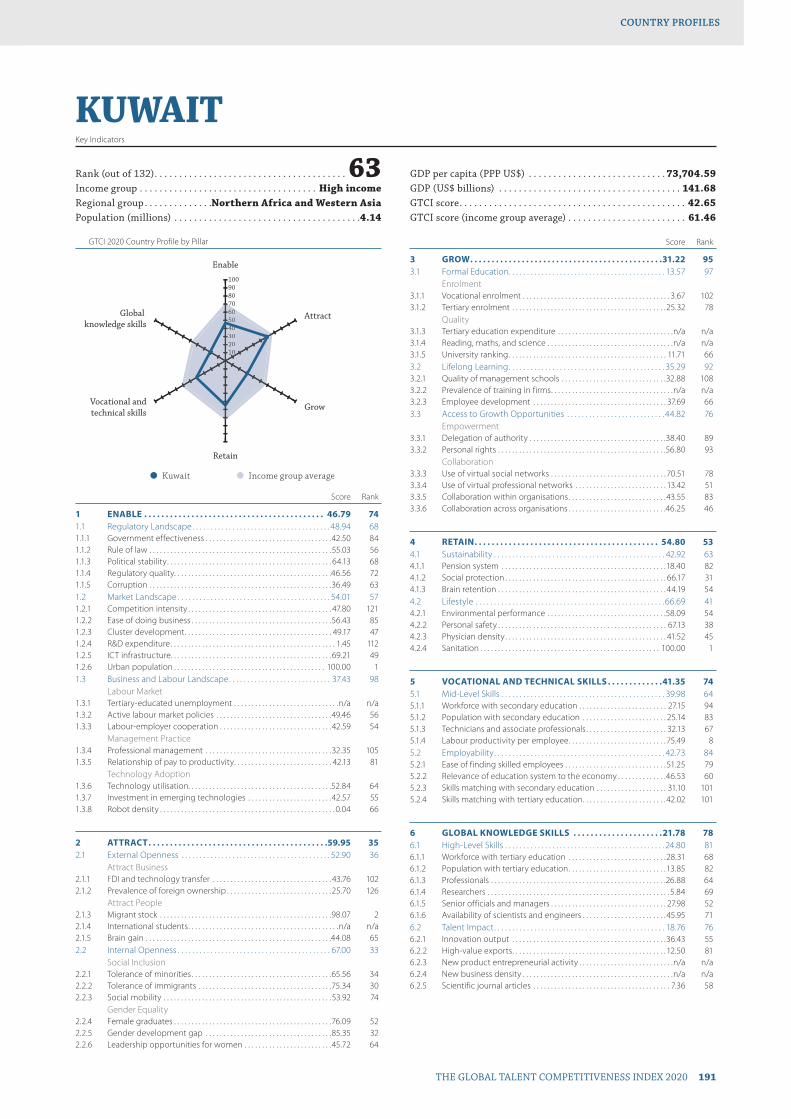
GTCI 2020 Country Profile by Pillar
THE GLOBAL TALENT COMPETITIVENESS INDEX 2020 191
COUNTRY PROFILESCOUNTRY PROFILES
102030405060708090100
Global knowledge skills
Vocational andtechnical skills
Retain
Grow
Attract
Enable
102030405060607
KUWAITKey Indicators
Rank (out of 132) . . . . . . . . . . . . . . . . . . . . . . . . . . . . . . . . . . . . . . . 63Income group . . . . . . . . . . . . . . . . . . . . . . . . . . . . . . . . . . . . High incomeRegional group . . . . . . . . . . . . . .Northern Africa and Western AsiaPopulation (millions) . . . . . . . . . . . . . . . . . . . . . . . . . . . . . . . . . . . . . .4.14
GDP per capita (PPP US$) . . . . . . . . . . . . . . . . . . . . . . . . . . . . 73,704.59GDP (US$ billions) . . . . . . . . . . . . . . . . . . . . . . . . . . . . . . . . . . . . . 141.68GTCI score . . . . . . . . . . . . . . . . . . . . . . . . . . . . . . . . . . . . . . . . . . . . . . 42.65GTCI score (income group average) . . . . . . . . . . . . . . . . . . . . . . . . 61.46
Score Rank
1 ENABLE . . . . . . . . . . . . . . . . . . . . . . . . . . . . . . . . . . . . . . . . . . 46.79 741.1 Regulatory Landscape . . . . . . . . . . . . . . . . . . . . . . . . . . . . . . . . . . . . . .48.94 681.1.1 Government effectiveness . . . . . . . . . . . . . . . . . . . . . . . . . . . . . . . . . . . .42.50 841.1.2 Rule of law . . . . . . . . . . . . . . . . . . . . . . . . . . . . . . . . . . . . . . . . . . . . . . . . . . . .55.03 561.1.3 Political stability . . . . . . . . . . . . . . . . . . . . . . . . . . . . . . . . . . . . . . . . . . . . . . . 64.13 681.1.4 Regulatory quality. . . . . . . . . . . . . . . . . . . . . . . . . . . . . . . . . . . . . . . . . . . . .46.56 721.1.5 Corruption . . . . . . . . . . . . . . . . . . . . . . . . . . . . . . . . . . . . . . . . . . . . . . . . . . . .36.49 631.2 Market Landscape . . . . . . . . . . . . . . . . . . . . . . . . . . . . . . . . . . . . . . . . . . 54.01 571.2.1 Competition intensity . . . . . . . . . . . . . . . . . . . . . . . . . . . . . . . . . . . . . . . . . 47.80 1211.2.2 Ease of doing business . . . . . . . . . . . . . . . . . . . . . . . . . . . . . . . . . . . . . . . .56.43 851.2.3 Cluster development . . . . . . . . . . . . . . . . . . . . . . . . . . . . . . . . . . . . . . . . . . 49.17 471.2.4 R&D expenditure . . . . . . . . . . . . . . . . . . . . . . . . . . . . . . . . . . . . . . . . . . . . . . . 1.45 1121.2.5 ICT infrastructure. . . . . . . . . . . . . . . . . . . . . . . . . . . . . . . . . . . . . . . . . . . . . .69.21 491.2.6 Urban population . . . . . . . . . . . . . . . . . . . . . . . . . . . . . . . . . . . . . . . . . . . 100.00 11.3 Business and Labour Landscape . . . . . . . . . . . . . . . . . . . . . . . . . . . . 37.43 98
Labour Market1.3.1 Tertiary-educated unemployment . . . . . . . . . . . . . . . . . . . . . . . . . . . . . .n/a n/a1.3.2 Active labour market policies . . . . . . . . . . . . . . . . . . . . . . . . . . . . . . . . .49.46 561.3.3 Labour-employer cooperation . . . . . . . . . . . . . . . . . . . . . . . . . . . . . . . .42.59 54
Management Practice1.3.4 Professional management . . . . . . . . . . . . . . . . . . . . . . . . . . . . . . . . . . . .32.35 1051.3.5 Relationship of pay to productivity . . . . . . . . . . . . . . . . . . . . . . . . . . . . 42.13 81
Technology Adoption1.3.6 Technology utilisation. . . . . . . . . . . . . . . . . . . . . . . . . . . . . . . . . . . . . . . . .52.84 641.3.7 Investment in emerging technologies . . . . . . . . . . . . . . . . . . . . . . . .42.57 551.3.8 Robot density . . . . . . . . . . . . . . . . . . . . . . . . . . . . . . . . . . . . . . . . . . . . . . . . . . 0.04 66
2 ATTRACT . . . . . . . . . . . . . . . . . . . . . . . . . . . . . . . . . . . . . . . . . .59.95 352.1 External Openness . . . . . . . . . . . . . . . . . . . . . . . . . . . . . . . . . . . . . . . . . 52.90 36
Attract Business2.1.1 FDI and technology transfer . . . . . . . . . . . . . . . . . . . . . . . . . . . . . . . . . . 43.76 1022.1.2 Prevalence of foreign ownership . . . . . . . . . . . . . . . . . . . . . . . . . . . . . .25.70 126
Attract People2.1.3 Migrant stock . . . . . . . . . . . . . . . . . . . . . . . . . . . . . . . . . . . . . . . . . . . . . . . . .98.07 22.1.4 International students . . . . . . . . . . . . . . . . . . . . . . . . . . . . . . . . . . . . . . . . . . .n/a n/a2.1.5 Brain gain . . . . . . . . . . . . . . . . . . . . . . . . . . . . . . . . . . . . . . . . . . . . . . . . . . . . .44.08 652.2 Internal Openness . . . . . . . . . . . . . . . . . . . . . . . . . . . . . . . . . . . . . . . . . . 67.00 33
Social Inclusion2.2.1 Tolerance of minorities . . . . . . . . . . . . . . . . . . . . . . . . . . . . . . . . . . . . . . . .65.56 342.2.2 Tolerance of immigrants . . . . . . . . . . . . . . . . . . . . . . . . . . . . . . . . . . . . . .75.34 302.2.3 Social mobility . . . . . . . . . . . . . . . . . . . . . . . . . . . . . . . . . . . . . . . . . . . . . . . . 53.92 74
Gender Equality2.2.4 Female graduates . . . . . . . . . . . . . . . . . . . . . . . . . . . . . . . . . . . . . . . . . . . . .76.09 522.2.5 Gender development gap . . . . . . . . . . . . . . . . . . . . . . . . . . . . . . . . . . . .85.35 322.2.6 Leadership opportunities for women . . . . . . . . . . . . . . . . . . . . . . . . .45.72 64
Score Rank
3 GROW . . . . . . . . . . . . . . . . . . . . . . . . . . . . . . . . . . . . . . . . . . . . .31.22 953.1 Formal Education . . . . . . . . . . . . . . . . . . . . . . . . . . . . . . . . . . . . . . . . . . . 13.57 97
Enrolment3.1.1 Vocational enrolment . . . . . . . . . . . . . . . . . . . . . . . . . . . . . . . . . . . . . . . . . . 3.67 1023.1.2 Tertiary enrolment . . . . . . . . . . . . . . . . . . . . . . . . . . . . . . . . . . . . . . . . . . . .25.32 78
Quality3.1.3 Tertiary education expenditure . . . . . . . . . . . . . . . . . . . . . . . . . . . . . . . . .n/a n/a3.1.4 Reading, maths, and science . . . . . . . . . . . . . . . . . . . . . . . . . . . . . . . . . . . .n/a n/a3.1.5 University ranking . . . . . . . . . . . . . . . . . . . . . . . . . . . . . . . . . . . . . . . . . . . . . 11.71 663.2 Lifelong Learning . . . . . . . . . . . . . . . . . . . . . . . . . . . . . . . . . . . . . . . . . . . 35.29 923.2.1 Quality of management schools . . . . . . . . . . . . . . . . . . . . . . . . . . . . . .32.88 1083.2.2 Prevalence of training in firms . . . . . . . . . . . . . . . . . . . . . . . . . . . . . . . . . . .n/a n/a3.2.3 Employee development . . . . . . . . . . . . . . . . . . . . . . . . . . . . . . . . . . . . . . 37.69 663.3 Access to Growth Opportunities . . . . . . . . . . . . . . . . . . . . . . . . . . .44.82 76
Empowerment3.3.1 Delegation of authority . . . . . . . . . . . . . . . . . . . . . . . . . . . . . . . . . . . . . . .38.40 893.3.2 Personal rights . . . . . . . . . . . . . . . . . . . . . . . . . . . . . . . . . . . . . . . . . . . . . . . .56.80 93
Collaboration3.3.3 Use of virtual social networks . . . . . . . . . . . . . . . . . . . . . . . . . . . . . . . . . 70.51 783.3.4 Use of virtual professional networks . . . . . . . . . . . . . . . . . . . . . . . . . . 13.42 513.3.5 Collaboration within organisations . . . . . . . . . . . . . . . . . . . . . . . . . . . .43.55 833.3.6 Collaboration across organisations . . . . . . . . . . . . . . . . . . . . . . . . . . . .46.25 46
4 RETAIN . . . . . . . . . . . . . . . . . . . . . . . . . . . . . . . . . . . . . . . . . . . 54.80 534.1 Sustainability . . . . . . . . . . . . . . . . . . . . . . . . . . . . . . . . . . . . . . . . . . . . . . . 42.92 634.1.1 Pension system . . . . . . . . . . . . . . . . . . . . . . . . . . . . . . . . . . . . . . . . . . . . . . .18.40 824.1.2 Social protection . . . . . . . . . . . . . . . . . . . . . . . . . . . . . . . . . . . . . . . . . . . . . . 66.17 314.1.3 Brain retention . . . . . . . . . . . . . . . . . . . . . . . . . . . . . . . . . . . . . . . . . . . . . . . . 44.19 544.2 Lifestyle . . . . . . . . . . . . . . . . . . . . . . . . . . . . . . . . . . . . . . . . . . . . . . . . . . . . 66.69 414.2.1 Environmental performance . . . . . . . . . . . . . . . . . . . . . . . . . . . . . . . . . .58.09 544.2.2 Personal safety . . . . . . . . . . . . . . . . . . . . . . . . . . . . . . . . . . . . . . . . . . . . . . . . 67.13 384.2.3 Physician density . . . . . . . . . . . . . . . . . . . . . . . . . . . . . . . . . . . . . . . . . . . . . . 41.52 454.2.4 Sanitation . . . . . . . . . . . . . . . . . . . . . . . . . . . . . . . . . . . . . . . . . . . . . . . . . . . 100.00 1
5 VOCATIONAL AND TECHNICAL SKILLS . . . . . . . . . . . . .41.35 745.1 Mid-Level Skills . . . . . . . . . . . . . . . . . . . . . . . . . . . . . . . . . . . . . . . . . . . . . 39.98 645.1.1 Workforce with secondary education . . . . . . . . . . . . . . . . . . . . . . . . . 27.15 945.1.2 Population with secondary education . . . . . . . . . . . . . . . . . . . . . . . . 25.14 835.1.3 Technicians and associate professionals . . . . . . . . . . . . . . . . . . . . . . . 32.13 675.1.4 Labour productivity per employee . . . . . . . . . . . . . . . . . . . . . . . . . . . . 75.49 85.2 Employability . . . . . . . . . . . . . . . . . . . . . . . . . . . . . . . . . . . . . . . . . . . . . . . 42.73 845.2.1 Ease of finding skilled employees . . . . . . . . . . . . . . . . . . . . . . . . . . . . . 51.25 795.2.2 Relevance of education system to the economy . . . . . . . . . . . . . .46.53 605.2.3 Skills matching with secondary education . . . . . . . . . . . . . . . . . . . . 31.10 1015.2.4 Skills matching with tertiary education . . . . . . . . . . . . . . . . . . . . . . . .42.02 101
6 GLOBAL KNOWLEDGE SKILLS . . . . . . . . . . . . . . . . . . . . .21.78 786.1 High-Level Skills . . . . . . . . . . . . . . . . . . . . . . . . . . . . . . . . . . . . . . . . . . . . 24.80 816.1.1 Workforce with tertiary education . . . . . . . . . . . . . . . . . . . . . . . . . . . .28.31 686.1.2 Population with tertiary education . . . . . . . . . . . . . . . . . . . . . . . . . . . . 13.85 826.1.3 Professionals . . . . . . . . . . . . . . . . . . . . . . . . . . . . . . . . . . . . . . . . . . . . . . . . . .26.88 646.1.4 Researchers . . . . . . . . . . . . . . . . . . . . . . . . . . . . . . . . . . . . . . . . . . . . . . . . . . . . 5.84 696.1.5 Senior officials and managers . . . . . . . . . . . . . . . . . . . . . . . . . . . . . . . . . 27.98 526.1.6 Availability of scientists and engineers . . . . . . . . . . . . . . . . . . . . . . . .45.95 716.2 Talent Impact . . . . . . . . . . . . . . . . . . . . . . . . . . . . . . . . . . . . . . . . . . . . . . . 18.76 766.2.1 Innovation output . . . . . . . . . . . . . . . . . . . . . . . . . . . . . . . . . . . . . . . . . . . .36.43 556.2.2 High-value exports . . . . . . . . . . . . . . . . . . . . . . . . . . . . . . . . . . . . . . . . . . . . 12.50 816.2.3 New product entrepreneurial activity . . . . . . . . . . . . . . . . . . . . . . . . . . .n/a n/a6.2.4 New business density . . . . . . . . . . . . . . . . . . . . . . . . . . . . . . . . . . . . . . . . . . .n/a n/a6.2.5 Scientific journal articles . . . . . . . . . . . . . . . . . . . . . . . . . . . . . . . . . . . . . . . 7.36 58
l Kuwait l Income group average
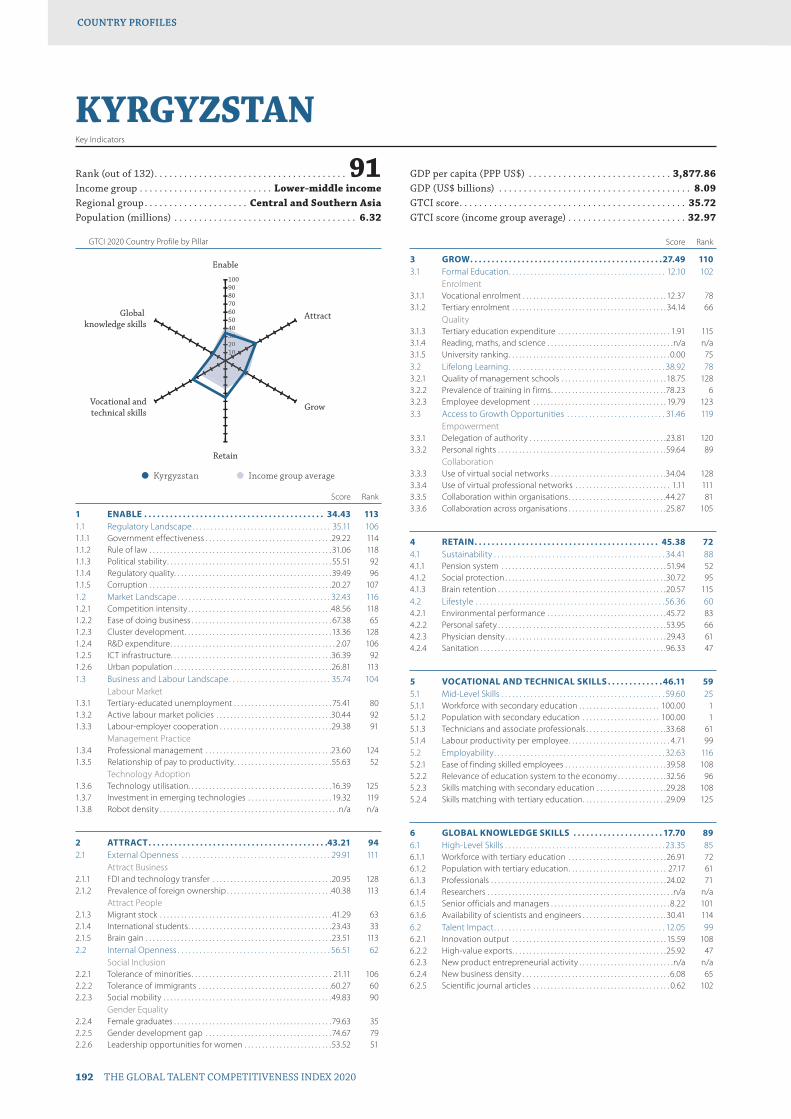
GTCI 2020 Country Profile by Pillar
192 THE GLOBAL TALENT COMPETITIVENESS INDEX 2020
COUNTRY PROFILESCOUNTRY PROFILES
102030405060708090100
Global knowledge skills
Vocational andtechnical skills
Retain
Grow
Attract
Enable
10203004
KYRGYZSTANKey Indicators
Rank (out of 132) . . . . . . . . . . . . . . . . . . . . . . . . . . . . . . . . . . . . . . . 91Income group . . . . . . . . . . . . . . . . . . . . . . . . . . . Lower-middle incomeRegional group . . . . . . . . . . . . . . . . . . . . . Central and Southern AsiaPopulation (millions) . . . . . . . . . . . . . . . . . . . . . . . . . . . . . . . . . . . . . 6.32
GDP per capita (PPP US$) . . . . . . . . . . . . . . . . . . . . . . . . . . . . . 3,877.86GDP (US$ billions) . . . . . . . . . . . . . . . . . . . . . . . . . . . . . . . . . . . . . . . 8.09GTCI score . . . . . . . . . . . . . . . . . . . . . . . . . . . . . . . . . . . . . . . . . . . . . . 35.72GTCI score (income group average) . . . . . . . . . . . . . . . . . . . . . . . . 32.97
Score Rank
1 ENABLE . . . . . . . . . . . . . . . . . . . . . . . . . . . . . . . . . . . . . . . . . . 34.43 1131.1 Regulatory Landscape . . . . . . . . . . . . . . . . . . . . . . . . . . . . . . . . . . . . . . 35.11 1061.1.1 Government effectiveness . . . . . . . . . . . . . . . . . . . . . . . . . . . . . . . . . . . .29.22 1141.1.2 Rule of law . . . . . . . . . . . . . . . . . . . . . . . . . . . . . . . . . . . . . . . . . . . . . . . . . . . . 31.06 1181.1.3 Political stability . . . . . . . . . . . . . . . . . . . . . . . . . . . . . . . . . . . . . . . . . . . . . . . 55.51 921.1.4 Regulatory quality. . . . . . . . . . . . . . . . . . . . . . . . . . . . . . . . . . . . . . . . . . . . . 39.49 961.1.5 Corruption . . . . . . . . . . . . . . . . . . . . . . . . . . . . . . . . . . . . . . . . . . . . . . . . . . . .20.27 1071.2 Market Landscape . . . . . . . . . . . . . . . . . . . . . . . . . . . . . . . . . . . . . . . . . . 32.43 1161.2.1 Competition intensity . . . . . . . . . . . . . . . . . . . . . . . . . . . . . . . . . . . . . . . . .48.56 1181.2.2 Ease of doing business . . . . . . . . . . . . . . . . . . . . . . . . . . . . . . . . . . . . . . . . 67.38 651.2.3 Cluster development . . . . . . . . . . . . . . . . . . . . . . . . . . . . . . . . . . . . . . . . . .13.36 1281.2.4 R&D expenditure . . . . . . . . . . . . . . . . . . . . . . . . . . . . . . . . . . . . . . . . . . . . . . . 2.07 1061.2.5 ICT infrastructure. . . . . . . . . . . . . . . . . . . . . . . . . . . . . . . . . . . . . . . . . . . . . .36.39 921.2.6 Urban population . . . . . . . . . . . . . . . . . . . . . . . . . . . . . . . . . . . . . . . . . . . . .26.81 1131.3 Business and Labour Landscape . . . . . . . . . . . . . . . . . . . . . . . . . . . . 35.74 104
Labour Market1.3.1 Tertiary-educated unemployment . . . . . . . . . . . . . . . . . . . . . . . . . . . . 75.41 801.3.2 Active labour market policies . . . . . . . . . . . . . . . . . . . . . . . . . . . . . . . . .30.44 921.3.3 Labour-employer cooperation . . . . . . . . . . . . . . . . . . . . . . . . . . . . . . . .29.38 91
Management Practice1.3.4 Professional management . . . . . . . . . . . . . . . . . . . . . . . . . . . . . . . . . . . .23.60 1241.3.5 Relationship of pay to productivity . . . . . . . . . . . . . . . . . . . . . . . . . . . .55.63 52
Technology Adoption1.3.6 Technology utilisation. . . . . . . . . . . . . . . . . . . . . . . . . . . . . . . . . . . . . . . . .16.39 1251.3.7 Investment in emerging technologies . . . . . . . . . . . . . . . . . . . . . . . . 19.32 1191.3.8 Robot density . . . . . . . . . . . . . . . . . . . . . . . . . . . . . . . . . . . . . . . . . . . . . . . . . . .n/a n/a
2 ATTRACT . . . . . . . . . . . . . . . . . . . . . . . . . . . . . . . . . . . . . . . . . .43.21 942.1 External Openness . . . . . . . . . . . . . . . . . . . . . . . . . . . . . . . . . . . . . . . . . 29.91 111
Attract Business2.1.1 FDI and technology transfer . . . . . . . . . . . . . . . . . . . . . . . . . . . . . . . . . .20.95 1282.1.2 Prevalence of foreign ownership . . . . . . . . . . . . . . . . . . . . . . . . . . . . . .40.38 113
Attract People2.1.3 Migrant stock . . . . . . . . . . . . . . . . . . . . . . . . . . . . . . . . . . . . . . . . . . . . . . . . . 41.29 632.1.4 International students . . . . . . . . . . . . . . . . . . . . . . . . . . . . . . . . . . . . . . . . .23.43 332.1.5 Brain gain . . . . . . . . . . . . . . . . . . . . . . . . . . . . . . . . . . . . . . . . . . . . . . . . . . . . .23.51 1132.2 Internal Openness . . . . . . . . . . . . . . . . . . . . . . . . . . . . . . . . . . . . . . . . . . 56.51 62
Social Inclusion2.2.1 Tolerance of minorities . . . . . . . . . . . . . . . . . . . . . . . . . . . . . . . . . . . . . . . . 21.11 1062.2.2 Tolerance of immigrants . . . . . . . . . . . . . . . . . . . . . . . . . . . . . . . . . . . . . .60.27 602.2.3 Social mobility . . . . . . . . . . . . . . . . . . . . . . . . . . . . . . . . . . . . . . . . . . . . . . . .49.83 90
Gender Equality2.2.4 Female graduates . . . . . . . . . . . . . . . . . . . . . . . . . . . . . . . . . . . . . . . . . . . . .79.63 352.2.5 Gender development gap . . . . . . . . . . . . . . . . . . . . . . . . . . . . . . . . . . . . 74.67 792.2.6 Leadership opportunities for women . . . . . . . . . . . . . . . . . . . . . . . . .53.52 51
Score Rank
3 GROW . . . . . . . . . . . . . . . . . . . . . . . . . . . . . . . . . . . . . . . . . . . . .27.49 1103.1 Formal Education . . . . . . . . . . . . . . . . . . . . . . . . . . . . . . . . . . . . . . . . . . . 12.10 102
Enrolment3.1.1 Vocational enrolment . . . . . . . . . . . . . . . . . . . . . . . . . . . . . . . . . . . . . . . . . 12.37 783.1.2 Tertiary enrolment . . . . . . . . . . . . . . . . . . . . . . . . . . . . . . . . . . . . . . . . . . . . 34.14 66
Quality3.1.3 Tertiary education expenditure . . . . . . . . . . . . . . . . . . . . . . . . . . . . . . . . 1.91 1153.1.4 Reading, maths, and science . . . . . . . . . . . . . . . . . . . . . . . . . . . . . . . . . . . .n/a n/a3.1.5 University ranking . . . . . . . . . . . . . . . . . . . . . . . . . . . . . . . . . . . . . . . . . . . . . . 0.00 753.2 Lifelong Learning . . . . . . . . . . . . . . . . . . . . . . . . . . . . . . . . . . . . . . . . . . . 38.92 783.2.1 Quality of management schools . . . . . . . . . . . . . . . . . . . . . . . . . . . . . . 18.75 1283.2.2 Prevalence of training in firms . . . . . . . . . . . . . . . . . . . . . . . . . . . . . . . . .78.23 63.2.3 Employee development . . . . . . . . . . . . . . . . . . . . . . . . . . . . . . . . . . . . . . 19.79 1233.3 Access to Growth Opportunities . . . . . . . . . . . . . . . . . . . . . . . . . . . 31.46 119
Empowerment3.3.1 Delegation of authority . . . . . . . . . . . . . . . . . . . . . . . . . . . . . . . . . . . . . . .23.81 1203.3.2 Personal rights . . . . . . . . . . . . . . . . . . . . . . . . . . . . . . . . . . . . . . . . . . . . . . . .59.64 89
Collaboration3.3.3 Use of virtual social networks . . . . . . . . . . . . . . . . . . . . . . . . . . . . . . . . .34.04 1283.3.4 Use of virtual professional networks . . . . . . . . . . . . . . . . . . . . . . . . . . . 1.11 1113.3.5 Collaboration within organisations . . . . . . . . . . . . . . . . . . . . . . . . . . . .44.27 813.3.6 Collaboration across organisations . . . . . . . . . . . . . . . . . . . . . . . . . . . .25.87 105
4 RETAIN . . . . . . . . . . . . . . . . . . . . . . . . . . . . . . . . . . . . . . . . . . . 45.38 724.1 Sustainability . . . . . . . . . . . . . . . . . . . . . . . . . . . . . . . . . . . . . . . . . . . . . . . 34.41 884.1.1 Pension system . . . . . . . . . . . . . . . . . . . . . . . . . . . . . . . . . . . . . . . . . . . . . . . 51.94 524.1.2 Social protection . . . . . . . . . . . . . . . . . . . . . . . . . . . . . . . . . . . . . . . . . . . . . .30.72 954.1.3 Brain retention . . . . . . . . . . . . . . . . . . . . . . . . . . . . . . . . . . . . . . . . . . . . . . . .20.57 1154.2 Lifestyle . . . . . . . . . . . . . . . . . . . . . . . . . . . . . . . . . . . . . . . . . . . . . . . . . . . . 56.36 604.2.1 Environmental performance . . . . . . . . . . . . . . . . . . . . . . . . . . . . . . . . . .45.72 834.2.2 Personal safety . . . . . . . . . . . . . . . . . . . . . . . . . . . . . . . . . . . . . . . . . . . . . . . .53.95 664.2.3 Physician density . . . . . . . . . . . . . . . . . . . . . . . . . . . . . . . . . . . . . . . . . . . . . . 29.43 614.2.4 Sanitation . . . . . . . . . . . . . . . . . . . . . . . . . . . . . . . . . . . . . . . . . . . . . . . . . . . . .96.33 47
5 VOCATIONAL AND TECHNICAL SKILLS . . . . . . . . . . . . .46.11 595.1 Mid-Level Skills . . . . . . . . . . . . . . . . . . . . . . . . . . . . . . . . . . . . . . . . . . . . . 59.60 255.1.1 Workforce with secondary education . . . . . . . . . . . . . . . . . . . . . . . 100.00 15.1.2 Population with secondary education . . . . . . . . . . . . . . . . . . . . . . 100.00 15.1.3 Technicians and associate professionals . . . . . . . . . . . . . . . . . . . . . . .33.68 615.1.4 Labour productivity per employee . . . . . . . . . . . . . . . . . . . . . . . . . . . . . 4.71 995.2 Employability . . . . . . . . . . . . . . . . . . . . . . . . . . . . . . . . . . . . . . . . . . . . . . . 32.63 1165.2.1 Ease of finding skilled employees . . . . . . . . . . . . . . . . . . . . . . . . . . . . .39.58 1085.2.2 Relevance of education system to the economy . . . . . . . . . . . . . .32.56 965.2.3 Skills matching with secondary education . . . . . . . . . . . . . . . . . . . .29.28 1085.2.4 Skills matching with tertiary education . . . . . . . . . . . . . . . . . . . . . . . .29.09 125
6 GLOBAL KNOWLEDGE SKILLS . . . . . . . . . . . . . . . . . . . . . 17.70 896.1 High-Level Skills . . . . . . . . . . . . . . . . . . . . . . . . . . . . . . . . . . . . . . . . . . . . 23.35 856.1.1 Workforce with tertiary education . . . . . . . . . . . . . . . . . . . . . . . . . . . . 26.91 726.1.2 Population with tertiary education . . . . . . . . . . . . . . . . . . . . . . . . . . . . 27.17 616.1.3 Professionals . . . . . . . . . . . . . . . . . . . . . . . . . . . . . . . . . . . . . . . . . . . . . . . . . .24.02 716.1.4 Researchers . . . . . . . . . . . . . . . . . . . . . . . . . . . . . . . . . . . . . . . . . . . . . . . . . . . . .n/a n/a6.1.5 Senior officials and managers . . . . . . . . . . . . . . . . . . . . . . . . . . . . . . . . . . 8.22 1016.1.6 Availability of scientists and engineers . . . . . . . . . . . . . . . . . . . . . . . . 30.41 1146.2 Talent Impact . . . . . . . . . . . . . . . . . . . . . . . . . . . . . . . . . . . . . . . . . . . . . . . 12.05 996.2.1 Innovation output . . . . . . . . . . . . . . . . . . . . . . . . . . . . . . . . . . . . . . . . . . . . 15.59 1086.2.2 High-value exports . . . . . . . . . . . . . . . . . . . . . . . . . . . . . . . . . . . . . . . . . . . .25.92 476.2.3 New product entrepreneurial activity . . . . . . . . . . . . . . . . . . . . . . . . . . .n/a n/a6.2.4 New business density . . . . . . . . . . . . . . . . . . . . . . . . . . . . . . . . . . . . . . . . . . 6.08 656.2.5 Scientific journal articles . . . . . . . . . . . . . . . . . . . . . . . . . . . . . . . . . . . . . . . 0.62 102
l Kyrgyzstan l Income group average
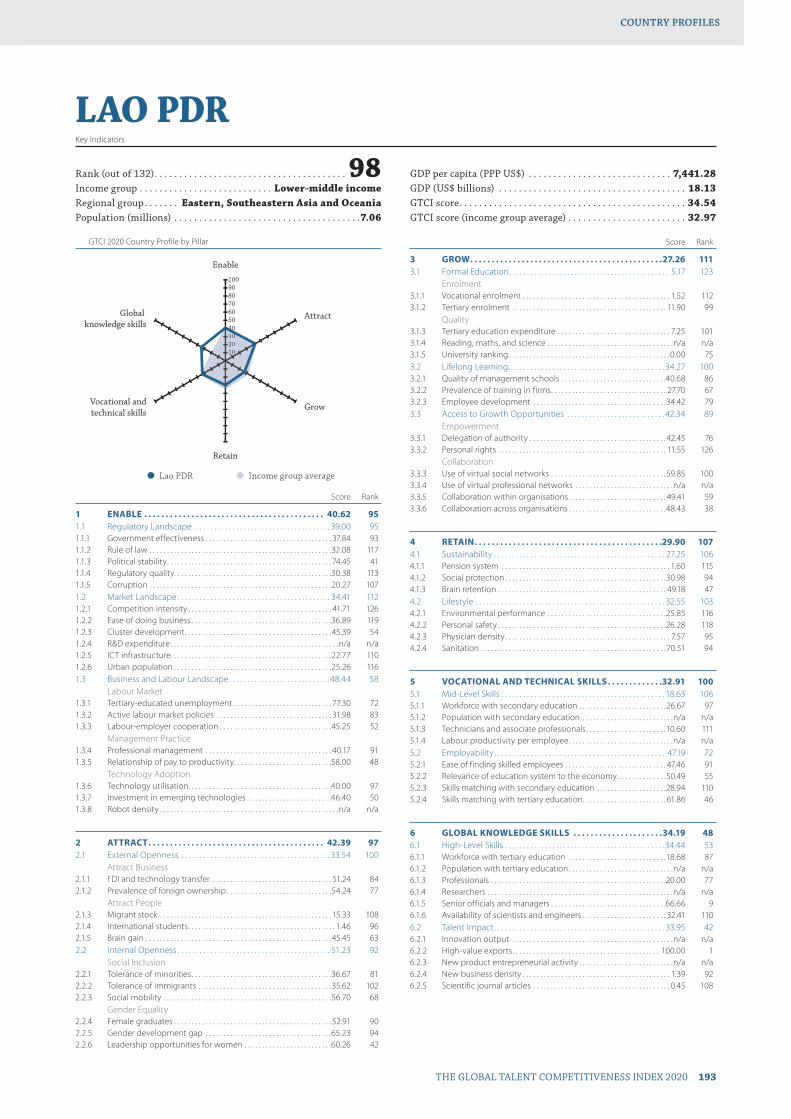
GTCI 2020 Country Profile by Pillar
THE GLOBAL TALENT COMPETITIVENESS INDEX 2020 193
COUNTRY PROFILESCOUNTRY PROFILES
102030405060708090100
Global knowledge skills
Vocational andtechnical skills
Retain
Grow
Attract
Enable
10203004
LAO PDRKey Indicators
Rank (out of 132) . . . . . . . . . . . . . . . . . . . . . . . . . . . . . . . . . . . . . . . 98Income group . . . . . . . . . . . . . . . . . . . . . . . . . . . Lower-middle incomeRegional group . . . . . . . Eastern, Southeastern Asia and OceaniaPopulation (millions) . . . . . . . . . . . . . . . . . . . . . . . . . . . . . . . . . . . . . .7.06
GDP per capita (PPP US$) . . . . . . . . . . . . . . . . . . . . . . . . . . . . . 7,441.28GDP (US$ billions) . . . . . . . . . . . . . . . . . . . . . . . . . . . . . . . . . . . . . . 18.13GTCI score . . . . . . . . . . . . . . . . . . . . . . . . . . . . . . . . . . . . . . . . . . . . . . 34.54GTCI score (income group average) . . . . . . . . . . . . . . . . . . . . . . . . 32.97
Score Rank
1 ENABLE . . . . . . . . . . . . . . . . . . . . . . . . . . . . . . . . . . . . . . . . . . 40.62 951.1 Regulatory Landscape . . . . . . . . . . . . . . . . . . . . . . . . . . . . . . . . . . . . . . 39.00 951.1.1 Government effectiveness . . . . . . . . . . . . . . . . . . . . . . . . . . . . . . . . . . . . 37.84 931.1.2 Rule of law . . . . . . . . . . . . . . . . . . . . . . . . . . . . . . . . . . . . . . . . . . . . . . . . . . . .32.08 1171.1.3 Political stability . . . . . . . . . . . . . . . . . . . . . . . . . . . . . . . . . . . . . . . . . . . . . . . 74.45 411.1.4 Regulatory quality. . . . . . . . . . . . . . . . . . . . . . . . . . . . . . . . . . . . . . . . . . . . .30.38 1131.1.5 Corruption . . . . . . . . . . . . . . . . . . . . . . . . . . . . . . . . . . . . . . . . . . . . . . . . . . . .20.27 1071.2 Market Landscape . . . . . . . . . . . . . . . . . . . . . . . . . . . . . . . . . . . . . . . . . . 34.41 1121.2.1 Competition intensity . . . . . . . . . . . . . . . . . . . . . . . . . . . . . . . . . . . . . . . . . 41.71 1261.2.2 Ease of doing business . . . . . . . . . . . . . . . . . . . . . . . . . . . . . . . . . . . . . . . .36.89 1191.2.3 Cluster development . . . . . . . . . . . . . . . . . . . . . . . . . . . . . . . . . . . . . . . . . .45.39 541.2.4 R&D expenditure . . . . . . . . . . . . . . . . . . . . . . . . . . . . . . . . . . . . . . . . . . . . . . . .n/a n/a1.2.5 ICT infrastructure. . . . . . . . . . . . . . . . . . . . . . . . . . . . . . . . . . . . . . . . . . . . . .22.77 1101.2.6 Urban population . . . . . . . . . . . . . . . . . . . . . . . . . . . . . . . . . . . . . . . . . . . . .25.26 1161.3 Business and Labour Landscape . . . . . . . . . . . . . . . . . . . . . . . . . . . .48.44 58
Labour Market1.3.1 Tertiary-educated unemployment . . . . . . . . . . . . . . . . . . . . . . . . . . . . 77.30 721.3.2 Active labour market policies . . . . . . . . . . . . . . . . . . . . . . . . . . . . . . . . . 31.98 831.3.3 Labour-employer cooperation . . . . . . . . . . . . . . . . . . . . . . . . . . . . . . . .45.25 52
Management Practice1.3.4 Professional management . . . . . . . . . . . . . . . . . . . . . . . . . . . . . . . . . . . . 40.17 911.3.5 Relationship of pay to productivity . . . . . . . . . . . . . . . . . . . . . . . . . . . .58.00 48
Technology Adoption1.3.6 Technology utilisation. . . . . . . . . . . . . . . . . . . . . . . . . . . . . . . . . . . . . . . . .40.00 971.3.7 Investment in emerging technologies . . . . . . . . . . . . . . . . . . . . . . . .46.40 501.3.8 Robot density . . . . . . . . . . . . . . . . . . . . . . . . . . . . . . . . . . . . . . . . . . . . . . . . . . .n/a n/a
2 ATTRACT . . . . . . . . . . . . . . . . . . . . . . . . . . . . . . . . . . . . . . . . . 42.39 972.1 External Openness . . . . . . . . . . . . . . . . . . . . . . . . . . . . . . . . . . . . . . . . . 33.54 100
Attract Business2.1.1 FDI and technology transfer . . . . . . . . . . . . . . . . . . . . . . . . . . . . . . . . . . 51.24 842.1.2 Prevalence of foreign ownership . . . . . . . . . . . . . . . . . . . . . . . . . . . . . .54.24 77
Attract People2.1.3 Migrant stock . . . . . . . . . . . . . . . . . . . . . . . . . . . . . . . . . . . . . . . . . . . . . . . . . 15.33 1082.1.4 International students . . . . . . . . . . . . . . . . . . . . . . . . . . . . . . . . . . . . . . . . . . 1.46 962.1.5 Brain gain . . . . . . . . . . . . . . . . . . . . . . . . . . . . . . . . . . . . . . . . . . . . . . . . . . . . . 45.45 632.2 Internal Openness . . . . . . . . . . . . . . . . . . . . . . . . . . . . . . . . . . . . . . . . . . 51.23 92
Social Inclusion2.2.1 Tolerance of minorities . . . . . . . . . . . . . . . . . . . . . . . . . . . . . . . . . . . . . . . .36.67 812.2.2 Tolerance of immigrants . . . . . . . . . . . . . . . . . . . . . . . . . . . . . . . . . . . . . .35.62 1022.2.3 Social mobility . . . . . . . . . . . . . . . . . . . . . . . . . . . . . . . . . . . . . . . . . . . . . . . .56.70 68
Gender Equality2.2.4 Female graduates . . . . . . . . . . . . . . . . . . . . . . . . . . . . . . . . . . . . . . . . . . . . . 52.91 902.2.5 Gender development gap . . . . . . . . . . . . . . . . . . . . . . . . . . . . . . . . . . . .65.23 942.2.6 Leadership opportunities for women . . . . . . . . . . . . . . . . . . . . . . . . .60.26 42
Score Rank
3 GROW . . . . . . . . . . . . . . . . . . . . . . . . . . . . . . . . . . . . . . . . . . . . .27.26 1113.1 Formal Education . . . . . . . . . . . . . . . . . . . . . . . . . . . . . . . . . . . . . . . . . . . . 5.17 123
Enrolment3.1.1 Vocational enrolment . . . . . . . . . . . . . . . . . . . . . . . . . . . . . . . . . . . . . . . . . . 1.52 1123.1.2 Tertiary enrolment . . . . . . . . . . . . . . . . . . . . . . . . . . . . . . . . . . . . . . . . . . . . 11.90 99
Quality3.1.3 Tertiary education expenditure . . . . . . . . . . . . . . . . . . . . . . . . . . . . . . . . 7.25 1013.1.4 Reading, maths, and science . . . . . . . . . . . . . . . . . . . . . . . . . . . . . . . . . . . .n/a n/a3.1.5 University ranking . . . . . . . . . . . . . . . . . . . . . . . . . . . . . . . . . . . . . . . . . . . . . . 0.00 753.2 Lifelong Learning . . . . . . . . . . . . . . . . . . . . . . . . . . . . . . . . . . . . . . . . . . . 34.27 1003.2.1 Quality of management schools . . . . . . . . . . . . . . . . . . . . . . . . . . . . . .40.68 863.2.2 Prevalence of training in firms . . . . . . . . . . . . . . . . . . . . . . . . . . . . . . . . . 27.70 673.2.3 Employee development . . . . . . . . . . . . . . . . . . . . . . . . . . . . . . . . . . . . . .34.42 793.3 Access to Growth Opportunities . . . . . . . . . . . . . . . . . . . . . . . . . . . 42.34 89
Empowerment3.3.1 Delegation of authority . . . . . . . . . . . . . . . . . . . . . . . . . . . . . . . . . . . . . . . 42.45 763.3.2 Personal rights . . . . . . . . . . . . . . . . . . . . . . . . . . . . . . . . . . . . . . . . . . . . . . . . 11.55 126
Collaboration3.3.3 Use of virtual social networks . . . . . . . . . . . . . . . . . . . . . . . . . . . . . . . . .59.85 1003.3.4 Use of virtual professional networks . . . . . . . . . . . . . . . . . . . . . . . . . . . .n/a n/a3.3.5 Collaboration within organisations . . . . . . . . . . . . . . . . . . . . . . . . . . . . 49.41 593.3.6 Collaboration across organisations . . . . . . . . . . . . . . . . . . . . . . . . . . . .48.43 38
4 RETAIN . . . . . . . . . . . . . . . . . . . . . . . . . . . . . . . . . . . . . . . . . . . .29.90 1074.1 Sustainability . . . . . . . . . . . . . . . . . . . . . . . . . . . . . . . . . . . . . . . . . . . . . . . 27.25 1064.1.1 Pension system . . . . . . . . . . . . . . . . . . . . . . . . . . . . . . . . . . . . . . . . . . . . . . . . 1.60 1154.1.2 Social protection . . . . . . . . . . . . . . . . . . . . . . . . . . . . . . . . . . . . . . . . . . . . . .30.98 944.1.3 Brain retention . . . . . . . . . . . . . . . . . . . . . . . . . . . . . . . . . . . . . . . . . . . . . . . . 49.18 474.2 Lifestyle . . . . . . . . . . . . . . . . . . . . . . . . . . . . . . . . . . . . . . . . . . . . . . . . . . . . 32.55 1034.2.1 Environmental performance . . . . . . . . . . . . . . . . . . . . . . . . . . . . . . . . . .25.85 1164.2.2 Personal safety . . . . . . . . . . . . . . . . . . . . . . . . . . . . . . . . . . . . . . . . . . . . . . . .26.28 1184.2.3 Physician density . . . . . . . . . . . . . . . . . . . . . . . . . . . . . . . . . . . . . . . . . . . . . . . 7.57 954.2.4 Sanitation . . . . . . . . . . . . . . . . . . . . . . . . . . . . . . . . . . . . . . . . . . . . . . . . . . . . . 70.51 94
5 VOCATIONAL AND TECHNICAL SKILLS . . . . . . . . . . . . .32.91 1005.1 Mid-Level Skills . . . . . . . . . . . . . . . . . . . . . . . . . . . . . . . . . . . . . . . . . . . . . 18.63 1065.1.1 Workforce with secondary education . . . . . . . . . . . . . . . . . . . . . . . . .26.67 975.1.2 Population with secondary education . . . . . . . . . . . . . . . . . . . . . . . . . .n/a n/a5.1.3 Technicians and associate professionals . . . . . . . . . . . . . . . . . . . . . . .10.60 1115.1.4 Labour productivity per employee . . . . . . . . . . . . . . . . . . . . . . . . . . . . . .n/a n/a5.2 Employability . . . . . . . . . . . . . . . . . . . . . . . . . . . . . . . . . . . . . . . . . . . . . . . 47.19 725.2.1 Ease of finding skilled employees . . . . . . . . . . . . . . . . . . . . . . . . . . . . . 47.46 915.2.2 Relevance of education system to the economy . . . . . . . . . . . . . .50.49 555.2.3 Skills matching with secondary education . . . . . . . . . . . . . . . . . . . .28.94 1105.2.4 Skills matching with tertiary education . . . . . . . . . . . . . . . . . . . . . . . . 61.86 46
6 GLOBAL KNOWLEDGE SKILLS . . . . . . . . . . . . . . . . . . . . .34.19 486.1 High-Level Skills . . . . . . . . . . . . . . . . . . . . . . . . . . . . . . . . . . . . . . . . . . . .34.44 536.1.1 Workforce with tertiary education . . . . . . . . . . . . . . . . . . . . . . . . . . . .18.68 876.1.2 Population with tertiary education . . . . . . . . . . . . . . . . . . . . . . . . . . . . . .n/a n/a6.1.3 Professionals . . . . . . . . . . . . . . . . . . . . . . . . . . . . . . . . . . . . . . . . . . . . . . . . . .20.00 776.1.4 Researchers . . . . . . . . . . . . . . . . . . . . . . . . . . . . . . . . . . . . . . . . . . . . . . . . . . . . .n/a n/a6.1.5 Senior officials and managers . . . . . . . . . . . . . . . . . . . . . . . . . . . . . . . . .66.66 96.1.6 Availability of scientists and engineers . . . . . . . . . . . . . . . . . . . . . . . . 32.41 1106.2 Talent Impact . . . . . . . . . . . . . . . . . . . . . . . . . . . . . . . . . . . . . . . . . . . . . . . 33.95 426.2.1 Innovation output . . . . . . . . . . . . . . . . . . . . . . . . . . . . . . . . . . . . . . . . . . . . . .n/a n/a6.2.2 High-value exports . . . . . . . . . . . . . . . . . . . . . . . . . . . . . . . . . . . . . . . . . . 100.00 16.2.3 New product entrepreneurial activity . . . . . . . . . . . . . . . . . . . . . . . . . . .n/a n/a6.2.4 New business density . . . . . . . . . . . . . . . . . . . . . . . . . . . . . . . . . . . . . . . . . . 1.39 926.2.5 Scientific journal articles . . . . . . . . . . . . . . . . . . . . . . . . . . . . . . . . . . . . . . . 0.45 108
l Lao PDR l Income group average

GTCI 2020 Country Profile by Pillar
194 THE GLOBAL TALENT COMPETITIVENESS INDEX 2020
COUNTRY PROFILESCOUNTRY PROFILES
102030405060708090100
Global knowledge skills
Vocational andtechnical skills
Retain
Grow
Attract
Enable
102030405060607
LATVIAKey Indicators
Rank (out of 132) . . . . . . . . . . . . . . . . . . . . . . . . . . . . . . . . . . . . . . . 33Income group . . . . . . . . . . . . . . . . . . . . . . . . . . . . . . . . . . . . High incomeRegional group . . . . . . . . . . . . . . . . . . . . . . . . . . . . . . . . . . . . . . . . .EuropePopulation (millions) . . . . . . . . . . . . . . . . . . . . . . . . . . . . . . . . . . . . . 1.93
GDP per capita (PPP US$) . . . . . . . . . . . . . . . . . . . . . . . . . . . .28,362.01GDP (US$ billions) . . . . . . . . . . . . . . . . . . . . . . . . . . . . . . . . . . . . . . 34.85GTCI score . . . . . . . . . . . . . . . . . . . . . . . . . . . . . . . . . . . . . . . . . . . . . . 54.40GTCI score (income group average) . . . . . . . . . . . . . . . . . . . . . . . . 61.46
Score Rank
1 ENABLE . . . . . . . . . . . . . . . . . . . . . . . . . . . . . . . . . . . . . . . . . . . 61.10 351.1 Regulatory Landscape . . . . . . . . . . . . . . . . . . . . . . . . . . . . . . . . . . . . . . 70.78 321.1.1 Government effectiveness . . . . . . . . . . . . . . . . . . . . . . . . . . . . . . . . . . . .68.47 331.1.2 Rule of law . . . . . . . . . . . . . . . . . . . . . . . . . . . . . . . . . . . . . . . . . . . . . . . . . . . . 74.41 311.1.3 Political stability . . . . . . . . . . . . . . . . . . . . . . . . . . . . . . . . . . . . . . . . . . . . . . . 75.12 401.1.4 Regulatory quality. . . . . . . . . . . . . . . . . . . . . . . . . . . . . . . . . . . . . . . . . . . . . 76.42 271.1.5 Corruption . . . . . . . . . . . . . . . . . . . . . . . . . . . . . . . . . . . . . . . . . . . . . . . . . . . .59.46 361.2 Market Landscape . . . . . . . . . . . . . . . . . . . . . . . . . . . . . . . . . . . . . . . . . . 59.24 411.2.1 Competition intensity . . . . . . . . . . . . . . . . . . . . . . . . . . . . . . . . . . . . . . . . .78.36 321.2.2 Ease of doing business . . . . . . . . . . . . . . . . . . . . . . . . . . . . . . . . . . . . . . . . 87.50 171.2.3 Cluster development . . . . . . . . . . . . . . . . . . . . . . . . . . . . . . . . . . . . . . . . . .42.37 691.2.4 R&D expenditure . . . . . . . . . . . . . . . . . . . . . . . . . . . . . . . . . . . . . . . . . . . . . .10.94 621.2.5 ICT infrastructure. . . . . . . . . . . . . . . . . . . . . . . . . . . . . . . . . . . . . . . . . . . . . .72.90 381.2.6 Urban population . . . . . . . . . . . . . . . . . . . . . . . . . . . . . . . . . . . . . . . . . . . . .63.37 581.3 Business and Labour Landscape . . . . . . . . . . . . . . . . . . . . . . . . . . . . 53.29 47
Labour Market1.3.1 Tertiary-educated unemployment . . . . . . . . . . . . . . . . . . . . . . . . . . . .88.02 371.3.2 Active labour market policies . . . . . . . . . . . . . . . . . . . . . . . . . . . . . . . . . 56.13 461.3.3 Labour-employer cooperation . . . . . . . . . . . . . . . . . . . . . . . . . . . . . . . . 51.14 41
Management Practice1.3.4 Professional management . . . . . . . . . . . . . . . . . . . . . . . . . . . . . . . . . . . . 55.95 511.3.5 Relationship of pay to productivity . . . . . . . . . . . . . . . . . . . . . . . . . . . . 61.34 44
Technology Adoption1.3.6 Technology utilisation. . . . . . . . . . . . . . . . . . . . . . . . . . . . . . . . . . . . . . . . . 67.45 351.3.7 Investment in emerging technologies . . . . . . . . . . . . . . . . . . . . . . . 44.86 521.3.8 Robot density . . . . . . . . . . . . . . . . . . . . . . . . . . . . . . . . . . . . . . . . . . . . . . . . . . 1.45 47
2 ATTRACT . . . . . . . . . . . . . . . . . . . . . . . . . . . . . . . . . . . . . . . . . .55.92 432.1 External Openness . . . . . . . . . . . . . . . . . . . . . . . . . . . . . . . . . . . . . . . . . 49.73 43
Attract Business2.1.1 FDI and technology transfer . . . . . . . . . . . . . . . . . . . . . . . . . . . . . . . . . .62.09 552.1.2 Prevalence of foreign ownership . . . . . . . . . . . . . . . . . . . . . . . . . . . . . .69.50 41
Attract People2.1.3 Migrant stock . . . . . . . . . . . . . . . . . . . . . . . . . . . . . . . . . . . . . . . . . . . . . . . . .63.70 272.1.4 International students . . . . . . . . . . . . . . . . . . . . . . . . . . . . . . . . . . . . . . . . . 28.10 272.1.5 Brain gain . . . . . . . . . . . . . . . . . . . . . . . . . . . . . . . . . . . . . . . . . . . . . . . . . . . . .25.25 1092.2 Internal Openness . . . . . . . . . . . . . . . . . . . . . . . . . . . . . . . . . . . . . . . . . . 62.10 48
Social Inclusion2.2.1 Tolerance of minorities . . . . . . . . . . . . . . . . . . . . . . . . . . . . . . . . . . . . . . . .16.67 1112.2.2 Tolerance of immigrants . . . . . . . . . . . . . . . . . . . . . . . . . . . . . . . . . . . . . . 12.33 1252.2.3 Social mobility . . . . . . . . . . . . . . . . . . . . . . . . . . . . . . . . . . . . . . . . . . . . . . . .69.05 34
Gender Equality2.2.4 Female graduates . . . . . . . . . . . . . . . . . . . . . . . . . . . . . . . . . . . . . . . . . . . . .94.78 72.2.5 Gender development gap . . . . . . . . . . . . . . . . . . . . . . . . . . . . . . . . . . . .99.48 22.2.6 Leadership opportunities for women . . . . . . . . . . . . . . . . . . . . . . . . .80.32 13
Score Rank
3 GROW . . . . . . . . . . . . . . . . . . . . . . . . . . . . . . . . . . . . . . . . . . . . .46.70 393.1 Formal Education . . . . . . . . . . . . . . . . . . . . . . . . . . . . . . . . . . . . . . . . . . . 42.17 35
Enrolment3.1.1 Vocational enrolment . . . . . . . . . . . . . . . . . . . . . . . . . . . . . . . . . . . . . . . . . 31.46 363.1.2 Tertiary enrolment . . . . . . . . . . . . . . . . . . . . . . . . . . . . . . . . . . . . . . . . . . . .69.49 9
Quality3.1.3 Tertiary education expenditure . . . . . . . . . . . . . . . . . . . . . . . . . . . . . . . 27.21 403.1.4 Reading, maths, and science . . . . . . . . . . . . . . . . . . . . . . . . . . . . . . . . . .69.49 293.1.5 University ranking . . . . . . . . . . . . . . . . . . . . . . . . . . . . . . . . . . . . . . . . . . . . . 13.18 633.2 Lifelong Learning . . . . . . . . . . . . . . . . . . . . . . . . . . . . . . . . . . . . . . . . . . .44.63 643.2.1 Quality of management schools . . . . . . . . . . . . . . . . . . . . . . . . . . . . . .56.34 453.2.2 Prevalence of training in firms . . . . . . . . . . . . . . . . . . . . . . . . . . . . . . . . .28.76 643.2.3 Employee development . . . . . . . . . . . . . . . . . . . . . . . . . . . . . . . . . . . . . .48.79 493.3 Access to Growth Opportunities . . . . . . . . . . . . . . . . . . . . . . . . . . . 53.31 42
Empowerment3.3.1 Delegation of authority . . . . . . . . . . . . . . . . . . . . . . . . . . . . . . . . . . . . . . . 53.14 463.3.2 Personal rights . . . . . . . . . . . . . . . . . . . . . . . . . . . . . . . . . . . . . . . . . . . . . . . .94.47 25
Collaboration3.3.3 Use of virtual social networks . . . . . . . . . . . . . . . . . . . . . . . . . . . . . . . . .79.82 523.3.4 Use of virtual professional networks . . . . . . . . . . . . . . . . . . . . . . . . . .15.44 443.3.5 Collaboration within organisations . . . . . . . . . . . . . . . . . . . . . . . . . . . . 43.11 853.3.6 Collaboration across organisations . . . . . . . . . . . . . . . . . . . . . . . . . . . .33.86 80
4 RETAIN . . . . . . . . . . . . . . . . . . . . . . . . . . . . . . . . . . . . . . . . . . . 62.09 384.1 Sustainability . . . . . . . . . . . . . . . . . . . . . . . . . . . . . . . . . . . . . . . . . . . . . . . 55.75 424.1.1 Pension system . . . . . . . . . . . . . . . . . . . . . . . . . . . . . . . . . . . . . . . . . . . . . . .92.59 114.1.2 Social protection . . . . . . . . . . . . . . . . . . . . . . . . . . . . . . . . . . . . . . . . . . . . . .46.20 584.1.3 Brain retention . . . . . . . . . . . . . . . . . . . . . . . . . . . . . . . . . . . . . . . . . . . . . . . .28.44 1014.2 Lifestyle . . . . . . . . . . . . . . . . . . . . . . . . . . . . . . . . . . . . . . . . . . . . . . . . . . . . 68.43 384.2.1 Environmental performance . . . . . . . . . . . . . . . . . . . . . . . . . . . . . . . . . .64.49 354.2.2 Personal safety . . . . . . . . . . . . . . . . . . . . . . . . . . . . . . . . . . . . . . . . . . . . . . . .65.75 414.2.3 Physician density . . . . . . . . . . . . . . . . . . . . . . . . . . . . . . . . . . . . . . . . . . . . . . 51.15 304.2.4 Sanitation . . . . . . . . . . . . . . . . . . . . . . . . . . . . . . . . . . . . . . . . . . . . . . . . . . . . .92.32 64
5 VOCATIONAL AND TECHNICAL SKILLS . . . . . . . . . . . . 55.68 355.1 Mid-Level Skills . . . . . . . . . . . . . . . . . . . . . . . . . . . . . . . . . . . . . . . . . . . . . 63.26 185.1.1 Workforce with secondary education . . . . . . . . . . . . . . . . . . . . . . . . .75.22 215.1.2 Population with secondary education . . . . . . . . . . . . . . . . . . . . . . . .80.79 85.1.3 Technicians and associate professionals . . . . . . . . . . . . . . . . . . . . . . .59.66 275.1.4 Labour productivity per employee . . . . . . . . . . . . . . . . . . . . . . . . . . . . 37.37 465.2 Employability . . . . . . . . . . . . . . . . . . . . . . . . . . . . . . . . . . . . . . . . . . . . . . . 48.10 685.2.1 Ease of finding skilled employees . . . . . . . . . . . . . . . . . . . . . . . . . . . . . 47.28 925.2.2 Relevance of education system to the economy . . . . . . . . . . . . . .46.70 595.2.3 Skills matching with secondary education . . . . . . . . . . . . . . . . . . . .42.62 645.2.4 Skills matching with tertiary education . . . . . . . . . . . . . . . . . . . . . . . .55.82 63
6 GLOBAL KNOWLEDGE SKILLS . . . . . . . . . . . . . . . . . . . . 44.91 286.1 High-Level Skills . . . . . . . . . . . . . . . . . . . . . . . . . . . . . . . . . . . . . . . . . . . . 44.71 356.1.1 Workforce with tertiary education . . . . . . . . . . . . . . . . . . . . . . . . . . . .53.95 266.1.2 Population with tertiary education . . . . . . . . . . . . . . . . . . . . . . . . . . . . 50.19 286.1.3 Professionals . . . . . . . . . . . . . . . . . . . . . . . . . . . . . . . . . . . . . . . . . . . . . . . . . .44.31 366.1.4 Researchers . . . . . . . . . . . . . . . . . . . . . . . . . . . . . . . . . . . . . . . . . . . . . . . . . . . 21.55 426.1.5 Senior officials and managers . . . . . . . . . . . . . . . . . . . . . . . . . . . . . . . . . 61.44 146.1.6 Availability of scientists and engineers . . . . . . . . . . . . . . . . . . . . . . . .36.84 976.2 Talent Impact . . . . . . . . . . . . . . . . . . . . . . . . . . . . . . . . . . . . . . . . . . . . . . . 45.10 266.2.1 Innovation output . . . . . . . . . . . . . . . . . . . . . . . . . . . . . . . . . . . . . . . . . . . .50.44 336.2.2 High-value exports . . . . . . . . . . . . . . . . . . . . . . . . . . . . . . . . . . . . . . . . . . . . 55.16 156.2.3 New product entrepreneurial activity . . . . . . . . . . . . . . . . . . . . . . . . .55.84 336.2.4 New business density . . . . . . . . . . . . . . . . . . . . . . . . . . . . . . . . . . . . . . . . .38.68 196.2.5 Scientific journal articles . . . . . . . . . . . . . . . . . . . . . . . . . . . . . . . . . . . . . .25.39 38
l Latvia l Income group average

GTCI 2020 Country Profile by Pillar
THE GLOBAL TALENT COMPETITIVENESS INDEX 2020 195
COUNTRY PROFILESCOUNTRY PROFILES
102030405060708090100
Global knowledge skills
Vocational andtechnical skills
Retain
Grow
Attract
Enable
10203004
LESOTHOKey Indicators
Rank (out of 132) . . . . . . . . . . . . . . . . . . . . . . . . . . . . . . . . . . . . 119Income group . . . . . . . . . . . . . . . . . . . . . . . . . . . Lower-middle incomeRegional group . . . . . . . . . . . . . . . . . . . . . . . . . . . . Sub-Saharan AfricaPopulation (millions) . . . . . . . . . . . . . . . . . . . . . . . . . . . . . . . . . . . . . 2.11
GDP per capita (PPP US$) . . . . . . . . . . . . . . . . . . . . . . . . . . . . . 3,223.02GDP (US$ billions) . . . . . . . . . . . . . . . . . . . . . . . . . . . . . . . . . . . . . . . 2.79GTCI score . . . . . . . . . . . . . . . . . . . . . . . . . . . . . . . . . . . . . . . . . . . . . . 26.62GTCI score (income group average) . . . . . . . . . . . . . . . . . . . . . . . . 32.97
Score Rank
1 ENABLE . . . . . . . . . . . . . . . . . . . . . . . . . . . . . . . . . . . . . . . . . . .34.67 1101.1 Regulatory Landscape . . . . . . . . . . . . . . . . . . . . . . . . . . . . . . . . . . . . . . 41.68 881.1.1 Government effectiveness . . . . . . . . . . . . . . . . . . . . . . . . . . . . . . . . . . . .25.93 1191.1.2 Rule of law . . . . . . . . . . . . . . . . . . . . . . . . . . . . . . . . . . . . . . . . . . . . . . . . . . . .46.25 791.1.3 Political stability . . . . . . . . . . . . . . . . . . . . . . . . . . . . . . . . . . . . . . . . . . . . . . . 59.57 771.1.4 Regulatory quality. . . . . . . . . . . . . . . . . . . . . . . . . . . . . . . . . . . . . . . . . . . . . 40.19 941.1.5 Corruption . . . . . . . . . . . . . . . . . . . . . . . . . . . . . . . . . . . . . . . . . . . . . . . . . . . .36.49 631.2 Market Landscape . . . . . . . . . . . . . . . . . . . . . . . . . . . . . . . . . . . . . . . . . . 35.73 1071.2.1 Competition intensity . . . . . . . . . . . . . . . . . . . . . . . . . . . . . . . . . . . . . . . . . 81.94 161.2.2 Ease of doing business . . . . . . . . . . . . . . . . . . . . . . . . . . . . . . . . . . . . . . . .53.57 911.2.3 Cluster development . . . . . . . . . . . . . . . . . . . . . . . . . . . . . . . . . . . . . . . . . .34.81 871.2.4 R&D expenditure . . . . . . . . . . . . . . . . . . . . . . . . . . . . . . . . . . . . . . . . . . . . . . . 0.73 1151.2.5 ICT infrastructure. . . . . . . . . . . . . . . . . . . . . . . . . . . . . . . . . . . . . . . . . . . . . .25.95 1051.2.6 Urban population . . . . . . . . . . . . . . . . . . . . . . . . . . . . . . . . . . . . . . . . . . . . . 17.39 1211.3 Business and Labour Landscape . . . . . . . . . . . . . . . . . . . . . . . . . . . . 26.61 122
Labour Market1.3.1 Tertiary-educated unemployment . . . . . . . . . . . . . . . . . . . . . . . . . . . . . .n/a n/a1.3.2 Active labour market policies . . . . . . . . . . . . . . . . . . . . . . . . . . . . . . . . . 56.18 451.3.3 Labour-employer cooperation . . . . . . . . . . . . . . . . . . . . . . . . . . . . . . . . . 3.13 129
Management Practice1.3.4 Professional management . . . . . . . . . . . . . . . . . . . . . . . . . . . . . . . . . . . .26.01 1221.3.5 Relationship of pay to productivity . . . . . . . . . . . . . . . . . . . . . . . . . . . . 35.70 104
Technology Adoption1.3.6 Technology utilisation. . . . . . . . . . . . . . . . . . . . . . . . . . . . . . . . . . . . . . . . . . 2.77 1301.3.7 Investment in emerging technologies . . . . . . . . . . . . . . . . . . . . . . . .35.86 761.3.8 Robot density . . . . . . . . . . . . . . . . . . . . . . . . . . . . . . . . . . . . . . . . . . . . . . . . . . .n/a n/a
2 ATTRACT . . . . . . . . . . . . . . . . . . . . . . . . . . . . . . . . . . . . . . . . . .39.64 1082.1 External Openness . . . . . . . . . . . . . . . . . . . . . . . . . . . . . . . . . . . . . . . . . 19.01 130
Attract Business2.1.1 FDI and technology transfer . . . . . . . . . . . . . . . . . . . . . . . . . . . . . . . . . .18.96 1302.1.2 Prevalence of foreign ownership . . . . . . . . . . . . . . . . . . . . . . . . . . . . . . 25.15 127
Attract People2.1.3 Migrant stock . . . . . . . . . . . . . . . . . . . . . . . . . . . . . . . . . . . . . . . . . . . . . . . . . . 8.17 1212.1.4 International students . . . . . . . . . . . . . . . . . . . . . . . . . . . . . . . . . . . . . . . . . . 1.09 1002.1.5 Brain gain . . . . . . . . . . . . . . . . . . . . . . . . . . . . . . . . . . . . . . . . . . . . . . . . . . . . . 41.66 752.2 Internal Openness . . . . . . . . . . . . . . . . . . . . . . . . . . . . . . . . . . . . . . . . . . 60.28 54
Social Inclusion2.2.1 Tolerance of minorities . . . . . . . . . . . . . . . . . . . . . . . . . . . . . . . . . . . . . . . .74.44 202.2.2 Tolerance of immigrants . . . . . . . . . . . . . . . . . . . . . . . . . . . . . . . . . . . . . .60.27 602.2.3 Social mobility . . . . . . . . . . . . . . . . . . . . . . . . . . . . . . . . . . . . . . . . . . . . . . . . 41.23 116
Gender Equality2.2.4 Female graduates . . . . . . . . . . . . . . . . . . . . . . . . . . . . . . . . . . . . . . . . . . . . .82.55 292.2.5 Gender development gap . . . . . . . . . . . . . . . . . . . . . . . . . . . . . . . . . . . .90.33 152.2.6 Leadership opportunities for women . . . . . . . . . . . . . . . . . . . . . . . . . 12.83 129
Score Rank
3 GROW . . . . . . . . . . . . . . . . . . . . . . . . . . . . . . . . . . . . . . . . . . . . 24.25 1213.1 Formal Education . . . . . . . . . . . . . . . . . . . . . . . . . . . . . . . . . . . . . . . . . . . . 4.69 125
Enrolment3.1.1 Vocational enrolment . . . . . . . . . . . . . . . . . . . . . . . . . . . . . . . . . . . . . . . . . . 3.18 1053.1.2 Tertiary enrolment . . . . . . . . . . . . . . . . . . . . . . . . . . . . . . . . . . . . . . . . . . . . . 6.63 111
Quality3.1.3 Tertiary education expenditure . . . . . . . . . . . . . . . . . . . . . . . . . . . . . . . . 8.94 1003.1.4 Reading, maths, and science . . . . . . . . . . . . . . . . . . . . . . . . . . . . . . . . . . . .n/a n/a3.1.5 University ranking . . . . . . . . . . . . . . . . . . . . . . . . . . . . . . . . . . . . . . . . . . . . . . 0.00 753.2 Lifelong Learning . . . . . . . . . . . . . . . . . . . . . . . . . . . . . . . . . . . . . . . . . . . 43.36 663.2.1 Quality of management schools . . . . . . . . . . . . . . . . . . . . . . . . . . . . . .66.71 293.2.2 Prevalence of training in firms . . . . . . . . . . . . . . . . . . . . . . . . . . . . . . . . .36.68 493.2.3 Employee development . . . . . . . . . . . . . . . . . . . . . . . . . . . . . . . . . . . . . .26.70 1053.3 Access to Growth Opportunities . . . . . . . . . . . . . . . . . . . . . . . . . . . 24.70 128
Empowerment3.3.1 Delegation of authority . . . . . . . . . . . . . . . . . . . . . . . . . . . . . . . . . . . . . . . 17.58 1273.3.2 Personal rights . . . . . . . . . . . . . . . . . . . . . . . . . . . . . . . . . . . . . . . . . . . . . . . .62.71 86
Collaboration3.3.3 Use of virtual social networks . . . . . . . . . . . . . . . . . . . . . . . . . . . . . . . . . . 0.00 1323.3.4 Use of virtual professional networks . . . . . . . . . . . . . . . . . . . . . . . . . . . 2.07 1033.3.5 Collaboration within organisations . . . . . . . . . . . . . . . . . . . . . . . . . . . .25.72 1273.3.6 Collaboration across organisations . . . . . . . . . . . . . . . . . . . . . . . . . . . . 40.12 63
4 RETAIN . . . . . . . . . . . . . . . . . . . . . . . . . . . . . . . . . . . . . . . . . . . .24.16 1154.1 Sustainability . . . . . . . . . . . . . . . . . . . . . . . . . . . . . . . . . . . . . . . . . . . . . . . 27.20 1074.1.1 Pension system . . . . . . . . . . . . . . . . . . . . . . . . . . . . . . . . . . . . . . . . . . . . . . . . 3.80 1104.1.2 Social protection . . . . . . . . . . . . . . . . . . . . . . . . . . . . . . . . . . . . . . . . . . . . . . 33.19 864.1.3 Brain retention . . . . . . . . . . . . . . . . . . . . . . . . . . . . . . . . . . . . . . . . . . . . . . . .44.62 524.2 Lifestyle . . . . . . . . . . . . . . . . . . . . . . . . . . . . . . . . . . . . . . . . . . . . . . . . . . . . 21.11 1234.2.1 Environmental performance . . . . . . . . . . . . . . . . . . . . . . . . . . . . . . . . . . 10.59 1254.2.2 Personal safety . . . . . . . . . . . . . . . . . . . . . . . . . . . . . . . . . . . . . . . . . . . . . . . .13.23 1254.2.3 Physician density . . . . . . . . . . . . . . . . . . . . . . . . . . . . . . . . . . . . . . . . . . . . . . . .n/a n/a4.2.4 Sanitation . . . . . . . . . . . . . . . . . . . . . . . . . . . . . . . . . . . . . . . . . . . . . . . . . . . . . 39.51 112
5 VOCATIONAL AND TECHNICAL SKILLS . . . . . . . . . . . . .31.82 1025.1 Mid-Level Skills . . . . . . . . . . . . . . . . . . . . . . . . . . . . . . . . . . . . . . . . . . . . .22.86 975.1.1 Workforce with secondary education . . . . . . . . . . . . . . . . . . . . . . . . .35.30 815.1.2 Population with secondary education . . . . . . . . . . . . . . . . . . . . . . . . 15.71 1025.1.3 Technicians and associate professionals . . . . . . . . . . . . . . . . . . . . . . . 17.57 985.1.4 Labour productivity per employee . . . . . . . . . . . . . . . . . . . . . . . . . . . . . .n/a n/a5.2 Employability . . . . . . . . . . . . . . . . . . . . . . . . . . . . . . . . . . . . . . . . . . . . . . . 40.77 915.2.1 Ease of finding skilled employees . . . . . . . . . . . . . . . . . . . . . . . . . . . . .36.56 1125.2.2 Relevance of education system to the economy . . . . . . . . . . . . . .39.39 825.2.3 Skills matching with secondary education . . . . . . . . . . . . . . . . . . . .22.33 1215.2.4 Skills matching with tertiary education . . . . . . . . . . . . . . . . . . . . . . . .64.81 39
6 GLOBAL KNOWLEDGE SKILLS . . . . . . . . . . . . . . . . . . . . . . 5.16 1306.1 High-Level Skills . . . . . . . . . . . . . . . . . . . . . . . . . . . . . . . . . . . . . . . . . . . . . 7.54 1296.1.1 Workforce with tertiary education . . . . . . . . . . . . . . . . . . . . . . . . . . . . . 5.87 1156.1.2 Population with tertiary education . . . . . . . . . . . . . . . . . . . . . . . . . . . . . 1.31 1066.1.3 Professionals . . . . . . . . . . . . . . . . . . . . . . . . . . . . . . . . . . . . . . . . . . . . . . . . . . . 2.16 1256.1.4 Researchers . . . . . . . . . . . . . . . . . . . . . . . . . . . . . . . . . . . . . . . . . . . . . . . . . . . . 0.15 1056.1.5 Senior officials and managers . . . . . . . . . . . . . . . . . . . . . . . . . . . . . . . . . . 6.76 1046.1.6 Availability of scientists and engineers . . . . . . . . . . . . . . . . . . . . . . . .28.97 1166.2 Talent Impact . . . . . . . . . . . . . . . . . . . . . . . . . . . . . . . . . . . . . . . . . . . . . . . . 2.79 1266.2.1 Innovation output . . . . . . . . . . . . . . . . . . . . . . . . . . . . . . . . . . . . . . . . . . . . . .n/a n/a6.2.2 High-value exports . . . . . . . . . . . . . . . . . . . . . . . . . . . . . . . . . . . . . . . . . . . . . 0.57 1226.2.3 New product entrepreneurial activity . . . . . . . . . . . . . . . . . . . . . . . . . . .n/a n/a6.2.4 New business density . . . . . . . . . . . . . . . . . . . . . . . . . . . . . . . . . . . . . . . . . . 7.41 596.2.5 Scientific journal articles . . . . . . . . . . . . . . . . . . . . . . . . . . . . . . . . . . . . . . . 0.40 111
l Lesotho l Income group average

GTCI 2020 Country Profile by Pillar
196 THE GLOBAL TALENT COMPETITIVENESS INDEX 2020
COUNTRY PROFILESCOUNTRY PROFILES
102030405060708090100
Global knowledge skills
Vocational andtechnical skills
Retain
Grow
Attract
Enable
1020330
LIBERIAKey Indicators
Rank (out of 132) . . . . . . . . . . . . . . . . . . . . . . . . . . . . . . . . . . . . 118Income group . . . . . . . . . . . . . . . . . . . . . . . . . . . . . . . . . . . . . Low incomeRegional group . . . . . . . . . . . . . . . . . . . . . . . . . . . . Sub-Saharan AfricaPopulation (millions) . . . . . . . . . . . . . . . . . . . . . . . . . . . . . . . . . . . . . 4.82
GDP per capita (PPP US$) . . . . . . . . . . . . . . . . . . . . . . . . . . . . . 1,306.32GDP (US$ billions) . . . . . . . . . . . . . . . . . . . . . . . . . . . . . . . . . . . . . . . 3.25GTCI score . . . . . . . . . . . . . . . . . . . . . . . . . . . . . . . . . . . . . . . . . . . . . . 26.74GTCI score (income group average) . . . . . . . . . . . . . . . . . . . . . . . . 26.01
Score Rank
1 ENABLE . . . . . . . . . . . . . . . . . . . . . . . . . . . . . . . . . . . . . . . . . . .33.78 1161.1 Regulatory Landscape . . . . . . . . . . . . . . . . . . . . . . . . . . . . . . . . . . . . . . 29.73 1191.1.1 Government effectiveness . . . . . . . . . . . . . . . . . . . . . . . . . . . . . . . . . . . . 13.33 1291.1.2 Rule of law . . . . . . . . . . . . . . . . . . . . . . . . . . . . . . . . . . . . . . . . . . . . . . . . . . . . 30.11 1191.1.3 Political stability . . . . . . . . . . . . . . . . . . . . . . . . . . . . . . . . . . . . . . . . . . . . . . .56.00 911.1.4 Regulatory quality. . . . . . . . . . . . . . . . . . . . . . . . . . . . . . . . . . . . . . . . . . . . .24.86 1221.1.5 Corruption . . . . . . . . . . . . . . . . . . . . . . . . . . . . . . . . . . . . . . . . . . . . . . . . . . . .24.32 1001.2 Market Landscape . . . . . . . . . . . . . . . . . . . . . . . . . . . . . . . . . . . . . . . . . . 36.02 1041.2.1 Competition intensity . . . . . . . . . . . . . . . . . . . . . . . . . . . . . . . . . . . . . . . . . 43.43 1251.2.2 Ease of doing business . . . . . . . . . . . . . . . . . . . . . . . . . . . . . . . . . . . . . . . .23.04 1281.2.3 Cluster development . . . . . . . . . . . . . . . . . . . . . . . . . . . . . . . . . . . . . . . . . .33.78 921.2.4 R&D expenditure . . . . . . . . . . . . . . . . . . . . . . . . . . . . . . . . . . . . . . . . . . . . . . . .n/a n/a1.2.5 ICT infrastructure. . . . . . . . . . . . . . . . . . . . . . . . . . . . . . . . . . . . . . . . . . . . . . . .n/a n/a1.2.6 Urban population . . . . . . . . . . . . . . . . . . . . . . . . . . . . . . . . . . . . . . . . . . . . .43.83 931.3 Business and Labour Landscape . . . . . . . . . . . . . . . . . . . . . . . . . . . . 35.58 105
Labour Market1.3.1 Tertiary-educated unemployment . . . . . . . . . . . . . . . . . . . . . . . . . . . .73.36 881.3.2 Active labour market policies . . . . . . . . . . . . . . . . . . . . . . . . . . . . . . . . .26.65 1011.3.3 Labour-employer cooperation . . . . . . . . . . . . . . . . . . . . . . . . . . . . . . . .25.53 101
Management Practice1.3.4 Professional management . . . . . . . . . . . . . . . . . . . . . . . . . . . . . . . . . . . .46.43 731.3.5 Relationship of pay to productivity . . . . . . . . . . . . . . . . . . . . . . . . . . . . 41.77 83
Technology Adoption1.3.6 Technology utilisation. . . . . . . . . . . . . . . . . . . . . . . . . . . . . . . . . . . . . . . . .12.64 1281.3.7 Investment in emerging technologies . . . . . . . . . . . . . . . . . . . . . . . .22.71 1141.3.8 Robot density . . . . . . . . . . . . . . . . . . . . . . . . . . . . . . . . . . . . . . . . . . . . . . . . . . .n/a n/a
2 ATTRACT . . . . . . . . . . . . . . . . . . . . . . . . . . . . . . . . . . . . . . . . . .47.32 732.1 External Openness . . . . . . . . . . . . . . . . . . . . . . . . . . . . . . . . . . . . . . . . . 49.14 46
Attract Business2.1.1 FDI and technology transfer . . . . . . . . . . . . . . . . . . . . . . . . . . . . . . . . . .34.36 1212.1.2 Prevalence of foreign ownership . . . . . . . . . . . . . . . . . . . . . . . . . . . . . . 79.75 22
Attract People2.1.3 Migrant stock . . . . . . . . . . . . . . . . . . . . . . . . . . . . . . . . . . . . . . . . . . . . . . . . . 31.16 812.1.4 International students . . . . . . . . . . . . . . . . . . . . . . . . . . . . . . . . . . . . . . . . . . .n/a n/a2.1.5 Brain gain . . . . . . . . . . . . . . . . . . . . . . . . . . . . . . . . . . . . . . . . . . . . . . . . . . . . . 51.27 432.2 Internal Openness . . . . . . . . . . . . . . . . . . . . . . . . . . . . . . . . . . . . . . . . . . 45.51 108
Social Inclusion2.2.1 Tolerance of minorities . . . . . . . . . . . . . . . . . . . . . . . . . . . . . . . . . . . . . . . .53.33 502.2.2 Tolerance of immigrants . . . . . . . . . . . . . . . . . . . . . . . . . . . . . . . . . . . . . . 57.53 692.2.3 Social mobility . . . . . . . . . . . . . . . . . . . . . . . . . . . . . . . . . . . . . . . . . . . . . . . . 57.47 64
Gender Equality2.2.4 Female graduates . . . . . . . . . . . . . . . . . . . . . . . . . . . . . . . . . . . . . . . . . . . . .24.99 1072.2.5 Gender development gap . . . . . . . . . . . . . . . . . . . . . . . . . . . . . . . . . . . .34.03 1252.2.6 Leadership opportunities for women . . . . . . . . . . . . . . . . . . . . . . . . . 45.70 65
Score Rank
3 GROW . . . . . . . . . . . . . . . . . . . . . . . . . . . . . . . . . . . . . . . . . . . . 26.42 1133.1 Formal Education . . . . . . . . . . . . . . . . . . . . . . . . . . . . . . . . . . . . . . . . . . . . 9.82 110
Enrolment3.1.1 Vocational enrolment . . . . . . . . . . . . . . . . . . . . . . . . . . . . . . . . . . . . . . . . . 11.38 833.1.2 Tertiary enrolment . . . . . . . . . . . . . . . . . . . . . . . . . . . . . . . . . . . . . . . . . . . . . 8.67 102
Quality3.1.3 Tertiary education expenditure . . . . . . . . . . . . . . . . . . . . . . . . . . . . . . . 19.24 703.1.4 Reading, maths, and science . . . . . . . . . . . . . . . . . . . . . . . . . . . . . . . . . . . .n/a n/a3.1.5 University ranking . . . . . . . . . . . . . . . . . . . . . . . . . . . . . . . . . . . . . . . . . . . . . . 0.00 753.2 Lifelong Learning . . . . . . . . . . . . . . . . . . . . . . . . . . . . . . . . . . . . . . . . . . . 28.22 1203.2.1 Quality of management schools . . . . . . . . . . . . . . . . . . . . . . . . . . . . . .25.39 1203.2.2 Prevalence of training in firms . . . . . . . . . . . . . . . . . . . . . . . . . . . . . . . . .25.59 713.2.3 Employee development . . . . . . . . . . . . . . . . . . . . . . . . . . . . . . . . . . . . . .33.67 813.3 Access to Growth Opportunities . . . . . . . . . . . . . . . . . . . . . . . . . . . 41.23 93
Empowerment3.3.1 Delegation of authority . . . . . . . . . . . . . . . . . . . . . . . . . . . . . . . . . . . . . . .40.75 823.3.2 Personal rights . . . . . . . . . . . . . . . . . . . . . . . . . . . . . . . . . . . . . . . . . . . . . . . . 77.99 60
Collaboration3.3.3 Use of virtual social networks . . . . . . . . . . . . . . . . . . . . . . . . . . . . . . . . .52.32 1123.3.4 Use of virtual professional networks . . . . . . . . . . . . . . . . . . . . . . . . . . . 1.71 1063.3.5 Collaboration within organisations . . . . . . . . . . . . . . . . . . . . . . . . . . . .44.72 763.3.6 Collaboration across organisations . . . . . . . . . . . . . . . . . . . . . . . . . . . .29.87 92
4 RETAIN . . . . . . . . . . . . . . . . . . . . . . . . . . . . . . . . . . . . . . . . . . . .21.94 1204.1 Sustainability . . . . . . . . . . . . . . . . . . . . . . . . . . . . . . . . . . . . . . . . . . . . . . . 22.54 1134.1.1 Pension system . . . . . . . . . . . . . . . . . . . . . . . . . . . . . . . . . . . . . . . . . . . . . . . . 0.26 1184.1.2 Social protection . . . . . . . . . . . . . . . . . . . . . . . . . . . . . . . . . . . . . . . . . . . . . .29.39 1004.1.3 Brain retention . . . . . . . . . . . . . . . . . . . . . . . . . . . . . . . . . . . . . . . . . . . . . . . . 37.97 754.2 Lifestyle . . . . . . . . . . . . . . . . . . . . . . . . . . . . . . . . . . . . . . . . . . . . . . . . . . . . 21.33 1224.2.1 Environmental performance . . . . . . . . . . . . . . . . . . . . . . . . . . . . . . . . . .23.65 1204.2.2 Personal safety . . . . . . . . . . . . . . . . . . . . . . . . . . . . . . . . . . . . . . . . . . . . . . . . 51.04 714.2.3 Physician density . . . . . . . . . . . . . . . . . . . . . . . . . . . . . . . . . . . . . . . . . . . . . . . 0.06 1244.2.4 Sanitation . . . . . . . . . . . . . . . . . . . . . . . . . . . . . . . . . . . . . . . . . . . . . . . . . . . . .10.56 129
5 VOCATIONAL AND TECHNICAL SKILLS . . . . . . . . . . . . .25.70 1205.1 Mid-Level Skills . . . . . . . . . . . . . . . . . . . . . . . . . . . . . . . . . . . . . . . . . . . . . 14.05 1145.1.1 Workforce with secondary education . . . . . . . . . . . . . . . . . . . . . . . . .23.99 1025.1.2 Population with secondary education . . . . . . . . . . . . . . . . . . . . . . . . . .n/a n/a5.1.3 Technicians and associate professionals . . . . . . . . . . . . . . . . . . . . . . . . 4.11 1245.1.4 Labour productivity per employee . . . . . . . . . . . . . . . . . . . . . . . . . . . . . .n/a n/a5.2 Employability . . . . . . . . . . . . . . . . . . . . . . . . . . . . . . . . . . . . . . . . . . . . . . . 37.35 995.2.1 Ease of finding skilled employees . . . . . . . . . . . . . . . . . . . . . . . . . . . . .44.40 975.2.2 Relevance of education system to the economy . . . . . . . . . . . . . .35.26 905.2.3 Skills matching with secondary education . . . . . . . . . . . . . . . . . . . .23.73 1205.2.4 Skills matching with tertiary education . . . . . . . . . . . . . . . . . . . . . . . .46.02 89
6 GLOBAL KNOWLEDGE SKILLS . . . . . . . . . . . . . . . . . . . . . .5.28 1296.1 High-Level Skills . . . . . . . . . . . . . . . . . . . . . . . . . . . . . . . . . . . . . . . . . . . . 10.51 1216.1.1 Workforce with tertiary education . . . . . . . . . . . . . . . . . . . . . . . . . . . . . 4.96 1186.1.2 Population with tertiary education . . . . . . . . . . . . . . . . . . . . . . . . . . . . . .n/a n/a6.1.3 Professionals . . . . . . . . . . . . . . . . . . . . . . . . . . . . . . . . . . . . . . . . . . . . . . . . . . 15.70 946.1.4 Researchers . . . . . . . . . . . . . . . . . . . . . . . . . . . . . . . . . . . . . . . . . . . . . . . . . . . . .n/a n/a6.1.5 Senior officials and managers . . . . . . . . . . . . . . . . . . . . . . . . . . . . . . . . . . 5.93 1076.1.6 Availability of scientists and engineers . . . . . . . . . . . . . . . . . . . . . . . . 15.45 1296.2 Talent Impact . . . . . . . . . . . . . . . . . . . . . . . . . . . . . . . . . . . . . . . . . . . . . . . . 0.05 1326.2.1 Innovation output . . . . . . . . . . . . . . . . . . . . . . . . . . . . . . . . . . . . . . . . . . . . . .n/a n/a6.2.2 High-value exports . . . . . . . . . . . . . . . . . . . . . . . . . . . . . . . . . . . . . . . . . . . . . .n/a n/a6.2.3 New product entrepreneurial activity . . . . . . . . . . . . . . . . . . . . . . . . . . .n/a n/a6.2.4 New business density . . . . . . . . . . . . . . . . . . . . . . . . . . . . . . . . . . . . . . . . . . 0.00 1076.2.5 Scientific journal articles . . . . . . . . . . . . . . . . . . . . . . . . . . . . . . . . . . . . . . . 0.10 126
l Liberia l Income group average
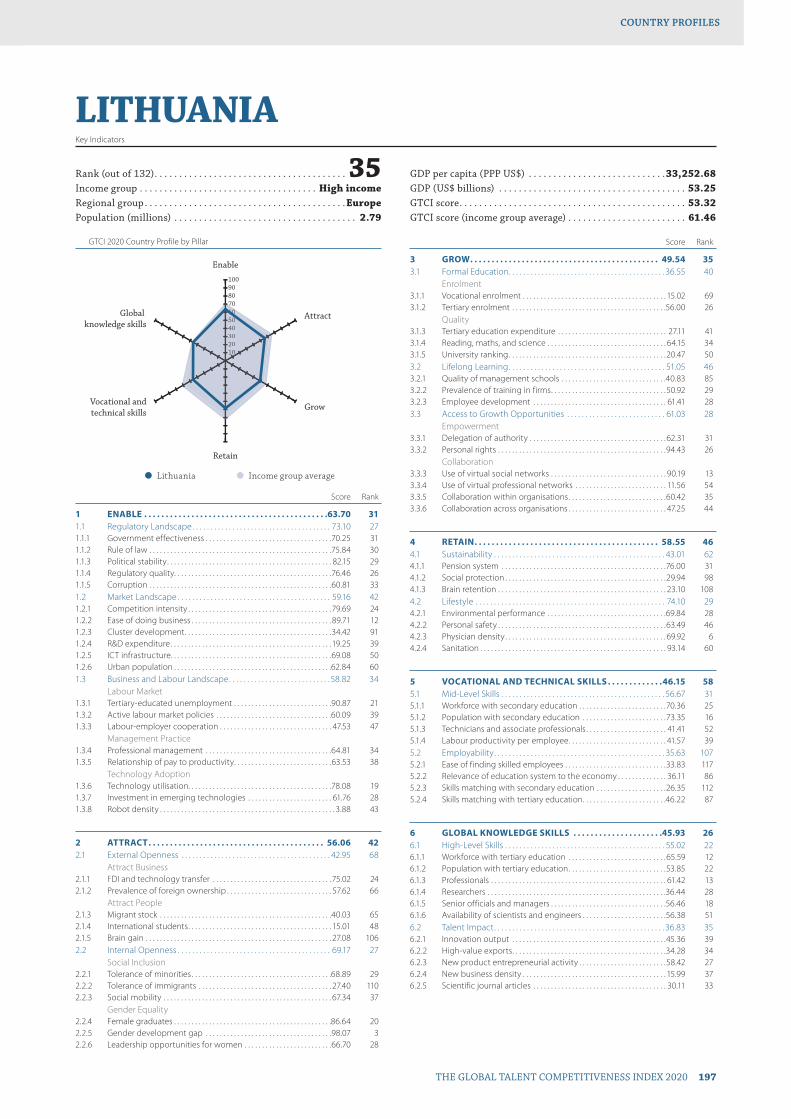
GTCI 2020 Country Profile by Pillar
THE GLOBAL TALENT COMPETITIVENESS INDEX 2020 197
COUNTRY PROFILESCOUNTRY PROFILES
102030405060708090100
Global knowledge skills
Vocational andtechnical skills
Retain
Grow
Attract
Enable
102030405060607
LITHUANIAKey Indicators
Rank (out of 132) . . . . . . . . . . . . . . . . . . . . . . . . . . . . . . . . . . . . . . . 35Income group . . . . . . . . . . . . . . . . . . . . . . . . . . . . . . . . . . . . High incomeRegional group . . . . . . . . . . . . . . . . . . . . . . . . . . . . . . . . . . . . . . . . .EuropePopulation (millions) . . . . . . . . . . . . . . . . . . . . . . . . . . . . . . . . . . . . . 2.79
GDP per capita (PPP US$) . . . . . . . . . . . . . . . . . . . . . . . . . . . .33,252.68GDP (US$ billions) . . . . . . . . . . . . . . . . . . . . . . . . . . . . . . . . . . . . . . 53.25GTCI score . . . . . . . . . . . . . . . . . . . . . . . . . . . . . . . . . . . . . . . . . . . . . . 53.32GTCI score (income group average) . . . . . . . . . . . . . . . . . . . . . . . . 61.46
Score Rank
1 ENABLE . . . . . . . . . . . . . . . . . . . . . . . . . . . . . . . . . . . . . . . . . . .63.70 311.1 Regulatory Landscape . . . . . . . . . . . . . . . . . . . . . . . . . . . . . . . . . . . . . . 73.10 271.1.1 Government effectiveness . . . . . . . . . . . . . . . . . . . . . . . . . . . . . . . . . . . .70.25 311.1.2 Rule of law . . . . . . . . . . . . . . . . . . . . . . . . . . . . . . . . . . . . . . . . . . . . . . . . . . . .75.84 301.1.3 Political stability . . . . . . . . . . . . . . . . . . . . . . . . . . . . . . . . . . . . . . . . . . . . . . . 82.15 291.1.4 Regulatory quality. . . . . . . . . . . . . . . . . . . . . . . . . . . . . . . . . . . . . . . . . . . . .76.46 261.1.5 Corruption . . . . . . . . . . . . . . . . . . . . . . . . . . . . . . . . . . . . . . . . . . . . . . . . . . . .60.81 331.2 Market Landscape . . . . . . . . . . . . . . . . . . . . . . . . . . . . . . . . . . . . . . . . . . 59.16 421.2.1 Competition intensity . . . . . . . . . . . . . . . . . . . . . . . . . . . . . . . . . . . . . . . . .79.69 241.2.2 Ease of doing business . . . . . . . . . . . . . . . . . . . . . . . . . . . . . . . . . . . . . . . . 89.71 121.2.3 Cluster development . . . . . . . . . . . . . . . . . . . . . . . . . . . . . . . . . . . . . . . . . .34.42 911.2.4 R&D expenditure . . . . . . . . . . . . . . . . . . . . . . . . . . . . . . . . . . . . . . . . . . . . . . 19.25 391.2.5 ICT infrastructure. . . . . . . . . . . . . . . . . . . . . . . . . . . . . . . . . . . . . . . . . . . . . .69.08 501.2.6 Urban population . . . . . . . . . . . . . . . . . . . . . . . . . . . . . . . . . . . . . . . . . . . . .62.84 601.3 Business and Labour Landscape . . . . . . . . . . . . . . . . . . . . . . . . . . . . 58.82 34
Labour Market1.3.1 Tertiary-educated unemployment . . . . . . . . . . . . . . . . . . . . . . . . . . . .90.87 211.3.2 Active labour market policies . . . . . . . . . . . . . . . . . . . . . . . . . . . . . . . . .60.09 391.3.3 Labour-employer cooperation . . . . . . . . . . . . . . . . . . . . . . . . . . . . . . . . 47.53 47
Management Practice1.3.4 Professional management . . . . . . . . . . . . . . . . . . . . . . . . . . . . . . . . . . . .64.81 341.3.5 Relationship of pay to productivity . . . . . . . . . . . . . . . . . . . . . . . . . . . .63.53 38
Technology Adoption1.3.6 Technology utilisation. . . . . . . . . . . . . . . . . . . . . . . . . . . . . . . . . . . . . . . . .78.08 191.3.7 Investment in emerging technologies . . . . . . . . . . . . . . . . . . . . . . . . 61.76 281.3.8 Robot density . . . . . . . . . . . . . . . . . . . . . . . . . . . . . . . . . . . . . . . . . . . . . . . . . . 3.88 43
2 ATTRACT . . . . . . . . . . . . . . . . . . . . . . . . . . . . . . . . . . . . . . . . . 56.06 422.1 External Openness . . . . . . . . . . . . . . . . . . . . . . . . . . . . . . . . . . . . . . . . . 42.95 68
Attract Business2.1.1 FDI and technology transfer . . . . . . . . . . . . . . . . . . . . . . . . . . . . . . . . . .75.02 242.1.2 Prevalence of foreign ownership . . . . . . . . . . . . . . . . . . . . . . . . . . . . . . 57.62 66
Attract People2.1.3 Migrant stock . . . . . . . . . . . . . . . . . . . . . . . . . . . . . . . . . . . . . . . . . . . . . . . . .40.03 652.1.4 International students . . . . . . . . . . . . . . . . . . . . . . . . . . . . . . . . . . . . . . . . . 15.01 482.1.5 Brain gain . . . . . . . . . . . . . . . . . . . . . . . . . . . . . . . . . . . . . . . . . . . . . . . . . . . . . 27.08 1062.2 Internal Openness . . . . . . . . . . . . . . . . . . . . . . . . . . . . . . . . . . . . . . . . . . 69.17 27
Social Inclusion2.2.1 Tolerance of minorities . . . . . . . . . . . . . . . . . . . . . . . . . . . . . . . . . . . . . . . .68.89 292.2.2 Tolerance of immigrants . . . . . . . . . . . . . . . . . . . . . . . . . . . . . . . . . . . . . . 27.40 1102.2.3 Social mobility . . . . . . . . . . . . . . . . . . . . . . . . . . . . . . . . . . . . . . . . . . . . . . . . 67.34 37
Gender Equality2.2.4 Female graduates . . . . . . . . . . . . . . . . . . . . . . . . . . . . . . . . . . . . . . . . . . . . .86.64 202.2.5 Gender development gap . . . . . . . . . . . . . . . . . . . . . . . . . . . . . . . . . . . .98.07 32.2.6 Leadership opportunities for women . . . . . . . . . . . . . . . . . . . . . . . . .66.70 28
Score Rank
3 GROW . . . . . . . . . . . . . . . . . . . . . . . . . . . . . . . . . . . . . . . . . . . . 49.54 353.1 Formal Education . . . . . . . . . . . . . . . . . . . . . . . . . . . . . . . . . . . . . . . . . . . 36.55 40
Enrolment3.1.1 Vocational enrolment . . . . . . . . . . . . . . . . . . . . . . . . . . . . . . . . . . . . . . . . . 15.02 693.1.2 Tertiary enrolment . . . . . . . . . . . . . . . . . . . . . . . . . . . . . . . . . . . . . . . . . . . .56.00 26
Quality3.1.3 Tertiary education expenditure . . . . . . . . . . . . . . . . . . . . . . . . . . . . . . . 27.11 413.1.4 Reading, maths, and science . . . . . . . . . . . . . . . . . . . . . . . . . . . . . . . . . . 64.15 343.1.5 University ranking . . . . . . . . . . . . . . . . . . . . . . . . . . . . . . . . . . . . . . . . . . . . .20.47 503.2 Lifelong Learning . . . . . . . . . . . . . . . . . . . . . . . . . . . . . . . . . . . . . . . . . . . 51.05 463.2.1 Quality of management schools . . . . . . . . . . . . . . . . . . . . . . . . . . . . . .40.83 853.2.2 Prevalence of training in firms . . . . . . . . . . . . . . . . . . . . . . . . . . . . . . . . .50.92 293.2.3 Employee development . . . . . . . . . . . . . . . . . . . . . . . . . . . . . . . . . . . . . . 61.41 283.3 Access to Growth Opportunities . . . . . . . . . . . . . . . . . . . . . . . . . . . 61.03 28
Empowerment3.3.1 Delegation of authority . . . . . . . . . . . . . . . . . . . . . . . . . . . . . . . . . . . . . . . 62.31 313.3.2 Personal rights . . . . . . . . . . . . . . . . . . . . . . . . . . . . . . . . . . . . . . . . . . . . . . . .94.43 26
Collaboration3.3.3 Use of virtual social networks . . . . . . . . . . . . . . . . . . . . . . . . . . . . . . . . . 90.19 133.3.4 Use of virtual professional networks . . . . . . . . . . . . . . . . . . . . . . . . . . 11.56 543.3.5 Collaboration within organisations . . . . . . . . . . . . . . . . . . . . . . . . . . . .60.42 353.3.6 Collaboration across organisations . . . . . . . . . . . . . . . . . . . . . . . . . . . . 47.25 44
4 RETAIN . . . . . . . . . . . . . . . . . . . . . . . . . . . . . . . . . . . . . . . . . . . 58.55 464.1 Sustainability . . . . . . . . . . . . . . . . . . . . . . . . . . . . . . . . . . . . . . . . . . . . . . . 43.01 624.1.1 Pension system . . . . . . . . . . . . . . . . . . . . . . . . . . . . . . . . . . . . . . . . . . . . . . .76.00 314.1.2 Social protection . . . . . . . . . . . . . . . . . . . . . . . . . . . . . . . . . . . . . . . . . . . . . .29.94 984.1.3 Brain retention . . . . . . . . . . . . . . . . . . . . . . . . . . . . . . . . . . . . . . . . . . . . . . . . 23.10 1084.2 Lifestyle . . . . . . . . . . . . . . . . . . . . . . . . . . . . . . . . . . . . . . . . . . . . . . . . . . . . 74.10 294.2.1 Environmental performance . . . . . . . . . . . . . . . . . . . . . . . . . . . . . . . . . .69.84 284.2.2 Personal safety . . . . . . . . . . . . . . . . . . . . . . . . . . . . . . . . . . . . . . . . . . . . . . . .63.49 464.2.3 Physician density . . . . . . . . . . . . . . . . . . . . . . . . . . . . . . . . . . . . . . . . . . . . . . 69.92 64.2.4 Sanitation . . . . . . . . . . . . . . . . . . . . . . . . . . . . . . . . . . . . . . . . . . . . . . . . . . . . . 93.14 60
5 VOCATIONAL AND TECHNICAL SKILLS . . . . . . . . . . . . .46.15 585.1 Mid-Level Skills . . . . . . . . . . . . . . . . . . . . . . . . . . . . . . . . . . . . . . . . . . . . . 56.67 315.1.1 Workforce with secondary education . . . . . . . . . . . . . . . . . . . . . . . . .70.36 255.1.2 Population with secondary education . . . . . . . . . . . . . . . . . . . . . . . .73.35 165.1.3 Technicians and associate professionals . . . . . . . . . . . . . . . . . . . . . . . 41.41 525.1.4 Labour productivity per employee . . . . . . . . . . . . . . . . . . . . . . . . . . . . 41.57 395.2 Employability . . . . . . . . . . . . . . . . . . . . . . . . . . . . . . . . . . . . . . . . . . . . . . . 35.63 1075.2.1 Ease of finding skilled employees . . . . . . . . . . . . . . . . . . . . . . . . . . . . .33.83 1175.2.2 Relevance of education system to the economy . . . . . . . . . . . . . . 36.11 865.2.3 Skills matching with secondary education . . . . . . . . . . . . . . . . . . . .26.35 1125.2.4 Skills matching with tertiary education . . . . . . . . . . . . . . . . . . . . . . . .46.22 87
6 GLOBAL KNOWLEDGE SKILLS . . . . . . . . . . . . . . . . . . . . .45.93 266.1 High-Level Skills . . . . . . . . . . . . . . . . . . . . . . . . . . . . . . . . . . . . . . . . . . . . 55.02 226.1.1 Workforce with tertiary education . . . . . . . . . . . . . . . . . . . . . . . . . . . .65.59 126.1.2 Population with tertiary education . . . . . . . . . . . . . . . . . . . . . . . . . . . .53.85 226.1.3 Professionals . . . . . . . . . . . . . . . . . . . . . . . . . . . . . . . . . . . . . . . . . . . . . . . . . . 61.42 136.1.4 Researchers . . . . . . . . . . . . . . . . . . . . . . . . . . . . . . . . . . . . . . . . . . . . . . . . . . .36.44 286.1.5 Senior officials and managers . . . . . . . . . . . . . . . . . . . . . . . . . . . . . . . . .56.46 186.1.6 Availability of scientists and engineers . . . . . . . . . . . . . . . . . . . . . . . .56.38 516.2 Talent Impact . . . . . . . . . . . . . . . . . . . . . . . . . . . . . . . . . . . . . . . . . . . . . . . 36.83 356.2.1 Innovation output . . . . . . . . . . . . . . . . . . . . . . . . . . . . . . . . . . . . . . . . . . . .45.36 396.2.2 High-value exports . . . . . . . . . . . . . . . . . . . . . . . . . . . . . . . . . . . . . . . . . . . .34.28 346.2.3 New product entrepreneurial activity . . . . . . . . . . . . . . . . . . . . . . . . .58.42 276.2.4 New business density . . . . . . . . . . . . . . . . . . . . . . . . . . . . . . . . . . . . . . . . . 15.99 376.2.5 Scientific journal articles . . . . . . . . . . . . . . . . . . . . . . . . . . . . . . . . . . . . . . 30.11 33
l Lithuania l Income group average

GTCI 2020 Country Profile by Pillar
198 THE GLOBAL TALENT COMPETITIVENESS INDEX 2020
COUNTRY PROFILESCOUNTRY PROFILES
102030405060708090100
Global knowledge skills
Vocational andtechnical skills
Retain
Grow
Attract
Enable
102030405060607
LUXEMBOURGKey Indicators
Rank (out of 132) . . . . . . . . . . . . . . . . . . . . . . . . . . . . . . . . . . . . . . . . . . .8Income group . . . . . . . . . . . . . . . . . . . . . . . . . . . . . . . . . . . . High incomeRegional group . . . . . . . . . . . . . . . . . . . . . . . . . . . . . . . . . . . . . . . . .EuropePopulation (millions) . . . . . . . . . . . . . . . . . . . . . . . . . . . . . . . . . . . . . .0.61
GDP per capita (PPP US$) . . . . . . . . . . . . . . . . . . . . . . . . . . .111,908.04GDP (US$ billions) . . . . . . . . . . . . . . . . . . . . . . . . . . . . . . . . . . . . . . 69.49GTCI score . . . . . . . . . . . . . . . . . . . . . . . . . . . . . . . . . . . . . . . . . . . . . . 73.94GTCI score (income group average) . . . . . . . . . . . . . . . . . . . . . . . . 61.46
Score Rank
1 ENABLE . . . . . . . . . . . . . . . . . . . . . . . . . . . . . . . . . . . . . . . . . . .82.74 91.1 Regulatory Landscape . . . . . . . . . . . . . . . . . . . . . . . . . . . . . . . . . . . . . . 91.02 101.1.1 Government effectiveness . . . . . . . . . . . . . . . . . . . . . . . . . . . . . . . . . . . . 87.34 111.1.2 Rule of law . . . . . . . . . . . . . . . . . . . . . . . . . . . . . . . . . . . . . . . . . . . . . . . . . . . .93.24 111.1.3 Political stability . . . . . . . . . . . . . . . . . . . . . . . . . . . . . . . . . . . . . . . . . . . . . . .94.37 41.1.4 Regulatory quality. . . . . . . . . . . . . . . . . . . . . . . . . . . . . . . . . . . . . . . . . . . . .89.60 121.1.5 Corruption . . . . . . . . . . . . . . . . . . . . . . . . . . . . . . . . . . . . . . . . . . . . . . . . . . . .90.54 91.2 Market Landscape . . . . . . . . . . . . . . . . . . . . . . . . . . . . . . . . . . . . . . . . . . 73.20 171.2.1 Competition intensity . . . . . . . . . . . . . . . . . . . . . . . . . . . . . . . . . . . . . . . . .75.29 421.2.2 Ease of doing business . . . . . . . . . . . . . . . . . . . . . . . . . . . . . . . . . . . . . . . .68.60 611.2.3 Cluster development . . . . . . . . . . . . . . . . . . . . . . . . . . . . . . . . . . . . . . . . . .78.49 121.2.4 R&D expenditure . . . . . . . . . . . . . . . . . . . . . . . . . . . . . . . . . . . . . . . . . . . . . . 27.18 291.2.5 ICT infrastructure. . . . . . . . . . . . . . . . . . . . . . . . . . . . . . . . . . . . . . . . . . . . 100.00 11.2.6 Urban population . . . . . . . . . . . . . . . . . . . . . . . . . . . . . . . . . . . . . . . . . . . . .89.63 121.3 Business and Labour Landscape . . . . . . . . . . . . . . . . . . . . . . . . . . . . 83.99 7
Labour Market1.3.1 Tertiary-educated unemployment . . . . . . . . . . . . . . . . . . . . . . . . . . . .86.09 471.3.2 Active labour market policies . . . . . . . . . . . . . . . . . . . . . . . . . . . . . . . . . 91.11 51.3.3 Labour-employer cooperation . . . . . . . . . . . . . . . . . . . . . . . . . . . . . . . .83.05 7
Management Practice1.3.4 Professional management . . . . . . . . . . . . . . . . . . . . . . . . . . . . . . . . . . . .88.74 131.3.5 Relationship of pay to productivity . . . . . . . . . . . . . . . . . . . . . . . . . . . .70.48 19
Technology Adoption1.3.6 Technology utilisation. . . . . . . . . . . . . . . . . . . . . . . . . . . . . . . . . . . . . . . . .88.90 91.3.7 Investment in emerging technologies . . . . . . . . . . . . . . . . . . . . . . . .79.58 101.3.8 Robot density . . . . . . . . . . . . . . . . . . . . . . . . . . . . . . . . . . . . . . . . . . . . . . . . . . .n/a n/a
2 ATTRACT . . . . . . . . . . . . . . . . . . . . . . . . . . . . . . . . . . . . . . . . . . 87.10 22.1 External Openness . . . . . . . . . . . . . . . . . . . . . . . . . . . . . . . . . . . . . . . . . 94.26 2
Attract Business2.1.1 FDI and technology transfer . . . . . . . . . . . . . . . . . . . . . . . . . . . . . . . . . . 91.33 42.1.2 Prevalence of foreign ownership . . . . . . . . . . . . . . . . . . . . . . . . . . . . 100.00 1
Attract People2.1.3 Migrant stock . . . . . . . . . . . . . . . . . . . . . . . . . . . . . . . . . . . . . . . . . . . . . . . . .88.46 62.1.4 International students . . . . . . . . . . . . . . . . . . . . . . . . . . . . . . . . . . . . . . . 100.00 12.1.5 Brain gain . . . . . . . . . . . . . . . . . . . . . . . . . . . . . . . . . . . . . . . . . . . . . . . . . . . . . 91.53 52.2 Internal Openness . . . . . . . . . . . . . . . . . . . . . . . . . . . . . . . . . . . . . . . . . . 79.93 12
Social Inclusion2.2.1 Tolerance of minorities . . . . . . . . . . . . . . . . . . . . . . . . . . . . . . . . . . . . . . . . 81.11 92.2.2 Tolerance of immigrants . . . . . . . . . . . . . . . . . . . . . . . . . . . . . . . . . . . . . .90.41 102.2.3 Social mobility . . . . . . . . . . . . . . . . . . . . . . . . . . . . . . . . . . . . . . . . . . . . . . . .92.83 6
Gender Equality2.2.4 Female graduates . . . . . . . . . . . . . . . . . . . . . . . . . . . . . . . . . . . . . . . . . . . . . 59.59 832.2.5 Gender development gap . . . . . . . . . . . . . . . . . . . . . . . . . . . . . . . . . . . . 77.99 632.2.6 Leadership opportunities for women . . . . . . . . . . . . . . . . . . . . . . . . .77.64 16
Score Rank
3 GROW . . . . . . . . . . . . . . . . . . . . . . . . . . . . . . . . . . . . . . . . . . . . 60.83 193.1 Formal Education . . . . . . . . . . . . . . . . . . . . . . . . . . . . . . . . . . . . . . . . . . . 28.82 60
Enrolment3.1.1 Vocational enrolment . . . . . . . . . . . . . . . . . . . . . . . . . . . . . . . . . . . . . . . . . 51.26 163.1.2 Tertiary enrolment . . . . . . . . . . . . . . . . . . . . . . . . . . . . . . . . . . . . . . . . . . . .14.96 93
Quality3.1.3 Tertiary education expenditure . . . . . . . . . . . . . . . . . . . . . . . . . . . . . . . 10.01 963.1.4 Reading, maths, and science . . . . . . . . . . . . . . . . . . . . . . . . . . . . . . . . . . 67.88 313.1.5 University ranking . . . . . . . . . . . . . . . . . . . . . . . . . . . . . . . . . . . . . . . . . . . . . . 0.00 753.2 Lifelong Learning . . . . . . . . . . . . . . . . . . . . . . . . . . . . . . . . . . . . . . . . . . . 77.01 113.2.1 Quality of management schools . . . . . . . . . . . . . . . . . . . . . . . . . . . . . .63.92 343.2.2 Prevalence of training in firms . . . . . . . . . . . . . . . . . . . . . . . . . . . . . . . . . . .n/a n/a3.2.3 Employee development . . . . . . . . . . . . . . . . . . . . . . . . . . . . . . . . . . . . . . 90.11 33.3 Access to Growth Opportunities . . . . . . . . . . . . . . . . . . . . . . . . . . . 76.64 11
Empowerment3.3.1 Delegation of authority . . . . . . . . . . . . . . . . . . . . . . . . . . . . . . . . . . . . . . . 81.78 163.3.2 Personal rights . . . . . . . . . . . . . . . . . . . . . . . . . . . . . . . . . . . . . . . . . . . . . . . .96.49 15
Collaboration3.3.3 Use of virtual social networks . . . . . . . . . . . . . . . . . . . . . . . . . . . . . . . . .86.06 253.3.4 Use of virtual professional networks . . . . . . . . . . . . . . . . . . . . . . . . . . 45.18 143.3.5 Collaboration within organisations . . . . . . . . . . . . . . . . . . . . . . . . . . . . 81.41 133.3.6 Collaboration across organisations . . . . . . . . . . . . . . . . . . . . . . . . . . . .68.91 13
4 RETAIN . . . . . . . . . . . . . . . . . . . . . . . . . . . . . . . . . . . . . . . . . . . 86.22 44.1 Sustainability . . . . . . . . . . . . . . . . . . . . . . . . . . . . . . . . . . . . . . . . . . . . . . . 95.81 24.1.1 Pension system . . . . . . . . . . . . . . . . . . . . . . . . . . . . . . . . . . . . . . . . . . . . . 100.00 14.1.2 Social protection . . . . . . . . . . . . . . . . . . . . . . . . . . . . . . . . . . . . . . . . . . . . . . 99.11 34.1.3 Brain retention . . . . . . . . . . . . . . . . . . . . . . . . . . . . . . . . . . . . . . . . . . . . . . . .88.32 54.2 Lifestyle . . . . . . . . . . . . . . . . . . . . . . . . . . . . . . . . . . . . . . . . . . . . . . . . . . . . 76.63 244.2.1 Environmental performance . . . . . . . . . . . . . . . . . . . . . . . . . . . . . . . . . . 86.16 74.2.2 Personal safety . . . . . . . . . . . . . . . . . . . . . . . . . . . . . . . . . . . . . . . . . . . . . . . .76.37 264.2.3 Physician density . . . . . . . . . . . . . . . . . . . . . . . . . . . . . . . . . . . . . . . . . . . . . .46.54 394.2.4 Sanitation . . . . . . . . . . . . . . . . . . . . . . . . . . . . . . . . . . . . . . . . . . . . . . . . . . . . . 97.43 43
5 VOCATIONAL AND TECHNICAL SKILLS . . . . . . . . . . . . 65.68 165.1 Mid-Level Skills . . . . . . . . . . . . . . . . . . . . . . . . . . . . . . . . . . . . . . . . . . . . . 63.53 175.1.1 Workforce with secondary education . . . . . . . . . . . . . . . . . . . . . . . . .43.62 695.1.2 Population with secondary education . . . . . . . . . . . . . . . . . . . . . . . .50.84 425.1.3 Technicians and associate professionals . . . . . . . . . . . . . . . . . . . . . . . 77.19 95.1.4 Labour productivity per employee . . . . . . . . . . . . . . . . . . . . . . . . . . . .82.46 45.2 Employability . . . . . . . . . . . . . . . . . . . . . . . . . . . . . . . . . . . . . . . . . . . . . . . 67.83 255.2.1 Ease of finding skilled employees . . . . . . . . . . . . . . . . . . . . . . . . . . . . . 59.11 585.2.2 Relevance of education system to the economy . . . . . . . . . . . . . . 64.15 265.2.3 Skills matching with secondary education . . . . . . . . . . . . . . . . . . . . 71.18 135.2.4 Skills matching with tertiary education . . . . . . . . . . . . . . . . . . . . . . . .76.90 24
6 GLOBAL KNOWLEDGE SKILLS . . . . . . . . . . . . . . . . . . . . .61.06 116.1 High-Level Skills . . . . . . . . . . . . . . . . . . . . . . . . . . . . . . . . . . . . . . . . . . . . 57.22 196.1.1 Workforce with tertiary education . . . . . . . . . . . . . . . . . . . . . . . . . . . . 67.80 116.1.2 Population with tertiary education . . . . . . . . . . . . . . . . . . . . . . . . . . . .54.54 216.1.3 Professionals . . . . . . . . . . . . . . . . . . . . . . . . . . . . . . . . . . . . . . . . . . . . . . . . 100.00 16.1.4 Researchers . . . . . . . . . . . . . . . . . . . . . . . . . . . . . . . . . . . . . . . . . . . . . . . . . . .56.70 156.1.5 Senior officials and managers . . . . . . . . . . . . . . . . . . . . . . . . . . . . . . . . . 11.51 896.1.6 Availability of scientists and engineers . . . . . . . . . . . . . . . . . . . . . . . . 52.76 566.2 Talent Impact . . . . . . . . . . . . . . . . . . . . . . . . . . . . . . . . . . . . . . . . . . . . . . . 64.91 36.2.1 Innovation output . . . . . . . . . . . . . . . . . . . . . . . . . . . . . . . . . . . . . . . . . . . . 74.96 116.2.2 High-value exports . . . . . . . . . . . . . . . . . . . . . . . . . . . . . . . . . . . . . . . . . . . . 19.99 606.2.3 New product entrepreneurial activity . . . . . . . . . . . . . . . . . . . . . . . 100.00 16.2.4 New business density . . . . . . . . . . . . . . . . . . . . . . . . . . . . . . . . . . . . . . . . . 73.91 76.2.5 Scientific journal articles . . . . . . . . . . . . . . . . . . . . . . . . . . . . . . . . . . . . . .55.68 18
l Luxembourg l Income group average
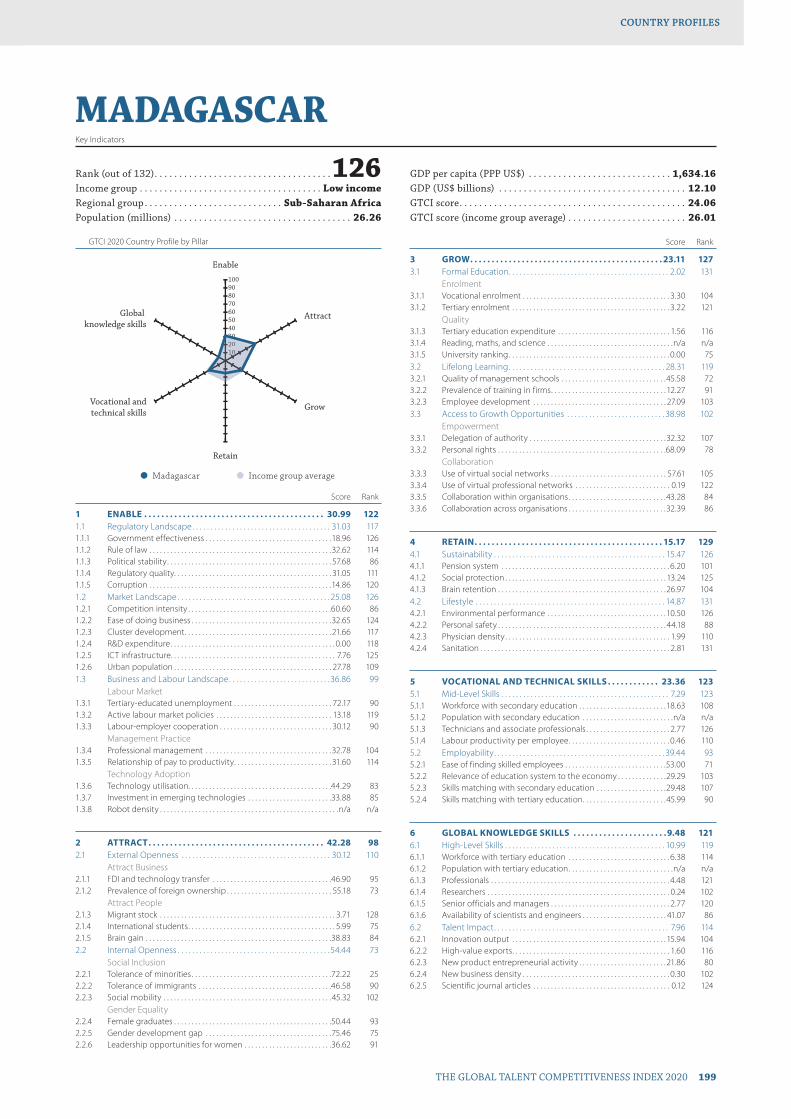
GTCI 2020 Country Profile by Pillar
THE GLOBAL TALENT COMPETITIVENESS INDEX 2020 199
COUNTRY PROFILESCOUNTRY PROFILES
102030405060708090100
Global knowledge skills
Vocational andtechnical skills
Retain
Grow
Attract
Enable
1020330
MADAGASCARKey Indicators
Rank (out of 132) . . . . . . . . . . . . . . . . . . . . . . . . . . . . . . . . . . . .126Income group . . . . . . . . . . . . . . . . . . . . . . . . . . . . . . . . . . . . . Low incomeRegional group . . . . . . . . . . . . . . . . . . . . . . . . . . . . Sub-Saharan AfricaPopulation (millions) . . . . . . . . . . . . . . . . . . . . . . . . . . . . . . . . . . . . 26.26
GDP per capita (PPP US$) . . . . . . . . . . . . . . . . . . . . . . . . . . . . . 1,634.16GDP (US$ billions) . . . . . . . . . . . . . . . . . . . . . . . . . . . . . . . . . . . . . . 12.10GTCI score . . . . . . . . . . . . . . . . . . . . . . . . . . . . . . . . . . . . . . . . . . . . . . 24.06GTCI score (income group average) . . . . . . . . . . . . . . . . . . . . . . . . 26.01
Score Rank
1 ENABLE . . . . . . . . . . . . . . . . . . . . . . . . . . . . . . . . . . . . . . . . . . 30.99 1221.1 Regulatory Landscape . . . . . . . . . . . . . . . . . . . . . . . . . . . . . . . . . . . . . . 31.03 1171.1.1 Government effectiveness . . . . . . . . . . . . . . . . . . . . . . . . . . . . . . . . . . . .18.96 1261.1.2 Rule of law . . . . . . . . . . . . . . . . . . . . . . . . . . . . . . . . . . . . . . . . . . . . . . . . . . . .32.62 1141.1.3 Political stability . . . . . . . . . . . . . . . . . . . . . . . . . . . . . . . . . . . . . . . . . . . . . . . 57.68 861.1.4 Regulatory quality. . . . . . . . . . . . . . . . . . . . . . . . . . . . . . . . . . . . . . . . . . . . . 31.05 1111.1.5 Corruption . . . . . . . . . . . . . . . . . . . . . . . . . . . . . . . . . . . . . . . . . . . . . . . . . . . .14.86 1201.2 Market Landscape . . . . . . . . . . . . . . . . . . . . . . . . . . . . . . . . . . . . . . . . . . 25.08 1261.2.1 Competition intensity . . . . . . . . . . . . . . . . . . . . . . . . . . . . . . . . . . . . . . . . .60.60 861.2.2 Ease of doing business . . . . . . . . . . . . . . . . . . . . . . . . . . . . . . . . . . . . . . . .32.65 1241.2.3 Cluster development . . . . . . . . . . . . . . . . . . . . . . . . . . . . . . . . . . . . . . . . . . 21.66 1171.2.4 R&D expenditure . . . . . . . . . . . . . . . . . . . . . . . . . . . . . . . . . . . . . . . . . . . . . . . 0.00 1181.2.5 ICT infrastructure. . . . . . . . . . . . . . . . . . . . . . . . . . . . . . . . . . . . . . . . . . . . . . . 7.76 1251.2.6 Urban population . . . . . . . . . . . . . . . . . . . . . . . . . . . . . . . . . . . . . . . . . . . . . 27.78 1091.3 Business and Labour Landscape . . . . . . . . . . . . . . . . . . . . . . . . . . . .36.86 99
Labour Market1.3.1 Tertiary-educated unemployment . . . . . . . . . . . . . . . . . . . . . . . . . . . . 72.17 901.3.2 Active labour market policies . . . . . . . . . . . . . . . . . . . . . . . . . . . . . . . . . 13.18 1191.3.3 Labour-employer cooperation . . . . . . . . . . . . . . . . . . . . . . . . . . . . . . . . 30.12 90
Management Practice1.3.4 Professional management . . . . . . . . . . . . . . . . . . . . . . . . . . . . . . . . . . . .32.78 1041.3.5 Relationship of pay to productivity . . . . . . . . . . . . . . . . . . . . . . . . . . . . 31.60 114
Technology Adoption1.3.6 Technology utilisation. . . . . . . . . . . . . . . . . . . . . . . . . . . . . . . . . . . . . . . . .44.29 831.3.7 Investment in emerging technologies . . . . . . . . . . . . . . . . . . . . . . . .33.88 851.3.8 Robot density . . . . . . . . . . . . . . . . . . . . . . . . . . . . . . . . . . . . . . . . . . . . . . . . . . .n/a n/a
2 ATTRACT . . . . . . . . . . . . . . . . . . . . . . . . . . . . . . . . . . . . . . . . . 42.28 982.1 External Openness . . . . . . . . . . . . . . . . . . . . . . . . . . . . . . . . . . . . . . . . . 30.12 110
Attract Business2.1.1 FDI and technology transfer . . . . . . . . . . . . . . . . . . . . . . . . . . . . . . . . . .46.90 952.1.2 Prevalence of foreign ownership . . . . . . . . . . . . . . . . . . . . . . . . . . . . . . 55.18 73
Attract People2.1.3 Migrant stock . . . . . . . . . . . . . . . . . . . . . . . . . . . . . . . . . . . . . . . . . . . . . . . . . . 3.71 1282.1.4 International students . . . . . . . . . . . . . . . . . . . . . . . . . . . . . . . . . . . . . . . . . . 5.99 752.1.5 Brain gain . . . . . . . . . . . . . . . . . . . . . . . . . . . . . . . . . . . . . . . . . . . . . . . . . . . . .38.83 842.2 Internal Openness . . . . . . . . . . . . . . . . . . . . . . . . . . . . . . . . . . . . . . . . . .54.44 73
Social Inclusion2.2.1 Tolerance of minorities . . . . . . . . . . . . . . . . . . . . . . . . . . . . . . . . . . . . . . . .72.22 252.2.2 Tolerance of immigrants . . . . . . . . . . . . . . . . . . . . . . . . . . . . . . . . . . . . . .46.58 902.2.3 Social mobility . . . . . . . . . . . . . . . . . . . . . . . . . . . . . . . . . . . . . . . . . . . . . . . .45.32 102
Gender Equality2.2.4 Female graduates . . . . . . . . . . . . . . . . . . . . . . . . . . . . . . . . . . . . . . . . . . . . .50.44 932.2.5 Gender development gap . . . . . . . . . . . . . . . . . . . . . . . . . . . . . . . . . . . .75.46 752.2.6 Leadership opportunities for women . . . . . . . . . . . . . . . . . . . . . . . . .36.62 91
Score Rank
3 GROW . . . . . . . . . . . . . . . . . . . . . . . . . . . . . . . . . . . . . . . . . . . . . 23.11 1273.1 Formal Education . . . . . . . . . . . . . . . . . . . . . . . . . . . . . . . . . . . . . . . . . . . . 2.02 131
Enrolment3.1.1 Vocational enrolment . . . . . . . . . . . . . . . . . . . . . . . . . . . . . . . . . . . . . . . . . . 3.30 1043.1.2 Tertiary enrolment . . . . . . . . . . . . . . . . . . . . . . . . . . . . . . . . . . . . . . . . . . . . . 3.22 121
Quality3.1.3 Tertiary education expenditure . . . . . . . . . . . . . . . . . . . . . . . . . . . . . . . . 1.56 1163.1.4 Reading, maths, and science . . . . . . . . . . . . . . . . . . . . . . . . . . . . . . . . . . . .n/a n/a3.1.5 University ranking . . . . . . . . . . . . . . . . . . . . . . . . . . . . . . . . . . . . . . . . . . . . . . 0.00 753.2 Lifelong Learning . . . . . . . . . . . . . . . . . . . . . . . . . . . . . . . . . . . . . . . . . . . 28.31 1193.2.1 Quality of management schools . . . . . . . . . . . . . . . . . . . . . . . . . . . . . .45.58 723.2.2 Prevalence of training in firms . . . . . . . . . . . . . . . . . . . . . . . . . . . . . . . . . 12.27 913.2.3 Employee development . . . . . . . . . . . . . . . . . . . . . . . . . . . . . . . . . . . . . . 27.09 1033.3 Access to Growth Opportunities . . . . . . . . . . . . . . . . . . . . . . . . . . . 38.98 102
Empowerment3.3.1 Delegation of authority . . . . . . . . . . . . . . . . . . . . . . . . . . . . . . . . . . . . . . .32.32 1073.3.2 Personal rights . . . . . . . . . . . . . . . . . . . . . . . . . . . . . . . . . . . . . . . . . . . . . . . .68.09 78
Collaboration3.3.3 Use of virtual social networks . . . . . . . . . . . . . . . . . . . . . . . . . . . . . . . . . 57.61 1053.3.4 Use of virtual professional networks . . . . . . . . . . . . . . . . . . . . . . . . . . . 0.19 1223.3.5 Collaboration within organisations . . . . . . . . . . . . . . . . . . . . . . . . . . . .43.28 843.3.6 Collaboration across organisations . . . . . . . . . . . . . . . . . . . . . . . . . . . .32.39 86
4 RETAIN . . . . . . . . . . . . . . . . . . . . . . . . . . . . . . . . . . . . . . . . . . . . 15.17 1294.1 Sustainability . . . . . . . . . . . . . . . . . . . . . . . . . . . . . . . . . . . . . . . . . . . . . . . 15.47 1264.1.1 Pension system . . . . . . . . . . . . . . . . . . . . . . . . . . . . . . . . . . . . . . . . . . . . . . . . 6.20 1014.1.2 Social protection . . . . . . . . . . . . . . . . . . . . . . . . . . . . . . . . . . . . . . . . . . . . . . 13.24 1254.1.3 Brain retention . . . . . . . . . . . . . . . . . . . . . . . . . . . . . . . . . . . . . . . . . . . . . . . .26.97 1044.2 Lifestyle . . . . . . . . . . . . . . . . . . . . . . . . . . . . . . . . . . . . . . . . . . . . . . . . . . . . 14.87 1314.2.1 Environmental performance . . . . . . . . . . . . . . . . . . . . . . . . . . . . . . . . . .10.50 1264.2.2 Personal safety . . . . . . . . . . . . . . . . . . . . . . . . . . . . . . . . . . . . . . . . . . . . . . . . 44.18 884.2.3 Physician density . . . . . . . . . . . . . . . . . . . . . . . . . . . . . . . . . . . . . . . . . . . . . . . 1.99 1104.2.4 Sanitation . . . . . . . . . . . . . . . . . . . . . . . . . . . . . . . . . . . . . . . . . . . . . . . . . . . . . . 2.81 131
5 VOCATIONAL AND TECHNICAL SKILLS . . . . . . . . . . . . 23.36 1235.1 Mid-Level Skills . . . . . . . . . . . . . . . . . . . . . . . . . . . . . . . . . . . . . . . . . . . . . . 7.29 1235.1.1 Workforce with secondary education . . . . . . . . . . . . . . . . . . . . . . . . .18.63 1085.1.2 Population with secondary education . . . . . . . . . . . . . . . . . . . . . . . . . .n/a n/a5.1.3 Technicians and associate professionals . . . . . . . . . . . . . . . . . . . . . . . . 2.77 1265.1.4 Labour productivity per employee . . . . . . . . . . . . . . . . . . . . . . . . . . . . . 0.46 1105.2 Employability . . . . . . . . . . . . . . . . . . . . . . . . . . . . . . . . . . . . . . . . . . . . . . . 39.44 935.2.1 Ease of finding skilled employees . . . . . . . . . . . . . . . . . . . . . . . . . . . . .53.00 715.2.2 Relevance of education system to the economy . . . . . . . . . . . . . .29.29 1035.2.3 Skills matching with secondary education . . . . . . . . . . . . . . . . . . . .29.48 1075.2.4 Skills matching with tertiary education . . . . . . . . . . . . . . . . . . . . . . . .45.99 90
6 GLOBAL KNOWLEDGE SKILLS . . . . . . . . . . . . . . . . . . . . . .9.48 1216.1 High-Level Skills . . . . . . . . . . . . . . . . . . . . . . . . . . . . . . . . . . . . . . . . . . . . 10.99 1196.1.1 Workforce with tertiary education . . . . . . . . . . . . . . . . . . . . . . . . . . . . . 6.38 1146.1.2 Population with tertiary education . . . . . . . . . . . . . . . . . . . . . . . . . . . . . .n/a n/a6.1.3 Professionals . . . . . . . . . . . . . . . . . . . . . . . . . . . . . . . . . . . . . . . . . . . . . . . . . . . 4.48 1216.1.4 Researchers . . . . . . . . . . . . . . . . . . . . . . . . . . . . . . . . . . . . . . . . . . . . . . . . . . . . 0.24 1026.1.5 Senior officials and managers . . . . . . . . . . . . . . . . . . . . . . . . . . . . . . . . . . 2.77 1206.1.6 Availability of scientists and engineers . . . . . . . . . . . . . . . . . . . . . . . . 41.07 866.2 Talent Impact . . . . . . . . . . . . . . . . . . . . . . . . . . . . . . . . . . . . . . . . . . . . . . . . 7.96 1146.2.1 Innovation output . . . . . . . . . . . . . . . . . . . . . . . . . . . . . . . . . . . . . . . . . . . . 15.94 1046.2.2 High-value exports . . . . . . . . . . . . . . . . . . . . . . . . . . . . . . . . . . . . . . . . . . . . . 1.60 1166.2.3 New product entrepreneurial activity . . . . . . . . . . . . . . . . . . . . . . . . . 21.86 806.2.4 New business density . . . . . . . . . . . . . . . . . . . . . . . . . . . . . . . . . . . . . . . . . . 0.30 1026.2.5 Scientific journal articles . . . . . . . . . . . . . . . . . . . . . . . . . . . . . . . . . . . . . . . 0.12 124
l Madagascar l Income group average

GTCI 2020 Country Profile by Pillar
200 THE GLOBAL TALENT COMPETITIVENESS INDEX 2020
COUNTRY PROFILESCOUNTRY PROFILES
102030405060708090100
Global knowledge skills
Vocational andtechnical skills
Retain
Grow
Attract
Enable
1020330
MALAWIKey Indicators
Rank (out of 132) . . . . . . . . . . . . . . . . . . . . . . . . . . . . . . . . . . . .120Income group . . . . . . . . . . . . . . . . . . . . . . . . . . . . . . . . . . . . . Low incomeRegional group . . . . . . . . . . . . . . . . . . . . . . . . . . . . Sub-Saharan AfricaPopulation (millions) . . . . . . . . . . . . . . . . . . . . . . . . . . . . . . . . . . . . 18.14
GDP per capita (PPP US$) . . . . . . . . . . . . . . . . . . . . . . . . . . . . . 1,308.68GDP (US$ billions) . . . . . . . . . . . . . . . . . . . . . . . . . . . . . . . . . . . . . . . .7.06GTCI score . . . . . . . . . . . . . . . . . . . . . . . . . . . . . . . . . . . . . . . . . . . . . . 26.44GTCI score (income group average) . . . . . . . . . . . . . . . . . . . . . . . . 26.01
Score Rank
1 ENABLE . . . . . . . . . . . . . . . . . . . . . . . . . . . . . . . . . . . . . . . . . . 32.30 1181.1 Regulatory Landscape . . . . . . . . . . . . . . . . . . . . . . . . . . . . . . . . . . . . . . 37.48 1021.1.1 Government effectiveness . . . . . . . . . . . . . . . . . . . . . . . . . . . . . . . . . . . .30.31 1121.1.2 Rule of law . . . . . . . . . . . . . . . . . . . . . . . . . . . . . . . . . . . . . . . . . . . . . . . . . . . .44.02 871.1.3 Political stability . . . . . . . . . . . . . . . . . . . . . . . . . . . . . . . . . . . . . . . . . . . . . . .59.04 821.1.4 Regulatory quality. . . . . . . . . . . . . . . . . . . . . . . . . . . . . . . . . . . . . . . . . . . . .29.72 1151.1.5 Corruption . . . . . . . . . . . . . . . . . . . . . . . . . . . . . . . . . . . . . . . . . . . . . . . . . . . .24.32 1001.2 Market Landscape . . . . . . . . . . . . . . . . . . . . . . . . . . . . . . . . . . . . . . . . . . 28.56 1221.2.1 Competition intensity . . . . . . . . . . . . . . . . . . . . . . . . . . . . . . . . . . . . . . . . .56.30 1051.2.2 Ease of doing business . . . . . . . . . . . . . . . . . . . . . . . . . . . . . . . . . . . . . . . . 51.77 951.2.3 Cluster development . . . . . . . . . . . . . . . . . . . . . . . . . . . . . . . . . . . . . . . . . .23.87 1091.2.4 R&D expenditure . . . . . . . . . . . . . . . . . . . . . . . . . . . . . . . . . . . . . . . . . . . . . . . .n/a n/a1.2.5 ICT infrastructure. . . . . . . . . . . . . . . . . . . . . . . . . . . . . . . . . . . . . . . . . . . . . . . 6.36 1261.2.6 Urban population . . . . . . . . . . . . . . . . . . . . . . . . . . . . . . . . . . . . . . . . . . . . . . 4.49 1311.3 Business and Labour Landscape . . . . . . . . . . . . . . . . . . . . . . . . . . . . 30.86 118
Labour Market1.3.1 Tertiary-educated unemployment . . . . . . . . . . . . . . . . . . . . . . . . . . . .53.30 1081.3.2 Active labour market policies . . . . . . . . . . . . . . . . . . . . . . . . . . . . . . . . . 19.79 1121.3.3 Labour-employer cooperation . . . . . . . . . . . . . . . . . . . . . . . . . . . . . . . .22.98 106
Management Practice1.3.4 Professional management . . . . . . . . . . . . . . . . . . . . . . . . . . . . . . . . . . . .45.07 791.3.5 Relationship of pay to productivity . . . . . . . . . . . . . . . . . . . . . . . . . . . . 37.93 96
Technology Adoption1.3.6 Technology utilisation. . . . . . . . . . . . . . . . . . . . . . . . . . . . . . . . . . . . . . . . . 17.15 1241.3.7 Investment in emerging technologies . . . . . . . . . . . . . . . . . . . . . . . . 19.79 1171.3.8 Robot density . . . . . . . . . . . . . . . . . . . . . . . . . . . . . . . . . . . . . . . . . . . . . . . . . . .n/a n/a
2 ATTRACT . . . . . . . . . . . . . . . . . . . . . . . . . . . . . . . . . . . . . . . . . .39.29 1102.1 External Openness . . . . . . . . . . . . . . . . . . . . . . . . . . . . . . . . . . . . . . . . . 34.07 97
Attract Business2.1.1 FDI and technology transfer . . . . . . . . . . . . . . . . . . . . . . . . . . . . . . . . . .32.22 1242.1.2 Prevalence of foreign ownership . . . . . . . . . . . . . . . . . . . . . . . . . . . . . .64.88 52
Attract People2.1.3 Migrant stock . . . . . . . . . . . . . . . . . . . . . . . . . . . . . . . . . . . . . . . . . . . . . . . . . 27.04 902.1.4 International students . . . . . . . . . . . . . . . . . . . . . . . . . . . . . . . . . . . . . . . . . . 4.08 802.1.5 Brain gain . . . . . . . . . . . . . . . . . . . . . . . . . . . . . . . . . . . . . . . . . . . . . . . . . . . . . 42.14 722.2 Internal Openness . . . . . . . . . . . . . . . . . . . . . . . . . . . . . . . . . . . . . . . . . .44.50 111
Social Inclusion2.2.1 Tolerance of minorities . . . . . . . . . . . . . . . . . . . . . . . . . . . . . . . . . . . . . . . .52.22 552.2.2 Tolerance of immigrants . . . . . . . . . . . . . . . . . . . . . . . . . . . . . . . . . . . . . .34.25 1052.2.3 Social mobility . . . . . . . . . . . . . . . . . . . . . . . . . . . . . . . . . . . . . . . . . . . . . . . .44.25 106
Gender Equality2.2.4 Female graduates . . . . . . . . . . . . . . . . . . . . . . . . . . . . . . . . . . . . . . . . . . . . . . .n/a n/a2.2.5 Gender development gap . . . . . . . . . . . . . . . . . . . . . . . . . . . . . . . . . . . .66.04 922.2.6 Leadership opportunities for women . . . . . . . . . . . . . . . . . . . . . . . . . 25.74 112
Score Rank
3 GROW . . . . . . . . . . . . . . . . . . . . . . . . . . . . . . . . . . . . . . . . . . . . 23.54 1253.1 Formal Education . . . . . . . . . . . . . . . . . . . . . . . . . . . . . . . . . . . . . . . . . . . . 8.37 118
Enrolment3.1.1 Vocational enrolment . . . . . . . . . . . . . . . . . . . . . . . . . . . . . . . . . . . . . . . . . . .n/a n/a3.1.2 Tertiary enrolment . . . . . . . . . . . . . . . . . . . . . . . . . . . . . . . . . . . . . . . . . . . . . 0.00 126
Quality3.1.3 Tertiary education expenditure . . . . . . . . . . . . . . . . . . . . . . . . . . . . . . . 25.10 493.1.4 Reading, maths, and science . . . . . . . . . . . . . . . . . . . . . . . . . . . . . . . . . . . .n/a n/a3.1.5 University ranking . . . . . . . . . . . . . . . . . . . . . . . . . . . . . . . . . . . . . . . . . . . . . . 0.00 753.2 Lifelong Learning . . . . . . . . . . . . . . . . . . . . . . . . . . . . . . . . . . . . . . . . . . . 31.03 1093.2.1 Quality of management schools . . . . . . . . . . . . . . . . . . . . . . . . . . . . . .23.58 1243.2.2 Prevalence of training in firms . . . . . . . . . . . . . . . . . . . . . . . . . . . . . . . . .38.92 443.2.3 Employee development . . . . . . . . . . . . . . . . . . . . . . . . . . . . . . . . . . . . . .30.57 943.3 Access to Growth Opportunities . . . . . . . . . . . . . . . . . . . . . . . . . . . 31.24 120
Empowerment3.3.1 Delegation of authority . . . . . . . . . . . . . . . . . . . . . . . . . . . . . . . . . . . . . . .40.86 813.3.2 Personal rights . . . . . . . . . . . . . . . . . . . . . . . . . . . . . . . . . . . . . . . . . . . . . . . . 67.52 79
Collaboration3.3.3 Use of virtual social networks . . . . . . . . . . . . . . . . . . . . . . . . . . . . . . . . .34.00 1293.3.4 Use of virtual professional networks . . . . . . . . . . . . . . . . . . . . . . . . . . . 0.56 1193.3.5 Collaboration within organisations . . . . . . . . . . . . . . . . . . . . . . . . . . . . 27.07 1263.3.6 Collaboration across organisations . . . . . . . . . . . . . . . . . . . . . . . . . . . . 17.44 125
4 RETAIN . . . . . . . . . . . . . . . . . . . . . . . . . . . . . . . . . . . . . . . . . . . .27.47 1124.1 Sustainability . . . . . . . . . . . . . . . . . . . . . . . . . . . . . . . . . . . . . . . . . . . . . . . 20.83 1174.1.1 Pension system . . . . . . . . . . . . . . . . . . . . . . . . . . . . . . . . . . . . . . . . . . . . . . . . 4.33 1064.1.2 Social protection . . . . . . . . . . . . . . . . . . . . . . . . . . . . . . . . . . . . . . . . . . . . . . 21.21 1164.1.3 Brain retention . . . . . . . . . . . . . . . . . . . . . . . . . . . . . . . . . . . . . . . . . . . . . . . .36.94 774.2 Lifestyle . . . . . . . . . . . . . . . . . . . . . . . . . . . . . . . . . . . . . . . . . . . . . . . . . . . . 34.11 1014.2.1 Environmental performance . . . . . . . . . . . . . . . . . . . . . . . . . . . . . . . . . .36.31 1014.2.2 Personal safety . . . . . . . . . . . . . . . . . . . . . . . . . . . . . . . . . . . . . . . . . . . . . . . .60.90 514.2.3 Physician density . . . . . . . . . . . . . . . . . . . . . . . . . . . . . . . . . . . . . . . . . . . . . . . 0.00 1274.2.4 Sanitation . . . . . . . . . . . . . . . . . . . . . . . . . . . . . . . . . . . . . . . . . . . . . . . . . . . . .39.23 113
5 VOCATIONAL AND TECHNICAL SKILLS . . . . . . . . . . . . .21.06 1295.1 Mid-Level Skills . . . . . . . . . . . . . . . . . . . . . . . . . . . . . . . . . . . . . . . . . . . . . . 6.29 1255.1.1 Workforce with secondary education . . . . . . . . . . . . . . . . . . . . . . . . .18.87 1075.1.2 Population with secondary education . . . . . . . . . . . . . . . . . . . . . . . . . .n/a n/a5.1.3 Technicians and associate professionals . . . . . . . . . . . . . . . . . . . . . . . . 0.00 1275.1.4 Labour productivity per employee . . . . . . . . . . . . . . . . . . . . . . . . . . . . . 0.00 1125.2 Employability . . . . . . . . . . . . . . . . . . . . . . . . . . . . . . . . . . . . . . . . . . . . . . . 35.83 1065.2.1 Ease of finding skilled employees . . . . . . . . . . . . . . . . . . . . . . . . . . . . .48.55 865.2.2 Relevance of education system to the economy . . . . . . . . . . . . . . 33.15 945.2.3 Skills matching with secondary education . . . . . . . . . . . . . . . . . . . . 19.23 1255.2.4 Skills matching with tertiary education . . . . . . . . . . . . . . . . . . . . . . . .42.39 99
6 GLOBAL KNOWLEDGE SKILLS . . . . . . . . . . . . . . . . . . . . .14.97 1016.1 High-Level Skills . . . . . . . . . . . . . . . . . . . . . . . . . . . . . . . . . . . . . . . . . . . . . 8.95 1276.1.1 Workforce with tertiary education . . . . . . . . . . . . . . . . . . . . . . . . . . . . . 1.18 1236.1.2 Population with tertiary education . . . . . . . . . . . . . . . . . . . . . . . . . . . . . .n/a n/a6.1.3 Professionals . . . . . . . . . . . . . . . . . . . . . . . . . . . . . . . . . . . . . . . . . . . . . . . . . . . 6.90 1166.1.4 Researchers . . . . . . . . . . . . . . . . . . . . . . . . . . . . . . . . . . . . . . . . . . . . . . . . . . . . 0.46 926.1.5 Senior officials and managers . . . . . . . . . . . . . . . . . . . . . . . . . . . . . . . . . . 1.49 1246.1.6 Availability of scientists and engineers . . . . . . . . . . . . . . . . . . . . . . . .34.73 1076.2 Talent Impact . . . . . . . . . . . . . . . . . . . . . . . . . . . . . . . . . . . . . . . . . . . . . . . 20.98 686.2.1 Innovation output . . . . . . . . . . . . . . . . . . . . . . . . . . . . . . . . . . . . . . . . . . . . 15.59 1086.2.2 High-value exports . . . . . . . . . . . . . . . . . . . . . . . . . . . . . . . . . . . . . . . . . . . . 33.15 366.2.3 New product entrepreneurial activity . . . . . . . . . . . . . . . . . . . . . . . . .55.39 356.2.4 New business density . . . . . . . . . . . . . . . . . . . . . . . . . . . . . . . . . . . . . . . . . . 0.35 1016.2.5 Scientific journal articles . . . . . . . . . . . . . . . . . . . . . . . . . . . . . . . . . . . . . . . 0.43 110
l Malawi l Income group average
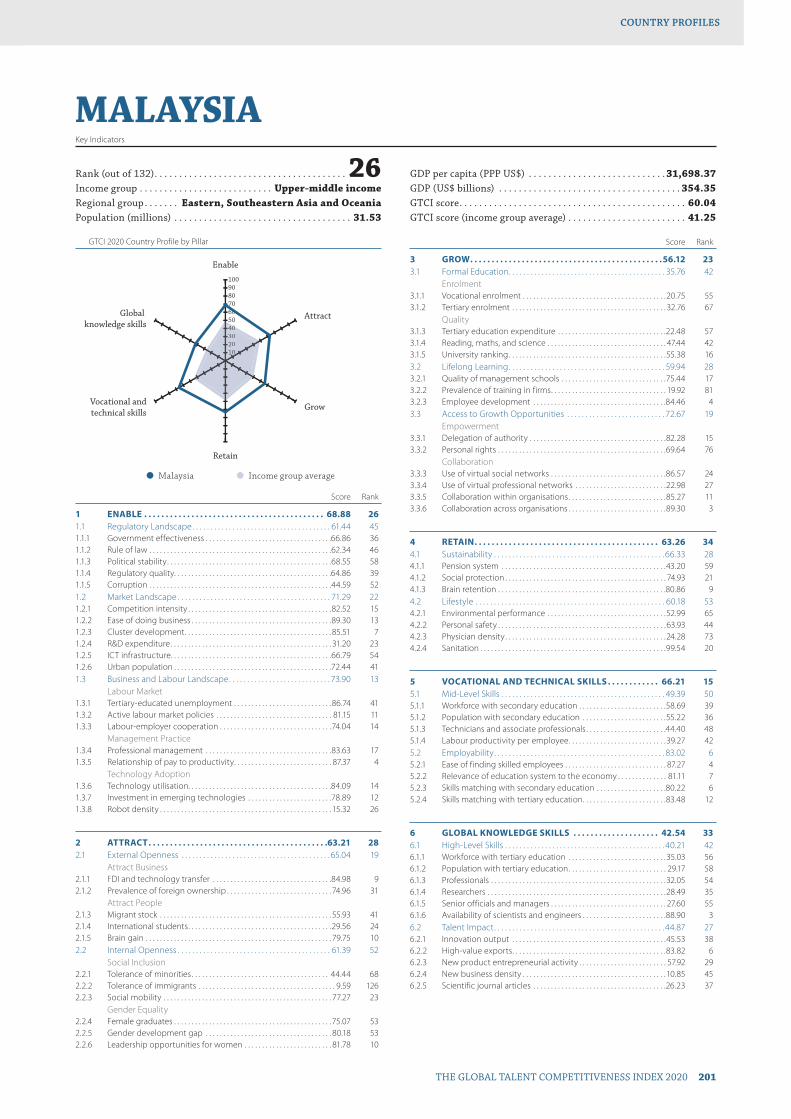
GTCI 2020 Country Profile by Pillar
THE GLOBAL TALENT COMPETITIVENESS INDEX 2020 201
COUNTRY PROFILESCOUNTRY PROFILES
102030405060708090100
Global knowledge skills
Vocational andtechnical skills
Retain
Grow
Attract
Enable
1020304040
MALAYSIAKey Indicators
Rank (out of 132) . . . . . . . . . . . . . . . . . . . . . . . . . . . . . . . . . . . . . . . 26Income group . . . . . . . . . . . . . . . . . . . . . . . . . . . Upper-middle incomeRegional group . . . . . . . Eastern, Southeastern Asia and OceaniaPopulation (millions) . . . . . . . . . . . . . . . . . . . . . . . . . . . . . . . . . . . . 31.53
GDP per capita (PPP US$) . . . . . . . . . . . . . . . . . . . . . . . . . . . . 31,698.37GDP (US$ billions) . . . . . . . . . . . . . . . . . . . . . . . . . . . . . . . . . . . . . 354.35GTCI score . . . . . . . . . . . . . . . . . . . . . . . . . . . . . . . . . . . . . . . . . . . . . . 60.04GTCI score (income group average) . . . . . . . . . . . . . . . . . . . . . . . . 41.25
Score Rank
1 ENABLE . . . . . . . . . . . . . . . . . . . . . . . . . . . . . . . . . . . . . . . . . . 68.88 261.1 Regulatory Landscape . . . . . . . . . . . . . . . . . . . . . . . . . . . . . . . . . . . . . . 61.44 451.1.1 Government effectiveness . . . . . . . . . . . . . . . . . . . . . . . . . . . . . . . . . . . .66.86 361.1.2 Rule of law . . . . . . . . . . . . . . . . . . . . . . . . . . . . . . . . . . . . . . . . . . . . . . . . . . . .62.34 461.1.3 Political stability . . . . . . . . . . . . . . . . . . . . . . . . . . . . . . . . . . . . . . . . . . . . . . .68.55 581.1.4 Regulatory quality. . . . . . . . . . . . . . . . . . . . . . . . . . . . . . . . . . . . . . . . . . . . .64.86 391.1.5 Corruption . . . . . . . . . . . . . . . . . . . . . . . . . . . . . . . . . . . . . . . . . . . . . . . . . . . .44.59 521.2 Market Landscape . . . . . . . . . . . . . . . . . . . . . . . . . . . . . . . . . . . . . . . . . . 71.29 221.2.1 Competition intensity . . . . . . . . . . . . . . . . . . . . . . . . . . . . . . . . . . . . . . . . .82.52 151.2.2 Ease of doing business . . . . . . . . . . . . . . . . . . . . . . . . . . . . . . . . . . . . . . . .89.30 131.2.3 Cluster development . . . . . . . . . . . . . . . . . . . . . . . . . . . . . . . . . . . . . . . . . . 85.51 71.2.4 R&D expenditure . . . . . . . . . . . . . . . . . . . . . . . . . . . . . . . . . . . . . . . . . . . . . . 31.20 231.2.5 ICT infrastructure. . . . . . . . . . . . . . . . . . . . . . . . . . . . . . . . . . . . . . . . . . . . . .66.79 541.2.6 Urban population . . . . . . . . . . . . . . . . . . . . . . . . . . . . . . . . . . . . . . . . . . . . .72.44 411.3 Business and Labour Landscape . . . . . . . . . . . . . . . . . . . . . . . . . . . . 73.90 13
Labour Market1.3.1 Tertiary-educated unemployment . . . . . . . . . . . . . . . . . . . . . . . . . . . .86.74 411.3.2 Active labour market policies . . . . . . . . . . . . . . . . . . . . . . . . . . . . . . . . . 81.15 111.3.3 Labour-employer cooperation . . . . . . . . . . . . . . . . . . . . . . . . . . . . . . . .74.04 14
Management Practice1.3.4 Professional management . . . . . . . . . . . . . . . . . . . . . . . . . . . . . . . . . . . .83.63 171.3.5 Relationship of pay to productivity . . . . . . . . . . . . . . . . . . . . . . . . . . . . 87.37 4
Technology Adoption1.3.6 Technology utilisation. . . . . . . . . . . . . . . . . . . . . . . . . . . . . . . . . . . . . . . . .84.09 141.3.7 Investment in emerging technologies . . . . . . . . . . . . . . . . . . . . . . . .78.89 121.3.8 Robot density . . . . . . . . . . . . . . . . . . . . . . . . . . . . . . . . . . . . . . . . . . . . . . . . . 15.32 26
2 ATTRACT . . . . . . . . . . . . . . . . . . . . . . . . . . . . . . . . . . . . . . . . . .63.21 282.1 External Openness . . . . . . . . . . . . . . . . . . . . . . . . . . . . . . . . . . . . . . . . . 65.04 19
Attract Business2.1.1 FDI and technology transfer . . . . . . . . . . . . . . . . . . . . . . . . . . . . . . . . . .84.98 92.1.2 Prevalence of foreign ownership . . . . . . . . . . . . . . . . . . . . . . . . . . . . . . 74.96 31
Attract People2.1.3 Migrant stock . . . . . . . . . . . . . . . . . . . . . . . . . . . . . . . . . . . . . . . . . . . . . . . . . 55.93 412.1.4 International students . . . . . . . . . . . . . . . . . . . . . . . . . . . . . . . . . . . . . . . . .29.56 242.1.5 Brain gain . . . . . . . . . . . . . . . . . . . . . . . . . . . . . . . . . . . . . . . . . . . . . . . . . . . . . 79.75 102.2 Internal Openness . . . . . . . . . . . . . . . . . . . . . . . . . . . . . . . . . . . . . . . . . . 61.39 52
Social Inclusion2.2.1 Tolerance of minorities . . . . . . . . . . . . . . . . . . . . . . . . . . . . . . . . . . . . . . . 44.44 682.2.2 Tolerance of immigrants . . . . . . . . . . . . . . . . . . . . . . . . . . . . . . . . . . . . . . . 9.59 1262.2.3 Social mobility . . . . . . . . . . . . . . . . . . . . . . . . . . . . . . . . . . . . . . . . . . . . . . . . 77.27 23
Gender Equality2.2.4 Female graduates . . . . . . . . . . . . . . . . . . . . . . . . . . . . . . . . . . . . . . . . . . . . .75.07 532.2.5 Gender development gap . . . . . . . . . . . . . . . . . . . . . . . . . . . . . . . . . . . . 80.18 532.2.6 Leadership opportunities for women . . . . . . . . . . . . . . . . . . . . . . . . . 81.78 10
Score Rank
3 GROW . . . . . . . . . . . . . . . . . . . . . . . . . . . . . . . . . . . . . . . . . . . . .56.12 233.1 Formal Education . . . . . . . . . . . . . . . . . . . . . . . . . . . . . . . . . . . . . . . . . . . 35.76 42
Enrolment3.1.1 Vocational enrolment . . . . . . . . . . . . . . . . . . . . . . . . . . . . . . . . . . . . . . . . .20.75 553.1.2 Tertiary enrolment . . . . . . . . . . . . . . . . . . . . . . . . . . . . . . . . . . . . . . . . . . . . 32.76 67
Quality3.1.3 Tertiary education expenditure . . . . . . . . . . . . . . . . . . . . . . . . . . . . . . .22.48 573.1.4 Reading, maths, and science . . . . . . . . . . . . . . . . . . . . . . . . . . . . . . . . . . 47.44 423.1.5 University ranking . . . . . . . . . . . . . . . . . . . . . . . . . . . . . . . . . . . . . . . . . . . . .55.38 163.2 Lifelong Learning . . . . . . . . . . . . . . . . . . . . . . . . . . . . . . . . . . . . . . . . . . . 59.94 283.2.1 Quality of management schools . . . . . . . . . . . . . . . . . . . . . . . . . . . . . .75.44 173.2.2 Prevalence of training in firms . . . . . . . . . . . . . . . . . . . . . . . . . . . . . . . . . 19.92 813.2.3 Employee development . . . . . . . . . . . . . . . . . . . . . . . . . . . . . . . . . . . . . .84.46 43.3 Access to Growth Opportunities . . . . . . . . . . . . . . . . . . . . . . . . . . . 72.67 19
Empowerment3.3.1 Delegation of authority . . . . . . . . . . . . . . . . . . . . . . . . . . . . . . . . . . . . . . .82.28 153.3.2 Personal rights . . . . . . . . . . . . . . . . . . . . . . . . . . . . . . . . . . . . . . . . . . . . . . . .69.64 76
Collaboration3.3.3 Use of virtual social networks . . . . . . . . . . . . . . . . . . . . . . . . . . . . . . . . .86.57 243.3.4 Use of virtual professional networks . . . . . . . . . . . . . . . . . . . . . . . . . .22.98 273.3.5 Collaboration within organisations . . . . . . . . . . . . . . . . . . . . . . . . . . . .85.27 113.3.6 Collaboration across organisations . . . . . . . . . . . . . . . . . . . . . . . . . . . .89.30 3
4 RETAIN . . . . . . . . . . . . . . . . . . . . . . . . . . . . . . . . . . . . . . . . . . . 63.26 344.1 Sustainability . . . . . . . . . . . . . . . . . . . . . . . . . . . . . . . . . . . . . . . . . . . . . . . 66.33 284.1.1 Pension system . . . . . . . . . . . . . . . . . . . . . . . . . . . . . . . . . . . . . . . . . . . . . . .43.20 594.1.2 Social protection . . . . . . . . . . . . . . . . . . . . . . . . . . . . . . . . . . . . . . . . . . . . . . 74.93 214.1.3 Brain retention . . . . . . . . . . . . . . . . . . . . . . . . . . . . . . . . . . . . . . . . . . . . . . . .80.86 94.2 Lifestyle . . . . . . . . . . . . . . . . . . . . . . . . . . . . . . . . . . . . . . . . . . . . . . . . . . . . 60.18 534.2.1 Environmental performance . . . . . . . . . . . . . . . . . . . . . . . . . . . . . . . . . .52.99 654.2.2 Personal safety . . . . . . . . . . . . . . . . . . . . . . . . . . . . . . . . . . . . . . . . . . . . . . . .63.93 444.2.3 Physician density . . . . . . . . . . . . . . . . . . . . . . . . . . . . . . . . . . . . . . . . . . . . . .24.28 734.2.4 Sanitation . . . . . . . . . . . . . . . . . . . . . . . . . . . . . . . . . . . . . . . . . . . . . . . . . . . . .99.54 20
5 VOCATIONAL AND TECHNICAL SKILLS . . . . . . . . . . . . 66.21 155.1 Mid-Level Skills . . . . . . . . . . . . . . . . . . . . . . . . . . . . . . . . . . . . . . . . . . . . . 49.39 505.1.1 Workforce with secondary education . . . . . . . . . . . . . . . . . . . . . . . . .58.69 395.1.2 Population with secondary education . . . . . . . . . . . . . . . . . . . . . . . .55.22 365.1.3 Technicians and associate professionals . . . . . . . . . . . . . . . . . . . . . . .44.40 485.1.4 Labour productivity per employee . . . . . . . . . . . . . . . . . . . . . . . . . . . .39.27 425.2 Employability . . . . . . . . . . . . . . . . . . . . . . . . . . . . . . . . . . . . . . . . . . . . . . . 83.02 65.2.1 Ease of finding skilled employees . . . . . . . . . . . . . . . . . . . . . . . . . . . . . 87.27 45.2.2 Relevance of education system to the economy . . . . . . . . . . . . . . 81.11 75.2.3 Skills matching with secondary education . . . . . . . . . . . . . . . . . . . .80.22 65.2.4 Skills matching with tertiary education . . . . . . . . . . . . . . . . . . . . . . . .83.48 12
6 GLOBAL KNOWLEDGE SKILLS . . . . . . . . . . . . . . . . . . . . 42.54 336.1 High-Level Skills . . . . . . . . . . . . . . . . . . . . . . . . . . . . . . . . . . . . . . . . . . . . 40.21 426.1.1 Workforce with tertiary education . . . . . . . . . . . . . . . . . . . . . . . . . . . .35.03 566.1.2 Population with tertiary education . . . . . . . . . . . . . . . . . . . . . . . . . . . . 29.17 586.1.3 Professionals . . . . . . . . . . . . . . . . . . . . . . . . . . . . . . . . . . . . . . . . . . . . . . . . . .32.05 546.1.4 Researchers . . . . . . . . . . . . . . . . . . . . . . . . . . . . . . . . . . . . . . . . . . . . . . . . . . .28.49 356.1.5 Senior officials and managers . . . . . . . . . . . . . . . . . . . . . . . . . . . . . . . . . 27.60 556.1.6 Availability of scientists and engineers . . . . . . . . . . . . . . . . . . . . . . . .88.90 36.2 Talent Impact . . . . . . . . . . . . . . . . . . . . . . . . . . . . . . . . . . . . . . . . . . . . . . . 44.87 276.2.1 Innovation output . . . . . . . . . . . . . . . . . . . . . . . . . . . . . . . . . . . . . . . . . . . .45.53 386.2.2 High-value exports . . . . . . . . . . . . . . . . . . . . . . . . . . . . . . . . . . . . . . . . . . . .83.82 66.2.3 New product entrepreneurial activity . . . . . . . . . . . . . . . . . . . . . . . . . 57.92 296.2.4 New business density . . . . . . . . . . . . . . . . . . . . . . . . . . . . . . . . . . . . . . . . .10.85 456.2.5 Scientific journal articles . . . . . . . . . . . . . . . . . . . . . . . . . . . . . . . . . . . . . .26.23 37
l Malaysia l Income group average

GTCI 2020 Country Profile by Pillar
202 THE GLOBAL TALENT COMPETITIVENESS INDEX 2020
COUNTRY PROFILESCOUNTRY PROFILES
102030405060708090100
Global knowledge skills
Vocational andtechnical skills
Retain
Grow
Attract
Enable
1020330
MALIKey Indicators
Rank (out of 132) . . . . . . . . . . . . . . . . . . . . . . . . . . . . . . . . . . . .125Income group . . . . . . . . . . . . . . . . . . . . . . . . . . . . . . . . . . . . . Low incomeRegional group . . . . . . . . . . . . . . . . . . . . . . . . . . . . Sub-Saharan AfricaPopulation (millions) . . . . . . . . . . . . . . . . . . . . . . . . . . . . . . . . . . . . 19.08
GDP per capita (PPP US$) . . . . . . . . . . . . . . . . . . . . . . . . . . . . . 2,312.57GDP (US$ billions) . . . . . . . . . . . . . . . . . . . . . . . . . . . . . . . . . . . . . . 17.20GTCI score . . . . . . . . . . . . . . . . . . . . . . . . . . . . . . . . . . . . . . . . . . . . . . 24.31GTCI score (income group average) . . . . . . . . . . . . . . . . . . . . . . . . 26.01
Score Rank
1 ENABLE . . . . . . . . . . . . . . . . . . . . . . . . . . . . . . . . . . . . . . . . . . .30.78 1231.1 Regulatory Landscape . . . . . . . . . . . . . . . . . . . . . . . . . . . . . . . . . . . . . . 27.95 1221.1.1 Government effectiveness . . . . . . . . . . . . . . . . . . . . . . . . . . . . . . . . . . . .23.81 1221.1.2 Rule of law . . . . . . . . . . . . . . . . . . . . . . . . . . . . . . . . . . . . . . . . . . . . . . . . . . . .34.51 1111.1.3 Political stability . . . . . . . . . . . . . . . . . . . . . . . . . . . . . . . . . . . . . . . . . . . . . . .23.08 1271.1.4 Regulatory quality. . . . . . . . . . . . . . . . . . . . . . . . . . . . . . . . . . . . . . . . . . . . .34.03 1071.1.5 Corruption . . . . . . . . . . . . . . . . . . . . . . . . . . . . . . . . . . . . . . . . . . . . . . . . . . . .24.32 1001.2 Market Landscape . . . . . . . . . . . . . . . . . . . . . . . . . . . . . . . . . . . . . . . . . . 32.43 1151.2.1 Competition intensity . . . . . . . . . . . . . . . . . . . . . . . . . . . . . . . . . . . . . . . . . 51.67 1131.2.2 Ease of doing business . . . . . . . . . . . . . . . . . . . . . . . . . . . . . . . . . . . . . . . .40.89 1151.2.3 Cluster development . . . . . . . . . . . . . . . . . . . . . . . . . . . . . . . . . . . . . . . . . .43.38 641.2.4 R&D expenditure . . . . . . . . . . . . . . . . . . . . . . . . . . . . . . . . . . . . . . . . . . . . . . . 6.10 801.2.5 ICT infrastructure. . . . . . . . . . . . . . . . . . . . . . . . . . . . . . . . . . . . . . . . . . . . . .18.83 1131.2.6 Urban population . . . . . . . . . . . . . . . . . . . . . . . . . . . . . . . . . . . . . . . . . . . . .33.72 1061.3 Business and Labour Landscape . . . . . . . . . . . . . . . . . . . . . . . . . . . . 31.94 115
Labour Market1.3.1 Tertiary-educated unemployment . . . . . . . . . . . . . . . . . . . . . . . . . . . .38.83 1181.3.2 Active labour market policies . . . . . . . . . . . . . . . . . . . . . . . . . . . . . . . . . 37.05 711.3.3 Labour-employer cooperation . . . . . . . . . . . . . . . . . . . . . . . . . . . . . . . . 17.99 114
Management Practice1.3.4 Professional management . . . . . . . . . . . . . . . . . . . . . . . . . . . . . . . . . . . . 27.25 1191.3.5 Relationship of pay to productivity . . . . . . . . . . . . . . . . . . . . . . . . . . . .35.08 107
Technology Adoption1.3.6 Technology utilisation. . . . . . . . . . . . . . . . . . . . . . . . . . . . . . . . . . . . . . . . .34.26 1101.3.7 Investment in emerging technologies . . . . . . . . . . . . . . . . . . . . . . . . 33.17 881.3.8 Robot density . . . . . . . . . . . . . . . . . . . . . . . . . . . . . . . . . . . . . . . . . . . . . . . . . . .n/a n/a
2 ATTRACT . . . . . . . . . . . . . . . . . . . . . . . . . . . . . . . . . . . . . . . . . .35.37 1192.1 External Openness . . . . . . . . . . . . . . . . . . . . . . . . . . . . . . . . . . . . . . . . . 31.54 107
Attract Business2.1.1 FDI and technology transfer . . . . . . . . . . . . . . . . . . . . . . . . . . . . . . . . . .39.53 1102.1.2 Prevalence of foreign ownership . . . . . . . . . . . . . . . . . . . . . . . . . . . . . . 41.67 110
Attract People2.1.3 Migrant stock . . . . . . . . . . . . . . . . . . . . . . . . . . . . . . . . . . . . . . . . . . . . . . . . .32.55 762.1.4 International students . . . . . . . . . . . . . . . . . . . . . . . . . . . . . . . . . . . . . . . . . . 3.05 842.1.5 Brain gain . . . . . . . . . . . . . . . . . . . . . . . . . . . . . . . . . . . . . . . . . . . . . . . . . . . . .40.90 782.2 Internal Openness . . . . . . . . . . . . . . . . . . . . . . . . . . . . . . . . . . . . . . . . . . 39.20 123
Social Inclusion2.2.1 Tolerance of minorities . . . . . . . . . . . . . . . . . . . . . . . . . . . . . . . . . . . . . . . . 21.11 1062.2.2 Tolerance of immigrants . . . . . . . . . . . . . . . . . . . . . . . . . . . . . . . . . . . . . .80.82 232.2.3 Social mobility . . . . . . . . . . . . . . . . . . . . . . . . . . . . . . . . . . . . . . . . . . . . . . . . 46.19 100
Gender Equality2.2.4 Female graduates . . . . . . . . . . . . . . . . . . . . . . . . . . . . . . . . . . . . . . . . . . . . . . .n/a n/a2.2.5 Gender development gap . . . . . . . . . . . . . . . . . . . . . . . . . . . . . . . . . . . . 21.53 1292.2.6 Leadership opportunities for women . . . . . . . . . . . . . . . . . . . . . . . . .26.37 110
Score Rank
3 GROW . . . . . . . . . . . . . . . . . . . . . . . . . . . . . . . . . . . . . . . . . . . . 24.25 1223.1 Formal Education . . . . . . . . . . . . . . . . . . . . . . . . . . . . . . . . . . . . . . . . . . . . 9.49 116
Enrolment3.1.1 Vocational enrolment . . . . . . . . . . . . . . . . . . . . . . . . . . . . . . . . . . . . . . . . .20.07 583.1.2 Tertiary enrolment . . . . . . . . . . . . . . . . . . . . . . . . . . . . . . . . . . . . . . . . . . . . . 3.75 119
Quality3.1.3 Tertiary education expenditure . . . . . . . . . . . . . . . . . . . . . . . . . . . . . . . 14.12 833.1.4 Reading, maths, and science . . . . . . . . . . . . . . . . . . . . . . . . . . . . . . . . . . . .n/a n/a3.1.5 University ranking . . . . . . . . . . . . . . . . . . . . . . . . . . . . . . . . . . . . . . . . . . . . . . 0.00 753.2 Lifelong Learning . . . . . . . . . . . . . . . . . . . . . . . . . . . . . . . . . . . . . . . . . . . 29.15 1173.2.1 Quality of management schools . . . . . . . . . . . . . . . . . . . . . . . . . . . . . .35.83 1023.2.2 Prevalence of training in firms . . . . . . . . . . . . . . . . . . . . . . . . . . . . . . . . .18.87 843.2.3 Employee development . . . . . . . . . . . . . . . . . . . . . . . . . . . . . . . . . . . . . . 32.75 853.3 Access to Growth Opportunities . . . . . . . . . . . . . . . . . . . . . . . . . . . 34.10 113
Empowerment3.3.1 Delegation of authority . . . . . . . . . . . . . . . . . . . . . . . . . . . . . . . . . . . . . . . 25.14 1173.3.2 Personal rights . . . . . . . . . . . . . . . . . . . . . . . . . . . . . . . . . . . . . . . . . . . . . . . .53.50 97
Collaboration3.3.3 Use of virtual social networks . . . . . . . . . . . . . . . . . . . . . . . . . . . . . . . . .44.21 1193.3.4 Use of virtual professional networks . . . . . . . . . . . . . . . . . . . . . . . . . . . 0.75 1153.3.5 Collaboration within organisations . . . . . . . . . . . . . . . . . . . . . . . . . . . . 46.19 703.3.6 Collaboration across organisations . . . . . . . . . . . . . . . . . . . . . . . . . . . .34.82 79
4 RETAIN . . . . . . . . . . . . . . . . . . . . . . . . . . . . . . . . . . . . . . . . . . . 23.87 1174.1 Sustainability . . . . . . . . . . . . . . . . . . . . . . . . . . . . . . . . . . . . . . . . . . . . . . . 24.15 1124.1.1 Pension system . . . . . . . . . . . . . . . . . . . . . . . . . . . . . . . . . . . . . . . . . . . . . . . . 3.32 1114.1.2 Social protection . . . . . . . . . . . . . . . . . . . . . . . . . . . . . . . . . . . . . . . . . . . . . .38.69 764.1.3 Brain retention . . . . . . . . . . . . . . . . . . . . . . . . . . . . . . . . . . . . . . . . . . . . . . . .30.44 964.2 Lifestyle . . . . . . . . . . . . . . . . . . . . . . . . . . . . . . . . . . . . . . . . . . . . . . . . . . . . 23.59 1184.2.1 Environmental performance . . . . . . . . . . . . . . . . . . . . . . . . . . . . . . . . . . 27.14 1124.2.2 Personal safety . . . . . . . . . . . . . . . . . . . . . . . . . . . . . . . . . . . . . . . . . . . . . . . . 40.13 934.2.3 Physician density . . . . . . . . . . . . . . . . . . . . . . . . . . . . . . . . . . . . . . . . . . . . . . . 1.06 1174.2.4 Sanitation . . . . . . . . . . . . . . . . . . . . . . . . . . . . . . . . . . . . . . . . . . . . . . . . . . . . .26.03 120
5 VOCATIONAL AND TECHNICAL SKILLS . . . . . . . . . . . . 23.32 1245.1 Mid-Level Skills . . . . . . . . . . . . . . . . . . . . . . . . . . . . . . . . . . . . . . . . . . . . . . 3.48 1295.1.1 Workforce with secondary education . . . . . . . . . . . . . . . . . . . . . . . . . . 3.39 1235.1.2 Population with secondary education . . . . . . . . . . . . . . . . . . . . . . . . . 3.76 1095.1.3 Technicians and associate professionals . . . . . . . . . . . . . . . . . . . . . . . . 4.15 1235.1.4 Labour productivity per employee . . . . . . . . . . . . . . . . . . . . . . . . . . . . . 2.63 1045.2 Employability . . . . . . . . . . . . . . . . . . . . . . . . . . . . . . . . . . . . . . . . . . . . . . . 43.15 805.2.1 Ease of finding skilled employees . . . . . . . . . . . . . . . . . . . . . . . . . . . . . 53.15 685.2.2 Relevance of education system to the economy . . . . . . . . . . . . . . 31.71 975.2.3 Skills matching with secondary education . . . . . . . . . . . . . . . . . . . 44.00 615.2.4 Skills matching with tertiary education . . . . . . . . . . . . . . . . . . . . . . . . 43.74 96
6 GLOBAL KNOWLEDGE SKILLS . . . . . . . . . . . . . . . . . . . . . .8.29 1256.1 High-Level Skills . . . . . . . . . . . . . . . . . . . . . . . . . . . . . . . . . . . . . . . . . . . . . 9.28 1246.1.1 Workforce with tertiary education . . . . . . . . . . . . . . . . . . . . . . . . . . . . . 2.11 1216.1.2 Population with tertiary education . . . . . . . . . . . . . . . . . . . . . . . . . . . . . 1.59 1046.1.3 Professionals . . . . . . . . . . . . . . . . . . . . . . . . . . . . . . . . . . . . . . . . . . . . . . . . . . . 7.33 1156.1.4 Researchers . . . . . . . . . . . . . . . . . . . . . . . . . . . . . . . . . . . . . . . . . . . . . . . . . . . . 0.27 1016.1.5 Senior officials and managers . . . . . . . . . . . . . . . . . . . . . . . . . . . . . . . . . . 5.16 1156.1.6 Availability of scientists and engineers . . . . . . . . . . . . . . . . . . . . . . . . 39.21 936.2 Talent Impact . . . . . . . . . . . . . . . . . . . . . . . . . . . . . . . . . . . . . . . . . . . . . . . . 7.30 1186.2.1 Innovation output . . . . . . . . . . . . . . . . . . . . . . . . . . . . . . . . . . . . . . . . . . . . 19.09 976.2.2 High-value exports . . . . . . . . . . . . . . . . . . . . . . . . . . . . . . . . . . . . . . . . . . . . . 2.65 1116.2.3 New product entrepreneurial activity . . . . . . . . . . . . . . . . . . . . . . . . . . .n/a n/a6.2.4 New business density . . . . . . . . . . . . . . . . . . . . . . . . . . . . . . . . . . . . . . . . . . .n/a n/a6.2.5 Scientific journal articles . . . . . . . . . . . . . . . . . . . . . . . . . . . . . . . . . . . . . . . 0.15 122
l Mali l Income group average

GTCI 2020 Country Profile by Pillar
THE GLOBAL TALENT COMPETITIVENESS INDEX 2020 203
COUNTRY PROFILESCOUNTRY PROFILES
102030405060708090100
Global knowledge skills
Vocational andtechnical skills
Retain
Grow
Attract
Enable
102030405060607
MALTAKey Indicators
Rank (out of 132) . . . . . . . . . . . . . . . . . . . . . . . . . . . . . . . . . . . . . . . 23Income group . . . . . . . . . . . . . . . . . . . . . . . . . . . . . . . . . . . . High incomeRegional group . . . . . . . . . . . . . . . . . . . . . . . . . . . . . . . . . . . . . . . . .EuropePopulation (millions) . . . . . . . . . . . . . . . . . . . . . . . . . . . . . . . . . . . . . 0.48
GDP per capita (PPP US$) . . . . . . . . . . . . . . . . . . . . . . . . . . . .41,548.51GDP (US$ billions) . . . . . . . . . . . . . . . . . . . . . . . . . . . . . . . . . . . . . . 14.54GTCI score . . . . . . . . . . . . . . . . . . . . . . . . . . . . . . . . . . . . . . . . . . . . . . 62.02GTCI score (income group average) . . . . . . . . . . . . . . . . . . . . . . . . 61.46
Score Rank
1 ENABLE . . . . . . . . . . . . . . . . . . . . . . . . . . . . . . . . . . . . . . . . . . 68.39 271.1 Regulatory Landscape . . . . . . . . . . . . . . . . . . . . . . . . . . . . . . . . . . . . . . 75.33 241.1.1 Government effectiveness . . . . . . . . . . . . . . . . . . . . . . . . . . . . . . . . . . . .70.89 301.1.2 Rule of law . . . . . . . . . . . . . . . . . . . . . . . . . . . . . . . . . . . . . . . . . . . . . . . . . . . . 79.37 231.1.3 Political stability . . . . . . . . . . . . . . . . . . . . . . . . . . . . . . . . . . . . . . . . . . . . . . .92.79 51.1.4 Regulatory quality. . . . . . . . . . . . . . . . . . . . . . . . . . . . . . . . . . . . . . . . . . . . .79.56 211.1.5 Corruption . . . . . . . . . . . . . . . . . . . . . . . . . . . . . . . . . . . . . . . . . . . . . . . . . . . .54.05 431.2 Market Landscape . . . . . . . . . . . . . . . . . . . . . . . . . . . . . . . . . . . . . . . . . . 67.59 261.2.1 Competition intensity . . . . . . . . . . . . . . . . . . . . . . . . . . . . . . . . . . . . . . . . .88.60 61.2.2 Ease of doing business . . . . . . . . . . . . . . . . . . . . . . . . . . . . . . . . . . . . . . . .62.20 781.2.3 Cluster development . . . . . . . . . . . . . . . . . . . . . . . . . . . . . . . . . . . . . . . . . . 55.81 401.2.4 R&D expenditure . . . . . . . . . . . . . . . . . . . . . . . . . . . . . . . . . . . . . . . . . . . . . . 11.72 561.2.5 ICT infrastructure. . . . . . . . . . . . . . . . . . . . . . . . . . . . . . . . . . . . . . . . . . . . . .93.38 41.2.6 Urban population . . . . . . . . . . . . . . . . . . . . . . . . . . . . . . . . . . . . . . . . . . . . .93.80 61.3 Business and Labour Landscape . . . . . . . . . . . . . . . . . . . . . . . . . . . . 62.25 29
Labour Market1.3.1 Tertiary-educated unemployment . . . . . . . . . . . . . . . . . . . . . . . . . . . .93.73 91.3.2 Active labour market policies . . . . . . . . . . . . . . . . . . . . . . . . . . . . . . . . .76.80 181.3.3 Labour-employer cooperation . . . . . . . . . . . . . . . . . . . . . . . . . . . . . . . .64.22 24
Management Practice1.3.4 Professional management . . . . . . . . . . . . . . . . . . . . . . . . . . . . . . . . . . . .62.78 371.3.5 Relationship of pay to productivity . . . . . . . . . . . . . . . . . . . . . . . . . . . .62.49 41
Technology Adoption1.3.6 Technology utilisation. . . . . . . . . . . . . . . . . . . . . . . . . . . . . . . . . . . . . . . . .72.70 301.3.7 Investment in emerging technologies . . . . . . . . . . . . . . . . . . . . . . . .53.67 371.3.8 Robot density . . . . . . . . . . . . . . . . . . . . . . . . . . . . . . . . . . . . . . . . . . . . . . . . . 11.58 33
2 ATTRACT . . . . . . . . . . . . . . . . . . . . . . . . . . . . . . . . . . . . . . . . . 68.53 202.1 External Openness . . . . . . . . . . . . . . . . . . . . . . . . . . . . . . . . . . . . . . . . . 64.75 20
Attract Business2.1.1 FDI and technology transfer . . . . . . . . . . . . . . . . . . . . . . . . . . . . . . . . . .85.75 72.1.2 Prevalence of foreign ownership . . . . . . . . . . . . . . . . . . . . . . . . . . . . . .73.03 35
Attract People2.1.3 Migrant stock . . . . . . . . . . . . . . . . . . . . . . . . . . . . . . . . . . . . . . . . . . . . . . . . .56.24 402.1.4 International students . . . . . . . . . . . . . . . . . . . . . . . . . . . . . . . . . . . . . . . . .30.90 212.1.5 Brain gain . . . . . . . . . . . . . . . . . . . . . . . . . . . . . . . . . . . . . . . . . . . . . . . . . . . . . 77.83 122.2 Internal Openness . . . . . . . . . . . . . . . . . . . . . . . . . . . . . . . . . . . . . . . . . . 72.30 21
Social Inclusion2.2.1 Tolerance of minorities . . . . . . . . . . . . . . . . . . . . . . . . . . . . . . . . . . . . . . . .74.44 202.2.2 Tolerance of immigrants . . . . . . . . . . . . . . . . . . . . . . . . . . . . . . . . . . . . . .71.23 382.2.3 Social mobility . . . . . . . . . . . . . . . . . . . . . . . . . . . . . . . . . . . . . . . . . . . . . . . . 77.60 21
Gender Equality2.2.4 Female graduates . . . . . . . . . . . . . . . . . . . . . . . . . . . . . . . . . . . . . . . . . . . . .78.43 422.2.5 Gender development gap . . . . . . . . . . . . . . . . . . . . . . . . . . . . . . . . . . . .74.83 772.2.6 Leadership opportunities for women . . . . . . . . . . . . . . . . . . . . . . . . . 57.27 46
Score Rank
3 GROW . . . . . . . . . . . . . . . . . . . . . . . . . . . . . . . . . . . . . . . . . . . . 48.99 373.1 Formal Education . . . . . . . . . . . . . . . . . . . . . . . . . . . . . . . . . . . . . . . . . . . 28.36 61
Enrolment3.1.1 Vocational enrolment . . . . . . . . . . . . . . . . . . . . . . . . . . . . . . . . . . . . . . . . . 13.83 743.1.2 Tertiary enrolment . . . . . . . . . . . . . . . . . . . . . . . . . . . . . . . . . . . . . . . . . . . .38.26 57
Quality3.1.3 Tertiary education expenditure . . . . . . . . . . . . . . . . . . . . . . . . . . . . . . . 31.22 313.1.4 Reading, maths, and science . . . . . . . . . . . . . . . . . . . . . . . . . . . . . . . . . .58.49 373.1.5 University ranking . . . . . . . . . . . . . . . . . . . . . . . . . . . . . . . . . . . . . . . . . . . . . . 0.00 753.2 Lifelong Learning . . . . . . . . . . . . . . . . . . . . . . . . . . . . . . . . . . . . . . . . . . . 55.05 363.2.1 Quality of management schools . . . . . . . . . . . . . . . . . . . . . . . . . . . . . .58.75 433.2.2 Prevalence of training in firms . . . . . . . . . . . . . . . . . . . . . . . . . . . . . . . . . . .n/a n/a3.2.3 Employee development . . . . . . . . . . . . . . . . . . . . . . . . . . . . . . . . . . . . . . 51.36 413.3 Access to Growth Opportunities . . . . . . . . . . . . . . . . . . . . . . . . . . . 63.57 25
Empowerment3.3.1 Delegation of authority . . . . . . . . . . . . . . . . . . . . . . . . . . . . . . . . . . . . . . . 57.84 373.3.2 Personal rights . . . . . . . . . . . . . . . . . . . . . . . . . . . . . . . . . . . . . . . . . . . . . . . .88.09 40
Collaboration3.3.3 Use of virtual social networks . . . . . . . . . . . . . . . . . . . . . . . . . . . . . . . . . 92.11 103.3.4 Use of virtual professional networks . . . . . . . . . . . . . . . . . . . . . . . . . .48.32 113.3.5 Collaboration within organisations . . . . . . . . . . . . . . . . . . . . . . . . . . . . 55.18 423.3.6 Collaboration across organisations . . . . . . . . . . . . . . . . . . . . . . . . . . . .39.88 64
4 RETAIN . . . . . . . . . . . . . . . . . . . . . . . . . . . . . . . . . . . . . . . . . . . .79.34 144.1 Sustainability . . . . . . . . . . . . . . . . . . . . . . . . . . . . . . . . . . . . . . . . . . . . . . . 76.66 204.1.1 Pension system . . . . . . . . . . . . . . . . . . . . . . . . . . . . . . . . . . . . . . . . . . . . . . .94.65 84.1.2 Social protection . . . . . . . . . . . . . . . . . . . . . . . . . . . . . . . . . . . . . . . . . . . . . . 71.61 244.1.3 Brain retention . . . . . . . . . . . . . . . . . . . . . . . . . . . . . . . . . . . . . . . . . . . . . . . .63.72 304.2 Lifestyle . . . . . . . . . . . . . . . . . . . . . . . . . . . . . . . . . . . . . . . . . . . . . . . . . . . . 82.03 104.2.1 Environmental performance . . . . . . . . . . . . . . . . . . . . . . . . . . . . . . . . . . 89.13 44.2.2 Personal safety . . . . . . . . . . . . . . . . . . . . . . . . . . . . . . . . . . . . . . . . . . . . . . . .76.66 254.2.3 Physician density . . . . . . . . . . . . . . . . . . . . . . . . . . . . . . . . . . . . . . . . . . . . . .62.36 134.2.4 Sanitation . . . . . . . . . . . . . . . . . . . . . . . . . . . . . . . . . . . . . . . . . . . . . . . . . . . . .99.96 13
5 VOCATIONAL AND TECHNICAL SKILLS . . . . . . . . . . . . .55.45 375.1 Mid-Level Skills . . . . . . . . . . . . . . . . . . . . . . . . . . . . . . . . . . . . . . . . . . . . . 47.76 525.1.1 Workforce with secondary education . . . . . . . . . . . . . . . . . . . . . . . . .43.59 705.1.2 Population with secondary education . . . . . . . . . . . . . . . . . . . . . . . . 29.13 775.1.3 Technicians and associate professionals . . . . . . . . . . . . . . . . . . . . . . .65.86 195.1.4 Labour productivity per employee . . . . . . . . . . . . . . . . . . . . . . . . . . . .52.44 265.2 Employability . . . . . . . . . . . . . . . . . . . . . . . . . . . . . . . . . . . . . . . . . . . . . . . 63.14 345.2.1 Ease of finding skilled employees . . . . . . . . . . . . . . . . . . . . . . . . . . . . .44.60 965.2.2 Relevance of education system to the economy . . . . . . . . . . . . . . 67.19 225.2.3 Skills matching with secondary education . . . . . . . . . . . . . . . . . . . 66.64 225.2.4 Skills matching with tertiary education . . . . . . . . . . . . . . . . . . . . . . . . 74.13 27
6 GLOBAL KNOWLEDGE SKILLS . . . . . . . . . . . . . . . . . . . . .51.39 216.1 High-Level Skills . . . . . . . . . . . . . . . . . . . . . . . . . . . . . . . . . . . . . . . . . . . . 42.10 406.1.1 Workforce with tertiary education . . . . . . . . . . . . . . . . . . . . . . . . . . . .44.90 376.1.2 Population with tertiary education . . . . . . . . . . . . . . . . . . . . . . . . . . . .25.79 626.1.3 Professionals . . . . . . . . . . . . . . . . . . . . . . . . . . . . . . . . . . . . . . . . . . . . . . . . . . 47.35 306.1.4 Researchers . . . . . . . . . . . . . . . . . . . . . . . . . . . . . . . . . . . . . . . . . . . . . . . . . . .25.05 396.1.5 Senior officials and managers . . . . . . . . . . . . . . . . . . . . . . . . . . . . . . . . .63.83 126.1.6 Availability of scientists and engineers . . . . . . . . . . . . . . . . . . . . . . . .45.66 726.2 Talent Impact . . . . . . . . . . . . . . . . . . . . . . . . . . . . . . . . . . . . . . . . . . . . . . . 60.69 96.2.1 Innovation output . . . . . . . . . . . . . . . . . . . . . . . . . . . . . . . . . . . . . . . . . . . .64.80 196.2.2 High-value exports . . . . . . . . . . . . . . . . . . . . . . . . . . . . . . . . . . . . . . . . . . . .63.94 116.2.3 New product entrepreneurial activity . . . . . . . . . . . . . . . . . . . . . . . . . . .n/a n/a6.2.4 New business density . . . . . . . . . . . . . . . . . . . . . . . . . . . . . . . . . . . . . . . . . 86.17 36.2.5 Scientific journal articles . . . . . . . . . . . . . . . . . . . . . . . . . . . . . . . . . . . . . . 27.86 36
l Malta l Income group average
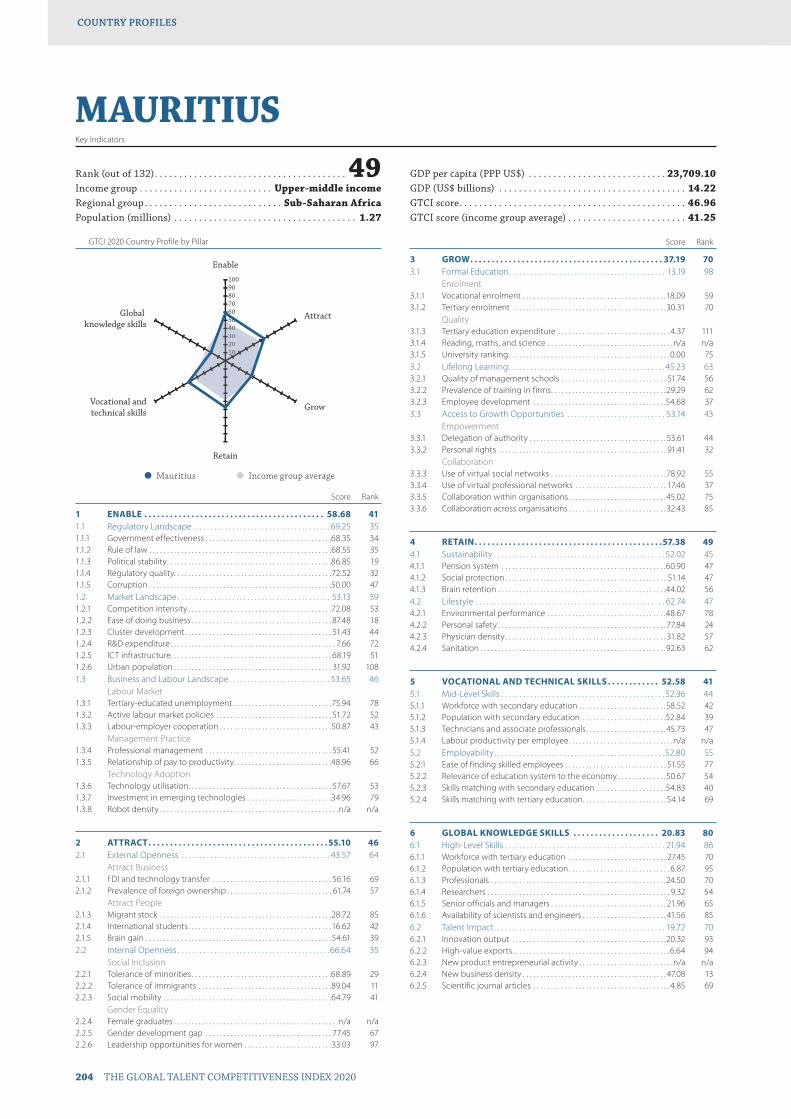
GTCI 2020 Country Profile by Pillar
204 THE GLOBAL TALENT COMPETITIVENESS INDEX 2020
COUNTRY PROFILESCOUNTRY PROFILES
102030405060708090100
Global knowledge skills
Vocational andtechnical skills
Retain
Grow
Attract
Enable
1020304040
MAURITIUSKey Indicators
Rank (out of 132) . . . . . . . . . . . . . . . . . . . . . . . . . . . . . . . . . . . . . . . 49Income group . . . . . . . . . . . . . . . . . . . . . . . . . . . Upper-middle incomeRegional group . . . . . . . . . . . . . . . . . . . . . . . . . . . . Sub-Saharan AfricaPopulation (millions) . . . . . . . . . . . . . . . . . . . . . . . . . . . . . . . . . . . . . 1.27
GDP per capita (PPP US$) . . . . . . . . . . . . . . . . . . . . . . . . . . . . 23,709.10GDP (US$ billions) . . . . . . . . . . . . . . . . . . . . . . . . . . . . . . . . . . . . . . 14.22GTCI score . . . . . . . . . . . . . . . . . . . . . . . . . . . . . . . . . . . . . . . . . . . . . . 46.96GTCI score (income group average) . . . . . . . . . . . . . . . . . . . . . . . . 41.25
Score Rank
1 ENABLE . . . . . . . . . . . . . . . . . . . . . . . . . . . . . . . . . . . . . . . . . . 58.68 411.1 Regulatory Landscape . . . . . . . . . . . . . . . . . . . . . . . . . . . . . . . . . . . . . . 69.25 351.1.1 Government effectiveness . . . . . . . . . . . . . . . . . . . . . . . . . . . . . . . . . . . .68.35 341.1.2 Rule of law . . . . . . . . . . . . . . . . . . . . . . . . . . . . . . . . . . . . . . . . . . . . . . . . . . . .68.55 351.1.3 Political stability . . . . . . . . . . . . . . . . . . . . . . . . . . . . . . . . . . . . . . . . . . . . . . .86.85 191.1.4 Regulatory quality. . . . . . . . . . . . . . . . . . . . . . . . . . . . . . . . . . . . . . . . . . . . .72.52 321.1.5 Corruption . . . . . . . . . . . . . . . . . . . . . . . . . . . . . . . . . . . . . . . . . . . . . . . . . . . .50.00 471.2 Market Landscape . . . . . . . . . . . . . . . . . . . . . . . . . . . . . . . . . . . . . . . . . . 53.13 591.2.1 Competition intensity . . . . . . . . . . . . . . . . . . . . . . . . . . . . . . . . . . . . . . . . .72.08 531.2.2 Ease of doing business . . . . . . . . . . . . . . . . . . . . . . . . . . . . . . . . . . . . . . . . 87.48 181.2.3 Cluster development . . . . . . . . . . . . . . . . . . . . . . . . . . . . . . . . . . . . . . . . . . 51.43 441.2.4 R&D expenditure . . . . . . . . . . . . . . . . . . . . . . . . . . . . . . . . . . . . . . . . . . . . . . . 7.66 721.2.5 ICT infrastructure. . . . . . . . . . . . . . . . . . . . . . . . . . . . . . . . . . . . . . . . . . . . . . 68.19 511.2.6 Urban population . . . . . . . . . . . . . . . . . . . . . . . . . . . . . . . . . . . . . . . . . . . . . 31.92 1081.3 Business and Labour Landscape . . . . . . . . . . . . . . . . . . . . . . . . . . . . 53.65 46
Labour Market1.3.1 Tertiary-educated unemployment . . . . . . . . . . . . . . . . . . . . . . . . . . . .75.94 781.3.2 Active labour market policies . . . . . . . . . . . . . . . . . . . . . . . . . . . . . . . . . 51.72 521.3.3 Labour-employer cooperation . . . . . . . . . . . . . . . . . . . . . . . . . . . . . . . .50.87 43
Management Practice1.3.4 Professional management . . . . . . . . . . . . . . . . . . . . . . . . . . . . . . . . . . . . 55.41 521.3.5 Relationship of pay to productivity . . . . . . . . . . . . . . . . . . . . . . . . . . . .48.96 66
Technology Adoption1.3.6 Technology utilisation. . . . . . . . . . . . . . . . . . . . . . . . . . . . . . . . . . . . . . . . . 57.67 531.3.7 Investment in emerging technologies . . . . . . . . . . . . . . . . . . . . . . . .34.96 791.3.8 Robot density . . . . . . . . . . . . . . . . . . . . . . . . . . . . . . . . . . . . . . . . . . . . . . . . . . .n/a n/a
2 ATTRACT . . . . . . . . . . . . . . . . . . . . . . . . . . . . . . . . . . . . . . . . . .55.10 462.1 External Openness . . . . . . . . . . . . . . . . . . . . . . . . . . . . . . . . . . . . . . . . . 43.57 64
Attract Business2.1.1 FDI and technology transfer . . . . . . . . . . . . . . . . . . . . . . . . . . . . . . . . . . 56.16 692.1.2 Prevalence of foreign ownership . . . . . . . . . . . . . . . . . . . . . . . . . . . . . . 61.74 57
Attract People2.1.3 Migrant stock . . . . . . . . . . . . . . . . . . . . . . . . . . . . . . . . . . . . . . . . . . . . . . . . .28.72 852.1.4 International students . . . . . . . . . . . . . . . . . . . . . . . . . . . . . . . . . . . . . . . . .16.62 422.1.5 Brain gain . . . . . . . . . . . . . . . . . . . . . . . . . . . . . . . . . . . . . . . . . . . . . . . . . . . . .54.61 392.2 Internal Openness . . . . . . . . . . . . . . . . . . . . . . . . . . . . . . . . . . . . . . . . . .66.64 35
Social Inclusion2.2.1 Tolerance of minorities . . . . . . . . . . . . . . . . . . . . . . . . . . . . . . . . . . . . . . . .68.89 292.2.2 Tolerance of immigrants . . . . . . . . . . . . . . . . . . . . . . . . . . . . . . . . . . . . . .89.04 112.2.3 Social mobility . . . . . . . . . . . . . . . . . . . . . . . . . . . . . . . . . . . . . . . . . . . . . . . .64.79 41
Gender Equality2.2.4 Female graduates . . . . . . . . . . . . . . . . . . . . . . . . . . . . . . . . . . . . . . . . . . . . . . .n/a n/a2.2.5 Gender development gap . . . . . . . . . . . . . . . . . . . . . . . . . . . . . . . . . . . . 77.45 672.2.6 Leadership opportunities for women . . . . . . . . . . . . . . . . . . . . . . . . .33.03 97
Score Rank
3 GROW . . . . . . . . . . . . . . . . . . . . . . . . . . . . . . . . . . . . . . . . . . . . . 37.19 703.1 Formal Education . . . . . . . . . . . . . . . . . . . . . . . . . . . . . . . . . . . . . . . . . . . 13.19 98
Enrolment3.1.1 Vocational enrolment . . . . . . . . . . . . . . . . . . . . . . . . . . . . . . . . . . . . . . . . .18.09 593.1.2 Tertiary enrolment . . . . . . . . . . . . . . . . . . . . . . . . . . . . . . . . . . . . . . . . . . . .30.31 70
Quality3.1.3 Tertiary education expenditure . . . . . . . . . . . . . . . . . . . . . . . . . . . . . . . . 4.37 1113.1.4 Reading, maths, and science . . . . . . . . . . . . . . . . . . . . . . . . . . . . . . . . . . . .n/a n/a3.1.5 University ranking . . . . . . . . . . . . . . . . . . . . . . . . . . . . . . . . . . . . . . . . . . . . . . 0.00 753.2 Lifelong Learning . . . . . . . . . . . . . . . . . . . . . . . . . . . . . . . . . . . . . . . . . . . 45.23 633.2.1 Quality of management schools . . . . . . . . . . . . . . . . . . . . . . . . . . . . . . 51.74 563.2.2 Prevalence of training in firms . . . . . . . . . . . . . . . . . . . . . . . . . . . . . . . . .29.29 623.2.3 Employee development . . . . . . . . . . . . . . . . . . . . . . . . . . . . . . . . . . . . . .54.68 373.3 Access to Growth Opportunities . . . . . . . . . . . . . . . . . . . . . . . . . . . 53.14 43
Empowerment3.3.1 Delegation of authority . . . . . . . . . . . . . . . . . . . . . . . . . . . . . . . . . . . . . . . 53.61 443.3.2 Personal rights . . . . . . . . . . . . . . . . . . . . . . . . . . . . . . . . . . . . . . . . . . . . . . . . 91.41 32
Collaboration3.3.3 Use of virtual social networks . . . . . . . . . . . . . . . . . . . . . . . . . . . . . . . . .78.92 553.3.4 Use of virtual professional networks . . . . . . . . . . . . . . . . . . . . . . . . . . 17.46 373.3.5 Collaboration within organisations . . . . . . . . . . . . . . . . . . . . . . . . . . . .45.02 753.3.6 Collaboration across organisations . . . . . . . . . . . . . . . . . . . . . . . . . . . . 32.43 85
4 RETAIN . . . . . . . . . . . . . . . . . . . . . . . . . . . . . . . . . . . . . . . . . . . .57.38 494.1 Sustainability . . . . . . . . . . . . . . . . . . . . . . . . . . . . . . . . . . . . . . . . . . . . . . . 52.02 454.1.1 Pension system . . . . . . . . . . . . . . . . . . . . . . . . . . . . . . . . . . . . . . . . . . . . . . .60.90 474.1.2 Social protection . . . . . . . . . . . . . . . . . . . . . . . . . . . . . . . . . . . . . . . . . . . . . . 51.14 474.1.3 Brain retention . . . . . . . . . . . . . . . . . . . . . . . . . . . . . . . . . . . . . . . . . . . . . . . .44.02 564.2 Lifestyle . . . . . . . . . . . . . . . . . . . . . . . . . . . . . . . . . . . . . . . . . . . . . . . . . . . . 62.74 474.2.1 Environmental performance . . . . . . . . . . . . . . . . . . . . . . . . . . . . . . . . . .48.67 784.2.2 Personal safety . . . . . . . . . . . . . . . . . . . . . . . . . . . . . . . . . . . . . . . . . . . . . . . .77.84 244.2.3 Physician density . . . . . . . . . . . . . . . . . . . . . . . . . . . . . . . . . . . . . . . . . . . . . . 31.82 574.2.4 Sanitation . . . . . . . . . . . . . . . . . . . . . . . . . . . . . . . . . . . . . . . . . . . . . . . . . . . . .92.63 62
5 VOCATIONAL AND TECHNICAL SKILLS . . . . . . . . . . . . 52.58 415.1 Mid-Level Skills . . . . . . . . . . . . . . . . . . . . . . . . . . . . . . . . . . . . . . . . . . . . . 52.36 445.1.1 Workforce with secondary education . . . . . . . . . . . . . . . . . . . . . . . . .58.52 425.1.2 Population with secondary education . . . . . . . . . . . . . . . . . . . . . . . .52.84 395.1.3 Technicians and associate professionals . . . . . . . . . . . . . . . . . . . . . . .45.73 475.1.4 Labour productivity per employee . . . . . . . . . . . . . . . . . . . . . . . . . . . . . .n/a n/a5.2 Employability . . . . . . . . . . . . . . . . . . . . . . . . . . . . . . . . . . . . . . . . . . . . . . . 52.80 555.2.1 Ease of finding skilled employees . . . . . . . . . . . . . . . . . . . . . . . . . . . . . 51.55 775.2.2 Relevance of education system to the economy . . . . . . . . . . . . . .50.67 545.2.3 Skills matching with secondary education . . . . . . . . . . . . . . . . . . . .54.83 405.2.4 Skills matching with tertiary education . . . . . . . . . . . . . . . . . . . . . . . . 54.14 69
6 GLOBAL KNOWLEDGE SKILLS . . . . . . . . . . . . . . . . . . . . 20.83 806.1 High-Level Skills . . . . . . . . . . . . . . . . . . . . . . . . . . . . . . . . . . . . . . . . . . . . 21.94 866.1.1 Workforce with tertiary education . . . . . . . . . . . . . . . . . . . . . . . . . . . . 27.45 706.1.2 Population with tertiary education . . . . . . . . . . . . . . . . . . . . . . . . . . . . . 6.87 956.1.3 Professionals . . . . . . . . . . . . . . . . . . . . . . . . . . . . . . . . . . . . . . . . . . . . . . . . . .24.50 706.1.4 Researchers . . . . . . . . . . . . . . . . . . . . . . . . . . . . . . . . . . . . . . . . . . . . . . . . . . . . 9.32 546.1.5 Senior officials and managers . . . . . . . . . . . . . . . . . . . . . . . . . . . . . . . . . 21.96 656.1.6 Availability of scientists and engineers . . . . . . . . . . . . . . . . . . . . . . . . 41.56 856.2 Talent Impact . . . . . . . . . . . . . . . . . . . . . . . . . . . . . . . . . . . . . . . . . . . . . . . 19.72 706.2.1 Innovation output . . . . . . . . . . . . . . . . . . . . . . . . . . . . . . . . . . . . . . . . . . . .20.32 936.2.2 High-value exports . . . . . . . . . . . . . . . . . . . . . . . . . . . . . . . . . . . . . . . . . . . . .6.64 946.2.3 New product entrepreneurial activity . . . . . . . . . . . . . . . . . . . . . . . . . . .n/a n/a6.2.4 New business density . . . . . . . . . . . . . . . . . . . . . . . . . . . . . . . . . . . . . . . . . 47.08 136.2.5 Scientific journal articles . . . . . . . . . . . . . . . . . . . . . . . . . . . . . . . . . . . . . . . 4.85 69
l Mauritius l Income group average
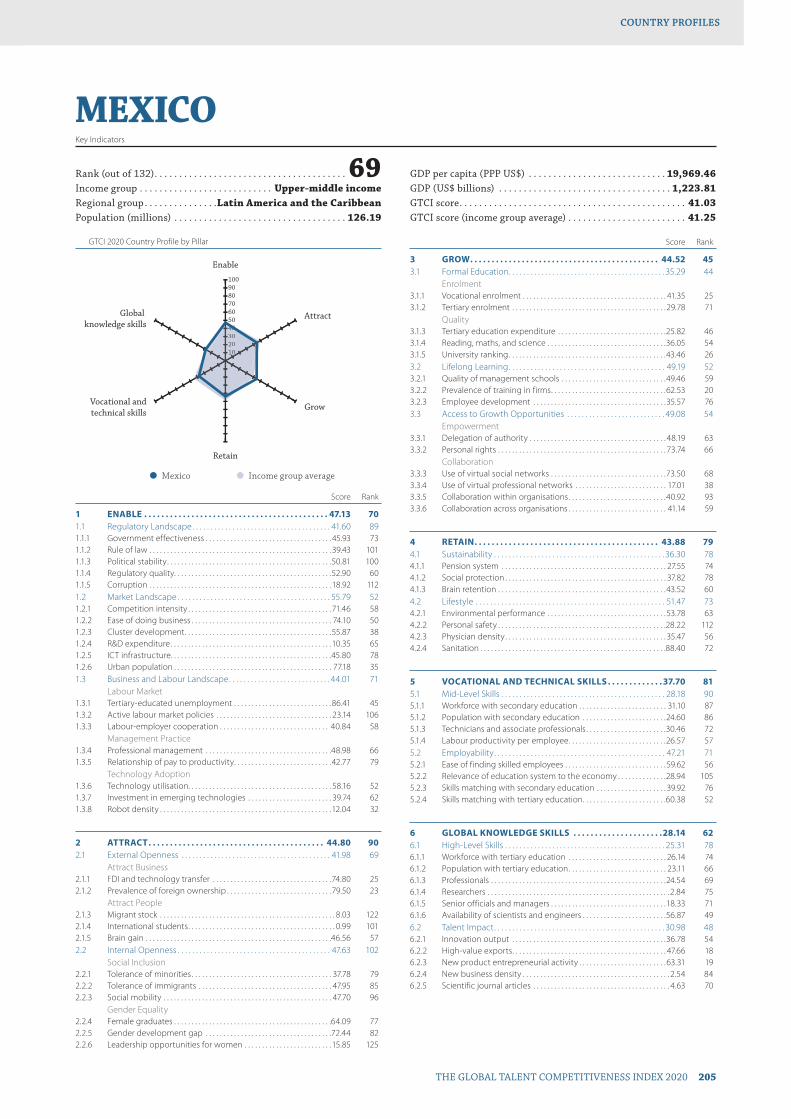
GTCI 2020 Country Profile by Pillar
THE GLOBAL TALENT COMPETITIVENESS INDEX 2020 205
COUNTRY PROFILESCOUNTRY PROFILES
102030405060708090100
Global knowledge skills
Vocational andtechnical skills
Retain
Grow
Attract
Enable
1020304040
MEXICOKey Indicators
Rank (out of 132) . . . . . . . . . . . . . . . . . . . . . . . . . . . . . . . . . . . . . . . 69Income group . . . . . . . . . . . . . . . . . . . . . . . . . . . Upper-middle incomeRegional group . . . . . . . . . . . . . . .Latin America and the CaribbeanPopulation (millions) . . . . . . . . . . . . . . . . . . . . . . . . . . . . . . . . . . . 126.19
GDP per capita (PPP US$) . . . . . . . . . . . . . . . . . . . . . . . . . . . . 19,969.46GDP (US$ billions) . . . . . . . . . . . . . . . . . . . . . . . . . . . . . . . . . . . 1,223.81GTCI score . . . . . . . . . . . . . . . . . . . . . . . . . . . . . . . . . . . . . . . . . . . . . . 41.03GTCI score (income group average) . . . . . . . . . . . . . . . . . . . . . . . . 41.25
Score Rank
1 ENABLE . . . . . . . . . . . . . . . . . . . . . . . . . . . . . . . . . . . . . . . . . . . 47.13 701.1 Regulatory Landscape . . . . . . . . . . . . . . . . . . . . . . . . . . . . . . . . . . . . . . 41.60 891.1.1 Government effectiveness . . . . . . . . . . . . . . . . . . . . . . . . . . . . . . . . . . . . 45.93 731.1.2 Rule of law . . . . . . . . . . . . . . . . . . . . . . . . . . . . . . . . . . . . . . . . . . . . . . . . . . . . 39.43 1011.1.3 Political stability . . . . . . . . . . . . . . . . . . . . . . . . . . . . . . . . . . . . . . . . . . . . . . .50.81 1001.1.4 Regulatory quality. . . . . . . . . . . . . . . . . . . . . . . . . . . . . . . . . . . . . . . . . . . . .52.90 601.1.5 Corruption . . . . . . . . . . . . . . . . . . . . . . . . . . . . . . . . . . . . . . . . . . . . . . . . . . . . 18.92 1121.2 Market Landscape . . . . . . . . . . . . . . . . . . . . . . . . . . . . . . . . . . . . . . . . . . 55.79 521.2.1 Competition intensity . . . . . . . . . . . . . . . . . . . . . . . . . . . . . . . . . . . . . . . . .71.46 581.2.2 Ease of doing business . . . . . . . . . . . . . . . . . . . . . . . . . . . . . . . . . . . . . . . . 74.10 501.2.3 Cluster development . . . . . . . . . . . . . . . . . . . . . . . . . . . . . . . . . . . . . . . . . .55.87 381.2.4 R&D expenditure . . . . . . . . . . . . . . . . . . . . . . . . . . . . . . . . . . . . . . . . . . . . . .10.35 651.2.5 ICT infrastructure. . . . . . . . . . . . . . . . . . . . . . . . . . . . . . . . . . . . . . . . . . . . . .45.80 781.2.6 Urban population . . . . . . . . . . . . . . . . . . . . . . . . . . . . . . . . . . . . . . . . . . . . . 77.18 351.3 Business and Labour Landscape . . . . . . . . . . . . . . . . . . . . . . . . . . . . 44.01 71
Labour Market1.3.1 Tertiary-educated unemployment . . . . . . . . . . . . . . . . . . . . . . . . . . . .86.41 451.3.2 Active labour market policies . . . . . . . . . . . . . . . . . . . . . . . . . . . . . . . . . 23.14 1061.3.3 Labour-employer cooperation . . . . . . . . . . . . . . . . . . . . . . . . . . . . . . . 40.84 58
Management Practice1.3.4 Professional management . . . . . . . . . . . . . . . . . . . . . . . . . . . . . . . . . . . .48.98 661.3.5 Relationship of pay to productivity . . . . . . . . . . . . . . . . . . . . . . . . . . . .42.77 79
Technology Adoption1.3.6 Technology utilisation. . . . . . . . . . . . . . . . . . . . . . . . . . . . . . . . . . . . . . . . . 58.16 521.3.7 Investment in emerging technologies . . . . . . . . . . . . . . . . . . . . . . . . 39.74 621.3.8 Robot density . . . . . . . . . . . . . . . . . . . . . . . . . . . . . . . . . . . . . . . . . . . . . . . . .12.04 32
2 ATTRACT . . . . . . . . . . . . . . . . . . . . . . . . . . . . . . . . . . . . . . . . . 44.80 902.1 External Openness . . . . . . . . . . . . . . . . . . . . . . . . . . . . . . . . . . . . . . . . . 41.98 69
Attract Business2.1.1 FDI and technology transfer . . . . . . . . . . . . . . . . . . . . . . . . . . . . . . . . . .74.80 252.1.2 Prevalence of foreign ownership . . . . . . . . . . . . . . . . . . . . . . . . . . . . . .79.50 23
Attract People2.1.3 Migrant stock . . . . . . . . . . . . . . . . . . . . . . . . . . . . . . . . . . . . . . . . . . . . . . . . . . 8.03 1222.1.4 International students . . . . . . . . . . . . . . . . . . . . . . . . . . . . . . . . . . . . . . . . . . 0.99 1012.1.5 Brain gain . . . . . . . . . . . . . . . . . . . . . . . . . . . . . . . . . . . . . . . . . . . . . . . . . . . . .46.56 572.2 Internal Openness . . . . . . . . . . . . . . . . . . . . . . . . . . . . . . . . . . . . . . . . . . 47.63 102
Social Inclusion2.2.1 Tolerance of minorities . . . . . . . . . . . . . . . . . . . . . . . . . . . . . . . . . . . . . . . . 37.78 792.2.2 Tolerance of immigrants . . . . . . . . . . . . . . . . . . . . . . . . . . . . . . . . . . . . . . 47.95 852.2.3 Social mobility . . . . . . . . . . . . . . . . . . . . . . . . . . . . . . . . . . . . . . . . . . . . . . . . 47.70 96
Gender Equality2.2.4 Female graduates . . . . . . . . . . . . . . . . . . . . . . . . . . . . . . . . . . . . . . . . . . . . .64.09 772.2.5 Gender development gap . . . . . . . . . . . . . . . . . . . . . . . . . . . . . . . . . . . .72.44 822.2.6 Leadership opportunities for women . . . . . . . . . . . . . . . . . . . . . . . . . 15.85 125
Score Rank
3 GROW . . . . . . . . . . . . . . . . . . . . . . . . . . . . . . . . . . . . . . . . . . . . 44.52 453.1 Formal Education . . . . . . . . . . . . . . . . . . . . . . . . . . . . . . . . . . . . . . . . . . . 35.29 44
Enrolment3.1.1 Vocational enrolment . . . . . . . . . . . . . . . . . . . . . . . . . . . . . . . . . . . . . . . . . 41.35 253.1.2 Tertiary enrolment . . . . . . . . . . . . . . . . . . . . . . . . . . . . . . . . . . . . . . . . . . . .29.78 71
Quality3.1.3 Tertiary education expenditure . . . . . . . . . . . . . . . . . . . . . . . . . . . . . . .25.82 463.1.4 Reading, maths, and science . . . . . . . . . . . . . . . . . . . . . . . . . . . . . . . . . .36.05 543.1.5 University ranking . . . . . . . . . . . . . . . . . . . . . . . . . . . . . . . . . . . . . . . . . . . . .43.46 263.2 Lifelong Learning . . . . . . . . . . . . . . . . . . . . . . . . . . . . . . . . . . . . . . . . . . . 49.19 523.2.1 Quality of management schools . . . . . . . . . . . . . . . . . . . . . . . . . . . . . .49.46 593.2.2 Prevalence of training in firms . . . . . . . . . . . . . . . . . . . . . . . . . . . . . . . . .62.53 203.2.3 Employee development . . . . . . . . . . . . . . . . . . . . . . . . . . . . . . . . . . . . . .35.57 763.3 Access to Growth Opportunities . . . . . . . . . . . . . . . . . . . . . . . . . . . 49.08 54
Empowerment3.3.1 Delegation of authority . . . . . . . . . . . . . . . . . . . . . . . . . . . . . . . . . . . . . . . 48.19 633.3.2 Personal rights . . . . . . . . . . . . . . . . . . . . . . . . . . . . . . . . . . . . . . . . . . . . . . . . 73.74 66
Collaboration3.3.3 Use of virtual social networks . . . . . . . . . . . . . . . . . . . . . . . . . . . . . . . . .73.50 683.3.4 Use of virtual professional networks . . . . . . . . . . . . . . . . . . . . . . . . . . 17.01 383.3.5 Collaboration within organisations . . . . . . . . . . . . . . . . . . . . . . . . . . . .40.92 933.3.6 Collaboration across organisations . . . . . . . . . . . . . . . . . . . . . . . . . . . . 41.14 59
4 RETAIN . . . . . . . . . . . . . . . . . . . . . . . . . . . . . . . . . . . . . . . . . . . 43.88 794.1 Sustainability . . . . . . . . . . . . . . . . . . . . . . . . . . . . . . . . . . . . . . . . . . . . . . . 36.30 784.1.1 Pension system . . . . . . . . . . . . . . . . . . . . . . . . . . . . . . . . . . . . . . . . . . . . . . . 27.55 744.1.2 Social protection . . . . . . . . . . . . . . . . . . . . . . . . . . . . . . . . . . . . . . . . . . . . . . 37.82 784.1.3 Brain retention . . . . . . . . . . . . . . . . . . . . . . . . . . . . . . . . . . . . . . . . . . . . . . . .43.52 604.2 Lifestyle . . . . . . . . . . . . . . . . . . . . . . . . . . . . . . . . . . . . . . . . . . . . . . . . . . . . 51.47 734.2.1 Environmental performance . . . . . . . . . . . . . . . . . . . . . . . . . . . . . . . . . .53.78 634.2.2 Personal safety . . . . . . . . . . . . . . . . . . . . . . . . . . . . . . . . . . . . . . . . . . . . . . . .28.22 1124.2.3 Physician density . . . . . . . . . . . . . . . . . . . . . . . . . . . . . . . . . . . . . . . . . . . . . . 35.47 564.2.4 Sanitation . . . . . . . . . . . . . . . . . . . . . . . . . . . . . . . . . . . . . . . . . . . . . . . . . . . . .88.40 72
5 VOCATIONAL AND TECHNICAL SKILLS . . . . . . . . . . . . . 37.70 815.1 Mid-Level Skills . . . . . . . . . . . . . . . . . . . . . . . . . . . . . . . . . . . . . . . . . . . . . 28.18 905.1.1 Workforce with secondary education . . . . . . . . . . . . . . . . . . . . . . . . . 31.10 875.1.2 Population with secondary education . . . . . . . . . . . . . . . . . . . . . . . .24.60 865.1.3 Technicians and associate professionals . . . . . . . . . . . . . . . . . . . . . . .30.46 725.1.4 Labour productivity per employee . . . . . . . . . . . . . . . . . . . . . . . . . . . .26.57 575.2 Employability . . . . . . . . . . . . . . . . . . . . . . . . . . . . . . . . . . . . . . . . . . . . . . . 47.21 715.2.1 Ease of finding skilled employees . . . . . . . . . . . . . . . . . . . . . . . . . . . . . 59.62 565.2.2 Relevance of education system to the economy . . . . . . . . . . . . . .28.94 1055.2.3 Skills matching with secondary education . . . . . . . . . . . . . . . . . . . . 39.92 765.2.4 Skills matching with tertiary education . . . . . . . . . . . . . . . . . . . . . . . .60.38 52
6 GLOBAL KNOWLEDGE SKILLS . . . . . . . . . . . . . . . . . . . . .28.14 626.1 High-Level Skills . . . . . . . . . . . . . . . . . . . . . . . . . . . . . . . . . . . . . . . . . . . . 25.31 786.1.1 Workforce with tertiary education . . . . . . . . . . . . . . . . . . . . . . . . . . . . 26.14 746.1.2 Population with tertiary education . . . . . . . . . . . . . . . . . . . . . . . . . . . . 23.11 666.1.3 Professionals . . . . . . . . . . . . . . . . . . . . . . . . . . . . . . . . . . . . . . . . . . . . . . . . . .24.54 696.1.4 Researchers . . . . . . . . . . . . . . . . . . . . . . . . . . . . . . . . . . . . . . . . . . . . . . . . . . . . 2.84 756.1.5 Senior officials and managers . . . . . . . . . . . . . . . . . . . . . . . . . . . . . . . . .18.33 716.1.6 Availability of scientists and engineers . . . . . . . . . . . . . . . . . . . . . . . .56.87 496.2 Talent Impact . . . . . . . . . . . . . . . . . . . . . . . . . . . . . . . . . . . . . . . . . . . . . . . 30.98 486.2.1 Innovation output . . . . . . . . . . . . . . . . . . . . . . . . . . . . . . . . . . . . . . . . . . . .36.78 546.2.2 High-value exports . . . . . . . . . . . . . . . . . . . . . . . . . . . . . . . . . . . . . . . . . . . . 47.66 186.2.3 New product entrepreneurial activity . . . . . . . . . . . . . . . . . . . . . . . . .63.31 196.2.4 New business density . . . . . . . . . . . . . . . . . . . . . . . . . . . . . . . . . . . . . . . . . . 2.54 846.2.5 Scientific journal articles . . . . . . . . . . . . . . . . . . . . . . . . . . . . . . . . . . . . . . . 4.63 70
l Mexico l Income group average

GTCI 2020 Country Profile by Pillar
206 THE GLOBAL TALENT COMPETITIVENESS INDEX 2020
COUNTRY PROFILESCOUNTRY PROFILES
102030405060708090100
Global knowledge skills
Vocational andtechnical skills
Retain
Grow
Attract
Enable
10203004
MOLDOVA, REP.Key Indicators
Rank (out of 132) . . . . . . . . . . . . . . . . . . . . . . . . . . . . . . . . . . . . . . . 86Income group . . . . . . . . . . . . . . . . . . . . . . . . . . . Lower-middle incomeRegional group . . . . . . . . . . . . . . . . . . . . . . . . . . . . . . . . . . . . . . . . .EuropePopulation (millions) . . . . . . . . . . . . . . . . . . . . . . . . . . . . . . . . . . . . . 3.55
GDP per capita (PPP US$) . . . . . . . . . . . . . . . . . . . . . . . . . . . . . 7,300.94GDP (US$ billions) . . . . . . . . . . . . . . . . . . . . . . . . . . . . . . . . . . . . . . 11.31GTCI score . . . . . . . . . . . . . . . . . . . . . . . . . . . . . . . . . . . . . . . . . . . . . . 36.64GTCI score (income group average) . . . . . . . . . . . . . . . . . . . . . . . . 32.97
Score Rank
1 ENABLE . . . . . . . . . . . . . . . . . . . . . . . . . . . . . . . . . . . . . . . . . . .41.24 911.1 Regulatory Landscape . . . . . . . . . . . . . . . . . . . . . . . . . . . . . . . . . . . . . . 41.94 861.1.1 Government effectiveness . . . . . . . . . . . . . . . . . . . . . . . . . . . . . . . . . . . . 34.15 981.1.2 Rule of law . . . . . . . . . . . . . . . . . . . . . . . . . . . . . . . . . . . . . . . . . . . . . . . . . . . .42.99 921.1.3 Political stability . . . . . . . . . . . . . . . . . . . . . . . . . . . . . . . . . . . . . . . . . . . . . . . 59.75 751.1.4 Regulatory quality. . . . . . . . . . . . . . . . . . . . . . . . . . . . . . . . . . . . . . . . . . . . . 47.15 711.1.5 Corruption . . . . . . . . . . . . . . . . . . . . . . . . . . . . . . . . . . . . . . . . . . . . . . . . . . . .25.68 971.2 Market Landscape . . . . . . . . . . . . . . . . . . . . . . . . . . . . . . . . . . . . . . . . . .44.09 801.2.1 Competition intensity . . . . . . . . . . . . . . . . . . . . . . . . . . . . . . . . . . . . . . . . .60.82 851.2.2 Ease of doing business . . . . . . . . . . . . . . . . . . . . . . . . . . . . . . . . . . . . . . . .76.69 431.2.3 Cluster development . . . . . . . . . . . . . . . . . . . . . . . . . . . . . . . . . . . . . . . . . . 11.91 1291.2.4 R&D expenditure . . . . . . . . . . . . . . . . . . . . . . . . . . . . . . . . . . . . . . . . . . . . . . . 6.30 791.2.5 ICT infrastructure. . . . . . . . . . . . . . . . . . . . . . . . . . . . . . . . . . . . . . . . . . . . . . 74.81 351.2.6 Urban population . . . . . . . . . . . . . . . . . . . . . . . . . . . . . . . . . . . . . . . . . . . . .34.03 1051.3 Business and Labour Landscape . . . . . . . . . . . . . . . . . . . . . . . . . . . . 37.69 95
Labour Market1.3.1 Tertiary-educated unemployment . . . . . . . . . . . . . . . . . . . . . . . . . . . .89.86 261.3.2 Active labour market policies . . . . . . . . . . . . . . . . . . . . . . . . . . . . . . . . . 32.61 821.3.3 Labour-employer cooperation . . . . . . . . . . . . . . . . . . . . . . . . . . . . . . . .38.26 67
Management Practice1.3.4 Professional management . . . . . . . . . . . . . . . . . . . . . . . . . . . . . . . . . . . .34.23 1001.3.5 Relationship of pay to productivity . . . . . . . . . . . . . . . . . . . . . . . . . . . .48.56 68
Technology Adoption1.3.6 Technology utilisation. . . . . . . . . . . . . . . . . . . . . . . . . . . . . . . . . . . . . . . . .38.40 1011.3.7 Investment in emerging technologies . . . . . . . . . . . . . . . . . . . . . . . . 19.51 1181.3.8 Robot density . . . . . . . . . . . . . . . . . . . . . . . . . . . . . . . . . . . . . . . . . . . . . . . . . . 0.10 64
2 ATTRACT . . . . . . . . . . . . . . . . . . . . . . . . . . . . . . . . . . . . . . . . . .41.40 1032.1 External Openness . . . . . . . . . . . . . . . . . . . . . . . . . . . . . . . . . . . . . . . . . 29.32 113
Attract Business2.1.1 FDI and technology transfer . . . . . . . . . . . . . . . . . . . . . . . . . . . . . . . . . . 47.39 932.1.2 Prevalence of foreign ownership . . . . . . . . . . . . . . . . . . . . . . . . . . . . . . 36.18 118
Attract People2.1.3 Migrant stock . . . . . . . . . . . . . . . . . . . . . . . . . . . . . . . . . . . . . . . . . . . . . . . . .34.26 742.1.4 International students . . . . . . . . . . . . . . . . . . . . . . . . . . . . . . . . . . . . . . . . . 15.09 472.1.5 Brain gain . . . . . . . . . . . . . . . . . . . . . . . . . . . . . . . . . . . . . . . . . . . . . . . . . . . . . 13.67 1252.2 Internal Openness . . . . . . . . . . . . . . . . . . . . . . . . . . . . . . . . . . . . . . . . . . 53.49 81
Social Inclusion2.2.1 Tolerance of minorities . . . . . . . . . . . . . . . . . . . . . . . . . . . . . . . . . . . . . . . .33.33 852.2.2 Tolerance of immigrants . . . . . . . . . . . . . . . . . . . . . . . . . . . . . . . . . . . . . .26.03 1112.2.3 Social mobility . . . . . . . . . . . . . . . . . . . . . . . . . . . . . . . . . . . . . . . . . . . . . . . . 41.69 113
Gender Equality2.2.4 Female graduates . . . . . . . . . . . . . . . . . . . . . . . . . . . . . . . . . . . . . . . . . . . . .78.73 402.2.5 Gender development gap . . . . . . . . . . . . . . . . . . . . . . . . . . . . . . . . . . . .90.64 142.2.6 Leadership opportunities for women . . . . . . . . . . . . . . . . . . . . . . . . .50.53 59
Score Rank
3 GROW . . . . . . . . . . . . . . . . . . . . . . . . . . . . . . . . . . . . . . . . . . . . .34.18 803.1 Formal Education . . . . . . . . . . . . . . . . . . . . . . . . . . . . . . . . . . . . . . . . . . . 23.06 70
Enrolment3.1.1 Vocational enrolment . . . . . . . . . . . . . . . . . . . . . . . . . . . . . . . . . . . . . . . . .22.32 523.1.2 Tertiary enrolment . . . . . . . . . . . . . . . . . . . . . . . . . . . . . . . . . . . . . . . . . . . .32.09 69
Quality3.1.3 Tertiary education expenditure . . . . . . . . . . . . . . . . . . . . . . . . . . . . . . .22.20 593.1.4 Reading, maths, and science . . . . . . . . . . . . . . . . . . . . . . . . . . . . . . . . . .38.70 513.1.5 University ranking . . . . . . . . . . . . . . . . . . . . . . . . . . . . . . . . . . . . . . . . . . . . . . 0.00 753.2 Lifelong Learning . . . . . . . . . . . . . . . . . . . . . . . . . . . . . . . . . . . . . . . . . . . 30.43 1103.2.1 Quality of management schools . . . . . . . . . . . . . . . . . . . . . . . . . . . . . .28.96 1173.2.2 Prevalence of training in firms . . . . . . . . . . . . . . . . . . . . . . . . . . . . . . . . .38.26 453.2.3 Employee development . . . . . . . . . . . . . . . . . . . . . . . . . . . . . . . . . . . . . . 24.07 1143.3 Access to Growth Opportunities . . . . . . . . . . . . . . . . . . . . . . . . . . . 49.05 55
Empowerment3.3.1 Delegation of authority . . . . . . . . . . . . . . . . . . . . . . . . . . . . . . . . . . . . . . .34.22 993.3.2 Personal rights . . . . . . . . . . . . . . . . . . . . . . . . . . . . . . . . . . . . . . . . . . . . . . . . 77.89 61
Collaboration3.3.3 Use of virtual social networks . . . . . . . . . . . . . . . . . . . . . . . . . . . . . . . . . 71.62 713.3.4 Use of virtual professional networks . . . . . . . . . . . . . . . . . . . . . . . . . . . .n/a n/a3.3.5 Collaboration within organisations . . . . . . . . . . . . . . . . . . . . . . . . . . . . 41.95 903.3.6 Collaboration across organisations . . . . . . . . . . . . . . . . . . . . . . . . . . . . 19.58 121
4 RETAIN . . . . . . . . . . . . . . . . . . . . . . . . . . . . . . . . . . . . . . . . . . . .43.71 804.1 Sustainability . . . . . . . . . . . . . . . . . . . . . . . . . . . . . . . . . . . . . . . . . . . . . . . 32.14 964.1.1 Pension system . . . . . . . . . . . . . . . . . . . . . . . . . . . . . . . . . . . . . . . . . . . . . . . 70.10 384.1.2 Social protection . . . . . . . . . . . . . . . . . . . . . . . . . . . . . . . . . . . . . . . . . . . . . .20.02 1184.1.3 Brain retention . . . . . . . . . . . . . . . . . . . . . . . . . . . . . . . . . . . . . . . . . . . . . . . . . 6.29 1274.2 Lifestyle . . . . . . . . . . . . . . . . . . . . . . . . . . . . . . . . . . . . . . . . . . . . . . . . . . . . 55.29 674.2.1 Environmental performance . . . . . . . . . . . . . . . . . . . . . . . . . . . . . . . . . .40.91 914.2.2 Personal safety . . . . . . . . . . . . . . . . . . . . . . . . . . . . . . . . . . . . . . . . . . . . . . . . 52.51 684.2.3 Physician density . . . . . . . . . . . . . . . . . . . . . . . . . . . . . . . . . . . . . . . . . . . . . .50.98 314.2.4 Sanitation . . . . . . . . . . . . . . . . . . . . . . . . . . . . . . . . . . . . . . . . . . . . . . . . . . . . . 76.75 86
5 VOCATIONAL AND TECHNICAL SKILLS . . . . . . . . . . . . 34.36 945.1 Mid-Level Skills . . . . . . . . . . . . . . . . . . . . . . . . . . . . . . . . . . . . . . . . . . . . . 35.76 735.1.1 Workforce with secondary education . . . . . . . . . . . . . . . . . . . . . . . . . 47.88 635.1.2 Population with secondary education . . . . . . . . . . . . . . . . . . . . . . . .58.31 325.1.3 Technicians and associate professionals . . . . . . . . . . . . . . . . . . . . . . .25.53 805.1.4 Labour productivity per employee . . . . . . . . . . . . . . . . . . . . . . . . . . . . 11.34 835.2 Employability . . . . . . . . . . . . . . . . . . . . . . . . . . . . . . . . . . . . . . . . . . . . . . . 32.95 1155.2.1 Ease of finding skilled employees . . . . . . . . . . . . . . . . . . . . . . . . . . . . . 29.14 1295.2.2 Relevance of education system to the economy . . . . . . . . . . . . . .36.01 875.2.3 Skills matching with secondary education . . . . . . . . . . . . . . . . . . . . 31.12 1005.2.4 Skills matching with tertiary education . . . . . . . . . . . . . . . . . . . . . . . .35.55 117
6 GLOBAL KNOWLEDGE SKILLS . . . . . . . . . . . . . . . . . . . . 24.95 706.1 High-Level Skills . . . . . . . . . . . . . . . . . . . . . . . . . . . . . . . . . . . . . . . . . . . . 32.69 586.1.1 Workforce with tertiary education . . . . . . . . . . . . . . . . . . . . . . . . . . . . 36.16 546.1.2 Population with tertiary education . . . . . . . . . . . . . . . . . . . . . . . . . . . .52.56 236.1.3 Professionals . . . . . . . . . . . . . . . . . . . . . . . . . . . . . . . . . . . . . . . . . . . . . . . . . .36.95 476.1.4 Researchers . . . . . . . . . . . . . . . . . . . . . . . . . . . . . . . . . . . . . . . . . . . . . . . . . . . . 8.66 566.1.5 Senior officials and managers . . . . . . . . . . . . . . . . . . . . . . . . . . . . . . . . .38.41 366.1.6 Availability of scientists and engineers . . . . . . . . . . . . . . . . . . . . . . . . 23.41 1236.2 Talent Impact . . . . . . . . . . . . . . . . . . . . . . . . . . . . . . . . . . . . . . . . . . . . . . . 17.21 826.2.1 Innovation output . . . . . . . . . . . . . . . . . . . . . . . . . . . . . . . . . . . . . . . . . . . . 41.86 436.2.2 High-value exports . . . . . . . . . . . . . . . . . . . . . . . . . . . . . . . . . . . . . . . . . . . . 15.32 696.2.3 New product entrepreneurial activity . . . . . . . . . . . . . . . . . . . . . . . . . . .n/a n/a6.2.4 New business density . . . . . . . . . . . . . . . . . . . . . . . . . . . . . . . . . . . . . . . . . . 8.41 536.2.5 Scientific journal articles . . . . . . . . . . . . . . . . . . . . . . . . . . . . . . . . . . . . . . . 3.26 77
l Moldova, Rep. l Income group average
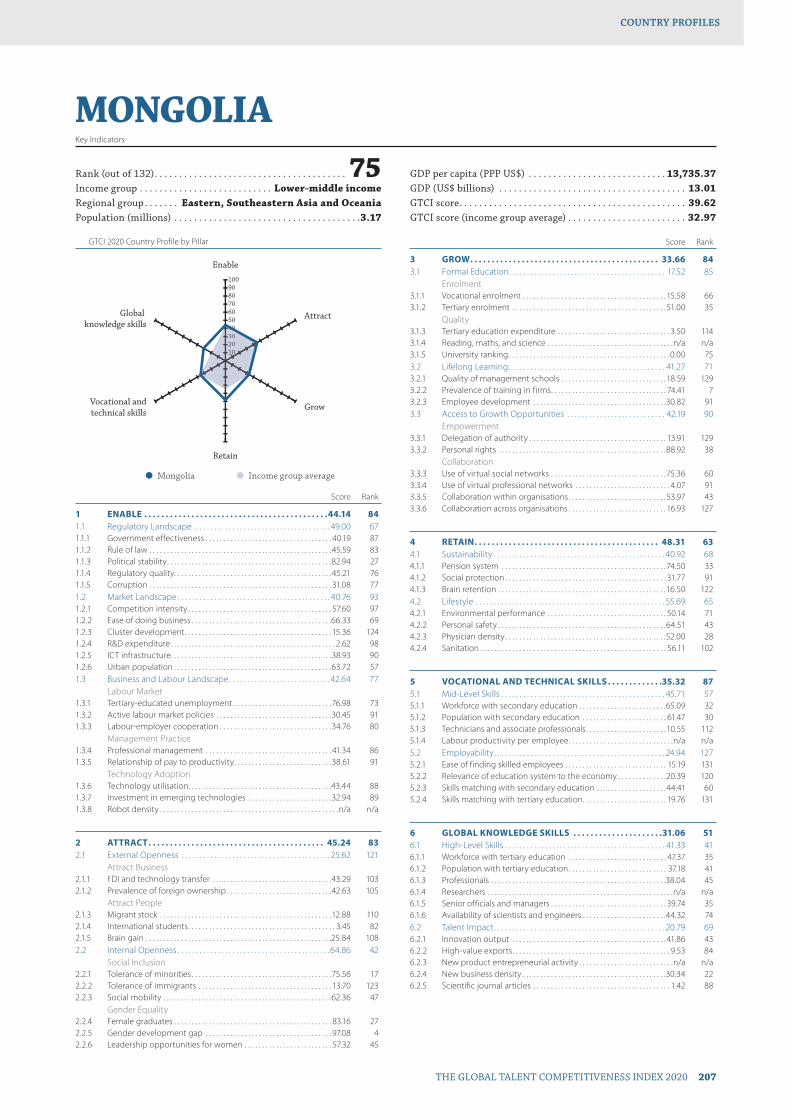
GTCI 2020 Country Profile by Pillar
THE GLOBAL TALENT COMPETITIVENESS INDEX 2020 207
COUNTRY PROFILESCOUNTRY PROFILES
102030405060708090100
Global knowledge skills
Vocational andtechnical skills
Retain
Grow
Attract
Enable
10203004
MONGOLIAKey Indicators
Rank (out of 132) . . . . . . . . . . . . . . . . . . . . . . . . . . . . . . . . . . . . . . . 75Income group . . . . . . . . . . . . . . . . . . . . . . . . . . . Lower-middle incomeRegional group . . . . . . . Eastern, Southeastern Asia and OceaniaPopulation (millions) . . . . . . . . . . . . . . . . . . . . . . . . . . . . . . . . . . . . . .3.17
GDP per capita (PPP US$) . . . . . . . . . . . . . . . . . . . . . . . . . . . . 13,735.37GDP (US$ billions) . . . . . . . . . . . . . . . . . . . . . . . . . . . . . . . . . . . . . . 13.01GTCI score . . . . . . . . . . . . . . . . . . . . . . . . . . . . . . . . . . . . . . . . . . . . . . 39.62GTCI score (income group average) . . . . . . . . . . . . . . . . . . . . . . . . 32.97
Score Rank
1 ENABLE . . . . . . . . . . . . . . . . . . . . . . . . . . . . . . . . . . . . . . . . . . .44.14 841.1 Regulatory Landscape . . . . . . . . . . . . . . . . . . . . . . . . . . . . . . . . . . . . . . 49.00 671.1.1 Government effectiveness . . . . . . . . . . . . . . . . . . . . . . . . . . . . . . . . . . . . 40.19 871.1.2 Rule of law . . . . . . . . . . . . . . . . . . . . . . . . . . . . . . . . . . . . . . . . . . . . . . . . . . . . 45.59 831.1.3 Political stability . . . . . . . . . . . . . . . . . . . . . . . . . . . . . . . . . . . . . . . . . . . . . . .82.94 271.1.4 Regulatory quality. . . . . . . . . . . . . . . . . . . . . . . . . . . . . . . . . . . . . . . . . . . . .45.21 761.1.5 Corruption . . . . . . . . . . . . . . . . . . . . . . . . . . . . . . . . . . . . . . . . . . . . . . . . . . . . 31.08 771.2 Market Landscape . . . . . . . . . . . . . . . . . . . . . . . . . . . . . . . . . . . . . . . . . . 40.76 931.2.1 Competition intensity . . . . . . . . . . . . . . . . . . . . . . . . . . . . . . . . . . . . . . . . . 57.60 971.2.2 Ease of doing business . . . . . . . . . . . . . . . . . . . . . . . . . . . . . . . . . . . . . . . .66.33 691.2.3 Cluster development . . . . . . . . . . . . . . . . . . . . . . . . . . . . . . . . . . . . . . . . . . 15.36 1241.2.4 R&D expenditure . . . . . . . . . . . . . . . . . . . . . . . . . . . . . . . . . . . . . . . . . . . . . . . 2.62 981.2.5 ICT infrastructure. . . . . . . . . . . . . . . . . . . . . . . . . . . . . . . . . . . . . . . . . . . . . .38.93 901.2.6 Urban population . . . . . . . . . . . . . . . . . . . . . . . . . . . . . . . . . . . . . . . . . . . . .63.72 571.3 Business and Labour Landscape . . . . . . . . . . . . . . . . . . . . . . . . . . . . 42.64 77
Labour Market1.3.1 Tertiary-educated unemployment . . . . . . . . . . . . . . . . . . . . . . . . . . . .76.98 731.3.2 Active labour market policies . . . . . . . . . . . . . . . . . . . . . . . . . . . . . . . . .30.45 911.3.3 Labour-employer cooperation . . . . . . . . . . . . . . . . . . . . . . . . . . . . . . . .34.76 80
Management Practice1.3.4 Professional management . . . . . . . . . . . . . . . . . . . . . . . . . . . . . . . . . . . . 41.34 861.3.5 Relationship of pay to productivity . . . . . . . . . . . . . . . . . . . . . . . . . . . .38.61 91
Technology Adoption1.3.6 Technology utilisation. . . . . . . . . . . . . . . . . . . . . . . . . . . . . . . . . . . . . . . . .43.44 881.3.7 Investment in emerging technologies . . . . . . . . . . . . . . . . . . . . . . . .32.94 891.3.8 Robot density . . . . . . . . . . . . . . . . . . . . . . . . . . . . . . . . . . . . . . . . . . . . . . . . . . .n/a n/a
2 ATTRACT . . . . . . . . . . . . . . . . . . . . . . . . . . . . . . . . . . . . . . . . . 45.24 832.1 External Openness . . . . . . . . . . . . . . . . . . . . . . . . . . . . . . . . . . . . . . . . . 25.62 121
Attract Business2.1.1 FDI and technology transfer . . . . . . . . . . . . . . . . . . . . . . . . . . . . . . . . . .43.29 1032.1.2 Prevalence of foreign ownership . . . . . . . . . . . . . . . . . . . . . . . . . . . . . .42.63 105
Attract People2.1.3 Migrant stock . . . . . . . . . . . . . . . . . . . . . . . . . . . . . . . . . . . . . . . . . . . . . . . . .12.88 1102.1.4 International students . . . . . . . . . . . . . . . . . . . . . . . . . . . . . . . . . . . . . . . . . . 3.45 822.1.5 Brain gain . . . . . . . . . . . . . . . . . . . . . . . . . . . . . . . . . . . . . . . . . . . . . . . . . . . . .25.84 1082.2 Internal Openness . . . . . . . . . . . . . . . . . . . . . . . . . . . . . . . . . . . . . . . . . .64.86 42
Social Inclusion2.2.1 Tolerance of minorities . . . . . . . . . . . . . . . . . . . . . . . . . . . . . . . . . . . . . . . .75.56 172.2.2 Tolerance of immigrants . . . . . . . . . . . . . . . . . . . . . . . . . . . . . . . . . . . . . . 13.70 1232.2.3 Social mobility . . . . . . . . . . . . . . . . . . . . . . . . . . . . . . . . . . . . . . . . . . . . . . . .62.36 47
Gender Equality2.2.4 Female graduates . . . . . . . . . . . . . . . . . . . . . . . . . . . . . . . . . . . . . . . . . . . . . 83.16 272.2.5 Gender development gap . . . . . . . . . . . . . . . . . . . . . . . . . . . . . . . . . . . . 97.08 42.2.6 Leadership opportunities for women . . . . . . . . . . . . . . . . . . . . . . . . . 57.32 45
Score Rank
3 GROW . . . . . . . . . . . . . . . . . . . . . . . . . . . . . . . . . . . . . . . . . . . . 33.66 843.1 Formal Education . . . . . . . . . . . . . . . . . . . . . . . . . . . . . . . . . . . . . . . . . . . 17.52 85
Enrolment3.1.1 Vocational enrolment . . . . . . . . . . . . . . . . . . . . . . . . . . . . . . . . . . . . . . . . . 15.58 663.1.2 Tertiary enrolment . . . . . . . . . . . . . . . . . . . . . . . . . . . . . . . . . . . . . . . . . . . . 51.00 35
Quality3.1.3 Tertiary education expenditure . . . . . . . . . . . . . . . . . . . . . . . . . . . . . . . . 3.50 1143.1.4 Reading, maths, and science . . . . . . . . . . . . . . . . . . . . . . . . . . . . . . . . . . . .n/a n/a3.1.5 University ranking . . . . . . . . . . . . . . . . . . . . . . . . . . . . . . . . . . . . . . . . . . . . . . 0.00 753.2 Lifelong Learning . . . . . . . . . . . . . . . . . . . . . . . . . . . . . . . . . . . . . . . . . . . 41.27 713.2.1 Quality of management schools . . . . . . . . . . . . . . . . . . . . . . . . . . . . . . 18.59 1293.2.2 Prevalence of training in firms . . . . . . . . . . . . . . . . . . . . . . . . . . . . . . . . . 74.41 73.2.3 Employee development . . . . . . . . . . . . . . . . . . . . . . . . . . . . . . . . . . . . . .30.82 913.3 Access to Growth Opportunities . . . . . . . . . . . . . . . . . . . . . . . . . . . 42.19 90
Empowerment3.3.1 Delegation of authority . . . . . . . . . . . . . . . . . . . . . . . . . . . . . . . . . . . . . . . 13.91 1293.3.2 Personal rights . . . . . . . . . . . . . . . . . . . . . . . . . . . . . . . . . . . . . . . . . . . . . . . .88.92 38
Collaboration3.3.3 Use of virtual social networks . . . . . . . . . . . . . . . . . . . . . . . . . . . . . . . . .75.36 603.3.4 Use of virtual professional networks . . . . . . . . . . . . . . . . . . . . . . . . . . . 4.07 913.3.5 Collaboration within organisations . . . . . . . . . . . . . . . . . . . . . . . . . . . . 53.97 433.3.6 Collaboration across organisations . . . . . . . . . . . . . . . . . . . . . . . . . . . . 16.93 127
4 RETAIN . . . . . . . . . . . . . . . . . . . . . . . . . . . . . . . . . . . . . . . . . . . 48.31 634.1 Sustainability . . . . . . . . . . . . . . . . . . . . . . . . . . . . . . . . . . . . . . . . . . . . . . . 40.92 684.1.1 Pension system . . . . . . . . . . . . . . . . . . . . . . . . . . . . . . . . . . . . . . . . . . . . . . . 74.50 334.1.2 Social protection . . . . . . . . . . . . . . . . . . . . . . . . . . . . . . . . . . . . . . . . . . . . . . 31.77 914.1.3 Brain retention . . . . . . . . . . . . . . . . . . . . . . . . . . . . . . . . . . . . . . . . . . . . . . . .16.50 1224.2 Lifestyle . . . . . . . . . . . . . . . . . . . . . . . . . . . . . . . . . . . . . . . . . . . . . . . . . . . . 55.69 654.2.1 Environmental performance . . . . . . . . . . . . . . . . . . . . . . . . . . . . . . . . . . 50.14 714.2.2 Personal safety . . . . . . . . . . . . . . . . . . . . . . . . . . . . . . . . . . . . . . . . . . . . . . . .64.51 434.2.3 Physician density . . . . . . . . . . . . . . . . . . . . . . . . . . . . . . . . . . . . . . . . . . . . . .52.00 284.2.4 Sanitation . . . . . . . . . . . . . . . . . . . . . . . . . . . . . . . . . . . . . . . . . . . . . . . . . . . . . 56.11 102
5 VOCATIONAL AND TECHNICAL SKILLS . . . . . . . . . . . . .35.32 875.1 Mid-Level Skills . . . . . . . . . . . . . . . . . . . . . . . . . . . . . . . . . . . . . . . . . . . . . 45.71 575.1.1 Workforce with secondary education . . . . . . . . . . . . . . . . . . . . . . . . .65.09 325.1.2 Population with secondary education . . . . . . . . . . . . . . . . . . . . . . . . 61.47 305.1.3 Technicians and associate professionals . . . . . . . . . . . . . . . . . . . . . . . 10.55 1125.1.4 Labour productivity per employee . . . . . . . . . . . . . . . . . . . . . . . . . . . . . .n/a n/a5.2 Employability . . . . . . . . . . . . . . . . . . . . . . . . . . . . . . . . . . . . . . . . . . . . . . . 24.94 1275.2.1 Ease of finding skilled employees . . . . . . . . . . . . . . . . . . . . . . . . . . . . . 15.19 1315.2.2 Relevance of education system to the economy . . . . . . . . . . . . . .20.39 1205.2.3 Skills matching with secondary education . . . . . . . . . . . . . . . . . . . .44.41 605.2.4 Skills matching with tertiary education . . . . . . . . . . . . . . . . . . . . . . . . 19.76 131
6 GLOBAL KNOWLEDGE SKILLS . . . . . . . . . . . . . . . . . . . . .31.06 516.1 High-Level Skills . . . . . . . . . . . . . . . . . . . . . . . . . . . . . . . . . . . . . . . . . . . . 41.33 416.1.1 Workforce with tertiary education . . . . . . . . . . . . . . . . . . . . . . . . . . . . 47.37 356.1.2 Population with tertiary education . . . . . . . . . . . . . . . . . . . . . . . . . . . . 37.18 416.1.3 Professionals . . . . . . . . . . . . . . . . . . . . . . . . . . . . . . . . . . . . . . . . . . . . . . . . . .38.04 456.1.4 Researchers . . . . . . . . . . . . . . . . . . . . . . . . . . . . . . . . . . . . . . . . . . . . . . . . . . . . .n/a n/a6.1.5 Senior officials and managers . . . . . . . . . . . . . . . . . . . . . . . . . . . . . . . . . 39.74 356.1.6 Availability of scientists and engineers . . . . . . . . . . . . . . . . . . . . . . . .44.32 746.2 Talent Impact . . . . . . . . . . . . . . . . . . . . . . . . . . . . . . . . . . . . . . . . . . . . . . . 20.79 696.2.1 Innovation output . . . . . . . . . . . . . . . . . . . . . . . . . . . . . . . . . . . . . . . . . . . . 41.86 436.2.2 High-value exports . . . . . . . . . . . . . . . . . . . . . . . . . . . . . . . . . . . . . . . . . . . . . 9.53 846.2.3 New product entrepreneurial activity . . . . . . . . . . . . . . . . . . . . . . . . . . .n/a n/a6.2.4 New business density . . . . . . . . . . . . . . . . . . . . . . . . . . . . . . . . . . . . . . . . .30.34 226.2.5 Scientific journal articles . . . . . . . . . . . . . . . . . . . . . . . . . . . . . . . . . . . . . . . 1.42 88
l Mongolia l Income group average

GTCI 2020 Country Profile by Pillar
208 THE GLOBAL TALENT COMPETITIVENESS INDEX 2020
COUNTRY PROFILESCOUNTRY PROFILES
102030405060708090100
Global knowledge skills
Vocational andtechnical skills
Retain
Grow
Attract
Enable
1020304040
MONTENEGROKey Indicators
Rank (out of 132) . . . . . . . . . . . . . . . . . . . . . . . . . . . . . . . . . . . . . . . 53Income group . . . . . . . . . . . . . . . . . . . . . . . . . . . Upper-middle incomeRegional group . . . . . . . . . . . . . . . . . . . . . . . . . . . . . . . . . . . . . . . . .EuropePopulation (millions) . . . . . . . . . . . . . . . . . . . . . . . . . . . . . . . . . . . . . 0.62
GDP per capita (PPP US$) . . . . . . . . . . . . . . . . . . . . . . . . . . . . 19,354.93GDP (US$ billions) . . . . . . . . . . . . . . . . . . . . . . . . . . . . . . . . . . . . . . . .5.45GTCI score . . . . . . . . . . . . . . . . . . . . . . . . . . . . . . . . . . . . . . . . . . . . . . 46.32GTCI score (income group average) . . . . . . . . . . . . . . . . . . . . . . . . 41.25
Score Rank
1 ENABLE . . . . . . . . . . . . . . . . . . . . . . . . . . . . . . . . . . . . . . . . . . .50.51 561.1 Regulatory Landscape . . . . . . . . . . . . . . . . . . . . . . . . . . . . . . . . . . . . . . 53.17 561.1.1 Government effectiveness . . . . . . . . . . . . . . . . . . . . . . . . . . . . . . . . . . . .50.28 631.1.2 Rule of law . . . . . . . . . . . . . . . . . . . . . . . . . . . . . . . . . . . . . . . . . . . . . . . . . . . . 52.97 641.1.3 Political stability . . . . . . . . . . . . . . . . . . . . . . . . . . . . . . . . . . . . . . . . . . . . . . .65.30 671.1.4 Regulatory quality. . . . . . . . . . . . . . . . . . . . . . . . . . . . . . . . . . . . . . . . . . . . . 55.42 551.1.5 Corruption . . . . . . . . . . . . . . . . . . . . . . . . . . . . . . . . . . . . . . . . . . . . . . . . . . . . 41.89 551.2 Market Landscape . . . . . . . . . . . . . . . . . . . . . . . . . . . . . . . . . . . . . . . . . . 51.08 651.2.1 Competition intensity . . . . . . . . . . . . . . . . . . . . . . . . . . . . . . . . . . . . . . . . . 59.31 911.2.2 Ease of doing business . . . . . . . . . . . . . . . . . . . . . . . . . . . . . . . . . . . . . . . .75.24 461.2.3 Cluster development . . . . . . . . . . . . . . . . . . . . . . . . . . . . . . . . . . . . . . . . . .35.22 861.2.4 R&D expenditure . . . . . . . . . . . . . . . . . . . . . . . . . . . . . . . . . . . . . . . . . . . . . . . 6.79 771.2.5 ICT infrastructure. . . . . . . . . . . . . . . . . . . . . . . . . . . . . . . . . . . . . . . . . . . . . .68.07 521.2.6 Urban population . . . . . . . . . . . . . . . . . . . . . . . . . . . . . . . . . . . . . . . . . . . . . 61.84 611.3 Business and Labour Landscape . . . . . . . . . . . . . . . . . . . . . . . . . . . . 47.28 64
Labour Market1.3.1 Tertiary-educated unemployment . . . . . . . . . . . . . . . . . . . . . . . . . . . .66.08 931.3.2 Active labour market policies . . . . . . . . . . . . . . . . . . . . . . . . . . . . . . . . .58.94 401.3.3 Labour-employer cooperation . . . . . . . . . . . . . . . . . . . . . . . . . . . . . . . .36.06 74
Management Practice1.3.4 Professional management . . . . . . . . . . . . . . . . . . . . . . . . . . . . . . . . . . . .40.90 881.3.5 Relationship of pay to productivity . . . . . . . . . . . . . . . . . . . . . . . . . . . .48.95 67
Technology Adoption1.3.6 Technology utilisation. . . . . . . . . . . . . . . . . . . . . . . . . . . . . . . . . . . . . . . . .46.36 751.3.7 Investment in emerging technologies . . . . . . . . . . . . . . . . . . . . . . . .33.65 861.3.8 Robot density . . . . . . . . . . . . . . . . . . . . . . . . . . . . . . . . . . . . . . . . . . . . . . . . . . .n/a n/a
2 ATTRACT . . . . . . . . . . . . . . . . . . . . . . . . . . . . . . . . . . . . . . . . . .53.57 502.1 External Openness . . . . . . . . . . . . . . . . . . . . . . . . . . . . . . . . . . . . . . . . . 53.14 35
Attract Business2.1.1 FDI and technology transfer . . . . . . . . . . . . . . . . . . . . . . . . . . . . . . . . . . 61.32 562.1.2 Prevalence of foreign ownership . . . . . . . . . . . . . . . . . . . . . . . . . . . . . .58.90 63
Attract People2.1.3 Migrant stock . . . . . . . . . . . . . . . . . . . . . . . . . . . . . . . . . . . . . . . . . . . . . . . . . 59.37 342.1.4 International students . . . . . . . . . . . . . . . . . . . . . . . . . . . . . . . . . . . . . . . . . . .n/a n/a2.1.5 Brain gain . . . . . . . . . . . . . . . . . . . . . . . . . . . . . . . . . . . . . . . . . . . . . . . . . . . . .32.96 932.2 Internal Openness . . . . . . . . . . . . . . . . . . . . . . . . . . . . . . . . . . . . . . . . . . 54.01 79
Social Inclusion2.2.1 Tolerance of minorities . . . . . . . . . . . . . . . . . . . . . . . . . . . . . . . . . . . . . . . .16.67 1112.2.2 Tolerance of immigrants . . . . . . . . . . . . . . . . . . . . . . . . . . . . . . . . . . . . . . 45.21 912.2.3 Social mobility . . . . . . . . . . . . . . . . . . . . . . . . . . . . . . . . . . . . . . . . . . . . . . . . 53.76 76
Gender Equality2.2.4 Female graduates . . . . . . . . . . . . . . . . . . . . . . . . . . . . . . . . . . . . . . . . . . . . . 79.91 342.2.5 Gender development gap . . . . . . . . . . . . . . . . . . . . . . . . . . . . . . . . . . . .73.25 802.2.6 Leadership opportunities for women . . . . . . . . . . . . . . . . . . . . . . . . .55.27 50
Score Rank
3 GROW . . . . . . . . . . . . . . . . . . . . . . . . . . . . . . . . . . . . . . . . . . . . 40.33 583.1 Formal Education . . . . . . . . . . . . . . . . . . . . . . . . . . . . . . . . . . . . . . . . . . . 33.38 49
Enrolment3.1.1 Vocational enrolment . . . . . . . . . . . . . . . . . . . . . . . . . . . . . . . . . . . . . . . . .50.27 173.1.2 Tertiary enrolment . . . . . . . . . . . . . . . . . . . . . . . . . . . . . . . . . . . . . . . . . . . . 45.75 47
Quality3.1.3 Tertiary education expenditure . . . . . . . . . . . . . . . . . . . . . . . . . . . . . . . . .n/a n/a3.1.4 Reading, maths, and science . . . . . . . . . . . . . . . . . . . . . . . . . . . . . . . . . . 37.48 523.1.5 University ranking . . . . . . . . . . . . . . . . . . . . . . . . . . . . . . . . . . . . . . . . . . . . . . 0.00 753.2 Lifelong Learning . . . . . . . . . . . . . . . . . . . . . . . . . . . . . . . . . . . . . . . . . . . 39.20 773.2.1 Quality of management schools . . . . . . . . . . . . . . . . . . . . . . . . . . . . . .54.24 483.2.2 Prevalence of training in firms . . . . . . . . . . . . . . . . . . . . . . . . . . . . . . . . .26.78 683.2.3 Employee development . . . . . . . . . . . . . . . . . . . . . . . . . . . . . . . . . . . . . .36.57 683.3 Access to Growth Opportunities . . . . . . . . . . . . . . . . . . . . . . . . . . . 48.43 60
Empowerment3.3.1 Delegation of authority . . . . . . . . . . . . . . . . . . . . . . . . . . . . . . . . . . . . . . . 31.35 1113.3.2 Personal rights . . . . . . . . . . . . . . . . . . . . . . . . . . . . . . . . . . . . . . . . . . . . . . . .69.96 75
Collaboration3.3.3 Use of virtual social networks . . . . . . . . . . . . . . . . . . . . . . . . . . . . . . . . .85.31 303.3.4 Use of virtual professional networks . . . . . . . . . . . . . . . . . . . . . . . . . . 11.19 573.3.5 Collaboration within organisations . . . . . . . . . . . . . . . . . . . . . . . . . . . . 51.10 523.3.6 Collaboration across organisations . . . . . . . . . . . . . . . . . . . . . . . . . . . . 41.66 56
4 RETAIN . . . . . . . . . . . . . . . . . . . . . . . . . . . . . . . . . . . . . . . . . . . .48.61 614.1 Sustainability . . . . . . . . . . . . . . . . . . . . . . . . . . . . . . . . . . . . . . . . . . . . . . . 37.62 754.1.1 Pension system . . . . . . . . . . . . . . . . . . . . . . . . . . . . . . . . . . . . . . . . . . . . . . . . .n/a n/a4.1.2 Social protection . . . . . . . . . . . . . . . . . . . . . . . . . . . . . . . . . . . . . . . . . . . . . .40.24 734.1.3 Brain retention . . . . . . . . . . . . . . . . . . . . . . . . . . . . . . . . . . . . . . . . . . . . . . . .34.99 814.2 Lifestyle . . . . . . . . . . . . . . . . . . . . . . . . . . . . . . . . . . . . . . . . . . . . . . . . . . . . 59.60 564.2.1 Environmental performance . . . . . . . . . . . . . . . . . . . . . . . . . . . . . . . . . .56.51 584.2.2 Personal safety . . . . . . . . . . . . . . . . . . . . . . . . . . . . . . . . . . . . . . . . . . . . . . . .49.04 784.2.3 Physician density . . . . . . . . . . . . . . . . . . . . . . . . . . . . . . . . . . . . . . . . . . . . . . 37.27 524.2.4 Sanitation . . . . . . . . . . . . . . . . . . . . . . . . . . . . . . . . . . . . . . . . . . . . . . . . . . . . .95.60 51
5 VOCATIONAL AND TECHNICAL SKILLS . . . . . . . . . . . . 54.95 385.1 Mid-Level Skills . . . . . . . . . . . . . . . . . . . . . . . . . . . . . . . . . . . . . . . . . . . . . 60.89 215.1.1 Workforce with secondary education . . . . . . . . . . . . . . . . . . . . . . . . .84.39 85.1.2 Population with secondary education . . . . . . . . . . . . . . . . . . . . . . . . 74.37 145.1.3 Technicians and associate professionals . . . . . . . . . . . . . . . . . . . . . . . 53.14 385.1.4 Labour productivity per employee . . . . . . . . . . . . . . . . . . . . . . . . . . . . 31.66 545.2 Employability . . . . . . . . . . . . . . . . . . . . . . . . . . . . . . . . . . . . . . . . . . . . . . . 49.01 655.2.1 Ease of finding skilled employees . . . . . . . . . . . . . . . . . . . . . . . . . . . . . 51.06 815.2.2 Relevance of education system to the economy . . . . . . . . . . . . . . 54.14 455.2.3 Skills matching with secondary education . . . . . . . . . . . . . . . . . . . .42.34 675.2.4 Skills matching with tertiary education . . . . . . . . . . . . . . . . . . . . . . . .48.47 80
6 GLOBAL KNOWLEDGE SKILLS . . . . . . . . . . . . . . . . . . . . .29.92 556.1 High-Level Skills . . . . . . . . . . . . . . . . . . . . . . . . . . . . . . . . . . . . . . . . . . . . 35.47 516.1.1 Workforce with tertiary education . . . . . . . . . . . . . . . . . . . . . . . . . . . . 41.43 446.1.2 Population with tertiary education . . . . . . . . . . . . . . . . . . . . . . . . . . . .30.37 546.1.3 Professionals . . . . . . . . . . . . . . . . . . . . . . . . . . . . . . . . . . . . . . . . . . . . . . . . . . 49.49 246.1.4 Researchers . . . . . . . . . . . . . . . . . . . . . . . . . . . . . . . . . . . . . . . . . . . . . . . . . . . . 8.54 576.1.5 Senior officials and managers . . . . . . . . . . . . . . . . . . . . . . . . . . . . . . . . .32.39 456.1.6 Availability of scientists and engineers . . . . . . . . . . . . . . . . . . . . . . . . 50.61 636.2 Talent Impact . . . . . . . . . . . . . . . . . . . . . . . . . . . . . . . . . . . . . . . . . . . . . . . 24.38 586.2.1 Innovation output . . . . . . . . . . . . . . . . . . . . . . . . . . . . . . . . . . . . . . . . . . . . 41.33 456.2.2 High-value exports . . . . . . . . . . . . . . . . . . . . . . . . . . . . . . . . . . . . . . . . . . . . . 7.55 906.2.3 New product entrepreneurial activity . . . . . . . . . . . . . . . . . . . . . . . . . . .n/a n/a6.2.4 New business density . . . . . . . . . . . . . . . . . . . . . . . . . . . . . . . . . . . . . . . . .32.25 216.2.5 Scientific journal articles . . . . . . . . . . . . . . . . . . . . . . . . . . . . . . . . . . . . . .16.38 46
l Montenegro l Income group average

GTCI 2020 Country Profile by Pillar
THE GLOBAL TALENT COMPETITIVENESS INDEX 2020 209
COUNTRY PROFILESCOUNTRY PROFILES
102030405060708090100
Global knowledge skills
Vocational andtechnical skills
Retain
Grow
Attract
Enable
10203004
MOROCCOKey Indicators
Rank (out of 132) . . . . . . . . . . . . . . . . . . . . . . . . . . . . . . . . . . . .100Income group . . . . . . . . . . . . . . . . . . . . . . . . . . . Lower-middle incomeRegional group . . . . . . . . . . . . . .Northern Africa and Western AsiaPopulation (millions) . . . . . . . . . . . . . . . . . . . . . . . . . . . . . . . . . . . . 36.03
GDP per capita (PPP US$) . . . . . . . . . . . . . . . . . . . . . . . . . . . . . 8,586.64GDP (US$ billions) . . . . . . . . . . . . . . . . . . . . . . . . . . . . . . . . . . . . . 118.50GTCI score . . . . . . . . . . . . . . . . . . . . . . . . . . . . . . . . . . . . . . . . . . . . . . 32.93GTCI score (income group average) . . . . . . . . . . . . . . . . . . . . . . . . 32.97
Score Rank
1 ENABLE . . . . . . . . . . . . . . . . . . . . . . . . . . . . . . . . . . . . . . . . . . .42.76 891.1 Regulatory Landscape . . . . . . . . . . . . . . . . . . . . . . . . . . . . . . . . . . . . . . 45.79 771.1.1 Government effectiveness . . . . . . . . . . . . . . . . . . . . . . . . . . . . . . . . . . . .42.66 821.1.2 Rule of law . . . . . . . . . . . . . . . . . . . . . . . . . . . . . . . . . . . . . . . . . . . . . . . . . . . .48.58 721.1.3 Political stability . . . . . . . . . . . . . . . . . . . . . . . . . . . . . . . . . . . . . . . . . . . . . . .56.02 901.1.4 Regulatory quality. . . . . . . . . . . . . . . . . . . . . . . . . . . . . . . . . . . . . . . . . . . . .42.49 861.1.5 Corruption . . . . . . . . . . . . . . . . . . . . . . . . . . . . . . . . . . . . . . . . . . . . . . . . . . . . 39.19 591.2 Market Landscape . . . . . . . . . . . . . . . . . . . . . . . . . . . . . . . . . . . . . . . . . . 51.49 641.2.1 Competition intensity . . . . . . . . . . . . . . . . . . . . . . . . . . . . . . . . . . . . . . . . .66.55 721.2.2 Ease of doing business . . . . . . . . . . . . . . . . . . . . . . . . . . . . . . . . . . . . . . . . 72.19 561.2.3 Cluster development . . . . . . . . . . . . . . . . . . . . . . . . . . . . . . . . . . . . . . . . . . 42.31 701.2.4 R&D expenditure . . . . . . . . . . . . . . . . . . . . . . . . . . . . . . . . . . . . . . . . . . . . . .15.34 491.2.5 ICT infrastructure. . . . . . . . . . . . . . . . . . . . . . . . . . . . . . . . . . . . . . . . . . . . . .55.73 671.2.6 Urban population . . . . . . . . . . . . . . . . . . . . . . . . . . . . . . . . . . . . . . . . . . . . .56.83 701.3 Business and Labour Landscape . . . . . . . . . . . . . . . . . . . . . . . . . . . . 31.01 117
Labour Market1.3.1 Tertiary-educated unemployment . . . . . . . . . . . . . . . . . . . . . . . . . . . . . .n/a n/a1.3.2 Active labour market policies . . . . . . . . . . . . . . . . . . . . . . . . . . . . . . . . .13.80 1181.3.3 Labour-employer cooperation . . . . . . . . . . . . . . . . . . . . . . . . . . . . . . . .23.69 104
Management Practice1.3.4 Professional management . . . . . . . . . . . . . . . . . . . . . . . . . . . . . . . . . . . .48.99 651.3.5 Relationship of pay to productivity . . . . . . . . . . . . . . . . . . . . . . . . . . . . 41.02 84
Technology Adoption1.3.6 Technology utilisation. . . . . . . . . . . . . . . . . . . . . . . . . . . . . . . . . . . . . . . . .53.23 601.3.7 Investment in emerging technologies . . . . . . . . . . . . . . . . . . . . . . . .34.94 801.3.8 Robot density . . . . . . . . . . . . . . . . . . . . . . . . . . . . . . . . . . . . . . . . . . . . . . . . . . 1.40 49
2 ATTRACT . . . . . . . . . . . . . . . . . . . . . . . . . . . . . . . . . . . . . . . . . .39.03 1112.1 External Openness . . . . . . . . . . . . . . . . . . . . . . . . . . . . . . . . . . . . . . . . . 39.44 79
Attract Business2.1.1 FDI and technology transfer . . . . . . . . . . . . . . . . . . . . . . . . . . . . . . . . . . 66.15 472.1.2 Prevalence of foreign ownership . . . . . . . . . . . . . . . . . . . . . . . . . . . . . . 75.95 28
Attract People2.1.3 Migrant stock . . . . . . . . . . . . . . . . . . . . . . . . . . . . . . . . . . . . . . . . . . . . . . . . . . 5.14 1252.1.4 International students . . . . . . . . . . . . . . . . . . . . . . . . . . . . . . . . . . . . . . . . . . 7.22 702.1.5 Brain gain . . . . . . . . . . . . . . . . . . . . . . . . . . . . . . . . . . . . . . . . . . . . . . . . . . . . . 42.75 702.2 Internal Openness . . . . . . . . . . . . . . . . . . . . . . . . . . . . . . . . . . . . . . . . . . 38.62 125
Social Inclusion2.2.1 Tolerance of minorities . . . . . . . . . . . . . . . . . . . . . . . . . . . . . . . . . . . . . . . .16.67 1112.2.2 Tolerance of immigrants . . . . . . . . . . . . . . . . . . . . . . . . . . . . . . . . . . . . . .39.73 1002.2.3 Social mobility . . . . . . . . . . . . . . . . . . . . . . . . . . . . . . . . . . . . . . . . . . . . . . . . 59.12 57
Gender Equality2.2.4 Female graduates . . . . . . . . . . . . . . . . . . . . . . . . . . . . . . . . . . . . . . . . . . . . .48.99 952.2.5 Gender development gap . . . . . . . . . . . . . . . . . . . . . . . . . . . . . . . . . . . . 31.25 1282.2.6 Leadership opportunities for women . . . . . . . . . . . . . . . . . . . . . . . . .35.99 93
Score Rank
3 GROW . . . . . . . . . . . . . . . . . . . . . . . . . . . . . . . . . . . . . . . . . . . . 30.60 973.1 Formal Education . . . . . . . . . . . . . . . . . . . . . . . . . . . . . . . . . . . . . . . . . . . 15.70 91
Enrolment3.1.1 Vocational enrolment . . . . . . . . . . . . . . . . . . . . . . . . . . . . . . . . . . . . . . . . .12.34 793.1.2 Tertiary enrolment . . . . . . . . . . . . . . . . . . . . . . . . . . . . . . . . . . . . . . . . . . . .26.26 76
Quality3.1.3 Tertiary education expenditure . . . . . . . . . . . . . . . . . . . . . . . . . . . . . . . 24.18 513.1.4 Reading, maths, and science . . . . . . . . . . . . . . . . . . . . . . . . . . . . . . . . . . . .n/a n/a3.1.5 University ranking . . . . . . . . . . . . . . . . . . . . . . . . . . . . . . . . . . . . . . . . . . . . . . 0.00 753.2 Lifelong Learning . . . . . . . . . . . . . . . . . . . . . . . . . . . . . . . . . . . . . . . . . . . 35.26 933.2.1 Quality of management schools . . . . . . . . . . . . . . . . . . . . . . . . . . . . . .44.46 783.2.2 Prevalence of training in firms . . . . . . . . . . . . . . . . . . . . . . . . . . . . . . . . .30.21 593.2.3 Employee development . . . . . . . . . . . . . . . . . . . . . . . . . . . . . . . . . . . . . . 31.10 903.3 Access to Growth Opportunities . . . . . . . . . . . . . . . . . . . . . . . . . . . 40.83 94
Empowerment3.3.1 Delegation of authority . . . . . . . . . . . . . . . . . . . . . . . . . . . . . . . . . . . . . . . 41.81 773.3.2 Personal rights . . . . . . . . . . . . . . . . . . . . . . . . . . . . . . . . . . . . . . . . . . . . . . . .54.60 96
Collaboration3.3.3 Use of virtual social networks . . . . . . . . . . . . . . . . . . . . . . . . . . . . . . . . . 72.19 703.3.4 Use of virtual professional networks . . . . . . . . . . . . . . . . . . . . . . . . . . . 7.04 723.3.5 Collaboration within organisations . . . . . . . . . . . . . . . . . . . . . . . . . . . .44.48 793.3.6 Collaboration across organisations . . . . . . . . . . . . . . . . . . . . . . . . . . . .24.88 109
4 RETAIN . . . . . . . . . . . . . . . . . . . . . . . . . . . . . . . . . . . . . . . . . . . .41.79 854.1 Sustainability . . . . . . . . . . . . . . . . . . . . . . . . . . . . . . . . . . . . . . . . . . . . . . . 29.91 984.1.1 Pension system . . . . . . . . . . . . . . . . . . . . . . . . . . . . . . . . . . . . . . . . . . . . . . .30.20 704.1.2 Social protection . . . . . . . . . . . . . . . . . . . . . . . . . . . . . . . . . . . . . . . . . . . . . .26.38 1074.1.3 Brain retention . . . . . . . . . . . . . . . . . . . . . . . . . . . . . . . . . . . . . . . . . . . . . . . . 33.16 874.2 Lifestyle . . . . . . . . . . . . . . . . . . . . . . . . . . . . . . . . . . . . . . . . . . . . . . . . . . . . 53.67 704.2.1 Environmental performance . . . . . . . . . . . . . . . . . . . . . . . . . . . . . . . . . .60.08 494.2.2 Personal safety . . . . . . . . . . . . . . . . . . . . . . . . . . . . . . . . . . . . . . . . . . . . . . . .62.77 474.2.3 Physician density . . . . . . . . . . . . . . . . . . . . . . . . . . . . . . . . . . . . . . . . . . . . . . . 9.61 934.2.4 Sanitation . . . . . . . . . . . . . . . . . . . . . . . . . . . . . . . . . . . . . . . . . . . . . . . . . . . . .82.21 82
5 VOCATIONAL AND TECHNICAL SKILLS . . . . . . . . . . . . .27.20 1165.1 Mid-Level Skills . . . . . . . . . . . . . . . . . . . . . . . . . . . . . . . . . . . . . . . . . . . . . 19.87 1025.1.1 Workforce with secondary education . . . . . . . . . . . . . . . . . . . . . . . . . 27.19 935.1.2 Population with secondary education . . . . . . . . . . . . . . . . . . . . . . . . . .n/a n/a5.1.3 Technicians and associate professionals . . . . . . . . . . . . . . . . . . . . . . . 18.45 955.1.4 Labour productivity per employee . . . . . . . . . . . . . . . . . . . . . . . . . . . . 13.98 775.2 Employability . . . . . . . . . . . . . . . . . . . . . . . . . . . . . . . . . . . . . . . . . . . . . . . 34.54 1115.2.1 Ease of finding skilled employees . . . . . . . . . . . . . . . . . . . . . . . . . . . . . 45.97 955.2.2 Relevance of education system to the economy . . . . . . . . . . . . . .25.96 1095.2.3 Skills matching with secondary education . . . . . . . . . . . . . . . . . . . .26.39 1115.2.4 Skills matching with tertiary education . . . . . . . . . . . . . . . . . . . . . . . .39.82 105
6 GLOBAL KNOWLEDGE SKILLS . . . . . . . . . . . . . . . . . . . . .16.21 956.1 High-Level Skills . . . . . . . . . . . . . . . . . . . . . . . . . . . . . . . . . . . . . . . . . . . . 16.81 1056.1.1 Workforce with tertiary education . . . . . . . . . . . . . . . . . . . . . . . . . . . . 12.97 996.1.2 Population with tertiary education . . . . . . . . . . . . . . . . . . . . . . . . . . . . . .n/a n/a6.1.3 Professionals . . . . . . . . . . . . . . . . . . . . . . . . . . . . . . . . . . . . . . . . . . . . . . . . . . . 3.81 1236.1.4 Researchers . . . . . . . . . . . . . . . . . . . . . . . . . . . . . . . . . . . . . . . . . . . . . . . . . . .12.84 496.1.5 Senior officials and managers . . . . . . . . . . . . . . . . . . . . . . . . . . . . . . . . . . 2.42 1226.1.6 Availability of scientists and engineers . . . . . . . . . . . . . . . . . . . . . . . . 51.99 596.2 Talent Impact . . . . . . . . . . . . . . . . . . . . . . . . . . . . . . . . . . . . . . . . . . . . . . . 15.62 856.2.1 Innovation output . . . . . . . . . . . . . . . . . . . . . . . . . . . . . . . . . . . . . . . . . . . .29.60 656.2.2 High-value exports . . . . . . . . . . . . . . . . . . . . . . . . . . . . . . . . . . . . . . . . . . . . 10.76 836.2.3 New product entrepreneurial activity . . . . . . . . . . . . . . . . . . . . . . . . .25.25 746.2.4 New business density . . . . . . . . . . . . . . . . . . . . . . . . . . . . . . . . . . . . . . . . . . 7.92 586.2.5 Scientific journal articles . . . . . . . . . . . . . . . . . . . . . . . . . . . . . . . . . . . . . . . 4.55 71
l Morocco l Income group average
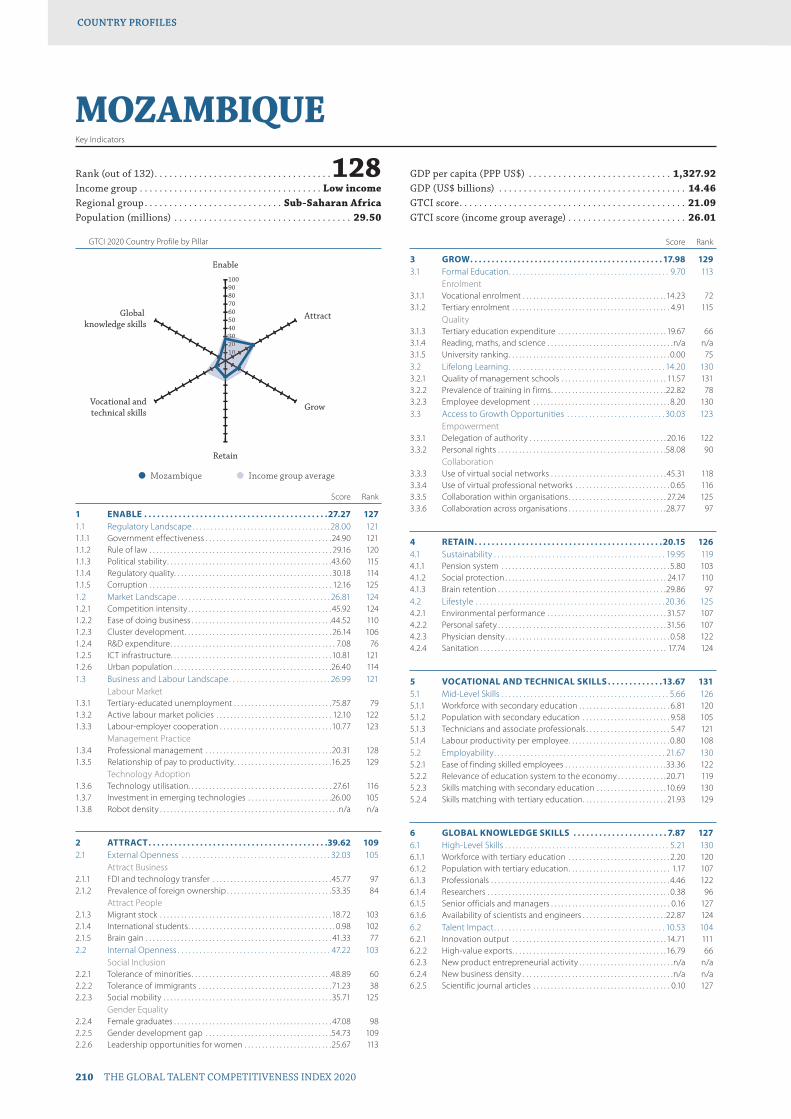
GTCI 2020 Country Profile by Pillar
210 THE GLOBAL TALENT COMPETITIVENESS INDEX 2020
COUNTRY PROFILESCOUNTRY PROFILES
102030405060708090100
Global knowledge skills
Vocational andtechnical skills
Retain
Grow
Attract
Enable
1020330
MOZAMBIQUEKey Indicators
Rank (out of 132) . . . . . . . . . . . . . . . . . . . . . . . . . . . . . . . . . . . .128Income group . . . . . . . . . . . . . . . . . . . . . . . . . . . . . . . . . . . . . Low incomeRegional group . . . . . . . . . . . . . . . . . . . . . . . . . . . . Sub-Saharan AfricaPopulation (millions) . . . . . . . . . . . . . . . . . . . . . . . . . . . . . . . . . . . . 29.50
GDP per capita (PPP US$) . . . . . . . . . . . . . . . . . . . . . . . . . . . . . 1,327.92GDP (US$ billions) . . . . . . . . . . . . . . . . . . . . . . . . . . . . . . . . . . . . . . 14.46GTCI score . . . . . . . . . . . . . . . . . . . . . . . . . . . . . . . . . . . . . . . . . . . . . . 21.09GTCI score (income group average) . . . . . . . . . . . . . . . . . . . . . . . . 26.01
Score Rank
1 ENABLE . . . . . . . . . . . . . . . . . . . . . . . . . . . . . . . . . . . . . . . . . . .27.27 1271.1 Regulatory Landscape . . . . . . . . . . . . . . . . . . . . . . . . . . . . . . . . . . . . . . 28.00 1211.1.1 Government effectiveness . . . . . . . . . . . . . . . . . . . . . . . . . . . . . . . . . . . .24.90 1211.1.2 Rule of law . . . . . . . . . . . . . . . . . . . . . . . . . . . . . . . . . . . . . . . . . . . . . . . . . . . . 29.16 1201.1.3 Political stability . . . . . . . . . . . . . . . . . . . . . . . . . . . . . . . . . . . . . . . . . . . . . . .43.60 1151.1.4 Regulatory quality. . . . . . . . . . . . . . . . . . . . . . . . . . . . . . . . . . . . . . . . . . . . . 30.18 1141.1.5 Corruption . . . . . . . . . . . . . . . . . . . . . . . . . . . . . . . . . . . . . . . . . . . . . . . . . . . . 12.16 1251.2 Market Landscape . . . . . . . . . . . . . . . . . . . . . . . . . . . . . . . . . . . . . . . . . . 26.81 1241.2.1 Competition intensity . . . . . . . . . . . . . . . . . . . . . . . . . . . . . . . . . . . . . . . . . 45.92 1241.2.2 Ease of doing business . . . . . . . . . . . . . . . . . . . . . . . . . . . . . . . . . . . . . . . .44.52 1101.2.3 Cluster development . . . . . . . . . . . . . . . . . . . . . . . . . . . . . . . . . . . . . . . . . . 26.14 1061.2.4 R&D expenditure . . . . . . . . . . . . . . . . . . . . . . . . . . . . . . . . . . . . . . . . . . . . . . . 7.08 761.2.5 ICT infrastructure. . . . . . . . . . . . . . . . . . . . . . . . . . . . . . . . . . . . . . . . . . . . . . 10.81 1211.2.6 Urban population . . . . . . . . . . . . . . . . . . . . . . . . . . . . . . . . . . . . . . . . . . . . .26.40 1141.3 Business and Labour Landscape . . . . . . . . . . . . . . . . . . . . . . . . . . . . 26.99 121
Labour Market1.3.1 Tertiary-educated unemployment . . . . . . . . . . . . . . . . . . . . . . . . . . . .75.87 791.3.2 Active labour market policies . . . . . . . . . . . . . . . . . . . . . . . . . . . . . . . . . 12.10 1221.3.3 Labour-employer cooperation . . . . . . . . . . . . . . . . . . . . . . . . . . . . . . . .10.77 123
Management Practice1.3.4 Professional management . . . . . . . . . . . . . . . . . . . . . . . . . . . . . . . . . . . .20.31 1281.3.5 Relationship of pay to productivity . . . . . . . . . . . . . . . . . . . . . . . . . . . .16.25 129
Technology Adoption1.3.6 Technology utilisation. . . . . . . . . . . . . . . . . . . . . . . . . . . . . . . . . . . . . . . . . 27.61 1161.3.7 Investment in emerging technologies . . . . . . . . . . . . . . . . . . . . . . . .26.00 1051.3.8 Robot density . . . . . . . . . . . . . . . . . . . . . . . . . . . . . . . . . . . . . . . . . . . . . . . . . . .n/a n/a
2 ATTRACT . . . . . . . . . . . . . . . . . . . . . . . . . . . . . . . . . . . . . . . . . .39.62 1092.1 External Openness . . . . . . . . . . . . . . . . . . . . . . . . . . . . . . . . . . . . . . . . . 32.03 105
Attract Business2.1.1 FDI and technology transfer . . . . . . . . . . . . . . . . . . . . . . . . . . . . . . . . . .45.77 972.1.2 Prevalence of foreign ownership . . . . . . . . . . . . . . . . . . . . . . . . . . . . . .53.35 84
Attract People2.1.3 Migrant stock . . . . . . . . . . . . . . . . . . . . . . . . . . . . . . . . . . . . . . . . . . . . . . . . .18.72 1032.1.4 International students . . . . . . . . . . . . . . . . . . . . . . . . . . . . . . . . . . . . . . . . . . 0.98 1022.1.5 Brain gain . . . . . . . . . . . . . . . . . . . . . . . . . . . . . . . . . . . . . . . . . . . . . . . . . . . . . 41.33 772.2 Internal Openness . . . . . . . . . . . . . . . . . . . . . . . . . . . . . . . . . . . . . . . . . . 47.22 103
Social Inclusion2.2.1 Tolerance of minorities . . . . . . . . . . . . . . . . . . . . . . . . . . . . . . . . . . . . . . . .48.89 602.2.2 Tolerance of immigrants . . . . . . . . . . . . . . . . . . . . . . . . . . . . . . . . . . . . . .71.23 382.2.3 Social mobility . . . . . . . . . . . . . . . . . . . . . . . . . . . . . . . . . . . . . . . . . . . . . . . . 35.71 125
Gender Equality2.2.4 Female graduates . . . . . . . . . . . . . . . . . . . . . . . . . . . . . . . . . . . . . . . . . . . . . 47.08 982.2.5 Gender development gap . . . . . . . . . . . . . . . . . . . . . . . . . . . . . . . . . . . .54.73 1092.2.6 Leadership opportunities for women . . . . . . . . . . . . . . . . . . . . . . . . .25.67 113
Score Rank
3 GROW . . . . . . . . . . . . . . . . . . . . . . . . . . . . . . . . . . . . . . . . . . . . . 17.98 1293.1 Formal Education . . . . . . . . . . . . . . . . . . . . . . . . . . . . . . . . . . . . . . . . . . . . 9.70 113
Enrolment3.1.1 Vocational enrolment . . . . . . . . . . . . . . . . . . . . . . . . . . . . . . . . . . . . . . . . .14.23 723.1.2 Tertiary enrolment . . . . . . . . . . . . . . . . . . . . . . . . . . . . . . . . . . . . . . . . . . . . . 4.91 115
Quality3.1.3 Tertiary education expenditure . . . . . . . . . . . . . . . . . . . . . . . . . . . . . . . 19.67 663.1.4 Reading, maths, and science . . . . . . . . . . . . . . . . . . . . . . . . . . . . . . . . . . . .n/a n/a3.1.5 University ranking . . . . . . . . . . . . . . . . . . . . . . . . . . . . . . . . . . . . . . . . . . . . . . 0.00 753.2 Lifelong Learning . . . . . . . . . . . . . . . . . . . . . . . . . . . . . . . . . . . . . . . . . . . 14.20 1303.2.1 Quality of management schools . . . . . . . . . . . . . . . . . . . . . . . . . . . . . . 11.57 1313.2.2 Prevalence of training in firms . . . . . . . . . . . . . . . . . . . . . . . . . . . . . . . . .22.82 783.2.3 Employee development . . . . . . . . . . . . . . . . . . . . . . . . . . . . . . . . . . . . . . . 8.20 1303.3 Access to Growth Opportunities . . . . . . . . . . . . . . . . . . . . . . . . . . . 30.03 123
Empowerment3.3.1 Delegation of authority . . . . . . . . . . . . . . . . . . . . . . . . . . . . . . . . . . . . . . . 20.16 1223.3.2 Personal rights . . . . . . . . . . . . . . . . . . . . . . . . . . . . . . . . . . . . . . . . . . . . . . . .58.08 90
Collaboration3.3.3 Use of virtual social networks . . . . . . . . . . . . . . . . . . . . . . . . . . . . . . . . . 45.31 1183.3.4 Use of virtual professional networks . . . . . . . . . . . . . . . . . . . . . . . . . . . 0.65 1163.3.5 Collaboration within organisations . . . . . . . . . . . . . . . . . . . . . . . . . . . . 27.24 1253.3.6 Collaboration across organisations . . . . . . . . . . . . . . . . . . . . . . . . . . . .28.77 97
4 RETAIN . . . . . . . . . . . . . . . . . . . . . . . . . . . . . . . . . . . . . . . . . . . .20.15 1264.1 Sustainability . . . . . . . . . . . . . . . . . . . . . . . . . . . . . . . . . . . . . . . . . . . . . . . 19.95 1194.1.1 Pension system . . . . . . . . . . . . . . . . . . . . . . . . . . . . . . . . . . . . . . . . . . . . . . . . 5.80 1034.1.2 Social protection . . . . . . . . . . . . . . . . . . . . . . . . . . . . . . . . . . . . . . . . . . . . . . 24.17 1104.1.3 Brain retention . . . . . . . . . . . . . . . . . . . . . . . . . . . . . . . . . . . . . . . . . . . . . . . .29.86 974.2 Lifestyle . . . . . . . . . . . . . . . . . . . . . . . . . . . . . . . . . . . . . . . . . . . . . . . . . . . . 20.36 1254.2.1 Environmental performance . . . . . . . . . . . . . . . . . . . . . . . . . . . . . . . . . . 31.57 1074.2.2 Personal safety . . . . . . . . . . . . . . . . . . . . . . . . . . . . . . . . . . . . . . . . . . . . . . . . 31.56 1074.2.3 Physician density . . . . . . . . . . . . . . . . . . . . . . . . . . . . . . . . . . . . . . . . . . . . . . . 0.58 1224.2.4 Sanitation . . . . . . . . . . . . . . . . . . . . . . . . . . . . . . . . . . . . . . . . . . . . . . . . . . . . . 17.74 124
5 VOCATIONAL AND TECHNICAL SKILLS . . . . . . . . . . . . .13.67 1315.1 Mid-Level Skills . . . . . . . . . . . . . . . . . . . . . . . . . . . . . . . . . . . . . . . . . . . . . . 5.66 1265.1.1 Workforce with secondary education . . . . . . . . . . . . . . . . . . . . . . . . . . 6.81 1205.1.2 Population with secondary education . . . . . . . . . . . . . . . . . . . . . . . . . 9.58 1055.1.3 Technicians and associate professionals . . . . . . . . . . . . . . . . . . . . . . . . 5.47 1215.1.4 Labour productivity per employee . . . . . . . . . . . . . . . . . . . . . . . . . . . . . 0.80 1085.2 Employability . . . . . . . . . . . . . . . . . . . . . . . . . . . . . . . . . . . . . . . . . . . . . . . 21.67 1305.2.1 Ease of finding skilled employees . . . . . . . . . . . . . . . . . . . . . . . . . . . . .33.36 1225.2.2 Relevance of education system to the economy . . . . . . . . . . . . . .20.71 1195.2.3 Skills matching with secondary education . . . . . . . . . . . . . . . . . . . .10.69 1305.2.4 Skills matching with tertiary education . . . . . . . . . . . . . . . . . . . . . . . . 21.93 129
6 GLOBAL KNOWLEDGE SKILLS . . . . . . . . . . . . . . . . . . . . . . 7.87 1276.1 High-Level Skills . . . . . . . . . . . . . . . . . . . . . . . . . . . . . . . . . . . . . . . . . . . . . 5.21 1306.1.1 Workforce with tertiary education . . . . . . . . . . . . . . . . . . . . . . . . . . . . . 2.20 1206.1.2 Population with tertiary education . . . . . . . . . . . . . . . . . . . . . . . . . . . . . 1.17 1076.1.3 Professionals . . . . . . . . . . . . . . . . . . . . . . . . . . . . . . . . . . . . . . . . . . . . . . . . . . . 4.46 1226.1.4 Researchers . . . . . . . . . . . . . . . . . . . . . . . . . . . . . . . . . . . . . . . . . . . . . . . . . . . . 0.38 966.1.5 Senior officials and managers . . . . . . . . . . . . . . . . . . . . . . . . . . . . . . . . . . 0.16 1276.1.6 Availability of scientists and engineers . . . . . . . . . . . . . . . . . . . . . . . .22.87 1246.2 Talent Impact . . . . . . . . . . . . . . . . . . . . . . . . . . . . . . . . . . . . . . . . . . . . . . . 10.53 1046.2.1 Innovation output . . . . . . . . . . . . . . . . . . . . . . . . . . . . . . . . . . . . . . . . . . . . 14.71 1116.2.2 High-value exports . . . . . . . . . . . . . . . . . . . . . . . . . . . . . . . . . . . . . . . . . . . . 16.79 666.2.3 New product entrepreneurial activity . . . . . . . . . . . . . . . . . . . . . . . . . . .n/a n/a6.2.4 New business density . . . . . . . . . . . . . . . . . . . . . . . . . . . . . . . . . . . . . . . . . . .n/a n/a6.2.5 Scientific journal articles . . . . . . . . . . . . . . . . . . . . . . . . . . . . . . . . . . . . . . . 0.10 127
l Mozambique l Income group average
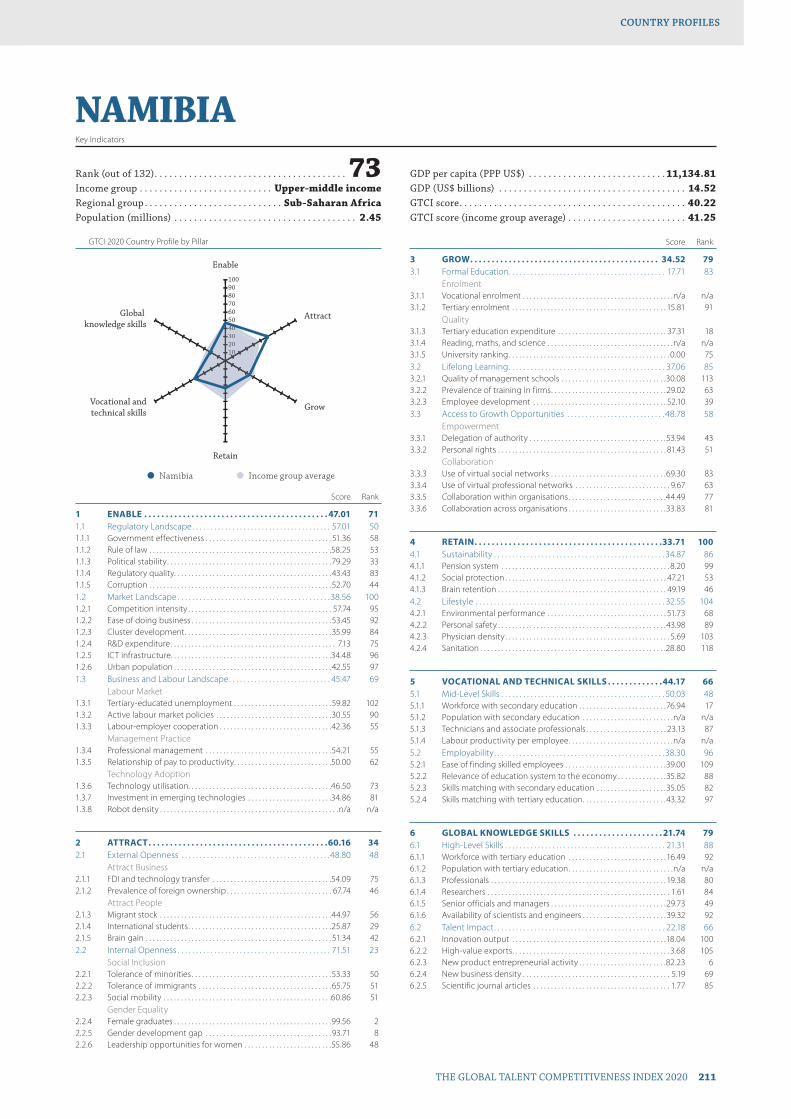
GTCI 2020 Country Profile by Pillar
THE GLOBAL TALENT COMPETITIVENESS INDEX 2020 211
COUNTRY PROFILESCOUNTRY PROFILES
102030405060708090100
Global knowledge skills
Vocational andtechnical skills
Retain
Grow
Attract
Enable
1020304040
NAMIBIAKey Indicators
Rank (out of 132) . . . . . . . . . . . . . . . . . . . . . . . . . . . . . . . . . . . . . . . 73Income group . . . . . . . . . . . . . . . . . . . . . . . . . . . Upper-middle incomeRegional group . . . . . . . . . . . . . . . . . . . . . . . . . . . . Sub-Saharan AfricaPopulation (millions) . . . . . . . . . . . . . . . . . . . . . . . . . . . . . . . . . . . . . 2.45
GDP per capita (PPP US$) . . . . . . . . . . . . . . . . . . . . . . . . . . . . 11,134.81GDP (US$ billions) . . . . . . . . . . . . . . . . . . . . . . . . . . . . . . . . . . . . . . 14.52GTCI score . . . . . . . . . . . . . . . . . . . . . . . . . . . . . . . . . . . . . . . . . . . . . . 40.22GTCI score (income group average) . . . . . . . . . . . . . . . . . . . . . . . . 41.25
Score Rank
1 ENABLE . . . . . . . . . . . . . . . . . . . . . . . . . . . . . . . . . . . . . . . . . . . 47.01 711.1 Regulatory Landscape . . . . . . . . . . . . . . . . . . . . . . . . . . . . . . . . . . . . . . 57.01 501.1.1 Government effectiveness . . . . . . . . . . . . . . . . . . . . . . . . . . . . . . . . . . . . 51.36 581.1.2 Rule of law . . . . . . . . . . . . . . . . . . . . . . . . . . . . . . . . . . . . . . . . . . . . . . . . . . . .58.25 531.1.3 Political stability . . . . . . . . . . . . . . . . . . . . . . . . . . . . . . . . . . . . . . . . . . . . . . .79.29 331.1.4 Regulatory quality. . . . . . . . . . . . . . . . . . . . . . . . . . . . . . . . . . . . . . . . . . . . . 43.43 831.1.5 Corruption . . . . . . . . . . . . . . . . . . . . . . . . . . . . . . . . . . . . . . . . . . . . . . . . . . . .52.70 441.2 Market Landscape . . . . . . . . . . . . . . . . . . . . . . . . . . . . . . . . . . . . . . . . . . 38.56 1001.2.1 Competition intensity . . . . . . . . . . . . . . . . . . . . . . . . . . . . . . . . . . . . . . . . . 57.74 951.2.2 Ease of doing business . . . . . . . . . . . . . . . . . . . . . . . . . . . . . . . . . . . . . . . .53.45 921.2.3 Cluster development . . . . . . . . . . . . . . . . . . . . . . . . . . . . . . . . . . . . . . . . . .35.99 841.2.4 R&D expenditure . . . . . . . . . . . . . . . . . . . . . . . . . . . . . . . . . . . . . . . . . . . . . . . 7.13 751.2.5 ICT infrastructure. . . . . . . . . . . . . . . . . . . . . . . . . . . . . . . . . . . . . . . . . . . . . .34.48 961.2.6 Urban population . . . . . . . . . . . . . . . . . . . . . . . . . . . . . . . . . . . . . . . . . . . . .42.55 971.3 Business and Labour Landscape . . . . . . . . . . . . . . . . . . . . . . . . . . . . 45.47 69
Labour Market1.3.1 Tertiary-educated unemployment . . . . . . . . . . . . . . . . . . . . . . . . . . . .59.82 1021.3.2 Active labour market policies . . . . . . . . . . . . . . . . . . . . . . . . . . . . . . . . .30.55 901.3.3 Labour-employer cooperation . . . . . . . . . . . . . . . . . . . . . . . . . . . . . . . .42.36 55
Management Practice1.3.4 Professional management . . . . . . . . . . . . . . . . . . . . . . . . . . . . . . . . . . . .54.21 551.3.5 Relationship of pay to productivity . . . . . . . . . . . . . . . . . . . . . . . . . . . .50.00 62
Technology Adoption1.3.6 Technology utilisation. . . . . . . . . . . . . . . . . . . . . . . . . . . . . . . . . . . . . . . . .46.50 731.3.7 Investment in emerging technologies . . . . . . . . . . . . . . . . . . . . . . . .34.86 811.3.8 Robot density . . . . . . . . . . . . . . . . . . . . . . . . . . . . . . . . . . . . . . . . . . . . . . . . . . .n/a n/a
2 ATTRACT . . . . . . . . . . . . . . . . . . . . . . . . . . . . . . . . . . . . . . . . . .60.16 342.1 External Openness . . . . . . . . . . . . . . . . . . . . . . . . . . . . . . . . . . . . . . . . .48.80 48
Attract Business2.1.1 FDI and technology transfer . . . . . . . . . . . . . . . . . . . . . . . . . . . . . . . . . .54.09 752.1.2 Prevalence of foreign ownership . . . . . . . . . . . . . . . . . . . . . . . . . . . . . . 67.74 46
Attract People2.1.3 Migrant stock . . . . . . . . . . . . . . . . . . . . . . . . . . . . . . . . . . . . . . . . . . . . . . . . .44.97 562.1.4 International students . . . . . . . . . . . . . . . . . . . . . . . . . . . . . . . . . . . . . . . . .25.87 292.1.5 Brain gain . . . . . . . . . . . . . . . . . . . . . . . . . . . . . . . . . . . . . . . . . . . . . . . . . . . . . 51.34 422.2 Internal Openness . . . . . . . . . . . . . . . . . . . . . . . . . . . . . . . . . . . . . . . . . . 71.51 23
Social Inclusion2.2.1 Tolerance of minorities . . . . . . . . . . . . . . . . . . . . . . . . . . . . . . . . . . . . . . . .53.33 502.2.2 Tolerance of immigrants . . . . . . . . . . . . . . . . . . . . . . . . . . . . . . . . . . . . . .65.75 512.2.3 Social mobility . . . . . . . . . . . . . . . . . . . . . . . . . . . . . . . . . . . . . . . . . . . . . . . .60.86 51
Gender Equality2.2.4 Female graduates . . . . . . . . . . . . . . . . . . . . . . . . . . . . . . . . . . . . . . . . . . . . .99.56 22.2.5 Gender development gap . . . . . . . . . . . . . . . . . . . . . . . . . . . . . . . . . . . . 93.71 82.2.6 Leadership opportunities for women . . . . . . . . . . . . . . . . . . . . . . . . .55.86 48
Score Rank
3 GROW . . . . . . . . . . . . . . . . . . . . . . . . . . . . . . . . . . . . . . . . . . . . 34.52 793.1 Formal Education . . . . . . . . . . . . . . . . . . . . . . . . . . . . . . . . . . . . . . . . . . . 17.71 83
Enrolment3.1.1 Vocational enrolment . . . . . . . . . . . . . . . . . . . . . . . . . . . . . . . . . . . . . . . . . . .n/a n/a3.1.2 Tertiary enrolment . . . . . . . . . . . . . . . . . . . . . . . . . . . . . . . . . . . . . . . . . . . . 15.81 91
Quality3.1.3 Tertiary education expenditure . . . . . . . . . . . . . . . . . . . . . . . . . . . . . . . 37.31 183.1.4 Reading, maths, and science . . . . . . . . . . . . . . . . . . . . . . . . . . . . . . . . . . . .n/a n/a3.1.5 University ranking . . . . . . . . . . . . . . . . . . . . . . . . . . . . . . . . . . . . . . . . . . . . . . 0.00 753.2 Lifelong Learning . . . . . . . . . . . . . . . . . . . . . . . . . . . . . . . . . . . . . . . . . . . 37.06 853.2.1 Quality of management schools . . . . . . . . . . . . . . . . . . . . . . . . . . . . . .30.08 1133.2.2 Prevalence of training in firms . . . . . . . . . . . . . . . . . . . . . . . . . . . . . . . . .29.02 633.2.3 Employee development . . . . . . . . . . . . . . . . . . . . . . . . . . . . . . . . . . . . . . 52.10 393.3 Access to Growth Opportunities . . . . . . . . . . . . . . . . . . . . . . . . . . . 48.78 58
Empowerment3.3.1 Delegation of authority . . . . . . . . . . . . . . . . . . . . . . . . . . . . . . . . . . . . . . .53.94 433.3.2 Personal rights . . . . . . . . . . . . . . . . . . . . . . . . . . . . . . . . . . . . . . . . . . . . . . . . 81.43 51
Collaboration3.3.3 Use of virtual social networks . . . . . . . . . . . . . . . . . . . . . . . . . . . . . . . . .69.30 833.3.4 Use of virtual professional networks . . . . . . . . . . . . . . . . . . . . . . . . . . . 9.67 633.3.5 Collaboration within organisations . . . . . . . . . . . . . . . . . . . . . . . . . . . .44.49 773.3.6 Collaboration across organisations . . . . . . . . . . . . . . . . . . . . . . . . . . . .33.83 81
4 RETAIN . . . . . . . . . . . . . . . . . . . . . . . . . . . . . . . . . . . . . . . . . . . .33.71 1004.1 Sustainability . . . . . . . . . . . . . . . . . . . . . . . . . . . . . . . . . . . . . . . . . . . . . . . 34.87 864.1.1 Pension system . . . . . . . . . . . . . . . . . . . . . . . . . . . . . . . . . . . . . . . . . . . . . . . . 8.20 994.1.2 Social protection . . . . . . . . . . . . . . . . . . . . . . . . . . . . . . . . . . . . . . . . . . . . . . 47.21 534.1.3 Brain retention . . . . . . . . . . . . . . . . . . . . . . . . . . . . . . . . . . . . . . . . . . . . . . . . 49.19 464.2 Lifestyle . . . . . . . . . . . . . . . . . . . . . . . . . . . . . . . . . . . . . . . . . . . . . . . . . . . . 32.55 1044.2.1 Environmental performance . . . . . . . . . . . . . . . . . . . . . . . . . . . . . . . . . . 51.73 684.2.2 Personal safety . . . . . . . . . . . . . . . . . . . . . . . . . . . . . . . . . . . . . . . . . . . . . . . .43.98 894.2.3 Physician density . . . . . . . . . . . . . . . . . . . . . . . . . . . . . . . . . . . . . . . . . . . . . . . 5.69 1034.2.4 Sanitation . . . . . . . . . . . . . . . . . . . . . . . . . . . . . . . . . . . . . . . . . . . . . . . . . . . . .28.80 118
5 VOCATIONAL AND TECHNICAL SKILLS . . . . . . . . . . . . .44.17 665.1 Mid-Level Skills . . . . . . . . . . . . . . . . . . . . . . . . . . . . . . . . . . . . . . . . . . . . . 50.03 485.1.1 Workforce with secondary education . . . . . . . . . . . . . . . . . . . . . . . . .76.94 175.1.2 Population with secondary education . . . . . . . . . . . . . . . . . . . . . . . . . .n/a n/a5.1.3 Technicians and associate professionals . . . . . . . . . . . . . . . . . . . . . . . 23.13 875.1.4 Labour productivity per employee . . . . . . . . . . . . . . . . . . . . . . . . . . . . . .n/a n/a5.2 Employability . . . . . . . . . . . . . . . . . . . . . . . . . . . . . . . . . . . . . . . . . . . . . . . 38.30 965.2.1 Ease of finding skilled employees . . . . . . . . . . . . . . . . . . . . . . . . . . . . .39.00 1095.2.2 Relevance of education system to the economy . . . . . . . . . . . . . .35.82 885.2.3 Skills matching with secondary education . . . . . . . . . . . . . . . . . . . .35.05 825.2.4 Skills matching with tertiary education . . . . . . . . . . . . . . . . . . . . . . . .43.32 97
6 GLOBAL KNOWLEDGE SKILLS . . . . . . . . . . . . . . . . . . . . . 21.74 796.1 High-Level Skills . . . . . . . . . . . . . . . . . . . . . . . . . . . . . . . . . . . . . . . . . . . . 21.31 886.1.1 Workforce with tertiary education . . . . . . . . . . . . . . . . . . . . . . . . . . . . 16.49 926.1.2 Population with tertiary education . . . . . . . . . . . . . . . . . . . . . . . . . . . . . .n/a n/a6.1.3 Professionals . . . . . . . . . . . . . . . . . . . . . . . . . . . . . . . . . . . . . . . . . . . . . . . . . . 19.38 806.1.4 Researchers . . . . . . . . . . . . . . . . . . . . . . . . . . . . . . . . . . . . . . . . . . . . . . . . . . . . 1.61 846.1.5 Senior officials and managers . . . . . . . . . . . . . . . . . . . . . . . . . . . . . . . . .29.73 496.1.6 Availability of scientists and engineers . . . . . . . . . . . . . . . . . . . . . . . . 39.32 926.2 Talent Impact . . . . . . . . . . . . . . . . . . . . . . . . . . . . . . . . . . . . . . . . . . . . . . . 22.18 666.2.1 Innovation output . . . . . . . . . . . . . . . . . . . . . . . . . . . . . . . . . . . . . . . . . . . .18.04 1006.2.2 High-value exports . . . . . . . . . . . . . . . . . . . . . . . . . . . . . . . . . . . . . . . . . . . . . 3.68 1056.2.3 New product entrepreneurial activity . . . . . . . . . . . . . . . . . . . . . . . . .82.23 66.2.4 New business density . . . . . . . . . . . . . . . . . . . . . . . . . . . . . . . . . . . . . . . . . . 5.19 696.2.5 Scientific journal articles . . . . . . . . . . . . . . . . . . . . . . . . . . . . . . . . . . . . . . . 1.77 85
l Namibia l Income group average
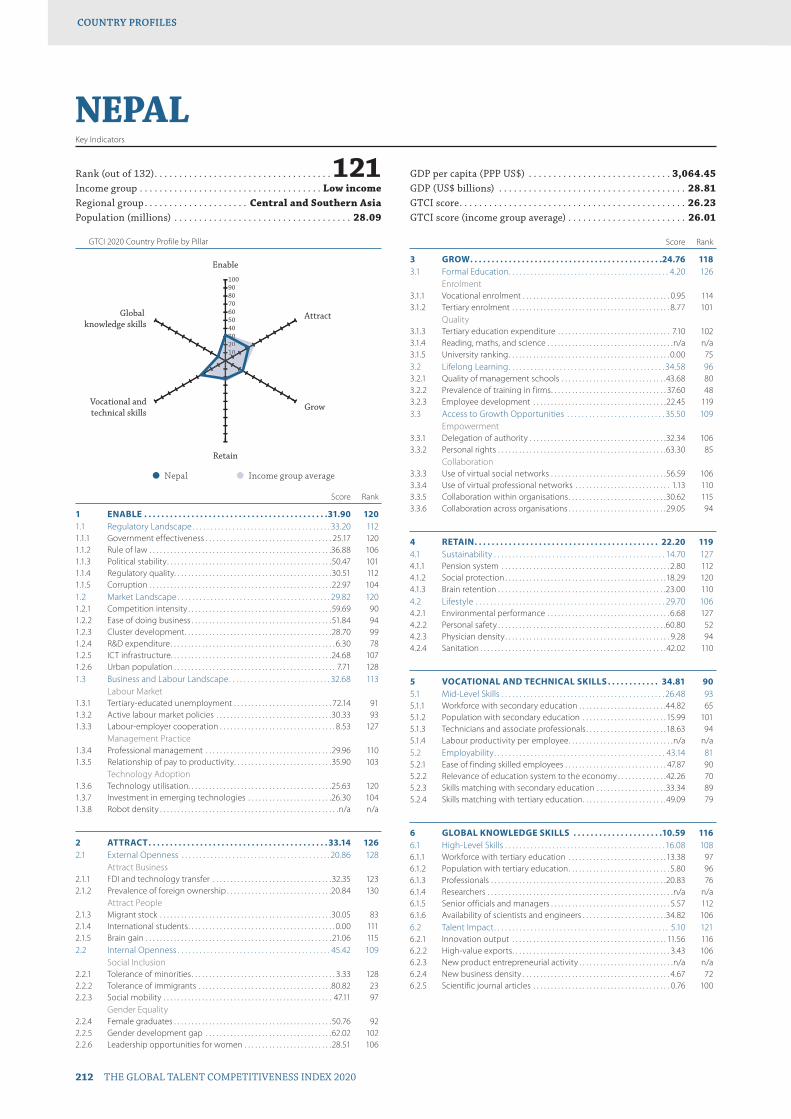
GTCI 2020 Country Profile by Pillar
212 THE GLOBAL TALENT COMPETITIVENESS INDEX 2020
COUNTRY PROFILESCOUNTRY PROFILES
102030405060708090100
Global knowledge skills
Vocational andtechnical skills
Retain
Grow
Attract
Enable
1020330
NEPALKey Indicators
Rank (out of 132) . . . . . . . . . . . . . . . . . . . . . . . . . . . . . . . . . . . .121Income group . . . . . . . . . . . . . . . . . . . . . . . . . . . . . . . . . . . . . Low incomeRegional group . . . . . . . . . . . . . . . . . . . . . Central and Southern AsiaPopulation (millions) . . . . . . . . . . . . . . . . . . . . . . . . . . . . . . . . . . . . 28.09
GDP per capita (PPP US$) . . . . . . . . . . . . . . . . . . . . . . . . . . . . . 3,064.45GDP (US$ billions) . . . . . . . . . . . . . . . . . . . . . . . . . . . . . . . . . . . . . . 28.81GTCI score . . . . . . . . . . . . . . . . . . . . . . . . . . . . . . . . . . . . . . . . . . . . . . 26.23GTCI score (income group average) . . . . . . . . . . . . . . . . . . . . . . . . 26.01
Score Rank
1 ENABLE . . . . . . . . . . . . . . . . . . . . . . . . . . . . . . . . . . . . . . . . . . .31.90 1201.1 Regulatory Landscape . . . . . . . . . . . . . . . . . . . . . . . . . . . . . . . . . . . . . . 33.20 1121.1.1 Government effectiveness . . . . . . . . . . . . . . . . . . . . . . . . . . . . . . . . . . . . 25.17 1201.1.2 Rule of law . . . . . . . . . . . . . . . . . . . . . . . . . . . . . . . . . . . . . . . . . . . . . . . . . . . .36.88 1061.1.3 Political stability . . . . . . . . . . . . . . . . . . . . . . . . . . . . . . . . . . . . . . . . . . . . . . .50.47 1011.1.4 Regulatory quality. . . . . . . . . . . . . . . . . . . . . . . . . . . . . . . . . . . . . . . . . . . . .30.51 1121.1.5 Corruption . . . . . . . . . . . . . . . . . . . . . . . . . . . . . . . . . . . . . . . . . . . . . . . . . . . .22.97 1041.2 Market Landscape . . . . . . . . . . . . . . . . . . . . . . . . . . . . . . . . . . . . . . . . . . 29.82 1201.2.1 Competition intensity . . . . . . . . . . . . . . . . . . . . . . . . . . . . . . . . . . . . . . . . .59.69 901.2.2 Ease of doing business . . . . . . . . . . . . . . . . . . . . . . . . . . . . . . . . . . . . . . . .51.84 941.2.3 Cluster development . . . . . . . . . . . . . . . . . . . . . . . . . . . . . . . . . . . . . . . . . .28.70 991.2.4 R&D expenditure . . . . . . . . . . . . . . . . . . . . . . . . . . . . . . . . . . . . . . . . . . . . . . . 6.30 781.2.5 ICT infrastructure. . . . . . . . . . . . . . . . . . . . . . . . . . . . . . . . . . . . . . . . . . . . . .24.68 1071.2.6 Urban population . . . . . . . . . . . . . . . . . . . . . . . . . . . . . . . . . . . . . . . . . . . . . . 7.71 1281.3 Business and Labour Landscape . . . . . . . . . . . . . . . . . . . . . . . . . . . . 32.68 113
Labour Market1.3.1 Tertiary-educated unemployment . . . . . . . . . . . . . . . . . . . . . . . . . . . . 72.14 911.3.2 Active labour market policies . . . . . . . . . . . . . . . . . . . . . . . . . . . . . . . . .30.33 931.3.3 Labour-employer cooperation . . . . . . . . . . . . . . . . . . . . . . . . . . . . . . . . . 8.53 127
Management Practice1.3.4 Professional management . . . . . . . . . . . . . . . . . . . . . . . . . . . . . . . . . . . .29.96 1101.3.5 Relationship of pay to productivity . . . . . . . . . . . . . . . . . . . . . . . . . . . .35.90 103
Technology Adoption1.3.6 Technology utilisation. . . . . . . . . . . . . . . . . . . . . . . . . . . . . . . . . . . . . . . . .25.63 1201.3.7 Investment in emerging technologies . . . . . . . . . . . . . . . . . . . . . . . .26.30 1041.3.8 Robot density . . . . . . . . . . . . . . . . . . . . . . . . . . . . . . . . . . . . . . . . . . . . . . . . . . .n/a n/a
2 ATTRACT . . . . . . . . . . . . . . . . . . . . . . . . . . . . . . . . . . . . . . . . . . 33.14 1262.1 External Openness . . . . . . . . . . . . . . . . . . . . . . . . . . . . . . . . . . . . . . . . . 20.86 128
Attract Business2.1.1 FDI and technology transfer . . . . . . . . . . . . . . . . . . . . . . . . . . . . . . . . . .32.35 1232.1.2 Prevalence of foreign ownership . . . . . . . . . . . . . . . . . . . . . . . . . . . . . .20.84 130
Attract People2.1.3 Migrant stock . . . . . . . . . . . . . . . . . . . . . . . . . . . . . . . . . . . . . . . . . . . . . . . . .30.05 832.1.4 International students . . . . . . . . . . . . . . . . . . . . . . . . . . . . . . . . . . . . . . . . . . 0.00 1112.1.5 Brain gain . . . . . . . . . . . . . . . . . . . . . . . . . . . . . . . . . . . . . . . . . . . . . . . . . . . . . 21.06 1152.2 Internal Openness . . . . . . . . . . . . . . . . . . . . . . . . . . . . . . . . . . . . . . . . . . 45.42 109
Social Inclusion2.2.1 Tolerance of minorities . . . . . . . . . . . . . . . . . . . . . . . . . . . . . . . . . . . . . . . . . 3.33 1282.2.2 Tolerance of immigrants . . . . . . . . . . . . . . . . . . . . . . . . . . . . . . . . . . . . . .80.82 232.2.3 Social mobility . . . . . . . . . . . . . . . . . . . . . . . . . . . . . . . . . . . . . . . . . . . . . . . . 47.11 97
Gender Equality2.2.4 Female graduates . . . . . . . . . . . . . . . . . . . . . . . . . . . . . . . . . . . . . . . . . . . . .50.76 922.2.5 Gender development gap . . . . . . . . . . . . . . . . . . . . . . . . . . . . . . . . . . . .62.02 1022.2.6 Leadership opportunities for women . . . . . . . . . . . . . . . . . . . . . . . . .28.51 106
Score Rank
3 GROW . . . . . . . . . . . . . . . . . . . . . . . . . . . . . . . . . . . . . . . . . . . . .24.76 1183.1 Formal Education . . . . . . . . . . . . . . . . . . . . . . . . . . . . . . . . . . . . . . . . . . . . 4.20 126
Enrolment3.1.1 Vocational enrolment . . . . . . . . . . . . . . . . . . . . . . . . . . . . . . . . . . . . . . . . . . 0.95 1143.1.2 Tertiary enrolment . . . . . . . . . . . . . . . . . . . . . . . . . . . . . . . . . . . . . . . . . . . . . 8.77 101
Quality3.1.3 Tertiary education expenditure . . . . . . . . . . . . . . . . . . . . . . . . . . . . . . . . 7.10 1023.1.4 Reading, maths, and science . . . . . . . . . . . . . . . . . . . . . . . . . . . . . . . . . . . .n/a n/a3.1.5 University ranking . . . . . . . . . . . . . . . . . . . . . . . . . . . . . . . . . . . . . . . . . . . . . . 0.00 753.2 Lifelong Learning . . . . . . . . . . . . . . . . . . . . . . . . . . . . . . . . . . . . . . . . . . . 34.58 963.2.1 Quality of management schools . . . . . . . . . . . . . . . . . . . . . . . . . . . . . .43.68 803.2.2 Prevalence of training in firms . . . . . . . . . . . . . . . . . . . . . . . . . . . . . . . . . 37.60 483.2.3 Employee development . . . . . . . . . . . . . . . . . . . . . . . . . . . . . . . . . . . . . .22.45 1193.3 Access to Growth Opportunities . . . . . . . . . . . . . . . . . . . . . . . . . . . 35.50 109
Empowerment3.3.1 Delegation of authority . . . . . . . . . . . . . . . . . . . . . . . . . . . . . . . . . . . . . . .32.34 1063.3.2 Personal rights . . . . . . . . . . . . . . . . . . . . . . . . . . . . . . . . . . . . . . . . . . . . . . . .63.30 85
Collaboration3.3.3 Use of virtual social networks . . . . . . . . . . . . . . . . . . . . . . . . . . . . . . . . .56.59 1063.3.4 Use of virtual professional networks . . . . . . . . . . . . . . . . . . . . . . . . . . . 1.13 1103.3.5 Collaboration within organisations . . . . . . . . . . . . . . . . . . . . . . . . . . . .30.62 1153.3.6 Collaboration across organisations . . . . . . . . . . . . . . . . . . . . . . . . . . . .29.05 94
4 RETAIN . . . . . . . . . . . . . . . . . . . . . . . . . . . . . . . . . . . . . . . . . . . 22.20 1194.1 Sustainability . . . . . . . . . . . . . . . . . . . . . . . . . . . . . . . . . . . . . . . . . . . . . . . 14.70 1274.1.1 Pension system . . . . . . . . . . . . . . . . . . . . . . . . . . . . . . . . . . . . . . . . . . . . . . . . 2.80 1124.1.2 Social protection . . . . . . . . . . . . . . . . . . . . . . . . . . . . . . . . . . . . . . . . . . . . . .18.29 1204.1.3 Brain retention . . . . . . . . . . . . . . . . . . . . . . . . . . . . . . . . . . . . . . . . . . . . . . . .23.00 1104.2 Lifestyle . . . . . . . . . . . . . . . . . . . . . . . . . . . . . . . . . . . . . . . . . . . . . . . . . . . . 29.70 1064.2.1 Environmental performance . . . . . . . . . . . . . . . . . . . . . . . . . . . . . . . . . . . 6.68 1274.2.2 Personal safety . . . . . . . . . . . . . . . . . . . . . . . . . . . . . . . . . . . . . . . . . . . . . . . .60.80 524.2.3 Physician density . . . . . . . . . . . . . . . . . . . . . . . . . . . . . . . . . . . . . . . . . . . . . . . 9.28 944.2.4 Sanitation . . . . . . . . . . . . . . . . . . . . . . . . . . . . . . . . . . . . . . . . . . . . . . . . . . . . .42.02 110
5 VOCATIONAL AND TECHNICAL SKILLS . . . . . . . . . . . . 34.81 905.1 Mid-Level Skills . . . . . . . . . . . . . . . . . . . . . . . . . . . . . . . . . . . . . . . . . . . . . 26.48 935.1.1 Workforce with secondary education . . . . . . . . . . . . . . . . . . . . . . . . .44.82 655.1.2 Population with secondary education . . . . . . . . . . . . . . . . . . . . . . . . 15.99 1015.1.3 Technicians and associate professionals . . . . . . . . . . . . . . . . . . . . . . .18.63 945.1.4 Labour productivity per employee . . . . . . . . . . . . . . . . . . . . . . . . . . . . . .n/a n/a5.2 Employability . . . . . . . . . . . . . . . . . . . . . . . . . . . . . . . . . . . . . . . . . . . . . . . 43.14 815.2.1 Ease of finding skilled employees . . . . . . . . . . . . . . . . . . . . . . . . . . . . . 47.87 905.2.2 Relevance of education system to the economy . . . . . . . . . . . . . .42.26 705.2.3 Skills matching with secondary education . . . . . . . . . . . . . . . . . . . .33.34 895.2.4 Skills matching with tertiary education . . . . . . . . . . . . . . . . . . . . . . . .49.09 79
6 GLOBAL KNOWLEDGE SKILLS . . . . . . . . . . . . . . . . . . . . .10.59 1166.1 High-Level Skills . . . . . . . . . . . . . . . . . . . . . . . . . . . . . . . . . . . . . . . . . . . . 16.08 1086.1.1 Workforce with tertiary education . . . . . . . . . . . . . . . . . . . . . . . . . . . . 13.38 976.1.2 Population with tertiary education . . . . . . . . . . . . . . . . . . . . . . . . . . . . . 5.80 966.1.3 Professionals . . . . . . . . . . . . . . . . . . . . . . . . . . . . . . . . . . . . . . . . . . . . . . . . . .20.83 766.1.4 Researchers . . . . . . . . . . . . . . . . . . . . . . . . . . . . . . . . . . . . . . . . . . . . . . . . . . . . .n/a n/a6.1.5 Senior officials and managers . . . . . . . . . . . . . . . . . . . . . . . . . . . . . . . . . . 5.57 1126.1.6 Availability of scientists and engineers . . . . . . . . . . . . . . . . . . . . . . . .34.82 1066.2 Talent Impact . . . . . . . . . . . . . . . . . . . . . . . . . . . . . . . . . . . . . . . . . . . . . . . . 5.10 1216.2.1 Innovation output . . . . . . . . . . . . . . . . . . . . . . . . . . . . . . . . . . . . . . . . . . . . 11.56 1166.2.2 High-value exports . . . . . . . . . . . . . . . . . . . . . . . . . . . . . . . . . . . . . . . . . . . . . 3.43 1066.2.3 New product entrepreneurial activity . . . . . . . . . . . . . . . . . . . . . . . . . . .n/a n/a6.2.4 New business density . . . . . . . . . . . . . . . . . . . . . . . . . . . . . . . . . . . . . . . . . . 4.67 726.2.5 Scientific journal articles . . . . . . . . . . . . . . . . . . . . . . . . . . . . . . . . . . . . . . . 0.76 100
l Nepal l Income group average
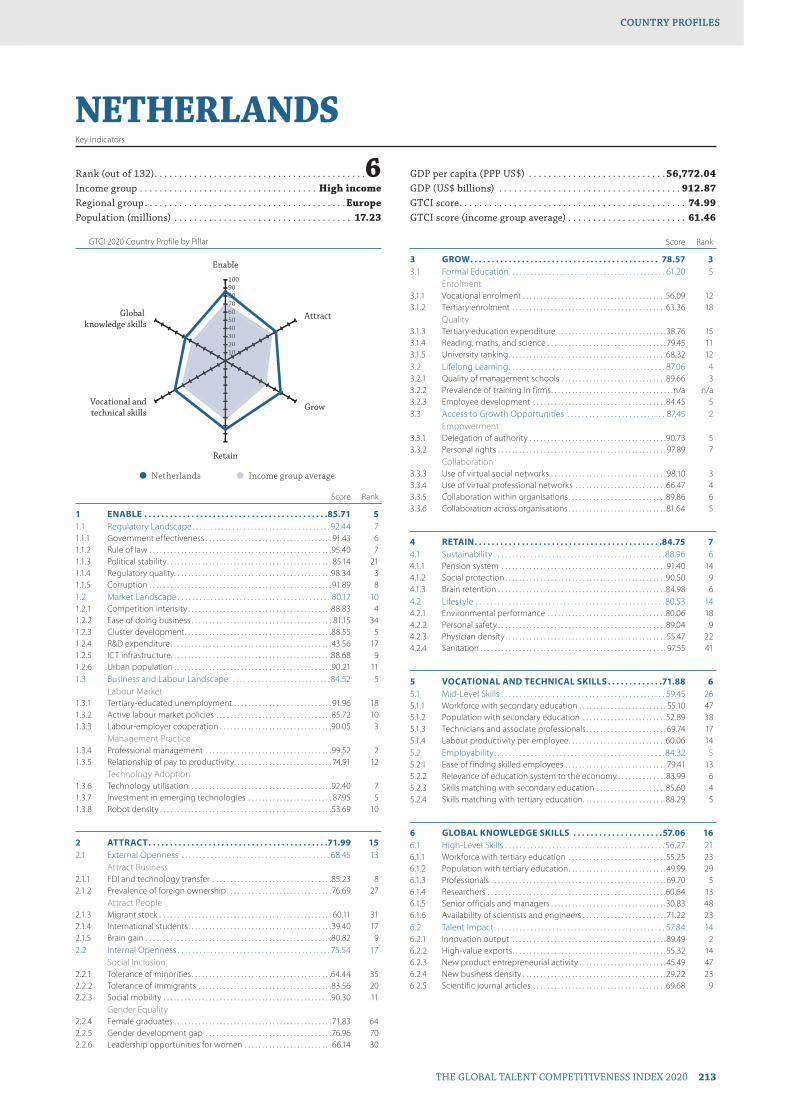
GTCI 2020 Country Profile by Pillar
THE GLOBAL TALENT COMPETITIVENESS INDEX 2020 213
COUNTRY PROFILESCOUNTRY PROFILES
102030405060708090100
Global knowledge skills
Vocational andtechnical skills
Retain
Grow
Attract
Enable
102030405060607
NETHERLANDSKey Indicators
Rank (out of 132) . . . . . . . . . . . . . . . . . . . . . . . . . . . . . . . . . . . . . . . . . . .6Income group . . . . . . . . . . . . . . . . . . . . . . . . . . . . . . . . . . . . High incomeRegional group . . . . . . . . . . . . . . . . . . . . . . . . . . . . . . . . . . . . . . . . .EuropePopulation (millions) . . . . . . . . . . . . . . . . . . . . . . . . . . . . . . . . . . . . 17.23
GDP per capita (PPP US$) . . . . . . . . . . . . . . . . . . . . . . . . . . . . 56,772.04GDP (US$ billions) . . . . . . . . . . . . . . . . . . . . . . . . . . . . . . . . . . . . . 912.87GTCI score . . . . . . . . . . . . . . . . . . . . . . . . . . . . . . . . . . . . . . . . . . . . . . 74.99GTCI score (income group average) . . . . . . . . . . . . . . . . . . . . . . . . 61.46
Score Rank
1 ENABLE . . . . . . . . . . . . . . . . . . . . . . . . . . . . . . . . . . . . . . . . . . .85.71 51.1 Regulatory Landscape . . . . . . . . . . . . . . . . . . . . . . . . . . . . . . . . . . . . . . 92.44 71.1.1 Government effectiveness . . . . . . . . . . . . . . . . . . . . . . . . . . . . . . . . . . . . 91.43 61.1.2 Rule of law . . . . . . . . . . . . . . . . . . . . . . . . . . . . . . . . . . . . . . . . . . . . . . . . . . . .95.40 71.1.3 Political stability . . . . . . . . . . . . . . . . . . . . . . . . . . . . . . . . . . . . . . . . . . . . . . . 85.14 211.1.4 Regulatory quality. . . . . . . . . . . . . . . . . . . . . . . . . . . . . . . . . . . . . . . . . . . . .98.34 31.1.5 Corruption . . . . . . . . . . . . . . . . . . . . . . . . . . . . . . . . . . . . . . . . . . . . . . . . . . . . 91.89 81.2 Market Landscape . . . . . . . . . . . . . . . . . . . . . . . . . . . . . . . . . . . . . . . . . . 80.17 101.2.1 Competition intensity . . . . . . . . . . . . . . . . . . . . . . . . . . . . . . . . . . . . . . . . .88.83 41.2.2 Ease of doing business . . . . . . . . . . . . . . . . . . . . . . . . . . . . . . . . . . . . . . . . 81.15 341.2.3 Cluster development . . . . . . . . . . . . . . . . . . . . . . . . . . . . . . . . . . . . . . . . . .88.55 51.2.4 R&D expenditure . . . . . . . . . . . . . . . . . . . . . . . . . . . . . . . . . . . . . . . . . . . . . .43.56 171.2.5 ICT infrastructure. . . . . . . . . . . . . . . . . . . . . . . . . . . . . . . . . . . . . . . . . . . . . .88.68 91.2.6 Urban population . . . . . . . . . . . . . . . . . . . . . . . . . . . . . . . . . . . . . . . . . . . . .90.21 111.3 Business and Labour Landscape . . . . . . . . . . . . . . . . . . . . . . . . . . . . 84.52 5
Labour Market1.3.1 Tertiary-educated unemployment . . . . . . . . . . . . . . . . . . . . . . . . . . . . 91.96 181.3.2 Active labour market policies . . . . . . . . . . . . . . . . . . . . . . . . . . . . . . . . .85.72 101.3.3 Labour-employer cooperation . . . . . . . . . . . . . . . . . . . . . . . . . . . . . . . .90.05 3
Management Practice1.3.4 Professional management . . . . . . . . . . . . . . . . . . . . . . . . . . . . . . . . . . . .99.52 21.3.5 Relationship of pay to productivity . . . . . . . . . . . . . . . . . . . . . . . . . . . . 74.91 12
Technology Adoption1.3.6 Technology utilisation. . . . . . . . . . . . . . . . . . . . . . . . . . . . . . . . . . . . . . . . .92.40 71.3.7 Investment in emerging technologies . . . . . . . . . . . . . . . . . . . . . . . . 87.95 51.3.8 Robot density . . . . . . . . . . . . . . . . . . . . . . . . . . . . . . . . . . . . . . . . . . . . . . . . .53.69 10
2 ATTRACT . . . . . . . . . . . . . . . . . . . . . . . . . . . . . . . . . . . . . . . . . .71.99 152.1 External Openness . . . . . . . . . . . . . . . . . . . . . . . . . . . . . . . . . . . . . . . . . 68.45 13
Attract Business2.1.1 FDI and technology transfer . . . . . . . . . . . . . . . . . . . . . . . . . . . . . . . . . .85.23 82.1.2 Prevalence of foreign ownership . . . . . . . . . . . . . . . . . . . . . . . . . . . . . .76.69 27
Attract People2.1.3 Migrant stock . . . . . . . . . . . . . . . . . . . . . . . . . . . . . . . . . . . . . . . . . . . . . . . . . 60.11 312.1.4 International students . . . . . . . . . . . . . . . . . . . . . . . . . . . . . . . . . . . . . . . . .39.40 172.1.5 Brain gain . . . . . . . . . . . . . . . . . . . . . . . . . . . . . . . . . . . . . . . . . . . . . . . . . . . . .80.82 92.2 Internal Openness . . . . . . . . . . . . . . . . . . . . . . . . . . . . . . . . . . . . . . . . . . 75.54 17
Social Inclusion2.2.1 Tolerance of minorities . . . . . . . . . . . . . . . . . . . . . . . . . . . . . . . . . . . . . . . .64.44 352.2.2 Tolerance of immigrants . . . . . . . . . . . . . . . . . . . . . . . . . . . . . . . . . . . . . .83.56 202.2.3 Social mobility . . . . . . . . . . . . . . . . . . . . . . . . . . . . . . . . . . . . . . . . . . . . . . . .90.30 11
Gender Equality2.2.4 Female graduates . . . . . . . . . . . . . . . . . . . . . . . . . . . . . . . . . . . . . . . . . . . . . 71.83 642.2.5 Gender development gap . . . . . . . . . . . . . . . . . . . . . . . . . . . . . . . . . . . .76.96 702.2.6 Leadership opportunities for women . . . . . . . . . . . . . . . . . . . . . . . . . 66.14 30
Score Rank
3 GROW . . . . . . . . . . . . . . . . . . . . . . . . . . . . . . . . . . . . . . . . . . . . 78.57 33.1 Formal Education . . . . . . . . . . . . . . . . . . . . . . . . . . . . . . . . . . . . . . . . . . . 61.20 5
Enrolment3.1.1 Vocational enrolment . . . . . . . . . . . . . . . . . . . . . . . . . . . . . . . . . . . . . . . . .56.09 123.1.2 Tertiary enrolment . . . . . . . . . . . . . . . . . . . . . . . . . . . . . . . . . . . . . . . . . . . .63.36 18
Quality3.1.3 Tertiary education expenditure . . . . . . . . . . . . . . . . . . . . . . . . . . . . . . .38.76 153.1.4 Reading, maths, and science . . . . . . . . . . . . . . . . . . . . . . . . . . . . . . . . . . 79.45 113.1.5 University ranking . . . . . . . . . . . . . . . . . . . . . . . . . . . . . . . . . . . . . . . . . . . . .68.32 123.2 Lifelong Learning . . . . . . . . . . . . . . . . . . . . . . . . . . . . . . . . . . . . . . . . . . . 87.06 43.2.1 Quality of management schools . . . . . . . . . . . . . . . . . . . . . . . . . . . . . .89.66 33.2.2 Prevalence of training in firms . . . . . . . . . . . . . . . . . . . . . . . . . . . . . . . . . . .n/a n/a3.2.3 Employee development . . . . . . . . . . . . . . . . . . . . . . . . . . . . . . . . . . . . . .84.45 53.3 Access to Growth Opportunities . . . . . . . . . . . . . . . . . . . . . . . . . . . 87.45 2
Empowerment3.3.1 Delegation of authority . . . . . . . . . . . . . . . . . . . . . . . . . . . . . . . . . . . . . . .90.73 53.3.2 Personal rights . . . . . . . . . . . . . . . . . . . . . . . . . . . . . . . . . . . . . . . . . . . . . . . . 97.89 7
Collaboration3.3.3 Use of virtual social networks . . . . . . . . . . . . . . . . . . . . . . . . . . . . . . . . . 98.10 33.3.4 Use of virtual professional networks . . . . . . . . . . . . . . . . . . . . . . . . . .66.47 43.3.5 Collaboration within organisations . . . . . . . . . . . . . . . . . . . . . . . . . . . .89.86 63.3.6 Collaboration across organisations . . . . . . . . . . . . . . . . . . . . . . . . . . . .81.64 5
4 RETAIN . . . . . . . . . . . . . . . . . . . . . . . . . . . . . . . . . . . . . . . . . . . .84.75 74.1 Sustainability . . . . . . . . . . . . . . . . . . . . . . . . . . . . . . . . . . . . . . . . . . . . . . . 88.96 64.1.1 Pension system . . . . . . . . . . . . . . . . . . . . . . . . . . . . . . . . . . . . . . . . . . . . . . . 91.40 144.1.2 Social protection . . . . . . . . . . . . . . . . . . . . . . . . . . . . . . . . . . . . . . . . . . . . . .90.50 94.1.3 Brain retention . . . . . . . . . . . . . . . . . . . . . . . . . . . . . . . . . . . . . . . . . . . . . . . .84.98 64.2 Lifestyle . . . . . . . . . . . . . . . . . . . . . . . . . . . . . . . . . . . . . . . . . . . . . . . . . . . . 80.53 144.2.1 Environmental performance . . . . . . . . . . . . . . . . . . . . . . . . . . . . . . . . . .80.06 184.2.2 Personal safety . . . . . . . . . . . . . . . . . . . . . . . . . . . . . . . . . . . . . . . . . . . . . . . .89.04 94.2.3 Physician density . . . . . . . . . . . . . . . . . . . . . . . . . . . . . . . . . . . . . . . . . . . . . . 55.47 224.2.4 Sanitation . . . . . . . . . . . . . . . . . . . . . . . . . . . . . . . . . . . . . . . . . . . . . . . . . . . . . 97.55 41
5 VOCATIONAL AND TECHNICAL SKILLS . . . . . . . . . . . . .71.88 65.1 Mid-Level Skills . . . . . . . . . . . . . . . . . . . . . . . . . . . . . . . . . . . . . . . . . . . . . 59.45 265.1.1 Workforce with secondary education . . . . . . . . . . . . . . . . . . . . . . . . . 55.10 475.1.2 Population with secondary education . . . . . . . . . . . . . . . . . . . . . . . .52.89 385.1.3 Technicians and associate professionals . . . . . . . . . . . . . . . . . . . . . . . 69.74 175.1.4 Labour productivity per employee . . . . . . . . . . . . . . . . . . . . . . . . . . . .60.06 145.2 Employability . . . . . . . . . . . . . . . . . . . . . . . . . . . . . . . . . . . . . . . . . . . . . . . 84.32 55.2.1 Ease of finding skilled employees . . . . . . . . . . . . . . . . . . . . . . . . . . . . . 79.41 135.2.2 Relevance of education system to the economy . . . . . . . . . . . . . .83.99 65.2.3 Skills matching with secondary education . . . . . . . . . . . . . . . . . . . .85.60 45.2.4 Skills matching with tertiary education . . . . . . . . . . . . . . . . . . . . . . . .88.29 5
6 GLOBAL KNOWLEDGE SKILLS . . . . . . . . . . . . . . . . . . . . .57.06 166.1 High-Level Skills . . . . . . . . . . . . . . . . . . . . . . . . . . . . . . . . . . . . . . . . . . . . 56.27 216.1.1 Workforce with tertiary education . . . . . . . . . . . . . . . . . . . . . . . . . . . .55.25 236.1.2 Population with tertiary education . . . . . . . . . . . . . . . . . . . . . . . . . . . .49.99 296.1.3 Professionals . . . . . . . . . . . . . . . . . . . . . . . . . . . . . . . . . . . . . . . . . . . . . . . . . . 69.70 56.1.4 Researchers . . . . . . . . . . . . . . . . . . . . . . . . . . . . . . . . . . . . . . . . . . . . . . . . . . .60.64 136.1.5 Senior officials and managers . . . . . . . . . . . . . . . . . . . . . . . . . . . . . . . . .30.83 486.1.6 Availability of scientists and engineers . . . . . . . . . . . . . . . . . . . . . . . .71.22 236.2 Talent Impact . . . . . . . . . . . . . . . . . . . . . . . . . . . . . . . . . . . . . . . . . . . . . . . 57.84 146.2.1 Innovation output . . . . . . . . . . . . . . . . . . . . . . . . . . . . . . . . . . . . . . . . . . . .89.49 26.2.2 High-value exports . . . . . . . . . . . . . . . . . . . . . . . . . . . . . . . . . . . . . . . . . . . .55.32 146.2.3 New product entrepreneurial activity . . . . . . . . . . . . . . . . . . . . . . . . .45.49 476.2.4 New business density . . . . . . . . . . . . . . . . . . . . . . . . . . . . . . . . . . . . . . . . .29.22 236.2.5 Scientific journal articles . . . . . . . . . . . . . . . . . . . . . . . . . . . . . . . . . . . . . .69.68 9
l Netherlands l Income group average
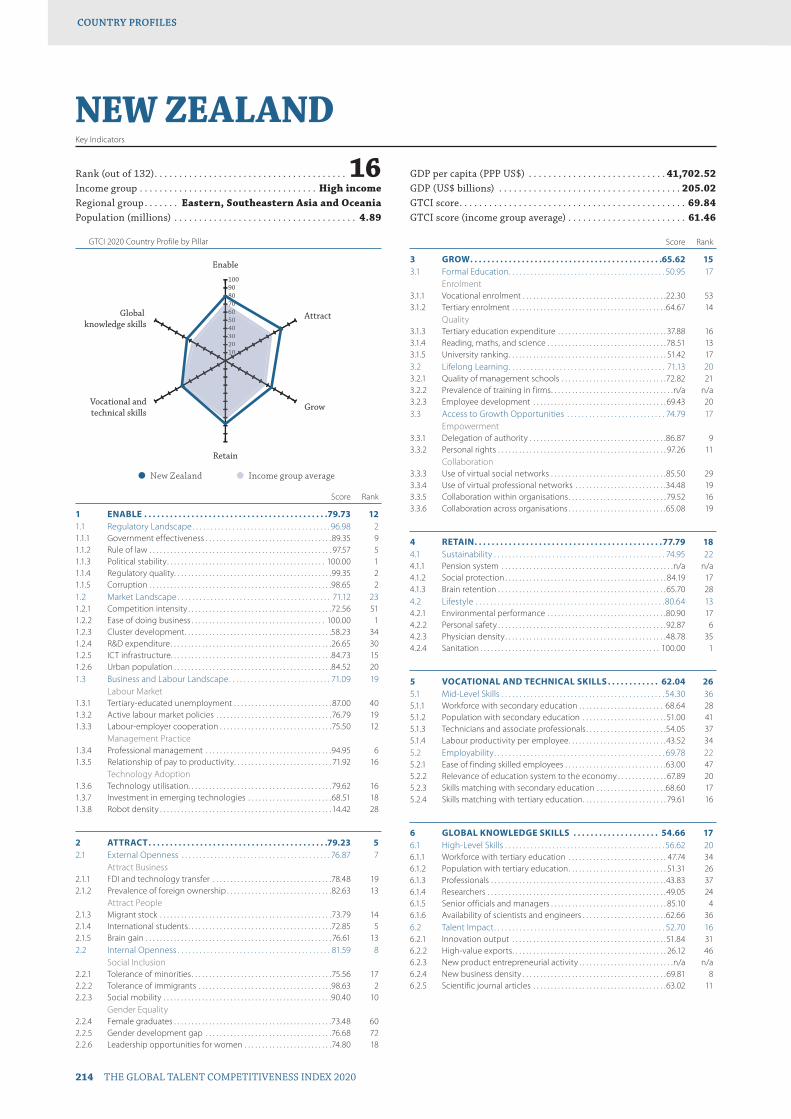
GTCI 2020 Country Profile by Pillar
214 THE GLOBAL TALENT COMPETITIVENESS INDEX 2020
COUNTRY PROFILESCOUNTRY PROFILES
102030405060708090100
Global knowledge skills
Vocational andtechnical skills
Retain
Grow
Attract
Enable
102030405060607
NEW ZEALANDKey Indicators
Rank (out of 132) . . . . . . . . . . . . . . . . . . . . . . . . . . . . . . . . . . . . . . . 16Income group . . . . . . . . . . . . . . . . . . . . . . . . . . . . . . . . . . . . High incomeRegional group . . . . . . . Eastern, Southeastern Asia and OceaniaPopulation (millions) . . . . . . . . . . . . . . . . . . . . . . . . . . . . . . . . . . . . . 4.89
GDP per capita (PPP US$) . . . . . . . . . . . . . . . . . . . . . . . . . . . . 41,702.52GDP (US$ billions) . . . . . . . . . . . . . . . . . . . . . . . . . . . . . . . . . . . . . 205.02GTCI score . . . . . . . . . . . . . . . . . . . . . . . . . . . . . . . . . . . . . . . . . . . . . . 69.84GTCI score (income group average) . . . . . . . . . . . . . . . . . . . . . . . . 61.46
Score Rank
1 ENABLE . . . . . . . . . . . . . . . . . . . . . . . . . . . . . . . . . . . . . . . . . . .79.73 121.1 Regulatory Landscape . . . . . . . . . . . . . . . . . . . . . . . . . . . . . . . . . . . . . . 96.98 21.1.1 Government effectiveness . . . . . . . . . . . . . . . . . . . . . . . . . . . . . . . . . . . .89.35 91.1.2 Rule of law . . . . . . . . . . . . . . . . . . . . . . . . . . . . . . . . . . . . . . . . . . . . . . . . . . . . 97.57 51.1.3 Political stability . . . . . . . . . . . . . . . . . . . . . . . . . . . . . . . . . . . . . . . . . . . . . 100.00 11.1.4 Regulatory quality. . . . . . . . . . . . . . . . . . . . . . . . . . . . . . . . . . . . . . . . . . . . .99.35 21.1.5 Corruption . . . . . . . . . . . . . . . . . . . . . . . . . . . . . . . . . . . . . . . . . . . . . . . . . . . .98.65 21.2 Market Landscape . . . . . . . . . . . . . . . . . . . . . . . . . . . . . . . . . . . . . . . . . . 71.12 231.2.1 Competition intensity . . . . . . . . . . . . . . . . . . . . . . . . . . . . . . . . . . . . . . . . .72.56 511.2.2 Ease of doing business . . . . . . . . . . . . . . . . . . . . . . . . . . . . . . . . . . . . . . 100.00 11.2.3 Cluster development . . . . . . . . . . . . . . . . . . . . . . . . . . . . . . . . . . . . . . . . . .58.23 341.2.4 R&D expenditure . . . . . . . . . . . . . . . . . . . . . . . . . . . . . . . . . . . . . . . . . . . . . .26.65 301.2.5 ICT infrastructure. . . . . . . . . . . . . . . . . . . . . . . . . . . . . . . . . . . . . . . . . . . . . .84.73 151.2.6 Urban population . . . . . . . . . . . . . . . . . . . . . . . . . . . . . . . . . . . . . . . . . . . . .84.52 201.3 Business and Labour Landscape . . . . . . . . . . . . . . . . . . . . . . . . . . . . 71.09 19
Labour Market1.3.1 Tertiary-educated unemployment . . . . . . . . . . . . . . . . . . . . . . . . . . . . 87.00 401.3.2 Active labour market policies . . . . . . . . . . . . . . . . . . . . . . . . . . . . . . . . .76.79 191.3.3 Labour-employer cooperation . . . . . . . . . . . . . . . . . . . . . . . . . . . . . . . .75.50 12
Management Practice1.3.4 Professional management . . . . . . . . . . . . . . . . . . . . . . . . . . . . . . . . . . . .94.95 61.3.5 Relationship of pay to productivity . . . . . . . . . . . . . . . . . . . . . . . . . . . . 71.92 16
Technology Adoption1.3.6 Technology utilisation. . . . . . . . . . . . . . . . . . . . . . . . . . . . . . . . . . . . . . . . .79.62 161.3.7 Investment in emerging technologies . . . . . . . . . . . . . . . . . . . . . . . .68.51 181.3.8 Robot density . . . . . . . . . . . . . . . . . . . . . . . . . . . . . . . . . . . . . . . . . . . . . . . . . 14.42 28
2 ATTRACT . . . . . . . . . . . . . . . . . . . . . . . . . . . . . . . . . . . . . . . . . .79.23 52.1 External Openness . . . . . . . . . . . . . . . . . . . . . . . . . . . . . . . . . . . . . . . . . 76.87 7
Attract Business2.1.1 FDI and technology transfer . . . . . . . . . . . . . . . . . . . . . . . . . . . . . . . . . .78.48 192.1.2 Prevalence of foreign ownership . . . . . . . . . . . . . . . . . . . . . . . . . . . . . .82.63 13
Attract People2.1.3 Migrant stock . . . . . . . . . . . . . . . . . . . . . . . . . . . . . . . . . . . . . . . . . . . . . . . . .73.79 142.1.4 International students . . . . . . . . . . . . . . . . . . . . . . . . . . . . . . . . . . . . . . . . .72.85 52.1.5 Brain gain . . . . . . . . . . . . . . . . . . . . . . . . . . . . . . . . . . . . . . . . . . . . . . . . . . . . . 76.61 132.2 Internal Openness . . . . . . . . . . . . . . . . . . . . . . . . . . . . . . . . . . . . . . . . . . 81.59 8
Social Inclusion2.2.1 Tolerance of minorities . . . . . . . . . . . . . . . . . . . . . . . . . . . . . . . . . . . . . . . .75.56 172.2.2 Tolerance of immigrants . . . . . . . . . . . . . . . . . . . . . . . . . . . . . . . . . . . . . .98.63 22.2.3 Social mobility . . . . . . . . . . . . . . . . . . . . . . . . . . . . . . . . . . . . . . . . . . . . . . . .90.40 10
Gender Equality2.2.4 Female graduates . . . . . . . . . . . . . . . . . . . . . . . . . . . . . . . . . . . . . . . . . . . . .73.48 602.2.5 Gender development gap . . . . . . . . . . . . . . . . . . . . . . . . . . . . . . . . . . . .76.68 722.2.6 Leadership opportunities for women . . . . . . . . . . . . . . . . . . . . . . . . .74.80 18
Score Rank
3 GROW . . . . . . . . . . . . . . . . . . . . . . . . . . . . . . . . . . . . . . . . . . . . .65.62 153.1 Formal Education . . . . . . . . . . . . . . . . . . . . . . . . . . . . . . . . . . . . . . . . . . . 50.95 17
Enrolment3.1.1 Vocational enrolment . . . . . . . . . . . . . . . . . . . . . . . . . . . . . . . . . . . . . . . . .22.30 533.1.2 Tertiary enrolment . . . . . . . . . . . . . . . . . . . . . . . . . . . . . . . . . . . . . . . . . . . .64.67 14
Quality3.1.3 Tertiary education expenditure . . . . . . . . . . . . . . . . . . . . . . . . . . . . . . . 37.88 163.1.4 Reading, maths, and science . . . . . . . . . . . . . . . . . . . . . . . . . . . . . . . . . .78.51 133.1.5 University ranking . . . . . . . . . . . . . . . . . . . . . . . . . . . . . . . . . . . . . . . . . . . . . 51.42 173.2 Lifelong Learning . . . . . . . . . . . . . . . . . . . . . . . . . . . . . . . . . . . . . . . . . . . 71.13 203.2.1 Quality of management schools . . . . . . . . . . . . . . . . . . . . . . . . . . . . . .72.82 213.2.2 Prevalence of training in firms . . . . . . . . . . . . . . . . . . . . . . . . . . . . . . . . . . .n/a n/a3.2.3 Employee development . . . . . . . . . . . . . . . . . . . . . . . . . . . . . . . . . . . . . . 69.43 203.3 Access to Growth Opportunities . . . . . . . . . . . . . . . . . . . . . . . . . . . 74.79 17
Empowerment3.3.1 Delegation of authority . . . . . . . . . . . . . . . . . . . . . . . . . . . . . . . . . . . . . . .86.87 93.3.2 Personal rights . . . . . . . . . . . . . . . . . . . . . . . . . . . . . . . . . . . . . . . . . . . . . . . . 97.26 11
Collaboration3.3.3 Use of virtual social networks . . . . . . . . . . . . . . . . . . . . . . . . . . . . . . . . .85.50 293.3.4 Use of virtual professional networks . . . . . . . . . . . . . . . . . . . . . . . . . .34.48 193.3.5 Collaboration within organisations . . . . . . . . . . . . . . . . . . . . . . . . . . . .79.52 163.3.6 Collaboration across organisations . . . . . . . . . . . . . . . . . . . . . . . . . . . .65.08 19
4 RETAIN . . . . . . . . . . . . . . . . . . . . . . . . . . . . . . . . . . . . . . . . . . . .77.79 184.1 Sustainability . . . . . . . . . . . . . . . . . . . . . . . . . . . . . . . . . . . . . . . . . . . . . . . 74.95 224.1.1 Pension system . . . . . . . . . . . . . . . . . . . . . . . . . . . . . . . . . . . . . . . . . . . . . . . . .n/a n/a4.1.2 Social protection . . . . . . . . . . . . . . . . . . . . . . . . . . . . . . . . . . . . . . . . . . . . . . 84.19 174.1.3 Brain retention . . . . . . . . . . . . . . . . . . . . . . . . . . . . . . . . . . . . . . . . . . . . . . . .65.70 284.2 Lifestyle . . . . . . . . . . . . . . . . . . . . . . . . . . . . . . . . . . . . . . . . . . . . . . . . . . . .80.64 134.2.1 Environmental performance . . . . . . . . . . . . . . . . . . . . . . . . . . . . . . . . . .80.90 174.2.2 Personal safety . . . . . . . . . . . . . . . . . . . . . . . . . . . . . . . . . . . . . . . . . . . . . . . .92.87 64.2.3 Physician density . . . . . . . . . . . . . . . . . . . . . . . . . . . . . . . . . . . . . . . . . . . . . .48.78 354.2.4 Sanitation . . . . . . . . . . . . . . . . . . . . . . . . . . . . . . . . . . . . . . . . . . . . . . . . . . . 100.00 1
5 VOCATIONAL AND TECHNICAL SKILLS . . . . . . . . . . . . 62.04 265.1 Mid-Level Skills . . . . . . . . . . . . . . . . . . . . . . . . . . . . . . . . . . . . . . . . . . . . . 54.30 365.1.1 Workforce with secondary education . . . . . . . . . . . . . . . . . . . . . . . . 68.64 285.1.2 Population with secondary education . . . . . . . . . . . . . . . . . . . . . . . . 51.00 415.1.3 Technicians and associate professionals . . . . . . . . . . . . . . . . . . . . . . .54.05 375.1.4 Labour productivity per employee . . . . . . . . . . . . . . . . . . . . . . . . . . . .43.52 345.2 Employability . . . . . . . . . . . . . . . . . . . . . . . . . . . . . . . . . . . . . . . . . . . . . . . 69.78 225.2.1 Ease of finding skilled employees . . . . . . . . . . . . . . . . . . . . . . . . . . . . .63.00 475.2.2 Relevance of education system to the economy . . . . . . . . . . . . . . 67.89 205.2.3 Skills matching with secondary education . . . . . . . . . . . . . . . . . . . .68.60 175.2.4 Skills matching with tertiary education . . . . . . . . . . . . . . . . . . . . . . . . 79.61 16
6 GLOBAL KNOWLEDGE SKILLS . . . . . . . . . . . . . . . . . . . . 54.66 176.1 High-Level Skills . . . . . . . . . . . . . . . . . . . . . . . . . . . . . . . . . . . . . . . . . . . . 56.62 206.1.1 Workforce with tertiary education . . . . . . . . . . . . . . . . . . . . . . . . . . . . 47.74 346.1.2 Population with tertiary education . . . . . . . . . . . . . . . . . . . . . . . . . . . . 51.31 266.1.3 Professionals . . . . . . . . . . . . . . . . . . . . . . . . . . . . . . . . . . . . . . . . . . . . . . . . . .43.83 376.1.4 Researchers . . . . . . . . . . . . . . . . . . . . . . . . . . . . . . . . . . . . . . . . . . . . . . . . . . .49.05 246.1.5 Senior officials and managers . . . . . . . . . . . . . . . . . . . . . . . . . . . . . . . . . 85.10 46.1.6 Availability of scientists and engineers . . . . . . . . . . . . . . . . . . . . . . . .62.66 366.2 Talent Impact . . . . . . . . . . . . . . . . . . . . . . . . . . . . . . . . . . . . . . . . . . . . . . . 52.70 166.2.1 Innovation output . . . . . . . . . . . . . . . . . . . . . . . . . . . . . . . . . . . . . . . . . . . .51.84 316.2.2 High-value exports . . . . . . . . . . . . . . . . . . . . . . . . . . . . . . . . . . . . . . . . . . . . 26.12 466.2.3 New product entrepreneurial activity . . . . . . . . . . . . . . . . . . . . . . . . . . .n/a n/a6.2.4 New business density . . . . . . . . . . . . . . . . . . . . . . . . . . . . . . . . . . . . . . . . .69.81 86.2.5 Scientific journal articles . . . . . . . . . . . . . . . . . . . . . . . . . . . . . . . . . . . . . .63.02 11
l New Zealand l Income group average
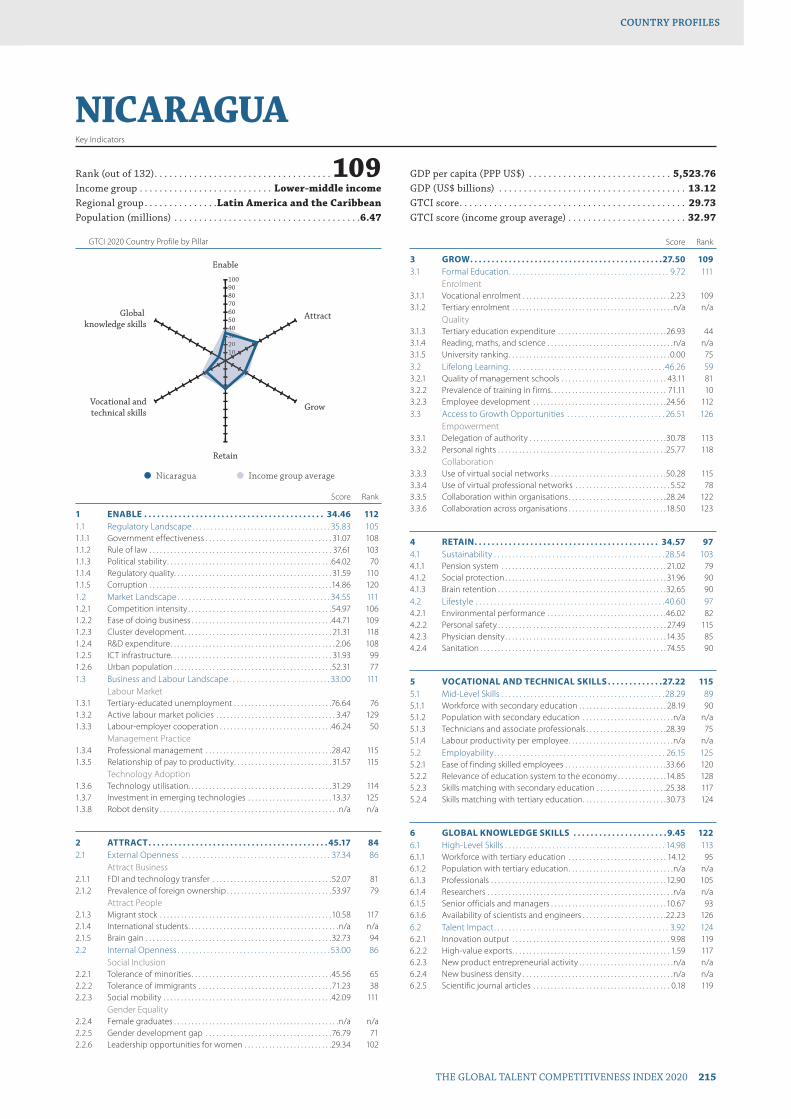
GTCI 2020 Country Profile by Pillar
THE GLOBAL TALENT COMPETITIVENESS INDEX 2020 215
COUNTRY PROFILESCOUNTRY PROFILES
102030405060708090100
Global knowledge skills
Vocational andtechnical skills
Retain
Grow
Attract
Enable
10203004
NICARAGUAKey Indicators
Rank (out of 132) . . . . . . . . . . . . . . . . . . . . . . . . . . . . . . . . . . . .109Income group . . . . . . . . . . . . . . . . . . . . . . . . . . . Lower-middle incomeRegional group . . . . . . . . . . . . . . .Latin America and the CaribbeanPopulation (millions) . . . . . . . . . . . . . . . . . . . . . . . . . . . . . . . . . . . . . .6.47
GDP per capita (PPP US$) . . . . . . . . . . . . . . . . . . . . . . . . . . . . . 5,523.76GDP (US$ billions) . . . . . . . . . . . . . . . . . . . . . . . . . . . . . . . . . . . . . . 13.12GTCI score . . . . . . . . . . . . . . . . . . . . . . . . . . . . . . . . . . . . . . . . . . . . . . 29.73GTCI score (income group average) . . . . . . . . . . . . . . . . . . . . . . . . 32.97
Score Rank
1 ENABLE . . . . . . . . . . . . . . . . . . . . . . . . . . . . . . . . . . . . . . . . . . 34.46 1121.1 Regulatory Landscape . . . . . . . . . . . . . . . . . . . . . . . . . . . . . . . . . . . . . . 35.83 1051.1.1 Government effectiveness . . . . . . . . . . . . . . . . . . . . . . . . . . . . . . . . . . . . 31.07 1081.1.2 Rule of law . . . . . . . . . . . . . . . . . . . . . . . . . . . . . . . . . . . . . . . . . . . . . . . . . . . . 37.61 1031.1.3 Political stability . . . . . . . . . . . . . . . . . . . . . . . . . . . . . . . . . . . . . . . . . . . . . . .64.02 701.1.4 Regulatory quality. . . . . . . . . . . . . . . . . . . . . . . . . . . . . . . . . . . . . . . . . . . . . 31.59 1101.1.5 Corruption . . . . . . . . . . . . . . . . . . . . . . . . . . . . . . . . . . . . . . . . . . . . . . . . . . . .14.86 1201.2 Market Landscape . . . . . . . . . . . . . . . . . . . . . . . . . . . . . . . . . . . . . . . . . . 34.55 1111.2.1 Competition intensity . . . . . . . . . . . . . . . . . . . . . . . . . . . . . . . . . . . . . . . . .54.97 1061.2.2 Ease of doing business . . . . . . . . . . . . . . . . . . . . . . . . . . . . . . . . . . . . . . . .44.71 1091.2.3 Cluster development . . . . . . . . . . . . . . . . . . . . . . . . . . . . . . . . . . . . . . . . . . 21.31 1181.2.4 R&D expenditure . . . . . . . . . . . . . . . . . . . . . . . . . . . . . . . . . . . . . . . . . . . . . . . 2.06 1081.2.5 ICT infrastructure. . . . . . . . . . . . . . . . . . . . . . . . . . . . . . . . . . . . . . . . . . . . . . 31.93 991.2.6 Urban population . . . . . . . . . . . . . . . . . . . . . . . . . . . . . . . . . . . . . . . . . . . . . 52.31 771.3 Business and Labour Landscape . . . . . . . . . . . . . . . . . . . . . . . . . . . . 33.00 111
Labour Market1.3.1 Tertiary-educated unemployment . . . . . . . . . . . . . . . . . . . . . . . . . . . .76.64 761.3.2 Active labour market policies . . . . . . . . . . . . . . . . . . . . . . . . . . . . . . . . . . 3.47 1291.3.3 Labour-employer cooperation . . . . . . . . . . . . . . . . . . . . . . . . . . . . . . . .46.24 50
Management Practice1.3.4 Professional management . . . . . . . . . . . . . . . . . . . . . . . . . . . . . . . . . . . .28.42 1151.3.5 Relationship of pay to productivity . . . . . . . . . . . . . . . . . . . . . . . . . . . . 31.57 115
Technology Adoption1.3.6 Technology utilisation. . . . . . . . . . . . . . . . . . . . . . . . . . . . . . . . . . . . . . . . . 31.29 1141.3.7 Investment in emerging technologies . . . . . . . . . . . . . . . . . . . . . . . . 13.37 1251.3.8 Robot density . . . . . . . . . . . . . . . . . . . . . . . . . . . . . . . . . . . . . . . . . . . . . . . . . . .n/a n/a
2 ATTRACT . . . . . . . . . . . . . . . . . . . . . . . . . . . . . . . . . . . . . . . . . . 45.17 842.1 External Openness . . . . . . . . . . . . . . . . . . . . . . . . . . . . . . . . . . . . . . . . . 37.34 86
Attract Business2.1.1 FDI and technology transfer . . . . . . . . . . . . . . . . . . . . . . . . . . . . . . . . . .52.07 812.1.2 Prevalence of foreign ownership . . . . . . . . . . . . . . . . . . . . . . . . . . . . . . 53.97 79
Attract People2.1.3 Migrant stock . . . . . . . . . . . . . . . . . . . . . . . . . . . . . . . . . . . . . . . . . . . . . . . . .10.58 1172.1.4 International students . . . . . . . . . . . . . . . . . . . . . . . . . . . . . . . . . . . . . . . . . . .n/a n/a2.1.5 Brain gain . . . . . . . . . . . . . . . . . . . . . . . . . . . . . . . . . . . . . . . . . . . . . . . . . . . . .32.73 942.2 Internal Openness . . . . . . . . . . . . . . . . . . . . . . . . . . . . . . . . . . . . . . . . . . 53.00 86
Social Inclusion2.2.1 Tolerance of minorities . . . . . . . . . . . . . . . . . . . . . . . . . . . . . . . . . . . . . . . .45.56 652.2.2 Tolerance of immigrants . . . . . . . . . . . . . . . . . . . . . . . . . . . . . . . . . . . . . .71.23 382.2.3 Social mobility . . . . . . . . . . . . . . . . . . . . . . . . . . . . . . . . . . . . . . . . . . . . . . . .42.09 111
Gender Equality2.2.4 Female graduates . . . . . . . . . . . . . . . . . . . . . . . . . . . . . . . . . . . . . . . . . . . . . . .n/a n/a2.2.5 Gender development gap . . . . . . . . . . . . . . . . . . . . . . . . . . . . . . . . . . . .76.79 712.2.6 Leadership opportunities for women . . . . . . . . . . . . . . . . . . . . . . . . .29.34 102
Score Rank
3 GROW . . . . . . . . . . . . . . . . . . . . . . . . . . . . . . . . . . . . . . . . . . . . .27.50 1093.1 Formal Education . . . . . . . . . . . . . . . . . . . . . . . . . . . . . . . . . . . . . . . . . . . . 9.72 111
Enrolment3.1.1 Vocational enrolment . . . . . . . . . . . . . . . . . . . . . . . . . . . . . . . . . . . . . . . . . . 2.23 1093.1.2 Tertiary enrolment . . . . . . . . . . . . . . . . . . . . . . . . . . . . . . . . . . . . . . . . . . . . . .n/a n/a
Quality3.1.3 Tertiary education expenditure . . . . . . . . . . . . . . . . . . . . . . . . . . . . . . .26.93 443.1.4 Reading, maths, and science . . . . . . . . . . . . . . . . . . . . . . . . . . . . . . . . . . . .n/a n/a3.1.5 University ranking . . . . . . . . . . . . . . . . . . . . . . . . . . . . . . . . . . . . . . . . . . . . . . 0.00 753.2 Lifelong Learning . . . . . . . . . . . . . . . . . . . . . . . . . . . . . . . . . . . . . . . . . . .46.26 593.2.1 Quality of management schools . . . . . . . . . . . . . . . . . . . . . . . . . . . . . . 43.11 813.2.2 Prevalence of training in firms . . . . . . . . . . . . . . . . . . . . . . . . . . . . . . . . . 71.11 103.2.3 Employee development . . . . . . . . . . . . . . . . . . . . . . . . . . . . . . . . . . . . . .24.56 1123.3 Access to Growth Opportunities . . . . . . . . . . . . . . . . . . . . . . . . . . . 26.51 126
Empowerment3.3.1 Delegation of authority . . . . . . . . . . . . . . . . . . . . . . . . . . . . . . . . . . . . . . .30.78 1133.3.2 Personal rights . . . . . . . . . . . . . . . . . . . . . . . . . . . . . . . . . . . . . . . . . . . . . . . .25.77 118
Collaboration3.3.3 Use of virtual social networks . . . . . . . . . . . . . . . . . . . . . . . . . . . . . . . . .50.28 1153.3.4 Use of virtual professional networks . . . . . . . . . . . . . . . . . . . . . . . . . . . 5.52 783.3.5 Collaboration within organisations . . . . . . . . . . . . . . . . . . . . . . . . . . . .28.24 1223.3.6 Collaboration across organisations . . . . . . . . . . . . . . . . . . . . . . . . . . . .18.50 123
4 RETAIN . . . . . . . . . . . . . . . . . . . . . . . . . . . . . . . . . . . . . . . . . . . 34.57 974.1 Sustainability . . . . . . . . . . . . . . . . . . . . . . . . . . . . . . . . . . . . . . . . . . . . . . . 28.54 1034.1.1 Pension system . . . . . . . . . . . . . . . . . . . . . . . . . . . . . . . . . . . . . . . . . . . . . . . 21.02 794.1.2 Social protection . . . . . . . . . . . . . . . . . . . . . . . . . . . . . . . . . . . . . . . . . . . . . . 31.96 904.1.3 Brain retention . . . . . . . . . . . . . . . . . . . . . . . . . . . . . . . . . . . . . . . . . . . . . . . .32.65 904.2 Lifestyle . . . . . . . . . . . . . . . . . . . . . . . . . . . . . . . . . . . . . . . . . . . . . . . . . . . .40.60 974.2.1 Environmental performance . . . . . . . . . . . . . . . . . . . . . . . . . . . . . . . . . .46.02 824.2.2 Personal safety . . . . . . . . . . . . . . . . . . . . . . . . . . . . . . . . . . . . . . . . . . . . . . . . 27.49 1154.2.3 Physician density . . . . . . . . . . . . . . . . . . . . . . . . . . . . . . . . . . . . . . . . . . . . . . 14.35 854.2.4 Sanitation . . . . . . . . . . . . . . . . . . . . . . . . . . . . . . . . . . . . . . . . . . . . . . . . . . . . . 74.55 90
5 VOCATIONAL AND TECHNICAL SKILLS . . . . . . . . . . . . .27.22 1155.1 Mid-Level Skills . . . . . . . . . . . . . . . . . . . . . . . . . . . . . . . . . . . . . . . . . . . . . 28.29 895.1.1 Workforce with secondary education . . . . . . . . . . . . . . . . . . . . . . . . . 28.19 905.1.2 Population with secondary education . . . . . . . . . . . . . . . . . . . . . . . . . .n/a n/a5.1.3 Technicians and associate professionals . . . . . . . . . . . . . . . . . . . . . . .28.39 755.1.4 Labour productivity per employee . . . . . . . . . . . . . . . . . . . . . . . . . . . . . .n/a n/a5.2 Employability . . . . . . . . . . . . . . . . . . . . . . . . . . . . . . . . . . . . . . . . . . . . . . . 26.15 1255.2.1 Ease of finding skilled employees . . . . . . . . . . . . . . . . . . . . . . . . . . . . .33.66 1205.2.2 Relevance of education system to the economy . . . . . . . . . . . . . .14.85 1285.2.3 Skills matching with secondary education . . . . . . . . . . . . . . . . . . . .25.38 1175.2.4 Skills matching with tertiary education . . . . . . . . . . . . . . . . . . . . . . . .30.73 124
6 GLOBAL KNOWLEDGE SKILLS . . . . . . . . . . . . . . . . . . . . . . 9.45 1226.1 High-Level Skills . . . . . . . . . . . . . . . . . . . . . . . . . . . . . . . . . . . . . . . . . . . . 14.98 1136.1.1 Workforce with tertiary education . . . . . . . . . . . . . . . . . . . . . . . . . . . . 14.12 956.1.2 Population with tertiary education . . . . . . . . . . . . . . . . . . . . . . . . . . . . . .n/a n/a6.1.3 Professionals . . . . . . . . . . . . . . . . . . . . . . . . . . . . . . . . . . . . . . . . . . . . . . . . . . 12.90 1056.1.4 Researchers . . . . . . . . . . . . . . . . . . . . . . . . . . . . . . . . . . . . . . . . . . . . . . . . . . . . .n/a n/a6.1.5 Senior officials and managers . . . . . . . . . . . . . . . . . . . . . . . . . . . . . . . . . 10.67 936.1.6 Availability of scientists and engineers . . . . . . . . . . . . . . . . . . . . . . . .22.23 1266.2 Talent Impact . . . . . . . . . . . . . . . . . . . . . . . . . . . . . . . . . . . . . . . . . . . . . . . . 3.92 1246.2.1 Innovation output . . . . . . . . . . . . . . . . . . . . . . . . . . . . . . . . . . . . . . . . . . . . . 9.98 1196.2.2 High-value exports . . . . . . . . . . . . . . . . . . . . . . . . . . . . . . . . . . . . . . . . . . . . . 1.59 1176.2.3 New product entrepreneurial activity . . . . . . . . . . . . . . . . . . . . . . . . . . .n/a n/a6.2.4 New business density . . . . . . . . . . . . . . . . . . . . . . . . . . . . . . . . . . . . . . . . . . .n/a n/a6.2.5 Scientific journal articles . . . . . . . . . . . . . . . . . . . . . . . . . . . . . . . . . . . . . . . 0.18 119
l Nicaragua l Income group average
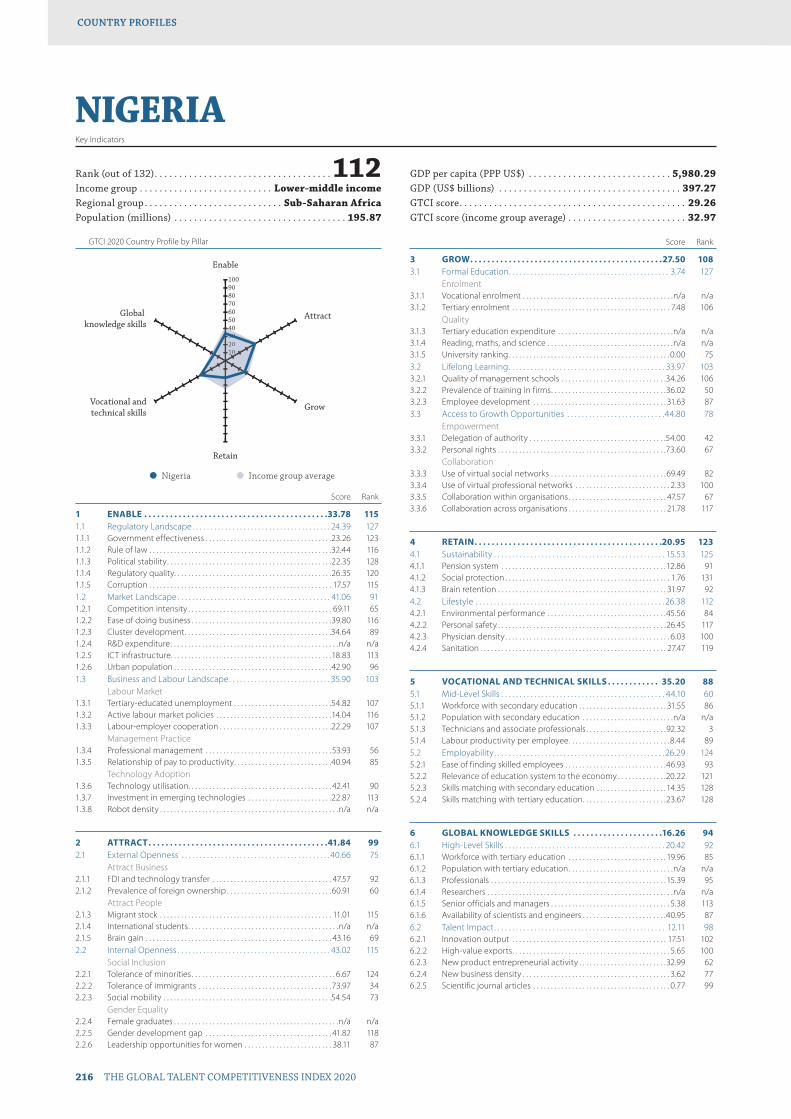
GTCI 2020 Country Profile by Pillar
216 THE GLOBAL TALENT COMPETITIVENESS INDEX 2020
COUNTRY PROFILESCOUNTRY PROFILES
102030405060708090100
Global knowledge skills
Vocational andtechnical skills
Retain
Grow
Attract
Enable
10203004
NIGERIAKey Indicators
Rank (out of 132) . . . . . . . . . . . . . . . . . . . . . . . . . . . . . . . . . . . .112Income group . . . . . . . . . . . . . . . . . . . . . . . . . . . Lower-middle incomeRegional group . . . . . . . . . . . . . . . . . . . . . . . . . . . . Sub-Saharan AfricaPopulation (millions) . . . . . . . . . . . . . . . . . . . . . . . . . . . . . . . . . . . 195.87
GDP per capita (PPP US$) . . . . . . . . . . . . . . . . . . . . . . . . . . . . . 5,980.29GDP (US$ billions) . . . . . . . . . . . . . . . . . . . . . . . . . . . . . . . . . . . . . 397.27GTCI score . . . . . . . . . . . . . . . . . . . . . . . . . . . . . . . . . . . . . . . . . . . . . . 29.26GTCI score (income group average) . . . . . . . . . . . . . . . . . . . . . . . . 32.97
Score Rank
1 ENABLE . . . . . . . . . . . . . . . . . . . . . . . . . . . . . . . . . . . . . . . . . . .33.78 1151.1 Regulatory Landscape . . . . . . . . . . . . . . . . . . . . . . . . . . . . . . . . . . . . . . 24.39 1271.1.1 Government effectiveness . . . . . . . . . . . . . . . . . . . . . . . . . . . . . . . . . . . .23.26 1231.1.2 Rule of law . . . . . . . . . . . . . . . . . . . . . . . . . . . . . . . . . . . . . . . . . . . . . . . . . . . .32.44 1161.1.3 Political stability . . . . . . . . . . . . . . . . . . . . . . . . . . . . . . . . . . . . . . . . . . . . . . .22.35 1281.1.4 Regulatory quality. . . . . . . . . . . . . . . . . . . . . . . . . . . . . . . . . . . . . . . . . . . . .26.35 1201.1.5 Corruption . . . . . . . . . . . . . . . . . . . . . . . . . . . . . . . . . . . . . . . . . . . . . . . . . . . . 17.57 1151.2 Market Landscape . . . . . . . . . . . . . . . . . . . . . . . . . . . . . . . . . . . . . . . . . . 41.06 911.2.1 Competition intensity . . . . . . . . . . . . . . . . . . . . . . . . . . . . . . . . . . . . . . . . . 69.11 651.2.2 Ease of doing business . . . . . . . . . . . . . . . . . . . . . . . . . . . . . . . . . . . . . . . .39.80 1161.2.3 Cluster development . . . . . . . . . . . . . . . . . . . . . . . . . . . . . . . . . . . . . . . . . .34.64 891.2.4 R&D expenditure . . . . . . . . . . . . . . . . . . . . . . . . . . . . . . . . . . . . . . . . . . . . . . . .n/a n/a1.2.5 ICT infrastructure. . . . . . . . . . . . . . . . . . . . . . . . . . . . . . . . . . . . . . . . . . . . . .18.83 1131.2.6 Urban population . . . . . . . . . . . . . . . . . . . . . . . . . . . . . . . . . . . . . . . . . . . . .42.90 961.3 Business and Labour Landscape . . . . . . . . . . . . . . . . . . . . . . . . . . . . 35.90 103
Labour Market1.3.1 Tertiary-educated unemployment . . . . . . . . . . . . . . . . . . . . . . . . . . . .54.82 1071.3.2 Active labour market policies . . . . . . . . . . . . . . . . . . . . . . . . . . . . . . . . .14.04 1161.3.3 Labour-employer cooperation . . . . . . . . . . . . . . . . . . . . . . . . . . . . . . . .22.29 107
Management Practice1.3.4 Professional management . . . . . . . . . . . . . . . . . . . . . . . . . . . . . . . . . . . . 53.93 561.3.5 Relationship of pay to productivity . . . . . . . . . . . . . . . . . . . . . . . . . . . .40.94 85
Technology Adoption1.3.6 Technology utilisation. . . . . . . . . . . . . . . . . . . . . . . . . . . . . . . . . . . . . . . . . 42.41 901.3.7 Investment in emerging technologies . . . . . . . . . . . . . . . . . . . . . . . .22.87 1131.3.8 Robot density . . . . . . . . . . . . . . . . . . . . . . . . . . . . . . . . . . . . . . . . . . . . . . . . . . .n/a n/a
2 ATTRACT . . . . . . . . . . . . . . . . . . . . . . . . . . . . . . . . . . . . . . . . . .41.84 992.1 External Openness . . . . . . . . . . . . . . . . . . . . . . . . . . . . . . . . . . . . . . . . .40.66 75
Attract Business2.1.1 FDI and technology transfer . . . . . . . . . . . . . . . . . . . . . . . . . . . . . . . . . . 47.57 922.1.2 Prevalence of foreign ownership . . . . . . . . . . . . . . . . . . . . . . . . . . . . . .60.91 60
Attract People2.1.3 Migrant stock . . . . . . . . . . . . . . . . . . . . . . . . . . . . . . . . . . . . . . . . . . . . . . . . . 11.01 1152.1.4 International students . . . . . . . . . . . . . . . . . . . . . . . . . . . . . . . . . . . . . . . . . . .n/a n/a2.1.5 Brain gain . . . . . . . . . . . . . . . . . . . . . . . . . . . . . . . . . . . . . . . . . . . . . . . . . . . . . 43.16 692.2 Internal Openness . . . . . . . . . . . . . . . . . . . . . . . . . . . . . . . . . . . . . . . . . . 43.02 115
Social Inclusion2.2.1 Tolerance of minorities . . . . . . . . . . . . . . . . . . . . . . . . . . . . . . . . . . . . . . . . . 6.67 1242.2.2 Tolerance of immigrants . . . . . . . . . . . . . . . . . . . . . . . . . . . . . . . . . . . . . .73.97 342.2.3 Social mobility . . . . . . . . . . . . . . . . . . . . . . . . . . . . . . . . . . . . . . . . . . . . . . . .54.54 73
Gender Equality2.2.4 Female graduates . . . . . . . . . . . . . . . . . . . . . . . . . . . . . . . . . . . . . . . . . . . . . . .n/a n/a2.2.5 Gender development gap . . . . . . . . . . . . . . . . . . . . . . . . . . . . . . . . . . . . 41.82 1182.2.6 Leadership opportunities for women . . . . . . . . . . . . . . . . . . . . . . . . . 38.11 87
Score Rank
3 GROW . . . . . . . . . . . . . . . . . . . . . . . . . . . . . . . . . . . . . . . . . . . . .27.50 1083.1 Formal Education . . . . . . . . . . . . . . . . . . . . . . . . . . . . . . . . . . . . . . . . . . . . 3.74 127
Enrolment3.1.1 Vocational enrolment . . . . . . . . . . . . . . . . . . . . . . . . . . . . . . . . . . . . . . . . . . .n/a n/a3.1.2 Tertiary enrolment . . . . . . . . . . . . . . . . . . . . . . . . . . . . . . . . . . . . . . . . . . . . . 7.48 106
Quality3.1.3 Tertiary education expenditure . . . . . . . . . . . . . . . . . . . . . . . . . . . . . . . . .n/a n/a3.1.4 Reading, maths, and science . . . . . . . . . . . . . . . . . . . . . . . . . . . . . . . . . . . .n/a n/a3.1.5 University ranking . . . . . . . . . . . . . . . . . . . . . . . . . . . . . . . . . . . . . . . . . . . . . . 0.00 753.2 Lifelong Learning . . . . . . . . . . . . . . . . . . . . . . . . . . . . . . . . . . . . . . . . . . . 33.97 1033.2.1 Quality of management schools . . . . . . . . . . . . . . . . . . . . . . . . . . . . . .34.26 1063.2.2 Prevalence of training in firms . . . . . . . . . . . . . . . . . . . . . . . . . . . . . . . . .36.02 503.2.3 Employee development . . . . . . . . . . . . . . . . . . . . . . . . . . . . . . . . . . . . . . 31.63 873.3 Access to Growth Opportunities . . . . . . . . . . . . . . . . . . . . . . . . . . .44.80 78
Empowerment3.3.1 Delegation of authority . . . . . . . . . . . . . . . . . . . . . . . . . . . . . . . . . . . . . . .54.00 423.3.2 Personal rights . . . . . . . . . . . . . . . . . . . . . . . . . . . . . . . . . . . . . . . . . . . . . . . .73.60 67
Collaboration3.3.3 Use of virtual social networks . . . . . . . . . . . . . . . . . . . . . . . . . . . . . . . . .69.49 823.3.4 Use of virtual professional networks . . . . . . . . . . . . . . . . . . . . . . . . . . . 2.33 1003.3.5 Collaboration within organisations . . . . . . . . . . . . . . . . . . . . . . . . . . . . 47.57 673.3.6 Collaboration across organisations . . . . . . . . . . . . . . . . . . . . . . . . . . . . 21.78 117
4 RETAIN . . . . . . . . . . . . . . . . . . . . . . . . . . . . . . . . . . . . . . . . . . . .20.95 1234.1 Sustainability . . . . . . . . . . . . . . . . . . . . . . . . . . . . . . . . . . . . . . . . . . . . . . . 15.53 1254.1.1 Pension system . . . . . . . . . . . . . . . . . . . . . . . . . . . . . . . . . . . . . . . . . . . . . . .12.86 914.1.2 Social protection . . . . . . . . . . . . . . . . . . . . . . . . . . . . . . . . . . . . . . . . . . . . . . . 1.76 1314.1.3 Brain retention . . . . . . . . . . . . . . . . . . . . . . . . . . . . . . . . . . . . . . . . . . . . . . . . 31.97 924.2 Lifestyle . . . . . . . . . . . . . . . . . . . . . . . . . . . . . . . . . . . . . . . . . . . . . . . . . . . . 26.38 1124.2.1 Environmental performance . . . . . . . . . . . . . . . . . . . . . . . . . . . . . . . . . .45.56 844.2.2 Personal safety . . . . . . . . . . . . . . . . . . . . . . . . . . . . . . . . . . . . . . . . . . . . . . . .26.45 1174.2.3 Physician density . . . . . . . . . . . . . . . . . . . . . . . . . . . . . . . . . . . . . . . . . . . . . . . 6.03 1004.2.4 Sanitation . . . . . . . . . . . . . . . . . . . . . . . . . . . . . . . . . . . . . . . . . . . . . . . . . . . . . 27.47 119
5 VOCATIONAL AND TECHNICAL SKILLS . . . . . . . . . . . . 35.20 885.1 Mid-Level Skills . . . . . . . . . . . . . . . . . . . . . . . . . . . . . . . . . . . . . . . . . . . . . 44.10 605.1.1 Workforce with secondary education . . . . . . . . . . . . . . . . . . . . . . . . . 31.55 865.1.2 Population with secondary education . . . . . . . . . . . . . . . . . . . . . . . . . .n/a n/a5.1.3 Technicians and associate professionals . . . . . . . . . . . . . . . . . . . . . . .92.32 35.1.4 Labour productivity per employee . . . . . . . . . . . . . . . . . . . . . . . . . . . . . 8.44 895.2 Employability . . . . . . . . . . . . . . . . . . . . . . . . . . . . . . . . . . . . . . . . . . . . . . . 26.29 1245.2.1 Ease of finding skilled employees . . . . . . . . . . . . . . . . . . . . . . . . . . . . .46.93 935.2.2 Relevance of education system to the economy . . . . . . . . . . . . . .20.22 1215.2.3 Skills matching with secondary education . . . . . . . . . . . . . . . . . . . . 14.35 1285.2.4 Skills matching with tertiary education . . . . . . . . . . . . . . . . . . . . . . . .23.67 128
6 GLOBAL KNOWLEDGE SKILLS . . . . . . . . . . . . . . . . . . . . .16.26 946.1 High-Level Skills . . . . . . . . . . . . . . . . . . . . . . . . . . . . . . . . . . . . . . . . . . . . 20.42 926.1.1 Workforce with tertiary education . . . . . . . . . . . . . . . . . . . . . . . . . . . . 19.96 856.1.2 Population with tertiary education . . . . . . . . . . . . . . . . . . . . . . . . . . . . . .n/a n/a6.1.3 Professionals . . . . . . . . . . . . . . . . . . . . . . . . . . . . . . . . . . . . . . . . . . . . . . . . . . 15.39 956.1.4 Researchers . . . . . . . . . . . . . . . . . . . . . . . . . . . . . . . . . . . . . . . . . . . . . . . . . . . . .n/a n/a6.1.5 Senior officials and managers . . . . . . . . . . . . . . . . . . . . . . . . . . . . . . . . . . 5.38 1136.1.6 Availability of scientists and engineers . . . . . . . . . . . . . . . . . . . . . . . .40.95 876.2 Talent Impact . . . . . . . . . . . . . . . . . . . . . . . . . . . . . . . . . . . . . . . . . . . . . . . 12.11 986.2.1 Innovation output . . . . . . . . . . . . . . . . . . . . . . . . . . . . . . . . . . . . . . . . . . . . 17.51 1026.2.2 High-value exports . . . . . . . . . . . . . . . . . . . . . . . . . . . . . . . . . . . . . . . . . . . . . 5.65 1006.2.3 New product entrepreneurial activity . . . . . . . . . . . . . . . . . . . . . . . . .32.99 626.2.4 New business density . . . . . . . . . . . . . . . . . . . . . . . . . . . . . . . . . . . . . . . . . . 3.62 776.2.5 Scientific journal articles . . . . . . . . . . . . . . . . . . . . . . . . . . . . . . . . . . . . . . . 0.77 99
l Nigeria l Income group average

GTCI 2020 Country Profile by Pillar
THE GLOBAL TALENT COMPETITIVENESS INDEX 2020 217
COUNTRY PROFILESCOUNTRY PROFILES
102030405060708090100
Global knowledge skills
Vocational andtechnical skills
Retain
Grow
Attract
Enable
1020304040
NORTH MACEDONIAKey Indicators
Rank (out of 132) . . . . . . . . . . . . . . . . . . . . . . . . . . . . . . . . . . . . . . . 89Income group . . . . . . . . . . . . . . . . . . . . . . . . . . . Upper-middle incomeRegional group . . . . . . . . . . . . . . . . . . . . . . . . . . . . . . . . . . . . . . . . .EuropePopulation (millions) . . . . . . . . . . . . . . . . . . . . . . . . . . . . . . . . . . . . . 2.08
GDP per capita (PPP US$) . . . . . . . . . . . . . . . . . . . . . . . . . . . .15,298.88GDP (US$ billions) . . . . . . . . . . . . . . . . . . . . . . . . . . . . . . . . . . . . . . 12.67GTCI score . . . . . . . . . . . . . . . . . . . . . . . . . . . . . . . . . . . . . . . . . . . . . . 36.42GTCI score (income group average) . . . . . . . . . . . . . . . . . . . . . . . . 41.25
Score Rank
1 ENABLE . . . . . . . . . . . . . . . . . . . . . . . . . . . . . . . . . . . . . . . . . . 43.06 861.1 Regulatory Landscape . . . . . . . . . . . . . . . . . . . . . . . . . . . . . . . . . . . . . . 49.61 641.1.1 Government effectiveness . . . . . . . . . . . . . . . . . . . . . . . . . . . . . . . . . . . . 49.93 641.1.2 Rule of law . . . . . . . . . . . . . . . . . . . . . . . . . . . . . . . . . . . . . . . . . . . . . . . . . . . . 47.01 751.1.3 Political stability . . . . . . . . . . . . . . . . . . . . . . . . . . . . . . . . . . . . . . . . . . . . . . . 59.55 781.1.4 Regulatory quality. . . . . . . . . . . . . . . . . . . . . . . . . . . . . . . . . . . . . . . . . . . . .60.48 441.1.5 Corruption . . . . . . . . . . . . . . . . . . . . . . . . . . . . . . . . . . . . . . . . . . . . . . . . . . . . 31.08 771.2 Market Landscape . . . . . . . . . . . . . . . . . . . . . . . . . . . . . . . . . . . . . . . . . . 49.79 671.2.1 Competition intensity . . . . . . . . . . . . . . . . . . . . . . . . . . . . . . . . . . . . . . . . .58.50 941.2.2 Ease of doing business . . . . . . . . . . . . . . . . . . . . . . . . . . . . . . . . . . . . . . . .91.00 91.2.3 Cluster development . . . . . . . . . . . . . . . . . . . . . . . . . . . . . . . . . . . . . . . . . .26.76 1051.2.4 R&D expenditure . . . . . . . . . . . . . . . . . . . . . . . . . . . . . . . . . . . . . . . . . . . . . . . 7.43 741.2.5 ICT infrastructure. . . . . . . . . . . . . . . . . . . . . . . . . . . . . . . . . . . . . . . . . . . . . .63.36 591.2.6 Urban population . . . . . . . . . . . . . . . . . . . . . . . . . . . . . . . . . . . . . . . . . . . . . 51.66 791.3 Business and Labour Landscape . . . . . . . . . . . . . . . . . . . . . . . . . . . . 29.79 119
Labour Market1.3.1 Tertiary-educated unemployment . . . . . . . . . . . . . . . . . . . . . . . . . . . . 41.14 1151.3.2 Active labour market policies . . . . . . . . . . . . . . . . . . . . . . . . . . . . . . . . .36.78 721.3.3 Labour-employer cooperation . . . . . . . . . . . . . . . . . . . . . . . . . . . . . . . . 11.04 120
Management Practice1.3.4 Professional management . . . . . . . . . . . . . . . . . . . . . . . . . . . . . . . . . . . . 28.18 1161.3.5 Relationship of pay to productivity . . . . . . . . . . . . . . . . . . . . . . . . . . . .40.78 86
Technology Adoption1.3.6 Technology utilisation. . . . . . . . . . . . . . . . . . . . . . . . . . . . . . . . . . . . . . . . . 33.16 1111.3.7 Investment in emerging technologies . . . . . . . . . . . . . . . . . . . . . . . . 17.45 1231.3.8 Robot density . . . . . . . . . . . . . . . . . . . . . . . . . . . . . . . . . . . . . . . . . . . . . . . . . . .n/a n/a
2 ATTRACT . . . . . . . . . . . . . . . . . . . . . . . . . . . . . . . . . . . . . . . . . 36.04 1172.1 External Openness . . . . . . . . . . . . . . . . . . . . . . . . . . . . . . . . . . . . . . . . . 29.75 112
Attract Business2.1.1 FDI and technology transfer . . . . . . . . . . . . . . . . . . . . . . . . . . . . . . . . . . 37.49 1162.1.2 Prevalence of foreign ownership . . . . . . . . . . . . . . . . . . . . . . . . . . . . . .42.09 106
Attract People2.1.3 Migrant stock . . . . . . . . . . . . . . . . . . . . . . . . . . . . . . . . . . . . . . . . . . . . . . . . .46.38 522.1.4 International students . . . . . . . . . . . . . . . . . . . . . . . . . . . . . . . . . . . . . . . . . 12.74 532.1.5 Brain gain . . . . . . . . . . . . . . . . . . . . . . . . . . . . . . . . . . . . . . . . . . . . . . . . . . . . . 10.03 1282.2 Internal Openness . . . . . . . . . . . . . . . . . . . . . . . . . . . . . . . . . . . . . . . . . . 42.32 117
Social Inclusion2.2.1 Tolerance of minorities . . . . . . . . . . . . . . . . . . . . . . . . . . . . . . . . . . . . . . . . 37.78 792.2.2 Tolerance of immigrants . . . . . . . . . . . . . . . . . . . . . . . . . . . . . . . . . . . . . .24.66 1132.2.3 Social mobility . . . . . . . . . . . . . . . . . . . . . . . . . . . . . . . . . . . . . . . . . . . . . . . . 29.41 128
Gender Equality2.2.4 Female graduates . . . . . . . . . . . . . . . . . . . . . . . . . . . . . . . . . . . . . . . . . . . . .73.93 592.2.5 Gender development gap . . . . . . . . . . . . . . . . . . . . . . . . . . . . . . . . . . . .69.64 872.2.6 Leadership opportunities for women . . . . . . . . . . . . . . . . . . . . . . . . .18.53 121
Score Rank
3 GROW . . . . . . . . . . . . . . . . . . . . . . . . . . . . . . . . . . . . . . . . . . . . .27.93 1073.1 Formal Education . . . . . . . . . . . . . . . . . . . . . . . . . . . . . . . . . . . . . . . . . . . 22.99 71
Enrolment3.1.1 Vocational enrolment . . . . . . . . . . . . . . . . . . . . . . . . . . . . . . . . . . . . . . . . . 45.75 193.1.2 Tertiary enrolment . . . . . . . . . . . . . . . . . . . . . . . . . . . . . . . . . . . . . . . . . . . . 32.14 68
Quality3.1.3 Tertiary education expenditure . . . . . . . . . . . . . . . . . . . . . . . . . . . . . . . . .n/a n/a3.1.4 Reading, maths, and science . . . . . . . . . . . . . . . . . . . . . . . . . . . . . . . . . .14.06 653.1.5 University ranking . . . . . . . . . . . . . . . . . . . . . . . . . . . . . . . . . . . . . . . . . . . . . . 0.00 753.2 Lifelong Learning . . . . . . . . . . . . . . . . . . . . . . . . . . . . . . . . . . . . . . . . . . . 15.07 1293.2.1 Quality of management schools . . . . . . . . . . . . . . . . . . . . . . . . . . . . . . 19.27 1273.2.2 Prevalence of training in firms . . . . . . . . . . . . . . . . . . . . . . . . . . . . . . . . . . .n/a n/a3.2.3 Employee development . . . . . . . . . . . . . . . . . . . . . . . . . . . . . . . . . . . . . .10.88 1283.3 Access to Growth Opportunities . . . . . . . . . . . . . . . . . . . . . . . . . . . 45.71 69
Empowerment3.3.1 Delegation of authority . . . . . . . . . . . . . . . . . . . . . . . . . . . . . . . . . . . . . . .29.44 1143.3.2 Personal rights . . . . . . . . . . . . . . . . . . . . . . . . . . . . . . . . . . . . . . . . . . . . . . . .68.47 77
Collaboration3.3.3 Use of virtual social networks . . . . . . . . . . . . . . . . . . . . . . . . . . . . . . . . . 81.14 433.3.4 Use of virtual professional networks . . . . . . . . . . . . . . . . . . . . . . . . . . . .n/a n/a3.3.5 Collaboration within organisations . . . . . . . . . . . . . . . . . . . . . . . . . . . .28.62 1203.3.6 Collaboration across organisations . . . . . . . . . . . . . . . . . . . . . . . . . . . . 20.91 119
4 RETAIN . . . . . . . . . . . . . . . . . . . . . . . . . . . . . . . . . . . . . . . . . . . 49.34 604.1 Sustainability . . . . . . . . . . . . . . . . . . . . . . . . . . . . . . . . . . . . . . . . . . . . . . . 36.22 794.1.1 Pension system . . . . . . . . . . . . . . . . . . . . . . . . . . . . . . . . . . . . . . . . . . . . . . .80.00 274.1.2 Social protection . . . . . . . . . . . . . . . . . . . . . . . . . . . . . . . . . . . . . . . . . . . . . .18.48 1194.1.3 Brain retention . . . . . . . . . . . . . . . . . . . . . . . . . . . . . . . . . . . . . . . . . . . . . . . . 10.18 1264.2 Lifestyle . . . . . . . . . . . . . . . . . . . . . . . . . . . . . . . . . . . . . . . . . . . . . . . . . . . . 62.47 494.2.1 Environmental performance . . . . . . . . . . . . . . . . . . . . . . . . . . . . . . . . . .56.06 604.2.2 Personal safety . . . . . . . . . . . . . . . . . . . . . . . . . . . . . . . . . . . . . . . . . . . . . . . . 57.79 614.2.3 Physician density . . . . . . . . . . . . . . . . . . . . . . . . . . . . . . . . . . . . . . . . . . . . . .45.80 404.2.4 Sanitation . . . . . . . . . . . . . . . . . . . . . . . . . . . . . . . . . . . . . . . . . . . . . . . . . . . . .90.22 70
5 VOCATIONAL AND TECHNICAL SKILLS . . . . . . . . . . . . . 39.15 795.1 Mid-Level Skills . . . . . . . . . . . . . . . . . . . . . . . . . . . . . . . . . . . . . . . . . . . . . 46.97 545.1.1 Workforce with secondary education . . . . . . . . . . . . . . . . . . . . . . . . .75.90 195.1.2 Population with secondary education . . . . . . . . . . . . . . . . . . . . . . . . . .n/a n/a5.1.3 Technicians and associate professionals . . . . . . . . . . . . . . . . . . . . . . .42.65 505.1.4 Labour productivity per employee . . . . . . . . . . . . . . . . . . . . . . . . . . . .22.36 655.2 Employability . . . . . . . . . . . . . . . . . . . . . . . . . . . . . . . . . . . . . . . . . . . . . . . 31.34 1195.2.1 Ease of finding skilled employees . . . . . . . . . . . . . . . . . . . . . . . . . . . . .32.80 1235.2.2 Relevance of education system to the economy . . . . . . . . . . . . . .25.45 1115.2.3 Skills matching with secondary education . . . . . . . . . . . . . . . . . . . .32.78 945.2.4 Skills matching with tertiary education . . . . . . . . . . . . . . . . . . . . . . . .34.32 120
6 GLOBAL KNOWLEDGE SKILLS . . . . . . . . . . . . . . . . . . . . 23.00 766.1 High-Level Skills . . . . . . . . . . . . . . . . . . . . . . . . . . . . . . . . . . . . . . . . . . . . 26.42 736.1.1 Workforce with tertiary education . . . . . . . . . . . . . . . . . . . . . . . . . . . .36.43 536.1.2 Population with tertiary education . . . . . . . . . . . . . . . . . . . . . . . . . . . . . .n/a n/a6.1.3 Professionals . . . . . . . . . . . . . . . . . . . . . . . . . . . . . . . . . . . . . . . . . . . . . . . . . .38.77 446.1.4 Researchers . . . . . . . . . . . . . . . . . . . . . . . . . . . . . . . . . . . . . . . . . . . . . . . . . . . . 8.72 556.1.5 Senior officials and managers . . . . . . . . . . . . . . . . . . . . . . . . . . . . . . . . .22.78 646.1.6 Availability of scientists and engineers . . . . . . . . . . . . . . . . . . . . . . . .25.42 1196.2 Talent Impact . . . . . . . . . . . . . . . . . . . . . . . . . . . . . . . . . . . . . . . . . . . . . . . 19.57 726.2.1 Innovation output . . . . . . . . . . . . . . . . . . . . . . . . . . . . . . . . . . . . . . . . . . . .32.40 626.2.2 High-value exports . . . . . . . . . . . . . . . . . . . . . . . . . . . . . . . . . . . . . . . . . . . .10.98 826.2.3 New product entrepreneurial activity . . . . . . . . . . . . . . . . . . . . . . . . .26.66 706.2.4 New business density . . . . . . . . . . . . . . . . . . . . . . . . . . . . . . . . . . . . . . . . .18.64 326.2.5 Scientific journal articles . . . . . . . . . . . . . . . . . . . . . . . . . . . . . . . . . . . . . . . 9.16 55
l North Macedonia l Income group average
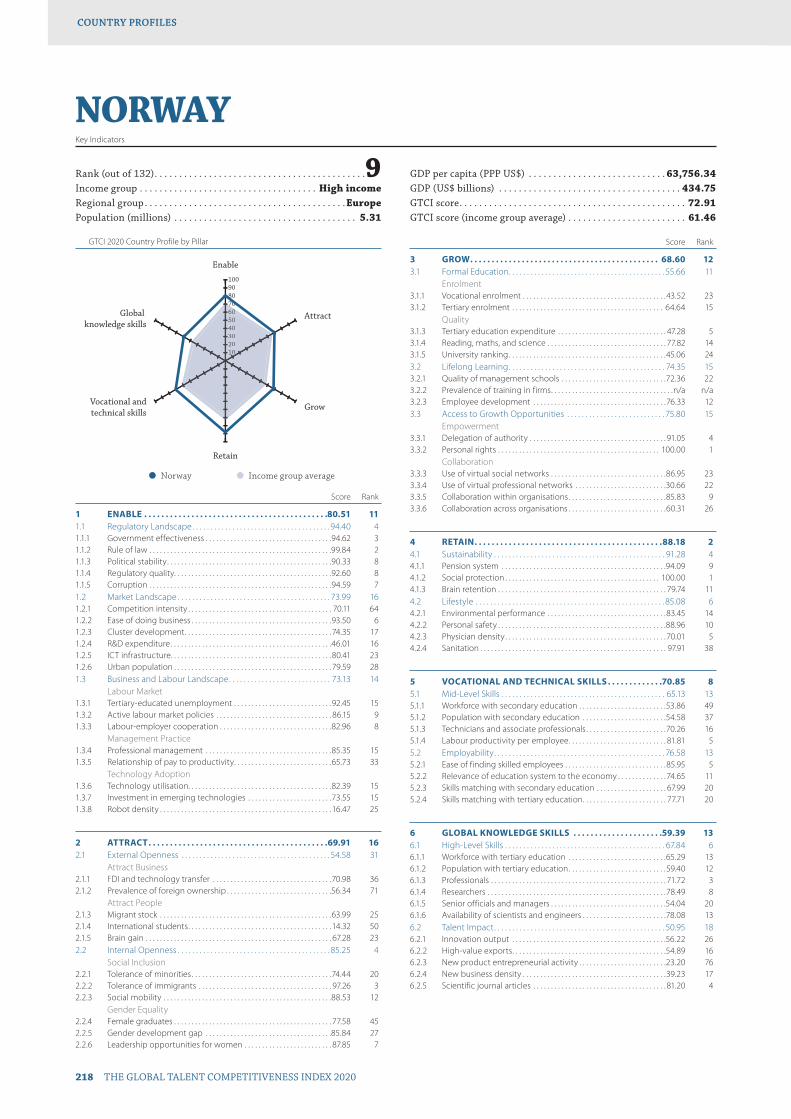
GTCI 2020 Country Profile by Pillar
218 THE GLOBAL TALENT COMPETITIVENESS INDEX 2020
COUNTRY PROFILESCOUNTRY PROFILES
102030405060708090100
Global knowledge skills
Vocational andtechnical skills
Retain
Grow
Attract
Enable
102030405060607
NORWAYKey Indicators
Rank (out of 132) . . . . . . . . . . . . . . . . . . . . . . . . . . . . . . . . . . . . . . . . . . .9Income group . . . . . . . . . . . . . . . . . . . . . . . . . . . . . . . . . . . . High incomeRegional group . . . . . . . . . . . . . . . . . . . . . . . . . . . . . . . . . . . . . . . . .EuropePopulation (millions) . . . . . . . . . . . . . . . . . . . . . . . . . . . . . . . . . . . . . 5.31
GDP per capita (PPP US$) . . . . . . . . . . . . . . . . . . . . . . . . . . . . 63,756.34GDP (US$ billions) . . . . . . . . . . . . . . . . . . . . . . . . . . . . . . . . . . . . . 434.75GTCI score . . . . . . . . . . . . . . . . . . . . . . . . . . . . . . . . . . . . . . . . . . . . . . 72.91GTCI score (income group average) . . . . . . . . . . . . . . . . . . . . . . . . 61.46
Score Rank
1 ENABLE . . . . . . . . . . . . . . . . . . . . . . . . . . . . . . . . . . . . . . . . . . .80.51 111.1 Regulatory Landscape . . . . . . . . . . . . . . . . . . . . . . . . . . . . . . . . . . . . . .94.40 41.1.1 Government effectiveness . . . . . . . . . . . . . . . . . . . . . . . . . . . . . . . . . . . .94.62 31.1.2 Rule of law . . . . . . . . . . . . . . . . . . . . . . . . . . . . . . . . . . . . . . . . . . . . . . . . . . . .99.84 21.1.3 Political stability . . . . . . . . . . . . . . . . . . . . . . . . . . . . . . . . . . . . . . . . . . . . . . .90.33 81.1.4 Regulatory quality. . . . . . . . . . . . . . . . . . . . . . . . . . . . . . . . . . . . . . . . . . . . .92.60 81.1.5 Corruption . . . . . . . . . . . . . . . . . . . . . . . . . . . . . . . . . . . . . . . . . . . . . . . . . . . .94.59 71.2 Market Landscape . . . . . . . . . . . . . . . . . . . . . . . . . . . . . . . . . . . . . . . . . . 73.99 161.2.1 Competition intensity . . . . . . . . . . . . . . . . . . . . . . . . . . . . . . . . . . . . . . . . . 70.11 641.2.2 Ease of doing business . . . . . . . . . . . . . . . . . . . . . . . . . . . . . . . . . . . . . . . .93.50 61.2.3 Cluster development . . . . . . . . . . . . . . . . . . . . . . . . . . . . . . . . . . . . . . . . . . 74.35 171.2.4 R&D expenditure . . . . . . . . . . . . . . . . . . . . . . . . . . . . . . . . . . . . . . . . . . . . . .46.01 161.2.5 ICT infrastructure. . . . . . . . . . . . . . . . . . . . . . . . . . . . . . . . . . . . . . . . . . . . . .80.41 231.2.6 Urban population . . . . . . . . . . . . . . . . . . . . . . . . . . . . . . . . . . . . . . . . . . . . . 79.59 281.3 Business and Labour Landscape . . . . . . . . . . . . . . . . . . . . . . . . . . . . 73.13 14
Labour Market1.3.1 Tertiary-educated unemployment . . . . . . . . . . . . . . . . . . . . . . . . . . . .92.45 151.3.2 Active labour market policies . . . . . . . . . . . . . . . . . . . . . . . . . . . . . . . . . 86.15 91.3.3 Labour-employer cooperation . . . . . . . . . . . . . . . . . . . . . . . . . . . . . . . .82.96 8
Management Practice1.3.4 Professional management . . . . . . . . . . . . . . . . . . . . . . . . . . . . . . . . . . . .85.35 151.3.5 Relationship of pay to productivity . . . . . . . . . . . . . . . . . . . . . . . . . . . .65.73 33
Technology Adoption1.3.6 Technology utilisation. . . . . . . . . . . . . . . . . . . . . . . . . . . . . . . . . . . . . . . . .82.39 151.3.7 Investment in emerging technologies . . . . . . . . . . . . . . . . . . . . . . . .73.55 151.3.8 Robot density . . . . . . . . . . . . . . . . . . . . . . . . . . . . . . . . . . . . . . . . . . . . . . . . . 16.47 25
2 ATTRACT . . . . . . . . . . . . . . . . . . . . . . . . . . . . . . . . . . . . . . . . . .69.91 162.1 External Openness . . . . . . . . . . . . . . . . . . . . . . . . . . . . . . . . . . . . . . . . . 54.58 31
Attract Business2.1.1 FDI and technology transfer . . . . . . . . . . . . . . . . . . . . . . . . . . . . . . . . . .70.98 362.1.2 Prevalence of foreign ownership . . . . . . . . . . . . . . . . . . . . . . . . . . . . . .56.34 71
Attract People2.1.3 Migrant stock . . . . . . . . . . . . . . . . . . . . . . . . . . . . . . . . . . . . . . . . . . . . . . . . .63.99 252.1.4 International students . . . . . . . . . . . . . . . . . . . . . . . . . . . . . . . . . . . . . . . . . 14.32 502.1.5 Brain gain . . . . . . . . . . . . . . . . . . . . . . . . . . . . . . . . . . . . . . . . . . . . . . . . . . . . . 67.28 232.2 Internal Openness . . . . . . . . . . . . . . . . . . . . . . . . . . . . . . . . . . . . . . . . . . 85.25 4
Social Inclusion2.2.1 Tolerance of minorities . . . . . . . . . . . . . . . . . . . . . . . . . . . . . . . . . . . . . . . .74.44 202.2.2 Tolerance of immigrants . . . . . . . . . . . . . . . . . . . . . . . . . . . . . . . . . . . . . . 97.26 32.2.3 Social mobility . . . . . . . . . . . . . . . . . . . . . . . . . . . . . . . . . . . . . . . . . . . . . . . .88.53 12
Gender Equality2.2.4 Female graduates . . . . . . . . . . . . . . . . . . . . . . . . . . . . . . . . . . . . . . . . . . . . . 77.58 452.2.5 Gender development gap . . . . . . . . . . . . . . . . . . . . . . . . . . . . . . . . . . . .85.84 272.2.6 Leadership opportunities for women . . . . . . . . . . . . . . . . . . . . . . . . . 87.85 7
Score Rank
3 GROW . . . . . . . . . . . . . . . . . . . . . . . . . . . . . . . . . . . . . . . . . . . . 68.60 123.1 Formal Education . . . . . . . . . . . . . . . . . . . . . . . . . . . . . . . . . . . . . . . . . . . 55.66 11
Enrolment3.1.1 Vocational enrolment . . . . . . . . . . . . . . . . . . . . . . . . . . . . . . . . . . . . . . . . .43.52 233.1.2 Tertiary enrolment . . . . . . . . . . . . . . . . . . . . . . . . . . . . . . . . . . . . . . . . . . . 64.64 15
Quality3.1.3 Tertiary education expenditure . . . . . . . . . . . . . . . . . . . . . . . . . . . . . . . 47.28 53.1.4 Reading, maths, and science . . . . . . . . . . . . . . . . . . . . . . . . . . . . . . . . . . 77.82 143.1.5 University ranking . . . . . . . . . . . . . . . . . . . . . . . . . . . . . . . . . . . . . . . . . . . . .45.06 243.2 Lifelong Learning . . . . . . . . . . . . . . . . . . . . . . . . . . . . . . . . . . . . . . . . . . . 74.35 153.2.1 Quality of management schools . . . . . . . . . . . . . . . . . . . . . . . . . . . . . .72.36 223.2.2 Prevalence of training in firms . . . . . . . . . . . . . . . . . . . . . . . . . . . . . . . . . . .n/a n/a3.2.3 Employee development . . . . . . . . . . . . . . . . . . . . . . . . . . . . . . . . . . . . . .76.33 123.3 Access to Growth Opportunities . . . . . . . . . . . . . . . . . . . . . . . . . . . 75.80 15
Empowerment3.3.1 Delegation of authority . . . . . . . . . . . . . . . . . . . . . . . . . . . . . . . . . . . . . . . 91.05 43.3.2 Personal rights . . . . . . . . . . . . . . . . . . . . . . . . . . . . . . . . . . . . . . . . . . . . . . 100.00 1
Collaboration3.3.3 Use of virtual social networks . . . . . . . . . . . . . . . . . . . . . . . . . . . . . . . . .86.95 233.3.4 Use of virtual professional networks . . . . . . . . . . . . . . . . . . . . . . . . . .30.66 223.3.5 Collaboration within organisations . . . . . . . . . . . . . . . . . . . . . . . . . . . .85.83 93.3.6 Collaboration across organisations . . . . . . . . . . . . . . . . . . . . . . . . . . . .60.31 26
4 RETAIN . . . . . . . . . . . . . . . . . . . . . . . . . . . . . . . . . . . . . . . . . . . .88.18 24.1 Sustainability . . . . . . . . . . . . . . . . . . . . . . . . . . . . . . . . . . . . . . . . . . . . . . . 91.28 44.1.1 Pension system . . . . . . . . . . . . . . . . . . . . . . . . . . . . . . . . . . . . . . . . . . . . . . .94.09 94.1.2 Social protection . . . . . . . . . . . . . . . . . . . . . . . . . . . . . . . . . . . . . . . . . . . . 100.00 14.1.3 Brain retention . . . . . . . . . . . . . . . . . . . . . . . . . . . . . . . . . . . . . . . . . . . . . . . . 79.74 114.2 Lifestyle . . . . . . . . . . . . . . . . . . . . . . . . . . . . . . . . . . . . . . . . . . . . . . . . . . . . 85.08 64.2.1 Environmental performance . . . . . . . . . . . . . . . . . . . . . . . . . . . . . . . . . .83.45 144.2.2 Personal safety . . . . . . . . . . . . . . . . . . . . . . . . . . . . . . . . . . . . . . . . . . . . . . . .88.96 104.2.3 Physician density . . . . . . . . . . . . . . . . . . . . . . . . . . . . . . . . . . . . . . . . . . . . . .70.01 54.2.4 Sanitation . . . . . . . . . . . . . . . . . . . . . . . . . . . . . . . . . . . . . . . . . . . . . . . . . . . . . 97.91 38
5 VOCATIONAL AND TECHNICAL SKILLS . . . . . . . . . . . . .70.85 85.1 Mid-Level Skills . . . . . . . . . . . . . . . . . . . . . . . . . . . . . . . . . . . . . . . . . . . . . 65.13 135.1.1 Workforce with secondary education . . . . . . . . . . . . . . . . . . . . . . . . .53.86 495.1.2 Population with secondary education . . . . . . . . . . . . . . . . . . . . . . . .54.58 375.1.3 Technicians and associate professionals . . . . . . . . . . . . . . . . . . . . . . .70.26 165.1.4 Labour productivity per employee . . . . . . . . . . . . . . . . . . . . . . . . . . . . 81.81 55.2 Employability . . . . . . . . . . . . . . . . . . . . . . . . . . . . . . . . . . . . . . . . . . . . . . . 76.58 135.2.1 Ease of finding skilled employees . . . . . . . . . . . . . . . . . . . . . . . . . . . . .85.95 55.2.2 Relevance of education system to the economy . . . . . . . . . . . . . . 74.65 115.2.3 Skills matching with secondary education . . . . . . . . . . . . . . . . . . . . 67.99 205.2.4 Skills matching with tertiary education . . . . . . . . . . . . . . . . . . . . . . . . 77.71 20
6 GLOBAL KNOWLEDGE SKILLS . . . . . . . . . . . . . . . . . . . . .59.39 136.1 High-Level Skills . . . . . . . . . . . . . . . . . . . . . . . . . . . . . . . . . . . . . . . . . . . . 67.84 66.1.1 Workforce with tertiary education . . . . . . . . . . . . . . . . . . . . . . . . . . . .65.29 136.1.2 Population with tertiary education . . . . . . . . . . . . . . . . . . . . . . . . . . . .59.40 126.1.3 Professionals . . . . . . . . . . . . . . . . . . . . . . . . . . . . . . . . . . . . . . . . . . . . . . . . . . 71.72 36.1.4 Researchers . . . . . . . . . . . . . . . . . . . . . . . . . . . . . . . . . . . . . . . . . . . . . . . . . . .78.49 86.1.5 Senior officials and managers . . . . . . . . . . . . . . . . . . . . . . . . . . . . . . . . .54.04 206.1.6 Availability of scientists and engineers . . . . . . . . . . . . . . . . . . . . . . . .78.08 136.2 Talent Impact . . . . . . . . . . . . . . . . . . . . . . . . . . . . . . . . . . . . . . . . . . . . . . . 50.95 186.2.1 Innovation output . . . . . . . . . . . . . . . . . . . . . . . . . . . . . . . . . . . . . . . . . . . .56.22 266.2.2 High-value exports . . . . . . . . . . . . . . . . . . . . . . . . . . . . . . . . . . . . . . . . . . . .54.89 166.2.3 New product entrepreneurial activity . . . . . . . . . . . . . . . . . . . . . . . . .23.20 766.2.4 New business density . . . . . . . . . . . . . . . . . . . . . . . . . . . . . . . . . . . . . . . . .39.23 176.2.5 Scientific journal articles . . . . . . . . . . . . . . . . . . . . . . . . . . . . . . . . . . . . . . 81.20 4
l Norway l Income group average

GTCI 2020 Country Profile by Pillar
THE GLOBAL TALENT COMPETITIVENESS INDEX 2020 219
COUNTRY PROFILESCOUNTRY PROFILES
102030405060708090100
Global knowledge skills
Vocational andtechnical skills
Retain
Grow
Attract
Enable
102030405060607
OMANKey Indicators
Rank (out of 132) . . . . . . . . . . . . . . . . . . . . . . . . . . . . . . . . . . . . . . . 43Income group . . . . . . . . . . . . . . . . . . . . . . . . . . . . . . . . . . . . High incomeRegional group . . . . . . . . . . . . . .Northern Africa and Western AsiaPopulation (millions) . . . . . . . . . . . . . . . . . . . . . . . . . . . . . . . . . . . . . 4.83
GDP per capita (PPP US$) . . . . . . . . . . . . . . . . . . . . . . . . . . . . 41,434.65GDP (US$ billions) . . . . . . . . . . . . . . . . . . . . . . . . . . . . . . . . . . . . . . 79.29GTCI score . . . . . . . . . . . . . . . . . . . . . . . . . . . . . . . . . . . . . . . . . . . . . . 49.63GTCI score (income group average) . . . . . . . . . . . . . . . . . . . . . . . . 61.46
Score Rank
1 ENABLE . . . . . . . . . . . . . . . . . . . . . . . . . . . . . . . . . . . . . . . . . . .58.71 401.1 Regulatory Landscape . . . . . . . . . . . . . . . . . . . . . . . . . . . . . . . . . . . . . . 61.08 481.1.1 Government effectiveness . . . . . . . . . . . . . . . . . . . . . . . . . . . . . . . . . . . . 51.56 571.1.2 Rule of law . . . . . . . . . . . . . . . . . . . . . . . . . . . . . . . . . . . . . . . . . . . . . . . . . . . . 62.76 451.1.3 Political stability . . . . . . . . . . . . . . . . . . . . . . . . . . . . . . . . . . . . . . . . . . . . . . . 81.30 311.1.4 Regulatory quality. . . . . . . . . . . . . . . . . . . . . . . . . . . . . . . . . . . . . . . . . . . . .58.42 491.1.5 Corruption . . . . . . . . . . . . . . . . . . . . . . . . . . . . . . . . . . . . . . . . . . . . . . . . . . . . 51.35 451.2 Market Landscape . . . . . . . . . . . . . . . . . . . . . . . . . . . . . . . . . . . . . . . . . . 59.34 391.2.1 Competition intensity . . . . . . . . . . . . . . . . . . . . . . . . . . . . . . . . . . . . . . . . .64.87 751.2.2 Ease of doing business . . . . . . . . . . . . . . . . . . . . . . . . . . . . . . . . . . . . . . . .65.34 721.2.3 Cluster development . . . . . . . . . . . . . . . . . . . . . . . . . . . . . . . . . . . . . . . . . . 67.29 231.2.4 R&D expenditure . . . . . . . . . . . . . . . . . . . . . . . . . . . . . . . . . . . . . . . . . . . . . . . 4.54 891.2.5 ICT infrastructure. . . . . . . . . . . . . . . . . . . . . . . . . . . . . . . . . . . . . . . . . . . . . . 71.76 411.2.6 Urban population . . . . . . . . . . . . . . . . . . . . . . . . . . . . . . . . . . . . . . . . . . . . .82.22 241.3 Business and Labour Landscape . . . . . . . . . . . . . . . . . . . . . . . . . . . . 55.73 43
Labour Market1.3.1 Tertiary-educated unemployment . . . . . . . . . . . . . . . . . . . . . . . . . . . . . .n/a n/a1.3.2 Active labour market policies . . . . . . . . . . . . . . . . . . . . . . . . . . . . . . . . .69.94 281.3.3 Labour-employer cooperation . . . . . . . . . . . . . . . . . . . . . . . . . . . . . . . . 74.99 13
Management Practice1.3.4 Professional management . . . . . . . . . . . . . . . . . . . . . . . . . . . . . . . . . . . . 70.74 271.3.5 Relationship of pay to productivity . . . . . . . . . . . . . . . . . . . . . . . . . . . . 63.18 39
Technology Adoption1.3.6 Technology utilisation. . . . . . . . . . . . . . . . . . . . . . . . . . . . . . . . . . . . . . . . . 61.08 481.3.7 Investment in emerging technologies . . . . . . . . . . . . . . . . . . . . . . . .50.01 421.3.8 Robot density . . . . . . . . . . . . . . . . . . . . . . . . . . . . . . . . . . . . . . . . . . . . . . . . . . 0.14 62
2 ATTRACT . . . . . . . . . . . . . . . . . . . . . . . . . . . . . . . . . . . . . . . . . .67.27 222.1 External Openness . . . . . . . . . . . . . . . . . . . . . . . . . . . . . . . . . . . . . . . . . 57.19 29
Attract Business2.1.1 FDI and technology transfer . . . . . . . . . . . . . . . . . . . . . . . . . . . . . . . . . .58.99 602.1.2 Prevalence of foreign ownership . . . . . . . . . . . . . . . . . . . . . . . . . . . . . .50.86 91
Attract People2.1.3 Migrant stock . . . . . . . . . . . . . . . . . . . . . . . . . . . . . . . . . . . . . . . . . . . . . . . . . 91.38 42.1.4 International students . . . . . . . . . . . . . . . . . . . . . . . . . . . . . . . . . . . . . . . . .10.73 582.1.5 Brain gain . . . . . . . . . . . . . . . . . . . . . . . . . . . . . . . . . . . . . . . . . . . . . . . . . . . . .73.99 162.2 Internal Openness . . . . . . . . . . . . . . . . . . . . . . . . . . . . . . . . . . . . . . . . . . 77.35 15
Social Inclusion2.2.1 Tolerance of minorities . . . . . . . . . . . . . . . . . . . . . . . . . . . . . . . . . . . . . . . .85.56 82.2.2 Tolerance of immigrants . . . . . . . . . . . . . . . . . . . . . . . . . . . . . . . . . . . . . . . .n/a n/a2.2.3 Social mobility . . . . . . . . . . . . . . . . . . . . . . . . . . . . . . . . . . . . . . . . . . . . . . . .72.29 29
Gender Equality2.2.4 Female graduates . . . . . . . . . . . . . . . . . . . . . . . . . . . . . . . . . . . . . . . . . . . . . 79.31 372.2.5 Gender development gap . . . . . . . . . . . . . . . . . . . . . . . . . . . . . . . . . . . .68.27 892.2.6 Leadership opportunities for women . . . . . . . . . . . . . . . . . . . . . . . . . 81.30 11
Score Rank
3 GROW . . . . . . . . . . . . . . . . . . . . . . . . . . . . . . . . . . . . . . . . . . . . 46.26 403.1 Formal Education . . . . . . . . . . . . . . . . . . . . . . . . . . . . . . . . . . . . . . . . . . . 27.61 62
Enrolment3.1.1 Vocational enrolment . . . . . . . . . . . . . . . . . . . . . . . . . . . . . . . . . . . . . . . . . . 0.00 1183.1.2 Tertiary enrolment . . . . . . . . . . . . . . . . . . . . . . . . . . . . . . . . . . . . . . . . . . . .34.89 65
Quality3.1.3 Tertiary education expenditure . . . . . . . . . . . . . . . . . . . . . . . . . . . . . . .46.24 63.1.4 Reading, maths, and science . . . . . . . . . . . . . . . . . . . . . . . . . . . . . . . . . . . .n/a n/a3.1.5 University ranking . . . . . . . . . . . . . . . . . . . . . . . . . . . . . . . . . . . . . . . . . . . . . 29.31 413.2 Lifelong Learning . . . . . . . . . . . . . . . . . . . . . . . . . . . . . . . . . . . . . . . . . . . 59.56 293.2.1 Quality of management schools . . . . . . . . . . . . . . . . . . . . . . . . . . . . . .62.81 353.2.2 Prevalence of training in firms . . . . . . . . . . . . . . . . . . . . . . . . . . . . . . . . . . .n/a n/a3.2.3 Employee development . . . . . . . . . . . . . . . . . . . . . . . . . . . . . . . . . . . . . .56.31 343.3 Access to Growth Opportunities . . . . . . . . . . . . . . . . . . . . . . . . . . . 51.61 48
Empowerment3.3.1 Delegation of authority . . . . . . . . . . . . . . . . . . . . . . . . . . . . . . . . . . . . . . .64.03 303.3.2 Personal rights . . . . . . . . . . . . . . . . . . . . . . . . . . . . . . . . . . . . . . . . . . . . . . . . 41.68 106
Collaboration3.3.3 Use of virtual social networks . . . . . . . . . . . . . . . . . . . . . . . . . . . . . . . . . 71.27 743.3.4 Use of virtual professional networks . . . . . . . . . . . . . . . . . . . . . . . . . . . 9.97 603.3.5 Collaboration within organisations . . . . . . . . . . . . . . . . . . . . . . . . . . . .64.86 283.3.6 Collaboration across organisations . . . . . . . . . . . . . . . . . . . . . . . . . . . . 57.88 29
4 RETAIN . . . . . . . . . . . . . . . . . . . . . . . . . . . . . . . . . . . . . . . . . . . .57.48 484.1 Sustainability . . . . . . . . . . . . . . . . . . . . . . . . . . . . . . . . . . . . . . . . . . . . . . . 58.60 394.1.1 Pension system . . . . . . . . . . . . . . . . . . . . . . . . . . . . . . . . . . . . . . . . . . . . . . . 13.70 894.1.2 Social protection . . . . . . . . . . . . . . . . . . . . . . . . . . . . . . . . . . . . . . . . . . . . . .84.46 164.1.3 Brain retention . . . . . . . . . . . . . . . . . . . . . . . . . . . . . . . . . . . . . . . . . . . . . . . .77.64 144.2 Lifestyle . . . . . . . . . . . . . . . . . . . . . . . . . . . . . . . . . . . . . . . . . . . . . . . . . . . . 56.35 614.2.1 Environmental performance . . . . . . . . . . . . . . . . . . . . . . . . . . . . . . . . . .39.82 944.2.2 Personal safety . . . . . . . . . . . . . . . . . . . . . . . . . . . . . . . . . . . . . . . . . . . . . . . . 55.92 644.2.3 Physician density . . . . . . . . . . . . . . . . . . . . . . . . . . . . . . . . . . . . . . . . . . . . . .30.40 594.2.4 Sanitation . . . . . . . . . . . . . . . . . . . . . . . . . . . . . . . . . . . . . . . . . . . . . . . . . . . . .99.27 25
5 VOCATIONAL AND TECHNICAL SKILLS . . . . . . . . . . . . 50.52 445.1 Mid-Level Skills . . . . . . . . . . . . . . . . . . . . . . . . . . . . . . . . . . . . . . . . . . . . . 38.42 675.1.1 Workforce with secondary education . . . . . . . . . . . . . . . . . . . . . . . . . . .n/a n/a5.1.2 Population with secondary education . . . . . . . . . . . . . . . . . . . . . . . .40.30 615.1.3 Technicians and associate professionals . . . . . . . . . . . . . . . . . . . . . . . 31.87 695.1.4 Labour productivity per employee . . . . . . . . . . . . . . . . . . . . . . . . . . . .43.09 355.2 Employability . . . . . . . . . . . . . . . . . . . . . . . . . . . . . . . . . . . . . . . . . . . . . . . 62.63 355.2.1 Ease of finding skilled employees . . . . . . . . . . . . . . . . . . . . . . . . . . . . . 61.72 525.2.2 Relevance of education system to the economy . . . . . . . . . . . . . . 65.93 245.2.3 Skills matching with secondary education . . . . . . . . . . . . . . . . . . . .56.44 375.2.4 Skills matching with tertiary education . . . . . . . . . . . . . . . . . . . . . . . .66.42 36
6 GLOBAL KNOWLEDGE SKILLS . . . . . . . . . . . . . . . . . . . . . 17.54 916.1 High-Level Skills . . . . . . . . . . . . . . . . . . . . . . . . . . . . . . . . . . . . . . . . . . . . 25.38 766.1.1 Workforce with tertiary education . . . . . . . . . . . . . . . . . . . . . . . . . . . . . .n/a n/a6.1.2 Population with tertiary education . . . . . . . . . . . . . . . . . . . . . . . . . . . . 21.27 716.1.3 Professionals . . . . . . . . . . . . . . . . . . . . . . . . . . . . . . . . . . . . . . . . . . . . . . . . . .18.66 856.1.4 Researchers . . . . . . . . . . . . . . . . . . . . . . . . . . . . . . . . . . . . . . . . . . . . . . . . . . . . 2.83 766.1.5 Senior officials and managers . . . . . . . . . . . . . . . . . . . . . . . . . . . . . . . . . 21.42 686.1.6 Availability of scientists and engineers . . . . . . . . . . . . . . . . . . . . . . . .62.73 356.2 Talent Impact . . . . . . . . . . . . . . . . . . . . . . . . . . . . . . . . . . . . . . . . . . . . . . . . 9.71 1066.2.1 Innovation output . . . . . . . . . . . . . . . . . . . . . . . . . . . . . . . . . . . . . . . . . . . .18.39 986.2.2 High-value exports . . . . . . . . . . . . . . . . . . . . . . . . . . . . . . . . . . . . . . . . . . . . . 3.32 1086.2.3 New product entrepreneurial activity . . . . . . . . . . . . . . . . . . . . . . . . . . .n/a n/a6.2.4 New business density . . . . . . . . . . . . . . . . . . . . . . . . . . . . . . . . . . . . . . . . . 10.12 476.2.5 Scientific journal articles . . . . . . . . . . . . . . . . . . . . . . . . . . . . . . . . . . . . . . . 7.00 59
l Oman l Income group average
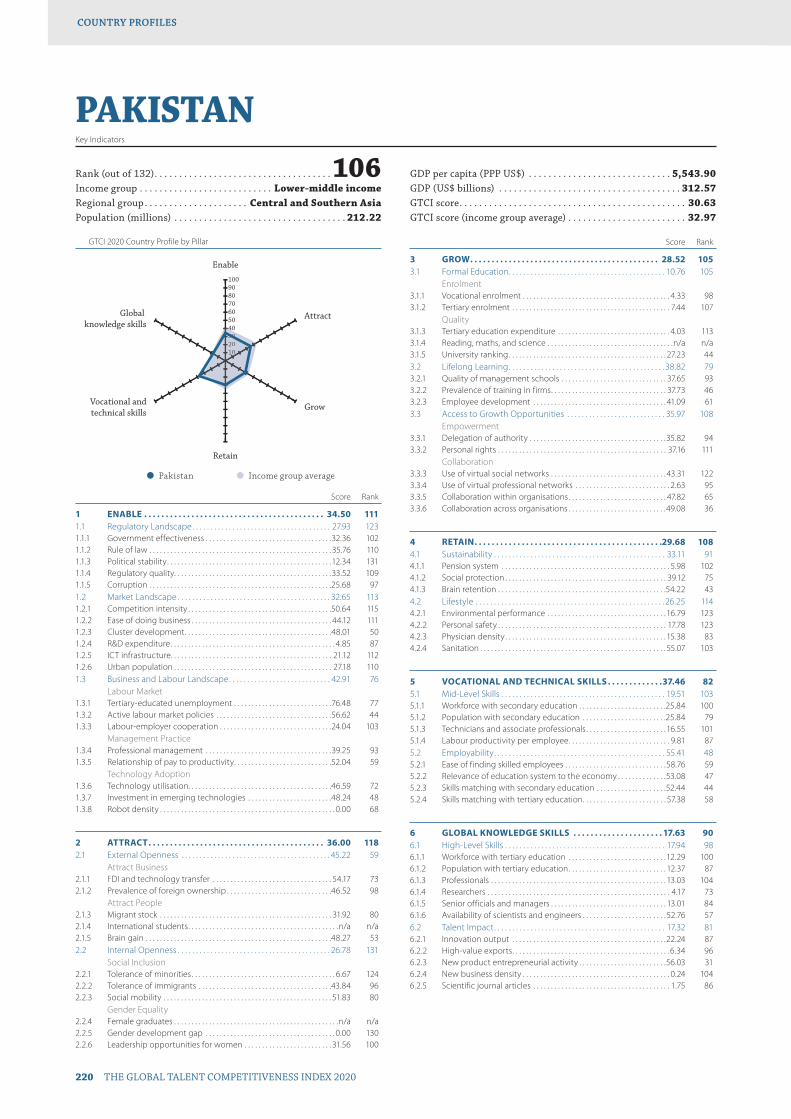
GTCI 2020 Country Profile by Pillar
220 THE GLOBAL TALENT COMPETITIVENESS INDEX 2020
COUNTRY PROFILESCOUNTRY PROFILES
102030405060708090100
Global knowledge skills
Vocational andtechnical skills
Retain
Grow
Attract
Enable
10203004
PAKISTANKey Indicators
Rank (out of 132) . . . . . . . . . . . . . . . . . . . . . . . . . . . . . . . . . . . .106Income group . . . . . . . . . . . . . . . . . . . . . . . . . . . Lower-middle incomeRegional group . . . . . . . . . . . . . . . . . . . . . Central and Southern AsiaPopulation (millions) . . . . . . . . . . . . . . . . . . . . . . . . . . . . . . . . . . . 212.22
GDP per capita (PPP US$) . . . . . . . . . . . . . . . . . . . . . . . . . . . . . 5,543.90GDP (US$ billions) . . . . . . . . . . . . . . . . . . . . . . . . . . . . . . . . . . . . . 312.57GTCI score . . . . . . . . . . . . . . . . . . . . . . . . . . . . . . . . . . . . . . . . . . . . . . 30.63GTCI score (income group average) . . . . . . . . . . . . . . . . . . . . . . . . 32.97
Score Rank
1 ENABLE . . . . . . . . . . . . . . . . . . . . . . . . . . . . . . . . . . . . . . . . . . 34.50 1111.1 Regulatory Landscape . . . . . . . . . . . . . . . . . . . . . . . . . . . . . . . . . . . . . . 27.93 1231.1.1 Government effectiveness . . . . . . . . . . . . . . . . . . . . . . . . . . . . . . . . . . . .32.36 1021.1.2 Rule of law . . . . . . . . . . . . . . . . . . . . . . . . . . . . . . . . . . . . . . . . . . . . . . . . . . . . 35.76 1101.1.3 Political stability . . . . . . . . . . . . . . . . . . . . . . . . . . . . . . . . . . . . . . . . . . . . . . .12.34 1311.1.4 Regulatory quality. . . . . . . . . . . . . . . . . . . . . . . . . . . . . . . . . . . . . . . . . . . . .33.52 1091.1.5 Corruption . . . . . . . . . . . . . . . . . . . . . . . . . . . . . . . . . . . . . . . . . . . . . . . . . . . .25.68 971.2 Market Landscape . . . . . . . . . . . . . . . . . . . . . . . . . . . . . . . . . . . . . . . . . . 32.65 1131.2.1 Competition intensity . . . . . . . . . . . . . . . . . . . . . . . . . . . . . . . . . . . . . . . . .50.64 1151.2.2 Ease of doing business . . . . . . . . . . . . . . . . . . . . . . . . . . . . . . . . . . . . . . . . 44.12 1111.2.3 Cluster development . . . . . . . . . . . . . . . . . . . . . . . . . . . . . . . . . . . . . . . . . .48.01 501.2.4 R&D expenditure . . . . . . . . . . . . . . . . . . . . . . . . . . . . . . . . . . . . . . . . . . . . . . . 4.85 871.2.5 ICT infrastructure. . . . . . . . . . . . . . . . . . . . . . . . . . . . . . . . . . . . . . . . . . . . . . 21.12 1121.2.6 Urban population . . . . . . . . . . . . . . . . . . . . . . . . . . . . . . . . . . . . . . . . . . . . . 27.18 1101.3 Business and Labour Landscape . . . . . . . . . . . . . . . . . . . . . . . . . . . . 42.91 76
Labour Market1.3.1 Tertiary-educated unemployment . . . . . . . . . . . . . . . . . . . . . . . . . . . .76.48 771.3.2 Active labour market policies . . . . . . . . . . . . . . . . . . . . . . . . . . . . . . . . .56.62 441.3.3 Labour-employer cooperation . . . . . . . . . . . . . . . . . . . . . . . . . . . . . . . .24.04 103
Management Practice1.3.4 Professional management . . . . . . . . . . . . . . . . . . . . . . . . . . . . . . . . . . . .39.25 931.3.5 Relationship of pay to productivity . . . . . . . . . . . . . . . . . . . . . . . . . . . .52.04 59
Technology Adoption1.3.6 Technology utilisation. . . . . . . . . . . . . . . . . . . . . . . . . . . . . . . . . . . . . . . . .46.59 721.3.7 Investment in emerging technologies . . . . . . . . . . . . . . . . . . . . . . . .48.24 481.3.8 Robot density . . . . . . . . . . . . . . . . . . . . . . . . . . . . . . . . . . . . . . . . . . . . . . . . . . 0.00 68
2 ATTRACT . . . . . . . . . . . . . . . . . . . . . . . . . . . . . . . . . . . . . . . . . 36.00 1182.1 External Openness . . . . . . . . . . . . . . . . . . . . . . . . . . . . . . . . . . . . . . . . . 45.22 59
Attract Business2.1.1 FDI and technology transfer . . . . . . . . . . . . . . . . . . . . . . . . . . . . . . . . . . 54.17 732.1.2 Prevalence of foreign ownership . . . . . . . . . . . . . . . . . . . . . . . . . . . . . .46.52 98
Attract People2.1.3 Migrant stock . . . . . . . . . . . . . . . . . . . . . . . . . . . . . . . . . . . . . . . . . . . . . . . . . 31.92 802.1.4 International students . . . . . . . . . . . . . . . . . . . . . . . . . . . . . . . . . . . . . . . . . . .n/a n/a2.1.5 Brain gain . . . . . . . . . . . . . . . . . . . . . . . . . . . . . . . . . . . . . . . . . . . . . . . . . . . . .48.27 532.2 Internal Openness . . . . . . . . . . . . . . . . . . . . . . . . . . . . . . . . . . . . . . . . . . 26.78 131
Social Inclusion2.2.1 Tolerance of minorities . . . . . . . . . . . . . . . . . . . . . . . . . . . . . . . . . . . . . . . . . 6.67 1242.2.2 Tolerance of immigrants . . . . . . . . . . . . . . . . . . . . . . . . . . . . . . . . . . . . . .43.84 962.2.3 Social mobility . . . . . . . . . . . . . . . . . . . . . . . . . . . . . . . . . . . . . . . . . . . . . . . . 51.83 80
Gender Equality2.2.4 Female graduates . . . . . . . . . . . . . . . . . . . . . . . . . . . . . . . . . . . . . . . . . . . . . . .n/a n/a2.2.5 Gender development gap . . . . . . . . . . . . . . . . . . . . . . . . . . . . . . . . . . . . . 0.00 1302.2.6 Leadership opportunities for women . . . . . . . . . . . . . . . . . . . . . . . . . 31.56 100
Score Rank
3 GROW . . . . . . . . . . . . . . . . . . . . . . . . . . . . . . . . . . . . . . . . . . . . 28.52 1053.1 Formal Education . . . . . . . . . . . . . . . . . . . . . . . . . . . . . . . . . . . . . . . . . . . 10.76 105
Enrolment3.1.1 Vocational enrolment . . . . . . . . . . . . . . . . . . . . . . . . . . . . . . . . . . . . . . . . . . 4.33 983.1.2 Tertiary enrolment . . . . . . . . . . . . . . . . . . . . . . . . . . . . . . . . . . . . . . . . . . . . . 7.44 107
Quality3.1.3 Tertiary education expenditure . . . . . . . . . . . . . . . . . . . . . . . . . . . . . . . . 4.03 1133.1.4 Reading, maths, and science . . . . . . . . . . . . . . . . . . . . . . . . . . . . . . . . . . . .n/a n/a3.1.5 University ranking . . . . . . . . . . . . . . . . . . . . . . . . . . . . . . . . . . . . . . . . . . . . . 27.23 443.2 Lifelong Learning . . . . . . . . . . . . . . . . . . . . . . . . . . . . . . . . . . . . . . . . . . . 38.82 793.2.1 Quality of management schools . . . . . . . . . . . . . . . . . . . . . . . . . . . . . . 37.65 933.2.2 Prevalence of training in firms . . . . . . . . . . . . . . . . . . . . . . . . . . . . . . . . . 37.73 463.2.3 Employee development . . . . . . . . . . . . . . . . . . . . . . . . . . . . . . . . . . . . . . 41.09 613.3 Access to Growth Opportunities . . . . . . . . . . . . . . . . . . . . . . . . . . . 35.97 108
Empowerment3.3.1 Delegation of authority . . . . . . . . . . . . . . . . . . . . . . . . . . . . . . . . . . . . . . .35.82 943.3.2 Personal rights . . . . . . . . . . . . . . . . . . . . . . . . . . . . . . . . . . . . . . . . . . . . . . . . 37.16 111
Collaboration3.3.3 Use of virtual social networks . . . . . . . . . . . . . . . . . . . . . . . . . . . . . . . . . 43.31 1223.3.4 Use of virtual professional networks . . . . . . . . . . . . . . . . . . . . . . . . . . . 2.63 953.3.5 Collaboration within organisations . . . . . . . . . . . . . . . . . . . . . . . . . . . . 47.82 653.3.6 Collaboration across organisations . . . . . . . . . . . . . . . . . . . . . . . . . . . .49.08 36
4 RETAIN . . . . . . . . . . . . . . . . . . . . . . . . . . . . . . . . . . . . . . . . . . . .29.68 1084.1 Sustainability . . . . . . . . . . . . . . . . . . . . . . . . . . . . . . . . . . . . . . . . . . . . . . . 33.11 914.1.1 Pension system . . . . . . . . . . . . . . . . . . . . . . . . . . . . . . . . . . . . . . . . . . . . . . . . 5.98 1024.1.2 Social protection . . . . . . . . . . . . . . . . . . . . . . . . . . . . . . . . . . . . . . . . . . . . . . 39.12 754.1.3 Brain retention . . . . . . . . . . . . . . . . . . . . . . . . . . . . . . . . . . . . . . . . . . . . . . . .54.22 434.2 Lifestyle . . . . . . . . . . . . . . . . . . . . . . . . . . . . . . . . . . . . . . . . . . . . . . . . . . . . 26.25 1144.2.1 Environmental performance . . . . . . . . . . . . . . . . . . . . . . . . . . . . . . . . . . 16.79 1234.2.2 Personal safety . . . . . . . . . . . . . . . . . . . . . . . . . . . . . . . . . . . . . . . . . . . . . . . . 17.78 1234.2.3 Physician density . . . . . . . . . . . . . . . . . . . . . . . . . . . . . . . . . . . . . . . . . . . . . . 15.38 834.2.4 Sanitation . . . . . . . . . . . . . . . . . . . . . . . . . . . . . . . . . . . . . . . . . . . . . . . . . . . . . 55.07 103
5 VOCATIONAL AND TECHNICAL SKILLS . . . . . . . . . . . . .37.46 825.1 Mid-Level Skills . . . . . . . . . . . . . . . . . . . . . . . . . . . . . . . . . . . . . . . . . . . . . 19.51 1035.1.1 Workforce with secondary education . . . . . . . . . . . . . . . . . . . . . . . . .25.84 1005.1.2 Population with secondary education . . . . . . . . . . . . . . . . . . . . . . . .25.84 795.1.3 Technicians and associate professionals . . . . . . . . . . . . . . . . . . . . . . . 16.55 1015.1.4 Labour productivity per employee . . . . . . . . . . . . . . . . . . . . . . . . . . . . . 9.81 875.2 Employability . . . . . . . . . . . . . . . . . . . . . . . . . . . . . . . . . . . . . . . . . . . . . . . 55.41 485.2.1 Ease of finding skilled employees . . . . . . . . . . . . . . . . . . . . . . . . . . . . .58.76 595.2.2 Relevance of education system to the economy . . . . . . . . . . . . . .53.08 475.2.3 Skills matching with secondary education . . . . . . . . . . . . . . . . . . . .52.44 445.2.4 Skills matching with tertiary education . . . . . . . . . . . . . . . . . . . . . . . . 57.38 58
6 GLOBAL KNOWLEDGE SKILLS . . . . . . . . . . . . . . . . . . . . . 17.63 906.1 High-Level Skills . . . . . . . . . . . . . . . . . . . . . . . . . . . . . . . . . . . . . . . . . . . . 17.94 986.1.1 Workforce with tertiary education . . . . . . . . . . . . . . . . . . . . . . . . . . . .12.29 1006.1.2 Population with tertiary education . . . . . . . . . . . . . . . . . . . . . . . . . . . . 12.37 876.1.3 Professionals . . . . . . . . . . . . . . . . . . . . . . . . . . . . . . . . . . . . . . . . . . . . . . . . . . 13.03 1046.1.4 Researchers . . . . . . . . . . . . . . . . . . . . . . . . . . . . . . . . . . . . . . . . . . . . . . . . . . . . 4.17 736.1.5 Senior officials and managers . . . . . . . . . . . . . . . . . . . . . . . . . . . . . . . . . 13.01 846.1.6 Availability of scientists and engineers . . . . . . . . . . . . . . . . . . . . . . . . 52.76 576.2 Talent Impact . . . . . . . . . . . . . . . . . . . . . . . . . . . . . . . . . . . . . . . . . . . . . . . 17.32 816.2.1 Innovation output . . . . . . . . . . . . . . . . . . . . . . . . . . . . . . . . . . . . . . . . . . . .22.24 876.2.2 High-value exports . . . . . . . . . . . . . . . . . . . . . . . . . . . . . . . . . . . . . . . . . . . . . 6.34 966.2.3 New product entrepreneurial activity . . . . . . . . . . . . . . . . . . . . . . . . .56.03 316.2.4 New business density . . . . . . . . . . . . . . . . . . . . . . . . . . . . . . . . . . . . . . . . . . 0.24 1046.2.5 Scientific journal articles . . . . . . . . . . . . . . . . . . . . . . . . . . . . . . . . . . . . . . . 1.75 86
l Pakistan l Income group average
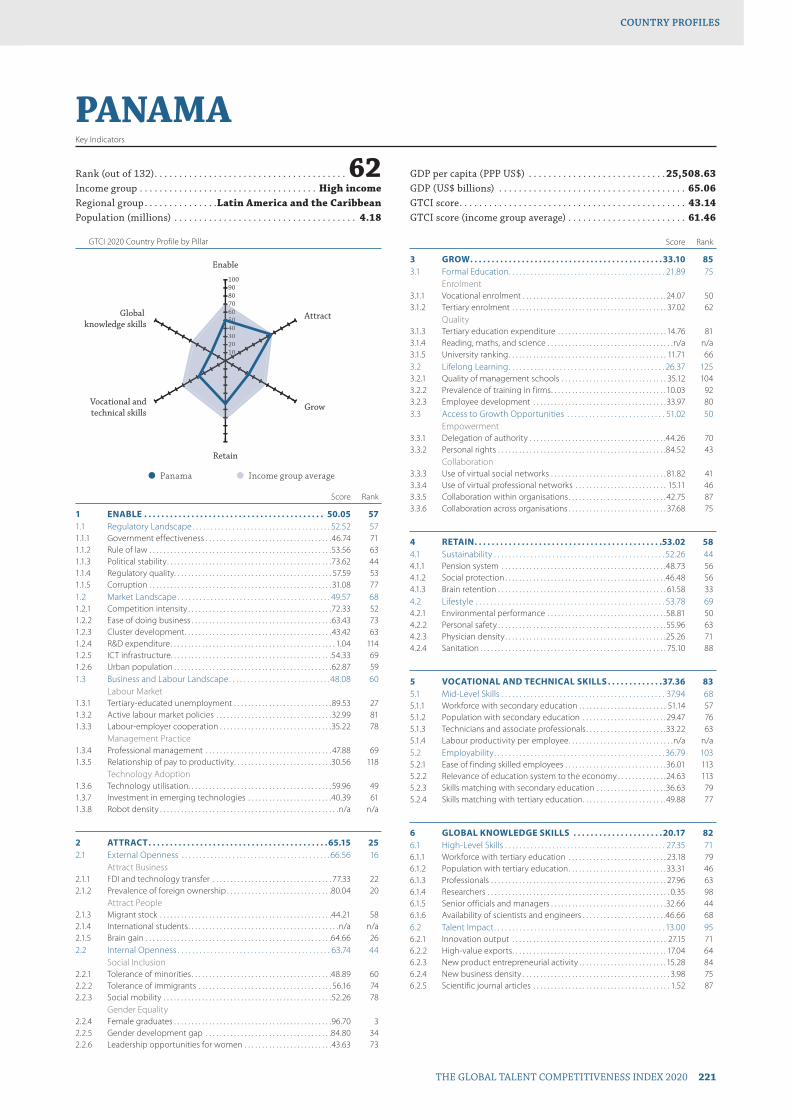
GTCI 2020 Country Profile by Pillar
THE GLOBAL TALENT COMPETITIVENESS INDEX 2020 221
COUNTRY PROFILESCOUNTRY PROFILES
102030405060708090100
Global knowledge skills
Vocational andtechnical skills
Retain
Grow
Attract
Enable
102030405060607
PANAMAKey Indicators
Rank (out of 132) . . . . . . . . . . . . . . . . . . . . . . . . . . . . . . . . . . . . . . . 62Income group . . . . . . . . . . . . . . . . . . . . . . . . . . . . . . . . . . . . High incomeRegional group . . . . . . . . . . . . . . .Latin America and the CaribbeanPopulation (millions) . . . . . . . . . . . . . . . . . . . . . . . . . . . . . . . . . . . . . 4.18
GDP per capita (PPP US$) . . . . . . . . . . . . . . . . . . . . . . . . . . . .25,508.63GDP (US$ billions) . . . . . . . . . . . . . . . . . . . . . . . . . . . . . . . . . . . . . . 65.06GTCI score . . . . . . . . . . . . . . . . . . . . . . . . . . . . . . . . . . . . . . . . . . . . . . 43.14GTCI score (income group average) . . . . . . . . . . . . . . . . . . . . . . . . 61.46
Score Rank
1 ENABLE . . . . . . . . . . . . . . . . . . . . . . . . . . . . . . . . . . . . . . . . . . 50.05 571.1 Regulatory Landscape . . . . . . . . . . . . . . . . . . . . . . . . . . . . . . . . . . . . . . 52.52 571.1.1 Government effectiveness . . . . . . . . . . . . . . . . . . . . . . . . . . . . . . . . . . . .46.74 711.1.2 Rule of law . . . . . . . . . . . . . . . . . . . . . . . . . . . . . . . . . . . . . . . . . . . . . . . . . . . .53.56 631.1.3 Political stability . . . . . . . . . . . . . . . . . . . . . . . . . . . . . . . . . . . . . . . . . . . . . . .73.62 441.1.4 Regulatory quality. . . . . . . . . . . . . . . . . . . . . . . . . . . . . . . . . . . . . . . . . . . . . 57.59 531.1.5 Corruption . . . . . . . . . . . . . . . . . . . . . . . . . . . . . . . . . . . . . . . . . . . . . . . . . . . . 31.08 771.2 Market Landscape . . . . . . . . . . . . . . . . . . . . . . . . . . . . . . . . . . . . . . . . . . 49.57 681.2.1 Competition intensity . . . . . . . . . . . . . . . . . . . . . . . . . . . . . . . . . . . . . . . . .72.33 521.2.2 Ease of doing business . . . . . . . . . . . . . . . . . . . . . . . . . . . . . . . . . . . . . . . .63.43 731.2.3 Cluster development . . . . . . . . . . . . . . . . . . . . . . . . . . . . . . . . . . . . . . . . . . 43.42 631.2.4 R&D expenditure . . . . . . . . . . . . . . . . . . . . . . . . . . . . . . . . . . . . . . . . . . . . . . . 1.04 1141.2.5 ICT infrastructure. . . . . . . . . . . . . . . . . . . . . . . . . . . . . . . . . . . . . . . . . . . . . .54.33 691.2.6 Urban population . . . . . . . . . . . . . . . . . . . . . . . . . . . . . . . . . . . . . . . . . . . . .62.87 591.3 Business and Labour Landscape . . . . . . . . . . . . . . . . . . . . . . . . . . . .48.08 60
Labour Market1.3.1 Tertiary-educated unemployment . . . . . . . . . . . . . . . . . . . . . . . . . . . .89.53 271.3.2 Active labour market policies . . . . . . . . . . . . . . . . . . . . . . . . . . . . . . . . .32.99 811.3.3 Labour-employer cooperation . . . . . . . . . . . . . . . . . . . . . . . . . . . . . . . .35.22 78
Management Practice1.3.4 Professional management . . . . . . . . . . . . . . . . . . . . . . . . . . . . . . . . . . . . 47.88 691.3.5 Relationship of pay to productivity . . . . . . . . . . . . . . . . . . . . . . . . . . . .30.56 118
Technology Adoption1.3.6 Technology utilisation. . . . . . . . . . . . . . . . . . . . . . . . . . . . . . . . . . . . . . . . . 59.96 491.3.7 Investment in emerging technologies . . . . . . . . . . . . . . . . . . . . . . . .40.39 611.3.8 Robot density . . . . . . . . . . . . . . . . . . . . . . . . . . . . . . . . . . . . . . . . . . . . . . . . . . .n/a n/a
2 ATTRACT . . . . . . . . . . . . . . . . . . . . . . . . . . . . . . . . . . . . . . . . . . 65.15 252.1 External Openness . . . . . . . . . . . . . . . . . . . . . . . . . . . . . . . . . . . . . . . . . 66.56 16
Attract Business2.1.1 FDI and technology transfer . . . . . . . . . . . . . . . . . . . . . . . . . . . . . . . . . . 77.33 222.1.2 Prevalence of foreign ownership . . . . . . . . . . . . . . . . . . . . . . . . . . . . . .80.04 20
Attract People2.1.3 Migrant stock . . . . . . . . . . . . . . . . . . . . . . . . . . . . . . . . . . . . . . . . . . . . . . . . .44.21 582.1.4 International students . . . . . . . . . . . . . . . . . . . . . . . . . . . . . . . . . . . . . . . . . . .n/a n/a2.1.5 Brain gain . . . . . . . . . . . . . . . . . . . . . . . . . . . . . . . . . . . . . . . . . . . . . . . . . . . . .64.66 262.2 Internal Openness . . . . . . . . . . . . . . . . . . . . . . . . . . . . . . . . . . . . . . . . . . 63.74 44
Social Inclusion2.2.1 Tolerance of minorities . . . . . . . . . . . . . . . . . . . . . . . . . . . . . . . . . . . . . . . .48.89 602.2.2 Tolerance of immigrants . . . . . . . . . . . . . . . . . . . . . . . . . . . . . . . . . . . . . . 56.16 742.2.3 Social mobility . . . . . . . . . . . . . . . . . . . . . . . . . . . . . . . . . . . . . . . . . . . . . . . .52.26 78
Gender Equality2.2.4 Female graduates . . . . . . . . . . . . . . . . . . . . . . . . . . . . . . . . . . . . . . . . . . . . .96.70 32.2.5 Gender development gap . . . . . . . . . . . . . . . . . . . . . . . . . . . . . . . . . . . .84.80 342.2.6 Leadership opportunities for women . . . . . . . . . . . . . . . . . . . . . . . . .43.63 73
Score Rank
3 GROW . . . . . . . . . . . . . . . . . . . . . . . . . . . . . . . . . . . . . . . . . . . . .33.10 853.1 Formal Education . . . . . . . . . . . . . . . . . . . . . . . . . . . . . . . . . . . . . . . . . . . 21.89 75
Enrolment3.1.1 Vocational enrolment . . . . . . . . . . . . . . . . . . . . . . . . . . . . . . . . . . . . . . . . . 24.07 503.1.2 Tertiary enrolment . . . . . . . . . . . . . . . . . . . . . . . . . . . . . . . . . . . . . . . . . . . . 37.02 62
Quality3.1.3 Tertiary education expenditure . . . . . . . . . . . . . . . . . . . . . . . . . . . . . . . 14.76 813.1.4 Reading, maths, and science . . . . . . . . . . . . . . . . . . . . . . . . . . . . . . . . . . . .n/a n/a3.1.5 University ranking . . . . . . . . . . . . . . . . . . . . . . . . . . . . . . . . . . . . . . . . . . . . . 11.71 663.2 Lifelong Learning . . . . . . . . . . . . . . . . . . . . . . . . . . . . . . . . . . . . . . . . . . . 26.37 1253.2.1 Quality of management schools . . . . . . . . . . . . . . . . . . . . . . . . . . . . . . 35.12 1043.2.2 Prevalence of training in firms . . . . . . . . . . . . . . . . . . . . . . . . . . . . . . . . . 10.03 923.2.3 Employee development . . . . . . . . . . . . . . . . . . . . . . . . . . . . . . . . . . . . . . 33.97 803.3 Access to Growth Opportunities . . . . . . . . . . . . . . . . . . . . . . . . . . . 51.02 50
Empowerment3.3.1 Delegation of authority . . . . . . . . . . . . . . . . . . . . . . . . . . . . . . . . . . . . . . .44.26 703.3.2 Personal rights . . . . . . . . . . . . . . . . . . . . . . . . . . . . . . . . . . . . . . . . . . . . . . . .84.52 43
Collaboration3.3.3 Use of virtual social networks . . . . . . . . . . . . . . . . . . . . . . . . . . . . . . . . . 81.82 413.3.4 Use of virtual professional networks . . . . . . . . . . . . . . . . . . . . . . . . . . 15.11 463.3.5 Collaboration within organisations . . . . . . . . . . . . . . . . . . . . . . . . . . . . 42.75 873.3.6 Collaboration across organisations . . . . . . . . . . . . . . . . . . . . . . . . . . . . 37.68 75
4 RETAIN . . . . . . . . . . . . . . . . . . . . . . . . . . . . . . . . . . . . . . . . . . . .53.02 584.1 Sustainability . . . . . . . . . . . . . . . . . . . . . . . . . . . . . . . . . . . . . . . . . . . . . . . 52.26 444.1.1 Pension system . . . . . . . . . . . . . . . . . . . . . . . . . . . . . . . . . . . . . . . . . . . . . . .48.73 564.1.2 Social protection . . . . . . . . . . . . . . . . . . . . . . . . . . . . . . . . . . . . . . . . . . . . . .46.48 564.1.3 Brain retention . . . . . . . . . . . . . . . . . . . . . . . . . . . . . . . . . . . . . . . . . . . . . . . . 61.58 334.2 Lifestyle . . . . . . . . . . . . . . . . . . . . . . . . . . . . . . . . . . . . . . . . . . . . . . . . . . . . 53.78 694.2.1 Environmental performance . . . . . . . . . . . . . . . . . . . . . . . . . . . . . . . . . .58.81 504.2.2 Personal safety . . . . . . . . . . . . . . . . . . . . . . . . . . . . . . . . . . . . . . . . . . . . . . . .55.96 634.2.3 Physician density . . . . . . . . . . . . . . . . . . . . . . . . . . . . . . . . . . . . . . . . . . . . . .25.26 714.2.4 Sanitation . . . . . . . . . . . . . . . . . . . . . . . . . . . . . . . . . . . . . . . . . . . . . . . . . . . . . 75.10 88
5 VOCATIONAL AND TECHNICAL SKILLS . . . . . . . . . . . . .37.36 835.1 Mid-Level Skills . . . . . . . . . . . . . . . . . . . . . . . . . . . . . . . . . . . . . . . . . . . . . 37.94 685.1.1 Workforce with secondary education . . . . . . . . . . . . . . . . . . . . . . . . . 51.14 575.1.2 Population with secondary education . . . . . . . . . . . . . . . . . . . . . . . . 29.47 765.1.3 Technicians and associate professionals . . . . . . . . . . . . . . . . . . . . . . .33.22 635.1.4 Labour productivity per employee . . . . . . . . . . . . . . . . . . . . . . . . . . . . . .n/a n/a5.2 Employability . . . . . . . . . . . . . . . . . . . . . . . . . . . . . . . . . . . . . . . . . . . . . . . 36.79 1035.2.1 Ease of finding skilled employees . . . . . . . . . . . . . . . . . . . . . . . . . . . . .36.01 1135.2.2 Relevance of education system to the economy . . . . . . . . . . . . . .24.63 1135.2.3 Skills matching with secondary education . . . . . . . . . . . . . . . . . . . .36.63 795.2.4 Skills matching with tertiary education . . . . . . . . . . . . . . . . . . . . . . . .49.88 77
6 GLOBAL KNOWLEDGE SKILLS . . . . . . . . . . . . . . . . . . . . . 20.17 826.1 High-Level Skills . . . . . . . . . . . . . . . . . . . . . . . . . . . . . . . . . . . . . . . . . . . . 27.35 716.1.1 Workforce with tertiary education . . . . . . . . . . . . . . . . . . . . . . . . . . . . 23.18 796.1.2 Population with tertiary education . . . . . . . . . . . . . . . . . . . . . . . . . . . . 33.31 466.1.3 Professionals . . . . . . . . . . . . . . . . . . . . . . . . . . . . . . . . . . . . . . . . . . . . . . . . . . 27.96 636.1.4 Researchers . . . . . . . . . . . . . . . . . . . . . . . . . . . . . . . . . . . . . . . . . . . . . . . . . . . . 0.35 986.1.5 Senior officials and managers . . . . . . . . . . . . . . . . . . . . . . . . . . . . . . . . .32.66 446.1.6 Availability of scientists and engineers . . . . . . . . . . . . . . . . . . . . . . . .46.66 686.2 Talent Impact . . . . . . . . . . . . . . . . . . . . . . . . . . . . . . . . . . . . . . . . . . . . . . . 13.00 956.2.1 Innovation output . . . . . . . . . . . . . . . . . . . . . . . . . . . . . . . . . . . . . . . . . . . . 27.15 716.2.2 High-value exports . . . . . . . . . . . . . . . . . . . . . . . . . . . . . . . . . . . . . . . . . . . . 17.04 646.2.3 New product entrepreneurial activity . . . . . . . . . . . . . . . . . . . . . . . . . 15.28 846.2.4 New business density . . . . . . . . . . . . . . . . . . . . . . . . . . . . . . . . . . . . . . . . . . 3.98 756.2.5 Scientific journal articles . . . . . . . . . . . . . . . . . . . . . . . . . . . . . . . . . . . . . . . 1.52 87
l Panama l Income group average
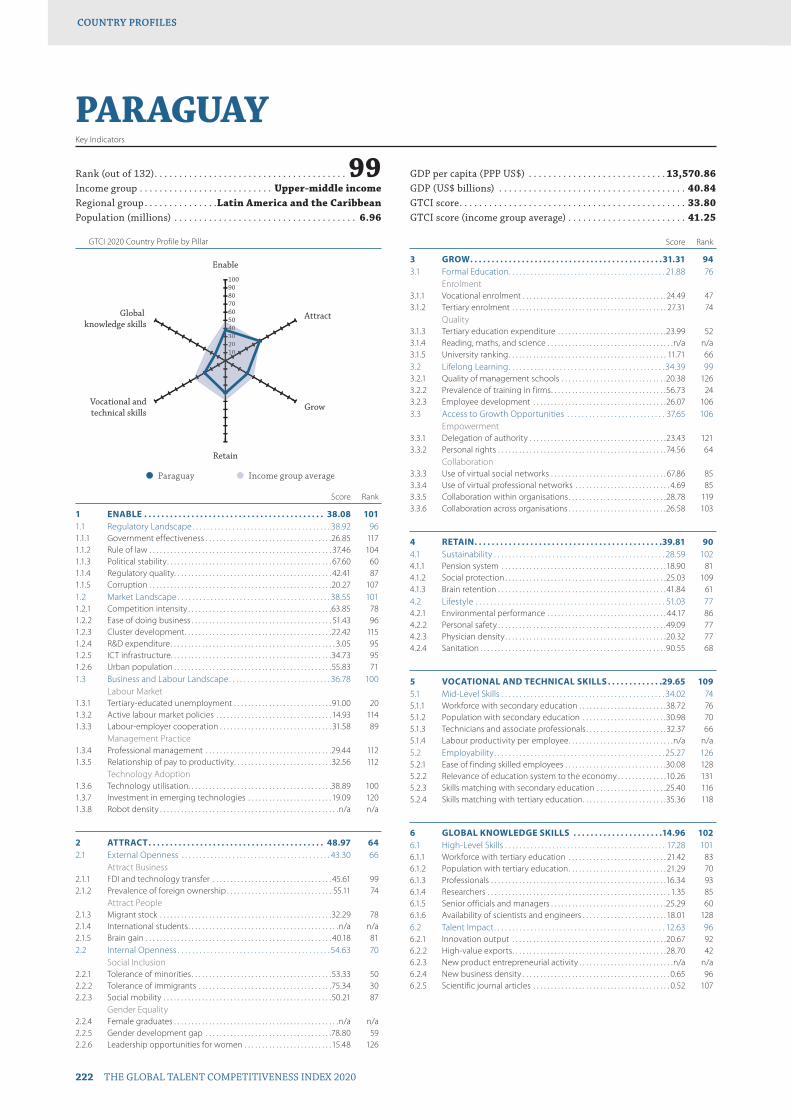
GTCI 2020 Country Profile by Pillar
222 THE GLOBAL TALENT COMPETITIVENESS INDEX 2020
COUNTRY PROFILESCOUNTRY PROFILES
102030405060708090100
Global knowledge skills
Vocational andtechnical skills
Retain
Grow
Attract
Enable
1020304040
PARAGUAYKey Indicators
Rank (out of 132) . . . . . . . . . . . . . . . . . . . . . . . . . . . . . . . . . . . . . . . 99Income group . . . . . . . . . . . . . . . . . . . . . . . . . . . Upper-middle incomeRegional group . . . . . . . . . . . . . . .Latin America and the CaribbeanPopulation (millions) . . . . . . . . . . . . . . . . . . . . . . . . . . . . . . . . . . . . . 6.96
GDP per capita (PPP US$) . . . . . . . . . . . . . . . . . . . . . . . . . . . . 13,570.86GDP (US$ billions) . . . . . . . . . . . . . . . . . . . . . . . . . . . . . . . . . . . . . . 40.84GTCI score . . . . . . . . . . . . . . . . . . . . . . . . . . . . . . . . . . . . . . . . . . . . . . 33.80GTCI score (income group average) . . . . . . . . . . . . . . . . . . . . . . . . 41.25
Score Rank
1 ENABLE . . . . . . . . . . . . . . . . . . . . . . . . . . . . . . . . . . . . . . . . . . 38.08 1011.1 Regulatory Landscape . . . . . . . . . . . . . . . . . . . . . . . . . . . . . . . . . . . . . . 38.92 961.1.1 Government effectiveness . . . . . . . . . . . . . . . . . . . . . . . . . . . . . . . . . . . .26.85 1171.1.2 Rule of law . . . . . . . . . . . . . . . . . . . . . . . . . . . . . . . . . . . . . . . . . . . . . . . . . . . . 37.46 1041.1.3 Political stability . . . . . . . . . . . . . . . . . . . . . . . . . . . . . . . . . . . . . . . . . . . . . . . 67.60 601.1.4 Regulatory quality. . . . . . . . . . . . . . . . . . . . . . . . . . . . . . . . . . . . . . . . . . . . . 42.41 871.1.5 Corruption . . . . . . . . . . . . . . . . . . . . . . . . . . . . . . . . . . . . . . . . . . . . . . . . . . . .20.27 1071.2 Market Landscape . . . . . . . . . . . . . . . . . . . . . . . . . . . . . . . . . . . . . . . . . . 38.55 1011.2.1 Competition intensity . . . . . . . . . . . . . . . . . . . . . . . . . . . . . . . . . . . . . . . . .63.85 781.2.2 Ease of doing business . . . . . . . . . . . . . . . . . . . . . . . . . . . . . . . . . . . . . . . . 51.43 961.2.3 Cluster development . . . . . . . . . . . . . . . . . . . . . . . . . . . . . . . . . . . . . . . . . .22.42 1151.2.4 R&D expenditure . . . . . . . . . . . . . . . . . . . . . . . . . . . . . . . . . . . . . . . . . . . . . . . 3.05 951.2.5 ICT infrastructure. . . . . . . . . . . . . . . . . . . . . . . . . . . . . . . . . . . . . . . . . . . . . .34.73 951.2.6 Urban population . . . . . . . . . . . . . . . . . . . . . . . . . . . . . . . . . . . . . . . . . . . . .55.83 711.3 Business and Labour Landscape . . . . . . . . . . . . . . . . . . . . . . . . . . . . 36.78 100
Labour Market1.3.1 Tertiary-educated unemployment . . . . . . . . . . . . . . . . . . . . . . . . . . . .91.00 201.3.2 Active labour market policies . . . . . . . . . . . . . . . . . . . . . . . . . . . . . . . . . 14.93 1141.3.3 Labour-employer cooperation . . . . . . . . . . . . . . . . . . . . . . . . . . . . . . . . 31.58 89
Management Practice1.3.4 Professional management . . . . . . . . . . . . . . . . . . . . . . . . . . . . . . . . . . . .29.44 1121.3.5 Relationship of pay to productivity . . . . . . . . . . . . . . . . . . . . . . . . . . . .32.56 112
Technology Adoption1.3.6 Technology utilisation. . . . . . . . . . . . . . . . . . . . . . . . . . . . . . . . . . . . . . . . .38.89 1001.3.7 Investment in emerging technologies . . . . . . . . . . . . . . . . . . . . . . . . 19.09 1201.3.8 Robot density . . . . . . . . . . . . . . . . . . . . . . . . . . . . . . . . . . . . . . . . . . . . . . . . . . .n/a n/a
2 ATTRACT . . . . . . . . . . . . . . . . . . . . . . . . . . . . . . . . . . . . . . . . . 48.97 642.1 External Openness . . . . . . . . . . . . . . . . . . . . . . . . . . . . . . . . . . . . . . . . . 43.30 66
Attract Business2.1.1 FDI and technology transfer . . . . . . . . . . . . . . . . . . . . . . . . . . . . . . . . . . 45.61 992.1.2 Prevalence of foreign ownership . . . . . . . . . . . . . . . . . . . . . . . . . . . . . . 55.11 74
Attract People2.1.3 Migrant stock . . . . . . . . . . . . . . . . . . . . . . . . . . . . . . . . . . . . . . . . . . . . . . . . .32.29 782.1.4 International students . . . . . . . . . . . . . . . . . . . . . . . . . . . . . . . . . . . . . . . . . . .n/a n/a2.1.5 Brain gain . . . . . . . . . . . . . . . . . . . . . . . . . . . . . . . . . . . . . . . . . . . . . . . . . . . . . 40.18 812.2 Internal Openness . . . . . . . . . . . . . . . . . . . . . . . . . . . . . . . . . . . . . . . . . . 54.63 70
Social Inclusion2.2.1 Tolerance of minorities . . . . . . . . . . . . . . . . . . . . . . . . . . . . . . . . . . . . . . . .53.33 502.2.2 Tolerance of immigrants . . . . . . . . . . . . . . . . . . . . . . . . . . . . . . . . . . . . . .75.34 302.2.3 Social mobility . . . . . . . . . . . . . . . . . . . . . . . . . . . . . . . . . . . . . . . . . . . . . . . .50.21 87
Gender Equality2.2.4 Female graduates . . . . . . . . . . . . . . . . . . . . . . . . . . . . . . . . . . . . . . . . . . . . . . .n/a n/a2.2.5 Gender development gap . . . . . . . . . . . . . . . . . . . . . . . . . . . . . . . . . . . .78.80 592.2.6 Leadership opportunities for women . . . . . . . . . . . . . . . . . . . . . . . . . 15.48 126
Score Rank
3 GROW . . . . . . . . . . . . . . . . . . . . . . . . . . . . . . . . . . . . . . . . . . . . .31.31 943.1 Formal Education . . . . . . . . . . . . . . . . . . . . . . . . . . . . . . . . . . . . . . . . . . . 21.88 76
Enrolment3.1.1 Vocational enrolment . . . . . . . . . . . . . . . . . . . . . . . . . . . . . . . . . . . . . . . . . 24.49 473.1.2 Tertiary enrolment . . . . . . . . . . . . . . . . . . . . . . . . . . . . . . . . . . . . . . . . . . . . 27.31 74
Quality3.1.3 Tertiary education expenditure . . . . . . . . . . . . . . . . . . . . . . . . . . . . . . .23.99 523.1.4 Reading, maths, and science . . . . . . . . . . . . . . . . . . . . . . . . . . . . . . . . . . . .n/a n/a3.1.5 University ranking . . . . . . . . . . . . . . . . . . . . . . . . . . . . . . . . . . . . . . . . . . . . . 11.71 663.2 Lifelong Learning . . . . . . . . . . . . . . . . . . . . . . . . . . . . . . . . . . . . . . . . . . . 34.39 993.2.1 Quality of management schools . . . . . . . . . . . . . . . . . . . . . . . . . . . . . .20.38 1263.2.2 Prevalence of training in firms . . . . . . . . . . . . . . . . . . . . . . . . . . . . . . . . .56.73 243.2.3 Employee development . . . . . . . . . . . . . . . . . . . . . . . . . . . . . . . . . . . . . .26.07 1063.3 Access to Growth Opportunities . . . . . . . . . . . . . . . . . . . . . . . . . . . 37.65 106
Empowerment3.3.1 Delegation of authority . . . . . . . . . . . . . . . . . . . . . . . . . . . . . . . . . . . . . . .23.43 1213.3.2 Personal rights . . . . . . . . . . . . . . . . . . . . . . . . . . . . . . . . . . . . . . . . . . . . . . . .74.56 64
Collaboration3.3.3 Use of virtual social networks . . . . . . . . . . . . . . . . . . . . . . . . . . . . . . . . . 67.86 853.3.4 Use of virtual professional networks . . . . . . . . . . . . . . . . . . . . . . . . . . . 4.69 853.3.5 Collaboration within organisations . . . . . . . . . . . . . . . . . . . . . . . . . . . .28.78 1193.3.6 Collaboration across organisations . . . . . . . . . . . . . . . . . . . . . . . . . . . .26.58 103
4 RETAIN . . . . . . . . . . . . . . . . . . . . . . . . . . . . . . . . . . . . . . . . . . . .39.81 904.1 Sustainability . . . . . . . . . . . . . . . . . . . . . . . . . . . . . . . . . . . . . . . . . . . . . . . 28.59 1024.1.1 Pension system . . . . . . . . . . . . . . . . . . . . . . . . . . . . . . . . . . . . . . . . . . . . . . .18.90 814.1.2 Social protection . . . . . . . . . . . . . . . . . . . . . . . . . . . . . . . . . . . . . . . . . . . . . .25.03 1094.1.3 Brain retention . . . . . . . . . . . . . . . . . . . . . . . . . . . . . . . . . . . . . . . . . . . . . . . . 41.84 614.2 Lifestyle . . . . . . . . . . . . . . . . . . . . . . . . . . . . . . . . . . . . . . . . . . . . . . . . . . . . 51.03 774.2.1 Environmental performance . . . . . . . . . . . . . . . . . . . . . . . . . . . . . . . . . . 44.17 864.2.2 Personal safety . . . . . . . . . . . . . . . . . . . . . . . . . . . . . . . . . . . . . . . . . . . . . . . .49.09 774.2.3 Physician density . . . . . . . . . . . . . . . . . . . . . . . . . . . . . . . . . . . . . . . . . . . . . .20.32 774.2.4 Sanitation . . . . . . . . . . . . . . . . . . . . . . . . . . . . . . . . . . . . . . . . . . . . . . . . . . . . .90.55 68
5 VOCATIONAL AND TECHNICAL SKILLS . . . . . . . . . . . . .29.65 1095.1 Mid-Level Skills . . . . . . . . . . . . . . . . . . . . . . . . . . . . . . . . . . . . . . . . . . . . . 34.02 745.1.1 Workforce with secondary education . . . . . . . . . . . . . . . . . . . . . . . . .38.72 765.1.2 Population with secondary education . . . . . . . . . . . . . . . . . . . . . . . .30.98 705.1.3 Technicians and associate professionals . . . . . . . . . . . . . . . . . . . . . . .32.37 665.1.4 Labour productivity per employee . . . . . . . . . . . . . . . . . . . . . . . . . . . . . .n/a n/a5.2 Employability . . . . . . . . . . . . . . . . . . . . . . . . . . . . . . . . . . . . . . . . . . . . . . . 25.27 1265.2.1 Ease of finding skilled employees . . . . . . . . . . . . . . . . . . . . . . . . . . . . .30.08 1285.2.2 Relevance of education system to the economy . . . . . . . . . . . . . .10.26 1315.2.3 Skills matching with secondary education . . . . . . . . . . . . . . . . . . . .25.40 1165.2.4 Skills matching with tertiary education . . . . . . . . . . . . . . . . . . . . . . . .35.36 118
6 GLOBAL KNOWLEDGE SKILLS . . . . . . . . . . . . . . . . . . . . .14.96 1026.1 High-Level Skills . . . . . . . . . . . . . . . . . . . . . . . . . . . . . . . . . . . . . . . . . . . . 17.28 1016.1.1 Workforce with tertiary education . . . . . . . . . . . . . . . . . . . . . . . . . . . . 21.42 836.1.2 Population with tertiary education . . . . . . . . . . . . . . . . . . . . . . . . . . . . 21.29 706.1.3 Professionals . . . . . . . . . . . . . . . . . . . . . . . . . . . . . . . . . . . . . . . . . . . . . . . . . .16.34 936.1.4 Researchers . . . . . . . . . . . . . . . . . . . . . . . . . . . . . . . . . . . . . . . . . . . . . . . . . . . . 1.35 856.1.5 Senior officials and managers . . . . . . . . . . . . . . . . . . . . . . . . . . . . . . . . .25.29 606.1.6 Availability of scientists and engineers . . . . . . . . . . . . . . . . . . . . . . . . 18.01 1286.2 Talent Impact . . . . . . . . . . . . . . . . . . . . . . . . . . . . . . . . . . . . . . . . . . . . . . . 12.63 966.2.1 Innovation output . . . . . . . . . . . . . . . . . . . . . . . . . . . . . . . . . . . . . . . . . . . .20.67 926.2.2 High-value exports . . . . . . . . . . . . . . . . . . . . . . . . . . . . . . . . . . . . . . . . . . . .28.70 426.2.3 New product entrepreneurial activity . . . . . . . . . . . . . . . . . . . . . . . . . . .n/a n/a6.2.4 New business density . . . . . . . . . . . . . . . . . . . . . . . . . . . . . . . . . . . . . . . . . . 0.65 966.2.5 Scientific journal articles . . . . . . . . . . . . . . . . . . . . . . . . . . . . . . . . . . . . . . . 0.52 107
l Paraguay l Income group average

GTCI 2020 Country Profile by Pillar
THE GLOBAL TALENT COMPETITIVENESS INDEX 2020 223
COUNTRY PROFILESCOUNTRY PROFILES
102030405060708090100
Global knowledge skills
Vocational andtechnical skills
Retain
Grow
Attract
Enable
1020304040
PERUKey Indicators
Rank (out of 132) . . . . . . . . . . . . . . . . . . . . . . . . . . . . . . . . . . . . . . . 77Income group . . . . . . . . . . . . . . . . . . . . . . . . . . . Upper-middle incomeRegional group . . . . . . . . . . . . . . .Latin America and the CaribbeanPopulation (millions) . . . . . . . . . . . . . . . . . . . . . . . . . . . . . . . . . . . . 31.99
GDP per capita (PPP US$) . . . . . . . . . . . . . . . . . . . . . . . . . . . . 14,393.45GDP (US$ billions) . . . . . . . . . . . . . . . . . . . . . . . . . . . . . . . . . . . . . 222.24GTCI score . . . . . . . . . . . . . . . . . . . . . . . . . . . . . . . . . . . . . . . . . . . . . . 38.68GTCI score (income group average) . . . . . . . . . . . . . . . . . . . . . . . . 41.25
Score Rank
1 ENABLE . . . . . . . . . . . . . . . . . . . . . . . . . . . . . . . . . . . . . . . . . . 43.06 871.1 Regulatory Landscape . . . . . . . . . . . . . . . . . . . . . . . . . . . . . . . . . . . . . . 46.11 751.1.1 Government effectiveness . . . . . . . . . . . . . . . . . . . . . . . . . . . . . . . . . . . .43.44 801.1.2 Rule of law . . . . . . . . . . . . . . . . . . . . . . . . . . . . . . . . . . . . . . . . . . . . . . . . . . . .40.96 981.1.3 Political stability . . . . . . . . . . . . . . . . . . . . . . . . . . . . . . . . . . . . . . . . . . . . . . .59.40 801.1.4 Regulatory quality. . . . . . . . . . . . . . . . . . . . . . . . . . . . . . . . . . . . . . . . . . . . .58.35 511.1.5 Corruption . . . . . . . . . . . . . . . . . . . . . . . . . . . . . . . . . . . . . . . . . . . . . . . . . . . .28.38 871.2 Market Landscape . . . . . . . . . . . . . . . . . . . . . . . . . . . . . . . . . . . . . . . . . .48.82 721.2.1 Competition intensity . . . . . . . . . . . . . . . . . . . . . . . . . . . . . . . . . . . . . . . . . 75.42 411.2.2 Ease of doing business . . . . . . . . . . . . . . . . . . . . . . . . . . . . . . . . . . . . . . . .68.27 631.2.3 Cluster development . . . . . . . . . . . . . . . . . . . . . . . . . . . . . . . . . . . . . . . . . . 31.33 961.2.4 R&D expenditure . . . . . . . . . . . . . . . . . . . . . . . . . . . . . . . . . . . . . . . . . . . . . . . 2.32 1021.2.5 ICT infrastructure. . . . . . . . . . . . . . . . . . . . . . . . . . . . . . . . . . . . . . . . . . . . . .40.97 831.2.6 Urban population . . . . . . . . . . . . . . . . . . . . . . . . . . . . . . . . . . . . . . . . . . . . .74.60 381.3 Business and Labour Landscape . . . . . . . . . . . . . . . . . . . . . . . . . . . . 34.26 108
Labour Market1.3.1 Tertiary-educated unemployment . . . . . . . . . . . . . . . . . . . . . . . . . . . .84.23 511.3.2 Active labour market policies . . . . . . . . . . . . . . . . . . . . . . . . . . . . . . . . .12.66 1211.3.3 Labour-employer cooperation . . . . . . . . . . . . . . . . . . . . . . . . . . . . . . . . 27.77 97
Management Practice1.3.4 Professional management . . . . . . . . . . . . . . . . . . . . . . . . . . . . . . . . . . . .44.75 801.3.5 Relationship of pay to productivity . . . . . . . . . . . . . . . . . . . . . . . . . . . .38.36 93
Technology Adoption1.3.6 Technology utilisation. . . . . . . . . . . . . . . . . . . . . . . . . . . . . . . . . . . . . . . . .40.97 951.3.7 Investment in emerging technologies . . . . . . . . . . . . . . . . . . . . . . . . 25.15 1071.3.8 Robot density . . . . . . . . . . . . . . . . . . . . . . . . . . . . . . . . . . . . . . . . . . . . . . . . . . 0.19 61
2 ATTRACT . . . . . . . . . . . . . . . . . . . . . . . . . . . . . . . . . . . . . . . . . . 47.15 752.1 External Openness . . . . . . . . . . . . . . . . . . . . . . . . . . . . . . . . . . . . . . . . . 43.20 67
Attract Business2.1.1 FDI and technology transfer . . . . . . . . . . . . . . . . . . . . . . . . . . . . . . . . . .58.52 622.1.2 Prevalence of foreign ownership . . . . . . . . . . . . . . . . . . . . . . . . . . . . . .65.73 50
Attract People2.1.3 Migrant stock . . . . . . . . . . . . . . . . . . . . . . . . . . . . . . . . . . . . . . . . . . . . . . . . . . 5.28 1242.1.4 International students . . . . . . . . . . . . . . . . . . . . . . . . . . . . . . . . . . . . . . . . . . .n/a n/a2.1.5 Brain gain . . . . . . . . . . . . . . . . . . . . . . . . . . . . . . . . . . . . . . . . . . . . . . . . . . . . .43.29 672.2 Internal Openness . . . . . . . . . . . . . . . . . . . . . . . . . . . . . . . . . . . . . . . . . . 51.10 93
Social Inclusion2.2.1 Tolerance of minorities . . . . . . . . . . . . . . . . . . . . . . . . . . . . . . . . . . . . . . . .22.22 1032.2.2 Tolerance of immigrants . . . . . . . . . . . . . . . . . . . . . . . . . . . . . . . . . . . . . . 67.12 462.2.3 Social mobility . . . . . . . . . . . . . . . . . . . . . . . . . . . . . . . . . . . . . . . . . . . . . . . . 51.59 82
Gender Equality2.2.4 Female graduates . . . . . . . . . . . . . . . . . . . . . . . . . . . . . . . . . . . . . . . . . . . . .72.90 622.2.5 Gender development gap . . . . . . . . . . . . . . . . . . . . . . . . . . . . . . . . . . . .71.04 832.2.6 Leadership opportunities for women . . . . . . . . . . . . . . . . . . . . . . . . . 21.71 117
Score Rank
3 GROW . . . . . . . . . . . . . . . . . . . . . . . . . . . . . . . . . . . . . . . . . . . . 36.43 763.1 Formal Education . . . . . . . . . . . . . . . . . . . . . . . . . . . . . . . . . . . . . . . . . . . 22.68 73
Enrolment3.1.1 Vocational enrolment . . . . . . . . . . . . . . . . . . . . . . . . . . . . . . . . . . . . . . . . . . 3.00 1073.1.2 Tertiary enrolment . . . . . . . . . . . . . . . . . . . . . . . . . . . . . . . . . . . . . . . . . . . .54.81 27
Quality3.1.3 Tertiary education expenditure . . . . . . . . . . . . . . . . . . . . . . . . . . . . . . .13.66 873.1.4 Reading, maths, and science . . . . . . . . . . . . . . . . . . . . . . . . . . . . . . . . . .25.67 633.1.5 University ranking . . . . . . . . . . . . . . . . . . . . . . . . . . . . . . . . . . . . . . . . . . . . .16.26 563.2 Lifelong Learning . . . . . . . . . . . . . . . . . . . . . . . . . . . . . . . . . . . . . . . . . . . 47.09 533.2.1 Quality of management schools . . . . . . . . . . . . . . . . . . . . . . . . . . . . . .38.04 923.2.2 Prevalence of training in firms . . . . . . . . . . . . . . . . . . . . . . . . . . . . . . . . .82.45 43.2.3 Employee development . . . . . . . . . . . . . . . . . . . . . . . . . . . . . . . . . . . . . .20.77 1203.3 Access to Growth Opportunities . . . . . . . . . . . . . . . . . . . . . . . . . . . 39.53 100
Empowerment3.3.1 Delegation of authority . . . . . . . . . . . . . . . . . . . . . . . . . . . . . . . . . . . . . . . 37.39 903.3.2 Personal rights . . . . . . . . . . . . . . . . . . . . . . . . . . . . . . . . . . . . . . . . . . . . . . . .76.49 63
Collaboration3.3.3 Use of virtual social networks . . . . . . . . . . . . . . . . . . . . . . . . . . . . . . . . .66.43 893.3.4 Use of virtual professional networks . . . . . . . . . . . . . . . . . . . . . . . . . . . 0.90 1143.3.5 Collaboration within organisations . . . . . . . . . . . . . . . . . . . . . . . . . . . .30.49 1163.3.6 Collaboration across organisations . . . . . . . . . . . . . . . . . . . . . . . . . . . .25.49 107
4 RETAIN . . . . . . . . . . . . . . . . . . . . . . . . . . . . . . . . . . . . . . . . . . . .39.93 894.1 Sustainability . . . . . . . . . . . . . . . . . . . . . . . . . . . . . . . . . . . . . . . . . . . . . . . 30.95 974.1.1 Pension system . . . . . . . . . . . . . . . . . . . . . . . . . . . . . . . . . . . . . . . . . . . . . . .24.28 774.1.2 Social protection . . . . . . . . . . . . . . . . . . . . . . . . . . . . . . . . . . . . . . . . . . . . . .28.64 1034.1.3 Brain retention . . . . . . . . . . . . . . . . . . . . . . . . . . . . . . . . . . . . . . . . . . . . . . . . 39.92 674.2 Lifestyle . . . . . . . . . . . . . . . . . . . . . . . . . . . . . . . . . . . . . . . . . . . . . . . . . . . .48.90 854.2.1 Environmental performance . . . . . . . . . . . . . . . . . . . . . . . . . . . . . . . . . . 57.49 574.2.2 Personal safety . . . . . . . . . . . . . . . . . . . . . . . . . . . . . . . . . . . . . . . . . . . . . . . .45.48 844.2.3 Physician density . . . . . . . . . . . . . . . . . . . . . . . . . . . . . . . . . . . . . . . . . . . . . . 17.59 814.2.4 Sanitation . . . . . . . . . . . . . . . . . . . . . . . . . . . . . . . . . . . . . . . . . . . . . . . . . . . . .75.05 89
5 VOCATIONAL AND TECHNICAL SKILLS . . . . . . . . . . . . .41.44 725.1 Mid-Level Skills . . . . . . . . . . . . . . . . . . . . . . . . . . . . . . . . . . . . . . . . . . . . . 47.49 535.1.1 Workforce with secondary education . . . . . . . . . . . . . . . . . . . . . . . . . 71.78 235.1.2 Population with secondary education . . . . . . . . . . . . . . . . . . . . . . . .48.93 465.1.3 Technicians and associate professionals . . . . . . . . . . . . . . . . . . . . . . .54.45 365.1.4 Labour productivity per employee . . . . . . . . . . . . . . . . . . . . . . . . . . . . 14.79 765.2 Employability . . . . . . . . . . . . . . . . . . . . . . . . . . . . . . . . . . . . . . . . . . . . . . . 35.40 1085.2.1 Ease of finding skilled employees . . . . . . . . . . . . . . . . . . . . . . . . . . . . .42.34 1015.2.2 Relevance of education system to the economy . . . . . . . . . . . . . . 19.99 1225.2.3 Skills matching with secondary education . . . . . . . . . . . . . . . . . . . . 31.02 1025.2.4 Skills matching with tertiary education . . . . . . . . . . . . . . . . . . . . . . . .48.24 81
6 GLOBAL KNOWLEDGE SKILLS . . . . . . . . . . . . . . . . . . . . 24.04 736.1 High-Level Skills . . . . . . . . . . . . . . . . . . . . . . . . . . . . . . . . . . . . . . . . . . . . 28.80 696.1.1 Workforce with tertiary education . . . . . . . . . . . . . . . . . . . . . . . . . . . .44.79 386.1.2 Population with tertiary education . . . . . . . . . . . . . . . . . . . . . . . . . . . .32.52 496.1.3 Professionals . . . . . . . . . . . . . . . . . . . . . . . . . . . . . . . . . . . . . . . . . . . . . . . . . . 28.74 616.1.4 Researchers . . . . . . . . . . . . . . . . . . . . . . . . . . . . . . . . . . . . . . . . . . . . . . . . . . . . .n/a n/a6.1.5 Senior officials and managers . . . . . . . . . . . . . . . . . . . . . . . . . . . . . . . . . . 2.53 1216.1.6 Availability of scientists and engineers . . . . . . . . . . . . . . . . . . . . . . . . 35.41 1046.2 Talent Impact . . . . . . . . . . . . . . . . . . . . . . . . . . . . . . . . . . . . . . . . . . . . . . . 19.29 746.2.1 Innovation output . . . . . . . . . . . . . . . . . . . . . . . . . . . . . . . . . . . . . . . . . . . .22.77 846.2.2 High-value exports . . . . . . . . . . . . . . . . . . . . . . . . . . . . . . . . . . . . . . . . . . . .13.86 766.2.3 New product entrepreneurial activity . . . . . . . . . . . . . . . . . . . . . . . . . 41.13 546.2.4 New business density . . . . . . . . . . . . . . . . . . . . . . . . . . . . . . . . . . . . . . . . . 17.45 346.2.5 Scientific journal articles . . . . . . . . . . . . . . . . . . . . . . . . . . . . . . . . . . . . . . . 1.25 90
l Peru l Income group average
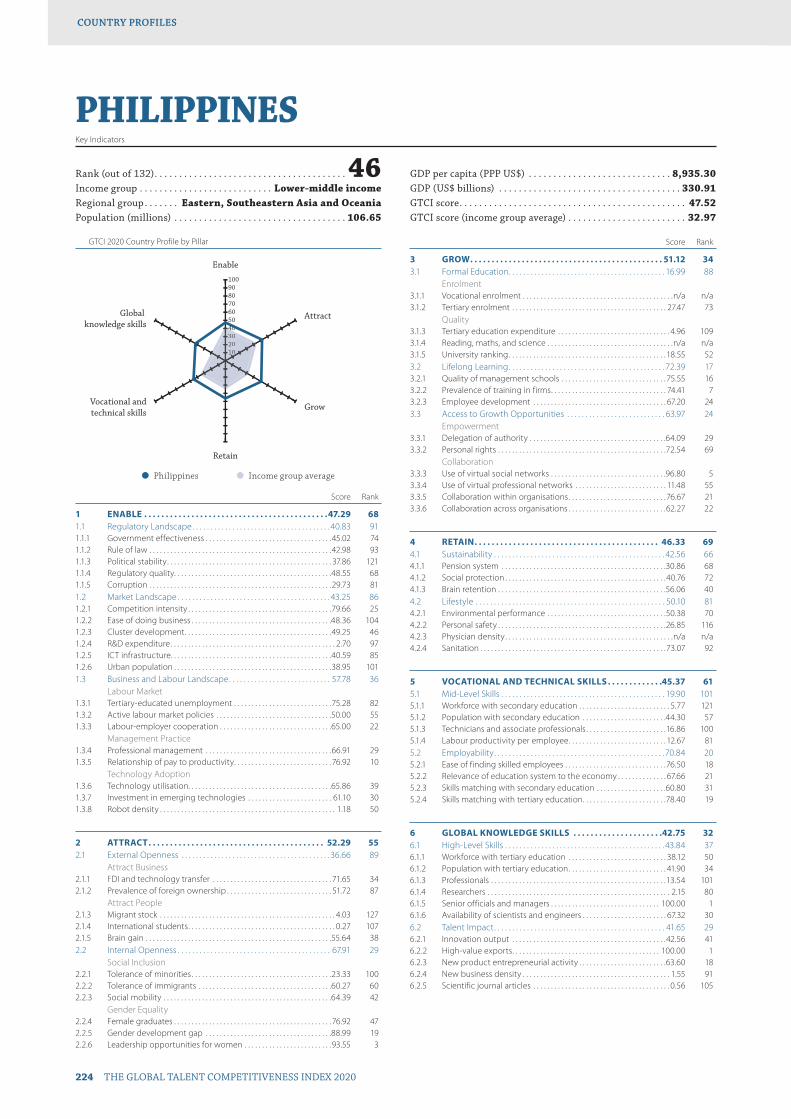
GTCI 2020 Country Profile by Pillar
224 THE GLOBAL TALENT COMPETITIVENESS INDEX 2020
COUNTRY PROFILESCOUNTRY PROFILES
102030405060708090100
Global knowledge skills
Vocational andtechnical skills
Retain
Grow
Attract
Enable
10203004
PHILIPPINESKey Indicators
Rank (out of 132) . . . . . . . . . . . . . . . . . . . . . . . . . . . . . . . . . . . . . . . 46Income group . . . . . . . . . . . . . . . . . . . . . . . . . . . Lower-middle incomeRegional group . . . . . . . Eastern, Southeastern Asia and OceaniaPopulation (millions) . . . . . . . . . . . . . . . . . . . . . . . . . . . . . . . . . . . 106.65
GDP per capita (PPP US$) . . . . . . . . . . . . . . . . . . . . . . . . . . . . . 8,935.30GDP (US$ billions) . . . . . . . . . . . . . . . . . . . . . . . . . . . . . . . . . . . . . 330.91GTCI score . . . . . . . . . . . . . . . . . . . . . . . . . . . . . . . . . . . . . . . . . . . . . . 47.52GTCI score (income group average) . . . . . . . . . . . . . . . . . . . . . . . . 32.97
Score Rank
1 ENABLE . . . . . . . . . . . . . . . . . . . . . . . . . . . . . . . . . . . . . . . . . . .47.29 681.1 Regulatory Landscape . . . . . . . . . . . . . . . . . . . . . . . . . . . . . . . . . . . . . . 40.83 911.1.1 Government effectiveness . . . . . . . . . . . . . . . . . . . . . . . . . . . . . . . . . . . .45.02 741.1.2 Rule of law . . . . . . . . . . . . . . . . . . . . . . . . . . . . . . . . . . . . . . . . . . . . . . . . . . . .42.98 931.1.3 Political stability . . . . . . . . . . . . . . . . . . . . . . . . . . . . . . . . . . . . . . . . . . . . . . . 37.86 1211.1.4 Regulatory quality. . . . . . . . . . . . . . . . . . . . . . . . . . . . . . . . . . . . . . . . . . . . .48.55 681.1.5 Corruption . . . . . . . . . . . . . . . . . . . . . . . . . . . . . . . . . . . . . . . . . . . . . . . . . . . .29.73 811.2 Market Landscape . . . . . . . . . . . . . . . . . . . . . . . . . . . . . . . . . . . . . . . . . . 43.25 861.2.1 Competition intensity . . . . . . . . . . . . . . . . . . . . . . . . . . . . . . . . . . . . . . . . .79.66 251.2.2 Ease of doing business . . . . . . . . . . . . . . . . . . . . . . . . . . . . . . . . . . . . . . . .48.36 1041.2.3 Cluster development . . . . . . . . . . . . . . . . . . . . . . . . . . . . . . . . . . . . . . . . . .49.25 461.2.4 R&D expenditure . . . . . . . . . . . . . . . . . . . . . . . . . . . . . . . . . . . . . . . . . . . . . . . 2.70 971.2.5 ICT infrastructure. . . . . . . . . . . . . . . . . . . . . . . . . . . . . . . . . . . . . . . . . . . . . .40.59 851.2.6 Urban population . . . . . . . . . . . . . . . . . . . . . . . . . . . . . . . . . . . . . . . . . . . . .38.95 1011.3 Business and Labour Landscape . . . . . . . . . . . . . . . . . . . . . . . . . . . . 57.78 36
Labour Market1.3.1 Tertiary-educated unemployment . . . . . . . . . . . . . . . . . . . . . . . . . . . .75.28 821.3.2 Active labour market policies . . . . . . . . . . . . . . . . . . . . . . . . . . . . . . . . .50.00 551.3.3 Labour-employer cooperation . . . . . . . . . . . . . . . . . . . . . . . . . . . . . . . .65.00 22
Management Practice1.3.4 Professional management . . . . . . . . . . . . . . . . . . . . . . . . . . . . . . . . . . . .66.91 291.3.5 Relationship of pay to productivity . . . . . . . . . . . . . . . . . . . . . . . . . . . . 76.92 10
Technology Adoption1.3.6 Technology utilisation. . . . . . . . . . . . . . . . . . . . . . . . . . . . . . . . . . . . . . . . .65.86 391.3.7 Investment in emerging technologies . . . . . . . . . . . . . . . . . . . . . . . . 61.10 301.3.8 Robot density . . . . . . . . . . . . . . . . . . . . . . . . . . . . . . . . . . . . . . . . . . . . . . . . . . 1.18 50
2 ATTRACT . . . . . . . . . . . . . . . . . . . . . . . . . . . . . . . . . . . . . . . . . 52.29 552.1 External Openness . . . . . . . . . . . . . . . . . . . . . . . . . . . . . . . . . . . . . . . . .36.66 89
Attract Business2.1.1 FDI and technology transfer . . . . . . . . . . . . . . . . . . . . . . . . . . . . . . . . . . 71.65 342.1.2 Prevalence of foreign ownership . . . . . . . . . . . . . . . . . . . . . . . . . . . . . . 51.72 87
Attract People2.1.3 Migrant stock . . . . . . . . . . . . . . . . . . . . . . . . . . . . . . . . . . . . . . . . . . . . . . . . . . 4.03 1272.1.4 International students . . . . . . . . . . . . . . . . . . . . . . . . . . . . . . . . . . . . . . . . . . 0.27 1072.1.5 Brain gain . . . . . . . . . . . . . . . . . . . . . . . . . . . . . . . . . . . . . . . . . . . . . . . . . . . . .55.64 382.2 Internal Openness . . . . . . . . . . . . . . . . . . . . . . . . . . . . . . . . . . . . . . . . . . 67.91 29
Social Inclusion2.2.1 Tolerance of minorities . . . . . . . . . . . . . . . . . . . . . . . . . . . . . . . . . . . . . . . .23.33 1002.2.2 Tolerance of immigrants . . . . . . . . . . . . . . . . . . . . . . . . . . . . . . . . . . . . . .60.27 602.2.3 Social mobility . . . . . . . . . . . . . . . . . . . . . . . . . . . . . . . . . . . . . . . . . . . . . . . .64.39 42
Gender Equality2.2.4 Female graduates . . . . . . . . . . . . . . . . . . . . . . . . . . . . . . . . . . . . . . . . . . . . . 76.92 472.2.5 Gender development gap . . . . . . . . . . . . . . . . . . . . . . . . . . . . . . . . . . . .88.99 192.2.6 Leadership opportunities for women . . . . . . . . . . . . . . . . . . . . . . . . .93.55 3
Score Rank
3 GROW . . . . . . . . . . . . . . . . . . . . . . . . . . . . . . . . . . . . . . . . . . . . . 51.12 343.1 Formal Education . . . . . . . . . . . . . . . . . . . . . . . . . . . . . . . . . . . . . . . . . . . 16.99 88
Enrolment3.1.1 Vocational enrolment . . . . . . . . . . . . . . . . . . . . . . . . . . . . . . . . . . . . . . . . . . .n/a n/a3.1.2 Tertiary enrolment . . . . . . . . . . . . . . . . . . . . . . . . . . . . . . . . . . . . . . . . . . . . 27.47 73
Quality3.1.3 Tertiary education expenditure . . . . . . . . . . . . . . . . . . . . . . . . . . . . . . . . 4.96 1093.1.4 Reading, maths, and science . . . . . . . . . . . . . . . . . . . . . . . . . . . . . . . . . . . .n/a n/a3.1.5 University ranking . . . . . . . . . . . . . . . . . . . . . . . . . . . . . . . . . . . . . . . . . . . . . 18.55 523.2 Lifelong Learning . . . . . . . . . . . . . . . . . . . . . . . . . . . . . . . . . . . . . . . . . . . 72.39 173.2.1 Quality of management schools . . . . . . . . . . . . . . . . . . . . . . . . . . . . . .75.55 163.2.2 Prevalence of training in firms . . . . . . . . . . . . . . . . . . . . . . . . . . . . . . . . . 74.41 73.2.3 Employee development . . . . . . . . . . . . . . . . . . . . . . . . . . . . . . . . . . . . . . 67.20 243.3 Access to Growth Opportunities . . . . . . . . . . . . . . . . . . . . . . . . . . . 63.97 24
Empowerment3.3.1 Delegation of authority . . . . . . . . . . . . . . . . . . . . . . . . . . . . . . . . . . . . . . .64.09 293.3.2 Personal rights . . . . . . . . . . . . . . . . . . . . . . . . . . . . . . . . . . . . . . . . . . . . . . . .72.54 69
Collaboration3.3.3 Use of virtual social networks . . . . . . . . . . . . . . . . . . . . . . . . . . . . . . . . .96.80 53.3.4 Use of virtual professional networks . . . . . . . . . . . . . . . . . . . . . . . . . . 11.48 553.3.5 Collaboration within organisations . . . . . . . . . . . . . . . . . . . . . . . . . . . .76.67 213.3.6 Collaboration across organisations . . . . . . . . . . . . . . . . . . . . . . . . . . . .62.27 22
4 RETAIN . . . . . . . . . . . . . . . . . . . . . . . . . . . . . . . . . . . . . . . . . . . 46.33 694.1 Sustainability . . . . . . . . . . . . . . . . . . . . . . . . . . . . . . . . . . . . . . . . . . . . . . . 42.56 664.1.1 Pension system . . . . . . . . . . . . . . . . . . . . . . . . . . . . . . . . . . . . . . . . . . . . . . .30.86 684.1.2 Social protection . . . . . . . . . . . . . . . . . . . . . . . . . . . . . . . . . . . . . . . . . . . . . .40.76 724.1.3 Brain retention . . . . . . . . . . . . . . . . . . . . . . . . . . . . . . . . . . . . . . . . . . . . . . . .56.06 404.2 Lifestyle . . . . . . . . . . . . . . . . . . . . . . . . . . . . . . . . . . . . . . . . . . . . . . . . . . . . 50.10 814.2.1 Environmental performance . . . . . . . . . . . . . . . . . . . . . . . . . . . . . . . . . .50.38 704.2.2 Personal safety . . . . . . . . . . . . . . . . . . . . . . . . . . . . . . . . . . . . . . . . . . . . . . . .26.85 1164.2.3 Physician density . . . . . . . . . . . . . . . . . . . . . . . . . . . . . . . . . . . . . . . . . . . . . . . .n/a n/a4.2.4 Sanitation . . . . . . . . . . . . . . . . . . . . . . . . . . . . . . . . . . . . . . . . . . . . . . . . . . . . .73.07 92
5 VOCATIONAL AND TECHNICAL SKILLS . . . . . . . . . . . . .45.37 615.1 Mid-Level Skills . . . . . . . . . . . . . . . . . . . . . . . . . . . . . . . . . . . . . . . . . . . . . 19.90 1015.1.1 Workforce with secondary education . . . . . . . . . . . . . . . . . . . . . . . . . . 5.77 1215.1.2 Population with secondary education . . . . . . . . . . . . . . . . . . . . . . . .44.30 575.1.3 Technicians and associate professionals . . . . . . . . . . . . . . . . . . . . . . .16.86 1005.1.4 Labour productivity per employee . . . . . . . . . . . . . . . . . . . . . . . . . . . . 12.67 815.2 Employability . . . . . . . . . . . . . . . . . . . . . . . . . . . . . . . . . . . . . . . . . . . . . . . 70.84 205.2.1 Ease of finding skilled employees . . . . . . . . . . . . . . . . . . . . . . . . . . . . .76.50 185.2.2 Relevance of education system to the economy . . . . . . . . . . . . . . 67.66 215.2.3 Skills matching with secondary education . . . . . . . . . . . . . . . . . . . .60.80 315.2.4 Skills matching with tertiary education . . . . . . . . . . . . . . . . . . . . . . . .78.40 19
6 GLOBAL KNOWLEDGE SKILLS . . . . . . . . . . . . . . . . . . . . .42.75 326.1 High-Level Skills . . . . . . . . . . . . . . . . . . . . . . . . . . . . . . . . . . . . . . . . . . . . 43.84 376.1.1 Workforce with tertiary education . . . . . . . . . . . . . . . . . . . . . . . . . . . . 38.12 506.1.2 Population with tertiary education . . . . . . . . . . . . . . . . . . . . . . . . . . . . 41.90 346.1.3 Professionals . . . . . . . . . . . . . . . . . . . . . . . . . . . . . . . . . . . . . . . . . . . . . . . . . .13.54 1016.1.4 Researchers . . . . . . . . . . . . . . . . . . . . . . . . . . . . . . . . . . . . . . . . . . . . . . . . . . . . 2.15 806.1.5 Senior officials and managers . . . . . . . . . . . . . . . . . . . . . . . . . . . . . . . 100.00 16.1.6 Availability of scientists and engineers . . . . . . . . . . . . . . . . . . . . . . . . 67.32 306.2 Talent Impact . . . . . . . . . . . . . . . . . . . . . . . . . . . . . . . . . . . . . . . . . . . . . . . 41.65 296.2.1 Innovation output . . . . . . . . . . . . . . . . . . . . . . . . . . . . . . . . . . . . . . . . . . . .42.56 416.2.2 High-value exports . . . . . . . . . . . . . . . . . . . . . . . . . . . . . . . . . . . . . . . . . . 100.00 16.2.3 New product entrepreneurial activity . . . . . . . . . . . . . . . . . . . . . . . . .63.60 186.2.4 New business density . . . . . . . . . . . . . . . . . . . . . . . . . . . . . . . . . . . . . . . . . . 1.55 916.2.5 Scientific journal articles . . . . . . . . . . . . . . . . . . . . . . . . . . . . . . . . . . . . . . . 0.56 105
l Philippines l Income group average

GTCI 2020 Country Profile by Pillar
THE GLOBAL TALENT COMPETITIVENESS INDEX 2020 225
COUNTRY PROFILESCOUNTRY PROFILES
102030405060708090100
Global knowledge skills
Vocational andtechnical skills
Retain
Grow
Attract
Enable
102030405060607
POLANDKey Indicators
Rank (out of 132) . . . . . . . . . . . . . . . . . . . . . . . . . . . . . . . . . . . . . . . 44Income group . . . . . . . . . . . . . . . . . . . . . . . . . . . . . . . . . . . . High incomeRegional group . . . . . . . . . . . . . . . . . . . . . . . . . . . . . . . . . . . . . . . . .EuropePopulation (millions) . . . . . . . . . . . . . . . . . . . . . . . . . . . . . . . . . . . . 37.98
GDP per capita (PPP US$) . . . . . . . . . . . . . . . . . . . . . . . . . . . .32,356.52GDP (US$ billions) . . . . . . . . . . . . . . . . . . . . . . . . . . . . . . . . . . . . . 585.78GTCI score . . . . . . . . . . . . . . . . . . . . . . . . . . . . . . . . . . . . . . . . . . . . . . 49.48GTCI score (income group average) . . . . . . . . . . . . . . . . . . . . . . . . 61.46
Score Rank
1 ENABLE . . . . . . . . . . . . . . . . . . . . . . . . . . . . . . . . . . . . . . . . . . .57.45 431.1 Regulatory Landscape . . . . . . . . . . . . . . . . . . . . . . . . . . . . . . . . . . . . . . 66.79 381.1.1 Government effectiveness . . . . . . . . . . . . . . . . . . . . . . . . . . . . . . . . . . . . 61.92 391.1.2 Rule of law . . . . . . . . . . . . . . . . . . . . . . . . . . . . . . . . . . . . . . . . . . . . . . . . . . . .63.70 421.1.3 Political stability . . . . . . . . . . . . . . . . . . . . . . . . . . . . . . . . . . . . . . . . . . . . . . .76.46 381.1.4 Regulatory quality. . . . . . . . . . . . . . . . . . . . . . . . . . . . . . . . . . . . . . . . . . . . .69.73 351.1.5 Corruption . . . . . . . . . . . . . . . . . . . . . . . . . . . . . . . . . . . . . . . . . . . . . . . . . . . . 62.16 311.2 Market Landscape . . . . . . . . . . . . . . . . . . . . . . . . . . . . . . . . . . . . . . . . . . 58.23 451.2.1 Competition intensity . . . . . . . . . . . . . . . . . . . . . . . . . . . . . . . . . . . . . . . . .71.54 571.2.2 Ease of doing business . . . . . . . . . . . . . . . . . . . . . . . . . . . . . . . . . . . . . . . .82.78 311.2.3 Cluster development . . . . . . . . . . . . . . . . . . . . . . . . . . . . . . . . . . . . . . . . . . 43.51 621.2.4 R&D expenditure . . . . . . . . . . . . . . . . . . . . . . . . . . . . . . . . . . . . . . . . . . . . . .22.44 351.2.5 ICT infrastructure. . . . . . . . . . . . . . . . . . . . . . . . . . . . . . . . . . . . . . . . . . . . . .75.06 341.2.6 Urban population . . . . . . . . . . . . . . . . . . . . . . . . . . . . . . . . . . . . . . . . . . . . .54.07 741.3 Business and Labour Landscape . . . . . . . . . . . . . . . . . . . . . . . . . . . . 47.31 63
Labour Market1.3.1 Tertiary-educated unemployment . . . . . . . . . . . . . . . . . . . . . . . . . . . .93.50 101.3.2 Active labour market policies . . . . . . . . . . . . . . . . . . . . . . . . . . . . . . . . .45.46 621.3.3 Labour-employer cooperation . . . . . . . . . . . . . . . . . . . . . . . . . . . . . . . .35.63 75
Management Practice1.3.4 Professional management . . . . . . . . . . . . . . . . . . . . . . . . . . . . . . . . . . . .46.57 721.3.5 Relationship of pay to productivity . . . . . . . . . . . . . . . . . . . . . . . . . . . .54.41 54
Technology Adoption1.3.6 Technology utilisation. . . . . . . . . . . . . . . . . . . . . . . . . . . . . . . . . . . . . . . . . 53.14 611.3.7 Investment in emerging technologies . . . . . . . . . . . . . . . . . . . . . . . . 37.21 701.3.8 Robot density . . . . . . . . . . . . . . . . . . . . . . . . . . . . . . . . . . . . . . . . . . . . . . . . .12.54 30
2 ATTRACT . . . . . . . . . . . . . . . . . . . . . . . . . . . . . . . . . . . . . . . . . . 47.92 722.1 External Openness . . . . . . . . . . . . . . . . . . . . . . . . . . . . . . . . . . . . . . . . . 38.61 81
Attract Business2.1.1 FDI and technology transfer . . . . . . . . . . . . . . . . . . . . . . . . . . . . . . . . . .66.28 452.1.2 Prevalence of foreign ownership . . . . . . . . . . . . . . . . . . . . . . . . . . . . . . 65.17 51
Attract People2.1.3 Migrant stock . . . . . . . . . . . . . . . . . . . . . . . . . . . . . . . . . . . . . . . . . . . . . . . . .22.62 952.1.4 International students . . . . . . . . . . . . . . . . . . . . . . . . . . . . . . . . . . . . . . . . . 12.47 542.1.5 Brain gain . . . . . . . . . . . . . . . . . . . . . . . . . . . . . . . . . . . . . . . . . . . . . . . . . . . . .26.52 1072.2 Internal Openness . . . . . . . . . . . . . . . . . . . . . . . . . . . . . . . . . . . . . . . . . . 57.22 60
Social Inclusion2.2.1 Tolerance of minorities . . . . . . . . . . . . . . . . . . . . . . . . . . . . . . . . . . . . . . . .42.22 742.2.2 Tolerance of immigrants . . . . . . . . . . . . . . . . . . . . . . . . . . . . . . . . . . . . . . 21.92 1172.2.3 Social mobility . . . . . . . . . . . . . . . . . . . . . . . . . . . . . . . . . . . . . . . . . . . . . . . .55.88 71
Gender Equality2.2.4 Female graduates . . . . . . . . . . . . . . . . . . . . . . . . . . . . . . . . . . . . . . . . . . . . .94.88 62.2.5 Gender development gap . . . . . . . . . . . . . . . . . . . . . . . . . . . . . . . . . . . . 91.11 122.2.6 Leadership opportunities for women . . . . . . . . . . . . . . . . . . . . . . . . . 37.33 89
Score Rank
3 GROW . . . . . . . . . . . . . . . . . . . . . . . . . . . . . . . . . . . . . . . . . . . . .43.62 493.1 Formal Education . . . . . . . . . . . . . . . . . . . . . . . . . . . . . . . . . . . . . . . . . . . 46.17 26
Enrolment3.1.1 Vocational enrolment . . . . . . . . . . . . . . . . . . . . . . . . . . . . . . . . . . . . . . . . .43.80 213.1.2 Tertiary enrolment . . . . . . . . . . . . . . . . . . . . . . . . . . . . . . . . . . . . . . . . . . . .52.37 33
Quality3.1.3 Tertiary education expenditure . . . . . . . . . . . . . . . . . . . . . . . . . . . . . . .28.20 393.1.4 Reading, maths, and science . . . . . . . . . . . . . . . . . . . . . . . . . . . . . . . . . . 77.54 163.1.5 University ranking . . . . . . . . . . . . . . . . . . . . . . . . . . . . . . . . . . . . . . . . . . . . .28.94 423.2 Lifelong Learning . . . . . . . . . . . . . . . . . . . . . . . . . . . . . . . . . . . . . . . . . . . 42.24 693.2.1 Quality of management schools . . . . . . . . . . . . . . . . . . . . . . . . . . . . . .45.02 763.2.2 Prevalence of training in firms . . . . . . . . . . . . . . . . . . . . . . . . . . . . . . . . . 41.16 423.2.3 Employee development . . . . . . . . . . . . . . . . . . . . . . . . . . . . . . . . . . . . . .40.54 623.3 Access to Growth Opportunities . . . . . . . . . . . . . . . . . . . . . . . . . . . 42.44 88
Empowerment3.3.1 Delegation of authority . . . . . . . . . . . . . . . . . . . . . . . . . . . . . . . . . . . . . . . 39.41 863.3.2 Personal rights . . . . . . . . . . . . . . . . . . . . . . . . . . . . . . . . . . . . . . . . . . . . . . . .83.21 47
Collaboration3.3.3 Use of virtual social networks . . . . . . . . . . . . . . . . . . . . . . . . . . . . . . . . .73.84 653.3.4 Use of virtual professional networks . . . . . . . . . . . . . . . . . . . . . . . . . . . 6.75 733.3.5 Collaboration within organisations . . . . . . . . . . . . . . . . . . . . . . . . . . . .28.49 1213.3.6 Collaboration across organisations . . . . . . . . . . . . . . . . . . . . . . . . . . . .22.94 114
4 RETAIN . . . . . . . . . . . . . . . . . . . . . . . . . . . . . . . . . . . . . . . . . . . .58.75 444.1 Sustainability . . . . . . . . . . . . . . . . . . . . . . . . . . . . . . . . . . . . . . . . . . . . . . . 47.79 504.1.1 Pension system . . . . . . . . . . . . . . . . . . . . . . . . . . . . . . . . . . . . . . . . . . . . . . .88.00 184.1.2 Social protection . . . . . . . . . . . . . . . . . . . . . . . . . . . . . . . . . . . . . . . . . . . . . .20.63 1174.1.3 Brain retention . . . . . . . . . . . . . . . . . . . . . . . . . . . . . . . . . . . . . . . . . . . . . . . .34.74 834.2 Lifestyle . . . . . . . . . . . . . . . . . . . . . . . . . . . . . . . . . . . . . . . . . . . . . . . . . . . . 69.72 354.2.1 Environmental performance . . . . . . . . . . . . . . . . . . . . . . . . . . . . . . . . . . 61.14 454.2.2 Personal safety . . . . . . . . . . . . . . . . . . . . . . . . . . . . . . . . . . . . . . . . . . . . . . . .83.32 204.2.3 Physician density . . . . . . . . . . . . . . . . . . . . . . . . . . . . . . . . . . . . . . . . . . . . . .36.42 544.2.4 Sanitation . . . . . . . . . . . . . . . . . . . . . . . . . . . . . . . . . . . . . . . . . . . . . . . . . . . . . 97.99 37
5 VOCATIONAL AND TECHNICAL SKILLS . . . . . . . . . . . . .54.31 405.1 Mid-Level Skills . . . . . . . . . . . . . . . . . . . . . . . . . . . . . . . . . . . . . . . . . . . . . 66.77 95.1.1 Workforce with secondary education . . . . . . . . . . . . . . . . . . . . . . . . . 81.06 125.1.2 Population with secondary education . . . . . . . . . . . . . . . . . . . . . . . .84.35 65.1.3 Technicians and associate professionals . . . . . . . . . . . . . . . . . . . . . . . 58.11 285.1.4 Labour productivity per employee . . . . . . . . . . . . . . . . . . . . . . . . . . . .43.54 335.2 Employability . . . . . . . . . . . . . . . . . . . . . . . . . . . . . . . . . . . . . . . . . . . . . . . 41.86 885.2.1 Ease of finding skilled employees . . . . . . . . . . . . . . . . . . . . . . . . . . . . . 56.15 635.2.2 Relevance of education system to the economy . . . . . . . . . . . . . .40.55 775.2.3 Skills matching with secondary education . . . . . . . . . . . . . . . . . . . .29.50 1065.2.4 Skills matching with tertiary education . . . . . . . . . . . . . . . . . . . . . . . . 41.25 103
6 GLOBAL KNOWLEDGE SKILLS . . . . . . . . . . . . . . . . . . . . 34.84 456.1 High-Level Skills . . . . . . . . . . . . . . . . . . . . . . . . . . . . . . . . . . . . . . . . . . . . 43.90 366.1.1 Workforce with tertiary education . . . . . . . . . . . . . . . . . . . . . . . . . . . .52.29 286.1.2 Population with tertiary education . . . . . . . . . . . . . . . . . . . . . . . . . . . .39.35 376.1.3 Professionals . . . . . . . . . . . . . . . . . . . . . . . . . . . . . . . . . . . . . . . . . . . . . . . . . . 52.16 226.1.4 Researchers . . . . . . . . . . . . . . . . . . . . . . . . . . . . . . . . . . . . . . . . . . . . . . . . . . .30.55 336.1.5 Senior officials and managers . . . . . . . . . . . . . . . . . . . . . . . . . . . . . . . . . 37.53 376.1.6 Availability of scientists and engineers . . . . . . . . . . . . . . . . . . . . . . . . 51.55 616.2 Talent Impact . . . . . . . . . . . . . . . . . . . . . . . . . . . . . . . . . . . . . . . . . . . . . . . 25.77 546.2.1 Innovation output . . . . . . . . . . . . . . . . . . . . . . . . . . . . . . . . . . . . . . . . . . . .44.31 406.2.2 High-value exports . . . . . . . . . . . . . . . . . . . . . . . . . . . . . . . . . . . . . . . . . . . .23.03 506.2.3 New product entrepreneurial activity . . . . . . . . . . . . . . . . . . . . . . . . . 19.13 816.2.4 New business density . . . . . . . . . . . . . . . . . . . . . . . . . . . . . . . . . . . . . . . . . . 7.97 576.2.5 Scientific journal articles . . . . . . . . . . . . . . . . . . . . . . . . . . . . . . . . . . . . . .34.39 31
l Poland l Income group average
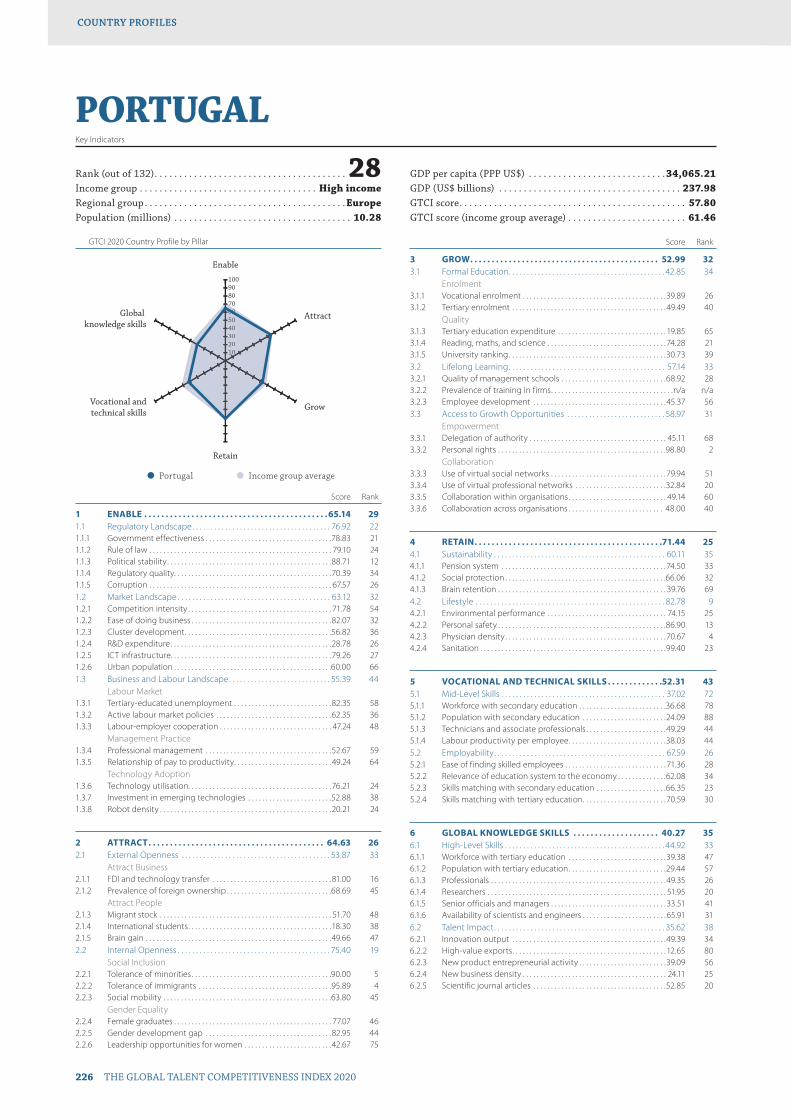
GTCI 2020 Country Profile by Pillar
226 THE GLOBAL TALENT COMPETITIVENESS INDEX 2020
COUNTRY PROFILESCOUNTRY PROFILES
102030405060708090100
Global knowledge skills
Vocational andtechnical skills
Retain
Grow
Attract
Enable
102030405060607
PORTUGALKey Indicators
Rank (out of 132) . . . . . . . . . . . . . . . . . . . . . . . . . . . . . . . . . . . . . . . 28Income group . . . . . . . . . . . . . . . . . . . . . . . . . . . . . . . . . . . . High incomeRegional group . . . . . . . . . . . . . . . . . . . . . . . . . . . . . . . . . . . . . . . . .EuropePopulation (millions) . . . . . . . . . . . . . . . . . . . . . . . . . . . . . . . . . . . . 10.28
GDP per capita (PPP US$) . . . . . . . . . . . . . . . . . . . . . . . . . . . .34,065.21GDP (US$ billions) . . . . . . . . . . . . . . . . . . . . . . . . . . . . . . . . . . . . . 237.98GTCI score . . . . . . . . . . . . . . . . . . . . . . . . . . . . . . . . . . . . . . . . . . . . . . 57.80GTCI score (income group average) . . . . . . . . . . . . . . . . . . . . . . . . 61.46
Score Rank
1 ENABLE . . . . . . . . . . . . . . . . . . . . . . . . . . . . . . . . . . . . . . . . . . . 65.14 291.1 Regulatory Landscape . . . . . . . . . . . . . . . . . . . . . . . . . . . . . . . . . . . . . . 76.92 221.1.1 Government effectiveness . . . . . . . . . . . . . . . . . . . . . . . . . . . . . . . . . . . .78.83 211.1.2 Rule of law . . . . . . . . . . . . . . . . . . . . . . . . . . . . . . . . . . . . . . . . . . . . . . . . . . . . 79.10 241.1.3 Political stability . . . . . . . . . . . . . . . . . . . . . . . . . . . . . . . . . . . . . . . . . . . . . . .88.71 121.1.4 Regulatory quality. . . . . . . . . . . . . . . . . . . . . . . . . . . . . . . . . . . . . . . . . . . . .70.39 341.1.5 Corruption . . . . . . . . . . . . . . . . . . . . . . . . . . . . . . . . . . . . . . . . . . . . . . . . . . . . 67.57 261.2 Market Landscape . . . . . . . . . . . . . . . . . . . . . . . . . . . . . . . . . . . . . . . . . . 63.12 321.2.1 Competition intensity . . . . . . . . . . . . . . . . . . . . . . . . . . . . . . . . . . . . . . . . . 71.78 541.2.2 Ease of doing business . . . . . . . . . . . . . . . . . . . . . . . . . . . . . . . . . . . . . . . .82.07 321.2.3 Cluster development . . . . . . . . . . . . . . . . . . . . . . . . . . . . . . . . . . . . . . . . . .56.82 361.2.4 R&D expenditure . . . . . . . . . . . . . . . . . . . . . . . . . . . . . . . . . . . . . . . . . . . . . .28.78 261.2.5 ICT infrastructure. . . . . . . . . . . . . . . . . . . . . . . . . . . . . . . . . . . . . . . . . . . . . .79.26 271.2.6 Urban population . . . . . . . . . . . . . . . . . . . . . . . . . . . . . . . . . . . . . . . . . . . . .60.00 661.3 Business and Labour Landscape . . . . . . . . . . . . . . . . . . . . . . . . . . . . 55.39 44
Labour Market1.3.1 Tertiary-educated unemployment . . . . . . . . . . . . . . . . . . . . . . . . . . . .82.35 581.3.2 Active labour market policies . . . . . . . . . . . . . . . . . . . . . . . . . . . . . . . . .62.35 361.3.3 Labour-employer cooperation . . . . . . . . . . . . . . . . . . . . . . . . . . . . . . . . 47.24 48
Management Practice1.3.4 Professional management . . . . . . . . . . . . . . . . . . . . . . . . . . . . . . . . . . . .52.67 591.3.5 Relationship of pay to productivity . . . . . . . . . . . . . . . . . . . . . . . . . . . . 49.24 64
Technology Adoption1.3.6 Technology utilisation. . . . . . . . . . . . . . . . . . . . . . . . . . . . . . . . . . . . . . . . .76.21 241.3.7 Investment in emerging technologies . . . . . . . . . . . . . . . . . . . . . . . .52.88 381.3.8 Robot density . . . . . . . . . . . . . . . . . . . . . . . . . . . . . . . . . . . . . . . . . . . . . . . . .20.21 24
2 ATTRACT . . . . . . . . . . . . . . . . . . . . . . . . . . . . . . . . . . . . . . . . . 64.63 262.1 External Openness . . . . . . . . . . . . . . . . . . . . . . . . . . . . . . . . . . . . . . . . . 53.87 33
Attract Business2.1.1 FDI and technology transfer . . . . . . . . . . . . . . . . . . . . . . . . . . . . . . . . . .81.00 162.1.2 Prevalence of foreign ownership . . . . . . . . . . . . . . . . . . . . . . . . . . . . . .68.69 45
Attract People2.1.3 Migrant stock . . . . . . . . . . . . . . . . . . . . . . . . . . . . . . . . . . . . . . . . . . . . . . . . . 51.70 482.1.4 International students . . . . . . . . . . . . . . . . . . . . . . . . . . . . . . . . . . . . . . . . .18.30 382.1.5 Brain gain . . . . . . . . . . . . . . . . . . . . . . . . . . . . . . . . . . . . . . . . . . . . . . . . . . . . .49.66 472.2 Internal Openness . . . . . . . . . . . . . . . . . . . . . . . . . . . . . . . . . . . . . . . . . . 75.40 19
Social Inclusion2.2.1 Tolerance of minorities . . . . . . . . . . . . . . . . . . . . . . . . . . . . . . . . . . . . . . . .90.00 52.2.2 Tolerance of immigrants . . . . . . . . . . . . . . . . . . . . . . . . . . . . . . . . . . . . . .95.89 42.2.3 Social mobility . . . . . . . . . . . . . . . . . . . . . . . . . . . . . . . . . . . . . . . . . . . . . . . .63.80 45
Gender Equality2.2.4 Female graduates . . . . . . . . . . . . . . . . . . . . . . . . . . . . . . . . . . . . . . . . . . . . . 77.07 462.2.5 Gender development gap . . . . . . . . . . . . . . . . . . . . . . . . . . . . . . . . . . . .82.95 442.2.6 Leadership opportunities for women . . . . . . . . . . . . . . . . . . . . . . . . .42.67 75
Score Rank
3 GROW . . . . . . . . . . . . . . . . . . . . . . . . . . . . . . . . . . . . . . . . . . . . 52.99 323.1 Formal Education . . . . . . . . . . . . . . . . . . . . . . . . . . . . . . . . . . . . . . . . . . . 42.85 34
Enrolment3.1.1 Vocational enrolment . . . . . . . . . . . . . . . . . . . . . . . . . . . . . . . . . . . . . . . . .39.89 263.1.2 Tertiary enrolment . . . . . . . . . . . . . . . . . . . . . . . . . . . . . . . . . . . . . . . . . . . . 49.49 40
Quality3.1.3 Tertiary education expenditure . . . . . . . . . . . . . . . . . . . . . . . . . . . . . . . 19.85 653.1.4 Reading, maths, and science . . . . . . . . . . . . . . . . . . . . . . . . . . . . . . . . . .74.28 213.1.5 University ranking . . . . . . . . . . . . . . . . . . . . . . . . . . . . . . . . . . . . . . . . . . . . .30.73 393.2 Lifelong Learning . . . . . . . . . . . . . . . . . . . . . . . . . . . . . . . . . . . . . . . . . . . 57.14 333.2.1 Quality of management schools . . . . . . . . . . . . . . . . . . . . . . . . . . . . . .68.92 283.2.2 Prevalence of training in firms . . . . . . . . . . . . . . . . . . . . . . . . . . . . . . . . . . .n/a n/a3.2.3 Employee development . . . . . . . . . . . . . . . . . . . . . . . . . . . . . . . . . . . . . . 45.37 563.3 Access to Growth Opportunities . . . . . . . . . . . . . . . . . . . . . . . . . . . 58.97 31
Empowerment3.3.1 Delegation of authority . . . . . . . . . . . . . . . . . . . . . . . . . . . . . . . . . . . . . . . 45.11 683.3.2 Personal rights . . . . . . . . . . . . . . . . . . . . . . . . . . . . . . . . . . . . . . . . . . . . . . . .98.80 2
Collaboration3.3.3 Use of virtual social networks . . . . . . . . . . . . . . . . . . . . . . . . . . . . . . . . .79.94 513.3.4 Use of virtual professional networks . . . . . . . . . . . . . . . . . . . . . . . . . .32.84 203.3.5 Collaboration within organisations . . . . . . . . . . . . . . . . . . . . . . . . . . . . 49.14 603.3.6 Collaboration across organisations . . . . . . . . . . . . . . . . . . . . . . . . . . . 48.00 40
4 RETAIN . . . . . . . . . . . . . . . . . . . . . . . . . . . . . . . . . . . . . . . . . . . .71.44 254.1 Sustainability . . . . . . . . . . . . . . . . . . . . . . . . . . . . . . . . . . . . . . . . . . . . . . . 60.11 354.1.1 Pension system . . . . . . . . . . . . . . . . . . . . . . . . . . . . . . . . . . . . . . . . . . . . . . . 74.50 334.1.2 Social protection . . . . . . . . . . . . . . . . . . . . . . . . . . . . . . . . . . . . . . . . . . . . . .66.06 324.1.3 Brain retention . . . . . . . . . . . . . . . . . . . . . . . . . . . . . . . . . . . . . . . . . . . . . . . . 39.76 694.2 Lifestyle . . . . . . . . . . . . . . . . . . . . . . . . . . . . . . . . . . . . . . . . . . . . . . . . . . . . 82.78 94.2.1 Environmental performance . . . . . . . . . . . . . . . . . . . . . . . . . . . . . . . . . . 74.15 254.2.2 Personal safety . . . . . . . . . . . . . . . . . . . . . . . . . . . . . . . . . . . . . . . . . . . . . . . .86.90 134.2.3 Physician density . . . . . . . . . . . . . . . . . . . . . . . . . . . . . . . . . . . . . . . . . . . . . .70.67 44.2.4 Sanitation . . . . . . . . . . . . . . . . . . . . . . . . . . . . . . . . . . . . . . . . . . . . . . . . . . . . .99.40 23
5 VOCATIONAL AND TECHNICAL SKILLS . . . . . . . . . . . . .52.31 435.1 Mid-Level Skills . . . . . . . . . . . . . . . . . . . . . . . . . . . . . . . . . . . . . . . . . . . . . 37.02 725.1.1 Workforce with secondary education . . . . . . . . . . . . . . . . . . . . . . . . .36.68 785.1.2 Population with secondary education . . . . . . . . . . . . . . . . . . . . . . . .24.09 885.1.3 Technicians and associate professionals . . . . . . . . . . . . . . . . . . . . . . .49.29 445.1.4 Labour productivity per employee . . . . . . . . . . . . . . . . . . . . . . . . . . . .38.03 445.2 Employability . . . . . . . . . . . . . . . . . . . . . . . . . . . . . . . . . . . . . . . . . . . . . . . 67.59 265.2.1 Ease of finding skilled employees . . . . . . . . . . . . . . . . . . . . . . . . . . . . . 71.36 285.2.2 Relevance of education system to the economy . . . . . . . . . . . . . .62.08 345.2.3 Skills matching with secondary education . . . . . . . . . . . . . . . . . . . .66.35 235.2.4 Skills matching with tertiary education . . . . . . . . . . . . . . . . . . . . . . . .70.59 30
6 GLOBAL KNOWLEDGE SKILLS . . . . . . . . . . . . . . . . . . . . 40.27 356.1 High-Level Skills . . . . . . . . . . . . . . . . . . . . . . . . . . . . . . . . . . . . . . . . . . . . 44.92 336.1.1 Workforce with tertiary education . . . . . . . . . . . . . . . . . . . . . . . . . . . .39.38 476.1.2 Population with tertiary education . . . . . . . . . . . . . . . . . . . . . . . . . . . .29.44 576.1.3 Professionals . . . . . . . . . . . . . . . . . . . . . . . . . . . . . . . . . . . . . . . . . . . . . . . . . .49.35 266.1.4 Researchers . . . . . . . . . . . . . . . . . . . . . . . . . . . . . . . . . . . . . . . . . . . . . . . . . . . 51.95 206.1.5 Senior officials and managers . . . . . . . . . . . . . . . . . . . . . . . . . . . . . . . . . 33.51 416.1.6 Availability of scientists and engineers . . . . . . . . . . . . . . . . . . . . . . . . 65.91 316.2 Talent Impact . . . . . . . . . . . . . . . . . . . . . . . . . . . . . . . . . . . . . . . . . . . . . . . 35.62 386.2.1 Innovation output . . . . . . . . . . . . . . . . . . . . . . . . . . . . . . . . . . . . . . . . . . . .49.39 346.2.2 High-value exports . . . . . . . . . . . . . . . . . . . . . . . . . . . . . . . . . . . . . . . . . . . . 12.65 806.2.3 New product entrepreneurial activity . . . . . . . . . . . . . . . . . . . . . . . . .39.09 566.2.4 New business density . . . . . . . . . . . . . . . . . . . . . . . . . . . . . . . . . . . . . . . . . 24.11 256.2.5 Scientific journal articles . . . . . . . . . . . . . . . . . . . . . . . . . . . . . . . . . . . . . .52.85 20
l Portugal l Income group average
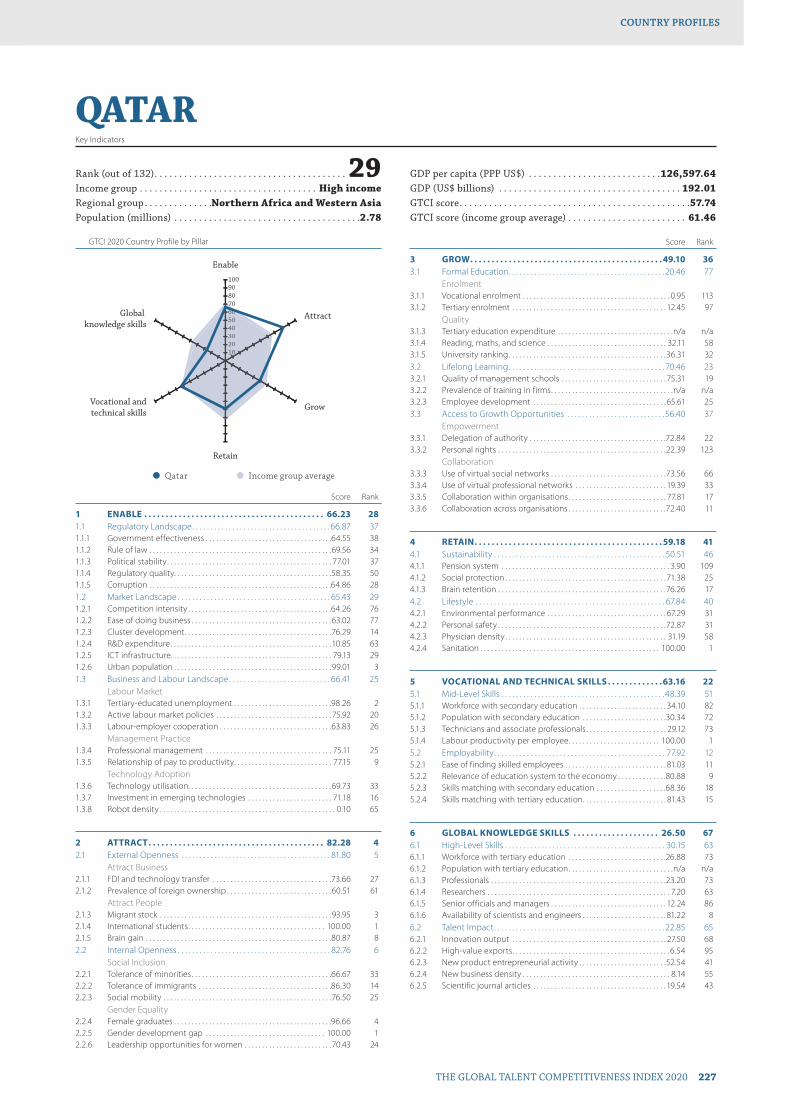
GTCI 2020 Country Profile by Pillar
THE GLOBAL TALENT COMPETITIVENESS INDEX 2020 227
COUNTRY PROFILESCOUNTRY PROFILES
102030405060708090100
Global knowledge skills
Vocational andtechnical skills
Retain
Grow
Attract
Enable
102030405060607
QATARKey Indicators
Rank (out of 132) . . . . . . . . . . . . . . . . . . . . . . . . . . . . . . . . . . . . . . . 29Income group . . . . . . . . . . . . . . . . . . . . . . . . . . . . . . . . . . . . High incomeRegional group . . . . . . . . . . . . . .Northern Africa and Western AsiaPopulation (millions) . . . . . . . . . . . . . . . . . . . . . . . . . . . . . . . . . . . . . .2.78
GDP per capita (PPP US$) . . . . . . . . . . . . . . . . . . . . . . . . . . .126,597.64GDP (US$ billions) . . . . . . . . . . . . . . . . . . . . . . . . . . . . . . . . . . . . . 192.01GTCI score . . . . . . . . . . . . . . . . . . . . . . . . . . . . . . . . . . . . . . . . . . . . . . .57.74GTCI score (income group average) . . . . . . . . . . . . . . . . . . . . . . . . 61.46
Score Rank
1 ENABLE . . . . . . . . . . . . . . . . . . . . . . . . . . . . . . . . . . . . . . . . . . 66.23 281.1 Regulatory Landscape . . . . . . . . . . . . . . . . . . . . . . . . . . . . . . . . . . . . . . 66.87 371.1.1 Government effectiveness . . . . . . . . . . . . . . . . . . . . . . . . . . . . . . . . . . . .64.55 381.1.2 Rule of law . . . . . . . . . . . . . . . . . . . . . . . . . . . . . . . . . . . . . . . . . . . . . . . . . . . .69.56 341.1.3 Political stability . . . . . . . . . . . . . . . . . . . . . . . . . . . . . . . . . . . . . . . . . . . . . . . 77.01 371.1.4 Regulatory quality. . . . . . . . . . . . . . . . . . . . . . . . . . . . . . . . . . . . . . . . . . . . .58.35 501.1.5 Corruption . . . . . . . . . . . . . . . . . . . . . . . . . . . . . . . . . . . . . . . . . . . . . . . . . . . .64.86 281.2 Market Landscape . . . . . . . . . . . . . . . . . . . . . . . . . . . . . . . . . . . . . . . . . . 65.43 291.2.1 Competition intensity . . . . . . . . . . . . . . . . . . . . . . . . . . . . . . . . . . . . . . . . .64.26 761.2.2 Ease of doing business . . . . . . . . . . . . . . . . . . . . . . . . . . . . . . . . . . . . . . . .63.02 771.2.3 Cluster development . . . . . . . . . . . . . . . . . . . . . . . . . . . . . . . . . . . . . . . . . .76.29 141.2.4 R&D expenditure . . . . . . . . . . . . . . . . . . . . . . . . . . . . . . . . . . . . . . . . . . . . . .10.85 631.2.5 ICT infrastructure. . . . . . . . . . . . . . . . . . . . . . . . . . . . . . . . . . . . . . . . . . . . . . 79.13 291.2.6 Urban population . . . . . . . . . . . . . . . . . . . . . . . . . . . . . . . . . . . . . . . . . . . . .99.01 31.3 Business and Labour Landscape . . . . . . . . . . . . . . . . . . . . . . . . . . . . 66.41 25
Labour Market1.3.1 Tertiary-educated unemployment . . . . . . . . . . . . . . . . . . . . . . . . . . . .98.26 21.3.2 Active labour market policies . . . . . . . . . . . . . . . . . . . . . . . . . . . . . . . . . 75.92 201.3.3 Labour-employer cooperation . . . . . . . . . . . . . . . . . . . . . . . . . . . . . . . .63.83 26
Management Practice1.3.4 Professional management . . . . . . . . . . . . . . . . . . . . . . . . . . . . . . . . . . . . 75.11 251.3.5 Relationship of pay to productivity . . . . . . . . . . . . . . . . . . . . . . . . . . . . 77.15 9
Technology Adoption1.3.6 Technology utilisation. . . . . . . . . . . . . . . . . . . . . . . . . . . . . . . . . . . . . . . . .69.73 331.3.7 Investment in emerging technologies . . . . . . . . . . . . . . . . . . . . . . . . 71.18 161.3.8 Robot density . . . . . . . . . . . . . . . . . . . . . . . . . . . . . . . . . . . . . . . . . . . . . . . . . . 0.10 65
2 ATTRACT . . . . . . . . . . . . . . . . . . . . . . . . . . . . . . . . . . . . . . . . . 82.28 42.1 External Openness . . . . . . . . . . . . . . . . . . . . . . . . . . . . . . . . . . . . . . . . . 81.80 5
Attract Business2.1.1 FDI and technology transfer . . . . . . . . . . . . . . . . . . . . . . . . . . . . . . . . . .73.66 272.1.2 Prevalence of foreign ownership . . . . . . . . . . . . . . . . . . . . . . . . . . . . . .60.51 61
Attract People2.1.3 Migrant stock . . . . . . . . . . . . . . . . . . . . . . . . . . . . . . . . . . . . . . . . . . . . . . . . .93.95 32.1.4 International students . . . . . . . . . . . . . . . . . . . . . . . . . . . . . . . . . . . . . . . 100.00 12.1.5 Brain gain . . . . . . . . . . . . . . . . . . . . . . . . . . . . . . . . . . . . . . . . . . . . . . . . . . . . .80.87 82.2 Internal Openness . . . . . . . . . . . . . . . . . . . . . . . . . . . . . . . . . . . . . . . . . . 82.76 6
Social Inclusion2.2.1 Tolerance of minorities . . . . . . . . . . . . . . . . . . . . . . . . . . . . . . . . . . . . . . . .66.67 332.2.2 Tolerance of immigrants . . . . . . . . . . . . . . . . . . . . . . . . . . . . . . . . . . . . . .86.30 142.2.3 Social mobility . . . . . . . . . . . . . . . . . . . . . . . . . . . . . . . . . . . . . . . . . . . . . . . .76.50 25
Gender Equality2.2.4 Female graduates . . . . . . . . . . . . . . . . . . . . . . . . . . . . . . . . . . . . . . . . . . . . .96.66 42.2.5 Gender development gap . . . . . . . . . . . . . . . . . . . . . . . . . . . . . . . . . . 100.00 12.2.6 Leadership opportunities for women . . . . . . . . . . . . . . . . . . . . . . . . .70.43 24
Score Rank
3 GROW . . . . . . . . . . . . . . . . . . . . . . . . . . . . . . . . . . . . . . . . . . . . . 49.10 363.1 Formal Education . . . . . . . . . . . . . . . . . . . . . . . . . . . . . . . . . . . . . . . . . . . 20.46 77
Enrolment3.1.1 Vocational enrolment . . . . . . . . . . . . . . . . . . . . . . . . . . . . . . . . . . . . . . . . . . 0.95 1133.1.2 Tertiary enrolment . . . . . . . . . . . . . . . . . . . . . . . . . . . . . . . . . . . . . . . . . . . . 12.45 97
Quality3.1.3 Tertiary education expenditure . . . . . . . . . . . . . . . . . . . . . . . . . . . . . . . . .n/a n/a3.1.4 Reading, maths, and science . . . . . . . . . . . . . . . . . . . . . . . . . . . . . . . . . . 32.11 583.1.5 University ranking . . . . . . . . . . . . . . . . . . . . . . . . . . . . . . . . . . . . . . . . . . . . .36.31 323.2 Lifelong Learning . . . . . . . . . . . . . . . . . . . . . . . . . . . . . . . . . . . . . . . . . . . 70.46 233.2.1 Quality of management schools . . . . . . . . . . . . . . . . . . . . . . . . . . . . . . 75.31 193.2.2 Prevalence of training in firms . . . . . . . . . . . . . . . . . . . . . . . . . . . . . . . . . . .n/a n/a3.2.3 Employee development . . . . . . . . . . . . . . . . . . . . . . . . . . . . . . . . . . . . . . 65.61 253.3 Access to Growth Opportunities . . . . . . . . . . . . . . . . . . . . . . . . . . . 56.40 37
Empowerment3.3.1 Delegation of authority . . . . . . . . . . . . . . . . . . . . . . . . . . . . . . . . . . . . . . .72.84 223.3.2 Personal rights . . . . . . . . . . . . . . . . . . . . . . . . . . . . . . . . . . . . . . . . . . . . . . . .22.39 123
Collaboration3.3.3 Use of virtual social networks . . . . . . . . . . . . . . . . . . . . . . . . . . . . . . . . .73.56 663.3.4 Use of virtual professional networks . . . . . . . . . . . . . . . . . . . . . . . . . . 19.39 333.3.5 Collaboration within organisations . . . . . . . . . . . . . . . . . . . . . . . . . . . . 77.81 173.3.6 Collaboration across organisations . . . . . . . . . . . . . . . . . . . . . . . . . . . .72.40 11
4 RETAIN . . . . . . . . . . . . . . . . . . . . . . . . . . . . . . . . . . . . . . . . . . . . 59.18 414.1 Sustainability . . . . . . . . . . . . . . . . . . . . . . . . . . . . . . . . . . . . . . . . . . . . . . . 50.51 464.1.1 Pension system . . . . . . . . . . . . . . . . . . . . . . . . . . . . . . . . . . . . . . . . . . . . . . . . 3.90 1094.1.2 Social protection . . . . . . . . . . . . . . . . . . . . . . . . . . . . . . . . . . . . . . . . . . . . . . 71.38 254.1.3 Brain retention . . . . . . . . . . . . . . . . . . . . . . . . . . . . . . . . . . . . . . . . . . . . . . . .76.26 174.2 Lifestyle . . . . . . . . . . . . . . . . . . . . . . . . . . . . . . . . . . . . . . . . . . . . . . . . . . . . 67.84 404.2.1 Environmental performance . . . . . . . . . . . . . . . . . . . . . . . . . . . . . . . . . . 67.29 314.2.2 Personal safety . . . . . . . . . . . . . . . . . . . . . . . . . . . . . . . . . . . . . . . . . . . . . . . .72.87 314.2.3 Physician density . . . . . . . . . . . . . . . . . . . . . . . . . . . . . . . . . . . . . . . . . . . . . . 31.19 584.2.4 Sanitation . . . . . . . . . . . . . . . . . . . . . . . . . . . . . . . . . . . . . . . . . . . . . . . . . . . 100.00 1
5 VOCATIONAL AND TECHNICAL SKILLS . . . . . . . . . . . . .63.16 225.1 Mid-Level Skills . . . . . . . . . . . . . . . . . . . . . . . . . . . . . . . . . . . . . . . . . . . . . 48.39 515.1.1 Workforce with secondary education . . . . . . . . . . . . . . . . . . . . . . . . . 34.10 825.1.2 Population with secondary education . . . . . . . . . . . . . . . . . . . . . . . .30.34 725.1.3 Technicians and associate professionals . . . . . . . . . . . . . . . . . . . . . . . 29.12 735.1.4 Labour productivity per employee . . . . . . . . . . . . . . . . . . . . . . . . . . 100.00 15.2 Employability . . . . . . . . . . . . . . . . . . . . . . . . . . . . . . . . . . . . . . . . . . . . . . . 77.92 125.2.1 Ease of finding skilled employees . . . . . . . . . . . . . . . . . . . . . . . . . . . . . 81.03 115.2.2 Relevance of education system to the economy . . . . . . . . . . . . . .80.88 95.2.3 Skills matching with secondary education . . . . . . . . . . . . . . . . . . . .68.36 185.2.4 Skills matching with tertiary education . . . . . . . . . . . . . . . . . . . . . . . . 81.43 15
6 GLOBAL KNOWLEDGE SKILLS . . . . . . . . . . . . . . . . . . . . 26.50 676.1 High-Level Skills . . . . . . . . . . . . . . . . . . . . . . . . . . . . . . . . . . . . . . . . . . . . 30.15 636.1.1 Workforce with tertiary education . . . . . . . . . . . . . . . . . . . . . . . . . . . .26.88 736.1.2 Population with tertiary education . . . . . . . . . . . . . . . . . . . . . . . . . . . . . .n/a n/a6.1.3 Professionals . . . . . . . . . . . . . . . . . . . . . . . . . . . . . . . . . . . . . . . . . . . . . . . . . .23.20 736.1.4 Researchers . . . . . . . . . . . . . . . . . . . . . . . . . . . . . . . . . . . . . . . . . . . . . . . . . . . . 7.20 636.1.5 Senior officials and managers . . . . . . . . . . . . . . . . . . . . . . . . . . . . . . . . . 12.24 866.1.6 Availability of scientists and engineers . . . . . . . . . . . . . . . . . . . . . . . . 81.22 86.2 Talent Impact . . . . . . . . . . . . . . . . . . . . . . . . . . . . . . . . . . . . . . . . . . . . . . . 22.85 656.2.1 Innovation output . . . . . . . . . . . . . . . . . . . . . . . . . . . . . . . . . . . . . . . . . . . . 27.50 686.2.2 High-value exports . . . . . . . . . . . . . . . . . . . . . . . . . . . . . . . . . . . . . . . . . . . . . 6.54 956.2.3 New product entrepreneurial activity . . . . . . . . . . . . . . . . . . . . . . . . .52.54 416.2.4 New business density . . . . . . . . . . . . . . . . . . . . . . . . . . . . . . . . . . . . . . . . . . 8.14 556.2.5 Scientific journal articles . . . . . . . . . . . . . . . . . . . . . . . . . . . . . . . . . . . . . . 19.54 43
l Qatar l Income group average
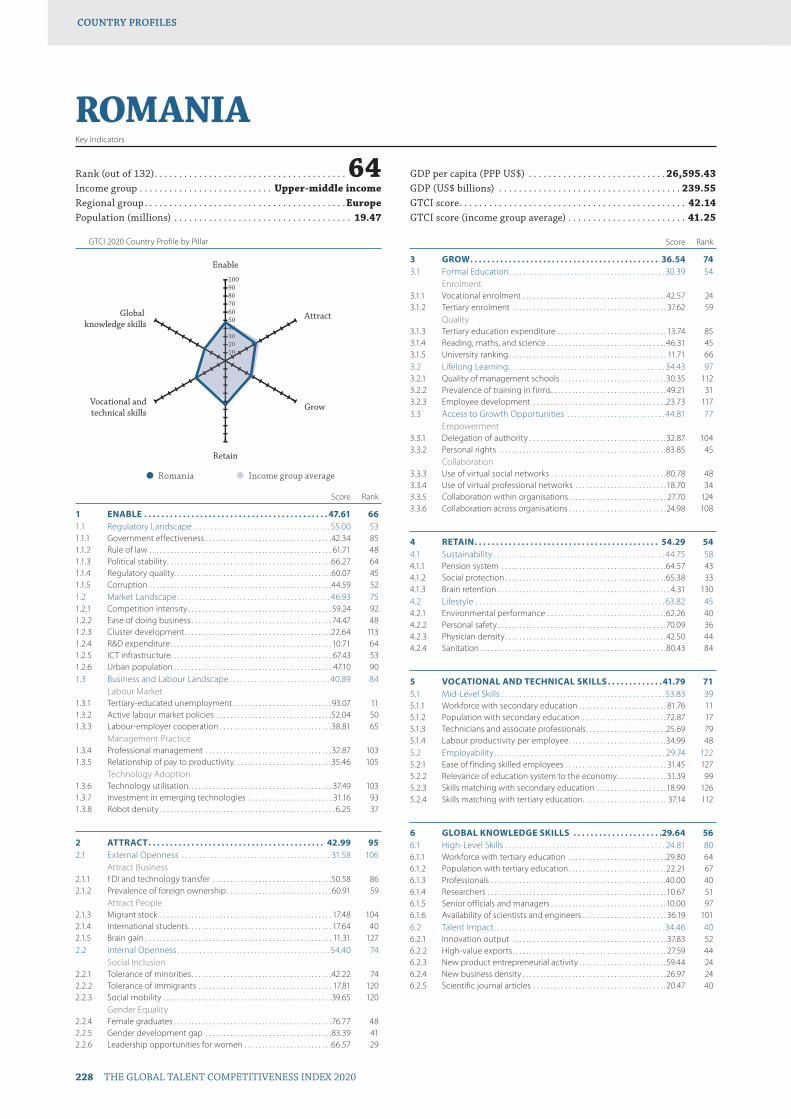
GTCI 2020 Country Profile by Pillar
228 THE GLOBAL TALENT COMPETITIVENESS INDEX 2020
COUNTRY PROFILESCOUNTRY PROFILES
102030405060708090100
Global knowledge skills
Vocational andtechnical skills
Retain
Grow
Attract
Enable
1020304040
ROMANIAKey Indicators
Rank (out of 132) . . . . . . . . . . . . . . . . . . . . . . . . . . . . . . . . . . . . . . . 64Income group . . . . . . . . . . . . . . . . . . . . . . . . . . . Upper-middle incomeRegional group . . . . . . . . . . . . . . . . . . . . . . . . . . . . . . . . . . . . . . . . .EuropePopulation (millions) . . . . . . . . . . . . . . . . . . . . . . . . . . . . . . . . . . . . 19.47
GDP per capita (PPP US$) . . . . . . . . . . . . . . . . . . . . . . . . . . . . 26,595.43GDP (US$ billions) . . . . . . . . . . . . . . . . . . . . . . . . . . . . . . . . . . . . . 239.55GTCI score . . . . . . . . . . . . . . . . . . . . . . . . . . . . . . . . . . . . . . . . . . . . . . 42.14GTCI score (income group average) . . . . . . . . . . . . . . . . . . . . . . . . 41.25
Score Rank
1 ENABLE . . . . . . . . . . . . . . . . . . . . . . . . . . . . . . . . . . . . . . . . . . . 47.61 661.1 Regulatory Landscape . . . . . . . . . . . . . . . . . . . . . . . . . . . . . . . . . . . . . . 55.00 531.1.1 Government effectiveness . . . . . . . . . . . . . . . . . . . . . . . . . . . . . . . . . . . .42.34 851.1.2 Rule of law . . . . . . . . . . . . . . . . . . . . . . . . . . . . . . . . . . . . . . . . . . . . . . . . . . . . 61.71 481.1.3 Political stability . . . . . . . . . . . . . . . . . . . . . . . . . . . . . . . . . . . . . . . . . . . . . . .66.27 641.1.4 Regulatory quality. . . . . . . . . . . . . . . . . . . . . . . . . . . . . . . . . . . . . . . . . . . . .60.07 451.1.5 Corruption . . . . . . . . . . . . . . . . . . . . . . . . . . . . . . . . . . . . . . . . . . . . . . . . . . . .44.59 521.2 Market Landscape . . . . . . . . . . . . . . . . . . . . . . . . . . . . . . . . . . . . . . . . . . 46.93 751.2.1 Competition intensity . . . . . . . . . . . . . . . . . . . . . . . . . . . . . . . . . . . . . . . . . 59.24 921.2.2 Ease of doing business . . . . . . . . . . . . . . . . . . . . . . . . . . . . . . . . . . . . . . . . 74.47 481.2.3 Cluster development . . . . . . . . . . . . . . . . . . . . . . . . . . . . . . . . . . . . . . . . . .22.64 1131.2.4 R&D expenditure . . . . . . . . . . . . . . . . . . . . . . . . . . . . . . . . . . . . . . . . . . . . . . 10.71 641.2.5 ICT infrastructure. . . . . . . . . . . . . . . . . . . . . . . . . . . . . . . . . . . . . . . . . . . . . . 67.43 531.2.6 Urban population . . . . . . . . . . . . . . . . . . . . . . . . . . . . . . . . . . . . . . . . . . . . . 47.10 901.3 Business and Labour Landscape . . . . . . . . . . . . . . . . . . . . . . . . . . . .40.89 84
Labour Market1.3.1 Tertiary-educated unemployment . . . . . . . . . . . . . . . . . . . . . . . . . . . .93.07 111.3.2 Active labour market policies . . . . . . . . . . . . . . . . . . . . . . . . . . . . . . . . .52.04 501.3.3 Labour-employer cooperation . . . . . . . . . . . . . . . . . . . . . . . . . . . . . . . .38.81 65
Management Practice1.3.4 Professional management . . . . . . . . . . . . . . . . . . . . . . . . . . . . . . . . . . . .32.87 1031.3.5 Relationship of pay to productivity . . . . . . . . . . . . . . . . . . . . . . . . . . . .35.46 105
Technology Adoption1.3.6 Technology utilisation. . . . . . . . . . . . . . . . . . . . . . . . . . . . . . . . . . . . . . . . . 37.49 1031.3.7 Investment in emerging technologies . . . . . . . . . . . . . . . . . . . . . . . . 31.16 931.3.8 Robot density . . . . . . . . . . . . . . . . . . . . . . . . . . . . . . . . . . . . . . . . . . . . . . . . . . 6.25 37
2 ATTRACT . . . . . . . . . . . . . . . . . . . . . . . . . . . . . . . . . . . . . . . . . 42.99 952.1 External Openness . . . . . . . . . . . . . . . . . . . . . . . . . . . . . . . . . . . . . . . . . 31.58 106
Attract Business2.1.1 FDI and technology transfer . . . . . . . . . . . . . . . . . . . . . . . . . . . . . . . . . .50.58 862.1.2 Prevalence of foreign ownership . . . . . . . . . . . . . . . . . . . . . . . . . . . . . .60.91 59
Attract People2.1.3 Migrant stock . . . . . . . . . . . . . . . . . . . . . . . . . . . . . . . . . . . . . . . . . . . . . . . . . 17.48 1042.1.4 International students . . . . . . . . . . . . . . . . . . . . . . . . . . . . . . . . . . . . . . . . . 17.64 402.1.5 Brain gain . . . . . . . . . . . . . . . . . . . . . . . . . . . . . . . . . . . . . . . . . . . . . . . . . . . . . 11.31 1272.2 Internal Openness . . . . . . . . . . . . . . . . . . . . . . . . . . . . . . . . . . . . . . . . . . 54.40 74
Social Inclusion2.2.1 Tolerance of minorities . . . . . . . . . . . . . . . . . . . . . . . . . . . . . . . . . . . . . . . .42.22 742.2.2 Tolerance of immigrants . . . . . . . . . . . . . . . . . . . . . . . . . . . . . . . . . . . . . . 17.81 1202.2.3 Social mobility . . . . . . . . . . . . . . . . . . . . . . . . . . . . . . . . . . . . . . . . . . . . . . . .39.65 120
Gender Equality2.2.4 Female graduates . . . . . . . . . . . . . . . . . . . . . . . . . . . . . . . . . . . . . . . . . . . . .76.77 482.2.5 Gender development gap . . . . . . . . . . . . . . . . . . . . . . . . . . . . . . . . . . . .83.39 412.2.6 Leadership opportunities for women . . . . . . . . . . . . . . . . . . . . . . . . .66.57 29
Score Rank
3 GROW . . . . . . . . . . . . . . . . . . . . . . . . . . . . . . . . . . . . . . . . . . . . 36.54 743.1 Formal Education . . . . . . . . . . . . . . . . . . . . . . . . . . . . . . . . . . . . . . . . . . . 30.39 54
Enrolment3.1.1 Vocational enrolment . . . . . . . . . . . . . . . . . . . . . . . . . . . . . . . . . . . . . . . . .42.57 243.1.2 Tertiary enrolment . . . . . . . . . . . . . . . . . . . . . . . . . . . . . . . . . . . . . . . . . . . . 37.62 59
Quality3.1.3 Tertiary education expenditure . . . . . . . . . . . . . . . . . . . . . . . . . . . . . . . 13.74 853.1.4 Reading, maths, and science . . . . . . . . . . . . . . . . . . . . . . . . . . . . . . . . . .46.31 453.1.5 University ranking . . . . . . . . . . . . . . . . . . . . . . . . . . . . . . . . . . . . . . . . . . . . . 11.71 663.2 Lifelong Learning . . . . . . . . . . . . . . . . . . . . . . . . . . . . . . . . . . . . . . . . . . . 34.43 973.2.1 Quality of management schools . . . . . . . . . . . . . . . . . . . . . . . . . . . . . .30.35 1123.2.2 Prevalence of training in firms . . . . . . . . . . . . . . . . . . . . . . . . . . . . . . . . . 49.21 313.2.3 Employee development . . . . . . . . . . . . . . . . . . . . . . . . . . . . . . . . . . . . . .23.73 1173.3 Access to Growth Opportunities . . . . . . . . . . . . . . . . . . . . . . . . . . . 44.81 77
Empowerment3.3.1 Delegation of authority . . . . . . . . . . . . . . . . . . . . . . . . . . . . . . . . . . . . . . .32.87 1043.3.2 Personal rights . . . . . . . . . . . . . . . . . . . . . . . . . . . . . . . . . . . . . . . . . . . . . . . .83.85 45
Collaboration3.3.3 Use of virtual social networks . . . . . . . . . . . . . . . . . . . . . . . . . . . . . . . . .80.78 483.3.4 Use of virtual professional networks . . . . . . . . . . . . . . . . . . . . . . . . . . 18.70 343.3.5 Collaboration within organisations . . . . . . . . . . . . . . . . . . . . . . . . . . . . 27.70 1243.3.6 Collaboration across organisations . . . . . . . . . . . . . . . . . . . . . . . . . . . .24.98 108
4 RETAIN . . . . . . . . . . . . . . . . . . . . . . . . . . . . . . . . . . . . . . . . . . . 54.29 544.1 Sustainability . . . . . . . . . . . . . . . . . . . . . . . . . . . . . . . . . . . . . . . . . . . . . . . 44.75 584.1.1 Pension system . . . . . . . . . . . . . . . . . . . . . . . . . . . . . . . . . . . . . . . . . . . . . . .64.57 434.1.2 Social protection . . . . . . . . . . . . . . . . . . . . . . . . . . . . . . . . . . . . . . . . . . . . . .65.38 334.1.3 Brain retention . . . . . . . . . . . . . . . . . . . . . . . . . . . . . . . . . . . . . . . . . . . . . . . . . 4.31 1304.2 Lifestyle . . . . . . . . . . . . . . . . . . . . . . . . . . . . . . . . . . . . . . . . . . . . . . . . . . . . 63.82 454.2.1 Environmental performance . . . . . . . . . . . . . . . . . . . . . . . . . . . . . . . . . .62.26 404.2.2 Personal safety . . . . . . . . . . . . . . . . . . . . . . . . . . . . . . . . . . . . . . . . . . . . . . . .70.09 364.2.3 Physician density . . . . . . . . . . . . . . . . . . . . . . . . . . . . . . . . . . . . . . . . . . . . . .42.50 444.2.4 Sanitation . . . . . . . . . . . . . . . . . . . . . . . . . . . . . . . . . . . . . . . . . . . . . . . . . . . . .80.43 84
5 VOCATIONAL AND TECHNICAL SKILLS . . . . . . . . . . . . .41.79 715.1 Mid-Level Skills . . . . . . . . . . . . . . . . . . . . . . . . . . . . . . . . . . . . . . . . . . . . . 53.83 395.1.1 Workforce with secondary education . . . . . . . . . . . . . . . . . . . . . . . . . 81.76 115.1.2 Population with secondary education . . . . . . . . . . . . . . . . . . . . . . . .72.87 175.1.3 Technicians and associate professionals . . . . . . . . . . . . . . . . . . . . . . .25.69 795.1.4 Labour productivity per employee . . . . . . . . . . . . . . . . . . . . . . . . . . . .34.99 485.2 Employability . . . . . . . . . . . . . . . . . . . . . . . . . . . . . . . . . . . . . . . . . . . . . . . 29.74 1225.2.1 Ease of finding skilled employees . . . . . . . . . . . . . . . . . . . . . . . . . . . . . 31.45 1275.2.2 Relevance of education system to the economy . . . . . . . . . . . . . . 31.39 995.2.3 Skills matching with secondary education . . . . . . . . . . . . . . . . . . . .18.99 1265.2.4 Skills matching with tertiary education . . . . . . . . . . . . . . . . . . . . . . . . 37.14 112
6 GLOBAL KNOWLEDGE SKILLS . . . . . . . . . . . . . . . . . . . . .29.64 566.1 High-Level Skills . . . . . . . . . . . . . . . . . . . . . . . . . . . . . . . . . . . . . . . . . . . . 24.81 806.1.1 Workforce with tertiary education . . . . . . . . . . . . . . . . . . . . . . . . . . . .29.80 646.1.2 Population with tertiary education . . . . . . . . . . . . . . . . . . . . . . . . . . . .22.21 676.1.3 Professionals . . . . . . . . . . . . . . . . . . . . . . . . . . . . . . . . . . . . . . . . . . . . . . . . . .40.00 406.1.4 Researchers . . . . . . . . . . . . . . . . . . . . . . . . . . . . . . . . . . . . . . . . . . . . . . . . . . . 10.67 516.1.5 Senior officials and managers . . . . . . . . . . . . . . . . . . . . . . . . . . . . . . . . .10.00 976.1.6 Availability of scientists and engineers . . . . . . . . . . . . . . . . . . . . . . . . 36.19 1016.2 Talent Impact . . . . . . . . . . . . . . . . . . . . . . . . . . . . . . . . . . . . . . . . . . . . . . . 34.46 406.2.1 Innovation output . . . . . . . . . . . . . . . . . . . . . . . . . . . . . . . . . . . . . . . . . . . . 37.83 526.2.2 High-value exports . . . . . . . . . . . . . . . . . . . . . . . . . . . . . . . . . . . . . . . . . . . . 27.59 446.2.3 New product entrepreneurial activity . . . . . . . . . . . . . . . . . . . . . . . . .59.44 246.2.4 New business density . . . . . . . . . . . . . . . . . . . . . . . . . . . . . . . . . . . . . . . . .26.97 246.2.5 Scientific journal articles . . . . . . . . . . . . . . . . . . . . . . . . . . . . . . . . . . . . . .20.47 40
l Romania l Income group average
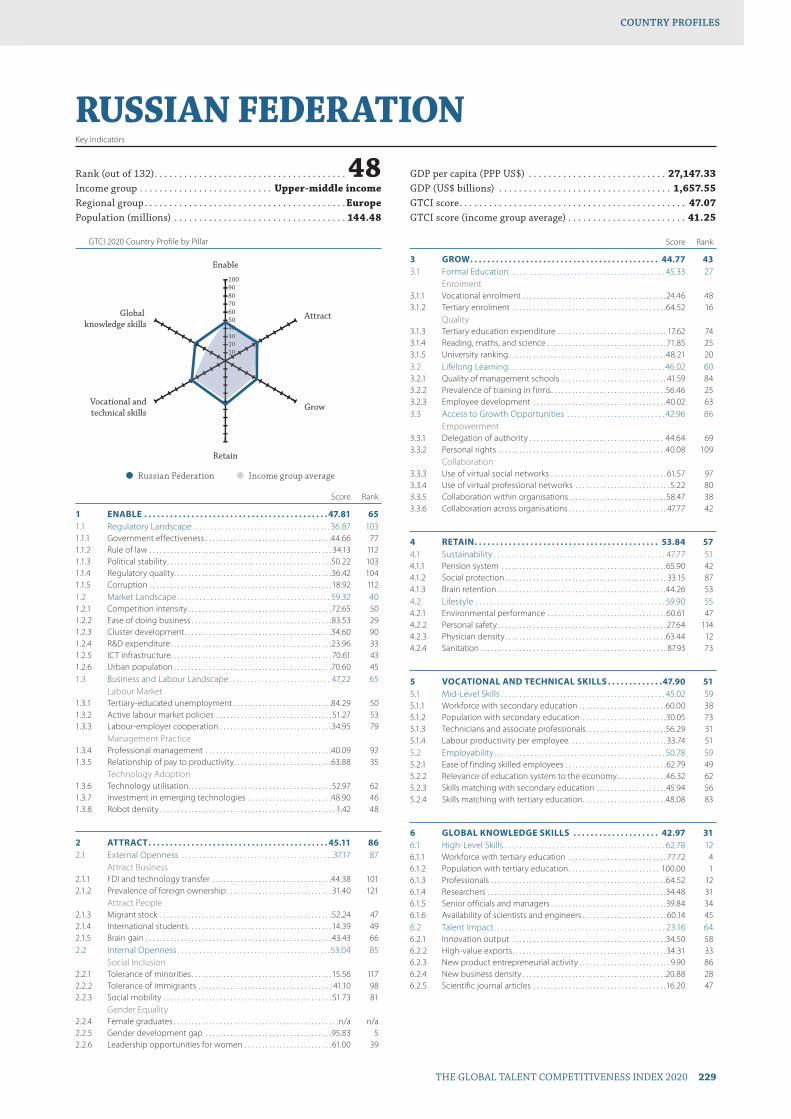
GTCI 2020 Country Profile by Pillar
THE GLOBAL TALENT COMPETITIVENESS INDEX 2020 229
COUNTRY PROFILESCOUNTRY PROFILES
102030405060708090100
Global knowledge skills
Vocational andtechnical skills
Retain
Grow
Attract
Enable
1020304040
RUSSIAN FEDERATIONKey Indicators
Rank (out of 132) . . . . . . . . . . . . . . . . . . . . . . . . . . . . . . . . . . . . . . . 48Income group . . . . . . . . . . . . . . . . . . . . . . . . . . . Upper-middle incomeRegional group . . . . . . . . . . . . . . . . . . . . . . . . . . . . . . . . . . . . . . . . .EuropePopulation (millions) . . . . . . . . . . . . . . . . . . . . . . . . . . . . . . . . . . . 144.48
GDP per capita (PPP US$) . . . . . . . . . . . . . . . . . . . . . . . . . . . . 27,147.33GDP (US$ billions) . . . . . . . . . . . . . . . . . . . . . . . . . . . . . . . . . . . 1,657.55GTCI score . . . . . . . . . . . . . . . . . . . . . . . . . . . . . . . . . . . . . . . . . . . . . . 47.07GTCI score (income group average) . . . . . . . . . . . . . . . . . . . . . . . . 41.25
Score Rank
1 ENABLE . . . . . . . . . . . . . . . . . . . . . . . . . . . . . . . . . . . . . . . . . . . 47.81 651.1 Regulatory Landscape . . . . . . . . . . . . . . . . . . . . . . . . . . . . . . . . . . . . . . 36.87 1031.1.1 Government effectiveness . . . . . . . . . . . . . . . . . . . . . . . . . . . . . . . . . . . .44.66 771.1.2 Rule of law . . . . . . . . . . . . . . . . . . . . . . . . . . . . . . . . . . . . . . . . . . . . . . . . . . . . 34.13 1121.1.3 Political stability . . . . . . . . . . . . . . . . . . . . . . . . . . . . . . . . . . . . . . . . . . . . . . .50.22 1031.1.4 Regulatory quality. . . . . . . . . . . . . . . . . . . . . . . . . . . . . . . . . . . . . . . . . . . . .36.42 1041.1.5 Corruption . . . . . . . . . . . . . . . . . . . . . . . . . . . . . . . . . . . . . . . . . . . . . . . . . . . . 18.92 1121.2 Market Landscape . . . . . . . . . . . . . . . . . . . . . . . . . . . . . . . . . . . . . . . . . . 59.32 401.2.1 Competition intensity . . . . . . . . . . . . . . . . . . . . . . . . . . . . . . . . . . . . . . . . .72.65 501.2.2 Ease of doing business . . . . . . . . . . . . . . . . . . . . . . . . . . . . . . . . . . . . . . . .83.53 291.2.3 Cluster development . . . . . . . . . . . . . . . . . . . . . . . . . . . . . . . . . . . . . . . . . .34.60 901.2.4 R&D expenditure . . . . . . . . . . . . . . . . . . . . . . . . . . . . . . . . . . . . . . . . . . . . . .23.96 331.2.5 ICT infrastructure. . . . . . . . . . . . . . . . . . . . . . . . . . . . . . . . . . . . . . . . . . . . . . 70.61 431.2.6 Urban population . . . . . . . . . . . . . . . . . . . . . . . . . . . . . . . . . . . . . . . . . . . . .70.60 451.3 Business and Labour Landscape . . . . . . . . . . . . . . . . . . . . . . . . . . . . 47.22 65
Labour Market1.3.1 Tertiary-educated unemployment . . . . . . . . . . . . . . . . . . . . . . . . . . . .84.29 501.3.2 Active labour market policies . . . . . . . . . . . . . . . . . . . . . . . . . . . . . . . . . 51.27 531.3.3 Labour-employer cooperation . . . . . . . . . . . . . . . . . . . . . . . . . . . . . . . .34.95 79
Management Practice1.3.4 Professional management . . . . . . . . . . . . . . . . . . . . . . . . . . . . . . . . . . . .40.09 921.3.5 Relationship of pay to productivity . . . . . . . . . . . . . . . . . . . . . . . . . . . .63.88 35
Technology Adoption1.3.6 Technology utilisation. . . . . . . . . . . . . . . . . . . . . . . . . . . . . . . . . . . . . . . . . 52.97 621.3.7 Investment in emerging technologies . . . . . . . . . . . . . . . . . . . . . . . .48.90 461.3.8 Robot density . . . . . . . . . . . . . . . . . . . . . . . . . . . . . . . . . . . . . . . . . . . . . . . . . . 1.42 48
2 ATTRACT . . . . . . . . . . . . . . . . . . . . . . . . . . . . . . . . . . . . . . . . . . 45.11 862.1 External Openness . . . . . . . . . . . . . . . . . . . . . . . . . . . . . . . . . . . . . . . . . .37.17 87
Attract Business2.1.1 FDI and technology transfer . . . . . . . . . . . . . . . . . . . . . . . . . . . . . . . . . .44.38 1012.1.2 Prevalence of foreign ownership . . . . . . . . . . . . . . . . . . . . . . . . . . . . . . 31.40 121
Attract People2.1.3 Migrant stock . . . . . . . . . . . . . . . . . . . . . . . . . . . . . . . . . . . . . . . . . . . . . . . . .52.24 472.1.4 International students . . . . . . . . . . . . . . . . . . . . . . . . . . . . . . . . . . . . . . . . .14.39 492.1.5 Brain gain . . . . . . . . . . . . . . . . . . . . . . . . . . . . . . . . . . . . . . . . . . . . . . . . . . . . . 43.43 662.2 Internal Openness . . . . . . . . . . . . . . . . . . . . . . . . . . . . . . . . . . . . . . . . . . 53.04 85
Social Inclusion2.2.1 Tolerance of minorities . . . . . . . . . . . . . . . . . . . . . . . . . . . . . . . . . . . . . . . . 15.56 1172.2.2 Tolerance of immigrants . . . . . . . . . . . . . . . . . . . . . . . . . . . . . . . . . . . . . . 41.10 982.2.3 Social mobility . . . . . . . . . . . . . . . . . . . . . . . . . . . . . . . . . . . . . . . . . . . . . . . . 51.73 81
Gender Equality2.2.4 Female graduates . . . . . . . . . . . . . . . . . . . . . . . . . . . . . . . . . . . . . . . . . . . . . . .n/a n/a2.2.5 Gender development gap . . . . . . . . . . . . . . . . . . . . . . . . . . . . . . . . . . . .95.83 52.2.6 Leadership opportunities for women . . . . . . . . . . . . . . . . . . . . . . . . . 61.00 39
Score Rank
3 GROW . . . . . . . . . . . . . . . . . . . . . . . . . . . . . . . . . . . . . . . . . . . . 44.77 433.1 Formal Education . . . . . . . . . . . . . . . . . . . . . . . . . . . . . . . . . . . . . . . . . . . 45.33 27
Enrolment3.1.1 Vocational enrolment . . . . . . . . . . . . . . . . . . . . . . . . . . . . . . . . . . . . . . . . .24.46 483.1.2 Tertiary enrolment . . . . . . . . . . . . . . . . . . . . . . . . . . . . . . . . . . . . . . . . . . . .64.52 16
Quality3.1.3 Tertiary education expenditure . . . . . . . . . . . . . . . . . . . . . . . . . . . . . . . 17.62 743.1.4 Reading, maths, and science . . . . . . . . . . . . . . . . . . . . . . . . . . . . . . . . . . 71.85 253.1.5 University ranking . . . . . . . . . . . . . . . . . . . . . . . . . . . . . . . . . . . . . . . . . . . . .48.21 203.2 Lifelong Learning . . . . . . . . . . . . . . . . . . . . . . . . . . . . . . . . . . . . . . . . . . . 46.02 603.2.1 Quality of management schools . . . . . . . . . . . . . . . . . . . . . . . . . . . . . . 41.59 843.2.2 Prevalence of training in firms . . . . . . . . . . . . . . . . . . . . . . . . . . . . . . . . .56.46 253.2.3 Employee development . . . . . . . . . . . . . . . . . . . . . . . . . . . . . . . . . . . . . .40.02 633.3 Access to Growth Opportunities . . . . . . . . . . . . . . . . . . . . . . . . . . . 42.96 86
Empowerment3.3.1 Delegation of authority . . . . . . . . . . . . . . . . . . . . . . . . . . . . . . . . . . . . . . 44.64 693.3.2 Personal rights . . . . . . . . . . . . . . . . . . . . . . . . . . . . . . . . . . . . . . . . . . . . . . . .40.08 109
Collaboration3.3.3 Use of virtual social networks . . . . . . . . . . . . . . . . . . . . . . . . . . . . . . . . . 61.57 973.3.4 Use of virtual professional networks . . . . . . . . . . . . . . . . . . . . . . . . . . . 5.22 803.3.5 Collaboration within organisations . . . . . . . . . . . . . . . . . . . . . . . . . . . .58.47 383.3.6 Collaboration across organisations . . . . . . . . . . . . . . . . . . . . . . . . . . . . 47.77 42
4 RETAIN . . . . . . . . . . . . . . . . . . . . . . . . . . . . . . . . . . . . . . . . . . . 53.84 574.1 Sustainability . . . . . . . . . . . . . . . . . . . . . . . . . . . . . . . . . . . . . . . . . . . . . . . 47.77 514.1.1 Pension system . . . . . . . . . . . . . . . . . . . . . . . . . . . . . . . . . . . . . . . . . . . . . . .65.90 424.1.2 Social protection . . . . . . . . . . . . . . . . . . . . . . . . . . . . . . . . . . . . . . . . . . . . . . 33.15 874.1.3 Brain retention . . . . . . . . . . . . . . . . . . . . . . . . . . . . . . . . . . . . . . . . . . . . . . . .44.26 534.2 Lifestyle . . . . . . . . . . . . . . . . . . . . . . . . . . . . . . . . . . . . . . . . . . . . . . . . . . . . 59.90 554.2.1 Environmental performance . . . . . . . . . . . . . . . . . . . . . . . . . . . . . . . . . .60.61 474.2.2 Personal safety . . . . . . . . . . . . . . . . . . . . . . . . . . . . . . . . . . . . . . . . . . . . . . . . 27.64 1144.2.3 Physician density . . . . . . . . . . . . . . . . . . . . . . . . . . . . . . . . . . . . . . . . . . . . . .63.44 124.2.4 Sanitation . . . . . . . . . . . . . . . . . . . . . . . . . . . . . . . . . . . . . . . . . . . . . . . . . . . . . 87.93 73
5 VOCATIONAL AND TECHNICAL SKILLS . . . . . . . . . . . . .47.90 515.1 Mid-Level Skills . . . . . . . . . . . . . . . . . . . . . . . . . . . . . . . . . . . . . . . . . . . . . 45.02 595.1.1 Workforce with secondary education . . . . . . . . . . . . . . . . . . . . . . . . .60.00 385.1.2 Population with secondary education . . . . . . . . . . . . . . . . . . . . . . . .30.05 735.1.3 Technicians and associate professionals . . . . . . . . . . . . . . . . . . . . . . .56.29 315.1.4 Labour productivity per employee . . . . . . . . . . . . . . . . . . . . . . . . . . . . 33.74 515.2 Employability . . . . . . . . . . . . . . . . . . . . . . . . . . . . . . . . . . . . . . . . . . . . . . . 50.78 595.2.1 Ease of finding skilled employees . . . . . . . . . . . . . . . . . . . . . . . . . . . . .62.79 495.2.2 Relevance of education system to the economy . . . . . . . . . . . . . .46.32 625.2.3 Skills matching with secondary education . . . . . . . . . . . . . . . . . . . .45.94 565.2.4 Skills matching with tertiary education . . . . . . . . . . . . . . . . . . . . . . . .48.08 83
6 GLOBAL KNOWLEDGE SKILLS . . . . . . . . . . . . . . . . . . . . 42.97 316.1 High-Level Skills . . . . . . . . . . . . . . . . . . . . . . . . . . . . . . . . . . . . . . . . . . . . 62.78 126.1.1 Workforce with tertiary education . . . . . . . . . . . . . . . . . . . . . . . . . . . . 77.72 46.1.2 Population with tertiary education . . . . . . . . . . . . . . . . . . . . . . . . . . 100.00 16.1.3 Professionals . . . . . . . . . . . . . . . . . . . . . . . . . . . . . . . . . . . . . . . . . . . . . . . . . .64.52 126.1.4 Researchers . . . . . . . . . . . . . . . . . . . . . . . . . . . . . . . . . . . . . . . . . . . . . . . . . . .34.48 316.1.5 Senior officials and managers . . . . . . . . . . . . . . . . . . . . . . . . . . . . . . . . .39.84 346.1.6 Availability of scientists and engineers . . . . . . . . . . . . . . . . . . . . . . . . 60.14 456.2 Talent Impact . . . . . . . . . . . . . . . . . . . . . . . . . . . . . . . . . . . . . . . . . . . . . . . 23.16 646.2.1 Innovation output . . . . . . . . . . . . . . . . . . . . . . . . . . . . . . . . . . . . . . . . . . . .34.50 586.2.2 High-value exports . . . . . . . . . . . . . . . . . . . . . . . . . . . . . . . . . . . . . . . . . . . .34.31 336.2.3 New product entrepreneurial activity . . . . . . . . . . . . . . . . . . . . . . . . . . 9.90 866.2.4 New business density . . . . . . . . . . . . . . . . . . . . . . . . . . . . . . . . . . . . . . . . .20.88 286.2.5 Scientific journal articles . . . . . . . . . . . . . . . . . . . . . . . . . . . . . . . . . . . . . .16.20 47
l Russian Federation l Income group average
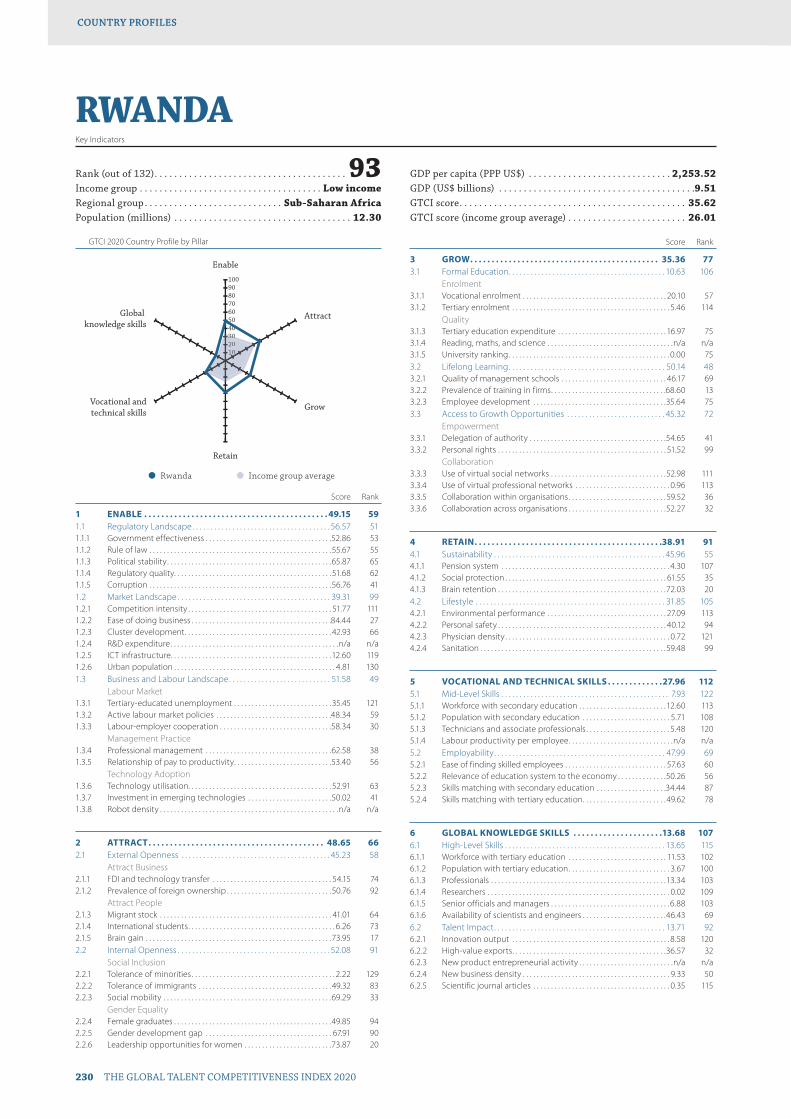
GTCI 2020 Country Profile by Pillar
230 THE GLOBAL TALENT COMPETITIVENESS INDEX 2020
COUNTRY PROFILESCOUNTRY PROFILES
102030405060708090100
Global knowledge skills
Vocational andtechnical skills
Retain
Grow
Attract
Enable
1020330
RWANDAKey Indicators
Rank (out of 132) . . . . . . . . . . . . . . . . . . . . . . . . . . . . . . . . . . . . . . . 93Income group . . . . . . . . . . . . . . . . . . . . . . . . . . . . . . . . . . . . . Low incomeRegional group . . . . . . . . . . . . . . . . . . . . . . . . . . . . Sub-Saharan AfricaPopulation (millions) . . . . . . . . . . . . . . . . . . . . . . . . . . . . . . . . . . . . 12.30
GDP per capita (PPP US$) . . . . . . . . . . . . . . . . . . . . . . . . . . . . . 2,253.52GDP (US$ billions) . . . . . . . . . . . . . . . . . . . . . . . . . . . . . . . . . . . . . . . .9.51GTCI score . . . . . . . . . . . . . . . . . . . . . . . . . . . . . . . . . . . . . . . . . . . . . . 35.62GTCI score (income group average) . . . . . . . . . . . . . . . . . . . . . . . . 26.01
Score Rank
1 ENABLE . . . . . . . . . . . . . . . . . . . . . . . . . . . . . . . . . . . . . . . . . . . 49.15 591.1 Regulatory Landscape . . . . . . . . . . . . . . . . . . . . . . . . . . . . . . . . . . . . . . 56.57 511.1.1 Government effectiveness . . . . . . . . . . . . . . . . . . . . . . . . . . . . . . . . . . . .52.86 531.1.2 Rule of law . . . . . . . . . . . . . . . . . . . . . . . . . . . . . . . . . . . . . . . . . . . . . . . . . . . .55.67 551.1.3 Political stability . . . . . . . . . . . . . . . . . . . . . . . . . . . . . . . . . . . . . . . . . . . . . . .65.87 651.1.4 Regulatory quality. . . . . . . . . . . . . . . . . . . . . . . . . . . . . . . . . . . . . . . . . . . . . 51.68 621.1.5 Corruption . . . . . . . . . . . . . . . . . . . . . . . . . . . . . . . . . . . . . . . . . . . . . . . . . . . .56.76 411.2 Market Landscape . . . . . . . . . . . . . . . . . . . . . . . . . . . . . . . . . . . . . . . . . . 39.31 991.2.1 Competition intensity . . . . . . . . . . . . . . . . . . . . . . . . . . . . . . . . . . . . . . . . . 51.77 1111.2.2 Ease of doing business . . . . . . . . . . . . . . . . . . . . . . . . . . . . . . . . . . . . . . . .84.44 271.2.3 Cluster development . . . . . . . . . . . . . . . . . . . . . . . . . . . . . . . . . . . . . . . . . . 42.93 661.2.4 R&D expenditure . . . . . . . . . . . . . . . . . . . . . . . . . . . . . . . . . . . . . . . . . . . . . . . .n/a n/a1.2.5 ICT infrastructure. . . . . . . . . . . . . . . . . . . . . . . . . . . . . . . . . . . . . . . . . . . . . .12.60 1191.2.6 Urban population . . . . . . . . . . . . . . . . . . . . . . . . . . . . . . . . . . . . . . . . . . . . . . 4.81 1301.3 Business and Labour Landscape . . . . . . . . . . . . . . . . . . . . . . . . . . . . 51.58 49
Labour Market1.3.1 Tertiary-educated unemployment . . . . . . . . . . . . . . . . . . . . . . . . . . . . 35.45 1211.3.2 Active labour market policies . . . . . . . . . . . . . . . . . . . . . . . . . . . . . . . . .48.34 591.3.3 Labour-employer cooperation . . . . . . . . . . . . . . . . . . . . . . . . . . . . . . . .58.34 30
Management Practice1.3.4 Professional management . . . . . . . . . . . . . . . . . . . . . . . . . . . . . . . . . . . .62.58 381.3.5 Relationship of pay to productivity . . . . . . . . . . . . . . . . . . . . . . . . . . . .53.40 56
Technology Adoption1.3.6 Technology utilisation. . . . . . . . . . . . . . . . . . . . . . . . . . . . . . . . . . . . . . . . . 52.91 631.3.7 Investment in emerging technologies . . . . . . . . . . . . . . . . . . . . . . . .50.02 411.3.8 Robot density . . . . . . . . . . . . . . . . . . . . . . . . . . . . . . . . . . . . . . . . . . . . . . . . . . .n/a n/a
2 ATTRACT . . . . . . . . . . . . . . . . . . . . . . . . . . . . . . . . . . . . . . . . . 48.65 662.1 External Openness . . . . . . . . . . . . . . . . . . . . . . . . . . . . . . . . . . . . . . . . . 45.23 58
Attract Business2.1.1 FDI and technology transfer . . . . . . . . . . . . . . . . . . . . . . . . . . . . . . . . . . 54.15 742.1.2 Prevalence of foreign ownership . . . . . . . . . . . . . . . . . . . . . . . . . . . . . .50.76 92
Attract People2.1.3 Migrant stock . . . . . . . . . . . . . . . . . . . . . . . . . . . . . . . . . . . . . . . . . . . . . . . . . 41.01 642.1.4 International students . . . . . . . . . . . . . . . . . . . . . . . . . . . . . . . . . . . . . . . . . . 6.26 732.1.5 Brain gain . . . . . . . . . . . . . . . . . . . . . . . . . . . . . . . . . . . . . . . . . . . . . . . . . . . . .73.95 172.2 Internal Openness . . . . . . . . . . . . . . . . . . . . . . . . . . . . . . . . . . . . . . . . . . 52.08 91
Social Inclusion2.2.1 Tolerance of minorities . . . . . . . . . . . . . . . . . . . . . . . . . . . . . . . . . . . . . . . . . 2.22 1292.2.2 Tolerance of immigrants . . . . . . . . . . . . . . . . . . . . . . . . . . . . . . . . . . . . . . 49.32 832.2.3 Social mobility . . . . . . . . . . . . . . . . . . . . . . . . . . . . . . . . . . . . . . . . . . . . . . . .69.29 33
Gender Equality2.2.4 Female graduates . . . . . . . . . . . . . . . . . . . . . . . . . . . . . . . . . . . . . . . . . . . . .49.85 942.2.5 Gender development gap . . . . . . . . . . . . . . . . . . . . . . . . . . . . . . . . . . . . 67.91 902.2.6 Leadership opportunities for women . . . . . . . . . . . . . . . . . . . . . . . . .73.87 20
Score Rank
3 GROW . . . . . . . . . . . . . . . . . . . . . . . . . . . . . . . . . . . . . . . . . . . . 35.36 773.1 Formal Education . . . . . . . . . . . . . . . . . . . . . . . . . . . . . . . . . . . . . . . . . . . 10.63 106
Enrolment3.1.1 Vocational enrolment . . . . . . . . . . . . . . . . . . . . . . . . . . . . . . . . . . . . . . . . . 20.10 573.1.2 Tertiary enrolment . . . . . . . . . . . . . . . . . . . . . . . . . . . . . . . . . . . . . . . . . . . . . 5.46 114
Quality3.1.3 Tertiary education expenditure . . . . . . . . . . . . . . . . . . . . . . . . . . . . . . . 16.97 753.1.4 Reading, maths, and science . . . . . . . . . . . . . . . . . . . . . . . . . . . . . . . . . . . .n/a n/a3.1.5 University ranking . . . . . . . . . . . . . . . . . . . . . . . . . . . . . . . . . . . . . . . . . . . . . . 0.00 753.2 Lifelong Learning . . . . . . . . . . . . . . . . . . . . . . . . . . . . . . . . . . . . . . . . . . . 50.14 483.2.1 Quality of management schools . . . . . . . . . . . . . . . . . . . . . . . . . . . . . . 46.17 693.2.2 Prevalence of training in firms . . . . . . . . . . . . . . . . . . . . . . . . . . . . . . . . .68.60 133.2.3 Employee development . . . . . . . . . . . . . . . . . . . . . . . . . . . . . . . . . . . . . .35.64 753.3 Access to Growth Opportunities . . . . . . . . . . . . . . . . . . . . . . . . . . . 45.32 72
Empowerment3.3.1 Delegation of authority . . . . . . . . . . . . . . . . . . . . . . . . . . . . . . . . . . . . . . .54.65 413.3.2 Personal rights . . . . . . . . . . . . . . . . . . . . . . . . . . . . . . . . . . . . . . . . . . . . . . . . 51.52 99
Collaboration3.3.3 Use of virtual social networks . . . . . . . . . . . . . . . . . . . . . . . . . . . . . . . . .52.98 1113.3.4 Use of virtual professional networks . . . . . . . . . . . . . . . . . . . . . . . . . . . 0.96 1133.3.5 Collaboration within organisations . . . . . . . . . . . . . . . . . . . . . . . . . . . . 59.52 363.3.6 Collaboration across organisations . . . . . . . . . . . . . . . . . . . . . . . . . . . .52.27 32
4 RETAIN . . . . . . . . . . . . . . . . . . . . . . . . . . . . . . . . . . . . . . . . . . . .38.91 914.1 Sustainability . . . . . . . . . . . . . . . . . . . . . . . . . . . . . . . . . . . . . . . . . . . . . . . 45.96 554.1.1 Pension system . . . . . . . . . . . . . . . . . . . . . . . . . . . . . . . . . . . . . . . . . . . . . . . . 4.30 1074.1.2 Social protection . . . . . . . . . . . . . . . . . . . . . . . . . . . . . . . . . . . . . . . . . . . . . . 61.55 354.1.3 Brain retention . . . . . . . . . . . . . . . . . . . . . . . . . . . . . . . . . . . . . . . . . . . . . . . .72.03 204.2 Lifestyle . . . . . . . . . . . . . . . . . . . . . . . . . . . . . . . . . . . . . . . . . . . . . . . . . . . . 31.85 1054.2.1 Environmental performance . . . . . . . . . . . . . . . . . . . . . . . . . . . . . . . . . . 27.09 1134.2.2 Personal safety . . . . . . . . . . . . . . . . . . . . . . . . . . . . . . . . . . . . . . . . . . . . . . . . 40.12 944.2.3 Physician density . . . . . . . . . . . . . . . . . . . . . . . . . . . . . . . . . . . . . . . . . . . . . . . 0.72 1214.2.4 Sanitation . . . . . . . . . . . . . . . . . . . . . . . . . . . . . . . . . . . . . . . . . . . . . . . . . . . . .59.48 99
5 VOCATIONAL AND TECHNICAL SKILLS . . . . . . . . . . . . .27.96 1125.1 Mid-Level Skills . . . . . . . . . . . . . . . . . . . . . . . . . . . . . . . . . . . . . . . . . . . . . . 7.93 1225.1.1 Workforce with secondary education . . . . . . . . . . . . . . . . . . . . . . . . .12.60 1135.1.2 Population with secondary education . . . . . . . . . . . . . . . . . . . . . . . . . 5.71 1085.1.3 Technicians and associate professionals . . . . . . . . . . . . . . . . . . . . . . . . 5.48 1205.1.4 Labour productivity per employee . . . . . . . . . . . . . . . . . . . . . . . . . . . . . .n/a n/a5.2 Employability . . . . . . . . . . . . . . . . . . . . . . . . . . . . . . . . . . . . . . . . . . . . . . . 47.99 695.2.1 Ease of finding skilled employees . . . . . . . . . . . . . . . . . . . . . . . . . . . . . 57.63 605.2.2 Relevance of education system to the economy . . . . . . . . . . . . . .50.26 565.2.3 Skills matching with secondary education . . . . . . . . . . . . . . . . . . . .34.44 875.2.4 Skills matching with tertiary education . . . . . . . . . . . . . . . . . . . . . . . .49.62 78
6 GLOBAL KNOWLEDGE SKILLS . . . . . . . . . . . . . . . . . . . . .13.68 1076.1 High-Level Skills . . . . . . . . . . . . . . . . . . . . . . . . . . . . . . . . . . . . . . . . . . . . 13.65 1156.1.1 Workforce with tertiary education . . . . . . . . . . . . . . . . . . . . . . . . . . . . 11.53 1026.1.2 Population with tertiary education . . . . . . . . . . . . . . . . . . . . . . . . . . . . . 3.67 1006.1.3 Professionals . . . . . . . . . . . . . . . . . . . . . . . . . . . . . . . . . . . . . . . . . . . . . . . . . .13.34 1036.1.4 Researchers . . . . . . . . . . . . . . . . . . . . . . . . . . . . . . . . . . . . . . . . . . . . . . . . . . . . 0.02 1096.1.5 Senior officials and managers . . . . . . . . . . . . . . . . . . . . . . . . . . . . . . . . . . 6.88 1036.1.6 Availability of scientists and engineers . . . . . . . . . . . . . . . . . . . . . . . .46.43 696.2 Talent Impact . . . . . . . . . . . . . . . . . . . . . . . . . . . . . . . . . . . . . . . . . . . . . . . 13.71 926.2.1 Innovation output . . . . . . . . . . . . . . . . . . . . . . . . . . . . . . . . . . . . . . . . . . . . . 8.58 1206.2.2 High-value exports . . . . . . . . . . . . . . . . . . . . . . . . . . . . . . . . . . . . . . . . . . . .36.57 326.2.3 New product entrepreneurial activity . . . . . . . . . . . . . . . . . . . . . . . . . . .n/a n/a6.2.4 New business density . . . . . . . . . . . . . . . . . . . . . . . . . . . . . . . . . . . . . . . . . . 9.33 506.2.5 Scientific journal articles . . . . . . . . . . . . . . . . . . . . . . . . . . . . . . . . . . . . . . . 0.35 115
l Rwanda l Income group average
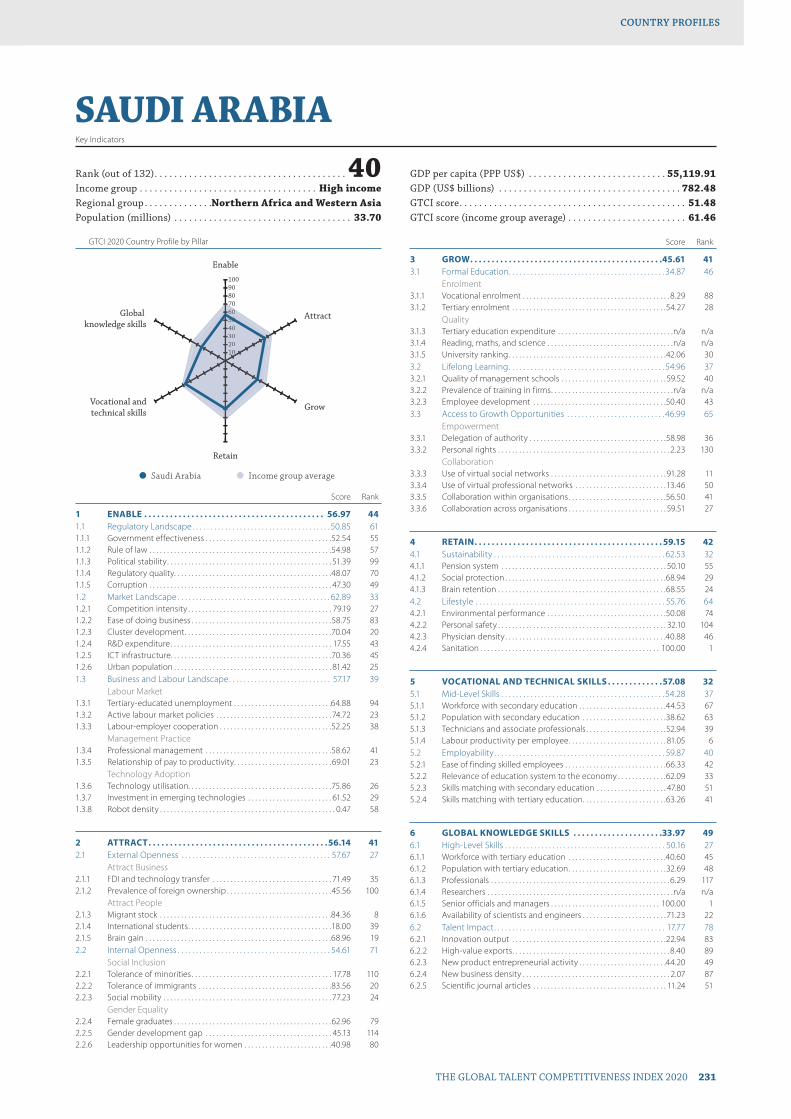
GTCI 2020 Country Profile by Pillar
THE GLOBAL TALENT COMPETITIVENESS INDEX 2020 231
COUNTRY PROFILESCOUNTRY PROFILES
102030405060708090100
Global knowledge skills
Vocational andtechnical skills
Retain
Grow
Attract
Enable
102030405060607
SAUDI ARABIAKey Indicators
Rank (out of 132) . . . . . . . . . . . . . . . . . . . . . . . . . . . . . . . . . . . . . . . 40Income group . . . . . . . . . . . . . . . . . . . . . . . . . . . . . . . . . . . . High incomeRegional group . . . . . . . . . . . . . .Northern Africa and Western AsiaPopulation (millions) . . . . . . . . . . . . . . . . . . . . . . . . . . . . . . . . . . . . 33.70
GDP per capita (PPP US$) . . . . . . . . . . . . . . . . . . . . . . . . . . . . 55,119.91GDP (US$ billions) . . . . . . . . . . . . . . . . . . . . . . . . . . . . . . . . . . . . . 782.48GTCI score . . . . . . . . . . . . . . . . . . . . . . . . . . . . . . . . . . . . . . . . . . . . . . 51.48GTCI score (income group average) . . . . . . . . . . . . . . . . . . . . . . . . 61.46
Score Rank
1 ENABLE . . . . . . . . . . . . . . . . . . . . . . . . . . . . . . . . . . . . . . . . . . 56.97 441.1 Regulatory Landscape . . . . . . . . . . . . . . . . . . . . . . . . . . . . . . . . . . . . . . 50.85 611.1.1 Government effectiveness . . . . . . . . . . . . . . . . . . . . . . . . . . . . . . . . . . . .52.54 551.1.2 Rule of law . . . . . . . . . . . . . . . . . . . . . . . . . . . . . . . . . . . . . . . . . . . . . . . . . . . .54.98 571.1.3 Political stability . . . . . . . . . . . . . . . . . . . . . . . . . . . . . . . . . . . . . . . . . . . . . . . 51.39 991.1.4 Regulatory quality. . . . . . . . . . . . . . . . . . . . . . . . . . . . . . . . . . . . . . . . . . . . .48.07 701.1.5 Corruption . . . . . . . . . . . . . . . . . . . . . . . . . . . . . . . . . . . . . . . . . . . . . . . . . . . . 47.30 491.2 Market Landscape . . . . . . . . . . . . . . . . . . . . . . . . . . . . . . . . . . . . . . . . . . 62.89 331.2.1 Competition intensity . . . . . . . . . . . . . . . . . . . . . . . . . . . . . . . . . . . . . . . . . 79.19 271.2.2 Ease of doing business . . . . . . . . . . . . . . . . . . . . . . . . . . . . . . . . . . . . . . . .58.75 831.2.3 Cluster development . . . . . . . . . . . . . . . . . . . . . . . . . . . . . . . . . . . . . . . . . .70.04 201.2.4 R&D expenditure . . . . . . . . . . . . . . . . . . . . . . . . . . . . . . . . . . . . . . . . . . . . . . 17.55 431.2.5 ICT infrastructure. . . . . . . . . . . . . . . . . . . . . . . . . . . . . . . . . . . . . . . . . . . . . .70.36 451.2.6 Urban population . . . . . . . . . . . . . . . . . . . . . . . . . . . . . . . . . . . . . . . . . . . . . 81.42 251.3 Business and Labour Landscape . . . . . . . . . . . . . . . . . . . . . . . . . . . . 57.17 39
Labour Market1.3.1 Tertiary-educated unemployment . . . . . . . . . . . . . . . . . . . . . . . . . . . .64.88 941.3.2 Active labour market policies . . . . . . . . . . . . . . . . . . . . . . . . . . . . . . . . . 74.72 231.3.3 Labour-employer cooperation . . . . . . . . . . . . . . . . . . . . . . . . . . . . . . . .52.25 38
Management Practice1.3.4 Professional management . . . . . . . . . . . . . . . . . . . . . . . . . . . . . . . . . . . .58.62 411.3.5 Relationship of pay to productivity . . . . . . . . . . . . . . . . . . . . . . . . . . . . 69.01 23
Technology Adoption1.3.6 Technology utilisation. . . . . . . . . . . . . . . . . . . . . . . . . . . . . . . . . . . . . . . . .75.86 261.3.7 Investment in emerging technologies . . . . . . . . . . . . . . . . . . . . . . . . 61.52 291.3.8 Robot density . . . . . . . . . . . . . . . . . . . . . . . . . . . . . . . . . . . . . . . . . . . . . . . . . . 0.47 58
2 ATTRACT . . . . . . . . . . . . . . . . . . . . . . . . . . . . . . . . . . . . . . . . . .56.14 412.1 External Openness . . . . . . . . . . . . . . . . . . . . . . . . . . . . . . . . . . . . . . . . . 57.67 27
Attract Business2.1.1 FDI and technology transfer . . . . . . . . . . . . . . . . . . . . . . . . . . . . . . . . . . 71.49 352.1.2 Prevalence of foreign ownership . . . . . . . . . . . . . . . . . . . . . . . . . . . . . .45.56 100
Attract People2.1.3 Migrant stock . . . . . . . . . . . . . . . . . . . . . . . . . . . . . . . . . . . . . . . . . . . . . . . . .84.36 82.1.4 International students . . . . . . . . . . . . . . . . . . . . . . . . . . . . . . . . . . . . . . . . .18.00 392.1.5 Brain gain . . . . . . . . . . . . . . . . . . . . . . . . . . . . . . . . . . . . . . . . . . . . . . . . . . . . .68.96 192.2 Internal Openness . . . . . . . . . . . . . . . . . . . . . . . . . . . . . . . . . . . . . . . . . . 54.61 71
Social Inclusion2.2.1 Tolerance of minorities . . . . . . . . . . . . . . . . . . . . . . . . . . . . . . . . . . . . . . . . 17.78 1102.2.2 Tolerance of immigrants . . . . . . . . . . . . . . . . . . . . . . . . . . . . . . . . . . . . . .83.56 202.2.3 Social mobility . . . . . . . . . . . . . . . . . . . . . . . . . . . . . . . . . . . . . . . . . . . . . . . . 77.23 24
Gender Equality2.2.4 Female graduates . . . . . . . . . . . . . . . . . . . . . . . . . . . . . . . . . . . . . . . . . . . . .62.96 792.2.5 Gender development gap . . . . . . . . . . . . . . . . . . . . . . . . . . . . . . . . . . . . 45.13 1142.2.6 Leadership opportunities for women . . . . . . . . . . . . . . . . . . . . . . . . .40.98 80
Score Rank
3 GROW . . . . . . . . . . . . . . . . . . . . . . . . . . . . . . . . . . . . . . . . . . . . .45.61 413.1 Formal Education . . . . . . . . . . . . . . . . . . . . . . . . . . . . . . . . . . . . . . . . . . . 34.87 46
Enrolment3.1.1 Vocational enrolment . . . . . . . . . . . . . . . . . . . . . . . . . . . . . . . . . . . . . . . . . . 8.29 883.1.2 Tertiary enrolment . . . . . . . . . . . . . . . . . . . . . . . . . . . . . . . . . . . . . . . . . . . .54.27 28
Quality3.1.3 Tertiary education expenditure . . . . . . . . . . . . . . . . . . . . . . . . . . . . . . . . .n/a n/a3.1.4 Reading, maths, and science . . . . . . . . . . . . . . . . . . . . . . . . . . . . . . . . . . . .n/a n/a3.1.5 University ranking . . . . . . . . . . . . . . . . . . . . . . . . . . . . . . . . . . . . . . . . . . . . .42.06 303.2 Lifelong Learning . . . . . . . . . . . . . . . . . . . . . . . . . . . . . . . . . . . . . . . . . . . 54.96 373.2.1 Quality of management schools . . . . . . . . . . . . . . . . . . . . . . . . . . . . . . 59.52 403.2.2 Prevalence of training in firms . . . . . . . . . . . . . . . . . . . . . . . . . . . . . . . . . . .n/a n/a3.2.3 Employee development . . . . . . . . . . . . . . . . . . . . . . . . . . . . . . . . . . . . . .50.40 433.3 Access to Growth Opportunities . . . . . . . . . . . . . . . . . . . . . . . . . . . 46.99 65
Empowerment3.3.1 Delegation of authority . . . . . . . . . . . . . . . . . . . . . . . . . . . . . . . . . . . . . . .58.98 363.3.2 Personal rights . . . . . . . . . . . . . . . . . . . . . . . . . . . . . . . . . . . . . . . . . . . . . . . . . 2.23 130
Collaboration3.3.3 Use of virtual social networks . . . . . . . . . . . . . . . . . . . . . . . . . . . . . . . . . 91.28 113.3.4 Use of virtual professional networks . . . . . . . . . . . . . . . . . . . . . . . . . .13.46 503.3.5 Collaboration within organisations . . . . . . . . . . . . . . . . . . . . . . . . . . . .56.50 413.3.6 Collaboration across organisations . . . . . . . . . . . . . . . . . . . . . . . . . . . . 59.51 27
4 RETAIN . . . . . . . . . . . . . . . . . . . . . . . . . . . . . . . . . . . . . . . . . . . . 59.15 424.1 Sustainability . . . . . . . . . . . . . . . . . . . . . . . . . . . . . . . . . . . . . . . . . . . . . . . 62.53 324.1.1 Pension system . . . . . . . . . . . . . . . . . . . . . . . . . . . . . . . . . . . . . . . . . . . . . . . 50.10 554.1.2 Social protection . . . . . . . . . . . . . . . . . . . . . . . . . . . . . . . . . . . . . . . . . . . . . .68.94 294.1.3 Brain retention . . . . . . . . . . . . . . . . . . . . . . . . . . . . . . . . . . . . . . . . . . . . . . . .68.55 244.2 Lifestyle . . . . . . . . . . . . . . . . . . . . . . . . . . . . . . . . . . . . . . . . . . . . . . . . . . . . 55.76 644.2.1 Environmental performance . . . . . . . . . . . . . . . . . . . . . . . . . . . . . . . . . .50.08 744.2.2 Personal safety . . . . . . . . . . . . . . . . . . . . . . . . . . . . . . . . . . . . . . . . . . . . . . . . 32.10 1044.2.3 Physician density . . . . . . . . . . . . . . . . . . . . . . . . . . . . . . . . . . . . . . . . . . . . . .40.88 464.2.4 Sanitation . . . . . . . . . . . . . . . . . . . . . . . . . . . . . . . . . . . . . . . . . . . . . . . . . . . 100.00 1
5 VOCATIONAL AND TECHNICAL SKILLS . . . . . . . . . . . . .57.08 325.1 Mid-Level Skills . . . . . . . . . . . . . . . . . . . . . . . . . . . . . . . . . . . . . . . . . . . . . 54.28 375.1.1 Workforce with secondary education . . . . . . . . . . . . . . . . . . . . . . . . .44.53 675.1.2 Population with secondary education . . . . . . . . . . . . . . . . . . . . . . . .38.62 635.1.3 Technicians and associate professionals . . . . . . . . . . . . . . . . . . . . . . .52.94 395.1.4 Labour productivity per employee . . . . . . . . . . . . . . . . . . . . . . . . . . . . 81.05 65.2 Employability . . . . . . . . . . . . . . . . . . . . . . . . . . . . . . . . . . . . . . . . . . . . . . . 59.87 405.2.1 Ease of finding skilled employees . . . . . . . . . . . . . . . . . . . . . . . . . . . . .66.33 425.2.2 Relevance of education system to the economy . . . . . . . . . . . . . .62.09 335.2.3 Skills matching with secondary education . . . . . . . . . . . . . . . . . . . . 47.80 515.2.4 Skills matching with tertiary education . . . . . . . . . . . . . . . . . . . . . . . .63.26 41
6 GLOBAL KNOWLEDGE SKILLS . . . . . . . . . . . . . . . . . . . . .33.97 496.1 High-Level Skills . . . . . . . . . . . . . . . . . . . . . . . . . . . . . . . . . . . . . . . . . . . . 50.16 276.1.1 Workforce with tertiary education . . . . . . . . . . . . . . . . . . . . . . . . . . . .40.60 456.1.2 Population with tertiary education . . . . . . . . . . . . . . . . . . . . . . . . . . . .32.69 486.1.3 Professionals . . . . . . . . . . . . . . . . . . . . . . . . . . . . . . . . . . . . . . . . . . . . . . . . . . . 6.29 1176.1.4 Researchers . . . . . . . . . . . . . . . . . . . . . . . . . . . . . . . . . . . . . . . . . . . . . . . . . . . . .n/a n/a6.1.5 Senior officials and managers . . . . . . . . . . . . . . . . . . . . . . . . . . . . . . . 100.00 16.1.6 Availability of scientists and engineers . . . . . . . . . . . . . . . . . . . . . . . .71.23 226.2 Talent Impact . . . . . . . . . . . . . . . . . . . . . . . . . . . . . . . . . . . . . . . . . . . . . . . 17.77 786.2.1 Innovation output . . . . . . . . . . . . . . . . . . . . . . . . . . . . . . . . . . . . . . . . . . . .22.94 836.2.2 High-value exports . . . . . . . . . . . . . . . . . . . . . . . . . . . . . . . . . . . . . . . . . . . . . 8.40 896.2.3 New product entrepreneurial activity . . . . . . . . . . . . . . . . . . . . . . . . .44.20 496.2.4 New business density . . . . . . . . . . . . . . . . . . . . . . . . . . . . . . . . . . . . . . . . . . 2.07 876.2.5 Scientific journal articles . . . . . . . . . . . . . . . . . . . . . . . . . . . . . . . . . . . . . . 11.24 51
l Saudi Arabia l Income group average

GTCI 2020 Country Profile by Pillar
232 THE GLOBAL TALENT COMPETITIVENESS INDEX 2020
COUNTRY PROFILESCOUNTRY PROFILES
102030405060708090100
Global knowledge skills
Vocational andtechnical skills
Retain
Grow
Attract
Enable
10203004
SENEGALKey Indicators
Rank (out of 132) . . . . . . . . . . . . . . . . . . . . . . . . . . . . . . . . . . . .104Income group . . . . . . . . . . . . . . . . . . . . . . . . . . . Lower-middle incomeRegional group . . . . . . . . . . . . . . . . . . . . . . . . . . . . Sub-Saharan AfricaPopulation (millions) . . . . . . . . . . . . . . . . . . . . . . . . . . . . . . . . . . . . 15.85
GDP per capita (PPP US$) . . . . . . . . . . . . . . . . . . . . . . . . . . . . . 3,775.87GDP (US$ billions) . . . . . . . . . . . . . . . . . . . . . . . . . . . . . . . . . . . . . . 24.13GTCI score . . . . . . . . . . . . . . . . . . . . . . . . . . . . . . . . . . . . . . . . . . . . . . 31.60GTCI score (income group average) . . . . . . . . . . . . . . . . . . . . . . . . 32.97
Score Rank
1 ENABLE . . . . . . . . . . . . . . . . . . . . . . . . . . . . . . . . . . . . . . . . . . .41.08 921.1 Regulatory Landscape . . . . . . . . . . . . . . . . . . . . . . . . . . . . . . . . . . . . . . 47.67 721.1.1 Government effectiveness . . . . . . . . . . . . . . . . . . . . . . . . . . . . . . . . . . . .38.79 901.1.2 Rule of law . . . . . . . . . . . . . . . . . . . . . . . . . . . . . . . . . . . . . . . . . . . . . . . . . . . . 49.19 691.1.3 Political stability . . . . . . . . . . . . . . . . . . . . . . . . . . . . . . . . . . . . . . . . . . . . . . .64.03 691.1.4 Regulatory quality. . . . . . . . . . . . . . . . . . . . . . . . . . . . . . . . . . . . . . . . . . . . .44.47 791.1.5 Corruption . . . . . . . . . . . . . . . . . . . . . . . . . . . . . . . . . . . . . . . . . . . . . . . . . . . . 41.89 551.2 Market Landscape . . . . . . . . . . . . . . . . . . . . . . . . . . . . . . . . . . . . . . . . . . 37.00 1021.2.1 Competition intensity . . . . . . . . . . . . . . . . . . . . . . . . . . . . . . . . . . . . . . . . . 67.81 671.2.2 Ease of doing business . . . . . . . . . . . . . . . . . . . . . . . . . . . . . . . . . . . . . . . .42.05 1131.2.3 Cluster development . . . . . . . . . . . . . . . . . . . . . . . . . . . . . . . . . . . . . . . . . .32.64 941.2.4 R&D expenditure . . . . . . . . . . . . . . . . . . . . . . . . . . . . . . . . . . . . . . . . . . . . . . 16.16 471.2.5 ICT infrastructure. . . . . . . . . . . . . . . . . . . . . . . . . . . . . . . . . . . . . . . . . . . . . .24.05 1091.2.6 Urban population . . . . . . . . . . . . . . . . . . . . . . . . . . . . . . . . . . . . . . . . . . . . .39.28 1001.3 Business and Labour Landscape . . . . . . . . . . . . . . . . . . . . . . . . . . . . 38.58 90
Labour Market1.3.1 Tertiary-educated unemployment . . . . . . . . . . . . . . . . . . . . . . . . . . . . 41.12 1161.3.2 Active labour market policies . . . . . . . . . . . . . . . . . . . . . . . . . . . . . . . . .22.63 1071.3.3 Labour-employer cooperation . . . . . . . . . . . . . . . . . . . . . . . . . . . . . . . .33.39 85
Management Practice1.3.4 Professional management . . . . . . . . . . . . . . . . . . . . . . . . . . . . . . . . . . . .33.20 1011.3.5 Relationship of pay to productivity . . . . . . . . . . . . . . . . . . . . . . . . . . . .33.46 109
Technology Adoption1.3.6 Technology utilisation. . . . . . . . . . . . . . . . . . . . . . . . . . . . . . . . . . . . . . . . .65.02 431.3.7 Investment in emerging technologies . . . . . . . . . . . . . . . . . . . . . . . . 41.21 581.3.8 Robot density . . . . . . . . . . . . . . . . . . . . . . . . . . . . . . . . . . . . . . . . . . . . . . . . . . .n/a n/a
2 ATTRACT . . . . . . . . . . . . . . . . . . . . . . . . . . . . . . . . . . . . . . . . . .47.94 702.1 External Openness . . . . . . . . . . . . . . . . . . . . . . . . . . . . . . . . . . . . . . . . . 45.24 57
Attract Business2.1.1 FDI and technology transfer . . . . . . . . . . . . . . . . . . . . . . . . . . . . . . . . . .55.23 712.1.2 Prevalence of foreign ownership . . . . . . . . . . . . . . . . . . . . . . . . . . . . . .66.63 47
Attract People2.1.3 Migrant stock . . . . . . . . . . . . . . . . . . . . . . . . . . . . . . . . . . . . . . . . . . . . . . . . .28.26 872.1.4 International students . . . . . . . . . . . . . . . . . . . . . . . . . . . . . . . . . . . . . . . . .30.50 222.1.5 Brain gain . . . . . . . . . . . . . . . . . . . . . . . . . . . . . . . . . . . . . . . . . . . . . . . . . . . . . 45.59 612.2 Internal Openness . . . . . . . . . . . . . . . . . . . . . . . . . . . . . . . . . . . . . . . . . . 50.63 95
Social Inclusion2.2.1 Tolerance of minorities . . . . . . . . . . . . . . . . . . . . . . . . . . . . . . . . . . . . . . . .46.67 632.2.2 Tolerance of immigrants . . . . . . . . . . . . . . . . . . . . . . . . . . . . . . . . . . . . . .75.34 302.2.3 Social mobility . . . . . . . . . . . . . . . . . . . . . . . . . . . . . . . . . . . . . . . . . . . . . . . . 57.51 63
Gender Equality2.2.4 Female graduates . . . . . . . . . . . . . . . . . . . . . . . . . . . . . . . . . . . . . . . . . . . . . 21.99 1082.2.5 Gender development gap . . . . . . . . . . . . . . . . . . . . . . . . . . . . . . . . . . . . 57.30 1072.2.6 Leadership opportunities for women . . . . . . . . . . . . . . . . . . . . . . . . .45.00 67
Score Rank
3 GROW . . . . . . . . . . . . . . . . . . . . . . . . . . . . . . . . . . . . . . . . . . . . .31.79 903.1 Formal Education . . . . . . . . . . . . . . . . . . . . . . . . . . . . . . . . . . . . . . . . . . . 14.47 93
Enrolment3.1.1 Vocational enrolment . . . . . . . . . . . . . . . . . . . . . . . . . . . . . . . . . . . . . . . . . . 4.78 973.1.2 Tertiary enrolment . . . . . . . . . . . . . . . . . . . . . . . . . . . . . . . . . . . . . . . . . . . . . 8.32 104
Quality3.1.3 Tertiary education expenditure . . . . . . . . . . . . . . . . . . . . . . . . . . . . . . .44.79 103.1.4 Reading, maths, and science . . . . . . . . . . . . . . . . . . . . . . . . . . . . . . . . . . . .n/a n/a3.1.5 University ranking . . . . . . . . . . . . . . . . . . . . . . . . . . . . . . . . . . . . . . . . . . . . . . 0.00 753.2 Lifelong Learning . . . . . . . . . . . . . . . . . . . . . . . . . . . . . . . . . . . . . . . . . . . 36.13 903.2.1 Quality of management schools . . . . . . . . . . . . . . . . . . . . . . . . . . . . . . 61.30 373.2.2 Prevalence of training in firms . . . . . . . . . . . . . . . . . . . . . . . . . . . . . . . . . 18.47 853.2.3 Employee development . . . . . . . . . . . . . . . . . . . . . . . . . . . . . . . . . . . . . .28.61 993.3 Access to Growth Opportunities . . . . . . . . . . . . . . . . . . . . . . . . . . . 44.77 79
Empowerment3.3.1 Delegation of authority . . . . . . . . . . . . . . . . . . . . . . . . . . . . . . . . . . . . . . .25.95 1163.3.2 Personal rights . . . . . . . . . . . . . . . . . . . . . . . . . . . . . . . . . . . . . . . . . . . . . . . . 79.76 55
Collaboration3.3.3 Use of virtual social networks . . . . . . . . . . . . . . . . . . . . . . . . . . . . . . . . . 74.73 623.3.4 Use of virtual professional networks . . . . . . . . . . . . . . . . . . . . . . . . . . . 2.86 943.3.5 Collaboration within organisations . . . . . . . . . . . . . . . . . . . . . . . . . . . .52.06 503.3.6 Collaboration across organisations . . . . . . . . . . . . . . . . . . . . . . . . . . . .33.24 83
4 RETAIN . . . . . . . . . . . . . . . . . . . . . . . . . . . . . . . . . . . . . . . . . . . 28.62 1094.1 Sustainability . . . . . . . . . . . . . . . . . . . . . . . . . . . . . . . . . . . . . . . . . . . . . . . 21.26 1164.1.1 Pension system . . . . . . . . . . . . . . . . . . . . . . . . . . . . . . . . . . . . . . . . . . . . . . . . 2.76 1134.1.2 Social protection . . . . . . . . . . . . . . . . . . . . . . . . . . . . . . . . . . . . . . . . . . . . . . 27.29 1054.1.3 Brain retention . . . . . . . . . . . . . . . . . . . . . . . . . . . . . . . . . . . . . . . . . . . . . . . .33.73 854.2 Lifestyle . . . . . . . . . . . . . . . . . . . . . . . . . . . . . . . . . . . . . . . . . . . . . . . . . . . . 35.98 994.2.1 Environmental performance . . . . . . . . . . . . . . . . . . . . . . . . . . . . . . . . . .36.82 1004.2.2 Personal safety . . . . . . . . . . . . . . . . . . . . . . . . . . . . . . . . . . . . . . . . . . . . . . . . 61.90 494.2.3 Physician density . . . . . . . . . . . . . . . . . . . . . . . . . . . . . . . . . . . . . . . . . . . . . . . 0.79 1204.2.4 Sanitation . . . . . . . . . . . . . . . . . . . . . . . . . . . . . . . . . . . . . . . . . . . . . . . . . . . . .44.42 108
5 VOCATIONAL AND TECHNICAL SKILLS . . . . . . . . . . . . .29.97 1075.1 Mid-Level Skills . . . . . . . . . . . . . . . . . . . . . . . . . . . . . . . . . . . . . . . . . . . . . . 7.07 1245.1.1 Workforce with secondary education . . . . . . . . . . . . . . . . . . . . . . . . . . 7.25 1185.1.2 Population with secondary education . . . . . . . . . . . . . . . . . . . . . . . . . 8.42 1065.1.3 Technicians and associate professionals . . . . . . . . . . . . . . . . . . . . . . . . 5.56 1195.1.4 Labour productivity per employee . . . . . . . . . . . . . . . . . . . . . . . . . . . . . 7.03 915.2 Employability . . . . . . . . . . . . . . . . . . . . . . . . . . . . . . . . . . . . . . . . . . . . . . . 52.87 545.2.1 Ease of finding skilled employees . . . . . . . . . . . . . . . . . . . . . . . . . . . . .68.98 355.2.2 Relevance of education system to the economy . . . . . . . . . . . . . .44.33 665.2.3 Skills matching with secondary education . . . . . . . . . . . . . . . . . . . . 41.91 705.2.4 Skills matching with tertiary education . . . . . . . . . . . . . . . . . . . . . . . .56.28 61
6 GLOBAL KNOWLEDGE SKILLS . . . . . . . . . . . . . . . . . . . . .10.21 1196.1 High-Level Skills . . . . . . . . . . . . . . . . . . . . . . . . . . . . . . . . . . . . . . . . . . . . 12.37 1176.1.1 Workforce with tertiary education . . . . . . . . . . . . . . . . . . . . . . . . . . . . . 7.63 1116.1.2 Population with tertiary education . . . . . . . . . . . . . . . . . . . . . . . . . . . . . 4.83 986.1.3 Professionals . . . . . . . . . . . . . . . . . . . . . . . . . . . . . . . . . . . . . . . . . . . . . . . . . . . 9.83 1106.1.4 Researchers . . . . . . . . . . . . . . . . . . . . . . . . . . . . . . . . . . . . . . . . . . . . . . . . . . . . 6.54 656.1.5 Senior officials and managers . . . . . . . . . . . . . . . . . . . . . . . . . . . . . . . . . . 3.45 1186.1.6 Availability of scientists and engineers . . . . . . . . . . . . . . . . . . . . . . . . 41.94 846.2 Talent Impact . . . . . . . . . . . . . . . . . . . . . . . . . . . . . . . . . . . . . . . . . . . . . . . . 8.06 1126.2.1 Innovation output . . . . . . . . . . . . . . . . . . . . . . . . . . . . . . . . . . . . . . . . . . . .23.99 796.2.2 High-value exports . . . . . . . . . . . . . . . . . . . . . . . . . . . . . . . . . . . . . . . . . . . . . 3.27 1096.2.3 New product entrepreneurial activity . . . . . . . . . . . . . . . . . . . . . . . . . 10.17 856.2.4 New business density . . . . . . . . . . . . . . . . . . . . . . . . . . . . . . . . . . . . . . . . . . 1.96 896.2.5 Scientific journal articles . . . . . . . . . . . . . . . . . . . . . . . . . . . . . . . . . . . . . . . 0.89 96
l Senegal l Income group average

GTCI 2020 Country Profile by Pillar
THE GLOBAL TALENT COMPETITIVENESS INDEX 2020 233
COUNTRY PROFILESCOUNTRY PROFILES
102030405060708090100
Global knowledge skills
Vocational andtechnical skills
Retain
Grow
Attract
Enable
1020304040
SERBIAKey Indicators
Rank (out of 132) . . . . . . . . . . . . . . . . . . . . . . . . . . . . . . . . . . . . . . . 58Income group . . . . . . . . . . . . . . . . . . . . . . . . . . . Upper-middle incomeRegional group . . . . . . . . . . . . . . . . . . . . . . . . . . . . . . . . . . . . . . . . .EuropePopulation (millions) . . . . . . . . . . . . . . . . . . . . . . . . . . . . . . . . . . . . . 6.98
GDP per capita (PPP US$) . . . . . . . . . . . . . . . . . . . . . . . . . . . . 16,433.38GDP (US$ billions) . . . . . . . . . . . . . . . . . . . . . . . . . . . . . . . . . . . . . . 50.51GTCI score . . . . . . . . . . . . . . . . . . . . . . . . . . . . . . . . . . . . . . . . . . . . . . 43.80GTCI score (income group average) . . . . . . . . . . . . . . . . . . . . . . . . 41.25
Score Rank
1 ENABLE . . . . . . . . . . . . . . . . . . . . . . . . . . . . . . . . . . . . . . . . . . 46.05 781.1 Regulatory Landscape . . . . . . . . . . . . . . . . . . . . . . . . . . . . . . . . . . . . . . 49.74 621.1.1 Government effectiveness . . . . . . . . . . . . . . . . . . . . . . . . . . . . . . . . . . . . 51.18 591.1.2 Rule of law . . . . . . . . . . . . . . . . . . . . . . . . . . . . . . . . . . . . . . . . . . . . . . . . . . . . 48.17 731.1.3 Political stability . . . . . . . . . . . . . . . . . . . . . . . . . . . . . . . . . . . . . . . . . . . . . . . 67.26 621.1.4 Regulatory quality. . . . . . . . . . . . . . . . . . . . . . . . . . . . . . . . . . . . . . . . . . . . .48.31 691.1.5 Corruption . . . . . . . . . . . . . . . . . . . . . . . . . . . . . . . . . . . . . . . . . . . . . . . . . . . .33.78 711.2 Market Landscape . . . . . . . . . . . . . . . . . . . . . . . . . . . . . . . . . . . . . . . . . . 52.48 631.2.1 Competition intensity . . . . . . . . . . . . . . . . . . . . . . . . . . . . . . . . . . . . . . . . . 61.30 831.2.2 Ease of doing business . . . . . . . . . . . . . . . . . . . . . . . . . . . . . . . . . . . . . . . .76.60 441.2.3 Cluster development . . . . . . . . . . . . . . . . . . . . . . . . . . . . . . . . . . . . . . . . . . 37.14 811.2.4 R&D expenditure . . . . . . . . . . . . . . . . . . . . . . . . . . . . . . . . . . . . . . . . . . . . . .20.07 381.2.5 ICT infrastructure. . . . . . . . . . . . . . . . . . . . . . . . . . . . . . . . . . . . . . . . . . . . . .70.23 461.2.6 Urban population . . . . . . . . . . . . . . . . . . . . . . . . . . . . . . . . . . . . . . . . . . . . . 49.51 841.3 Business and Labour Landscape . . . . . . . . . . . . . . . . . . . . . . . . . . . . 35.92 102
Labour Market1.3.1 Tertiary-educated unemployment . . . . . . . . . . . . . . . . . . . . . . . . . . . .64.32 961.3.2 Active labour market policies . . . . . . . . . . . . . . . . . . . . . . . . . . . . . . . . . 41.37 661.3.3 Labour-employer cooperation . . . . . . . . . . . . . . . . . . . . . . . . . . . . . . . .28.21 95
Management Practice1.3.4 Professional management . . . . . . . . . . . . . . . . . . . . . . . . . . . . . . . . . . . . 28.11 1181.3.5 Relationship of pay to productivity . . . . . . . . . . . . . . . . . . . . . . . . . . . .53.28 57
Technology Adoption1.3.6 Technology utilisation. . . . . . . . . . . . . . . . . . . . . . . . . . . . . . . . . . . . . . . . . 39.74 981.3.7 Investment in emerging technologies . . . . . . . . . . . . . . . . . . . . . . . . 31.34 921.3.8 Robot density . . . . . . . . . . . . . . . . . . . . . . . . . . . . . . . . . . . . . . . . . . . . . . . . . . 0.99 52
2 ATTRACT . . . . . . . . . . . . . . . . . . . . . . . . . . . . . . . . . . . . . . . . . .47.26 742.1 External Openness . . . . . . . . . . . . . . . . . . . . . . . . . . . . . . . . . . . . . . . . . 40.59 76
Attract Business2.1.1 FDI and technology transfer . . . . . . . . . . . . . . . . . . . . . . . . . . . . . . . . . .50.95 852.1.2 Prevalence of foreign ownership . . . . . . . . . . . . . . . . . . . . . . . . . . . . . .59.44 62
Attract People2.1.3 Migrant stock . . . . . . . . . . . . . . . . . . . . . . . . . . . . . . . . . . . . . . . . . . . . . . . . .56.65 392.1.4 International students . . . . . . . . . . . . . . . . . . . . . . . . . . . . . . . . . . . . . . . . .16.20 432.1.5 Brain gain . . . . . . . . . . . . . . . . . . . . . . . . . . . . . . . . . . . . . . . . . . . . . . . . . . . . . 19.70 1192.2 Internal Openness . . . . . . . . . . . . . . . . . . . . . . . . . . . . . . . . . . . . . . . . . . 53.92 80
Social Inclusion2.2.1 Tolerance of minorities . . . . . . . . . . . . . . . . . . . . . . . . . . . . . . . . . . . . . . . .25.56 992.2.2 Tolerance of immigrants . . . . . . . . . . . . . . . . . . . . . . . . . . . . . . . . . . . . . .58.90 652.2.3 Social mobility . . . . . . . . . . . . . . . . . . . . . . . . . . . . . . . . . . . . . . . . . . . . . . . .40.77 118
Gender Equality2.2.4 Female graduates . . . . . . . . . . . . . . . . . . . . . . . . . . . . . . . . . . . . . . . . . . . . . 76.41 512.2.5 Gender development gap . . . . . . . . . . . . . . . . . . . . . . . . . . . . . . . . . . . .80.44 512.2.6 Leadership opportunities for women . . . . . . . . . . . . . . . . . . . . . . . . . 41.46 78
Score Rank
3 GROW . . . . . . . . . . . . . . . . . . . . . . . . . . . . . . . . . . . . . . . . . . . . 40.39 573.1 Formal Education . . . . . . . . . . . . . . . . . . . . . . . . . . . . . . . . . . . . . . . . . . . 35.86 41
Enrolment3.1.1 Vocational enrolment . . . . . . . . . . . . . . . . . . . . . . . . . . . . . . . . . . . . . . . . .53.83 133.1.2 Tertiary enrolment . . . . . . . . . . . . . . . . . . . . . . . . . . . . . . . . . . . . . . . . . . . .52.32 34
Quality3.1.3 Tertiary education expenditure . . . . . . . . . . . . . . . . . . . . . . . . . . . . . . .25.59 483.1.4 Reading, maths, and science . . . . . . . . . . . . . . . . . . . . . . . . . . . . . . . . . . . .n/a n/a3.1.5 University ranking . . . . . . . . . . . . . . . . . . . . . . . . . . . . . . . . . . . . . . . . . . . . . 11.71 663.2 Lifelong Learning . . . . . . . . . . . . . . . . . . . . . . . . . . . . . . . . . . . . . . . . . . . 40.92 733.2.1 Quality of management schools . . . . . . . . . . . . . . . . . . . . . . . . . . . . . . 45.79 703.2.2 Prevalence of training in firms . . . . . . . . . . . . . . . . . . . . . . . . . . . . . . . . .45.38 343.2.3 Employee development . . . . . . . . . . . . . . . . . . . . . . . . . . . . . . . . . . . . . . 31.60 883.3 Access to Growth Opportunities . . . . . . . . . . . . . . . . . . . . . . . . . . .44.38 81
Empowerment3.3.1 Delegation of authority . . . . . . . . . . . . . . . . . . . . . . . . . . . . . . . . . . . . . . . 37.32 913.3.2 Personal rights . . . . . . . . . . . . . . . . . . . . . . . . . . . . . . . . . . . . . . . . . . . . . . . .66.72 81
Collaboration3.3.3 Use of virtual social networks . . . . . . . . . . . . . . . . . . . . . . . . . . . . . . . . .73.51 673.3.4 Use of virtual professional networks . . . . . . . . . . . . . . . . . . . . . . . . . . . 8.14 683.3.5 Collaboration within organisations . . . . . . . . . . . . . . . . . . . . . . . . . . . .45.29 733.3.6 Collaboration across organisations . . . . . . . . . . . . . . . . . . . . . . . . . . . . 35.31 77
4 RETAIN . . . . . . . . . . . . . . . . . . . . . . . . . . . . . . . . . . . . . . . . . . . . 47.73 654.1 Sustainability . . . . . . . . . . . . . . . . . . . . . . . . . . . . . . . . . . . . . . . . . . . . . . . 35.05 844.1.1 Pension system . . . . . . . . . . . . . . . . . . . . . . . . . . . . . . . . . . . . . . . . . . . . . . . 61.10 454.1.2 Social protection . . . . . . . . . . . . . . . . . . . . . . . . . . . . . . . . . . . . . . . . . . . . . .30.47 964.1.3 Brain retention . . . . . . . . . . . . . . . . . . . . . . . . . . . . . . . . . . . . . . . . . . . . . . . . 13.57 1254.2 Lifestyle . . . . . . . . . . . . . . . . . . . . . . . . . . . . . . . . . . . . . . . . . . . . . . . . . . . . 60.42 524.2.1 Environmental performance . . . . . . . . . . . . . . . . . . . . . . . . . . . . . . . . . . 50.11 724.2.2 Personal safety . . . . . . . . . . . . . . . . . . . . . . . . . . . . . . . . . . . . . . . . . . . . . . . . 58.13 594.2.3 Physician density . . . . . . . . . . . . . . . . . . . . . . . . . . . . . . . . . . . . . . . . . . . . . . 39.19 504.2.4 Sanitation . . . . . . . . . . . . . . . . . . . . . . . . . . . . . . . . . . . . . . . . . . . . . . . . . . . . .94.23 58
5 VOCATIONAL AND TECHNICAL SKILLS . . . . . . . . . . . . 52.55 425.1 Mid-Level Skills . . . . . . . . . . . . . . . . . . . . . . . . . . . . . . . . . . . . . . . . . . . . . 54.69 355.1.1 Workforce with secondary education . . . . . . . . . . . . . . . . . . . . . . . . . 77.60 165.1.2 Population with secondary education . . . . . . . . . . . . . . . . . . . . . . . . 71.30 215.1.3 Technicians and associate professionals . . . . . . . . . . . . . . . . . . . . . . .50.60 415.1.4 Labour productivity per employee . . . . . . . . . . . . . . . . . . . . . . . . . . . . 19.26 705.2 Employability . . . . . . . . . . . . . . . . . . . . . . . . . . . . . . . . . . . . . . . . . . . . . . . 50.42 615.2.1 Ease of finding skilled employees . . . . . . . . . . . . . . . . . . . . . . . . . . . . .55.06 665.2.2 Relevance of education system to the economy . . . . . . . . . . . . . . 39.42 815.2.3 Skills matching with secondary education . . . . . . . . . . . . . . . . . . . .53.27 425.2.4 Skills matching with tertiary education . . . . . . . . . . . . . . . . . . . . . . . . 53.92 70
6 GLOBAL KNOWLEDGE SKILLS . . . . . . . . . . . . . . . . . . . . 28.83 586.1 High-Level Skills . . . . . . . . . . . . . . . . . . . . . . . . . . . . . . . . . . . . . . . . . . . . 33.43 566.1.1 Workforce with tertiary education . . . . . . . . . . . . . . . . . . . . . . . . . . . .38.38 496.1.2 Population with tertiary education . . . . . . . . . . . . . . . . . . . . . . . . . . . .32.21 506.1.3 Professionals . . . . . . . . . . . . . . . . . . . . . . . . . . . . . . . . . . . . . . . . . . . . . . . . . . 36.10 486.1.4 Researchers . . . . . . . . . . . . . . . . . . . . . . . . . . . . . . . . . . . . . . . . . . . . . . . . . . . 25.11 386.1.5 Senior officials and managers . . . . . . . . . . . . . . . . . . . . . . . . . . . . . . . . . 16.31 776.1.6 Availability of scientists and engineers . . . . . . . . . . . . . . . . . . . . . . . .52.50 586.2 Talent Impact . . . . . . . . . . . . . . . . . . . . . . . . . . . . . . . . . . . . . . . . . . . . . . . 24.23 596.2.1 Innovation output . . . . . . . . . . . . . . . . . . . . . . . . . . . . . . . . . . . . . . . . . . . .35.90 566.2.2 High-value exports . . . . . . . . . . . . . . . . . . . . . . . . . . . . . . . . . . . . . . . . . . . . . .n/a n/a6.2.3 New product entrepreneurial activity . . . . . . . . . . . . . . . . . . . . . . . . . . .n/a n/a6.2.4 New business density . . . . . . . . . . . . . . . . . . . . . . . . . . . . . . . . . . . . . . . . . . 8.44 526.2.5 Scientific journal articles . . . . . . . . . . . . . . . . . . . . . . . . . . . . . . . . . . . . . .28.34 35
l Serbia l Income group average

GTCI 2020 Country Profile by Pillar
234 THE GLOBAL TALENT COMPETITIVENESS INDEX 2020
COUNTRY PROFILESCOUNTRY PROFILES
102030405060708090100
Global knowledge skills
Vocational andtechnical skills
Retain
Grow
Attract
Enable
102030405060607
SINGAPOREKey Indicators
Rank (out of 132) . . . . . . . . . . . . . . . . . . . . . . . . . . . . . . . . . . . . . . . . . . .3Income group . . . . . . . . . . . . . . . . . . . . . . . . . . . . . . . . . . . . High incomeRegional group . . . . . . . Eastern, Southeastern Asia and OceaniaPopulation (millions) . . . . . . . . . . . . . . . . . . . . . . . . . . . . . . . . . . . . . 5.64
GDP per capita (PPP US$) . . . . . . . . . . . . . . . . . . . . . . . . . . .101,352.58GDP (US$ billions) . . . . . . . . . . . . . . . . . . . . . . . . . . . . . . . . . . . . . 364.16GTCI score . . . . . . . . . . . . . . . . . . . . . . . . . . . . . . . . . . . . . . . . . . . . . . 78.48GTCI score (income group average) . . . . . . . . . . . . . . . . . . . . . . . . 61.46
Score Rank
1 ENABLE . . . . . . . . . . . . . . . . . . . . . . . . . . . . . . . . . . . . . . . . . . . 91.17 11.1 Regulatory Landscape . . . . . . . . . . . . . . . . . . . . . . . . . . . . . . . . . . . . . . 98.20 11.1.1 Government effectiveness . . . . . . . . . . . . . . . . . . . . . . . . . . . . . . . . . . 100.00 11.1.2 Rule of law . . . . . . . . . . . . . . . . . . . . . . . . . . . . . . . . . . . . . . . . . . . . . . . . . . . .95.23 81.1.3 Political stability . . . . . . . . . . . . . . . . . . . . . . . . . . . . . . . . . . . . . . . . . . . . . . .99.83 21.1.4 Regulatory quality. . . . . . . . . . . . . . . . . . . . . . . . . . . . . . . . . . . . . . . . . . . 100.00 11.1.5 Corruption . . . . . . . . . . . . . . . . . . . . . . . . . . . . . . . . . . . . . . . . . . . . . . . . . . . .95.95 31.2 Market Landscape . . . . . . . . . . . . . . . . . . . . . . . . . . . . . . . . . . . . . . . . . . 83.46 41.2.1 Competition intensity . . . . . . . . . . . . . . . . . . . . . . . . . . . . . . . . . . . . . . . . .85.28 131.2.2 Ease of doing business . . . . . . . . . . . . . . . . . . . . . . . . . . . . . . . . . . . . . . . . 97.59 21.2.3 Cluster development . . . . . . . . . . . . . . . . . . . . . . . . . . . . . . . . . . . . . . . . . . 81.27 101.2.4 R&D expenditure . . . . . . . . . . . . . . . . . . . . . . . . . . . . . . . . . . . . . . . . . . . . . .48.45 121.2.5 ICT infrastructure. . . . . . . . . . . . . . . . . . . . . . . . . . . . . . . . . . . . . . . . . . . . . . 88.17 111.2.6 Urban population . . . . . . . . . . . . . . . . . . . . . . . . . . . . . . . . . . . . . . . . . . . 100.00 11.3 Business and Labour Landscape . . . . . . . . . . . . . . . . . . . . . . . . . . . . 91.84 1
Labour Market1.3.1 Tertiary-educated unemployment . . . . . . . . . . . . . . . . . . . . . . . . . . . .86.51 441.3.2 Active labour market policies . . . . . . . . . . . . . . . . . . . . . . . . . . . . . . . . .96.73 41.3.3 Labour-employer cooperation . . . . . . . . . . . . . . . . . . . . . . . . . . . . . . . .98.83 2
Management Practice1.3.4 Professional management . . . . . . . . . . . . . . . . . . . . . . . . . . . . . . . . . . . . 97.40 31.3.5 Relationship of pay to productivity . . . . . . . . . . . . . . . . . . . . . . . . . . . . 91.59 3
Technology Adoption1.3.6 Technology utilisation. . . . . . . . . . . . . . . . . . . . . . . . . . . . . . . . . . . . . . . . .85.04 121.3.7 Investment in emerging technologies . . . . . . . . . . . . . . . . . . . . . . . .78.60 131.3.8 Robot density . . . . . . . . . . . . . . . . . . . . . . . . . . . . . . . . . . . . . . . . . . . . . . . 100.00 1
2 ATTRACT . . . . . . . . . . . . . . . . . . . . . . . . . . . . . . . . . . . . . . . . . .88.61 12.1 External Openness . . . . . . . . . . . . . . . . . . . . . . . . . . . . . . . . . . . . . . . . . 94.74 1
Attract Business2.1.1 FDI and technology transfer . . . . . . . . . . . . . . . . . . . . . . . . . . . . . . . . . .95.97 22.1.2 Prevalence of foreign ownership . . . . . . . . . . . . . . . . . . . . . . . . . . . . . .95.97 3
Attract People2.1.3 Migrant stock . . . . . . . . . . . . . . . . . . . . . . . . . . . . . . . . . . . . . . . . . . . . . . . . . 87.30 72.1.4 International students . . . . . . . . . . . . . . . . . . . . . . . . . . . . . . . . . . . . . . . 100.00 12.1.5 Brain gain . . . . . . . . . . . . . . . . . . . . . . . . . . . . . . . . . . . . . . . . . . . . . . . . . . . . .94.47 32.2 Internal Openness . . . . . . . . . . . . . . . . . . . . . . . . . . . . . . . . . . . . . . . . . . 82.48 7
Social Inclusion2.2.1 Tolerance of minorities . . . . . . . . . . . . . . . . . . . . . . . . . . . . . . . . . . . . . . . .88.89 62.2.2 Tolerance of immigrants . . . . . . . . . . . . . . . . . . . . . . . . . . . . . . . . . . . . . . 79.45 252.2.3 Social mobility . . . . . . . . . . . . . . . . . . . . . . . . . . . . . . . . . . . . . . . . . . . . . . . .95.08 3
Gender Equality2.2.4 Female graduates . . . . . . . . . . . . . . . . . . . . . . . . . . . . . . . . . . . . . . . . . . . . .60.59 812.2.5 Gender development gap . . . . . . . . . . . . . . . . . . . . . . . . . . . . . . . . . . . .82.49 452.2.6 Leadership opportunities for women . . . . . . . . . . . . . . . . . . . . . . . . .88.39 6
Score Rank
3 GROW . . . . . . . . . . . . . . . . . . . . . . . . . . . . . . . . . . . . . . . . . . . . 73.22 83.1 Formal Education . . . . . . . . . . . . . . . . . . . . . . . . . . . . . . . . . . . . . . . . . . . 55.43 12
Enrolment3.1.1 Vocational enrolment . . . . . . . . . . . . . . . . . . . . . . . . . . . . . . . . . . . . . . . . . 17.84 613.1.2 Tertiary enrolment . . . . . . . . . . . . . . . . . . . . . . . . . . . . . . . . . . . . . . . . . . . .66.21 12
Quality3.1.3 Tertiary education expenditure . . . . . . . . . . . . . . . . . . . . . . . . . . . . . . .22.63 553.1.4 Reading, maths, and science . . . . . . . . . . . . . . . . . . . . . . . . . . . . . . . . 100.00 13.1.5 University ranking . . . . . . . . . . . . . . . . . . . . . . . . . . . . . . . . . . . . . . . . . . . . .70.49 113.2 Lifelong Learning . . . . . . . . . . . . . . . . . . . . . . . . . . . . . . . . . . . . . . . . . . . 87.35 33.2.1 Quality of management schools . . . . . . . . . . . . . . . . . . . . . . . . . . . . . .90.48 23.2.2 Prevalence of training in firms . . . . . . . . . . . . . . . . . . . . . . . . . . . . . . . . . . .n/a n/a3.2.3 Employee development . . . . . . . . . . . . . . . . . . . . . . . . . . . . . . . . . . . . . .84.23 63.3 Access to Growth Opportunities . . . . . . . . . . . . . . . . . . . . . . . . . . . 76.89 10
Empowerment3.3.1 Delegation of authority . . . . . . . . . . . . . . . . . . . . . . . . . . . . . . . . . . . . . . .79.35 183.3.2 Personal rights . . . . . . . . . . . . . . . . . . . . . . . . . . . . . . . . . . . . . . . . . . . . . . . . 66.13 82
Collaboration3.3.3 Use of virtual social networks . . . . . . . . . . . . . . . . . . . . . . . . . . . . . . . . .95.69 73.3.4 Use of virtual professional networks . . . . . . . . . . . . . . . . . . . . . . . . . .76.35 33.3.5 Collaboration within organisations . . . . . . . . . . . . . . . . . . . . . . . . . . . . 77.59 183.3.6 Collaboration across organisations . . . . . . . . . . . . . . . . . . . . . . . . . . . .66.20 16
4 RETAIN . . . . . . . . . . . . . . . . . . . . . . . . . . . . . . . . . . . . . . . . . . . 72.34 244.1 Sustainability . . . . . . . . . . . . . . . . . . . . . . . . . . . . . . . . . . . . . . . . . . . . . . . 70.29 244.1.1 Pension system . . . . . . . . . . . . . . . . . . . . . . . . . . . . . . . . . . . . . . . . . . . . . . . 61.67 444.1.2 Social protection . . . . . . . . . . . . . . . . . . . . . . . . . . . . . . . . . . . . . . . . . . . . . . 59.91 374.1.3 Brain retention . . . . . . . . . . . . . . . . . . . . . . . . . . . . . . . . . . . . . . . . . . . . . . . .89.29 44.2 Lifestyle . . . . . . . . . . . . . . . . . . . . . . . . . . . . . . . . . . . . . . . . . . . . . . . . . . . . 74.38 284.2.1 Environmental performance . . . . . . . . . . . . . . . . . . . . . . . . . . . . . . . . . . 61.34 444.2.2 Personal safety . . . . . . . . . . . . . . . . . . . . . . . . . . . . . . . . . . . . . . . . . . . . . . 100.00 14.2.3 Physician density . . . . . . . . . . . . . . . . . . . . . . . . . . . . . . . . . . . . . . . . . . . . . . 36.19 554.2.4 Sanitation . . . . . . . . . . . . . . . . . . . . . . . . . . . . . . . . . . . . . . . . . . . . . . . . . . . 100.00 1
5 VOCATIONAL AND TECHNICAL SKILLS . . . . . . . . . . . . .74.34 55.1 Mid-Level Skills . . . . . . . . . . . . . . . . . . . . . . . . . . . . . . . . . . . . . . . . . . . . . 63.58 165.1.1 Workforce with secondary education . . . . . . . . . . . . . . . . . . . . . . . . .36.85 775.1.2 Population with secondary education . . . . . . . . . . . . . . . . . . . . . . . . 37.09 665.1.3 Technicians and associate professionals . . . . . . . . . . . . . . . . . . . . . . .90.75 45.1.4 Labour productivity per employee . . . . . . . . . . . . . . . . . . . . . . . . . . . .89.64 25.2 Employability . . . . . . . . . . . . . . . . . . . . . . . . . . . . . . . . . . . . . . . . . . . . . . . 85.11 45.2.1 Ease of finding skilled employees . . . . . . . . . . . . . . . . . . . . . . . . . . . . . 82.18 105.2.2 Relevance of education system to the economy . . . . . . . . . . . . . . 91.96 35.2.3 Skills matching with secondary education . . . . . . . . . . . . . . . . . . . . 77.93 85.2.4 Skills matching with tertiary education . . . . . . . . . . . . . . . . . . . . . . . .88.37 4
6 GLOBAL KNOWLEDGE SKILLS . . . . . . . . . . . . . . . . . . . . . 71.19 16.1 High-Level Skills . . . . . . . . . . . . . . . . . . . . . . . . . . . . . . . . . . . . . . . . . . . . 77.21 16.1.1 Workforce with tertiary education . . . . . . . . . . . . . . . . . . . . . . . . . . . .82.70 26.1.2 Population with tertiary education . . . . . . . . . . . . . . . . . . . . . . . . . . . .70.28 66.1.3 Professionals . . . . . . . . . . . . . . . . . . . . . . . . . . . . . . . . . . . . . . . . . . . . . . . . . .52.42 196.1.4 Researchers . . . . . . . . . . . . . . . . . . . . . . . . . . . . . . . . . . . . . . . . . . . . . . . . . . . 81.54 56.1.5 Senior officials and managers . . . . . . . . . . . . . . . . . . . . . . . . . . . . . . . . .95.68 36.1.6 Availability of scientists and engineers . . . . . . . . . . . . . . . . . . . . . . . .80.63 106.2 Talent Impact . . . . . . . . . . . . . . . . . . . . . . . . . . . . . . . . . . . . . . . . . . . . . . . 65.17 26.2.1 Innovation output . . . . . . . . . . . . . . . . . . . . . . . . . . . . . . . . . . . . . . . . . . . .66.90 156.2.2 High-value exports . . . . . . . . . . . . . . . . . . . . . . . . . . . . . . . . . . . . . . . . . . 100.00 16.2.3 New product entrepreneurial activity . . . . . . . . . . . . . . . . . . . . . . . . . 37.89 576.2.4 New business density . . . . . . . . . . . . . . . . . . . . . . . . . . . . . . . . . . . . . . . . . 41.51 156.2.5 Scientific journal articles . . . . . . . . . . . . . . . . . . . . . . . . . . . . . . . . . . . . . .79.53 6
l Singapore l Income group average
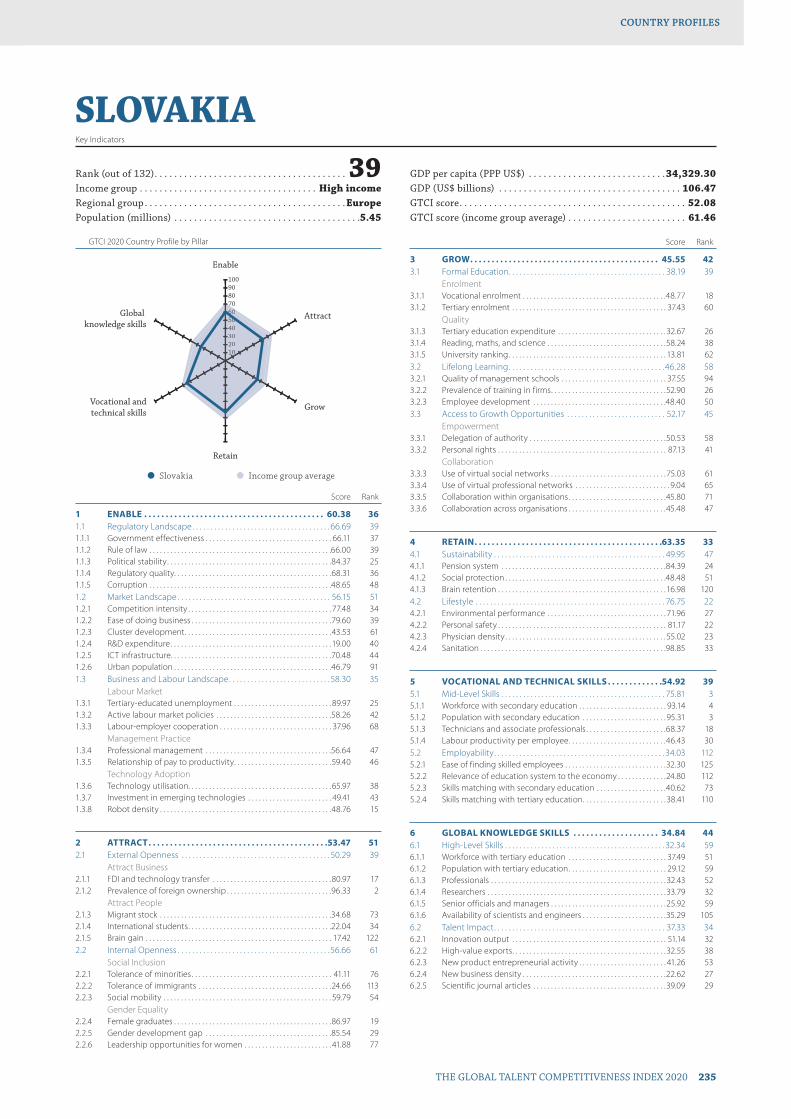
GTCI 2020 Country Profile by Pillar
THE GLOBAL TALENT COMPETITIVENESS INDEX 2020 235
COUNTRY PROFILESCOUNTRY PROFILES
102030405060708090100
Global knowledge skills
Vocational andtechnical skills
Retain
Grow
Attract
Enable
102030405060607
SLOVAKIAKey Indicators
Rank (out of 132) . . . . . . . . . . . . . . . . . . . . . . . . . . . . . . . . . . . . . . . 39Income group . . . . . . . . . . . . . . . . . . . . . . . . . . . . . . . . . . . . High incomeRegional group . . . . . . . . . . . . . . . . . . . . . . . . . . . . . . . . . . . . . . . . .EuropePopulation (millions) . . . . . . . . . . . . . . . . . . . . . . . . . . . . . . . . . . . . . .5.45
GDP per capita (PPP US$) . . . . . . . . . . . . . . . . . . . . . . . . . . . .34,329.30GDP (US$ billions) . . . . . . . . . . . . . . . . . . . . . . . . . . . . . . . . . . . . . 106.47GTCI score . . . . . . . . . . . . . . . . . . . . . . . . . . . . . . . . . . . . . . . . . . . . . . 52.08GTCI score (income group average) . . . . . . . . . . . . . . . . . . . . . . . . 61.46
Score Rank
1 ENABLE . . . . . . . . . . . . . . . . . . . . . . . . . . . . . . . . . . . . . . . . . . 60.38 361.1 Regulatory Landscape . . . . . . . . . . . . . . . . . . . . . . . . . . . . . . . . . . . . . . 66.69 391.1.1 Government effectiveness . . . . . . . . . . . . . . . . . . . . . . . . . . . . . . . . . . . . 66.11 371.1.2 Rule of law . . . . . . . . . . . . . . . . . . . . . . . . . . . . . . . . . . . . . . . . . . . . . . . . . . . .66.00 391.1.3 Political stability . . . . . . . . . . . . . . . . . . . . . . . . . . . . . . . . . . . . . . . . . . . . . . .84.37 251.1.4 Regulatory quality. . . . . . . . . . . . . . . . . . . . . . . . . . . . . . . . . . . . . . . . . . . . .68.31 361.1.5 Corruption . . . . . . . . . . . . . . . . . . . . . . . . . . . . . . . . . . . . . . . . . . . . . . . . . . . .48.65 481.2 Market Landscape . . . . . . . . . . . . . . . . . . . . . . . . . . . . . . . . . . . . . . . . . . 56.15 511.2.1 Competition intensity . . . . . . . . . . . . . . . . . . . . . . . . . . . . . . . . . . . . . . . . . 77.48 341.2.2 Ease of doing business . . . . . . . . . . . . . . . . . . . . . . . . . . . . . . . . . . . . . . . .79.60 391.2.3 Cluster development . . . . . . . . . . . . . . . . . . . . . . . . . . . . . . . . . . . . . . . . . .43.53 611.2.4 R&D expenditure . . . . . . . . . . . . . . . . . . . . . . . . . . . . . . . . . . . . . . . . . . . . . .19.00 401.2.5 ICT infrastructure. . . . . . . . . . . . . . . . . . . . . . . . . . . . . . . . . . . . . . . . . . . . . .70.48 441.2.6 Urban population . . . . . . . . . . . . . . . . . . . . . . . . . . . . . . . . . . . . . . . . . . . . .46.79 911.3 Business and Labour Landscape . . . . . . . . . . . . . . . . . . . . . . . . . . . . 58.30 35
Labour Market1.3.1 Tertiary-educated unemployment . . . . . . . . . . . . . . . . . . . . . . . . . . . . 89.97 251.3.2 Active labour market policies . . . . . . . . . . . . . . . . . . . . . . . . . . . . . . . . .58.26 421.3.3 Labour-employer cooperation . . . . . . . . . . . . . . . . . . . . . . . . . . . . . . . . 37.96 68
Management Practice1.3.4 Professional management . . . . . . . . . . . . . . . . . . . . . . . . . . . . . . . . . . . .56.64 471.3.5 Relationship of pay to productivity . . . . . . . . . . . . . . . . . . . . . . . . . . . .59.40 46
Technology Adoption1.3.6 Technology utilisation. . . . . . . . . . . . . . . . . . . . . . . . . . . . . . . . . . . . . . . . . 65.97 381.3.7 Investment in emerging technologies . . . . . . . . . . . . . . . . . . . . . . . . 49.41 431.3.8 Robot density . . . . . . . . . . . . . . . . . . . . . . . . . . . . . . . . . . . . . . . . . . . . . . . . .48.76 15
2 ATTRACT . . . . . . . . . . . . . . . . . . . . . . . . . . . . . . . . . . . . . . . . . .53.47 512.1 External Openness . . . . . . . . . . . . . . . . . . . . . . . . . . . . . . . . . . . . . . . . . 50.29 39
Attract Business2.1.1 FDI and technology transfer . . . . . . . . . . . . . . . . . . . . . . . . . . . . . . . . . .80.97 172.1.2 Prevalence of foreign ownership . . . . . . . . . . . . . . . . . . . . . . . . . . . . . .96.33 2
Attract People2.1.3 Migrant stock . . . . . . . . . . . . . . . . . . . . . . . . . . . . . . . . . . . . . . . . . . . . . . . . .34.68 732.1.4 International students . . . . . . . . . . . . . . . . . . . . . . . . . . . . . . . . . . . . . . . . .22.04 342.1.5 Brain gain . . . . . . . . . . . . . . . . . . . . . . . . . . . . . . . . . . . . . . . . . . . . . . . . . . . . . 17.42 1222.2 Internal Openness . . . . . . . . . . . . . . . . . . . . . . . . . . . . . . . . . . . . . . . . . . 56.66 61
Social Inclusion2.2.1 Tolerance of minorities . . . . . . . . . . . . . . . . . . . . . . . . . . . . . . . . . . . . . . . . 41.11 762.2.2 Tolerance of immigrants . . . . . . . . . . . . . . . . . . . . . . . . . . . . . . . . . . . . . .24.66 1132.2.3 Social mobility . . . . . . . . . . . . . . . . . . . . . . . . . . . . . . . . . . . . . . . . . . . . . . . . 59.79 54
Gender Equality2.2.4 Female graduates . . . . . . . . . . . . . . . . . . . . . . . . . . . . . . . . . . . . . . . . . . . . .86.97 192.2.5 Gender development gap . . . . . . . . . . . . . . . . . . . . . . . . . . . . . . . . . . . .85.54 292.2.6 Leadership opportunities for women . . . . . . . . . . . . . . . . . . . . . . . . . 41.88 77
Score Rank
3 GROW . . . . . . . . . . . . . . . . . . . . . . . . . . . . . . . . . . . . . . . . . . . . 45.55 423.1 Formal Education . . . . . . . . . . . . . . . . . . . . . . . . . . . . . . . . . . . . . . . . . . . 38.19 39
Enrolment3.1.1 Vocational enrolment . . . . . . . . . . . . . . . . . . . . . . . . . . . . . . . . . . . . . . . . .48.77 183.1.2 Tertiary enrolment . . . . . . . . . . . . . . . . . . . . . . . . . . . . . . . . . . . . . . . . . . . . 37.43 60
Quality3.1.3 Tertiary education expenditure . . . . . . . . . . . . . . . . . . . . . . . . . . . . . . .32.67 263.1.4 Reading, maths, and science . . . . . . . . . . . . . . . . . . . . . . . . . . . . . . . . . .58.24 383.1.5 University ranking . . . . . . . . . . . . . . . . . . . . . . . . . . . . . . . . . . . . . . . . . . . . . 13.81 623.2 Lifelong Learning . . . . . . . . . . . . . . . . . . . . . . . . . . . . . . . . . . . . . . . . . . .46.28 583.2.1 Quality of management schools . . . . . . . . . . . . . . . . . . . . . . . . . . . . . . 37.55 943.2.2 Prevalence of training in firms . . . . . . . . . . . . . . . . . . . . . . . . . . . . . . . . .52.90 263.2.3 Employee development . . . . . . . . . . . . . . . . . . . . . . . . . . . . . . . . . . . . . .48.40 503.3 Access to Growth Opportunities . . . . . . . . . . . . . . . . . . . . . . . . . . . 52.17 45
Empowerment3.3.1 Delegation of authority . . . . . . . . . . . . . . . . . . . . . . . . . . . . . . . . . . . . . . .50.53 583.3.2 Personal rights . . . . . . . . . . . . . . . . . . . . . . . . . . . . . . . . . . . . . . . . . . . . . . . . 87.13 41
Collaboration3.3.3 Use of virtual social networks . . . . . . . . . . . . . . . . . . . . . . . . . . . . . . . . .75.03 613.3.4 Use of virtual professional networks . . . . . . . . . . . . . . . . . . . . . . . . . . . 9.04 653.3.5 Collaboration within organisations . . . . . . . . . . . . . . . . . . . . . . . . . . . .45.80 713.3.6 Collaboration across organisations . . . . . . . . . . . . . . . . . . . . . . . . . . . .45.48 47
4 RETAIN . . . . . . . . . . . . . . . . . . . . . . . . . . . . . . . . . . . . . . . . . . . .63.35 334.1 Sustainability . . . . . . . . . . . . . . . . . . . . . . . . . . . . . . . . . . . . . . . . . . . . . . . 49.95 474.1.1 Pension system . . . . . . . . . . . . . . . . . . . . . . . . . . . . . . . . . . . . . . . . . . . . . . .84.39 244.1.2 Social protection . . . . . . . . . . . . . . . . . . . . . . . . . . . . . . . . . . . . . . . . . . . . . .48.48 514.1.3 Brain retention . . . . . . . . . . . . . . . . . . . . . . . . . . . . . . . . . . . . . . . . . . . . . . . .16.98 1204.2 Lifestyle . . . . . . . . . . . . . . . . . . . . . . . . . . . . . . . . . . . . . . . . . . . . . . . . . . . . 76.75 224.2.1 Environmental performance . . . . . . . . . . . . . . . . . . . . . . . . . . . . . . . . . . 71.96 274.2.2 Personal safety . . . . . . . . . . . . . . . . . . . . . . . . . . . . . . . . . . . . . . . . . . . . . . . . 81.17 224.2.3 Physician density . . . . . . . . . . . . . . . . . . . . . . . . . . . . . . . . . . . . . . . . . . . . . .55.02 234.2.4 Sanitation . . . . . . . . . . . . . . . . . . . . . . . . . . . . . . . . . . . . . . . . . . . . . . . . . . . . .98.85 33
5 VOCATIONAL AND TECHNICAL SKILLS . . . . . . . . . . . . .54.92 395.1 Mid-Level Skills . . . . . . . . . . . . . . . . . . . . . . . . . . . . . . . . . . . . . . . . . . . . . 75.81 35.1.1 Workforce with secondary education . . . . . . . . . . . . . . . . . . . . . . . . . 93.14 45.1.2 Population with secondary education . . . . . . . . . . . . . . . . . . . . . . . .95.31 35.1.3 Technicians and associate professionals . . . . . . . . . . . . . . . . . . . . . . .68.37 185.1.4 Labour productivity per employee . . . . . . . . . . . . . . . . . . . . . . . . . . . .46.43 305.2 Employability . . . . . . . . . . . . . . . . . . . . . . . . . . . . . . . . . . . . . . . . . . . . . . . 34.03 1125.2.1 Ease of finding skilled employees . . . . . . . . . . . . . . . . . . . . . . . . . . . . .32.30 1255.2.2 Relevance of education system to the economy . . . . . . . . . . . . . .24.80 1125.2.3 Skills matching with secondary education . . . . . . . . . . . . . . . . . . . .40.62 735.2.4 Skills matching with tertiary education . . . . . . . . . . . . . . . . . . . . . . . .38.41 110
6 GLOBAL KNOWLEDGE SKILLS . . . . . . . . . . . . . . . . . . . . 34.84 446.1 High-Level Skills . . . . . . . . . . . . . . . . . . . . . . . . . . . . . . . . . . . . . . . . . . . . 32.34 596.1.1 Workforce with tertiary education . . . . . . . . . . . . . . . . . . . . . . . . . . . . 37.49 516.1.2 Population with tertiary education . . . . . . . . . . . . . . . . . . . . . . . . . . . . 29.12 596.1.3 Professionals . . . . . . . . . . . . . . . . . . . . . . . . . . . . . . . . . . . . . . . . . . . . . . . . . . 32.43 526.1.4 Researchers . . . . . . . . . . . . . . . . . . . . . . . . . . . . . . . . . . . . . . . . . . . . . . . . . . .33.79 326.1.5 Senior officials and managers . . . . . . . . . . . . . . . . . . . . . . . . . . . . . . . . .25.92 596.1.6 Availability of scientists and engineers . . . . . . . . . . . . . . . . . . . . . . . .35.29 1056.2 Talent Impact . . . . . . . . . . . . . . . . . . . . . . . . . . . . . . . . . . . . . . . . . . . . . . . 37.33 346.2.1 Innovation output . . . . . . . . . . . . . . . . . . . . . . . . . . . . . . . . . . . . . . . . . . . . 51.14 326.2.2 High-value exports . . . . . . . . . . . . . . . . . . . . . . . . . . . . . . . . . . . . . . . . . . . .32.55 386.2.3 New product entrepreneurial activity . . . . . . . . . . . . . . . . . . . . . . . . . 41.26 536.2.4 New business density . . . . . . . . . . . . . . . . . . . . . . . . . . . . . . . . . . . . . . . . .22.62 276.2.5 Scientific journal articles . . . . . . . . . . . . . . . . . . . . . . . . . . . . . . . . . . . . . .39.09 29
l Slovakia l Income group average
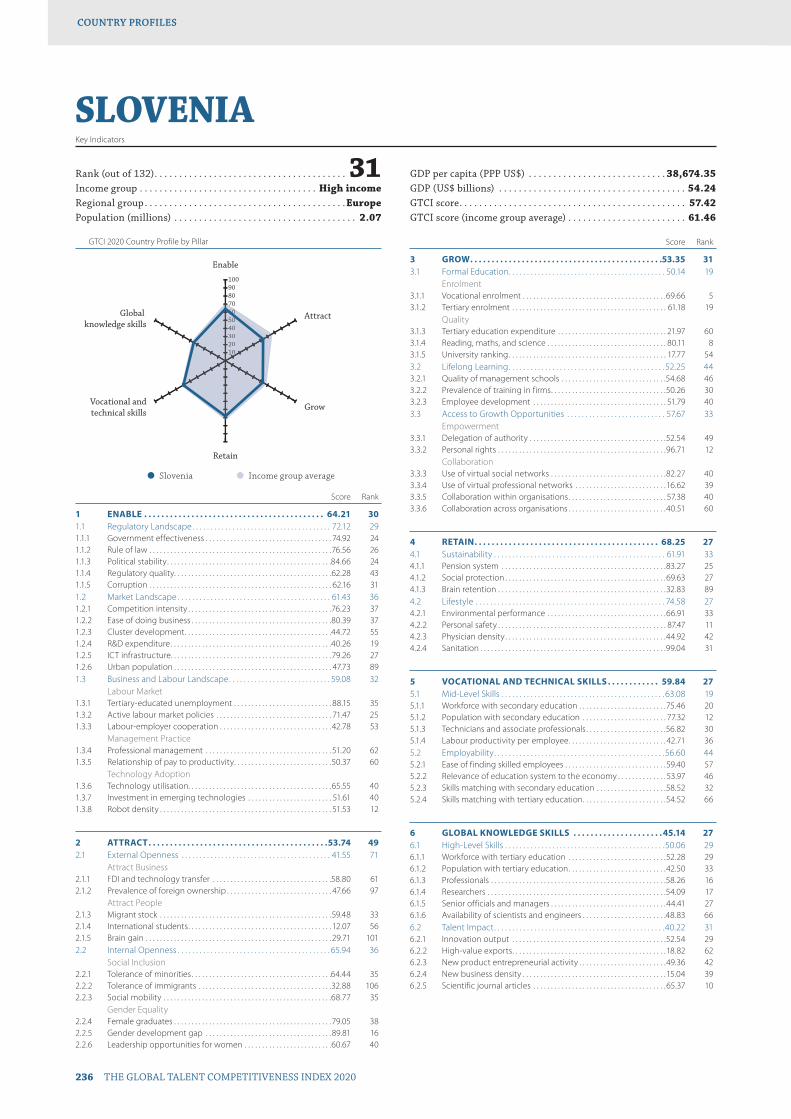
GTCI 2020 Country Profile by Pillar
236 THE GLOBAL TALENT COMPETITIVENESS INDEX 2020
COUNTRY PROFILESCOUNTRY PROFILES
102030405060708090100
Global knowledge skills
Vocational andtechnical skills
Retain
Grow
Attract
Enable
102030405060607
SLOVENIAKey Indicators
Rank (out of 132) . . . . . . . . . . . . . . . . . . . . . . . . . . . . . . . . . . . . . . . 31Income group . . . . . . . . . . . . . . . . . . . . . . . . . . . . . . . . . . . . High incomeRegional group . . . . . . . . . . . . . . . . . . . . . . . . . . . . . . . . . . . . . . . . .EuropePopulation (millions) . . . . . . . . . . . . . . . . . . . . . . . . . . . . . . . . . . . . . 2.07
GDP per capita (PPP US$) . . . . . . . . . . . . . . . . . . . . . . . . . . . . 38,674.35GDP (US$ billions) . . . . . . . . . . . . . . . . . . . . . . . . . . . . . . . . . . . . . . 54.24GTCI score . . . . . . . . . . . . . . . . . . . . . . . . . . . . . . . . . . . . . . . . . . . . . . 57.42GTCI score (income group average) . . . . . . . . . . . . . . . . . . . . . . . . 61.46
Score Rank
1 ENABLE . . . . . . . . . . . . . . . . . . . . . . . . . . . . . . . . . . . . . . . . . . 64.21 301.1 Regulatory Landscape . . . . . . . . . . . . . . . . . . . . . . . . . . . . . . . . . . . . . . 72.12 291.1.1 Government effectiveness . . . . . . . . . . . . . . . . . . . . . . . . . . . . . . . . . . . . 74.92 241.1.2 Rule of law . . . . . . . . . . . . . . . . . . . . . . . . . . . . . . . . . . . . . . . . . . . . . . . . . . . .76.56 261.1.3 Political stability . . . . . . . . . . . . . . . . . . . . . . . . . . . . . . . . . . . . . . . . . . . . . . .84.66 241.1.4 Regulatory quality. . . . . . . . . . . . . . . . . . . . . . . . . . . . . . . . . . . . . . . . . . . . .62.28 431.1.5 Corruption . . . . . . . . . . . . . . . . . . . . . . . . . . . . . . . . . . . . . . . . . . . . . . . . . . . . 62.16 311.2 Market Landscape . . . . . . . . . . . . . . . . . . . . . . . . . . . . . . . . . . . . . . . . . . 61.43 361.2.1 Competition intensity . . . . . . . . . . . . . . . . . . . . . . . . . . . . . . . . . . . . . . . . .76.23 371.2.2 Ease of doing business . . . . . . . . . . . . . . . . . . . . . . . . . . . . . . . . . . . . . . . .80.39 371.2.3 Cluster development . . . . . . . . . . . . . . . . . . . . . . . . . . . . . . . . . . . . . . . . . .44.72 551.2.4 R&D expenditure . . . . . . . . . . . . . . . . . . . . . . . . . . . . . . . . . . . . . . . . . . . . . .40.26 191.2.5 ICT infrastructure. . . . . . . . . . . . . . . . . . . . . . . . . . . . . . . . . . . . . . . . . . . . . .79.26 271.2.6 Urban population . . . . . . . . . . . . . . . . . . . . . . . . . . . . . . . . . . . . . . . . . . . . . 47.73 891.3 Business and Labour Landscape . . . . . . . . . . . . . . . . . . . . . . . . . . . . 59.08 32
Labour Market1.3.1 Tertiary-educated unemployment . . . . . . . . . . . . . . . . . . . . . . . . . . . . 88.15 351.3.2 Active labour market policies . . . . . . . . . . . . . . . . . . . . . . . . . . . . . . . . . 71.47 251.3.3 Labour-employer cooperation . . . . . . . . . . . . . . . . . . . . . . . . . . . . . . . .42.78 53
Management Practice1.3.4 Professional management . . . . . . . . . . . . . . . . . . . . . . . . . . . . . . . . . . . . 51.20 621.3.5 Relationship of pay to productivity . . . . . . . . . . . . . . . . . . . . . . . . . . . .50.37 60
Technology Adoption1.3.6 Technology utilisation. . . . . . . . . . . . . . . . . . . . . . . . . . . . . . . . . . . . . . . . .65.55 401.3.7 Investment in emerging technologies . . . . . . . . . . . . . . . . . . . . . . . . 51.61 401.3.8 Robot density . . . . . . . . . . . . . . . . . . . . . . . . . . . . . . . . . . . . . . . . . . . . . . . . . 51.53 12
2 ATTRACT . . . . . . . . . . . . . . . . . . . . . . . . . . . . . . . . . . . . . . . . . .53.74 492.1 External Openness . . . . . . . . . . . . . . . . . . . . . . . . . . . . . . . . . . . . . . . . . 41.55 71
Attract Business2.1.1 FDI and technology transfer . . . . . . . . . . . . . . . . . . . . . . . . . . . . . . . . . .58.80 612.1.2 Prevalence of foreign ownership . . . . . . . . . . . . . . . . . . . . . . . . . . . . . . 47.66 97
Attract People2.1.3 Migrant stock . . . . . . . . . . . . . . . . . . . . . . . . . . . . . . . . . . . . . . . . . . . . . . . . .59.48 332.1.4 International students . . . . . . . . . . . . . . . . . . . . . . . . . . . . . . . . . . . . . . . . . 12.07 562.1.5 Brain gain . . . . . . . . . . . . . . . . . . . . . . . . . . . . . . . . . . . . . . . . . . . . . . . . . . . . . 29.71 1012.2 Internal Openness . . . . . . . . . . . . . . . . . . . . . . . . . . . . . . . . . . . . . . . . . . 65.94 36
Social Inclusion2.2.1 Tolerance of minorities . . . . . . . . . . . . . . . . . . . . . . . . . . . . . . . . . . . . . . . .64.44 352.2.2 Tolerance of immigrants . . . . . . . . . . . . . . . . . . . . . . . . . . . . . . . . . . . . . .32.88 1062.2.3 Social mobility . . . . . . . . . . . . . . . . . . . . . . . . . . . . . . . . . . . . . . . . . . . . . . . .68.77 35
Gender Equality2.2.4 Female graduates . . . . . . . . . . . . . . . . . . . . . . . . . . . . . . . . . . . . . . . . . . . . .79.05 382.2.5 Gender development gap . . . . . . . . . . . . . . . . . . . . . . . . . . . . . . . . . . . .89.81 162.2.6 Leadership opportunities for women . . . . . . . . . . . . . . . . . . . . . . . . .60.67 40
Score Rank
3 GROW . . . . . . . . . . . . . . . . . . . . . . . . . . . . . . . . . . . . . . . . . . . . .53.35 313.1 Formal Education . . . . . . . . . . . . . . . . . . . . . . . . . . . . . . . . . . . . . . . . . . . 50.14 19
Enrolment3.1.1 Vocational enrolment . . . . . . . . . . . . . . . . . . . . . . . . . . . . . . . . . . . . . . . . .69.66 53.1.2 Tertiary enrolment . . . . . . . . . . . . . . . . . . . . . . . . . . . . . . . . . . . . . . . . . . . . 61.18 19
Quality3.1.3 Tertiary education expenditure . . . . . . . . . . . . . . . . . . . . . . . . . . . . . . . 21.97 603.1.4 Reading, maths, and science . . . . . . . . . . . . . . . . . . . . . . . . . . . . . . . . . . 80.11 83.1.5 University ranking . . . . . . . . . . . . . . . . . . . . . . . . . . . . . . . . . . . . . . . . . . . . . 17.77 543.2 Lifelong Learning . . . . . . . . . . . . . . . . . . . . . . . . . . . . . . . . . . . . . . . . . . . 52.25 443.2.1 Quality of management schools . . . . . . . . . . . . . . . . . . . . . . . . . . . . . .54.68 463.2.2 Prevalence of training in firms . . . . . . . . . . . . . . . . . . . . . . . . . . . . . . . . .50.26 303.2.3 Employee development . . . . . . . . . . . . . . . . . . . . . . . . . . . . . . . . . . . . . . 51.79 403.3 Access to Growth Opportunities . . . . . . . . . . . . . . . . . . . . . . . . . . . 57.67 33
Empowerment3.3.1 Delegation of authority . . . . . . . . . . . . . . . . . . . . . . . . . . . . . . . . . . . . . . .52.54 493.3.2 Personal rights . . . . . . . . . . . . . . . . . . . . . . . . . . . . . . . . . . . . . . . . . . . . . . . .96.71 12
Collaboration3.3.3 Use of virtual social networks . . . . . . . . . . . . . . . . . . . . . . . . . . . . . . . . .82.27 403.3.4 Use of virtual professional networks . . . . . . . . . . . . . . . . . . . . . . . . . .16.62 393.3.5 Collaboration within organisations . . . . . . . . . . . . . . . . . . . . . . . . . . . . 57.38 403.3.6 Collaboration across organisations . . . . . . . . . . . . . . . . . . . . . . . . . . . .40.51 60
4 RETAIN . . . . . . . . . . . . . . . . . . . . . . . . . . . . . . . . . . . . . . . . . . . 68.25 274.1 Sustainability . . . . . . . . . . . . . . . . . . . . . . . . . . . . . . . . . . . . . . . . . . . . . . . 61.91 334.1.1 Pension system . . . . . . . . . . . . . . . . . . . . . . . . . . . . . . . . . . . . . . . . . . . . . . .83.27 254.1.2 Social protection . . . . . . . . . . . . . . . . . . . . . . . . . . . . . . . . . . . . . . . . . . . . . .69.63 274.1.3 Brain retention . . . . . . . . . . . . . . . . . . . . . . . . . . . . . . . . . . . . . . . . . . . . . . . .32.83 894.2 Lifestyle . . . . . . . . . . . . . . . . . . . . . . . . . . . . . . . . . . . . . . . . . . . . . . . . . . . . 74.58 274.2.1 Environmental performance . . . . . . . . . . . . . . . . . . . . . . . . . . . . . . . . . .66.91 334.2.2 Personal safety . . . . . . . . . . . . . . . . . . . . . . . . . . . . . . . . . . . . . . . . . . . . . . . . 87.47 114.2.3 Physician density . . . . . . . . . . . . . . . . . . . . . . . . . . . . . . . . . . . . . . . . . . . . . .44.92 424.2.4 Sanitation . . . . . . . . . . . . . . . . . . . . . . . . . . . . . . . . . . . . . . . . . . . . . . . . . . . . .99.04 31
5 VOCATIONAL AND TECHNICAL SKILLS . . . . . . . . . . . . 59.84 275.1 Mid-Level Skills . . . . . . . . . . . . . . . . . . . . . . . . . . . . . . . . . . . . . . . . . . . . . 63.08 195.1.1 Workforce with secondary education . . . . . . . . . . . . . . . . . . . . . . . . .75.46 205.1.2 Population with secondary education . . . . . . . . . . . . . . . . . . . . . . . . 77.32 125.1.3 Technicians and associate professionals . . . . . . . . . . . . . . . . . . . . . . .56.82 305.1.4 Labour productivity per employee . . . . . . . . . . . . . . . . . . . . . . . . . . . . 42.71 365.2 Employability . . . . . . . . . . . . . . . . . . . . . . . . . . . . . . . . . . . . . . . . . . . . . . . 56.60 445.2.1 Ease of finding skilled employees . . . . . . . . . . . . . . . . . . . . . . . . . . . . .59.40 575.2.2 Relevance of education system to the economy . . . . . . . . . . . . . . 53.97 465.2.3 Skills matching with secondary education . . . . . . . . . . . . . . . . . . . .58.52 325.2.4 Skills matching with tertiary education . . . . . . . . . . . . . . . . . . . . . . . .54.52 66
6 GLOBAL KNOWLEDGE SKILLS . . . . . . . . . . . . . . . . . . . . . 45.14 276.1 High-Level Skills . . . . . . . . . . . . . . . . . . . . . . . . . . . . . . . . . . . . . . . . . . . . 50.06 296.1.1 Workforce with tertiary education . . . . . . . . . . . . . . . . . . . . . . . . . . . .52.28 296.1.2 Population with tertiary education . . . . . . . . . . . . . . . . . . . . . . . . . . . .42.50 336.1.3 Professionals . . . . . . . . . . . . . . . . . . . . . . . . . . . . . . . . . . . . . . . . . . . . . . . . . .58.26 166.1.4 Researchers . . . . . . . . . . . . . . . . . . . . . . . . . . . . . . . . . . . . . . . . . . . . . . . . . . .54.09 176.1.5 Senior officials and managers . . . . . . . . . . . . . . . . . . . . . . . . . . . . . . . . .44.41 276.1.6 Availability of scientists and engineers . . . . . . . . . . . . . . . . . . . . . . . .48.83 666.2 Talent Impact . . . . . . . . . . . . . . . . . . . . . . . . . . . . . . . . . . . . . . . . . . . . . . .40.22 316.2.1 Innovation output . . . . . . . . . . . . . . . . . . . . . . . . . . . . . . . . . . . . . . . . . . . .52.54 296.2.2 High-value exports . . . . . . . . . . . . . . . . . . . . . . . . . . . . . . . . . . . . . . . . . . . .18.82 626.2.3 New product entrepreneurial activity . . . . . . . . . . . . . . . . . . . . . . . . .49.36 426.2.4 New business density . . . . . . . . . . . . . . . . . . . . . . . . . . . . . . . . . . . . . . . . .15.04 396.2.5 Scientific journal articles . . . . . . . . . . . . . . . . . . . . . . . . . . . . . . . . . . . . . .65.37 10
l Slovenia l Income group average
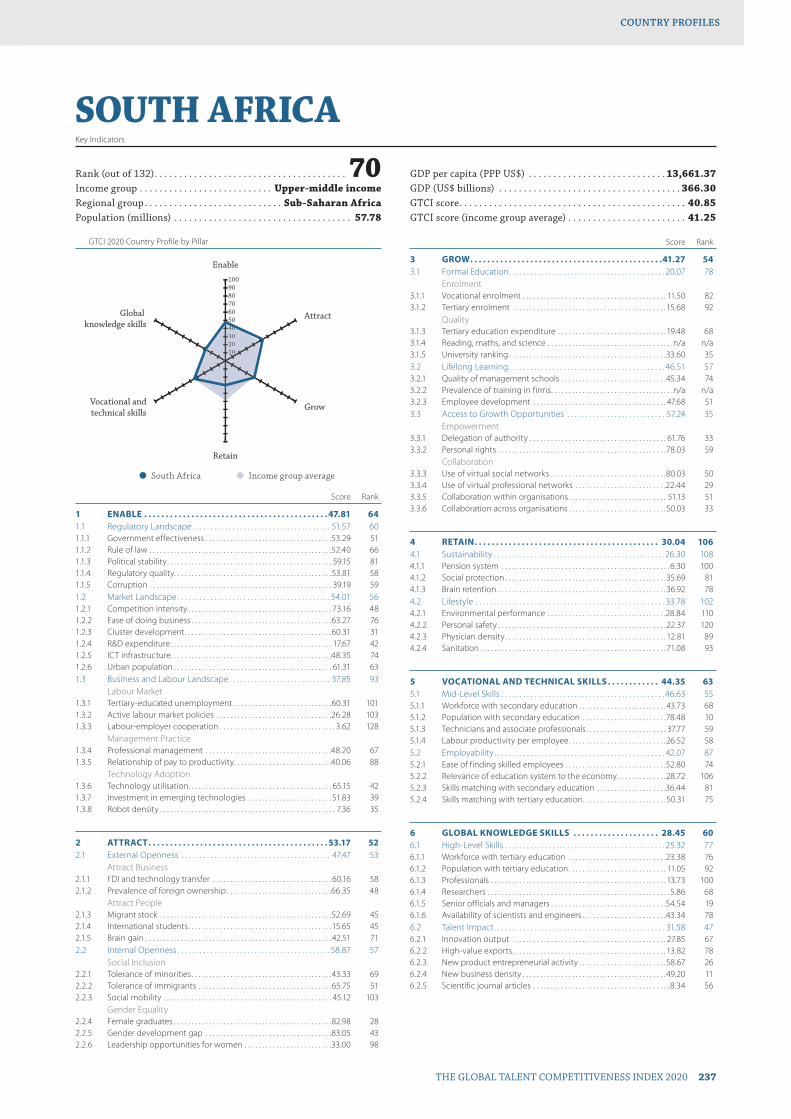
GTCI 2020 Country Profile by Pillar
THE GLOBAL TALENT COMPETITIVENESS INDEX 2020 237
COUNTRY PROFILESCOUNTRY PROFILES
102030405060708090100
Global knowledge skills
Vocational andtechnical skills
Retain
Grow
Attract
Enable
1020304040
SOUTH AFRICAKey Indicators
Rank (out of 132) . . . . . . . . . . . . . . . . . . . . . . . . . . . . . . . . . . . . . . . 70Income group . . . . . . . . . . . . . . . . . . . . . . . . . . . Upper-middle incomeRegional group . . . . . . . . . . . . . . . . . . . . . . . . . . . . Sub-Saharan AfricaPopulation (millions) . . . . . . . . . . . . . . . . . . . . . . . . . . . . . . . . . . . . 57.78
GDP per capita (PPP US$) . . . . . . . . . . . . . . . . . . . . . . . . . . . . 13,661.37GDP (US$ billions) . . . . . . . . . . . . . . . . . . . . . . . . . . . . . . . . . . . . . 366.30GTCI score . . . . . . . . . . . . . . . . . . . . . . . . . . . . . . . . . . . . . . . . . . . . . . 40.85GTCI score (income group average) . . . . . . . . . . . . . . . . . . . . . . . . 41.25
Score Rank
1 ENABLE . . . . . . . . . . . . . . . . . . . . . . . . . . . . . . . . . . . . . . . . . . . 47.81 641.1 Regulatory Landscape . . . . . . . . . . . . . . . . . . . . . . . . . . . . . . . . . . . . . . 51.57 601.1.1 Government effectiveness . . . . . . . . . . . . . . . . . . . . . . . . . . . . . . . . . . . .53.29 511.1.2 Rule of law . . . . . . . . . . . . . . . . . . . . . . . . . . . . . . . . . . . . . . . . . . . . . . . . . . . .52.40 661.1.3 Political stability . . . . . . . . . . . . . . . . . . . . . . . . . . . . . . . . . . . . . . . . . . . . . . . 59.15 811.1.4 Regulatory quality. . . . . . . . . . . . . . . . . . . . . . . . . . . . . . . . . . . . . . . . . . . . .53.81 581.1.5 Corruption . . . . . . . . . . . . . . . . . . . . . . . . . . . . . . . . . . . . . . . . . . . . . . . . . . . . 39.19 591.2 Market Landscape . . . . . . . . . . . . . . . . . . . . . . . . . . . . . . . . . . . . . . . . . . 54.01 561.2.1 Competition intensity . . . . . . . . . . . . . . . . . . . . . . . . . . . . . . . . . . . . . . . . . 73.16 481.2.2 Ease of doing business . . . . . . . . . . . . . . . . . . . . . . . . . . . . . . . . . . . . . . . .63.27 761.2.3 Cluster development . . . . . . . . . . . . . . . . . . . . . . . . . . . . . . . . . . . . . . . . . .60.31 311.2.4 R&D expenditure . . . . . . . . . . . . . . . . . . . . . . . . . . . . . . . . . . . . . . . . . . . . . . 17.67 421.2.5 ICT infrastructure. . . . . . . . . . . . . . . . . . . . . . . . . . . . . . . . . . . . . . . . . . . . . .48.35 741.2.6 Urban population . . . . . . . . . . . . . . . . . . . . . . . . . . . . . . . . . . . . . . . . . . . . . 61.31 631.3 Business and Labour Landscape . . . . . . . . . . . . . . . . . . . . . . . . . . . . 37.85 93
Labour Market1.3.1 Tertiary-educated unemployment . . . . . . . . . . . . . . . . . . . . . . . . . . . .60.31 1011.3.2 Active labour market policies . . . . . . . . . . . . . . . . . . . . . . . . . . . . . . . . .26.28 1031.3.3 Labour-employer cooperation . . . . . . . . . . . . . . . . . . . . . . . . . . . . . . . . . 3.62 128
Management Practice1.3.4 Professional management . . . . . . . . . . . . . . . . . . . . . . . . . . . . . . . . . . . .48.20 671.3.5 Relationship of pay to productivity . . . . . . . . . . . . . . . . . . . . . . . . . . . .40.06 88
Technology Adoption1.3.6 Technology utilisation. . . . . . . . . . . . . . . . . . . . . . . . . . . . . . . . . . . . . . . . . 65.15 421.3.7 Investment in emerging technologies . . . . . . . . . . . . . . . . . . . . . . . . 51.83 391.3.8 Robot density . . . . . . . . . . . . . . . . . . . . . . . . . . . . . . . . . . . . . . . . . . . . . . . . . . 7.36 35
2 ATTRACT . . . . . . . . . . . . . . . . . . . . . . . . . . . . . . . . . . . . . . . . . . 53.17 522.1 External Openness . . . . . . . . . . . . . . . . . . . . . . . . . . . . . . . . . . . . . . . . . 47.47 53
Attract Business2.1.1 FDI and technology transfer . . . . . . . . . . . . . . . . . . . . . . . . . . . . . . . . . . 60.16 582.1.2 Prevalence of foreign ownership . . . . . . . . . . . . . . . . . . . . . . . . . . . . . .66.35 48
Attract People2.1.3 Migrant stock . . . . . . . . . . . . . . . . . . . . . . . . . . . . . . . . . . . . . . . . . . . . . . . . .52.69 452.1.4 International students . . . . . . . . . . . . . . . . . . . . . . . . . . . . . . . . . . . . . . . . . 15.65 452.1.5 Brain gain . . . . . . . . . . . . . . . . . . . . . . . . . . . . . . . . . . . . . . . . . . . . . . . . . . . . . 42.51 712.2 Internal Openness . . . . . . . . . . . . . . . . . . . . . . . . . . . . . . . . . . . . . . . . . . 58.87 57
Social Inclusion2.2.1 Tolerance of minorities . . . . . . . . . . . . . . . . . . . . . . . . . . . . . . . . . . . . . . . .43.33 692.2.2 Tolerance of immigrants . . . . . . . . . . . . . . . . . . . . . . . . . . . . . . . . . . . . . .65.75 512.2.3 Social mobility . . . . . . . . . . . . . . . . . . . . . . . . . . . . . . . . . . . . . . . . . . . . . . . . 45.12 103
Gender Equality2.2.4 Female graduates . . . . . . . . . . . . . . . . . . . . . . . . . . . . . . . . . . . . . . . . . . . . .82.98 282.2.5 Gender development gap . . . . . . . . . . . . . . . . . . . . . . . . . . . . . . . . . . . .83.05 432.2.6 Leadership opportunities for women . . . . . . . . . . . . . . . . . . . . . . . . .33.00 98
Score Rank
3 GROW . . . . . . . . . . . . . . . . . . . . . . . . . . . . . . . . . . . . . . . . . . . . .41.27 543.1 Formal Education . . . . . . . . . . . . . . . . . . . . . . . . . . . . . . . . . . . . . . . . . . . 20.07 78
Enrolment3.1.1 Vocational enrolment . . . . . . . . . . . . . . . . . . . . . . . . . . . . . . . . . . . . . . . . . 11.50 823.1.2 Tertiary enrolment . . . . . . . . . . . . . . . . . . . . . . . . . . . . . . . . . . . . . . . . . . . .15.68 92
Quality3.1.3 Tertiary education expenditure . . . . . . . . . . . . . . . . . . . . . . . . . . . . . . . 19.48 683.1.4 Reading, maths, and science . . . . . . . . . . . . . . . . . . . . . . . . . . . . . . . . . . . .n/a n/a3.1.5 University ranking . . . . . . . . . . . . . . . . . . . . . . . . . . . . . . . . . . . . . . . . . . . . .33.60 353.2 Lifelong Learning . . . . . . . . . . . . . . . . . . . . . . . . . . . . . . . . . . . . . . . . . . . 46.51 573.2.1 Quality of management schools . . . . . . . . . . . . . . . . . . . . . . . . . . . . . .45.34 743.2.2 Prevalence of training in firms . . . . . . . . . . . . . . . . . . . . . . . . . . . . . . . . . . .n/a n/a3.2.3 Employee development . . . . . . . . . . . . . . . . . . . . . . . . . . . . . . . . . . . . . . 47.68 513.3 Access to Growth Opportunities . . . . . . . . . . . . . . . . . . . . . . . . . . . 57.24 35
Empowerment3.3.1 Delegation of authority . . . . . . . . . . . . . . . . . . . . . . . . . . . . . . . . . . . . . . . 61.76 333.3.2 Personal rights . . . . . . . . . . . . . . . . . . . . . . . . . . . . . . . . . . . . . . . . . . . . . . . .78.03 59
Collaboration3.3.3 Use of virtual social networks . . . . . . . . . . . . . . . . . . . . . . . . . . . . . . . . .80.03 503.3.4 Use of virtual professional networks . . . . . . . . . . . . . . . . . . . . . . . . . .22.44 293.3.5 Collaboration within organisations . . . . . . . . . . . . . . . . . . . . . . . . . . . . 51.13 513.3.6 Collaboration across organisations . . . . . . . . . . . . . . . . . . . . . . . . . . . .50.03 33
4 RETAIN . . . . . . . . . . . . . . . . . . . . . . . . . . . . . . . . . . . . . . . . . . . 30.04 1064.1 Sustainability . . . . . . . . . . . . . . . . . . . . . . . . . . . . . . . . . . . . . . . . . . . . . . . 26.30 1084.1.1 Pension system . . . . . . . . . . . . . . . . . . . . . . . . . . . . . . . . . . . . . . . . . . . . . . . . 6.30 1004.1.2 Social protection . . . . . . . . . . . . . . . . . . . . . . . . . . . . . . . . . . . . . . . . . . . . . .35.69 814.1.3 Brain retention . . . . . . . . . . . . . . . . . . . . . . . . . . . . . . . . . . . . . . . . . . . . . . . .36.92 784.2 Lifestyle . . . . . . . . . . . . . . . . . . . . . . . . . . . . . . . . . . . . . . . . . . . . . . . . . . . . 33.78 1024.2.1 Environmental performance . . . . . . . . . . . . . . . . . . . . . . . . . . . . . . . . . .28.84 1104.2.2 Personal safety . . . . . . . . . . . . . . . . . . . . . . . . . . . . . . . . . . . . . . . . . . . . . . . .22.37 1204.2.3 Physician density . . . . . . . . . . . . . . . . . . . . . . . . . . . . . . . . . . . . . . . . . . . . . . 12.81 894.2.4 Sanitation . . . . . . . . . . . . . . . . . . . . . . . . . . . . . . . . . . . . . . . . . . . . . . . . . . . . .71.08 93
5 VOCATIONAL AND TECHNICAL SKILLS . . . . . . . . . . . . 44.35 635.1 Mid-Level Skills . . . . . . . . . . . . . . . . . . . . . . . . . . . . . . . . . . . . . . . . . . . . . 46.63 555.1.1 Workforce with secondary education . . . . . . . . . . . . . . . . . . . . . . . . .43.73 685.1.2 Population with secondary education . . . . . . . . . . . . . . . . . . . . . . . .78.48 105.1.3 Technicians and associate professionals . . . . . . . . . . . . . . . . . . . . . . . 37.77 595.1.4 Labour productivity per employee . . . . . . . . . . . . . . . . . . . . . . . . . . . .26.52 585.2 Employability . . . . . . . . . . . . . . . . . . . . . . . . . . . . . . . . . . . . . . . . . . . . . . . 42.07 875.2.1 Ease of finding skilled employees . . . . . . . . . . . . . . . . . . . . . . . . . . . . .52.80 745.2.2 Relevance of education system to the economy . . . . . . . . . . . . . .28.72 1065.2.3 Skills matching with secondary education . . . . . . . . . . . . . . . . . . . .36.44 815.2.4 Skills matching with tertiary education . . . . . . . . . . . . . . . . . . . . . . . .50.31 75
6 GLOBAL KNOWLEDGE SKILLS . . . . . . . . . . . . . . . . . . . . 28.45 606.1 High-Level Skills . . . . . . . . . . . . . . . . . . . . . . . . . . . . . . . . . . . . . . . . . . . . 25.32 776.1.1 Workforce with tertiary education . . . . . . . . . . . . . . . . . . . . . . . . . . . .23.38 766.1.2 Population with tertiary education . . . . . . . . . . . . . . . . . . . . . . . . . . . . 11.05 926.1.3 Professionals . . . . . . . . . . . . . . . . . . . . . . . . . . . . . . . . . . . . . . . . . . . . . . . . . . 13.73 1006.1.4 Researchers . . . . . . . . . . . . . . . . . . . . . . . . . . . . . . . . . . . . . . . . . . . . . . . . . . . . 5.86 686.1.5 Senior officials and managers . . . . . . . . . . . . . . . . . . . . . . . . . . . . . . . . .54.54 196.1.6 Availability of scientists and engineers . . . . . . . . . . . . . . . . . . . . . . . .43.34 786.2 Talent Impact . . . . . . . . . . . . . . . . . . . . . . . . . . . . . . . . . . . . . . . . . . . . . . . 31.58 476.2.1 Innovation output . . . . . . . . . . . . . . . . . . . . . . . . . . . . . . . . . . . . . . . . . . . . 27.85 676.2.2 High-value exports . . . . . . . . . . . . . . . . . . . . . . . . . . . . . . . . . . . . . . . . . . . . 13.82 786.2.3 New product entrepreneurial activity . . . . . . . . . . . . . . . . . . . . . . . . .58.67 266.2.4 New business density . . . . . . . . . . . . . . . . . . . . . . . . . . . . . . . . . . . . . . . . .49.20 116.2.5 Scientific journal articles . . . . . . . . . . . . . . . . . . . . . . . . . . . . . . . . . . . . . . . 8.34 56
l South Africa l Income group average

GTCI 2020 Country Profile by Pillar
238 THE GLOBAL TALENT COMPETITIVENESS INDEX 2020
COUNTRY PROFILESCOUNTRY PROFILES
102030405060708090100
Global knowledge skills
Vocational andtechnical skills
Retain
Grow
Attract
Enable
102030405060607
SPAINKey Indicators
Rank (out of 132) . . . . . . . . . . . . . . . . . . . . . . . . . . . . . . . . . . . . . . . 32Income group . . . . . . . . . . . . . . . . . . . . . . . . . . . . . . . . . . . . High incomeRegional group . . . . . . . . . . . . . . . . . . . . . . . . . . . . . . . . . . . . . . . . .EuropePopulation (millions) . . . . . . . . . . . . . . . . . . . . . . . . . . . . . . . . . . . . 46.72
GDP per capita (PPP US$) . . . . . . . . . . . . . . . . . . . . . . . . . . . .40,854.58GDP (US$ billions) . . . . . . . . . . . . . . . . . . . . . . . . . . . . . . . . . . . 1,426.19GTCI score . . . . . . . . . . . . . . . . . . . . . . . . . . . . . . . . . . . . . . . . . . . . . . 55.70GTCI score (income group average) . . . . . . . . . . . . . . . . . . . . . . . . 61.46
Score Rank
1 ENABLE . . . . . . . . . . . . . . . . . . . . . . . . . . . . . . . . . . . . . . . . . . 62.58 321.1 Regulatory Landscape . . . . . . . . . . . . . . . . . . . . . . . . . . . . . . . . . . . . . . 69.89 341.1.1 Government effectiveness . . . . . . . . . . . . . . . . . . . . . . . . . . . . . . . . . . . . 71.61 281.1.2 Rule of law . . . . . . . . . . . . . . . . . . . . . . . . . . . . . . . . . . . . . . . . . . . . . . . . . . . .76.21 291.1.3 Political stability . . . . . . . . . . . . . . . . . . . . . . . . . . . . . . . . . . . . . . . . . . . . . . . 70.93 511.1.4 Regulatory quality. . . . . . . . . . . . . . . . . . . . . . . . . . . . . . . . . . . . . . . . . . . . .71.23 331.1.5 Corruption . . . . . . . . . . . . . . . . . . . . . . . . . . . . . . . . . . . . . . . . . . . . . . . . . . . .59.46 361.2 Market Landscape . . . . . . . . . . . . . . . . . . . . . . . . . . . . . . . . . . . . . . . . . . 67.61 251.2.1 Competition intensity . . . . . . . . . . . . . . . . . . . . . . . . . . . . . . . . . . . . . . . . .80.93 201.2.2 Ease of doing business . . . . . . . . . . . . . . . . . . . . . . . . . . . . . . . . . . . . . . . .84.08 281.2.3 Cluster development . . . . . . . . . . . . . . . . . . . . . . . . . . . . . . . . . . . . . . . . . .56.96 351.2.4 R&D expenditure . . . . . . . . . . . . . . . . . . . . . . . . . . . . . . . . . . . . . . . . . . . . . . 26.15 311.2.5 ICT infrastructure. . . . . . . . . . . . . . . . . . . . . . . . . . . . . . . . . . . . . . . . . . . . . . 80.15 251.2.6 Urban population . . . . . . . . . . . . . . . . . . . . . . . . . . . . . . . . . . . . . . . . . . . . . 77.37 341.3 Business and Labour Landscape . . . . . . . . . . . . . . . . . . . . . . . . . . . . 50.24 54
Labour Market1.3.1 Tertiary-educated unemployment . . . . . . . . . . . . . . . . . . . . . . . . . . . .70.65 921.3.2 Active labour market policies . . . . . . . . . . . . . . . . . . . . . . . . . . . . . . . . . 47.65 601.3.3 Labour-employer cooperation . . . . . . . . . . . . . . . . . . . . . . . . . . . . . . . .33.78 84
Management Practice1.3.4 Professional management . . . . . . . . . . . . . . . . . . . . . . . . . . . . . . . . . . . . 58.17 421.3.5 Relationship of pay to productivity . . . . . . . . . . . . . . . . . . . . . . . . . . . .36.62 99
Technology Adoption1.3.6 Technology utilisation. . . . . . . . . . . . . . . . . . . . . . . . . . . . . . . . . . . . . . . . .62.27 471.3.7 Investment in emerging technologies . . . . . . . . . . . . . . . . . . . . . . . . 43.01 541.3.8 Robot density . . . . . . . . . . . . . . . . . . . . . . . . . . . . . . . . . . . . . . . . . . . . . . . . .49.72 14
2 ATTRACT . . . . . . . . . . . . . . . . . . . . . . . . . . . . . . . . . . . . . . . . . .55.43 452.1 External Openness . . . . . . . . . . . . . . . . . . . . . . . . . . . . . . . . . . . . . . . . . 51.12 37
Attract Business2.1.1 FDI and technology transfer . . . . . . . . . . . . . . . . . . . . . . . . . . . . . . . . . .73.33 292.1.2 Prevalence of foreign ownership . . . . . . . . . . . . . . . . . . . . . . . . . . . . . .73.84 34
Attract People2.1.3 Migrant stock . . . . . . . . . . . . . . . . . . . . . . . . . . . . . . . . . . . . . . . . . . . . . . . . . 59.63 322.1.4 International students . . . . . . . . . . . . . . . . . . . . . . . . . . . . . . . . . . . . . . . . . . 9.87 632.1.5 Brain gain . . . . . . . . . . . . . . . . . . . . . . . . . . . . . . . . . . . . . . . . . . . . . . . . . . . . .38.93 832.2 Internal Openness . . . . . . . . . . . . . . . . . . . . . . . . . . . . . . . . . . . . . . . . . . 59.75 55
Social Inclusion2.2.1 Tolerance of minorities . . . . . . . . . . . . . . . . . . . . . . . . . . . . . . . . . . . . . . . .43.33 692.2.2 Tolerance of immigrants . . . . . . . . . . . . . . . . . . . . . . . . . . . . . . . . . . . . . . 87.67 122.2.3 Social mobility . . . . . . . . . . . . . . . . . . . . . . . . . . . . . . . . . . . . . . . . . . . . . . . .54.93 72
Gender Equality2.2.4 Female graduates . . . . . . . . . . . . . . . . . . . . . . . . . . . . . . . . . . . . . . . . . . . . .70.04 692.2.5 Gender development gap . . . . . . . . . . . . . . . . . . . . . . . . . . . . . . . . . . . . 81.37 482.2.6 Leadership opportunities for women . . . . . . . . . . . . . . . . . . . . . . . . . 21.13 118
Score Rank
3 GROW . . . . . . . . . . . . . . . . . . . . . . . . . . . . . . . . . . . . . . . . . . . . .53.91 293.1 Formal Education . . . . . . . . . . . . . . . . . . . . . . . . . . . . . . . . . . . . . . . . . . . 48.03 22
Enrolment3.1.1 Vocational enrolment . . . . . . . . . . . . . . . . . . . . . . . . . . . . . . . . . . . . . . . . .28.49 433.1.2 Tertiary enrolment . . . . . . . . . . . . . . . . . . . . . . . . . . . . . . . . . . . . . . . . . . . . 71.97 6
Quality3.1.3 Tertiary education expenditure . . . . . . . . . . . . . . . . . . . . . . . . . . . . . . . 21.46 613.1.4 Reading, maths, and science . . . . . . . . . . . . . . . . . . . . . . . . . . . . . . . . . . 71.67 263.1.5 University ranking . . . . . . . . . . . . . . . . . . . . . . . . . . . . . . . . . . . . . . . . . . . . .46.55 233.2 Lifelong Learning . . . . . . . . . . . . . . . . . . . . . . . . . . . . . . . . . . . . . . . . . . . 58.42 313.2.1 Quality of management schools . . . . . . . . . . . . . . . . . . . . . . . . . . . . . . 79.79 103.2.2 Prevalence of training in firms . . . . . . . . . . . . . . . . . . . . . . . . . . . . . . . . . . .n/a n/a3.2.3 Employee development . . . . . . . . . . . . . . . . . . . . . . . . . . . . . . . . . . . . . . 37.04 673.3 Access to Growth Opportunities . . . . . . . . . . . . . . . . . . . . . . . . . . . 55.29 40
Empowerment3.3.1 Delegation of authority . . . . . . . . . . . . . . . . . . . . . . . . . . . . . . . . . . . . . . . 49.01 613.3.2 Personal rights . . . . . . . . . . . . . . . . . . . . . . . . . . . . . . . . . . . . . . . . . . . . . . . . 96.10 18
Collaboration3.3.3 Use of virtual social networks . . . . . . . . . . . . . . . . . . . . . . . . . . . . . . . . . 81.49 423.3.4 Use of virtual professional networks . . . . . . . . . . . . . . . . . . . . . . . . . . 37.29 173.3.5 Collaboration within organisations . . . . . . . . . . . . . . . . . . . . . . . . . . . . 36.11 1013.3.6 Collaboration across organisations . . . . . . . . . . . . . . . . . . . . . . . . . . . . 31.73 87
4 RETAIN . . . . . . . . . . . . . . . . . . . . . . . . . . . . . . . . . . . . . . . . . . . 73.54 234.1 Sustainability . . . . . . . . . . . . . . . . . . . . . . . . . . . . . . . . . . . . . . . . . . . . . . . 65.97 294.1.1 Pension system . . . . . . . . . . . . . . . . . . . . . . . . . . . . . . . . . . . . . . . . . . . . . . . 74.98 324.1.2 Social protection . . . . . . . . . . . . . . . . . . . . . . . . . . . . . . . . . . . . . . . . . . . . . .84.78 154.1.3 Brain retention . . . . . . . . . . . . . . . . . . . . . . . . . . . . . . . . . . . . . . . . . . . . . . . . 38.14 744.2 Lifestyle . . . . . . . . . . . . . . . . . . . . . . . . . . . . . . . . . . . . . . . . . . . . . . . . . . . . 81.12 124.2.1 Environmental performance . . . . . . . . . . . . . . . . . . . . . . . . . . . . . . . . . .84.95 124.2.2 Personal safety . . . . . . . . . . . . . . . . . . . . . . . . . . . . . . . . . . . . . . . . . . . . . . . . 77.86 234.2.3 Physician density . . . . . . . . . . . . . . . . . . . . . . . . . . . . . . . . . . . . . . . . . . . . . . 61.79 154.2.4 Sanitation . . . . . . . . . . . . . . . . . . . . . . . . . . . . . . . . . . . . . . . . . . . . . . . . . . . . .99.90 14
5 VOCATIONAL AND TECHNICAL SKILLS . . . . . . . . . . . . . 47.77 535.1 Mid-Level Skills . . . . . . . . . . . . . . . . . . . . . . . . . . . . . . . . . . . . . . . . . . . . . 39.98 655.1.1 Workforce with secondary education . . . . . . . . . . . . . . . . . . . . . . . . . 31.67 855.1.2 Population with secondary education . . . . . . . . . . . . . . . . . . . . . . . .25.65 815.1.3 Technicians and associate professionals . . . . . . . . . . . . . . . . . . . . . . .48.72 455.1.4 Labour productivity per employee . . . . . . . . . . . . . . . . . . . . . . . . . . . .53.87 245.2 Employability . . . . . . . . . . . . . . . . . . . . . . . . . . . . . . . . . . . . . . . . . . . . . . . 55.57 475.2.1 Ease of finding skilled employees . . . . . . . . . . . . . . . . . . . . . . . . . . . . .68.91 375.2.2 Relevance of education system to the economy . . . . . . . . . . . . . .40.25 785.2.3 Skills matching with secondary education . . . . . . . . . . . . . . . . . . . .50.21 475.2.4 Skills matching with tertiary education . . . . . . . . . . . . . . . . . . . . . . . . 62.91 42
6 GLOBAL KNOWLEDGE SKILLS . . . . . . . . . . . . . . . . . . . . 40.99 346.1 High-Level Skills . . . . . . . . . . . . . . . . . . . . . . . . . . . . . . . . . . . . . . . . . . . .46.05 326.1.1 Workforce with tertiary education . . . . . . . . . . . . . . . . . . . . . . . . . . . .60.20 196.1.2 Population with tertiary education . . . . . . . . . . . . . . . . . . . . . . . . . . . . 47.17 306.1.3 Professionals . . . . . . . . . . . . . . . . . . . . . . . . . . . . . . . . . . . . . . . . . . . . . . . . . .46.73 326.1.4 Researchers . . . . . . . . . . . . . . . . . . . . . . . . . . . . . . . . . . . . . . . . . . . . . . . . . . .34.74 306.1.5 Senior officials and managers . . . . . . . . . . . . . . . . . . . . . . . . . . . . . . . . .24.33 626.1.6 Availability of scientists and engineers . . . . . . . . . . . . . . . . . . . . . . . . 63.13 346.2 Talent Impact . . . . . . . . . . . . . . . . . . . . . . . . . . . . . . . . . . . . . . . . . . . . . . . 35.93 376.2.1 Innovation output . . . . . . . . . . . . . . . . . . . . . . . . . . . . . . . . . . . . . . . . . . . .56.04 276.2.2 High-value exports . . . . . . . . . . . . . . . . . . . . . . . . . . . . . . . . . . . . . . . . . . . .20.97 576.2.3 New product entrepreneurial activity . . . . . . . . . . . . . . . . . . . . . . . . . 42.10 526.2.4 New business density . . . . . . . . . . . . . . . . . . . . . . . . . . . . . . . . . . . . . . . . . 15.51 386.2.5 Scientific journal articles . . . . . . . . . . . . . . . . . . . . . . . . . . . . . . . . . . . . . . 45.01 25
l Spain l Income group average
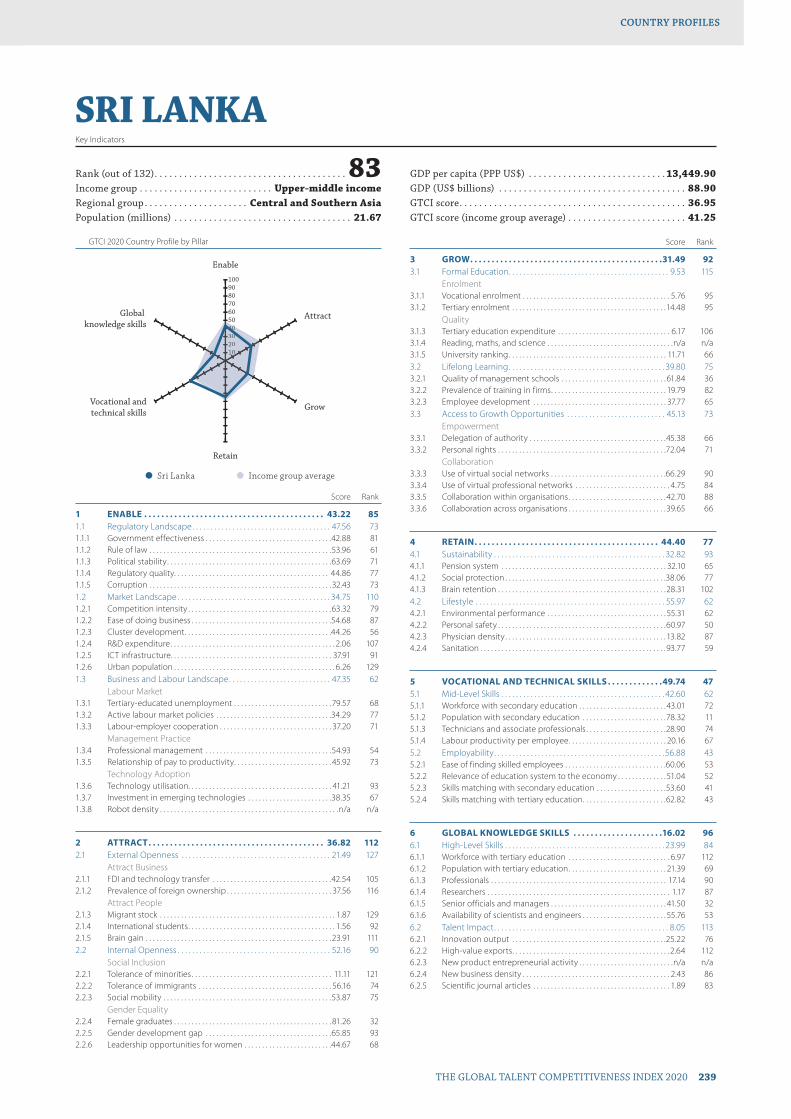
GTCI 2020 Country Profile by Pillar
THE GLOBAL TALENT COMPETITIVENESS INDEX 2020 239
COUNTRY PROFILESCOUNTRY PROFILES
102030405060708090100
Global knowledge skills
Vocational andtechnical skills
Retain
Grow
Attract
Enable
1020304040
SRI LANKAKey Indicators
Rank (out of 132) . . . . . . . . . . . . . . . . . . . . . . . . . . . . . . . . . . . . . . . 83Income group . . . . . . . . . . . . . . . . . . . . . . . . . . . Upper-middle incomeRegional group . . . . . . . . . . . . . . . . . . . . . Central and Southern AsiaPopulation (millions) . . . . . . . . . . . . . . . . . . . . . . . . . . . . . . . . . . . . 21.67
GDP per capita (PPP US$) . . . . . . . . . . . . . . . . . . . . . . . . . . . . 13,449.90GDP (US$ billions) . . . . . . . . . . . . . . . . . . . . . . . . . . . . . . . . . . . . . . 88.90GTCI score . . . . . . . . . . . . . . . . . . . . . . . . . . . . . . . . . . . . . . . . . . . . . . 36.95GTCI score (income group average) . . . . . . . . . . . . . . . . . . . . . . . . 41.25
Score Rank
1 ENABLE . . . . . . . . . . . . . . . . . . . . . . . . . . . . . . . . . . . . . . . . . . 43.22 851.1 Regulatory Landscape . . . . . . . . . . . . . . . . . . . . . . . . . . . . . . . . . . . . . . 47.56 731.1.1 Government effectiveness . . . . . . . . . . . . . . . . . . . . . . . . . . . . . . . . . . . .42.88 811.1.2 Rule of law . . . . . . . . . . . . . . . . . . . . . . . . . . . . . . . . . . . . . . . . . . . . . . . . . . . .53.96 611.1.3 Political stability . . . . . . . . . . . . . . . . . . . . . . . . . . . . . . . . . . . . . . . . . . . . . . .63.69 711.1.4 Regulatory quality. . . . . . . . . . . . . . . . . . . . . . . . . . . . . . . . . . . . . . . . . . . . 44.86 771.1.5 Corruption . . . . . . . . . . . . . . . . . . . . . . . . . . . . . . . . . . . . . . . . . . . . . . . . . . . . 32.43 731.2 Market Landscape . . . . . . . . . . . . . . . . . . . . . . . . . . . . . . . . . . . . . . . . . . 34.75 1101.2.1 Competition intensity . . . . . . . . . . . . . . . . . . . . . . . . . . . . . . . . . . . . . . . . .63.32 791.2.2 Ease of doing business . . . . . . . . . . . . . . . . . . . . . . . . . . . . . . . . . . . . . . . .54.68 871.2.3 Cluster development . . . . . . . . . . . . . . . . . . . . . . . . . . . . . . . . . . . . . . . . . .44.26 561.2.4 R&D expenditure . . . . . . . . . . . . . . . . . . . . . . . . . . . . . . . . . . . . . . . . . . . . . . . 2.06 1071.2.5 ICT infrastructure. . . . . . . . . . . . . . . . . . . . . . . . . . . . . . . . . . . . . . . . . . . . . . 37.91 911.2.6 Urban population . . . . . . . . . . . . . . . . . . . . . . . . . . . . . . . . . . . . . . . . . . . . . . 6.26 1291.3 Business and Labour Landscape . . . . . . . . . . . . . . . . . . . . . . . . . . . . 47.35 62
Labour Market1.3.1 Tertiary-educated unemployment . . . . . . . . . . . . . . . . . . . . . . . . . . . .79.57 681.3.2 Active labour market policies . . . . . . . . . . . . . . . . . . . . . . . . . . . . . . . . .34.29 771.3.3 Labour-employer cooperation . . . . . . . . . . . . . . . . . . . . . . . . . . . . . . . . 37.20 71
Management Practice1.3.4 Professional management . . . . . . . . . . . . . . . . . . . . . . . . . . . . . . . . . . . .54.93 541.3.5 Relationship of pay to productivity . . . . . . . . . . . . . . . . . . . . . . . . . . . . 45.92 73
Technology Adoption1.3.6 Technology utilisation. . . . . . . . . . . . . . . . . . . . . . . . . . . . . . . . . . . . . . . . . 41.21 931.3.7 Investment in emerging technologies . . . . . . . . . . . . . . . . . . . . . . . .38.35 671.3.8 Robot density . . . . . . . . . . . . . . . . . . . . . . . . . . . . . . . . . . . . . . . . . . . . . . . . . . .n/a n/a
2 ATTRACT . . . . . . . . . . . . . . . . . . . . . . . . . . . . . . . . . . . . . . . . . 36.82 1122.1 External Openness . . . . . . . . . . . . . . . . . . . . . . . . . . . . . . . . . . . . . . . . . 21.49 127
Attract Business2.1.1 FDI and technology transfer . . . . . . . . . . . . . . . . . . . . . . . . . . . . . . . . . .42.54 1052.1.2 Prevalence of foreign ownership . . . . . . . . . . . . . . . . . . . . . . . . . . . . . . 37.56 116
Attract People2.1.3 Migrant stock . . . . . . . . . . . . . . . . . . . . . . . . . . . . . . . . . . . . . . . . . . . . . . . . . . 1.87 1292.1.4 International students . . . . . . . . . . . . . . . . . . . . . . . . . . . . . . . . . . . . . . . . . . 1.56 922.1.5 Brain gain . . . . . . . . . . . . . . . . . . . . . . . . . . . . . . . . . . . . . . . . . . . . . . . . . . . . .23.91 1112.2 Internal Openness . . . . . . . . . . . . . . . . . . . . . . . . . . . . . . . . . . . . . . . . . . 52.16 90
Social Inclusion2.2.1 Tolerance of minorities . . . . . . . . . . . . . . . . . . . . . . . . . . . . . . . . . . . . . . . . 11.11 1212.2.2 Tolerance of immigrants . . . . . . . . . . . . . . . . . . . . . . . . . . . . . . . . . . . . . . 56.16 742.2.3 Social mobility . . . . . . . . . . . . . . . . . . . . . . . . . . . . . . . . . . . . . . . . . . . . . . . .53.87 75
Gender Equality2.2.4 Female graduates . . . . . . . . . . . . . . . . . . . . . . . . . . . . . . . . . . . . . . . . . . . . . 81.26 322.2.5 Gender development gap . . . . . . . . . . . . . . . . . . . . . . . . . . . . . . . . . . . .65.85 932.2.6 Leadership opportunities for women . . . . . . . . . . . . . . . . . . . . . . . . .44.67 68
Score Rank
3 GROW . . . . . . . . . . . . . . . . . . . . . . . . . . . . . . . . . . . . . . . . . . . . .31.49 923.1 Formal Education . . . . . . . . . . . . . . . . . . . . . . . . . . . . . . . . . . . . . . . . . . . . 9.53 115
Enrolment3.1.1 Vocational enrolment . . . . . . . . . . . . . . . . . . . . . . . . . . . . . . . . . . . . . . . . . . 5.76 953.1.2 Tertiary enrolment . . . . . . . . . . . . . . . . . . . . . . . . . . . . . . . . . . . . . . . . . . . .14.48 95
Quality3.1.3 Tertiary education expenditure . . . . . . . . . . . . . . . . . . . . . . . . . . . . . . . . 6.17 1063.1.4 Reading, maths, and science . . . . . . . . . . . . . . . . . . . . . . . . . . . . . . . . . . . .n/a n/a3.1.5 University ranking . . . . . . . . . . . . . . . . . . . . . . . . . . . . . . . . . . . . . . . . . . . . . 11.71 663.2 Lifelong Learning . . . . . . . . . . . . . . . . . . . . . . . . . . . . . . . . . . . . . . . . . . . 39.80 753.2.1 Quality of management schools . . . . . . . . . . . . . . . . . . . . . . . . . . . . . . 61.84 363.2.2 Prevalence of training in firms . . . . . . . . . . . . . . . . . . . . . . . . . . . . . . . . . 19.79 823.2.3 Employee development . . . . . . . . . . . . . . . . . . . . . . . . . . . . . . . . . . . . . . 37.77 653.3 Access to Growth Opportunities . . . . . . . . . . . . . . . . . . . . . . . . . . . 45.13 73
Empowerment3.3.1 Delegation of authority . . . . . . . . . . . . . . . . . . . . . . . . . . . . . . . . . . . . . . .45.38 663.3.2 Personal rights . . . . . . . . . . . . . . . . . . . . . . . . . . . . . . . . . . . . . . . . . . . . . . . .72.04 71
Collaboration3.3.3 Use of virtual social networks . . . . . . . . . . . . . . . . . . . . . . . . . . . . . . . . .66.29 903.3.4 Use of virtual professional networks . . . . . . . . . . . . . . . . . . . . . . . . . . . 4.75 843.3.5 Collaboration within organisations . . . . . . . . . . . . . . . . . . . . . . . . . . . . 42.70 883.3.6 Collaboration across organisations . . . . . . . . . . . . . . . . . . . . . . . . . . . .39.65 66
4 RETAIN . . . . . . . . . . . . . . . . . . . . . . . . . . . . . . . . . . . . . . . . . . . 44.40 774.1 Sustainability . . . . . . . . . . . . . . . . . . . . . . . . . . . . . . . . . . . . . . . . . . . . . . . 32.82 934.1.1 Pension system . . . . . . . . . . . . . . . . . . . . . . . . . . . . . . . . . . . . . . . . . . . . . . . 32.10 654.1.2 Social protection . . . . . . . . . . . . . . . . . . . . . . . . . . . . . . . . . . . . . . . . . . . . . .38.06 774.1.3 Brain retention . . . . . . . . . . . . . . . . . . . . . . . . . . . . . . . . . . . . . . . . . . . . . . . .28.31 1024.2 Lifestyle . . . . . . . . . . . . . . . . . . . . . . . . . . . . . . . . . . . . . . . . . . . . . . . . . . . . 55.97 624.2.1 Environmental performance . . . . . . . . . . . . . . . . . . . . . . . . . . . . . . . . . . 55.31 624.2.2 Personal safety . . . . . . . . . . . . . . . . . . . . . . . . . . . . . . . . . . . . . . . . . . . . . . . .60.97 504.2.3 Physician density . . . . . . . . . . . . . . . . . . . . . . . . . . . . . . . . . . . . . . . . . . . . . . 13.82 874.2.4 Sanitation . . . . . . . . . . . . . . . . . . . . . . . . . . . . . . . . . . . . . . . . . . . . . . . . . . . . .93.77 59
5 VOCATIONAL AND TECHNICAL SKILLS . . . . . . . . . . . . .49.74 475.1 Mid-Level Skills . . . . . . . . . . . . . . . . . . . . . . . . . . . . . . . . . . . . . . . . . . . . . 42.60 625.1.1 Workforce with secondary education . . . . . . . . . . . . . . . . . . . . . . . . . 43.01 725.1.2 Population with secondary education . . . . . . . . . . . . . . . . . . . . . . . .78.32 115.1.3 Technicians and associate professionals . . . . . . . . . . . . . . . . . . . . . . .28.90 745.1.4 Labour productivity per employee . . . . . . . . . . . . . . . . . . . . . . . . . . . . 20.16 675.2 Employability . . . . . . . . . . . . . . . . . . . . . . . . . . . . . . . . . . . . . . . . . . . . . . .56.88 435.2.1 Ease of finding skilled employees . . . . . . . . . . . . . . . . . . . . . . . . . . . . .60.06 535.2.2 Relevance of education system to the economy . . . . . . . . . . . . . . 51.04 525.2.3 Skills matching with secondary education . . . . . . . . . . . . . . . . . . . .53.60 415.2.4 Skills matching with tertiary education . . . . . . . . . . . . . . . . . . . . . . . .62.82 43
6 GLOBAL KNOWLEDGE SKILLS . . . . . . . . . . . . . . . . . . . . .16.02 966.1 High-Level Skills . . . . . . . . . . . . . . . . . . . . . . . . . . . . . . . . . . . . . . . . . . . . 23.99 846.1.1 Workforce with tertiary education . . . . . . . . . . . . . . . . . . . . . . . . . . . . . 6.97 1126.1.2 Population with tertiary education . . . . . . . . . . . . . . . . . . . . . . . . . . . . 21.39 696.1.3 Professionals . . . . . . . . . . . . . . . . . . . . . . . . . . . . . . . . . . . . . . . . . . . . . . . . . . 17.14 906.1.4 Researchers . . . . . . . . . . . . . . . . . . . . . . . . . . . . . . . . . . . . . . . . . . . . . . . . . . . . 1.17 876.1.5 Senior officials and managers . . . . . . . . . . . . . . . . . . . . . . . . . . . . . . . . . 41.50 326.1.6 Availability of scientists and engineers . . . . . . . . . . . . . . . . . . . . . . . . 55.76 536.2 Talent Impact . . . . . . . . . . . . . . . . . . . . . . . . . . . . . . . . . . . . . . . . . . . . . . . . 8.05 1136.2.1 Innovation output . . . . . . . . . . . . . . . . . . . . . . . . . . . . . . . . . . . . . . . . . . . .25.22 766.2.2 High-value exports . . . . . . . . . . . . . . . . . . . . . . . . . . . . . . . . . . . . . . . . . . . . . 2.64 1126.2.3 New product entrepreneurial activity . . . . . . . . . . . . . . . . . . . . . . . . . . .n/a n/a6.2.4 New business density . . . . . . . . . . . . . . . . . . . . . . . . . . . . . . . . . . . . . . . . . . 2.43 866.2.5 Scientific journal articles . . . . . . . . . . . . . . . . . . . . . . . . . . . . . . . . . . . . . . . 1.89 83
l Sri Lanka l Income group average

GTCI 2020 Country Profile by Pillar
240 THE GLOBAL TALENT COMPETITIVENESS INDEX 2020
COUNTRY PROFILESCOUNTRY PROFILES
102030405060708090100
Global knowledge skills
Vocational andtechnical skills
Retain
Grow
Attract
Enable
102030405060607
SWEDENKey Indicators
Rank (out of 132) . . . . . . . . . . . . . . . . . . . . . . . . . . . . . . . . . . . . . . . . . . .4Income group . . . . . . . . . . . . . . . . . . . . . . . . . . . . . . . . . . . . High incomeRegional group . . . . . . . . . . . . . . . . . . . . . . . . . . . . . . . . . . . . . . . . .EuropePopulation (millions) . . . . . . . . . . . . . . . . . . . . . . . . . . . . . . . . . . . . 10.18
GDP per capita (PPP US$) . . . . . . . . . . . . . . . . . . . . . . . . . . . . 53,119.71GDP (US$ billions) . . . . . . . . . . . . . . . . . . . . . . . . . . . . . . . . . . . . . 551.03GTCI score . . . . . . . . . . . . . . . . . . . . . . . . . . . . . . . . . . . . . . . . . . . . . . 75.82GTCI score (income group average) . . . . . . . . . . . . . . . . . . . . . . . . 61.46
Score Rank
1 ENABLE . . . . . . . . . . . . . . . . . . . . . . . . . . . . . . . . . . . . . . . . . . 86.37 41.1 Regulatory Landscape . . . . . . . . . . . . . . . . . . . . . . . . . . . . . . . . . . . . . . 92.72 61.1.1 Government effectiveness . . . . . . . . . . . . . . . . . . . . . . . . . . . . . . . . . . . . 91.09 71.1.2 Rule of law . . . . . . . . . . . . . . . . . . . . . . . . . . . . . . . . . . . . . . . . . . . . . . . . . . . . 97.88 31.1.3 Political stability . . . . . . . . . . . . . . . . . . . . . . . . . . . . . . . . . . . . . . . . . . . . . . .86.46 201.1.4 Regulatory quality. . . . . . . . . . . . . . . . . . . . . . . . . . . . . . . . . . . . . . . . . . . . .92.23 91.1.5 Corruption . . . . . . . . . . . . . . . . . . . . . . . . . . . . . . . . . . . . . . . . . . . . . . . . . . . .95.95 31.2 Market Landscape . . . . . . . . . . . . . . . . . . . . . . . . . . . . . . . . . . . . . . . . . . 82.53 51.2.1 Competition intensity . . . . . . . . . . . . . . . . . . . . . . . . . . . . . . . . . . . . . . . . .79.84 231.2.2 Ease of doing business . . . . . . . . . . . . . . . . . . . . . . . . . . . . . . . . . . . . . . . .90.50 111.2.3 Cluster development . . . . . . . . . . . . . . . . . . . . . . . . . . . . . . . . . . . . . . . . . .79.58 111.2.4 R&D expenditure . . . . . . . . . . . . . . . . . . . . . . . . . . . . . . . . . . . . . . . . . . . . . .72.29 41.2.5 ICT infrastructure. . . . . . . . . . . . . . . . . . . . . . . . . . . . . . . . . . . . . . . . . . . . . . 87.40 121.2.6 Urban population . . . . . . . . . . . . . . . . . . . . . . . . . . . . . . . . . . . . . . . . . . . . .85.55 181.3 Business and Labour Landscape . . . . . . . . . . . . . . . . . . . . . . . . . . . . 83.86 8
Labour Market1.3.1 Tertiary-educated unemployment . . . . . . . . . . . . . . . . . . . . . . . . . . . .88.31 341.3.2 Active labour market policies . . . . . . . . . . . . . . . . . . . . . . . . . . . . . . . . . 78.14 141.3.3 Labour-employer cooperation . . . . . . . . . . . . . . . . . . . . . . . . . . . . . . . .80.49 9
Management Practice1.3.4 Professional management . . . . . . . . . . . . . . . . . . . . . . . . . . . . . . . . . . . . 93.43 71.3.5 Relationship of pay to productivity . . . . . . . . . . . . . . . . . . . . . . . . . . . .66.95 29
Technology Adoption1.3.6 Technology utilisation. . . . . . . . . . . . . . . . . . . . . . . . . . . . . . . . . . . . . . . . .98.63 21.3.7 Investment in emerging technologies . . . . . . . . . . . . . . . . . . . . . . . . 91.97 31.3.8 Robot density . . . . . . . . . . . . . . . . . . . . . . . . . . . . . . . . . . . . . . . . . . . . . . . . .72.93 5
2 ATTRACT . . . . . . . . . . . . . . . . . . . . . . . . . . . . . . . . . . . . . . . . . .75.66 102.1 External Openness . . . . . . . . . . . . . . . . . . . . . . . . . . . . . . . . . . . . . . . . .64.60 21
Attract Business2.1.1 FDI and technology transfer . . . . . . . . . . . . . . . . . . . . . . . . . . . . . . . . . . 84.12 102.1.2 Prevalence of foreign ownership . . . . . . . . . . . . . . . . . . . . . . . . . . . . . . 79.42 24
Attract People2.1.3 Migrant stock . . . . . . . . . . . . . . . . . . . . . . . . . . . . . . . . . . . . . . . . . . . . . . . . . 67.44 182.1.4 International students . . . . . . . . . . . . . . . . . . . . . . . . . . . . . . . . . . . . . . . . .24.08 322.1.5 Brain gain . . . . . . . . . . . . . . . . . . . . . . . . . . . . . . . . . . . . . . . . . . . . . . . . . . . . . 67.97 222.2 Internal Openness . . . . . . . . . . . . . . . . . . . . . . . . . . . . . . . . . . . . . . . . . . 86.71 3
Social Inclusion2.2.1 Tolerance of minorities . . . . . . . . . . . . . . . . . . . . . . . . . . . . . . . . . . . . . . . .92.22 42.2.2 Tolerance of immigrants . . . . . . . . . . . . . . . . . . . . . . . . . . . . . . . . . . . . . .86.30 142.2.3 Social mobility . . . . . . . . . . . . . . . . . . . . . . . . . . . . . . . . . . . . . . . . . . . . . . . .80.78 18
Gender Equality2.2.4 Female graduates . . . . . . . . . . . . . . . . . . . . . . . . . . . . . . . . . . . . . . . . . . . . .86.40 222.2.5 Gender development gap . . . . . . . . . . . . . . . . . . . . . . . . . . . . . . . . . . . .86.01 262.2.6 Leadership opportunities for women . . . . . . . . . . . . . . . . . . . . . . . . .88.55 4
Score Rank
3 GROW . . . . . . . . . . . . . . . . . . . . . . . . . . . . . . . . . . . . . . . . . . . . 73.83 63.1 Formal Education . . . . . . . . . . . . . . . . . . . . . . . . . . . . . . . . . . . . . . . . . . . 52.52 16
Enrolment3.1.1 Vocational enrolment . . . . . . . . . . . . . . . . . . . . . . . . . . . . . . . . . . . . . . . . .33.43 323.1.2 Tertiary enrolment . . . . . . . . . . . . . . . . . . . . . . . . . . . . . . . . . . . . . . . . . . . .49.98 38
Quality3.1.3 Tertiary education expenditure . . . . . . . . . . . . . . . . . . . . . . . . . . . . . . .45.34 93.1.4 Reading, maths, and science . . . . . . . . . . . . . . . . . . . . . . . . . . . . . . . . . .73.76 223.1.5 University ranking . . . . . . . . . . . . . . . . . . . . . . . . . . . . . . . . . . . . . . . . . . . . . 60.11 133.2 Lifelong Learning . . . . . . . . . . . . . . . . . . . . . . . . . . . . . . . . . . . . . . . . . . . 83.11 53.2.1 Quality of management schools . . . . . . . . . . . . . . . . . . . . . . . . . . . . . . 77.73 133.2.2 Prevalence of training in firms . . . . . . . . . . . . . . . . . . . . . . . . . . . . . . . . .88.26 33.2.3 Employee development . . . . . . . . . . . . . . . . . . . . . . . . . . . . . . . . . . . . . .83.35 73.3 Access to Growth Opportunities . . . . . . . . . . . . . . . . . . . . . . . . . . . 85.85 3
Empowerment3.3.1 Delegation of authority . . . . . . . . . . . . . . . . . . . . . . . . . . . . . . . . . . . . . . . 97.96 23.3.2 Personal rights . . . . . . . . . . . . . . . . . . . . . . . . . . . . . . . . . . . . . . . . . . . . . . . .98.61 4
Collaboration3.3.3 Use of virtual social networks . . . . . . . . . . . . . . . . . . . . . . . . . . . . . . . . .96.42 63.3.4 Use of virtual professional networks . . . . . . . . . . . . . . . . . . . . . . . . . . 47.34 123.3.5 Collaboration within organisations . . . . . . . . . . . . . . . . . . . . . . . . . . . .93.72 43.3.6 Collaboration across organisations . . . . . . . . . . . . . . . . . . . . . . . . . . . . 81.08 6
4 RETAIN . . . . . . . . . . . . . . . . . . . . . . . . . . . . . . . . . . . . . . . . . . . 83.28 94.1 Sustainability . . . . . . . . . . . . . . . . . . . . . . . . . . . . . . . . . . . . . . . . . . . . . . . 81.15 144.1.1 Pension system . . . . . . . . . . . . . . . . . . . . . . . . . . . . . . . . . . . . . . . . . . . . . . .79.30 284.1.2 Social protection . . . . . . . . . . . . . . . . . . . . . . . . . . . . . . . . . . . . . . . . . . . . . .85.34 144.1.3 Brain retention . . . . . . . . . . . . . . . . . . . . . . . . . . . . . . . . . . . . . . . . . . . . . . . .78.80 124.2 Lifestyle . . . . . . . . . . . . . . . . . . . . . . . . . . . . . . . . . . . . . . . . . . . . . . . . . . . . 85.42 54.2.1 Environmental performance . . . . . . . . . . . . . . . . . . . . . . . . . . . . . . . . . .88.48 54.2.2 Personal safety . . . . . . . . . . . . . . . . . . . . . . . . . . . . . . . . . . . . . . . . . . . . . . . . 87.08 124.2.3 Physician density . . . . . . . . . . . . . . . . . . . . . . . . . . . . . . . . . . . . . . . . . . . . . .66.85 94.2.4 Sanitation . . . . . . . . . . . . . . . . . . . . . . . . . . . . . . . . . . . . . . . . . . . . . . . . . . . . .99.25 26
5 VOCATIONAL AND TECHNICAL SKILLS . . . . . . . . . . . . .71.77 75.1 Mid-Level Skills . . . . . . . . . . . . . . . . . . . . . . . . . . . . . . . . . . . . . . . . . . . . . 65.22 125.1.1 Workforce with secondary education . . . . . . . . . . . . . . . . . . . . . . . . .58.62 415.1.2 Population with secondary education . . . . . . . . . . . . . . . . . . . . . . . .59.58 315.1.3 Technicians and associate professionals . . . . . . . . . . . . . . . . . . . . . . . 81.09 85.1.4 Labour productivity per employee . . . . . . . . . . . . . . . . . . . . . . . . . . . . 61.60 125.2 Employability . . . . . . . . . . . . . . . . . . . . . . . . . . . . . . . . . . . . . . . . . . . . . . . 78.31 105.2.1 Ease of finding skilled employees . . . . . . . . . . . . . . . . . . . . . . . . . . . . .78.71 165.2.2 Relevance of education system to the economy . . . . . . . . . . . . . .73.21 145.2.3 Skills matching with secondary education . . . . . . . . . . . . . . . . . . . .76.38 95.2.4 Skills matching with tertiary education . . . . . . . . . . . . . . . . . . . . . . . .84.96 7
6 GLOBAL KNOWLEDGE SKILLS . . . . . . . . . . . . . . . . . . . . 63.99 56.1 High-Level Skills . . . . . . . . . . . . . . . . . . . . . . . . . . . . . . . . . . . . . . . . . . . . 65.58 76.1.1 Workforce with tertiary education . . . . . . . . . . . . . . . . . . . . . . . . . . . . 61.91 166.1.2 Population with tertiary education . . . . . . . . . . . . . . . . . . . . . . . . . . . . 51.18 276.1.3 Professionals . . . . . . . . . . . . . . . . . . . . . . . . . . . . . . . . . . . . . . . . . . . . . . . . . .75.63 26.1.4 Researchers . . . . . . . . . . . . . . . . . . . . . . . . . . . . . . . . . . . . . . . . . . . . . . . . . . .92.01 36.1.5 Senior officials and managers . . . . . . . . . . . . . . . . . . . . . . . . . . . . . . . . . 37.33 386.1.6 Availability of scientists and engineers . . . . . . . . . . . . . . . . . . . . . . . .75.38 156.2 Talent Impact . . . . . . . . . . . . . . . . . . . . . . . . . . . . . . . . . . . . . . . . . . . . . . . 62.40 76.2.1 Innovation output . . . . . . . . . . . . . . . . . . . . . . . . . . . . . . . . . . . . . . . . . . . .88.44 36.2.2 High-value exports . . . . . . . . . . . . . . . . . . . . . . . . . . . . . . . . . . . . . . . . . . . . 37.16 306.2.3 New product entrepreneurial activity . . . . . . . . . . . . . . . . . . . . . . . . . 67.83 136.2.4 New business density . . . . . . . . . . . . . . . . . . . . . . . . . . . . . . . . . . . . . . . . .38.95 186.2.5 Scientific journal articles . . . . . . . . . . . . . . . . . . . . . . . . . . . . . . . . . . . . . .79.62 5
l Sweden l Income group average
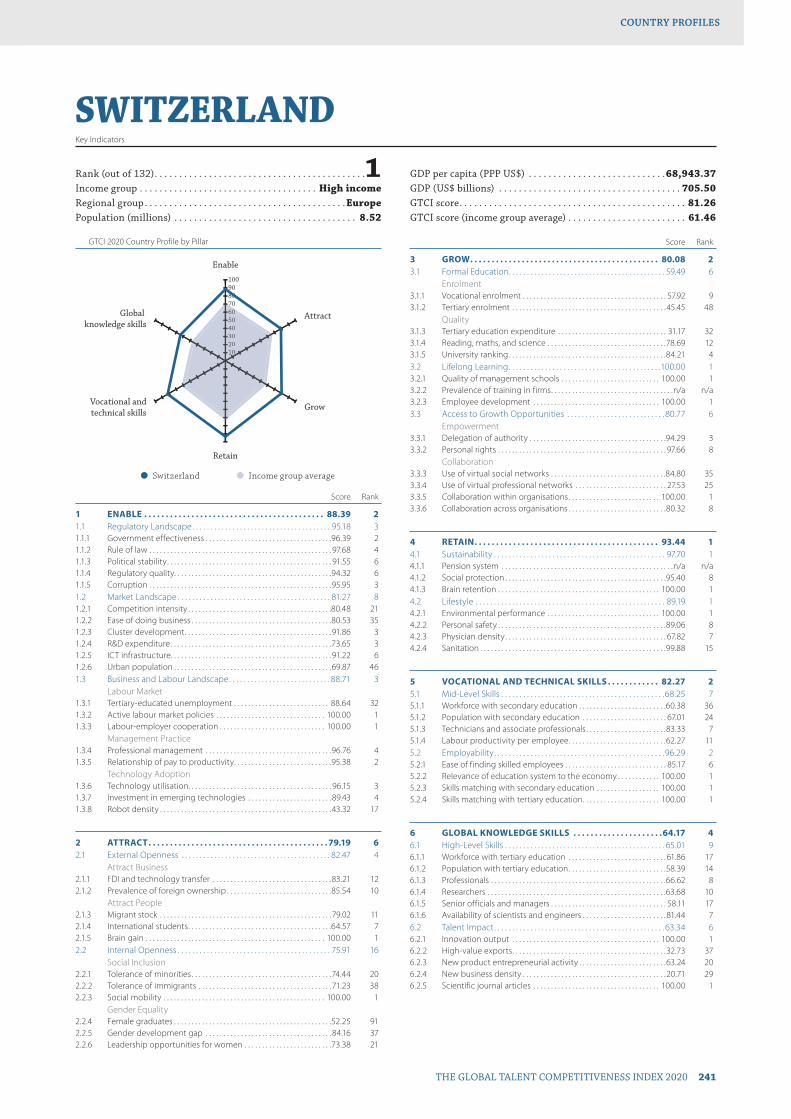
GTCI 2020 Country Profile by Pillar
THE GLOBAL TALENT COMPETITIVENESS INDEX 2020 241
COUNTRY PROFILESCOUNTRY PROFILES
102030405060708090100
Global knowledge skills
Vocational andtechnical skills
Retain
Grow
Attract
Enable
102030405060607
SWITZERLANDKey Indicators
Rank (out of 132) . . . . . . . . . . . . . . . . . . . . . . . . . . . . . . . . . . . . . . . . . . .1Income group . . . . . . . . . . . . . . . . . . . . . . . . . . . . . . . . . . . . High incomeRegional group . . . . . . . . . . . . . . . . . . . . . . . . . . . . . . . . . . . . . . . . .EuropePopulation (millions) . . . . . . . . . . . . . . . . . . . . . . . . . . . . . . . . . . . . . 8.52
GDP per capita (PPP US$) . . . . . . . . . . . . . . . . . . . . . . . . . . . .68,943.37GDP (US$ billions) . . . . . . . . . . . . . . . . . . . . . . . . . . . . . . . . . . . . . 705.50GTCI score . . . . . . . . . . . . . . . . . . . . . . . . . . . . . . . . . . . . . . . . . . . . . . 81.26GTCI score (income group average) . . . . . . . . . . . . . . . . . . . . . . . . 61.46
Score Rank
1 ENABLE . . . . . . . . . . . . . . . . . . . . . . . . . . . . . . . . . . . . . . . . . . 88.39 21.1 Regulatory Landscape . . . . . . . . . . . . . . . . . . . . . . . . . . . . . . . . . . . . . . 95.18 31.1.1 Government effectiveness . . . . . . . . . . . . . . . . . . . . . . . . . . . . . . . . . . . .96.39 21.1.2 Rule of law . . . . . . . . . . . . . . . . . . . . . . . . . . . . . . . . . . . . . . . . . . . . . . . . . . . . 97.68 41.1.3 Political stability . . . . . . . . . . . . . . . . . . . . . . . . . . . . . . . . . . . . . . . . . . . . . . . 91.55 61.1.4 Regulatory quality. . . . . . . . . . . . . . . . . . . . . . . . . . . . . . . . . . . . . . . . . . . . .94.32 61.1.5 Corruption . . . . . . . . . . . . . . . . . . . . . . . . . . . . . . . . . . . . . . . . . . . . . . . . . . . .95.95 31.2 Market Landscape . . . . . . . . . . . . . . . . . . . . . . . . . . . . . . . . . . . . . . . . . . 81.27 81.2.1 Competition intensity . . . . . . . . . . . . . . . . . . . . . . . . . . . . . . . . . . . . . . . . .80.48 211.2.2 Ease of doing business . . . . . . . . . . . . . . . . . . . . . . . . . . . . . . . . . . . . . . . .80.53 351.2.3 Cluster development . . . . . . . . . . . . . . . . . . . . . . . . . . . . . . . . . . . . . . . . . .91.86 31.2.4 R&D expenditure . . . . . . . . . . . . . . . . . . . . . . . . . . . . . . . . . . . . . . . . . . . . . .73.65 31.2.5 ICT infrastructure. . . . . . . . . . . . . . . . . . . . . . . . . . . . . . . . . . . . . . . . . . . . . . 91.22 61.2.6 Urban population . . . . . . . . . . . . . . . . . . . . . . . . . . . . . . . . . . . . . . . . . . . . .69.87 461.3 Business and Labour Landscape . . . . . . . . . . . . . . . . . . . . . . . . . . . . 88.71 3
Labour Market1.3.1 Tertiary-educated unemployment . . . . . . . . . . . . . . . . . . . . . . . . . . . 88.64 321.3.2 Active labour market policies . . . . . . . . . . . . . . . . . . . . . . . . . . . . . . . 100.00 11.3.3 Labour-employer cooperation . . . . . . . . . . . . . . . . . . . . . . . . . . . . . . 100.00 1
Management Practice1.3.4 Professional management . . . . . . . . . . . . . . . . . . . . . . . . . . . . . . . . . . . .96.76 41.3.5 Relationship of pay to productivity . . . . . . . . . . . . . . . . . . . . . . . . . . . .95.38 2
Technology Adoption1.3.6 Technology utilisation. . . . . . . . . . . . . . . . . . . . . . . . . . . . . . . . . . . . . . . . . 96.15 31.3.7 Investment in emerging technologies . . . . . . . . . . . . . . . . . . . . . . . . 89.43 41.3.8 Robot density . . . . . . . . . . . . . . . . . . . . . . . . . . . . . . . . . . . . . . . . . . . . . . . . .43.32 17
2 ATTRACT . . . . . . . . . . . . . . . . . . . . . . . . . . . . . . . . . . . . . . . . . . 79.19 62.1 External Openness . . . . . . . . . . . . . . . . . . . . . . . . . . . . . . . . . . . . . . . . . 82.47 4
Attract Business2.1.1 FDI and technology transfer . . . . . . . . . . . . . . . . . . . . . . . . . . . . . . . . . .83.21 122.1.2 Prevalence of foreign ownership . . . . . . . . . . . . . . . . . . . . . . . . . . . . . .85.54 10
Attract People2.1.3 Migrant stock . . . . . . . . . . . . . . . . . . . . . . . . . . . . . . . . . . . . . . . . . . . . . . . . . 79.02 112.1.4 International students . . . . . . . . . . . . . . . . . . . . . . . . . . . . . . . . . . . . . . . . .64.57 72.1.5 Brain gain . . . . . . . . . . . . . . . . . . . . . . . . . . . . . . . . . . . . . . . . . . . . . . . . . . . 100.00 12.2 Internal Openness . . . . . . . . . . . . . . . . . . . . . . . . . . . . . . . . . . . . . . . . . . 75.91 16
Social Inclusion2.2.1 Tolerance of minorities . . . . . . . . . . . . . . . . . . . . . . . . . . . . . . . . . . . . . . . .74.44 202.2.2 Tolerance of immigrants . . . . . . . . . . . . . . . . . . . . . . . . . . . . . . . . . . . . . .71.23 382.2.3 Social mobility . . . . . . . . . . . . . . . . . . . . . . . . . . . . . . . . . . . . . . . . . . . . . . 100.00 1
Gender Equality2.2.4 Female graduates . . . . . . . . . . . . . . . . . . . . . . . . . . . . . . . . . . . . . . . . . . . . .52.25 912.2.5 Gender development gap . . . . . . . . . . . . . . . . . . . . . . . . . . . . . . . . . . . . 84.16 372.2.6 Leadership opportunities for women . . . . . . . . . . . . . . . . . . . . . . . . .73.38 21
Score Rank
3 GROW . . . . . . . . . . . . . . . . . . . . . . . . . . . . . . . . . . . . . . . . . . . . 80.08 23.1 Formal Education . . . . . . . . . . . . . . . . . . . . . . . . . . . . . . . . . . . . . . . . . . . 59.49 6
Enrolment3.1.1 Vocational enrolment . . . . . . . . . . . . . . . . . . . . . . . . . . . . . . . . . . . . . . . . . 57.92 93.1.2 Tertiary enrolment . . . . . . . . . . . . . . . . . . . . . . . . . . . . . . . . . . . . . . . . . . . . 45.45 48
Quality3.1.3 Tertiary education expenditure . . . . . . . . . . . . . . . . . . . . . . . . . . . . . . . 31.17 323.1.4 Reading, maths, and science . . . . . . . . . . . . . . . . . . . . . . . . . . . . . . . . . .78.69 123.1.5 University ranking . . . . . . . . . . . . . . . . . . . . . . . . . . . . . . . . . . . . . . . . . . . . .84.21 43.2 Lifelong Learning . . . . . . . . . . . . . . . . . . . . . . . . . . . . . . . . . . . . . . . . . .100.00 13.2.1 Quality of management schools . . . . . . . . . . . . . . . . . . . . . . . . . . . . 100.00 13.2.2 Prevalence of training in firms . . . . . . . . . . . . . . . . . . . . . . . . . . . . . . . . . . .n/a n/a3.2.3 Employee development . . . . . . . . . . . . . . . . . . . . . . . . . . . . . . . . . . . . 100.00 13.3 Access to Growth Opportunities . . . . . . . . . . . . . . . . . . . . . . . . . . . 80.77 6
Empowerment3.3.1 Delegation of authority . . . . . . . . . . . . . . . . . . . . . . . . . . . . . . . . . . . . . . .94.29 33.3.2 Personal rights . . . . . . . . . . . . . . . . . . . . . . . . . . . . . . . . . . . . . . . . . . . . . . . . 97.66 8
Collaboration3.3.3 Use of virtual social networks . . . . . . . . . . . . . . . . . . . . . . . . . . . . . . . . .84.80 353.3.4 Use of virtual professional networks . . . . . . . . . . . . . . . . . . . . . . . . . . 27.53 253.3.5 Collaboration within organisations . . . . . . . . . . . . . . . . . . . . . . . . . . 100.00 13.3.6 Collaboration across organisations . . . . . . . . . . . . . . . . . . . . . . . . . . . .80.32 8
4 RETAIN . . . . . . . . . . . . . . . . . . . . . . . . . . . . . . . . . . . . . . . . . . . 93.44 14.1 Sustainability . . . . . . . . . . . . . . . . . . . . . . . . . . . . . . . . . . . . . . . . . . . . . . . 97.70 14.1.1 Pension system . . . . . . . . . . . . . . . . . . . . . . . . . . . . . . . . . . . . . . . . . . . . . . . . .n/a n/a4.1.2 Social protection . . . . . . . . . . . . . . . . . . . . . . . . . . . . . . . . . . . . . . . . . . . . . .95.40 84.1.3 Brain retention . . . . . . . . . . . . . . . . . . . . . . . . . . . . . . . . . . . . . . . . . . . . . . 100.00 14.2 Lifestyle . . . . . . . . . . . . . . . . . . . . . . . . . . . . . . . . . . . . . . . . . . . . . . . . . . . . 89.19 14.2.1 Environmental performance . . . . . . . . . . . . . . . . . . . . . . . . . . . . . . . . 100.00 14.2.2 Personal safety . . . . . . . . . . . . . . . . . . . . . . . . . . . . . . . . . . . . . . . . . . . . . . . .89.06 84.2.3 Physician density . . . . . . . . . . . . . . . . . . . . . . . . . . . . . . . . . . . . . . . . . . . . . . 67.82 74.2.4 Sanitation . . . . . . . . . . . . . . . . . . . . . . . . . . . . . . . . . . . . . . . . . . . . . . . . . . . . .99.88 15
5 VOCATIONAL AND TECHNICAL SKILLS . . . . . . . . . . . . 82.27 25.1 Mid-Level Skills . . . . . . . . . . . . . . . . . . . . . . . . . . . . . . . . . . . . . . . . . . . . .68.25 75.1.1 Workforce with secondary education . . . . . . . . . . . . . . . . . . . . . . . . .60.38 365.1.2 Population with secondary education . . . . . . . . . . . . . . . . . . . . . . . . 67.01 245.1.3 Technicians and associate professionals . . . . . . . . . . . . . . . . . . . . . . .83.33 75.1.4 Labour productivity per employee . . . . . . . . . . . . . . . . . . . . . . . . . . . .62.27 115.2 Employability . . . . . . . . . . . . . . . . . . . . . . . . . . . . . . . . . . . . . . . . . . . . . . .96.29 25.2.1 Ease of finding skilled employees . . . . . . . . . . . . . . . . . . . . . . . . . . . . . 85.17 65.2.2 Relevance of education system to the economy . . . . . . . . . . . . 100.00 15.2.3 Skills matching with secondary education . . . . . . . . . . . . . . . . . . 100.00 15.2.4 Skills matching with tertiary education . . . . . . . . . . . . . . . . . . . . . . 100.00 1
6 GLOBAL KNOWLEDGE SKILLS . . . . . . . . . . . . . . . . . . . . .64.17 46.1 High-Level Skills . . . . . . . . . . . . . . . . . . . . . . . . . . . . . . . . . . . . . . . . . . . . 65.01 96.1.1 Workforce with tertiary education . . . . . . . . . . . . . . . . . . . . . . . . . . . . 61.86 176.1.2 Population with tertiary education . . . . . . . . . . . . . . . . . . . . . . . . . . . .58.39 146.1.3 Professionals . . . . . . . . . . . . . . . . . . . . . . . . . . . . . . . . . . . . . . . . . . . . . . . . . .66.62 86.1.4 Researchers . . . . . . . . . . . . . . . . . . . . . . . . . . . . . . . . . . . . . . . . . . . . . . . . . . .63.68 106.1.5 Senior officials and managers . . . . . . . . . . . . . . . . . . . . . . . . . . . . . . . . . 58.11 176.1.6 Availability of scientists and engineers . . . . . . . . . . . . . . . . . . . . . . . .81.44 76.2 Talent Impact . . . . . . . . . . . . . . . . . . . . . . . . . . . . . . . . . . . . . . . . . . . . . . . 63.34 66.2.1 Innovation output . . . . . . . . . . . . . . . . . . . . . . . . . . . . . . . . . . . . . . . . . . 100.00 16.2.2 High-value exports . . . . . . . . . . . . . . . . . . . . . . . . . . . . . . . . . . . . . . . . . . . .32.73 376.2.3 New product entrepreneurial activity . . . . . . . . . . . . . . . . . . . . . . . . .63.24 206.2.4 New business density . . . . . . . . . . . . . . . . . . . . . . . . . . . . . . . . . . . . . . . . .20.71 296.2.5 Scientific journal articles . . . . . . . . . . . . . . . . . . . . . . . . . . . . . . . . . . . . 100.00 1
l Switzerland l Income group average
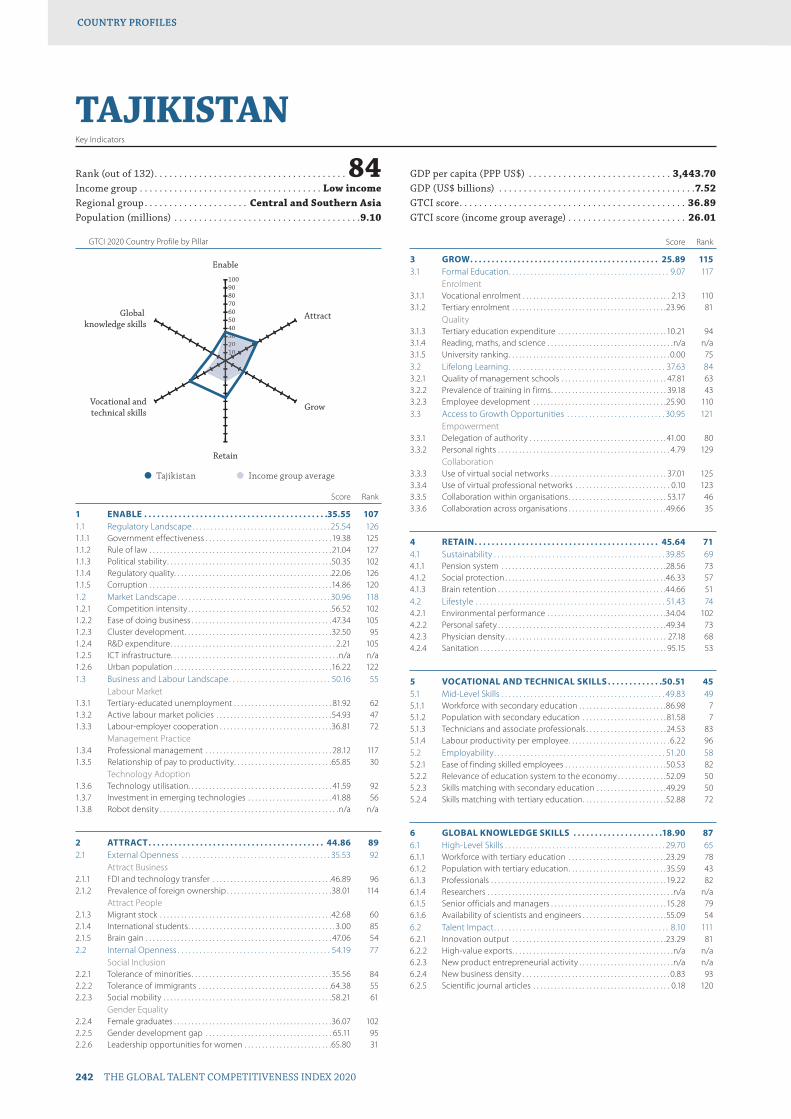
GTCI 2020 Country Profile by Pillar
242 THE GLOBAL TALENT COMPETITIVENESS INDEX 2020
COUNTRY PROFILESCOUNTRY PROFILES
102030405060708090100
Global knowledge skills
Vocational andtechnical skills
Retain
Grow
Attract
Enable
1020330
TAJIKISTANKey Indicators
Rank (out of 132) . . . . . . . . . . . . . . . . . . . . . . . . . . . . . . . . . . . . . . . 84Income group . . . . . . . . . . . . . . . . . . . . . . . . . . . . . . . . . . . . . Low incomeRegional group . . . . . . . . . . . . . . . . . . . . . Central and Southern AsiaPopulation (millions) . . . . . . . . . . . . . . . . . . . . . . . . . . . . . . . . . . . . . .9.10
GDP per capita (PPP US$) . . . . . . . . . . . . . . . . . . . . . . . . . . . . . 3,443.70GDP (US$ billions) . . . . . . . . . . . . . . . . . . . . . . . . . . . . . . . . . . . . . . . .7.52GTCI score . . . . . . . . . . . . . . . . . . . . . . . . . . . . . . . . . . . . . . . . . . . . . . 36.89GTCI score (income group average) . . . . . . . . . . . . . . . . . . . . . . . . 26.01
Score Rank
1 ENABLE . . . . . . . . . . . . . . . . . . . . . . . . . . . . . . . . . . . . . . . . . . .35.55 1071.1 Regulatory Landscape . . . . . . . . . . . . . . . . . . . . . . . . . . . . . . . . . . . . . . 25.54 1261.1.1 Government effectiveness . . . . . . . . . . . . . . . . . . . . . . . . . . . . . . . . . . . . 19.38 1251.1.2 Rule of law . . . . . . . . . . . . . . . . . . . . . . . . . . . . . . . . . . . . . . . . . . . . . . . . . . . . 21.04 1271.1.3 Political stability . . . . . . . . . . . . . . . . . . . . . . . . . . . . . . . . . . . . . . . . . . . . . . .50.35 1021.1.4 Regulatory quality. . . . . . . . . . . . . . . . . . . . . . . . . . . . . . . . . . . . . . . . . . . . .22.06 1261.1.5 Corruption . . . . . . . . . . . . . . . . . . . . . . . . . . . . . . . . . . . . . . . . . . . . . . . . . . . .14.86 1201.2 Market Landscape . . . . . . . . . . . . . . . . . . . . . . . . . . . . . . . . . . . . . . . . . . 30.96 1181.2.1 Competition intensity . . . . . . . . . . . . . . . . . . . . . . . . . . . . . . . . . . . . . . . . .56.52 1021.2.2 Ease of doing business . . . . . . . . . . . . . . . . . . . . . . . . . . . . . . . . . . . . . . . . 47.34 1051.2.3 Cluster development . . . . . . . . . . . . . . . . . . . . . . . . . . . . . . . . . . . . . . . . . .32.50 951.2.4 R&D expenditure . . . . . . . . . . . . . . . . . . . . . . . . . . . . . . . . . . . . . . . . . . . . . . . 2.21 1051.2.5 ICT infrastructure. . . . . . . . . . . . . . . . . . . . . . . . . . . . . . . . . . . . . . . . . . . . . . . .n/a n/a1.2.6 Urban population . . . . . . . . . . . . . . . . . . . . . . . . . . . . . . . . . . . . . . . . . . . . .16.22 1221.3 Business and Labour Landscape . . . . . . . . . . . . . . . . . . . . . . . . . . . . 50.16 55
Labour Market1.3.1 Tertiary-educated unemployment . . . . . . . . . . . . . . . . . . . . . . . . . . . . 81.92 621.3.2 Active labour market policies . . . . . . . . . . . . . . . . . . . . . . . . . . . . . . . . .54.93 471.3.3 Labour-employer cooperation . . . . . . . . . . . . . . . . . . . . . . . . . . . . . . . .36.81 72
Management Practice1.3.4 Professional management . . . . . . . . . . . . . . . . . . . . . . . . . . . . . . . . . . . . 28.12 1171.3.5 Relationship of pay to productivity . . . . . . . . . . . . . . . . . . . . . . . . . . . .65.85 30
Technology Adoption1.3.6 Technology utilisation. . . . . . . . . . . . . . . . . . . . . . . . . . . . . . . . . . . . . . . . . 41.59 921.3.7 Investment in emerging technologies . . . . . . . . . . . . . . . . . . . . . . . . 41.88 561.3.8 Robot density . . . . . . . . . . . . . . . . . . . . . . . . . . . . . . . . . . . . . . . . . . . . . . . . . . .n/a n/a
2 ATTRACT . . . . . . . . . . . . . . . . . . . . . . . . . . . . . . . . . . . . . . . . . 44.86 892.1 External Openness . . . . . . . . . . . . . . . . . . . . . . . . . . . . . . . . . . . . . . . . . 35.53 92
Attract Business2.1.1 FDI and technology transfer . . . . . . . . . . . . . . . . . . . . . . . . . . . . . . . . . .46.89 962.1.2 Prevalence of foreign ownership . . . . . . . . . . . . . . . . . . . . . . . . . . . . . .38.01 114
Attract People2.1.3 Migrant stock . . . . . . . . . . . . . . . . . . . . . . . . . . . . . . . . . . . . . . . . . . . . . . . . .42.68 602.1.4 International students . . . . . . . . . . . . . . . . . . . . . . . . . . . . . . . . . . . . . . . . . . 3.00 852.1.5 Brain gain . . . . . . . . . . . . . . . . . . . . . . . . . . . . . . . . . . . . . . . . . . . . . . . . . . . . . 47.06 542.2 Internal Openness . . . . . . . . . . . . . . . . . . . . . . . . . . . . . . . . . . . . . . . . . . 54.19 77
Social Inclusion2.2.1 Tolerance of minorities . . . . . . . . . . . . . . . . . . . . . . . . . . . . . . . . . . . . . . . .35.56 842.2.2 Tolerance of immigrants . . . . . . . . . . . . . . . . . . . . . . . . . . . . . . . . . . . . . .64.38 552.2.3 Social mobility . . . . . . . . . . . . . . . . . . . . . . . . . . . . . . . . . . . . . . . . . . . . . . . .58.21 61
Gender Equality2.2.4 Female graduates . . . . . . . . . . . . . . . . . . . . . . . . . . . . . . . . . . . . . . . . . . . . .36.07 1022.2.5 Gender development gap . . . . . . . . . . . . . . . . . . . . . . . . . . . . . . . . . . . . 65.11 952.2.6 Leadership opportunities for women . . . . . . . . . . . . . . . . . . . . . . . . .65.80 31
Score Rank
3 GROW . . . . . . . . . . . . . . . . . . . . . . . . . . . . . . . . . . . . . . . . . . . . 25.89 1153.1 Formal Education . . . . . . . . . . . . . . . . . . . . . . . . . . . . . . . . . . . . . . . . . . . . 9.07 117
Enrolment3.1.1 Vocational enrolment . . . . . . . . . . . . . . . . . . . . . . . . . . . . . . . . . . . . . . . . . . 2.13 1103.1.2 Tertiary enrolment . . . . . . . . . . . . . . . . . . . . . . . . . . . . . . . . . . . . . . . . . . . .23.96 81
Quality3.1.3 Tertiary education expenditure . . . . . . . . . . . . . . . . . . . . . . . . . . . . . . . 10.21 943.1.4 Reading, maths, and science . . . . . . . . . . . . . . . . . . . . . . . . . . . . . . . . . . . .n/a n/a3.1.5 University ranking . . . . . . . . . . . . . . . . . . . . . . . . . . . . . . . . . . . . . . . . . . . . . . 0.00 753.2 Lifelong Learning . . . . . . . . . . . . . . . . . . . . . . . . . . . . . . . . . . . . . . . . . . . 37.63 843.2.1 Quality of management schools . . . . . . . . . . . . . . . . . . . . . . . . . . . . . . 47.81 633.2.2 Prevalence of training in firms . . . . . . . . . . . . . . . . . . . . . . . . . . . . . . . . . 39.18 433.2.3 Employee development . . . . . . . . . . . . . . . . . . . . . . . . . . . . . . . . . . . . . .25.90 1103.3 Access to Growth Opportunities . . . . . . . . . . . . . . . . . . . . . . . . . . . 30.95 121
Empowerment3.3.1 Delegation of authority . . . . . . . . . . . . . . . . . . . . . . . . . . . . . . . . . . . . . . . 41.00 803.3.2 Personal rights . . . . . . . . . . . . . . . . . . . . . . . . . . . . . . . . . . . . . . . . . . . . . . . . . 4.79 129
Collaboration3.3.3 Use of virtual social networks . . . . . . . . . . . . . . . . . . . . . . . . . . . . . . . . . 37.01 1253.3.4 Use of virtual professional networks . . . . . . . . . . . . . . . . . . . . . . . . . . . 0.10 1233.3.5 Collaboration within organisations . . . . . . . . . . . . . . . . . . . . . . . . . . . . 53.17 463.3.6 Collaboration across organisations . . . . . . . . . . . . . . . . . . . . . . . . . . . .49.66 35
4 RETAIN . . . . . . . . . . . . . . . . . . . . . . . . . . . . . . . . . . . . . . . . . . . 45.64 714.1 Sustainability . . . . . . . . . . . . . . . . . . . . . . . . . . . . . . . . . . . . . . . . . . . . . . . 39.85 694.1.1 Pension system . . . . . . . . . . . . . . . . . . . . . . . . . . . . . . . . . . . . . . . . . . . . . . .28.56 734.1.2 Social protection . . . . . . . . . . . . . . . . . . . . . . . . . . . . . . . . . . . . . . . . . . . . . .46.33 574.1.3 Brain retention . . . . . . . . . . . . . . . . . . . . . . . . . . . . . . . . . . . . . . . . . . . . . . . .44.66 514.2 Lifestyle . . . . . . . . . . . . . . . . . . . . . . . . . . . . . . . . . . . . . . . . . . . . . . . . . . . . 51.43 744.2.1 Environmental performance . . . . . . . . . . . . . . . . . . . . . . . . . . . . . . . . . .34.04 1024.2.2 Personal safety . . . . . . . . . . . . . . . . . . . . . . . . . . . . . . . . . . . . . . . . . . . . . . . .49.34 734.2.3 Physician density . . . . . . . . . . . . . . . . . . . . . . . . . . . . . . . . . . . . . . . . . . . . . . 27.18 684.2.4 Sanitation . . . . . . . . . . . . . . . . . . . . . . . . . . . . . . . . . . . . . . . . . . . . . . . . . . . . . 95.15 53
5 VOCATIONAL AND TECHNICAL SKILLS . . . . . . . . . . . . .50.51 455.1 Mid-Level Skills . . . . . . . . . . . . . . . . . . . . . . . . . . . . . . . . . . . . . . . . . . . . . 49.83 495.1.1 Workforce with secondary education . . . . . . . . . . . . . . . . . . . . . . . . .86.98 75.1.2 Population with secondary education . . . . . . . . . . . . . . . . . . . . . . . . 81.58 75.1.3 Technicians and associate professionals . . . . . . . . . . . . . . . . . . . . . . .24.53 835.1.4 Labour productivity per employee . . . . . . . . . . . . . . . . . . . . . . . . . . . . . 6.22 965.2 Employability . . . . . . . . . . . . . . . . . . . . . . . . . . . . . . . . . . . . . . . . . . . . . . . 51.20 585.2.1 Ease of finding skilled employees . . . . . . . . . . . . . . . . . . . . . . . . . . . . .50.53 825.2.2 Relevance of education system to the economy . . . . . . . . . . . . . .52.09 505.2.3 Skills matching with secondary education . . . . . . . . . . . . . . . . . . . .49.29 505.2.4 Skills matching with tertiary education . . . . . . . . . . . . . . . . . . . . . . . .52.88 72
6 GLOBAL KNOWLEDGE SKILLS . . . . . . . . . . . . . . . . . . . . .18.90 876.1 High-Level Skills . . . . . . . . . . . . . . . . . . . . . . . . . . . . . . . . . . . . . . . . . . . . 29.70 656.1.1 Workforce with tertiary education . . . . . . . . . . . . . . . . . . . . . . . . . . . .23.29 786.1.2 Population with tertiary education . . . . . . . . . . . . . . . . . . . . . . . . . . . .35.59 436.1.3 Professionals . . . . . . . . . . . . . . . . . . . . . . . . . . . . . . . . . . . . . . . . . . . . . . . . . . 19.22 826.1.4 Researchers . . . . . . . . . . . . . . . . . . . . . . . . . . . . . . . . . . . . . . . . . . . . . . . . . . . . .n/a n/a6.1.5 Senior officials and managers . . . . . . . . . . . . . . . . . . . . . . . . . . . . . . . . . 15.28 796.1.6 Availability of scientists and engineers . . . . . . . . . . . . . . . . . . . . . . . .55.09 546.2 Talent Impact . . . . . . . . . . . . . . . . . . . . . . . . . . . . . . . . . . . . . . . . . . . . . . . . 8.10 1116.2.1 Innovation output . . . . . . . . . . . . . . . . . . . . . . . . . . . . . . . . . . . . . . . . . . . .23.29 816.2.2 High-value exports . . . . . . . . . . . . . . . . . . . . . . . . . . . . . . . . . . . . . . . . . . . . . .n/a n/a6.2.3 New product entrepreneurial activity . . . . . . . . . . . . . . . . . . . . . . . . . . .n/a n/a6.2.4 New business density . . . . . . . . . . . . . . . . . . . . . . . . . . . . . . . . . . . . . . . . . . 0.83 936.2.5 Scientific journal articles . . . . . . . . . . . . . . . . . . . . . . . . . . . . . . . . . . . . . . . 0.18 120
l Tajikistan l Income group average

GTCI 2020 Country Profile by Pillar
THE GLOBAL TALENT COMPETITIVENESS INDEX 2020 243
COUNTRY PROFILESCOUNTRY PROFILES
102030405060708090100
Global knowledge skills
Vocational andtechnical skills
Retain
Grow
Attract
Enable
1020330
TANZANIA, UNITED REP.Key Indicators
Rank (out of 132) . . . . . . . . . . . . . . . . . . . . . . . . . . . . . . . . . . . . 111Income group . . . . . . . . . . . . . . . . . . . . . . . . . . . . . . . . . . . . . Low incomeRegional group . . . . . . . . . . . . . . . . . . . . . . . . . . . . Sub-Saharan AfricaPopulation (millions) . . . . . . . . . . . . . . . . . . . . . . . . . . . . . . . . . . . . 56.32
GDP per capita (PPP US$) . . . . . . . . . . . . . . . . . . . . . . . . . . . . . 3,227.03GDP (US$ billions) . . . . . . . . . . . . . . . . . . . . . . . . . . . . . . . . . . . . . . 57.44GTCI score . . . . . . . . . . . . . . . . . . . . . . . . . . . . . . . . . . . . . . . . . . . . . . 29.40GTCI score (income group average) . . . . . . . . . . . . . . . . . . . . . . . . 26.01
Score Rank
1 ENABLE . . . . . . . . . . . . . . . . . . . . . . . . . . . . . . . . . . . . . . . . . . 38.28 991.1 Regulatory Landscape . . . . . . . . . . . . . . . . . . . . . . . . . . . . . . . . . . . . . . 37.86 991.1.1 Government effectiveness . . . . . . . . . . . . . . . . . . . . . . . . . . . . . . . . . . . . 31.28 1071.1.2 Rule of law . . . . . . . . . . . . . . . . . . . . . . . . . . . . . . . . . . . . . . . . . . . . . . . . . . . .42.23 951.1.3 Political stability . . . . . . . . . . . . . . . . . . . . . . . . . . . . . . . . . . . . . . . . . . . . . . .52.21 981.1.4 Regulatory quality. . . . . . . . . . . . . . . . . . . . . . . . . . . . . . . . . . . . . . . . . . . . .33.87 1081.1.5 Corruption . . . . . . . . . . . . . . . . . . . . . . . . . . . . . . . . . . . . . . . . . . . . . . . . . . . .29.73 811.2 Market Landscape . . . . . . . . . . . . . . . . . . . . . . . . . . . . . . . . . . . . . . . . . . 31.24 1171.2.1 Competition intensity . . . . . . . . . . . . . . . . . . . . . . . . . . . . . . . . . . . . . . . . .53.42 1091.2.2 Ease of doing business . . . . . . . . . . . . . . . . . . . . . . . . . . . . . . . . . . . . . . . . 41.12 1141.2.3 Cluster development . . . . . . . . . . . . . . . . . . . . . . . . . . . . . . . . . . . . . . . . . . 47.10 521.2.4 R&D expenditure . . . . . . . . . . . . . . . . . . . . . . . . . . . . . . . . . . . . . . . . . . . . . . 11.28 601.2.5 ICT infrastructure. . . . . . . . . . . . . . . . . . . . . . . . . . . . . . . . . . . . . . . . . . . . . .10.69 1221.2.6 Urban population . . . . . . . . . . . . . . . . . . . . . . . . . . . . . . . . . . . . . . . . . . . . .23.85 1181.3 Business and Labour Landscape . . . . . . . . . . . . . . . . . . . . . . . . . . . . 45.73 68
Labour Market1.3.1 Tertiary-educated unemployment . . . . . . . . . . . . . . . . . . . . . . . . . . . .83.59 531.3.2 Active labour market policies . . . . . . . . . . . . . . . . . . . . . . . . . . . . . . . . .39.04 671.3.3 Labour-employer cooperation . . . . . . . . . . . . . . . . . . . . . . . . . . . . . . . .34.34 81
Management Practice1.3.4 Professional management . . . . . . . . . . . . . . . . . . . . . . . . . . . . . . . . . . . .45.65 761.3.5 Relationship of pay to productivity . . . . . . . . . . . . . . . . . . . . . . . . . . . .36.75 98
Technology Adoption1.3.6 Technology utilisation. . . . . . . . . . . . . . . . . . . . . . . . . . . . . . . . . . . . . . . . . 39.07 991.3.7 Investment in emerging technologies . . . . . . . . . . . . . . . . . . . . . . . . 41.64 571.3.8 Robot density . . . . . . . . . . . . . . . . . . . . . . . . . . . . . . . . . . . . . . . . . . . . . . . . . . .n/a n/a
2 ATTRACT . . . . . . . . . . . . . . . . . . . . . . . . . . . . . . . . . . . . . . . . . 46.85 772.1 External Openness . . . . . . . . . . . . . . . . . . . . . . . . . . . . . . . . . . . . . . . . . 40.33 77
Attract Business2.1.1 FDI and technology transfer . . . . . . . . . . . . . . . . . . . . . . . . . . . . . . . . . .48.61 902.1.2 Prevalence of foreign ownership . . . . . . . . . . . . . . . . . . . . . . . . . . . . . . 45.49 101
Attract People2.1.3 Migrant stock . . . . . . . . . . . . . . . . . . . . . . . . . . . . . . . . . . . . . . . . . . . . . . . . .20.93 1002.1.4 International students . . . . . . . . . . . . . . . . . . . . . . . . . . . . . . . . . . . . . . . . . . .n/a n/a2.1.5 Brain gain . . . . . . . . . . . . . . . . . . . . . . . . . . . . . . . . . . . . . . . . . . . . . . . . . . . . .46.30 592.2 Internal Openness . . . . . . . . . . . . . . . . . . . . . . . . . . . . . . . . . . . . . . . . . . 53.37 83
Social Inclusion2.2.1 Tolerance of minorities . . . . . . . . . . . . . . . . . . . . . . . . . . . . . . . . . . . . . . . .55.56 492.2.2 Tolerance of immigrants . . . . . . . . . . . . . . . . . . . . . . . . . . . . . . . . . . . . . . 49.32 832.2.3 Social mobility . . . . . . . . . . . . . . . . . . . . . . . . . . . . . . . . . . . . . . . . . . . . . . . .58.96 58
Gender Equality2.2.4 Female graduates . . . . . . . . . . . . . . . . . . . . . . . . . . . . . . . . . . . . . . . . . . . . . . .n/a n/a2.2.5 Gender development gap . . . . . . . . . . . . . . . . . . . . . . . . . . . . . . . . . . . .63.24 1012.2.6 Leadership opportunities for women . . . . . . . . . . . . . . . . . . . . . . . . .39.77 84
Score Rank
3 GROW . . . . . . . . . . . . . . . . . . . . . . . . . . . . . . . . . . . . . . . . . . . . .28.10 1063.1 Formal Education . . . . . . . . . . . . . . . . . . . . . . . . . . . . . . . . . . . . . . . . . . . . 4.77 124
Enrolment3.1.1 Vocational enrolment . . . . . . . . . . . . . . . . . . . . . . . . . . . . . . . . . . . . . . . . . . 0.59 1163.1.2 Tertiary enrolment . . . . . . . . . . . . . . . . . . . . . . . . . . . . . . . . . . . . . . . . . . . . . 2.50 124
Quality3.1.3 Tertiary education expenditure . . . . . . . . . . . . . . . . . . . . . . . . . . . . . . .16.00 793.1.4 Reading, maths, and science . . . . . . . . . . . . . . . . . . . . . . . . . . . . . . . . . . . .n/a n/a3.1.5 University ranking . . . . . . . . . . . . . . . . . . . . . . . . . . . . . . . . . . . . . . . . . . . . . . 0.00 753.2 Lifelong Learning . . . . . . . . . . . . . . . . . . . . . . . . . . . . . . . . . . . . . . . . . . . 32.56 1073.2.1 Quality of management schools . . . . . . . . . . . . . . . . . . . . . . . . . . . . . . 31.00 1113.2.2 Prevalence of training in firms . . . . . . . . . . . . . . . . . . . . . . . . . . . . . . . . .36.02 503.2.3 Employee development . . . . . . . . . . . . . . . . . . . . . . . . . . . . . . . . . . . . . .30.65 923.3 Access to Growth Opportunities . . . . . . . . . . . . . . . . . . . . . . . . . . . 46.97 66
Empowerment3.3.1 Delegation of authority . . . . . . . . . . . . . . . . . . . . . . . . . . . . . . . . . . . . . . . 42.75 743.3.2 Personal rights . . . . . . . . . . . . . . . . . . . . . . . . . . . . . . . . . . . . . . . . . . . . . . . . 57.70 92
Collaboration3.3.3 Use of virtual social networks . . . . . . . . . . . . . . . . . . . . . . . . . . . . . . . . .46.63 1173.3.4 Use of virtual professional networks . . . . . . . . . . . . . . . . . . . . . . . . . . . .n/a n/a3.3.5 Collaboration within organisations . . . . . . . . . . . . . . . . . . . . . . . . . . . .45.28 743.3.6 Collaboration across organisations . . . . . . . . . . . . . . . . . . . . . . . . . . . .42.52 55
4 RETAIN . . . . . . . . . . . . . . . . . . . . . . . . . . . . . . . . . . . . . . . . . . . .27.96 1114.1 Sustainability . . . . . . . . . . . . . . . . . . . . . . . . . . . . . . . . . . . . . . . . . . . . . . . 29.43 1004.1.1 Pension system . . . . . . . . . . . . . . . . . . . . . . . . . . . . . . . . . . . . . . . . . . . . . . . . 4.30 1074.1.2 Social protection . . . . . . . . . . . . . . . . . . . . . . . . . . . . . . . . . . . . . . . . . . . . . .44.69 634.1.3 Brain retention . . . . . . . . . . . . . . . . . . . . . . . . . . . . . . . . . . . . . . . . . . . . . . . . 39.32 714.2 Lifestyle . . . . . . . . . . . . . . . . . . . . . . . . . . . . . . . . . . . . . . . . . . . . . . . . . . . . 26.48 1114.2.1 Environmental performance . . . . . . . . . . . . . . . . . . . . . . . . . . . . . . . . . . 39.01 964.2.2 Personal safety . . . . . . . . . . . . . . . . . . . . . . . . . . . . . . . . . . . . . . . . . . . . . . . . 49.14 744.2.3 Physician density . . . . . . . . . . . . . . . . . . . . . . . . . . . . . . . . . . . . . . . . . . . . . . . 0.05 1254.2.4 Sanitation . . . . . . . . . . . . . . . . . . . . . . . . . . . . . . . . . . . . . . . . . . . . . . . . . . . . . 17.71 125
5 VOCATIONAL AND TECHNICAL SKILLS . . . . . . . . . . . . 24.80 1225.1 Mid-Level Skills . . . . . . . . . . . . . . . . . . . . . . . . . . . . . . . . . . . . . . . . . . . . . . 3.95 1285.1.1 Workforce with secondary education . . . . . . . . . . . . . . . . . . . . . . . . . . 4.21 1225.1.2 Population with secondary education . . . . . . . . . . . . . . . . . . . . . . . . . 0.73 1145.1.3 Technicians and associate professionals . . . . . . . . . . . . . . . . . . . . . . . . 8.17 1145.1.4 Labour productivity per employee . . . . . . . . . . . . . . . . . . . . . . . . . . . . . 2.68 1035.2 Employability . . . . . . . . . . . . . . . . . . . . . . . . . . . . . . . . . . . . . . . . . . . . . . . 45.65 765.2.1 Ease of finding skilled employees . . . . . . . . . . . . . . . . . . . . . . . . . . . . .52.84 735.2.2 Relevance of education system to the economy . . . . . . . . . . . . . .42.49 695.2.3 Skills matching with secondary education . . . . . . . . . . . . . . . . . . . .35.02 835.2.4 Skills matching with tertiary education . . . . . . . . . . . . . . . . . . . . . . . .52.26 73
6 GLOBAL KNOWLEDGE SKILLS . . . . . . . . . . . . . . . . . . . . .10.39 1186.1 High-Level Skills . . . . . . . . . . . . . . . . . . . . . . . . . . . . . . . . . . . . . . . . . . . . . 9.32 1236.1.1 Workforce with tertiary education . . . . . . . . . . . . . . . . . . . . . . . . . . . . . 0.73 1256.1.2 Population with tertiary education . . . . . . . . . . . . . . . . . . . . . . . . . . . . . 1.37 1056.1.3 Professionals . . . . . . . . . . . . . . . . . . . . . . . . . . . . . . . . . . . . . . . . . . . . . . . . . . . 1.27 1266.1.4 Researchers . . . . . . . . . . . . . . . . . . . . . . . . . . . . . . . . . . . . . . . . . . . . . . . . . . . . 0.09 1086.1.5 Senior officials and managers . . . . . . . . . . . . . . . . . . . . . . . . . . . . . . . . . . 0.84 1266.1.6 Availability of scientists and engineers . . . . . . . . . . . . . . . . . . . . . . . . 51.63 606.2 Talent Impact . . . . . . . . . . . . . . . . . . . . . . . . . . . . . . . . . . . . . . . . . . . . . . . 11.46 1016.2.1 Innovation output . . . . . . . . . . . . . . . . . . . . . . . . . . . . . . . . . . . . . . . . . . . .26.97 726.2.2 High-value exports . . . . . . . . . . . . . . . . . . . . . . . . . . . . . . . . . . . . . . . . . . . . . 7.04 926.2.3 New product entrepreneurial activity . . . . . . . . . . . . . . . . . . . . . . . . . . .n/a n/a6.2.4 New business density . . . . . . . . . . . . . . . . . . . . . . . . . . . . . . . . . . . . . . . . . . .n/a n/a6.2.5 Scientific journal articles . . . . . . . . . . . . . . . . . . . . . . . . . . . . . . . . . . . . . . . 0.36 114
l Tanzania, United Rep. l Income group average
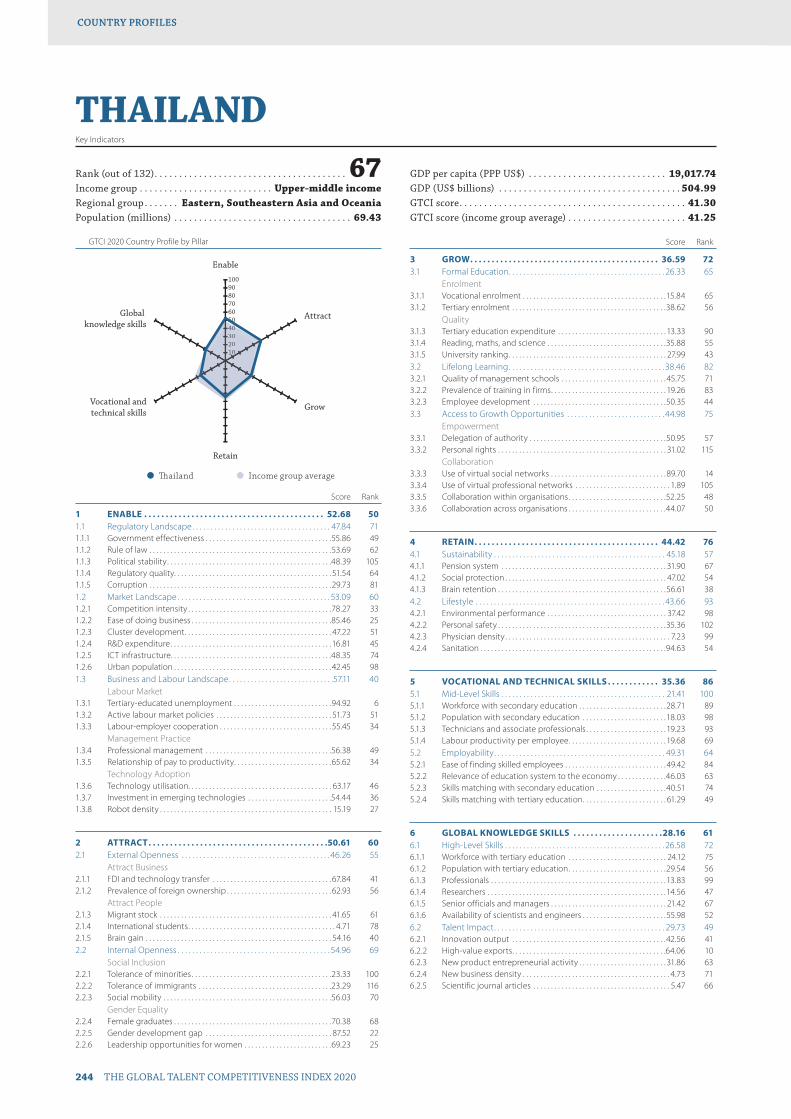
GTCI 2020 Country Profile by Pillar
244 THE GLOBAL TALENT COMPETITIVENESS INDEX 2020
COUNTRY PROFILESCOUNTRY PROFILES
102030405060708090100
Global knowledge skills
Vocational andtechnical skills
Retain
Grow
Attract
Enable
1020304040
THAILANDKey Indicators
Rank (out of 132) . . . . . . . . . . . . . . . . . . . . . . . . . . . . . . . . . . . . . . . 67Income group . . . . . . . . . . . . . . . . . . . . . . . . . . . Upper-middle incomeRegional group . . . . . . . Eastern, Southeastern Asia and OceaniaPopulation (millions) . . . . . . . . . . . . . . . . . . . . . . . . . . . . . . . . . . . . 69.43
GDP per capita (PPP US$) . . . . . . . . . . . . . . . . . . . . . . . . . . . . 19,017.74GDP (US$ billions) . . . . . . . . . . . . . . . . . . . . . . . . . . . . . . . . . . . . . 504.99GTCI score . . . . . . . . . . . . . . . . . . . . . . . . . . . . . . . . . . . . . . . . . . . . . . 41.30GTCI score (income group average) . . . . . . . . . . . . . . . . . . . . . . . . 41.25
Score Rank
1 ENABLE . . . . . . . . . . . . . . . . . . . . . . . . . . . . . . . . . . . . . . . . . . 52.68 501.1 Regulatory Landscape . . . . . . . . . . . . . . . . . . . . . . . . . . . . . . . . . . . . . . 47.84 711.1.1 Government effectiveness . . . . . . . . . . . . . . . . . . . . . . . . . . . . . . . . . . . .55.86 491.1.2 Rule of law . . . . . . . . . . . . . . . . . . . . . . . . . . . . . . . . . . . . . . . . . . . . . . . . . . . .53.69 621.1.3 Political stability . . . . . . . . . . . . . . . . . . . . . . . . . . . . . . . . . . . . . . . . . . . . . . .48.39 1051.1.4 Regulatory quality. . . . . . . . . . . . . . . . . . . . . . . . . . . . . . . . . . . . . . . . . . . . . 51.54 641.1.5 Corruption . . . . . . . . . . . . . . . . . . . . . . . . . . . . . . . . . . . . . . . . . . . . . . . . . . . .29.73 811.2 Market Landscape . . . . . . . . . . . . . . . . . . . . . . . . . . . . . . . . . . . . . . . . . . 53.09 601.2.1 Competition intensity . . . . . . . . . . . . . . . . . . . . . . . . . . . . . . . . . . . . . . . . .78.27 331.2.2 Ease of doing business . . . . . . . . . . . . . . . . . . . . . . . . . . . . . . . . . . . . . . . .85.46 251.2.3 Cluster development . . . . . . . . . . . . . . . . . . . . . . . . . . . . . . . . . . . . . . . . . . 47.22 511.2.4 R&D expenditure . . . . . . . . . . . . . . . . . . . . . . . . . . . . . . . . . . . . . . . . . . . . . . 16.81 451.2.5 ICT infrastructure. . . . . . . . . . . . . . . . . . . . . . . . . . . . . . . . . . . . . . . . . . . . . .48.35 741.2.6 Urban population . . . . . . . . . . . . . . . . . . . . . . . . . . . . . . . . . . . . . . . . . . . . . 42.45 981.3 Business and Labour Landscape . . . . . . . . . . . . . . . . . . . . . . . . . . . . .57.11 40
Labour Market1.3.1 Tertiary-educated unemployment . . . . . . . . . . . . . . . . . . . . . . . . . . . .94.92 61.3.2 Active labour market policies . . . . . . . . . . . . . . . . . . . . . . . . . . . . . . . . . 51.73 511.3.3 Labour-employer cooperation . . . . . . . . . . . . . . . . . . . . . . . . . . . . . . . . 55.45 34
Management Practice1.3.4 Professional management . . . . . . . . . . . . . . . . . . . . . . . . . . . . . . . . . . . .56.38 491.3.5 Relationship of pay to productivity . . . . . . . . . . . . . . . . . . . . . . . . . . . .65.62 34
Technology Adoption1.3.6 Technology utilisation. . . . . . . . . . . . . . . . . . . . . . . . . . . . . . . . . . . . . . . . . 63.17 461.3.7 Investment in emerging technologies . . . . . . . . . . . . . . . . . . . . . . . .54.44 361.3.8 Robot density . . . . . . . . . . . . . . . . . . . . . . . . . . . . . . . . . . . . . . . . . . . . . . . . . 15.19 27
2 ATTRACT . . . . . . . . . . . . . . . . . . . . . . . . . . . . . . . . . . . . . . . . . .50.61 602.1 External Openness . . . . . . . . . . . . . . . . . . . . . . . . . . . . . . . . . . . . . . . . .46.26 55
Attract Business2.1.1 FDI and technology transfer . . . . . . . . . . . . . . . . . . . . . . . . . . . . . . . . . . 67.84 412.1.2 Prevalence of foreign ownership . . . . . . . . . . . . . . . . . . . . . . . . . . . . . . 62.93 56
Attract People2.1.3 Migrant stock . . . . . . . . . . . . . . . . . . . . . . . . . . . . . . . . . . . . . . . . . . . . . . . . . 41.65 612.1.4 International students . . . . . . . . . . . . . . . . . . . . . . . . . . . . . . . . . . . . . . . . . . 4.71 782.1.5 Brain gain . . . . . . . . . . . . . . . . . . . . . . . . . . . . . . . . . . . . . . . . . . . . . . . . . . . . . 54.16 402.2 Internal Openness . . . . . . . . . . . . . . . . . . . . . . . . . . . . . . . . . . . . . . . . . . 54.96 69
Social Inclusion2.2.1 Tolerance of minorities . . . . . . . . . . . . . . . . . . . . . . . . . . . . . . . . . . . . . . . .23.33 1002.2.2 Tolerance of immigrants . . . . . . . . . . . . . . . . . . . . . . . . . . . . . . . . . . . . . .23.29 1162.2.3 Social mobility . . . . . . . . . . . . . . . . . . . . . . . . . . . . . . . . . . . . . . . . . . . . . . . .56.03 70
Gender Equality2.2.4 Female graduates . . . . . . . . . . . . . . . . . . . . . . . . . . . . . . . . . . . . . . . . . . . . .70.38 682.2.5 Gender development gap . . . . . . . . . . . . . . . . . . . . . . . . . . . . . . . . . . . . 87.52 222.2.6 Leadership opportunities for women . . . . . . . . . . . . . . . . . . . . . . . . .69.23 25
Score Rank
3 GROW . . . . . . . . . . . . . . . . . . . . . . . . . . . . . . . . . . . . . . . . . . . . 36.59 723.1 Formal Education . . . . . . . . . . . . . . . . . . . . . . . . . . . . . . . . . . . . . . . . . . . 26.33 65
Enrolment3.1.1 Vocational enrolment . . . . . . . . . . . . . . . . . . . . . . . . . . . . . . . . . . . . . . . . .15.84 653.1.2 Tertiary enrolment . . . . . . . . . . . . . . . . . . . . . . . . . . . . . . . . . . . . . . . . . . . .38.62 56
Quality3.1.3 Tertiary education expenditure . . . . . . . . . . . . . . . . . . . . . . . . . . . . . . . 13.33 903.1.4 Reading, maths, and science . . . . . . . . . . . . . . . . . . . . . . . . . . . . . . . . . .35.88 553.1.5 University ranking . . . . . . . . . . . . . . . . . . . . . . . . . . . . . . . . . . . . . . . . . . . . . 27.99 433.2 Lifelong Learning . . . . . . . . . . . . . . . . . . . . . . . . . . . . . . . . . . . . . . . . . . . 38.46 823.2.1 Quality of management schools . . . . . . . . . . . . . . . . . . . . . . . . . . . . . . 45.75 713.2.2 Prevalence of training in firms . . . . . . . . . . . . . . . . . . . . . . . . . . . . . . . . . 19.26 833.2.3 Employee development . . . . . . . . . . . . . . . . . . . . . . . . . . . . . . . . . . . . . .50.35 443.3 Access to Growth Opportunities . . . . . . . . . . . . . . . . . . . . . . . . . . . 44.98 75
Empowerment3.3.1 Delegation of authority . . . . . . . . . . . . . . . . . . . . . . . . . . . . . . . . . . . . . . .50.95 573.3.2 Personal rights . . . . . . . . . . . . . . . . . . . . . . . . . . . . . . . . . . . . . . . . . . . . . . . . 31.02 115
Collaboration3.3.3 Use of virtual social networks . . . . . . . . . . . . . . . . . . . . . . . . . . . . . . . . .89.70 143.3.4 Use of virtual professional networks . . . . . . . . . . . . . . . . . . . . . . . . . . . 1.89 1053.3.5 Collaboration within organisations . . . . . . . . . . . . . . . . . . . . . . . . . . . .52.25 483.3.6 Collaboration across organisations . . . . . . . . . . . . . . . . . . . . . . . . . . . .44.07 50
4 RETAIN . . . . . . . . . . . . . . . . . . . . . . . . . . . . . . . . . . . . . . . . . . . 44.42 764.1 Sustainability . . . . . . . . . . . . . . . . . . . . . . . . . . . . . . . . . . . . . . . . . . . . . . . 45.18 574.1.1 Pension system . . . . . . . . . . . . . . . . . . . . . . . . . . . . . . . . . . . . . . . . . . . . . . . 31.90 674.1.2 Social protection . . . . . . . . . . . . . . . . . . . . . . . . . . . . . . . . . . . . . . . . . . . . . . 47.02 544.1.3 Brain retention . . . . . . . . . . . . . . . . . . . . . . . . . . . . . . . . . . . . . . . . . . . . . . . .56.61 384.2 Lifestyle . . . . . . . . . . . . . . . . . . . . . . . . . . . . . . . . . . . . . . . . . . . . . . . . . . . . 43.66 934.2.1 Environmental performance . . . . . . . . . . . . . . . . . . . . . . . . . . . . . . . . . . 37.42 984.2.2 Personal safety . . . . . . . . . . . . . . . . . . . . . . . . . . . . . . . . . . . . . . . . . . . . . . . .35.36 1024.2.3 Physician density . . . . . . . . . . . . . . . . . . . . . . . . . . . . . . . . . . . . . . . . . . . . . . . 7.23 994.2.4 Sanitation . . . . . . . . . . . . . . . . . . . . . . . . . . . . . . . . . . . . . . . . . . . . . . . . . . . . .94.63 54
5 VOCATIONAL AND TECHNICAL SKILLS . . . . . . . . . . . . 35.36 865.1 Mid-Level Skills . . . . . . . . . . . . . . . . . . . . . . . . . . . . . . . . . . . . . . . . . . . . . 21.41 1005.1.1 Workforce with secondary education . . . . . . . . . . . . . . . . . . . . . . . . .28.71 895.1.2 Population with secondary education . . . . . . . . . . . . . . . . . . . . . . . .18.03 985.1.3 Technicians and associate professionals . . . . . . . . . . . . . . . . . . . . . . . 19.23 935.1.4 Labour productivity per employee . . . . . . . . . . . . . . . . . . . . . . . . . . . . 19.68 695.2 Employability . . . . . . . . . . . . . . . . . . . . . . . . . . . . . . . . . . . . . . . . . . . . . . . 49.31 645.2.1 Ease of finding skilled employees . . . . . . . . . . . . . . . . . . . . . . . . . . . . . 49.42 845.2.2 Relevance of education system to the economy . . . . . . . . . . . . . .46.03 635.2.3 Skills matching with secondary education . . . . . . . . . . . . . . . . . . . .40.51 745.2.4 Skills matching with tertiary education . . . . . . . . . . . . . . . . . . . . . . . . 61.29 49
6 GLOBAL KNOWLEDGE SKILLS . . . . . . . . . . . . . . . . . . . . .28.16 616.1 High-Level Skills . . . . . . . . . . . . . . . . . . . . . . . . . . . . . . . . . . . . . . . . . . . . 26.58 726.1.1 Workforce with tertiary education . . . . . . . . . . . . . . . . . . . . . . . . . . . . 24.12 756.1.2 Population with tertiary education . . . . . . . . . . . . . . . . . . . . . . . . . . . .29.54 566.1.3 Professionals . . . . . . . . . . . . . . . . . . . . . . . . . . . . . . . . . . . . . . . . . . . . . . . . . . 13.83 996.1.4 Researchers . . . . . . . . . . . . . . . . . . . . . . . . . . . . . . . . . . . . . . . . . . . . . . . . . . .14.56 476.1.5 Senior officials and managers . . . . . . . . . . . . . . . . . . . . . . . . . . . . . . . . . 21.42 676.1.6 Availability of scientists and engineers . . . . . . . . . . . . . . . . . . . . . . . .55.98 526.2 Talent Impact . . . . . . . . . . . . . . . . . . . . . . . . . . . . . . . . . . . . . . . . . . . . . . . 29.73 496.2.1 Innovation output . . . . . . . . . . . . . . . . . . . . . . . . . . . . . . . . . . . . . . . . . . . .42.56 416.2.2 High-value exports . . . . . . . . . . . . . . . . . . . . . . . . . . . . . . . . . . . . . . . . . . . .64.06 106.2.3 New product entrepreneurial activity . . . . . . . . . . . . . . . . . . . . . . . . . 31.86 636.2.4 New business density . . . . . . . . . . . . . . . . . . . . . . . . . . . . . . . . . . . . . . . . . . 4.73 716.2.5 Scientific journal articles . . . . . . . . . . . . . . . . . . . . . . . . . . . . . . . . . . . . . . . 5.47 66
l Thailand l Income group average
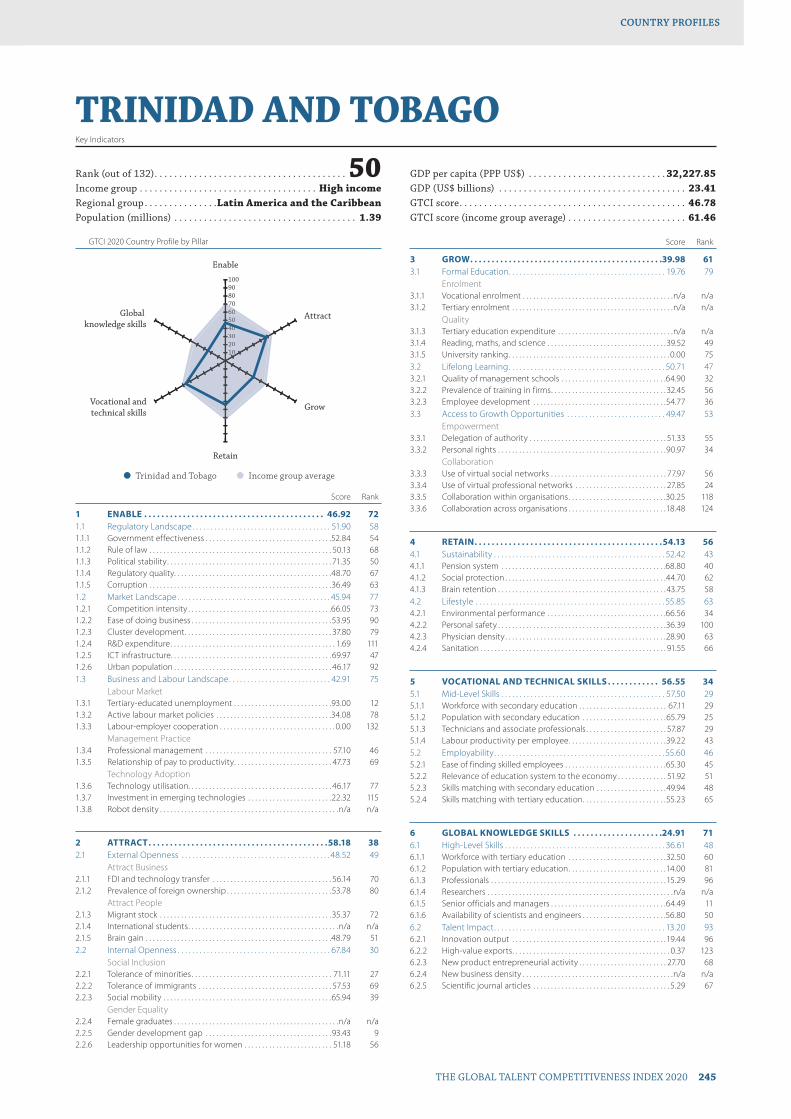
GTCI 2020 Country Profile by Pillar
THE GLOBAL TALENT COMPETITIVENESS INDEX 2020 245
COUNTRY PROFILESCOUNTRY PROFILES
102030405060708090100
Global knowledge skills
Vocational andtechnical skills
Retain
Grow
Attract
Enable
102030405060607
TRINIDAD AND TOBAGOKey Indicators
Rank (out of 132) . . . . . . . . . . . . . . . . . . . . . . . . . . . . . . . . . . . . . . . 50Income group . . . . . . . . . . . . . . . . . . . . . . . . . . . . . . . . . . . . High incomeRegional group . . . . . . . . . . . . . . .Latin America and the CaribbeanPopulation (millions) . . . . . . . . . . . . . . . . . . . . . . . . . . . . . . . . . . . . . 1.39
GDP per capita (PPP US$) . . . . . . . . . . . . . . . . . . . . . . . . . . . . 32,227.85GDP (US$ billions) . . . . . . . . . . . . . . . . . . . . . . . . . . . . . . . . . . . . . . 23.41GTCI score . . . . . . . . . . . . . . . . . . . . . . . . . . . . . . . . . . . . . . . . . . . . . . 46.78GTCI score (income group average) . . . . . . . . . . . . . . . . . . . . . . . . 61.46
Score Rank
1 ENABLE . . . . . . . . . . . . . . . . . . . . . . . . . . . . . . . . . . . . . . . . . . 46.92 721.1 Regulatory Landscape . . . . . . . . . . . . . . . . . . . . . . . . . . . . . . . . . . . . . . 51.90 581.1.1 Government effectiveness . . . . . . . . . . . . . . . . . . . . . . . . . . . . . . . . . . . .52.84 541.1.2 Rule of law . . . . . . . . . . . . . . . . . . . . . . . . . . . . . . . . . . . . . . . . . . . . . . . . . . . . 50.13 681.1.3 Political stability . . . . . . . . . . . . . . . . . . . . . . . . . . . . . . . . . . . . . . . . . . . . . . . 71.35 501.1.4 Regulatory quality. . . . . . . . . . . . . . . . . . . . . . . . . . . . . . . . . . . . . . . . . . . . .48.70 671.1.5 Corruption . . . . . . . . . . . . . . . . . . . . . . . . . . . . . . . . . . . . . . . . . . . . . . . . . . . .36.49 631.2 Market Landscape . . . . . . . . . . . . . . . . . . . . . . . . . . . . . . . . . . . . . . . . . . 45.94 771.2.1 Competition intensity . . . . . . . . . . . . . . . . . . . . . . . . . . . . . . . . . . . . . . . . .66.05 731.2.2 Ease of doing business . . . . . . . . . . . . . . . . . . . . . . . . . . . . . . . . . . . . . . . .53.95 901.2.3 Cluster development . . . . . . . . . . . . . . . . . . . . . . . . . . . . . . . . . . . . . . . . . . 37.80 791.2.4 R&D expenditure . . . . . . . . . . . . . . . . . . . . . . . . . . . . . . . . . . . . . . . . . . . . . . . 1.69 1111.2.5 ICT infrastructure. . . . . . . . . . . . . . . . . . . . . . . . . . . . . . . . . . . . . . . . . . . . . . 69.97 471.2.6 Urban population . . . . . . . . . . . . . . . . . . . . . . . . . . . . . . . . . . . . . . . . . . . . . 46.17 921.3 Business and Labour Landscape . . . . . . . . . . . . . . . . . . . . . . . . . . . . 42.91 75
Labour Market1.3.1 Tertiary-educated unemployment . . . . . . . . . . . . . . . . . . . . . . . . . . . .93.00 121.3.2 Active labour market policies . . . . . . . . . . . . . . . . . . . . . . . . . . . . . . . . .34.08 781.3.3 Labour-employer cooperation . . . . . . . . . . . . . . . . . . . . . . . . . . . . . . . . . 0.00 132
Management Practice1.3.4 Professional management . . . . . . . . . . . . . . . . . . . . . . . . . . . . . . . . . . . . 57.10 461.3.5 Relationship of pay to productivity . . . . . . . . . . . . . . . . . . . . . . . . . . . . 47.73 69
Technology Adoption1.3.6 Technology utilisation. . . . . . . . . . . . . . . . . . . . . . . . . . . . . . . . . . . . . . . . . 46.17 771.3.7 Investment in emerging technologies . . . . . . . . . . . . . . . . . . . . . . . .22.32 1151.3.8 Robot density . . . . . . . . . . . . . . . . . . . . . . . . . . . . . . . . . . . . . . . . . . . . . . . . . . .n/a n/a
2 ATTRACT . . . . . . . . . . . . . . . . . . . . . . . . . . . . . . . . . . . . . . . . . .58.18 382.1 External Openness . . . . . . . . . . . . . . . . . . . . . . . . . . . . . . . . . . . . . . . . . 48.52 49
Attract Business2.1.1 FDI and technology transfer . . . . . . . . . . . . . . . . . . . . . . . . . . . . . . . . . . 56.14 702.1.2 Prevalence of foreign ownership . . . . . . . . . . . . . . . . . . . . . . . . . . . . . .53.78 80
Attract People2.1.3 Migrant stock . . . . . . . . . . . . . . . . . . . . . . . . . . . . . . . . . . . . . . . . . . . . . . . . .35.37 722.1.4 International students . . . . . . . . . . . . . . . . . . . . . . . . . . . . . . . . . . . . . . . . . . .n/a n/a2.1.5 Brain gain . . . . . . . . . . . . . . . . . . . . . . . . . . . . . . . . . . . . . . . . . . . . . . . . . . . . .48.79 512.2 Internal Openness . . . . . . . . . . . . . . . . . . . . . . . . . . . . . . . . . . . . . . . . . . 67.84 30
Social Inclusion2.2.1 Tolerance of minorities . . . . . . . . . . . . . . . . . . . . . . . . . . . . . . . . . . . . . . . . 71.11 272.2.2 Tolerance of immigrants . . . . . . . . . . . . . . . . . . . . . . . . . . . . . . . . . . . . . . 57.53 692.2.3 Social mobility . . . . . . . . . . . . . . . . . . . . . . . . . . . . . . . . . . . . . . . . . . . . . . . .65.94 39
Gender Equality2.2.4 Female graduates . . . . . . . . . . . . . . . . . . . . . . . . . . . . . . . . . . . . . . . . . . . . . . .n/a n/a2.2.5 Gender development gap . . . . . . . . . . . . . . . . . . . . . . . . . . . . . . . . . . . . 93.43 92.2.6 Leadership opportunities for women . . . . . . . . . . . . . . . . . . . . . . . . . 51.18 56
Score Rank
3 GROW . . . . . . . . . . . . . . . . . . . . . . . . . . . . . . . . . . . . . . . . . . . . .39.98 613.1 Formal Education . . . . . . . . . . . . . . . . . . . . . . . . . . . . . . . . . . . . . . . . . . . 19.76 79
Enrolment3.1.1 Vocational enrolment . . . . . . . . . . . . . . . . . . . . . . . . . . . . . . . . . . . . . . . . . . .n/a n/a3.1.2 Tertiary enrolment . . . . . . . . . . . . . . . . . . . . . . . . . . . . . . . . . . . . . . . . . . . . . .n/a n/a
Quality3.1.3 Tertiary education expenditure . . . . . . . . . . . . . . . . . . . . . . . . . . . . . . . . .n/a n/a3.1.4 Reading, maths, and science . . . . . . . . . . . . . . . . . . . . . . . . . . . . . . . . . .39.52 493.1.5 University ranking . . . . . . . . . . . . . . . . . . . . . . . . . . . . . . . . . . . . . . . . . . . . . . 0.00 753.2 Lifelong Learning . . . . . . . . . . . . . . . . . . . . . . . . . . . . . . . . . . . . . . . . . . . 50.71 473.2.1 Quality of management schools . . . . . . . . . . . . . . . . . . . . . . . . . . . . . .64.90 323.2.2 Prevalence of training in firms . . . . . . . . . . . . . . . . . . . . . . . . . . . . . . . . . 32.45 563.2.3 Employee development . . . . . . . . . . . . . . . . . . . . . . . . . . . . . . . . . . . . . .54.77 363.3 Access to Growth Opportunities . . . . . . . . . . . . . . . . . . . . . . . . . . . 49.47 53
Empowerment3.3.1 Delegation of authority . . . . . . . . . . . . . . . . . . . . . . . . . . . . . . . . . . . . . . . 51.33 553.3.2 Personal rights . . . . . . . . . . . . . . . . . . . . . . . . . . . . . . . . . . . . . . . . . . . . . . . .90.97 34
Collaboration3.3.3 Use of virtual social networks . . . . . . . . . . . . . . . . . . . . . . . . . . . . . . . . . 77.97 563.3.4 Use of virtual professional networks . . . . . . . . . . . . . . . . . . . . . . . . . . 27.85 243.3.5 Collaboration within organisations . . . . . . . . . . . . . . . . . . . . . . . . . . . .30.25 1183.3.6 Collaboration across organisations . . . . . . . . . . . . . . . . . . . . . . . . . . . .18.48 124
4 RETAIN . . . . . . . . . . . . . . . . . . . . . . . . . . . . . . . . . . . . . . . . . . . .54.13 564.1 Sustainability . . . . . . . . . . . . . . . . . . . . . . . . . . . . . . . . . . . . . . . . . . . . . . . 52.42 434.1.1 Pension system . . . . . . . . . . . . . . . . . . . . . . . . . . . . . . . . . . . . . . . . . . . . . . .68.80 404.1.2 Social protection . . . . . . . . . . . . . . . . . . . . . . . . . . . . . . . . . . . . . . . . . . . . . .44.70 624.1.3 Brain retention . . . . . . . . . . . . . . . . . . . . . . . . . . . . . . . . . . . . . . . . . . . . . . . . 43.75 584.2 Lifestyle . . . . . . . . . . . . . . . . . . . . . . . . . . . . . . . . . . . . . . . . . . . . . . . . . . . . 55.85 634.2.1 Environmental performance . . . . . . . . . . . . . . . . . . . . . . . . . . . . . . . . . .66.56 344.2.2 Personal safety . . . . . . . . . . . . . . . . . . . . . . . . . . . . . . . . . . . . . . . . . . . . . . . .36.39 1004.2.3 Physician density . . . . . . . . . . . . . . . . . . . . . . . . . . . . . . . . . . . . . . . . . . . . . .28.90 634.2.4 Sanitation . . . . . . . . . . . . . . . . . . . . . . . . . . . . . . . . . . . . . . . . . . . . . . . . . . . . . 91.55 66
5 VOCATIONAL AND TECHNICAL SKILLS . . . . . . . . . . . . 56.55 345.1 Mid-Level Skills . . . . . . . . . . . . . . . . . . . . . . . . . . . . . . . . . . . . . . . . . . . . . 57.50 295.1.1 Workforce with secondary education . . . . . . . . . . . . . . . . . . . . . . . . . 67.11 295.1.2 Population with secondary education . . . . . . . . . . . . . . . . . . . . . . . .65.79 255.1.3 Technicians and associate professionals . . . . . . . . . . . . . . . . . . . . . . . 57.87 295.1.4 Labour productivity per employee . . . . . . . . . . . . . . . . . . . . . . . . . . . .39.22 435.2 Employability . . . . . . . . . . . . . . . . . . . . . . . . . . . . . . . . . . . . . . . . . . . . . . . 55.60 465.2.1 Ease of finding skilled employees . . . . . . . . . . . . . . . . . . . . . . . . . . . . .65.30 455.2.2 Relevance of education system to the economy . . . . . . . . . . . . . . 51.92 515.2.3 Skills matching with secondary education . . . . . . . . . . . . . . . . . . . .49.94 485.2.4 Skills matching with tertiary education . . . . . . . . . . . . . . . . . . . . . . . .55.23 65
6 GLOBAL KNOWLEDGE SKILLS . . . . . . . . . . . . . . . . . . . . .24.91 716.1 High-Level Skills . . . . . . . . . . . . . . . . . . . . . . . . . . . . . . . . . . . . . . . . . . . . 36.61 486.1.1 Workforce with tertiary education . . . . . . . . . . . . . . . . . . . . . . . . . . . .32.50 606.1.2 Population with tertiary education . . . . . . . . . . . . . . . . . . . . . . . . . . . .14.00 816.1.3 Professionals . . . . . . . . . . . . . . . . . . . . . . . . . . . . . . . . . . . . . . . . . . . . . . . . . . 15.29 966.1.4 Researchers . . . . . . . . . . . . . . . . . . . . . . . . . . . . . . . . . . . . . . . . . . . . . . . . . . . . .n/a n/a6.1.5 Senior officials and managers . . . . . . . . . . . . . . . . . . . . . . . . . . . . . . . . .64.49 116.1.6 Availability of scientists and engineers . . . . . . . . . . . . . . . . . . . . . . . .56.80 506.2 Talent Impact . . . . . . . . . . . . . . . . . . . . . . . . . . . . . . . . . . . . . . . . . . . . . . . 13.20 936.2.1 Innovation output . . . . . . . . . . . . . . . . . . . . . . . . . . . . . . . . . . . . . . . . . . . .19.44 966.2.2 High-value exports . . . . . . . . . . . . . . . . . . . . . . . . . . . . . . . . . . . . . . . . . . . . . 0.37 1236.2.3 New product entrepreneurial activity . . . . . . . . . . . . . . . . . . . . . . . . . 27.70 686.2.4 New business density . . . . . . . . . . . . . . . . . . . . . . . . . . . . . . . . . . . . . . . . . . .n/a n/a6.2.5 Scientific journal articles . . . . . . . . . . . . . . . . . . . . . . . . . . . . . . . . . . . . . . . 5.29 67
l Trinidad and Tobago l Income group average

GTCI 2020 Country Profile by Pillar
246 THE GLOBAL TALENT COMPETITIVENESS INDEX 2020
COUNTRY PROFILESCOUNTRY PROFILES
102030405060708090100
Global knowledge skills
Vocational andtechnical skills
Retain
Grow
Attract
Enable
10203004
TUNISIAKey Indicators
Rank (out of 132) . . . . . . . . . . . . . . . . . . . . . . . . . . . . . . . . . . . . . . . 79Income group . . . . . . . . . . . . . . . . . . . . . . . . . . . Lower-middle incomeRegional group . . . . . . . . . . . . . .Northern Africa and Western AsiaPopulation (millions) . . . . . . . . . . . . . . . . . . . . . . . . . . . . . . . . . . . . 11.57
GDP per capita (PPP US$) . . . . . . . . . . . . . . . . . . . . . . . . . . . .12,483.51GDP (US$ billions) . . . . . . . . . . . . . . . . . . . . . . . . . . . . . . . . . . . . . . 39.86GTCI score . . . . . . . . . . . . . . . . . . . . . . . . . . . . . . . . . . . . . . . . . . . . . . 38.25GTCI score (income group average) . . . . . . . . . . . . . . . . . . . . . . . . 32.97
Score Rank
1 ENABLE . . . . . . . . . . . . . . . . . . . . . . . . . . . . . . . . . . . . . . . . . . .37.83 1021.1 Regulatory Landscape . . . . . . . . . . . . . . . . . . . . . . . . . . . . . . . . . . . . . . 43.65 821.1.1 Government effectiveness . . . . . . . . . . . . . . . . . . . . . . . . . . . . . . . . . . . .44.87 761.1.2 Rule of law . . . . . . . . . . . . . . . . . . . . . . . . . . . . . . . . . . . . . . . . . . . . . . . . . . . .54.33 591.1.3 Political stability . . . . . . . . . . . . . . . . . . . . . . . . . . . . . . . . . . . . . . . . . . . . . . . 41.90 1161.1.4 Regulatory quality. . . . . . . . . . . . . . . . . . . . . . . . . . . . . . . . . . . . . . . . . . . . . 37.98 991.1.5 Corruption . . . . . . . . . . . . . . . . . . . . . . . . . . . . . . . . . . . . . . . . . . . . . . . . . . . . 39.19 591.2 Market Landscape . . . . . . . . . . . . . . . . . . . . . . . . . . . . . . . . . . . . . . . . . . 45.67 781.2.1 Competition intensity . . . . . . . . . . . . . . . . . . . . . . . . . . . . . . . . . . . . . . . . . 62.91 811.2.2 Ease of doing business . . . . . . . . . . . . . . . . . . . . . . . . . . . . . . . . . . . . . . . .63.42 741.2.3 Cluster development . . . . . . . . . . . . . . . . . . . . . . . . . . . . . . . . . . . . . . . . . .26.96 1031.2.4 R&D expenditure . . . . . . . . . . . . . . . . . . . . . . . . . . . . . . . . . . . . . . . . . . . . . . 12.83 541.2.5 ICT infrastructure. . . . . . . . . . . . . . . . . . . . . . . . . . . . . . . . . . . . . . . . . . . . . .43.64 811.2.6 Urban population . . . . . . . . . . . . . . . . . . . . . . . . . . . . . . . . . . . . . . . . . . . . .64.29 551.3 Business and Labour Landscape . . . . . . . . . . . . . . . . . . . . . . . . . . . . 24.17 127
Labour Market1.3.1 Tertiary-educated unemployment . . . . . . . . . . . . . . . . . . . . . . . . . . . . . 0.00 1231.3.2 Active labour market policies . . . . . . . . . . . . . . . . . . . . . . . . . . . . . . . . .34.31 761.3.3 Labour-employer cooperation . . . . . . . . . . . . . . . . . . . . . . . . . . . . . . . .16.34 116
Management Practice1.3.4 Professional management . . . . . . . . . . . . . . . . . . . . . . . . . . . . . . . . . . . . 41.18 871.3.5 Relationship of pay to productivity . . . . . . . . . . . . . . . . . . . . . . . . . . . .28.78 121
Technology Adoption1.3.6 Technology utilisation. . . . . . . . . . . . . . . . . . . . . . . . . . . . . . . . . . . . . . . . . 36.16 1071.3.7 Investment in emerging technologies . . . . . . . . . . . . . . . . . . . . . . . .35.63 781.3.8 Robot density . . . . . . . . . . . . . . . . . . . . . . . . . . . . . . . . . . . . . . . . . . . . . . . . . . 0.95 53
2 ATTRACT . . . . . . . . . . . . . . . . . . . . . . . . . . . . . . . . . . . . . . . . . .41.52 1012.1 External Openness . . . . . . . . . . . . . . . . . . . . . . . . . . . . . . . . . . . . . . . . . 27.83 116
Attract Business2.1.1 FDI and technology transfer . . . . . . . . . . . . . . . . . . . . . . . . . . . . . . . . . .48.78 882.1.2 Prevalence of foreign ownership . . . . . . . . . . . . . . . . . . . . . . . . . . . . . . 51.00 90
Attract People2.1.3 Migrant stock . . . . . . . . . . . . . . . . . . . . . . . . . . . . . . . . . . . . . . . . . . . . . . . . . . 9.41 1202.1.4 International students . . . . . . . . . . . . . . . . . . . . . . . . . . . . . . . . . . . . . . . . . . 8.20 662.1.5 Brain gain . . . . . . . . . . . . . . . . . . . . . . . . . . . . . . . . . . . . . . . . . . . . . . . . . . . . . 21.76 1142.2 Internal Openness . . . . . . . . . . . . . . . . . . . . . . . . . . . . . . . . . . . . . . . . . . 55.20 68
Social Inclusion2.2.1 Tolerance of minorities . . . . . . . . . . . . . . . . . . . . . . . . . . . . . . . . . . . . . . . .32.22 882.2.2 Tolerance of immigrants . . . . . . . . . . . . . . . . . . . . . . . . . . . . . . . . . . . . . . 45.21 912.2.3 Social mobility . . . . . . . . . . . . . . . . . . . . . . . . . . . . . . . . . . . . . . . . . . . . . . . . 58.12 62
Gender Equality2.2.4 Female graduates . . . . . . . . . . . . . . . . . . . . . . . . . . . . . . . . . . . . . . . . . . . 100.00 12.2.5 Gender development gap . . . . . . . . . . . . . . . . . . . . . . . . . . . . . . . . . . . .52.39 1102.2.6 Leadership opportunities for women . . . . . . . . . . . . . . . . . . . . . . . . .43.28 74
Score Rank
3 GROW . . . . . . . . . . . . . . . . . . . . . . . . . . . . . . . . . . . . . . . . . . . . 34.04 813.1 Formal Education . . . . . . . . . . . . . . . . . . . . . . . . . . . . . . . . . . . . . . . . . . . 18.33 80
Enrolment3.1.1 Vocational enrolment . . . . . . . . . . . . . . . . . . . . . . . . . . . . . . . . . . . . . . . . . 13.98 733.1.2 Tertiary enrolment . . . . . . . . . . . . . . . . . . . . . . . . . . . . . . . . . . . . . . . . . . . . 24.91 79
Quality3.1.3 Tertiary education expenditure . . . . . . . . . . . . . . . . . . . . . . . . . . . . . . . 37.55 173.1.4 Reading, maths, and science . . . . . . . . . . . . . . . . . . . . . . . . . . . . . . . . . . 15.24 643.1.5 University ranking . . . . . . . . . . . . . . . . . . . . . . . . . . . . . . . . . . . . . . . . . . . . . . 0.00 753.2 Lifelong Learning . . . . . . . . . . . . . . . . . . . . . . . . . . . . . . . . . . . . . . . . . . .38.68 813.2.1 Quality of management schools . . . . . . . . . . . . . . . . . . . . . . . . . . . . . . 47.01 663.2.2 Prevalence of training in firms . . . . . . . . . . . . . . . . . . . . . . . . . . . . . . . . .33.64 523.2.3 Employee development . . . . . . . . . . . . . . . . . . . . . . . . . . . . . . . . . . . . . .35.40 773.3 Access to Growth Opportunities . . . . . . . . . . . . . . . . . . . . . . . . . . . 45.09 74
Empowerment3.3.1 Delegation of authority . . . . . . . . . . . . . . . . . . . . . . . . . . . . . . . . . . . . . . .30.97 1123.3.2 Personal rights . . . . . . . . . . . . . . . . . . . . . . . . . . . . . . . . . . . . . . . . . . . . . . . .84.09 44
Collaboration3.3.3 Use of virtual social networks . . . . . . . . . . . . . . . . . . . . . . . . . . . . . . . . .80.80 463.3.4 Use of virtual professional networks . . . . . . . . . . . . . . . . . . . . . . . . . . . 9.13 643.3.5 Collaboration within organisations . . . . . . . . . . . . . . . . . . . . . . . . . . . . 42.45 893.3.6 Collaboration across organisations . . . . . . . . . . . . . . . . . . . . . . . . . . . . 23.10 113
4 RETAIN . . . . . . . . . . . . . . . . . . . . . . . . . . . . . . . . . . . . . . . . . . . 46.86 664.1 Sustainability . . . . . . . . . . . . . . . . . . . . . . . . . . . . . . . . . . . . . . . . . . . . . . . 38.77 724.1.1 Pension system . . . . . . . . . . . . . . . . . . . . . . . . . . . . . . . . . . . . . . . . . . . . . . . 61.00 464.1.2 Social protection . . . . . . . . . . . . . . . . . . . . . . . . . . . . . . . . . . . . . . . . . . . . . . 33.76 844.1.3 Brain retention . . . . . . . . . . . . . . . . . . . . . . . . . . . . . . . . . . . . . . . . . . . . . . . . 21.55 1134.2 Lifestyle . . . . . . . . . . . . . . . . . . . . . . . . . . . . . . . . . . . . . . . . . . . . . . . . . . . . 54.95 684.2.1 Environmental performance . . . . . . . . . . . . . . . . . . . . . . . . . . . . . . . . . .58.21 514.2.2 Personal safety . . . . . . . . . . . . . . . . . . . . . . . . . . . . . . . . . . . . . . . . . . . . . . . .48.60 794.2.3 Physician density . . . . . . . . . . . . . . . . . . . . . . . . . . . . . . . . . . . . . . . . . . . . . .20.37 764.2.4 Sanitation . . . . . . . . . . . . . . . . . . . . . . . . . . . . . . . . . . . . . . . . . . . . . . . . . . . . .92.60 63
5 VOCATIONAL AND TECHNICAL SKILLS . . . . . . . . . . . . .39.20 785.1 Mid-Level Skills . . . . . . . . . . . . . . . . . . . . . . . . . . . . . . . . . . . . . . . . . . . . . 37.24 705.1.1 Workforce with secondary education . . . . . . . . . . . . . . . . . . . . . . . . . 52.17 555.1.2 Population with secondary education . . . . . . . . . . . . . . . . . . . . . . . .40.80 605.1.3 Technicians and associate professionals . . . . . . . . . . . . . . . . . . . . . . .32.49 655.1.4 Labour productivity per employee . . . . . . . . . . . . . . . . . . . . . . . . . . . .23.51 635.2 Employability . . . . . . . . . . . . . . . . . . . . . . . . . . . . . . . . . . . . . . . . . . . . . . . 41.16 905.2.1 Ease of finding skilled employees . . . . . . . . . . . . . . . . . . . . . . . . . . . . .56.81 625.2.2 Relevance of education system to the economy . . . . . . . . . . . . . .33.89 925.2.3 Skills matching with secondary education . . . . . . . . . . . . . . . . . . . .34.66 865.2.4 Skills matching with tertiary education . . . . . . . . . . . . . . . . . . . . . . . .39.27 106
6 GLOBAL KNOWLEDGE SKILLS . . . . . . . . . . . . . . . . . . . . 30.06 536.1 High-Level Skills . . . . . . . . . . . . . . . . . . . . . . . . . . . . . . . . . . . . . . . . . . . . 32.86 576.1.1 Workforce with tertiary education . . . . . . . . . . . . . . . . . . . . . . . . . . . .28.69 656.1.2 Population with tertiary education . . . . . . . . . . . . . . . . . . . . . . . . . . . . 23.12 656.1.3 Professionals . . . . . . . . . . . . . . . . . . . . . . . . . . . . . . . . . . . . . . . . . . . . . . . . . . 17.01 926.1.4 Researchers . . . . . . . . . . . . . . . . . . . . . . . . . . . . . . . . . . . . . . . . . . . . . . . . . . .23.72 406.1.5 Senior officials and managers . . . . . . . . . . . . . . . . . . . . . . . . . . . . . . . . . 40.16 336.1.6 Availability of scientists and engineers . . . . . . . . . . . . . . . . . . . . . . . .64.44 336.2 Talent Impact . . . . . . . . . . . . . . . . . . . . . . . . . . . . . . . . . . . . . . . . . . . . . . . 27.27 526.2.1 Innovation output . . . . . . . . . . . . . . . . . . . . . . . . . . . . . . . . . . . . . . . . . . . .29.95 646.2.2 High-value exports . . . . . . . . . . . . . . . . . . . . . . . . . . . . . . . . . . . . . . . . . . . . 15.58 676.2.3 New product entrepreneurial activity . . . . . . . . . . . . . . . . . . . . . . . . .64.35 166.2.4 New business density . . . . . . . . . . . . . . . . . . . . . . . . . . . . . . . . . . . . . . . . . . 8.02 566.2.5 Scientific journal articles . . . . . . . . . . . . . . . . . . . . . . . . . . . . . . . . . . . . . . 18.43 44
l Tunisia l Income group average
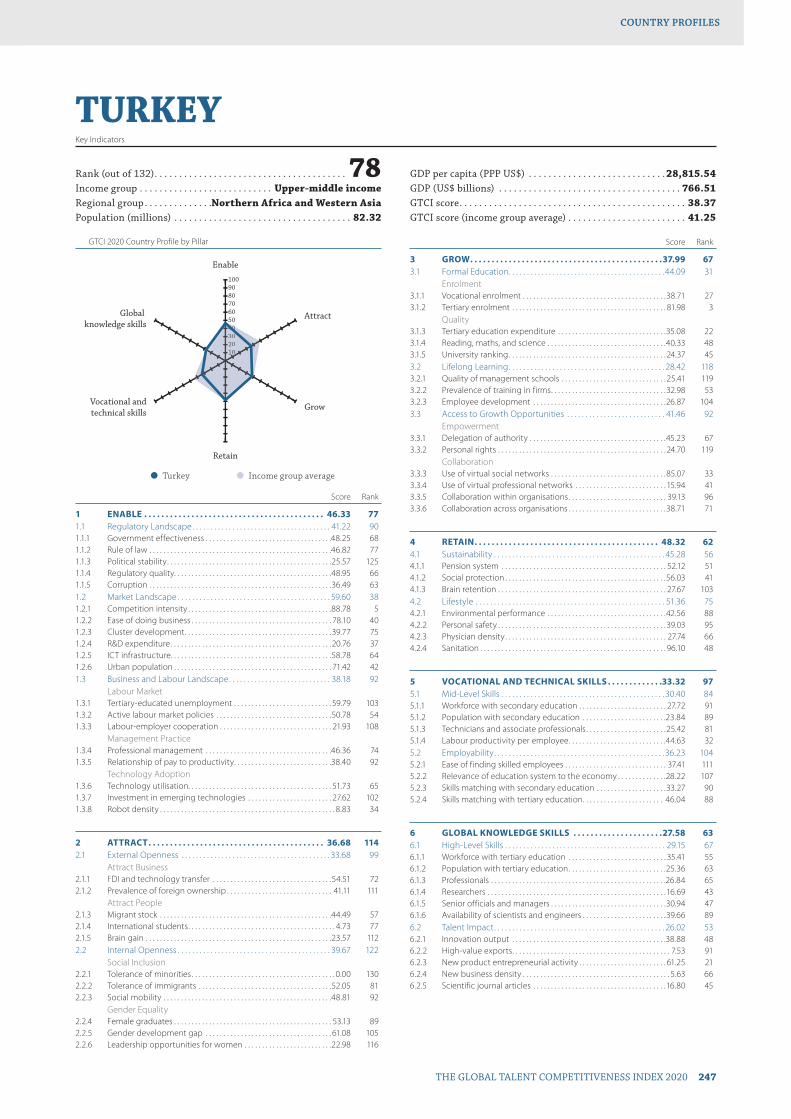
GTCI 2020 Country Profile by Pillar
THE GLOBAL TALENT COMPETITIVENESS INDEX 2020 247
COUNTRY PROFILESCOUNTRY PROFILES
102030405060708090100
Global knowledge skills
Vocational andtechnical skills
Retain
Grow
Attract
Enable
1020304040
TURKEYKey Indicators
Rank (out of 132) . . . . . . . . . . . . . . . . . . . . . . . . . . . . . . . . . . . . . . . 78Income group . . . . . . . . . . . . . . . . . . . . . . . . . . . Upper-middle incomeRegional group . . . . . . . . . . . . . .Northern Africa and Western AsiaPopulation (millions) . . . . . . . . . . . . . . . . . . . . . . . . . . . . . . . . . . . . 82.32
GDP per capita (PPP US$) . . . . . . . . . . . . . . . . . . . . . . . . . . . . 28,815.54GDP (US$ billions) . . . . . . . . . . . . . . . . . . . . . . . . . . . . . . . . . . . . . 766.51GTCI score . . . . . . . . . . . . . . . . . . . . . . . . . . . . . . . . . . . . . . . . . . . . . . 38.37GTCI score (income group average) . . . . . . . . . . . . . . . . . . . . . . . . 41.25
Score Rank
1 ENABLE . . . . . . . . . . . . . . . . . . . . . . . . . . . . . . . . . . . . . . . . . . 46.33 771.1 Regulatory Landscape . . . . . . . . . . . . . . . . . . . . . . . . . . . . . . . . . . . . . . 41.22 901.1.1 Government effectiveness . . . . . . . . . . . . . . . . . . . . . . . . . . . . . . . . . . . .48.25 681.1.2 Rule of law . . . . . . . . . . . . . . . . . . . . . . . . . . . . . . . . . . . . . . . . . . . . . . . . . . . .46.82 771.1.3 Political stability . . . . . . . . . . . . . . . . . . . . . . . . . . . . . . . . . . . . . . . . . . . . . . .25.57 1251.1.4 Regulatory quality. . . . . . . . . . . . . . . . . . . . . . . . . . . . . . . . . . . . . . . . . . . . .48.95 661.1.5 Corruption . . . . . . . . . . . . . . . . . . . . . . . . . . . . . . . . . . . . . . . . . . . . . . . . . . . .36.49 631.2 Market Landscape . . . . . . . . . . . . . . . . . . . . . . . . . . . . . . . . . . . . . . . . . . 59.60 381.2.1 Competition intensity . . . . . . . . . . . . . . . . . . . . . . . . . . . . . . . . . . . . . . . . .88.78 51.2.2 Ease of doing business . . . . . . . . . . . . . . . . . . . . . . . . . . . . . . . . . . . . . . . . 78.10 401.2.3 Cluster development . . . . . . . . . . . . . . . . . . . . . . . . . . . . . . . . . . . . . . . . . .39.77 751.2.4 R&D expenditure . . . . . . . . . . . . . . . . . . . . . . . . . . . . . . . . . . . . . . . . . . . . . .20.76 371.2.5 ICT infrastructure. . . . . . . . . . . . . . . . . . . . . . . . . . . . . . . . . . . . . . . . . . . . . .58.78 641.2.6 Urban population . . . . . . . . . . . . . . . . . . . . . . . . . . . . . . . . . . . . . . . . . . . . . 71.42 421.3 Business and Labour Landscape . . . . . . . . . . . . . . . . . . . . . . . . . . . . 38.18 92
Labour Market1.3.1 Tertiary-educated unemployment . . . . . . . . . . . . . . . . . . . . . . . . . . . . 59.79 1031.3.2 Active labour market policies . . . . . . . . . . . . . . . . . . . . . . . . . . . . . . . . .50.78 541.3.3 Labour-employer cooperation . . . . . . . . . . . . . . . . . . . . . . . . . . . . . . . . 21.93 108
Management Practice1.3.4 Professional management . . . . . . . . . . . . . . . . . . . . . . . . . . . . . . . . . . . .46.36 741.3.5 Relationship of pay to productivity . . . . . . . . . . . . . . . . . . . . . . . . . . . .38.40 92
Technology Adoption1.3.6 Technology utilisation. . . . . . . . . . . . . . . . . . . . . . . . . . . . . . . . . . . . . . . . . 51.73 651.3.7 Investment in emerging technologies . . . . . . . . . . . . . . . . . . . . . . . . 27.62 1021.3.8 Robot density . . . . . . . . . . . . . . . . . . . . . . . . . . . . . . . . . . . . . . . . . . . . . . . . . . 8.83 34
2 ATTRACT . . . . . . . . . . . . . . . . . . . . . . . . . . . . . . . . . . . . . . . . . 36.68 1142.1 External Openness . . . . . . . . . . . . . . . . . . . . . . . . . . . . . . . . . . . . . . . . . 33.68 99
Attract Business2.1.1 FDI and technology transfer . . . . . . . . . . . . . . . . . . . . . . . . . . . . . . . . . .54.51 722.1.2 Prevalence of foreign ownership . . . . . . . . . . . . . . . . . . . . . . . . . . . . . . 41.11 111
Attract People2.1.3 Migrant stock . . . . . . . . . . . . . . . . . . . . . . . . . . . . . . . . . . . . . . . . . . . . . . . . .44.49 572.1.4 International students . . . . . . . . . . . . . . . . . . . . . . . . . . . . . . . . . . . . . . . . . . 4.73 772.1.5 Brain gain . . . . . . . . . . . . . . . . . . . . . . . . . . . . . . . . . . . . . . . . . . . . . . . . . . . . .23.57 1122.2 Internal Openness . . . . . . . . . . . . . . . . . . . . . . . . . . . . . . . . . . . . . . . . . . 39.67 122
Social Inclusion2.2.1 Tolerance of minorities . . . . . . . . . . . . . . . . . . . . . . . . . . . . . . . . . . . . . . . . . 0.00 1302.2.2 Tolerance of immigrants . . . . . . . . . . . . . . . . . . . . . . . . . . . . . . . . . . . . . .52.05 812.2.3 Social mobility . . . . . . . . . . . . . . . . . . . . . . . . . . . . . . . . . . . . . . . . . . . . . . . .48.81 92
Gender Equality2.2.4 Female graduates . . . . . . . . . . . . . . . . . . . . . . . . . . . . . . . . . . . . . . . . . . . . . 53.13 892.2.5 Gender development gap . . . . . . . . . . . . . . . . . . . . . . . . . . . . . . . . . . . . 61.08 1052.2.6 Leadership opportunities for women . . . . . . . . . . . . . . . . . . . . . . . . .22.98 116
Score Rank
3 GROW . . . . . . . . . . . . . . . . . . . . . . . . . . . . . . . . . . . . . . . . . . . . .37.99 673.1 Formal Education . . . . . . . . . . . . . . . . . . . . . . . . . . . . . . . . . . . . . . . . . . .44.09 31
Enrolment3.1.1 Vocational enrolment . . . . . . . . . . . . . . . . . . . . . . . . . . . . . . . . . . . . . . . . .38.71 273.1.2 Tertiary enrolment . . . . . . . . . . . . . . . . . . . . . . . . . . . . . . . . . . . . . . . . . . . . 81.98 3
Quality3.1.3 Tertiary education expenditure . . . . . . . . . . . . . . . . . . . . . . . . . . . . . . .35.08 223.1.4 Reading, maths, and science . . . . . . . . . . . . . . . . . . . . . . . . . . . . . . . . . .40.33 483.1.5 University ranking . . . . . . . . . . . . . . . . . . . . . . . . . . . . . . . . . . . . . . . . . . . . . 24.37 453.2 Lifelong Learning . . . . . . . . . . . . . . . . . . . . . . . . . . . . . . . . . . . . . . . . . . . 28.42 1183.2.1 Quality of management schools . . . . . . . . . . . . . . . . . . . . . . . . . . . . . . 25.41 1193.2.2 Prevalence of training in firms . . . . . . . . . . . . . . . . . . . . . . . . . . . . . . . . .32.98 533.2.3 Employee development . . . . . . . . . . . . . . . . . . . . . . . . . . . . . . . . . . . . . .26.87 1043.3 Access to Growth Opportunities . . . . . . . . . . . . . . . . . . . . . . . . . . . 41.46 92
Empowerment3.3.1 Delegation of authority . . . . . . . . . . . . . . . . . . . . . . . . . . . . . . . . . . . . . . .45.23 673.3.2 Personal rights . . . . . . . . . . . . . . . . . . . . . . . . . . . . . . . . . . . . . . . . . . . . . . . . 24.70 119
Collaboration3.3.3 Use of virtual social networks . . . . . . . . . . . . . . . . . . . . . . . . . . . . . . . . .85.07 333.3.4 Use of virtual professional networks . . . . . . . . . . . . . . . . . . . . . . . . . . 15.94 413.3.5 Collaboration within organisations . . . . . . . . . . . . . . . . . . . . . . . . . . . . 39.13 963.3.6 Collaboration across organisations . . . . . . . . . . . . . . . . . . . . . . . . . . . .38.71 71
4 RETAIN . . . . . . . . . . . . . . . . . . . . . . . . . . . . . . . . . . . . . . . . . . . 48.32 624.1 Sustainability . . . . . . . . . . . . . . . . . . . . . . . . . . . . . . . . . . . . . . . . . . . . . . . 45.28 564.1.1 Pension system . . . . . . . . . . . . . . . . . . . . . . . . . . . . . . . . . . . . . . . . . . . . . . . 52.12 514.1.2 Social protection . . . . . . . . . . . . . . . . . . . . . . . . . . . . . . . . . . . . . . . . . . . . . .56.03 414.1.3 Brain retention . . . . . . . . . . . . . . . . . . . . . . . . . . . . . . . . . . . . . . . . . . . . . . . . 27.67 1034.2 Lifestyle . . . . . . . . . . . . . . . . . . . . . . . . . . . . . . . . . . . . . . . . . . . . . . . . . . . . 51.36 754.2.1 Environmental performance . . . . . . . . . . . . . . . . . . . . . . . . . . . . . . . . . .42.56 884.2.2 Personal safety . . . . . . . . . . . . . . . . . . . . . . . . . . . . . . . . . . . . . . . . . . . . . . . .39.03 954.2.3 Physician density . . . . . . . . . . . . . . . . . . . . . . . . . . . . . . . . . . . . . . . . . . . . . . 27.74 664.2.4 Sanitation . . . . . . . . . . . . . . . . . . . . . . . . . . . . . . . . . . . . . . . . . . . . . . . . . . . . . 96.10 48
5 VOCATIONAL AND TECHNICAL SKILLS . . . . . . . . . . . . .33.32 975.1 Mid-Level Skills . . . . . . . . . . . . . . . . . . . . . . . . . . . . . . . . . . . . . . . . . . . . . 30.40 845.1.1 Workforce with secondary education . . . . . . . . . . . . . . . . . . . . . . . . . 27.72 915.1.2 Population with secondary education . . . . . . . . . . . . . . . . . . . . . . . .23.84 895.1.3 Technicians and associate professionals . . . . . . . . . . . . . . . . . . . . . . .25.42 815.1.4 Labour productivity per employee . . . . . . . . . . . . . . . . . . . . . . . . . . . .44.63 325.2 Employability . . . . . . . . . . . . . . . . . . . . . . . . . . . . . . . . . . . . . . . . . . . . . . .36.23 1045.2.1 Ease of finding skilled employees . . . . . . . . . . . . . . . . . . . . . . . . . . . . . 37.41 1115.2.2 Relevance of education system to the economy . . . . . . . . . . . . . .28.22 1075.2.3 Skills matching with secondary education . . . . . . . . . . . . . . . . . . . .33.27 905.2.4 Skills matching with tertiary education . . . . . . . . . . . . . . . . . . . . . . . 46.04 88
6 GLOBAL KNOWLEDGE SKILLS . . . . . . . . . . . . . . . . . . . . .27.58 636.1 High-Level Skills . . . . . . . . . . . . . . . . . . . . . . . . . . . . . . . . . . . . . . . . . . . . 29.15 676.1.1 Workforce with tertiary education . . . . . . . . . . . . . . . . . . . . . . . . . . . . 35.41 556.1.2 Population with tertiary education . . . . . . . . . . . . . . . . . . . . . . . . . . . .25.36 636.1.3 Professionals . . . . . . . . . . . . . . . . . . . . . . . . . . . . . . . . . . . . . . . . . . . . . . . . . .26.84 656.1.4 Researchers . . . . . . . . . . . . . . . . . . . . . . . . . . . . . . . . . . . . . . . . . . . . . . . . . . .16.69 436.1.5 Senior officials and managers . . . . . . . . . . . . . . . . . . . . . . . . . . . . . . . . .30.94 476.1.6 Availability of scientists and engineers . . . . . . . . . . . . . . . . . . . . . . . .39.66 896.2 Talent Impact . . . . . . . . . . . . . . . . . . . . . . . . . . . . . . . . . . . . . . . . . . . . . . . 26.02 536.2.1 Innovation output . . . . . . . . . . . . . . . . . . . . . . . . . . . . . . . . . . . . . . . . . . . .38.88 486.2.2 High-value exports . . . . . . . . . . . . . . . . . . . . . . . . . . . . . . . . . . . . . . . . . . . . . 7.53 916.2.3 New product entrepreneurial activity . . . . . . . . . . . . . . . . . . . . . . . . . 61.25 216.2.4 New business density . . . . . . . . . . . . . . . . . . . . . . . . . . . . . . . . . . . . . . . . . . 5.63 666.2.5 Scientific journal articles . . . . . . . . . . . . . . . . . . . . . . . . . . . . . . . . . . . . . .16.80 45
l Turkey l Income group average

GTCI 2020 Country Profile by Pillar
248 THE GLOBAL TALENT COMPETITIVENESS INDEX 2020
COUNTRY PROFILESCOUNTRY PROFILES
102030405060708090100
Global knowledge skills
Vocational andtechnical skills
Retain
Grow
Attract
Enable
1020330
UGANDAKey Indicators
Rank (out of 132) . . . . . . . . . . . . . . . . . . . . . . . . . . . . . . . . . . . . 113Income group . . . . . . . . . . . . . . . . . . . . . . . . . . . . . . . . . . . . . Low incomeRegional group . . . . . . . . . . . . . . . . . . . . . . . . . . . . Sub-Saharan AfricaPopulation (millions) . . . . . . . . . . . . . . . . . . . . . . . . . . . . . . . . . . . . 42.72
GDP per capita (PPP US$) . . . . . . . . . . . . . . . . . . . . . . . . . . . . . 2,033.29GDP (US$ billions) . . . . . . . . . . . . . . . . . . . . . . . . . . . . . . . . . . . . . . 27.48GTCI score . . . . . . . . . . . . . . . . . . . . . . . . . . . . . . . . . . . . . . . . . . . . . . 28.47GTCI score (income group average) . . . . . . . . . . . . . . . . . . . . . . . . 26.01
Score Rank
1 ENABLE . . . . . . . . . . . . . . . . . . . . . . . . . . . . . . . . . . . . . . . . . . 36.88 1031.1 Regulatory Landscape . . . . . . . . . . . . . . . . . . . . . . . . . . . . . . . . . . . . . . 37.95 981.1.1 Government effectiveness . . . . . . . . . . . . . . . . . . . . . . . . . . . . . . . . . . . .32.38 1011.1.2 Rule of law . . . . . . . . . . . . . . . . . . . . . . . . . . . . . . . . . . . . . . . . . . . . . . . . . . . . 45.75 821.1.3 Political stability . . . . . . . . . . . . . . . . . . . . . . . . . . . . . . . . . . . . . . . . . . . . . . .52.78 961.1.4 Regulatory quality. . . . . . . . . . . . . . . . . . . . . . . . . . . . . . . . . . . . . . . . . . . . .42.63 851.1.5 Corruption . . . . . . . . . . . . . . . . . . . . . . . . . . . . . . . . . . . . . . . . . . . . . . . . . . . .16.22 1181.2 Market Landscape . . . . . . . . . . . . . . . . . . . . . . . . . . . . . . . . . . . . . . . . . . 30.92 1191.2.1 Competition intensity . . . . . . . . . . . . . . . . . . . . . . . . . . . . . . . . . . . . . . . . .75.20 431.2.2 Ease of doing business . . . . . . . . . . . . . . . . . . . . . . . . . . . . . . . . . . . . . . . . 47.25 1061.2.3 Cluster development . . . . . . . . . . . . . . . . . . . . . . . . . . . . . . . . . . . . . . . . . . 37.41 801.2.4 R&D expenditure . . . . . . . . . . . . . . . . . . . . . . . . . . . . . . . . . . . . . . . . . . . . . . . 3.42 921.2.5 ICT infrastructure. . . . . . . . . . . . . . . . . . . . . . . . . . . . . . . . . . . . . . . . . . . . . . . 9.92 1231.2.6 Urban population . . . . . . . . . . . . . . . . . . . . . . . . . . . . . . . . . . . . . . . . . . . . . 12.35 1251.3 Business and Labour Landscape . . . . . . . . . . . . . . . . . . . . . . . . . . . . 41.77 80
Labour Market1.3.1 Tertiary-educated unemployment . . . . . . . . . . . . . . . . . . . . . . . . . . . .82.87 551.3.2 Active labour market policies . . . . . . . . . . . . . . . . . . . . . . . . . . . . . . . . . 19.99 1111.3.3 Labour-employer cooperation . . . . . . . . . . . . . . . . . . . . . . . . . . . . . . . .39.66 61
Management Practice1.3.4 Professional management . . . . . . . . . . . . . . . . . . . . . . . . . . . . . . . . . . . . 42.17 841.3.5 Relationship of pay to productivity . . . . . . . . . . . . . . . . . . . . . . . . . . . .36.42 101
Technology Adoption1.3.6 Technology utilisation. . . . . . . . . . . . . . . . . . . . . . . . . . . . . . . . . . . . . . . . .35.29 1091.3.7 Investment in emerging technologies . . . . . . . . . . . . . . . . . . . . . . . .36.03 741.3.8 Robot density . . . . . . . . . . . . . . . . . . . . . . . . . . . . . . . . . . . . . . . . . . . . . . . . . . .n/a n/a
2 ATTRACT . . . . . . . . . . . . . . . . . . . . . . . . . . . . . . . . . . . . . . . . . 46.92 762.1 External Openness . . . . . . . . . . . . . . . . . . . . . . . . . . . . . . . . . . . . . . . . . 50.27 40
Attract Business2.1.1 FDI and technology transfer . . . . . . . . . . . . . . . . . . . . . . . . . . . . . . . . . . 51.76 822.1.2 Prevalence of foreign ownership . . . . . . . . . . . . . . . . . . . . . . . . . . . . . .72.23 36
Attract People2.1.3 Migrant stock . . . . . . . . . . . . . . . . . . . . . . . . . . . . . . . . . . . . . . . . . . . . . . . . . 47.34 512.1.4 International students . . . . . . . . . . . . . . . . . . . . . . . . . . . . . . . . . . . . . . . . .39.36 182.1.5 Brain gain . . . . . . . . . . . . . . . . . . . . . . . . . . . . . . . . . . . . . . . . . . . . . . . . . . . . .40.63 792.2 Internal Openness . . . . . . . . . . . . . . . . . . . . . . . . . . . . . . . . . . . . . . . . . . 43.58 113
Social Inclusion2.2.1 Tolerance of minorities . . . . . . . . . . . . . . . . . . . . . . . . . . . . . . . . . . . . . . . .18.89 1092.2.2 Tolerance of immigrants . . . . . . . . . . . . . . . . . . . . . . . . . . . . . . . . . . . . . .35.62 1022.2.3 Social mobility . . . . . . . . . . . . . . . . . . . . . . . . . . . . . . . . . . . . . . . . . . . . . . . . 59.79 55
Gender Equality2.2.4 Female graduates . . . . . . . . . . . . . . . . . . . . . . . . . . . . . . . . . . . . . . . . . . . . . . .n/a n/a2.2.5 Gender development gap . . . . . . . . . . . . . . . . . . . . . . . . . . . . . . . . . . . .40.76 1202.2.6 Leadership opportunities for women . . . . . . . . . . . . . . . . . . . . . . . . .62.83 35
Score Rank
3 GROW . . . . . . . . . . . . . . . . . . . . . . . . . . . . . . . . . . . . . . . . . . . . .26.12 1143.1 Formal Education . . . . . . . . . . . . . . . . . . . . . . . . . . . . . . . . . . . . . . . . . . . . 3.10 129
Enrolment3.1.1 Vocational enrolment . . . . . . . . . . . . . . . . . . . . . . . . . . . . . . . . . . . . . . . . . . .n/a n/a3.1.2 Tertiary enrolment . . . . . . . . . . . . . . . . . . . . . . . . . . . . . . . . . . . . . . . . . . . . . 3.06 122
Quality3.1.3 Tertiary education expenditure . . . . . . . . . . . . . . . . . . . . . . . . . . . . . . . . 6.24 1053.1.4 Reading, maths, and science . . . . . . . . . . . . . . . . . . . . . . . . . . . . . . . . . . . .n/a n/a3.1.5 University ranking . . . . . . . . . . . . . . . . . . . . . . . . . . . . . . . . . . . . . . . . . . . . . . 0.00 753.2 Lifelong Learning . . . . . . . . . . . . . . . . . . . . . . . . . . . . . . . . . . . . . . . . . . . 36.65 883.2.1 Quality of management schools . . . . . . . . . . . . . . . . . . . . . . . . . . . . . . 35.76 1033.2.2 Prevalence of training in firms . . . . . . . . . . . . . . . . . . . . . . . . . . . . . . . . . 41.29 413.2.3 Employee development . . . . . . . . . . . . . . . . . . . . . . . . . . . . . . . . . . . . . . 32.91 823.3 Access to Growth Opportunities . . . . . . . . . . . . . . . . . . . . . . . . . . .38.60 104
Empowerment3.3.1 Delegation of authority . . . . . . . . . . . . . . . . . . . . . . . . . . . . . . . . . . . . . . . 46.17 653.3.2 Personal rights . . . . . . . . . . . . . . . . . . . . . . . . . . . . . . . . . . . . . . . . . . . . . . . . 49.70 101
Collaboration3.3.3 Use of virtual social networks . . . . . . . . . . . . . . . . . . . . . . . . . . . . . . . . .50.32 1143.3.4 Use of virtual professional networks . . . . . . . . . . . . . . . . . . . . . . . . . . . 1.48 1083.3.5 Collaboration within organisations . . . . . . . . . . . . . . . . . . . . . . . . . . . .50.70 533.3.6 Collaboration across organisations . . . . . . . . . . . . . . . . . . . . . . . . . . . .33.24 84
4 RETAIN . . . . . . . . . . . . . . . . . . . . . . . . . . . . . . . . . . . . . . . . . . . .21.41 1224.1 Sustainability . . . . . . . . . . . . . . . . . . . . . . . . . . . . . . . . . . . . . . . . . . . . . . . 25.26 1104.1.1 Pension system . . . . . . . . . . . . . . . . . . . . . . . . . . . . . . . . . . . . . . . . . . . . . . . . .n/a n/a4.1.2 Social protection . . . . . . . . . . . . . . . . . . . . . . . . . . . . . . . . . . . . . . . . . . . . . . 21.83 1144.1.3 Brain retention . . . . . . . . . . . . . . . . . . . . . . . . . . . . . . . . . . . . . . . . . . . . . . . .28.69 1004.2 Lifestyle . . . . . . . . . . . . . . . . . . . . . . . . . . . . . . . . . . . . . . . . . . . . . . . . . . . . 17.57 1284.2.1 Environmental performance . . . . . . . . . . . . . . . . . . . . . . . . . . . . . . . . . .28.09 1114.2.2 Personal safety . . . . . . . . . . . . . . . . . . . . . . . . . . . . . . . . . . . . . . . . . . . . . . . .28.00 1134.2.3 Physician density . . . . . . . . . . . . . . . . . . . . . . . . . . . . . . . . . . . . . . . . . . . . . . . 1.19 1144.2.4 Sanitation . . . . . . . . . . . . . . . . . . . . . . . . . . . . . . . . . . . . . . . . . . . . . . . . . . . . . 12.99 128
5 VOCATIONAL AND TECHNICAL SKILLS . . . . . . . . . . . . .27.84 1135.1 Mid-Level Skills . . . . . . . . . . . . . . . . . . . . . . . . . . . . . . . . . . . . . . . . . . . . . 13.03 1165.1.1 Workforce with secondary education . . . . . . . . . . . . . . . . . . . . . . . . .36.49 795.1.2 Population with secondary education . . . . . . . . . . . . . . . . . . . . . . . . . 1.06 1135.1.3 Technicians and associate professionals . . . . . . . . . . . . . . . . . . . . . . . 11.77 1085.1.4 Labour productivity per employee . . . . . . . . . . . . . . . . . . . . . . . . . . . . . 2.80 1025.2 Employability . . . . . . . . . . . . . . . . . . . . . . . . . . . . . . . . . . . . . . . . . . . . . . . 42.66 855.2.1 Ease of finding skilled employees . . . . . . . . . . . . . . . . . . . . . . . . . . . . 68.64 385.2.2 Relevance of education system to the economy . . . . . . . . . . . . . .40.82 765.2.3 Skills matching with secondary education . . . . . . . . . . . . . . . . . . . . 15.94 1275.2.4 Skills matching with tertiary education . . . . . . . . . . . . . . . . . . . . . . . .45.22 93
6 GLOBAL KNOWLEDGE SKILLS . . . . . . . . . . . . . . . . . . . . .11.66 1116.1 High-Level Skills . . . . . . . . . . . . . . . . . . . . . . . . . . . . . . . . . . . . . . . . . . . . 16.56 1076.1.1 Workforce with tertiary education . . . . . . . . . . . . . . . . . . . . . . . . . . . .13.20 986.1.2 Population with tertiary education . . . . . . . . . . . . . . . . . . . . . . . . . . . . 11.59 896.1.3 Professionals . . . . . . . . . . . . . . . . . . . . . . . . . . . . . . . . . . . . . . . . . . . . . . . . . . 14.74 976.1.4 Researchers . . . . . . . . . . . . . . . . . . . . . . . . . . . . . . . . . . . . . . . . . . . . . . . . . . . . 0.19 1046.1.5 Senior officials and managers . . . . . . . . . . . . . . . . . . . . . . . . . . . . . . . . . . 6.06 1066.1.6 Availability of scientists and engineers . . . . . . . . . . . . . . . . . . . . . . . .53.56 556.2 Talent Impact . . . . . . . . . . . . . . . . . . . . . . . . . . . . . . . . . . . . . . . . . . . . . . . . 6.76 1196.2.1 Innovation output . . . . . . . . . . . . . . . . . . . . . . . . . . . . . . . . . . . . . . . . . . . . 15.94 1046.2.2 High-value exports . . . . . . . . . . . . . . . . . . . . . . . . . . . . . . . . . . . . . . . . . . . . . 5.32 1026.2.3 New product entrepreneurial activity . . . . . . . . . . . . . . . . . . . . . . . . . . 8.70 886.2.4 New business density . . . . . . . . . . . . . . . . . . . . . . . . . . . . . . . . . . . . . . . . . . 3.32 786.2.5 Scientific journal articles . . . . . . . . . . . . . . . . . . . . . . . . . . . . . . . . . . . . . . . 0.53 106
l Uganda l Income group average

GTCI 2020 Country Profile by Pillar
THE GLOBAL TALENT COMPETITIVENESS INDEX 2020 249
COUNTRY PROFILESCOUNTRY PROFILES
102030405060708090100
Global knowledge skills
Vocational andtechnical skills
Retain
Grow
Attract
Enable
10203004
UKRAINEKey Indicators
Rank (out of 132) . . . . . . . . . . . . . . . . . . . . . . . . . . . . . . . . . . . . . . . 66Income group . . . . . . . . . . . . . . . . . . . . . . . . . . . Lower-middle incomeRegional group . . . . . . . . . . . . . . . . . . . . . . . . . . . . . . . . . . . . . . . . .EuropePopulation (millions) . . . . . . . . . . . . . . . . . . . . . . . . . . . . . . . . . . . . 44.62
GDP per capita (PPP US$) . . . . . . . . . . . . . . . . . . . . . . . . . . . . . 9,233.15GDP (US$ billions) . . . . . . . . . . . . . . . . . . . . . . . . . . . . . . . . . . . . . 130.83GTCI score . . . . . . . . . . . . . . . . . . . . . . . . . . . . . . . . . . . . . . . . . . . . . . 41.47GTCI score (income group average) . . . . . . . . . . . . . . . . . . . . . . . . 32.97
Score Rank
1 ENABLE . . . . . . . . . . . . . . . . . . . . . . . . . . . . . . . . . . . . . . . . . . 40.72 941.1 Regulatory Landscape . . . . . . . . . . . . . . . . . . . . . . . . . . . . . . . . . . . . . . 31.91 1151.1.1 Government effectiveness . . . . . . . . . . . . . . . . . . . . . . . . . . . . . . . . . . . .35.39 961.1.2 Rule of law . . . . . . . . . . . . . . . . . . . . . . . . . . . . . . . . . . . . . . . . . . . . . . . . . . . .36.05 1091.1.3 Political stability . . . . . . . . . . . . . . . . . . . . . . . . . . . . . . . . . . . . . . . . . . . . . . .23.61 1261.1.4 Regulatory quality. . . . . . . . . . . . . . . . . . . . . . . . . . . . . . . . . . . . . . . . . . . . .40.20 931.1.5 Corruption . . . . . . . . . . . . . . . . . . . . . . . . . . . . . . . . . . . . . . . . . . . . . . . . . . . .24.32 1001.2 Market Landscape . . . . . . . . . . . . . . . . . . . . . . . . . . . . . . . . . . . . . . . . . .48.89 701.2.1 Competition intensity . . . . . . . . . . . . . . . . . . . . . . . . . . . . . . . . . . . . . . . . . 61.78 821.2.2 Ease of doing business . . . . . . . . . . . . . . . . . . . . . . . . . . . . . . . . . . . . . . . . 67.24 661.2.3 Cluster development . . . . . . . . . . . . . . . . . . . . . . . . . . . . . . . . . . . . . . . . . . 27.43 1011.2.4 R&D expenditure . . . . . . . . . . . . . . . . . . . . . . . . . . . . . . . . . . . . . . . . . . . . . . . 9.51 671.2.5 ICT infrastructure. . . . . . . . . . . . . . . . . . . . . . . . . . . . . . . . . . . . . . . . . . . . . .62.60 611.2.6 Urban population . . . . . . . . . . . . . . . . . . . . . . . . . . . . . . . . . . . . . . . . . . . . .64.76 541.3 Business and Labour Landscape . . . . . . . . . . . . . . . . . . . . . . . . . . . . 41.36 81
Labour Market1.3.1 Tertiary-educated unemployment . . . . . . . . . . . . . . . . . . . . . . . . . . . . 74.65 851.3.2 Active labour market policies . . . . . . . . . . . . . . . . . . . . . . . . . . . . . . . . .48.54 571.3.3 Labour-employer cooperation . . . . . . . . . . . . . . . . . . . . . . . . . . . . . . . .35.50 76
Management Practice1.3.4 Professional management . . . . . . . . . . . . . . . . . . . . . . . . . . . . . . . . . . . . 32.13 1061.3.5 Relationship of pay to productivity . . . . . . . . . . . . . . . . . . . . . . . . . . . .56.49 51
Technology Adoption1.3.6 Technology utilisation. . . . . . . . . . . . . . . . . . . . . . . . . . . . . . . . . . . . . . . . .42.28 911.3.7 Investment in emerging technologies . . . . . . . . . . . . . . . . . . . . . . . .40.56 601.3.8 Robot density . . . . . . . . . . . . . . . . . . . . . . . . . . . . . . . . . . . . . . . . . . . . . . . . . . 0.74 55
2 ATTRACT . . . . . . . . . . . . . . . . . . . . . . . . . . . . . . . . . . . . . . . . . 43.64 932.1 External Openness . . . . . . . . . . . . . . . . . . . . . . . . . . . . . . . . . . . . . . . . . 34.01 98
Attract Business2.1.1 FDI and technology transfer . . . . . . . . . . . . . . . . . . . . . . . . . . . . . . . . . .36.29 1192.1.2 Prevalence of foreign ownership . . . . . . . . . . . . . . . . . . . . . . . . . . . . . . 33.75 119
Attract People2.1.3 Migrant stock . . . . . . . . . . . . . . . . . . . . . . . . . . . . . . . . . . . . . . . . . . . . . . . . .58.65 362.1.4 International students . . . . . . . . . . . . . . . . . . . . . . . . . . . . . . . . . . . . . . . . . 11.53 572.1.5 Brain gain . . . . . . . . . . . . . . . . . . . . . . . . . . . . . . . . . . . . . . . . . . . . . . . . . . . . .29.84 1002.2 Internal Openness . . . . . . . . . . . . . . . . . . . . . . . . . . . . . . . . . . . . . . . . . . 53.27 84
Social Inclusion2.2.1 Tolerance of minorities . . . . . . . . . . . . . . . . . . . . . . . . . . . . . . . . . . . . . . . .43.33 692.2.2 Tolerance of immigrants . . . . . . . . . . . . . . . . . . . . . . . . . . . . . . . . . . . . . .28.77 1092.2.3 Social mobility . . . . . . . . . . . . . . . . . . . . . . . . . . . . . . . . . . . . . . . . . . . . . . . .39.56 121
Gender Equality2.2.4 Female graduates . . . . . . . . . . . . . . . . . . . . . . . . . . . . . . . . . . . . . . . . . . . . .63.48 782.2.5 Gender development gap . . . . . . . . . . . . . . . . . . . . . . . . . . . . . . . . . . . .86.42 232.2.6 Leadership opportunities for women . . . . . . . . . . . . . . . . . . . . . . . . .58.09 44
Score Rank
3 GROW . . . . . . . . . . . . . . . . . . . . . . . . . . . . . . . . . . . . . . . . . . . . . 37.70 683.1 Formal Education . . . . . . . . . . . . . . . . . . . . . . . . . . . . . . . . . . . . . . . . . . . 33.83 48
Enrolment3.1.1 Vocational enrolment . . . . . . . . . . . . . . . . . . . . . . . . . . . . . . . . . . . . . . . . . 11.80 803.1.2 Tertiary enrolment . . . . . . . . . . . . . . . . . . . . . . . . . . . . . . . . . . . . . . . . . . . .65.80 13
Quality3.1.3 Tertiary education expenditure . . . . . . . . . . . . . . . . . . . . . . . . . . . . . . .36.20 213.1.4 Reading, maths, and science . . . . . . . . . . . . . . . . . . . . . . . . . . . . . . . . . . . .n/a n/a3.1.5 University ranking . . . . . . . . . . . . . . . . . . . . . . . . . . . . . . . . . . . . . . . . . . . . . 21.53 493.2 Lifelong Learning . . . . . . . . . . . . . . . . . . . . . . . . . . . . . . . . . . . . . . . . . . . 36.78 873.2.1 Quality of management schools . . . . . . . . . . . . . . . . . . . . . . . . . . . . . .48.94 623.2.2 Prevalence of training in firms . . . . . . . . . . . . . . . . . . . . . . . . . . . . . . . . .25.33 723.2.3 Employee development . . . . . . . . . . . . . . . . . . . . . . . . . . . . . . . . . . . . . .36.06 723.3 Access to Growth Opportunities . . . . . . . . . . . . . . . . . . . . . . . . . . . 42.50 87
Empowerment3.3.1 Delegation of authority . . . . . . . . . . . . . . . . . . . . . . . . . . . . . . . . . . . . . . .35.84 933.3.2 Personal rights . . . . . . . . . . . . . . . . . . . . . . . . . . . . . . . . . . . . . . . . . . . . . . . .60.05 88
Collaboration3.3.3 Use of virtual social networks . . . . . . . . . . . . . . . . . . . . . . . . . . . . . . . . . 59.73 1013.3.4 Use of virtual professional networks . . . . . . . . . . . . . . . . . . . . . . . . . . . 4.57 883.3.5 Collaboration within organisations . . . . . . . . . . . . . . . . . . . . . . . . . . . .53.22 443.3.6 Collaboration across organisations . . . . . . . . . . . . . . . . . . . . . . . . . . . . 41.62 57
4 RETAIN . . . . . . . . . . . . . . . . . . . . . . . . . . . . . . . . . . . . . . . . . . . .45.07 734.1 Sustainability . . . . . . . . . . . . . . . . . . . . . . . . . . . . . . . . . . . . . . . . . . . . . . . 34.48 874.1.1 Pension system . . . . . . . . . . . . . . . . . . . . . . . . . . . . . . . . . . . . . . . . . . . . . . . 47.06 574.1.2 Social protection . . . . . . . . . . . . . . . . . . . . . . . . . . . . . . . . . . . . . . . . . . . . . . 37.24 804.1.3 Brain retention . . . . . . . . . . . . . . . . . . . . . . . . . . . . . . . . . . . . . . . . . . . . . . . . 19.14 1184.2 Lifestyle . . . . . . . . . . . . . . . . . . . . . . . . . . . . . . . . . . . . . . . . . . . . . . . . . . . . 55.67 664.2.1 Environmental performance . . . . . . . . . . . . . . . . . . . . . . . . . . . . . . . . . . 42.41 894.2.2 Personal safety . . . . . . . . . . . . . . . . . . . . . . . . . . . . . . . . . . . . . . . . . . . . . . . .36.83 984.2.3 Physician density . . . . . . . . . . . . . . . . . . . . . . . . . . . . . . . . . . . . . . . . . . . . . . 47.80 374.2.4 Sanitation . . . . . . . . . . . . . . . . . . . . . . . . . . . . . . . . . . . . . . . . . . . . . . . . . . . . .95.63 50
5 VOCATIONAL AND TECHNICAL SKILLS . . . . . . . . . . . . 46.82 565.1 Mid-Level Skills . . . . . . . . . . . . . . . . . . . . . . . . . . . . . . . . . . . . . . . . . . . . . 40.65 635.1.1 Workforce with secondary education . . . . . . . . . . . . . . . . . . . . . . . . . 60.15 375.1.2 Population with secondary education . . . . . . . . . . . . . . . . . . . . . . . . . .n/a n/a5.1.3 Technicians and associate professionals . . . . . . . . . . . . . . . . . . . . . . .48.56 465.1.4 Labour productivity per employee . . . . . . . . . . . . . . . . . . . . . . . . . . . .13.23 805.2 Employability . . . . . . . . . . . . . . . . . . . . . . . . . . . . . . . . . . . . . . . . . . . . . . . 53.00 525.2.1 Ease of finding skilled employees . . . . . . . . . . . . . . . . . . . . . . . . . . . . .62.54 505.2.2 Relevance of education system to the economy . . . . . . . . . . . . . . 47.98 585.2.3 Skills matching with secondary education . . . . . . . . . . . . . . . . . . . . 45.92 575.2.4 Skills matching with tertiary education . . . . . . . . . . . . . . . . . . . . . . . .55.56 64
6 GLOBAL KNOWLEDGE SKILLS . . . . . . . . . . . . . . . . . . . . 34.83 466.1 High-Level Skills . . . . . . . . . . . . . . . . . . . . . . . . . . . . . . . . . . . . . . . . . . . . 50.36 266.1.1 Workforce with tertiary education . . . . . . . . . . . . . . . . . . . . . . . . . . . .80.84 36.1.2 Population with tertiary education . . . . . . . . . . . . . . . . . . . . . . . . . . . . . .n/a n/a6.1.3 Professionals . . . . . . . . . . . . . . . . . . . . . . . . . . . . . . . . . . . . . . . . . . . . . . . . . . 48.10 296.1.4 Researchers . . . . . . . . . . . . . . . . . . . . . . . . . . . . . . . . . . . . . . . . . . . . . . . . . . . 11.94 506.1.5 Senior officials and managers . . . . . . . . . . . . . . . . . . . . . . . . . . . . . . . . .49.40 256.1.6 Availability of scientists and engineers . . . . . . . . . . . . . . . . . . . . . . . . 61.54 416.2 Talent Impact . . . . . . . . . . . . . . . . . . . . . . . . . . . . . . . . . . . . . . . . . . . . . . . 19.30 736.2.1 Innovation output . . . . . . . . . . . . . . . . . . . . . . . . . . . . . . . . . . . . . . . . . . . .48.51 356.2.2 High-value exports . . . . . . . . . . . . . . . . . . . . . . . . . . . . . . . . . . . . . . . . . . . .14.82 726.2.3 New product entrepreneurial activity . . . . . . . . . . . . . . . . . . . . . . . . . . .n/a n/a6.2.4 New business density . . . . . . . . . . . . . . . . . . . . . . . . . . . . . . . . . . . . . . . . . . 7.39 606.2.5 Scientific journal articles . . . . . . . . . . . . . . . . . . . . . . . . . . . . . . . . . . . . . . . 6.46 62
l Ukraine l Income group average

GTCI 2020 Country Profile by Pillar
250 THE GLOBAL TALENT COMPETITIVENESS INDEX 2020
COUNTRY PROFILESCOUNTRY PROFILES
102030405060708090100
Global knowledge skills
Vocational andtechnical skills
Retain
Grow
Attract
Enable
102030405060607
UNITED ARAB EMIRATESKey Indicators
Rank (out of 132) . . . . . . . . . . . . . . . . . . . . . . . . . . . . . . . . . . . . . . . 22Income group . . . . . . . . . . . . . . . . . . . . . . . . . . . . . . . . . . . . High incomeRegional group . . . . . . . . . . . . . .Northern Africa and Western AsiaPopulation (millions) . . . . . . . . . . . . . . . . . . . . . . . . . . . . . . . . . . . . . .9.63
GDP per capita (PPP US$) . . . . . . . . . . . . . . . . . . . . . . . . . . . . 74,942.72GDP (US$ billions) . . . . . . . . . . . . . . . . . . . . . . . . . . . . . . . . . . . . . 414.18GTCI score . . . . . . . . . . . . . . . . . . . . . . . . . . . . . . . . . . . . . . . . . . . . . . 62.63GTCI score (income group average) . . . . . . . . . . . . . . . . . . . . . . . . 61.46
Score Rank
1 ENABLE . . . . . . . . . . . . . . . . . . . . . . . . . . . . . . . . . . . . . . . . . . 72.20 221.1 Regulatory Landscape . . . . . . . . . . . . . . . . . . . . . . . . . . . . . . . . . . . . . . 75.83 231.1.1 Government effectiveness . . . . . . . . . . . . . . . . . . . . . . . . . . . . . . . . . . . .80.43 181.1.2 Rule of law . . . . . . . . . . . . . . . . . . . . . . . . . . . . . . . . . . . . . . . . . . . . . . . . . . . . 71.29 331.1.3 Political stability . . . . . . . . . . . . . . . . . . . . . . . . . . . . . . . . . . . . . . . . . . . . . . .78.79 341.1.4 Regulatory quality. . . . . . . . . . . . . . . . . . . . . . . . . . . . . . . . . . . . . . . . . . . . .72.95 311.1.5 Corruption . . . . . . . . . . . . . . . . . . . . . . . . . . . . . . . . . . . . . . . . . . . . . . . . . . . .75.68 221.2 Market Landscape . . . . . . . . . . . . . . . . . . . . . . . . . . . . . . . . . . . . . . . . . . 72.34 201.2.1 Competition intensity . . . . . . . . . . . . . . . . . . . . . . . . . . . . . . . . . . . . . . . . .73.58 461.2.2 Ease of doing business . . . . . . . . . . . . . . . . . . . . . . . . . . . . . . . . . . . . . . . .90.51 101.2.3 Cluster development . . . . . . . . . . . . . . . . . . . . . . . . . . . . . . . . . . . . . . . . . .82.83 91.2.4 R&D expenditure . . . . . . . . . . . . . . . . . . . . . . . . . . . . . . . . . . . . . . . . . . . . . .20.81 361.2.5 ICT infrastructure. . . . . . . . . . . . . . . . . . . . . . . . . . . . . . . . . . . . . . . . . . . . . . 81.81 221.2.6 Urban population . . . . . . . . . . . . . . . . . . . . . . . . . . . . . . . . . . . . . . . . . . . . .84.50 211.3 Business and Labour Landscape . . . . . . . . . . . . . . . . . . . . . . . . . . . . 68.43 22
Labour Market1.3.1 Tertiary-educated unemployment . . . . . . . . . . . . . . . . . . . . . . . . . . . . 89.13 291.3.2 Active labour market policies . . . . . . . . . . . . . . . . . . . . . . . . . . . . . . . . .70.86 261.3.3 Labour-employer cooperation . . . . . . . . . . . . . . . . . . . . . . . . . . . . . . . . 67.80 16
Management Practice1.3.4 Professional management . . . . . . . . . . . . . . . . . . . . . . . . . . . . . . . . . . . .75.54 241.3.5 Relationship of pay to productivity . . . . . . . . . . . . . . . . . . . . . . . . . . . .84.76 6
Technology Adoption1.3.6 Technology utilisation. . . . . . . . . . . . . . . . . . . . . . . . . . . . . . . . . . . . . . . . .78.92 181.3.7 Investment in emerging technologies . . . . . . . . . . . . . . . . . . . . . . . .79.57 111.3.8 Robot density . . . . . . . . . . . . . . . . . . . . . . . . . . . . . . . . . . . . . . . . . . . . . . . . . . 0.90 54
2 ATTRACT . . . . . . . . . . . . . . . . . . . . . . . . . . . . . . . . . . . . . . . . . .85.51 32.1 External Openness . . . . . . . . . . . . . . . . . . . . . . . . . . . . . . . . . . . . . . . . . 89.96 3
Attract Business2.1.1 FDI and technology transfer . . . . . . . . . . . . . . . . . . . . . . . . . . . . . . . . . . 81.39 152.1.2 Prevalence of foreign ownership . . . . . . . . . . . . . . . . . . . . . . . . . . . . . . 77.04 26
Attract People2.1.3 Migrant stock . . . . . . . . . . . . . . . . . . . . . . . . . . . . . . . . . . . . . . . . . . . . . . . 100.00 12.1.4 International students . . . . . . . . . . . . . . . . . . . . . . . . . . . . . . . . . . . . . . . 100.00 12.1.5 Brain gain . . . . . . . . . . . . . . . . . . . . . . . . . . . . . . . . . . . . . . . . . . . . . . . . . . . . . 91.35 62.2 Internal Openness . . . . . . . . . . . . . . . . . . . . . . . . . . . . . . . . . . . . . . . . . . 81.07 9
Social Inclusion2.2.1 Tolerance of minorities . . . . . . . . . . . . . . . . . . . . . . . . . . . . . . . . . . . . . . . .80.00 112.2.2 Tolerance of immigrants . . . . . . . . . . . . . . . . . . . . . . . . . . . . . . . . . . . . . .95.89 42.2.3 Social mobility . . . . . . . . . . . . . . . . . . . . . . . . . . . . . . . . . . . . . . . . . . . . . . . .82.82 15
Gender Equality2.2.4 Female graduates . . . . . . . . . . . . . . . . . . . . . . . . . . . . . . . . . . . . . . . . . . . . . 68.14 732.2.5 Gender development gap . . . . . . . . . . . . . . . . . . . . . . . . . . . . . . . . . . . . 77.56 662.2.6 Leadership opportunities for women . . . . . . . . . . . . . . . . . . . . . . . . . 81.98 9
Score Rank
3 GROW . . . . . . . . . . . . . . . . . . . . . . . . . . . . . . . . . . . . . . . . . . . . 56.03 243.1 Formal Education . . . . . . . . . . . . . . . . . . . . . . . . . . . . . . . . . . . . . . . . . . . 26.73 64
Enrolment3.1.1 Vocational enrolment . . . . . . . . . . . . . . . . . . . . . . . . . . . . . . . . . . . . . . . . . . 2.87 1083.1.2 Tertiary enrolment . . . . . . . . . . . . . . . . . . . . . . . . . . . . . . . . . . . . . . . . . . . . . .n/a n/a
Quality3.1.3 Tertiary education expenditure . . . . . . . . . . . . . . . . . . . . . . . . . . . . . . . . .n/a n/a3.1.4 Reading, maths, and science . . . . . . . . . . . . . . . . . . . . . . . . . . . . . . . . . .44.01 463.1.5 University ranking . . . . . . . . . . . . . . . . . . . . . . . . . . . . . . . . . . . . . . . . . . . . .33.30 363.2 Lifelong Learning . . . . . . . . . . . . . . . . . . . . . . . . . . . . . . . . . . . . . . . . . . . 70.98 213.2.1 Quality of management schools . . . . . . . . . . . . . . . . . . . . . . . . . . . . . . 71.87 243.2.2 Prevalence of training in firms . . . . . . . . . . . . . . . . . . . . . . . . . . . . . . . . . . .n/a n/a3.2.3 Employee development . . . . . . . . . . . . . . . . . . . . . . . . . . . . . . . . . . . . . .70.09 193.3 Access to Growth Opportunities . . . . . . . . . . . . . . . . . . . . . . . . . . . 70.39 20
Empowerment3.3.1 Delegation of authority . . . . . . . . . . . . . . . . . . . . . . . . . . . . . . . . . . . . . . . 71.65 233.3.2 Personal rights . . . . . . . . . . . . . . . . . . . . . . . . . . . . . . . . . . . . . . . . . . . . . . . . 31.40 114
Collaboration3.3.3 Use of virtual social networks . . . . . . . . . . . . . . . . . . . . . . . . . . . . . . . . .79.00 543.3.4 Use of virtual professional networks . . . . . . . . . . . . . . . . . . . . . . . . 100.00 13.3.5 Collaboration within organisations . . . . . . . . . . . . . . . . . . . . . . . . . . . .70.66 253.3.6 Collaboration across organisations . . . . . . . . . . . . . . . . . . . . . . . . . . . . 69.61 12
4 RETAIN . . . . . . . . . . . . . . . . . . . . . . . . . . . . . . . . . . . . . . . . . . . .67.02 294.1 Sustainability . . . . . . . . . . . . . . . . . . . . . . . . . . . . . . . . . . . . . . . . . . . . . . . 76.82 194.1.1 Pension system . . . . . . . . . . . . . . . . . . . . . . . . . . . . . . . . . . . . . . . . . . . . . . . . .n/a n/a4.1.2 Social protection . . . . . . . . . . . . . . . . . . . . . . . . . . . . . . . . . . . . . . . . . . . . . .62.57 344.1.3 Brain retention . . . . . . . . . . . . . . . . . . . . . . . . . . . . . . . . . . . . . . . . . . . . . . . . 91.08 34.2 Lifestyle . . . . . . . . . . . . . . . . . . . . . . . . . . . . . . . . . . . . . . . . . . . . . . . . . . . . 57.21 584.2.1 Environmental performance . . . . . . . . . . . . . . . . . . . . . . . . . . . . . . . . . .52.46 664.2.2 Personal safety . . . . . . . . . . . . . . . . . . . . . . . . . . . . . . . . . . . . . . . . . . . . . . . . 51.73 694.2.3 Physician density . . . . . . . . . . . . . . . . . . . . . . . . . . . . . . . . . . . . . . . . . . . . . .24.68 724.2.4 Sanitation . . . . . . . . . . . . . . . . . . . . . . . . . . . . . . . . . . . . . . . . . . . . . . . . . . . . .99.98 10
5 VOCATIONAL AND TECHNICAL SKILLS . . . . . . . . . . . . .57.24 315.1 Mid-Level Skills . . . . . . . . . . . . . . . . . . . . . . . . . . . . . . . . . . . . . . . . . . . . . 38.57 665.1.1 Workforce with secondary education . . . . . . . . . . . . . . . . . . . . . . . . . 21.27 1045.1.2 Population with secondary education . . . . . . . . . . . . . . . . . . . . . . . .24.72 845.1.3 Technicians and associate professionals . . . . . . . . . . . . . . . . . . . . . . . 44.19 495.1.4 Labour productivity per employee . . . . . . . . . . . . . . . . . . . . . . . . . . . . 64.11 105.2 Employability . . . . . . . . . . . . . . . . . . . . . . . . . . . . . . . . . . . . . . . . . . . . . . . 75.90 165.2.1 Ease of finding skilled employees . . . . . . . . . . . . . . . . . . . . . . . . . . . . .82.28 95.2.2 Relevance of education system to the economy . . . . . . . . . . . . . .73.82 135.2.3 Skills matching with secondary education . . . . . . . . . . . . . . . . . . . .70.50 145.2.4 Skills matching with tertiary education . . . . . . . . . . . . . . . . . . . . . . . . 77.01 22
6 GLOBAL KNOWLEDGE SKILLS . . . . . . . . . . . . . . . . . . . . . 37.79 386.1 High-Level Skills . . . . . . . . . . . . . . . . . . . . . . . . . . . . . . . . . . . . . . . . . . . . 51.64 246.1.1 Workforce with tertiary education . . . . . . . . . . . . . . . . . . . . . . . . . . . .55.08 246.1.2 Population with tertiary education . . . . . . . . . . . . . . . . . . . . . . . . . . . .55.50 176.1.3 Professionals . . . . . . . . . . . . . . . . . . . . . . . . . . . . . . . . . . . . . . . . . . . . . . . . . .35.27 496.1.4 Researchers . . . . . . . . . . . . . . . . . . . . . . . . . . . . . . . . . . . . . . . . . . . . . . . . . . .29.08 346.1.5 Senior officials and managers . . . . . . . . . . . . . . . . . . . . . . . . . . . . . . . . .54.03 216.1.6 Availability of scientists and engineers . . . . . . . . . . . . . . . . . . . . . . . .80.89 96.2 Talent Impact . . . . . . . . . . . . . . . . . . . . . . . . . . . . . . . . . . . . . . . . . . . . . . . 23.94 616.2.1 Innovation output . . . . . . . . . . . . . . . . . . . . . . . . . . . . . . . . . . . . . . . . . . . .35.55 576.2.2 High-value exports . . . . . . . . . . . . . . . . . . . . . . . . . . . . . . . . . . . . . . . . . . . . . 6.90 936.2.3 New product entrepreneurial activity . . . . . . . . . . . . . . . . . . . . . . . . .55.46 346.2.4 New business density . . . . . . . . . . . . . . . . . . . . . . . . . . . . . . . . . . . . . . . . .12.60 416.2.5 Scientific journal articles . . . . . . . . . . . . . . . . . . . . . . . . . . . . . . . . . . . . . . . 9.20 54
l United Arab Emirates l Income group average
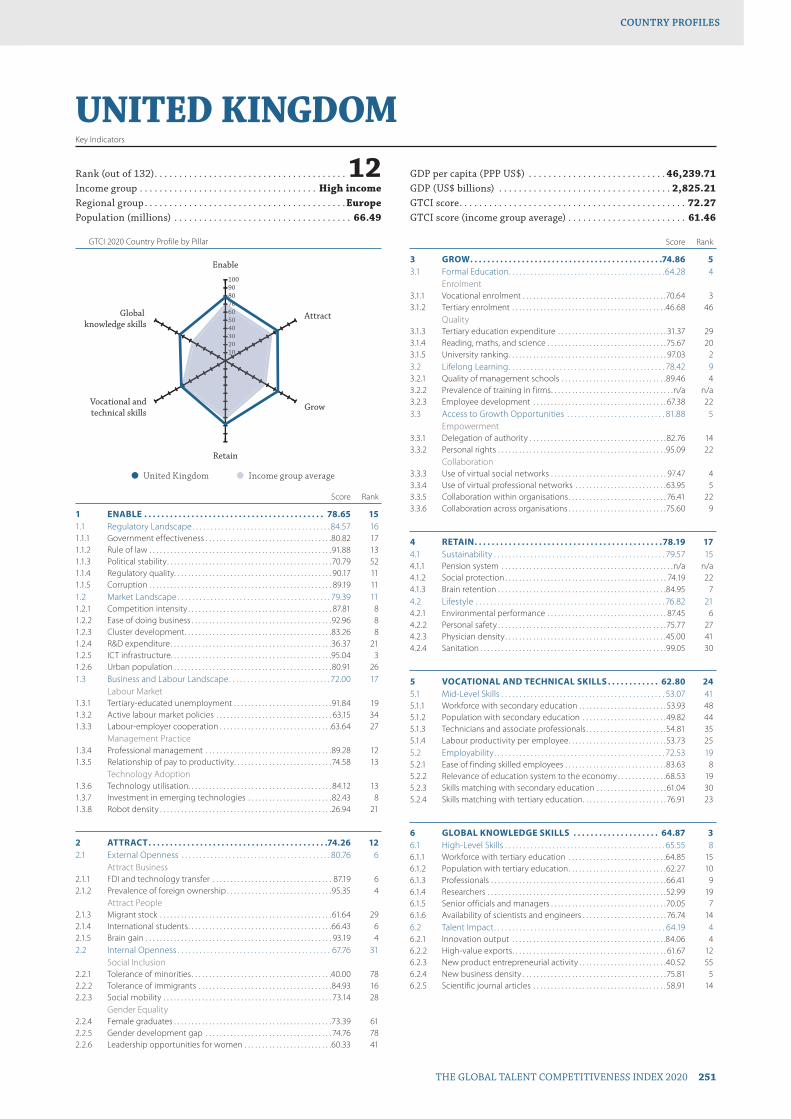
GTCI 2020 Country Profile by Pillar
THE GLOBAL TALENT COMPETITIVENESS INDEX 2020 251
COUNTRY PROFILESCOUNTRY PROFILES
102030405060708090100
Global knowledge skills
Vocational andtechnical skills
Retain
Grow
Attract
Enable
102030405060607
UNITED KINGDOMKey Indicators
Rank (out of 132) . . . . . . . . . . . . . . . . . . . . . . . . . . . . . . . . . . . . . . . 12Income group . . . . . . . . . . . . . . . . . . . . . . . . . . . . . . . . . . . . High incomeRegional group . . . . . . . . . . . . . . . . . . . . . . . . . . . . . . . . . . . . . . . . .EuropePopulation (millions) . . . . . . . . . . . . . . . . . . . . . . . . . . . . . . . . . . . . 66.49
GDP per capita (PPP US$) . . . . . . . . . . . . . . . . . . . . . . . . . . . . 46,239.71GDP (US$ billions) . . . . . . . . . . . . . . . . . . . . . . . . . . . . . . . . . . . 2,825.21GTCI score . . . . . . . . . . . . . . . . . . . . . . . . . . . . . . . . . . . . . . . . . . . . . . 72.27GTCI score (income group average) . . . . . . . . . . . . . . . . . . . . . . . . 61.46
Score Rank
1 ENABLE . . . . . . . . . . . . . . . . . . . . . . . . . . . . . . . . . . . . . . . . . . 78.65 151.1 Regulatory Landscape . . . . . . . . . . . . . . . . . . . . . . . . . . . . . . . . . . . . . . 84.57 161.1.1 Government effectiveness . . . . . . . . . . . . . . . . . . . . . . . . . . . . . . . . . . . .80.82 171.1.2 Rule of law . . . . . . . . . . . . . . . . . . . . . . . . . . . . . . . . . . . . . . . . . . . . . . . . . . . .91.88 131.1.3 Political stability . . . . . . . . . . . . . . . . . . . . . . . . . . . . . . . . . . . . . . . . . . . . . . .70.79 521.1.4 Regulatory quality. . . . . . . . . . . . . . . . . . . . . . . . . . . . . . . . . . . . . . . . . . . . . 90.17 111.1.5 Corruption . . . . . . . . . . . . . . . . . . . . . . . . . . . . . . . . . . . . . . . . . . . . . . . . . . . . 89.19 111.2 Market Landscape . . . . . . . . . . . . . . . . . . . . . . . . . . . . . . . . . . . . . . . . . . 79.39 111.2.1 Competition intensity . . . . . . . . . . . . . . . . . . . . . . . . . . . . . . . . . . . . . . . . . 87.81 81.2.2 Ease of doing business . . . . . . . . . . . . . . . . . . . . . . . . . . . . . . . . . . . . . . . .92.96 81.2.3 Cluster development . . . . . . . . . . . . . . . . . . . . . . . . . . . . . . . . . . . . . . . . . .83.26 81.2.4 R&D expenditure . . . . . . . . . . . . . . . . . . . . . . . . . . . . . . . . . . . . . . . . . . . . . .36.37 211.2.5 ICT infrastructure. . . . . . . . . . . . . . . . . . . . . . . . . . . . . . . . . . . . . . . . . . . . . .95.04 31.2.6 Urban population . . . . . . . . . . . . . . . . . . . . . . . . . . . . . . . . . . . . . . . . . . . . .80.91 261.3 Business and Labour Landscape . . . . . . . . . . . . . . . . . . . . . . . . . . . . 72.00 17
Labour Market1.3.1 Tertiary-educated unemployment . . . . . . . . . . . . . . . . . . . . . . . . . . . .91.84 191.3.2 Active labour market policies . . . . . . . . . . . . . . . . . . . . . . . . . . . . . . . . . 63.15 341.3.3 Labour-employer cooperation . . . . . . . . . . . . . . . . . . . . . . . . . . . . . . . .63.64 27
Management Practice1.3.4 Professional management . . . . . . . . . . . . . . . . . . . . . . . . . . . . . . . . . . . .89.28 121.3.5 Relationship of pay to productivity . . . . . . . . . . . . . . . . . . . . . . . . . . . .74.58 13
Technology Adoption1.3.6 Technology utilisation. . . . . . . . . . . . . . . . . . . . . . . . . . . . . . . . . . . . . . . . . 84.12 131.3.7 Investment in emerging technologies . . . . . . . . . . . . . . . . . . . . . . . .82.43 81.3.8 Robot density . . . . . . . . . . . . . . . . . . . . . . . . . . . . . . . . . . . . . . . . . . . . . . . . .26.94 21
2 ATTRACT . . . . . . . . . . . . . . . . . . . . . . . . . . . . . . . . . . . . . . . . . .74.26 122.1 External Openness . . . . . . . . . . . . . . . . . . . . . . . . . . . . . . . . . . . . . . . . . 80.76 6
Attract Business2.1.1 FDI and technology transfer . . . . . . . . . . . . . . . . . . . . . . . . . . . . . . . . . . 87.19 62.1.2 Prevalence of foreign ownership . . . . . . . . . . . . . . . . . . . . . . . . . . . . . .95.35 4
Attract People2.1.3 Migrant stock . . . . . . . . . . . . . . . . . . . . . . . . . . . . . . . . . . . . . . . . . . . . . . . . . 61.64 292.1.4 International students . . . . . . . . . . . . . . . . . . . . . . . . . . . . . . . . . . . . . . . . .66.43 62.1.5 Brain gain . . . . . . . . . . . . . . . . . . . . . . . . . . . . . . . . . . . . . . . . . . . . . . . . . . . . . 93.19 42.2 Internal Openness . . . . . . . . . . . . . . . . . . . . . . . . . . . . . . . . . . . . . . . . . . 67.76 31
Social Inclusion2.2.1 Tolerance of minorities . . . . . . . . . . . . . . . . . . . . . . . . . . . . . . . . . . . . . . . .40.00 782.2.2 Tolerance of immigrants . . . . . . . . . . . . . . . . . . . . . . . . . . . . . . . . . . . . . .84.93 162.2.3 Social mobility . . . . . . . . . . . . . . . . . . . . . . . . . . . . . . . . . . . . . . . . . . . . . . . . 73.14 28
Gender Equality2.2.4 Female graduates . . . . . . . . . . . . . . . . . . . . . . . . . . . . . . . . . . . . . . . . . . . . .73.39 612.2.5 Gender development gap . . . . . . . . . . . . . . . . . . . . . . . . . . . . . . . . . . . . 74.76 782.2.6 Leadership opportunities for women . . . . . . . . . . . . . . . . . . . . . . . . .60.33 41
Score Rank
3 GROW . . . . . . . . . . . . . . . . . . . . . . . . . . . . . . . . . . . . . . . . . . . . .74.86 53.1 Formal Education . . . . . . . . . . . . . . . . . . . . . . . . . . . . . . . . . . . . . . . . . . .64.28 4
Enrolment3.1.1 Vocational enrolment . . . . . . . . . . . . . . . . . . . . . . . . . . . . . . . . . . . . . . . . .70.64 33.1.2 Tertiary enrolment . . . . . . . . . . . . . . . . . . . . . . . . . . . . . . . . . . . . . . . . . . . .46.68 46
Quality3.1.3 Tertiary education expenditure . . . . . . . . . . . . . . . . . . . . . . . . . . . . . . . 31.37 293.1.4 Reading, maths, and science . . . . . . . . . . . . . . . . . . . . . . . . . . . . . . . . . .75.67 203.1.5 University ranking . . . . . . . . . . . . . . . . . . . . . . . . . . . . . . . . . . . . . . . . . . . . . 97.03 23.2 Lifelong Learning . . . . . . . . . . . . . . . . . . . . . . . . . . . . . . . . . . . . . . . . . . . 78.42 93.2.1 Quality of management schools . . . . . . . . . . . . . . . . . . . . . . . . . . . . . .89.46 43.2.2 Prevalence of training in firms . . . . . . . . . . . . . . . . . . . . . . . . . . . . . . . . . . .n/a n/a3.2.3 Employee development . . . . . . . . . . . . . . . . . . . . . . . . . . . . . . . . . . . . . . 67.38 223.3 Access to Growth Opportunities . . . . . . . . . . . . . . . . . . . . . . . . . . . 81.88 5
Empowerment3.3.1 Delegation of authority . . . . . . . . . . . . . . . . . . . . . . . . . . . . . . . . . . . . . . . 82.76 143.3.2 Personal rights . . . . . . . . . . . . . . . . . . . . . . . . . . . . . . . . . . . . . . . . . . . . . . . .95.09 22
Collaboration3.3.3 Use of virtual social networks . . . . . . . . . . . . . . . . . . . . . . . . . . . . . . . . . 97.47 43.3.4 Use of virtual professional networks . . . . . . . . . . . . . . . . . . . . . . . . . .63.95 53.3.5 Collaboration within organisations . . . . . . . . . . . . . . . . . . . . . . . . . . . . 76.41 223.3.6 Collaboration across organisations . . . . . . . . . . . . . . . . . . . . . . . . . . . .75.60 9
4 RETAIN . . . . . . . . . . . . . . . . . . . . . . . . . . . . . . . . . . . . . . . . . . . .78.19 174.1 Sustainability . . . . . . . . . . . . . . . . . . . . . . . . . . . . . . . . . . . . . . . . . . . . . . . 79.57 154.1.1 Pension system . . . . . . . . . . . . . . . . . . . . . . . . . . . . . . . . . . . . . . . . . . . . . . . . .n/a n/a4.1.2 Social protection . . . . . . . . . . . . . . . . . . . . . . . . . . . . . . . . . . . . . . . . . . . . . . 74.19 224.1.3 Brain retention . . . . . . . . . . . . . . . . . . . . . . . . . . . . . . . . . . . . . . . . . . . . . . . .84.95 74.2 Lifestyle . . . . . . . . . . . . . . . . . . . . . . . . . . . . . . . . . . . . . . . . . . . . . . . . . . . . 76.82 214.2.1 Environmental performance . . . . . . . . . . . . . . . . . . . . . . . . . . . . . . . . . . 87.45 64.2.2 Personal safety . . . . . . . . . . . . . . . . . . . . . . . . . . . . . . . . . . . . . . . . . . . . . . . .75.77 274.2.3 Physician density . . . . . . . . . . . . . . . . . . . . . . . . . . . . . . . . . . . . . . . . . . . . . .45.00 414.2.4 Sanitation . . . . . . . . . . . . . . . . . . . . . . . . . . . . . . . . . . . . . . . . . . . . . . . . . . . . .99.05 30
5 VOCATIONAL AND TECHNICAL SKILLS . . . . . . . . . . . . 62.80 245.1 Mid-Level Skills . . . . . . . . . . . . . . . . . . . . . . . . . . . . . . . . . . . . . . . . . . . . . 53.07 415.1.1 Workforce with secondary education . . . . . . . . . . . . . . . . . . . . . . . . . 53.93 485.1.2 Population with secondary education . . . . . . . . . . . . . . . . . . . . . . . .49.82 445.1.3 Technicians and associate professionals . . . . . . . . . . . . . . . . . . . . . . .54.81 355.1.4 Labour productivity per employee . . . . . . . . . . . . . . . . . . . . . . . . . . . .53.73 255.2 Employability . . . . . . . . . . . . . . . . . . . . . . . . . . . . . . . . . . . . . . . . . . . . . . . 72.53 195.2.1 Ease of finding skilled employees . . . . . . . . . . . . . . . . . . . . . . . . . . . . .83.63 85.2.2 Relevance of education system to the economy . . . . . . . . . . . . . .68.53 195.2.3 Skills matching with secondary education . . . . . . . . . . . . . . . . . . . . 61.04 305.2.4 Skills matching with tertiary education . . . . . . . . . . . . . . . . . . . . . . . . 76.91 23
6 GLOBAL KNOWLEDGE SKILLS . . . . . . . . . . . . . . . . . . . . 64.87 36.1 High-Level Skills . . . . . . . . . . . . . . . . . . . . . . . . . . . . . . . . . . . . . . . . . . . . 65.55 86.1.1 Workforce with tertiary education . . . . . . . . . . . . . . . . . . . . . . . . . . . .64.85 156.1.2 Population with tertiary education . . . . . . . . . . . . . . . . . . . . . . . . . . . .62.27 106.1.3 Professionals . . . . . . . . . . . . . . . . . . . . . . . . . . . . . . . . . . . . . . . . . . . . . . . . . .66.41 96.1.4 Researchers . . . . . . . . . . . . . . . . . . . . . . . . . . . . . . . . . . . . . . . . . . . . . . . . . . .52.99 196.1.5 Senior officials and managers . . . . . . . . . . . . . . . . . . . . . . . . . . . . . . . . .70.05 76.1.6 Availability of scientists and engineers . . . . . . . . . . . . . . . . . . . . . . . . 76.74 146.2 Talent Impact . . . . . . . . . . . . . . . . . . . . . . . . . . . . . . . . . . . . . . . . . . . . . . . 64.19 46.2.1 Innovation output . . . . . . . . . . . . . . . . . . . . . . . . . . . . . . . . . . . . . . . . . . . .84.06 46.2.2 High-value exports . . . . . . . . . . . . . . . . . . . . . . . . . . . . . . . . . . . . . . . . . . . . 61.67 126.2.3 New product entrepreneurial activity . . . . . . . . . . . . . . . . . . . . . . . . .40.52 556.2.4 New business density . . . . . . . . . . . . . . . . . . . . . . . . . . . . . . . . . . . . . . . . .75.81 56.2.5 Scientific journal articles . . . . . . . . . . . . . . . . . . . . . . . . . . . . . . . . . . . . . .58.91 14
l United Kingdom l Income group average
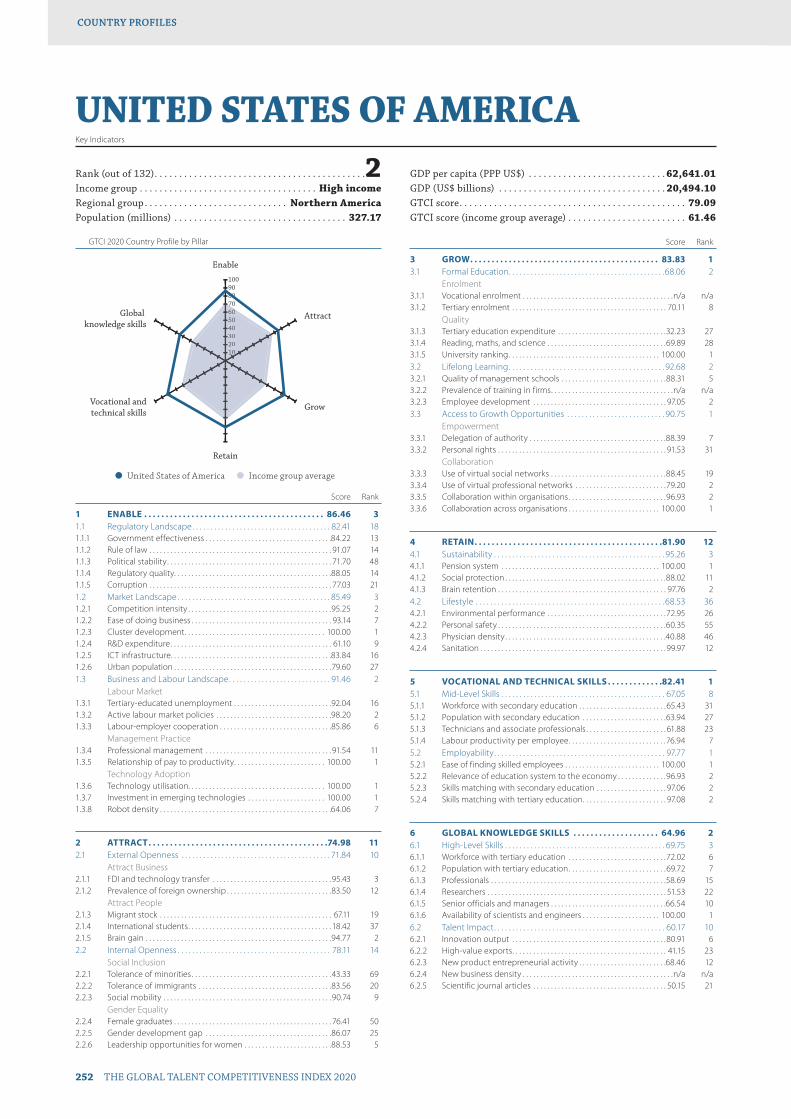
GTCI 2020 Country Profile by Pillar
252 THE GLOBAL TALENT COMPETITIVENESS INDEX 2020
COUNTRY PROFILESCOUNTRY PROFILES
102030405060708090100
Global knowledge skills
Vocational andtechnical skills
Retain
Grow
Attract
Enable
102030405060607
UNITED STATES OF AMERICAKey Indicators
Rank (out of 132) . . . . . . . . . . . . . . . . . . . . . . . . . . . . . . . . . . . . . . . . . . .2Income group . . . . . . . . . . . . . . . . . . . . . . . . . . . . . . . . . . . . High incomeRegional group . . . . . . . . . . . . . . . . . . . . . . . . . . . . . Northern AmericaPopulation (millions) . . . . . . . . . . . . . . . . . . . . . . . . . . . . . . . . . . . 327.17
GDP per capita (PPP US$) . . . . . . . . . . . . . . . . . . . . . . . . . . . . 62,641.01GDP (US$ billions) . . . . . . . . . . . . . . . . . . . . . . . . . . . . . . . . . . 20,494.10GTCI score . . . . . . . . . . . . . . . . . . . . . . . . . . . . . . . . . . . . . . . . . . . . . . 79.09GTCI score (income group average) . . . . . . . . . . . . . . . . . . . . . . . . 61.46
Score Rank
1 ENABLE . . . . . . . . . . . . . . . . . . . . . . . . . . . . . . . . . . . . . . . . . . 86.46 31.1 Regulatory Landscape . . . . . . . . . . . . . . . . . . . . . . . . . . . . . . . . . . . . . . 82.41 181.1.1 Government effectiveness . . . . . . . . . . . . . . . . . . . . . . . . . . . . . . . . . . . .84.22 131.1.2 Rule of law . . . . . . . . . . . . . . . . . . . . . . . . . . . . . . . . . . . . . . . . . . . . . . . . . . . . 91.07 141.1.3 Political stability . . . . . . . . . . . . . . . . . . . . . . . . . . . . . . . . . . . . . . . . . . . . . . . 71.70 481.1.4 Regulatory quality. . . . . . . . . . . . . . . . . . . . . . . . . . . . . . . . . . . . . . . . . . . . .88.05 141.1.5 Corruption . . . . . . . . . . . . . . . . . . . . . . . . . . . . . . . . . . . . . . . . . . . . . . . . . . . . 77.03 211.2 Market Landscape . . . . . . . . . . . . . . . . . . . . . . . . . . . . . . . . . . . . . . . . . . 85.49 31.2.1 Competition intensity . . . . . . . . . . . . . . . . . . . . . . . . . . . . . . . . . . . . . . . . .95.25 21.2.2 Ease of doing business . . . . . . . . . . . . . . . . . . . . . . . . . . . . . . . . . . . . . . . . 93.14 71.2.3 Cluster development . . . . . . . . . . . . . . . . . . . . . . . . . . . . . . . . . . . . . . . . 100.00 11.2.4 R&D expenditure . . . . . . . . . . . . . . . . . . . . . . . . . . . . . . . . . . . . . . . . . . . . . . 61.10 91.2.5 ICT infrastructure. . . . . . . . . . . . . . . . . . . . . . . . . . . . . . . . . . . . . . . . . . . . . .83.84 161.2.6 Urban population . . . . . . . . . . . . . . . . . . . . . . . . . . . . . . . . . . . . . . . . . . . . .79.60 271.3 Business and Labour Landscape . . . . . . . . . . . . . . . . . . . . . . . . . . . . 91.46 2
Labour Market1.3.1 Tertiary-educated unemployment . . . . . . . . . . . . . . . . . . . . . . . . . . . .92.04 161.3.2 Active labour market policies . . . . . . . . . . . . . . . . . . . . . . . . . . . . . . . . .98.20 21.3.3 Labour-employer cooperation . . . . . . . . . . . . . . . . . . . . . . . . . . . . . . . .85.86 6
Management Practice1.3.4 Professional management . . . . . . . . . . . . . . . . . . . . . . . . . . . . . . . . . . . . 91.54 111.3.5 Relationship of pay to productivity . . . . . . . . . . . . . . . . . . . . . . . . . . 100.00 1
Technology Adoption1.3.6 Technology utilisation. . . . . . . . . . . . . . . . . . . . . . . . . . . . . . . . . . . . . . . 100.00 11.3.7 Investment in emerging technologies . . . . . . . . . . . . . . . . . . . . . . 100.00 11.3.8 Robot density . . . . . . . . . . . . . . . . . . . . . . . . . . . . . . . . . . . . . . . . . . . . . . . . .64.06 7
2 ATTRACT . . . . . . . . . . . . . . . . . . . . . . . . . . . . . . . . . . . . . . . . . .74.98 112.1 External Openness . . . . . . . . . . . . . . . . . . . . . . . . . . . . . . . . . . . . . . . . . 71.84 10
Attract Business2.1.1 FDI and technology transfer . . . . . . . . . . . . . . . . . . . . . . . . . . . . . . . . . .95.43 32.1.2 Prevalence of foreign ownership . . . . . . . . . . . . . . . . . . . . . . . . . . . . . .83.50 12
Attract People2.1.3 Migrant stock . . . . . . . . . . . . . . . . . . . . . . . . . . . . . . . . . . . . . . . . . . . . . . . . . 67.11 192.1.4 International students . . . . . . . . . . . . . . . . . . . . . . . . . . . . . . . . . . . . . . . . . 18.42 372.1.5 Brain gain . . . . . . . . . . . . . . . . . . . . . . . . . . . . . . . . . . . . . . . . . . . . . . . . . . . . .94.77 22.2 Internal Openness . . . . . . . . . . . . . . . . . . . . . . . . . . . . . . . . . . . . . . . . . . 78.11 14
Social Inclusion2.2.1 Tolerance of minorities . . . . . . . . . . . . . . . . . . . . . . . . . . . . . . . . . . . . . . . .43.33 692.2.2 Tolerance of immigrants . . . . . . . . . . . . . . . . . . . . . . . . . . . . . . . . . . . . . .83.56 202.2.3 Social mobility . . . . . . . . . . . . . . . . . . . . . . . . . . . . . . . . . . . . . . . . . . . . . . . .90.74 9
Gender Equality2.2.4 Female graduates . . . . . . . . . . . . . . . . . . . . . . . . . . . . . . . . . . . . . . . . . . . . . 76.41 502.2.5 Gender development gap . . . . . . . . . . . . . . . . . . . . . . . . . . . . . . . . . . . .86.07 252.2.6 Leadership opportunities for women . . . . . . . . . . . . . . . . . . . . . . . . .88.53 5
Score Rank
3 GROW . . . . . . . . . . . . . . . . . . . . . . . . . . . . . . . . . . . . . . . . . . . . 83.83 13.1 Formal Education . . . . . . . . . . . . . . . . . . . . . . . . . . . . . . . . . . . . . . . . . . .68.06 2
Enrolment3.1.1 Vocational enrolment . . . . . . . . . . . . . . . . . . . . . . . . . . . . . . . . . . . . . . . . . . .n/a n/a3.1.2 Tertiary enrolment . . . . . . . . . . . . . . . . . . . . . . . . . . . . . . . . . . . . . . . . . . . . 70.11 8
Quality3.1.3 Tertiary education expenditure . . . . . . . . . . . . . . . . . . . . . . . . . . . . . . .32.23 273.1.4 Reading, maths, and science . . . . . . . . . . . . . . . . . . . . . . . . . . . . . . . . . .69.89 283.1.5 University ranking . . . . . . . . . . . . . . . . . . . . . . . . . . . . . . . . . . . . . . . . . . . 100.00 13.2 Lifelong Learning . . . . . . . . . . . . . . . . . . . . . . . . . . . . . . . . . . . . . . . . . . . 92.68 23.2.1 Quality of management schools . . . . . . . . . . . . . . . . . . . . . . . . . . . . . .88.31 53.2.2 Prevalence of training in firms . . . . . . . . . . . . . . . . . . . . . . . . . . . . . . . . . . .n/a n/a3.2.3 Employee development . . . . . . . . . . . . . . . . . . . . . . . . . . . . . . . . . . . . . . 97.05 23.3 Access to Growth Opportunities . . . . . . . . . . . . . . . . . . . . . . . . . . . 90.75 1
Empowerment3.3.1 Delegation of authority . . . . . . . . . . . . . . . . . . . . . . . . . . . . . . . . . . . . . . .88.39 73.3.2 Personal rights . . . . . . . . . . . . . . . . . . . . . . . . . . . . . . . . . . . . . . . . . . . . . . . . 91.53 31
Collaboration3.3.3 Use of virtual social networks . . . . . . . . . . . . . . . . . . . . . . . . . . . . . . . . .88.45 193.3.4 Use of virtual professional networks . . . . . . . . . . . . . . . . . . . . . . . . . .79.20 23.3.5 Collaboration within organisations . . . . . . . . . . . . . . . . . . . . . . . . . . . .96.93 23.3.6 Collaboration across organisations . . . . . . . . . . . . . . . . . . . . . . . . . . 100.00 1
4 RETAIN . . . . . . . . . . . . . . . . . . . . . . . . . . . . . . . . . . . . . . . . . . . .81.90 124.1 Sustainability . . . . . . . . . . . . . . . . . . . . . . . . . . . . . . . . . . . . . . . . . . . . . . . 95.26 34.1.1 Pension system . . . . . . . . . . . . . . . . . . . . . . . . . . . . . . . . . . . . . . . . . . . . . 100.00 14.1.2 Social protection . . . . . . . . . . . . . . . . . . . . . . . . . . . . . . . . . . . . . . . . . . . . . .88.02 114.1.3 Brain retention . . . . . . . . . . . . . . . . . . . . . . . . . . . . . . . . . . . . . . . . . . . . . . . . 97.76 24.2 Lifestyle . . . . . . . . . . . . . . . . . . . . . . . . . . . . . . . . . . . . . . . . . . . . . . . . . . . . 68.53 364.2.1 Environmental performance . . . . . . . . . . . . . . . . . . . . . . . . . . . . . . . . . .72.95 264.2.2 Personal safety . . . . . . . . . . . . . . . . . . . . . . . . . . . . . . . . . . . . . . . . . . . . . . . .60.35 554.2.3 Physician density . . . . . . . . . . . . . . . . . . . . . . . . . . . . . . . . . . . . . . . . . . . . . .40.88 464.2.4 Sanitation . . . . . . . . . . . . . . . . . . . . . . . . . . . . . . . . . . . . . . . . . . . . . . . . . . . . .99.97 12
5 VOCATIONAL AND TECHNICAL SKILLS . . . . . . . . . . . . .82.41 15.1 Mid-Level Skills . . . . . . . . . . . . . . . . . . . . . . . . . . . . . . . . . . . . . . . . . . . . . 67.05 85.1.1 Workforce with secondary education . . . . . . . . . . . . . . . . . . . . . . . . .65.43 315.1.2 Population with secondary education . . . . . . . . . . . . . . . . . . . . . . . .63.94 275.1.3 Technicians and associate professionals . . . . . . . . . . . . . . . . . . . . . . . 61.88 235.1.4 Labour productivity per employee . . . . . . . . . . . . . . . . . . . . . . . . . . . .76.94 75.2 Employability . . . . . . . . . . . . . . . . . . . . . . . . . . . . . . . . . . . . . . . . . . . . . . . 97.77 15.2.1 Ease of finding skilled employees . . . . . . . . . . . . . . . . . . . . . . . . . . . 100.00 15.2.2 Relevance of education system to the economy . . . . . . . . . . . . . .96.93 25.2.3 Skills matching with secondary education . . . . . . . . . . . . . . . . . . . . 97.06 25.2.4 Skills matching with tertiary education . . . . . . . . . . . . . . . . . . . . . . . . 97.08 2
6 GLOBAL KNOWLEDGE SKILLS . . . . . . . . . . . . . . . . . . . . 64.96 26.1 High-Level Skills . . . . . . . . . . . . . . . . . . . . . . . . . . . . . . . . . . . . . . . . . . . . 69.75 36.1.1 Workforce with tertiary education . . . . . . . . . . . . . . . . . . . . . . . . . . . .72.02 66.1.2 Population with tertiary education . . . . . . . . . . . . . . . . . . . . . . . . . . . .69.72 76.1.3 Professionals . . . . . . . . . . . . . . . . . . . . . . . . . . . . . . . . . . . . . . . . . . . . . . . . . .58.69 156.1.4 Researchers . . . . . . . . . . . . . . . . . . . . . . . . . . . . . . . . . . . . . . . . . . . . . . . . . . . 51.53 226.1.5 Senior officials and managers . . . . . . . . . . . . . . . . . . . . . . . . . . . . . . . . .66.54 106.1.6 Availability of scientists and engineers . . . . . . . . . . . . . . . . . . . . . . 100.00 16.2 Talent Impact . . . . . . . . . . . . . . . . . . . . . . . . . . . . . . . . . . . . . . . . . . . . . . . 60.17 106.2.1 Innovation output . . . . . . . . . . . . . . . . . . . . . . . . . . . . . . . . . . . . . . . . . . . .80.91 66.2.2 High-value exports . . . . . . . . . . . . . . . . . . . . . . . . . . . . . . . . . . . . . . . . . . . . 41.15 236.2.3 New product entrepreneurial activity . . . . . . . . . . . . . . . . . . . . . . . . .68.46 126.2.4 New business density . . . . . . . . . . . . . . . . . . . . . . . . . . . . . . . . . . . . . . . . . . .n/a n/a6.2.5 Scientific journal articles . . . . . . . . . . . . . . . . . . . . . . . . . . . . . . . . . . . . . . 50.15 21
l United States of America l Income group average
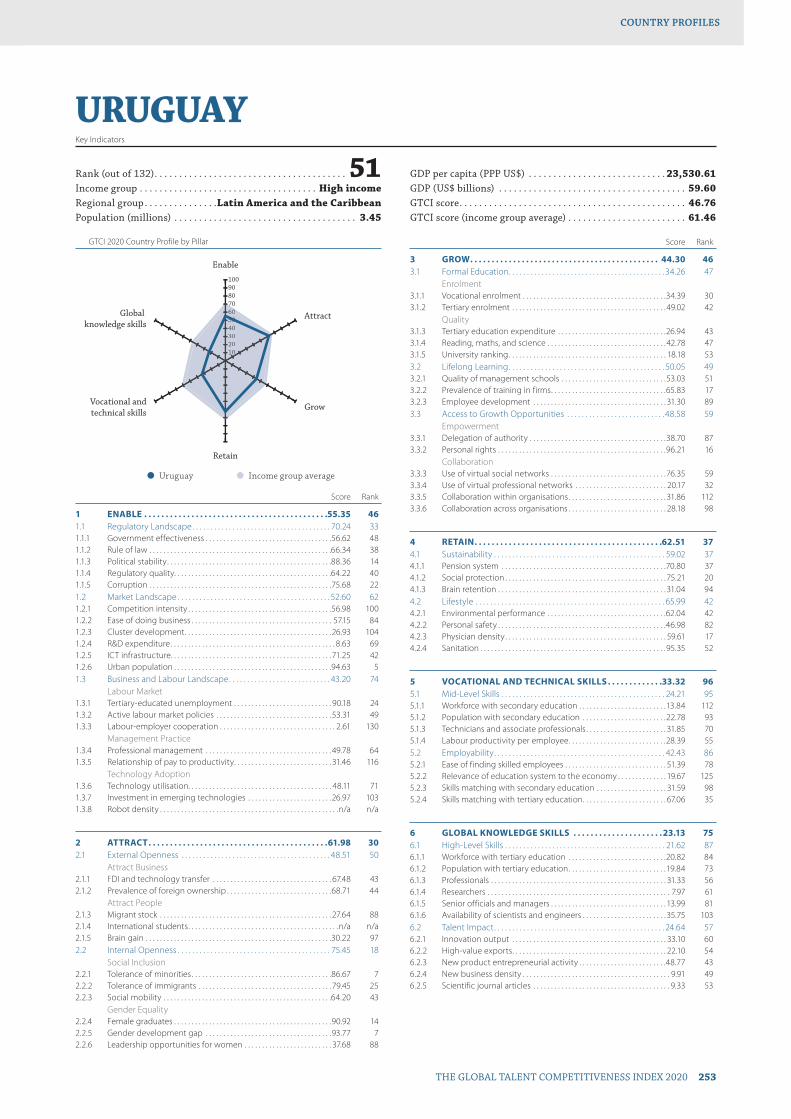
GTCI 2020 Country Profile by Pillar
THE GLOBAL TALENT COMPETITIVENESS INDEX 2020 253
COUNTRY PROFILESCOUNTRY PROFILES
102030405060708090100
Global knowledge skills
Vocational andtechnical skills
Retain
Grow
Attract
Enable
102030405060607
URUGUAYKey Indicators
Rank (out of 132) . . . . . . . . . . . . . . . . . . . . . . . . . . . . . . . . . . . . . . . 51Income group . . . . . . . . . . . . . . . . . . . . . . . . . . . . . . . . . . . . High incomeRegional group . . . . . . . . . . . . . . .Latin America and the CaribbeanPopulation (millions) . . . . . . . . . . . . . . . . . . . . . . . . . . . . . . . . . . . . . 3.45
GDP per capita (PPP US$) . . . . . . . . . . . . . . . . . . . . . . . . . . . . 23,530.61GDP (US$ billions) . . . . . . . . . . . . . . . . . . . . . . . . . . . . . . . . . . . . . . 59.60GTCI score . . . . . . . . . . . . . . . . . . . . . . . . . . . . . . . . . . . . . . . . . . . . . . 46.76GTCI score (income group average) . . . . . . . . . . . . . . . . . . . . . . . . 61.46
Score Rank
1 ENABLE . . . . . . . . . . . . . . . . . . . . . . . . . . . . . . . . . . . . . . . . . . .55.35 461.1 Regulatory Landscape . . . . . . . . . . . . . . . . . . . . . . . . . . . . . . . . . . . . . . 70.24 331.1.1 Government effectiveness . . . . . . . . . . . . . . . . . . . . . . . . . . . . . . . . . . . .56.62 481.1.2 Rule of law . . . . . . . . . . . . . . . . . . . . . . . . . . . . . . . . . . . . . . . . . . . . . . . . . . . .66.34 381.1.3 Political stability . . . . . . . . . . . . . . . . . . . . . . . . . . . . . . . . . . . . . . . . . . . . . . .88.36 141.1.4 Regulatory quality. . . . . . . . . . . . . . . . . . . . . . . . . . . . . . . . . . . . . . . . . . . . .64.22 401.1.5 Corruption . . . . . . . . . . . . . . . . . . . . . . . . . . . . . . . . . . . . . . . . . . . . . . . . . . . .75.68 221.2 Market Landscape . . . . . . . . . . . . . . . . . . . . . . . . . . . . . . . . . . . . . . . . . . 52.60 621.2.1 Competition intensity . . . . . . . . . . . . . . . . . . . . . . . . . . . . . . . . . . . . . . . . .56.98 1001.2.2 Ease of doing business . . . . . . . . . . . . . . . . . . . . . . . . . . . . . . . . . . . . . . . . 57.15 841.2.3 Cluster development . . . . . . . . . . . . . . . . . . . . . . . . . . . . . . . . . . . . . . . . . .26.93 1041.2.4 R&D expenditure . . . . . . . . . . . . . . . . . . . . . . . . . . . . . . . . . . . . . . . . . . . . . . . 8.63 691.2.5 ICT infrastructure. . . . . . . . . . . . . . . . . . . . . . . . . . . . . . . . . . . . . . . . . . . . . .71.25 421.2.6 Urban population . . . . . . . . . . . . . . . . . . . . . . . . . . . . . . . . . . . . . . . . . . . . .94.63 51.3 Business and Labour Landscape . . . . . . . . . . . . . . . . . . . . . . . . . . . . 43.20 74
Labour Market1.3.1 Tertiary-educated unemployment . . . . . . . . . . . . . . . . . . . . . . . . . . . . 90.18 241.3.2 Active labour market policies . . . . . . . . . . . . . . . . . . . . . . . . . . . . . . . . . 53.31 491.3.3 Labour-employer cooperation . . . . . . . . . . . . . . . . . . . . . . . . . . . . . . . . . 2.61 130
Management Practice1.3.4 Professional management . . . . . . . . . . . . . . . . . . . . . . . . . . . . . . . . . . . . 49.78 641.3.5 Relationship of pay to productivity . . . . . . . . . . . . . . . . . . . . . . . . . . . . 31.46 116
Technology Adoption1.3.6 Technology utilisation. . . . . . . . . . . . . . . . . . . . . . . . . . . . . . . . . . . . . . . . . 48.11 711.3.7 Investment in emerging technologies . . . . . . . . . . . . . . . . . . . . . . . .26.97 1031.3.8 Robot density . . . . . . . . . . . . . . . . . . . . . . . . . . . . . . . . . . . . . . . . . . . . . . . . . . .n/a n/a
2 ATTRACT . . . . . . . . . . . . . . . . . . . . . . . . . . . . . . . . . . . . . . . . . .61.98 302.1 External Openness . . . . . . . . . . . . . . . . . . . . . . . . . . . . . . . . . . . . . . . . . 48.51 50
Attract Business2.1.1 FDI and technology transfer . . . . . . . . . . . . . . . . . . . . . . . . . . . . . . . . . . 67.48 432.1.2 Prevalence of foreign ownership . . . . . . . . . . . . . . . . . . . . . . . . . . . . . .68.71 44
Attract People2.1.3 Migrant stock . . . . . . . . . . . . . . . . . . . . . . . . . . . . . . . . . . . . . . . . . . . . . . . . . 27.64 882.1.4 International students . . . . . . . . . . . . . . . . . . . . . . . . . . . . . . . . . . . . . . . . . . .n/a n/a2.1.5 Brain gain . . . . . . . . . . . . . . . . . . . . . . . . . . . . . . . . . . . . . . . . . . . . . . . . . . . . .30.22 972.2 Internal Openness . . . . . . . . . . . . . . . . . . . . . . . . . . . . . . . . . . . . . . . . . . 75.45 18
Social Inclusion2.2.1 Tolerance of minorities . . . . . . . . . . . . . . . . . . . . . . . . . . . . . . . . . . . . . . . .86.67 72.2.2 Tolerance of immigrants . . . . . . . . . . . . . . . . . . . . . . . . . . . . . . . . . . . . . . 79.45 252.2.3 Social mobility . . . . . . . . . . . . . . . . . . . . . . . . . . . . . . . . . . . . . . . . . . . . . . . .64.20 43
Gender Equality2.2.4 Female graduates . . . . . . . . . . . . . . . . . . . . . . . . . . . . . . . . . . . . . . . . . . . . .90.92 142.2.5 Gender development gap . . . . . . . . . . . . . . . . . . . . . . . . . . . . . . . . . . . .93.77 72.2.6 Leadership opportunities for women . . . . . . . . . . . . . . . . . . . . . . . . . 37.68 88
Score Rank
3 GROW . . . . . . . . . . . . . . . . . . . . . . . . . . . . . . . . . . . . . . . . . . . . 44.30 463.1 Formal Education . . . . . . . . . . . . . . . . . . . . . . . . . . . . . . . . . . . . . . . . . . . 34.26 47
Enrolment3.1.1 Vocational enrolment . . . . . . . . . . . . . . . . . . . . . . . . . . . . . . . . . . . . . . . . .34.39 303.1.2 Tertiary enrolment . . . . . . . . . . . . . . . . . . . . . . . . . . . . . . . . . . . . . . . . . . . . 49.02 42
Quality3.1.3 Tertiary education expenditure . . . . . . . . . . . . . . . . . . . . . . . . . . . . . . .26.94 433.1.4 Reading, maths, and science . . . . . . . . . . . . . . . . . . . . . . . . . . . . . . . . . .42.78 473.1.5 University ranking . . . . . . . . . . . . . . . . . . . . . . . . . . . . . . . . . . . . . . . . . . . . . 18.18 533.2 Lifelong Learning . . . . . . . . . . . . . . . . . . . . . . . . . . . . . . . . . . . . . . . . . . . 50.05 493.2.1 Quality of management schools . . . . . . . . . . . . . . . . . . . . . . . . . . . . . .53.03 513.2.2 Prevalence of training in firms . . . . . . . . . . . . . . . . . . . . . . . . . . . . . . . . .65.83 173.2.3 Employee development . . . . . . . . . . . . . . . . . . . . . . . . . . . . . . . . . . . . . . 31.30 893.3 Access to Growth Opportunities . . . . . . . . . . . . . . . . . . . . . . . . . . .48.58 59
Empowerment3.3.1 Delegation of authority . . . . . . . . . . . . . . . . . . . . . . . . . . . . . . . . . . . . . . .38.70 873.3.2 Personal rights . . . . . . . . . . . . . . . . . . . . . . . . . . . . . . . . . . . . . . . . . . . . . . . .96.21 16
Collaboration3.3.3 Use of virtual social networks . . . . . . . . . . . . . . . . . . . . . . . . . . . . . . . . .76.35 593.3.4 Use of virtual professional networks . . . . . . . . . . . . . . . . . . . . . . . . . . 20.17 323.3.5 Collaboration within organisations . . . . . . . . . . . . . . . . . . . . . . . . . . . . 31.86 1123.3.6 Collaboration across organisations . . . . . . . . . . . . . . . . . . . . . . . . . . . . 28.18 98
4 RETAIN . . . . . . . . . . . . . . . . . . . . . . . . . . . . . . . . . . . . . . . . . . . .62.51 374.1 Sustainability . . . . . . . . . . . . . . . . . . . . . . . . . . . . . . . . . . . . . . . . . . . . . . . 59.02 374.1.1 Pension system . . . . . . . . . . . . . . . . . . . . . . . . . . . . . . . . . . . . . . . . . . . . . . .70.80 374.1.2 Social protection . . . . . . . . . . . . . . . . . . . . . . . . . . . . . . . . . . . . . . . . . . . . . . 75.21 204.1.3 Brain retention . . . . . . . . . . . . . . . . . . . . . . . . . . . . . . . . . . . . . . . . . . . . . . . . 31.04 944.2 Lifestyle . . . . . . . . . . . . . . . . . . . . . . . . . . . . . . . . . . . . . . . . . . . . . . . . . . . . 65.99 424.2.1 Environmental performance . . . . . . . . . . . . . . . . . . . . . . . . . . . . . . . . . .62.04 424.2.2 Personal safety . . . . . . . . . . . . . . . . . . . . . . . . . . . . . . . . . . . . . . . . . . . . . . . .46.98 824.2.3 Physician density . . . . . . . . . . . . . . . . . . . . . . . . . . . . . . . . . . . . . . . . . . . . . . 59.61 174.2.4 Sanitation . . . . . . . . . . . . . . . . . . . . . . . . . . . . . . . . . . . . . . . . . . . . . . . . . . . . .95.35 52
5 VOCATIONAL AND TECHNICAL SKILLS . . . . . . . . . . . . .33.32 965.1 Mid-Level Skills . . . . . . . . . . . . . . . . . . . . . . . . . . . . . . . . . . . . . . . . . . . . . 24.21 955.1.1 Workforce with secondary education . . . . . . . . . . . . . . . . . . . . . . . . .13.84 1125.1.2 Population with secondary education . . . . . . . . . . . . . . . . . . . . . . . .22.78 935.1.3 Technicians and associate professionals . . . . . . . . . . . . . . . . . . . . . . . 31.85 705.1.4 Labour productivity per employee . . . . . . . . . . . . . . . . . . . . . . . . . . . .28.39 555.2 Employability . . . . . . . . . . . . . . . . . . . . . . . . . . . . . . . . . . . . . . . . . . . . . . . 42.43 865.2.1 Ease of finding skilled employees . . . . . . . . . . . . . . . . . . . . . . . . . . . . . 51.39 785.2.2 Relevance of education system to the economy . . . . . . . . . . . . . . 19.67 1255.2.3 Skills matching with secondary education . . . . . . . . . . . . . . . . . . . . 31.59 985.2.4 Skills matching with tertiary education . . . . . . . . . . . . . . . . . . . . . . . . 67.06 35
6 GLOBAL KNOWLEDGE SKILLS . . . . . . . . . . . . . . . . . . . . .23.13 756.1 High-Level Skills . . . . . . . . . . . . . . . . . . . . . . . . . . . . . . . . . . . . . . . . . . . . 21.62 876.1.1 Workforce with tertiary education . . . . . . . . . . . . . . . . . . . . . . . . . . . .20.82 846.1.2 Population with tertiary education . . . . . . . . . . . . . . . . . . . . . . . . . . . .19.84 736.1.3 Professionals . . . . . . . . . . . . . . . . . . . . . . . . . . . . . . . . . . . . . . . . . . . . . . . . . . 31.33 566.1.4 Researchers . . . . . . . . . . . . . . . . . . . . . . . . . . . . . . . . . . . . . . . . . . . . . . . . . . . . 7.97 616.1.5 Senior officials and managers . . . . . . . . . . . . . . . . . . . . . . . . . . . . . . . . . 13.99 816.1.6 Availability of scientists and engineers . . . . . . . . . . . . . . . . . . . . . . . . 35.75 1036.2 Talent Impact . . . . . . . . . . . . . . . . . . . . . . . . . . . . . . . . . . . . . . . . . . . . . . . 24.64 576.2.1 Innovation output . . . . . . . . . . . . . . . . . . . . . . . . . . . . . . . . . . . . . . . . . . . . 33.10 606.2.2 High-value exports . . . . . . . . . . . . . . . . . . . . . . . . . . . . . . . . . . . . . . . . . . . . 22.10 546.2.3 New product entrepreneurial activity . . . . . . . . . . . . . . . . . . . . . . . . .48.77 436.2.4 New business density . . . . . . . . . . . . . . . . . . . . . . . . . . . . . . . . . . . . . . . . . . 9.91 496.2.5 Scientific journal articles . . . . . . . . . . . . . . . . . . . . . . . . . . . . . . . . . . . . . . . 9.33 53
l Uruguay l Income group average

GTCI 2020 Country Profile by Pillar
254 THE GLOBAL TALENT COMPETITIVENESS INDEX 2020
COUNTRY PROFILESCOUNTRY PROFILES
102030405060708090100
Global knowledge skills
Vocational andtechnical skills
Retain
Grow
Attract
Enable
1020304040
VENEZUELA, BOLIVARIAN REP.Key Indicators
Rank (out of 132) . . . . . . . . . . . . . . . . . . . . . . . . . . . . . . . . . . . . 114Income group . . . . . . . . . . . . . . . . . . . . . . . . . . . Upper-middle incomeRegional group . . . . . . . . . . . . . . .Latin America and the CaribbeanPopulation (millions) . . . . . . . . . . . . . . . . . . . . . . . . . . . . . . . . . . . . 28.87
GDP per capita (PPP US$) . . . . . . . . . . . . . . . . . . . . . . . . . . . . 18,102.47GDP (US$ billions) . . . . . . . . . . . . . . . . . . . . . . . . . . . . . . . . . . . . . 482.36GTCI score . . . . . . . . . . . . . . . . . . . . . . . . . . . . . . . . . . . . . . . . . . . . . . 27.89GTCI score (income group average) . . . . . . . . . . . . . . . . . . . . . . . . 41.25
Score Rank
1 ENABLE . . . . . . . . . . . . . . . . . . . . . . . . . . . . . . . . . . . . . . . . . . .18.32 1301.1 Regulatory Landscape . . . . . . . . . . . . . . . . . . . . . . . . . . . . . . . . . . . . . . 11.43 1301.1.1 Government effectiveness . . . . . . . . . . . . . . . . . . . . . . . . . . . . . . . . . . . . 12.63 1301.1.2 Rule of law . . . . . . . . . . . . . . . . . . . . . . . . . . . . . . . . . . . . . . . . . . . . . . . . . . . . . 0.00 1321.1.3 Political stability . . . . . . . . . . . . . . . . . . . . . . . . . . . . . . . . . . . . . . . . . . . . . . . 39.11 1201.1.4 Regulatory quality. . . . . . . . . . . . . . . . . . . . . . . . . . . . . . . . . . . . . . . . . . . . . . 0.00 1321.1.5 Corruption . . . . . . . . . . . . . . . . . . . . . . . . . . . . . . . . . . . . . . . . . . . . . . . . . . . . . 5.41 1301.2 Market Landscape . . . . . . . . . . . . . . . . . . . . . . . . . . . . . . . . . . . . . . . . . . 22.90 1271.2.1 Competition intensity . . . . . . . . . . . . . . . . . . . . . . . . . . . . . . . . . . . . . . . . . . 0.00 1321.2.2 Ease of doing business . . . . . . . . . . . . . . . . . . . . . . . . . . . . . . . . . . . . . . . . . 0.00 1321.2.3 Cluster development . . . . . . . . . . . . . . . . . . . . . . . . . . . . . . . . . . . . . . . . . . . 4.54 1311.2.4 R&D expenditure . . . . . . . . . . . . . . . . . . . . . . . . . . . . . . . . . . . . . . . . . . . . . . . 2.28 1031.2.5 ICT infrastructure. . . . . . . . . . . . . . . . . . . . . . . . . . . . . . . . . . . . . . . . . . . . . . 44.15 791.2.6 Urban population . . . . . . . . . . . . . . . . . . . . . . . . . . . . . . . . . . . . . . . . . . . . .86.44 151.3 Business and Labour Landscape . . . . . . . . . . . . . . . . . . . . . . . . . . . . 20.63 129
Labour Market1.3.1 Tertiary-educated unemployment . . . . . . . . . . . . . . . . . . . . . . . . . . . .73.84 871.3.2 Active labour market policies . . . . . . . . . . . . . . . . . . . . . . . . . . . . . . . . . . 4.02 1281.3.3 Labour-employer cooperation . . . . . . . . . . . . . . . . . . . . . . . . . . . . . . . .10.85 122
Management Practice1.3.4 Professional management . . . . . . . . . . . . . . . . . . . . . . . . . . . . . . . . . . . .45.72 751.3.5 Relationship of pay to productivity . . . . . . . . . . . . . . . . . . . . . . . . . . . . . 0.00 132
Technology Adoption1.3.6 Technology utilisation. . . . . . . . . . . . . . . . . . . . . . . . . . . . . . . . . . . . . . . . . 19.85 1231.3.7 Investment in emerging technologies . . . . . . . . . . . . . . . . . . . . . . . . 10.78 1291.3.8 Robot density . . . . . . . . . . . . . . . . . . . . . . . . . . . . . . . . . . . . . . . . . . . . . . . . . . 0.03 67
2 ATTRACT . . . . . . . . . . . . . . . . . . . . . . . . . . . . . . . . . . . . . . . . . .30.15 1292.1 External Openness . . . . . . . . . . . . . . . . . . . . . . . . . . . . . . . . . . . . . . . . . 15.30 131
Attract Business2.1.1 FDI and technology transfer . . . . . . . . . . . . . . . . . . . . . . . . . . . . . . . . . . . 9.64 1312.1.2 Prevalence of foreign ownership . . . . . . . . . . . . . . . . . . . . . . . . . . . . . .23.01 128
Attract People2.1.3 Migrant stock . . . . . . . . . . . . . . . . . . . . . . . . . . . . . . . . . . . . . . . . . . . . . . . . .43.62 592.1.4 International students . . . . . . . . . . . . . . . . . . . . . . . . . . . . . . . . . . . . . . . . . . 0.23 1092.1.5 Brain gain . . . . . . . . . . . . . . . . . . . . . . . . . . . . . . . . . . . . . . . . . . . . . . . . . . . . . . 0.00 1322.2 Internal Openness . . . . . . . . . . . . . . . . . . . . . . . . . . . . . . . . . . . . . . . . . . 44.99 110
Social Inclusion2.2.1 Tolerance of minorities . . . . . . . . . . . . . . . . . . . . . . . . . . . . . . . . . . . . . . . .26.67 972.2.2 Tolerance of immigrants . . . . . . . . . . . . . . . . . . . . . . . . . . . . . . . . . . . . . .58.90 652.2.3 Social mobility . . . . . . . . . . . . . . . . . . . . . . . . . . . . . . . . . . . . . . . . . . . . . . . . . 0.00 132
Gender Equality2.2.4 Female graduates . . . . . . . . . . . . . . . . . . . . . . . . . . . . . . . . . . . . . . . . . . . . . . .n/a n/a2.2.5 Gender development gap . . . . . . . . . . . . . . . . . . . . . . . . . . . . . . . . . . . .92.80 102.2.6 Leadership opportunities for women . . . . . . . . . . . . . . . . . . . . . . . . .46.60 63
Score Rank
3 GROW . . . . . . . . . . . . . . . . . . . . . . . . . . . . . . . . . . . . . . . . . . . . 38.46 663.1 Formal Education . . . . . . . . . . . . . . . . . . . . . . . . . . . . . . . . . . . . . . . . . . . 29.67 55
Enrolment3.1.1 Vocational enrolment . . . . . . . . . . . . . . . . . . . . . . . . . . . . . . . . . . . . . . . . . . 8.29 873.1.2 Tertiary enrolment . . . . . . . . . . . . . . . . . . . . . . . . . . . . . . . . . . . . . . . . . . . .60.68 21
Quality3.1.3 Tertiary education expenditure . . . . . . . . . . . . . . . . . . . . . . . . . . . . . . .36.88 193.1.4 Reading, maths, and science . . . . . . . . . . . . . . . . . . . . . . . . . . . . . . . . . . . .n/a n/a3.1.5 University ranking . . . . . . . . . . . . . . . . . . . . . . . . . . . . . . . . . . . . . . . . . . . . . 12.82 643.2 Lifelong Learning . . . . . . . . . . . . . . . . . . . . . . . . . . . . . . . . . . . . . . . . . . .46.85 563.2.1 Quality of management schools . . . . . . . . . . . . . . . . . . . . . . . . . . . . . 46.64 683.2.2 Prevalence of training in firms . . . . . . . . . . . . . . . . . . . . . . . . . . . . . . . . .69.39 113.2.3 Employee development . . . . . . . . . . . . . . . . . . . . . . . . . . . . . . . . . . . . . . 24.51 1133.3 Access to Growth Opportunities . . . . . . . . . . . . . . . . . . . . . . . . . . .38.86 103
Empowerment3.3.1 Delegation of authority . . . . . . . . . . . . . . . . . . . . . . . . . . . . . . . . . . . . . . . 43.14 733.3.2 Personal rights . . . . . . . . . . . . . . . . . . . . . . . . . . . . . . . . . . . . . . . . . . . . . . . .32.99 113
Collaboration3.3.3 Use of virtual social networks . . . . . . . . . . . . . . . . . . . . . . . . . . . . . . . . .69.77 813.3.4 Use of virtual professional networks . . . . . . . . . . . . . . . . . . . . . . . . . . 12.26 523.3.5 Collaboration within organisations . . . . . . . . . . . . . . . . . . . . . . . . . . . .44.23 823.3.6 Collaboration across organisations . . . . . . . . . . . . . . . . . . . . . . . . . . . . 30.74 88
4 RETAIN . . . . . . . . . . . . . . . . . . . . . . . . . . . . . . . . . . . . . . . . . . . 32.68 1014.1 Sustainability . . . . . . . . . . . . . . . . . . . . . . . . . . . . . . . . . . . . . . . . . . . . . . . 13.47 1294.1.1 Pension system . . . . . . . . . . . . . . . . . . . . . . . . . . . . . . . . . . . . . . . . . . . . . . .33.90 644.1.2 Social protection . . . . . . . . . . . . . . . . . . . . . . . . . . . . . . . . . . . . . . . . . . . . . . . 6.51 1304.1.3 Brain retention . . . . . . . . . . . . . . . . . . . . . . . . . . . . . . . . . . . . . . . . . . . . . . . . . 0.00 1324.2 Lifestyle . . . . . . . . . . . . . . . . . . . . . . . . . . . . . . . . . . . . . . . . . . . . . . . . . . . . 51.88 714.2.1 Environmental performance . . . . . . . . . . . . . . . . . . . . . . . . . . . . . . . . . .60.78 464.2.2 Personal safety . . . . . . . . . . . . . . . . . . . . . . . . . . . . . . . . . . . . . . . . . . . . . . . . . 0.32 1304.2.3 Physician density . . . . . . . . . . . . . . . . . . . . . . . . . . . . . . . . . . . . . . . . . . . . . . . .n/a n/a4.2.4 Sanitation . . . . . . . . . . . . . . . . . . . . . . . . . . . . . . . . . . . . . . . . . . . . . . . . . . . . .94.55 55
5 VOCATIONAL AND TECHNICAL SKILLS . . . . . . . . . . . . 28.29 1115.1 Mid-Level Skills . . . . . . . . . . . . . . . . . . . . . . . . . . . . . . . . . . . . . . . . . . . . . 21.98 985.1.1 Workforce with secondary education . . . . . . . . . . . . . . . . . . . . . . . . .16.40 1105.1.2 Population with secondary education . . . . . . . . . . . . . . . . . . . . . . . . 38.18 645.1.3 Technicians and associate professionals . . . . . . . . . . . . . . . . . . . . . . . . .n/a n/a5.1.4 Labour productivity per employee . . . . . . . . . . . . . . . . . . . . . . . . . . . . 11.36 825.2 Employability . . . . . . . . . . . . . . . . . . . . . . . . . . . . . . . . . . . . . . . . . . . . . . . 34.59 1105.2.1 Ease of finding skilled employees . . . . . . . . . . . . . . . . . . . . . . . . . . . . . 31.69 1265.2.2 Relevance of education system to the economy . . . . . . . . . . . . . .22.45 1165.2.3 Skills matching with secondary education . . . . . . . . . . . . . . . . . . . .29.99 1045.2.4 Skills matching with tertiary education . . . . . . . . . . . . . . . . . . . . . . . .54.22 68
6 GLOBAL KNOWLEDGE SKILLS . . . . . . . . . . . . . . . . . . . . .19.48 836.1 High-Level Skills . . . . . . . . . . . . . . . . . . . . . . . . . . . . . . . . . . . . . . . . . . . . 30.15 626.1.1 Workforce with tertiary education . . . . . . . . . . . . . . . . . . . . . . . . . . . .44.71 396.1.2 Population with tertiary education . . . . . . . . . . . . . . . . . . . . . . . . . . . .54.56 206.1.3 Professionals . . . . . . . . . . . . . . . . . . . . . . . . . . . . . . . . . . . . . . . . . . . . . . . . . .39.04 436.1.4 Researchers . . . . . . . . . . . . . . . . . . . . . . . . . . . . . . . . . . . . . . . . . . . . . . . . . . . . 3.32 746.1.5 Senior officials and managers . . . . . . . . . . . . . . . . . . . . . . . . . . . . . . . . .24.48 616.1.6 Availability of scientists and engineers . . . . . . . . . . . . . . . . . . . . . . . . 14.79 1306.2 Talent Impact . . . . . . . . . . . . . . . . . . . . . . . . . . . . . . . . . . . . . . . . . . . . . . . . 8.82 1086.2.1 Innovation output . . . . . . . . . . . . . . . . . . . . . . . . . . . . . . . . . . . . . . . . . . . . . .n/a n/a6.2.2 High-value exports . . . . . . . . . . . . . . . . . . . . . . . . . . . . . . . . . . . . . . . . . . . . . 3.36 1076.2.3 New product entrepreneurial activity . . . . . . . . . . . . . . . . . . . . . . . . .22.00 796.2.4 New business density . . . . . . . . . . . . . . . . . . . . . . . . . . . . . . . . . . . . . . . . . . .n/a n/a6.2.5 Scientific journal articles . . . . . . . . . . . . . . . . . . . . . . . . . . . . . . . . . . . . . . . 1.10 93
l Venezuela, Bolivarian Rep. l Income group average
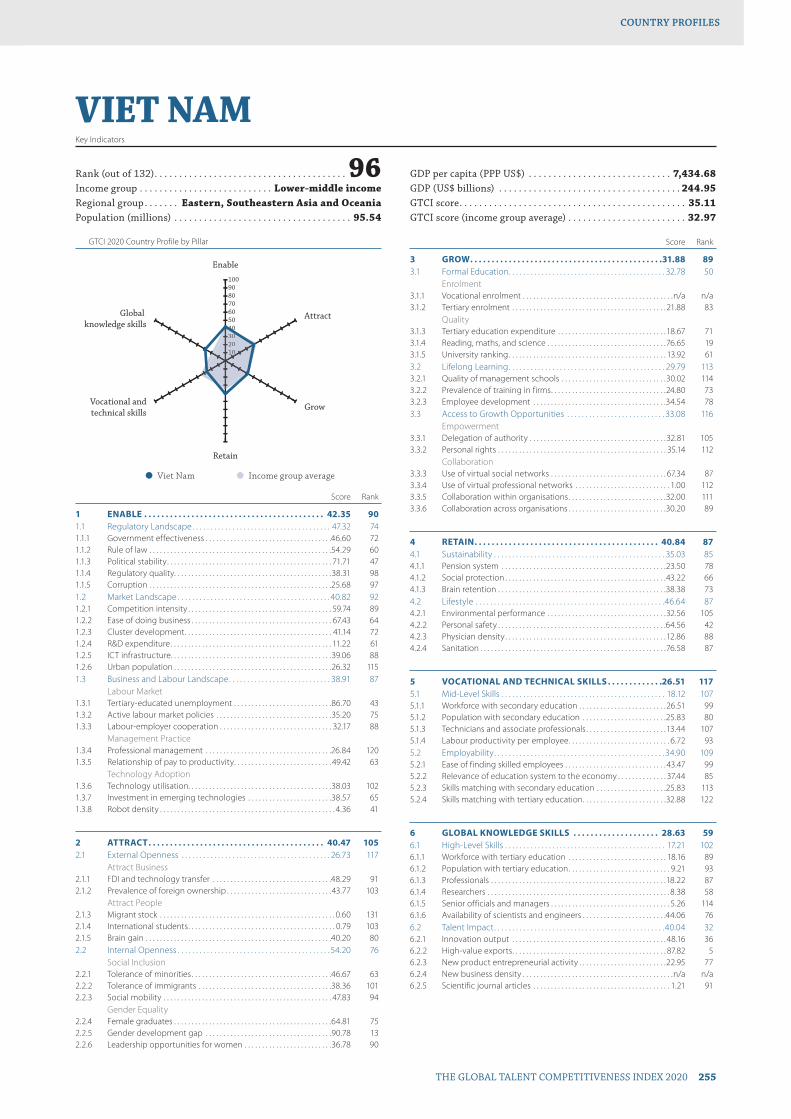
GTCI 2020 Country Profile by Pillar
THE GLOBAL TALENT COMPETITIVENESS INDEX 2020 255
COUNTRY PROFILESCOUNTRY PROFILES
102030405060708090100
Global knowledge skills
Vocational andtechnical skills
Retain
Grow
Attract
Enable
10203004
VIET NAMKey Indicators
Rank (out of 132) . . . . . . . . . . . . . . . . . . . . . . . . . . . . . . . . . . . . . . . 96Income group . . . . . . . . . . . . . . . . . . . . . . . . . . . Lower-middle incomeRegional group . . . . . . . Eastern, Southeastern Asia and OceaniaPopulation (millions) . . . . . . . . . . . . . . . . . . . . . . . . . . . . . . . . . . . . 95.54
GDP per capita (PPP US$) . . . . . . . . . . . . . . . . . . . . . . . . . . . . . 7,434.68GDP (US$ billions) . . . . . . . . . . . . . . . . . . . . . . . . . . . . . . . . . . . . . 244.95GTCI score . . . . . . . . . . . . . . . . . . . . . . . . . . . . . . . . . . . . . . . . . . . . . . 35.11GTCI score (income group average) . . . . . . . . . . . . . . . . . . . . . . . . 32.97
Score Rank
1 ENABLE . . . . . . . . . . . . . . . . . . . . . . . . . . . . . . . . . . . . . . . . . . 42.35 901.1 Regulatory Landscape . . . . . . . . . . . . . . . . . . . . . . . . . . . . . . . . . . . . . . 47.32 741.1.1 Government effectiveness . . . . . . . . . . . . . . . . . . . . . . . . . . . . . . . . . . . .46.60 721.1.2 Rule of law . . . . . . . . . . . . . . . . . . . . . . . . . . . . . . . . . . . . . . . . . . . . . . . . . . . .54.29 601.1.3 Political stability . . . . . . . . . . . . . . . . . . . . . . . . . . . . . . . . . . . . . . . . . . . . . . . 71.71 471.1.4 Regulatory quality. . . . . . . . . . . . . . . . . . . . . . . . . . . . . . . . . . . . . . . . . . . . .38.31 981.1.5 Corruption . . . . . . . . . . . . . . . . . . . . . . . . . . . . . . . . . . . . . . . . . . . . . . . . . . . .25.68 971.2 Market Landscape . . . . . . . . . . . . . . . . . . . . . . . . . . . . . . . . . . . . . . . . . . 40.82 921.2.1 Competition intensity . . . . . . . . . . . . . . . . . . . . . . . . . . . . . . . . . . . . . . . . . 59.74 891.2.2 Ease of doing business . . . . . . . . . . . . . . . . . . . . . . . . . . . . . . . . . . . . . . . . 67.43 641.2.3 Cluster development . . . . . . . . . . . . . . . . . . . . . . . . . . . . . . . . . . . . . . . . . . 41.14 721.2.4 R&D expenditure . . . . . . . . . . . . . . . . . . . . . . . . . . . . . . . . . . . . . . . . . . . . . . 11.22 611.2.5 ICT infrastructure. . . . . . . . . . . . . . . . . . . . . . . . . . . . . . . . . . . . . . . . . . . . . .39.06 881.2.6 Urban population . . . . . . . . . . . . . . . . . . . . . . . . . . . . . . . . . . . . . . . . . . . . .26.32 1151.3 Business and Labour Landscape . . . . . . . . . . . . . . . . . . . . . . . . . . . . 38.91 87
Labour Market1.3.1 Tertiary-educated unemployment . . . . . . . . . . . . . . . . . . . . . . . . . . . .86.70 431.3.2 Active labour market policies . . . . . . . . . . . . . . . . . . . . . . . . . . . . . . . . .35.20 751.3.3 Labour-employer cooperation . . . . . . . . . . . . . . . . . . . . . . . . . . . . . . . . 32.17 88
Management Practice1.3.4 Professional management . . . . . . . . . . . . . . . . . . . . . . . . . . . . . . . . . . . .26.84 1201.3.5 Relationship of pay to productivity . . . . . . . . . . . . . . . . . . . . . . . . . . . . 49.42 63
Technology Adoption1.3.6 Technology utilisation. . . . . . . . . . . . . . . . . . . . . . . . . . . . . . . . . . . . . . . . .38.03 1021.3.7 Investment in emerging technologies . . . . . . . . . . . . . . . . . . . . . . . .38.57 651.3.8 Robot density . . . . . . . . . . . . . . . . . . . . . . . . . . . . . . . . . . . . . . . . . . . . . . . . . . 4.36 41
2 ATTRACT . . . . . . . . . . . . . . . . . . . . . . . . . . . . . . . . . . . . . . . . . 40.47 1052.1 External Openness . . . . . . . . . . . . . . . . . . . . . . . . . . . . . . . . . . . . . . . . . 26.73 117
Attract Business2.1.1 FDI and technology transfer . . . . . . . . . . . . . . . . . . . . . . . . . . . . . . . . . .48.29 912.1.2 Prevalence of foreign ownership . . . . . . . . . . . . . . . . . . . . . . . . . . . . . .43.77 103
Attract People2.1.3 Migrant stock . . . . . . . . . . . . . . . . . . . . . . . . . . . . . . . . . . . . . . . . . . . . . . . . . . 0.60 1312.1.4 International students . . . . . . . . . . . . . . . . . . . . . . . . . . . . . . . . . . . . . . . . . . 0.79 1032.1.5 Brain gain . . . . . . . . . . . . . . . . . . . . . . . . . . . . . . . . . . . . . . . . . . . . . . . . . . . . .40.20 802.2 Internal Openness . . . . . . . . . . . . . . . . . . . . . . . . . . . . . . . . . . . . . . . . . . 54.20 76
Social Inclusion2.2.1 Tolerance of minorities . . . . . . . . . . . . . . . . . . . . . . . . . . . . . . . . . . . . . . . .46.67 632.2.2 Tolerance of immigrants . . . . . . . . . . . . . . . . . . . . . . . . . . . . . . . . . . . . . .38.36 1012.2.3 Social mobility . . . . . . . . . . . . . . . . . . . . . . . . . . . . . . . . . . . . . . . . . . . . . . . . 47.83 94
Gender Equality2.2.4 Female graduates . . . . . . . . . . . . . . . . . . . . . . . . . . . . . . . . . . . . . . . . . . . . .64.81 752.2.5 Gender development gap . . . . . . . . . . . . . . . . . . . . . . . . . . . . . . . . . . . .90.78 132.2.6 Leadership opportunities for women . . . . . . . . . . . . . . . . . . . . . . . . .36.78 90
Score Rank
3 GROW . . . . . . . . . . . . . . . . . . . . . . . . . . . . . . . . . . . . . . . . . . . . .31.88 893.1 Formal Education . . . . . . . . . . . . . . . . . . . . . . . . . . . . . . . . . . . . . . . . . . . 32.78 50
Enrolment3.1.1 Vocational enrolment . . . . . . . . . . . . . . . . . . . . . . . . . . . . . . . . . . . . . . . . . . .n/a n/a3.1.2 Tertiary enrolment . . . . . . . . . . . . . . . . . . . . . . . . . . . . . . . . . . . . . . . . . . . . 21.88 83
Quality3.1.3 Tertiary education expenditure . . . . . . . . . . . . . . . . . . . . . . . . . . . . . . .18.67 713.1.4 Reading, maths, and science . . . . . . . . . . . . . . . . . . . . . . . . . . . . . . . . . .76.65 193.1.5 University ranking . . . . . . . . . . . . . . . . . . . . . . . . . . . . . . . . . . . . . . . . . . . . . 13.92 613.2 Lifelong Learning . . . . . . . . . . . . . . . . . . . . . . . . . . . . . . . . . . . . . . . . . . . 29.79 1133.2.1 Quality of management schools . . . . . . . . . . . . . . . . . . . . . . . . . . . . . .30.02 1143.2.2 Prevalence of training in firms . . . . . . . . . . . . . . . . . . . . . . . . . . . . . . . . .24.80 733.2.3 Employee development . . . . . . . . . . . . . . . . . . . . . . . . . . . . . . . . . . . . . .34.54 783.3 Access to Growth Opportunities . . . . . . . . . . . . . . . . . . . . . . . . . . . 33.08 116
Empowerment3.3.1 Delegation of authority . . . . . . . . . . . . . . . . . . . . . . . . . . . . . . . . . . . . . . .32.81 1053.3.2 Personal rights . . . . . . . . . . . . . . . . . . . . . . . . . . . . . . . . . . . . . . . . . . . . . . . . 35.14 112
Collaboration3.3.3 Use of virtual social networks . . . . . . . . . . . . . . . . . . . . . . . . . . . . . . . . . 67.34 873.3.4 Use of virtual professional networks . . . . . . . . . . . . . . . . . . . . . . . . . . . 1.00 1123.3.5 Collaboration within organisations . . . . . . . . . . . . . . . . . . . . . . . . . . . .32.00 1113.3.6 Collaboration across organisations . . . . . . . . . . . . . . . . . . . . . . . . . . . .30.20 89
4 RETAIN . . . . . . . . . . . . . . . . . . . . . . . . . . . . . . . . . . . . . . . . . . . 40.84 874.1 Sustainability . . . . . . . . . . . . . . . . . . . . . . . . . . . . . . . . . . . . . . . . . . . . . . . 35.03 854.1.1 Pension system . . . . . . . . . . . . . . . . . . . . . . . . . . . . . . . . . . . . . . . . . . . . . . .23.50 784.1.2 Social protection . . . . . . . . . . . . . . . . . . . . . . . . . . . . . . . . . . . . . . . . . . . . . .43.22 664.1.3 Brain retention . . . . . . . . . . . . . . . . . . . . . . . . . . . . . . . . . . . . . . . . . . . . . . . .38.38 734.2 Lifestyle . . . . . . . . . . . . . . . . . . . . . . . . . . . . . . . . . . . . . . . . . . . . . . . . . . . .46.64 874.2.1 Environmental performance . . . . . . . . . . . . . . . . . . . . . . . . . . . . . . . . . .32.56 1054.2.2 Personal safety . . . . . . . . . . . . . . . . . . . . . . . . . . . . . . . . . . . . . . . . . . . . . . . .64.56 424.2.3 Physician density . . . . . . . . . . . . . . . . . . . . . . . . . . . . . . . . . . . . . . . . . . . . . .12.86 884.2.4 Sanitation . . . . . . . . . . . . . . . . . . . . . . . . . . . . . . . . . . . . . . . . . . . . . . . . . . . . .76.58 87
5 VOCATIONAL AND TECHNICAL SKILLS . . . . . . . . . . . . .26.51 1175.1 Mid-Level Skills . . . . . . . . . . . . . . . . . . . . . . . . . . . . . . . . . . . . . . . . . . . . . 18.12 1075.1.1 Workforce with secondary education . . . . . . . . . . . . . . . . . . . . . . . . .26.51 995.1.2 Population with secondary education . . . . . . . . . . . . . . . . . . . . . . . .25.83 805.1.3 Technicians and associate professionals . . . . . . . . . . . . . . . . . . . . . . .13.44 1075.1.4 Labour productivity per employee . . . . . . . . . . . . . . . . . . . . . . . . . . . . . 6.72 935.2 Employability . . . . . . . . . . . . . . . . . . . . . . . . . . . . . . . . . . . . . . . . . . . . . . . 34.90 1095.2.1 Ease of finding skilled employees . . . . . . . . . . . . . . . . . . . . . . . . . . . . . 43.47 995.2.2 Relevance of education system to the economy . . . . . . . . . . . . . . 37.44 855.2.3 Skills matching with secondary education . . . . . . . . . . . . . . . . . . . .25.83 1135.2.4 Skills matching with tertiary education . . . . . . . . . . . . . . . . . . . . . . . .32.88 122
6 GLOBAL KNOWLEDGE SKILLS . . . . . . . . . . . . . . . . . . . . 28.63 596.1 High-Level Skills . . . . . . . . . . . . . . . . . . . . . . . . . . . . . . . . . . . . . . . . . . . . 17.21 1026.1.1 Workforce with tertiary education . . . . . . . . . . . . . . . . . . . . . . . . . . . . 18.16 896.1.2 Population with tertiary education . . . . . . . . . . . . . . . . . . . . . . . . . . . . . 9.21 936.1.3 Professionals . . . . . . . . . . . . . . . . . . . . . . . . . . . . . . . . . . . . . . . . . . . . . . . . . .18.22 876.1.4 Researchers . . . . . . . . . . . . . . . . . . . . . . . . . . . . . . . . . . . . . . . . . . . . . . . . . . . . 8.38 586.1.5 Senior officials and managers . . . . . . . . . . . . . . . . . . . . . . . . . . . . . . . . . . 5.26 1146.1.6 Availability of scientists and engineers . . . . . . . . . . . . . . . . . . . . . . . .44.06 766.2 Talent Impact . . . . . . . . . . . . . . . . . . . . . . . . . . . . . . . . . . . . . . . . . . . . . . .40.04 326.2.1 Innovation output . . . . . . . . . . . . . . . . . . . . . . . . . . . . . . . . . . . . . . . . . . . . 48.16 366.2.2 High-value exports . . . . . . . . . . . . . . . . . . . . . . . . . . . . . . . . . . . . . . . . . . . . 87.82 56.2.3 New product entrepreneurial activity . . . . . . . . . . . . . . . . . . . . . . . . .22.95 776.2.4 New business density . . . . . . . . . . . . . . . . . . . . . . . . . . . . . . . . . . . . . . . . . . .n/a n/a6.2.5 Scientific journal articles . . . . . . . . . . . . . . . . . . . . . . . . . . . . . . . . . . . . . . . 1.21 91
l Viet Nam l Income group average

GTCI 2020 Country Profile by Pillar
256 THE GLOBAL TALENT COMPETITIVENESS INDEX 2020
COUNTRY PROFILESCOUNTRY PROFILES
102030405060708090100
Global knowledge skills
Vocational andtechnical skills
Retain
Grow
Attract
Enable
1020330
YEMENKey Indicators
Rank (out of 132) . . . . . . . . . . . . . . . . . . . . . . . . . . . . . . . . . . . .132Income group . . . . . . . . . . . . . . . . . . . . . . . . . . . . . . . . . . . . . Low incomeRegional group . . . . . . . . . . . . . .Northern Africa and Western AsiaPopulation (millions) . . . . . . . . . . . . . . . . . . . . . . . . . . . . . . . . . . . . 28.50
GDP per capita (PPP US$) . . . . . . . . . . . . . . . . . . . . . . . . . . . . . 2,570.59GDP (US$ billions) . . . . . . . . . . . . . . . . . . . . . . . . . . . . . . . . . . . . . . 26.91GTCI score . . . . . . . . . . . . . . . . . . . . . . . . . . . . . . . . . . . . . . . . . . . . . . 12.36GTCI score (income group average) . . . . . . . . . . . . . . . . . . . . . . . . 26.01
Score Rank
1 ENABLE . . . . . . . . . . . . . . . . . . . . . . . . . . . . . . . . . . . . . . . . . . .14.08 1321.1 Regulatory Landscape . . . . . . . . . . . . . . . . . . . . . . . . . . . . . . . . . . . . . . . 4.84 1321.1.1 Government effectiveness . . . . . . . . . . . . . . . . . . . . . . . . . . . . . . . . . . . . . 0.00 1321.1.2 Rule of law . . . . . . . . . . . . . . . . . . . . . . . . . . . . . . . . . . . . . . . . . . . . . . . . . . . . 11.73 1311.1.3 Political stability . . . . . . . . . . . . . . . . . . . . . . . . . . . . . . . . . . . . . . . . . . . . . . . . 0.00 1321.1.4 Regulatory quality. . . . . . . . . . . . . . . . . . . . . . . . . . . . . . . . . . . . . . . . . . . . . 12.49 1291.1.5 Corruption . . . . . . . . . . . . . . . . . . . . . . . . . . . . . . . . . . . . . . . . . . . . . . . . . . . . . 0.00 1321.2 Market Landscape . . . . . . . . . . . . . . . . . . . . . . . . . . . . . . . . . . . . . . . . . . 20.85 1301.2.1 Competition intensity . . . . . . . . . . . . . . . . . . . . . . . . . . . . . . . . . . . . . . . . .38.32 1281.2.2 Ease of doing business . . . . . . . . . . . . . . . . . . . . . . . . . . . . . . . . . . . . . . . . . 3.22 1311.2.3 Cluster development . . . . . . . . . . . . . . . . . . . . . . . . . . . . . . . . . . . . . . . . . . 14.71 1261.2.4 R&D expenditure . . . . . . . . . . . . . . . . . . . . . . . . . . . . . . . . . . . . . . . . . . . . . . . .n/a n/a1.2.5 ICT infrastructure. . . . . . . . . . . . . . . . . . . . . . . . . . . . . . . . . . . . . . . . . . . . . . . .n/a n/a1.2.6 Urban population . . . . . . . . . . . . . . . . . . . . . . . . . . . . . . . . . . . . . . . . . . . . . 27.15 1111.3 Business and Labour Landscape . . . . . . . . . . . . . . . . . . . . . . . . . . . . 16.56 131
Labour Market1.3.1 Tertiary-educated unemployment . . . . . . . . . . . . . . . . . . . . . . . . . . . . 51.19 1101.3.2 Active labour market policies . . . . . . . . . . . . . . . . . . . . . . . . . . . . . . . . . . 6.98 1261.3.3 Labour-employer cooperation . . . . . . . . . . . . . . . . . . . . . . . . . . . . . . . . 19.75 111
Management Practice1.3.4 Professional management . . . . . . . . . . . . . . . . . . . . . . . . . . . . . . . . . . . . . 3.30 1311.3.5 Relationship of pay to productivity . . . . . . . . . . . . . . . . . . . . . . . . . . . .26.86 122
Technology Adoption1.3.6 Technology utilisation. . . . . . . . . . . . . . . . . . . . . . . . . . . . . . . . . . . . . . . . . . 0.00 1321.3.7 Investment in emerging technologies . . . . . . . . . . . . . . . . . . . . . . . . . 7.80 1301.3.8 Robot density . . . . . . . . . . . . . . . . . . . . . . . . . . . . . . . . . . . . . . . . . . . . . . . . . . .n/a n/a
2 ATTRACT . . . . . . . . . . . . . . . . . . . . . . . . . . . . . . . . . . . . . . . . . . 11.02 1322.1 External Openness . . . . . . . . . . . . . . . . . . . . . . . . . . . . . . . . . . . . . . . . . 10.04 132
Attract Business2.1.1 FDI and technology transfer . . . . . . . . . . . . . . . . . . . . . . . . . . . . . . . . . . . 0.00 1322.1.2 Prevalence of foreign ownership . . . . . . . . . . . . . . . . . . . . . . . . . . . . . . . 0.00 132
Attract People2.1.3 Migrant stock . . . . . . . . . . . . . . . . . . . . . . . . . . . . . . . . . . . . . . . . . . . . . . . . . 24.78 922.1.4 International students . . . . . . . . . . . . . . . . . . . . . . . . . . . . . . . . . . . . . . . . . 15.56 462.1.5 Brain gain . . . . . . . . . . . . . . . . . . . . . . . . . . . . . . . . . . . . . . . . . . . . . . . . . . . . . . 9.87 1302.2 Internal Openness . . . . . . . . . . . . . . . . . . . . . . . . . . . . . . . . . . . . . . . . . . 11.99 132
Social Inclusion2.2.1 Tolerance of minorities . . . . . . . . . . . . . . . . . . . . . . . . . . . . . . . . . . . . . . . . . 4.44 1272.2.2 Tolerance of immigrants . . . . . . . . . . . . . . . . . . . . . . . . . . . . . . . . . . . . . .24.66 1132.2.3 Social mobility . . . . . . . . . . . . . . . . . . . . . . . . . . . . . . . . . . . . . . . . . . . . . . . .30.87 127
Gender Equality2.2.4 Female graduates . . . . . . . . . . . . . . . . . . . . . . . . . . . . . . . . . . . . . . . . . . . . . . .n/a n/a2.2.5 Gender development gap . . . . . . . . . . . . . . . . . . . . . . . . . . . . . . . . . . . . . 0.00 1302.2.6 Leadership opportunities for women . . . . . . . . . . . . . . . . . . . . . . . . . . 0.00 132
Score Rank
3 GROW . . . . . . . . . . . . . . . . . . . . . . . . . . . . . . . . . . . . . . . . . . . . . .8.29 1323.1 Formal Education . . . . . . . . . . . . . . . . . . . . . . . . . . . . . . . . . . . . . . . . . . . . 2.55 130
Enrolment3.1.1 Vocational enrolment . . . . . . . . . . . . . . . . . . . . . . . . . . . . . . . . . . . . . . . . . . 0.32 1173.1.2 Tertiary enrolment . . . . . . . . . . . . . . . . . . . . . . . . . . . . . . . . . . . . . . . . . . . . . 7.32 108
Quality3.1.3 Tertiary education expenditure . . . . . . . . . . . . . . . . . . . . . . . . . . . . . . . . .n/a n/a3.1.4 Reading, maths, and science . . . . . . . . . . . . . . . . . . . . . . . . . . . . . . . . . . . .n/a n/a3.1.5 University ranking . . . . . . . . . . . . . . . . . . . . . . . . . . . . . . . . . . . . . . . . . . . . . . 0.00 753.2 Lifelong Learning . . . . . . . . . . . . . . . . . . . . . . . . . . . . . . . . . . . . . . . . . . . . 8.95 1323.2.1 Quality of management schools . . . . . . . . . . . . . . . . . . . . . . . . . . . . . . 12.47 1303.2.2 Prevalence of training in firms . . . . . . . . . . . . . . . . . . . . . . . . . . . . . . . . .14.38 903.2.3 Employee development . . . . . . . . . . . . . . . . . . . . . . . . . . . . . . . . . . . . . . . 0.00 1323.3 Access to Growth Opportunities . . . . . . . . . . . . . . . . . . . . . . . . . . . 13.36 132
Empowerment3.3.1 Delegation of authority . . . . . . . . . . . . . . . . . . . . . . . . . . . . . . . . . . . . . . . . 0.37 1313.3.2 Personal rights . . . . . . . . . . . . . . . . . . . . . . . . . . . . . . . . . . . . . . . . . . . . . . . . . 0.00 131
Collaboration3.3.3 Use of virtual social networks . . . . . . . . . . . . . . . . . . . . . . . . . . . . . . . . . 47.02 1163.3.4 Use of virtual professional networks . . . . . . . . . . . . . . . . . . . . . . . . . . . 0.59 1173.3.5 Collaboration within organisations . . . . . . . . . . . . . . . . . . . . . . . . . . . . 15.63 1313.3.6 Collaboration across organisations . . . . . . . . . . . . . . . . . . . . . . . . . . . . 16.55 128
4 RETAIN . . . . . . . . . . . . . . . . . . . . . . . . . . . . . . . . . . . . . . . . . . . .12.03 1314.1 Sustainability . . . . . . . . . . . . . . . . . . . . . . . . . . . . . . . . . . . . . . . . . . . . . . . . 3.64 1324.1.1 Pension system . . . . . . . . . . . . . . . . . . . . . . . . . . . . . . . . . . . . . . . . . . . . . . . . 5.20 1044.1.2 Social protection . . . . . . . . . . . . . . . . . . . . . . . . . . . . . . . . . . . . . . . . . . . . . . . 0.00 1324.1.3 Brain retention . . . . . . . . . . . . . . . . . . . . . . . . . . . . . . . . . . . . . . . . . . . . . . . . . 5.71 1284.2 Lifestyle . . . . . . . . . . . . . . . . . . . . . . . . . . . . . . . . . . . . . . . . . . . . . . . . . . . . 20.43 1244.2.1 Environmental performance . . . . . . . . . . . . . . . . . . . . . . . . . . . . . . . . . . . .n/a n/a4.2.2 Personal safety . . . . . . . . . . . . . . . . . . . . . . . . . . . . . . . . . . . . . . . . . . . . . . . . . 0.00 1314.2.3 Physician density . . . . . . . . . . . . . . . . . . . . . . . . . . . . . . . . . . . . . . . . . . . . . . . 4.68 1044.2.4 Sanitation . . . . . . . . . . . . . . . . . . . . . . . . . . . . . . . . . . . . . . . . . . . . . . . . . . . . .56.61 101
5 VOCATIONAL AND TECHNICAL SKILLS . . . . . . . . . . . . . 17.66 1305.1 Mid-Level Skills . . . . . . . . . . . . . . . . . . . . . . . . . . . . . . . . . . . . . . . . . . . . . 16.79 1105.1.1 Workforce with secondary education . . . . . . . . . . . . . . . . . . . . . . . . .30.21 885.1.2 Population with secondary education . . . . . . . . . . . . . . . . . . . . . . . . . .n/a n/a5.1.3 Technicians and associate professionals . . . . . . . . . . . . . . . . . . . . . . .14.34 1055.1.4 Labour productivity per employee . . . . . . . . . . . . . . . . . . . . . . . . . . . . . 5.81 975.2 Employability . . . . . . . . . . . . . . . . . . . . . . . . . . . . . . . . . . . . . . . . . . . . . . . 18.53 1315.2.1 Ease of finding skilled employees . . . . . . . . . . . . . . . . . . . . . . . . . . . . .35.59 1145.2.2 Relevance of education system to the economy . . . . . . . . . . . . . .14.27 1295.2.3 Skills matching with secondary education . . . . . . . . . . . . . . . . . . . . . 2.44 1315.2.4 Skills matching with tertiary education . . . . . . . . . . . . . . . . . . . . . . . . 21.83 130
6 GLOBAL KNOWLEDGE SKILLS . . . . . . . . . . . . . . . . . . . . . 11.10 1136.1 High-Level Skills . . . . . . . . . . . . . . . . . . . . . . . . . . . . . . . . . . . . . . . . . . . . 17.50 1006.1.1 Workforce with tertiary education . . . . . . . . . . . . . . . . . . . . . . . . . . . . 11.15 1036.1.2 Population with tertiary education . . . . . . . . . . . . . . . . . . . . . . . . . . . . . .n/a n/a6.1.3 Professionals . . . . . . . . . . . . . . . . . . . . . . . . . . . . . . . . . . . . . . . . . . . . . . . . . .18.35 866.1.4 Researchers . . . . . . . . . . . . . . . . . . . . . . . . . . . . . . . . . . . . . . . . . . . . . . . . . . . . .n/a n/a6.1.5 Senior officials and managers . . . . . . . . . . . . . . . . . . . . . . . . . . . . . . . . . . 8.36 1006.1.6 Availability of scientists and engineers . . . . . . . . . . . . . . . . . . . . . . . . 32.13 1116.2 Talent Impact . . . . . . . . . . . . . . . . . . . . . . . . . . . . . . . . . . . . . . . . . . . . . . . . 4.70 1236.2.1 Innovation output . . . . . . . . . . . . . . . . . . . . . . . . . . . . . . . . . . . . . . . . . . . . . 0.00 1226.2.2 High-value exports . . . . . . . . . . . . . . . . . . . . . . . . . . . . . . . . . . . . . . . . . . . . 13.98 746.2.3 New product entrepreneurial activity . . . . . . . . . . . . . . . . . . . . . . . . . . .n/a n/a6.2.4 New business density . . . . . . . . . . . . . . . . . . . . . . . . . . . . . . . . . . . . . . . . . . .n/a n/a6.2.5 Scientific journal articles . . . . . . . . . . . . . . . . . . . . . . . . . . . . . . . . . . . . . . . 0.12 125
l Yemen l Income group average

GTCI 2020 Country Profile by Pillar
THE GLOBAL TALENT COMPETITIVENESS INDEX 2020 257
COUNTRY PROFILESCOUNTRY PROFILES
102030405060708090100
Global knowledge skills
Vocational andtechnical skills
Retain
Grow
Attract
Enable
10203004
ZAMBIAKey Indicators
Rank (out of 132) . . . . . . . . . . . . . . . . . . . . . . . . . . . . . . . . . . . .103Income group . . . . . . . . . . . . . . . . . . . . . . . . . . . Lower-middle incomeRegional group . . . . . . . . . . . . . . . . . . . . . . . . . . . . Sub-Saharan AfricaPopulation (millions) . . . . . . . . . . . . . . . . . . . . . . . . . . . . . . . . . . . . 17.35
GDP per capita (PPP US$) . . . . . . . . . . . . . . . . . . . . . . . . . . . . . 4,216.46GDP (US$ billions) . . . . . . . . . . . . . . . . . . . . . . . . . . . . . . . . . . . . . . 26.72GTCI score . . . . . . . . . . . . . . . . . . . . . . . . . . . . . . . . . . . . . . . . . . . . . . 31.73GTCI score (income group average) . . . . . . . . . . . . . . . . . . . . . . . . 32.97
Score Rank
1 ENABLE . . . . . . . . . . . . . . . . . . . . . . . . . . . . . . . . . . . . . . . . . . .38.12 1001.1 Regulatory Landscape . . . . . . . . . . . . . . . . . . . . . . . . . . . . . . . . . . . . . . 41.79 871.1.1 Government effectiveness . . . . . . . . . . . . . . . . . . . . . . . . . . . . . . . . . . . . 31.46 1061.1.2 Rule of law . . . . . . . . . . . . . . . . . . . . . . . . . . . . . . . . . . . . . . . . . . . . . . . . . . . .45.03 841.1.3 Political stability . . . . . . . . . . . . . . . . . . . . . . . . . . . . . . . . . . . . . . . . . . . . . . . 67.44 611.1.4 Regulatory quality. . . . . . . . . . . . . . . . . . . . . . . . . . . . . . . . . . . . . . . . . . . . .36.65 1031.1.5 Corruption . . . . . . . . . . . . . . . . . . . . . . . . . . . . . . . . . . . . . . . . . . . . . . . . . . . .28.38 871.2 Market Landscape . . . . . . . . . . . . . . . . . . . . . . . . . . . . . . . . . . . . . . . . . . 36.37 1031.2.1 Competition intensity . . . . . . . . . . . . . . . . . . . . . . . . . . . . . . . . . . . . . . . . . 65.13 741.2.2 Ease of doing business . . . . . . . . . . . . . . . . . . . . . . . . . . . . . . . . . . . . . . . . 61.58 811.2.3 Cluster development . . . . . . . . . . . . . . . . . . . . . . . . . . . . . . . . . . . . . . . . . .35.80 851.2.4 R&D expenditure . . . . . . . . . . . . . . . . . . . . . . . . . . . . . . . . . . . . . . . . . . . . . . . 5.78 821.2.5 ICT infrastructure. . . . . . . . . . . . . . . . . . . . . . . . . . . . . . . . . . . . . . . . . . . . . .14.89 1161.2.6 Urban population . . . . . . . . . . . . . . . . . . . . . . . . . . . . . . . . . . . . . . . . . . . . .35.06 1031.3 Business and Labour Landscape . . . . . . . . . . . . . . . . . . . . . . . . . . . . 36.21 101
Labour Market1.3.1 Tertiary-educated unemployment . . . . . . . . . . . . . . . . . . . . . . . . . . . .76.89 751.3.2 Active labour market policies . . . . . . . . . . . . . . . . . . . . . . . . . . . . . . . . .16.82 1131.3.3 Labour-employer cooperation . . . . . . . . . . . . . . . . . . . . . . . . . . . . . . . .20.04 110
Management Practice1.3.4 Professional management . . . . . . . . . . . . . . . . . . . . . . . . . . . . . . . . . . . .38.00 951.3.5 Relationship of pay to productivity . . . . . . . . . . . . . . . . . . . . . . . . . . . .38.74 89
Technology Adoption1.3.6 Technology utilisation. . . . . . . . . . . . . . . . . . . . . . . . . . . . . . . . . . . . . . . . . 31.59 1131.3.7 Investment in emerging technologies . . . . . . . . . . . . . . . . . . . . . . . . 31.39 901.3.8 Robot density . . . . . . . . . . . . . . . . . . . . . . . . . . . . . . . . . . . . . . . . . . . . . . . . . . .n/a n/a
2 ATTRACT . . . . . . . . . . . . . . . . . . . . . . . . . . . . . . . . . . . . . . . . . 52.44 542.1 External Openness . . . . . . . . . . . . . . . . . . . . . . . . . . . . . . . . . . . . . . . . . 49.52 44
Attract Business2.1.1 FDI and technology transfer . . . . . . . . . . . . . . . . . . . . . . . . . . . . . . . . . .50.02 872.1.2 Prevalence of foreign ownership . . . . . . . . . . . . . . . . . . . . . . . . . . . . . .79.77 21
Attract People2.1.3 Migrant stock . . . . . . . . . . . . . . . . . . . . . . . . . . . . . . . . . . . . . . . . . . . . . . . . .22.56 962.1.4 International students . . . . . . . . . . . . . . . . . . . . . . . . . . . . . . . . . . . . . . . . . . .n/a n/a2.1.5 Brain gain . . . . . . . . . . . . . . . . . . . . . . . . . . . . . . . . . . . . . . . . . . . . . . . . . . . . .45.73 602.2 Internal Openness . . . . . . . . . . . . . . . . . . . . . . . . . . . . . . . . . . . . . . . . . . 55.37 67
Social Inclusion2.2.1 Tolerance of minorities . . . . . . . . . . . . . . . . . . . . . . . . . . . . . . . . . . . . . . . .52.22 552.2.2 Tolerance of immigrants . . . . . . . . . . . . . . . . . . . . . . . . . . . . . . . . . . . . . .65.75 512.2.3 Social mobility . . . . . . . . . . . . . . . . . . . . . . . . . . . . . . . . . . . . . . . . . . . . . . . . 51.55 83
Gender Equality2.2.4 Female graduates . . . . . . . . . . . . . . . . . . . . . . . . . . . . . . . . . . . . . . . . . . . . . . .n/a n/a2.2.5 Gender development gap . . . . . . . . . . . . . . . . . . . . . . . . . . . . . . . . . . . . 67.72 912.2.6 Leadership opportunities for women . . . . . . . . . . . . . . . . . . . . . . . . .39.60 85
Score Rank
3 GROW . . . . . . . . . . . . . . . . . . . . . . . . . . . . . . . . . . . . . . . . . . . . .24.93 1173.1 Formal Education . . . . . . . . . . . . . . . . . . . . . . . . . . . . . . . . . . . . . . . . . . . . 1.29 132
Enrolment3.1.1 Vocational enrolment . . . . . . . . . . . . . . . . . . . . . . . . . . . . . . . . . . . . . . . . . . .n/a n/a3.1.2 Tertiary enrolment . . . . . . . . . . . . . . . . . . . . . . . . . . . . . . . . . . . . . . . . . . . . . 2.58 123
Quality3.1.3 Tertiary education expenditure . . . . . . . . . . . . . . . . . . . . . . . . . . . . . . . . .n/a n/a3.1.4 Reading, maths, and science . . . . . . . . . . . . . . . . . . . . . . . . . . . . . . . . . . . .n/a n/a3.1.5 University ranking . . . . . . . . . . . . . . . . . . . . . . . . . . . . . . . . . . . . . . . . . . . . . . 0.00 753.2 Lifelong Learning . . . . . . . . . . . . . . . . . . . . . . . . . . . . . . . . . . . . . . . . . . . 33.49 1063.2.1 Quality of management schools . . . . . . . . . . . . . . . . . . . . . . . . . . . . . .40.07 883.2.2 Prevalence of training in firms . . . . . . . . . . . . . . . . . . . . . . . . . . . . . . . . .32.72 553.2.3 Employee development . . . . . . . . . . . . . . . . . . . . . . . . . . . . . . . . . . . . . . 27.68 1023.3 Access to Growth Opportunities . . . . . . . . . . . . . . . . . . . . . . . . . . . 40.02 99
Empowerment3.3.1 Delegation of authority . . . . . . . . . . . . . . . . . . . . . . . . . . . . . . . . . . . . . . .52.53 503.3.2 Personal rights . . . . . . . . . . . . . . . . . . . . . . . . . . . . . . . . . . . . . . . . . . . . . . . .56.33 94
Collaboration3.3.3 Use of virtual social networks . . . . . . . . . . . . . . . . . . . . . . . . . . . . . . . . .63.88 963.3.4 Use of virtual professional networks . . . . . . . . . . . . . . . . . . . . . . . . . . . 2.01 1043.3.5 Collaboration within organisations . . . . . . . . . . . . . . . . . . . . . . . . . . . . 37.38 993.3.6 Collaboration across organisations . . . . . . . . . . . . . . . . . . . . . . . . . . . .28.01 100
4 RETAIN . . . . . . . . . . . . . . . . . . . . . . . . . . . . . . . . . . . . . . . . . . . .26.97 1134.1 Sustainability . . . . . . . . . . . . . . . . . . . . . . . . . . . . . . . . . . . . . . . . . . . . . . . 26.13 1094.1.1 Pension system . . . . . . . . . . . . . . . . . . . . . . . . . . . . . . . . . . . . . . . . . . . . . . .12.20 934.1.2 Social protection . . . . . . . . . . . . . . . . . . . . . . . . . . . . . . . . . . . . . . . . . . . . . . 31.21 934.1.3 Brain retention . . . . . . . . . . . . . . . . . . . . . . . . . . . . . . . . . . . . . . . . . . . . . . . .34.99 824.2 Lifestyle . . . . . . . . . . . . . . . . . . . . . . . . . . . . . . . . . . . . . . . . . . . . . . . . . . . . 27.81 1084.2.1 Environmental performance . . . . . . . . . . . . . . . . . . . . . . . . . . . . . . . . . . 39.24 954.2.2 Personal safety . . . . . . . . . . . . . . . . . . . . . . . . . . . . . . . . . . . . . . . . . . . . . . . .44.96 854.2.3 Physician density . . . . . . . . . . . . . . . . . . . . . . . . . . . . . . . . . . . . . . . . . . . . . . . 1.15 1154.2.4 Sanitation . . . . . . . . . . . . . . . . . . . . . . . . . . . . . . . . . . . . . . . . . . . . . . . . . . . . .25.86 121
5 VOCATIONAL AND TECHNICAL SKILLS . . . . . . . . . . . . 34.81 915.1 Mid-Level Skills . . . . . . . . . . . . . . . . . . . . . . . . . . . . . . . . . . . . . . . . . . . . . 19.35 1045.1.1 Workforce with secondary education . . . . . . . . . . . . . . . . . . . . . . . . .36.24 805.1.2 Population with secondary education . . . . . . . . . . . . . . . . . . . . . . . . . .n/a n/a5.1.3 Technicians and associate professionals . . . . . . . . . . . . . . . . . . . . . . .14.83 1035.1.4 Labour productivity per employee . . . . . . . . . . . . . . . . . . . . . . . . . . . . . 6.97 925.2 Employability . . . . . . . . . . . . . . . . . . . . . . . . . . . . . . . . . . . . . . . . . . . . . . . 50.27 625.2.1 Ease of finding skilled employees . . . . . . . . . . . . . . . . . . . . . . . . . . . . . 69.97 335.2.2 Relevance of education system to the economy . . . . . . . . . . . . . .43.65 675.2.3 Skills matching with secondary education . . . . . . . . . . . . . . . . . . . . 31.40 995.2.4 Skills matching with tertiary education . . . . . . . . . . . . . . . . . . . . . . . .56.08 62
6 GLOBAL KNOWLEDGE SKILLS . . . . . . . . . . . . . . . . . . . . . 13.10 1086.1 High-Level Skills . . . . . . . . . . . . . . . . . . . . . . . . . . . . . . . . . . . . . . . . . . . . 19.81 936.1.1 Workforce with tertiary education . . . . . . . . . . . . . . . . . . . . . . . . . . . . 18.93 866.1.2 Population with tertiary education . . . . . . . . . . . . . . . . . . . . . . . . . . . . . .n/a n/a6.1.3 Professionals . . . . . . . . . . . . . . . . . . . . . . . . . . . . . . . . . . . . . . . . . . . . . . . . . . 19.85 786.1.4 Researchers . . . . . . . . . . . . . . . . . . . . . . . . . . . . . . . . . . . . . . . . . . . . . . . . . . . . 0.37 976.1.5 Senior officials and managers . . . . . . . . . . . . . . . . . . . . . . . . . . . . . . . . .10.72 926.1.6 Availability of scientists and engineers . . . . . . . . . . . . . . . . . . . . . . . . 49.18 656.2 Talent Impact . . . . . . . . . . . . . . . . . . . . . . . . . . . . . . . . . . . . . . . . . . . . . . . . 6.40 1206.2.1 Innovation output . . . . . . . . . . . . . . . . . . . . . . . . . . . . . . . . . . . . . . . . . . . . 11.03 1186.2.2 High-value exports . . . . . . . . . . . . . . . . . . . . . . . . . . . . . . . . . . . . . . . . . . . . . 5.86 986.2.3 New product entrepreneurial activity . . . . . . . . . . . . . . . . . . . . . . . . . . 9.38 876.2.4 New business density . . . . . . . . . . . . . . . . . . . . . . . . . . . . . . . . . . . . . . . . . . 5.34 686.2.5 Scientific journal articles . . . . . . . . . . . . . . . . . . . . . . . . . . . . . . . . . . . . . . . 0.39 112
l Zambia l Income group average

GTCI 2020 Country Profile by Pillar
258 THE GLOBAL TALENT COMPETITIVENESS INDEX 2020
COUNTRY PROFILES
102030405060708090100
Global knowledge skills
Vocational andtechnical skills
Retain
Grow
Attract
Enable
10203004
ZIMBABWEKey Indicators
Rank (out of 132) . . . . . . . . . . . . . . . . . . . . . . . . . . . . . . . . . . . .127Income group . . . . . . . . . . . . . . . . . . . . . . . . . . . Lower-middle incomeRegional group . . . . . . . . . . . . . . . . . . . . . . . . . . . . Sub-Saharan AfricaPopulation (millions) . . . . . . . . . . . . . . . . . . . . . . . . . . . . . . . . . . . . 14.44
GDP per capita (PPP US$) . . . . . . . . . . . . . . . . . . . . . . . . . . . . . 3,024.45GDP (US$ billions) . . . . . . . . . . . . . . . . . . . . . . . . . . . . . . . . . . . . . . 31.00GTCI score . . . . . . . . . . . . . . . . . . . . . . . . . . . . . . . . . . . . . . . . . . . . . . 23.44GTCI score (income group average) . . . . . . . . . . . . . . . . . . . . . . . . 32.97
Score Rank
1 ENABLE . . . . . . . . . . . . . . . . . . . . . . . . . . . . . . . . . . . . . . . . . . .27.93 1261.1 Regulatory Landscape . . . . . . . . . . . . . . . . . . . . . . . . . . . . . . . . . . . . . . 21.34 1281.1.1 Government effectiveness . . . . . . . . . . . . . . . . . . . . . . . . . . . . . . . . . . . . 17.68 1271.1.2 Rule of law . . . . . . . . . . . . . . . . . . . . . . . . . . . . . . . . . . . . . . . . . . . . . . . . . . . .20.46 1281.1.3 Political stability . . . . . . . . . . . . . . . . . . . . . . . . . . . . . . . . . . . . . . . . . . . . . . .48.01 1071.1.4 Regulatory quality. . . . . . . . . . . . . . . . . . . . . . . . . . . . . . . . . . . . . . . . . . . . . . 9.71 1311.1.5 Corruption . . . . . . . . . . . . . . . . . . . . . . . . . . . . . . . . . . . . . . . . . . . . . . . . . . . . 10.81 1261.2 Market Landscape . . . . . . . . . . . . . . . . . . . . . . . . . . . . . . . . . . . . . . . . . . 28.03 1231.2.1 Competition intensity . . . . . . . . . . . . . . . . . . . . . . . . . . . . . . . . . . . . . . . . . 51.71 1121.2.2 Ease of doing business . . . . . . . . . . . . . . . . . . . . . . . . . . . . . . . . . . . . . . . . 35.42 1201.2.3 Cluster development . . . . . . . . . . . . . . . . . . . . . . . . . . . . . . . . . . . . . . . . . . . 9.08 1301.2.4 R&D expenditure . . . . . . . . . . . . . . . . . . . . . . . . . . . . . . . . . . . . . . . . . . . . . . . .n/a n/a1.2.5 ICT infrastructure. . . . . . . . . . . . . . . . . . . . . . . . . . . . . . . . . . . . . . . . . . . . . . 21.88 1111.2.6 Urban population . . . . . . . . . . . . . . . . . . . . . . . . . . . . . . . . . . . . . . . . . . . . .22.05 1191.3 Business and Labour Landscape . . . . . . . . . . . . . . . . . . . . . . . . . . . . 34.43 107
Labour Market1.3.1 Tertiary-educated unemployment . . . . . . . . . . . . . . . . . . . . . . . . . . . . 77.89 691.3.2 Active labour market policies . . . . . . . . . . . . . . . . . . . . . . . . . . . . . . . . . . 2.52 1301.3.3 Labour-employer cooperation . . . . . . . . . . . . . . . . . . . . . . . . . . . . . . . .28.46 92
Management Practice1.3.4 Professional management . . . . . . . . . . . . . . . . . . . . . . . . . . . . . . . . . . . .62.34 391.3.5 Relationship of pay to productivity . . . . . . . . . . . . . . . . . . . . . . . . . . . .29.57 120
Technology Adoption1.3.6 Technology utilisation. . . . . . . . . . . . . . . . . . . . . . . . . . . . . . . . . . . . . . . . .28.02 1151.3.7 Investment in emerging technologies . . . . . . . . . . . . . . . . . . . . . . . .12.22 1261.3.8 Robot density . . . . . . . . . . . . . . . . . . . . . . . . . . . . . . . . . . . . . . . . . . . . . . . . . . .n/a n/a
2 ATTRACT . . . . . . . . . . . . . . . . . . . . . . . . . . . . . . . . . . . . . . . . . . 35.11 1202.1 External Openness . . . . . . . . . . . . . . . . . . . . . . . . . . . . . . . . . . . . . . . . . 23.97 124
Attract Business2.1.1 FDI and technology transfer . . . . . . . . . . . . . . . . . . . . . . . . . . . . . . . . . . 19.79 1292.1.2 Prevalence of foreign ownership . . . . . . . . . . . . . . . . . . . . . . . . . . . . . . 41.73 107
Attract People2.1.3 Migrant stock . . . . . . . . . . . . . . . . . . . . . . . . . . . . . . . . . . . . . . . . . . . . . . . . .38.85 672.1.4 International students . . . . . . . . . . . . . . . . . . . . . . . . . . . . . . . . . . . . . . . . . . 1.61 912.1.5 Brain gain . . . . . . . . . . . . . . . . . . . . . . . . . . . . . . . . . . . . . . . . . . . . . . . . . . . . . 17.86 1212.2 Internal Openness . . . . . . . . . . . . . . . . . . . . . . . . . . . . . . . . . . . . . . . . . . 46.24 106
Social Inclusion2.2.1 Tolerance of minorities . . . . . . . . . . . . . . . . . . . . . . . . . . . . . . . . . . . . . . . .36.67 812.2.2 Tolerance of immigrants . . . . . . . . . . . . . . . . . . . . . . . . . . . . . . . . . . . . . .65.75 512.2.3 Social mobility . . . . . . . . . . . . . . . . . . . . . . . . . . . . . . . . . . . . . . . . . . . . . . . .38.30 122
Gender Equality2.2.4 Female graduates . . . . . . . . . . . . . . . . . . . . . . . . . . . . . . . . . . . . . . . . . . . . .33.58 1032.2.5 Gender development gap . . . . . . . . . . . . . . . . . . . . . . . . . . . . . . . . . . . . 61.98 1032.2.6 Leadership opportunities for women . . . . . . . . . . . . . . . . . . . . . . . . . 41.18 79
Score Rank
3 GROW . . . . . . . . . . . . . . . . . . . . . . . . . . . . . . . . . . . . . . . . . . . . 26.80 1123.1 Formal Education . . . . . . . . . . . . . . . . . . . . . . . . . . . . . . . . . . . . . . . . . . . 11.88 103
Enrolment3.1.1 Vocational enrolment . . . . . . . . . . . . . . . . . . . . . . . . . . . . . . . . . . . . . . . . . . .n/a n/a3.1.2 Tertiary enrolment . . . . . . . . . . . . . . . . . . . . . . . . . . . . . . . . . . . . . . . . . . . . . 6.14 112
Quality3.1.3 Tertiary education expenditure . . . . . . . . . . . . . . . . . . . . . . . . . . . . . . .29.50 353.1.4 Reading, maths, and science . . . . . . . . . . . . . . . . . . . . . . . . . . . . . . . . . . . .n/a n/a3.1.5 University ranking . . . . . . . . . . . . . . . . . . . . . . . . . . . . . . . . . . . . . . . . . . . . . . 0.00 753.2 Lifelong Learning . . . . . . . . . . . . . . . . . . . . . . . . . . . . . . . . . . . . . . . . . . . 34.39 983.2.1 Quality of management schools . . . . . . . . . . . . . . . . . . . . . . . . . . . . . .40.04 893.2.2 Prevalence of training in firms . . . . . . . . . . . . . . . . . . . . . . . . . . . . . . . . .30.34 583.2.3 Employee development . . . . . . . . . . . . . . . . . . . . . . . . . . . . . . . . . . . . . .32.80 833.3 Access to Growth Opportunities . . . . . . . . . . . . . . . . . . . . . . . . . . . 34.12 112
Empowerment3.3.1 Delegation of authority . . . . . . . . . . . . . . . . . . . . . . . . . . . . . . . . . . . . . . . 51.16 563.3.2 Personal rights . . . . . . . . . . . . . . . . . . . . . . . . . . . . . . . . . . . . . . . . . . . . . . . . 41.41 107
Collaboration3.3.3 Use of virtual social networks . . . . . . . . . . . . . . . . . . . . . . . . . . . . . . . . .56.01 1083.3.4 Use of virtual professional networks . . . . . . . . . . . . . . . . . . . . . . . . . . . 2.63 963.3.5 Collaboration within organisations . . . . . . . . . . . . . . . . . . . . . . . . . . . .32.29 1103.3.6 Collaboration across organisations . . . . . . . . . . . . . . . . . . . . . . . . . . . . 21.22 118
4 RETAIN . . . . . . . . . . . . . . . . . . . . . . . . . . . . . . . . . . . . . . . . . . . .15.76 1284.1 Sustainability . . . . . . . . . . . . . . . . . . . . . . . . . . . . . . . . . . . . . . . . . . . . . . . 14.59 1284.1.1 Pension system . . . . . . . . . . . . . . . . . . . . . . . . . . . . . . . . . . . . . . . . . . . . . . .18.30 834.1.2 Social protection . . . . . . . . . . . . . . . . . . . . . . . . . . . . . . . . . . . . . . . . . . . . . . . 8.77 1284.1.3 Brain retention . . . . . . . . . . . . . . . . . . . . . . . . . . . . . . . . . . . . . . . . . . . . . . . . 16.71 1214.2 Lifestyle . . . . . . . . . . . . . . . . . . . . . . . . . . . . . . . . . . . . . . . . . . . . . . . . . . . . 16.92 1294.2.1 Environmental performance . . . . . . . . . . . . . . . . . . . . . . . . . . . . . . . . . .26.64 1144.2.2 Personal safety . . . . . . . . . . . . . . . . . . . . . . . . . . . . . . . . . . . . . . . . . . . . . . . . . 6.22 1274.2.3 Physician density . . . . . . . . . . . . . . . . . . . . . . . . . . . . . . . . . . . . . . . . . . . . . . . 0.93 1194.2.4 Sanitation . . . . . . . . . . . . . . . . . . . . . . . . . . . . . . . . . . . . . . . . . . . . . . . . . . . . . 33.91 117
5 VOCATIONAL AND TECHNICAL SKILLS . . . . . . . . . . . . 26.32 1195.1 Mid-Level Skills . . . . . . . . . . . . . . . . . . . . . . . . . . . . . . . . . . . . . . . . . . . . . . 2.68 1315.1.1 Workforce with secondary education . . . . . . . . . . . . . . . . . . . . . . . . . . 1.53 1265.1.2 Population with secondary education . . . . . . . . . . . . . . . . . . . . . . . . . 1.69 1115.1.3 Technicians and associate professionals . . . . . . . . . . . . . . . . . . . . . . . . 6.06 1175.1.4 Labour productivity per employee . . . . . . . . . . . . . . . . . . . . . . . . . . . . . 1.43 1065.2 Employability . . . . . . . . . . . . . . . . . . . . . . . . . . . . . . . . . . . . . . . . . . . . . . . 49.97 635.2.1 Ease of finding skilled employees . . . . . . . . . . . . . . . . . . . . . . . . . . . . .56.93 615.2.2 Relevance of education system to the economy . . . . . . . . . . . . . .52.77 485.2.3 Skills matching with secondary education . . . . . . . . . . . . . . . . . . . .42.53 665.2.4 Skills matching with tertiary education . . . . . . . . . . . . . . . . . . . . . . . . 47.64 85
6 GLOBAL KNOWLEDGE SKILLS . . . . . . . . . . . . . . . . . . . . . . 8.75 1246.1 High-Level Skills . . . . . . . . . . . . . . . . . . . . . . . . . . . . . . . . . . . . . . . . . . . . . 9.98 1226.1.1 Workforce with tertiary education . . . . . . . . . . . . . . . . . . . . . . . . . . . . 16.41 936.1.2 Population with tertiary education . . . . . . . . . . . . . . . . . . . . . . . . . . . . . 3.79 996.1.3 Professionals . . . . . . . . . . . . . . . . . . . . . . . . . . . . . . . . . . . . . . . . . . . . . . . . . . . 8.29 1136.1.4 Researchers . . . . . . . . . . . . . . . . . . . . . . . . . . . . . . . . . . . . . . . . . . . . . . . . . . . . 0.95 886.1.5 Senior officials and managers . . . . . . . . . . . . . . . . . . . . . . . . . . . . . . . . . . 4.65 1166.1.6 Availability of scientists and engineers . . . . . . . . . . . . . . . . . . . . . . . .25.77 1186.2 Talent Impact . . . . . . . . . . . . . . . . . . . . . . . . . . . . . . . . . . . . . . . . . . . . . . . . 7.52 1176.2.1 Innovation output . . . . . . . . . . . . . . . . . . . . . . . . . . . . . . . . . . . . . . . . . . . . 15.76 1076.2.2 High-value exports . . . . . . . . . . . . . . . . . . . . . . . . . . . . . . . . . . . . . . . . . . . . . 5.98 976.2.3 New product entrepreneurial activity . . . . . . . . . . . . . . . . . . . . . . . . . . .n/a n/a6.2.4 New business density . . . . . . . . . . . . . . . . . . . . . . . . . . . . . . . . . . . . . . . . . . .n/a n/a6.2.5 Scientific journal articles . . . . . . . . . . . . . . . . . . . . . . . . . . . . . . . . . . . . . . . 0.80 98
l Zimbabwe l Income group average

Data Tables


THE GLOBAL TALENT COMPETITIVENESS INDEX 2020 261
DATA TABLES
THE GLOBAL TALENT COMPETITIVENESS INDEX 2020 273
DATA TABLESDATA TABLES
1.2.3 Cluster development
Average answer to the question: In your country, how widespread are well-developed and deep clusters (geographic concentrations of firms, suppliers, producers of related products and services, and specialized institutions in a particular field)? [1 = nonexistent; 7 = widespread in many fields] | 2018
Rank Country Value Score 1 United States of America......................................................................5.77 100.00 2 Germany ..........................................................................................................5.52 92.94 3 Switzerland ....................................................................................................5.49 91.86 4 Italy ......................................................................................................................5.47 91.45 5 Netherlands ...................................................................................................5.37 88.55 6 Japan ..................................................................................................................5.34 87.60 7 Malaysia ............................................................................................................5.26 85.51 8 United Kingdom ........................................................................................ 5.19 83.26 9 United Arab Emirates .............................................................................. 5.17 82.83 10 Singapore........................................................................................................ 5.12 81.27 11 Sweden ............................................................................................................5.06 79.58 12 Luxembourg .................................................................................................5.02 78.49 13 Austria ...............................................................................................................5.00 78.08 14 Qatar ...................................................................................................................4.94 76.29 15 Belgium ............................................................................................................4.90 74.96 16 Finland ..............................................................................................................4.89 74.89 17 Norway .............................................................................................................4.87 74.35 18 Denmark ......................................................................................................... 4.84 73.27 19 France ................................................................................................................4.79 71.94 20 Saudi Arabia ..................................................................................................4.72 70.04 21 Canada ..............................................................................................................4.72 69.87 22 Ireland ...............................................................................................................4.65 67.83 23 Oman .................................................................................................................4.63 67.29 24 India ....................................................................................................................4.63 67.25 25 Bahrain ..............................................................................................................4.62 67.06 26 Indonesia.........................................................................................................4.60 66.44 27 China ..................................................................................................................4.58 65.86 28 Korea, Rep. ......................................................................................................4.57 65.73 29 Israel ...................................................................................................................4.51 63.87 30 Jordan................................................................................................................4.46 62.52 31 South Africa ...................................................................................................4.38 60.31 32 Azerbaijan .......................................................................................................4.34 59.07 33 Kenya .................................................................................................................4.32 58.54 34 New Zealand ................................................................................................4.31 58.23 35 Spain ..................................................................................................................4.27 56.96 36 Portugal ...........................................................................................................4.26 56.82 37 Egypt ..................................................................................................................4.23 56.04 38 Mexico ..............................................................................................................4.23 55.87 39 Australia ...........................................................................................................4.23 55.84 40 Malta ..................................................................................................................4.23 55.81 41 Ghana ................................................................................................................ 4.17 54.22 42 Iceland .............................................................................................................. 4.15 53.75 43 Cambodia ....................................................................................................... 4.13 53.03 44 Mauritius ..........................................................................................................4.07 51.43 45 Czech Republic ...........................................................................................4.03 50.22 46 Philippines ......................................................................................................4.00 49.25 47 Kuwait ...............................................................................................................4.00 49.17 48 Brazil ...................................................................................................................3.98 48.85 49 Costa Rica .......................................................................................................3.98 48.71 50 Pakistan ............................................................................................................3.95 48.01 51 Thailand ...........................................................................................................3.93 47.22 52 Tanzania, United Rep. .............................................................................3.92 47.10 53 Jamaica .............................................................................................................3.89 46.20 54 Lao PDR ............................................................................................................3.86 45.39 55 Slovenia ........................................................................................................... 3.84 44.72 56 Sri Lanka ...........................................................................................................3.82 44.26 57 Dominican Republic ................................................................................3.82 44.06 58 Bangladesh ....................................................................................................3.81 43.86 59 Bulgaria.............................................................................................................3.81 43.77 60 Hungary ...........................................................................................................3.81 43.77 61 Slovakia ............................................................................................................3.80 43.53 62 Poland ...............................................................................................................3.80 43.51 63 Panama .............................................................................................................3.79 43.42 64 Mali ......................................................................................................................3.79 43.38 65 Cyprus ...............................................................................................................3.78 42.95 66 Rwanda ............................................................................................................3.78 42.93
Rank Country Value Score 67 Honduras ........................................................................................................3.76 42.51 68 Armenia............................................................................................................3.76 42.40 69 Latvia .................................................................................................................3.76 42.37 70 Morocco ...........................................................................................................3.76 42.31 71 Estonia ..............................................................................................................3.73 41.67 72 Viet Nam ..........................................................................................................3.71 41.14 73 Colombia .........................................................................................................3.71 40.95 74 Gambia .............................................................................................................3.71 40.89 75 Turkey ................................................................................................................3.67 39.77 76 Bhutan...............................................................................................................3.65 39.38 77 Chile ................................................................................................................... 3.64 39.10 78 Iran, Islamic Rep. .........................................................................................3.63 38.75 79 Trinidad and Tobago ...............................................................................3.60 37.80 80 Uganda .............................................................................................................3.58 37.41 81 Serbia .................................................................................................................3.57 37.14 82 Guatemala ......................................................................................................3.57 37.08 83 Ethiopia ............................................................................................................3.56 36.68 84 Namibia ............................................................................................................3.53 35.99 85 Zambia ..............................................................................................................3.53 35.80 86 Montenegro ..................................................................................................3.51 35.22 87 Lesotho.............................................................................................................3.49 34.81 88 Brunei Darussalam ....................................................................................3.49 34.77 89 Nigeria ...............................................................................................................3.49 34.64 90 Russian Federation ...................................................................................3.49 34.60 91 Lithuania ..........................................................................................................3.48 34.42 92 Liberia ................................................................................................................3.46 33.78 93 Algeria ...............................................................................................................3.43 33.12 94 Senegal .............................................................................................................3.42 32.64 95 Tajikistan ..........................................................................................................3.41 32.50 96 Peru .....................................................................................................................3.37 31.33 97 Argentina ........................................................................................................3.35 30.64 98 Cabo Verde ....................................................................................................3.29 29.10 99 Nepal ..................................................................................................................3.28 28.70 100 Bosnia and Herzegovina .......................................................................3.24 27.61 101 Ukraine .............................................................................................................3.24 27.43 102 Eswatini ............................................................................................................3.24 27.41 103 Tunisia................................................................................................................3.22 26.96 104 Uruguay ...........................................................................................................3.22 26.93 105 North Macedonia ......................................................................................3.21 26.76 106 Mozambique ................................................................................................ 3.19 26.14 107 Ecuador ............................................................................................................ 3.19 26.13 108 Cameroon ....................................................................................................... 3.12 24.05 109 Malawi ................................................................................................................3.11 23.87 110 Burundi ..............................................................................................................3.11 23.72 111 Georgia .............................................................................................................3.09 23.20 112 Botswana ........................................................................................................3.07 22.74 113 Romania ...........................................................................................................3.07 22.64 114 Kazakhstan .....................................................................................................3.07 22.54 115 Paraguay ..........................................................................................................3.06 22.42 116 Albania ..............................................................................................................3.06 22.40 117 Madagascar ...................................................................................................3.03 21.66 118 Nicaragua ........................................................................................................3.02 21.31 119 Burkina Faso ..................................................................................................3.00 20.67 120 Côte d’Ivoire ..................................................................................................2.95 19.16 121 Greece ...............................................................................................................2.94 18.88 122 Bolivia, Plurinational St. ..........................................................................2.87 16.82 123 Croatia ...............................................................................................................2.83 15.66 124 Mongolia .........................................................................................................2.81 15.36 125 Congo, Dem. Rep. .....................................................................................2.81 15.24 126 Yemen ...............................................................................................................2.79 14.71 127 El Salvador ......................................................................................................2.78 14.37 128 Kyrgyzstan ......................................................................................................2.74 13.36 129 Moldova, Rep. ..............................................................................................2.69 11.91 130 Zimbabwe ......................................................................................................2.60 9.08 131 Venezuela, Bolivarian Rep. .................................................................. 2.44 4.54 132 Angola...............................................................................................................2.28 0.00
SOURCE: World Economic Forum, Executive Opinion Survey 2017–2018 (http://reports.weforum.org)For some countries, the latest year for which data are available may differ from the year that appears at the top of the page. The cut-off year is 2008.
1 The first section provides the variable number that represents its position in the overall structure of GTCI. The first digit refers to the pillar, the second digit refers to the sub-pillar within that pillar, and the third digit refers to the position of the variable in that sub-pillar. For instance, the variable 1.2.3 Cluster development refers to the third variable in the second sub-pillar of the first pillar.
2 The second section spells out the description or tech-nical name of the variable, along with the latest year for which the data are available. For some countries, the year of the data differs from the most frequent year; in these cases, the most recent year available is used.
For variables derived from a published report where the publication date differs from the year the data were actu-ally collected, the year of the data collection was used. This applies to variables taken from the Doing Business 2019 report, which was published in October 2018 and which uses data collected in 2018, for example.
For qualitative variables derived from survey responses, the question asked in the survey is shown as the exact techni-cal name. This applies to all variables taken from the World Economic Forum’s Executive Opinion Survey, for instance.
3 The ranking of the countries within the data table fol-lows their normalised scores. There are three parts to the information in the ranking: the rank of the country, the raw value, and the normalised score. Because of the way out liers are treated, in some variables several countries have the same score. For variables in which two or more countries happen to have the same raw value (with a tie in the ranking as a result), the relevant countries have been sorted alphabetically. For more information about normal-isation methods and variable names, please refer to the Technical Notes and the Sources and Definitions sections in the Appendices.
4 The final section presents all sources and a link to the data source as well as the cut-off year.
How to Read the Data Tables
1
2
3
4
This section provides the rankings and scores for each of the 70 variables that make up the GTCI 2020.
Each data table consists of four parts:
1 the name of the variable,2 the description or technical name and the latest year
for which data are available,3 the ranking, and4 the source.


Index of Data Tables
1 ENABLE ................................................................... 265
1.1 Regulatory Landscape1.1.1 Government effectiveness ...............................................................2661.1.2 Rule of law................................................................................................... 2671.1.3 Political stability .......................................................................................2681.1.4 Regulatory quality ..................................................................................2691.1.5 Corruption ..................................................................................................270
1.2 Market Landscape1.2.1 Competition intensity...........................................................................2711.2.2 Ease of doing business........................................................................ 2721.2.3 Cluster development ...........................................................................2731.2.4 R&D expenditure .................................................................................... 2741.2.5 ICT infrastructure .................................................................................... 2751.2.6 Urban population ................................................................................... 276
1.3 Business and Labour Landscape1.3.1 Tertiary-educated unemployment ............................................. 2771.3.2 Active labour market policies .........................................................2781.3.3 Labour-employer cooperation ......................................................2791.3.4 Professional management ................................................................2801.3.5 Relationship of pay to productivity .............................................2811.3.6 Technology utilisation ......................................................................... 2821.3.7 Investment in emerging technologies .....................................2831.3.8 Robot density ...........................................................................................284
2 ATTRACT ................................................................. 285
2.1 External Openness2.1.1 FDI and technology transfer............................................................2862.1.2 Prevalence of foreign ownership ................................................. 2872.1.3 Migrant stock ............................................................................................2882.1.4 International students .........................................................................2892.1.5 Brain gain .....................................................................................................290
2.2 Internal Openness2.2.1 Tolerance of minorities ........................................................................2912.2.2 Tolerance of immigrants .................................................................... 2922.2.3 Social mobility ..........................................................................................2932.2.4 Female graduates ...................................................................................2942.2.5 Gender development gap ................................................................2952.2.6 Leadership opportunities for women .......................................296
3 GROW .......................................................................297
3.1 Formal Education3.1.1 Vocational enrolment ..........................................................................2983.1.2 Tertiary enrolment .................................................................................2993.1.3 Tertiary education expenditure.....................................................3003.1.4 Reading, maths, and science ............................................................3013.1.5 University ranking .................................................................................. 302
3.2 Lifelong Learning3.2.1 Quality of management schools ..................................................3033.2.2 Prevalence of training in firms ........................................................3043.2.3 Employee development ....................................................................305
3.3 Access to Growth Opportunities3.3.1 Delegation of authority ......................................................................3063.3.2 Personal rights .......................................................................................... 3073.3.3 Use of virtual social networks .........................................................3083.3.4 Use of virtual professional networks ..........................................3093.3.5 Collaboration within organisations ............................................. 3103.3.6 Collaboration across organisations .............................................. 311
4 RETAIN .....................................................................313
4.1 Sustainability4.1.1 Pension system ........................................................................................ 3144.1.2 Social protection ......................................................................................3154.1.3 Brain retention .......................................................................................... 316
4.2 Lifestyle4.2.1 Environmental performance ............................................................3174.2.2 Personal safety ......................................................................................... 3184.2.3 Physician density .....................................................................................3194.2.4 Sanitation ....................................................................................................320
5 VOCATIONAL AND TECHNICAL SKILLS ...............321
5.1 Mid-Level Skills5.1.1 Workforce with secondary education ....................................... 3225.1.2 Population with secondary education .....................................3235.1.3 Technicians and associate professionals .................................. 3245.1.4 Labour productivity per employee ............................................ 325
5.2 Employability5.2.1 Ease of finding skilled employees ................................................ 3265.2.2 Relevance of education system to the economy ...............3275.2.3 Skills matching with secondary education ............................3285.2.4 Skills matching with tertiary education ....................................329
6 GLOBAL KNOWLEDGE SKILLS ..............................331
6.1 High-Level Skills6.1.1 Workforce with tertiary education .............................................. 3326.1.2 Population with tertiary education ............................................. 3336.1.3 Professionals ..............................................................................................3346.1.4 Researchers ................................................................................................ 3356.1.5 Senior officials and managers ........................................................3366.1.6 Availability of scientists and engineers ......................................337
6.2 Talent Impact6.2.1 Innovation output .................................................................................3386.2.2 High-value exports................................................................................3396.2.3 New product entrepreneurial activity ......................................3406.2.4 New business density ...........................................................................3416.2.5 Scientific journal articles ....................................................................342
THE GLOBAL TALENT COMPETITIVENESS INDEX 2020 263
DATA TABLES

THE GLOBAL TALENT COMPETITIVENESS INDEX 2020 265
DATA TABLES
Pillar 1Enable

266 THE GLOBAL TALENT COMPETITIVENESS INDEX 2020
DATA TABLESDATA TABLES
1.1.1 Government effectiveness
Government effectiveness indicator | 2017
Rank Country Value Score 1 Singapore........................................................................................................2.21 100.00 2 Switzerland ....................................................................................................2.06 96.39 3 Norway .............................................................................................................1.98 94.62 4 Finland ..............................................................................................................1.94 93.49 5 Canada ..............................................................................................................1.85 91.49 6 Netherlands ...................................................................................................1.85 91.43 7 Sweden ............................................................................................................1.84 91.09 8 Denmark ..........................................................................................................1.80 90.10 9 New Zealand ................................................................................................1.77 89.35 10 Germany ..........................................................................................................1.72 88.22 11 Luxembourg .................................................................................................1.68 87.34 12 Japan ..................................................................................................................1.62 85.74 13 United States of America......................................................................1.55 84.22 14 Australia ...........................................................................................................1.54 83.76 15 Austria ...............................................................................................................1.46 81.97 16 Iceland ..............................................................................................................1.45 81.71 17 United Kingdom ........................................................................................ 1.41 80.82 18 United Arab Emirates ..............................................................................1.40 80.43 19 Israel ...................................................................................................................1.39 80.13 20 France ................................................................................................................1.35 79.32 21 Portugal ...........................................................................................................1.33 78.83 22 Ireland ...............................................................................................................1.29 77.84 23 Belgium .............................................................................................................1.18 75.19 24 Slovenia .............................................................................................................1.17 74.92 25 Brunei Darussalam .....................................................................................1.14 74.28 26 Estonia ...............................................................................................................1.12 73.60 27 Korea, Rep. ......................................................................................................1.08 72.78 28 Spain ..................................................................................................................1.03 71.61 29 Czech Republic ...........................................................................................1.02 71.34 30 Malta ..................................................................................................................1.00 70.89 31 Lithuania ..........................................................................................................0.98 70.25 32 Cyprus ...............................................................................................................0.92 68.85 33 Latvia .................................................................................................................0.90 68.47 34 Mauritius ..........................................................................................................0.90 68.35 35 Chile ....................................................................................................................0.85 67.18 36 Malaysia ........................................................................................................... 0.84 66.86 37 Slovakia ............................................................................................................0.81 66.11 38 Qatar ...................................................................................................................0.74 64.55 39 Poland ...............................................................................................................0.63 61.92 40 Croatia ...............................................................................................................0.58 60.52 41 Georgia .............................................................................................................0.57 60.37 42 Bhutan...............................................................................................................0.56 60.06 43 Hungary ...........................................................................................................0.51 58.99 44 Italy ......................................................................................................................0.50 58.72 45 Jamaica .............................................................................................................0.49 58.41 46 Botswana ........................................................................................................0.43 56.85 47 China ..................................................................................................................0.42 56.77 48 Uruguay ...........................................................................................................0.42 56.62 49 Thailand ...........................................................................................................0.38 55.86 50 Greece ...............................................................................................................0.31 54.14 51 South Africa ...................................................................................................0.28 53.29 52 Bulgaria.............................................................................................................0.26 52.87 53 Rwanda ............................................................................................................0.26 52.86 54 Trinidad and Tobago ...............................................................................0.26 52.84 55 Saudi Arabia ..................................................................................................0.25 52.54 56 Costa Rica .......................................................................................................0.25 52.54 57 Oman .................................................................................................................0.21 51.56 58 Namibia ............................................................................................................0.20 51.36 59 Serbia ................................................................................................................. 0.19 51.18 60 Bahrain .............................................................................................................. 0.19 51.05 61 Argentina ........................................................................................................ 0.16 50.42 62 Cabo Verde .................................................................................................... 0.16 50.33 63 Montenegro .................................................................................................. 0.15 50.28 64 North Macedonia ...................................................................................... 0.14 49.93 65 Jordan................................................................................................................ 0.12 49.36 66 India ....................................................................................................................0.09 48.76
Rank Country Value Score 67 Albania ..............................................................................................................0.08 48.37 68 Turkey ................................................................................................................0.07 48.25 69 Indonesia........................................................................................................ 0.04 47.53 70 Kazakhstan .....................................................................................................0.01 46.76 71 Panama .............................................................................................................0.01 46.74 72 Viet Nam ..........................................................................................................0.00 46.60 73 Mexico ...........................................................................................................–0.03 45.93 74 Philippines .................................................................................................. –0.06 45.02 75 Colombia ......................................................................................................–0.07 44.91 76 Tunisia.............................................................................................................–0.07 44.87 77 Russian Federation ............................................................................... –0.08 44.66 78 Armenia.........................................................................................................–0.10 44.20 79 Ghana ............................................................................................................. –0.11 43.83 80 Peru .................................................................................................................. –0.13 43.44 81 Sri Lanka ........................................................................................................ –0.15 42.88 82 Morocco ........................................................................................................–0.16 42.66 83 Azerbaijan ....................................................................................................–0.16 42.62 84 Kuwait ............................................................................................................ –0.17 42.50 85 Romania ........................................................................................................ –0.17 42.34 86 Iran, Islamic Rep. ...................................................................................... –0.19 41.91 87 Mongolia ......................................................................................................–0.26 40.19 88 Brazil ............................................................................................................... –0.29 39.56 89 Kenya ..............................................................................................................–0.31 38.98 90 Senegal ..........................................................................................................–0.32 38.79 91 Ecuador .........................................................................................................–0.32 38.77 92 Dominican Republic .............................................................................–0.35 37.98 93 Lao PDR ........................................................................................................ –0.36 37.84 94 El Salvador ...................................................................................................–0.37 37.68 95 Bolivia, Plurinational St. .......................................................................–0.39 37.07 96 Ukraine ......................................................................................................... –0.46 35.39 97 Bosnia and Herzegovina ................................................................... –0.48 34.85 98 Moldova, Rep. ...........................................................................................–0.51 34.15 99 Honduras .....................................................................................................–0.51 34.14 100 Eswatini .........................................................................................................–0.58 32.55 101 Uganda ..........................................................................................................–0.58 32.38 102 Pakistan .........................................................................................................–0.58 32.36 103 Burkina Faso ...............................................................................................–0.59 32.27 104 Algeria ........................................................................................................... –0.60 32.08 105 Egypt ...............................................................................................................–0.62 31.53 106 Zambia ...........................................................................................................–0.62 31.46 107 Tanzania, United Rep. ..........................................................................–0.63 31.28 108 Nicaragua .................................................................................................... –0.64 31.07 109 Guatemala .................................................................................................. –0.64 31.03 110 Gambia ..........................................................................................................–0.65 30.84 111 Cambodia ................................................................................................... –0.66 30.66 112 Malawi ............................................................................................................–0.67 30.31 113 Ethiopia .........................................................................................................–0.70 29.59 114 Kyrgyzstan ...................................................................................................–0.71 29.22 115 Bangladesh .................................................................................................–0.74 28.65 116 Côte d’Ivoire ...............................................................................................–0.74 28.57 117 Paraguay .......................................................................................................–0.81 26.85 118 Cameroon ....................................................................................................–0.82 26.67 119 Lesotho......................................................................................................... –0.85 25.93 120 Nepal .............................................................................................................. –0.88 25.17 121 Mozambique ............................................................................................ –0.89 24.90 122 Mali ...................................................................................................................–0.94 23.81 123 Nigeria ............................................................................................................–0.96 23.26 124 Angola............................................................................................................ –1.03 21.60 125 Tajikistan ........................................................................................................–1.12 19.38 126 Madagascar .................................................................................................–1.14 18.96 127 Zimbabwe ....................................................................................................–1.19 17.68 128 Burundi .......................................................................................................... –1.34 14.07 129 Liberia ............................................................................................................. –1.37 13.33 130 Venezuela, Bolivarian Rep. ................................................................ –1.40 12.63 131 Congo, Dem. Rep. .................................................................................. –1.63 6.93 132 Yemen .............................................................................................................–1.92 0.00
SOURCE: World Bank, Worldwide Governance Indicators, 2018 Update (www.govindicators.org)For some countries, the latest year for which data are available may differ from the year that appears at the top of the page. The cut-off year is 2008.
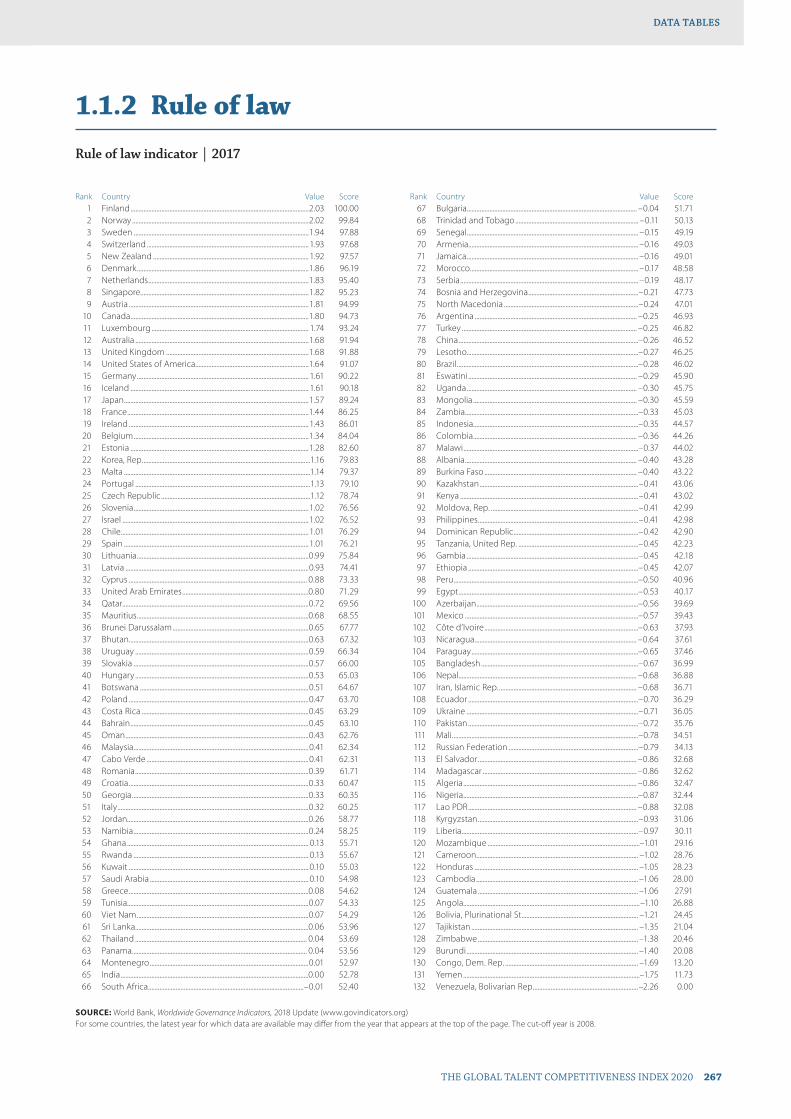
THE GLOBAL TALENT COMPETITIVENESS INDEX 2020 267
DATA TABLESDATA TABLES
1.1.2 Rule of law
Rule of law indicator | 2017
Rank Country Value Score 1 Finland ..............................................................................................................2.03 100.00 2 Norway .............................................................................................................2.02 99.84 3 Sweden ............................................................................................................1.94 97.88 4 Switzerland .................................................................................................... 1.93 97.68 5 New Zealand ................................................................................................1.92 97.57 6 Denmark ..........................................................................................................1.86 96.19 7 Netherlands ...................................................................................................1.83 95.40 8 Singapore........................................................................................................1.82 95.23 9 Austria ...............................................................................................................1.81 94.99 10 Canada ..............................................................................................................1.80 94.73 11 Luxembourg ................................................................................................. 1.74 93.24 12 Australia ...........................................................................................................1.68 91.94 13 United Kingdom ........................................................................................1.68 91.88 14 United States of America......................................................................1.64 91.07 15 Germany .......................................................................................................... 1.61 90.22 16 Iceland .............................................................................................................. 1.61 90.18 17 Japan ..................................................................................................................1.57 89.24 18 France ................................................................................................................1.44 86.25 19 Ireland ...............................................................................................................1.43 86.01 20 Belgium ............................................................................................................1.34 84.04 21 Estonia ..............................................................................................................1.28 82.60 22 Korea, Rep. .......................................................................................................1.16 79.83 23 Malta ...................................................................................................................1.14 79.37 24 Portugal ............................................................................................................1.13 79.10 25 Czech Republic ............................................................................................1.12 78.74 26 Slovenia ............................................................................................................1.02 76.56 27 Israel ...................................................................................................................1.02 76.52 28 Chile ....................................................................................................................1.01 76.29 29 Spain ..................................................................................................................1.01 76.21 30 Lithuania ..........................................................................................................0.99 75.84 31 Latvia .................................................................................................................0.93 74.41 32 Cyprus .............................................................................................................. 0.88 73.33 33 United Arab Emirates ..............................................................................0.80 71.29 34 Qatar ...................................................................................................................0.72 69.56 35 Mauritius ..........................................................................................................0.68 68.55 36 Brunei Darussalam ....................................................................................0.65 67.77 37 Bhutan...............................................................................................................0.63 67.32 38 Uruguay ...........................................................................................................0.59 66.34 39 Slovakia ............................................................................................................0.57 66.00 40 Hungary ...........................................................................................................0.53 65.03 41 Botswana ........................................................................................................0.51 64.67 42 Poland ...............................................................................................................0.47 63.70 43 Costa Rica .......................................................................................................0.45 63.29 44 Bahrain ..............................................................................................................0.45 63.10 45 Oman .................................................................................................................0.43 62.76 46 Malaysia ............................................................................................................0.41 62.34 47 Cabo Verde ....................................................................................................0.41 62.31 48 Romania ...........................................................................................................0.39 61.71 49 Croatia ...............................................................................................................0.33 60.47 50 Georgia .............................................................................................................0.33 60.35 51 Italy ......................................................................................................................0.32 60.25 52 Jordan................................................................................................................0.26 58.77 53 Namibia ............................................................................................................0.24 58.25 54 Ghana ................................................................................................................ 0.13 55.71 55 Rwanda ............................................................................................................ 0.13 55.67 56 Kuwait ............................................................................................................... 0.10 55.03 57 Saudi Arabia .................................................................................................. 0.10 54.98 58 Greece ...............................................................................................................0.08 54.62 59 Tunisia................................................................................................................0.07 54.33 60 Viet Nam ..........................................................................................................0.07 54.29 61 Sri Lanka ...........................................................................................................0.06 53.96 62 Thailand .......................................................................................................... 0.04 53.69 63 Panama ............................................................................................................ 0.04 53.56 64 Montenegro ..................................................................................................0.01 52.97 65 India ....................................................................................................................0.00 52.78 66 South Africa ................................................................................................–0.01 52.40
Rank Country Value Score 67 Bulgaria......................................................................................................... –0.04 51.71 68 Trinidad and Tobago ............................................................................ –0.11 50.13 69 Senegal .......................................................................................................... –0.15 49.19 70 Armenia.........................................................................................................–0.16 49.03 71 Jamaica ..........................................................................................................–0.16 49.01 72 Morocco ........................................................................................................ –0.17 48.58 73 Serbia .............................................................................................................. –0.19 48.17 74 Bosnia and Herzegovina ....................................................................–0.21 47.73 75 North Macedonia ...................................................................................–0.24 47.01 76 Argentina .................................................................................................... –0.25 46.93 77 Turkey ............................................................................................................ –0.25 46.82 78 China ...............................................................................................................–0.26 46.52 79 Lesotho..........................................................................................................–0.27 46.25 80 Brazil ................................................................................................................–0.28 46.02 81 Eswatini ........................................................................................................ –0.29 45.90 82 Uganda ......................................................................................................... –0.30 45.75 83 Mongolia ..................................................................................................... –0.30 45.59 84 Zambia ...........................................................................................................–0.33 45.03 85 Indonesia......................................................................................................–0.35 44.57 86 Colombia ..................................................................................................... –0.36 44.26 87 Malawi ............................................................................................................–0.37 44.02 88 Albania .......................................................................................................... –0.40 43.28 89 Burkina Faso .............................................................................................. –0.40 43.22 90 Kazakhstan ..................................................................................................–0.41 43.06 91 Kenya ..............................................................................................................–0.41 43.02 92 Moldova, Rep. ...........................................................................................–0.41 42.99 93 Philippines ...................................................................................................–0.41 42.98 94 Dominican Republic .............................................................................–0.42 42.90 95 Tanzania, United Rep. ..........................................................................–0.45 42.23 96 Gambia ..........................................................................................................–0.45 42.18 97 Ethiopia .........................................................................................................–0.45 42.07 98 Peru ..................................................................................................................–0.50 40.96 99 Egypt ...............................................................................................................–0.53 40.17 100 Azerbaijan ....................................................................................................–0.56 39.69 101 Mexico ...........................................................................................................–0.57 39.43 102 Côte d’Ivoire ...............................................................................................–0.63 37.93 103 Nicaragua .................................................................................................... –0.64 37.61 104 Paraguay .......................................................................................................–0.65 37.46 105 Bangladesh .................................................................................................–0.67 36.99 106 Nepal .............................................................................................................. –0.68 36.88 107 Iran, Islamic Rep. ..................................................................................... –0.68 36.71 108 Ecuador .........................................................................................................–0.70 36.29 109 Ukraine ..........................................................................................................–0.71 36.05 110 Pakistan .........................................................................................................–0.72 35.76 111 Mali ...................................................................................................................–0.78 34.51 112 Russian Federation ................................................................................–0.79 34.13 113 El Salvador .................................................................................................. –0.86 32.68 114 Madagascar ............................................................................................... –0.86 32.62 115 Algeria ........................................................................................................... –0.86 32.47 116 Nigeria ............................................................................................................–0.87 32.44 117 Lao PDR ........................................................................................................ –0.88 32.08 118 Kyrgyzstan ...................................................................................................–0.93 31.06 119 Liberia .............................................................................................................–0.97 30.11 120 Mozambique ..............................................................................................–1.01 29.16 121 Cameroon .................................................................................................... –1.02 28.76 122 Honduras ..................................................................................................... –1.05 28.23 123 Cambodia .................................................................................................... –1.06 28.00 124 Guatemala ................................................................................................... –1.06 27.91 125 Angola.............................................................................................................–1.10 26.88 126 Bolivia, Plurinational St. ....................................................................... –1.21 24.45 127 Tajikistan ....................................................................................................... –1.35 21.04 128 Zimbabwe ................................................................................................... –1.38 20.46 129 Burundi .......................................................................................................... –1.40 20.08 130 Congo, Dem. Rep. .................................................................................. –1.69 13.20 131 Yemen .............................................................................................................–1.75 11.73 132 Venezuela, Bolivarian Rep. ................................................................–2.26 0.00
SOURCE: World Bank, Worldwide Governance Indicators, 2018 Update (www.govindicators.org)For some countries, the latest year for which data are available may differ from the year that appears at the top of the page. The cut-off year is 2008.
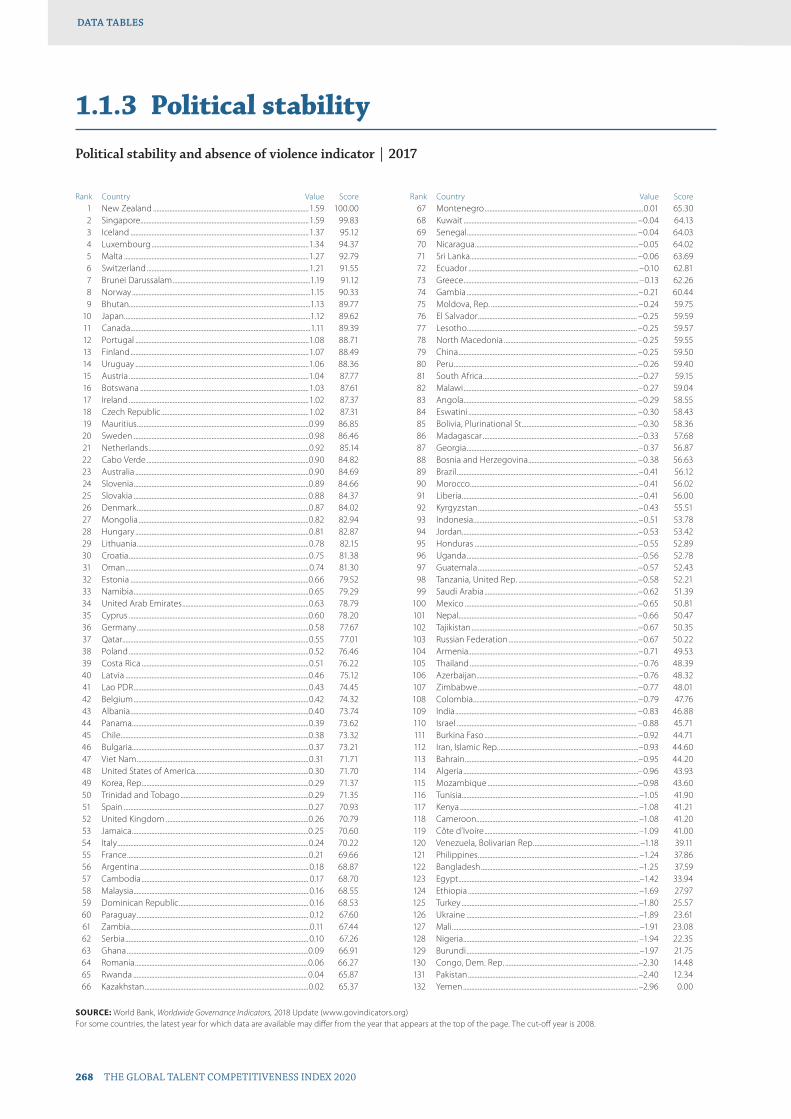
268 THE GLOBAL TALENT COMPETITIVENESS INDEX 2020
DATA TABLESDATA TABLES
1.1.3 Political stability
Political stability and absence of violence indicator | 2017
Rank Country Value Score 1 New Zealand ................................................................................................1.59 100.00 2 Singapore........................................................................................................1.59 99.83 3 Iceland ..............................................................................................................1.37 95.12 4 Luxembourg .................................................................................................1.34 94.37 5 Malta ..................................................................................................................1.27 92.79 6 Switzerland ....................................................................................................1.21 91.55 7 Brunei Darussalam .....................................................................................1.19 91.12 8 Norway ..............................................................................................................1.15 90.33 9 Bhutan................................................................................................................1.13 89.77 10 Japan ...................................................................................................................1.12 89.62 11 Canada ...............................................................................................................1.11 89.39 12 Portugal ...........................................................................................................1.08 88.71 13 Finland ..............................................................................................................1.07 88.49 14 Uruguay ...........................................................................................................1.06 88.36 15 Austria ...............................................................................................................1.04 87.77 16 Botswana ........................................................................................................1.03 87.61 17 Ireland ...............................................................................................................1.02 87.37 18 Czech Republic ...........................................................................................1.02 87.31 19 Mauritius ..........................................................................................................0.99 86.85 20 Sweden ............................................................................................................0.98 86.46 21 Netherlands ...................................................................................................0.92 85.14 22 Cabo Verde ....................................................................................................0.90 84.82 23 Australia ...........................................................................................................0.90 84.69 24 Slovenia ............................................................................................................0.89 84.66 25 Slovakia ........................................................................................................... 0.88 84.37 26 Denmark ..........................................................................................................0.87 84.02 27 Mongolia .........................................................................................................0.82 82.94 28 Hungary ...........................................................................................................0.81 82.87 29 Lithuania ..........................................................................................................0.78 82.15 30 Croatia ...............................................................................................................0.75 81.38 31 Oman .................................................................................................................0.74 81.30 32 Estonia ..............................................................................................................0.66 79.52 33 Namibia ............................................................................................................0.65 79.29 34 United Arab Emirates ..............................................................................0.63 78.79 35 Cyprus ...............................................................................................................0.60 78.20 36 Germany ..........................................................................................................0.58 77.67 37 Qatar ...................................................................................................................0.55 77.01 38 Poland ...............................................................................................................0.52 76.46 39 Costa Rica .......................................................................................................0.51 76.22 40 Latvia .................................................................................................................0.46 75.12 41 Lao PDR ............................................................................................................0.43 74.45 42 Belgium ............................................................................................................0.42 74.32 43 Albania ..............................................................................................................0.40 73.74 44 Panama .............................................................................................................0.39 73.62 45 Chile ....................................................................................................................0.38 73.32 46 Bulgaria.............................................................................................................0.37 73.21 47 Viet Nam ..........................................................................................................0.31 71.71 48 United States of America......................................................................0.30 71.70 49 Korea, Rep. ......................................................................................................0.29 71.37 50 Trinidad and Tobago ...............................................................................0.29 71.35 51 Spain ..................................................................................................................0.27 70.93 52 United Kingdom ........................................................................................0.26 70.79 53 Jamaica .............................................................................................................0.25 70.60 54 Italy ......................................................................................................................0.24 70.22 55 France ................................................................................................................0.21 69.66 56 Argentina ........................................................................................................ 0.18 68.87 57 Cambodia ....................................................................................................... 0.17 68.70 58 Malaysia ............................................................................................................ 0.16 68.55 59 Dominican Republic ................................................................................ 0.16 68.53 60 Paraguay .......................................................................................................... 0.12 67.60 61 Zambia ...............................................................................................................0.11 67.44 62 Serbia ................................................................................................................. 0.10 67.26 63 Ghana ................................................................................................................0.09 66.91 64 Romania ...........................................................................................................0.06 66.27 65 Rwanda ........................................................................................................... 0.04 65.87 66 Kazakhstan .....................................................................................................0.02 65.37
Rank Country Value Score 67 Montenegro ..................................................................................................0.01 65.30 68 Kuwait ........................................................................................................... –0.04 64.13 69 Senegal ......................................................................................................... –0.04 64.03 70 Nicaragua .....................................................................................................–0.05 64.02 71 Sri Lanka ....................................................................................................... –0.06 63.69 72 Ecuador .........................................................................................................–0.10 62.81 73 Greece ............................................................................................................ –0.13 62.26 74 Gambia ..........................................................................................................–0.21 60.44 75 Moldova, Rep. ...........................................................................................–0.24 59.75 76 El Salvador .................................................................................................. –0.25 59.59 77 Lesotho......................................................................................................... –0.25 59.57 78 North Macedonia .................................................................................. –0.25 59.55 79 China .............................................................................................................. –0.25 59.50 80 Peru ..................................................................................................................–0.26 59.40 81 South Africa ................................................................................................–0.27 59.15 82 Malawi ............................................................................................................–0.27 59.04 83 Angola........................................................................................................... –0.29 58.55 84 Eswatini ........................................................................................................ –0.30 58.43 85 Bolivia, Plurinational St. ...................................................................... –0.30 58.36 86 Madagascar ................................................................................................–0.33 57.68 87 Georgia ..........................................................................................................–0.37 56.87 88 Bosnia and Herzegovina ................................................................... –0.38 56.63 89 Brazil ................................................................................................................–0.41 56.12 90 Morocco ........................................................................................................–0.41 56.02 91 Liberia .............................................................................................................–0.41 56.00 92 Kyrgyzstan ...................................................................................................–0.43 55.51 93 Indonesia......................................................................................................–0.51 53.78 94 Jordan.............................................................................................................–0.53 53.42 95 Honduras .....................................................................................................–0.55 52.89 96 Uganda ..........................................................................................................–0.56 52.78 97 Guatemala ...................................................................................................–0.57 52.43 98 Tanzania, United Rep. ..........................................................................–0.58 52.21 99 Saudi Arabia ...............................................................................................–0.62 51.39 100 Mexico ...........................................................................................................–0.65 50.81 101 Nepal .............................................................................................................. –0.66 50.47 102 Tajikistan .......................................................................................................–0.67 50.35 103 Russian Federation ................................................................................–0.67 50.22 104 Armenia.........................................................................................................–0.71 49.53 105 Thailand ........................................................................................................–0.76 48.39 106 Azerbaijan ....................................................................................................–0.76 48.32 107 Zimbabwe ...................................................................................................–0.77 48.01 108 Colombia ......................................................................................................–0.79 47.76 109 India ................................................................................................................ –0.83 46.88 110 Israel ............................................................................................................... –0.88 45.71 111 Burkina Faso ...............................................................................................–0.92 44.71 112 Iran, Islamic Rep. ......................................................................................–0.93 44.60 113 Bahrain ...........................................................................................................–0.95 44.20 114 Algeria ............................................................................................................–0.96 43.93 115 Mozambique .............................................................................................–0.98 43.60 116 Tunisia............................................................................................................. –1.05 41.90 117 Kenya .............................................................................................................. –1.08 41.21 118 Cameroon .................................................................................................... –1.08 41.20 119 Côte d’Ivoire ............................................................................................... –1.09 41.00 120 Venezuela, Bolivarian Rep. .................................................................–1.18 39.11 121 Philippines ................................................................................................... –1.24 37.86 122 Bangladesh ................................................................................................. –1.25 37.59 123 Egypt ................................................................................................................–1.42 33.94 124 Ethiopia ......................................................................................................... –1.69 27.97 125 Turkey ............................................................................................................. –1.80 25.57 126 Ukraine .......................................................................................................... –1.89 23.61 127 Mali ....................................................................................................................–1.91 23.08 128 Nigeria ............................................................................................................ –1.94 22.35 129 Burundi ...........................................................................................................–1.97 21.75 130 Congo, Dem. Rep. ..................................................................................–2.30 14.48 131 Pakistan .........................................................................................................–2.40 12.34 132 Yemen ............................................................................................................–2.96 0.00
SOURCE: World Bank, Worldwide Governance Indicators, 2018 Update (www.govindicators.org)For some countries, the latest year for which data are available may differ from the year that appears at the top of the page. The cut-off year is 2008.

THE GLOBAL TALENT COMPETITIVENESS INDEX 2020 269
DATA TABLESDATA TABLES
1.1.4 Regulatory quality
Regulatory quality indicator | 2017
Rank Country Value Score 1 Singapore........................................................................................................ 2.12 100.00 2 New Zealand ................................................................................................2.09 99.35 3 Netherlands ...................................................................................................2.05 98.34 4 Australia ........................................................................................................... 1.93 95.46 5 Canada ..............................................................................................................1.89 94.39 6 Switzerland ....................................................................................................1.88 94.32 7 Finland ..............................................................................................................1.82 92.76 8 Norway .............................................................................................................1.81 92.60 9 Sweden ............................................................................................................1.80 92.23 10 Germany ..........................................................................................................1.78 91.85 11 United Kingdom ........................................................................................1.71 90.17 12 Luxembourg .................................................................................................1.69 89.60 13 Estonia ..............................................................................................................1.64 88.39 14 United States of America......................................................................1.63 88.05 15 Denmark ..........................................................................................................1.62 87.88 16 Ireland ...............................................................................................................1.59 86.99 17 Austria ...............................................................................................................1.44 83.37 18 Iceland ..............................................................................................................1.43 83.24 19 Japan ..................................................................................................................1.37 81.81 20 Chile ....................................................................................................................1.34 80.86 21 Malta ..................................................................................................................1.28 79.56 22 Israel ...................................................................................................................1.27 79.30 23 Belgium ............................................................................................................1.24 78.63 24 Czech Republic ...........................................................................................1.23 78.34 25 France .................................................................................................................1.16 76.48 26 Lithuania ...........................................................................................................1.16 76.46 27 Latvia ..................................................................................................................1.15 76.42 28 Korea, Rep. .......................................................................................................1.11 75.21 29 Georgia .............................................................................................................1.05 73.94 30 Cyprus ...............................................................................................................1.03 73.37 31 United Arab Emirates ..............................................................................1.01 72.95 32 Mauritius ..........................................................................................................1.00 72.52 33 Spain ..................................................................................................................0.94 71.23 34 Portugal ...........................................................................................................0.91 70.39 35 Poland .............................................................................................................. 0.88 69.73 36 Slovakia ............................................................................................................0.82 68.31 37 Brunei Darussalam ....................................................................................0.72 65.65 38 Italy ......................................................................................................................0.70 65.37 39 Malaysia ............................................................................................................0.68 64.86 40 Uruguay ...........................................................................................................0.66 64.22 41 Hungary ...........................................................................................................0.65 64.04 42 Bulgaria.............................................................................................................0.63 63.45 43 Slovenia ............................................................................................................0.58 62.28 44 North Macedonia ......................................................................................0.50 60.48 45 Romania ...........................................................................................................0.49 60.07 46 Botswana ........................................................................................................0.46 59.49 47 Costa Rica .......................................................................................................0.45 59.08 48 Croatia ...............................................................................................................0.42 58.50 49 Oman .................................................................................................................0.42 58.42 50 Qatar ...................................................................................................................0.42 58.35 51 Peru .....................................................................................................................0.42 58.35 52 Bahrain ..............................................................................................................0.41 58.26 53 Panama .............................................................................................................0.39 57.59 54 Colombia .........................................................................................................0.34 56.45 55 Montenegro ..................................................................................................0.30 55.42 56 Armenia............................................................................................................0.28 54.97 57 Greece ...............................................................................................................0.24 53.93 58 South Africa ...................................................................................................0.23 53.81 59 Albania ..............................................................................................................0.22 53.56 60 Mexico ..............................................................................................................0.20 52.90 61 Kazakhstan ..................................................................................................... 0.17 52.27 62 Rwanda ............................................................................................................ 0.15 51.68 63 Jamaica ............................................................................................................. 0.14 51.65 64 Thailand ........................................................................................................... 0.14 51.54 65 Jordan................................................................................................................ 0.10 50.45 66 Turkey ............................................................................................................... 0.04 48.95
Rank Country Value Score 67 Trinidad and Tobago ...............................................................................0.03 48.70 68 Philippines ......................................................................................................0.02 48.55 69 Serbia .................................................................................................................0.01 48.31 70 Saudi Arabia ..................................................................................................0.00 48.07 71 Moldova, Rep. .......................................................................................... –0.04 47.15 72 Kuwait ........................................................................................................... –0.06 46.56 73 Dominican Republic ............................................................................ –0.08 46.15 74 Indonesia...................................................................................................... –0.11 45.48 75 Brazil ................................................................................................................ –0.11 45.28 76 Mongolia ...................................................................................................... –0.12 45.21 77 Sri Lanka ........................................................................................................ –0.13 44.86 78 Ghana .............................................................................................................–0.14 44.71 79 Senegal .......................................................................................................... –0.15 44.47 80 China ............................................................................................................... –0.15 44.46 81 Bosnia and Herzegovina .................................................................... –0.15 44.41 82 El Salvador ................................................................................................... –0.15 44.34 83 Namibia ......................................................................................................... –0.19 43.43 84 Cabo Verde ................................................................................................ –0.20 43.07 85 Uganda ......................................................................................................... –0.22 42.63 86 Morocco ....................................................................................................... –0.23 42.49 87 Paraguay ...................................................................................................... –0.23 42.41 88 Kenya ............................................................................................................. –0.23 42.38 89 Azerbaijan ................................................................................................... –0.25 42.06 90 India ................................................................................................................ –0.25 41.85 91 Guatemala ...................................................................................................–0.26 41.82 92 Argentina .................................................................................................... –0.29 40.94 93 Ukraine ..........................................................................................................–0.32 40.20 94 Lesotho..........................................................................................................–0.32 40.19 95 Bhutan............................................................................................................–0.33 39.93 96 Kyrgyzstan ...................................................................................................–0.35 39.49 97 Côte d’Ivoire .............................................................................................. –0.36 39.20 98 Viet Nam ...................................................................................................... –0.40 38.31 99 Tunisia.............................................................................................................–0.41 37.98 100 Honduras .................................................................................................... –0.44 37.38 101 Burkina Faso .............................................................................................. –0.44 37.20 102 Gambia ..........................................................................................................–0.45 37.09 103 Zambia ...........................................................................................................–0.47 36.65 104 Russian Federation ............................................................................... –0.48 36.42 105 Cambodia ....................................................................................................–0.50 35.74 106 Eswatini .........................................................................................................–0.56 34.31 107 Mali ...................................................................................................................–0.57 34.03 108 Tanzania, United Rep. ..........................................................................–0.58 33.87 109 Pakistan .........................................................................................................–0.59 33.52 110 Nicaragua .....................................................................................................–0.67 31.59 111 Madagascar ................................................................................................–0.69 31.05 112 Nepal ...............................................................................................................–0.72 30.51 113 Lao PDR .........................................................................................................–0.72 30.38 114 Mozambique .............................................................................................–0.73 30.18 115 Malawi ............................................................................................................–0.75 29.72 116 Bangladesh .................................................................................................–0.81 28.27 117 Cameroon ....................................................................................................–0.82 27.89 118 Burundi ......................................................................................................... –0.84 27.57 119 Egypt .............................................................................................................. –0.86 26.93 120 Nigeria ........................................................................................................... –0.89 26.35 121 Bolivia, Plurinational St. .......................................................................–0.90 26.03 122 Liberia .............................................................................................................–0.95 24.86 123 Ecuador .........................................................................................................–1.00 23.48 124 Ethiopia ..........................................................................................................–1.01 23.39 125 Angola............................................................................................................–1.04 22.46 126 Tajikistan ....................................................................................................... –1.06 22.06 127 Algeria ............................................................................................................ –1.20 18.72 128 Iran, Islamic Rep. ...................................................................................... –1.20 18.66 129 Yemen ............................................................................................................ –1.45 12.49 130 Congo, Dem. Rep. ...................................................................................–1.47 12.11 131 Zimbabwe ................................................................................................... –1.56 9.71 132 Venezuela, Bolivarian Rep. ................................................................ –1.96 0.00
SOURCE: World Bank, Worldwide Governance Indicators, 2018 Update (www.govindicators.org)For some countries, the latest year for which data are available may differ from the year that appears at the top of the page. The cut-off year is 2008.

270 THE GLOBAL TALENT COMPETITIVENESS INDEX 2020
DATA TABLESDATA TABLES
1.1.5 Corruption
Corruption Perceptions Index | 2018
Rank Country Value Score 1 Denmark .......................................................................................................88.00 100.00 2 New Zealand ............................................................................................. 87.00 98.65 3 Finland ...........................................................................................................85.00 95.95 3 Singapore.....................................................................................................85.00 95.95 3 Sweden .........................................................................................................85.00 95.95 3 Switzerland .................................................................................................85.00 95.95 7 Norway ..........................................................................................................84.00 94.59 8 Netherlands ................................................................................................82.00 91.89 9 Canada ...........................................................................................................81.00 90.54 9 Luxembourg ..............................................................................................81.00 90.54 11 Germany .......................................................................................................80.00 89.19 11 United Kingdom .....................................................................................80.00 89.19 13 Australia ........................................................................................................ 77.00 85.14 14 Austria ............................................................................................................76.00 83.78 14 Iceland ...........................................................................................................76.00 83.78 16 Belgium .........................................................................................................75.00 82.43 17 Estonia ...........................................................................................................73.00 79.73 17 Ireland ............................................................................................................73.00 79.73 17 Japan ...............................................................................................................73.00 79.73 20 France .............................................................................................................72.00 78.38 21 United States of America...................................................................71.00 77.03 22 United Arab Emirates ...........................................................................70.00 75.68 22 Uruguay ........................................................................................................70.00 75.68 24 Bhutan............................................................................................................68.00 72.97 25 Chile ................................................................................................................. 67.00 71.62 26 Portugal ........................................................................................................64.00 67.57 27 Brunei Darussalam .................................................................................63.00 66.22 28 Qatar ................................................................................................................62.00 64.86 29 Botswana ..................................................................................................... 61.00 63.51 29 Israel ................................................................................................................ 61.00 63.51 31 Poland ............................................................................................................60.00 62.16 31 Slovenia .........................................................................................................60.00 62.16 33 Cyprus ............................................................................................................59.00 60.81 33 Czech Republic ........................................................................................59.00 60.81 33 Lithuania .......................................................................................................59.00 60.81 36 Georgia ..........................................................................................................58.00 59.46 36 Latvia ..............................................................................................................58.00 59.46 36 Spain ...............................................................................................................58.00 59.46 39 Cabo Verde ................................................................................................. 57.00 58.11 39 Korea, Rep. ................................................................................................... 57.00 58.11 41 Costa Rica ....................................................................................................56.00 56.76 41 Rwanda .........................................................................................................56.00 56.76 43 Malta ...............................................................................................................54.00 54.05 44 Namibia .........................................................................................................53.00 52.70 45 Italy ...................................................................................................................52.00 51.35 45 Oman ..............................................................................................................52.00 51.35 47 Mauritius ....................................................................................................... 51.00 50.00 48 Slovakia .........................................................................................................50.00 48.65 49 Jordan.............................................................................................................49.00 47.30 49 Saudi Arabia ...............................................................................................49.00 47.30 51 Croatia ........................................................................................................... 48.00 45.95 52 Malaysia ......................................................................................................... 47.00 44.59 52 Romania ........................................................................................................ 47.00 44.59 54 Hungary ....................................................................................................... 46.00 43.24 55 Greece ............................................................................................................45.00 41.89 55 Montenegro ...............................................................................................45.00 41.89 55 Senegal ..........................................................................................................45.00 41.89 58 Jamaica ......................................................................................................... 44.00 40.54 59 Morocco ........................................................................................................43.00 39.19 59 South Africa ................................................................................................43.00 39.19 59 Tunisia.............................................................................................................43.00 39.19 62 Bulgaria..........................................................................................................42.00 37.84 63 Burkina Faso ............................................................................................... 41.00 36.49 63 Ghana ............................................................................................................. 41.00 36.49 63 India ................................................................................................................. 41.00 36.49 63 Kuwait ............................................................................................................ 41.00 36.49
Rank Country Value Score 63 Lesotho.......................................................................................................... 41.00 36.49 63 Trinidad and Tobago ............................................................................ 41.00 36.49 63 Turkey ............................................................................................................. 41.00 36.49 70 Argentina .....................................................................................................40.00 35.14 71 China ...............................................................................................................39.00 33.78 71 Serbia ..............................................................................................................39.00 33.78 73 Bosnia and Herzegovina ....................................................................38.00 32.43 73 Eswatini .........................................................................................................38.00 32.43 73 Indonesia......................................................................................................38.00 32.43 73 Sri Lanka ........................................................................................................38.00 32.43 77 Gambia .......................................................................................................... 37.00 31.08 77 Mongolia ...................................................................................................... 37.00 31.08 77 North Macedonia ................................................................................... 37.00 31.08 77 Panama .......................................................................................................... 37.00 31.08 81 Albania ...........................................................................................................36.00 29.73 81 Bahrain ...........................................................................................................36.00 29.73 81 Colombia ......................................................................................................36.00 29.73 81 Philippines ...................................................................................................36.00 29.73 81 Tanzania, United Rep. ..........................................................................36.00 29.73 81 Thailand ........................................................................................................36.00 29.73 87 Algeria ............................................................................................................35.00 28.38 87 Armenia.........................................................................................................35.00 28.38 87 Brazil ................................................................................................................35.00 28.38 87 Côte d’Ivoire ...............................................................................................35.00 28.38 87 Egypt ...............................................................................................................35.00 28.38 87 El Salvador ...................................................................................................35.00 28.38 87 Peru ..................................................................................................................35.00 28.38 87 Zambia ...........................................................................................................35.00 28.38 95 Ecuador .........................................................................................................34.00 27.03 95 Ethiopia .........................................................................................................34.00 27.03 97 Moldova, Rep. ...........................................................................................33.00 25.68 97 Pakistan .........................................................................................................33.00 25.68 97 Viet Nam .......................................................................................................33.00 25.68 100 Liberia .............................................................................................................32.00 24.32 100 Malawi ............................................................................................................32.00 24.32 100 Mali ...................................................................................................................32.00 24.32 100 Ukraine ..........................................................................................................32.00 24.32 104 Kazakhstan .................................................................................................. 31.00 22.97 104 Nepal ............................................................................................................... 31.00 22.97 106 Dominican Republic .............................................................................30.00 21.62 107 Bolivia, Plurinational St. .......................................................................29.00 20.27 107 Honduras .....................................................................................................29.00 20.27 107 Kyrgyzstan ...................................................................................................29.00 20.27 107 Lao PDR .........................................................................................................29.00 20.27 107 Paraguay .......................................................................................................29.00 20.27 112 Iran, Islamic Rep. ......................................................................................28.00 18.92 112 Mexico ...........................................................................................................28.00 18.92 112 Russian Federation ................................................................................28.00 18.92 115 Guatemala ................................................................................................... 27.00 17.57 115 Kenya .............................................................................................................. 27.00 17.57 115 Nigeria ............................................................................................................ 27.00 17.57 118 Bangladesh .................................................................................................26.00 16.22 118 Uganda ..........................................................................................................26.00 16.22 120 Azerbaijan ....................................................................................................25.00 14.86 120 Cameroon ....................................................................................................25.00 14.86 120 Madagascar ................................................................................................25.00 14.86 120 Nicaragua .....................................................................................................25.00 14.86 120 Tajikistan .......................................................................................................25.00 14.86 125 Mozambique .............................................................................................23.00 12.16 126 Zimbabwe ...................................................................................................22.00 10.81 127 Cambodia ....................................................................................................20.00 8.11 127 Congo, Dem. Rep. ..................................................................................20.00 8.11 129 Angola............................................................................................................19.00 6.76 130 Venezuela, Bolivarian Rep. ................................................................18.00 5.41 131 Burundi ...........................................................................................................17.00 4.05 132 Yemen ............................................................................................................14.00 0.00
SOURCE: Transparency International, The Corruption Perceptions Index 2018 (http://www.transparency.org/research/cpi)For some countries, the latest year for which data are available may differ from the year that appears at the top of the page. The cut-off year is 2008.
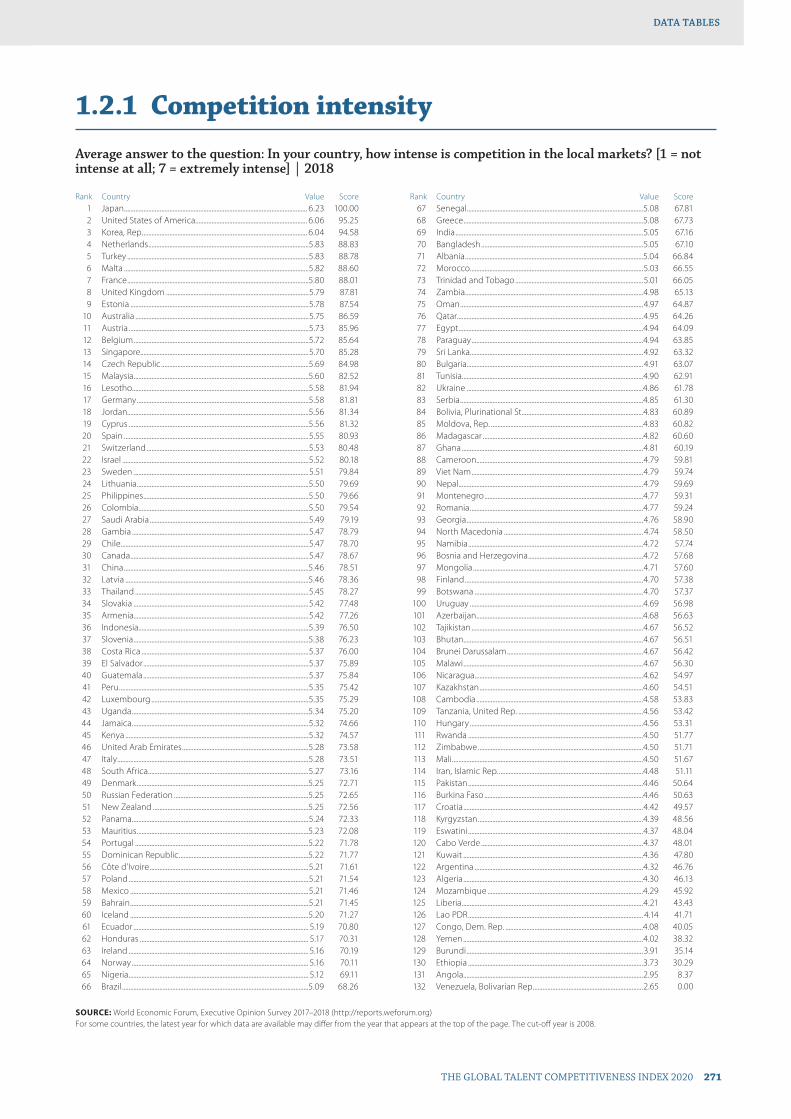
THE GLOBAL TALENT COMPETITIVENESS INDEX 2020 271
DATA TABLESDATA TABLES
1.2.1 Competition intensity
Average answer to the question: In your country, how intense is competition in the local markets? [1 = not intense at all; 7 = extremely intense] | 2018
Rank Country Value Score 1 Japan ................................................................................................................. 6.23 100.00 2 United States of America..................................................................... 6.06 95.25 3 Korea, Rep. ..................................................................................................... 6.04 94.58 4 Netherlands ...................................................................................................5.83 88.83 5 Turkey ................................................................................................................5.83 88.78 6 Malta ..................................................................................................................5.82 88.60 7 France ................................................................................................................5.80 88.01 8 United Kingdom ........................................................................................5.79 87.81 9 Estonia ..............................................................................................................5.78 87.54 10 Australia ...........................................................................................................5.75 86.59 11 Austria ...............................................................................................................5.73 85.96 12 Belgium ............................................................................................................5.72 85.64 13 Singapore........................................................................................................5.70 85.28 14 Czech Republic ...........................................................................................5.69 84.98 15 Malaysia ............................................................................................................5.60 82.52 16 Lesotho.............................................................................................................5.58 81.94 17 Germany ..........................................................................................................5.58 81.81 18 Jordan................................................................................................................5.56 81.34 19 Cyprus ...............................................................................................................5.56 81.32 20 Spain ..................................................................................................................5.55 80.93 21 Switzerland ....................................................................................................5.53 80.48 22 Israel ...................................................................................................................5.52 80.18 23 Sweden ............................................................................................................5.51 79.84 24 Lithuania ..........................................................................................................5.50 79.69 25 Philippines ......................................................................................................5.50 79.66 26 Colombia .........................................................................................................5.50 79.54 27 Saudi Arabia ..................................................................................................5.49 79.19 28 Gambia .............................................................................................................5.47 78.79 29 Chile ....................................................................................................................5.47 78.70 30 Canada ..............................................................................................................5.47 78.67 31 China ..................................................................................................................5.46 78.51 32 Latvia .................................................................................................................5.46 78.36 33 Thailand ...........................................................................................................5.45 78.27 34 Slovakia ............................................................................................................5.42 77.48 35 Armenia............................................................................................................5.42 77.26 36 Indonesia.........................................................................................................5.39 76.50 37 Slovenia ............................................................................................................5.38 76.23 38 Costa Rica .......................................................................................................5.37 76.00 39 El Salvador ......................................................................................................5.37 75.89 40 Guatemala ......................................................................................................5.37 75.84 41 Peru .....................................................................................................................5.35 75.42 42 Luxembourg .................................................................................................5.35 75.29 43 Uganda .............................................................................................................5.34 75.20 44 Jamaica .............................................................................................................5.32 74.66 45 Kenya .................................................................................................................5.32 74.57 46 United Arab Emirates ..............................................................................5.28 73.58 47 Italy ......................................................................................................................5.28 73.51 48 South Africa ...................................................................................................5.27 73.16 49 Denmark ..........................................................................................................5.25 72.71 50 Russian Federation ...................................................................................5.25 72.65 51 New Zealand ................................................................................................5.25 72.56 52 Panama .............................................................................................................5.24 72.33 53 Mauritius ..........................................................................................................5.23 72.08 54 Portugal ...........................................................................................................5.22 71.78 55 Dominican Republic ................................................................................5.22 71.77 56 Côte d’Ivoire ..................................................................................................5.21 71.61 57 Poland ...............................................................................................................5.21 71.54 58 Mexico ..............................................................................................................5.21 71.46 59 Bahrain ..............................................................................................................5.21 71.45 60 Iceland ..............................................................................................................5.20 71.27 61 Ecuador ............................................................................................................ 5.19 70.80 62 Honduras ........................................................................................................ 5.17 70.31 63 Ireland ............................................................................................................... 5.16 70.19 64 Norway ............................................................................................................. 5.16 70.11 65 Nigeria ............................................................................................................... 5.12 69.11 66 Brazil ...................................................................................................................5.09 68.26
Rank Country Value Score 67 Senegal .............................................................................................................5.08 67.81 68 Greece ...............................................................................................................5.08 67.73 69 India ....................................................................................................................5.05 67.16 70 Bangladesh ....................................................................................................5.05 67.10 71 Albania ..............................................................................................................5.04 66.84 72 Morocco ...........................................................................................................5.03 66.55 73 Trinidad and Tobago ...............................................................................5.01 66.05 74 Zambia ..............................................................................................................4.98 65.13 75 Oman .................................................................................................................4.97 64.87 76 Qatar ...................................................................................................................4.95 64.26 77 Egypt ..................................................................................................................4.94 64.09 78 Paraguay ..........................................................................................................4.94 63.85 79 Sri Lanka ...........................................................................................................4.92 63.32 80 Bulgaria.............................................................................................................4.91 63.07 81 Tunisia................................................................................................................4.90 62.91 82 Ukraine .............................................................................................................4.86 61.78 83 Serbia .................................................................................................................4.85 61.30 84 Bolivia, Plurinational St. ..........................................................................4.83 60.89 85 Moldova, Rep. ..............................................................................................4.83 60.82 86 Madagascar ...................................................................................................4.82 60.60 87 Ghana ................................................................................................................4.81 60.19 88 Cameroon .......................................................................................................4.79 59.81 89 Viet Nam ..........................................................................................................4.79 59.74 90 Nepal ..................................................................................................................4.79 59.69 91 Montenegro ..................................................................................................4.77 59.31 92 Romania ...........................................................................................................4.77 59.24 93 Georgia .............................................................................................................4.76 58.90 94 North Macedonia ......................................................................................4.74 58.50 95 Namibia ............................................................................................................4.72 57.74 96 Bosnia and Herzegovina .......................................................................4.72 57.68 97 Mongolia .........................................................................................................4.71 57.60 98 Finland ..............................................................................................................4.70 57.38 99 Botswana ........................................................................................................4.70 57.37 100 Uruguay ...........................................................................................................4.69 56.98 101 Azerbaijan .......................................................................................................4.68 56.63 102 Tajikistan ..........................................................................................................4.67 56.52 103 Bhutan...............................................................................................................4.67 56.51 104 Brunei Darussalam ....................................................................................4.67 56.42 105 Malawi ...............................................................................................................4.67 56.30 106 Nicaragua ........................................................................................................4.62 54.97 107 Kazakhstan .....................................................................................................4.60 54.51 108 Cambodia .......................................................................................................4.58 53.83 109 Tanzania, United Rep. .............................................................................4.56 53.42 110 Hungary ...........................................................................................................4.56 53.31 111 Rwanda ............................................................................................................4.50 51.77 112 Zimbabwe ......................................................................................................4.50 51.71 113 Mali ......................................................................................................................4.50 51.67 114 Iran, Islamic Rep. .........................................................................................4.48 51.11 115 Pakistan ............................................................................................................4.46 50.64 116 Burkina Faso ..................................................................................................4.46 50.63 117 Croatia ...............................................................................................................4.42 49.57 118 Kyrgyzstan ......................................................................................................4.39 48.56 119 Eswatini ............................................................................................................4.37 48.04 120 Cabo Verde ....................................................................................................4.37 48.01 121 Kuwait ...............................................................................................................4.36 47.80 122 Argentina ........................................................................................................4.32 46.76 123 Algeria ...............................................................................................................4.30 46.13 124 Mozambique ................................................................................................4.29 45.92 125 Liberia ................................................................................................................4.21 43.43 126 Lao PDR ............................................................................................................ 4.14 41.71 127 Congo, Dem. Rep. .....................................................................................4.08 40.05 128 Yemen ...............................................................................................................4.02 38.32 129 Burundi .............................................................................................................3.91 35.14 130 Ethiopia ............................................................................................................3.73 30.29 131 Angola...............................................................................................................2.95 8.37 132 Venezuela, Bolivarian Rep. ...................................................................2.65 0.00
SOURCE: World Economic Forum, Executive Opinion Survey 2017–2018 (http://reports.weforum.org)For some countries, the latest year for which data are available may differ from the year that appears at the top of the page. The cut-off year is 2008.
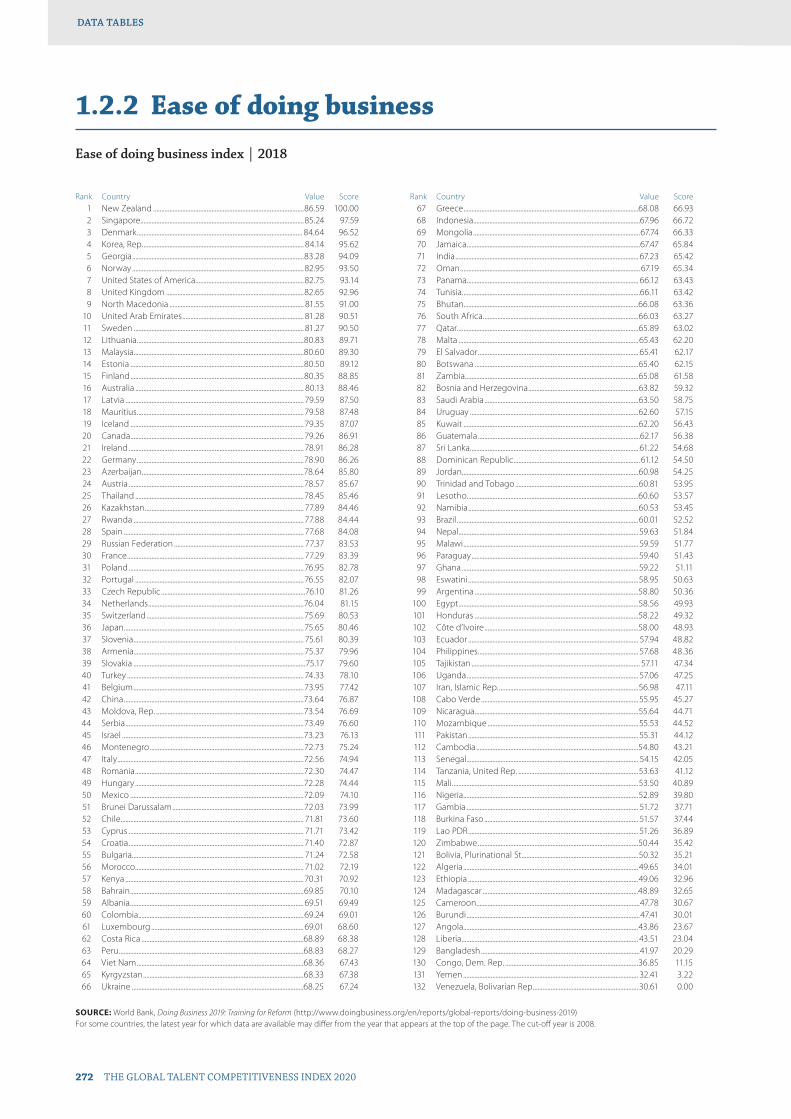
272 THE GLOBAL TALENT COMPETITIVENESS INDEX 2020
DATA TABLESDATA TABLES
1.2.2 Ease of doing business
Ease of doing business index | 2018
Rank Country Value Score 1 New Zealand .............................................................................................86.59 100.00 2 Singapore.....................................................................................................85.24 97.59 3 Denmark ...................................................................................................... 84.64 96.52 4 Korea, Rep. ................................................................................................... 84.14 95.62 5 Georgia ..........................................................................................................83.28 94.09 6 Norway ..........................................................................................................82.95 93.50 7 United States of America...................................................................82.75 93.14 8 United Kingdom .....................................................................................82.65 92.96 9 North Macedonia ................................................................................... 81.55 91.00 10 United Arab Emirates ........................................................................... 81.28 90.51 11 Sweden ......................................................................................................... 81.27 90.50 12 Lithuania .......................................................................................................80.83 89.71 13 Malaysia .........................................................................................................80.60 89.30 14 Estonia ...........................................................................................................80.50 89.12 15 Finland ...........................................................................................................80.35 88.85 16 Australia ........................................................................................................ 80.13 88.46 17 Latvia .............................................................................................................. 79.59 87.50 18 Mauritius .......................................................................................................79.58 87.48 19 Iceland ...........................................................................................................79.35 87.07 20 Canada ...........................................................................................................79.26 86.91 21 Ireland ............................................................................................................ 78.91 86.28 22 Germany .......................................................................................................78.90 86.26 23 Azerbaijan ....................................................................................................78.64 85.80 24 Austria ............................................................................................................78.57 85.67 25 Thailand ........................................................................................................78.45 85.46 26 Kazakhstan .................................................................................................. 77.89 84.46 27 Rwanda ......................................................................................................... 77.88 84.44 28 Spain ............................................................................................................... 77.68 84.08 29 Russian Federation ................................................................................ 77.37 83.53 30 France ............................................................................................................. 77.29 83.39 31 Poland ............................................................................................................76.95 82.78 32 Portugal ........................................................................................................76.55 82.07 33 Czech Republic .........................................................................................76.10 81.26 34 Netherlands ................................................................................................76.04 81.15 35 Switzerland .................................................................................................75.69 80.53 36 Japan ...............................................................................................................75.65 80.46 37 Slovenia ......................................................................................................... 75.61 80.39 38 Armenia......................................................................................................... 75.37 79.96 39 Slovakia ..........................................................................................................75.17 79.60 40 Turkey ............................................................................................................. 74.33 78.10 41 Belgium .........................................................................................................73.95 77.42 42 China ...............................................................................................................73.64 76.87 43 Moldova, Rep. ...........................................................................................73.54 76.69 44 Serbia ..............................................................................................................73.49 76.60 45 Israel ................................................................................................................73.23 76.13 46 Montenegro ...............................................................................................72.73 75.24 47 Italy ...................................................................................................................72.56 74.94 48 Romania ........................................................................................................72.30 74.47 49 Hungary ........................................................................................................72.28 74.44 50 Mexico ...........................................................................................................72.09 74.10 51 Brunei Darussalam .................................................................................72.03 73.99 52 Chile ................................................................................................................. 71.81 73.60 53 Cyprus ............................................................................................................ 71.71 73.42 54 Croatia ............................................................................................................ 71.40 72.87 55 Bulgaria.......................................................................................................... 71.24 72.58 56 Morocco ........................................................................................................ 71.02 72.19 57 Kenya .............................................................................................................. 70.31 70.92 58 Bahrain ...........................................................................................................69.85 70.10 59 Albania ........................................................................................................... 69.51 69.49 60 Colombia ......................................................................................................69.24 69.01 61 Luxembourg .............................................................................................. 69.01 68.60 62 Costa Rica ....................................................................................................68.89 68.38 63 Peru ..................................................................................................................68.83 68.27 64 Viet Nam .......................................................................................................68.36 67.43 65 Kyrgyzstan ...................................................................................................68.33 67.38 66 Ukraine ..........................................................................................................68.25 67.24
Rank Country Value Score 67 Greece ............................................................................................................68.08 66.93 68 Indonesia.......................................................................................................67.96 66.72 69 Mongolia .......................................................................................................67.74 66.33 70 Jamaica ...........................................................................................................67.47 65.84 71 India ................................................................................................................. 67.23 65.42 72 Oman ............................................................................................................... 67.19 65.34 73 Panama .......................................................................................................... 66.12 63.43 74 Tunisia..............................................................................................................66.11 63.42 75 Bhutan............................................................................................................66.08 63.36 76 South Africa ................................................................................................66.03 63.27 77 Qatar ................................................................................................................65.89 63.02 78 Malta ...............................................................................................................65.43 62.20 79 El Salvador ................................................................................................... 65.41 62.17 80 Botswana .....................................................................................................65.40 62.15 81 Zambia ...........................................................................................................65.08 61.58 82 Bosnia and Herzegovina ....................................................................63.82 59.32 83 Saudi Arabia ...............................................................................................63.50 58.75 84 Uruguay ........................................................................................................62.60 57.15 85 Kuwait ............................................................................................................62.20 56.43 86 Guatemala ....................................................................................................62.17 56.38 87 Sri Lanka ........................................................................................................ 61.22 54.68 88 Dominican Republic ..............................................................................61.12 54.50 89 Jordan.............................................................................................................60.98 54.25 90 Trinidad and Tobago ............................................................................60.81 53.95 91 Lesotho..........................................................................................................60.60 53.57 92 Namibia .........................................................................................................60.53 53.45 93 Brazil ................................................................................................................60.01 52.52 94 Nepal ............................................................................................................... 59.63 51.84 95 Malawi ............................................................................................................ 59.59 51.77 96 Paraguay .......................................................................................................59.40 51.43 97 Ghana .............................................................................................................59.22 51.11 98 Eswatini .........................................................................................................58.95 50.63 99 Argentina .....................................................................................................58.80 50.36 100 Egypt ...............................................................................................................58.56 49.93 101 Honduras .....................................................................................................58.22 49.32 102 Côte d’Ivoire ...............................................................................................58.00 48.93 103 Ecuador ......................................................................................................... 57.94 48.82 104 Philippines ................................................................................................... 57.68 48.36 105 Tajikistan ........................................................................................................ 57.11 47.34 106 Uganda .......................................................................................................... 57.06 47.25 107 Iran, Islamic Rep. ......................................................................................56.98 47.11 108 Cabo Verde ................................................................................................. 55.95 45.27 109 Nicaragua .....................................................................................................55.64 44.71 110 Mozambique .............................................................................................55.53 44.52 111 Pakistan ......................................................................................................... 55.31 44.12 112 Cambodia ....................................................................................................54.80 43.21 113 Senegal .......................................................................................................... 54.15 42.05 114 Tanzania, United Rep. ..........................................................................53.63 41.12 115 Mali ...................................................................................................................53.50 40.89 116 Nigeria ............................................................................................................52.89 39.80 117 Gambia .......................................................................................................... 51.72 37.71 118 Burkina Faso ............................................................................................... 51.57 37.44 119 Lao PDR ......................................................................................................... 51.26 36.89 120 Zimbabwe ...................................................................................................50.44 35.42 121 Bolivia, Plurinational St. .......................................................................50.32 35.21 122 Algeria ............................................................................................................49.65 34.01 123 Ethiopia .........................................................................................................49.06 32.96 124 Madagascar ................................................................................................48.89 32.65 125 Cameroon .....................................................................................................47.78 30.67 126 Burundi ...........................................................................................................47.41 30.01 127 Angola............................................................................................................43.86 23.67 128 Liberia ............................................................................................................. 43.51 23.04 129 Bangladesh ..................................................................................................41.97 20.29 130 Congo, Dem. Rep. ..................................................................................36.85 11.15 131 Yemen ............................................................................................................ 32.41 3.22 132 Venezuela, Bolivarian Rep. ................................................................30.61 0.00
SOURCE: World Bank, Doing Business 2019: Training for Reform (http://www.doingbusiness.org/en/reports/global-reports/doing-business-2019)For some countries, the latest year for which data are available may differ from the year that appears at the top of the page. The cut-off year is 2008.

THE GLOBAL TALENT COMPETITIVENESS INDEX 2020 273
DATA TABLESDATA TABLES
1.2.3 Cluster development
Average answer to the question: In your country, how widespread are well-developed and deep clusters (geographic concentrations of firms, suppliers, producers of related products and services, and specialized institutions in a particular field)? [1 = nonexistent; 7 = widespread in many fields] | 2018
Rank Country Value Score 1 United States of America......................................................................5.77 100.00 2 Germany ..........................................................................................................5.52 92.94 3 Switzerland ....................................................................................................5.49 91.86 4 Italy ......................................................................................................................5.47 91.45 5 Netherlands ...................................................................................................5.37 88.55 6 Japan ..................................................................................................................5.34 87.60 7 Malaysia ............................................................................................................5.26 85.51 8 United Kingdom ........................................................................................ 5.19 83.26 9 United Arab Emirates .............................................................................. 5.17 82.83 10 Singapore........................................................................................................ 5.12 81.27 11 Sweden ............................................................................................................5.06 79.58 12 Luxembourg .................................................................................................5.02 78.49 13 Austria ...............................................................................................................5.00 78.08 14 Qatar ...................................................................................................................4.94 76.29 15 Belgium ............................................................................................................4.90 74.96 16 Finland ..............................................................................................................4.89 74.89 17 Norway .............................................................................................................4.87 74.35 18 Denmark ......................................................................................................... 4.84 73.27 19 France ................................................................................................................4.79 71.94 20 Saudi Arabia ..................................................................................................4.72 70.04 21 Canada ..............................................................................................................4.72 69.87 22 Ireland ...............................................................................................................4.65 67.83 23 Oman .................................................................................................................4.63 67.29 24 India ....................................................................................................................4.63 67.25 25 Bahrain ..............................................................................................................4.62 67.06 26 Indonesia.........................................................................................................4.60 66.44 27 China ..................................................................................................................4.58 65.86 28 Korea, Rep. ......................................................................................................4.57 65.73 29 Israel ...................................................................................................................4.51 63.87 30 Jordan................................................................................................................4.46 62.52 31 South Africa ...................................................................................................4.38 60.31 32 Azerbaijan .......................................................................................................4.34 59.07 33 Kenya .................................................................................................................4.32 58.54 34 New Zealand ................................................................................................4.31 58.23 35 Spain ..................................................................................................................4.27 56.96 36 Portugal ...........................................................................................................4.26 56.82 37 Egypt ..................................................................................................................4.23 56.04 38 Mexico ..............................................................................................................4.23 55.87 39 Australia ...........................................................................................................4.23 55.84 40 Malta ..................................................................................................................4.23 55.81 41 Ghana ................................................................................................................ 4.17 54.22 42 Iceland .............................................................................................................. 4.15 53.75 43 Cambodia ....................................................................................................... 4.13 53.03 44 Mauritius ..........................................................................................................4.07 51.43 45 Czech Republic ...........................................................................................4.03 50.22 46 Philippines ......................................................................................................4.00 49.25 47 Kuwait ...............................................................................................................4.00 49.17 48 Brazil ...................................................................................................................3.98 48.85 49 Costa Rica .......................................................................................................3.98 48.71 50 Pakistan ............................................................................................................3.95 48.01 51 Thailand ...........................................................................................................3.93 47.22 52 Tanzania, United Rep. .............................................................................3.92 47.10 53 Jamaica .............................................................................................................3.89 46.20 54 Lao PDR ............................................................................................................3.86 45.39 55 Slovenia ........................................................................................................... 3.84 44.72 56 Sri Lanka ...........................................................................................................3.82 44.26 57 Dominican Republic ................................................................................3.82 44.06 58 Bangladesh ....................................................................................................3.81 43.86 59 Bulgaria.............................................................................................................3.81 43.77 60 Hungary ...........................................................................................................3.81 43.77 61 Slovakia ............................................................................................................3.80 43.53 62 Poland ...............................................................................................................3.80 43.51 63 Panama .............................................................................................................3.79 43.42 64 Mali ......................................................................................................................3.79 43.38 65 Cyprus ...............................................................................................................3.78 42.95 66 Rwanda ............................................................................................................3.78 42.93
Rank Country Value Score 67 Honduras ........................................................................................................3.76 42.51 68 Armenia............................................................................................................3.76 42.40 69 Latvia .................................................................................................................3.76 42.37 70 Morocco ...........................................................................................................3.76 42.31 71 Estonia ..............................................................................................................3.73 41.67 72 Viet Nam ..........................................................................................................3.71 41.14 73 Colombia .........................................................................................................3.71 40.95 74 Gambia .............................................................................................................3.71 40.89 75 Turkey ................................................................................................................3.67 39.77 76 Bhutan...............................................................................................................3.65 39.38 77 Chile ................................................................................................................... 3.64 39.10 78 Iran, Islamic Rep. .........................................................................................3.63 38.75 79 Trinidad and Tobago ...............................................................................3.60 37.80 80 Uganda .............................................................................................................3.58 37.41 81 Serbia .................................................................................................................3.57 37.14 82 Guatemala ......................................................................................................3.57 37.08 83 Ethiopia ............................................................................................................3.56 36.68 84 Namibia ............................................................................................................3.53 35.99 85 Zambia ..............................................................................................................3.53 35.80 86 Montenegro ..................................................................................................3.51 35.22 87 Lesotho.............................................................................................................3.49 34.81 88 Brunei Darussalam ....................................................................................3.49 34.77 89 Nigeria ...............................................................................................................3.49 34.64 90 Russian Federation ...................................................................................3.49 34.60 91 Lithuania ..........................................................................................................3.48 34.42 92 Liberia ................................................................................................................3.46 33.78 93 Algeria ...............................................................................................................3.43 33.12 94 Senegal .............................................................................................................3.42 32.64 95 Tajikistan ..........................................................................................................3.41 32.50 96 Peru .....................................................................................................................3.37 31.33 97 Argentina ........................................................................................................3.35 30.64 98 Cabo Verde ....................................................................................................3.29 29.10 99 Nepal ..................................................................................................................3.28 28.70 100 Bosnia and Herzegovina .......................................................................3.24 27.61 101 Ukraine .............................................................................................................3.24 27.43 102 Eswatini ............................................................................................................3.24 27.41 103 Tunisia................................................................................................................3.22 26.96 104 Uruguay ...........................................................................................................3.22 26.93 105 North Macedonia ......................................................................................3.21 26.76 106 Mozambique ................................................................................................ 3.19 26.14 107 Ecuador ............................................................................................................ 3.19 26.13 108 Cameroon ....................................................................................................... 3.12 24.05 109 Malawi ................................................................................................................3.11 23.87 110 Burundi ..............................................................................................................3.11 23.72 111 Georgia .............................................................................................................3.09 23.20 112 Botswana ........................................................................................................3.07 22.74 113 Romania ...........................................................................................................3.07 22.64 114 Kazakhstan .....................................................................................................3.07 22.54 115 Paraguay ..........................................................................................................3.06 22.42 116 Albania ..............................................................................................................3.06 22.40 117 Madagascar ...................................................................................................3.03 21.66 118 Nicaragua ........................................................................................................3.02 21.31 119 Burkina Faso ..................................................................................................3.00 20.67 120 Côte d’Ivoire ..................................................................................................2.95 19.16 121 Greece ...............................................................................................................2.94 18.88 122 Bolivia, Plurinational St. ..........................................................................2.87 16.82 123 Croatia ...............................................................................................................2.83 15.66 124 Mongolia .........................................................................................................2.81 15.36 125 Congo, Dem. Rep. .....................................................................................2.81 15.24 126 Yemen ...............................................................................................................2.79 14.71 127 El Salvador ......................................................................................................2.78 14.37 128 Kyrgyzstan ......................................................................................................2.74 13.36 129 Moldova, Rep. ..............................................................................................2.69 11.91 130 Zimbabwe ......................................................................................................2.60 9.08 131 Venezuela, Bolivarian Rep. .................................................................. 2.44 4.54 132 Angola...............................................................................................................2.28 0.00
SOURCE: World Economic Forum, Executive Opinion Survey 2017–2018 (http://reports.weforum.org)For some countries, the latest year for which data are available may differ from the year that appears at the top of the page. The cut-off year is 2008.
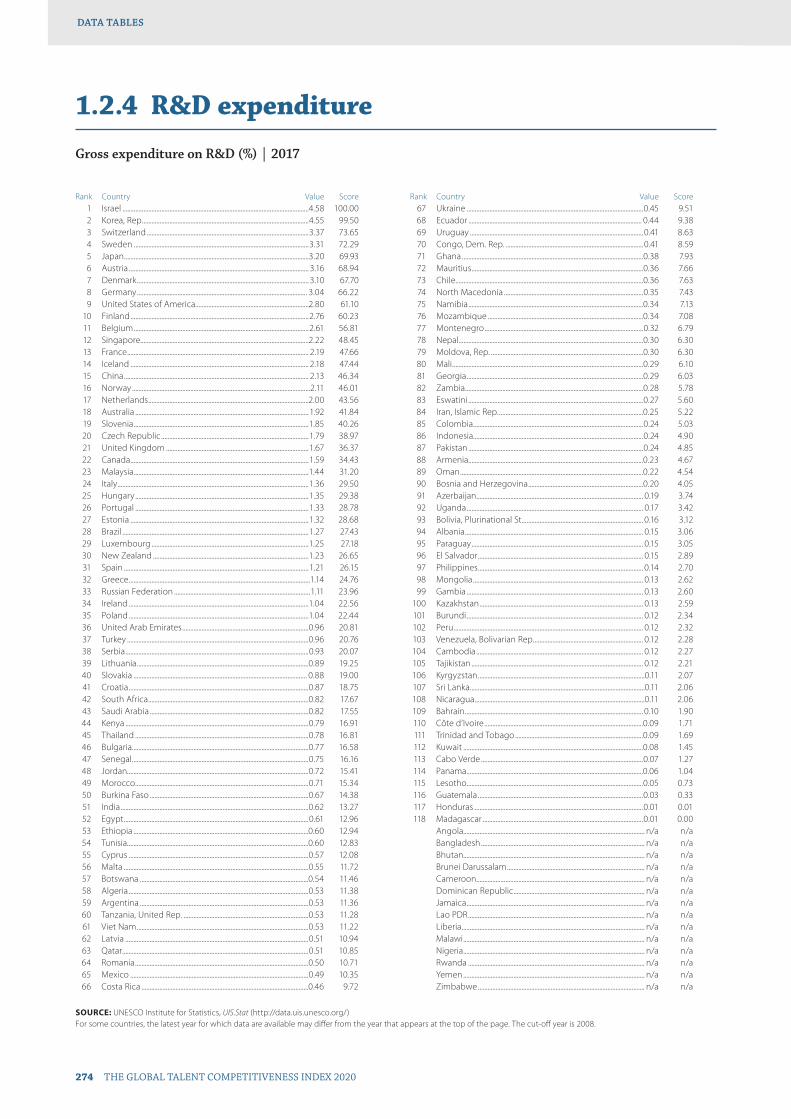
274 THE GLOBAL TALENT COMPETITIVENESS INDEX 2020
DATA TABLESDATA TABLES
1.2.4 R&D expenditure
Gross expenditure on R&D (%) | 2017
Rank Country Value Score 1 Israel ...................................................................................................................4.58 100.00 2 Korea, Rep. ......................................................................................................4.55 99.50 3 Switzerland ....................................................................................................3.37 73.65 4 Sweden ............................................................................................................3.31 72.29 5 Japan ..................................................................................................................3.20 69.93 6 Austria ............................................................................................................... 3.16 68.94 7 Denmark .......................................................................................................... 3.10 67.70 8 Germany ......................................................................................................... 3.04 66.22 9 United States of America......................................................................2.80 61.10 10 Finland ..............................................................................................................2.76 60.23 11 Belgium ............................................................................................................2.61 56.81 12 Singapore........................................................................................................2.22 48.45 13 France ................................................................................................................ 2.19 47.66 14 Iceland .............................................................................................................. 2.18 47.44 15 China .................................................................................................................. 2.13 46.34 16 Norway ..............................................................................................................2.11 46.01 17 Netherlands ...................................................................................................2.00 43.56 18 Australia ...........................................................................................................1.92 41.84 19 Slovenia ............................................................................................................1.85 40.26 20 Czech Republic ...........................................................................................1.79 38.97 21 United Kingdom ........................................................................................1.67 36.37 22 Canada ..............................................................................................................1.59 34.43 23 Malaysia ............................................................................................................1.44 31.20 24 Italy ......................................................................................................................1.36 29.50 25 Hungary ...........................................................................................................1.35 29.38 26 Portugal ...........................................................................................................1.33 28.78 27 Estonia ..............................................................................................................1.32 28.68 28 Brazil ...................................................................................................................1.27 27.43 29 Luxembourg .................................................................................................1.25 27.18 30 New Zealand ................................................................................................1.23 26.65 31 Spain ..................................................................................................................1.21 26.15 32 Greece ................................................................................................................1.14 24.76 33 Russian Federation ....................................................................................1.11 23.96 34 Ireland ...............................................................................................................1.04 22.56 35 Poland ...............................................................................................................1.04 22.44 36 United Arab Emirates ..............................................................................0.96 20.81 37 Turkey ................................................................................................................0.96 20.76 38 Serbia .................................................................................................................0.93 20.07 39 Lithuania ..........................................................................................................0.89 19.25 40 Slovakia ........................................................................................................... 0.88 19.00 41 Croatia ...............................................................................................................0.87 18.75 42 South Africa ...................................................................................................0.82 17.67 43 Saudi Arabia ..................................................................................................0.82 17.55 44 Kenya .................................................................................................................0.79 16.91 45 Thailand ...........................................................................................................0.78 16.81 46 Bulgaria.............................................................................................................0.77 16.58 47 Senegal .............................................................................................................0.75 16.16 48 Jordan................................................................................................................0.72 15.41 49 Morocco ...........................................................................................................0.71 15.34 50 Burkina Faso ..................................................................................................0.67 14.38 51 India ....................................................................................................................0.62 13.27 52 Egypt ..................................................................................................................0.61 12.96 53 Ethiopia ............................................................................................................0.60 12.94 54 Tunisia................................................................................................................0.60 12.83 55 Cyprus ...............................................................................................................0.57 12.08 56 Malta ..................................................................................................................0.55 11.72 57 Botswana ........................................................................................................0.54 11.46 58 Algeria ...............................................................................................................0.53 11.38 59 Argentina ........................................................................................................0.53 11.36 60 Tanzania, United Rep. .............................................................................0.53 11.28 61 Viet Nam ..........................................................................................................0.53 11.22 62 Latvia .................................................................................................................0.51 10.94 63 Qatar ...................................................................................................................0.51 10.85 64 Romania ...........................................................................................................0.50 10.71 65 Mexico ..............................................................................................................0.49 10.35 66 Costa Rica .......................................................................................................0.46 9.72
Rank Country Value Score 67 Ukraine .............................................................................................................0.45 9.51 68 Ecuador ........................................................................................................... 0.44 9.38 69 Uruguay ...........................................................................................................0.41 8.63 70 Congo, Dem. Rep. .....................................................................................0.41 8.59 71 Ghana ................................................................................................................0.38 7.93 72 Mauritius ..........................................................................................................0.36 7.66 73 Chile ....................................................................................................................0.36 7.63 74 North Macedonia ......................................................................................0.35 7.43 75 Namibia ............................................................................................................0.34 7.13 76 Mozambique ................................................................................................0.34 7.08 77 Montenegro ..................................................................................................0.32 6.79 78 Nepal ..................................................................................................................0.30 6.30 79 Moldova, Rep. ..............................................................................................0.30 6.30 80 Mali ......................................................................................................................0.29 6.10 81 Georgia .............................................................................................................0.29 6.03 82 Zambia ..............................................................................................................0.28 5.78 83 Eswatini ............................................................................................................0.27 5.60 84 Iran, Islamic Rep. .........................................................................................0.25 5.22 85 Colombia .........................................................................................................0.24 5.03 86 Indonesia.........................................................................................................0.24 4.90 87 Pakistan ............................................................................................................0.24 4.85 88 Armenia............................................................................................................0.23 4.67 89 Oman .................................................................................................................0.22 4.54 90 Bosnia and Herzegovina .......................................................................0.20 4.05 91 Azerbaijan ....................................................................................................... 0.19 3.74 92 Uganda ............................................................................................................. 0.17 3.42 93 Bolivia, Plurinational St. .......................................................................... 0.16 3.12 94 Albania .............................................................................................................. 0.15 3.06 95 Paraguay .......................................................................................................... 0.15 3.05 96 El Salvador ...................................................................................................... 0.15 2.89 97 Philippines ...................................................................................................... 0.14 2.70 98 Mongolia ......................................................................................................... 0.13 2.62 99 Gambia ............................................................................................................. 0.13 2.60 100 Kazakhstan ..................................................................................................... 0.13 2.59 101 Burundi ............................................................................................................. 0.12 2.34 102 Peru ..................................................................................................................... 0.12 2.32 103 Venezuela, Bolivarian Rep. ................................................................... 0.12 2.28 104 Cambodia ....................................................................................................... 0.12 2.27 105 Tajikistan .......................................................................................................... 0.12 2.21 106 Kyrgyzstan .......................................................................................................0.11 2.07 107 Sri Lanka ............................................................................................................0.11 2.06 108 Nicaragua .........................................................................................................0.11 2.06 109 Bahrain .............................................................................................................. 0.10 1.90 110 Côte d’Ivoire ..................................................................................................0.09 1.71 111 Trinidad and Tobago ...............................................................................0.09 1.69 112 Kuwait ...............................................................................................................0.08 1.45 113 Cabo Verde ....................................................................................................0.07 1.27 114 Panama .............................................................................................................0.06 1.04 115 Lesotho.............................................................................................................0.05 0.73 116 Guatemala ......................................................................................................0.03 0.33 117 Honduras ........................................................................................................0.01 0.01 118 Madagascar ...................................................................................................0.01 0.00 Angola................................................................................................................ n/a n/a Bangladesh ..................................................................................................... n/a n/a Bhutan................................................................................................................ n/a n/a Brunei Darussalam ..................................................................................... n/a n/a Cameroon ........................................................................................................ n/a n/a Dominican Republic ................................................................................. n/a n/a Jamaica .............................................................................................................. n/a n/a Lao PDR ............................................................................................................. n/a n/a Liberia ................................................................................................................. n/a n/a Malawi ................................................................................................................ n/a n/a Nigeria ................................................................................................................ n/a n/a Rwanda ............................................................................................................. n/a n/a Yemen ................................................................................................................ n/a n/a Zimbabwe ....................................................................................................... n/a n/a
SOURCE: UNESCO Institute for Statistics, UIS.Stat (http://data.uis.unesco.org/)For some countries, the latest year for which data are available may differ from the year that appears at the top of the page. The cut-off year is 2008.

THE GLOBAL TALENT COMPETITIVENESS INDEX 2020 275
DATA TABLESDATA TABLES
1.2.5 ICT infrastructure
ICT access index | 2017
Rank Country Value Score 1 Luxembourg .................................................................................................9.54 100.00 2 Iceland ..............................................................................................................9.38 97.96 3 United Kingdom ........................................................................................ 9.15 95.04 4 Malta ..................................................................................................................9.02 93.38 5 Germany ..........................................................................................................8.93 92.24 6 Korea, Rep. ......................................................................................................8.85 91.22 6 Switzerland ....................................................................................................8.85 91.22 8 Japan ................................................................................................................. 8.80 90.59 9 Netherlands ...................................................................................................8.65 88.68 10 France ............................................................................................................... 8.64 88.55 11 Singapore........................................................................................................8.61 88.17 12 Sweden ............................................................................................................8.55 87.40 13 Denmark ..........................................................................................................8.39 85.37 14 Austria ...............................................................................................................8.38 85.24 15 New Zealand ............................................................................................... 8.34 84.73 16 United States of America......................................................................8.27 83.84 17 Israel ................................................................................................................... 8.17 82.57 18 Estonia .............................................................................................................. 8.16 82.44 19 Belgium ............................................................................................................ 8.15 82.32 20 Bahrain .............................................................................................................. 8.14 82.19 20 Ireland ............................................................................................................... 8.14 82.19 22 United Arab Emirates .............................................................................. 8.11 81.81 23 Australia .......................................................................................................... 8.00 80.41 23 Norway ............................................................................................................ 8.00 80.41 25 Spain .................................................................................................................. 7.98 80.15 26 Canada .............................................................................................................. 7.93 79.52 27 Portugal ............................................................................................................7.91 79.26 27 Slovenia .............................................................................................................7.91 79.26 29 Qatar ................................................................................................................... 7.90 79.13 30 Cyprus ...............................................................................................................7.86 78.63 31 Hungary ........................................................................................................... 7.78 77.61 32 Greece ............................................................................................................... 7.76 77.35 33 Croatia ...............................................................................................................7.60 75.32 34 Poland ............................................................................................................... 7.58 75.06 35 Moldova, Rep. .............................................................................................. 7.56 74.81 36 Kazakhstan ..................................................................................................... 7.55 74.68 37 Brunei Darussalam .................................................................................... 7.47 73.66 38 Latvia ..................................................................................................................7.41 72.90 39 Finland .............................................................................................................. 7.35 72.14 40 Italy ...................................................................................................................... 7.33 71.88 41 Oman ................................................................................................................. 7.32 71.76 42 Uruguay ...........................................................................................................7.28 71.25 43 Russian Federation ...................................................................................7.23 70.61 44 Slovakia ............................................................................................................7.22 70.48 45 Saudi Arabia .................................................................................................. 7.21 70.36 46 Serbia .................................................................................................................7.20 70.23 47 Trinidad and Tobago ................................................................................7.18 69.97 48 Czech Republic ............................................................................................7.14 69.47 49 Kuwait ................................................................................................................7.12 69.21 50 Lithuania ...........................................................................................................7.11 69.08 51 Mauritius ..........................................................................................................7.04 68.19 52 Montenegro .................................................................................................. 7.03 68.07 53 Romania ...........................................................................................................6.98 67.43 54 Malaysia ............................................................................................................6.93 66.79 55 Argentina ........................................................................................................6.87 66.03 56 Bulgaria.............................................................................................................6.83 65.52 57 Chile ....................................................................................................................6.79 65.01 58 Iran, Islamic Rep. .........................................................................................6.74 64.38 59 North Macedonia ..................................................................................... 6.66 63.36 60 Azerbaijan .......................................................................................................6.62 62.85 61 Ukraine ............................................................................................................ 6.60 62.60 62 Armenia............................................................................................................6.52 61.58 63 Costa Rica .......................................................................................................6.40 60.05 64 Turkey ................................................................................................................6.30 58.78 65 Georgia .............................................................................................................6.26 58.27 66 Brazil .................................................................................................................. 6.25 58.14
Rank Country Value Score 67 Morocco .......................................................................................................... 6.06 55.73 68 Jordan................................................................................................................6.03 55.34 69 Panama .............................................................................................................5.95 54.33 70 Colombia .........................................................................................................5.88 53.44 71 Bosnia and Herzegovina ...................................................................... 5.84 52.93 72 Cabo Verde ....................................................................................................5.76 51.91 73 China ..................................................................................................................5.58 49.62 74 South Africa ...................................................................................................5.48 48.35 74 Thailand ...........................................................................................................5.48 48.35 76 Egypt ..................................................................................................................5.40 47.33 77 Jamaica .............................................................................................................5.29 45.93 78 Mexico ..............................................................................................................5.28 45.80 79 Venezuela, Bolivarian Rep. ................................................................... 5.15 44.15 80 Algeria ............................................................................................................... 5.14 44.02 81 Tunisia.................................................................................................................5.11 43.64 82 Ecuador ............................................................................................................4.93 41.35 83 Botswana ........................................................................................................4.90 40.97 83 Peru .....................................................................................................................4.90 40.97 85 Philippines ......................................................................................................4.87 40.59 86 Indonesia.........................................................................................................4.85 40.33 87 Albania ..............................................................................................................4.80 39.69 88 El Salvador ......................................................................................................4.75 39.06 88 Viet Nam ..........................................................................................................4.75 39.06 90 Mongolia .........................................................................................................4.74 38.93 91 Sri Lanka ...........................................................................................................4.66 37.91 92 Kyrgyzstan ......................................................................................................4.54 36.39 93 Guatemala ......................................................................................................4.52 36.13 94 Bolivia, Plurinational St. ..........................................................................4.42 34.86 95 Paraguay ..........................................................................................................4.41 34.73 96 Namibia ............................................................................................................4.39 34.48 97 Ghana ................................................................................................................4.36 34.10 98 Dominican Republic ................................................................................4.30 33.33 99 Nicaragua ........................................................................................................ 4.19 31.93 100 Cambodia ....................................................................................................... 4.16 31.55 101 Bhutan...............................................................................................................4.09 30.66 102 Honduras ........................................................................................................4.08 30.53 103 Côte d’Ivoire ..................................................................................................3.92 28.50 104 Gambia .............................................................................................................3.77 26.59 105 Lesotho.............................................................................................................3.72 25.95 106 Kenya .................................................................................................................3.63 24.81 107 Nepal ..................................................................................................................3.62 24.68 108 India ....................................................................................................................3.60 24.43 109 Senegal .............................................................................................................3.57 24.05 110 Lao PDR ............................................................................................................3.47 22.77 111 Zimbabwe ......................................................................................................3.40 21.88 112 Pakistan ............................................................................................................3.34 21.12 113 Mali ...................................................................................................................... 3.16 18.83 113 Nigeria ............................................................................................................... 3.16 18.83 115 Bangladesh ....................................................................................................3.05 17.43 116 Zambia ..............................................................................................................2.85 14.89 117 Cameroon ...................................................................................................... 2.84 14.76 118 Burkina Faso ..................................................................................................2.82 14.50 119 Rwanda ............................................................................................................2.67 12.60 120 Angola...............................................................................................................2.62 11.96 121 Mozambique ................................................................................................2.53 10.81 122 Tanzania, United Rep. .............................................................................2.52 10.69 123 Uganda .............................................................................................................2.46 9.92 124 Ethiopia ............................................................................................................2.35 8.52 125 Madagascar ...................................................................................................2.29 7.76 126 Malawi ............................................................................................................... 2.18 6.36 127 Burundi ............................................................................................................. 2.14 5.85 128 Congo, Dem. Rep. .....................................................................................1.68 0.00 Eswatini ............................................................................................................. n/a n/a Liberia ................................................................................................................. n/a n/a Tajikistan ........................................................................................................... n/a n/a Yemen ................................................................................................................ n/a n/a
SOURCE: International Telecommunication Union, Measuring the Information Society Report 2017, ICT Development Index 2017 (http://www.itu.int/en/ITU-D/Statistics/Pages/publications/mis2017.aspx)
For some countries, the latest year for which data are available may differ from the year that appears at the top of the page. The cut-off year is 2008.
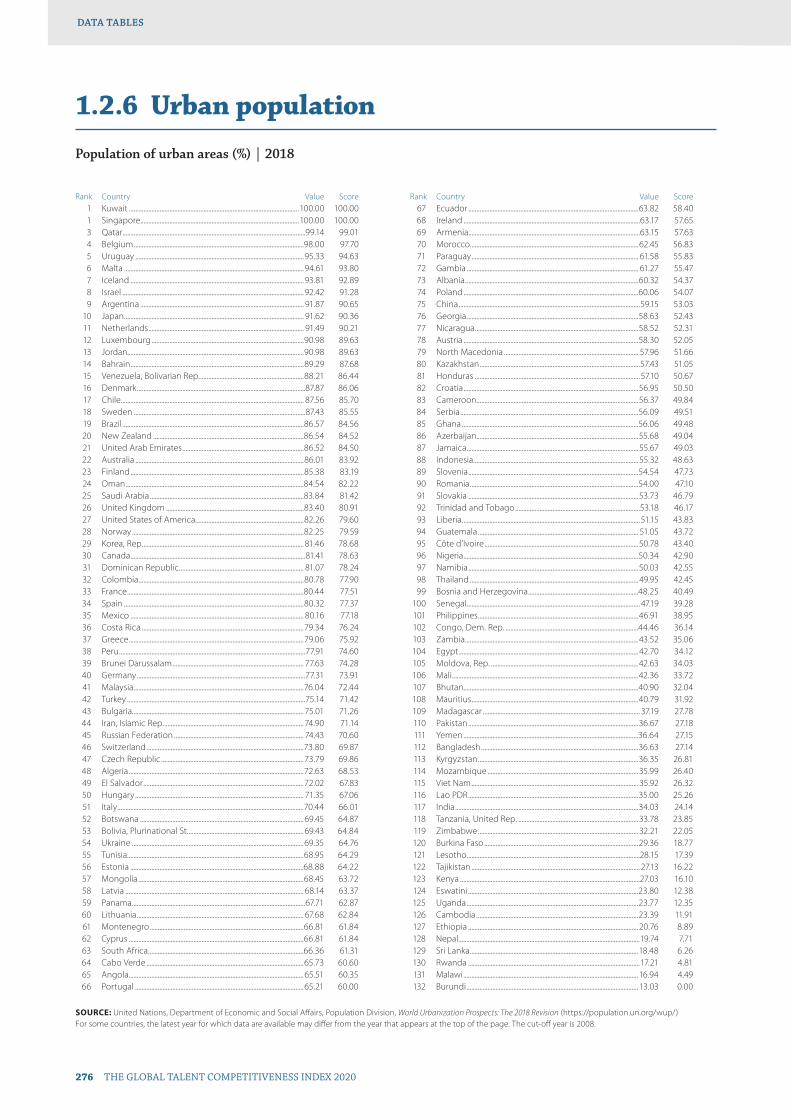
276 THE GLOBAL TALENT COMPETITIVENESS INDEX 2020
DATA TABLESDATA TABLES
1.2.6 Urban population
Population of urban areas (%) | 2018
Rank Country Value Score 1 Kuwait .........................................................................................................100.00 100.00 1 Singapore..................................................................................................100.00 100.00 3 Qatar .................................................................................................................99.14 99.01 4 Belgium .........................................................................................................98.00 97.70 5 Uruguay ........................................................................................................95.33 94.63 6 Malta ...............................................................................................................94.61 93.80 7 Iceland ...........................................................................................................93.81 92.89 8 Israel ................................................................................................................92.42 91.28 9 Argentina ..................................................................................................... 91.87 90.65 10 Japan ............................................................................................................... 91.62 90.36 11 Netherlands ................................................................................................ 91.49 90.21 12 Luxembourg ..............................................................................................90.98 89.63 13 Jordan.............................................................................................................90.98 89.63 14 Bahrain ...........................................................................................................89.29 87.68 15 Venezuela, Bolivarian Rep. ................................................................88.21 86.44 16 Denmark ........................................................................................................87.87 86.06 17 Chile ................................................................................................................. 87.56 85.70 18 Sweden ..........................................................................................................87.43 85.55 19 Brazil ................................................................................................................86.57 84.56 20 New Zealand .............................................................................................86.54 84.52 21 United Arab Emirates ...........................................................................86.52 84.50 22 Australia ........................................................................................................86.01 83.92 23 Finland ...........................................................................................................85.38 83.19 24 Oman ..............................................................................................................84.54 82.22 25 Saudi Arabia ...............................................................................................83.84 81.42 26 United Kingdom .....................................................................................83.40 80.91 27 United States of America...................................................................82.26 79.60 28 Norway ..........................................................................................................82.25 79.59 29 Korea, Rep. ................................................................................................... 81.46 78.68 30 Canada ............................................................................................................81.41 78.63 31 Dominican Republic ............................................................................. 81.07 78.24 32 Colombia ......................................................................................................80.78 77.90 33 France .............................................................................................................80.44 77.51 34 Spain ...............................................................................................................80.32 77.37 35 Mexico ........................................................................................................... 80.16 77.18 36 Costa Rica ....................................................................................................79.34 76.24 37 Greece ............................................................................................................79.06 75.92 38 Peru ...................................................................................................................77.91 74.60 39 Brunei Darussalam ................................................................................. 77.63 74.28 40 Germany ........................................................................................................77.31 73.91 41 Malaysia .........................................................................................................76.04 72.44 42 Turkey ..............................................................................................................75.14 71.42 43 Bulgaria.......................................................................................................... 75.01 71.26 44 Iran, Islamic Rep. ...................................................................................... 74.90 71.14 45 Russian Federation ................................................................................ 74.43 70.60 46 Switzerland .................................................................................................73.80 69.87 47 Czech Republic ........................................................................................73.79 69.86 48 Algeria ............................................................................................................72.63 68.53 49 El Salvador ...................................................................................................72.02 67.83 50 Hungary ........................................................................................................ 71.35 67.06 51 Italy ...................................................................................................................70.44 66.01 52 Botswana ..................................................................................................... 69.45 64.87 53 Bolivia, Plurinational St. ....................................................................... 69.43 64.84 54 Ukraine ..........................................................................................................69.35 64.76 55 Tunisia.............................................................................................................68.95 64.29 56 Estonia ...........................................................................................................68.88 64.22 57 Mongolia ......................................................................................................68.45 63.72 58 Latvia .............................................................................................................. 68.14 63.37 59 Panama ...........................................................................................................67.71 62.87 60 Lithuania ....................................................................................................... 67.68 62.84 61 Montenegro ...............................................................................................66.81 61.84 62 Cyprus ............................................................................................................66.81 61.84 63 South Africa ................................................................................................66.36 61.31 64 Cabo Verde .................................................................................................65.73 60.60 65 Angola............................................................................................................ 65.51 60.35 66 Portugal ........................................................................................................65.21 60.00
Rank Country Value Score 67 Ecuador .........................................................................................................63.82 58.40 68 Ireland .............................................................................................................63.17 57.65 69 Armenia..........................................................................................................63.15 57.63 70 Morocco ........................................................................................................62.45 56.83 71 Paraguay ....................................................................................................... 61.58 55.83 72 Gambia .......................................................................................................... 61.27 55.47 73 Albania ...........................................................................................................60.32 54.37 74 Poland ............................................................................................................60.06 54.07 75 China ................................................................................................................59.15 53.03 76 Georgia ..........................................................................................................58.63 52.43 77 Nicaragua .....................................................................................................58.52 52.31 78 Austria ............................................................................................................58.30 52.05 79 North Macedonia ................................................................................... 57.96 51.66 80 Kazakhstan ...................................................................................................57.43 51.05 81 Honduras ......................................................................................................57.10 50.67 82 Croatia ............................................................................................................56.95 50.50 83 Cameroon ....................................................................................................56.37 49.84 84 Serbia ..............................................................................................................56.09 49.51 85 Ghana .............................................................................................................56.06 49.48 86 Azerbaijan ....................................................................................................55.68 49.04 87 Jamaica ..........................................................................................................55.67 49.03 88 Indonesia......................................................................................................55.32 48.63 89 Slovenia .........................................................................................................54.54 47.73 90 Romania ........................................................................................................54.00 47.10 91 Slovakia .........................................................................................................53.73 46.79 92 Trinidad and Tobago .............................................................................53.18 46.17 93 Liberia ..............................................................................................................51.15 43.83 94 Guatemala ................................................................................................... 51.05 43.72 95 Côte d’Ivoire ...............................................................................................50.78 43.40 96 Nigeria ............................................................................................................50.34 42.90 97 Namibia .........................................................................................................50.03 42.55 98 Thailand ........................................................................................................ 49.95 42.45 99 Bosnia and Herzegovina ....................................................................48.25 40.49 100 Senegal ........................................................................................................... 47.19 39.28 101 Philippines ...................................................................................................46.91 38.95 102 Congo, Dem. Rep. ..................................................................................44.46 36.14 103 Zambia ...........................................................................................................43.52 35.06 104 Egypt ............................................................................................................... 42.70 34.12 105 Moldova, Rep. ...........................................................................................42.63 34.03 106 Mali ...................................................................................................................42.36 33.72 107 Bhutan............................................................................................................40.90 32.04 108 Mauritius .......................................................................................................40.79 31.92 109 Madagascar ................................................................................................. 37.19 27.78 110 Pakistan .........................................................................................................36.67 27.18 111 Yemen ............................................................................................................36.64 27.15 112 Bangladesh .................................................................................................36.63 27.14 113 Kyrgyzstan ...................................................................................................36.35 26.81 114 Mozambique .............................................................................................35.99 26.40 115 Viet Nam ....................................................................................................... 35.92 26.32 116 Lao PDR .........................................................................................................35.00 25.26 117 India .................................................................................................................34.03 24.14 118 Tanzania, United Rep. ..........................................................................33.78 23.85 119 Zimbabwe ...................................................................................................32.21 22.05 120 Burkina Faso ...............................................................................................29.36 18.77 121 Lesotho...........................................................................................................28.15 17.39 122 Tajikistan ........................................................................................................ 27.13 16.22 123 Kenya ...............................................................................................................27.03 16.10 124 Eswatini .........................................................................................................23.80 12.38 125 Uganda ..........................................................................................................23.77 12.35 126 Cambodia ....................................................................................................23.39 11.91 127 Ethiopia .........................................................................................................20.76 8.89 128 Nepal ................................................................................................................19.74 7.71 129 Sri Lanka ........................................................................................................18.48 6.26 130 Rwanda ..........................................................................................................17.21 4.81 131 Malawi ............................................................................................................16.94 4.49 132 Burundi .......................................................................................................... 13.03 0.00
SOURCE: United Nations, Department of Economic and Social Affairs, Population Division, World Urbanization Prospects: The 2018 Revision (https://population.un.org/wup/)For some countries, the latest year for which data are available may differ from the year that appears at the top of the page. The cut-off year is 2008.
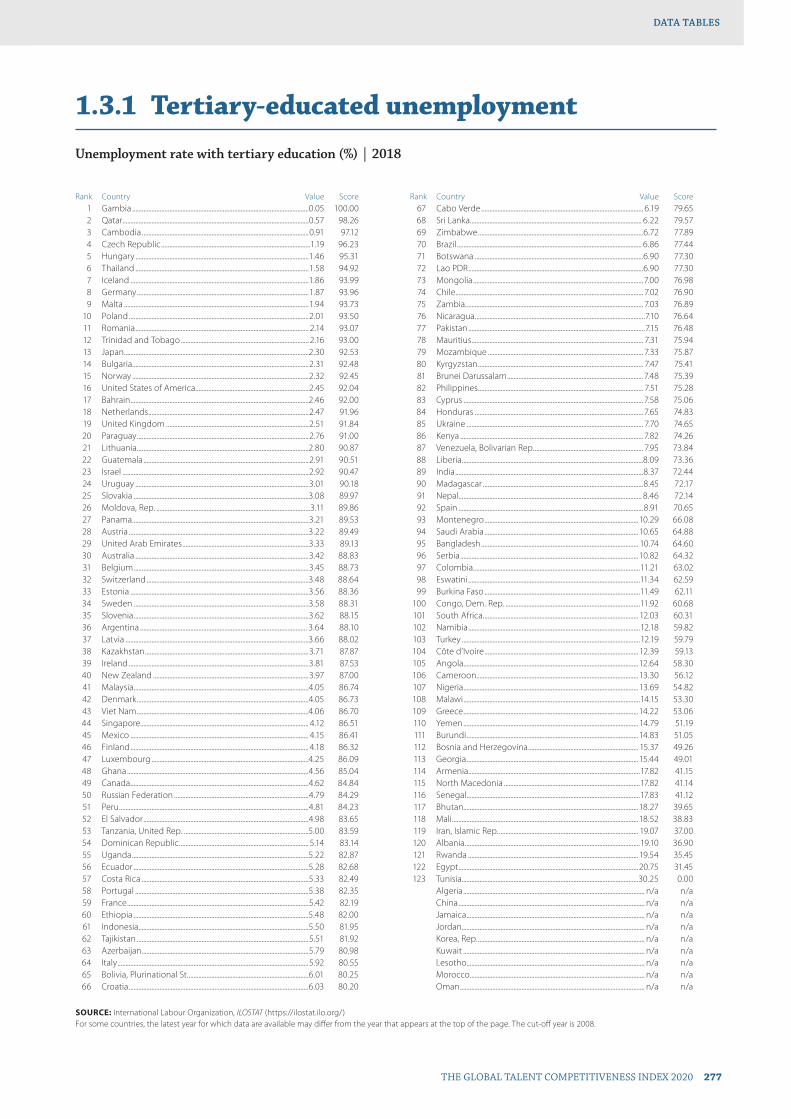
THE GLOBAL TALENT COMPETITIVENESS INDEX 2020 277
DATA TABLESDATA TABLES
1.3.1 Tertiary-educated unemployment
Unemployment rate with tertiary education (%) | 2018
Rank Country Value Score 1 Gambia .............................................................................................................0.05 100.00 2 Qatar ...................................................................................................................0.57 98.26 3 Cambodia .......................................................................................................0.91 97.12 4 Czech Republic ............................................................................................1.19 96.23 5 Hungary ...........................................................................................................1.46 95.31 6 Thailand ...........................................................................................................1.58 94.92 7 Iceland ..............................................................................................................1.86 93.99 8 Germany ..........................................................................................................1.87 93.96 9 Malta ..................................................................................................................1.94 93.73 10 Poland ...............................................................................................................2.01 93.50 11 Romania ........................................................................................................... 2.14 93.07 12 Trinidad and Tobago ............................................................................... 2.16 93.00 13 Japan ..................................................................................................................2.30 92.53 14 Bulgaria.............................................................................................................2.31 92.48 15 Norway .............................................................................................................2.32 92.45 16 United States of America......................................................................2.45 92.04 17 Bahrain ..............................................................................................................2.46 92.00 18 Netherlands ...................................................................................................2.47 91.96 19 United Kingdom ........................................................................................2.51 91.84 20 Paraguay ..........................................................................................................2.76 91.00 21 Lithuania ..........................................................................................................2.80 90.87 22 Guatemala ......................................................................................................2.91 90.51 23 Israel ...................................................................................................................2.92 90.47 24 Uruguay ...........................................................................................................3.01 90.18 25 Slovakia ............................................................................................................3.08 89.97 26 Moldova, Rep. ...............................................................................................3.11 89.86 27 Panama .............................................................................................................3.21 89.53 28 Austria ...............................................................................................................3.22 89.49 29 United Arab Emirates ..............................................................................3.33 89.13 30 Australia ...........................................................................................................3.42 88.83 31 Belgium ............................................................................................................3.45 88.73 32 Switzerland ....................................................................................................3.48 88.64 33 Estonia ..............................................................................................................3.56 88.36 34 Sweden ............................................................................................................3.58 88.31 35 Slovenia ............................................................................................................3.62 88.15 36 Argentina ....................................................................................................... 3.64 88.10 37 Latvia .................................................................................................................3.66 88.02 38 Kazakhstan .....................................................................................................3.71 87.87 39 Ireland ...............................................................................................................3.81 87.53 40 New Zealand ................................................................................................3.97 87.00 41 Malaysia ............................................................................................................4.05 86.74 42 Denmark ..........................................................................................................4.05 86.73 43 Viet Nam ..........................................................................................................4.06 86.70 44 Singapore........................................................................................................ 4.12 86.51 45 Mexico .............................................................................................................. 4.15 86.41 46 Finland .............................................................................................................. 4.18 86.32 47 Luxembourg .................................................................................................4.25 86.09 48 Ghana ................................................................................................................4.56 85.04 49 Canada ..............................................................................................................4.62 84.84 50 Russian Federation ...................................................................................4.79 84.29 51 Peru .....................................................................................................................4.81 84.23 52 El Salvador ......................................................................................................4.98 83.65 53 Tanzania, United Rep. .............................................................................5.00 83.59 54 Dominican Republic ................................................................................ 5.14 83.14 55 Uganda .............................................................................................................5.22 82.87 56 Ecuador ............................................................................................................5.28 82.68 57 Costa Rica .......................................................................................................5.33 82.49 58 Portugal ...........................................................................................................5.38 82.35 59 France ................................................................................................................5.42 82.19 60 Ethiopia ............................................................................................................5.48 82.00 61 Indonesia.........................................................................................................5.50 81.95 62 Tajikistan ..........................................................................................................5.51 81.92 63 Azerbaijan .......................................................................................................5.79 80.98 64 Italy ......................................................................................................................5.92 80.55 65 Bolivia, Plurinational St. ..........................................................................6.01 80.25 66 Croatia ...............................................................................................................6.03 80.20
Rank Country Value Score 67 Cabo Verde .................................................................................................... 6.19 79.65 68 Sri Lanka .......................................................................................................... 6.22 79.57 69 Zimbabwe ......................................................................................................6.72 77.89 70 Brazil .................................................................................................................. 6.86 77.44 71 Botswana ........................................................................................................6.90 77.30 72 Lao PDR ............................................................................................................6.90 77.30 73 Mongolia .........................................................................................................7.00 76.98 74 Chile .................................................................................................................... 7.02 76.90 75 Zambia .............................................................................................................. 7.03 76.89 76 Nicaragua .........................................................................................................7.10 76.64 77 Pakistan .............................................................................................................7.15 76.48 78 Mauritius .......................................................................................................... 7.31 75.94 79 Mozambique ................................................................................................ 7.33 75.87 80 Kyrgyzstan ...................................................................................................... 7.47 75.41 81 Brunei Darussalam ....................................................................................7.48 75.39 82 Philippines ...................................................................................................... 7.51 75.28 83 Cyprus ............................................................................................................... 7.58 75.06 84 Honduras ........................................................................................................ 7.65 74.83 85 Ukraine ............................................................................................................. 7.70 74.65 86 Kenya ................................................................................................................. 7.82 74.26 87 Venezuela, Bolivarian Rep. ................................................................... 7.95 73.84 88 Liberia ................................................................................................................8.09 73.36 89 India ....................................................................................................................8.37 72.44 90 Madagascar ...................................................................................................8.45 72.17 91 Nepal ................................................................................................................. 8.46 72.14 92 Spain ..................................................................................................................8.91 70.65 93 Montenegro ...............................................................................................10.29 66.08 94 Saudi Arabia ...............................................................................................10.65 64.88 95 Bangladesh ................................................................................................. 10.74 64.60 96 Serbia ..............................................................................................................10.82 64.32 97 Colombia .......................................................................................................11.21 63.02 98 Eswatini ..........................................................................................................11.34 62.59 99 Burkina Faso ................................................................................................11.49 62.11 100 Congo, Dem. Rep. ...................................................................................11.92 60.68 101 South Africa ................................................................................................ 12.03 60.31 102 Namibia ..........................................................................................................12.18 59.82 103 Turkey ..............................................................................................................12.19 59.79 104 Côte d’Ivoire ............................................................................................... 12.39 59.13 105 Angola............................................................................................................12.64 58.30 106 Cameroon ....................................................................................................13.30 56.12 107 Nigeria ............................................................................................................ 13.69 54.82 108 Malawi .............................................................................................................14.15 53.30 109 Greece ............................................................................................................14.22 53.06 110 Yemen ............................................................................................................ 14.79 51.19 111 Burundi ..........................................................................................................14.83 51.05 112 Bosnia and Herzegovina .................................................................... 15.37 49.26 113 Georgia ..........................................................................................................15.44 49.01 114 Armenia..........................................................................................................17.82 41.15 115 North Macedonia ....................................................................................17.82 41.14 116 Senegal ...........................................................................................................17.83 41.12 117 Bhutan............................................................................................................18.27 39.65 118 Mali ...................................................................................................................18.52 38.83 119 Iran, Islamic Rep. ...................................................................................... 19.07 37.00 120 Albania ............................................................................................................19.10 36.90 121 Rwanda ......................................................................................................... 19.54 35.45 122 Egypt ...............................................................................................................20.75 31.45 123 Tunisia.............................................................................................................30.25 0.00 Algeria ................................................................................................................ n/a n/a China ................................................................................................................... n/a n/a Jamaica .............................................................................................................. n/a n/a Jordan................................................................................................................. n/a n/a Korea, Rep. ....................................................................................................... n/a n/a Kuwait ................................................................................................................ n/a n/a Lesotho.............................................................................................................. n/a n/a Morocco ............................................................................................................ n/a n/a Oman .................................................................................................................. n/a n/a
SOURCE: International Labour Organization, ILOSTAT (https://ilostat.ilo.org/)For some countries, the latest year for which data are available may differ from the year that appears at the top of the page. The cut-off year is 2008.

278 THE GLOBAL TALENT COMPETITIVENESS INDEX 2020
DATA TABLESDATA TABLES
1.3.2 Active labour market policies
Average answer to the question: In your country, to what extent do labour market policies help unemployed people to reskill and find new employment (including skills matching, retraining, etc.)? [1 = not at all; 7 = to a great extent] | 2018
Rank Country Value Score 1 Switzerland ....................................................................................................5.75 100.00 2 United States of America......................................................................5.68 98.20 3 Austria ...............................................................................................................5.65 97.59 4 Singapore........................................................................................................5.61 96.73 5 Luxembourg .................................................................................................5.38 91.11 6 Iceland ..............................................................................................................5.29 89.01 7 Denmark ..........................................................................................................5.29 88.94 8 Germany ..........................................................................................................5.20 86.99 9 Norway ............................................................................................................. 5.17 86.15 10 Netherlands ................................................................................................... 5.15 85.72 11 Malaysia ............................................................................................................4.96 81.15 12 Finland ..............................................................................................................4.95 80.91 13 Estonia ..............................................................................................................4.90 79.65 14 Sweden ............................................................................................................4.83 78.14 15 Ireland ...............................................................................................................4.79 77.12 16 Australia ...........................................................................................................4.78 76.85 17 Czech Republic ...........................................................................................4.78 76.80 18 Malta ..................................................................................................................4.78 76.80 19 New Zealand ................................................................................................4.77 76.79 20 Qatar ...................................................................................................................4.74 75.92 21 Canada ..............................................................................................................4.71 75.33 22 Japan ..................................................................................................................4.69 74.79 23 Saudi Arabia ..................................................................................................4.69 74.72 24 Belgium ............................................................................................................4.55 71.48 25 Slovenia ............................................................................................................4.55 71.47 26 United Arab Emirates ..............................................................................4.53 70.86 27 China ..................................................................................................................4.49 70.12 28 Oman .................................................................................................................4.49 69.94 29 Korea, Rep. ......................................................................................................4.48 69.76 30 France ................................................................................................................4.45 69.14 31 Israel ...................................................................................................................4.42 68.30 32 India ....................................................................................................................4.40 67.79 33 Bahrain ..............................................................................................................4.38 67.33 34 United Kingdom ........................................................................................4.20 63.15 35 Azerbaijan ....................................................................................................... 4.19 62.98 36 Portugal ........................................................................................................... 4.17 62.35 37 Bhutan............................................................................................................... 4.15 61.90 38 Indonesia.........................................................................................................4.09 60.64 39 Lithuania ..........................................................................................................4.07 60.09 40 Montenegro ..................................................................................................4.02 58.94 41 Kazakhstan .....................................................................................................4.01 58.69 42 Slovakia ............................................................................................................3.99 58.26 43 Cyprus ...............................................................................................................3.99 58.15 44 Pakistan ............................................................................................................3.93 56.62 45 Lesotho.............................................................................................................3.91 56.18 46 Latvia .................................................................................................................3.90 56.13 47 Tajikistan ..........................................................................................................3.85 54.93 48 Brunei Darussalam ....................................................................................3.83 54.38 49 Uruguay ...........................................................................................................3.79 53.31 50 Romania ...........................................................................................................3.73 52.04 51 Thailand ...........................................................................................................3.72 51.73 52 Mauritius ..........................................................................................................3.72 51.72 53 Russian Federation ...................................................................................3.70 51.27 54 Turkey ................................................................................................................3.68 50.78 55 Philippines ......................................................................................................3.65 50.00 56 Kuwait ...............................................................................................................3.62 49.46 57 Ukraine .............................................................................................................3.59 48.54 58 Ghana ................................................................................................................3.58 48.38 59 Rwanda ............................................................................................................3.58 48.34 60 Spain ..................................................................................................................3.55 47.65 61 Hungary ...........................................................................................................3.48 46.15 62 Poland ...............................................................................................................3.46 45.46 63 Bulgaria............................................................................................................ 3.44 44.98 64 Ethiopia ............................................................................................................3.39 43.80 65 Gambia .............................................................................................................3.35 42.85 66 Serbia .................................................................................................................3.28 41.37
Rank Country Value Score 67 Tanzania, United Rep. ............................................................................. 3.18 39.04 68 Armenia............................................................................................................ 3.18 38.86 69 Kenya ................................................................................................................. 3.15 38.16 70 Jordan................................................................................................................ 3.13 37.83 71 Mali ...................................................................................................................... 3.10 37.05 72 North Macedonia ......................................................................................3.09 36.78 73 Croatia ...............................................................................................................3.09 36.75 74 Jamaica .............................................................................................................3.09 36.74 75 Viet Nam ..........................................................................................................3.02 35.20 76 Tunisia................................................................................................................2.99 34.31 77 Sri Lanka ...........................................................................................................2.98 34.29 78 Trinidad and Tobago ...............................................................................2.98 34.08 79 Chile ....................................................................................................................2.96 33.80 80 Algeria ...............................................................................................................2.94 33.18 81 Panama .............................................................................................................2.93 32.99 82 Moldova, Rep. ..............................................................................................2.91 32.61 83 Lao PDR ............................................................................................................2.89 31.98 84 Greece ...............................................................................................................2.88 31.92 85 Iran, Islamic Rep. .........................................................................................2.88 31.88 86 Botswana ........................................................................................................2.88 31.75 87 Cambodia .......................................................................................................2.87 31.55 88 Georgia .............................................................................................................2.85 31.18 89 Colombia .........................................................................................................2.83 30.66 90 Namibia ............................................................................................................2.83 30.55 91 Mongolia .........................................................................................................2.82 30.45 92 Kyrgyzstan ......................................................................................................2.82 30.44 93 Nepal ..................................................................................................................2.82 30.33 94 Italy ......................................................................................................................2.81 30.19 95 Cabo Verde ....................................................................................................2.80 29.84 96 Costa Rica .......................................................................................................2.80 29.81 97 Argentina ........................................................................................................2.78 29.42 98 Albania ..............................................................................................................2.69 27.24 99 Bosnia and Herzegovina .......................................................................2.68 27.03 100 Egypt ..................................................................................................................2.67 26.86 101 Liberia ................................................................................................................2.66 26.65 102 Brazil ...................................................................................................................2.66 26.54 103 South Africa ...................................................................................................2.65 26.28 104 Bangladesh ....................................................................................................2.61 25.28 105 Cameroon .......................................................................................................2.55 23.97 106 Mexico ..............................................................................................................2.52 23.14 107 Senegal .............................................................................................................2.49 22.63 108 Honduras ....................................................................................................... 2.44 21.29 109 Eswatini ............................................................................................................2.39 20.18 110 Burundi .............................................................................................................2.38 20.01 111 Uganda .............................................................................................................2.38 19.99 112 Malawi ...............................................................................................................2.37 19.79 113 Zambia ..............................................................................................................2.25 16.82 114 Paraguay .......................................................................................................... 2.17 14.93 115 Dominican Republic ................................................................................ 2.14 14.21 116 Nigeria ............................................................................................................... 2.13 14.04 117 Ecuador ............................................................................................................ 2.12 13.85 118 Morocco ........................................................................................................... 2.12 13.80 119 Madagascar ................................................................................................... 2.10 13.18 120 Guatemala ......................................................................................................2.08 12.77 121 Peru .....................................................................................................................2.07 12.66 122 Mozambique ................................................................................................2.05 12.10 123 Côte d’Ivoire ..................................................................................................2.03 11.70 124 Burkina Faso ..................................................................................................1.88 8.12 125 Congo, Dem. Rep. .....................................................................................1.85 7.40 126 Yemen ...............................................................................................................1.83 6.98 127 Bolivia, Plurinational St. ..........................................................................1.83 6.80 128 Venezuela, Bolivarian Rep. ...................................................................1.71 4.02 129 Nicaragua ........................................................................................................1.69 3.47 130 Zimbabwe ......................................................................................................1.65 2.52 131 El Salvador ......................................................................................................1.63 2.07 132 Angola...............................................................................................................1.54 0.00
SOURCE: World Economic Forum, Executive Opinion Survey 2017–2018 (http://reports.weforum.org)For some countries, the latest year for which data are available may differ from the year that appears at the top of the page. The cut-off year is 2008.
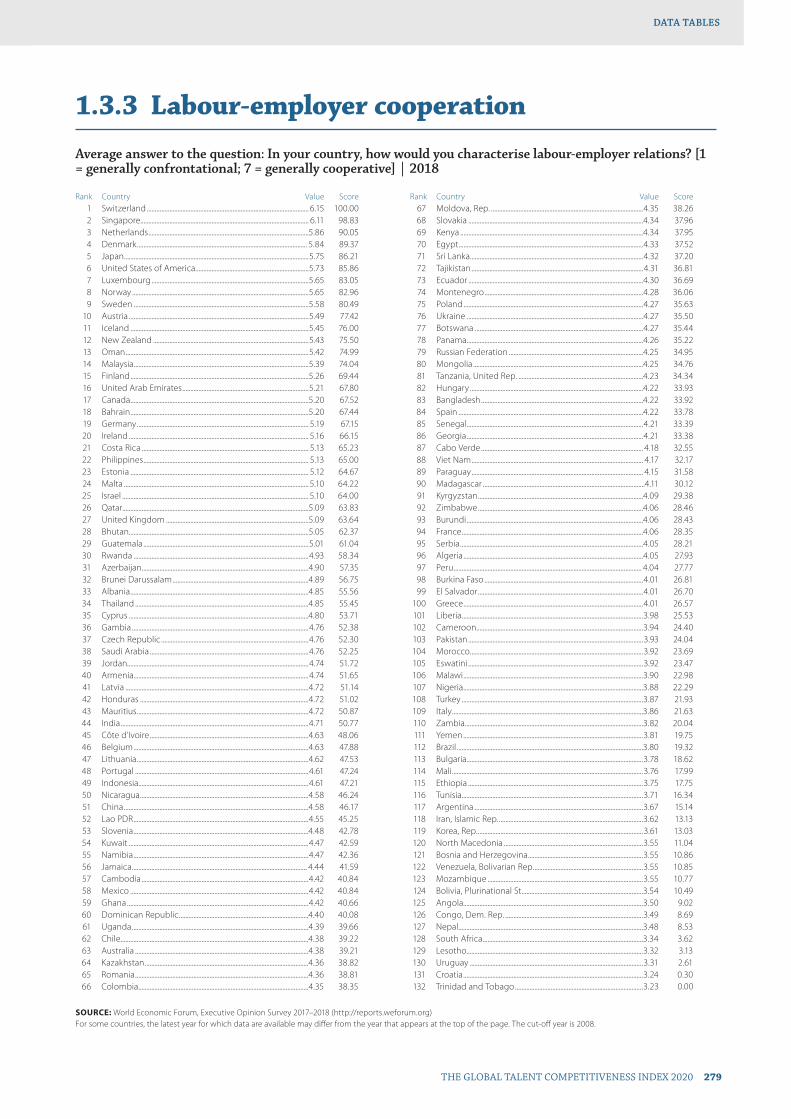
THE GLOBAL TALENT COMPETITIVENESS INDEX 2020 279
DATA TABLESDATA TABLES
1.3.3 Labour-employer cooperation
Average answer to the question: In your country, how would you characterise labour-employer relations? [1 = generally confrontational; 7 = generally cooperative] | 2018
Rank Country Value Score 1 Switzerland .................................................................................................... 6.15 100.00 2 Singapore........................................................................................................ 6.11 98.83 3 Netherlands ...................................................................................................5.86 90.05 4 Denmark ......................................................................................................... 5.84 89.37 5 Japan ..................................................................................................................5.75 86.21 6 United States of America......................................................................5.73 85.86 7 Luxembourg .................................................................................................5.65 83.05 8 Norway .............................................................................................................5.65 82.96 9 Sweden ............................................................................................................5.58 80.49 10 Austria ...............................................................................................................5.49 77.42 11 Iceland ..............................................................................................................5.45 76.00 12 New Zealand ................................................................................................5.43 75.50 13 Oman .................................................................................................................5.42 74.99 14 Malaysia ............................................................................................................5.39 74.04 15 Finland ..............................................................................................................5.26 69.44 16 United Arab Emirates ..............................................................................5.21 67.80 17 Canada ..............................................................................................................5.20 67.52 18 Bahrain ..............................................................................................................5.20 67.44 19 Germany .......................................................................................................... 5.19 67.15 20 Ireland ............................................................................................................... 5.16 66.15 21 Costa Rica ....................................................................................................... 5.13 65.23 22 Philippines ...................................................................................................... 5.13 65.00 23 Estonia .............................................................................................................. 5.12 64.67 24 Malta .................................................................................................................. 5.10 64.22 25 Israel ................................................................................................................... 5.10 64.00 26 Qatar ...................................................................................................................5.09 63.83 27 United Kingdom ........................................................................................5.09 63.64 28 Bhutan...............................................................................................................5.05 62.37 29 Guatemala ......................................................................................................5.01 61.04 30 Rwanda ............................................................................................................4.93 58.34 31 Azerbaijan .......................................................................................................4.90 57.35 32 Brunei Darussalam ....................................................................................4.89 56.75 33 Albania ..............................................................................................................4.85 55.56 34 Thailand ...........................................................................................................4.85 55.45 35 Cyprus ...............................................................................................................4.80 53.71 36 Gambia .............................................................................................................4.76 52.38 37 Czech Republic ...........................................................................................4.76 52.30 38 Saudi Arabia ..................................................................................................4.76 52.25 39 Jordan................................................................................................................4.74 51.72 40 Armenia............................................................................................................4.74 51.65 41 Latvia .................................................................................................................4.72 51.14 42 Honduras ........................................................................................................4.72 51.02 43 Mauritius ..........................................................................................................4.72 50.87 44 India ....................................................................................................................4.71 50.77 45 Côte d’Ivoire ..................................................................................................4.63 48.06 46 Belgium ............................................................................................................4.63 47.88 47 Lithuania ..........................................................................................................4.62 47.53 48 Portugal ...........................................................................................................4.61 47.24 49 Indonesia.........................................................................................................4.61 47.21 50 Nicaragua ........................................................................................................4.58 46.24 51 China ..................................................................................................................4.58 46.17 52 Lao PDR ............................................................................................................4.55 45.25 53 Slovenia ............................................................................................................4.48 42.78 54 Kuwait ...............................................................................................................4.47 42.59 55 Namibia ............................................................................................................4.47 42.36 56 Jamaica ............................................................................................................ 4.44 41.59 57 Cambodia .......................................................................................................4.42 40.84 58 Mexico ..............................................................................................................4.42 40.84 59 Ghana ................................................................................................................4.42 40.66 60 Dominican Republic ................................................................................4.40 40.08 61 Uganda .............................................................................................................4.39 39.66 62 Chile ....................................................................................................................4.38 39.22 63 Australia ...........................................................................................................4.38 39.21 64 Kazakhstan .....................................................................................................4.36 38.82 65 Romania ...........................................................................................................4.36 38.81 66 Colombia .........................................................................................................4.35 38.35
Rank Country Value Score 67 Moldova, Rep. ..............................................................................................4.35 38.26 68 Slovakia ............................................................................................................4.34 37.96 69 Kenya .................................................................................................................4.34 37.95 70 Egypt ..................................................................................................................4.33 37.52 71 Sri Lanka ...........................................................................................................4.32 37.20 72 Tajikistan ..........................................................................................................4.31 36.81 73 Ecuador ............................................................................................................4.30 36.69 74 Montenegro ..................................................................................................4.28 36.06 75 Poland ...............................................................................................................4.27 35.63 76 Ukraine .............................................................................................................4.27 35.50 77 Botswana ........................................................................................................4.27 35.44 78 Panama .............................................................................................................4.26 35.22 79 Russian Federation ...................................................................................4.25 34.95 80 Mongolia .........................................................................................................4.25 34.76 81 Tanzania, United Rep. .............................................................................4.23 34.34 82 Hungary ...........................................................................................................4.22 33.93 83 Bangladesh ....................................................................................................4.22 33.92 84 Spain ..................................................................................................................4.22 33.78 85 Senegal .............................................................................................................4.21 33.39 86 Georgia .............................................................................................................4.21 33.38 87 Cabo Verde .................................................................................................... 4.18 32.55 88 Viet Nam .......................................................................................................... 4.17 32.17 89 Paraguay .......................................................................................................... 4.15 31.58 90 Madagascar ....................................................................................................4.11 30.12 91 Kyrgyzstan ......................................................................................................4.09 29.38 92 Zimbabwe ......................................................................................................4.06 28.46 93 Burundi .............................................................................................................4.06 28.43 94 France ................................................................................................................4.06 28.35 95 Serbia .................................................................................................................4.05 28.21 96 Algeria ...............................................................................................................4.05 27.93 97 Peru .................................................................................................................... 4.04 27.77 98 Burkina Faso ..................................................................................................4.01 26.81 99 El Salvador ......................................................................................................4.01 26.70 100 Greece ...............................................................................................................4.01 26.57 101 Liberia ................................................................................................................3.98 25.53 102 Cameroon .......................................................................................................3.94 24.40 103 Pakistan ............................................................................................................3.93 24.04 104 Morocco ...........................................................................................................3.92 23.69 105 Eswatini ............................................................................................................3.92 23.47 106 Malawi ...............................................................................................................3.90 22.98 107 Nigeria ...............................................................................................................3.88 22.29 108 Turkey ................................................................................................................3.87 21.93 109 Italy ......................................................................................................................3.86 21.63 110 Zambia ..............................................................................................................3.82 20.04 111 Yemen ...............................................................................................................3.81 19.75 112 Brazil ...................................................................................................................3.80 19.32 113 Bulgaria.............................................................................................................3.78 18.62 114 Mali ......................................................................................................................3.76 17.99 115 Ethiopia ............................................................................................................3.75 17.75 116 Tunisia................................................................................................................3.71 16.34 117 Argentina ........................................................................................................3.67 15.14 118 Iran, Islamic Rep. .........................................................................................3.62 13.13 119 Korea, Rep. ......................................................................................................3.61 13.03 120 North Macedonia ......................................................................................3.55 11.04 121 Bosnia and Herzegovina .......................................................................3.55 10.86 122 Venezuela, Bolivarian Rep. ...................................................................3.55 10.85 123 Mozambique ................................................................................................3.55 10.77 124 Bolivia, Plurinational St. ..........................................................................3.54 10.49 125 Angola...............................................................................................................3.50 9.02 126 Congo, Dem. Rep. .....................................................................................3.49 8.69 127 Nepal ..................................................................................................................3.48 8.53 128 South Africa ...................................................................................................3.34 3.62 129 Lesotho.............................................................................................................3.32 3.13 130 Uruguay ...........................................................................................................3.31 2.61 131 Croatia ...............................................................................................................3.24 0.30 132 Trinidad and Tobago ...............................................................................3.23 0.00
SOURCE: World Economic Forum, Executive Opinion Survey 2017–2018 (http://reports.weforum.org)For some countries, the latest year for which data are available may differ from the year that appears at the top of the page. The cut-off year is 2008.
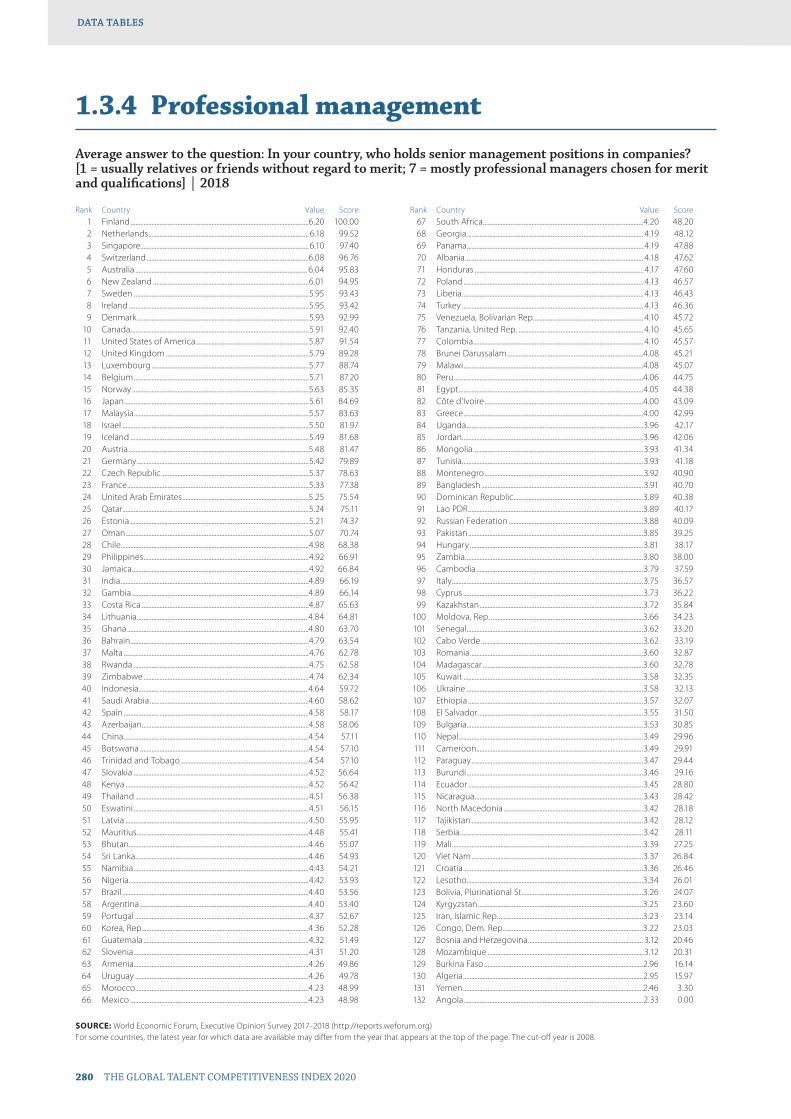
280 THE GLOBAL TALENT COMPETITIVENESS INDEX 2020
DATA TABLESDATA TABLES
1.3.4 Professional management
Average answer to the question: In your country, who holds senior management positions in companies? [1 = usually relatives or friends without regard to merit; 7 = mostly professional managers chosen for merit and qualifications] | 2018
Rank Country Value Score 1 Finland ..............................................................................................................6.20 100.00 2 Netherlands ................................................................................................... 6.18 99.52 3 Singapore........................................................................................................ 6.10 97.40 4 Switzerland ....................................................................................................6.08 96.76 5 Australia .......................................................................................................... 6.04 95.83 6 New Zealand ................................................................................................6.01 94.95 7 Sweden ............................................................................................................5.95 93.43 8 Ireland ...............................................................................................................5.95 93.42 9 Denmark ..........................................................................................................5.93 92.99 10 Canada ..............................................................................................................5.91 92.40 11 United States of America......................................................................5.87 91.54 12 United Kingdom ........................................................................................5.79 89.28 13 Luxembourg .................................................................................................5.77 88.74 14 Belgium ............................................................................................................5.71 87.20 15 Norway .............................................................................................................5.63 85.35 16 Japan ..................................................................................................................5.61 84.69 17 Malaysia ............................................................................................................5.57 83.63 18 Israel ...................................................................................................................5.50 81.97 19 Iceland ..............................................................................................................5.49 81.68 20 Austria ...............................................................................................................5.48 81.47 21 Germany ..........................................................................................................5.42 79.89 22 Czech Republic ...........................................................................................5.37 78.63 23 France ................................................................................................................5.33 77.38 24 United Arab Emirates ..............................................................................5.25 75.54 25 Qatar ...................................................................................................................5.24 75.11 26 Estonia ..............................................................................................................5.21 74.37 27 Oman .................................................................................................................5.07 70.74 28 Chile ....................................................................................................................4.98 68.38 29 Philippines ......................................................................................................4.92 66.91 30 Jamaica .............................................................................................................4.92 66.84 31 India ....................................................................................................................4.89 66.19 32 Gambia .............................................................................................................4.89 66.14 33 Costa Rica .......................................................................................................4.87 65.63 34 Lithuania ......................................................................................................... 4.84 64.81 35 Ghana ................................................................................................................4.80 63.70 36 Bahrain ..............................................................................................................4.79 63.54 37 Malta ..................................................................................................................4.76 62.78 38 Rwanda ............................................................................................................4.75 62.58 39 Zimbabwe ......................................................................................................4.74 62.34 40 Indonesia........................................................................................................ 4.64 59.72 41 Saudi Arabia ..................................................................................................4.60 58.62 42 Spain ..................................................................................................................4.58 58.17 43 Azerbaijan .......................................................................................................4.58 58.06 44 China ..................................................................................................................4.54 57.11 45 Botswana ........................................................................................................4.54 57.10 46 Trinidad and Tobago ...............................................................................4.54 57.10 47 Slovakia ............................................................................................................4.52 56.64 48 Kenya .................................................................................................................4.52 56.42 49 Thailand ...........................................................................................................4.51 56.38 50 Eswatini ............................................................................................................4.51 56.15 51 Latvia .................................................................................................................4.50 55.95 52 Mauritius ..........................................................................................................4.48 55.41 53 Bhutan...............................................................................................................4.46 55.07 54 Sri Lanka ...........................................................................................................4.46 54.93 55 Namibia ............................................................................................................4.43 54.21 56 Nigeria ...............................................................................................................4.42 53.93 57 Brazil ...................................................................................................................4.40 53.56 58 Argentina ........................................................................................................4.40 53.40 59 Portugal ...........................................................................................................4.37 52.67 60 Korea, Rep. ......................................................................................................4.36 52.28 61 Guatemala ......................................................................................................4.32 51.49 62 Slovenia ............................................................................................................4.31 51.20 63 Armenia............................................................................................................4.26 49.86 64 Uruguay ...........................................................................................................4.26 49.78 65 Morocco ...........................................................................................................4.23 48.99 66 Mexico ..............................................................................................................4.23 48.98
Rank Country Value Score 67 South Africa ...................................................................................................4.20 48.20 68 Georgia ............................................................................................................. 4.19 48.12 69 Panama ............................................................................................................. 4.19 47.88 70 Albania .............................................................................................................. 4.18 47.62 71 Honduras ........................................................................................................ 4.17 47.60 72 Poland ............................................................................................................... 4.13 46.57 73 Liberia ................................................................................................................ 4.13 46.43 74 Turkey ................................................................................................................ 4.13 46.36 75 Venezuela, Bolivarian Rep. ................................................................... 4.10 45.72 76 Tanzania, United Rep. ............................................................................. 4.10 45.65 77 Colombia ......................................................................................................... 4.10 45.57 78 Brunei Darussalam ....................................................................................4.08 45.21 79 Malawi ...............................................................................................................4.08 45.07 80 Peru .....................................................................................................................4.06 44.75 81 Egypt ..................................................................................................................4.05 44.38 82 Côte d’Ivoire ..................................................................................................4.00 43.09 83 Greece ...............................................................................................................4.00 42.99 84 Uganda .............................................................................................................3.96 42.17 85 Jordan................................................................................................................3.96 42.06 86 Mongolia .........................................................................................................3.93 41.34 87 Tunisia................................................................................................................3.93 41.18 88 Montenegro ..................................................................................................3.92 40.90 89 Bangladesh ....................................................................................................3.91 40.70 90 Dominican Republic ................................................................................3.89 40.38 91 Lao PDR ............................................................................................................3.89 40.17 92 Russian Federation ...................................................................................3.88 40.09 93 Pakistan ............................................................................................................3.85 39.25 94 Hungary ...........................................................................................................3.81 38.17 95 Zambia ..............................................................................................................3.80 38.00 96 Cambodia .......................................................................................................3.79 37.59 97 Italy ......................................................................................................................3.75 36.57 98 Cyprus ...............................................................................................................3.73 36.22 99 Kazakhstan .....................................................................................................3.72 35.84 100 Moldova, Rep. ..............................................................................................3.66 34.23 101 Senegal .............................................................................................................3.62 33.20 102 Cabo Verde ....................................................................................................3.62 33.19 103 Romania ...........................................................................................................3.60 32.87 104 Madagascar ...................................................................................................3.60 32.78 105 Kuwait ...............................................................................................................3.58 32.35 106 Ukraine .............................................................................................................3.58 32.13 107 Ethiopia ............................................................................................................3.57 32.07 108 El Salvador ......................................................................................................3.55 31.50 109 Bulgaria.............................................................................................................3.53 30.85 110 Nepal ..................................................................................................................3.49 29.96 111 Cameroon .......................................................................................................3.49 29.91 112 Paraguay ..........................................................................................................3.47 29.44 113 Burundi .............................................................................................................3.46 29.16 114 Ecuador ............................................................................................................3.45 28.80 115 Nicaragua ........................................................................................................3.43 28.42 116 North Macedonia ......................................................................................3.42 28.18 117 Tajikistan ..........................................................................................................3.42 28.12 118 Serbia .................................................................................................................3.42 28.11 119 Mali ......................................................................................................................3.39 27.25 120 Viet Nam ..........................................................................................................3.37 26.84 121 Croatia ...............................................................................................................3.36 26.46 122 Lesotho.............................................................................................................3.34 26.01 123 Bolivia, Plurinational St. ..........................................................................3.26 24.07 124 Kyrgyzstan ......................................................................................................3.25 23.60 125 Iran, Islamic Rep. .........................................................................................3.23 23.14 126 Congo, Dem. Rep. .....................................................................................3.22 23.03 127 Bosnia and Herzegovina ....................................................................... 3.12 20.46 128 Mozambique ................................................................................................ 3.12 20.31 129 Burkina Faso ..................................................................................................2.96 16.14 130 Algeria ...............................................................................................................2.95 15.97 131 Yemen ...............................................................................................................2.46 3.30 132 Angola...............................................................................................................2.33 0.00
SOURCE: World Economic Forum, Executive Opinion Survey 2017–2018 (http://reports.weforum.org)For some countries, the latest year for which data are available may differ from the year that appears at the top of the page. The cut-off year is 2008.

THE GLOBAL TALENT COMPETITIVENESS INDEX 2020 281
DATA TABLESDATA TABLES
1.3.5 Relationship of pay to productivity
Average answer to the question: In your country, to what extent is pay related to employee productivity? [1 = not at all; 7 = to a great extent] | 2018
Rank Country Value Score 1 United States of America......................................................................5.75 100.00 2 Switzerland ....................................................................................................5.59 95.38 3 Singapore........................................................................................................5.45 91.59 4 Malaysia ............................................................................................................5.30 87.37 5 Germany ..........................................................................................................5.27 86.43 6 United Arab Emirates ..............................................................................5.21 84.76 7 Canada ..............................................................................................................4.99 78.61 8 Denmark ..........................................................................................................4.96 77.95 9 Qatar ...................................................................................................................4.93 77.15 10 Philippines ......................................................................................................4.93 76.92 11 Ireland ...............................................................................................................4.90 76.05 12 Netherlands ...................................................................................................4.85 74.91 13 United Kingdom ....................................................................................... 4.84 74.58 14 Azerbaijan .......................................................................................................4.81 73.56 15 Korea, Rep. ......................................................................................................4.80 73.45 16 New Zealand ................................................................................................4.75 71.92 17 Indonesia.........................................................................................................4.74 71.76 18 Bahrain ..............................................................................................................4.71 70.93 19 Luxembourg .................................................................................................4.70 70.48 20 Estonia ..............................................................................................................4.67 69.81 21 Israel ...................................................................................................................4.67 69.64 22 India ....................................................................................................................4.66 69.40 23 Saudi Arabia ................................................................................................. 4.64 69.01 24 Finland ............................................................................................................. 4.64 68.82 25 Iceland ..............................................................................................................4.63 68.69 26 China ..................................................................................................................4.63 68.62 27 Austria ...............................................................................................................4.59 67.55 28 Australia ...........................................................................................................4.59 67.49 29 Sweden ............................................................................................................4.57 66.95 30 Tajikistan ..........................................................................................................4.53 65.85 31 Japan ..................................................................................................................4.53 65.84 32 Czech Republic ...........................................................................................4.53 65.77 33 Norway .............................................................................................................4.53 65.73 34 Thailand ...........................................................................................................4.52 65.62 35 Russian Federation ...................................................................................4.46 63.88 36 Albania ..............................................................................................................4.46 63.88 37 Kenya .................................................................................................................4.46 63.79 38 Lithuania ..........................................................................................................4.45 63.53 39 Oman ................................................................................................................ 4.44 63.18 40 Gambia .............................................................................................................4.43 63.06 41 Malta ..................................................................................................................4.41 62.49 42 Chile ....................................................................................................................4.41 62.41 43 Belgium ............................................................................................................4.41 62.32 44 Latvia .................................................................................................................4.37 61.34 45 Bhutan...............................................................................................................4.30 59.41 46 Slovakia ............................................................................................................4.30 59.40 47 Kazakhstan .....................................................................................................4.25 58.01 48 Lao PDR ............................................................................................................4.25 58.00 49 Jordan................................................................................................................4.22 57.21 50 Costa Rica .......................................................................................................4.22 57.18 51 Ukraine .............................................................................................................4.20 56.49 52 Kyrgyzstan ...................................................................................................... 4.17 55.63 53 Cambodia ....................................................................................................... 4.13 54.55 54 Poland ............................................................................................................... 4.12 54.41 55 Armenia.............................................................................................................4.11 54.13 56 Rwanda ............................................................................................................4.09 53.40 57 Serbia .................................................................................................................4.08 53.28 58 Ghana ................................................................................................................4.08 53.22 59 Pakistan ........................................................................................................... 4.04 52.04 60 Slovenia ............................................................................................................3.98 50.37 61 Guatemala ......................................................................................................3.97 50.19 62 Namibia ............................................................................................................3.97 50.00 63 Viet Nam ..........................................................................................................3.94 49.42 64 Portugal ...........................................................................................................3.94 49.24 65 France ................................................................................................................3.93 49.01 66 Mauritius ..........................................................................................................3.93 48.96
Rank Country Value Score 67 Montenegro ..................................................................................................3.93 48.95 68 Moldova, Rep. ..............................................................................................3.91 48.56 69 Trinidad and Tobago ...............................................................................3.88 47.73 70 Cyprus .............................................................................................................. 3.84 46.46 71 Honduras ....................................................................................................... 3.84 46.42 72 Egypt ..................................................................................................................3.83 46.16 73 Sri Lanka ...........................................................................................................3.82 45.92 74 Brunei Darussalam ....................................................................................3.81 45.60 75 Bangladesh ....................................................................................................3.81 45.56 76 Ethiopia ............................................................................................................3.80 45.30 77 Eswatini ............................................................................................................3.77 44.44 78 Bulgaria.............................................................................................................3.74 43.57 79 Mexico ..............................................................................................................3.71 42.77 80 Jamaica .............................................................................................................3.69 42.40 81 Kuwait ...............................................................................................................3.68 42.13 82 Georgia .............................................................................................................3.68 41.96 83 Liberia ................................................................................................................3.67 41.77 84 Morocco .......................................................................................................... 3.64 41.02 85 Nigeria .............................................................................................................. 3.64 40.94 86 North Macedonia ..................................................................................... 3.64 40.78 87 Ecuador ............................................................................................................3.63 40.53 88 South Africa ...................................................................................................3.61 40.06 89 Zambia ..............................................................................................................3.56 38.74 90 Hungary ...........................................................................................................3.56 38.67 91 Mongolia .........................................................................................................3.56 38.61 92 Turkey ................................................................................................................3.55 38.40 93 Peru .....................................................................................................................3.55 38.36 94 Colombia .........................................................................................................3.55 38.29 95 Dominican Republic ................................................................................3.54 37.98 96 Malawi ...............................................................................................................3.53 37.93 97 Botswana ........................................................................................................3.51 37.26 98 Tanzania, United Rep. .............................................................................3.49 36.75 99 Spain ..................................................................................................................3.49 36.62 100 Cabo Verde ....................................................................................................3.48 36.50 101 Uganda .............................................................................................................3.48 36.42 102 Iran, Islamic Rep. .........................................................................................3.48 36.38 103 Nepal ..................................................................................................................3.46 35.90 104 Lesotho.............................................................................................................3.45 35.70 105 Romania ...........................................................................................................3.45 35.46 106 Algeria .............................................................................................................. 3.44 35.33 107 Mali ......................................................................................................................3.43 35.08 108 Greece ...............................................................................................................3.43 35.05 109 Senegal .............................................................................................................3.37 33.46 110 Brazil ...................................................................................................................3.37 33.33 111 Croatia ...............................................................................................................3.34 32.58 112 Paraguay ..........................................................................................................3.34 32.56 113 Argentina ........................................................................................................3.33 32.24 114 Madagascar ...................................................................................................3.31 31.60 115 Nicaragua ........................................................................................................3.31 31.57 116 Uruguay ...........................................................................................................3.30 31.46 117 Côte d’Ivoire ..................................................................................................3.28 30.67 118 Panama .............................................................................................................3.27 30.56 119 Cameroon .......................................................................................................3.26 30.29 120 Zimbabwe ......................................................................................................3.24 29.57 121 Tunisia................................................................................................................3.21 28.78 122 Yemen ............................................................................................................... 3.14 26.86 123 El Salvador ...................................................................................................... 3.12 26.20 124 Italy ...................................................................................................................... 3.10 25.81 125 Burundi ............................................................................................................ 3.04 24.03 126 Bosnia and Herzegovina .......................................................................3.02 23.57 127 Bolivia, Plurinational St. ..........................................................................2.78 16.92 128 Burkina Faso ..................................................................................................2.77 16.65 129 Mozambique ................................................................................................2.76 16.25 130 Congo, Dem. Rep. .................................................................................... 2.44 7.15 131 Angola...............................................................................................................2.35 4.62 132 Venezuela, Bolivarian Rep. ................................................................... 2.18 0.00
SOURCE: World Economic Forum, Executive Opinion Survey 2017–2018 (http://reports.weforum.org)For some countries, the latest year for which data are available may differ from the year that appears at the top of the page. The cut-off year is 2008.

282 THE GLOBAL TALENT COMPETITIVENESS INDEX 2020
DATA TABLESDATA TABLES
1.3.6 Technology utilisation
Average answer to the question: In your country, to what extent do businesses adopt the latest technologies? [1 = not at all; 7 = to a great extent] | 2018
Rank Country Value Score 1 United States of America......................................................................6.01 100.00 2 Sweden ............................................................................................................5.97 98.63 3 Switzerland ....................................................................................................5.89 96.15 4 Iceland ..............................................................................................................5.89 96.05 5 Israel ...................................................................................................................5.88 95.65 6 Finland ..............................................................................................................5.82 93.73 7 Netherlands ...................................................................................................5.77 92.40 8 Denmark ..........................................................................................................5.75 91.77 9 Luxembourg .................................................................................................5.66 88.90 10 Germany ..........................................................................................................5.58 86.41 11 Japan ..................................................................................................................5.58 86.16 12 Singapore........................................................................................................5.54 85.04 13 United Kingdom ........................................................................................5.51 84.12 14 Malaysia ............................................................................................................5.51 84.09 15 Norway .............................................................................................................5.46 82.39 16 New Zealand ................................................................................................5.37 79.62 17 Ireland ...............................................................................................................5.35 79.12 18 United Arab Emirates ..............................................................................5.35 78.92 19 Lithuania ..........................................................................................................5.32 78.08 20 Austria ...............................................................................................................5.29 77.21 21 Korea, Rep. ......................................................................................................5.28 76.83 22 Canada ..............................................................................................................5.28 76.74 23 Estonia ..............................................................................................................5.28 76.64 24 Portugal ...........................................................................................................5.26 76.21 25 Australia ...........................................................................................................5.25 75.91 26 Saudi Arabia ..................................................................................................5.25 75.86 27 France ................................................................................................................ 5.19 73.86 28 Belgium ............................................................................................................ 5.18 73.73 29 Indonesia......................................................................................................... 5.18 73.64 30 Malta .................................................................................................................. 5.15 72.70 31 Bahrain ..............................................................................................................5.08 70.44 32 Kenya .................................................................................................................5.07 70.07 33 Qatar ...................................................................................................................5.06 69.73 34 Czech Republic ...........................................................................................4.99 67.76 35 Latvia .................................................................................................................4.99 67.45 36 Guatemala ......................................................................................................4.97 66.96 37 Chile ....................................................................................................................4.97 66.95 38 Slovakia ............................................................................................................4.94 65.97 39 Philippines ......................................................................................................4.93 65.86 40 Slovenia ............................................................................................................4.92 65.55 41 Costa Rica .......................................................................................................4.92 65.53 42 South Africa ...................................................................................................4.91 65.15 43 Senegal .............................................................................................................4.91 65.02 44 Azerbaijan .......................................................................................................4.88 64.06 45 Jordan................................................................................................................4.88 64.02 46 Thailand ...........................................................................................................4.85 63.17 47 Spain ..................................................................................................................4.82 62.27 48 Oman .................................................................................................................4.78 61.08 49 Panama .............................................................................................................4.75 59.96 50 India ....................................................................................................................4.74 59.61 51 Cyprus ...............................................................................................................4.70 58.34 52 Mexico ..............................................................................................................4.69 58.16 53 Mauritius ..........................................................................................................4.68 57.67 54 Côte d’Ivoire ..................................................................................................4.62 56.04 55 Honduras ........................................................................................................4.62 55.87 56 China ..................................................................................................................4.56 54.03 57 Brazil ...................................................................................................................4.54 53.43 58 Jamaica .............................................................................................................4.54 53.41 59 Italy ......................................................................................................................4.54 53.33 60 Morocco ...........................................................................................................4.53 53.23 61 Poland ...............................................................................................................4.53 53.14 62 Russian Federation ...................................................................................4.53 52.97 63 Rwanda ............................................................................................................4.52 52.91 64 Kuwait ...............................................................................................................4.52 52.84 65 Turkey ................................................................................................................4.49 51.73 66 Gambia .............................................................................................................4.48 51.64
Rank Country Value Score 67 Dominican Republic ................................................................................4.43 50.03 68 Hungary ...........................................................................................................4.40 48.83 69 Armenia............................................................................................................4.39 48.58 70 Bulgaria.............................................................................................................4.39 48.58 71 Uruguay ...........................................................................................................4.37 48.11 72 Pakistan ............................................................................................................4.32 46.59 73 Namibia ............................................................................................................4.32 46.50 74 Ecuador ............................................................................................................4.32 46.44 75 Montenegro ..................................................................................................4.32 46.36 76 Brunei Darussalam ....................................................................................4.31 46.25 77 Trinidad and Tobago ...............................................................................4.31 46.17 78 Egypt ..................................................................................................................4.31 46.09 79 Colombia .........................................................................................................4.30 45.74 80 Bangladesh ....................................................................................................4.29 45.43 81 Albania ..............................................................................................................4.27 44.87 82 Croatia ...............................................................................................................4.27 44.79 83 Madagascar ...................................................................................................4.25 44.29 84 Greece ...............................................................................................................4.25 44.22 85 Ghana ................................................................................................................4.24 44.06 86 Argentina ........................................................................................................4.24 44.03 87 Kazakhstan .....................................................................................................4.23 43.48 88 Mongolia .........................................................................................................4.23 43.44 89 Cabo Verde ....................................................................................................4.22 43.37 90 Nigeria ............................................................................................................... 4.19 42.41 91 Ukraine ............................................................................................................. 4.19 42.28 92 Tajikistan .......................................................................................................... 4.17 41.59 93 Sri Lanka ........................................................................................................... 4.15 41.21 94 Cambodia ....................................................................................................... 4.15 41.07 95 Peru ..................................................................................................................... 4.15 40.97 96 Bhutan............................................................................................................... 4.14 40.89 97 Lao PDR ............................................................................................................ 4.12 40.00 98 Serbia ..................................................................................................................4.11 39.74 99 Tanzania, United Rep. .............................................................................4.09 39.07 100 Paraguay ..........................................................................................................4.08 38.89 101 Moldova, Rep. ..............................................................................................4.07 38.40 102 Viet Nam ..........................................................................................................4.05 38.03 103 Romania .......................................................................................................... 4.04 37.49 104 Botswana ........................................................................................................4.02 36.97 105 Bosnia and Herzegovina .......................................................................4.02 36.85 106 Georgia .............................................................................................................4.01 36.65 107 Tunisia................................................................................................................3.99 36.16 108 El Salvador ......................................................................................................3.99 35.90 109 Uganda .............................................................................................................3.97 35.29 110 Mali ......................................................................................................................3.93 34.26 111 North Macedonia ......................................................................................3.90 33.16 112 Cameroon .......................................................................................................3.86 31.79 113 Zambia ..............................................................................................................3.85 31.59 114 Nicaragua ....................................................................................................... 3.84 31.29 115 Zimbabwe ......................................................................................................3.74 28.02 116 Mozambique ................................................................................................3.72 27.61 117 Iran, Islamic Rep. .........................................................................................3.72 27.54 118 Algeria ...............................................................................................................3.68 26.37 119 Burkina Faso ..................................................................................................3.67 25.79 120 Nepal ..................................................................................................................3.66 25.63 121 Bolivia, Plurinational St. ..........................................................................3.62 24.40 122 Eswatini ............................................................................................................3.59 23.43 123 Venezuela, Bolivarian Rep. ...................................................................3.48 19.85 124 Malawi ...............................................................................................................3.39 17.15 125 Kyrgyzstan ......................................................................................................3.37 16.39 126 Ethiopia ............................................................................................................3.29 13.80 127 Congo, Dem. Rep. .....................................................................................3.27 13.38 128 Liberia ................................................................................................................3.25 12.64 129 Angola...............................................................................................................3.07 6.84 130 Lesotho.............................................................................................................2.94 2.77 131 Burundi .............................................................................................................2.90 1.54 132 Yemen ...............................................................................................................2.85 0.00
SOURCE: World Economic Forum, Executive Opinion Survey 2017–2018 (http://reports.weforum.org)For some countries, the latest year for which data are available may differ from the year that appears at the top of the page. The cut-off year is 2008.
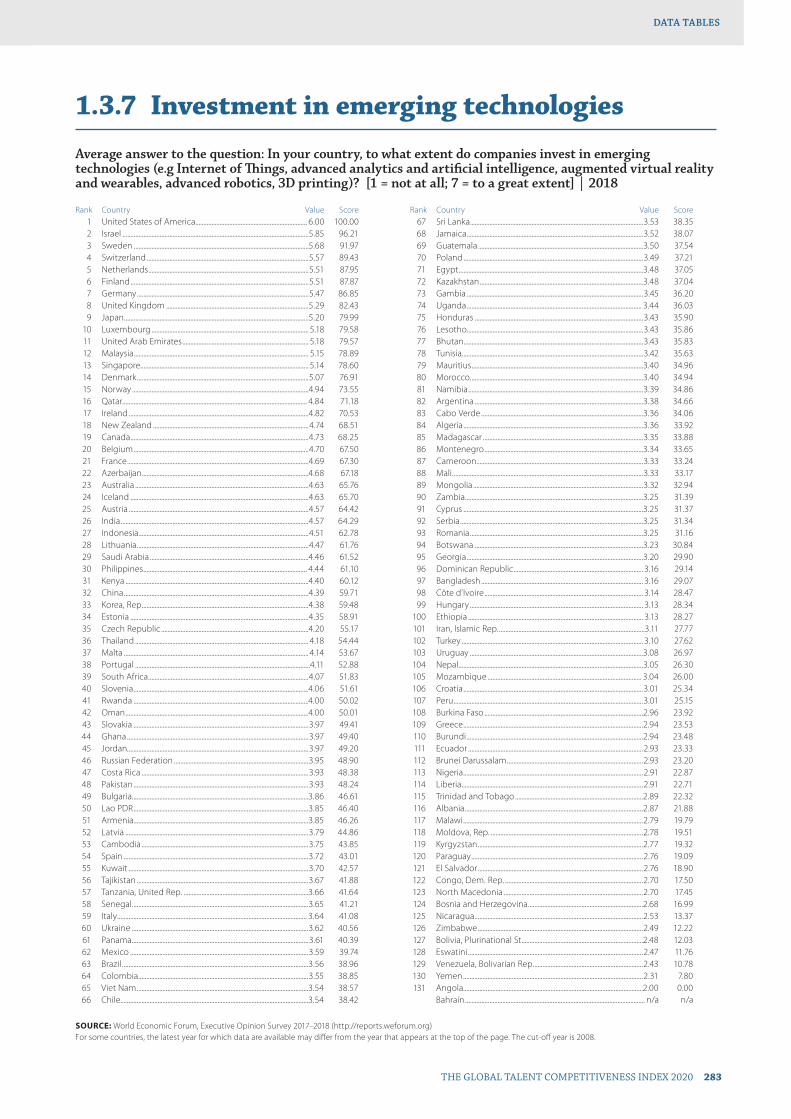
THE GLOBAL TALENT COMPETITIVENESS INDEX 2020 283
DATA TABLESDATA TABLES
1.3.7 Investment in emerging technologies
Average answer to the question: In your country, to what extent do companies invest in emerging technologies (e.g Internet of Things, advanced analytics and artificial intelligence, augmented virtual reality and wearables, advanced robotics, 3D printing)? [1 = not at all; 7 = to a great extent] | 2018
Rank Country Value Score 1 United States of America..................................................................... 6.00 100.00 2 Israel ...................................................................................................................5.85 96.21 3 Sweden ............................................................................................................5.68 91.97 4 Switzerland ....................................................................................................5.57 89.43 5 Netherlands ...................................................................................................5.51 87.95 6 Finland ..............................................................................................................5.51 87.87 7 Germany ..........................................................................................................5.47 86.85 8 United Kingdom ........................................................................................5.29 82.43 9 Japan ..................................................................................................................5.20 79.99 10 Luxembourg ................................................................................................. 5.18 79.58 11 United Arab Emirates .............................................................................. 5.18 79.57 12 Malaysia ............................................................................................................ 5.15 78.89 13 Singapore........................................................................................................ 5.14 78.60 14 Denmark ..........................................................................................................5.07 76.91 15 Norway .............................................................................................................4.94 73.55 16 Qatar .................................................................................................................. 4.84 71.18 17 Ireland ...............................................................................................................4.82 70.53 18 New Zealand ................................................................................................4.74 68.51 19 Canada ..............................................................................................................4.73 68.25 20 Belgium ............................................................................................................4.70 67.50 21 France ................................................................................................................4.69 67.30 22 Azerbaijan .......................................................................................................4.68 67.18 23 Australia ...........................................................................................................4.63 65.76 24 Iceland ..............................................................................................................4.63 65.70 25 Austria ...............................................................................................................4.57 64.42 26 India ....................................................................................................................4.57 64.29 27 Indonesia.........................................................................................................4.51 62.78 28 Lithuania ..........................................................................................................4.47 61.76 29 Saudi Arabia ..................................................................................................4.46 61.52 30 Philippines ..................................................................................................... 4.44 61.10 31 Kenya .................................................................................................................4.40 60.12 32 China ..................................................................................................................4.39 59.71 33 Korea, Rep. ......................................................................................................4.38 59.48 34 Estonia ..............................................................................................................4.35 58.91 35 Czech Republic ...........................................................................................4.20 55.17 36 Thailand ........................................................................................................... 4.18 54.44 37 Malta .................................................................................................................. 4.14 53.67 38 Portugal ............................................................................................................4.11 52.88 39 South Africa ...................................................................................................4.07 51.83 40 Slovenia ............................................................................................................4.06 51.61 41 Rwanda ............................................................................................................4.00 50.02 42 Oman .................................................................................................................4.00 50.01 43 Slovakia ............................................................................................................3.97 49.41 44 Ghana ................................................................................................................3.97 49.40 45 Jordan................................................................................................................3.97 49.20 46 Russian Federation ...................................................................................3.95 48.90 47 Costa Rica .......................................................................................................3.93 48.38 48 Pakistan ............................................................................................................3.93 48.24 49 Bulgaria.............................................................................................................3.86 46.61 50 Lao PDR ............................................................................................................3.85 46.40 51 Armenia............................................................................................................3.85 46.26 52 Latvia .................................................................................................................3.79 44.86 53 Cambodia .......................................................................................................3.75 43.85 54 Spain ..................................................................................................................3.72 43.01 55 Kuwait ...............................................................................................................3.70 42.57 56 Tajikistan ..........................................................................................................3.67 41.88 57 Tanzania, United Rep. .............................................................................3.66 41.64 58 Senegal .............................................................................................................3.65 41.21 59 Italy ..................................................................................................................... 3.64 41.08 60 Ukraine .............................................................................................................3.62 40.56 61 Panama .............................................................................................................3.61 40.39 62 Mexico ..............................................................................................................3.59 39.74 63 Brazil ...................................................................................................................3.56 38.96 64 Colombia .........................................................................................................3.55 38.85 65 Viet Nam ..........................................................................................................3.54 38.57 66 Chile ....................................................................................................................3.54 38.42
Rank Country Value Score 67 Sri Lanka ...........................................................................................................3.53 38.35 68 Jamaica .............................................................................................................3.52 38.07 69 Guatemala ......................................................................................................3.50 37.54 70 Poland ...............................................................................................................3.49 37.21 71 Egypt ..................................................................................................................3.48 37.05 72 Kazakhstan .....................................................................................................3.48 37.04 73 Gambia .............................................................................................................3.45 36.20 74 Uganda ............................................................................................................ 3.44 36.03 75 Honduras ........................................................................................................3.43 35.90 76 Lesotho.............................................................................................................3.43 35.86 77 Bhutan...............................................................................................................3.43 35.83 78 Tunisia................................................................................................................3.42 35.63 79 Mauritius ..........................................................................................................3.40 34.96 80 Morocco ...........................................................................................................3.40 34.94 81 Namibia ............................................................................................................3.39 34.86 82 Argentina ........................................................................................................3.38 34.66 83 Cabo Verde ....................................................................................................3.36 34.06 84 Algeria ...............................................................................................................3.36 33.92 85 Madagascar ...................................................................................................3.35 33.88 86 Montenegro ..................................................................................................3.34 33.65 87 Cameroon .......................................................................................................3.33 33.24 88 Mali ......................................................................................................................3.33 33.17 89 Mongolia .........................................................................................................3.32 32.94 90 Zambia ..............................................................................................................3.25 31.39 91 Cyprus ...............................................................................................................3.25 31.37 92 Serbia .................................................................................................................3.25 31.34 93 Romania ...........................................................................................................3.25 31.16 94 Botswana ........................................................................................................3.23 30.84 95 Georgia .............................................................................................................3.20 29.90 96 Dominican Republic ................................................................................ 3.16 29.14 97 Bangladesh .................................................................................................... 3.16 29.07 98 Côte d’Ivoire .................................................................................................. 3.14 28.47 99 Hungary ........................................................................................................... 3.13 28.34 100 Ethiopia ............................................................................................................ 3.13 28.27 101 Iran, Islamic Rep. ..........................................................................................3.11 27.77 102 Turkey ................................................................................................................ 3.10 27.62 103 Uruguay ...........................................................................................................3.08 26.97 104 Nepal ..................................................................................................................3.05 26.30 105 Mozambique ............................................................................................... 3.04 26.00 106 Croatia ...............................................................................................................3.01 25.34 107 Peru .....................................................................................................................3.01 25.15 108 Burkina Faso ..................................................................................................2.96 23.92 109 Greece ...............................................................................................................2.94 23.53 110 Burundi .............................................................................................................2.94 23.48 111 Ecuador ............................................................................................................2.93 23.33 112 Brunei Darussalam ....................................................................................2.93 23.20 113 Nigeria ...............................................................................................................2.91 22.87 114 Liberia ................................................................................................................2.91 22.71 115 Trinidad and Tobago ...............................................................................2.89 22.32 116 Albania ..............................................................................................................2.87 21.88 117 Malawi ...............................................................................................................2.79 19.79 118 Moldova, Rep. ..............................................................................................2.78 19.51 119 Kyrgyzstan ......................................................................................................2.77 19.32 120 Paraguay ..........................................................................................................2.76 19.09 121 El Salvador ......................................................................................................2.76 18.90 122 Congo, Dem. Rep. .....................................................................................2.70 17.50 123 North Macedonia ......................................................................................2.70 17.45 124 Bosnia and Herzegovina .......................................................................2.68 16.99 125 Nicaragua ........................................................................................................2.53 13.37 126 Zimbabwe ......................................................................................................2.49 12.22 127 Bolivia, Plurinational St. ..........................................................................2.48 12.03 128 Eswatini ............................................................................................................2.47 11.76 129 Venezuela, Bolivarian Rep. ...................................................................2.43 10.78 130 Yemen ...............................................................................................................2.31 7.80 131 Angola...............................................................................................................2.00 0.00 Bahrain ............................................................................................................... n/a n/a
SOURCE: World Economic Forum, Executive Opinion Survey 2017–2018 (http://reports.weforum.org)For some countries, the latest year for which data are available may differ from the year that appears at the top of the page. The cut-off year is 2008.
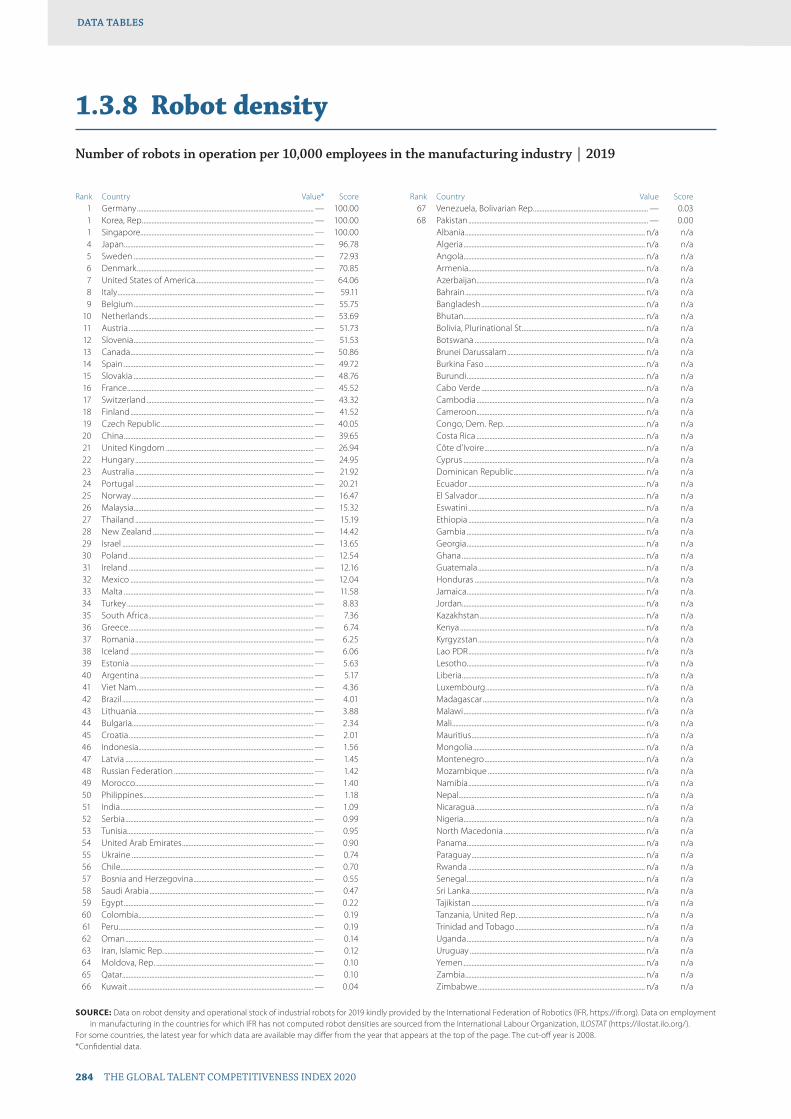
DATA TABLESDATA TABLES
284 THE GLOBAL TALENT COMPETITIVENESS INDEX 2020
DATA TABLESDATA TABLES
1.3.8 Robot density
Number of robots in operation per 10,000 employees in the manufacturing industry | 2019
Rank Country Value* Score 1 Germany ............................................................................................................. — 100.00 1 Korea, Rep. ......................................................................................................... — 100.00 1 Singapore........................................................................................................... — 100.00 4 Japan ..................................................................................................................... — 96.78 5 Sweden ............................................................................................................... — 72.93 6 Denmark ............................................................................................................. — 70.85 7 United States of America......................................................................... — 64.06 8 Italy ......................................................................................................................... — 59.11 9 Belgium ............................................................................................................... — 55.75 10 Netherlands ...................................................................................................... — 53.69 11 Austria .................................................................................................................. — 51.73 12 Slovenia ............................................................................................................... — 51.53 13 Canada ................................................................................................................. — 50.86 14 Spain ..................................................................................................................... — 49.72 15 Slovakia ............................................................................................................... — 48.76 16 France ................................................................................................................... — 45.52 17 Switzerland ....................................................................................................... — 43.32 18 Finland ................................................................................................................. — 41.52 19 Czech Republic .............................................................................................. — 40.05 20 China ..................................................................................................................... — 39.65 21 United Kingdom ........................................................................................... — 26.94 22 Hungary .............................................................................................................. — 24.95 23 Australia .............................................................................................................. — 21.92 24 Portugal .............................................................................................................. — 20.21 25 Norway ................................................................................................................ — 16.47 26 Malaysia ............................................................................................................... — 15.32 27 Thailand .............................................................................................................. — 15.19 28 New Zealand ................................................................................................... — 14.42 29 Israel ...................................................................................................................... — 13.65 30 Poland .................................................................................................................. — 12.54 31 Ireland .................................................................................................................. — 12.16 32 Mexico ................................................................................................................. — 12.04 33 Malta ..................................................................................................................... — 11.58 34 Turkey ................................................................................................................... — 8.83 35 South Africa ...................................................................................................... — 7.36 36 Greece .................................................................................................................. — 6.74 37 Romania .............................................................................................................. — 6.25 38 Iceland ................................................................................................................. — 6.06 39 Estonia ................................................................................................................. — 5.63 40 Argentina ........................................................................................................... — 5.17 41 Viet Nam ............................................................................................................. — 4.36 42 Brazil ...................................................................................................................... — 4.01 43 Lithuania ............................................................................................................. — 3.88 44 Bulgaria................................................................................................................ — 2.34 45 Croatia .................................................................................................................. — 2.01 46 Indonesia............................................................................................................ — 1.56 47 Latvia .................................................................................................................... — 1.45 48 Russian Federation ...................................................................................... — 1.42 49 Morocco .............................................................................................................. — 1.40 50 Philippines ......................................................................................................... — 1.18 51 India ....................................................................................................................... — 1.09 52 Serbia .................................................................................................................... — 0.99 53 Tunisia................................................................................................................... — 0.95 54 United Arab Emirates ................................................................................. — 0.90 55 Ukraine ................................................................................................................ — 0.74 56 Chile ....................................................................................................................... — 0.70 57 Bosnia and Herzegovina .......................................................................... — 0.55 58 Saudi Arabia ..................................................................................................... — 0.47 59 Egypt ..................................................................................................................... — 0.22 60 Colombia ............................................................................................................ — 0.19 61 Peru ........................................................................................................................ — 0.19 62 Oman .................................................................................................................... — 0.14 63 Iran, Islamic Rep. ............................................................................................ — 0.12 64 Moldova, Rep. ................................................................................................. — 0.10 65 Qatar ...................................................................................................................... — 0.10 66 Kuwait .................................................................................................................. — 0.04
Rank Country Value Score 67 Venezuela, Bolivarian Rep. ...................................................................... — 0.03 68 Pakistan ............................................................................................................... — 0.00 Albania ............................................................................................................... n/a n/a Algeria ................................................................................................................ n/a n/a Angola................................................................................................................ n/a n/a Armenia............................................................................................................. n/a n/a Azerbaijan ........................................................................................................ n/a n/a Bahrain ............................................................................................................... n/a n/a Bangladesh ..................................................................................................... n/a n/a Bhutan................................................................................................................ n/a n/a Bolivia, Plurinational St. ........................................................................... n/a n/a Botswana ......................................................................................................... n/a n/a Brunei Darussalam ..................................................................................... n/a n/a Burkina Faso ................................................................................................... n/a n/a Burundi .............................................................................................................. n/a n/a Cabo Verde ..................................................................................................... n/a n/a Cambodia ........................................................................................................ n/a n/a Cameroon ........................................................................................................ n/a n/a Congo, Dem. Rep. ...................................................................................... n/a n/a Costa Rica ........................................................................................................ n/a n/a Côte d’Ivoire ................................................................................................... n/a n/a Cyprus ................................................................................................................ n/a n/a Dominican Republic ................................................................................. n/a n/a Ecuador ............................................................................................................. n/a n/a El Salvador ....................................................................................................... n/a n/a Eswatini ............................................................................................................. n/a n/a Ethiopia ............................................................................................................. n/a n/a Gambia .............................................................................................................. n/a n/a Georgia .............................................................................................................. n/a n/a Ghana ................................................................................................................. n/a n/a Guatemala ....................................................................................................... n/a n/a Honduras ......................................................................................................... n/a n/a Jamaica .............................................................................................................. n/a n/a Jordan................................................................................................................. n/a n/a Kazakhstan ...................................................................................................... n/a n/a Kenya .................................................................................................................. n/a n/a Kyrgyzstan ....................................................................................................... n/a n/a Lao PDR ............................................................................................................. n/a n/a Lesotho.............................................................................................................. n/a n/a Liberia ................................................................................................................. n/a n/a Luxembourg .................................................................................................. n/a n/a Madagascar .................................................................................................... n/a n/a Malawi ................................................................................................................ n/a n/a Mali ....................................................................................................................... n/a n/a Mauritius ........................................................................................................... n/a n/a Mongolia .......................................................................................................... n/a n/a Montenegro ................................................................................................... n/a n/a Mozambique ................................................................................................. n/a n/a Namibia ............................................................................................................. n/a n/a Nepal ................................................................................................................... n/a n/a Nicaragua ......................................................................................................... n/a n/a Nigeria ................................................................................................................ n/a n/a North Macedonia ....................................................................................... n/a n/a Panama .............................................................................................................. n/a n/a Paraguay ........................................................................................................... n/a n/a Rwanda ............................................................................................................. n/a n/a Senegal .............................................................................................................. n/a n/a Sri Lanka ............................................................................................................ n/a n/a Tajikistan ........................................................................................................... n/a n/a Tanzania, United Rep. .............................................................................. n/a n/a Trinidad and Tobago ................................................................................ n/a n/a Uganda .............................................................................................................. n/a n/a Uruguay ............................................................................................................ n/a n/a Yemen ................................................................................................................ n/a n/a Zambia ............................................................................................................... n/a n/a Zimbabwe ....................................................................................................... n/a n/a
SOURCE: Data on robot density and operational stock of industrial robots for 2019 kindly provided by the International Federation of Robotics (IFR, https://ifr.org). Data on employment in manufacturing in the countries for which IFR has not computed robot densities are sourced from the International Labour Organization, ILOSTAT (https://ilostat.ilo.org/).
For some countries, the latest year for which data are available may differ from the year that appears at the top of the page. The cut-off year is 2008.*Confidential data.
THE GLOBAL TALENT COMPETITIVENESS INDEX 2020 285
DATA TABLESDATA TABLES DATA TABLESDATA TABLES
Pillar 2Attract

286 THE GLOBAL TALENT COMPETITIVENESS INDEX 2020
DATA TABLESDATA TABLES
2.1.1 FDI and technology transfer
Average answer to the question: To what extent does foreign direct investment (FDI) bring new technology into your country? [1 = not at all; 7 = to a great extent] | 2018
Rank Country Value Score 1 Ireland ............................................................................................................... 6.11 100.00 2 Singapore........................................................................................................5.94 95.97 3 United States of America......................................................................5.92 95.43 4 Luxembourg .................................................................................................5.76 91.33 5 Israel ...................................................................................................................5.65 88.72 6 United Kingdom ........................................................................................5.59 87.19 7 Malta ..................................................................................................................5.53 85.75 8 Netherlands ...................................................................................................5.51 85.23 9 Malaysia ............................................................................................................5.50 84.98 10 Sweden ............................................................................................................5.46 84.12 11 Germany ..........................................................................................................5.44 83.51 12 Switzerland ....................................................................................................5.42 83.21 13 Denmark ..........................................................................................................5.41 82.89 14 Japan ..................................................................................................................5.40 82.67 15 United Arab Emirates ..............................................................................5.35 81.39 16 Portugal ...........................................................................................................5.33 81.00 17 Slovakia ............................................................................................................5.33 80.97 18 Chile ....................................................................................................................5.25 78.89 19 New Zealand ................................................................................................5.23 78.48 20 Australia ...........................................................................................................5.20 77.79 21 Costa Rica .......................................................................................................5.20 77.71 22 Panama ............................................................................................................. 5.19 77.33 23 Belgium ............................................................................................................ 5.15 76.58 24 Lithuania ..........................................................................................................5.09 75.02 25 Mexico ..............................................................................................................5.08 74.80 26 Canada ..............................................................................................................5.08 74.71 27 Qatar ...................................................................................................................5.04 73.66 28 Albania ..............................................................................................................5.03 73.48 29 Spain ..................................................................................................................5.02 73.33 30 Azerbaijan .......................................................................................................4.99 72.44 31 Hungary ...........................................................................................................4.97 72.09 32 Finland ..............................................................................................................4.97 72.05 33 France ................................................................................................................4.95 71.67 34 Philippines ......................................................................................................4.95 71.65 35 Saudi Arabia ..................................................................................................4.95 71.49 36 Norway .............................................................................................................4.93 70.98 37 Jamaica .............................................................................................................4.92 70.73 38 Czech Republic ...........................................................................................4.90 70.25 39 Bahrain ..............................................................................................................4.87 69.65 40 Dominican Republic ............................................................................... 4.84 68.81 41 Thailand ...........................................................................................................4.80 67.84 42 Estonia ..............................................................................................................4.79 67.67 43 Uruguay ...........................................................................................................4.78 67.48 44 Indonesia.........................................................................................................4.75 66.69 45 Poland ...............................................................................................................4.74 66.28 46 Austria ...............................................................................................................4.74 66.28 47 Morocco ...........................................................................................................4.73 66.15 48 Korea, Rep. ......................................................................................................4.69 65.23 49 Honduras ........................................................................................................4.67 64.64 50 Kenya .................................................................................................................4.66 64.55 51 China ..................................................................................................................4.66 64.42 52 India ................................................................................................................... 4.64 63.84 53 Cambodia .......................................................................................................4.59 62.79 54 Gambia .............................................................................................................4.58 62.34 55 Latvia .................................................................................................................4.56 62.09 56 Montenegro ..................................................................................................4.53 61.32 57 Brazil ...................................................................................................................4.53 61.16 58 South Africa ...................................................................................................4.49 60.16 59 Jordan................................................................................................................4.49 60.14 60 Oman ................................................................................................................ 4.44 58.99 61 Slovenia ............................................................................................................4.43 58.80 62 Peru .....................................................................................................................4.42 58.52 63 Bulgaria.............................................................................................................4.42 58.46 64 Cyprus ...............................................................................................................4.36 57.07 65 Egypt ..................................................................................................................4.36 57.05 66 Iceland ..............................................................................................................4.34 56.48
Rank Country Value Score 67 Colombia .........................................................................................................4.34 56.46 68 Guatemala ......................................................................................................4.33 56.20 69 Mauritius ..........................................................................................................4.32 56.16 70 Trinidad and Tobago ...............................................................................4.32 56.14 71 Senegal .............................................................................................................4.29 55.23 72 Turkey ................................................................................................................4.26 54.51 73 Pakistan ............................................................................................................4.24 54.17 74 Rwanda ............................................................................................................4.24 54.15 75 Namibia ............................................................................................................4.24 54.09 76 Ghana ................................................................................................................4.24 54.06 77 Côte d’Ivoire ..................................................................................................4.23 53.74 78 Cabo Verde ....................................................................................................4.21 53.26 79 Brunei Darussalam .................................................................................... 4.18 52.68 80 Italy ...................................................................................................................... 4.17 52.30 81 Nicaragua ........................................................................................................ 4.16 52.07 82 Uganda ............................................................................................................. 4.14 51.76 83 Armenia............................................................................................................ 4.14 51.72 84 Lao PDR ............................................................................................................ 4.12 51.24 85 Serbia ..................................................................................................................4.11 50.95 86 Romania ........................................................................................................... 4.10 50.58 87 Zambia ..............................................................................................................4.07 50.02 88 Tunisia................................................................................................................4.02 48.78 89 Georgia .............................................................................................................4.02 48.64 90 Tanzania, United Rep. .............................................................................4.02 48.61 91 Viet Nam ..........................................................................................................4.00 48.29 92 Nigeria ...............................................................................................................3.97 47.57 93 Moldova, Rep. ..............................................................................................3.97 47.39 94 Iran, Islamic Rep. .........................................................................................3.96 47.28 95 Madagascar ...................................................................................................3.95 46.90 96 Tajikistan ..........................................................................................................3.95 46.89 97 Mozambique ................................................................................................3.90 45.77 98 Kazakhstan .....................................................................................................3.90 45.77 99 Paraguay ..........................................................................................................3.89 45.61 100 Bangladesh ....................................................................................................3.85 44.51 101 Russian Federation .................................................................................. 3.84 44.38 102 Kuwait ...............................................................................................................3.82 43.76 103 Mongolia .........................................................................................................3.80 43.29 104 Botswana ........................................................................................................3.79 42.99 105 Sri Lanka ...........................................................................................................3.77 42.54 106 Argentina ........................................................................................................3.74 41.79 107 Burkina Faso ..................................................................................................3.71 41.08 108 Bhutan...............................................................................................................3.70 40.76 109 Greece ...............................................................................................................3.66 39.85 110 Mali ......................................................................................................................3.65 39.53 111 Croatia ...............................................................................................................3.63 39.20 112 Ethiopia ............................................................................................................3.63 39.09 113 Cameroon .......................................................................................................3.59 38.05 114 Algeria ...............................................................................................................3.58 37.96 115 Bosnia and Herzegovina .......................................................................3.58 37.96 116 North Macedonia ......................................................................................3.56 37.49 117 El Salvador ......................................................................................................3.54 36.83 118 Ecuador ............................................................................................................3.52 36.46 119 Ukraine .............................................................................................................3.51 36.29 120 Congo, Dem. Rep. .....................................................................................3.46 34.92 121 Liberia ............................................................................................................... 3.44 34.36 122 Eswatini ............................................................................................................3.39 33.23 123 Nepal ..................................................................................................................3.35 32.35 124 Malawi ...............................................................................................................3.35 32.22 125 Angola...............................................................................................................3.33 31.76 126 Burundi .............................................................................................................3.30 30.91 127 Bolivia, Plurinational St. ..........................................................................3.27 30.39 128 Kyrgyzstan ......................................................................................................2.89 20.95 129 Zimbabwe ..................................................................................................... 2.84 19.79 130 Lesotho.............................................................................................................2.81 18.96 131 Venezuela, Bolivarian Rep. ...................................................................2.43 9.64 132 Yemen .............................................................................................................. 2.04 0.00
SOURCE: World Economic Forum, Executive Opinion Survey 2017–2018 (http://reports.weforum.org)For some countries, the latest year for which data are available may differ from the year that appears at the top of the page. The cut-off year is 2008.
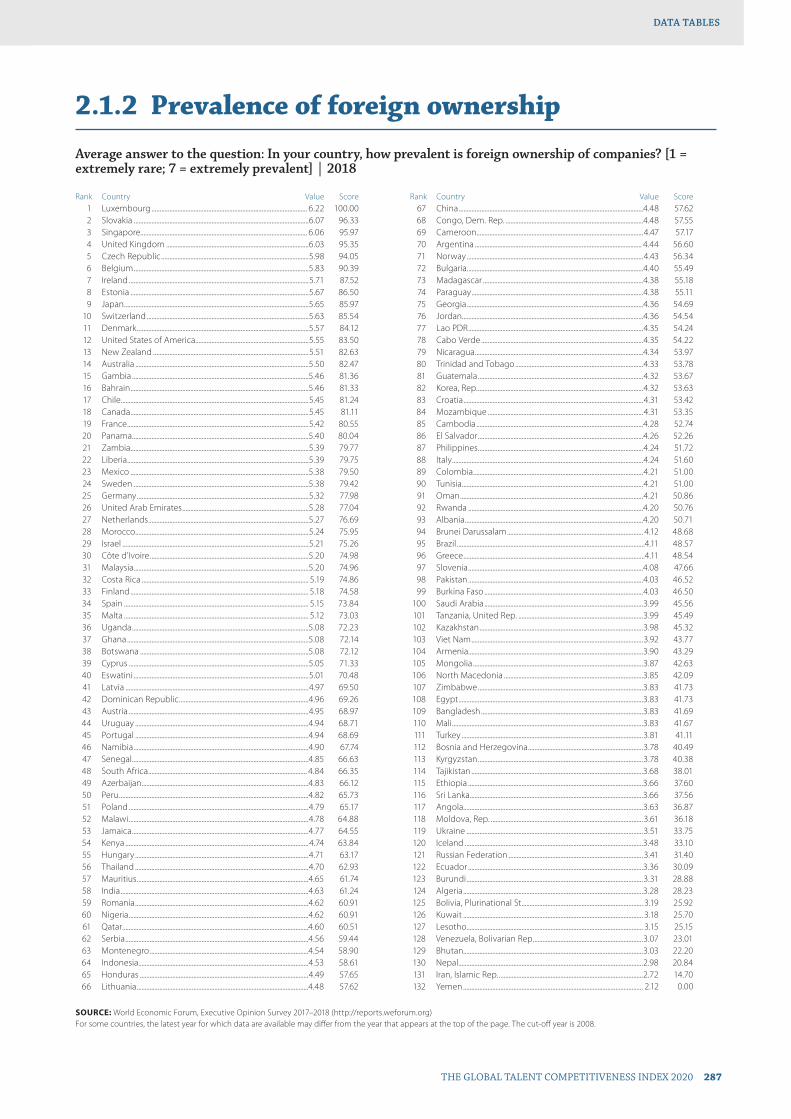
THE GLOBAL TALENT COMPETITIVENESS INDEX 2020 287
DATA TABLESDATA TABLES
2.1.2 Prevalence of foreign ownership
Average answer to the question: In your country, how prevalent is foreign ownership of companies? [1 = extremely rare; 7 = extremely prevalent] | 2018
Rank Country Value Score 1 Luxembourg ................................................................................................ 6.22 100.00 2 Slovakia ............................................................................................................6.07 96.33 3 Singapore....................................................................................................... 6.06 95.97 4 United Kingdom ........................................................................................6.03 95.35 5 Czech Republic ...........................................................................................5.98 94.05 6 Belgium ............................................................................................................5.83 90.39 7 Ireland ...............................................................................................................5.71 87.52 8 Estonia ..............................................................................................................5.67 86.50 9 Japan ..................................................................................................................5.65 85.97 10 Switzerland ....................................................................................................5.63 85.54 11 Denmark ..........................................................................................................5.57 84.12 12 United States of America......................................................................5.55 83.50 13 New Zealand ................................................................................................5.51 82.63 14 Australia ...........................................................................................................5.50 82.47 15 Gambia .............................................................................................................5.46 81.36 16 Bahrain ..............................................................................................................5.46 81.33 17 Chile ....................................................................................................................5.45 81.24 18 Canada ..............................................................................................................5.45 81.11 19 France ................................................................................................................5.42 80.55 20 Panama .............................................................................................................5.40 80.04 21 Zambia ..............................................................................................................5.39 79.77 22 Liberia ................................................................................................................5.39 79.75 23 Mexico ..............................................................................................................5.38 79.50 24 Sweden ............................................................................................................5.38 79.42 25 Germany ..........................................................................................................5.32 77.98 26 United Arab Emirates ..............................................................................5.28 77.04 27 Netherlands ...................................................................................................5.27 76.69 28 Morocco ...........................................................................................................5.24 75.95 29 Israel ...................................................................................................................5.21 75.26 30 Côte d’Ivoire ..................................................................................................5.20 74.98 31 Malaysia ............................................................................................................5.20 74.96 32 Costa Rica ....................................................................................................... 5.19 74.86 33 Finland .............................................................................................................. 5.18 74.58 34 Spain .................................................................................................................. 5.15 73.84 35 Malta .................................................................................................................. 5.12 73.03 36 Uganda .............................................................................................................5.08 72.23 37 Ghana ................................................................................................................5.08 72.14 38 Botswana ........................................................................................................5.08 72.12 39 Cyprus ...............................................................................................................5.05 71.33 40 Eswatini ............................................................................................................5.01 70.48 41 Latvia .................................................................................................................4.97 69.50 42 Dominican Republic ................................................................................4.96 69.26 43 Austria ...............................................................................................................4.95 68.97 44 Uruguay ...........................................................................................................4.94 68.71 45 Portugal ...........................................................................................................4.94 68.69 46 Namibia ............................................................................................................4.90 67.74 47 Senegal .............................................................................................................4.85 66.63 48 South Africa .................................................................................................. 4.84 66.35 49 Azerbaijan .......................................................................................................4.83 66.12 50 Peru .....................................................................................................................4.82 65.73 51 Poland ...............................................................................................................4.79 65.17 52 Malawi ...............................................................................................................4.78 64.88 53 Jamaica .............................................................................................................4.77 64.55 54 Kenya .................................................................................................................4.74 63.84 55 Hungary ...........................................................................................................4.71 63.17 56 Thailand ...........................................................................................................4.70 62.93 57 Mauritius ..........................................................................................................4.65 61.74 58 India ....................................................................................................................4.63 61.24 59 Romania ...........................................................................................................4.62 60.91 60 Nigeria ...............................................................................................................4.62 60.91 61 Qatar ...................................................................................................................4.60 60.51 62 Serbia .................................................................................................................4.56 59.44 63 Montenegro ..................................................................................................4.54 58.90 64 Indonesia.........................................................................................................4.53 58.61 65 Honduras ........................................................................................................4.49 57.65 66 Lithuania ..........................................................................................................4.48 57.62
Rank Country Value Score 67 China ..................................................................................................................4.48 57.62 68 Congo, Dem. Rep. .....................................................................................4.48 57.55 69 Cameroon .......................................................................................................4.47 57.17 70 Argentina ....................................................................................................... 4.44 56.60 71 Norway .............................................................................................................4.43 56.34 72 Bulgaria.............................................................................................................4.40 55.49 73 Madagascar ...................................................................................................4.38 55.18 74 Paraguay ..........................................................................................................4.38 55.11 75 Georgia .............................................................................................................4.36 54.69 76 Jordan................................................................................................................4.36 54.54 77 Lao PDR ............................................................................................................4.35 54.24 78 Cabo Verde ....................................................................................................4.35 54.22 79 Nicaragua ........................................................................................................4.34 53.97 80 Trinidad and Tobago ...............................................................................4.33 53.78 81 Guatemala ......................................................................................................4.32 53.67 82 Korea, Rep. ......................................................................................................4.32 53.63 83 Croatia ...............................................................................................................4.31 53.42 84 Mozambique ................................................................................................4.31 53.35 85 Cambodia .......................................................................................................4.28 52.74 86 El Salvador ......................................................................................................4.26 52.26 87 Philippines ......................................................................................................4.24 51.72 88 Italy ......................................................................................................................4.24 51.60 89 Colombia .........................................................................................................4.21 51.00 90 Tunisia................................................................................................................4.21 51.00 91 Oman .................................................................................................................4.21 50.86 92 Rwanda ............................................................................................................4.20 50.76 93 Albania ..............................................................................................................4.20 50.71 94 Brunei Darussalam .................................................................................... 4.12 48.68 95 Brazil ....................................................................................................................4.11 48.57 96 Greece ................................................................................................................4.11 48.54 97 Slovenia ............................................................................................................4.08 47.66 98 Pakistan ............................................................................................................4.03 46.52 99 Burkina Faso ..................................................................................................4.03 46.50 100 Saudi Arabia ..................................................................................................3.99 45.56 101 Tanzania, United Rep. .............................................................................3.99 45.49 102 Kazakhstan .....................................................................................................3.98 45.32 103 Viet Nam ..........................................................................................................3.92 43.77 104 Armenia............................................................................................................3.90 43.29 105 Mongolia .........................................................................................................3.87 42.63 106 North Macedonia ......................................................................................3.85 42.09 107 Zimbabwe ......................................................................................................3.83 41.73 108 Egypt ..................................................................................................................3.83 41.73 109 Bangladesh ....................................................................................................3.83 41.69 110 Mali ......................................................................................................................3.83 41.67 111 Turkey ................................................................................................................3.81 41.11 112 Bosnia and Herzegovina .......................................................................3.78 40.49 113 Kyrgyzstan ......................................................................................................3.78 40.38 114 Tajikistan ..........................................................................................................3.68 38.01 115 Ethiopia ............................................................................................................3.66 37.60 116 Sri Lanka ...........................................................................................................3.66 37.56 117 Angola...............................................................................................................3.63 36.87 118 Moldova, Rep. ..............................................................................................3.61 36.18 119 Ukraine .............................................................................................................3.51 33.75 120 Iceland ..............................................................................................................3.48 33.10 121 Russian Federation ...................................................................................3.41 31.40 122 Ecuador ............................................................................................................3.36 30.09 123 Burundi .............................................................................................................3.31 28.88 124 Algeria ...............................................................................................................3.28 28.23 125 Bolivia, Plurinational St. .......................................................................... 3.19 25.92 126 Kuwait ............................................................................................................... 3.18 25.70 127 Lesotho............................................................................................................. 3.15 25.15 128 Venezuela, Bolivarian Rep. ...................................................................3.07 23.01 129 Bhutan...............................................................................................................3.03 22.20 130 Nepal ..................................................................................................................2.98 20.84 131 Iran, Islamic Rep. .........................................................................................2.72 14.70 132 Yemen ............................................................................................................... 2.12 0.00
SOURCE: World Economic Forum, Executive Opinion Survey 2017–2018 (http://reports.weforum.org)For some countries, the latest year for which data are available may differ from the year that appears at the top of the page. The cut-off year is 2008.

288 THE GLOBAL TALENT COMPETITIVENESS INDEX 2020
DATA TABLESDATA TABLES
2.1.3 Migrant stock
Adult migrant stock (%) | 2017
Rank Country Value Score 1 United Arab Emirates ..............................................................................4.51 100.00 2 Kuwait ...............................................................................................................4.42 98.07 3 Qatar ...................................................................................................................4.24 93.95 4 Oman ................................................................................................................. 4.12 91.38 5 Bahrain ............................................................................................................. 4.04 89.66 6 Luxembourg .................................................................................................3.99 88.46 7 Singapore........................................................................................................3.94 87.30 8 Saudi Arabia ..................................................................................................3.80 84.36 9 Australia ...........................................................................................................3.58 79.40 10 Israel ...................................................................................................................3.56 79.05 11 Switzerland ....................................................................................................3.56 79.02 12 Jordan................................................................................................................3.50 77.69 13 Brunei Darussalam ....................................................................................3.42 75.90 14 New Zealand ................................................................................................3.33 73.79 15 Kazakhstan .....................................................................................................3.31 73.47 16 Canada ..............................................................................................................3.26 72.31 17 Austria ............................................................................................................... 3.15 69.95 18 Sweden ........................................................................................................... 3.04 67.44 19 United States of America......................................................................3.03 67.11 20 Ireland ...............................................................................................................2.99 66.23 21 Estonia ..............................................................................................................2.96 65.75 22 Côte d’Ivoire ..................................................................................................2.95 65.40 23 Cyprus ...............................................................................................................2.92 64.69 24 Gambia .............................................................................................................2.91 64.49 25 Norway .............................................................................................................2.89 63.99 26 Germany ..........................................................................................................2.88 63.79 27 Latvia .................................................................................................................2.87 63.70 28 Croatia ...............................................................................................................2.82 62.44 29 United Kingdom ........................................................................................2.78 61.64 30 France ................................................................................................................2.76 61.13 31 Netherlands ...................................................................................................2.71 60.11 32 Spain ..................................................................................................................2.69 59.63 33 Slovenia ............................................................................................................2.68 59.48 34 Montenegro ..................................................................................................2.68 59.37 35 Iceland ..............................................................................................................2.66 58.94 36 Ukraine ............................................................................................................ 2.64 58.65 37 Denmark ..........................................................................................................2.61 57.92 38 Greece ...............................................................................................................2.59 57.45 39 Serbia .................................................................................................................2.55 56.65 40 Malta ..................................................................................................................2.54 56.24 41 Malaysia ............................................................................................................2.52 55.93 42 Belgium ............................................................................................................2.50 55.55 43 Costa Rica .......................................................................................................2.49 55.15 44 Italy ......................................................................................................................2.45 54.34 45 South Africa ...................................................................................................2.38 52.69 46 Botswana ........................................................................................................2.37 52.51 47 Russian Federation ...................................................................................2.36 52.24 48 Portugal ...........................................................................................................2.33 51.70 49 Bhutan...............................................................................................................2.31 51.17 50 Armenia............................................................................................................2.23 49.43 51 Uganda ............................................................................................................. 2.13 47.34 52 North Macedonia ......................................................................................2.09 46.38 53 Burkina Faso ..................................................................................................2.05 45.40 54 Argentina ....................................................................................................... 2.04 45.34 55 Finland ............................................................................................................. 2.04 45.24 56 Namibia ............................................................................................................2.03 44.97 57 Turkey ................................................................................................................2.01 44.49 58 Panama .............................................................................................................1.99 44.21 59 Venezuela, Bolivarian Rep. ................................................................... 1.97 43.62 60 Tajikistan ..........................................................................................................1.92 42.68 61 Thailand ...........................................................................................................1.88 41.65 62 Hungary ...........................................................................................................1.87 41.48 63 Kyrgyzstan ......................................................................................................1.86 41.29 64 Rwanda ............................................................................................................1.85 41.01 65 Lithuania ..........................................................................................................1.80 40.03 66 Dominican Republic ................................................................................1.77 39.15
Rank Country Value Score 67 Zimbabwe ......................................................................................................1.75 38.85 68 Burundi .............................................................................................................1.73 38.41 69 Czech Republic ...........................................................................................1.73 38.31 70 Cabo Verde ....................................................................................................1.69 37.59 71 Eswatini ............................................................................................................1.63 36.14 72 Trinidad and Tobago ...............................................................................1.59 35.37 73 Slovakia ............................................................................................................1.56 34.68 74 Moldova, Rep. ..............................................................................................1.54 34.26 75 Azerbaijan .......................................................................................................1.48 32.78 76 Mali ...................................................................................................................... 1.47 32.55 77 Cameroon .......................................................................................................1.46 32.31 78 Paraguay ..........................................................................................................1.46 32.29 79 Iran, Islamic Rep. .........................................................................................1.44 32.05 80 Pakistan ............................................................................................................1.44 31.92 81 Liberia ................................................................................................................1.40 31.16 82 Angola...............................................................................................................1.36 30.21 83 Nepal ..................................................................................................................1.35 30.05 84 Chile .................................................................................................................... 1.31 29.00 85 Mauritius ..........................................................................................................1.29 28.72 86 Kenya .................................................................................................................1.29 28.56 87 Senegal .............................................................................................................1.27 28.26 88 Uruguay ...........................................................................................................1.25 27.64 89 Korea, Rep. ......................................................................................................1.24 27.40 90 Malawi ...............................................................................................................1.22 27.04 91 Ecuador .............................................................................................................1.19 26.47 92 Yemen ................................................................................................................1.12 24.78 93 Georgia .............................................................................................................1.08 23.93 94 Ghana ................................................................................................................1.05 23.31 95 Poland ...............................................................................................................1.02 22.62 96 Zambia ..............................................................................................................1.02 22.56 97 Bulgaria.............................................................................................................0.98 21.77 98 Congo, Dem. Rep. .....................................................................................0.98 21.71 99 Japan ..................................................................................................................0.97 21.41 100 Tanzania, United Rep. .............................................................................0.94 20.93 101 Bolivia, Plurinational St. ..........................................................................0.90 20.02 102 Ethiopia ............................................................................................................0.85 18.77 103 Mozambique ............................................................................................... 0.84 18.72 104 Romania ...........................................................................................................0.79 17.48 105 Bangladesh ....................................................................................................0.74 16.50 106 Albania ..............................................................................................................0.70 15.50 107 Bosnia and Herzegovina .......................................................................0.69 15.34 108 Lao PDR ............................................................................................................0.69 15.33 109 El Salvador ......................................................................................................0.61 13.47 110 Mongolia .........................................................................................................0.58 12.88 111 Jamaica .............................................................................................................0.57 12.64 112 Algeria ...............................................................................................................0.54 12.00 113 Guatemala ......................................................................................................0.53 11.81 114 Cambodia .......................................................................................................0.53 11.66 115 Nigeria ...............................................................................................................0.50 11.01 116 Egypt ..................................................................................................................0.50 10.99 117 Nicaragua ........................................................................................................0.48 10.58 118 Honduras ....................................................................................................... 0.44 9.76 119 India ................................................................................................................... 0.44 9.69 120 Tunisia................................................................................................................0.42 9.41 121 Lesotho.............................................................................................................0.37 8.17 122 Mexico ..............................................................................................................0.36 8.03 123 Brazil ...................................................................................................................0.32 7.04 124 Peru .....................................................................................................................0.24 5.28 125 Morocco ...........................................................................................................0.23 5.14 126 Colombia ......................................................................................................... 0.19 4.15 127 Philippines ...................................................................................................... 0.18 4.03 128 Madagascar ................................................................................................... 0.17 3.71 129 Sri Lanka ...........................................................................................................0.08 1.87 130 Indonesia.........................................................................................................0.07 1.52 131 Viet Nam ..........................................................................................................0.03 0.60 132 China ..................................................................................................................0.00 0.00
SOURCE: United Nations Population Division, Trends in International Migrant Stock: Migrants by Age and Sex (www.un.org/en/development/desa/population/migration/data/estimates2/estimates17.shtml)
For some countries, the latest year for which data are available may differ from the year that appears at the top of the page. The cut-off year is 2008.

THE GLOBAL TALENT COMPETITIVENESS INDEX 2020 289
DATA TABLESDATA TABLES
2.1.4 International students
Tertiary inbound mobility ratio (%) | 2017
Rank Country Value Score 1 Luxembourg ..............................................................................................46.99 100.00 1 Qatar ................................................................................................................35.28 100.00 1 Singapore..................................................................................................... 27.22 100.00 1 United Arab Emirates ...........................................................................48.55 100.00 5 New Zealand .............................................................................................19.84 72.85 6 United Kingdom ......................................................................................18.10 66.43 7 Switzerland ..................................................................................................17.59 64.57 8 Cyprus .............................................................................................................17.53 64.36 9 Australia .........................................................................................................17.49 64.20 10 Austria ............................................................................................................16.35 60.01 11 Jordan............................................................................................................. 13.94 51.15 12 Bahrain ............................................................................................................13.15 48.24 13 Belgium ......................................................................................................... 12.02 44.10 14 Canada ............................................................................................................11.89 43.62 15 Czech Republic .........................................................................................11.51 42.22 16 Denmark ....................................................................................................... 10.81 39.65 17 Netherlands ................................................................................................ 10.74 39.40 18 Uganda .......................................................................................................... 10.73 39.36 19 France ................................................................................................................9.89 36.27 20 Hungary .......................................................................................................... 8.86 32.46 21 Malta ..................................................................................................................8.43 30.90 22 Senegal .............................................................................................................8.32 30.50 23 Ireland ............................................................................................................... 8.19 30.00 24 Malaysia ............................................................................................................8.07 29.56 25 Germany ......................................................................................................... 8.04 29.45 26 Finland .............................................................................................................. 7.81 28.60 27 Latvia ................................................................................................................. 7.67 28.10 28 Bosnia and Herzegovina ........................................................................7.12 26.06 29 Namibia ............................................................................................................7.06 25.87 30 Estonia ............................................................................................................. 6.80 24.91 31 Iceland ..............................................................................................................6.78 24.82 32 Sweden ............................................................................................................6.58 24.08 33 Kyrgyzstan ......................................................................................................6.40 23.43 34 Slovakia ............................................................................................................6.02 22.04 35 Georgia .............................................................................................................5.55 20.31 36 Italy ...................................................................................................................... 5.10 18.66 37 United States of America......................................................................5.04 18.42 38 Portugal ...........................................................................................................5.00 18.30 39 Saudi Arabia ..................................................................................................4.92 18.00 40 Romania ...........................................................................................................4.82 17.64 41 Bulgaria.............................................................................................................4.57 16.72 42 Mauritius ..........................................................................................................4.55 16.62 43 Serbia .................................................................................................................4.43 16.20 44 Armenia............................................................................................................4.30 15.72 45 South Africa ...................................................................................................4.28 15.65 46 Yemen ...............................................................................................................4.26 15.56 47 Moldova, Rep. .............................................................................................. 4.13 15.09 48 Lithuania ...........................................................................................................4.11 15.01 49 Russian Federation ...................................................................................3.94 14.39 50 Norway .............................................................................................................3.92 14.32 51 Brunei Darussalam ....................................................................................3.76 13.73 52 Japan ..................................................................................................................3.73 13.61 53 North Macedonia ......................................................................................3.49 12.74 54 Poland ...............................................................................................................3.42 12.47 55 Greece ...............................................................................................................3.35 12.20 56 Slovenia ............................................................................................................3.31 12.07 57 Ukraine ............................................................................................................. 3.16 11.53 58 Oman .................................................................................................................2.95 10.73 59 Ghana ................................................................................................................2.92 10.65 60 Burkina Faso ..................................................................................................2.90 10.56 61 Burundi .............................................................................................................2.90 10.56 62 Israel ...................................................................................................................2.78 10.11 63 Spain ..................................................................................................................2.71 9.87 64 Botswana ........................................................................................................2.70 9.81 65 Argentina ........................................................................................................2.47 8.99 66 Tunisia................................................................................................................2.26 8.20
Rank Country Value Score 67 Kazakhstan .....................................................................................................2.21 8.03 68 Côte d’Ivoire .................................................................................................. 2.13 7.74 69 Azerbaijan .......................................................................................................2.07 7.52 70 Morocco ...........................................................................................................1.99 7.22 71 Korea, Rep. ...................................................................................................... 1.93 7.00 72 Egypt ..................................................................................................................1.83 6.64 73 Rwanda ............................................................................................................1.73 6.26 74 Dominican Republic ................................................................................1.73 6.25 75 Madagascar ...................................................................................................1.66 5.99 76 Albania .............................................................................................................. 1.51 5.47 77 Turkey ................................................................................................................ 1.31 4.73 78 Thailand ........................................................................................................... 1.31 4.71 79 Costa Rica .......................................................................................................1.30 4.68 80 Malawi ................................................................................................................1.14 4.08 81 Cameroon ........................................................................................................1.13 4.06 82 Mongolia .........................................................................................................0.97 3.45 83 Kenya .................................................................................................................0.89 3.16 84 Mali ..................................................................................................................... 0.86 3.05 85 Tajikistan ......................................................................................................... 0.84 3.00 86 Cabo Verde ....................................................................................................0.82 2.91 87 Ecuador ............................................................................................................0.78 2.75 88 Honduras ........................................................................................................0.76 2.71 89 Algeria ...............................................................................................................0.55 1.93 90 Eswatini ............................................................................................................0.51 1.77 91 Zimbabwe ......................................................................................................0.47 1.61 92 Sri Lanka ...........................................................................................................0.45 1.56 93 Congo, Dem. Rep. .................................................................................... 0.44 1.51 94 Iran, Islamic Rep. .........................................................................................0.43 1.48 95 Croatia ...............................................................................................................0.43 1.47 96 Lao PDR ............................................................................................................0.42 1.46 97 El Salvador ......................................................................................................0.39 1.34 98 Chile ....................................................................................................................0.37 1.26 99 China ..................................................................................................................0.36 1.21 100 Lesotho.............................................................................................................0.32 1.09 101 Mexico ..............................................................................................................0.30 0.99 102 Mozambique ................................................................................................0.29 0.98 103 Viet Nam ..........................................................................................................0.24 0.79 104 Brazil ...................................................................................................................0.24 0.78 105 Colombia ......................................................................................................... 0.19 0.58 106 India .................................................................................................................... 0.14 0.41 107 Philippines ...................................................................................................... 0.10 0.27 108 Bangladesh .................................................................................................... 0.10 0.27 109 Venezuela, Bolivarian Rep. ...................................................................0.09 0.23 110 Indonesia.........................................................................................................0.07 0.17 111 Nepal ..................................................................................................................0.03 0.00 Angola................................................................................................................ n/a n/a Bhutan................................................................................................................ n/a n/a Bolivia, Plurinational St. ........................................................................... n/a n/a Cambodia ........................................................................................................ n/a n/a Ethiopia ............................................................................................................. n/a n/a Gambia .............................................................................................................. n/a n/a Guatemala ....................................................................................................... n/a n/a Jamaica .............................................................................................................. n/a n/a Kuwait ................................................................................................................ n/a n/a Liberia ................................................................................................................. n/a n/a Montenegro ................................................................................................... n/a n/a Nicaragua ......................................................................................................... n/a n/a Nigeria ................................................................................................................ n/a n/a Pakistan ............................................................................................................. n/a n/a Panama .............................................................................................................. n/a n/a Paraguay ........................................................................................................... n/a n/a Peru ...................................................................................................................... n/a n/a Tanzania, United Rep. .............................................................................. n/a n/a Trinidad and Tobago ................................................................................ n/a n/a Uruguay ............................................................................................................ n/a n/a Zambia ............................................................................................................... n/a n/a
SOURCE: UNESCO Institute for Statistics, UIS.Stat (http://data.uis.unesco.org/)For some countries, the latest year for which data are available may differ from the year that appears at the top of the page. The cut-off year is 2008.
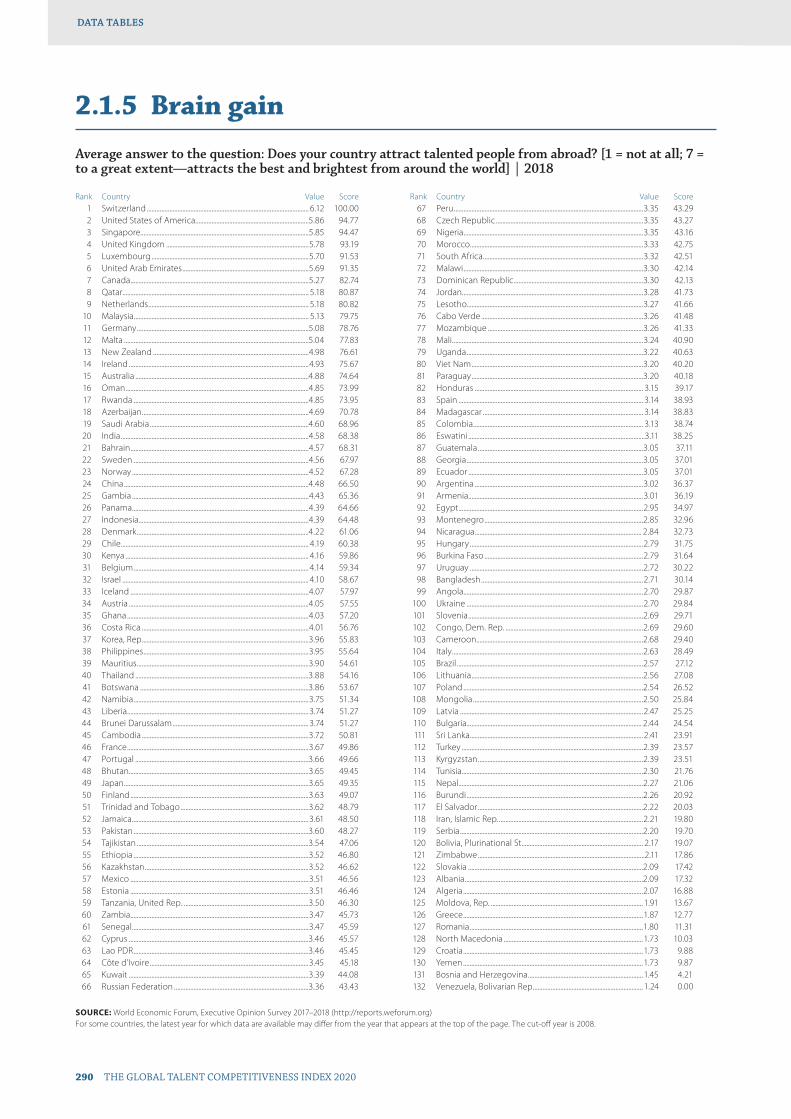
290 THE GLOBAL TALENT COMPETITIVENESS INDEX 2020
DATA TABLESDATA TABLES
2.1.5 Brain gain
Average answer to the question: Does your country attract talented people from abroad? [1 = not at all; 7 = to a great extent—attracts the best and brightest from around the world] | 2018
Rank Country Value Score 1 Switzerland .................................................................................................... 6.12 100.00 2 United States of America......................................................................5.86 94.77 3 Singapore........................................................................................................5.85 94.47 4 United Kingdom ........................................................................................5.78 93.19 5 Luxembourg .................................................................................................5.70 91.53 6 United Arab Emirates ..............................................................................5.69 91.35 7 Canada ..............................................................................................................5.27 82.74 8 Qatar ................................................................................................................... 5.18 80.87 9 Netherlands ................................................................................................... 5.18 80.82 10 Malaysia ............................................................................................................ 5.13 79.75 11 Germany ..........................................................................................................5.08 78.76 12 Malta ..................................................................................................................5.04 77.83 13 New Zealand ................................................................................................4.98 76.61 14 Ireland ...............................................................................................................4.93 75.67 15 Australia ...........................................................................................................4.88 74.64 16 Oman .................................................................................................................4.85 73.99 17 Rwanda ............................................................................................................4.85 73.95 18 Azerbaijan .......................................................................................................4.69 70.78 19 Saudi Arabia ..................................................................................................4.60 68.96 20 India ....................................................................................................................4.58 68.38 21 Bahrain ..............................................................................................................4.57 68.31 22 Sweden ............................................................................................................4.56 67.97 23 Norway .............................................................................................................4.52 67.28 24 China ..................................................................................................................4.48 66.50 25 Gambia .............................................................................................................4.43 65.36 26 Panama .............................................................................................................4.39 64.66 27 Indonesia.........................................................................................................4.39 64.48 28 Denmark ..........................................................................................................4.22 61.06 29 Chile .................................................................................................................... 4.19 60.38 30 Kenya ................................................................................................................. 4.16 59.86 31 Belgium ............................................................................................................ 4.14 59.34 32 Israel ................................................................................................................... 4.10 58.67 33 Iceland ..............................................................................................................4.07 57.97 34 Austria ...............................................................................................................4.05 57.55 35 Ghana ................................................................................................................4.03 57.20 36 Costa Rica .......................................................................................................4.01 56.76 37 Korea, Rep. ......................................................................................................3.96 55.83 38 Philippines ......................................................................................................3.95 55.64 39 Mauritius ..........................................................................................................3.90 54.61 40 Thailand ...........................................................................................................3.88 54.16 41 Botswana ........................................................................................................3.86 53.67 42 Namibia ............................................................................................................3.75 51.34 43 Liberia ................................................................................................................3.74 51.27 44 Brunei Darussalam ....................................................................................3.74 51.27 45 Cambodia .......................................................................................................3.72 50.81 46 France ................................................................................................................3.67 49.86 47 Portugal ...........................................................................................................3.66 49.66 48 Bhutan...............................................................................................................3.65 49.45 49 Japan ..................................................................................................................3.65 49.35 50 Finland ..............................................................................................................3.63 49.07 51 Trinidad and Tobago ...............................................................................3.62 48.79 52 Jamaica .............................................................................................................3.61 48.50 53 Pakistan ............................................................................................................3.60 48.27 54 Tajikistan ..........................................................................................................3.54 47.06 55 Ethiopia ............................................................................................................3.52 46.80 56 Kazakhstan .....................................................................................................3.52 46.62 57 Mexico ..............................................................................................................3.51 46.56 58 Estonia ..............................................................................................................3.51 46.46 59 Tanzania, United Rep. .............................................................................3.50 46.30 60 Zambia ..............................................................................................................3.47 45.73 61 Senegal .............................................................................................................3.47 45.59 62 Cyprus ...............................................................................................................3.46 45.57 63 Lao PDR ............................................................................................................3.46 45.45 64 Côte d’Ivoire ..................................................................................................3.45 45.18 65 Kuwait ...............................................................................................................3.39 44.08 66 Russian Federation ...................................................................................3.36 43.43
Rank Country Value Score 67 Peru .....................................................................................................................3.35 43.29 68 Czech Republic ...........................................................................................3.35 43.27 69 Nigeria ...............................................................................................................3.35 43.16 70 Morocco ...........................................................................................................3.33 42.75 71 South Africa ...................................................................................................3.32 42.51 72 Malawi ...............................................................................................................3.30 42.14 73 Dominican Republic ................................................................................3.30 42.13 74 Jordan................................................................................................................3.28 41.73 75 Lesotho.............................................................................................................3.27 41.66 76 Cabo Verde ....................................................................................................3.26 41.48 77 Mozambique ................................................................................................3.26 41.33 78 Mali ......................................................................................................................3.24 40.90 79 Uganda .............................................................................................................3.22 40.63 80 Viet Nam ..........................................................................................................3.20 40.20 81 Paraguay ..........................................................................................................3.20 40.18 82 Honduras ........................................................................................................ 3.15 39.17 83 Spain .................................................................................................................. 3.14 38.93 84 Madagascar ................................................................................................... 3.14 38.83 85 Colombia ......................................................................................................... 3.13 38.74 86 Eswatini .............................................................................................................3.11 38.25 87 Guatemala ......................................................................................................3.05 37.11 88 Georgia .............................................................................................................3.05 37.01 89 Ecuador ............................................................................................................3.05 37.01 90 Argentina ........................................................................................................3.02 36.37 91 Armenia............................................................................................................3.01 36.19 92 Egypt ..................................................................................................................2.95 34.97 93 Montenegro ..................................................................................................2.85 32.96 94 Nicaragua ....................................................................................................... 2.84 32.73 95 Hungary ...........................................................................................................2.79 31.75 96 Burkina Faso ..................................................................................................2.79 31.64 97 Uruguay ...........................................................................................................2.72 30.22 98 Bangladesh ....................................................................................................2.71 30.14 99 Angola...............................................................................................................2.70 29.87 100 Ukraine .............................................................................................................2.70 29.84 101 Slovenia ............................................................................................................2.69 29.71 102 Congo, Dem. Rep. .....................................................................................2.69 29.60 103 Cameroon .......................................................................................................2.68 29.40 104 Italy ......................................................................................................................2.63 28.49 105 Brazil ...................................................................................................................2.57 27.12 106 Lithuania ..........................................................................................................2.56 27.08 107 Poland ...............................................................................................................2.54 26.52 108 Mongolia .........................................................................................................2.50 25.84 109 Latvia .................................................................................................................2.47 25.25 110 Bulgaria............................................................................................................ 2.44 24.54 111 Sri Lanka ...........................................................................................................2.41 23.91 112 Turkey ................................................................................................................2.39 23.57 113 Kyrgyzstan ......................................................................................................2.39 23.51 114 Tunisia................................................................................................................2.30 21.76 115 Nepal ..................................................................................................................2.27 21.06 116 Burundi .............................................................................................................2.26 20.92 117 El Salvador ......................................................................................................2.22 20.03 118 Iran, Islamic Rep. .........................................................................................2.21 19.80 119 Serbia .................................................................................................................2.20 19.70 120 Bolivia, Plurinational St. .......................................................................... 2.17 19.07 121 Zimbabwe .......................................................................................................2.11 17.86 122 Slovakia ............................................................................................................2.09 17.42 123 Albania ..............................................................................................................2.09 17.32 124 Algeria ...............................................................................................................2.07 16.88 125 Moldova, Rep. .............................................................................................. 1.91 13.67 126 Greece ...............................................................................................................1.87 12.77 127 Romania ...........................................................................................................1.80 11.31 128 North Macedonia ......................................................................................1.73 10.03 129 Croatia ...............................................................................................................1.73 9.88 130 Yemen ...............................................................................................................1.73 9.87 131 Bosnia and Herzegovina .......................................................................1.45 4.21 132 Venezuela, Bolivarian Rep. ................................................................... 1.24 0.00
SOURCE: World Economic Forum, Executive Opinion Survey 2017–2018 (http://reports.weforum.org)For some countries, the latest year for which data are available may differ from the year that appears at the top of the page. The cut-off year is 2008.
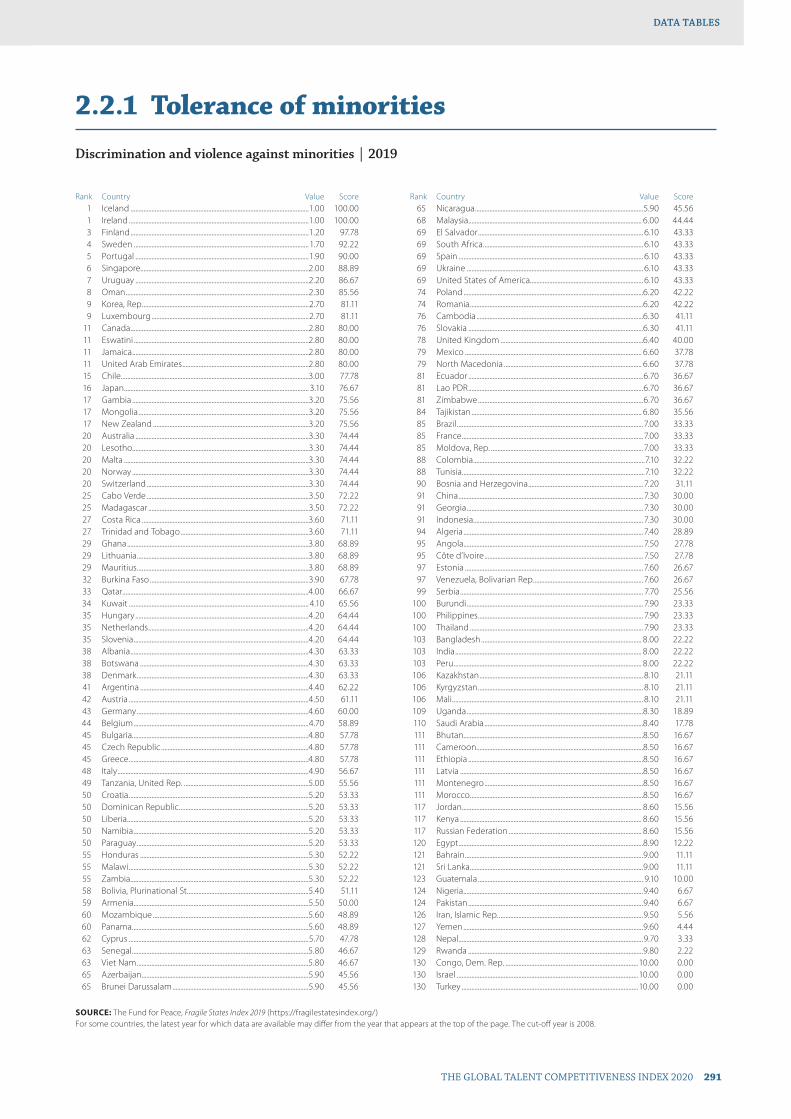
THE GLOBAL TALENT COMPETITIVENESS INDEX 2020 291
DATA TABLESDATA TABLES
2.2.1 Tolerance of minorities
Discrimination and violence against minorities | 2019
Rank Country Value Score 1 Iceland ..............................................................................................................1.00 100.00 1 Ireland ...............................................................................................................1.00 100.00 3 Finland ..............................................................................................................1.20 97.78 4 Sweden ............................................................................................................1.70 92.22 5 Portugal ...........................................................................................................1.90 90.00 6 Singapore........................................................................................................2.00 88.89 7 Uruguay ...........................................................................................................2.20 86.67 8 Oman .................................................................................................................2.30 85.56 9 Korea, Rep. ......................................................................................................2.70 81.11 9 Luxembourg .................................................................................................2.70 81.11 11 Canada ..............................................................................................................2.80 80.00 11 Eswatini ............................................................................................................2.80 80.00 11 Jamaica .............................................................................................................2.80 80.00 11 United Arab Emirates ..............................................................................2.80 80.00 15 Chile ....................................................................................................................3.00 77.78 16 Japan .................................................................................................................. 3.10 76.67 17 Gambia .............................................................................................................3.20 75.56 17 Mongolia .........................................................................................................3.20 75.56 17 New Zealand ................................................................................................3.20 75.56 20 Australia ...........................................................................................................3.30 74.44 20 Lesotho.............................................................................................................3.30 74.44 20 Malta ..................................................................................................................3.30 74.44 20 Norway .............................................................................................................3.30 74.44 20 Switzerland ....................................................................................................3.30 74.44 25 Cabo Verde ....................................................................................................3.50 72.22 25 Madagascar ...................................................................................................3.50 72.22 27 Costa Rica .......................................................................................................3.60 71.11 27 Trinidad and Tobago ...............................................................................3.60 71.11 29 Ghana ................................................................................................................3.80 68.89 29 Lithuania ..........................................................................................................3.80 68.89 29 Mauritius ..........................................................................................................3.80 68.89 32 Burkina Faso ..................................................................................................3.90 67.78 33 Qatar ...................................................................................................................4.00 66.67 34 Kuwait ............................................................................................................... 4.10 65.56 35 Hungary ...........................................................................................................4.20 64.44 35 Netherlands ...................................................................................................4.20 64.44 35 Slovenia ............................................................................................................4.20 64.44 38 Albania ..............................................................................................................4.30 63.33 38 Botswana ........................................................................................................4.30 63.33 38 Denmark ..........................................................................................................4.30 63.33 41 Argentina ........................................................................................................4.40 62.22 42 Austria ...............................................................................................................4.50 61.11 43 Germany ..........................................................................................................4.60 60.00 44 Belgium ............................................................................................................4.70 58.89 45 Bulgaria.............................................................................................................4.80 57.78 45 Czech Republic ...........................................................................................4.80 57.78 45 Greece ...............................................................................................................4.80 57.78 48 Italy ......................................................................................................................4.90 56.67 49 Tanzania, United Rep. .............................................................................5.00 55.56 50 Croatia ...............................................................................................................5.20 53.33 50 Dominican Republic ................................................................................5.20 53.33 50 Liberia ................................................................................................................5.20 53.33 50 Namibia ............................................................................................................5.20 53.33 50 Paraguay ..........................................................................................................5.20 53.33 55 Honduras ........................................................................................................5.30 52.22 55 Malawi ...............................................................................................................5.30 52.22 55 Zambia ..............................................................................................................5.30 52.22 58 Bolivia, Plurinational St. ..........................................................................5.40 51.11 59 Armenia............................................................................................................5.50 50.00 60 Mozambique ................................................................................................5.60 48.89 60 Panama .............................................................................................................5.60 48.89 62 Cyprus ...............................................................................................................5.70 47.78 63 Senegal .............................................................................................................5.80 46.67 63 Viet Nam ..........................................................................................................5.80 46.67 65 Azerbaijan .......................................................................................................5.90 45.56 65 Brunei Darussalam ....................................................................................5.90 45.56
Rank Country Value Score 65 Nicaragua ........................................................................................................5.90 45.56 68 Malaysia ........................................................................................................... 6.00 44.44 69 El Salvador ...................................................................................................... 6.10 43.33 69 South Africa ................................................................................................... 6.10 43.33 69 Spain .................................................................................................................. 6.10 43.33 69 Ukraine ............................................................................................................. 6.10 43.33 69 United States of America...................................................................... 6.10 43.33 74 Poland ...............................................................................................................6.20 42.22 74 Romania ...........................................................................................................6.20 42.22 76 Cambodia .......................................................................................................6.30 41.11 76 Slovakia ............................................................................................................6.30 41.11 78 United Kingdom ........................................................................................6.40 40.00 79 Mexico ............................................................................................................. 6.60 37.78 79 North Macedonia ..................................................................................... 6.60 37.78 81 Ecuador ............................................................................................................6.70 36.67 81 Lao PDR ............................................................................................................6.70 36.67 81 Zimbabwe ......................................................................................................6.70 36.67 84 Tajikistan ......................................................................................................... 6.80 35.56 85 Brazil ...................................................................................................................7.00 33.33 85 France ................................................................................................................7.00 33.33 85 Moldova, Rep. ..............................................................................................7.00 33.33 88 Colombia ..........................................................................................................7.10 32.22 88 Tunisia.................................................................................................................7.10 32.22 90 Bosnia and Herzegovina .......................................................................7.20 31.11 91 China ..................................................................................................................7.30 30.00 91 Georgia .............................................................................................................7.30 30.00 91 Indonesia.........................................................................................................7.30 30.00 94 Algeria ...............................................................................................................7.40 28.89 95 Angola............................................................................................................... 7.50 27.78 95 Côte d’Ivoire .................................................................................................. 7.50 27.78 97 Estonia ..............................................................................................................7.60 26.67 97 Venezuela, Bolivarian Rep. ...................................................................7.60 26.67 99 Serbia ................................................................................................................. 7.70 25.56 100 Burundi ............................................................................................................. 7.90 23.33 100 Philippines ...................................................................................................... 7.90 23.33 100 Thailand ........................................................................................................... 7.90 23.33 103 Bangladesh ................................................................................................... 8.00 22.22 103 India ................................................................................................................... 8.00 22.22 103 Peru .................................................................................................................... 8.00 22.22 106 Kazakhstan ..................................................................................................... 8.10 21.11 106 Kyrgyzstan ...................................................................................................... 8.10 21.11 106 Mali ...................................................................................................................... 8.10 21.11 109 Uganda .............................................................................................................8.30 18.89 110 Saudi Arabia ..................................................................................................8.40 17.78 111 Bhutan...............................................................................................................8.50 16.67 111 Cameroon .......................................................................................................8.50 16.67 111 Ethiopia ............................................................................................................8.50 16.67 111 Latvia .................................................................................................................8.50 16.67 111 Montenegro ..................................................................................................8.50 16.67 111 Morocco ...........................................................................................................8.50 16.67 117 Jordan............................................................................................................... 8.60 15.56 117 Kenya ................................................................................................................ 8.60 15.56 117 Russian Federation .................................................................................. 8.60 15.56 120 Egypt ..................................................................................................................8.90 12.22 121 Bahrain ..............................................................................................................9.00 11.11 121 Sri Lanka ...........................................................................................................9.00 11.11 123 Guatemala ...................................................................................................... 9.10 10.00 124 Nigeria ...............................................................................................................9.40 6.67 124 Pakistan ............................................................................................................9.40 6.67 126 Iran, Islamic Rep. .........................................................................................9.50 5.56 127 Yemen ...............................................................................................................9.60 4.44 128 Nepal ..................................................................................................................9.70 3.33 129 Rwanda ............................................................................................................9.80 2.22 130 Congo, Dem. Rep. ..................................................................................10.00 0.00 130 Israel ................................................................................................................10.00 0.00 130 Turkey .............................................................................................................10.00 0.00
SOURCE: The Fund for Peace, Fragile States Index 2019 (https://fragilestatesindex.org/)For some countries, the latest year for which data are available may differ from the year that appears at the top of the page. The cut-off year is 2008.
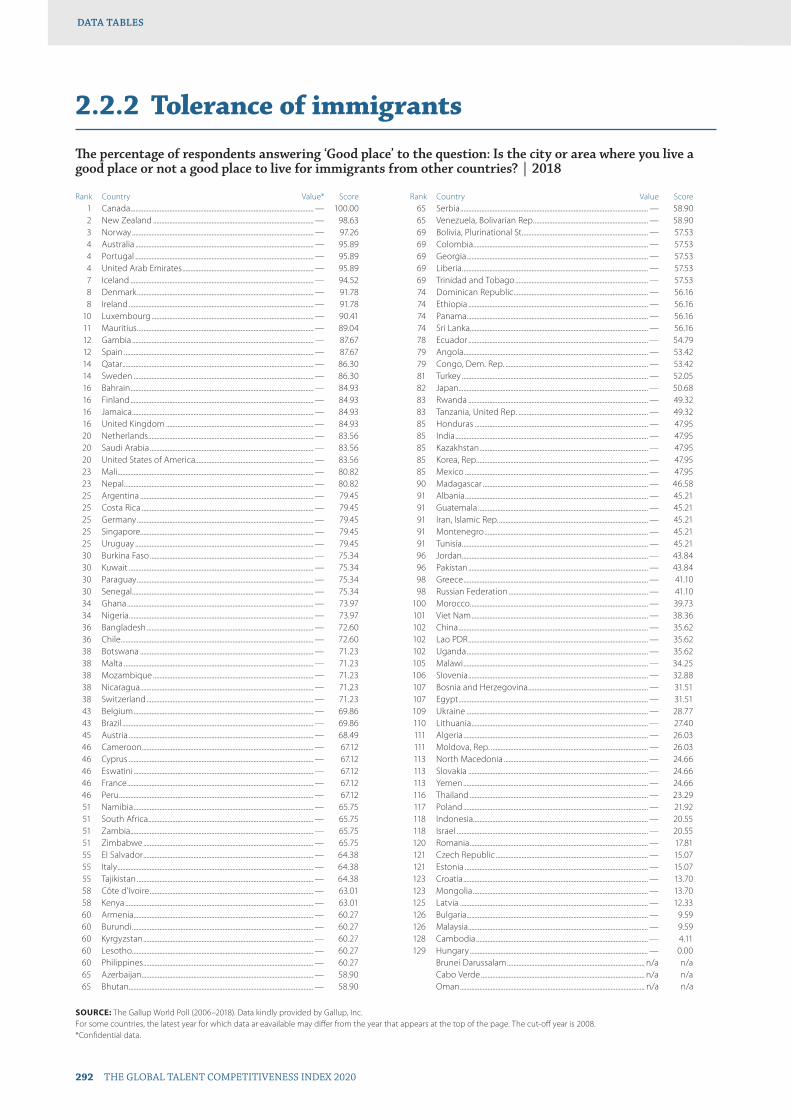
292 THE GLOBAL TALENT COMPETITIVENESS INDEX 2020
DATA TABLESDATA TABLES
2.2.2 Tolerance of immigrants
The percentage of respondents answering ‘Good place’ to the question: Is the city or area where you live a good place or not a good place to live for immigrants from other countries? | 2018
Rank Country Value* Score 1 Canada ................................................................................................................. — 100.00 2 New Zealand ................................................................................................... — 98.63 3 Norway ................................................................................................................ — 97.26 4 Australia .............................................................................................................. — 95.89 4 Portugal .............................................................................................................. — 95.89 4 United Arab Emirates ................................................................................. — 95.89 7 Iceland ................................................................................................................. — 94.52 8 Denmark ............................................................................................................. — 91.78 8 Ireland .................................................................................................................. — 91.78 10 Luxembourg .................................................................................................... — 90.41 11 Mauritius ............................................................................................................. — 89.04 12 Gambia ................................................................................................................ — 87.67 12 Spain ..................................................................................................................... — 87.67 14 Qatar ...................................................................................................................... — 86.30 14 Sweden ............................................................................................................... — 86.30 16 Bahrain ................................................................................................................. — 84.93 16 Finland ................................................................................................................. — 84.93 16 Jamaica ................................................................................................................ — 84.93 16 United Kingdom ........................................................................................... — 84.93 20 Netherlands ...................................................................................................... — 83.56 20 Saudi Arabia ..................................................................................................... — 83.56 20 United States of America......................................................................... — 83.56 23 Mali ......................................................................................................................... — 80.82 23 Nepal ..................................................................................................................... — 80.82 25 Argentina ........................................................................................................... — 79.45 25 Costa Rica .......................................................................................................... — 79.45 25 Germany ............................................................................................................. — 79.45 25 Singapore........................................................................................................... — 79.45 25 Uruguay .............................................................................................................. — 79.45 30 Burkina Faso ..................................................................................................... — 75.34 30 Kuwait .................................................................................................................. — 75.34 30 Paraguay ............................................................................................................. — 75.34 30 Senegal ................................................................................................................ — 75.34 34 Ghana ................................................................................................................... — 73.97 34 Nigeria .................................................................................................................. — 73.97 36 Bangladesh ....................................................................................................... — 72.60 36 Chile ....................................................................................................................... — 72.60 38 Botswana ........................................................................................................... — 71.23 38 Malta ..................................................................................................................... — 71.23 38 Mozambique ................................................................................................... — 71.23 38 Nicaragua ........................................................................................................... — 71.23 38 Switzerland ....................................................................................................... — 71.23 43 Belgium ............................................................................................................... — 69.86 43 Brazil ...................................................................................................................... — 69.86 45 Austria .................................................................................................................. — 68.49 46 Cameroon .......................................................................................................... — 67.12 46 Cyprus .................................................................................................................. — 67.12 46 Eswatini ............................................................................................................... — 67.12 46 France ................................................................................................................... — 67.12 46 Peru ........................................................................................................................ — 67.12 51 Namibia ............................................................................................................... — 65.75 51 South Africa ...................................................................................................... — 65.75 51 Zambia ................................................................................................................. — 65.75 51 Zimbabwe ......................................................................................................... — 65.75 55 El Salvador ......................................................................................................... — 64.38 55 Italy ......................................................................................................................... — 64.38 55 Tajikistan ............................................................................................................. — 64.38 58 Côte d’Ivoire ..................................................................................................... — 63.01 58 Kenya .................................................................................................................... — 63.01 60 Armenia............................................................................................................... — 60.27 60 Burundi ................................................................................................................ — 60.27 60 Kyrgyzstan ......................................................................................................... — 60.27 60 Lesotho................................................................................................................ — 60.27 60 Philippines ......................................................................................................... — 60.27 65 Azerbaijan .......................................................................................................... — 58.90 65 Bhutan.................................................................................................................. — 58.90
Rank Country Value Score 65 Serbia .................................................................................................................... — 58.90 65 Venezuela, Bolivarian Rep. ...................................................................... — 58.90 69 Bolivia, Plurinational St. ............................................................................. — 57.53 69 Colombia ............................................................................................................ — 57.53 69 Georgia ................................................................................................................ — 57.53 69 Liberia ................................................................................................................... — 57.53 69 Trinidad and Tobago .................................................................................. — 57.53 74 Dominican Republic ................................................................................... — 56.16 74 Ethiopia ............................................................................................................... — 56.16 74 Panama ................................................................................................................ — 56.16 74 Sri Lanka .............................................................................................................. — 56.16 78 Ecuador ............................................................................................................... — 54.79 79 Angola.................................................................................................................. — 53.42 79 Congo, Dem. Rep. ........................................................................................ — 53.42 81 Turkey ................................................................................................................... — 52.05 82 Japan ..................................................................................................................... — 50.68 83 Rwanda ............................................................................................................... — 49.32 83 Tanzania, United Rep. ................................................................................ — 49.32 85 Honduras ........................................................................................................... — 47.95 85 India ....................................................................................................................... — 47.95 85 Kazakhstan ........................................................................................................ — 47.95 85 Korea, Rep. ......................................................................................................... — 47.95 85 Mexico ................................................................................................................. — 47.95 90 Madagascar ...................................................................................................... — 46.58 91 Albania ................................................................................................................. — 45.21 91 Guatemala ......................................................................................................... — 45.21 91 Iran, Islamic Rep. ............................................................................................ — 45.21 91 Montenegro ..................................................................................................... — 45.21 91 Tunisia................................................................................................................... — 45.21 96 Jordan................................................................................................................... — 43.84 96 Pakistan ............................................................................................................... — 43.84 98 Greece .................................................................................................................. — 41.10 98 Russian Federation ...................................................................................... — 41.10 100 Morocco .............................................................................................................. — 39.73 101 Viet Nam ............................................................................................................. — 38.36 102 China ..................................................................................................................... — 35.62 102 Lao PDR ............................................................................................................... — 35.62 102 Uganda ................................................................................................................ — 35.62 105 Malawi .................................................................................................................. — 34.25 106 Slovenia ............................................................................................................... — 32.88 107 Bosnia and Herzegovina .......................................................................... — 31.51 107 Egypt ..................................................................................................................... — 31.51 109 Ukraine ................................................................................................................ — 28.77 110 Lithuania ............................................................................................................. — 27.40 111 Algeria .................................................................................................................. — 26.03 111 Moldova, Rep. ................................................................................................. — 26.03 113 North Macedonia ......................................................................................... — 24.66 113 Slovakia ............................................................................................................... — 24.66 113 Yemen .................................................................................................................. — 24.66 116 Thailand .............................................................................................................. — 23.29 117 Poland .................................................................................................................. — 21.92 118 Indonesia............................................................................................................ — 20.55 118 Israel ...................................................................................................................... — 20.55 120 Romania .............................................................................................................. — 17.81 121 Czech Republic .............................................................................................. — 15.07 121 Estonia ................................................................................................................. — 15.07 123 Croatia .................................................................................................................. — 13.70 123 Mongolia ............................................................................................................ — 13.70 125 Latvia .................................................................................................................... — 12.33 126 Bulgaria................................................................................................................ — 9.59 126 Malaysia ............................................................................................................... — 9.59 128 Cambodia .......................................................................................................... — 4.11 129 Hungary .............................................................................................................. — 0.00 Brunei Darussalam ..................................................................................... n/a n/a Cabo Verde ..................................................................................................... n/a n/a Oman .................................................................................................................. n/a n/a
SOURCE: The Gallup World Poll (2006–2018). Data kindly provided by Gallup, Inc.For some countries, the latest year for which data ar eavailable may differ from the year that appears at the top of the page. The cut-off year is 2008.*Confidential data.
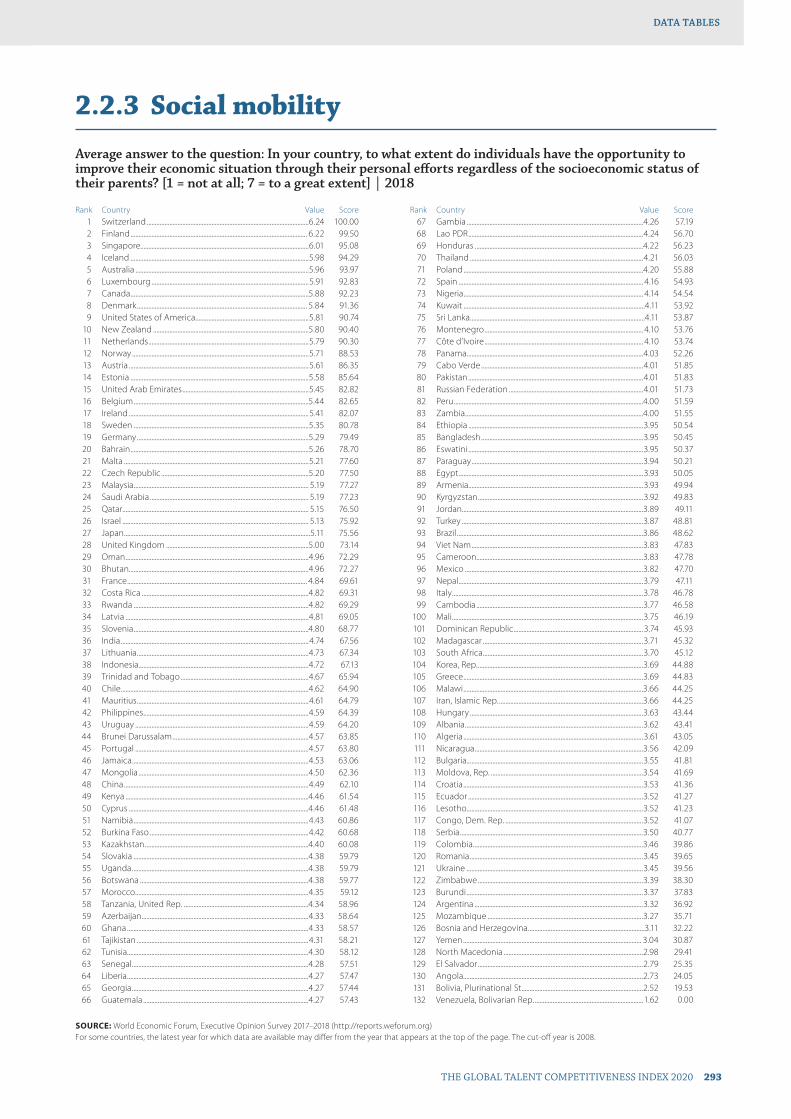
THE GLOBAL TALENT COMPETITIVENESS INDEX 2020 293
DATA TABLESDATA TABLES
2.2.3 Social mobility
Average answer to the question: In your country, to what extent do individuals have the opportunity to improve their economic situation through their personal efforts regardless of the socioeconomic status of their parents? [1 = not at all; 7 = to a great extent] | 2018
Rank Country Value Score 1 Switzerland ....................................................................................................6.24 100.00 2 Finland ............................................................................................................. 6.22 99.50 3 Singapore........................................................................................................6.01 95.08 4 Iceland ..............................................................................................................5.98 94.29 5 Australia ...........................................................................................................5.96 93.97 6 Luxembourg .................................................................................................5.91 92.83 7 Canada ..............................................................................................................5.88 92.23 8 Denmark ......................................................................................................... 5.84 91.36 9 United States of America......................................................................5.81 90.74 10 New Zealand ................................................................................................5.80 90.40 11 Netherlands ...................................................................................................5.79 90.30 12 Norway .............................................................................................................5.71 88.53 13 Austria ...............................................................................................................5.61 86.35 14 Estonia ..............................................................................................................5.58 85.64 15 United Arab Emirates ..............................................................................5.45 82.82 16 Belgium ............................................................................................................5.44 82.65 17 Ireland ...............................................................................................................5.41 82.07 18 Sweden ............................................................................................................5.35 80.78 19 Germany ..........................................................................................................5.29 79.49 20 Bahrain ..............................................................................................................5.26 78.70 21 Malta ..................................................................................................................5.21 77.60 22 Czech Republic ...........................................................................................5.20 77.50 23 Malaysia ............................................................................................................ 5.19 77.27 24 Saudi Arabia .................................................................................................. 5.19 77.23 25 Qatar ................................................................................................................... 5.15 76.50 26 Israel ................................................................................................................... 5.13 75.92 27 Japan ...................................................................................................................5.11 75.56 28 United Kingdom ........................................................................................5.00 73.14 29 Oman .................................................................................................................4.96 72.29 30 Bhutan...............................................................................................................4.96 72.27 31 France ............................................................................................................... 4.84 69.61 32 Costa Rica .......................................................................................................4.82 69.31 33 Rwanda ............................................................................................................4.82 69.29 34 Latvia .................................................................................................................4.81 69.05 35 Slovenia ............................................................................................................4.80 68.77 36 India ....................................................................................................................4.74 67.56 37 Lithuania ..........................................................................................................4.73 67.34 38 Indonesia.........................................................................................................4.72 67.13 39 Trinidad and Tobago ...............................................................................4.67 65.94 40 Chile ....................................................................................................................4.62 64.90 41 Mauritius ..........................................................................................................4.61 64.79 42 Philippines ......................................................................................................4.59 64.39 43 Uruguay ...........................................................................................................4.59 64.20 44 Brunei Darussalam ....................................................................................4.57 63.85 45 Portugal ...........................................................................................................4.57 63.80 46 Jamaica .............................................................................................................4.53 63.06 47 Mongolia .........................................................................................................4.50 62.36 48 China ..................................................................................................................4.49 62.10 49 Kenya .................................................................................................................4.46 61.54 50 Cyprus ...............................................................................................................4.46 61.48 51 Namibia ............................................................................................................4.43 60.86 52 Burkina Faso ..................................................................................................4.42 60.68 53 Kazakhstan .....................................................................................................4.40 60.08 54 Slovakia ............................................................................................................4.38 59.79 55 Uganda .............................................................................................................4.38 59.79 56 Botswana ........................................................................................................4.38 59.77 57 Morocco ...........................................................................................................4.35 59.12 58 Tanzania, United Rep. .............................................................................4.34 58.96 59 Azerbaijan .......................................................................................................4.33 58.64 60 Ghana ................................................................................................................4.33 58.57 61 Tajikistan ..........................................................................................................4.31 58.21 62 Tunisia................................................................................................................4.30 58.12 63 Senegal .............................................................................................................4.28 57.51 64 Liberia ................................................................................................................4.27 57.47 65 Georgia .............................................................................................................4.27 57.44 66 Guatemala ......................................................................................................4.27 57.43
Rank Country Value Score 67 Gambia .............................................................................................................4.26 57.19 68 Lao PDR ............................................................................................................4.24 56.70 69 Honduras ........................................................................................................4.22 56.23 70 Thailand ...........................................................................................................4.21 56.03 71 Poland ...............................................................................................................4.20 55.88 72 Spain .................................................................................................................. 4.16 54.93 73 Nigeria ............................................................................................................... 4.14 54.54 74 Kuwait ................................................................................................................4.11 53.92 75 Sri Lanka ............................................................................................................4.11 53.87 76 Montenegro .................................................................................................. 4.10 53.76 77 Côte d’Ivoire .................................................................................................. 4.10 53.74 78 Panama .............................................................................................................4.03 52.26 79 Cabo Verde ....................................................................................................4.01 51.85 80 Pakistan ............................................................................................................4.01 51.83 81 Russian Federation ...................................................................................4.01 51.73 82 Peru .....................................................................................................................4.00 51.59 83 Zambia ..............................................................................................................4.00 51.55 84 Ethiopia ............................................................................................................3.95 50.54 85 Bangladesh ....................................................................................................3.95 50.45 86 Eswatini ............................................................................................................3.95 50.37 87 Paraguay ..........................................................................................................3.94 50.21 88 Egypt ..................................................................................................................3.93 50.05 89 Armenia............................................................................................................3.93 49.94 90 Kyrgyzstan ......................................................................................................3.92 49.83 91 Jordan................................................................................................................3.89 49.11 92 Turkey ................................................................................................................3.87 48.81 93 Brazil ...................................................................................................................3.86 48.62 94 Viet Nam ..........................................................................................................3.83 47.83 95 Cameroon .......................................................................................................3.83 47.78 96 Mexico ..............................................................................................................3.82 47.70 97 Nepal ..................................................................................................................3.79 47.11 98 Italy ......................................................................................................................3.78 46.78 99 Cambodia .......................................................................................................3.77 46.58 100 Mali ......................................................................................................................3.75 46.19 101 Dominican Republic ................................................................................3.74 45.93 102 Madagascar ...................................................................................................3.71 45.32 103 South Africa ...................................................................................................3.70 45.12 104 Korea, Rep. ......................................................................................................3.69 44.88 105 Greece ...............................................................................................................3.69 44.83 106 Malawi ...............................................................................................................3.66 44.25 107 Iran, Islamic Rep. .........................................................................................3.66 44.25 108 Hungary ...........................................................................................................3.63 43.44 109 Albania ..............................................................................................................3.62 43.41 110 Algeria ...............................................................................................................3.61 43.05 111 Nicaragua ........................................................................................................3.56 42.09 112 Bulgaria.............................................................................................................3.55 41.81 113 Moldova, Rep. ..............................................................................................3.54 41.69 114 Croatia ...............................................................................................................3.53 41.36 115 Ecuador ............................................................................................................3.52 41.27 116 Lesotho.............................................................................................................3.52 41.23 117 Congo, Dem. Rep. .....................................................................................3.52 41.07 118 Serbia .................................................................................................................3.50 40.77 119 Colombia .........................................................................................................3.46 39.86 120 Romania ...........................................................................................................3.45 39.65 121 Ukraine .............................................................................................................3.45 39.56 122 Zimbabwe ......................................................................................................3.39 38.30 123 Burundi .............................................................................................................3.37 37.83 124 Argentina ........................................................................................................3.32 36.92 125 Mozambique ................................................................................................3.27 35.71 126 Bosnia and Herzegovina ........................................................................3.11 32.22 127 Yemen .............................................................................................................. 3.04 30.87 128 North Macedonia ......................................................................................2.98 29.41 129 El Salvador ......................................................................................................2.79 25.35 130 Angola...............................................................................................................2.73 24.05 131 Bolivia, Plurinational St. ..........................................................................2.52 19.53 132 Venezuela, Bolivarian Rep. ...................................................................1.62 0.00
SOURCE: World Economic Forum, Executive Opinion Survey 2017–2018 (http://reports.weforum.org)For some countries, the latest year for which data are available may differ from the year that appears at the top of the page. The cut-off year is 2008.
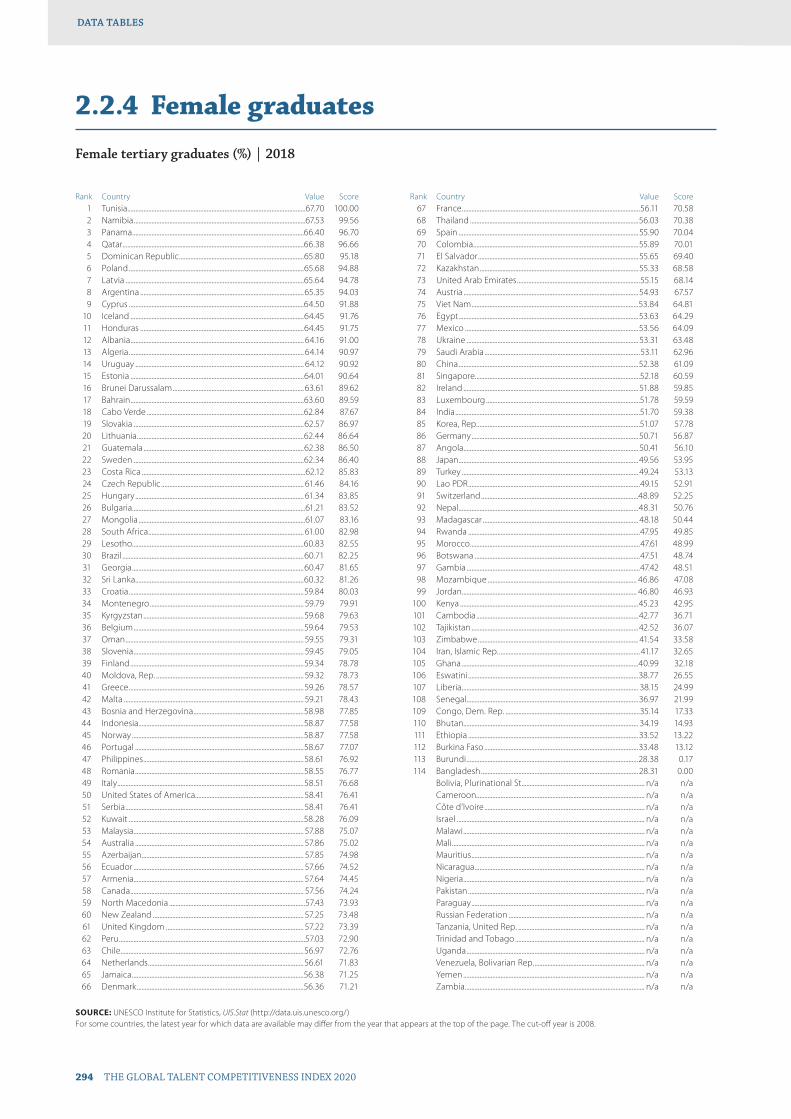
294 THE GLOBAL TALENT COMPETITIVENESS INDEX 2020
DATA TABLESDATA TABLES
2.2.4 Female graduates
Female tertiary graduates (%) | 2018
Rank Country Value Score 1 Tunisia..............................................................................................................67.70 100.00 2 Namibia ..........................................................................................................67.53 99.56 3 Panama ..........................................................................................................66.40 96.70 4 Qatar ................................................................................................................66.38 96.66 5 Dominican Republic .............................................................................65.80 95.18 6 Poland ............................................................................................................65.68 94.88 7 Latvia ..............................................................................................................65.64 94.78 8 Argentina .....................................................................................................65.35 94.03 9 Cyprus ............................................................................................................64.50 91.88 10 Iceland ...........................................................................................................64.45 91.76 11 Honduras .....................................................................................................64.45 91.75 12 Albania ........................................................................................................... 64.16 91.00 13 Algeria ............................................................................................................ 64.14 90.97 14 Uruguay ........................................................................................................ 64.12 90.92 15 Estonia ...........................................................................................................64.01 90.64 16 Brunei Darussalam ................................................................................. 63.61 89.62 17 Bahrain ...........................................................................................................63.60 89.59 18 Cabo Verde .................................................................................................62.84 87.67 19 Slovakia .........................................................................................................62.57 86.97 20 Lithuania .......................................................................................................62.44 86.64 21 Guatemala ...................................................................................................62.38 86.50 22 Sweden .........................................................................................................62.34 86.40 23 Costa Rica .....................................................................................................62.12 85.83 24 Czech Republic ........................................................................................ 61.46 84.16 25 Hungary ........................................................................................................ 61.34 83.85 26 Bulgaria...........................................................................................................61.21 83.52 27 Mongolia .......................................................................................................61.07 83.16 28 South Africa ................................................................................................ 61.00 82.98 29 Lesotho..........................................................................................................60.83 82.55 30 Brazil ................................................................................................................60.71 82.25 31 Georgia ..........................................................................................................60.47 81.65 32 Sri Lanka ........................................................................................................60.32 81.26 33 Croatia ............................................................................................................59.84 80.03 34 Montenegro ............................................................................................... 59.79 79.91 35 Kyrgyzstan ...................................................................................................59.68 79.63 36 Belgium .........................................................................................................59.64 79.53 37 Oman .............................................................................................................. 59.55 79.31 38 Slovenia ......................................................................................................... 59.45 79.05 39 Finland ...........................................................................................................59.34 78.78 40 Moldova, Rep. ........................................................................................... 59.32 78.73 41 Greece ............................................................................................................59.26 78.57 42 Malta ............................................................................................................... 59.21 78.43 43 Bosnia and Herzegovina ....................................................................58.98 77.85 44 Indonesia......................................................................................................58.87 77.58 45 Norway ..........................................................................................................58.87 77.58 46 Portugal ........................................................................................................58.67 77.07 47 Philippines ...................................................................................................58.61 76.92 48 Romania ........................................................................................................58.55 76.77 49 Italy ...................................................................................................................58.51 76.68 50 United States of America................................................................... 58.41 76.41 51 Serbia .............................................................................................................. 58.41 76.41 52 Kuwait ............................................................................................................58.28 76.09 53 Malaysia ......................................................................................................... 57.88 75.07 54 Australia ........................................................................................................ 57.86 75.02 55 Azerbaijan .................................................................................................... 57.85 74.98 56 Ecuador ......................................................................................................... 57.66 74.52 57 Armenia......................................................................................................... 57.64 74.45 58 Canada ........................................................................................................... 57.56 74.24 59 North Macedonia ....................................................................................57.43 73.93 60 New Zealand ............................................................................................. 57.25 73.48 61 United Kingdom ..................................................................................... 57.22 73.39 62 Peru ...................................................................................................................57.03 72.90 63 Chile .................................................................................................................56.97 72.76 64 Netherlands ................................................................................................56.61 71.83 65 Jamaica ..........................................................................................................56.38 71.25 66 Denmark .......................................................................................................56.36 71.21
Rank Country Value Score 67 France ..............................................................................................................56.11 70.58 68 Thailand ........................................................................................................56.03 70.38 69 Spain ...............................................................................................................55.90 70.04 70 Colombia ......................................................................................................55.89 70.01 71 El Salvador ...................................................................................................55.65 69.40 72 Kazakhstan ..................................................................................................55.33 68.58 73 United Arab Emirates ............................................................................55.15 68.14 74 Austria ............................................................................................................54.93 67.57 75 Viet Nam .......................................................................................................53.84 64.81 76 Egypt ...............................................................................................................53.63 64.29 77 Mexico ...........................................................................................................53.56 64.09 78 Ukraine .......................................................................................................... 53.31 63.48 79 Saudi Arabia ................................................................................................53.11 62.96 80 China ...............................................................................................................52.38 61.09 81 Singapore......................................................................................................52.18 60.59 82 Ireland ............................................................................................................ 51.88 59.85 83 Luxembourg ...............................................................................................51.78 59.59 84 India ..................................................................................................................51.70 59.38 85 Korea, Rep. ....................................................................................................51.07 57.78 86 Germany .......................................................................................................50.71 56.87 87 Angola............................................................................................................ 50.41 56.10 88 Japan ...............................................................................................................49.56 53.95 89 Turkey ............................................................................................................. 49.24 53.13 90 Lao PDR ..........................................................................................................49.15 52.91 91 Switzerland .................................................................................................48.89 52.25 92 Nepal ...............................................................................................................48.31 50.76 93 Madagascar ................................................................................................ 48.18 50.44 94 Rwanda ..........................................................................................................47.95 49.85 95 Morocco .........................................................................................................47.61 48.99 96 Botswana ......................................................................................................47.51 48.74 97 Gambia ...........................................................................................................47.42 48.51 98 Mozambique ............................................................................................ 46.86 47.08 99 Jordan............................................................................................................ 46.80 46.93 100 Kenya ..............................................................................................................45.23 42.95 101 Cambodia ....................................................................................................42.77 36.71 102 Tajikistan .......................................................................................................42.52 36.07 103 Zimbabwe ................................................................................................... 41.54 33.58 104 Iran, Islamic Rep. ....................................................................................... 41.17 32.65 105 Ghana .............................................................................................................40.99 32.18 106 Eswatini .........................................................................................................38.77 26.55 107 Liberia ............................................................................................................. 38.15 24.99 108 Senegal ..........................................................................................................36.97 21.99 109 Congo, Dem. Rep. ...................................................................................35.14 17.33 110 Bhutan............................................................................................................ 34.19 14.93 111 Ethiopia .........................................................................................................33.52 13.22 112 Burkina Faso ...............................................................................................33.48 13.12 113 Burundi ..........................................................................................................28.38 0.17 114 Bangladesh .................................................................................................28.31 0.00 Bolivia, Plurinational St. ........................................................................... n/a n/a Cameroon ........................................................................................................ n/a n/a Côte d’Ivoire ................................................................................................... n/a n/a Israel .................................................................................................................... n/a n/a Malawi ................................................................................................................ n/a n/a Mali ....................................................................................................................... n/a n/a Mauritius ........................................................................................................... n/a n/a Nicaragua ......................................................................................................... n/a n/a Nigeria ................................................................................................................ n/a n/a Pakistan ............................................................................................................. n/a n/a Paraguay ........................................................................................................... n/a n/a Russian Federation .................................................................................... n/a n/a Tanzania, United Rep. .............................................................................. n/a n/a Trinidad and Tobago ................................................................................ n/a n/a Uganda .............................................................................................................. n/a n/a Venezuela, Bolivarian Rep. .................................................................... n/a n/a Yemen ................................................................................................................ n/a n/a Zambia ............................................................................................................... n/a n/a
SOURCE: UNESCO Institute for Statistics, UIS.Stat (http://data.uis.unesco.org/)For some countries, the latest year for which data are available may differ from the year that appears at the top of the page. The cut-off year is 2008.
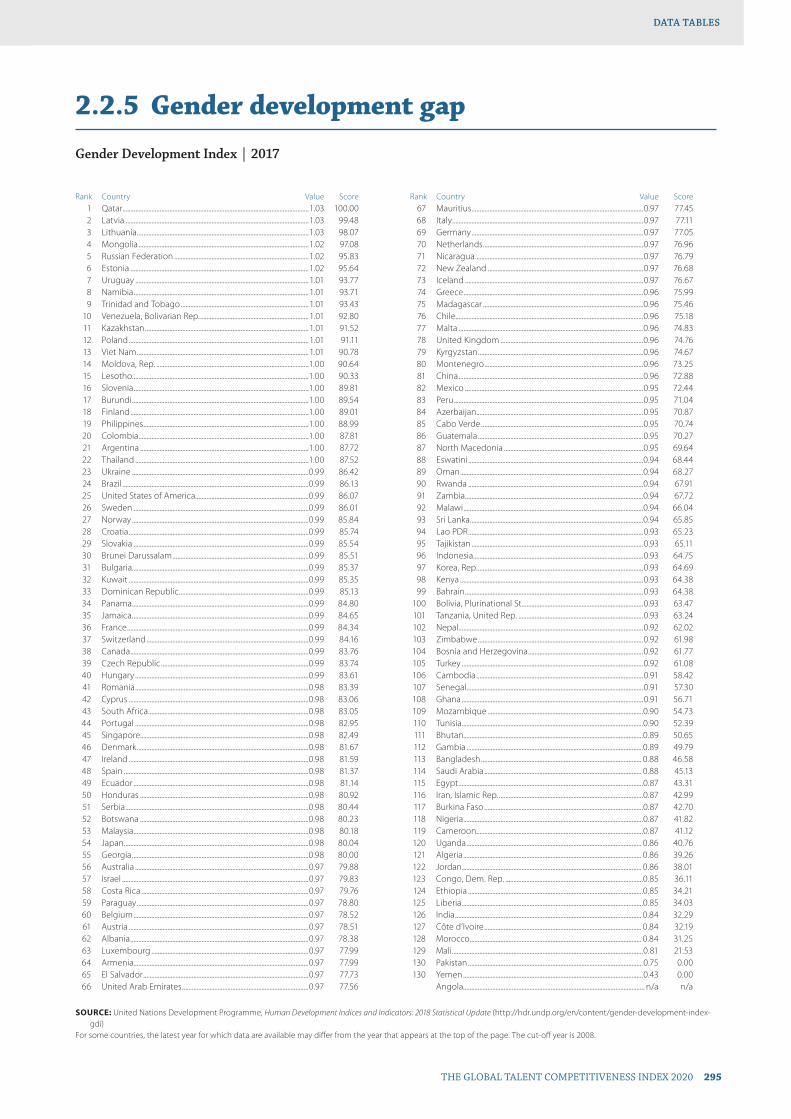
THE GLOBAL TALENT COMPETITIVENESS INDEX 2020 295
DATA TABLESDATA TABLES
2.2.5 Gender development gap
Gender Development Index | 2017
Rank Country Value Score 1 Qatar ...................................................................................................................1.03 100.00 2 Latvia .................................................................................................................1.03 99.48 3 Lithuania ..........................................................................................................1.03 98.07 4 Mongolia .........................................................................................................1.02 97.08 5 Russian Federation ...................................................................................1.02 95.83 6 Estonia ..............................................................................................................1.02 95.64 7 Uruguay ...........................................................................................................1.01 93.77 8 Namibia ............................................................................................................1.01 93.71 9 Trinidad and Tobago ...............................................................................1.01 93.43 10 Venezuela, Bolivarian Rep. ...................................................................1.01 92.80 11 Kazakhstan .....................................................................................................1.01 91.52 12 Poland ...............................................................................................................1.01 91.11 13 Viet Nam ..........................................................................................................1.01 90.78 14 Moldova, Rep. ..............................................................................................1.00 90.64 15 Lesotho.............................................................................................................1.00 90.33 16 Slovenia ............................................................................................................1.00 89.81 17 Burundi .............................................................................................................1.00 89.54 18 Finland ..............................................................................................................1.00 89.01 19 Philippines ......................................................................................................1.00 88.99 20 Colombia .........................................................................................................1.00 87.81 21 Argentina ........................................................................................................1.00 87.72 22 Thailand ...........................................................................................................1.00 87.52 23 Ukraine .............................................................................................................0.99 86.42 24 Brazil ...................................................................................................................0.99 86.13 25 United States of America......................................................................0.99 86.07 26 Sweden ............................................................................................................0.99 86.01 27 Norway .............................................................................................................0.99 85.84 28 Croatia ...............................................................................................................0.99 85.74 29 Slovakia ............................................................................................................0.99 85.54 30 Brunei Darussalam ....................................................................................0.99 85.51 31 Bulgaria.............................................................................................................0.99 85.37 32 Kuwait ...............................................................................................................0.99 85.35 33 Dominican Republic ................................................................................0.99 85.13 34 Panama .............................................................................................................0.99 84.80 35 Jamaica .............................................................................................................0.99 84.65 36 France ................................................................................................................0.99 84.34 37 Switzerland ....................................................................................................0.99 84.16 38 Canada ..............................................................................................................0.99 83.76 39 Czech Republic ...........................................................................................0.99 83.74 40 Hungary ...........................................................................................................0.99 83.61 41 Romania ...........................................................................................................0.98 83.39 42 Cyprus ...............................................................................................................0.98 83.06 43 South Africa ...................................................................................................0.98 83.05 44 Portugal ...........................................................................................................0.98 82.95 45 Singapore........................................................................................................0.98 82.49 46 Denmark ..........................................................................................................0.98 81.67 47 Ireland ...............................................................................................................0.98 81.59 48 Spain ..................................................................................................................0.98 81.37 49 Ecuador ............................................................................................................0.98 81.14 50 Honduras ........................................................................................................0.98 80.92 51 Serbia .................................................................................................................0.98 80.44 52 Botswana ........................................................................................................0.98 80.23 53 Malaysia ............................................................................................................0.98 80.18 54 Japan ..................................................................................................................0.98 80.04 55 Georgia .............................................................................................................0.98 80.00 56 Australia ...........................................................................................................0.97 79.88 57 Israel ...................................................................................................................0.97 79.83 58 Costa Rica .......................................................................................................0.97 79.76 59 Paraguay ..........................................................................................................0.97 78.80 60 Belgium ............................................................................................................0.97 78.52 61 Austria ...............................................................................................................0.97 78.51 62 Albania ..............................................................................................................0.97 78.38 63 Luxembourg .................................................................................................0.97 77.99 64 Armenia............................................................................................................0.97 77.99 65 El Salvador ......................................................................................................0.97 77.73 66 United Arab Emirates ..............................................................................0.97 77.56
Rank Country Value Score 67 Mauritius ..........................................................................................................0.97 77.45 68 Italy ......................................................................................................................0.97 77.11 69 Germany ..........................................................................................................0.97 77.05 70 Netherlands ...................................................................................................0.97 76.96 71 Nicaragua ........................................................................................................0.97 76.79 72 New Zealand ................................................................................................0.97 76.68 73 Iceland ..............................................................................................................0.97 76.67 74 Greece ...............................................................................................................0.96 75.99 75 Madagascar ...................................................................................................0.96 75.46 76 Chile ....................................................................................................................0.96 75.18 77 Malta ..................................................................................................................0.96 74.83 78 United Kingdom ........................................................................................0.96 74.76 79 Kyrgyzstan ......................................................................................................0.96 74.67 80 Montenegro ..................................................................................................0.96 73.25 81 China ..................................................................................................................0.96 72.88 82 Mexico ..............................................................................................................0.95 72.44 83 Peru .....................................................................................................................0.95 71.04 84 Azerbaijan .......................................................................................................0.95 70.87 85 Cabo Verde ....................................................................................................0.95 70.74 86 Guatemala ......................................................................................................0.95 70.27 87 North Macedonia ......................................................................................0.95 69.64 88 Eswatini ............................................................................................................0.94 68.44 89 Oman .................................................................................................................0.94 68.27 90 Rwanda ............................................................................................................0.94 67.91 91 Zambia ..............................................................................................................0.94 67.72 92 Malawi ...............................................................................................................0.94 66.04 93 Sri Lanka ...........................................................................................................0.94 65.85 94 Lao PDR ............................................................................................................0.93 65.23 95 Tajikistan ..........................................................................................................0.93 65.11 96 Indonesia.........................................................................................................0.93 64.75 97 Korea, Rep. ......................................................................................................0.93 64.69 98 Kenya .................................................................................................................0.93 64.38 99 Bahrain ..............................................................................................................0.93 64.38 100 Bolivia, Plurinational St. ..........................................................................0.93 63.47 101 Tanzania, United Rep. .............................................................................0.93 63.24 102 Nepal ..................................................................................................................0.92 62.02 103 Zimbabwe ......................................................................................................0.92 61.98 104 Bosnia and Herzegovina .......................................................................0.92 61.77 105 Turkey ................................................................................................................0.92 61.08 106 Cambodia .......................................................................................................0.91 58.42 107 Senegal .............................................................................................................0.91 57.30 108 Ghana ................................................................................................................0.91 56.71 109 Mozambique ................................................................................................0.90 54.73 110 Tunisia................................................................................................................0.90 52.39 111 Bhutan...............................................................................................................0.89 50.65 112 Gambia .............................................................................................................0.89 49.79 113 Bangladesh ................................................................................................... 0.88 46.58 114 Saudi Arabia ................................................................................................. 0.88 45.13 115 Egypt ..................................................................................................................0.87 43.31 116 Iran, Islamic Rep. .........................................................................................0.87 42.99 117 Burkina Faso ..................................................................................................0.87 42.70 118 Nigeria ...............................................................................................................0.87 41.82 119 Cameroon .......................................................................................................0.87 41.12 120 Uganda ............................................................................................................ 0.86 40.76 121 Algeria .............................................................................................................. 0.86 39.26 122 Jordan............................................................................................................... 0.86 38.01 123 Congo, Dem. Rep. .....................................................................................0.85 36.11 124 Ethiopia ............................................................................................................0.85 34.21 125 Liberia ................................................................................................................0.85 34.03 126 India ................................................................................................................... 0.84 32.29 127 Côte d’Ivoire ................................................................................................. 0.84 32.19 128 Morocco .......................................................................................................... 0.84 31.25 129 Mali ......................................................................................................................0.81 21.53 130 Pakistan ............................................................................................................0.75 0.00 130 Yemen ...............................................................................................................0.43 0.00 Angola................................................................................................................ n/a n/a
SOURCE: United Nations Development Programme, Human Development Indices and Indicators: 2018 Statistical Update (http://hdr.undp.org/en/content/gender-development-index-gdi)
For some countries, the latest year for which data are available may differ from the year that appears at the top of the page. The cut-off year is 2008.
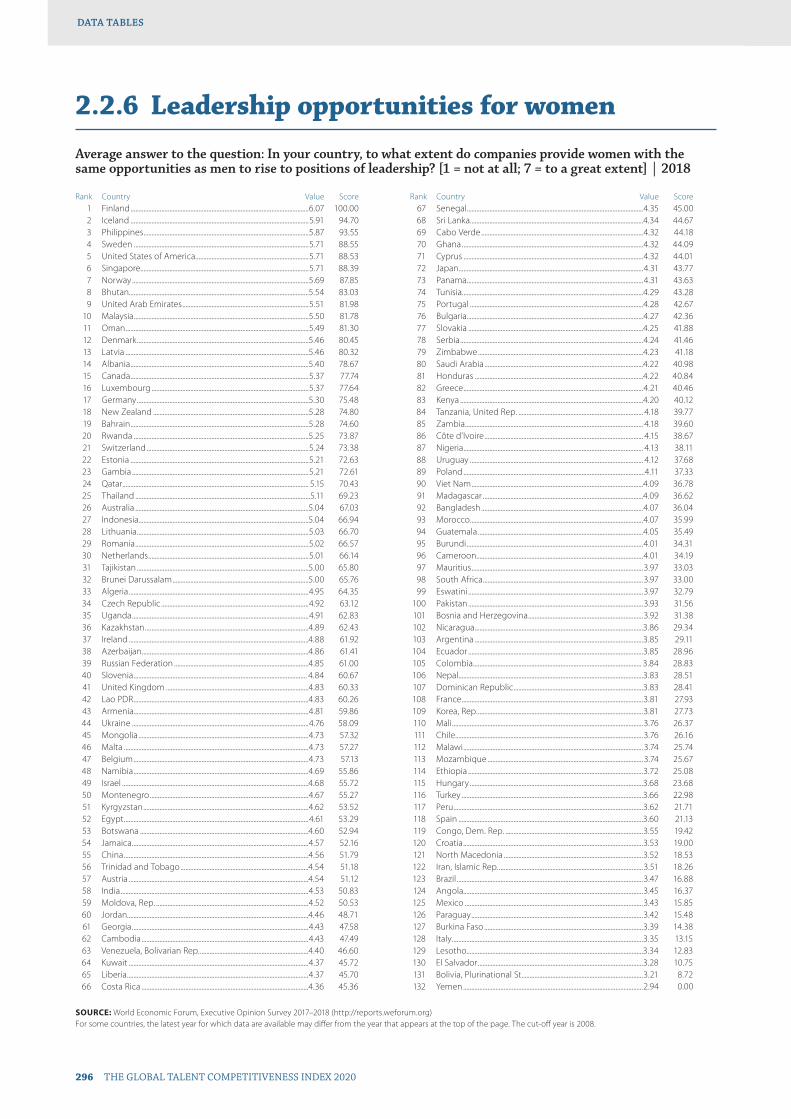
DATA TABLESDATA TABLES
296 THE GLOBAL TALENT COMPETITIVENESS INDEX 2020
DATA TABLESDATA TABLES
2.2.6 Leadership opportunities for women
Average answer to the question: In your country, to what extent do companies provide women with the same opportunities as men to rise to positions of leadership? [1 = not at all; 7 = to a great extent] | 2018
Rank Country Value Score 1 Finland ..............................................................................................................6.07 100.00 2 Iceland ..............................................................................................................5.91 94.70 3 Philippines ......................................................................................................5.87 93.55 4 Sweden ............................................................................................................5.71 88.55 5 United States of America......................................................................5.71 88.53 6 Singapore........................................................................................................5.71 88.39 7 Norway .............................................................................................................5.69 87.85 8 Bhutan...............................................................................................................5.54 83.03 9 United Arab Emirates ..............................................................................5.51 81.98 10 Malaysia ............................................................................................................5.50 81.78 11 Oman .................................................................................................................5.49 81.30 12 Denmark ..........................................................................................................5.46 80.45 13 Latvia .................................................................................................................5.46 80.32 14 Albania ..............................................................................................................5.40 78.67 15 Canada ..............................................................................................................5.37 77.74 16 Luxembourg .................................................................................................5.37 77.64 17 Germany ..........................................................................................................5.30 75.48 18 New Zealand ................................................................................................5.28 74.80 19 Bahrain ..............................................................................................................5.28 74.60 20 Rwanda ............................................................................................................5.25 73.87 21 Switzerland ....................................................................................................5.24 73.38 22 Estonia ..............................................................................................................5.21 72.63 23 Gambia .............................................................................................................5.21 72.61 24 Qatar ................................................................................................................... 5.15 70.43 25 Thailand ............................................................................................................5.11 69.23 26 Australia ...........................................................................................................5.04 67.03 27 Indonesia.........................................................................................................5.04 66.94 28 Lithuania ..........................................................................................................5.03 66.70 29 Romania ...........................................................................................................5.02 66.57 30 Netherlands ...................................................................................................5.01 66.14 31 Tajikistan ..........................................................................................................5.00 65.80 32 Brunei Darussalam ....................................................................................5.00 65.76 33 Algeria ...............................................................................................................4.95 64.35 34 Czech Republic ...........................................................................................4.92 63.12 35 Uganda .............................................................................................................4.91 62.83 36 Kazakhstan .....................................................................................................4.89 62.43 37 Ireland ...............................................................................................................4.88 61.92 38 Azerbaijan .......................................................................................................4.86 61.41 39 Russian Federation ...................................................................................4.85 61.00 40 Slovenia ........................................................................................................... 4.84 60.67 41 United Kingdom ........................................................................................4.83 60.33 42 Lao PDR ............................................................................................................4.83 60.26 43 Armenia............................................................................................................4.81 59.86 44 Ukraine .............................................................................................................4.76 58.09 45 Mongolia .........................................................................................................4.73 57.32 46 Malta ..................................................................................................................4.73 57.27 47 Belgium ............................................................................................................4.73 57.13 48 Namibia ............................................................................................................4.69 55.86 49 Israel ...................................................................................................................4.68 55.72 50 Montenegro ..................................................................................................4.67 55.27 51 Kyrgyzstan ......................................................................................................4.62 53.52 52 Egypt ..................................................................................................................4.61 53.29 53 Botswana ........................................................................................................4.60 52.94 54 Jamaica .............................................................................................................4.57 52.16 55 China ..................................................................................................................4.56 51.79 56 Trinidad and Tobago ...............................................................................4.54 51.18 57 Austria ...............................................................................................................4.54 51.12 58 India ....................................................................................................................4.53 50.83 59 Moldova, Rep. ..............................................................................................4.52 50.53 60 Jordan................................................................................................................4.46 48.71 61 Georgia .............................................................................................................4.43 47.58 62 Cambodia .......................................................................................................4.43 47.49 63 Venezuela, Bolivarian Rep. ...................................................................4.40 46.60 64 Kuwait ...............................................................................................................4.37 45.72 65 Liberia ................................................................................................................4.37 45.70 66 Costa Rica .......................................................................................................4.36 45.36
Rank Country Value Score 67 Senegal .............................................................................................................4.35 45.00 68 Sri Lanka ...........................................................................................................4.34 44.67 69 Cabo Verde ....................................................................................................4.32 44.18 70 Ghana ................................................................................................................4.32 44.09 71 Cyprus ...............................................................................................................4.32 44.01 72 Japan ..................................................................................................................4.31 43.77 73 Panama .............................................................................................................4.31 43.63 74 Tunisia................................................................................................................4.29 43.28 75 Portugal ...........................................................................................................4.28 42.67 76 Bulgaria.............................................................................................................4.27 42.36 77 Slovakia ............................................................................................................4.25 41.88 78 Serbia .................................................................................................................4.24 41.46 79 Zimbabwe ......................................................................................................4.23 41.18 80 Saudi Arabia ..................................................................................................4.22 40.98 81 Honduras ........................................................................................................4.22 40.84 82 Greece ...............................................................................................................4.21 40.46 83 Kenya .................................................................................................................4.20 40.12 84 Tanzania, United Rep. ............................................................................. 4.18 39.77 85 Zambia .............................................................................................................. 4.18 39.60 86 Côte d’Ivoire .................................................................................................. 4.15 38.67 87 Nigeria ............................................................................................................... 4.13 38.11 88 Uruguay ........................................................................................................... 4.12 37.68 89 Poland ................................................................................................................4.11 37.33 90 Viet Nam ..........................................................................................................4.09 36.78 91 Madagascar ...................................................................................................4.09 36.62 92 Bangladesh ....................................................................................................4.07 36.04 93 Morocco ...........................................................................................................4.07 35.99 94 Guatemala ......................................................................................................4.05 35.49 95 Burundi .............................................................................................................4.01 34.31 96 Cameroon .......................................................................................................4.01 34.19 97 Mauritius ..........................................................................................................3.97 33.03 98 South Africa ...................................................................................................3.97 33.00 99 Eswatini ............................................................................................................3.97 32.79 100 Pakistan ............................................................................................................3.93 31.56 101 Bosnia and Herzegovina .......................................................................3.92 31.38 102 Nicaragua ........................................................................................................3.86 29.34 103 Argentina ........................................................................................................3.85 29.11 104 Ecuador ............................................................................................................3.85 28.96 105 Colombia ........................................................................................................ 3.84 28.83 106 Nepal ..................................................................................................................3.83 28.51 107 Dominican Republic ................................................................................3.83 28.41 108 France ................................................................................................................3.81 27.93 109 Korea, Rep. ......................................................................................................3.81 27.73 110 Mali ......................................................................................................................3.76 26.37 111 Chile ....................................................................................................................3.76 26.16 112 Malawi ...............................................................................................................3.74 25.74 113 Mozambique ................................................................................................3.74 25.67 114 Ethiopia ............................................................................................................3.72 25.08 115 Hungary ...........................................................................................................3.68 23.68 116 Turkey ................................................................................................................3.66 22.98 117 Peru .....................................................................................................................3.62 21.71 118 Spain ..................................................................................................................3.60 21.13 119 Congo, Dem. Rep. .....................................................................................3.55 19.42 120 Croatia ...............................................................................................................3.53 19.00 121 North Macedonia ......................................................................................3.52 18.53 122 Iran, Islamic Rep. .........................................................................................3.51 18.26 123 Brazil ...................................................................................................................3.47 16.88 124 Angola...............................................................................................................3.45 16.37 125 Mexico ..............................................................................................................3.43 15.85 126 Paraguay ..........................................................................................................3.42 15.48 127 Burkina Faso ..................................................................................................3.39 14.38 128 Italy ......................................................................................................................3.35 13.15 129 Lesotho.............................................................................................................3.34 12.83 130 El Salvador ......................................................................................................3.28 10.75 131 Bolivia, Plurinational St. ..........................................................................3.21 8.72 132 Yemen ...............................................................................................................2.94 0.00
SOURCE: World Economic Forum, Executive Opinion Survey 2017–2018 (http://reports.weforum.org)For some countries, the latest year for which data are available may differ from the year that appears at the top of the page. The cut-off year is 2008.

THE GLOBAL TALENT COMPETITIVENESS INDEX 2020 297
DATA TABLESDATA TABLES DATA TABLESDATA TABLES
Pillar 3Grow
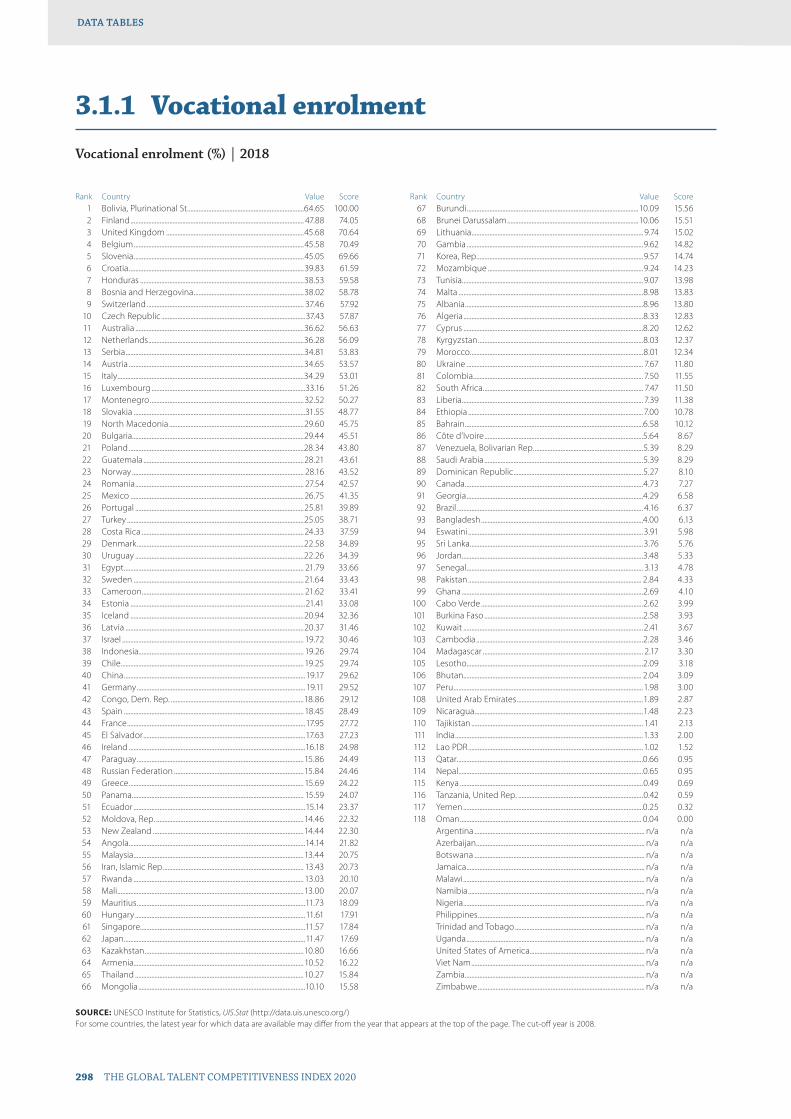
298 THE GLOBAL TALENT COMPETITIVENESS INDEX 2020
DATA TABLESDATA TABLES
3.1.1 Vocational enrolment
Vocational enrolment (%) | 2018
Rank Country Value Score 1 Bolivia, Plurinational St. .......................................................................64.65 100.00 2 Finland ........................................................................................................... 47.88 74.05 3 United Kingdom .....................................................................................45.68 70.64 4 Belgium .........................................................................................................45.58 70.49 5 Slovenia .........................................................................................................45.05 69.66 6 Croatia ............................................................................................................39.83 61.59 7 Honduras .....................................................................................................38.53 59.58 8 Bosnia and Herzegovina ....................................................................38.02 58.78 9 Switzerland ................................................................................................. 37.46 57.92 10 Czech Republic .........................................................................................37.43 57.87 11 Australia ........................................................................................................36.62 56.63 12 Netherlands ................................................................................................36.28 56.09 13 Serbia ..............................................................................................................34.81 53.83 14 Austria ............................................................................................................34.65 53.57 15 Italy ...................................................................................................................34.29 53.01 16 Luxembourg ...............................................................................................33.16 51.26 17 Montenegro ...............................................................................................32.52 50.27 18 Slovakia ..........................................................................................................31.55 48.77 19 North Macedonia ...................................................................................29.60 45.75 20 Bulgaria..........................................................................................................29.44 45.51 21 Poland ............................................................................................................28.34 43.80 22 Guatemala ...................................................................................................28.21 43.61 23 Norway .......................................................................................................... 28.16 43.52 24 Romania ........................................................................................................ 27.54 42.57 25 Mexico ...........................................................................................................26.75 41.35 26 Portugal ........................................................................................................25.81 39.89 27 Turkey .............................................................................................................25.05 38.71 28 Costa Rica ....................................................................................................24.33 37.59 29 Denmark .......................................................................................................22.58 34.89 30 Uruguay ........................................................................................................22.26 34.39 31 Egypt ............................................................................................................... 21.79 33.66 32 Sweden .........................................................................................................21.64 33.43 33 Cameroon .................................................................................................... 21.62 33.41 34 Estonia ............................................................................................................21.41 33.08 35 Iceland ...........................................................................................................20.94 32.36 36 Latvia ..............................................................................................................20.37 31.46 37 Israel ................................................................................................................ 19.72 30.46 38 Indonesia...................................................................................................... 19.26 29.74 39 Chile ................................................................................................................. 19.25 29.74 40 China ................................................................................................................19.17 29.62 41 Germany ........................................................................................................ 19.11 29.52 42 Congo, Dem. Rep. ..................................................................................18.86 29.12 43 Spain ............................................................................................................... 18.45 28.49 44 France ..............................................................................................................17.95 27.72 45 El Salvador ....................................................................................................17.63 27.23 46 Ireland .............................................................................................................16.18 24.98 47 Paraguay .......................................................................................................15.86 24.49 48 Russian Federation ................................................................................15.84 24.46 49 Greece ............................................................................................................ 15.69 24.22 50 Panama .......................................................................................................... 15.59 24.07 51 Ecuador ..........................................................................................................15.14 23.37 52 Moldova, Rep. ...........................................................................................14.46 22.32 53 New Zealand .............................................................................................14.44 22.30 54 Angola.............................................................................................................14.14 21.82 55 Malaysia .........................................................................................................13.44 20.75 56 Iran, Islamic Rep. ...................................................................................... 13.43 20.73 57 Rwanda ......................................................................................................... 13.03 20.10 58 Mali ...................................................................................................................13.00 20.07 59 Mauritius ........................................................................................................11.73 18.09 60 Hungary .........................................................................................................11.61 17.91 61 Singapore......................................................................................................11.57 17.84 62 Japan ................................................................................................................11.47 17.69 63 Kazakhstan ..................................................................................................10.80 16.66 64 Armenia.........................................................................................................10.52 16.22 65 Thailand ........................................................................................................10.27 15.84 66 Mongolia .......................................................................................................10.10 15.58
Rank Country Value Score 67 Burundi ..........................................................................................................10.09 15.56 68 Brunei Darussalam .................................................................................10.06 15.51 69 Lithuania .......................................................................................................... 9.74 15.02 70 Gambia .............................................................................................................9.62 14.82 71 Korea, Rep. ......................................................................................................9.57 14.74 72 Mozambique ................................................................................................9.24 14.23 73 Tunisia................................................................................................................9.07 13.98 74 Malta ..................................................................................................................8.98 13.83 75 Albania ..............................................................................................................8.96 13.80 76 Algeria ...............................................................................................................8.33 12.83 77 Cyprus ...............................................................................................................8.20 12.62 78 Kyrgyzstan ......................................................................................................8.03 12.37 79 Morocco ...........................................................................................................8.01 12.34 80 Ukraine ............................................................................................................. 7.67 11.80 81 Colombia ......................................................................................................... 7.50 11.55 82 South Africa ................................................................................................... 7.47 11.50 83 Liberia ................................................................................................................ 7.39 11.38 84 Ethiopia ............................................................................................................7.00 10.78 85 Bahrain ..............................................................................................................6.58 10.12 86 Côte d’Ivoire ..................................................................................................5.64 8.67 87 Venezuela, Bolivarian Rep. ...................................................................5.39 8.29 88 Saudi Arabia ..................................................................................................5.39 8.29 89 Dominican Republic ................................................................................5.27 8.10 90 Canada ..............................................................................................................4.73 7.27 91 Georgia .............................................................................................................4.29 6.58 92 Brazil ................................................................................................................... 4.16 6.37 93 Bangladesh ....................................................................................................4.00 6.13 94 Eswatini ............................................................................................................3.91 5.98 95 Sri Lanka ...........................................................................................................3.76 5.76 96 Jordan................................................................................................................3.48 5.33 97 Senegal ............................................................................................................. 3.13 4.78 98 Pakistan ........................................................................................................... 2.84 4.33 99 Ghana ................................................................................................................2.69 4.10 100 Cabo Verde ....................................................................................................2.62 3.99 101 Burkina Faso ..................................................................................................2.58 3.93 102 Kuwait ...............................................................................................................2.41 3.67 103 Cambodia .......................................................................................................2.28 3.46 104 Madagascar ................................................................................................... 2.17 3.30 105 Lesotho.............................................................................................................2.09 3.18 106 Bhutan.............................................................................................................. 2.04 3.09 107 Peru .....................................................................................................................1.98 3.00 108 United Arab Emirates ..............................................................................1.89 2.87 109 Nicaragua ........................................................................................................1.48 2.23 110 Tajikistan .......................................................................................................... 1.41 2.13 111 India ....................................................................................................................1.33 2.00 112 Lao PDR ............................................................................................................1.02 1.52 113 Qatar ...................................................................................................................0.66 0.95 114 Nepal ..................................................................................................................0.65 0.95 115 Kenya .................................................................................................................0.49 0.69 116 Tanzania, United Rep. .............................................................................0.42 0.59 117 Yemen ...............................................................................................................0.25 0.32 118 Oman ................................................................................................................ 0.04 0.00 Argentina ......................................................................................................... n/a n/a Azerbaijan ........................................................................................................ n/a n/a Botswana ......................................................................................................... n/a n/a Jamaica .............................................................................................................. n/a n/a Malawi ................................................................................................................ n/a n/a Namibia ............................................................................................................. n/a n/a Nigeria ................................................................................................................ n/a n/a Philippines ....................................................................................................... n/a n/a Trinidad and Tobago ................................................................................ n/a n/a Uganda .............................................................................................................. n/a n/a United States of America....................................................................... n/a n/a Viet Nam ........................................................................................................... n/a n/a Zambia ............................................................................................................... n/a n/a Zimbabwe ....................................................................................................... n/a n/a
SOURCE: UNESCO Institute for Statistics, UIS.Stat (http://data.uis.unesco.org/)For some countries, the latest year for which data are available may differ from the year that appears at the top of the page. The cut-off year is 2008.
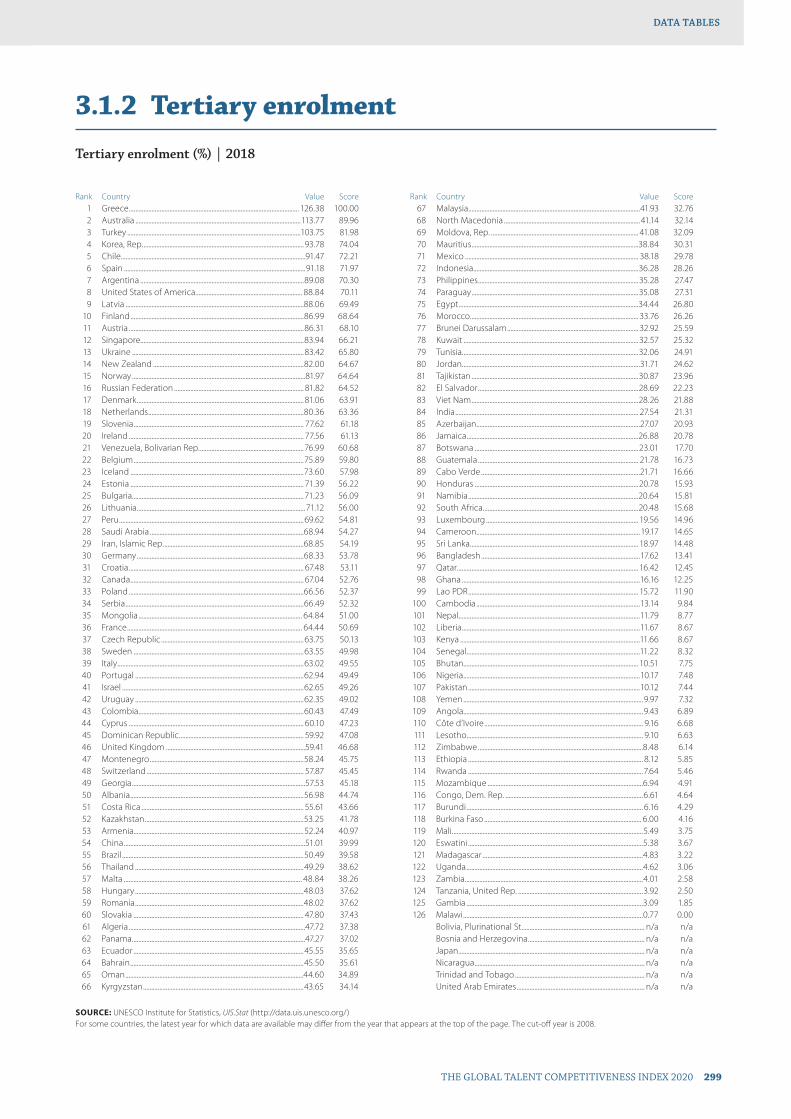
THE GLOBAL TALENT COMPETITIVENESS INDEX 2020 299
DATA TABLESDATA TABLES
3.1.2 Tertiary enrolment
Tertiary enrolment (%) | 2018
Rank Country Value Score 1 Greece ......................................................................................................... 126.38 100.00 2 Australia ......................................................................................................113.77 89.96 3 Turkey ...........................................................................................................103.75 81.98 4 Korea, Rep. ...................................................................................................93.78 74.04 5 Chile ..................................................................................................................91.47 72.21 6 Spain ................................................................................................................91.18 71.97 7 Argentina .....................................................................................................89.08 70.30 8 United States of America.................................................................. 88.84 70.11 9 Latvia ..............................................................................................................88.06 69.49 10 Finland ...........................................................................................................86.99 68.64 11 Austria ............................................................................................................86.31 68.10 12 Singapore.....................................................................................................83.94 66.21 13 Ukraine ..........................................................................................................83.42 65.80 14 New Zealand .............................................................................................82.00 64.67 15 Norway ...........................................................................................................81.97 64.64 16 Russian Federation ................................................................................ 81.82 64.52 17 Denmark ....................................................................................................... 81.06 63.91 18 Netherlands ................................................................................................80.36 63.36 19 Slovenia ......................................................................................................... 77.62 61.18 20 Ireland ............................................................................................................ 77.56 61.13 21 Venezuela, Bolivarian Rep. ................................................................76.99 60.68 22 Belgium .........................................................................................................75.89 59.80 23 Iceland ...........................................................................................................73.60 57.98 24 Estonia ........................................................................................................... 71.39 56.22 25 Bulgaria..........................................................................................................71.23 56.09 26 Lithuania ........................................................................................................71.12 56.00 27 Peru ..................................................................................................................69.62 54.81 28 Saudi Arabia ...............................................................................................68.94 54.27 29 Iran, Islamic Rep. ......................................................................................68.85 54.19 30 Germany .......................................................................................................68.33 53.78 31 Croatia ............................................................................................................ 67.48 53.11 32 Canada ........................................................................................................... 67.04 52.76 33 Poland ............................................................................................................66.56 52.37 34 Serbia ..............................................................................................................66.49 52.32 35 Mongolia ..................................................................................................... 64.84 51.00 36 France ............................................................................................................ 64.44 50.69 37 Czech Republic ........................................................................................63.75 50.13 38 Sweden .........................................................................................................63.55 49.98 39 Italy ...................................................................................................................63.02 49.55 40 Portugal ........................................................................................................62.94 49.49 41 Israel ................................................................................................................62.65 49.26 42 Uruguay ........................................................................................................62.35 49.02 43 Colombia ......................................................................................................60.43 47.49 44 Cyprus ............................................................................................................ 60.10 47.23 45 Dominican Republic ............................................................................. 59.92 47.08 46 United Kingdom ......................................................................................59.41 46.68 47 Montenegro ...............................................................................................58.24 45.75 48 Switzerland ................................................................................................. 57.87 45.45 49 Georgia ...........................................................................................................57.53 45.18 50 Albania ...........................................................................................................56.98 44.74 51 Costa Rica .................................................................................................... 55.61 43.66 52 Kazakhstan ..................................................................................................53.25 41.78 53 Armenia.........................................................................................................52.24 40.97 54 China ................................................................................................................51.01 39.99 55 Brazil ................................................................................................................50.49 39.58 56 Thailand ........................................................................................................49.29 38.62 57 Malta .............................................................................................................. 48.84 38.26 58 Hungary ........................................................................................................48.03 37.62 59 Romania ........................................................................................................48.02 37.62 60 Slovakia ......................................................................................................... 47.80 37.43 61 Algeria .............................................................................................................47.72 37.38 62 Panama ...........................................................................................................47.27 37.02 63 Ecuador .........................................................................................................45.55 35.65 64 Bahrain ...........................................................................................................45.50 35.61 65 Oman ..............................................................................................................44.60 34.89 66 Kyrgyzstan ...................................................................................................43.65 34.14
Rank Country Value Score 67 Malaysia ..........................................................................................................41.93 32.76 68 North Macedonia ....................................................................................41.14 32.14 69 Moldova, Rep. ........................................................................................... 41.08 32.09 70 Mauritius .......................................................................................................38.84 30.31 71 Mexico ........................................................................................................... 38.18 29.78 72 Indonesia......................................................................................................36.28 28.26 73 Philippines ...................................................................................................35.28 27.47 74 Paraguay .......................................................................................................35.08 27.31 75 Egypt ...............................................................................................................34.44 26.80 76 Morocco ........................................................................................................ 33.76 26.26 77 Brunei Darussalam ................................................................................. 32.92 25.59 78 Kuwait ............................................................................................................32.57 25.32 79 Tunisia.............................................................................................................32.06 24.91 80 Jordan..............................................................................................................31.71 24.62 81 Tajikistan .......................................................................................................30.87 23.96 82 El Salvador ...................................................................................................28.69 22.23 83 Viet Nam .......................................................................................................28.26 21.88 84 India ................................................................................................................. 27.54 21.31 85 Azerbaijan .....................................................................................................27.07 20.93 86 Jamaica ..........................................................................................................26.88 20.78 87 Botswana .....................................................................................................23.01 17.70 88 Guatemala ................................................................................................... 21.78 16.73 89 Cabo Verde ..................................................................................................21.71 16.66 90 Honduras .....................................................................................................20.78 15.93 91 Namibia .........................................................................................................20.64 15.81 92 South Africa ................................................................................................20.48 15.68 93 Luxembourg .............................................................................................. 19.56 14.96 94 Cameroon .....................................................................................................19.17 14.65 95 Sri Lanka ........................................................................................................ 18.97 14.48 96 Bangladesh ..................................................................................................17.62 13.41 97 Qatar ................................................................................................................ 16.42 12.45 98 Ghana ..............................................................................................................16.16 12.25 99 Lao PDR ......................................................................................................... 15.72 11.90 100 Cambodia .....................................................................................................13.14 9.84 101 Nepal ................................................................................................................11.79 8.77 102 Liberia ..............................................................................................................11.67 8.67 103 Kenya ...............................................................................................................11.66 8.67 104 Senegal ...........................................................................................................11.22 8.32 105 Bhutan............................................................................................................ 10.51 7.75 106 Nigeria .............................................................................................................10.17 7.48 107 Pakistan ..........................................................................................................10.12 7.44 108 Yemen ...............................................................................................................9.97 7.32 109 Angola...............................................................................................................9.43 6.89 110 Côte d’Ivoire .................................................................................................. 9.16 6.68 111 Lesotho............................................................................................................. 9.10 6.63 112 Zimbabwe ......................................................................................................8.48 6.14 113 Ethiopia ............................................................................................................ 8.12 5.85 114 Rwanda ............................................................................................................7.64 5.46 115 Mozambique ................................................................................................6.94 4.91 116 Congo, Dem. Rep. .....................................................................................6.61 4.64 117 Burundi ............................................................................................................. 6.16 4.29 118 Burkina Faso ................................................................................................. 6.00 4.16 119 Mali ......................................................................................................................5.49 3.75 120 Eswatini ............................................................................................................5.38 3.67 121 Madagascar ...................................................................................................4.83 3.22 122 Uganda .............................................................................................................4.62 3.06 123 Zambia ..............................................................................................................4.01 2.58 124 Tanzania, United Rep. .............................................................................3.92 2.50 125 Gambia .............................................................................................................3.09 1.85 126 Malawi ...............................................................................................................0.77 0.00 Bolivia, Plurinational St. ........................................................................... n/a n/a Bosnia and Herzegovina ........................................................................ n/a n/a Japan ................................................................................................................... n/a n/a Nicaragua ......................................................................................................... n/a n/a Trinidad and Tobago ................................................................................ n/a n/a United Arab Emirates ............................................................................... n/a n/a
SOURCE: UNESCO Institute for Statistics, UIS.Stat (http://data.uis.unesco.org/)For some countries, the latest year for which data are available may differ from the year that appears at the top of the page. The cut-off year is 2008.
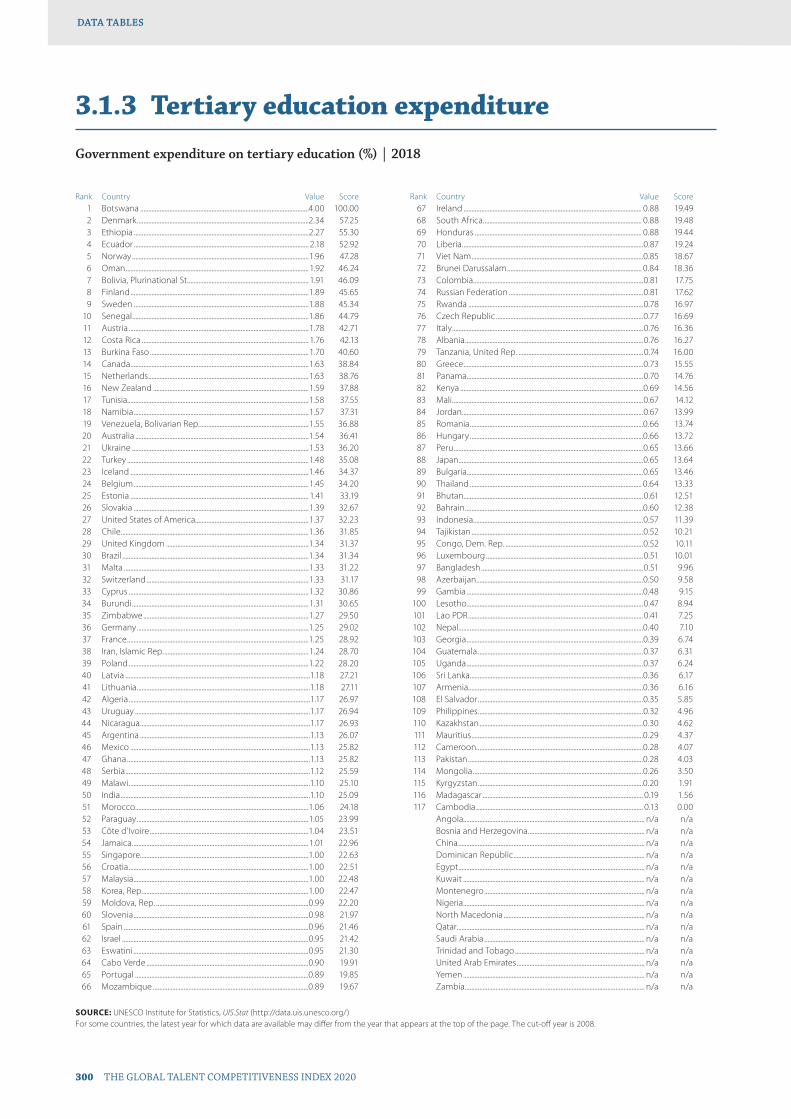
300 THE GLOBAL TALENT COMPETITIVENESS INDEX 2020
DATA TABLESDATA TABLES
3.1.3 Tertiary education expenditure
Government expenditure on tertiary education (%) | 2018
Rank Country Value Score 1 Botswana ........................................................................................................4.00 100.00 2 Denmark ..........................................................................................................2.34 57.25 3 Ethiopia ............................................................................................................2.27 55.30 4 Ecuador ............................................................................................................ 2.18 52.92 5 Norway .............................................................................................................1.96 47.28 6 Oman .................................................................................................................1.92 46.24 7 Bolivia, Plurinational St. .......................................................................... 1.91 46.09 8 Finland ..............................................................................................................1.89 45.65 9 Sweden ............................................................................................................1.88 45.34 10 Senegal .............................................................................................................1.86 44.79 11 Austria ...............................................................................................................1.78 42.71 12 Costa Rica ....................................................................................................... 1.76 42.13 13 Burkina Faso ..................................................................................................1.70 40.60 14 Canada ..............................................................................................................1.63 38.84 15 Netherlands ...................................................................................................1.63 38.76 16 New Zealand ................................................................................................1.59 37.88 17 Tunisia................................................................................................................1.58 37.55 18 Namibia ............................................................................................................1.57 37.31 19 Venezuela, Bolivarian Rep. ...................................................................1.55 36.88 20 Australia ...........................................................................................................1.54 36.41 21 Ukraine .............................................................................................................1.53 36.20 22 Turkey ................................................................................................................1.48 35.08 23 Iceland ..............................................................................................................1.46 34.37 24 Belgium ............................................................................................................1.45 34.20 25 Estonia .............................................................................................................. 1.41 33.19 26 Slovakia ............................................................................................................1.39 32.67 27 United States of America......................................................................1.37 32.23 28 Chile ....................................................................................................................1.36 31.85 29 United Kingdom ........................................................................................1.34 31.37 30 Brazil ...................................................................................................................1.34 31.34 31 Malta ..................................................................................................................1.33 31.22 32 Switzerland ....................................................................................................1.33 31.17 33 Cyprus ...............................................................................................................1.32 30.86 34 Burundi .............................................................................................................1.31 30.65 35 Zimbabwe ......................................................................................................1.27 29.50 36 Germany ..........................................................................................................1.25 29.02 37 France ................................................................................................................1.25 28.92 38 Iran, Islamic Rep. .........................................................................................1.24 28.70 39 Poland ...............................................................................................................1.22 28.20 40 Latvia ..................................................................................................................1.18 27.21 41 Lithuania ...........................................................................................................1.18 27.11 42 Algeria ................................................................................................................1.17 26.97 43 Uruguay ............................................................................................................1.17 26.94 44 Nicaragua .........................................................................................................1.17 26.93 45 Argentina .........................................................................................................1.13 26.07 46 Mexico ...............................................................................................................1.13 25.82 47 Ghana .................................................................................................................1.13 25.82 48 Serbia ..................................................................................................................1.12 25.59 49 Malawi ................................................................................................................1.10 25.10 50 India .....................................................................................................................1.10 25.09 51 Morocco ...........................................................................................................1.06 24.18 52 Paraguay ..........................................................................................................1.05 23.99 53 Côte d’Ivoire ..................................................................................................1.04 23.51 54 Jamaica .............................................................................................................1.01 22.96 55 Singapore........................................................................................................1.00 22.63 56 Croatia ...............................................................................................................1.00 22.51 57 Malaysia ............................................................................................................1.00 22.48 58 Korea, Rep. ......................................................................................................1.00 22.47 59 Moldova, Rep. ..............................................................................................0.99 22.20 60 Slovenia ............................................................................................................0.98 21.97 61 Spain ..................................................................................................................0.96 21.46 62 Israel ...................................................................................................................0.95 21.42 63 Eswatini ............................................................................................................0.95 21.30 64 Cabo Verde ....................................................................................................0.90 19.91 65 Portugal ...........................................................................................................0.89 19.85 66 Mozambique ................................................................................................0.89 19.67
Rank Country Value Score 67 Ireland .............................................................................................................. 0.88 19.49 68 South Africa .................................................................................................. 0.88 19.48 69 Honduras ....................................................................................................... 0.88 19.44 70 Liberia ................................................................................................................0.87 19.24 71 Viet Nam ..........................................................................................................0.85 18.67 72 Brunei Darussalam ................................................................................... 0.84 18.36 73 Colombia .........................................................................................................0.81 17.75 74 Russian Federation ...................................................................................0.81 17.62 75 Rwanda ............................................................................................................0.78 16.97 76 Czech Republic ...........................................................................................0.77 16.69 77 Italy ......................................................................................................................0.76 16.36 78 Albania ..............................................................................................................0.76 16.27 79 Tanzania, United Rep. .............................................................................0.74 16.00 80 Greece ...............................................................................................................0.73 15.55 81 Panama .............................................................................................................0.70 14.76 82 Kenya .................................................................................................................0.69 14.56 83 Mali ......................................................................................................................0.67 14.12 84 Jordan................................................................................................................0.67 13.99 85 Romania ...........................................................................................................0.66 13.74 86 Hungary ...........................................................................................................0.66 13.72 87 Peru .....................................................................................................................0.65 13.66 88 Japan ..................................................................................................................0.65 13.64 89 Bulgaria.............................................................................................................0.65 13.46 90 Thailand .......................................................................................................... 0.64 13.33 91 Bhutan...............................................................................................................0.61 12.51 92 Bahrain ..............................................................................................................0.60 12.38 93 Indonesia.........................................................................................................0.57 11.39 94 Tajikistan ..........................................................................................................0.52 10.21 95 Congo, Dem. Rep. .....................................................................................0.52 10.11 96 Luxembourg .................................................................................................0.51 10.01 97 Bangladesh ....................................................................................................0.51 9.96 98 Azerbaijan .......................................................................................................0.50 9.58 99 Gambia .............................................................................................................0.48 9.15 100 Lesotho.............................................................................................................0.47 8.94 101 Lao PDR ............................................................................................................0.41 7.25 102 Nepal ..................................................................................................................0.40 7.10 103 Georgia .............................................................................................................0.39 6.74 104 Guatemala ......................................................................................................0.37 6.31 105 Uganda .............................................................................................................0.37 6.24 106 Sri Lanka ...........................................................................................................0.36 6.17 107 Armenia............................................................................................................0.36 6.16 108 El Salvador ......................................................................................................0.35 5.85 109 Philippines ......................................................................................................0.32 4.96 110 Kazakhstan .....................................................................................................0.30 4.62 111 Mauritius ..........................................................................................................0.29 4.37 112 Cameroon .......................................................................................................0.28 4.07 113 Pakistan ............................................................................................................0.28 4.03 114 Mongolia .........................................................................................................0.26 3.50 115 Kyrgyzstan ......................................................................................................0.20 1.91 116 Madagascar ................................................................................................... 0.19 1.56 117 Cambodia ....................................................................................................... 0.13 0.00 Angola................................................................................................................ n/a n/a Bosnia and Herzegovina ........................................................................ n/a n/a China ................................................................................................................... n/a n/a Dominican Republic ................................................................................. n/a n/a Egypt ................................................................................................................... n/a n/a Kuwait ................................................................................................................ n/a n/a Montenegro ................................................................................................... n/a n/a Nigeria ................................................................................................................ n/a n/a North Macedonia ....................................................................................... n/a n/a Qatar .................................................................................................................... n/a n/a Saudi Arabia ................................................................................................... n/a n/a Trinidad and Tobago ................................................................................ n/a n/a United Arab Emirates ............................................................................... n/a n/a Yemen ................................................................................................................ n/a n/a Zambia ............................................................................................................... n/a n/a
SOURCE: UNESCO Institute for Statistics, UIS.Stat (http://data.uis.unesco.org/)For some countries, the latest year for which data are available may differ from the year that appears at the top of the page. The cut-off year is 2008.

THE GLOBAL TALENT COMPETITIVENESS INDEX 2020 301
DATA TABLESDATA TABLES
3.1.4 Reading, maths, and science
PISA average scores in reading, mathematics, and science | 2015
Rank Country Value Score 1 Singapore...................................................................................................551.62 100.00 2 Japan ............................................................................................................ 528.93 89.33 3 Estonia ........................................................................................................ 524.29 87.14 4 Canada ........................................................................................................523.34 86.70 5 Finland ........................................................................................................ 522.72 86.41 6 Korea, Rep. ................................................................................................. 519.12 84.71 7 China ............................................................................................................ 514.34 82.46 8 Slovenia ...................................................................................................... 509.33 80.11 9 Ireland .........................................................................................................509.04 79.97 10 Germany ....................................................................................................508.07 79.52 11 Netherlands ..............................................................................................507.93 79.45 12 Switzerland ..............................................................................................506.32 78.69 13 New Zealand .......................................................................................... 505.93 78.51 14 Norway .......................................................................................................504.47 77.82 15 Denmark ....................................................................................................504.28 77.73 16 Poland ......................................................................................................... 503.87 77.54 17 Belgium ......................................................................................................502.50 76.90 18 Australia .....................................................................................................502.26 76.78 19 Viet Nam .....................................................................................................501.98 76.65 20 United Kingdom ..................................................................................499.89 75.67 21 Portugal .....................................................................................................496.95 74.28 22 Sweden ......................................................................................................495.83 73.76 23 France .......................................................................................................... 495.73 73.71 24 Austria .........................................................................................................492.22 72.06 25 Russian Federation ..............................................................................491.77 71.85 26 Spain ............................................................................................................ 491.40 71.67 27 Czech Republic .....................................................................................490.80 71.39 28 United States of America................................................................ 487.60 69.89 29 Latvia ...........................................................................................................486.76 69.49 30 Italy ................................................................................................................ 485.01 68.67 31 Luxembourg ...........................................................................................483.34 67.88 32 Iceland ........................................................................................................480.93 66.75 33 Croatia ..........................................................................................................475.43 64.16 34 Lithuania .................................................................................................... 475.40 64.15 35 Hungary ......................................................................................................474.37 63.66 36 Israel ..............................................................................................................471.73 62.42 37 Malta ............................................................................................................463.36 58.49 38 Slovakia ......................................................................................................462.84 58.24 39 Greece .........................................................................................................458.50 56.20 40 Kazakhstan ................................................................................................447.81 51.17 41 Chile ..............................................................................................................442.73 48.78 42 Malaysia ...................................................................................................... 439.88 47.44 43 Bulgaria....................................................................................................... 439.56 47.29 44 Cyprus ..........................................................................................................437.51 46.33 45 Romania ......................................................................................................437.49 46.31 46 United Arab Emirates ........................................................................ 432.59 44.01 47 Uruguay ..................................................................................................... 429.98 42.78 48 Turkey ...........................................................................................................424.76 40.33 49 Trinidad and Tobago .........................................................................423.04 39.52 50 Argentina ...................................................................................................422.19 39.12 51 Moldova, Rep. .........................................................................................421.30 38.70 52 Montenegro .............................................................................................418.71 37.48 53 Costa Rica ..................................................................................................415.78 36.10 54 Mexico .........................................................................................................415.67 36.05 55 Thailand ......................................................................................................415.31 35.88 56 Albania .........................................................................................................415.21 35.84 57 Colombia ....................................................................................................410.09 33.43 58 Qatar ............................................................................................................. 407.30 32.11 59 Georgia .......................................................................................................405.42 31.23 60 Jordan.......................................................................................................... 399.01 28.22 61 Indonesia................................................................................................... 395.49 26.56 62 Brazil ............................................................................................................. 395.03 26.34 63 Peru ...............................................................................................................393.60 25.67 64 Tunisia...........................................................................................................371.43 15.24 65 North Macedonia ................................................................................ 368.91 14.06 66 Algeria ..........................................................................................................361.74 10.68
Rank Country Value Score 67 Dominican Republic .......................................................................... 339.03 0.00 Angola................................................................................................................ n/a n/a Armenia............................................................................................................. n/a n/a Azerbaijan ........................................................................................................ n/a n/a Bahrain ............................................................................................................... n/a n/a Bangladesh ..................................................................................................... n/a n/a Bhutan................................................................................................................ n/a n/a Bolivia, Plurinational St. ........................................................................... n/a n/a Bosnia and Herzegovina ........................................................................ n/a n/a Botswana ......................................................................................................... n/a n/a Brunei Darussalam ..................................................................................... n/a n/a Burkina Faso ................................................................................................... n/a n/a Burundi .............................................................................................................. n/a n/a Cabo Verde ..................................................................................................... n/a n/a Cambodia ........................................................................................................ n/a n/a Cameroon ........................................................................................................ n/a n/a Congo, Dem. Rep. ...................................................................................... n/a n/a Côte d’Ivoire ................................................................................................... n/a n/a Ecuador ............................................................................................................. n/a n/a Egypt ................................................................................................................... n/a n/a El Salvador ....................................................................................................... n/a n/a Eswatini ............................................................................................................. n/a n/a Ethiopia ............................................................................................................. n/a n/a Gambia .............................................................................................................. n/a n/a Ghana ................................................................................................................. n/a n/a Guatemala ....................................................................................................... n/a n/a Honduras ......................................................................................................... n/a n/a India ..................................................................................................................... n/a n/a Iran, Islamic Rep. .......................................................................................... n/a n/a Jamaica .............................................................................................................. n/a n/a Kenya .................................................................................................................. n/a n/a Kuwait ................................................................................................................ n/a n/a Kyrgyzstan ....................................................................................................... n/a n/a Lao PDR ............................................................................................................. n/a n/a Lesotho.............................................................................................................. n/a n/a Liberia ................................................................................................................. n/a n/a Madagascar .................................................................................................... n/a n/a Malawi ................................................................................................................ n/a n/a Mali ....................................................................................................................... n/a n/a Mauritius ........................................................................................................... n/a n/a Mongolia .......................................................................................................... n/a n/a Morocco ............................................................................................................ n/a n/a Mozambique ................................................................................................. n/a n/a Namibia ............................................................................................................. n/a n/a Nepal ................................................................................................................... n/a n/a Nicaragua ......................................................................................................... n/a n/a Nigeria ................................................................................................................ n/a n/a Oman .................................................................................................................. n/a n/a Pakistan ............................................................................................................. n/a n/a Panama .............................................................................................................. n/a n/a Paraguay ........................................................................................................... n/a n/a Philippines ....................................................................................................... n/a n/a Rwanda ............................................................................................................. n/a n/a Saudi Arabia ................................................................................................... n/a n/a Senegal .............................................................................................................. n/a n/a Serbia .................................................................................................................. n/a n/a South Africa .................................................................................................... n/a n/a Sri Lanka ............................................................................................................ n/a n/a Tajikistan ........................................................................................................... n/a n/a Tanzania, United Rep. .............................................................................. n/a n/a Uganda .............................................................................................................. n/a n/a Ukraine .............................................................................................................. n/a n/a Venezuela, Bolivarian Rep. .................................................................... n/a n/a Yemen ................................................................................................................ n/a n/a Zambia ............................................................................................................... n/a n/a Zimbabwe ....................................................................................................... n/a n/a
SOURCE: OECD Programme for International Student Assessment (PISA) (www.oecd.org/pisa)For some countries, the latest year for which data are available may differ from the year that appears at the top of the page. The cut-off year is 2008.
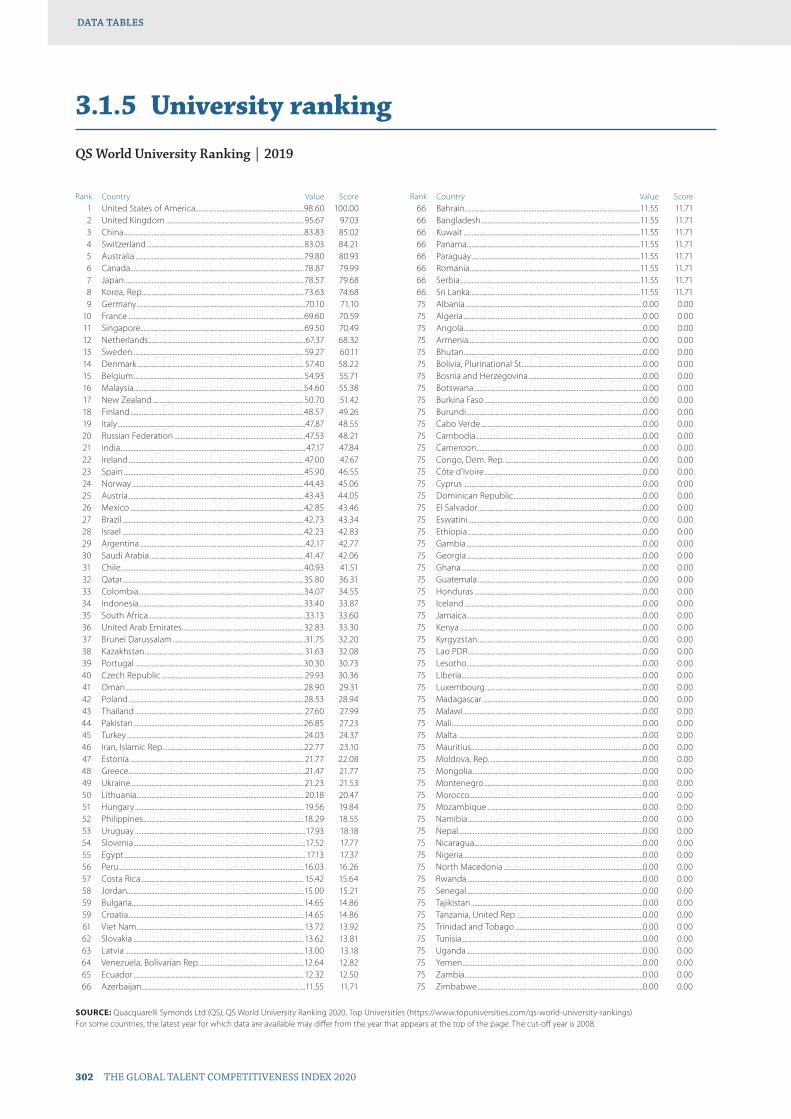
302 THE GLOBAL TALENT COMPETITIVENESS INDEX 2020
DATA TABLESDATA TABLES
3.1.5 University ranking
QS World University Ranking | 2019
Rank Country Value Score 1 United States of America...................................................................98.60 100.00 2 United Kingdom .....................................................................................95.67 97.03 3 China ...............................................................................................................83.83 85.02 4 Switzerland .................................................................................................83.03 84.21 5 Australia ........................................................................................................79.80 80.93 6 Canada ...........................................................................................................78.87 79.99 7 Japan ...............................................................................................................78.57 79.68 8 Korea, Rep. ...................................................................................................73.63 74.68 9 Germany ........................................................................................................70.10 71.10 10 France .............................................................................................................69.60 70.59 11 Singapore.....................................................................................................69.50 70.49 12 Netherlands .................................................................................................67.37 68.32 13 Sweden ......................................................................................................... 59.27 60.11 14 Denmark ....................................................................................................... 57.40 58.22 15 Belgium .........................................................................................................54.93 55.71 16 Malaysia .........................................................................................................54.60 55.38 17 New Zealand .............................................................................................50.70 51.42 18 Finland ...........................................................................................................48.57 49.26 19 Italy ....................................................................................................................47.87 48.55 20 Russian Federation .................................................................................47.53 48.21 21 India .................................................................................................................. 47.17 47.84 22 Ireland ............................................................................................................ 47.00 47.67 23 Spain ...............................................................................................................45.90 46.55 24 Norway ..........................................................................................................44.43 45.06 25 Austria ............................................................................................................ 43.43 44.05 26 Mexico ...........................................................................................................42.85 43.46 27 Brazil ................................................................................................................42.73 43.34 28 Israel ................................................................................................................42.23 42.83 29 Argentina ......................................................................................................42.17 42.77 30 Saudi Arabia ................................................................................................41.47 42.06 31 Chile .................................................................................................................40.93 41.51 32 Qatar ................................................................................................................35.80 36.31 33 Colombia ......................................................................................................34.07 34.55 34 Indonesia......................................................................................................33.40 33.87 35 South Africa .................................................................................................33.13 33.60 36 United Arab Emirates ...........................................................................32.83 33.30 37 Brunei Darussalam ..................................................................................31.75 32.20 38 Kazakhstan .................................................................................................. 31.63 32.08 39 Portugal ........................................................................................................30.30 30.73 40 Czech Republic ........................................................................................ 29.93 30.36 41 Oman ..............................................................................................................28.90 29.31 42 Poland ............................................................................................................28.53 28.94 43 Thailand ........................................................................................................ 27.60 27.99 44 Pakistan .........................................................................................................26.85 27.23 45 Turkey .............................................................................................................24.03 24.37 46 Iran, Islamic Rep. ......................................................................................22.77 23.10 47 Estonia ........................................................................................................... 21.77 22.08 48 Greece .............................................................................................................21.47 21.77 49 Ukraine .......................................................................................................... 21.23 21.53 50 Lithuania ....................................................................................................... 20.18 20.47 51 Hungary ........................................................................................................ 19.56 19.84 52 Philippines ...................................................................................................18.29 18.55 53 Uruguay .........................................................................................................17.93 18.18 54 Slovenia ..........................................................................................................17.52 17.77 55 Egypt ................................................................................................................ 17.13 17.37 56 Peru ..................................................................................................................16.03 16.26 57 Costa Rica .................................................................................................... 15.42 15.64 58 Jordan.............................................................................................................15.00 15.21 59 Bulgaria..........................................................................................................14.65 14.86 59 Croatia ............................................................................................................14.65 14.86 61 Viet Nam ....................................................................................................... 13.72 13.92 62 Slovakia ......................................................................................................... 13.62 13.81 63 Latvia ..............................................................................................................13.00 13.18 64 Venezuela, Bolivarian Rep. ................................................................12.64 12.82 65 Ecuador ......................................................................................................... 12.32 12.50 66 Azerbaijan .....................................................................................................11.55 11.71
Rank Country Value Score 66 Bahrain ............................................................................................................11.55 11.71 66 Bangladesh ..................................................................................................11.55 11.71 66 Kuwait .............................................................................................................11.55 11.71 66 Panama ...........................................................................................................11.55 11.71 66 Paraguay ........................................................................................................11.55 11.71 66 Romania .........................................................................................................11.55 11.71 66 Serbia ...............................................................................................................11.55 11.71 66 Sri Lanka .........................................................................................................11.55 11.71 75 Albania ..............................................................................................................0.00 0.00 75 Algeria ...............................................................................................................0.00 0.00 75 Angola...............................................................................................................0.00 0.00 75 Armenia............................................................................................................0.00 0.00 75 Bhutan...............................................................................................................0.00 0.00 75 Bolivia, Plurinational St. ..........................................................................0.00 0.00 75 Bosnia and Herzegovina .......................................................................0.00 0.00 75 Botswana ........................................................................................................0.00 0.00 75 Burkina Faso ..................................................................................................0.00 0.00 75 Burundi .............................................................................................................0.00 0.00 75 Cabo Verde ....................................................................................................0.00 0.00 75 Cambodia .......................................................................................................0.00 0.00 75 Cameroon .......................................................................................................0.00 0.00 75 Congo, Dem. Rep. .....................................................................................0.00 0.00 75 Côte d’Ivoire ..................................................................................................0.00 0.00 75 Cyprus ...............................................................................................................0.00 0.00 75 Dominican Republic ................................................................................0.00 0.00 75 El Salvador ......................................................................................................0.00 0.00 75 Eswatini ............................................................................................................0.00 0.00 75 Ethiopia ............................................................................................................0.00 0.00 75 Gambia .............................................................................................................0.00 0.00 75 Georgia .............................................................................................................0.00 0.00 75 Ghana ................................................................................................................0.00 0.00 75 Guatemala ......................................................................................................0.00 0.00 75 Honduras ........................................................................................................0.00 0.00 75 Iceland ..............................................................................................................0.00 0.00 75 Jamaica .............................................................................................................0.00 0.00 75 Kenya .................................................................................................................0.00 0.00 75 Kyrgyzstan ......................................................................................................0.00 0.00 75 Lao PDR ............................................................................................................0.00 0.00 75 Lesotho.............................................................................................................0.00 0.00 75 Liberia ................................................................................................................0.00 0.00 75 Luxembourg .................................................................................................0.00 0.00 75 Madagascar ...................................................................................................0.00 0.00 75 Malawi ...............................................................................................................0.00 0.00 75 Mali ......................................................................................................................0.00 0.00 75 Malta ..................................................................................................................0.00 0.00 75 Mauritius ..........................................................................................................0.00 0.00 75 Moldova, Rep. ..............................................................................................0.00 0.00 75 Mongolia .........................................................................................................0.00 0.00 75 Montenegro ..................................................................................................0.00 0.00 75 Morocco ...........................................................................................................0.00 0.00 75 Mozambique ................................................................................................0.00 0.00 75 Namibia ............................................................................................................0.00 0.00 75 Nepal ..................................................................................................................0.00 0.00 75 Nicaragua ........................................................................................................0.00 0.00 75 Nigeria ...............................................................................................................0.00 0.00 75 North Macedonia ......................................................................................0.00 0.00 75 Rwanda ............................................................................................................0.00 0.00 75 Senegal .............................................................................................................0.00 0.00 75 Tajikistan ..........................................................................................................0.00 0.00 75 Tanzania, United Rep. .............................................................................0.00 0.00 75 Trinidad and Tobago ...............................................................................0.00 0.00 75 Tunisia................................................................................................................0.00 0.00 75 Uganda .............................................................................................................0.00 0.00 75 Yemen ...............................................................................................................0.00 0.00 75 Zambia ..............................................................................................................0.00 0.00 75 Zimbabwe ......................................................................................................0.00 0.00
SOURCE: Quacquarelli Symonds Ltd (QS), QS World University Ranking 2020, Top Universities (https://www.topuniversities.com/qs-world-university-rankings)For some countries, the latest year for which data are available may differ from the year that appears at the top of the page. The cut-off year is 2008.

THE GLOBAL TALENT COMPETITIVENESS INDEX 2020 303
DATA TABLESDATA TABLES
3.2.1 Quality of management schools
Average answer to the question: In your country, how do you assess the quality of business schools [1 = extremely poor—among the worst in the world; 7 = excellent—among the best in the world] | 2018
Rank Country Value Score 1 Switzerland ....................................................................................................6.39 100.00 2 Singapore........................................................................................................5.99 90.48 3 Netherlands ...................................................................................................5.96 89.66 4 United Kingdom ........................................................................................5.95 89.46 5 United States of America......................................................................5.90 88.31 6 Canada ..............................................................................................................5.78 85.39 7 Belgium ............................................................................................................5.71 83.77 8 Finland ..............................................................................................................5.62 81.53 9 France ................................................................................................................5.58 80.73 10 Spain ..................................................................................................................5.54 79.79 11 Denmark ..........................................................................................................5.50 78.87 12 Ireland ...............................................................................................................5.50 78.75 13 Sweden ............................................................................................................5.46 77.73 14 Israel ...................................................................................................................5.43 77.19 15 Italy ......................................................................................................................5.39 76.14 16 Philippines ......................................................................................................5.36 75.55 17 Malaysia ............................................................................................................5.36 75.44 18 Australia ...........................................................................................................5.36 75.39 19 Qatar ...................................................................................................................5.35 75.31 20 Iceland ..............................................................................................................5.25 72.89 21 New Zealand ................................................................................................5.25 72.82 22 Norway .............................................................................................................5.23 72.36 23 Germany ..........................................................................................................5.22 72.09 24 United Arab Emirates ..............................................................................5.21 71.87 25 Costa Rica .......................................................................................................5.20 71.62 26 Chile .................................................................................................................... 5.12 69.70 27 Austria ...............................................................................................................5.09 68.94 28 Portugal ...........................................................................................................5.09 68.92 29 Lesotho.............................................................................................................4.99 66.71 30 Jamaica .............................................................................................................4.99 66.57 31 Estonia ..............................................................................................................4.96 66.02 32 Trinidad and Tobago ...............................................................................4.92 64.90 33 Bahrain ..............................................................................................................4.89 64.17 34 Luxembourg .................................................................................................4.88 63.92 35 Oman .................................................................................................................4.83 62.81 36 Sri Lanka ...........................................................................................................4.79 61.84 37 Senegal .............................................................................................................4.77 61.30 38 Kenya .................................................................................................................4.71 59.98 39 Argentina ........................................................................................................4.71 59.87 40 Saudi Arabia ..................................................................................................4.69 59.52 41 Indonesia.........................................................................................................4.69 59.42 42 India ....................................................................................................................4.68 59.32 43 Malta ..................................................................................................................4.66 58.75 44 Cyprus ...............................................................................................................4.66 58.65 45 Latvia .................................................................................................................4.56 56.34 46 Slovenia ............................................................................................................4.49 54.68 47 China ..................................................................................................................4.48 54.44 48 Montenegro ..................................................................................................4.47 54.24 49 Korea, Rep. ......................................................................................................4.45 53.64 50 Japan ..................................................................................................................4.43 53.30 51 Uruguay ...........................................................................................................4.42 53.03 52 Ghana ................................................................................................................4.40 52.52 53 Guatemala ......................................................................................................4.39 52.42 54 Cameroon .......................................................................................................4.39 52.29 55 Bhutan...............................................................................................................4.37 51.85 56 Mauritius ..........................................................................................................4.37 51.74 57 Gambia .............................................................................................................4.29 49.84 58 Czech Republic ...........................................................................................4.28 49.69 59 Mexico ..............................................................................................................4.27 49.46 60 Jordan................................................................................................................4.27 49.43 61 Brunei Darussalam ....................................................................................4.26 49.16 62 Ukraine .............................................................................................................4.25 48.94 63 Tajikistan ..........................................................................................................4.20 47.81 64 Colombia .........................................................................................................4.20 47.72 65 Azerbaijan ....................................................................................................... 4.17 47.07 66 Tunisia................................................................................................................ 4.17 47.01
Rank Country Value Score 67 Greece ............................................................................................................... 4.16 46.92 68 Venezuela, Bolivarian Rep. ................................................................... 4.15 46.64 69 Rwanda ............................................................................................................ 4.13 46.17 70 Serbia ................................................................................................................. 4.12 45.79 71 Thailand ............................................................................................................4.11 45.75 72 Madagascar ....................................................................................................4.11 45.58 73 Cabo Verde .................................................................................................... 4.10 45.45 74 South Africa ................................................................................................... 4.10 45.34 75 Albania ..............................................................................................................4.08 45.05 76 Poland ...............................................................................................................4.08 45.02 77 Hungary ...........................................................................................................4.08 44.96 78 Morocco ...........................................................................................................4.06 44.46 79 Ecuador ............................................................................................................4.05 44.14 80 Nepal ..................................................................................................................4.03 43.68 81 Nicaragua ........................................................................................................4.00 43.11 82 Burundi .............................................................................................................4.00 43.10 83 Côte d’Ivoire ..................................................................................................3.98 42.64 84 Russian Federation ...................................................................................3.94 41.59 85 Lithuania ..........................................................................................................3.91 40.83 86 Lao PDR ............................................................................................................3.90 40.68 87 Burkina Faso ..................................................................................................3.89 40.32 88 Zambia ..............................................................................................................3.88 40.07 89 Zimbabwe ......................................................................................................3.87 40.04 90 Dominican Republic ............................................................................... 3.84 39.15 91 Kazakhstan .....................................................................................................3.81 38.55 92 Peru .....................................................................................................................3.79 38.04 93 Pakistan ............................................................................................................3.77 37.65 94 Slovakia ............................................................................................................3.77 37.55 95 Ethiopia ............................................................................................................3.77 37.50 96 Georgia .............................................................................................................3.73 36.58 97 Armenia............................................................................................................3.72 36.47 98 Bangladesh ....................................................................................................3.72 36.29 99 Croatia ...............................................................................................................3.72 36.27 100 Honduras ........................................................................................................3.71 36.06 101 Iran, Islamic Rep. .........................................................................................3.70 35.93 102 Mali ......................................................................................................................3.70 35.83 103 Uganda .............................................................................................................3.69 35.76 104 Panama .............................................................................................................3.67 35.12 105 Brazil ...................................................................................................................3.66 35.04 106 Nigeria ...............................................................................................................3.63 34.26 107 Bulgaria.............................................................................................................3.61 33.81 108 Kuwait ...............................................................................................................3.57 32.88 109 Botswana ........................................................................................................3.55 32.26 110 El Salvador ......................................................................................................3.52 31.72 111 Tanzania, United Rep. .............................................................................3.49 31.00 112 Romania ...........................................................................................................3.47 30.35 113 Namibia ............................................................................................................3.46 30.08 114 Viet Nam ..........................................................................................................3.45 30.02 115 Bolivia, Plurinational St. ..........................................................................3.42 29.30 116 Algeria ...............................................................................................................3.42 29.29 117 Moldova, Rep. ..............................................................................................3.41 28.96 118 Cambodia .......................................................................................................3.37 28.06 119 Turkey ................................................................................................................3.26 25.41 120 Liberia ................................................................................................................3.26 25.39 121 Bosnia and Herzegovina .......................................................................3.26 25.33 122 Congo, Dem. Rep. .....................................................................................3.20 24.06 123 Egypt ..................................................................................................................3.20 23.88 124 Malawi ............................................................................................................... 3.18 23.58 125 Eswatini ............................................................................................................3.06 20.73 126 Paraguay ..........................................................................................................3.05 20.38 127 North Macedonia ......................................................................................3.00 19.27 128 Kyrgyzstan ......................................................................................................2.98 18.75 129 Mongolia .........................................................................................................2.97 18.59 130 Yemen ...............................................................................................................2.72 12.47 131 Mozambique ................................................................................................2.68 11.57 132 Angola............................................................................................................... 2.19 0.00
SOURCE: World Economic Forum, Executive Opinion Survey 2017–2018 (http://reports.weforum.org)For some countries, the latest year for which data are available may differ from the year that appears at the top of the page. The cut-off year is 2008.
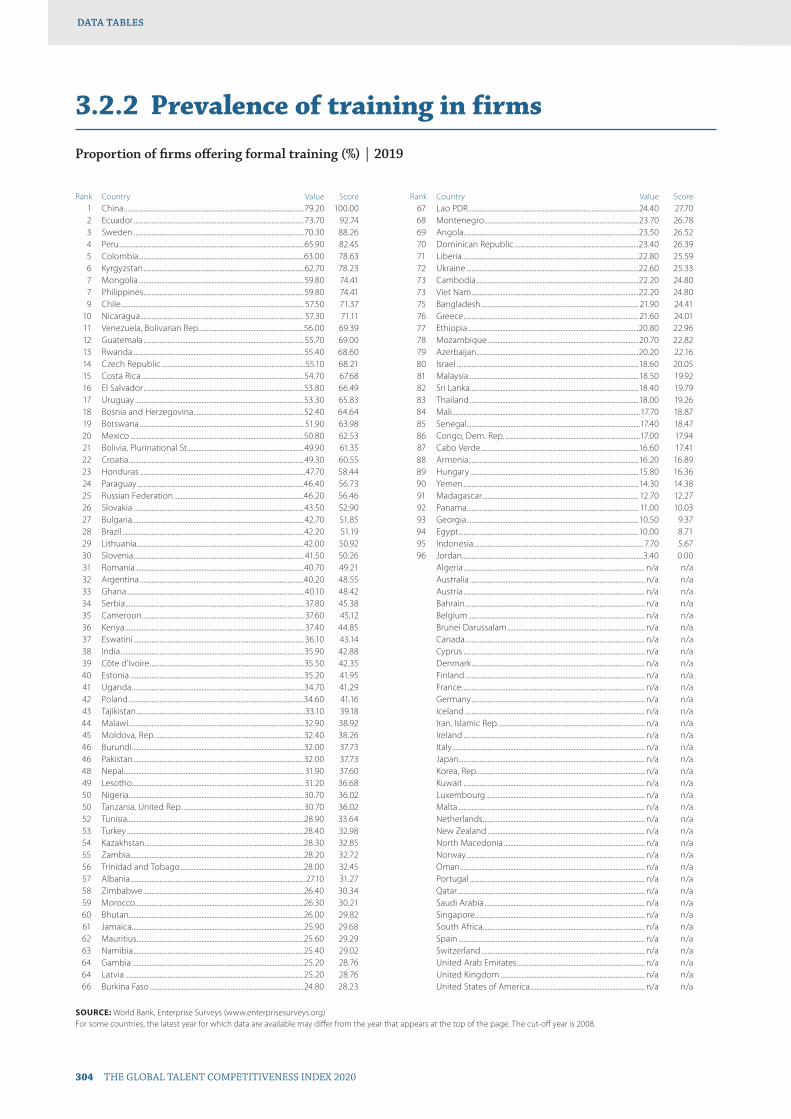
304 THE GLOBAL TALENT COMPETITIVENESS INDEX 2020
DATA TABLESDATA TABLES
3.2.2 Prevalence of training in firms
Proportion of firms offering formal training (%) | 2019
Rank Country Value Score 1 China ...............................................................................................................79.20 100.00 2 Ecuador .........................................................................................................73.70 92.74 3 Sweden .........................................................................................................70.30 88.26 4 Peru ..................................................................................................................65.90 82.45 5 Colombia ......................................................................................................63.00 78.63 6 Kyrgyzstan ...................................................................................................62.70 78.23 7 Mongolia ......................................................................................................59.80 74.41 7 Philippines ...................................................................................................59.80 74.41 9 Chile ................................................................................................................. 57.50 71.37 10 Nicaragua ..................................................................................................... 57.30 71.11 11 Venezuela, Bolivarian Rep. ................................................................56.00 69.39 12 Guatemala ................................................................................................... 55.70 69.00 13 Rwanda .........................................................................................................55.40 68.60 14 Czech Republic .........................................................................................55.10 68.21 15 Costa Rica ....................................................................................................54.70 67.68 16 El Salvador ...................................................................................................53.80 66.49 17 Uruguay ........................................................................................................53.30 65.83 18 Bosnia and Herzegovina ....................................................................52.40 64.64 19 Botswana ..................................................................................................... 51.90 63.98 20 Mexico ...........................................................................................................50.80 62.53 21 Bolivia, Plurinational St. .......................................................................49.90 61.35 22 Croatia ............................................................................................................49.30 60.55 23 Honduras ......................................................................................................47.70 58.44 24 Paraguay .......................................................................................................46.40 56.73 25 Russian Federation ................................................................................46.20 56.46 26 Slovakia .........................................................................................................43.50 52.90 27 Bulgaria.......................................................................................................... 42.70 51.85 28 Brazil ................................................................................................................42.20 51.19 29 Lithuania .......................................................................................................42.00 50.92 30 Slovenia ......................................................................................................... 41.50 50.26 31 Romania ........................................................................................................40.70 49.21 32 Argentina .....................................................................................................40.20 48.55 33 Ghana ............................................................................................................. 40.10 48.42 34 Serbia .............................................................................................................. 37.80 45.38 35 Cameroon .................................................................................................... 37.60 45.12 36 Kenya .............................................................................................................. 37.40 44.85 37 Eswatini ......................................................................................................... 36.10 43.14 38 India .................................................................................................................35.90 42.88 39 Côte d’Ivoire ...............................................................................................35.50 42.35 40 Estonia ...........................................................................................................35.20 41.95 41 Uganda ..........................................................................................................34.70 41.29 42 Poland ............................................................................................................34.60 41.16 43 Tajikistan ........................................................................................................33.10 39.18 44 Malawi ............................................................................................................32.90 38.92 45 Moldova, Rep. ...........................................................................................32.40 38.26 46 Burundi ..........................................................................................................32.00 37.73 46 Pakistan .........................................................................................................32.00 37.73 48 Nepal ............................................................................................................... 31.90 37.60 49 Lesotho.......................................................................................................... 31.20 36.68 50 Nigeria ............................................................................................................30.70 36.02 50 Tanzania, United Rep. ..........................................................................30.70 36.02 52 Tunisia.............................................................................................................28.90 33.64 53 Turkey .............................................................................................................28.40 32.98 54 Kazakhstan ..................................................................................................28.30 32.85 55 Zambia ...........................................................................................................28.20 32.72 56 Trinidad and Tobago ............................................................................28.00 32.45 57 Albania ............................................................................................................27.10 31.27 58 Zimbabwe ...................................................................................................26.40 30.34 59 Morocco ........................................................................................................26.30 30.21 60 Bhutan............................................................................................................26.00 29.82 61 Jamaica ..........................................................................................................25.90 29.68 62 Mauritius .......................................................................................................25.60 29.29 63 Namibia .........................................................................................................25.40 29.02 64 Gambia ..........................................................................................................25.20 28.76 64 Latvia ..............................................................................................................25.20 28.76 66 Burkina Faso ...............................................................................................24.80 28.23
Rank Country Value Score 67 Lao PDR .........................................................................................................24.40 27.70 68 Montenegro ...............................................................................................23.70 26.78 69 Angola............................................................................................................23.50 26.52 70 Dominican Republic .............................................................................23.40 26.39 71 Liberia .............................................................................................................22.80 25.59 72 Ukraine ..........................................................................................................22.60 25.33 73 Cambodia ....................................................................................................22.20 24.80 73 Viet Nam .......................................................................................................22.20 24.80 75 Bangladesh ................................................................................................. 21.90 24.41 76 Greece ............................................................................................................ 21.60 24.01 77 Ethiopia .........................................................................................................20.80 22.96 78 Mozambique .............................................................................................20.70 22.82 79 Azerbaijan ....................................................................................................20.20 22.16 80 Israel ................................................................................................................18.60 20.05 81 Malaysia .........................................................................................................18.50 19.92 82 Sri Lanka ........................................................................................................18.40 19.79 83 Thailand ........................................................................................................18.00 19.26 84 Mali ....................................................................................................................17.70 18.87 85 Senegal ...........................................................................................................17.40 18.47 86 Congo, Dem. Rep. ...................................................................................17.00 17.94 87 Cabo Verde .................................................................................................16.60 17.41 88 Armenia.........................................................................................................16.20 16.89 89 Hungary ........................................................................................................15.80 16.36 90 Yemen ............................................................................................................14.30 14.38 91 Madagascar ................................................................................................ 12.70 12.27 92 Panama .......................................................................................................... 11.00 10.03 93 Georgia ..........................................................................................................10.50 9.37 94 Egypt ...............................................................................................................10.00 8.71 95 Indonesia......................................................................................................... 7.70 5.67 96 Jordan................................................................................................................3.40 0.00 Algeria ................................................................................................................ n/a n/a Australia ............................................................................................................ n/a n/a Austria ................................................................................................................ n/a n/a Bahrain ............................................................................................................... n/a n/a Belgium ............................................................................................................. n/a n/a Brunei Darussalam ..................................................................................... n/a n/a Canada ............................................................................................................... n/a n/a Cyprus ................................................................................................................ n/a n/a Denmark ........................................................................................................... n/a n/a Finland ............................................................................................................... n/a n/a France ................................................................................................................. n/a n/a Germany ........................................................................................................... n/a n/a Iceland ............................................................................................................... n/a n/a Iran, Islamic Rep. .......................................................................................... n/a n/a Ireland ................................................................................................................ n/a n/a Italy ....................................................................................................................... n/a n/a Japan ................................................................................................................... n/a n/a Korea, Rep. ....................................................................................................... n/a n/a Kuwait ................................................................................................................ n/a n/a Luxembourg .................................................................................................. n/a n/a Malta ................................................................................................................... n/a n/a Netherlands .................................................................................................... n/a n/a New Zealand ................................................................................................. n/a n/a North Macedonia ....................................................................................... n/a n/a Norway .............................................................................................................. n/a n/a Oman .................................................................................................................. n/a n/a Portugal ............................................................................................................ n/a n/a Qatar .................................................................................................................... n/a n/a Saudi Arabia ................................................................................................... n/a n/a Singapore......................................................................................................... n/a n/a South Africa .................................................................................................... n/a n/a Spain ................................................................................................................... n/a n/a Switzerland ..................................................................................................... n/a n/a United Arab Emirates ............................................................................... n/a n/a United Kingdom ......................................................................................... n/a n/a United States of America....................................................................... n/a n/a
SOURCE: World Bank, Enterprise Surveys (www.enterprisesurveys.org)For some countries, the latest year for which data are available may differ from the year that appears at the top of the page. The cut-off year is 2008.

THE GLOBAL TALENT COMPETITIVENESS INDEX 2020 305
DATA TABLESDATA TABLES
3.2.3 Employee development
Average answer to the question: In your country, to what extent do companies invest in training and employee development? [1 = not at all; 7 = to a great extent] | 2018
Rank Country Value Score 1 Switzerland ....................................................................................................5.86 100.00 2 United States of America......................................................................5.76 97.05 3 Luxembourg .................................................................................................5.54 90.11 4 Malaysia ............................................................................................................5.36 84.46 5 Netherlands ...................................................................................................5.36 84.45 6 Singapore........................................................................................................5.35 84.23 7 Sweden ............................................................................................................5.32 83.35 8 Denmark ..........................................................................................................5.28 82.06 9 Finland ..............................................................................................................5.23 80.65 10 Germany .......................................................................................................... 5.19 79.37 11 Japan .................................................................................................................. 5.15 78.21 12 Norway .............................................................................................................5.09 76.33 13 Australia ...........................................................................................................5.03 74.48 14 Ireland ...............................................................................................................5.02 74.04 15 Austria ...............................................................................................................5.02 74.00 16 Belgium ............................................................................................................4.99 73.24 17 Iceland ..............................................................................................................4.95 71.79 18 Canada ..............................................................................................................4.90 70.38 19 United Arab Emirates ..............................................................................4.89 70.09 20 New Zealand ................................................................................................4.87 69.43 21 Israel ...................................................................................................................4.81 67.48 22 United Kingdom ........................................................................................4.81 67.38 23 France ................................................................................................................4.80 67.34 24 Philippines ......................................................................................................4.80 67.20 25 Qatar ...................................................................................................................4.75 65.61 26 Bahrain ..............................................................................................................4.71 64.45 27 Indonesia.........................................................................................................4.71 64.35 28 Lithuania ..........................................................................................................4.61 61.41 29 Estonia ..............................................................................................................4.58 60.46 30 India ....................................................................................................................4.56 59.90 31 Czech Republic ...........................................................................................4.53 58.74 32 China ..................................................................................................................4.50 57.78 33 Korea, Rep. ......................................................................................................4.49 57.47 34 Oman .................................................................................................................4.45 56.31 35 Costa Rica .......................................................................................................4.42 55.38 36 Trinidad and Tobago ...............................................................................4.40 54.77 37 Mauritius ..........................................................................................................4.40 54.68 38 Jamaica .............................................................................................................4.31 52.11 39 Namibia ............................................................................................................4.31 52.10 40 Slovenia ............................................................................................................4.30 51.79 41 Malta ..................................................................................................................4.29 51.36 42 Kenya .................................................................................................................4.28 51.06 43 Saudi Arabia ..................................................................................................4.26 50.40 44 Thailand ...........................................................................................................4.26 50.35 45 Guatemala ......................................................................................................4.25 50.05 46 Cyprus ...............................................................................................................4.22 49.32 47 Chile ....................................................................................................................4.22 49.15 48 Ghana ................................................................................................................4.21 49.01 49 Latvia .................................................................................................................4.21 48.79 50 Slovakia ............................................................................................................ 4.19 48.40 51 South Africa ................................................................................................... 4.17 47.68 52 Azerbaijan ....................................................................................................... 4.15 47.06 53 Honduras ........................................................................................................ 4.13 46.34 54 Côte d’Ivoire .................................................................................................. 4.12 46.01 55 Bhutan............................................................................................................... 4.12 45.98 56 Portugal ........................................................................................................... 4.10 45.37 57 Jordan................................................................................................................ 4.10 45.34 58 Brunei Darussalam ....................................................................................4.00 42.30 59 Albania ..............................................................................................................3.97 41.39 60 Eswatini ............................................................................................................3.96 41.16 61 Pakistan ............................................................................................................3.96 41.09 62 Poland ...............................................................................................................3.94 40.54 63 Russian Federation ...................................................................................3.92 40.02 64 Botswana ........................................................................................................3.91 39.54 65 Sri Lanka ...........................................................................................................3.85 37.77 66 Kuwait ...............................................................................................................3.85 37.69
Rank Country Value Score 67 Spain ..................................................................................................................3.83 37.04 68 Montenegro ..................................................................................................3.81 36.57 69 Cambodia .......................................................................................................3.81 36.44 70 Dominican Republic ................................................................................3.81 36.42 71 Gambia .............................................................................................................3.80 36.11 72 Ukraine .............................................................................................................3.80 36.06 73 Brazil ...................................................................................................................3.79 35.81 74 Kazakhstan .....................................................................................................3.79 35.73 75 Rwanda ............................................................................................................3.78 35.64 76 Mexico ..............................................................................................................3.78 35.57 77 Tunisia................................................................................................................3.77 35.40 78 Viet Nam ..........................................................................................................3.75 34.54 79 Lao PDR ............................................................................................................3.74 34.42 80 Panama .............................................................................................................3.73 33.97 81 Liberia ................................................................................................................3.72 33.67 82 Uganda .............................................................................................................3.69 32.91 83 Zimbabwe ......................................................................................................3.69 32.80 84 Argentina ........................................................................................................3.69 32.76 85 Mali ......................................................................................................................3.69 32.75 86 Colombia .........................................................................................................3.66 31.98 87 Nigeria ...............................................................................................................3.65 31.63 88 Serbia .................................................................................................................3.65 31.60 89 Uruguay .......................................................................................................... 3.64 31.30 90 Morocco .......................................................................................................... 3.64 31.10 91 Mongolia .........................................................................................................3.63 30.82 92 Tanzania, United Rep. .............................................................................3.62 30.65 93 Armenia............................................................................................................3.62 30.59 94 Malawi ...............................................................................................................3.62 30.57 95 Greece ...............................................................................................................3.61 30.27 96 Hungary ...........................................................................................................3.58 29.28 97 Ethiopia ............................................................................................................3.57 29.00 98 Cameroon .......................................................................................................3.56 28.79 99 Senegal .............................................................................................................3.56 28.61 100 Italy ......................................................................................................................3.55 28.53 101 Egypt ..................................................................................................................3.54 28.26 102 Zambia ..............................................................................................................3.53 27.68 103 Madagascar ...................................................................................................3.51 27.09 104 Turkey ................................................................................................................3.50 26.87 105 Lesotho.............................................................................................................3.49 26.70 106 Paraguay ..........................................................................................................3.47 26.07 107 Cabo Verde ....................................................................................................3.47 25.99 108 Ecuador ............................................................................................................3.47 25.92 109 Georgia .............................................................................................................3.47 25.90 110 Tajikistan ..........................................................................................................3.47 25.90 111 El Salvador ..................................................................................................... 3.44 25.01 112 Nicaragua ........................................................................................................3.43 24.56 113 Venezuela, Bolivarian Rep. ...................................................................3.42 24.51 114 Moldova, Rep. ..............................................................................................3.41 24.07 115 Bulgaria.............................................................................................................3.41 24.01 116 Algeria ...............................................................................................................3.41 23.94 117 Romania ...........................................................................................................3.40 23.73 118 Iran, Islamic Rep. .........................................................................................3.39 23.33 119 Nepal ..................................................................................................................3.36 22.45 120 Peru .....................................................................................................................3.30 20.77 121 Burundi .............................................................................................................3.29 20.49 122 Bangladesh ....................................................................................................3.29 20.44 123 Kyrgyzstan ......................................................................................................3.27 19.79 124 Burkina Faso .................................................................................................. 3.14 15.79 125 Bolivia, Plurinational St. .......................................................................... 3.12 14.93 126 Croatia ...............................................................................................................3.08 13.81 127 Bosnia and Herzegovina .......................................................................3.03 12.19 128 North Macedonia ......................................................................................2.98 10.88 129 Congo, Dem. Rep. .....................................................................................2.96 10.17 130 Mozambique ................................................................................................2.90 8.20 131 Angola...............................................................................................................2.65 0.37 132 Yemen ...............................................................................................................2.63 0.00
SOURCE: World Economic Forum, Executive Opinion Survey 2017–2018 (http://reports.weforum.org)For some countries, the latest year for which data are available may differ from the year that appears at the top of the page. The cut-off year is 2008.
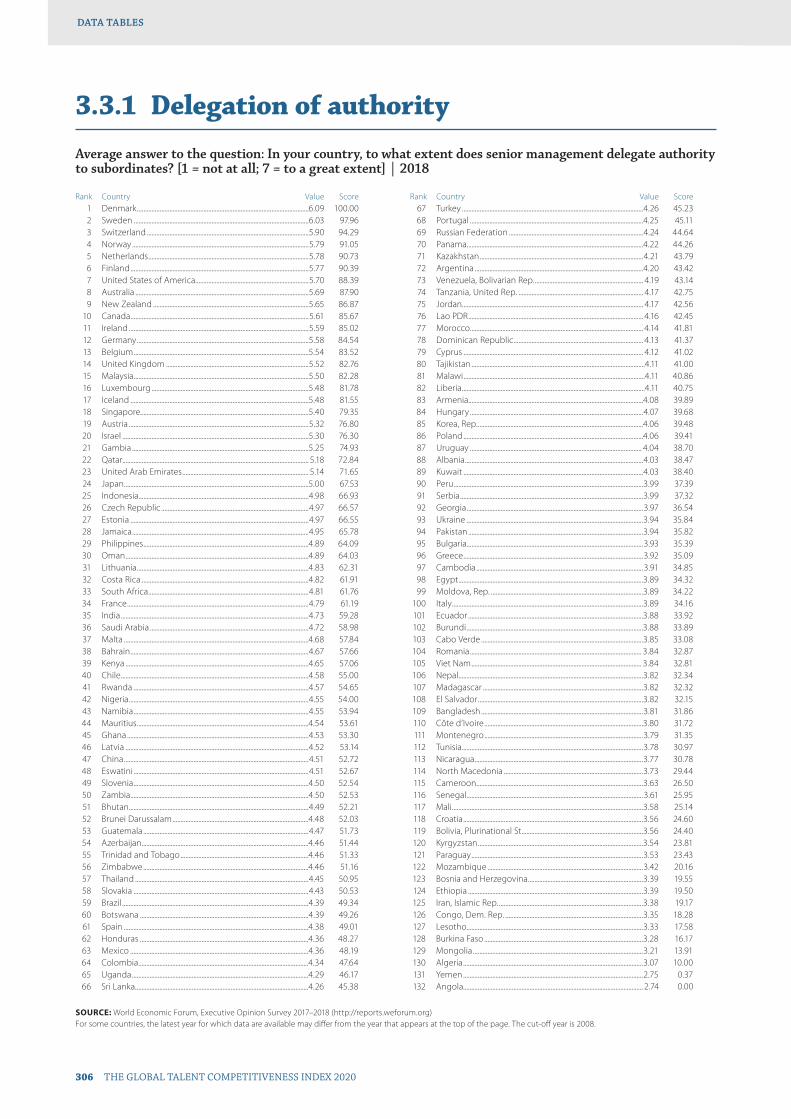
306 THE GLOBAL TALENT COMPETITIVENESS INDEX 2020
DATA TABLESDATA TABLES
3.3.1 Delegation of authority
Average answer to the question: In your country, to what extent does senior management delegate authority to subordinates? [1 = not at all; 7 = to a great extent] | 2018
Rank Country Value Score 1 Denmark ..........................................................................................................6.09 100.00 2 Sweden ............................................................................................................6.03 97.96 3 Switzerland ....................................................................................................5.90 94.29 4 Norway .............................................................................................................5.79 91.05 5 Netherlands ...................................................................................................5.78 90.73 6 Finland ..............................................................................................................5.77 90.39 7 United States of America......................................................................5.70 88.39 8 Australia ...........................................................................................................5.69 87.90 9 New Zealand ................................................................................................5.65 86.87 10 Canada ..............................................................................................................5.61 85.67 11 Ireland ...............................................................................................................5.59 85.02 12 Germany ..........................................................................................................5.58 84.54 13 Belgium ............................................................................................................5.54 83.52 14 United Kingdom ........................................................................................5.52 82.76 15 Malaysia ............................................................................................................5.50 82.28 16 Luxembourg .................................................................................................5.48 81.78 17 Iceland ..............................................................................................................5.48 81.55 18 Singapore........................................................................................................5.40 79.35 19 Austria ...............................................................................................................5.32 76.80 20 Israel ...................................................................................................................5.30 76.30 21 Gambia .............................................................................................................5.25 74.93 22 Qatar ................................................................................................................... 5.18 72.84 23 United Arab Emirates .............................................................................. 5.14 71.65 24 Japan ..................................................................................................................5.00 67.53 25 Indonesia.........................................................................................................4.98 66.93 26 Czech Republic ...........................................................................................4.97 66.57 27 Estonia ..............................................................................................................4.97 66.55 28 Jamaica .............................................................................................................4.95 65.78 29 Philippines ......................................................................................................4.89 64.09 30 Oman .................................................................................................................4.89 64.03 31 Lithuania ..........................................................................................................4.83 62.31 32 Costa Rica .......................................................................................................4.82 61.91 33 South Africa ...................................................................................................4.81 61.76 34 France ................................................................................................................4.79 61.19 35 India ....................................................................................................................4.73 59.28 36 Saudi Arabia ..................................................................................................4.72 58.98 37 Malta ..................................................................................................................4.68 57.84 38 Bahrain ..............................................................................................................4.67 57.66 39 Kenya .................................................................................................................4.65 57.06 40 Chile ....................................................................................................................4.58 55.00 41 Rwanda ............................................................................................................4.57 54.65 42 Nigeria ...............................................................................................................4.55 54.00 43 Namibia ............................................................................................................4.55 53.94 44 Mauritius ..........................................................................................................4.54 53.61 45 Ghana ................................................................................................................4.53 53.30 46 Latvia .................................................................................................................4.52 53.14 47 China ..................................................................................................................4.51 52.72 48 Eswatini ............................................................................................................4.51 52.67 49 Slovenia ............................................................................................................4.50 52.54 50 Zambia ..............................................................................................................4.50 52.53 51 Bhutan...............................................................................................................4.49 52.21 52 Brunei Darussalam ....................................................................................4.48 52.03 53 Guatemala ......................................................................................................4.47 51.73 54 Azerbaijan .......................................................................................................4.46 51.44 55 Trinidad and Tobago ...............................................................................4.46 51.33 56 Zimbabwe ......................................................................................................4.46 51.16 57 Thailand ...........................................................................................................4.45 50.95 58 Slovakia ............................................................................................................4.43 50.53 59 Brazil ...................................................................................................................4.39 49.34 60 Botswana ........................................................................................................4.39 49.26 61 Spain ..................................................................................................................4.38 49.01 62 Honduras ........................................................................................................4.36 48.27 63 Mexico ..............................................................................................................4.36 48.19 64 Colombia .........................................................................................................4.34 47.64 65 Uganda .............................................................................................................4.29 46.17 66 Sri Lanka ...........................................................................................................4.26 45.38
Rank Country Value Score 67 Turkey ................................................................................................................4.26 45.23 68 Portugal ...........................................................................................................4.25 45.11 69 Russian Federation ...................................................................................4.24 44.64 70 Panama .............................................................................................................4.22 44.26 71 Kazakhstan .....................................................................................................4.21 43.79 72 Argentina ........................................................................................................4.20 43.42 73 Venezuela, Bolivarian Rep. ................................................................... 4.19 43.14 74 Tanzania, United Rep. ............................................................................. 4.17 42.75 75 Jordan................................................................................................................ 4.17 42.56 76 Lao PDR ............................................................................................................ 4.16 42.45 77 Morocco ........................................................................................................... 4.14 41.81 78 Dominican Republic ................................................................................ 4.13 41.37 79 Cyprus ............................................................................................................... 4.12 41.02 80 Tajikistan ...........................................................................................................4.11 41.00 81 Malawi ................................................................................................................4.11 40.86 82 Liberia .................................................................................................................4.11 40.75 83 Armenia............................................................................................................4.08 39.89 84 Hungary ...........................................................................................................4.07 39.68 85 Korea, Rep. ......................................................................................................4.06 39.48 86 Poland ...............................................................................................................4.06 39.41 87 Uruguay .......................................................................................................... 4.04 38.70 88 Albania ..............................................................................................................4.03 38.47 89 Kuwait ...............................................................................................................4.03 38.40 90 Peru .....................................................................................................................3.99 37.39 91 Serbia .................................................................................................................3.99 37.32 92 Georgia .............................................................................................................3.97 36.54 93 Ukraine .............................................................................................................3.94 35.84 94 Pakistan ............................................................................................................3.94 35.82 95 Bulgaria.............................................................................................................3.93 35.39 96 Greece ...............................................................................................................3.92 35.09 97 Cambodia .......................................................................................................3.91 34.85 98 Egypt ..................................................................................................................3.89 34.32 99 Moldova, Rep. ..............................................................................................3.89 34.22 100 Italy ......................................................................................................................3.89 34.16 101 Ecuador ............................................................................................................3.88 33.92 102 Burundi .............................................................................................................3.88 33.89 103 Cabo Verde ....................................................................................................3.85 33.08 104 Romania .......................................................................................................... 3.84 32.87 105 Viet Nam ......................................................................................................... 3.84 32.81 106 Nepal ..................................................................................................................3.82 32.34 107 Madagascar ...................................................................................................3.82 32.32 108 El Salvador ......................................................................................................3.82 32.15 109 Bangladesh ....................................................................................................3.81 31.86 110 Côte d’Ivoire ..................................................................................................3.80 31.72 111 Montenegro ..................................................................................................3.79 31.35 112 Tunisia................................................................................................................3.78 30.97 113 Nicaragua ........................................................................................................3.77 30.78 114 North Macedonia ......................................................................................3.73 29.44 115 Cameroon .......................................................................................................3.63 26.50 116 Senegal .............................................................................................................3.61 25.95 117 Mali ......................................................................................................................3.58 25.14 118 Croatia ...............................................................................................................3.56 24.60 119 Bolivia, Plurinational St. ..........................................................................3.56 24.40 120 Kyrgyzstan ......................................................................................................3.54 23.81 121 Paraguay ..........................................................................................................3.53 23.43 122 Mozambique ................................................................................................3.42 20.16 123 Bosnia and Herzegovina .......................................................................3.39 19.55 124 Ethiopia ............................................................................................................3.39 19.50 125 Iran, Islamic Rep. .........................................................................................3.38 19.17 126 Congo, Dem. Rep. .....................................................................................3.35 18.28 127 Lesotho.............................................................................................................3.33 17.58 128 Burkina Faso ..................................................................................................3.28 16.17 129 Mongolia .........................................................................................................3.21 13.91 130 Algeria ...............................................................................................................3.07 10.00 131 Yemen ...............................................................................................................2.75 0.37 132 Angola............................................................................................................... 2.74 0.00
SOURCE: World Economic Forum, Executive Opinion Survey 2017–2018 (http://reports.weforum.org)For some countries, the latest year for which data are available may differ from the year that appears at the top of the page. The cut-off year is 2008.
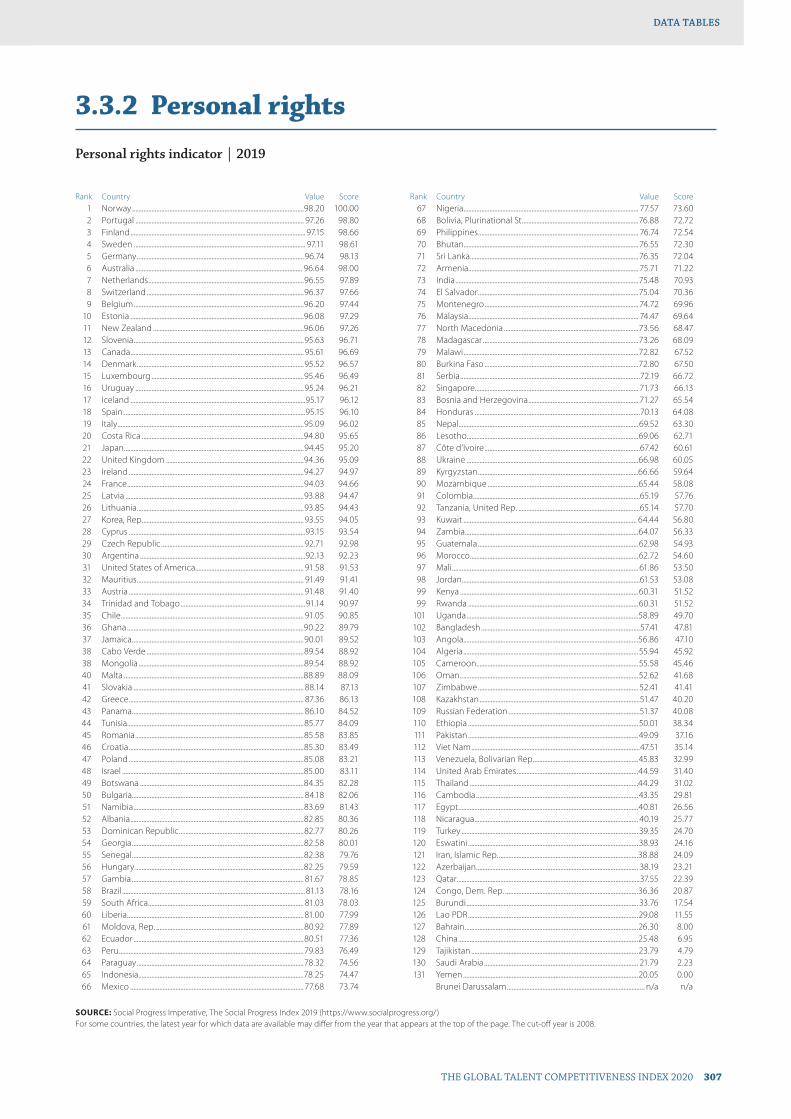
THE GLOBAL TALENT COMPETITIVENESS INDEX 2020 307
DATA TABLESDATA TABLES
3.3.2 Personal rights
Personal rights indicator | 2019
Rank Country Value Score 1 Norway ..........................................................................................................98.20 100.00 2 Portugal ........................................................................................................ 97.26 98.80 3 Finland ............................................................................................................ 97.15 98.66 4 Sweden .......................................................................................................... 97.11 98.61 5 Germany .......................................................................................................96.74 98.13 6 Australia ....................................................................................................... 96.64 98.00 7 Netherlands ................................................................................................96.55 97.89 8 Switzerland .................................................................................................96.37 97.66 9 Belgium .........................................................................................................96.20 97.44 10 Estonia ...........................................................................................................96.08 97.29 11 New Zealand .............................................................................................96.06 97.26 12 Slovenia .........................................................................................................95.63 96.71 13 Canada ........................................................................................................... 95.61 96.69 14 Denmark .......................................................................................................95.52 96.57 15 Luxembourg ..............................................................................................95.46 96.49 16 Uruguay ........................................................................................................95.24 96.21 17 Iceland ............................................................................................................95.17 96.12 18 Spain ................................................................................................................95.15 96.10 19 Italy ...................................................................................................................95.09 96.02 20 Costa Rica ....................................................................................................94.80 95.65 21 Japan ...............................................................................................................94.45 95.20 22 United Kingdom .....................................................................................94.36 95.09 23 Ireland ............................................................................................................94.27 94.97 24 France .............................................................................................................94.03 94.66 25 Latvia ..............................................................................................................93.88 94.47 26 Lithuania .......................................................................................................93.85 94.43 27 Korea, Rep. ...................................................................................................93.55 94.05 28 Cyprus .............................................................................................................93.15 93.54 29 Czech Republic ........................................................................................ 92.71 92.98 30 Argentina ......................................................................................................92.13 92.23 31 United States of America................................................................... 91.58 91.53 32 Mauritius ....................................................................................................... 91.49 91.41 33 Austria ............................................................................................................ 91.48 91.40 34 Trinidad and Tobago .............................................................................91.14 90.97 35 Chile ................................................................................................................. 91.05 90.85 36 Ghana .............................................................................................................90.22 89.79 37 Jamaica ..........................................................................................................90.01 89.52 38 Cabo Verde .................................................................................................89.54 88.92 38 Mongolia ......................................................................................................89.54 88.92 40 Malta ...............................................................................................................88.89 88.09 41 Slovakia ......................................................................................................... 88.14 87.13 42 Greece ............................................................................................................ 87.36 86.13 43 Panama .......................................................................................................... 86.10 84.52 44 Tunisia.............................................................................................................85.77 84.09 45 Romania ........................................................................................................85.58 83.85 46 Croatia ............................................................................................................85.30 83.49 47 Poland ............................................................................................................85.08 83.21 48 Israel ................................................................................................................85.00 83.11 49 Botswana .....................................................................................................84.35 82.28 50 Bulgaria.......................................................................................................... 84.18 82.06 51 Namibia .........................................................................................................83.69 81.43 52 Albania ...........................................................................................................82.85 80.36 53 Dominican Republic .............................................................................82.77 80.26 54 Georgia ..........................................................................................................82.58 80.01 55 Senegal ..........................................................................................................82.38 79.76 56 Hungary ........................................................................................................82.25 79.59 57 Gambia .......................................................................................................... 81.67 78.85 58 Brazil .................................................................................................................81.13 78.16 59 South Africa ................................................................................................ 81.03 78.03 60 Liberia .............................................................................................................81.00 77.99 61 Moldova, Rep. ...........................................................................................80.92 77.89 62 Ecuador .........................................................................................................80.51 77.36 63 Peru ..................................................................................................................79.83 76.49 64 Paraguay .......................................................................................................78.32 74.56 65 Indonesia......................................................................................................78.25 74.47 66 Mexico ........................................................................................................... 77.68 73.74
Rank Country Value Score 67 Nigeria ............................................................................................................ 77.57 73.60 68 Bolivia, Plurinational St. .......................................................................76.88 72.72 69 Philippines ................................................................................................... 76.74 72.54 70 Bhutan............................................................................................................76.55 72.30 71 Sri Lanka ........................................................................................................76.35 72.04 72 Armenia......................................................................................................... 75.71 71.22 73 India .................................................................................................................75.48 70.93 74 El Salvador ...................................................................................................75.04 70.36 75 Montenegro ............................................................................................... 74.72 69.96 76 Malaysia ......................................................................................................... 74.47 69.64 77 North Macedonia ...................................................................................73.56 68.47 78 Madagascar ................................................................................................73.26 68.09 79 Malawi ............................................................................................................72.82 67.52 80 Burkina Faso ...............................................................................................72.80 67.50 81 Serbia ...............................................................................................................72.19 66.72 82 Singapore..................................................................................................... 71.73 66.13 83 Bosnia and Herzegovina .................................................................... 71.27 65.54 84 Honduras ......................................................................................................70.13 64.08 85 Nepal ...............................................................................................................69.52 63.30 86 Lesotho..........................................................................................................69.06 62.71 87 Côte d’Ivoire ................................................................................................67.42 60.61 88 Ukraine ..........................................................................................................66.98 60.05 89 Kyrgyzstan ...................................................................................................66.66 59.64 90 Mozambique .............................................................................................65.44 58.08 91 Colombia .......................................................................................................65.19 57.76 92 Tanzania, United Rep. ...........................................................................65.14 57.70 93 Kuwait ........................................................................................................... 64.44 56.80 94 Zambia ...........................................................................................................64.07 56.33 95 Guatemala ...................................................................................................62.98 54.93 96 Morocco ........................................................................................................62.72 54.60 97 Mali ................................................................................................................... 61.86 53.50 98 Jordan..............................................................................................................61.53 53.08 99 Kenya ..............................................................................................................60.31 51.52 99 Rwanda .........................................................................................................60.31 51.52 101 Uganda ..........................................................................................................58.89 49.70 102 Bangladesh ..................................................................................................57.41 47.81 103 Angola............................................................................................................56.86 47.10 104 Algeria ............................................................................................................55.94 45.92 105 Cameroon ....................................................................................................55.58 45.46 106 Oman ..............................................................................................................52.62 41.68 107 Zimbabwe ................................................................................................... 52.41 41.41 108 Kazakhstan ...................................................................................................51.47 40.20 109 Russian Federation .................................................................................51.37 40.08 110 Ethiopia .........................................................................................................50.01 38.34 111 Pakistan .........................................................................................................49.09 37.16 112 Viet Nam ........................................................................................................47.51 35.14 113 Venezuela, Bolivarian Rep. ................................................................45.83 32.99 114 United Arab Emirates ...........................................................................44.59 31.40 115 Thailand ........................................................................................................44.29 31.02 116 Cambodia ....................................................................................................43.35 29.81 117 Egypt ...............................................................................................................40.81 26.56 118 Nicaragua ..................................................................................................... 40.19 25.77 119 Turkey .............................................................................................................39.35 24.70 120 Eswatini .........................................................................................................38.93 24.16 121 Iran, Islamic Rep. ......................................................................................38.88 24.09 122 Azerbaijan .................................................................................................... 38.19 23.21 123 Qatar .................................................................................................................37.55 22.39 124 Congo, Dem. Rep. ..................................................................................36.36 20.87 125 Burundi .......................................................................................................... 33.76 17.54 126 Lao PDR .........................................................................................................29.08 11.55 127 Bahrain ...........................................................................................................26.30 8.00 128 China ...............................................................................................................25.48 6.95 129 Tajikistan .......................................................................................................23.79 4.79 130 Saudi Arabia ............................................................................................... 21.79 2.23 131 Yemen ............................................................................................................20.05 0.00 Brunei Darussalam ..................................................................................... n/a n/a
SOURCE: Social Progress Imperative, The Social Progress Index 2019 (https://www.socialprogress.org/)For some countries, the latest year for which data are available may differ from the year that appears at the top of the page. The cut-off year is 2008.
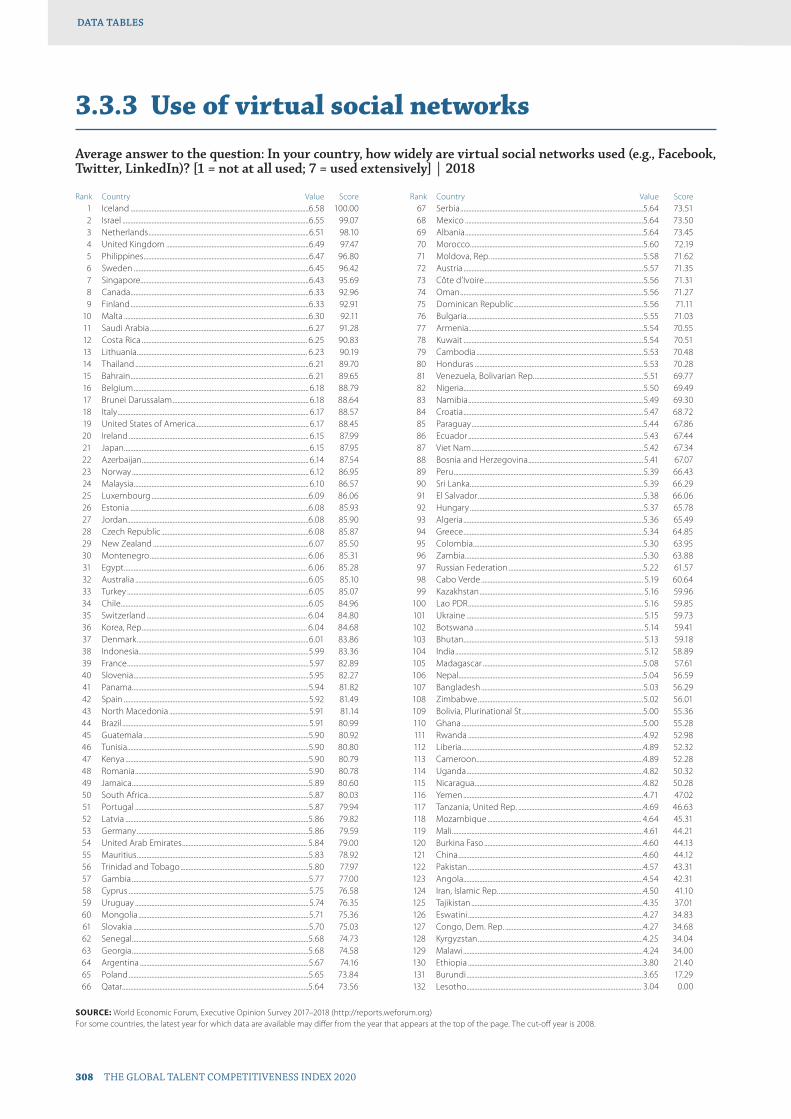
308 THE GLOBAL TALENT COMPETITIVENESS INDEX 2020
DATA TABLESDATA TABLES
3.3.3 Use of virtual social networks
Average answer to the question: In your country, how widely are virtual social networks used (e.g., Facebook, Twitter, LinkedIn)? [1 = not at all used; 7 = used extensively] | 2018
Rank Country Value Score 1 Iceland ..............................................................................................................6.58 100.00 2 Israel ...................................................................................................................6.55 99.07 3 Netherlands ...................................................................................................6.51 98.10 4 United Kingdom ........................................................................................6.49 97.47 5 Philippines ......................................................................................................6.47 96.80 6 Sweden ............................................................................................................6.45 96.42 7 Singapore........................................................................................................6.43 95.69 8 Canada ..............................................................................................................6.33 92.96 9 Finland ..............................................................................................................6.33 92.91 10 Malta ..................................................................................................................6.30 92.11 11 Saudi Arabia ..................................................................................................6.27 91.28 12 Costa Rica ...................................................................................................... 6.25 90.83 13 Lithuania ......................................................................................................... 6.23 90.19 14 Thailand ...........................................................................................................6.21 89.70 15 Bahrain ..............................................................................................................6.21 89.65 16 Belgium ............................................................................................................ 6.18 88.79 17 Brunei Darussalam .................................................................................... 6.18 88.64 18 Italy ...................................................................................................................... 6.17 88.57 19 United States of America...................................................................... 6.17 88.45 20 Ireland ............................................................................................................... 6.15 87.99 21 Japan .................................................................................................................. 6.15 87.95 22 Azerbaijan ....................................................................................................... 6.14 87.54 23 Norway ............................................................................................................. 6.12 86.95 24 Malaysia ............................................................................................................ 6.10 86.57 25 Luxembourg .................................................................................................6.09 86.06 26 Estonia ..............................................................................................................6.08 85.93 27 Jordan................................................................................................................6.08 85.90 28 Czech Republic ...........................................................................................6.08 85.87 29 New Zealand ................................................................................................6.07 85.50 30 Montenegro ................................................................................................. 6.06 85.31 31 Egypt ................................................................................................................. 6.06 85.28 32 Australia ...........................................................................................................6.05 85.10 33 Turkey ................................................................................................................6.05 85.07 34 Chile ....................................................................................................................6.05 84.96 35 Switzerland ................................................................................................... 6.04 84.80 36 Korea, Rep. ..................................................................................................... 6.04 84.68 37 Denmark ..........................................................................................................6.01 83.86 38 Indonesia.........................................................................................................5.99 83.36 39 France ................................................................................................................5.97 82.89 40 Slovenia ............................................................................................................5.95 82.27 41 Panama .............................................................................................................5.94 81.82 42 Spain ..................................................................................................................5.92 81.49 43 North Macedonia ......................................................................................5.91 81.14 44 Brazil ...................................................................................................................5.91 80.99 45 Guatemala ......................................................................................................5.90 80.92 46 Tunisia................................................................................................................5.90 80.80 47 Kenya .................................................................................................................5.90 80.79 48 Romania ...........................................................................................................5.90 80.78 49 Jamaica .............................................................................................................5.89 80.60 50 South Africa ...................................................................................................5.87 80.03 51 Portugal ...........................................................................................................5.87 79.94 52 Latvia .................................................................................................................5.86 79.82 53 Germany ..........................................................................................................5.86 79.59 54 United Arab Emirates ............................................................................. 5.84 79.00 55 Mauritius ..........................................................................................................5.83 78.92 56 Trinidad and Tobago ...............................................................................5.80 77.97 57 Gambia .............................................................................................................5.77 77.00 58 Cyprus ...............................................................................................................5.75 76.58 59 Uruguay ...........................................................................................................5.74 76.35 60 Mongolia .........................................................................................................5.71 75.36 61 Slovakia ............................................................................................................5.70 75.03 62 Senegal .............................................................................................................5.68 74.73 63 Georgia .............................................................................................................5.68 74.58 64 Argentina ........................................................................................................5.67 74.16 65 Poland ...............................................................................................................5.65 73.84 66 Qatar ...................................................................................................................5.64 73.56
Rank Country Value Score 67 Serbia .................................................................................................................5.64 73.51 68 Mexico ..............................................................................................................5.64 73.50 69 Albania ..............................................................................................................5.64 73.45 70 Morocco ...........................................................................................................5.60 72.19 71 Moldova, Rep. ..............................................................................................5.58 71.62 72 Austria ...............................................................................................................5.57 71.35 73 Côte d’Ivoire ..................................................................................................5.56 71.31 74 Oman .................................................................................................................5.56 71.27 75 Dominican Republic ................................................................................5.56 71.11 76 Bulgaria.............................................................................................................5.55 71.03 77 Armenia............................................................................................................5.54 70.55 78 Kuwait ...............................................................................................................5.54 70.51 79 Cambodia .......................................................................................................5.53 70.48 80 Honduras ........................................................................................................5.53 70.28 81 Venezuela, Bolivarian Rep. ...................................................................5.51 69.77 82 Nigeria ...............................................................................................................5.50 69.49 83 Namibia ............................................................................................................5.49 69.30 84 Croatia ...............................................................................................................5.47 68.72 85 Paraguay ..........................................................................................................5.44 67.86 86 Ecuador ............................................................................................................5.43 67.44 87 Viet Nam ..........................................................................................................5.42 67.34 88 Bosnia and Herzegovina .......................................................................5.41 67.07 89 Peru .....................................................................................................................5.39 66.43 90 Sri Lanka ...........................................................................................................5.39 66.29 91 El Salvador ......................................................................................................5.38 66.06 92 Hungary ...........................................................................................................5.37 65.78 93 Algeria ...............................................................................................................5.36 65.49 94 Greece ...............................................................................................................5.34 64.85 95 Colombia .........................................................................................................5.30 63.95 96 Zambia ..............................................................................................................5.30 63.88 97 Russian Federation ...................................................................................5.22 61.57 98 Cabo Verde .................................................................................................... 5.19 60.64 99 Kazakhstan ..................................................................................................... 5.16 59.96 100 Lao PDR ............................................................................................................ 5.16 59.85 101 Ukraine ............................................................................................................. 5.15 59.73 102 Botswana ........................................................................................................ 5.14 59.41 103 Bhutan............................................................................................................... 5.13 59.18 104 India .................................................................................................................... 5.12 58.89 105 Madagascar ...................................................................................................5.08 57.61 106 Nepal ..................................................................................................................5.04 56.59 107 Bangladesh ....................................................................................................5.03 56.29 108 Zimbabwe ......................................................................................................5.02 56.01 109 Bolivia, Plurinational St. ..........................................................................5.00 55.36 110 Ghana ................................................................................................................5.00 55.28 111 Rwanda ............................................................................................................4.92 52.98 112 Liberia ................................................................................................................4.89 52.32 113 Cameroon .......................................................................................................4.89 52.28 114 Uganda .............................................................................................................4.82 50.32 115 Nicaragua ........................................................................................................4.82 50.28 116 Yemen ...............................................................................................................4.71 47.02 117 Tanzania, United Rep. .............................................................................4.69 46.63 118 Mozambique ............................................................................................... 4.64 45.31 119 Mali ......................................................................................................................4.61 44.21 120 Burkina Faso ..................................................................................................4.60 44.13 121 China ..................................................................................................................4.60 44.12 122 Pakistan ............................................................................................................4.57 43.31 123 Angola...............................................................................................................4.54 42.31 124 Iran, Islamic Rep. .........................................................................................4.50 41.10 125 Tajikistan ..........................................................................................................4.35 37.01 126 Eswatini ............................................................................................................4.27 34.83 127 Congo, Dem. Rep. .....................................................................................4.27 34.68 128 Kyrgyzstan ......................................................................................................4.25 34.04 129 Malawi ...............................................................................................................4.24 34.00 130 Ethiopia ............................................................................................................3.80 21.40 131 Burundi .............................................................................................................3.65 17.29 132 Lesotho............................................................................................................ 3.04 0.00
SOURCE: World Economic Forum, Executive Opinion Survey 2017–2018 (http://reports.weforum.org)For some countries, the latest year for which data are available may differ from the year that appears at the top of the page. The cut-off year is 2008.
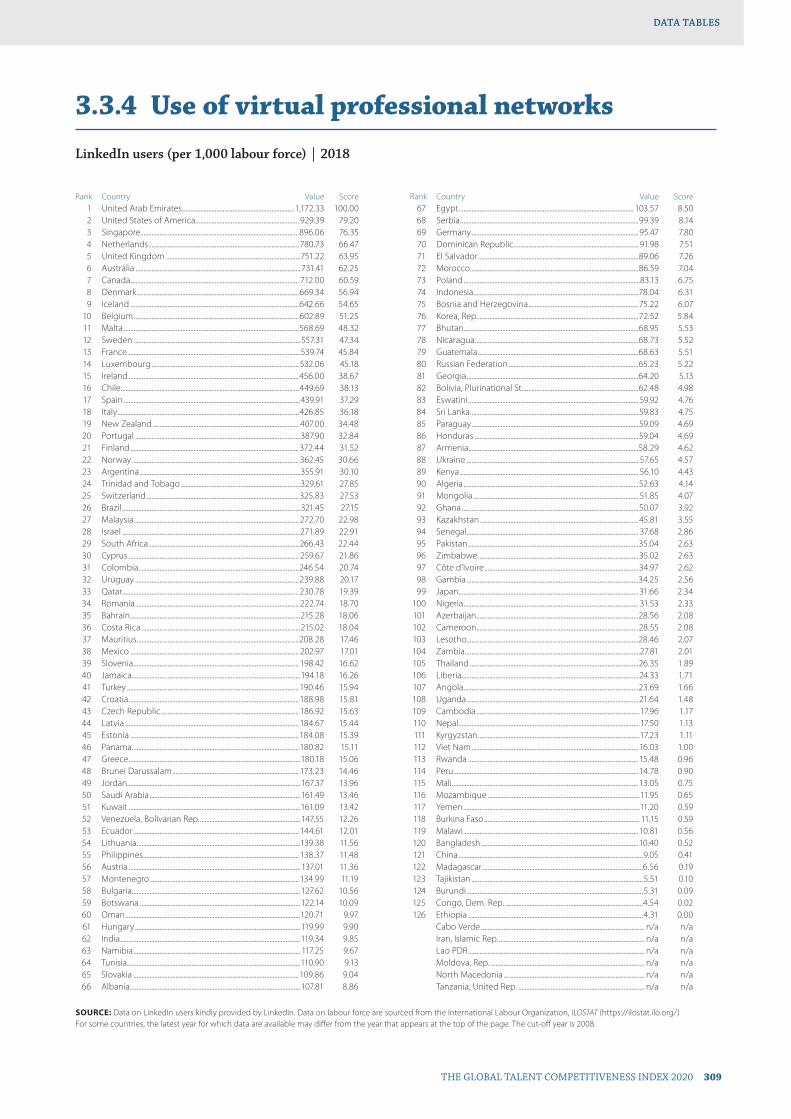
THE GLOBAL TALENT COMPETITIVENESS INDEX 2020 309
DATA TABLESDATA TABLES
3.3.4 Use of virtual professional networks
LinkedIn users (per 1,000 labour force) | 2018
Rank Country Value Score 1 United Arab Emirates ..................................................................... 1,172.33 100.00 2 United States of America................................................................ 929.39 79.20 3 Singapore..................................................................................................896.06 76.35 4 Netherlands .............................................................................................780.73 66.47 5 United Kingdom ...................................................................................751.22 63.95 6 Australia ......................................................................................................731.41 62.25 7 Canada ........................................................................................................ 712.00 60.59 8 Denmark ....................................................................................................669.34 56.94 9 Iceland ........................................................................................................642.66 54.65 10 Belgium ......................................................................................................602.89 51.25 11 Malta ............................................................................................................568.69 48.32 12 Sweden .......................................................................................................557.31 47.34 13 France ...........................................................................................................539.74 45.84 14 Luxembourg ........................................................................................... 532.06 45.18 15 Ireland .........................................................................................................456.00 38.67 16 Chile ..............................................................................................................449.69 38.13 17 Spain .............................................................................................................439.91 37.29 18 Italy ................................................................................................................426.85 36.18 19 New Zealand .......................................................................................... 407.00 34.48 20 Portugal ......................................................................................................387.90 32.84 21 Finland ........................................................................................................372.44 31.52 22 Norway ....................................................................................................... 362.45 30.66 23 Argentina ...................................................................................................355.91 30.10 24 Trinidad and Tobago ..........................................................................329.61 27.85 25 Switzerland ..............................................................................................325.83 27.53 26 Brazil ..............................................................................................................321.45 27.15 27 Malaysia ...................................................................................................... 272.70 22.98 28 Israel ............................................................................................................. 271.89 22.91 29 South Africa .............................................................................................266.43 22.44 30 Cyprus ......................................................................................................... 259.67 21.86 31 Colombia ...................................................................................................246.54 20.74 32 Uruguay .....................................................................................................239.88 20.17 33 Qatar .............................................................................................................230.78 19.39 34 Romania ..................................................................................................... 222.74 18.70 35 Bahrain .........................................................................................................215.28 18.06 36 Costa Rica ..................................................................................................215.02 18.04 37 Mauritius ....................................................................................................208.28 17.46 38 Mexico ........................................................................................................ 202.97 17.01 39 Slovenia ...................................................................................................... 198.42 16.62 40 Jamaica ........................................................................................................194.18 16.26 41 Turkey .......................................................................................................... 190.46 15.94 42 Croatia ......................................................................................................... 188.98 15.81 43 Czech Republic ..................................................................................... 186.92 15.63 44 Latvia ........................................................................................................... 184.67 15.44 45 Estonia ........................................................................................................184.08 15.39 46 Panama ....................................................................................................... 180.82 15.11 47 Greece ..........................................................................................................180.18 15.06 48 Brunei Darussalam .............................................................................. 173.23 14.46 49 Jordan...........................................................................................................167.37 13.96 50 Saudi Arabia .............................................................................................161.49 13.46 51 Kuwait ..........................................................................................................161.09 13.42 52 Venezuela, Bolivarian Rep. ..............................................................147.55 12.26 53 Ecuador ...................................................................................................... 144.61 12.01 54 Lithuania .....................................................................................................139.38 11.56 55 Philippines ................................................................................................ 138.37 11.48 56 Austria .......................................................................................................... 137.01 11.36 57 Montenegro ............................................................................................ 134.99 11.19 58 Bulgaria........................................................................................................127.62 10.56 59 Botswana ...................................................................................................122.14 10.09 60 Oman ............................................................................................................120.71 9.97 61 Hungary ......................................................................................................119.99 9.90 62 India ...............................................................................................................119.34 9.85 63 Namibia ....................................................................................................... 117.25 9.67 64 Tunisia...........................................................................................................110.90 9.13 65 Slovakia ...................................................................................................... 109.86 9.04 66 Albania .........................................................................................................107.81 8.86
Rank Country Value Score 67 Egypt ............................................................................................................ 103.57 8.50 68 Serbia ..............................................................................................................99.39 8.14 69 Germany .......................................................................................................95.47 7.80 70 Dominican Republic ............................................................................. 91.98 7.51 71 El Salvador ...................................................................................................89.06 7.26 72 Morocco ........................................................................................................86.59 7.04 73 Poland .............................................................................................................83.13 6.75 74 Indonesia......................................................................................................78.04 6.31 75 Bosnia and Herzegovina ....................................................................75.22 6.07 76 Korea, Rep. ...................................................................................................72.52 5.84 77 Bhutan............................................................................................................68.95 5.53 78 Nicaragua .....................................................................................................68.73 5.52 79 Guatemala ...................................................................................................68.63 5.51 80 Russian Federation ................................................................................65.23 5.22 81 Georgia ..........................................................................................................64.20 5.13 82 Bolivia, Plurinational St. .......................................................................62.48 4.98 83 Eswatini ......................................................................................................... 59.92 4.76 84 Sri Lanka ........................................................................................................59.83 4.75 85 Paraguay .......................................................................................................59.09 4.69 86 Honduras .....................................................................................................59.04 4.69 87 Armenia.........................................................................................................58.29 4.62 88 Ukraine .......................................................................................................... 57.65 4.57 89 Kenya .............................................................................................................. 56.10 4.43 90 Algeria ............................................................................................................52.63 4.14 91 Mongolia ...................................................................................................... 51.85 4.07 92 Ghana .............................................................................................................50.07 3.92 93 Kazakhstan ..................................................................................................45.81 3.55 94 Senegal .......................................................................................................... 37.68 2.86 95 Pakistan .........................................................................................................35.04 2.63 96 Zimbabwe ...................................................................................................35.02 2.63 97 Côte d’Ivoire ...............................................................................................34.97 2.62 98 Gambia ..........................................................................................................34.25 2.56 99 Japan ............................................................................................................... 31.66 2.34 100 Nigeria ............................................................................................................ 31.53 2.33 101 Azerbaijan ....................................................................................................28.56 2.08 102 Cameroon ....................................................................................................28.55 2.08 103 Lesotho..........................................................................................................28.46 2.07 104 Zambia ............................................................................................................27.81 2.01 105 Thailand ........................................................................................................26.35 1.89 106 Liberia .............................................................................................................24.33 1.71 107 Angola............................................................................................................23.69 1.66 108 Uganda ..........................................................................................................21.64 1.48 109 Cambodia .....................................................................................................17.96 1.17 110 Nepal ................................................................................................................17.50 1.13 111 Kyrgyzstan ....................................................................................................17.23 1.11 112 Viet Nam .......................................................................................................16.03 1.00 113 Rwanda .........................................................................................................15.48 0.96 114 Peru .................................................................................................................. 14.78 0.90 115 Mali ................................................................................................................... 13.05 0.75 116 Mozambique ..............................................................................................11.95 0.65 117 Yemen .............................................................................................................11.20 0.59 118 Burkina Faso ................................................................................................ 11.15 0.59 119 Malawi ............................................................................................................ 10.81 0.56 120 Bangladesh .................................................................................................10.40 0.52 121 China ..................................................................................................................9.05 0.41 122 Madagascar ...................................................................................................6.56 0.19 123 Tajikistan ..........................................................................................................5.51 0.10 124 Burundi .............................................................................................................5.31 0.09 125 Congo, Dem. Rep. .....................................................................................4.54 0.02 126 Ethiopia ............................................................................................................4.31 0.00 Cabo Verde ..................................................................................................... n/a n/a Iran, Islamic Rep. .......................................................................................... n/a n/a Lao PDR ............................................................................................................. n/a n/a Moldova, Rep. ............................................................................................... n/a n/a North Macedonia ....................................................................................... n/a n/a Tanzania, United Rep. .............................................................................. n/a n/a
SOURCE: Data on LinkedIn users kindly provided by LinkedIn. Data on labour force are sourced from the International Labour Organization, ILOSTAT (https://ilostat.ilo.org/)For some countries, the latest year for which data are available may differ from the year that appears at the top of the page. The cut-off year is 2008.
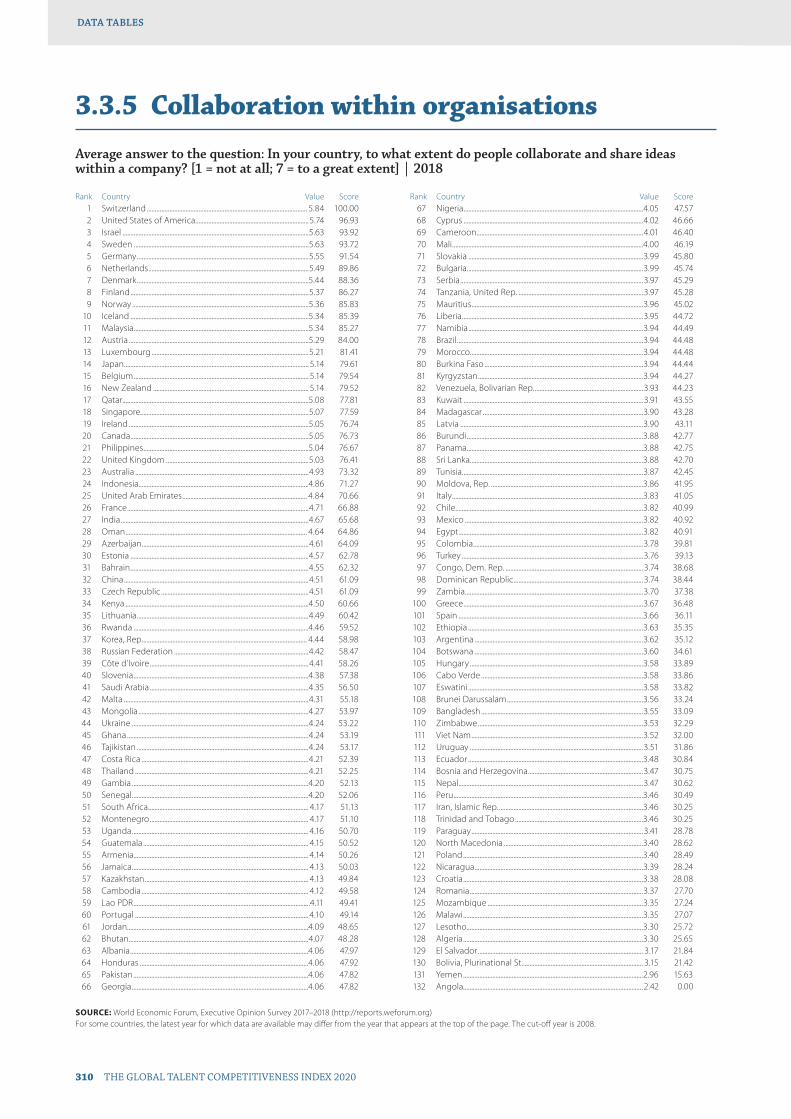
310 THE GLOBAL TALENT COMPETITIVENESS INDEX 2020
DATA TABLESDATA TABLES
3.3.5 Collaboration within organisations
Average answer to the question: In your country, to what extent do people collaborate and share ideas within a company? [1 = not at all; 7 = to a great extent] | 2018
Rank Country Value Score 1 Switzerland ................................................................................................... 5.84 100.00 2 United States of America......................................................................5.74 96.93 3 Israel ...................................................................................................................5.63 93.92 4 Sweden ............................................................................................................5.63 93.72 5 Germany ..........................................................................................................5.55 91.54 6 Netherlands ...................................................................................................5.49 89.86 7 Denmark ..........................................................................................................5.44 88.36 8 Finland ..............................................................................................................5.37 86.27 9 Norway .............................................................................................................5.36 85.83 10 Iceland ..............................................................................................................5.34 85.39 11 Malaysia ............................................................................................................5.34 85.27 12 Austria ...............................................................................................................5.29 84.00 13 Luxembourg .................................................................................................5.21 81.41 14 Japan .................................................................................................................. 5.14 79.61 15 Belgium ............................................................................................................ 5.14 79.54 16 New Zealand ................................................................................................ 5.14 79.52 17 Qatar ...................................................................................................................5.08 77.81 18 Singapore........................................................................................................5.07 77.59 19 Ireland ...............................................................................................................5.05 76.74 20 Canada ..............................................................................................................5.05 76.73 21 Philippines ......................................................................................................5.04 76.67 22 United Kingdom ........................................................................................5.03 76.41 23 Australia ...........................................................................................................4.93 73.32 24 Indonesia.........................................................................................................4.86 71.27 25 United Arab Emirates ............................................................................. 4.84 70.66 26 France ................................................................................................................4.71 66.88 27 India ....................................................................................................................4.67 65.68 28 Oman ................................................................................................................ 4.64 64.86 29 Azerbaijan .......................................................................................................4.61 64.09 30 Estonia ..............................................................................................................4.57 62.78 31 Bahrain ..............................................................................................................4.55 62.32 32 China ..................................................................................................................4.51 61.09 33 Czech Republic ...........................................................................................4.51 61.09 34 Kenya .................................................................................................................4.50 60.66 35 Lithuania ..........................................................................................................4.49 60.42 36 Rwanda ............................................................................................................4.46 59.52 37 Korea, Rep. ..................................................................................................... 4.44 58.98 38 Russian Federation ...................................................................................4.42 58.47 39 Côte d’Ivoire ..................................................................................................4.41 58.26 40 Slovenia ............................................................................................................4.38 57.38 41 Saudi Arabia ..................................................................................................4.35 56.50 42 Malta ..................................................................................................................4.31 55.18 43 Mongolia .........................................................................................................4.27 53.97 44 Ukraine .............................................................................................................4.24 53.22 45 Ghana ................................................................................................................4.24 53.19 46 Tajikistan ..........................................................................................................4.24 53.17 47 Costa Rica .......................................................................................................4.21 52.39 48 Thailand ...........................................................................................................4.21 52.25 49 Gambia .............................................................................................................4.20 52.13 50 Senegal .............................................................................................................4.20 52.06 51 South Africa ................................................................................................... 4.17 51.13 52 Montenegro .................................................................................................. 4.17 51.10 53 Uganda ............................................................................................................. 4.16 50.70 54 Guatemala ...................................................................................................... 4.15 50.52 55 Armenia............................................................................................................ 4.14 50.26 56 Jamaica ............................................................................................................. 4.13 50.03 57 Kazakhstan ..................................................................................................... 4.13 49.84 58 Cambodia ....................................................................................................... 4.12 49.58 59 Lao PDR .............................................................................................................4.11 49.41 60 Portugal ........................................................................................................... 4.10 49.14 61 Jordan................................................................................................................4.09 48.65 62 Bhutan...............................................................................................................4.07 48.28 63 Albania ..............................................................................................................4.06 47.97 64 Honduras ........................................................................................................4.06 47.92 65 Pakistan ............................................................................................................4.06 47.82 66 Georgia .............................................................................................................4.06 47.82
Rank Country Value Score 67 Nigeria ...............................................................................................................4.05 47.57 68 Cyprus ...............................................................................................................4.02 46.66 69 Cameroon .......................................................................................................4.01 46.40 70 Mali ......................................................................................................................4.00 46.19 71 Slovakia ............................................................................................................3.99 45.80 72 Bulgaria.............................................................................................................3.99 45.74 73 Serbia .................................................................................................................3.97 45.29 74 Tanzania, United Rep. .............................................................................3.97 45.28 75 Mauritius ..........................................................................................................3.96 45.02 76 Liberia ................................................................................................................3.95 44.72 77 Namibia ............................................................................................................3.94 44.49 78 Brazil ...................................................................................................................3.94 44.48 79 Morocco ...........................................................................................................3.94 44.48 80 Burkina Faso ..................................................................................................3.94 44.44 81 Kyrgyzstan ......................................................................................................3.94 44.27 82 Venezuela, Bolivarian Rep. ...................................................................3.93 44.23 83 Kuwait ...............................................................................................................3.91 43.55 84 Madagascar ...................................................................................................3.90 43.28 85 Latvia .................................................................................................................3.90 43.11 86 Burundi .............................................................................................................3.88 42.77 87 Panama .............................................................................................................3.88 42.75 88 Sri Lanka ...........................................................................................................3.88 42.70 89 Tunisia................................................................................................................3.87 42.45 90 Moldova, Rep. ..............................................................................................3.86 41.95 91 Italy ......................................................................................................................3.83 41.05 92 Chile ....................................................................................................................3.82 40.99 93 Mexico ..............................................................................................................3.82 40.92 94 Egypt ..................................................................................................................3.82 40.91 95 Colombia .........................................................................................................3.78 39.81 96 Turkey ................................................................................................................3.76 39.13 97 Congo, Dem. Rep. .....................................................................................3.74 38.68 98 Dominican Republic ................................................................................3.74 38.44 99 Zambia ..............................................................................................................3.70 37.38 100 Greece ...............................................................................................................3.67 36.48 101 Spain ..................................................................................................................3.66 36.11 102 Ethiopia ............................................................................................................3.63 35.35 103 Argentina ........................................................................................................3.62 35.12 104 Botswana ........................................................................................................3.60 34.61 105 Hungary ...........................................................................................................3.58 33.89 106 Cabo Verde ....................................................................................................3.58 33.86 107 Eswatini ............................................................................................................3.58 33.82 108 Brunei Darussalam ....................................................................................3.56 33.24 109 Bangladesh ....................................................................................................3.55 33.09 110 Zimbabwe ......................................................................................................3.53 32.29 111 Viet Nam ..........................................................................................................3.52 32.00 112 Uruguay ...........................................................................................................3.51 31.86 113 Ecuador ............................................................................................................3.48 30.84 114 Bosnia and Herzegovina .......................................................................3.47 30.75 115 Nepal ..................................................................................................................3.47 30.62 116 Peru .....................................................................................................................3.46 30.49 117 Iran, Islamic Rep. .........................................................................................3.46 30.25 118 Trinidad and Tobago ...............................................................................3.46 30.25 119 Paraguay ..........................................................................................................3.41 28.78 120 North Macedonia ......................................................................................3.40 28.62 121 Poland ...............................................................................................................3.40 28.49 122 Nicaragua ........................................................................................................3.39 28.24 123 Croatia ...............................................................................................................3.38 28.08 124 Romania ...........................................................................................................3.37 27.70 125 Mozambique ................................................................................................3.35 27.24 126 Malawi ...............................................................................................................3.35 27.07 127 Lesotho.............................................................................................................3.30 25.72 128 Algeria ...............................................................................................................3.30 25.65 129 El Salvador ...................................................................................................... 3.17 21.84 130 Bolivia, Plurinational St. .......................................................................... 3.15 21.42 131 Yemen ...............................................................................................................2.96 15.63 132 Angola...............................................................................................................2.42 0.00
SOURCE: World Economic Forum, Executive Opinion Survey 2017–2018 (http://reports.weforum.org)For some countries, the latest year for which data are available may differ from the year that appears at the top of the page. The cut-off year is 2008.
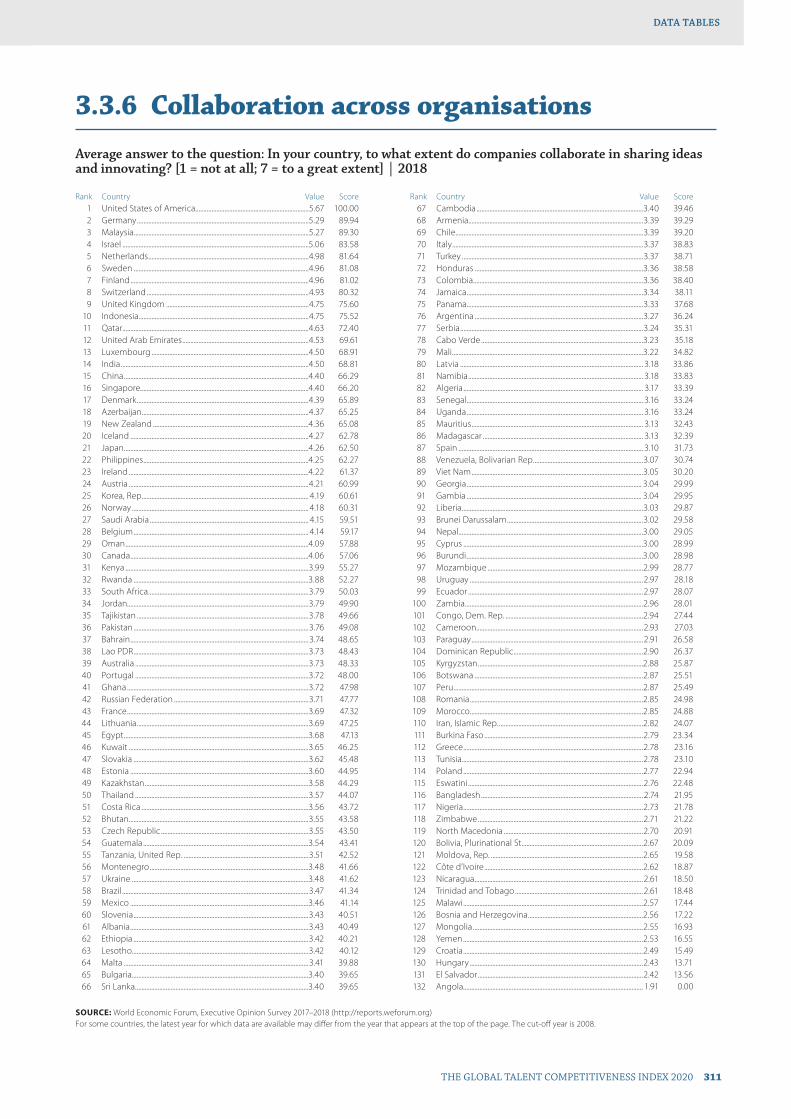
THE GLOBAL TALENT COMPETITIVENESS INDEX 2020 311
DATA TABLESDATA TABLES
3.3.6 Collaboration across organisations
Average answer to the question: In your country, to what extent do companies collaborate in sharing ideas and innovating? [1 = not at all; 7 = to a great extent] | 2018
Rank Country Value Score 1 United States of America......................................................................5.67 100.00 2 Germany ..........................................................................................................5.29 89.94 3 Malaysia ............................................................................................................5.27 89.30 4 Israel ...................................................................................................................5.06 83.58 5 Netherlands ...................................................................................................4.98 81.64 6 Sweden ............................................................................................................4.96 81.08 7 Finland ..............................................................................................................4.96 81.02 8 Switzerland ....................................................................................................4.93 80.32 9 United Kingdom ........................................................................................4.75 75.60 10 Indonesia.........................................................................................................4.75 75.52 11 Qatar ...................................................................................................................4.63 72.40 12 United Arab Emirates ..............................................................................4.53 69.61 13 Luxembourg .................................................................................................4.50 68.91 14 India ....................................................................................................................4.50 68.81 15 China ..................................................................................................................4.40 66.29 16 Singapore........................................................................................................4.40 66.20 17 Denmark ..........................................................................................................4.39 65.89 18 Azerbaijan .......................................................................................................4.37 65.25 19 New Zealand ................................................................................................4.36 65.08 20 Iceland ..............................................................................................................4.27 62.78 21 Japan ..................................................................................................................4.26 62.50 22 Philippines ......................................................................................................4.25 62.27 23 Ireland ...............................................................................................................4.22 61.37 24 Austria ...............................................................................................................4.21 60.99 25 Korea, Rep. ...................................................................................................... 4.19 60.61 26 Norway ............................................................................................................. 4.18 60.31 27 Saudi Arabia .................................................................................................. 4.15 59.51 28 Belgium ............................................................................................................ 4.14 59.17 29 Oman .................................................................................................................4.09 57.88 30 Canada ..............................................................................................................4.06 57.06 31 Kenya .................................................................................................................3.99 55.27 32 Rwanda ............................................................................................................3.88 52.27 33 South Africa ...................................................................................................3.79 50.03 34 Jordan................................................................................................................3.79 49.90 35 Tajikistan ..........................................................................................................3.78 49.66 36 Pakistan ............................................................................................................3.76 49.08 37 Bahrain ..............................................................................................................3.74 48.65 38 Lao PDR ............................................................................................................3.73 48.43 39 Australia ...........................................................................................................3.73 48.33 40 Portugal ...........................................................................................................3.72 48.00 41 Ghana ................................................................................................................3.72 47.98 42 Russian Federation ...................................................................................3.71 47.77 43 France ................................................................................................................3.69 47.32 44 Lithuania ..........................................................................................................3.69 47.25 45 Egypt ..................................................................................................................3.68 47.13 46 Kuwait ...............................................................................................................3.65 46.25 47 Slovakia ............................................................................................................3.62 45.48 48 Estonia ..............................................................................................................3.60 44.95 49 Kazakhstan .....................................................................................................3.58 44.29 50 Thailand ...........................................................................................................3.57 44.07 51 Costa Rica .......................................................................................................3.56 43.72 52 Bhutan...............................................................................................................3.55 43.58 53 Czech Republic ...........................................................................................3.55 43.50 54 Guatemala ......................................................................................................3.54 43.41 55 Tanzania, United Rep. .............................................................................3.51 42.52 56 Montenegro ..................................................................................................3.48 41.66 57 Ukraine .............................................................................................................3.48 41.62 58 Brazil ...................................................................................................................3.47 41.34 59 Mexico ..............................................................................................................3.46 41.14 60 Slovenia ............................................................................................................3.43 40.51 61 Albania ..............................................................................................................3.43 40.49 62 Ethiopia ............................................................................................................3.42 40.21 63 Lesotho.............................................................................................................3.42 40.12 64 Malta ..................................................................................................................3.41 39.88 65 Bulgaria.............................................................................................................3.40 39.65 66 Sri Lanka ...........................................................................................................3.40 39.65
Rank Country Value Score 67 Cambodia .......................................................................................................3.40 39.46 68 Armenia............................................................................................................3.39 39.29 69 Chile ....................................................................................................................3.39 39.20 70 Italy ......................................................................................................................3.37 38.83 71 Turkey ................................................................................................................3.37 38.71 72 Honduras ........................................................................................................3.36 38.58 73 Colombia .........................................................................................................3.36 38.40 74 Jamaica .............................................................................................................3.34 38.11 75 Panama .............................................................................................................3.33 37.68 76 Argentina ........................................................................................................3.27 36.24 77 Serbia .................................................................................................................3.24 35.31 78 Cabo Verde ....................................................................................................3.23 35.18 79 Mali ......................................................................................................................3.22 34.82 80 Latvia ................................................................................................................. 3.18 33.86 81 Namibia ............................................................................................................ 3.18 33.83 82 Algeria ............................................................................................................... 3.17 33.39 83 Senegal ............................................................................................................. 3.16 33.24 84 Uganda ............................................................................................................. 3.16 33.24 85 Mauritius .......................................................................................................... 3.13 32.43 86 Madagascar ................................................................................................... 3.13 32.39 87 Spain .................................................................................................................. 3.10 31.73 88 Venezuela, Bolivarian Rep. ...................................................................3.07 30.74 89 Viet Nam ..........................................................................................................3.05 30.20 90 Georgia ............................................................................................................ 3.04 29.99 91 Gambia ............................................................................................................ 3.04 29.95 92 Liberia ................................................................................................................3.03 29.87 93 Brunei Darussalam ....................................................................................3.02 29.58 94 Nepal ..................................................................................................................3.00 29.05 95 Cyprus ...............................................................................................................3.00 28.99 96 Burundi .............................................................................................................3.00 28.98 97 Mozambique ................................................................................................2.99 28.77 98 Uruguay ...........................................................................................................2.97 28.18 99 Ecuador ............................................................................................................2.97 28.07 100 Zambia ..............................................................................................................2.96 28.01 101 Congo, Dem. Rep. .....................................................................................2.94 27.44 102 Cameroon .......................................................................................................2.93 27.03 103 Paraguay ..........................................................................................................2.91 26.58 104 Dominican Republic ................................................................................2.90 26.37 105 Kyrgyzstan ......................................................................................................2.88 25.87 106 Botswana ........................................................................................................2.87 25.51 107 Peru .....................................................................................................................2.87 25.49 108 Romania ...........................................................................................................2.85 24.98 109 Morocco ...........................................................................................................2.85 24.88 110 Iran, Islamic Rep. .........................................................................................2.82 24.07 111 Burkina Faso ..................................................................................................2.79 23.34 112 Greece ...............................................................................................................2.78 23.16 113 Tunisia................................................................................................................2.78 23.10 114 Poland ...............................................................................................................2.77 22.94 115 Eswatini ............................................................................................................2.76 22.48 116 Bangladesh ....................................................................................................2.74 21.95 117 Nigeria ...............................................................................................................2.73 21.78 118 Zimbabwe ......................................................................................................2.71 21.22 119 North Macedonia ......................................................................................2.70 20.91 120 Bolivia, Plurinational St. ..........................................................................2.67 20.09 121 Moldova, Rep. ..............................................................................................2.65 19.58 122 Côte d’Ivoire ..................................................................................................2.62 18.87 123 Nicaragua ........................................................................................................2.61 18.50 124 Trinidad and Tobago ...............................................................................2.61 18.48 125 Malawi ...............................................................................................................2.57 17.44 126 Bosnia and Herzegovina .......................................................................2.56 17.22 127 Mongolia .........................................................................................................2.55 16.93 128 Yemen ...............................................................................................................2.53 16.55 129 Croatia ...............................................................................................................2.49 15.49 130 Hungary ...........................................................................................................2.43 13.71 131 El Salvador ......................................................................................................2.42 13.56 132 Angola............................................................................................................... 1.91 0.00
SOURCE: World Economic Forum, Executive Opinion Survey 2017–2018 (http://reports.weforum.org)For some countries, the latest year for which data are available may differ from the year that appears at the top of the page. The cut-off year is 2008.

DATA TABLES

THE GLOBAL TALENT COMPETITIVENESS INDEX 2020 313
DATA TABLES
Pillar 4Retain

314 THE GLOBAL TALENT COMPETITIVENESS INDEX 2020
DATA TABLESDATA TABLES
4.1.1 Pension system
Workforce contributing to pension system (%) | 2015
Rank Country Value Score 1 Ireland .........................................................................................................100.00 100.00 1 Israel .............................................................................................................100.00 100.00 1 Japan ............................................................................................................100.00 100.00 1 Kazakhstan ...............................................................................................100.00 100.00 1 Luxembourg ...........................................................................................100.00 100.00 1 United States of America................................................................100.00 100.00 7 Denmark .......................................................................................................96.60 96.60 8 Malta ...............................................................................................................94.65 94.65 9 Norway ..........................................................................................................94.09 94.09 10 Italy ...................................................................................................................93.37 93.37 11 Latvia ..............................................................................................................92.59 92.59 12 Czech Republic ........................................................................................92.00 92.00 13 Belgium ......................................................................................................... 91.99 91.99 14 Netherlands ................................................................................................ 91.40 91.40 15 Australia ........................................................................................................88.80 88.80 16 Austria ............................................................................................................88.56 88.56 17 France .............................................................................................................88.56 88.56 18 Poland ............................................................................................................88.00 88.00 19 Hungary .........................................................................................................87.52 87.52 20 Greece ............................................................................................................86.60 86.60 21 Germany .......................................................................................................86.02 86.02 22 Bulgaria..........................................................................................................84.97 84.97 23 Finland ...........................................................................................................84.89 84.89 24 Slovakia .........................................................................................................84.39 84.39 25 Slovenia .........................................................................................................83.27 83.27 26 Estonia ...........................................................................................................82.30 82.30 27 North Macedonia ...................................................................................80.00 80.00 28 Sweden .........................................................................................................79.30 79.30 29 Korea, Rep. ................................................................................................... 77.80 77.80 30 Croatia ............................................................................................................ 77.00 77.00 31 Lithuania .......................................................................................................76.00 76.00 32 Spain ............................................................................................................... 74.98 74.98 33 Mongolia ...................................................................................................... 74.50 74.50 33 Portugal ........................................................................................................ 74.50 74.50 35 Costa Rica .................................................................................................... 71.92 71.92 36 Canada ........................................................................................................... 71.07 71.07 37 Uruguay ........................................................................................................70.80 70.80 38 Moldova, Rep. ............................................................................................70.10 70.10 39 China ...............................................................................................................69.80 69.80 40 Trinidad and Tobago ............................................................................68.80 68.80 41 Cyprus ............................................................................................................ 67.36 67.36 42 Russian Federation ................................................................................65.90 65.90 43 Romania ........................................................................................................64.57 64.57 44 Singapore......................................................................................................61.67 61.67 45 Serbia ...............................................................................................................61.10 61.10 46 Tunisia............................................................................................................. 61.00 61.00 47 Mauritius .......................................................................................................60.90 60.90 48 Chile .................................................................................................................60.00 60.00 49 Egypt ...............................................................................................................53.60 53.60 50 Brazil ................................................................................................................52.48 52.48 51 Turkey ..............................................................................................................52.12 52.12 52 Kyrgyzstan ................................................................................................... 51.94 51.94 53 Jordan............................................................................................................. 51.50 51.50 54 Argentina .....................................................................................................50.20 50.20 55 Saudi Arabia ............................................................................................... 50.10 50.10 56 Panama ..........................................................................................................48.73 48.73 57 Ukraine .......................................................................................................... 47.06 47.06 58 Bosnia and Herzegovina ....................................................................44.60 44.60 59 Malaysia .........................................................................................................43.20 43.20 60 Ecuador .........................................................................................................42.05 42.05 61 Algeria .............................................................................................................41.03 41.03 62 Iran, Islamic Rep. ......................................................................................39.30 39.30 63 Armenia.........................................................................................................36.92 36.92 64 Venezuela, Bolivarian Rep. ................................................................33.90 33.90 65 Sri Lanka .........................................................................................................32.10 32.10 66 Dominican Republic .............................................................................32.06 32.06
Rank Country Value Score 67 Thailand ........................................................................................................ 31.90 31.90 68 Philippines ...................................................................................................30.86 30.86 69 Colombia ......................................................................................................30.83 30.83 70 Morocco ........................................................................................................30.20 30.20 71 Georgia ..........................................................................................................29.50 29.50 72 El Salvador ................................................................................................... 29.31 29.31 73 Tajikistan .......................................................................................................28.56 28.56 74 Mexico ............................................................................................................27.55 27.55 75 Eswatini .........................................................................................................25.50 25.50 76 Cabo Verde .................................................................................................24.39 24.39 77 Peru ..................................................................................................................24.28 24.28 78 Viet Nam .......................................................................................................23.50 23.50 79 Nicaragua ..................................................................................................... 21.02 21.02 80 Guatemala ................................................................................................... 19.70 19.70 81 Paraguay .......................................................................................................18.90 18.90 82 Kuwait ............................................................................................................18.40 18.40 83 Zimbabwe ...................................................................................................18.30 18.30 84 Honduras ......................................................................................................17.30 17.30 85 Bolivia, Plurinational St. .......................................................................16.66 16.66 86 Kenya ..............................................................................................................16.30 16.30 87 Botswana ..................................................................................................... 15.50 15.50 88 Congo, Dem. Rep. ..................................................................................14.00 14.00 89 India ................................................................................................................. 13.70 13.70 89 Oman .............................................................................................................. 13.70 13.70 91 Nigeria ............................................................................................................12.86 12.86 92 Gambia .......................................................................................................... 12.49 12.49 93 Zambia ...........................................................................................................12.20 12.20 94 Bhutan.............................................................................................................12.10 12.10 95 Indonesia......................................................................................................10.50 10.50 96 Ghana ................................................................................................................9.00 9.00 97 Côte d’Ivoire ................................................................................................. 8.80 8.80 98 Cameroon .......................................................................................................8.74 8.74 99 Namibia ............................................................................................................8.20 8.20 100 South Africa ...................................................................................................6.30 6.30 101 Madagascar ...................................................................................................6.20 6.20 102 Pakistan ............................................................................................................5.98 5.98 103 Mozambique ................................................................................................5.80 5.80 104 Yemen ...............................................................................................................5.20 5.20 105 Burundi ............................................................................................................. 5.18 5.18 106 Malawi ...............................................................................................................4.33 4.33 107 Rwanda ............................................................................................................4.30 4.30 107 Tanzania, United Rep. .............................................................................4.30 4.30 109 Qatar ...................................................................................................................3.90 3.90 110 Lesotho.............................................................................................................3.80 3.80 111 Mali ......................................................................................................................3.32 3.32 112 Nepal ..................................................................................................................2.80 2.80 113 Senegal .............................................................................................................2.76 2.76 114 Burkina Faso ..................................................................................................2.26 2.26 115 Lao PDR ............................................................................................................1.60 1.60 116 Angola...............................................................................................................1.25 1.25 117 Bangladesh ....................................................................................................0.85 0.85 118 Liberia ................................................................................................................0.26 0.26 119 Cambodia .......................................................................................................0.00 0.00 Albania ............................................................................................................... n/a n/a Azerbaijan ........................................................................................................ n/a n/a Bahrain ............................................................................................................... n/a n/a Brunei Darussalam ..................................................................................... n/a n/a Ethiopia ............................................................................................................. n/a n/a Iceland ............................................................................................................... n/a n/a Jamaica .............................................................................................................. n/a n/a Montenegro ................................................................................................... n/a n/a New Zealand ................................................................................................. n/a n/a Switzerland ..................................................................................................... n/a n/a Uganda .............................................................................................................. n/a n/a United Arab Emirates ............................................................................... n/a n/a United Kingdom ......................................................................................... n/a n/a
SOURCE: International Labour Organization, World Social Protection Report 2017–19 (https://www.social-protection.org)For some countries, the latest year for which data are available may differ from the year that appears at the top of the page. The cut-off year is 2008.

THE GLOBAL TALENT COMPETITIVENESS INDEX 2020 315
DATA TABLESDATA TABLES
4.1.2 Social protection
Average answer to the question: In your country, to what extent does a formal social safety net provide protection to the general population from economic insecurity in the event of job loss or disability? [1 = not at all; 7 = provides full protection] | 2018
Rank Country Value Score 1 Norway .............................................................................................................6.20 100.00 2 Denmark .......................................................................................................... 6.17 99.20 3 Luxembourg ................................................................................................. 6.17 99.11 4 Austria ............................................................................................................... 6.16 99.05 5 Belgium ............................................................................................................ 6.15 98.78 6 France ................................................................................................................ 6.14 98.51 7 Finland .............................................................................................................. 6.12 98.11 8 Switzerland ....................................................................................................6.01 95.40 9 Netherlands ...................................................................................................5.80 90.50 10 Iceland ..............................................................................................................5.71 88.25 11 United States of America......................................................................5.70 88.02 12 Australia ...........................................................................................................5.66 87.17 13 Canada ..............................................................................................................5.61 85.80 14 Sweden ............................................................................................................5.59 85.34 15 Spain ..................................................................................................................5.56 84.78 16 Oman .................................................................................................................5.55 84.46 17 New Zealand ................................................................................................5.54 84.19 18 Japan ..................................................................................................................5.35 79.77 19 Germany ..........................................................................................................5.24 76.98 20 Uruguay ........................................................................................................... 5.16 75.21 21 Malaysia ............................................................................................................ 5.15 74.93 22 United Kingdom ........................................................................................ 5.12 74.19 23 Ireland ...............................................................................................................5.09 73.64 24 Malta ..................................................................................................................5.01 71.61 25 Qatar ...................................................................................................................5.00 71.38 26 Czech Republic ...........................................................................................4.96 70.38 27 Slovenia ............................................................................................................4.93 69.63 28 Costa Rica .......................................................................................................4.92 69.36 29 Saudi Arabia ..................................................................................................4.90 68.94 30 Bahrain ..............................................................................................................4.87 68.21 31 Kuwait ...............................................................................................................4.78 66.17 32 Portugal ...........................................................................................................4.78 66.06 33 Romania ...........................................................................................................4.75 65.38 34 United Arab Emirates ..............................................................................4.63 62.57 35 Rwanda ............................................................................................................4.59 61.55 36 Israel ...................................................................................................................4.55 60.72 37 Singapore........................................................................................................4.52 59.91 38 Azerbaijan .......................................................................................................4.52 59.90 39 China ..................................................................................................................4.49 59.37 40 Indonesia.........................................................................................................4.36 56.11 41 Turkey ................................................................................................................4.35 56.03 42 India ....................................................................................................................4.29 54.42 43 Korea, Rep. ......................................................................................................4.27 54.00 44 Cyprus ...............................................................................................................4.22 52.93 45 Estonia ..............................................................................................................4.20 52.28 46 Italy ...................................................................................................................... 4.17 51.53 47 Mauritius .......................................................................................................... 4.15 51.14 48 Brunei Darussalam .................................................................................... 4.13 50.80 49 Bhutan...............................................................................................................4.09 49.74 50 Chile ....................................................................................................................4.05 48.71 51 Slovakia ........................................................................................................... 4.04 48.48 52 Jordan................................................................................................................4.02 48.16 53 Namibia ............................................................................................................3.98 47.21 54 Thailand ...........................................................................................................3.98 47.02 55 Ecuador ............................................................................................................3.96 46.66 56 Panama .............................................................................................................3.95 46.48 57 Tajikistan ..........................................................................................................3.95 46.33 58 Latvia .................................................................................................................3.94 46.20 59 Gambia .............................................................................................................3.94 46.17 60 Botswana ........................................................................................................3.93 45.93 61 Argentina ........................................................................................................3.91 45.54 62 Trinidad and Tobago ...............................................................................3.88 44.70 63 Tanzania, United Rep. .............................................................................3.88 44.69 64 Iran, Islamic Rep. .........................................................................................3.86 44.31 65 Ghana ................................................................................................................3.82 43.23 66 Viet Nam ..........................................................................................................3.82 43.22
Rank Country Value Score 67 Colombia .........................................................................................................3.80 42.74 68 Egypt ..................................................................................................................3.77 42.06 69 Kenya .................................................................................................................3.75 41.55 70 Kazakhstan .....................................................................................................3.73 41.09 71 Algeria ...............................................................................................................3.72 40.86 72 Philippines ......................................................................................................3.71 40.76 73 Montenegro ..................................................................................................3.69 40.24 74 Cabo Verde ....................................................................................................3.66 39.51 75 Pakistan ........................................................................................................... 3.64 39.12 76 Mali ......................................................................................................................3.63 38.69 77 Sri Lanka ...........................................................................................................3.60 38.06 78 Mexico ..............................................................................................................3.59 37.82 79 Brazil ...................................................................................................................3.57 37.42 80 Ukraine .............................................................................................................3.56 37.24 81 South Africa ...................................................................................................3.50 35.69 82 Ethiopia ............................................................................................................3.46 34.79 83 Bolivia, Plurinational St. ......................................................................... 3.44 34.33 84 Tunisia................................................................................................................3.42 33.76 85 Albania ..............................................................................................................3.40 33.21 86 Lesotho.............................................................................................................3.39 33.19 87 Russian Federation ...................................................................................3.39 33.15 88 Bulgaria.............................................................................................................3.38 32.80 89 Dominican Republic ................................................................................3.34 31.96 90 Nicaragua ........................................................................................................3.34 31.96 91 Mongolia .........................................................................................................3.33 31.77 92 Armenia............................................................................................................3.33 31.72 93 Zambia ..............................................................................................................3.31 31.21 94 Lao PDR ............................................................................................................3.30 30.98 95 Kyrgyzstan ......................................................................................................3.29 30.72 96 Serbia .................................................................................................................3.28 30.47 97 Honduras ........................................................................................................3.28 30.36 98 Lithuania ..........................................................................................................3.26 29.94 99 Eswatini ............................................................................................................3.24 29.51 100 Liberia ................................................................................................................3.23 29.39 101 Croatia ...............................................................................................................3.23 29.21 102 Guatemala ......................................................................................................3.22 29.15 103 Peru .....................................................................................................................3.20 28.64 104 Jamaica ............................................................................................................. 3.19 28.30 105 Senegal ............................................................................................................. 3.15 27.29 106 Burkina Faso .................................................................................................. 3.12 26.57 107 Morocco ............................................................................................................3.11 26.38 108 Greece ...............................................................................................................3.09 25.97 109 Paraguay ..........................................................................................................3.05 25.03 110 Mozambique ................................................................................................3.02 24.17 111 Côte d’Ivoire ..................................................................................................2.98 23.41 112 Cameroon .......................................................................................................2.98 23.31 113 Hungary ...........................................................................................................2.95 22.61 114 Uganda .............................................................................................................2.92 21.83 115 Cambodia .......................................................................................................2.91 21.71 116 Malawi ...............................................................................................................2.89 21.21 117 Poland ...............................................................................................................2.87 20.63 118 Moldova, Rep. ............................................................................................. 2.84 20.02 119 North Macedonia ......................................................................................2.78 18.48 120 Nepal ..................................................................................................................2.77 18.29 121 Georgia .............................................................................................................2.75 17.82 122 El Salvador ......................................................................................................2.69 16.37 123 Congo, Dem. Rep. .....................................................................................2.69 16.34 124 Burundi .............................................................................................................2.62 14.81 125 Madagascar ...................................................................................................2.56 13.24 126 Bangladesh ....................................................................................................2.53 12.67 127 Bosnia and Herzegovina .......................................................................2.50 11.87 128 Zimbabwe ......................................................................................................2.37 8.77 129 Angola...............................................................................................................2.28 6.60 130 Venezuela, Bolivarian Rep. ...................................................................2.27 6.51 131 Nigeria ...............................................................................................................2.07 1.76 132 Yemen ...............................................................................................................2.00 0.00
SOURCE: World Economic Forum, Executive Opinion Survey 2017–2018 (http://reports.weforum.org)For some countries, the latest year for which data are available may differ from the year that appears at the top of the page. The cut-off year is 2008.
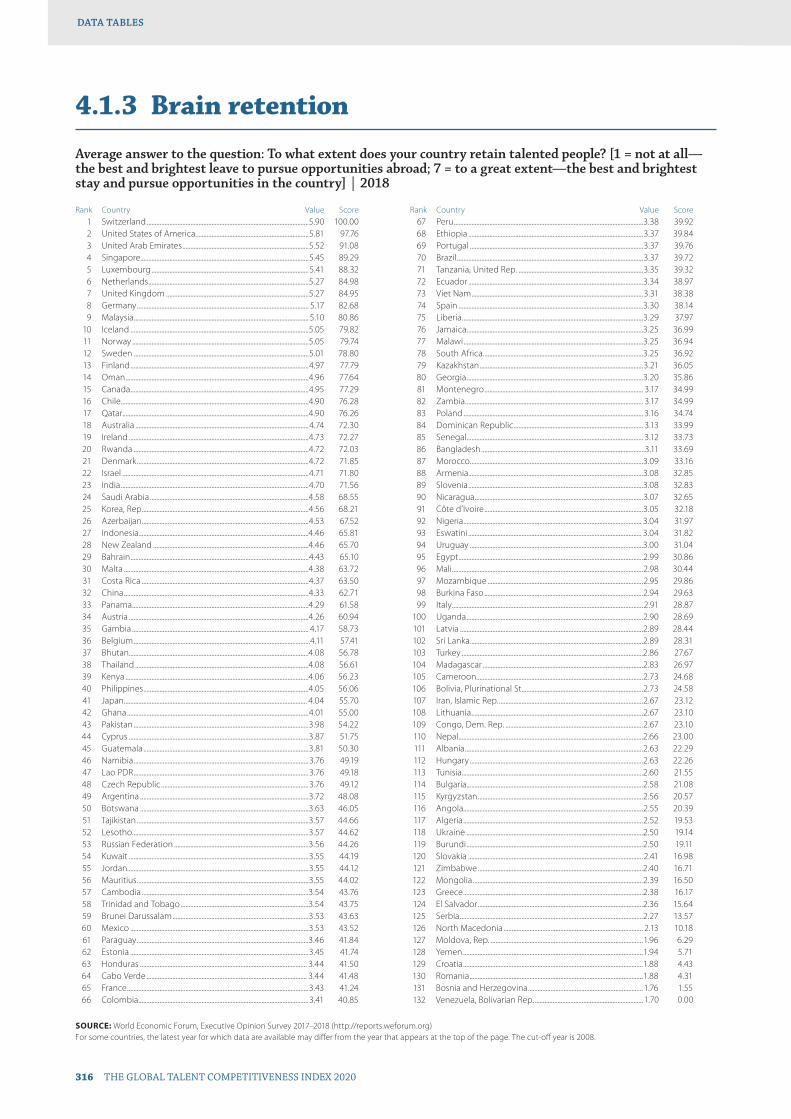
316 THE GLOBAL TALENT COMPETITIVENESS INDEX 2020
DATA TABLESDATA TABLES
4.1.3 Brain retention
Average answer to the question: To what extent does your country retain talented people? [1 = not at all—the best and brightest leave to pursue opportunities abroad; 7 = to a great extent—the best and brightest stay and pursue opportunities in the country] | 2018
Rank Country Value Score 1 Switzerland ....................................................................................................5.90 100.00 2 United States of America......................................................................5.81 97.76 3 United Arab Emirates ..............................................................................5.52 91.08 4 Singapore........................................................................................................5.45 89.29 5 Luxembourg .................................................................................................5.41 88.32 6 Netherlands ...................................................................................................5.27 84.98 7 United Kingdom ........................................................................................5.27 84.95 8 Germany .......................................................................................................... 5.17 82.68 9 Malaysia ............................................................................................................ 5.10 80.86 10 Iceland ..............................................................................................................5.05 79.82 11 Norway .............................................................................................................5.05 79.74 12 Sweden ............................................................................................................5.01 78.80 13 Finland ..............................................................................................................4.97 77.79 14 Oman .................................................................................................................4.96 77.64 15 Canada ..............................................................................................................4.95 77.29 16 Chile ....................................................................................................................4.90 76.28 17 Qatar ...................................................................................................................4.90 76.26 18 Australia ...........................................................................................................4.74 72.30 19 Ireland ...............................................................................................................4.73 72.27 20 Rwanda ............................................................................................................4.72 72.03 21 Denmark ..........................................................................................................4.72 71.85 22 Israel ...................................................................................................................4.71 71.80 23 India ....................................................................................................................4.70 71.56 24 Saudi Arabia ..................................................................................................4.58 68.55 25 Korea, Rep. ......................................................................................................4.56 68.21 26 Azerbaijan .......................................................................................................4.53 67.52 27 Indonesia.........................................................................................................4.46 65.81 28 New Zealand ................................................................................................4.46 65.70 29 Bahrain ..............................................................................................................4.43 65.10 30 Malta ..................................................................................................................4.38 63.72 31 Costa Rica .......................................................................................................4.37 63.50 32 China ..................................................................................................................4.33 62.71 33 Panama .............................................................................................................4.29 61.58 34 Austria ...............................................................................................................4.26 60.94 35 Gambia ............................................................................................................. 4.17 58.73 36 Belgium .............................................................................................................4.11 57.41 37 Bhutan...............................................................................................................4.08 56.78 38 Thailand ...........................................................................................................4.08 56.61 39 Kenya .................................................................................................................4.06 56.23 40 Philippines ......................................................................................................4.05 56.06 41 Japan ................................................................................................................. 4.04 55.70 42 Ghana ................................................................................................................4.01 55.00 43 Pakistan ............................................................................................................3.98 54.22 44 Cyprus ...............................................................................................................3.87 51.75 45 Guatemala ......................................................................................................3.81 50.30 46 Namibia ............................................................................................................3.76 49.19 47 Lao PDR ............................................................................................................3.76 49.18 48 Czech Republic ...........................................................................................3.76 49.12 49 Argentina ........................................................................................................3.72 48.08 50 Botswana ........................................................................................................3.63 46.05 51 Tajikistan ..........................................................................................................3.57 44.66 52 Lesotho.............................................................................................................3.57 44.62 53 Russian Federation ...................................................................................3.56 44.26 54 Kuwait ...............................................................................................................3.55 44.19 55 Jordan................................................................................................................3.55 44.12 56 Mauritius ..........................................................................................................3.55 44.02 57 Cambodia .......................................................................................................3.54 43.76 58 Trinidad and Tobago ...............................................................................3.54 43.75 59 Brunei Darussalam ....................................................................................3.53 43.63 60 Mexico ..............................................................................................................3.53 43.52 61 Paraguay ..........................................................................................................3.46 41.84 62 Estonia ..............................................................................................................3.45 41.74 63 Honduras ....................................................................................................... 3.44 41.50 64 Cabo Verde ................................................................................................... 3.44 41.48 65 France ................................................................................................................3.43 41.24 66 Colombia .........................................................................................................3.41 40.85
Rank Country Value Score 67 Peru .....................................................................................................................3.38 39.92 68 Ethiopia ............................................................................................................3.37 39.84 69 Portugal ...........................................................................................................3.37 39.76 70 Brazil ...................................................................................................................3.37 39.72 71 Tanzania, United Rep. .............................................................................3.35 39.32 72 Ecuador ............................................................................................................3.34 38.97 73 Viet Nam ..........................................................................................................3.31 38.38 74 Spain ..................................................................................................................3.30 38.14 75 Liberia ................................................................................................................3.29 37.97 76 Jamaica .............................................................................................................3.25 36.99 77 Malawi ...............................................................................................................3.25 36.94 78 South Africa ...................................................................................................3.25 36.92 79 Kazakhstan .....................................................................................................3.21 36.05 80 Georgia .............................................................................................................3.20 35.86 81 Montenegro .................................................................................................. 3.17 34.99 82 Zambia .............................................................................................................. 3.17 34.99 83 Poland ............................................................................................................... 3.16 34.74 84 Dominican Republic ................................................................................ 3.13 33.99 85 Senegal ............................................................................................................. 3.12 33.73 86 Bangladesh .....................................................................................................3.11 33.69 87 Morocco ...........................................................................................................3.09 33.16 88 Armenia............................................................................................................3.08 32.85 89 Slovenia ............................................................................................................3.08 32.83 90 Nicaragua ........................................................................................................3.07 32.65 91 Côte d’Ivoire ..................................................................................................3.05 32.18 92 Nigeria .............................................................................................................. 3.04 31.97 93 Eswatini ........................................................................................................... 3.04 31.82 94 Uruguay ...........................................................................................................3.00 31.04 95 Egypt ..................................................................................................................2.99 30.86 96 Mali ......................................................................................................................2.98 30.44 97 Mozambique ................................................................................................2.95 29.86 98 Burkina Faso ..................................................................................................2.94 29.63 99 Italy ......................................................................................................................2.91 28.87 100 Uganda .............................................................................................................2.90 28.69 101 Latvia .................................................................................................................2.89 28.44 102 Sri Lanka ...........................................................................................................2.89 28.31 103 Turkey ................................................................................................................2.86 27.67 104 Madagascar ...................................................................................................2.83 26.97 105 Cameroon .......................................................................................................2.73 24.68 106 Bolivia, Plurinational St. ..........................................................................2.73 24.58 107 Iran, Islamic Rep. .........................................................................................2.67 23.12 108 Lithuania ..........................................................................................................2.67 23.10 109 Congo, Dem. Rep. .....................................................................................2.67 23.10 110 Nepal ..................................................................................................................2.66 23.00 111 Albania ..............................................................................................................2.63 22.29 112 Hungary ...........................................................................................................2.63 22.26 113 Tunisia................................................................................................................2.60 21.55 114 Bulgaria.............................................................................................................2.58 21.08 115 Kyrgyzstan ......................................................................................................2.56 20.57 116 Angola...............................................................................................................2.55 20.39 117 Algeria ...............................................................................................................2.52 19.53 118 Ukraine .............................................................................................................2.50 19.14 119 Burundi .............................................................................................................2.50 19.11 120 Slovakia ............................................................................................................2.41 16.98 121 Zimbabwe ......................................................................................................2.40 16.71 122 Mongolia .........................................................................................................2.39 16.50 123 Greece ...............................................................................................................2.38 16.17 124 El Salvador ......................................................................................................2.36 15.64 125 Serbia .................................................................................................................2.27 13.57 126 North Macedonia ...................................................................................... 2.13 10.18 127 Moldova, Rep. ..............................................................................................1.96 6.29 128 Yemen ...............................................................................................................1.94 5.71 129 Croatia ...............................................................................................................1.88 4.43 130 Romania ...........................................................................................................1.88 4.31 131 Bosnia and Herzegovina ....................................................................... 1.76 1.55 132 Venezuela, Bolivarian Rep. ...................................................................1.70 0.00
SOURCE: World Economic Forum, Executive Opinion Survey 2017–2018 (http://reports.weforum.org)For some countries, the latest year for which data are available may differ from the year that appears at the top of the page. The cut-off year is 2008.

THE GLOBAL TALENT COMPETITIVENESS INDEX 2020 317
DATA TABLESDATA TABLES
4.2.1 Environmental performance
Environmental Performance Index | 2018
Rank Country Value Score 1 Switzerland ..................................................................................................87.42 100.00 2 France .............................................................................................................83.95 94.22 3 Denmark ....................................................................................................... 81.60 90.30 4 Malta ...............................................................................................................80.90 89.13 5 Sweden .........................................................................................................80.51 88.48 6 United Kingdom .....................................................................................79.89 87.45 7 Luxembourg ...............................................................................................79.12 86.16 8 Austria ............................................................................................................78.97 85.91 9 Ireland ............................................................................................................78.77 85.58 10 Finland ...........................................................................................................78.64 85.36 11 Iceland ...........................................................................................................78.57 85.25 12 Spain ...............................................................................................................78.39 84.95 13 Germany .......................................................................................................78.37 84.91 14 Norway .......................................................................................................... 77.49 83.45 15 Belgium ......................................................................................................... 77.38 83.26 16 Italy ...................................................................................................................76.96 82.56 17 New Zealand .............................................................................................75.96 80.90 18 Netherlands ................................................................................................75.46 80.06 19 Israel ................................................................................................................ 75.01 79.31 20 Japan ............................................................................................................... 74.69 78.78 21 Australia .........................................................................................................74.12 77.83 22 Greece ............................................................................................................73.60 76.96 23 Cyprus ............................................................................................................72.60 75.30 24 Canada ........................................................................................................... 72.18 74.60 25 Portugal .........................................................................................................71.91 74.15 26 United States of America....................................................................71.19 72.95 27 Slovakia .........................................................................................................70.60 71.96 28 Lithuania .......................................................................................................69.33 69.84 29 Bulgaria.......................................................................................................... 67.85 67.38 29 Costa Rica .................................................................................................... 67.85 67.38 31 Qatar ................................................................................................................ 67.80 67.29 32 Czech Republic ........................................................................................ 67.68 67.09 33 Slovenia ..........................................................................................................67.57 66.91 34 Trinidad and Tobago ............................................................................ 67.36 66.56 35 Latvia .............................................................................................................. 66.12 64.49 36 Albania ...........................................................................................................65.46 63.39 37 Croatia ............................................................................................................65.45 63.38 38 Colombia ......................................................................................................65.22 62.99 39 Hungary ........................................................................................................65.01 62.64 40 Romania ........................................................................................................64.78 62.26 41 Dominican Republic .............................................................................64.71 62.14 42 Uruguay ........................................................................................................64.65 62.04 43 Estonia ...........................................................................................................64.31 61.48 44 Singapore.....................................................................................................64.23 61.34 45 Poland .............................................................................................................64.11 61.14 46 Venezuela, Bolivarian Rep. ................................................................63.89 60.78 47 Russian Federation ................................................................................63.79 60.61 48 Brunei Darussalam .................................................................................63.57 60.24 49 Morocco ........................................................................................................63.47 60.08 50 Panama ..........................................................................................................62.71 58.81 51 Tunisia.............................................................................................................62.35 58.21 52 Azerbaijan ....................................................................................................62.33 58.18 53 Korea, Rep. ...................................................................................................62.30 58.13 54 Kuwait ............................................................................................................62.28 58.09 55 Jordan.............................................................................................................62.20 57.96 56 Armenia.........................................................................................................62.07 57.74 57 Peru ...................................................................................................................61.92 57.49 58 Montenegro ................................................................................................61.33 56.51 59 Egypt ................................................................................................................61.21 56.31 60 North Macedonia ................................................................................... 61.06 56.06 61 Brazil ................................................................................................................60.70 55.46 62 Sri Lanka ........................................................................................................60.61 55.31 63 Mexico ...........................................................................................................59.69 53.78 64 Argentina .....................................................................................................59.30 53.13 65 Malaysia .........................................................................................................59.22 52.99 66 United Arab Emirates ...........................................................................58.90 52.46
Rank Country Value Score 67 Jamaica ..........................................................................................................58.58 51.93 68 Namibia .........................................................................................................58.46 51.73 69 Iran, Islamic Rep. ...................................................................................... 58.16 51.23 70 Philippines ................................................................................................... 57.65 50.38 71 Mongolia .......................................................................................................57.51 50.14 72 Chile ..................................................................................................................57.49 50.11 72 Serbia ...............................................................................................................57.49 50.11 74 Saudi Arabia ................................................................................................57.47 50.08 75 Ecuador ..........................................................................................................57.42 49.99 76 Algeria .............................................................................................................57.18 49.59 77 Cabo Verde .................................................................................................56.94 49.19 78 Mauritius .......................................................................................................56.63 48.67 79 Bolivia, Plurinational St. .......................................................................55.98 47.59 80 Georgia ..........................................................................................................55.69 47.11 81 Bahrain ............................................................................................................55.15 46.21 82 Nicaragua .....................................................................................................55.04 46.02 83 Kyrgyzstan ...................................................................................................54.86 45.72 84 Nigeria ............................................................................................................54.76 45.56 85 Kazakhstan ..................................................................................................54.56 45.22 86 Paraguay ....................................................................................................... 53.93 44.17 87 El Salvador ................................................................................................... 53.91 44.14 88 Turkey .............................................................................................................52.96 42.56 89 Ukraine ..........................................................................................................52.87 42.41 90 Guatemala ...................................................................................................52.33 41.51 91 Moldova, Rep. ............................................................................................51.97 40.91 92 Botswana ......................................................................................................51.70 40.46 93 Honduras ......................................................................................................51.51 40.14 94 Oman .............................................................................................................. 51.32 39.82 95 Zambia ...........................................................................................................50.97 39.24 96 Tanzania, United Rep. ..........................................................................50.83 39.01 97 China ............................................................................................................... 50.74 38.86 98 Thailand ........................................................................................................49.88 37.42 99 Ghana .............................................................................................................49.66 37.06 100 Senegal ..........................................................................................................49.52 36.82 101 Malawi ............................................................................................................ 49.21 36.31 102 Tajikistan ........................................................................................................47.85 34.04 103 Kenya .............................................................................................................. 47.25 33.04 104 Bhutan............................................................................................................ 47.22 32.99 105 Viet Nam .......................................................................................................46.96 32.56 106 Indonesia......................................................................................................46.92 32.49 107 Mozambique .............................................................................................46.37 31.57 108 Côte d’Ivoire ...............................................................................................45.25 29.70 109 Ethiopia .........................................................................................................44.78 28.92 110 South Africa ................................................................................................44.73 28.84 111 Uganda ..........................................................................................................44.28 28.09 112 Mali ................................................................................................................... 43.71 27.14 113 Rwanda .........................................................................................................43.68 27.09 114 Zimbabwe ................................................................................................... 43.41 26.64 115 Cambodia ....................................................................................................43.23 26.34 116 Lao PDR .........................................................................................................42.94 25.85 117 Burkina Faso ...............................................................................................42.83 25.67 118 Gambia .......................................................................................................... 42.42 24.99 119 Bosnia and Herzegovina .................................................................... 41.84 24.02 120 Liberia ............................................................................................................. 41.62 23.65 121 Cameroon ....................................................................................................40.81 22.30 122 Eswatini .........................................................................................................40.32 21.49 123 Pakistan ..........................................................................................................37.50 16.79 124 Angola............................................................................................................ 37.44 16.69 125 Lesotho..........................................................................................................33.78 10.59 126 Madagascar ................................................................................................33.73 10.50 127 Nepal ............................................................................................................... 31.44 6.68 128 India .................................................................................................................30.57 5.23 129 Congo, Dem. Rep. .................................................................................. 30.41 4.97 130 Bangladesh .................................................................................................29.56 3.55 131 Burundi ...........................................................................................................27.43 0.00 Yemen ................................................................................................................ n/a n/a
SOURCE: Wendling, Z. A., Emerson, J. W., Esty, D. C., Levy, M. A., de Sherbinin, A., et al. (2018). 2018 Environmental Performance Index. New Haven, CT: Yale Center for Environmental Law & Policy. (https://epi.envirocenter.yale.edu/)
For some countries, the latest year for which data are available may differ from the year that appears at the top of the page. The cut-off year is 2008.
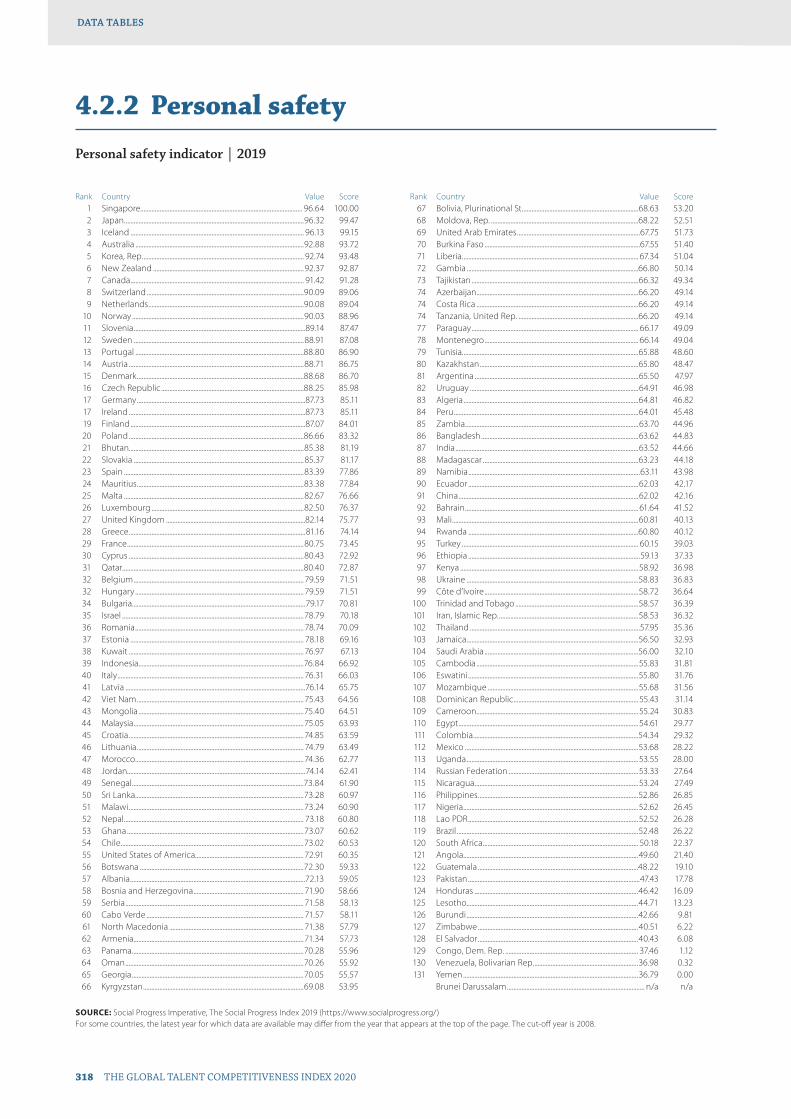
318 THE GLOBAL TALENT COMPETITIVENESS INDEX 2020
DATA TABLESDATA TABLES
4.2.2 Personal safety
Personal safety indicator | 2019
Rank Country Value Score 1 Singapore.................................................................................................... 96.64 100.00 2 Japan ...............................................................................................................96.32 99.47 3 Iceland ........................................................................................................... 96.13 99.15 4 Australia ........................................................................................................92.88 93.72 5 Korea, Rep. ................................................................................................... 92.74 93.48 6 New Zealand .............................................................................................92.37 92.87 7 Canada ........................................................................................................... 91.42 91.28 8 Switzerland .................................................................................................90.09 89.06 9 Netherlands ................................................................................................90.08 89.04 10 Norway ..........................................................................................................90.03 88.96 11 Slovenia ..........................................................................................................89.14 87.47 12 Sweden .........................................................................................................88.91 87.08 13 Portugal ........................................................................................................88.80 86.90 14 Austria ............................................................................................................88.71 86.75 15 Denmark .......................................................................................................88.68 86.70 16 Czech Republic ........................................................................................88.25 85.98 17 Germany ........................................................................................................87.73 85.11 17 Ireland .............................................................................................................87.73 85.11 19 Finland ............................................................................................................87.07 84.01 20 Poland ............................................................................................................86.66 83.32 21 Bhutan............................................................................................................85.38 81.19 22 Slovakia .........................................................................................................85.37 81.17 23 Spain ...............................................................................................................83.39 77.86 24 Mauritius .......................................................................................................83.38 77.84 25 Malta ...............................................................................................................82.67 76.66 26 Luxembourg ..............................................................................................82.50 76.37 27 United Kingdom ......................................................................................82.14 75.77 28 Greece .............................................................................................................81.16 74.14 29 France .............................................................................................................80.75 73.45 30 Cyprus ............................................................................................................80.43 72.92 31 Qatar ................................................................................................................80.40 72.87 32 Belgium ......................................................................................................... 79.59 71.51 32 Hungary ........................................................................................................ 79.59 71.51 34 Bulgaria...........................................................................................................79.17 70.81 35 Israel ................................................................................................................78.79 70.18 36 Romania ........................................................................................................ 78.74 70.09 37 Estonia ........................................................................................................... 78.18 69.16 38 Kuwait ............................................................................................................ 76.97 67.13 39 Indonesia......................................................................................................76.84 66.92 40 Italy ................................................................................................................... 76.31 66.03 41 Latvia ...............................................................................................................76.14 65.75 42 Viet Nam ....................................................................................................... 75.43 64.56 43 Mongolia ......................................................................................................75.40 64.51 44 Malaysia .........................................................................................................75.05 63.93 45 Croatia ............................................................................................................74.85 63.59 46 Lithuania ....................................................................................................... 74.79 63.49 47 Morocco ........................................................................................................74.36 62.77 48 Jordan..............................................................................................................74.14 62.41 49 Senegal ..........................................................................................................73.84 61.90 50 Sri Lanka ........................................................................................................73.28 60.97 51 Malawi ............................................................................................................73.24 60.90 52 Nepal ............................................................................................................... 73.18 60.80 53 Ghana .............................................................................................................73.07 60.62 54 Chile .................................................................................................................73.02 60.53 55 United States of America................................................................... 72.91 60.35 56 Botswana .....................................................................................................72.30 59.33 57 Albania ............................................................................................................72.13 59.05 58 Bosnia and Herzegovina .................................................................... 71.90 58.66 59 Serbia .............................................................................................................. 71.58 58.13 60 Cabo Verde ................................................................................................. 71.57 58.11 61 North Macedonia ................................................................................... 71.38 57.79 62 Armenia.........................................................................................................71.34 57.73 63 Panama ..........................................................................................................70.28 55.96 64 Oman ..............................................................................................................70.26 55.92 65 Georgia ..........................................................................................................70.05 55.57 66 Kyrgyzstan ...................................................................................................69.08 53.95
Rank Country Value Score 67 Bolivia, Plurinational St. .......................................................................68.63 53.20 68 Moldova, Rep. ...........................................................................................68.22 52.51 69 United Arab Emirates ............................................................................67.75 51.73 70 Burkina Faso ................................................................................................67.55 51.40 71 Liberia ............................................................................................................. 67.34 51.04 72 Gambia ..........................................................................................................66.80 50.14 73 Tajikistan .......................................................................................................66.32 49.34 74 Azerbaijan ....................................................................................................66.20 49.14 74 Costa Rica ....................................................................................................66.20 49.14 74 Tanzania, United Rep. ..........................................................................66.20 49.14 77 Paraguay ....................................................................................................... 66.17 49.09 78 Montenegro ............................................................................................... 66.14 49.04 79 Tunisia.............................................................................................................65.88 48.60 80 Kazakhstan ..................................................................................................65.80 48.47 81 Argentina .....................................................................................................65.50 47.97 82 Uruguay ........................................................................................................64.91 46.98 83 Algeria ............................................................................................................64.81 46.82 84 Peru ..................................................................................................................64.01 45.48 85 Zambia ...........................................................................................................63.70 44.96 86 Bangladesh .................................................................................................63.62 44.83 87 India .................................................................................................................63.52 44.66 88 Madagascar ................................................................................................63.23 44.18 89 Namibia ..........................................................................................................63.11 43.98 90 Ecuador .........................................................................................................62.03 42.17 91 China ...............................................................................................................62.02 42.16 92 Bahrain ........................................................................................................... 61.64 41.52 93 Mali ...................................................................................................................60.81 40.13 94 Rwanda .........................................................................................................60.80 40.12 95 Turkey ............................................................................................................. 60.15 39.03 96 Ethiopia ..........................................................................................................59.13 37.33 97 Kenya ..............................................................................................................58.92 36.98 98 Ukraine ..........................................................................................................58.83 36.83 99 Côte d’Ivoire ...............................................................................................58.72 36.64 100 Trinidad and Tobago ............................................................................58.57 36.39 101 Iran, Islamic Rep. ......................................................................................58.53 36.32 102 Thailand .........................................................................................................57.95 35.36 103 Jamaica ..........................................................................................................56.50 32.93 104 Saudi Arabia ...............................................................................................56.00 32.10 105 Cambodia ....................................................................................................55.83 31.81 106 Eswatini .........................................................................................................55.80 31.76 107 Mozambique .............................................................................................55.68 31.56 108 Dominican Republic ............................................................................. 55.43 31.14 109 Cameroon .................................................................................................... 55.24 30.83 110 Egypt ...............................................................................................................54.61 29.77 111 Colombia ......................................................................................................54.34 29.32 112 Mexico ...........................................................................................................53.68 28.22 113 Uganda ..........................................................................................................53.55 28.00 114 Russian Federation ................................................................................53.33 27.64 115 Nicaragua .....................................................................................................53.24 27.49 116 Philippines ...................................................................................................52.86 26.85 117 Nigeria ............................................................................................................52.62 26.45 118 Lao PDR .........................................................................................................52.52 26.28 119 Brazil ................................................................................................................52.48 26.22 120 South Africa ................................................................................................ 50.18 22.37 121 Angola............................................................................................................49.60 21.40 122 Guatemala ...................................................................................................48.22 19.10 123 Pakistan ..........................................................................................................47.43 17.78 124 Honduras .....................................................................................................46.42 16.09 125 Lesotho..........................................................................................................44.71 13.23 126 Burundi ..........................................................................................................42.66 9.81 127 Zimbabwe ...................................................................................................40.51 6.22 128 El Salvador ...................................................................................................40.43 6.08 129 Congo, Dem. Rep. .................................................................................. 37.46 1.12 130 Venezuela, Bolivarian Rep. ................................................................36.98 0.32 131 Yemen ............................................................................................................36.79 0.00 Brunei Darussalam ..................................................................................... n/a n/a
SOURCE: Social Progress Imperative, The Social Progress Index 2019 (https://www.socialprogress.org/)For some countries, the latest year for which data are available may differ from the year that appears at the top of the page. The cut-off year is 2008.

THE GLOBAL TALENT COMPETITIVENESS INDEX 2020 319
DATA TABLESDATA TABLES
4.2.3 Physician density
Physicians (per 1,000 people) | 2016
Rank Country Value Score 1 Greece .............................................................................................................. 6.25 100.00 2 Austria ...............................................................................................................5.23 83.56 3 Georgia .............................................................................................................4.78 76.28 4 Portugal ...........................................................................................................4.43 70.67 5 Norway .............................................................................................................4.38 70.01 6 Lithuania ..........................................................................................................4.38 69.92 7 Switzerland ....................................................................................................4.25 67.82 8 Germany .......................................................................................................... 4.19 66.90 9 Sweden ............................................................................................................ 4.19 66.85 10 Italy ......................................................................................................................4.02 64.18 11 Bulgaria.............................................................................................................4.00 63.82 12 Russian Federation ...................................................................................3.98 63.44 13 Malta ..................................................................................................................3.91 62.36 14 Argentina ........................................................................................................3.91 62.35 15 Spain ..................................................................................................................3.87 61.79 16 Iceland ..............................................................................................................3.79 60.49 17 Uruguay ...........................................................................................................3.74 59.61 18 Czech Republic ...........................................................................................3.68 58.66 19 Denmark ..........................................................................................................3.65 58.31 20 Israel ...................................................................................................................3.58 57.04 21 Australia ...........................................................................................................3.50 55.76 22 Netherlands ...................................................................................................3.48 55.47 23 Slovakia ............................................................................................................3.45 55.02 24 Estonia ..............................................................................................................3.43 54.70 25 Jordan................................................................................................................3.43 54.63 26 Azerbaijan .......................................................................................................3.40 54.25 27 Kazakhstan .....................................................................................................3.27 52.20 28 Mongolia .........................................................................................................3.26 52.00 29 France ................................................................................................................3.24 51.62 30 Latvia .................................................................................................................3.21 51.15 31 Moldova, Rep. ..............................................................................................3.20 50.98 32 Finland ..............................................................................................................3.20 50.95 33 Croatia ............................................................................................................... 3.13 49.82 34 Hungary ...........................................................................................................3.09 49.29 35 New Zealand ................................................................................................3.06 48.78 36 Belgium ............................................................................................................3.01 47.98 37 Ukraine .............................................................................................................3.00 47.80 38 Ireland ...............................................................................................................2.96 47.18 39 Luxembourg .................................................................................................2.92 46.54 40 North Macedonia ......................................................................................2.88 45.80 41 United Kingdom ........................................................................................2.83 45.00 42 Slovenia ............................................................................................................2.82 44.92 43 Armenia............................................................................................................2.80 44.64 44 Romania ...........................................................................................................2.67 42.50 45 Kuwait ...............................................................................................................2.61 41.52 46 Saudi Arabia ..................................................................................................2.57 40.88 46 United States of America......................................................................2.57 40.88 48 Canada ..............................................................................................................2.54 40.41 49 Cyprus ...............................................................................................................2.50 39.72 50 Serbia .................................................................................................................2.46 39.19 51 Japan ..................................................................................................................2.37 37.65 52 Montenegro ..................................................................................................2.34 37.27 53 Korea, Rep. ......................................................................................................2.33 36.99 54 Poland ...............................................................................................................2.29 36.42 55 Singapore........................................................................................................2.28 36.19 56 Mexico ..............................................................................................................2.23 35.47 57 Mauritius ..........................................................................................................2.00 31.82 58 Qatar ...................................................................................................................1.96 31.19 59 Oman .................................................................................................................1.92 30.40 60 Bosnia and Herzegovina .......................................................................1.89 29.94 61 Kyrgyzstan ......................................................................................................1.85 29.43 62 Brazil ...................................................................................................................1.85 29.39 63 Colombia .........................................................................................................1.82 28.90 63 Trinidad and Tobago ...............................................................................1.82 28.90 65 China ..................................................................................................................1.81 28.75 66 Turkey ................................................................................................................1.75 27.74
Rank Country Value Score 67 Brunei Darussalam ....................................................................................1.75 27.69 68 Tajikistan ..........................................................................................................1.71 27.18 69 Ecuador ............................................................................................................1.66 26.40 70 El Salvador ......................................................................................................1.60 25.29 71 Panama .............................................................................................................1.59 25.26 72 United Arab Emirates ..............................................................................1.56 24.68 73 Malaysia ............................................................................................................1.53 24.28 74 Dominican Republic ................................................................................1.49 23.65 75 Iran, Islamic Rep. .........................................................................................1.49 23.60 76 Tunisia................................................................................................................1.29 20.37 77 Albania ..............................................................................................................1.29 20.32 77 Paraguay ..........................................................................................................1.29 20.32 79 Algeria ...............................................................................................................1.21 19.05 80 Costa Rica ........................................................................................................1.15 18.14 81 Peru ......................................................................................................................1.12 17.59 82 Chile ....................................................................................................................1.03 16.26 83 Pakistan ............................................................................................................0.98 15.38 84 Bahrain ..............................................................................................................0.92 14.48 85 Nicaragua ........................................................................................................0.91 14.35 86 Guatemala ......................................................................................................0.90 14.08 87 Sri Lanka .......................................................................................................... 0.88 13.82 88 Viet Nam ..........................................................................................................0.82 12.86 89 South Africa ...................................................................................................0.82 12.81 90 Egypt ..................................................................................................................0.81 12.75 91 Cabo Verde ....................................................................................................0.79 12.33 92 India ....................................................................................................................0.76 11.85 93 Morocco ...........................................................................................................0.62 9.61 94 Nepal ..................................................................................................................0.60 9.28 95 Lao PDR ............................................................................................................0.49 7.57 96 Bolivia, Plurinational St. ..........................................................................0.47 7.28 97 Bangladesh ....................................................................................................0.47 7.26 97 Jamaica .............................................................................................................0.47 7.26 99 Thailand ...........................................................................................................0.47 7.23 100 Nigeria ...............................................................................................................0.40 6.03 101 Botswana ........................................................................................................0.38 5.85 102 Bhutan...............................................................................................................0.38 5.81 103 Namibia ............................................................................................................0.37 5.69 104 Yemen ...............................................................................................................0.31 4.68 105 Kenya .................................................................................................................0.20 2.97 106 Indonesia.........................................................................................................0.20 2.92 107 Eswatini ............................................................................................................ 0.15 2.05 108 Angola............................................................................................................... 0.14 2.00 108 Côte d’Ivoire .................................................................................................. 0.14 2.00 110 Cambodia ....................................................................................................... 0.14 1.99 110 Madagascar ................................................................................................... 0.14 1.99 112 Gambia ..............................................................................................................0.11 1.41 113 Ghana ................................................................................................................ 0.10 1.23 114 Uganda .............................................................................................................0.09 1.19 115 Congo, Dem. Rep. .....................................................................................0.09 1.15 115 Zambia ..............................................................................................................0.09 1.15 117 Mali ......................................................................................................................0.08 1.06 118 Cameroon .......................................................................................................0.08 1.03 119 Zimbabwe ......................................................................................................0.08 0.93 120 Senegal .............................................................................................................0.07 0.79 121 Rwanda ............................................................................................................0.06 0.72 122 Mozambique ................................................................................................0.06 0.58 123 Burkina Faso ..................................................................................................0.05 0.45 124 Liberia ................................................................................................................0.02 0.06 125 Ethiopia ............................................................................................................0.02 0.05 125 Tanzania, United Rep. .............................................................................0.02 0.05 127 Malawi ...............................................................................................................0.02 0.00 Burundi .............................................................................................................. n/a n/a Honduras ......................................................................................................... n/a n/a Lesotho.............................................................................................................. n/a n/a Philippines ....................................................................................................... n/a n/a Venezuela, Bolivarian Rep. .................................................................... n/a n/a
SOURCE: World Bank, World Development Indicators based on World Health Organization, Global Atlas of the Health Workforce; OECD; and country data (http://data.worldbank.org/data-catalog/world-development-indicators)
For some countries, the latest year for which data are available may differ from the year that appears at the top of the page. The cut-off year is 2008.
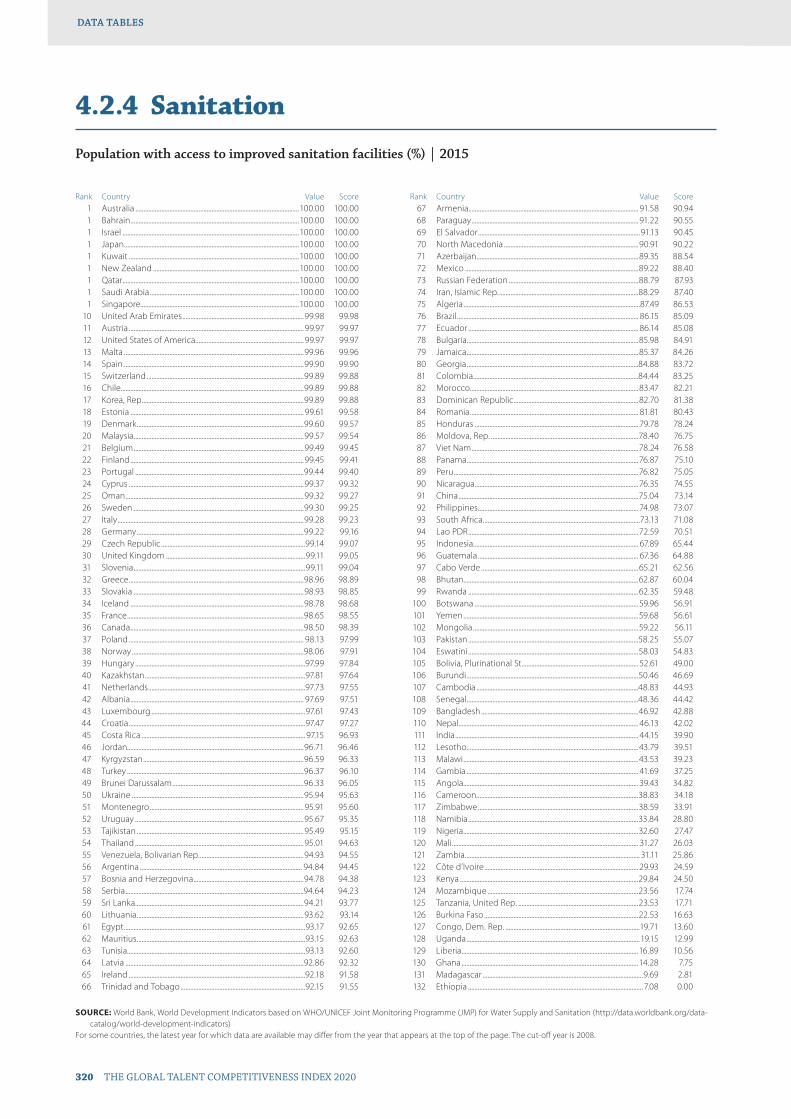
DATA TABLESDATA TABLES
320 THE GLOBAL TALENT COMPETITIVENESS INDEX 2020
DATA TABLESDATA TABLES
4.2.4 Sanitation
Population with access to improved sanitation facilities (%) | 2015
Rank Country Value Score 1 Australia .....................................................................................................100.00 100.00 1 Bahrain ........................................................................................................100.00 100.00 1 Israel .............................................................................................................100.00 100.00 1 Japan ............................................................................................................100.00 100.00 1 Kuwait .........................................................................................................100.00 100.00 1 New Zealand ..........................................................................................100.00 100.00 1 Qatar .............................................................................................................100.00 100.00 1 Saudi Arabia ............................................................................................100.00 100.00 1 Singapore..................................................................................................100.00 100.00 10 United Arab Emirates ...........................................................................99.98 99.98 11 Austria ............................................................................................................99.97 99.97 12 United States of America...................................................................99.97 99.97 13 Malta ...............................................................................................................99.96 99.96 14 Spain ...............................................................................................................99.90 99.90 15 Switzerland .................................................................................................99.89 99.88 16 Chile .................................................................................................................99.89 99.88 17 Korea, Rep. ...................................................................................................99.89 99.88 18 Estonia ........................................................................................................... 99.61 99.58 19 Denmark .......................................................................................................99.60 99.57 20 Malaysia .........................................................................................................99.57 99.54 21 Belgium .........................................................................................................99.49 99.45 22 Finland ...........................................................................................................99.45 99.41 23 Portugal ........................................................................................................99.44 99.40 24 Cyprus ............................................................................................................99.37 99.32 25 Oman ..............................................................................................................99.32 99.27 26 Sweden .........................................................................................................99.30 99.25 27 Italy ...................................................................................................................99.28 99.23 28 Germany .......................................................................................................99.22 99.16 29 Czech Republic .........................................................................................99.14 99.07 30 United Kingdom ......................................................................................99.11 99.05 31 Slovenia ..........................................................................................................99.11 99.04 32 Greece ............................................................................................................98.96 98.89 33 Slovakia .........................................................................................................98.93 98.85 34 Iceland ...........................................................................................................98.78 98.68 35 France .............................................................................................................98.65 98.55 36 Canada ...........................................................................................................98.50 98.39 37 Poland ............................................................................................................ 98.13 97.99 38 Norway ..........................................................................................................98.06 97.91 39 Hungary .........................................................................................................97.99 97.84 40 Kazakhstan ...................................................................................................97.81 97.64 41 Netherlands .................................................................................................97.73 97.55 42 Albania ........................................................................................................... 97.69 97.51 43 Luxembourg ...............................................................................................97.61 97.43 44 Croatia .............................................................................................................97.47 97.27 45 Costa Rica ..................................................................................................... 97.15 96.93 46 Jordan.............................................................................................................96.71 96.46 47 Kyrgyzstan ...................................................................................................96.59 96.33 48 Turkey .............................................................................................................96.37 96.10 49 Brunei Darussalam .................................................................................96.33 96.05 50 Ukraine ..........................................................................................................95.94 95.63 51 Montenegro ............................................................................................... 95.91 95.60 52 Uruguay ........................................................................................................95.67 95.35 53 Tajikistan .......................................................................................................95.49 95.15 54 Thailand ........................................................................................................95.01 94.63 55 Venezuela, Bolivarian Rep. ................................................................94.93 94.55 56 Argentina .................................................................................................... 94.84 94.45 57 Bosnia and Herzegovina ....................................................................94.78 94.38 58 Serbia ..............................................................................................................94.64 94.23 59 Sri Lanka ........................................................................................................94.21 93.77 60 Lithuania .......................................................................................................93.62 93.14 61 Egypt ................................................................................................................93.17 92.65 62 Mauritius ........................................................................................................93.15 92.63 63 Tunisia..............................................................................................................93.13 92.60 64 Latvia ..............................................................................................................92.86 92.32 65 Ireland .............................................................................................................92.18 91.58 66 Trinidad and Tobago .............................................................................92.15 91.55
Rank Country Value Score 67 Armenia......................................................................................................... 91.58 90.94 68 Paraguay ....................................................................................................... 91.22 90.55 69 El Salvador ....................................................................................................91.13 90.45 70 North Macedonia ...................................................................................90.91 90.22 71 Azerbaijan ....................................................................................................89.35 88.54 72 Mexico ...........................................................................................................89.22 88.40 73 Russian Federation ................................................................................88.79 87.93 74 Iran, Islamic Rep. ......................................................................................88.29 87.40 75 Algeria .............................................................................................................87.49 86.53 76 Brazil ................................................................................................................ 86.15 85.09 77 Ecuador ......................................................................................................... 86.14 85.08 78 Bulgaria..........................................................................................................85.98 84.91 79 Jamaica ..........................................................................................................85.37 84.26 80 Georgia ..........................................................................................................84.88 83.72 81 Colombia ......................................................................................................84.44 83.25 82 Morocco ........................................................................................................83.47 82.21 83 Dominican Republic .............................................................................82.70 81.38 84 Romania ........................................................................................................ 81.81 80.43 85 Honduras ..................................................................................................... 79.78 78.24 86 Moldova, Rep. ...........................................................................................78.40 76.75 87 Viet Nam .......................................................................................................78.24 76.58 88 Panama ..........................................................................................................76.87 75.10 89 Peru ..................................................................................................................76.82 75.05 90 Nicaragua .....................................................................................................76.35 74.55 91 China ...............................................................................................................75.04 73.14 92 Philippines ................................................................................................... 74.98 73.07 93 South Africa .................................................................................................73.13 71.08 94 Lao PDR .........................................................................................................72.59 70.51 95 Indonesia...................................................................................................... 67.89 65.44 96 Guatemala ................................................................................................... 67.36 64.88 97 Cabo Verde .................................................................................................65.21 62.56 98 Bhutan............................................................................................................62.87 60.04 99 Rwanda .........................................................................................................62.35 59.48 100 Botswana ..................................................................................................... 59.96 56.91 101 Yemen ............................................................................................................59.68 56.61 102 Mongolia ......................................................................................................59.22 56.11 103 Pakistan .........................................................................................................58.25 55.07 104 Eswatini .........................................................................................................58.03 54.83 105 Bolivia, Plurinational St. ....................................................................... 52.61 49.00 106 Burundi ..........................................................................................................50.46 46.69 107 Cambodia ....................................................................................................48.83 44.93 108 Senegal ..........................................................................................................48.36 44.42 109 Bangladesh .................................................................................................46.92 42.88 110 Nepal ............................................................................................................... 46.13 42.02 111 India ................................................................................................................. 44.15 39.90 112 Lesotho..........................................................................................................43.79 39.51 113 Malawi ............................................................................................................43.53 39.23 114 Gambia .......................................................................................................... 41.69 37.25 115 Angola............................................................................................................ 39.43 34.82 116 Cameroon ....................................................................................................38.83 34.18 117 Zimbabwe ...................................................................................................38.59 33.91 118 Namibia .........................................................................................................33.84 28.80 119 Nigeria ............................................................................................................32.60 27.47 120 Mali ................................................................................................................... 31.27 26.03 121 Zambia ............................................................................................................ 31.11 25.86 122 Côte d’Ivoire ............................................................................................... 29.93 24.59 123 Kenya ..............................................................................................................29.84 24.50 124 Mozambique .............................................................................................23.56 17.74 125 Tanzania, United Rep. ..........................................................................23.53 17.71 126 Burkina Faso ...............................................................................................22.53 16.63 127 Congo, Dem. Rep. ...................................................................................19.71 13.60 128 Uganda ...........................................................................................................19.15 12.99 129 Liberia .............................................................................................................16.89 10.56 130 Ghana .............................................................................................................14.28 7.75 131 Madagascar ...................................................................................................9.69 2.81 132 Ethiopia ............................................................................................................7.08 0.00
SOURCE: World Bank, World Development Indicators based on WHO/UNICEF Joint Monitoring Programme (JMP) for Water Supply and Sanitation (http://data.worldbank.org/data-catalog/world-development-indicators)
For some countries, the latest year for which data are available may differ from the year that appears at the top of the page. The cut-off year is 2008.

THE GLOBAL TALENT COMPETITIVENESS INDEX 2020 321
DATA TABLESDATA TABLES DATA TABLESDATA TABLES
Pillar 5Vocational and Technical Skills
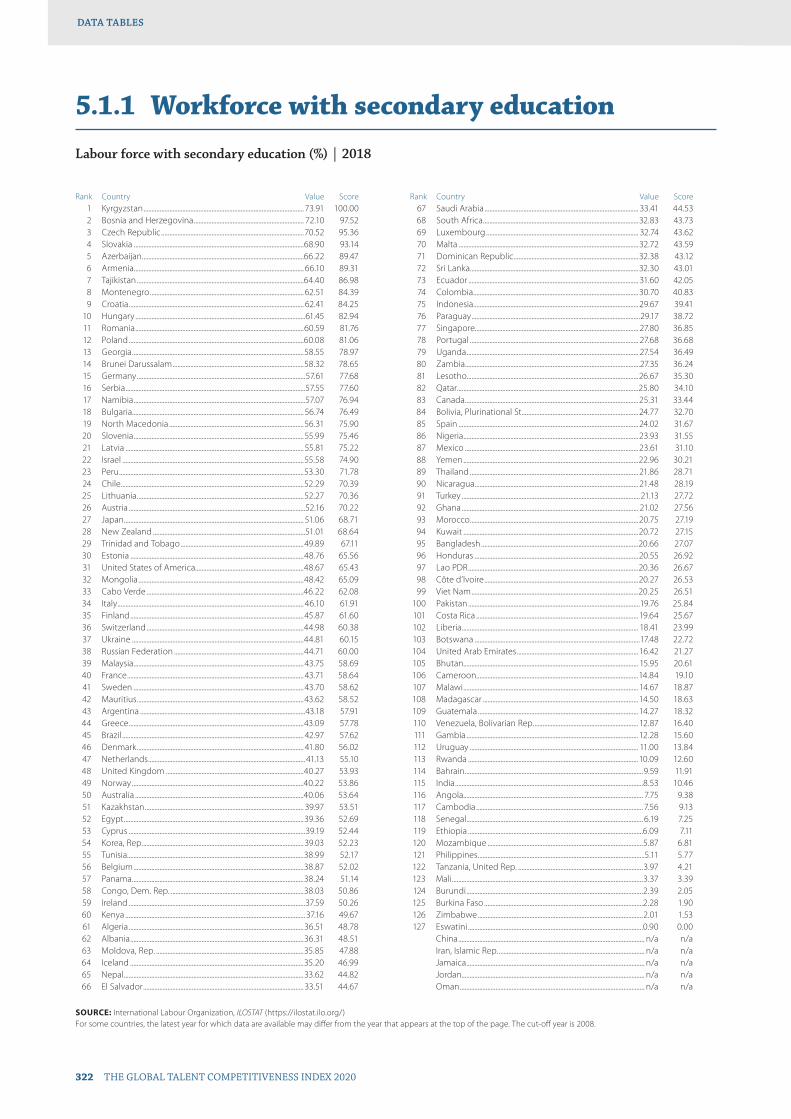
322 THE GLOBAL TALENT COMPETITIVENESS INDEX 2020
DATA TABLESDATA TABLES
5.1.1 Workforce with secondary education
Labour force with secondary education (%) | 2018
Rank Country Value Score 1 Kyrgyzstan ................................................................................................... 73.91 100.00 2 Bosnia and Herzegovina .................................................................... 72.10 97.52 3 Czech Republic ........................................................................................70.52 95.36 4 Slovakia .........................................................................................................68.90 93.14 5 Azerbaijan ....................................................................................................66.22 89.47 6 Armenia......................................................................................................... 66.10 89.31 7 Tajikistan .......................................................................................................64.40 86.98 8 Montenegro ............................................................................................... 62.51 84.39 9 Croatia ............................................................................................................ 62.41 84.25 10 Hungary .........................................................................................................61.45 82.94 11 Romania ........................................................................................................60.59 81.76 12 Poland ............................................................................................................60.08 81.06 13 Georgia ..........................................................................................................58.55 78.97 14 Brunei Darussalam .................................................................................58.32 78.65 15 Germany ........................................................................................................57.61 77.68 16 Serbia ...............................................................................................................57.55 77.60 17 Namibia ..........................................................................................................57.07 76.94 18 Bulgaria.......................................................................................................... 56.74 76.49 19 North Macedonia ...................................................................................56.31 75.90 20 Slovenia .........................................................................................................55.99 75.46 21 Latvia .............................................................................................................. 55.81 75.22 22 Israel ................................................................................................................55.58 74.90 23 Peru ..................................................................................................................53.30 71.78 24 Chile .................................................................................................................52.29 70.39 25 Lithuania .......................................................................................................52.27 70.36 26 Austria .............................................................................................................52.16 70.22 27 Japan ............................................................................................................... 51.06 68.71 28 New Zealand ..............................................................................................51.01 68.64 29 Trinidad and Tobago ............................................................................49.89 67.11 30 Estonia ...........................................................................................................48.76 65.56 31 United States of America...................................................................48.67 65.43 32 Mongolia ......................................................................................................48.42 65.09 33 Cabo Verde .................................................................................................46.22 62.08 34 Italy ................................................................................................................... 46.10 61.91 35 Finland ...........................................................................................................45.87 61.60 36 Switzerland .................................................................................................44.98 60.38 37 Ukraine ..........................................................................................................44.81 60.15 38 Russian Federation ................................................................................44.71 60.00 39 Malaysia ......................................................................................................... 43.75 58.69 40 France ............................................................................................................. 43.71 58.64 41 Sweden ......................................................................................................... 43.70 58.62 42 Mauritius .......................................................................................................43.62 58.52 43 Argentina ......................................................................................................43.18 57.91 44 Greece ............................................................................................................43.09 57.78 45 Brazil ................................................................................................................ 42.97 57.62 46 Denmark ....................................................................................................... 41.80 56.02 47 Netherlands .................................................................................................41.13 55.10 48 United Kingdom .....................................................................................40.27 53.93 49 Norway ..........................................................................................................40.22 53.86 50 Australia ........................................................................................................40.06 53.64 51 Kazakhstan .................................................................................................. 39.97 53.51 52 Egypt ...............................................................................................................39.36 52.69 53 Cyprus .............................................................................................................39.19 52.44 54 Korea, Rep. ...................................................................................................39.03 52.23 55 Tunisia.............................................................................................................38.99 52.17 56 Belgium .........................................................................................................38.87 52.02 57 Panama ..........................................................................................................38.24 51.14 58 Congo, Dem. Rep. ..................................................................................38.03 50.86 59 Ireland .............................................................................................................37.59 50.26 60 Kenya ...............................................................................................................37.16 49.67 61 Algeria ............................................................................................................36.51 48.78 62 Albania ...........................................................................................................36.31 48.51 63 Moldova, Rep. ...........................................................................................35.85 47.88 64 Iceland ...........................................................................................................35.20 46.99 65 Nepal ...............................................................................................................33.62 44.82 66 El Salvador ................................................................................................... 33.51 44.67
Rank Country Value Score 67 Saudi Arabia ............................................................................................... 33.41 44.53 68 South Africa ................................................................................................32.83 43.73 69 Luxembourg .............................................................................................. 32.74 43.62 70 Malta ...............................................................................................................32.72 43.59 71 Dominican Republic .............................................................................32.38 43.12 72 Sri Lanka ........................................................................................................32.30 43.01 73 Ecuador ......................................................................................................... 31.60 42.05 74 Colombia ......................................................................................................30.70 40.83 75 Indonesia......................................................................................................29.67 39.41 76 Paraguay ........................................................................................................29.17 38.72 77 Singapore..................................................................................................... 27.80 36.85 78 Portugal ........................................................................................................ 27.68 36.68 79 Uganda .......................................................................................................... 27.54 36.49 80 Zambia ............................................................................................................27.35 36.24 81 Lesotho..........................................................................................................26.67 35.30 82 Qatar ................................................................................................................25.80 34.10 83 Canada ...........................................................................................................25.31 33.44 84 Bolivia, Plurinational St. .......................................................................24.77 32.70 85 Spain ............................................................................................................... 24.02 31.67 86 Nigeria ............................................................................................................23.93 31.55 87 Mexico ...........................................................................................................23.61 31.10 88 Yemen ............................................................................................................22.96 30.21 89 Thailand ........................................................................................................ 21.86 28.71 90 Nicaragua ..................................................................................................... 21.48 28.19 91 Turkey ..............................................................................................................21.13 27.72 92 Ghana ............................................................................................................. 21.02 27.56 93 Morocco ........................................................................................................20.75 27.19 94 Kuwait ............................................................................................................20.72 27.15 95 Bangladesh .................................................................................................20.66 27.07 96 Honduras .....................................................................................................20.55 26.92 97 Lao PDR .........................................................................................................20.36 26.67 98 Côte d’Ivoire ...............................................................................................20.27 26.53 99 Viet Nam .......................................................................................................20.25 26.51 100 Pakistan ..........................................................................................................19.76 25.84 101 Costa Rica ....................................................................................................19.64 25.67 102 Liberia ............................................................................................................. 18.41 23.99 103 Botswana ......................................................................................................17.48 22.72 104 United Arab Emirates ........................................................................... 16.42 21.27 105 Bhutan............................................................................................................ 15.95 20.61 106 Cameroon ....................................................................................................14.84 19.10 107 Malawi ............................................................................................................ 14.67 18.87 108 Madagascar ................................................................................................14.50 18.63 109 Guatemala ...................................................................................................14.27 18.32 110 Venezuela, Bolivarian Rep. ................................................................ 12.87 16.40 111 Gambia .......................................................................................................... 12.28 15.60 112 Uruguay ........................................................................................................ 11.00 13.84 113 Rwanda .........................................................................................................10.09 12.60 114 Bahrain ..............................................................................................................9.59 11.91 115 India ....................................................................................................................8.53 10.46 116 Angola............................................................................................................... 7.75 9.38 117 Cambodia ....................................................................................................... 7.56 9.13 118 Senegal ............................................................................................................. 6.19 7.25 119 Ethiopia ............................................................................................................6.09 7.11 120 Mozambique ................................................................................................5.87 6.81 121 Philippines .......................................................................................................5.11 5.77 122 Tanzania, United Rep. .............................................................................3.97 4.21 123 Mali ......................................................................................................................3.37 3.39 124 Burundi .............................................................................................................2.39 2.05 125 Burkina Faso ..................................................................................................2.28 1.90 126 Zimbabwe ......................................................................................................2.01 1.53 127 Eswatini ............................................................................................................0.90 0.00 China ................................................................................................................... n/a n/a Iran, Islamic Rep. .......................................................................................... n/a n/a Jamaica .............................................................................................................. n/a n/a Jordan................................................................................................................. n/a n/a Oman .................................................................................................................. n/a n/a
SOURCE: International Labour Organization, ILOSTAT (https://ilostat.ilo.org/)For some countries, the latest year for which data are available may differ from the year that appears at the top of the page. The cut-off year is 2008.

THE GLOBAL TALENT COMPETITIVENESS INDEX 2020 323
DATA TABLESDATA TABLES
5.1.2 Population with secondary education
Population with secondary education (%) | 2018
Rank Country Value Score 1 Kyrgyzstan ...................................................................................................70.75 100.00 2 Czech Republic ........................................................................................69.98 98.90 3 Slovakia ......................................................................................................... 67.48 95.31 4 Azerbaijan ....................................................................................................63.20 89.18 5 Georgia ..........................................................................................................60.59 85.45 6 Poland ............................................................................................................59.83 84.35 7 Tajikistan ....................................................................................................... 57.89 81.58 8 Latvia .............................................................................................................. 57.34 80.79 9 Germany .......................................................................................................56.71 79.89 10 South Africa ................................................................................................55.73 78.48 11 Sri Lanka ........................................................................................................55.62 78.32 12 Slovenia .........................................................................................................54.92 77.32 13 Hungary ........................................................................................................54.66 76.95 14 Montenegro ...............................................................................................52.86 74.37 15 Croatia ............................................................................................................52.32 73.59 16 Lithuania ........................................................................................................52.15 73.35 17 Romania ........................................................................................................ 51.82 72.87 18 Austria .............................................................................................................51.76 72.80 19 Bosnia and Herzegovina .................................................................... 51.29 72.12 20 Bulgaria..........................................................................................................50.97 71.66 21 Serbia ..............................................................................................................50.72 71.30 22 Brunei Darussalam .................................................................................49.83 70.03 23 Estonia ...........................................................................................................49.09 68.97 24 Switzerland ..................................................................................................47.72 67.01 25 Trinidad and Tobago ............................................................................46.87 65.79 26 Japan ...............................................................................................................45.94 64.46 27 United States of America...................................................................45.58 63.94 28 Jamaica ..........................................................................................................44.67 62.64 29 Armenia.........................................................................................................44.51 62.41 30 Mongolia ......................................................................................................43.86 61.47 31 Sweden .........................................................................................................42.54 59.58 32 Moldova, Rep. ........................................................................................... 41.65 58.31 33 Denmark ........................................................................................................41.31 57.83 34 France .............................................................................................................40.07 56.04 35 Finland ........................................................................................................... 39.67 55.47 36 Malaysia ......................................................................................................... 39.49 55.22 37 Norway ..........................................................................................................39.05 54.58 38 Netherlands .................................................................................................37.87 52.89 39 Mauritius ........................................................................................................37.83 52.84 40 Chile .................................................................................................................. 37.13 51.83 41 New Zealand .............................................................................................36.55 51.00 42 Luxembourg ..............................................................................................36.44 50.84 43 Korea, Rep. ................................................................................................... 36.15 50.42 44 United Kingdom .....................................................................................35.73 49.82 45 Argentina .....................................................................................................35.30 49.21 46 Peru ...................................................................................................................35.11 48.93 47 Canada ...........................................................................................................35.07 48.89 48 Italy ...................................................................................................................34.80 48.49 49 Cyprus ............................................................................................................34.67 48.30 50 Belgium .........................................................................................................34.54 48.12 51 Israel ................................................................................................................34.34 47.83 52 Australia ........................................................................................................ 34.12 47.52 53 Greece ............................................................................................................33.44 46.54 54 Kazakhstan .................................................................................................. 32.75 45.56 55 Albania ...........................................................................................................32.38 45.02 56 Ireland ............................................................................................................32.00 44.49 57 Philippines ................................................................................................... 31.87 44.30 58 Brazil .................................................................................................................30.19 41.89 59 Bahrain ........................................................................................................... 29.61 41.05 60 Tunisia............................................................................................................. 29.43 40.80 61 Oman ..............................................................................................................29.08 40.30 62 Ecuador .........................................................................................................28.82 39.92 63 Saudi Arabia ................................................................................................27.91 38.62 64 Venezuela, Bolivarian Rep. ................................................................ 27.60 38.18 65 Colombia ....................................................................................................... 27.11 37.48 66 Singapore.....................................................................................................26.84 37.09
Rank Country Value Score 67 Iran, Islamic Rep. ......................................................................................25.32 34.91 68 Jordan..............................................................................................................25.17 34.70 69 Indonesia......................................................................................................24.33 33.50 70 Paraguay .......................................................................................................22.57 30.98 71 Dominican Republic .............................................................................22.49 30.85 72 Qatar .................................................................................................................22.13 30.34 73 Russian Federation .................................................................................21.93 30.05 74 El Salvador ................................................................................................... 21.67 29.67 75 Kenya ..............................................................................................................21.64 29.64 76 Panama .......................................................................................................... 21.52 29.47 77 Malta ............................................................................................................... 21.29 29.13 78 Bangladesh .................................................................................................20.45 27.93 79 Pakistan .........................................................................................................18.99 25.84 80 Viet Nam .......................................................................................................18.98 25.83 81 Spain ...............................................................................................................18.86 25.65 82 Bolivia, Plurinational St. .......................................................................18.62 25.30 83 Kuwait ............................................................................................................18.50 25.14 84 United Arab Emirates ........................................................................... 18.21 24.72 85 Congo, Dem. Rep. ...................................................................................18.15 24.63 86 Mexico ............................................................................................................18.13 24.60 87 Guatemala ................................................................................................... 18.07 24.52 88 Portugal .........................................................................................................17.77 24.09 89 Turkey ..............................................................................................................17.59 23.84 90 Ghana ..............................................................................................................17.43 23.61 91 Algeria .............................................................................................................17.26 23.35 92 India ................................................................................................................. 16.95 22.92 93 Uruguay ........................................................................................................16.85 22.78 94 Costa Rica ....................................................................................................16.80 22.70 95 Cameroon ....................................................................................................16.72 22.59 96 Cambodia .................................................................................................... 15.63 21.02 97 Honduras ..................................................................................................... 13.82 18.43 98 Thailand ........................................................................................................13.54 18.03 99 China ............................................................................................................... 13.50 17.98 100 Angola............................................................................................................13.23 17.59 101 Nepal ................................................................................................................12.12 15.99 102 Lesotho...........................................................................................................11.92 15.71 103 Cabo Verde .................................................................................................10.26 13.33 104 Ethiopia .............................................................................................................7.74 9.72 105 Mozambique ................................................................................................7.64 9.58 106 Senegal .............................................................................................................6.83 8.42 107 Côte d’Ivoire ..................................................................................................5.87 7.04 108 Rwanda ............................................................................................................4.94 5.71 109 Mali ......................................................................................................................3.58 3.76 110 Burkina Faso ..................................................................................................2.81 2.65 111 Zimbabwe ...................................................................................................... 2.14 1.69 112 Burundi ............................................................................................................. 1.97 1.46 113 Uganda .............................................................................................................1.70 1.06 114 Tanzania, United Rep. ............................................................................. 1.47 0.73 115 Bhutan...............................................................................................................0.96 0.00 Botswana ......................................................................................................... n/a n/a Egypt ................................................................................................................... n/a n/a Eswatini ............................................................................................................. n/a n/a Gambia .............................................................................................................. n/a n/a Iceland ............................................................................................................... n/a n/a Lao PDR ............................................................................................................. n/a n/a Liberia ................................................................................................................. n/a n/a Madagascar .................................................................................................... n/a n/a Malawi ................................................................................................................ n/a n/a Morocco ............................................................................................................ n/a n/a Namibia ............................................................................................................. n/a n/a Nicaragua ......................................................................................................... n/a n/a Nigeria ................................................................................................................ n/a n/a North Macedonia ....................................................................................... n/a n/a Ukraine .............................................................................................................. n/a n/a Yemen ................................................................................................................ n/a n/a Zambia ............................................................................................................... n/a n/a
SOURCE: UNESCO Institute for Statistics, UIS.Stat (http://data.uis.unesco.org/)For some countries, the latest year for which data are available may differ from the year that appears at the top of the page. The cut-off year is 2008.
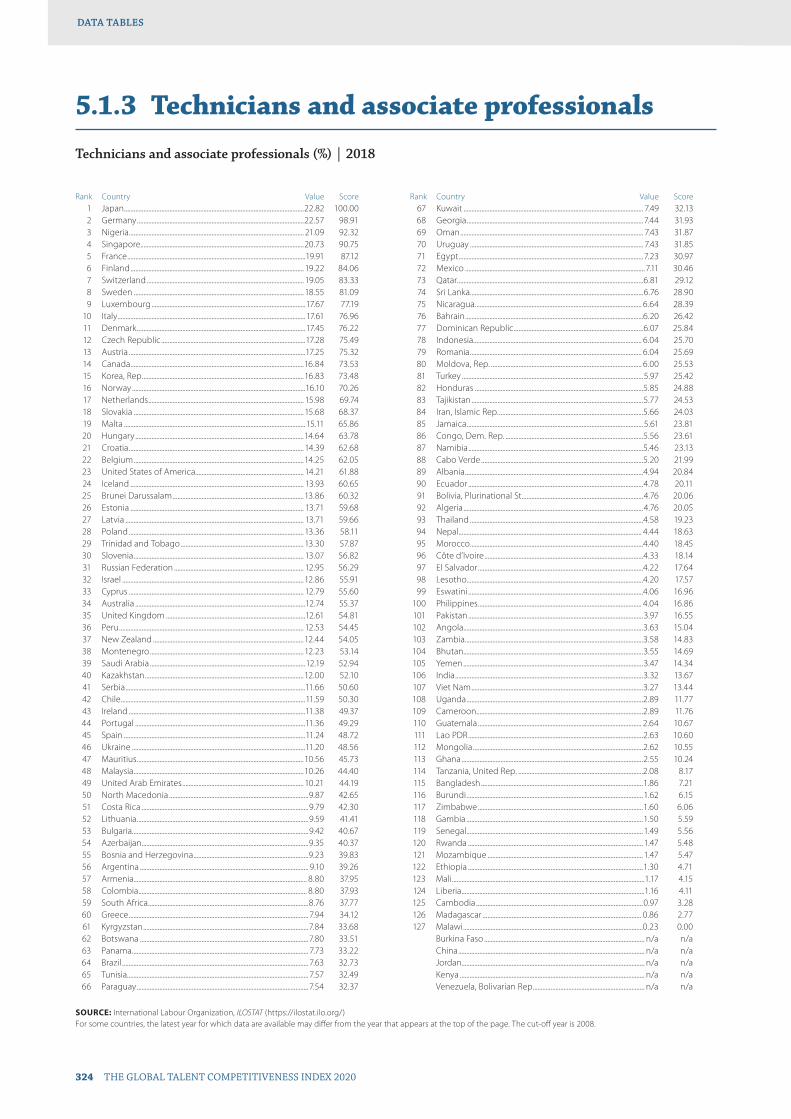
324 THE GLOBAL TALENT COMPETITIVENESS INDEX 2020
DATA TABLESDATA TABLES
5.1.3 Technicians and associate professionals
Technicians and associate professionals (%) | 2018
Rank Country Value Score 1 Japan ...............................................................................................................22.82 100.00 2 Germany .......................................................................................................22.57 98.91 3 Nigeria ............................................................................................................ 21.09 92.32 4 Singapore.....................................................................................................20.73 90.75 5 France ..............................................................................................................19.91 87.12 6 Finland ........................................................................................................... 19.22 84.06 7 Switzerland ................................................................................................. 19.05 83.33 8 Sweden ......................................................................................................... 18.55 81.09 9 Luxembourg ...............................................................................................17.67 77.19 10 Italy ....................................................................................................................17.61 76.96 11 Denmark ........................................................................................................17.45 76.22 12 Czech Republic .........................................................................................17.28 75.49 13 Austria .............................................................................................................17.25 75.32 14 Canada ...........................................................................................................16.84 73.53 15 Korea, Rep. ...................................................................................................16.83 73.48 16 Norway ...........................................................................................................16.10 70.26 17 Netherlands ................................................................................................ 15.98 69.74 18 Slovakia .........................................................................................................15.68 68.37 19 Malta ................................................................................................................15.11 65.86 20 Hungary ........................................................................................................14.64 63.78 21 Croatia ............................................................................................................ 14.39 62.68 22 Belgium .........................................................................................................14.25 62.05 23 United States of America................................................................... 14.21 61.88 24 Iceland ........................................................................................................... 13.93 60.65 25 Brunei Darussalam .................................................................................13.86 60.32 26 Estonia ........................................................................................................... 13.71 59.68 27 Latvia .............................................................................................................. 13.71 59.66 28 Poland ............................................................................................................13.36 58.11 29 Trinidad and Tobago ............................................................................13.30 57.87 30 Slovenia ......................................................................................................... 13.07 56.82 31 Russian Federation ................................................................................ 12.95 56.29 32 Israel ................................................................................................................12.86 55.91 33 Cyprus ............................................................................................................ 12.79 55.60 34 Australia .........................................................................................................12.74 55.37 35 United Kingdom ......................................................................................12.61 54.81 36 Peru .................................................................................................................. 12.53 54.45 37 New Zealand .............................................................................................12.44 54.05 38 Montenegro ...............................................................................................12.23 53.14 39 Saudi Arabia ................................................................................................12.19 52.94 40 Kazakhstan ..................................................................................................12.00 52.10 41 Serbia ...............................................................................................................11.66 50.60 42 Chile ..................................................................................................................11.59 50.30 43 Ireland .............................................................................................................11.38 49.37 44 Portugal .........................................................................................................11.36 49.29 45 Spain ................................................................................................................11.24 48.72 46 Ukraine ...........................................................................................................11.20 48.56 47 Mauritius .......................................................................................................10.56 45.73 48 Malaysia .........................................................................................................10.26 44.40 49 United Arab Emirates ........................................................................... 10.21 44.19 50 North Macedonia ......................................................................................9.87 42.65 51 Costa Rica .......................................................................................................9.79 42.30 52 Lithuania ..........................................................................................................9.59 41.41 53 Bulgaria.............................................................................................................9.42 40.67 54 Azerbaijan .......................................................................................................9.35 40.37 55 Bosnia and Herzegovina .......................................................................9.23 39.83 56 Argentina ........................................................................................................ 9.10 39.26 57 Armenia........................................................................................................... 8.80 37.95 58 Colombia ........................................................................................................ 8.80 37.93 59 South Africa ...................................................................................................8.76 37.77 60 Greece ............................................................................................................... 7.94 34.12 61 Kyrgyzstan ......................................................................................................7.84 33.68 62 Botswana ........................................................................................................7.80 33.51 63 Panama ............................................................................................................. 7.73 33.22 64 Brazil ................................................................................................................... 7.63 32.73 65 Tunisia................................................................................................................ 7.57 32.49 66 Paraguay ..........................................................................................................7.54 32.37
Rank Country Value Score 67 Kuwait ............................................................................................................... 7.49 32.13 68 Georgia .............................................................................................................7.44 31.93 69 Oman ................................................................................................................. 7.43 31.87 70 Uruguay ........................................................................................................... 7.43 31.85 71 Egypt ..................................................................................................................7.23 30.97 72 Mexico ...............................................................................................................7.11 30.46 73 Qatar ...................................................................................................................6.81 29.12 74 Sri Lanka ...........................................................................................................6.76 28.90 75 Nicaragua ....................................................................................................... 6.64 28.39 76 Bahrain ..............................................................................................................6.20 26.42 77 Dominican Republic ................................................................................6.07 25.84 78 Indonesia........................................................................................................ 6.04 25.70 79 Romania .......................................................................................................... 6.04 25.69 80 Moldova, Rep. ............................................................................................. 6.00 25.53 81 Turkey ................................................................................................................5.97 25.42 82 Honduras ........................................................................................................5.85 24.88 83 Tajikistan ..........................................................................................................5.77 24.53 84 Iran, Islamic Rep. .........................................................................................5.66 24.03 85 Jamaica .............................................................................................................5.61 23.81 86 Congo, Dem. Rep. .....................................................................................5.56 23.61 87 Namibia ............................................................................................................5.46 23.13 88 Cabo Verde ....................................................................................................5.20 21.99 89 Albania ..............................................................................................................4.94 20.84 90 Ecuador ............................................................................................................4.78 20.11 91 Bolivia, Plurinational St. ..........................................................................4.76 20.06 92 Algeria ...............................................................................................................4.76 20.05 93 Thailand ...........................................................................................................4.58 19.23 94 Nepal ................................................................................................................. 4.44 18.63 95 Morocco ...........................................................................................................4.40 18.45 96 Côte d’Ivoire ..................................................................................................4.33 18.14 97 El Salvador ......................................................................................................4.22 17.64 98 Lesotho.............................................................................................................4.20 17.57 99 Eswatini ............................................................................................................4.06 16.96 100 Philippines ..................................................................................................... 4.04 16.86 101 Pakistan ............................................................................................................3.97 16.55 102 Angola...............................................................................................................3.63 15.04 103 Zambia ..............................................................................................................3.58 14.83 104 Bhutan...............................................................................................................3.55 14.69 105 Yemen ...............................................................................................................3.47 14.34 106 India ....................................................................................................................3.32 13.67 107 Viet Nam ..........................................................................................................3.27 13.44 108 Uganda .............................................................................................................2.89 11.77 109 Cameroon .......................................................................................................2.89 11.76 110 Guatemala ..................................................................................................... 2.64 10.67 111 Lao PDR ............................................................................................................2.63 10.60 112 Mongolia .........................................................................................................2.62 10.55 113 Ghana ................................................................................................................2.55 10.24 114 Tanzania, United Rep. .............................................................................2.08 8.17 115 Bangladesh ....................................................................................................1.86 7.21 116 Burundi .............................................................................................................1.62 6.15 117 Zimbabwe ......................................................................................................1.60 6.06 118 Gambia .............................................................................................................1.50 5.59 119 Senegal .............................................................................................................1.49 5.56 120 Rwanda ............................................................................................................1.47 5.48 121 Mozambique ................................................................................................1.47 5.47 122 Ethiopia ............................................................................................................1.30 4.71 123 Mali .......................................................................................................................1.17 4.15 124 Liberia .................................................................................................................1.16 4.11 125 Cambodia .......................................................................................................0.97 3.28 126 Madagascar .................................................................................................. 0.86 2.77 127 Malawi ...............................................................................................................0.23 0.00 Burkina Faso ................................................................................................... n/a n/a China ................................................................................................................... n/a n/a Jordan................................................................................................................. n/a n/a Kenya .................................................................................................................. n/a n/a Venezuela, Bolivarian Rep. .................................................................... n/a n/a
SOURCE: International Labour Organization, ILOSTAT (https://ilostat.ilo.org/)For some countries, the latest year for which data are available may differ from the year that appears at the top of the page. The cut-off year is 2008.

THE GLOBAL TALENT COMPETITIVENESS INDEX 2020 325
DATA TABLESDATA TABLES
5.1.4 Labour productivity per employee
Labour productivity per person employed (2018 US$) | 2019
Rank Country Value Score 1 Qatar .................................................................................................... 170,528.53 100.00 2 Singapore..........................................................................................153,123.97 89.64 3 Ireland .................................................................................................152,145.65 89.06 4 Luxembourg .................................................................................. 141,060.35 82.46 5 Norway ..............................................................................................139,960.22 81.81 6 Saudi Arabia ...................................................................................138,682.72 81.05 7 United States of America........................................................131,783.05 76.94 8 Kuwait .................................................................................................129,337.48 75.49 9 Belgium ............................................................................................. 114,405.43 66.60 10 United Arab Emirates ................................................................110,221.02 64.11 11 Switzerland ......................................................................................107,122.39 62.27 12 Sweden ............................................................................................106,004.00 61.60 13 France ..................................................................................................105,106.10 61.07 14 Netherlands ..................................................................................... 103,412.12 60.06 15 Australia ............................................................................................ 103,329.57 60.01 16 Austria ................................................................................................102,332.33 59.42 17 Denmark ........................................................................................... 101,064.91 58.66 18 Finland ..................................................................................................98,109.62 56.91 19 Iceland ..................................................................................................97,625.32 56.62 20 Germany .............................................................................................96,409.84 55.89 21 Canada ..................................................................................................95,612.57 55.42 22 Bahrain ..................................................................................................93,765.60 54.32 23 Italy ..........................................................................................................93,519.23 54.17 24 Spain ...................................................................................................... 93,007.75 53.87 25 United Kingdom ............................................................................92,771.96 53.73 26 Malta ..................................................................................................... 90,602.37 52.44 27 Japan ......................................................................................................82,381.88 47.55 28 Cyprus ...................................................................................................82,067.56 47.36 29 Korea, Rep. ......................................................................................... 80,565.77 46.47 30 Slovakia ................................................................................................80,505.01 46.43 31 Israel .......................................................................................................80,279.21 46.30 32 Turkey ....................................................................................................77,482.75 44.63 33 Poland ...................................................................................................75,650.98 43.54 34 New Zealand ....................................................................................75,614.33 43.52 35 Oman .................................................................................................... 74,898.35 43.09 36 Slovenia ................................................................................................74,253.40 42.71 37 Czech Republic ..............................................................................73,846.87 42.47 38 Greece ...................................................................................................73,257.24 42.12 39 Lithuania ..............................................................................................72,339.72 41.57 40 Estonia .................................................................................................70,040.30 40.20 41 Hungary ............................................................................................... 68,737.93 39.43 42 Malaysia ................................................................................................68,472.93 39.27 43 Trinidad and Tobago ...................................................................68,391.42 39.22 44 Portugal ...............................................................................................66,396.16 38.03 45 Iran, Islamic Rep. ............................................................................ 65,299.26 37.38 46 Latvia .....................................................................................................65,278.51 37.37 47 Croatia .................................................................................................. 63,880.02 36.54 48 Romania ................................................................................................61,281.79 34.99 49 Algeria ....................................................................................................61,121.84 34.90 50 Kazakhstan .........................................................................................59,881.77 34.16 51 Russian Federation ........................................................................59,174.22 33.74 52 Chile .........................................................................................................58,351.19 33.25 53 Bosnia and Herzegovina ........................................................... 57,926.77 32.99 54 Montenegro ......................................................................................55,678.31 31.66 55 Uruguay ................................................................................................ 50,197.19 28.39 56 Egypt ..................................................................................................... 49,092.80 27.74 57 Mexico ...................................................................................................47,129.48 26.57 58 South Africa .......................................................................................47,053.36 26.52 59 Bulgaria................................................................................................. 46,987.10 26.48 60 Argentina ........................................................................................... 44,186.86 24.82 61 Jordan....................................................................................................43,210.95 24.24 62 Costa Rica .......................................................................................... 42,003.46 23.52 63 Tunisia.................................................................................................... 41,985.53 23.51 64 Dominican Republic ...................................................................40,704.34 22.75 65 North Macedonia .........................................................................40,062.58 22.36 66 Azerbaijan ............................................................................................37,317.34 20.73
Rank Country Value Score 67 Sri Lanka ............................................................................................... 36,367.74 20.16 68 China .....................................................................................................35,604.34 19.71 69 Thailand ...............................................................................................35,555.98 19.68 70 Serbia .................................................................................................... 34,855.53 19.26 71 Albania ..................................................................................................34,572.13 19.10 72 Colombia .............................................................................................33,219.50 18.29 73 Brazil .......................................................................................................32,863.97 18.08 74 Armenia................................................................................................ 30,870.17 16.89 75 Indonesia............................................................................................ 28,693.57 15.60 76 Peru ..........................................................................................................27,341.47 14.79 77 Morocco .............................................................................................. 25,966.48 13.98 78 Georgia ................................................................................................ 25,463.05 13.68 79 Ecuador ................................................................................................24,821.52 13.29 80 Ukraine ................................................................................................. 24,715.03 13.23 81 Philippines ..........................................................................................23,770.19 12.67 82 Venezuela, Bolivarian Rep. .......................................................21,578.56 11.36 83 Moldova, Rep. ..................................................................................21,534.95 11.34 84 Guatemala .......................................................................................... 21,138.96 11.10 85 India .........................................................................................................20,127.21 10.50 86 Jamaica ................................................................................................ 19,840.06 10.33 87 Pakistan ................................................................................................18,959.46 9.81 88 Bolivia, Plurinational St. ............................................................. 16,858.99 8.56 89 Nigeria ...................................................................................................16,669.75 8.44 90 Angola...................................................................................................16,126.22 8.12 91 Senegal .................................................................................................14,292.63 7.03 92 Zambia .................................................................................................. 14,196.57 6.97 93 Viet Nam .............................................................................................. 13,768.41 6.72 94 Côte d’Ivoire ..................................................................................... 13,686.90 6.67 95 Ghana ................................................................................................... 13,046.65 6.29 96 Tajikistan .............................................................................................. 12,938.10 6.22 97 Yemen ...................................................................................................12,253.26 5.81 98 Bangladesh .........................................................................................11,713.22 5.49 99 Kyrgyzstan ......................................................................................... 10,388.66 4.71 100 Kenya .......................................................................................................8,600.60 3.64 101 Cambodia .............................................................................................. 7,447.75 2.96 102 Uganda .................................................................................................... 7,179.00 2.80 103 Tanzania, United Rep. ...................................................................6,990.08 2.68 104 Mali .............................................................................................................6,901.62 2.63 105 Cameroon ..............................................................................................6,569.18 2.43 106 Zimbabwe .............................................................................................4,881.15 1.43 107 Burkina Faso .........................................................................................4,585.16 1.25 108 Mozambique .......................................................................................3,821.48 0.80 109 Ethiopia ...................................................................................................3,537.87 0.63 110 Madagascar .........................................................................................3,260.35 0.46 111 Congo, Dem. Rep. .......................................................................... 2,646.64 0.10 112 Malawi ......................................................................................................2,481.62 0.00 Bhutan................................................................................................................ n/a n/a Botswana ......................................................................................................... n/a n/a Brunei Darussalam ..................................................................................... n/a n/a Burundi .............................................................................................................. n/a n/a Cabo Verde ..................................................................................................... n/a n/a El Salvador ....................................................................................................... n/a n/a Eswatini ............................................................................................................. n/a n/a Gambia .............................................................................................................. n/a n/a Honduras ......................................................................................................... n/a n/a Lao PDR ............................................................................................................. n/a n/a Lesotho.............................................................................................................. n/a n/a Liberia ................................................................................................................. n/a n/a Mauritius ........................................................................................................... n/a n/a Mongolia .......................................................................................................... n/a n/a Namibia ............................................................................................................. n/a n/a Nepal ................................................................................................................... n/a n/a Nicaragua ......................................................................................................... n/a n/a Panama .............................................................................................................. n/a n/a Paraguay ........................................................................................................... n/a n/a Rwanda ............................................................................................................. n/a n/a
SOURCE: The Conference Board, Total Economy Database™ (Adjusted version) (www.conference-board.org/data/economydatabase)For some countries, the latest year for which data are available may differ from the year that appears at the top of the page. The cut-off year is 2008.
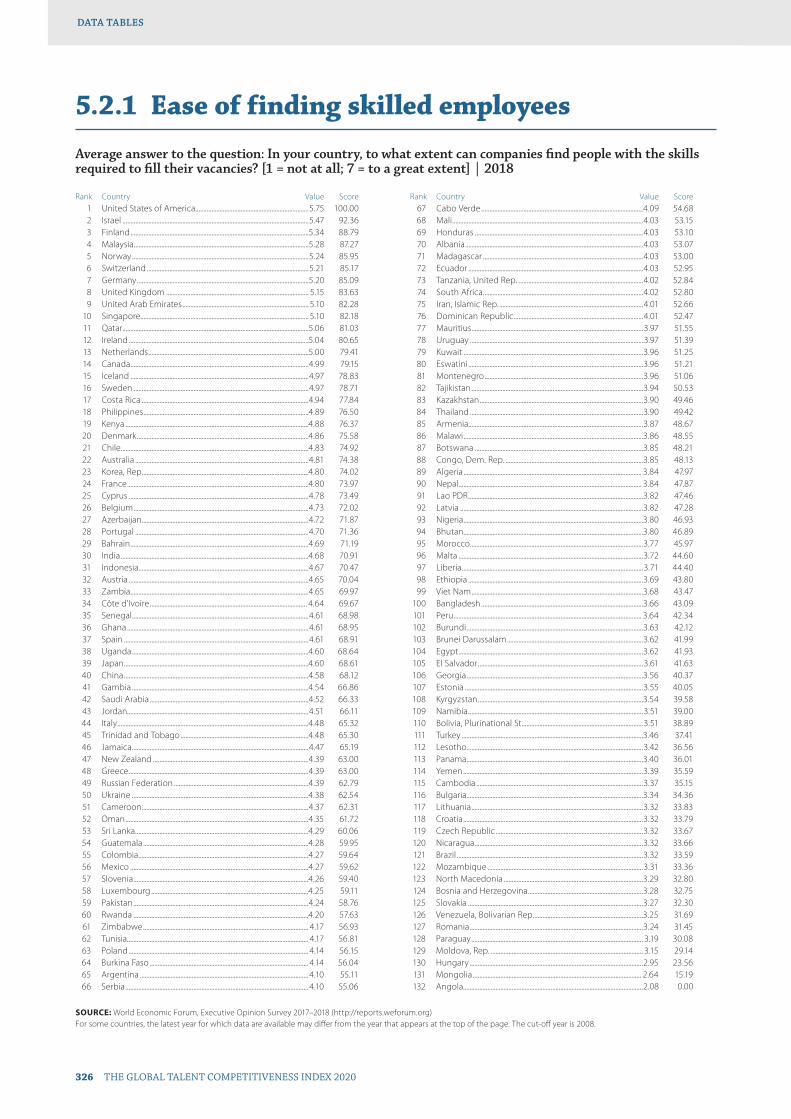
326 THE GLOBAL TALENT COMPETITIVENESS INDEX 2020
DATA TABLESDATA TABLES
5.2.1 Ease of finding skilled employees
Average answer to the question: In your country, to what extent can companies find people with the skills required to fill their vacancies? [1 = not at all; 7 = to a great extent] | 2018
Rank Country Value Score 1 United States of America......................................................................5.75 100.00 2 Israel ...................................................................................................................5.47 92.36 3 Finland ..............................................................................................................5.34 88.79 4 Malaysia ............................................................................................................5.28 87.27 5 Norway .............................................................................................................5.24 85.95 6 Switzerland ....................................................................................................5.21 85.17 7 Germany ..........................................................................................................5.20 85.09 8 United Kingdom ........................................................................................ 5.15 83.63 9 United Arab Emirates .............................................................................. 5.10 82.28 10 Singapore........................................................................................................ 5.10 82.18 11 Qatar ...................................................................................................................5.06 81.03 12 Ireland ...............................................................................................................5.04 80.65 13 Netherlands ...................................................................................................5.00 79.41 14 Canada ..............................................................................................................4.99 79.15 15 Iceland ..............................................................................................................4.97 78.83 16 Sweden ............................................................................................................4.97 78.71 17 Costa Rica .......................................................................................................4.94 77.84 18 Philippines ......................................................................................................4.89 76.50 19 Kenya .................................................................................................................4.88 76.37 20 Denmark ..........................................................................................................4.86 75.58 21 Chile ....................................................................................................................4.83 74.92 22 Australia ...........................................................................................................4.81 74.38 23 Korea, Rep. ......................................................................................................4.80 74.02 24 France ................................................................................................................4.80 73.97 25 Cyprus ...............................................................................................................4.78 73.49 26 Belgium ............................................................................................................4.73 72.02 27 Azerbaijan .......................................................................................................4.72 71.87 28 Portugal ...........................................................................................................4.70 71.36 29 Bahrain ..............................................................................................................4.69 71.19 30 India ....................................................................................................................4.68 70.91 31 Indonesia.........................................................................................................4.67 70.47 32 Austria ...............................................................................................................4.65 70.04 33 Zambia ..............................................................................................................4.65 69.97 34 Côte d’Ivoire ................................................................................................. 4.64 69.67 35 Senegal .............................................................................................................4.61 68.98 36 Ghana ................................................................................................................4.61 68.95 37 Spain ..................................................................................................................4.61 68.91 38 Uganda .............................................................................................................4.60 68.64 39 Japan ..................................................................................................................4.60 68.61 40 China ..................................................................................................................4.58 68.12 41 Gambia .............................................................................................................4.54 66.86 42 Saudi Arabia ..................................................................................................4.52 66.33 43 Jordan................................................................................................................4.51 66.11 44 Italy ......................................................................................................................4.48 65.32 45 Trinidad and Tobago ...............................................................................4.48 65.30 46 Jamaica .............................................................................................................4.47 65.19 47 New Zealand ................................................................................................4.39 63.00 48 Greece ...............................................................................................................4.39 63.00 49 Russian Federation ...................................................................................4.39 62.79 50 Ukraine .............................................................................................................4.38 62.54 51 Cameroon .......................................................................................................4.37 62.31 52 Oman .................................................................................................................4.35 61.72 53 Sri Lanka ...........................................................................................................4.29 60.06 54 Guatemala ......................................................................................................4.28 59.95 55 Colombia .........................................................................................................4.27 59.64 56 Mexico ..............................................................................................................4.27 59.62 57 Slovenia ............................................................................................................4.26 59.40 58 Luxembourg .................................................................................................4.25 59.11 59 Pakistan ............................................................................................................4.24 58.76 60 Rwanda ............................................................................................................4.20 57.63 61 Zimbabwe ...................................................................................................... 4.17 56.93 62 Tunisia................................................................................................................ 4.17 56.81 63 Poland ............................................................................................................... 4.14 56.15 64 Burkina Faso .................................................................................................. 4.14 56.04 65 Argentina ........................................................................................................ 4.10 55.11 66 Serbia ................................................................................................................. 4.10 55.06
Rank Country Value Score 67 Cabo Verde ....................................................................................................4.09 54.68 68 Mali ......................................................................................................................4.03 53.15 69 Honduras ........................................................................................................4.03 53.10 70 Albania ..............................................................................................................4.03 53.07 71 Madagascar ...................................................................................................4.03 53.00 72 Ecuador ............................................................................................................4.03 52.95 73 Tanzania, United Rep. .............................................................................4.02 52.84 74 South Africa ...................................................................................................4.02 52.80 75 Iran, Islamic Rep. .........................................................................................4.01 52.66 76 Dominican Republic ................................................................................4.01 52.47 77 Mauritius ..........................................................................................................3.97 51.55 78 Uruguay ...........................................................................................................3.97 51.39 79 Kuwait ...............................................................................................................3.96 51.25 80 Eswatini ............................................................................................................3.96 51.21 81 Montenegro ..................................................................................................3.96 51.06 82 Tajikistan ..........................................................................................................3.94 50.53 83 Kazakhstan .....................................................................................................3.90 49.46 84 Thailand ...........................................................................................................3.90 49.42 85 Armenia............................................................................................................3.87 48.67 86 Malawi ...............................................................................................................3.86 48.55 87 Botswana ........................................................................................................3.85 48.21 88 Congo, Dem. Rep. .....................................................................................3.85 48.13 89 Algeria .............................................................................................................. 3.84 47.97 90 Nepal ................................................................................................................. 3.84 47.87 91 Lao PDR ............................................................................................................3.82 47.46 92 Latvia .................................................................................................................3.82 47.28 93 Nigeria ...............................................................................................................3.80 46.93 94 Bhutan...............................................................................................................3.80 46.89 95 Morocco ...........................................................................................................3.77 45.97 96 Malta ..................................................................................................................3.72 44.60 97 Liberia ................................................................................................................3.71 44.40 98 Ethiopia ............................................................................................................3.69 43.80 99 Viet Nam ..........................................................................................................3.68 43.47 100 Bangladesh ....................................................................................................3.66 43.09 101 Peru .................................................................................................................... 3.64 42.34 102 Burundi .............................................................................................................3.63 42.12 103 Brunei Darussalam ....................................................................................3.62 41.99 104 Egypt ..................................................................................................................3.62 41.93 105 El Salvador ......................................................................................................3.61 41.63 106 Georgia .............................................................................................................3.56 40.37 107 Estonia ..............................................................................................................3.55 40.05 108 Kyrgyzstan ......................................................................................................3.54 39.58 109 Namibia ............................................................................................................3.51 39.00 110 Bolivia, Plurinational St. ..........................................................................3.51 38.89 111 Turkey ................................................................................................................3.46 37.41 112 Lesotho.............................................................................................................3.42 36.56 113 Panama .............................................................................................................3.40 36.01 114 Yemen ...............................................................................................................3.39 35.59 115 Cambodia .......................................................................................................3.37 35.15 116 Bulgaria.............................................................................................................3.34 34.36 117 Lithuania ..........................................................................................................3.32 33.83 118 Croatia ...............................................................................................................3.32 33.79 119 Czech Republic ...........................................................................................3.32 33.67 120 Nicaragua ........................................................................................................3.32 33.66 121 Brazil ...................................................................................................................3.32 33.59 122 Mozambique ................................................................................................3.31 33.36 123 North Macedonia ......................................................................................3.29 32.80 124 Bosnia and Herzegovina .......................................................................3.28 32.75 125 Slovakia ............................................................................................................3.27 32.30 126 Venezuela, Bolivarian Rep. ...................................................................3.25 31.69 127 Romania ...........................................................................................................3.24 31.45 128 Paraguay .......................................................................................................... 3.19 30.08 129 Moldova, Rep. .............................................................................................. 3.15 29.14 130 Hungary ...........................................................................................................2.95 23.56 131 Mongolia ........................................................................................................ 2.64 15.19 132 Angola...............................................................................................................2.08 0.00
SOURCE: World Economic Forum, Executive Opinion Survey 2017–2018 (http://reports.weforum.org)For some countries, the latest year for which data are available may differ from the year that appears at the top of the page. The cut-off year is 2008.

THE GLOBAL TALENT COMPETITIVENESS INDEX 2020 327
DATA TABLESDATA TABLES
5.2.2 Relevance of education system to the economy
Average answer to the question: In your country, how well does the education system meet the needs of a competitive economy? [1 = not well at all; 7 = extremely well] | 2018
Rank Country Value Score 1 Switzerland .................................................................................................... 6.15 100.00 2 United States of America......................................................................6.01 96.93 3 Singapore........................................................................................................5.79 91.96 4 Finland ..............................................................................................................5.71 90.22 5 Ireland ...............................................................................................................5.50 85.63 6 Netherlands ...................................................................................................5.43 83.99 7 Malaysia ............................................................................................................5.30 81.11 8 Germany ..........................................................................................................5.30 81.05 9 Qatar ...................................................................................................................5.29 80.88 10 Canada .............................................................................................................. 5.19 78.62 11 Norway .............................................................................................................5.01 74.65 12 Denmark ..........................................................................................................4.98 74.07 13 United Arab Emirates ..............................................................................4.97 73.82 14 Sweden ............................................................................................................4.94 73.21 15 Iceland ..............................................................................................................4.82 70.51 16 Australia ...........................................................................................................4.81 70.24 17 Belgium ............................................................................................................4.77 69.31 18 India ....................................................................................................................4.74 68.66 19 United Kingdom ........................................................................................4.73 68.53 20 New Zealand ................................................................................................4.70 67.89 21 Philippines ......................................................................................................4.69 67.66 22 Malta ..................................................................................................................4.67 67.19 23 Bahrain ............................................................................................................. 4.64 66.47 24 Oman .................................................................................................................4.61 65.93 25 Israel ...................................................................................................................4.56 64.76 26 Luxembourg .................................................................................................4.53 64.15 27 China ..................................................................................................................4.52 63.76 28 Bhutan...............................................................................................................4.50 63.40 29 Brunei Darussalam ....................................................................................4.50 63.33 30 Japan ..................................................................................................................4.50 63.32 31 Estonia ..............................................................................................................4.46 62.53 32 Kenya .................................................................................................................4.46 62.51 33 Saudi Arabia ................................................................................................. 4.44 62.09 34 Portugal .......................................................................................................... 4.44 62.08 35 Indonesia.........................................................................................................4.42 61.73 36 Albania ..............................................................................................................4.42 61.66 37 Azerbaijan .......................................................................................................4.40 61.19 38 Gambia .............................................................................................................4.35 60.04 39 Austria ...............................................................................................................4.30 58.99 40 Jamaica .............................................................................................................4.28 58.46 41 Costa Rica ....................................................................................................... 4.19 56.61 42 Cyprus ............................................................................................................... 4.18 56.26 43 Ghana ................................................................................................................ 4.14 55.45 44 France ................................................................................................................ 4.14 55.45 45 Montenegro ..................................................................................................4.08 54.14 46 Slovenia ............................................................................................................4.07 53.97 47 Pakistan ............................................................................................................4.03 53.08 48 Zimbabwe ......................................................................................................4.02 52.77 49 Jordan................................................................................................................4.00 52.37 50 Tajikistan ..........................................................................................................3.99 52.09 51 Trinidad and Tobago ...............................................................................3.98 51.92 52 Sri Lanka ...........................................................................................................3.94 51.04 53 Armenia............................................................................................................3.93 50.80 54 Mauritius ..........................................................................................................3.93 50.67 55 Lao PDR ............................................................................................................3.92 50.49 56 Rwanda ............................................................................................................3.91 50.26 57 Cabo Verde ....................................................................................................3.89 49.89 58 Ukraine .............................................................................................................3.80 47.98 59 Latvia .................................................................................................................3.75 46.70 60 Kuwait ...............................................................................................................3.74 46.53 61 Korea, Rep. ......................................................................................................3.73 46.44 62 Russian Federation ...................................................................................3.73 46.32 63 Thailand ...........................................................................................................3.72 46.03 64 Cambodia .......................................................................................................3.66 44.81 65 Italy ......................................................................................................................3.65 44.58 66 Senegal ............................................................................................................ 3.64 44.33
Rank Country Value Score 67 Zambia ..............................................................................................................3.61 43.65 68 Czech Republic ...........................................................................................3.59 43.21 69 Tanzania, United Rep. .............................................................................3.56 42.49 70 Nepal ..................................................................................................................3.55 42.26 71 Kazakhstan .....................................................................................................3.53 41.96 72 Chile ....................................................................................................................3.52 41.63 73 Botswana ........................................................................................................3.51 41.44 74 Ethiopia ............................................................................................................3.49 41.06 75 Bulgaria.............................................................................................................3.48 40.89 76 Uganda .............................................................................................................3.48 40.82 77 Poland ...............................................................................................................3.47 40.55 78 Spain ..................................................................................................................3.46 40.25 79 Eswatini ............................................................................................................3.43 39.79 80 Cameroon .......................................................................................................3.43 39.67 81 Serbia .................................................................................................................3.42 39.42 82 Lesotho.............................................................................................................3.42 39.39 83 Colombia .........................................................................................................3.40 39.05 84 Bangladesh ....................................................................................................3.33 37.48 85 Viet Nam ..........................................................................................................3.33 37.44 86 Lithuania ..........................................................................................................3.27 36.11 87 Moldova, Rep. ..............................................................................................3.26 36.01 88 Namibia ............................................................................................................3.25 35.82 89 Ecuador ............................................................................................................3.25 35.64 90 Liberia ................................................................................................................3.23 35.26 91 Honduras ........................................................................................................3.21 34.76 92 Tunisia................................................................................................................ 3.17 33.89 93 Algeria ............................................................................................................... 3.16 33.72 94 Malawi ............................................................................................................... 3.13 33.15 95 Côte d’Ivoire .................................................................................................. 3.13 32.99 96 Kyrgyzstan .......................................................................................................3.11 32.56 97 Mali ......................................................................................................................3.07 31.71 98 Burundi .............................................................................................................3.06 31.49 99 Romania ...........................................................................................................3.05 31.39 100 Georgia .............................................................................................................3.05 31.33 101 Argentina ........................................................................................................3.03 30.83 102 Iran, Islamic Rep. .........................................................................................3.02 30.66 103 Madagascar ...................................................................................................2.96 29.29 104 Burkina Faso ..................................................................................................2.96 29.24 105 Mexico ..............................................................................................................2.94 28.94 106 South Africa ...................................................................................................2.93 28.72 107 Turkey ................................................................................................................2.91 28.22 108 Hungary ...........................................................................................................2.89 27.67 109 Morocco ...........................................................................................................2.81 25.96 110 Greece ...............................................................................................................2.79 25.56 111 North Macedonia ......................................................................................2.79 25.45 112 Slovakia ............................................................................................................2.76 24.80 113 Panama .............................................................................................................2.75 24.63 114 Dominican Republic ................................................................................2.74 24.46 115 Congo, Dem. Rep. .....................................................................................2.66 22.70 116 Venezuela, Bolivarian Rep. ...................................................................2.65 22.45 117 Croatia ...............................................................................................................2.60 21.40 118 Guatemala ......................................................................................................2.58 20.81 119 Mozambique ................................................................................................2.57 20.71 120 Mongolia .........................................................................................................2.56 20.39 121 Nigeria ...............................................................................................................2.55 20.22 122 Peru .....................................................................................................................2.54 19.99 123 Egypt ..................................................................................................................2.54 19.98 124 Bolivia, Plurinational St. ..........................................................................2.53 19.73 125 Uruguay ...........................................................................................................2.53 19.67 126 Brazil ...................................................................................................................2.35 15.86 127 Bosnia and Herzegovina .......................................................................2.35 15.79 128 Nicaragua ........................................................................................................2.31 14.85 129 Yemen ...............................................................................................................2.28 14.27 130 El Salvador ...................................................................................................... 2.17 11.81 131 Paraguay .......................................................................................................... 2.10 10.26 132 Angola...............................................................................................................1.64 0.00
SOURCE: World Economic Forum, Executive Opinion Survey 2017–2018 (http://reports.weforum.org)For some countries, the latest year for which data are available may differ from the year that appears at the top of the page. The cut-off year is 2008.
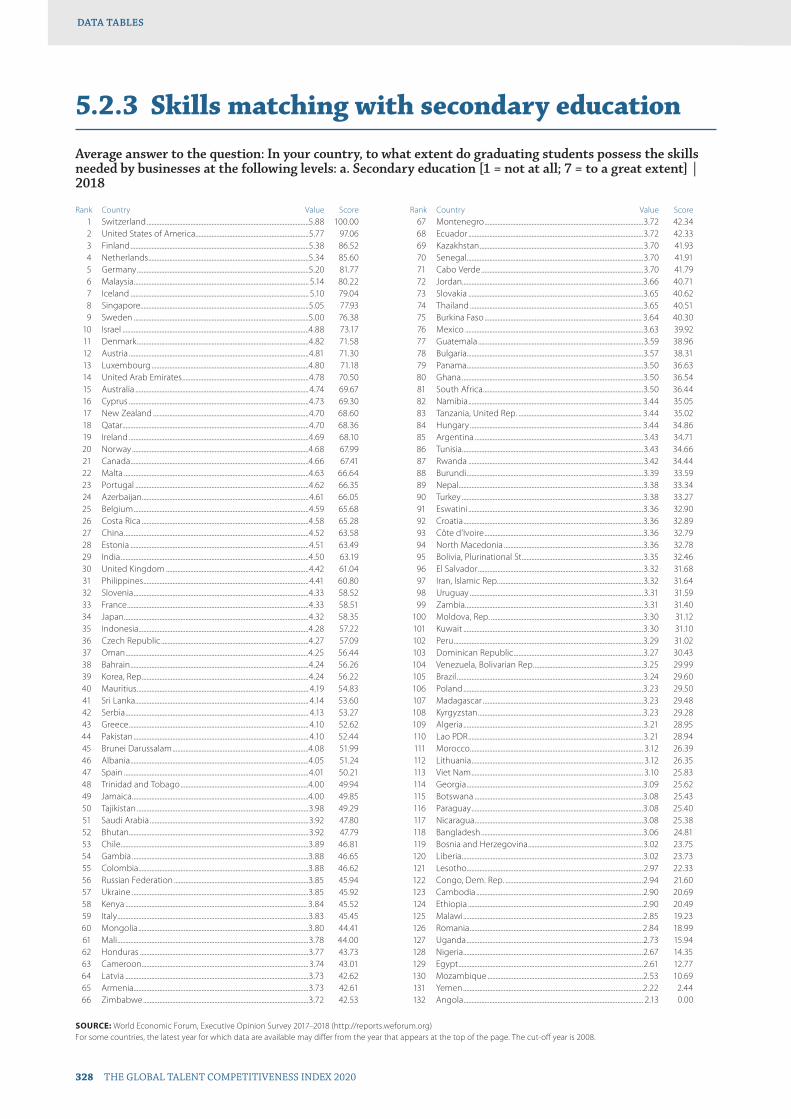
328 THE GLOBAL TALENT COMPETITIVENESS INDEX 2020
DATA TABLESDATA TABLES
5.2.3 Skills matching with secondary education
Average answer to the question: In your country, to what extent do graduating students possess the skills needed by businesses at the following levels: a. Secondary education [1 = not at all; 7 = to a great extent] | 2018
Rank Country Value Score 1 Switzerland ....................................................................................................5.88 100.00 2 United States of America......................................................................5.77 97.06 3 Finland ..............................................................................................................5.38 86.52 4 Netherlands ...................................................................................................5.34 85.60 5 Germany ..........................................................................................................5.20 81.77 6 Malaysia ............................................................................................................ 5.14 80.22 7 Iceland .............................................................................................................. 5.10 79.04 8 Singapore........................................................................................................5.05 77.93 9 Sweden ............................................................................................................5.00 76.38 10 Israel ...................................................................................................................4.88 73.17 11 Denmark ..........................................................................................................4.82 71.58 12 Austria ...............................................................................................................4.81 71.30 13 Luxembourg .................................................................................................4.80 71.18 14 United Arab Emirates ..............................................................................4.78 70.50 15 Australia ...........................................................................................................4.74 69.67 16 Cyprus ...............................................................................................................4.73 69.30 17 New Zealand ................................................................................................4.70 68.60 18 Qatar ...................................................................................................................4.70 68.36 19 Ireland ...............................................................................................................4.69 68.10 20 Norway .............................................................................................................4.68 67.99 21 Canada ..............................................................................................................4.66 67.41 22 Malta ..................................................................................................................4.63 66.64 23 Portugal ...........................................................................................................4.62 66.35 24 Azerbaijan .......................................................................................................4.61 66.05 25 Belgium ............................................................................................................4.59 65.68 26 Costa Rica .......................................................................................................4.58 65.28 27 China ..................................................................................................................4.52 63.58 28 Estonia ..............................................................................................................4.51 63.49 29 India ....................................................................................................................4.50 63.19 30 United Kingdom ........................................................................................4.42 61.04 31 Philippines ......................................................................................................4.41 60.80 32 Slovenia ............................................................................................................4.33 58.52 33 France ................................................................................................................4.33 58.51 34 Japan ..................................................................................................................4.32 58.35 35 Indonesia.........................................................................................................4.28 57.22 36 Czech Republic ...........................................................................................4.27 57.09 37 Oman .................................................................................................................4.25 56.44 38 Bahrain ..............................................................................................................4.24 56.26 39 Korea, Rep. ......................................................................................................4.24 56.22 40 Mauritius .......................................................................................................... 4.19 54.83 41 Sri Lanka ........................................................................................................... 4.14 53.60 42 Serbia ................................................................................................................. 4.13 53.27 43 Greece ............................................................................................................... 4.10 52.62 44 Pakistan ............................................................................................................ 4.10 52.44 45 Brunei Darussalam ....................................................................................4.08 51.99 46 Albania ..............................................................................................................4.05 51.24 47 Spain ..................................................................................................................4.01 50.21 48 Trinidad and Tobago ...............................................................................4.00 49.94 49 Jamaica .............................................................................................................4.00 49.85 50 Tajikistan ..........................................................................................................3.98 49.29 51 Saudi Arabia ..................................................................................................3.92 47.80 52 Bhutan...............................................................................................................3.92 47.79 53 Chile ....................................................................................................................3.89 46.81 54 Gambia .............................................................................................................3.88 46.65 55 Colombia .........................................................................................................3.88 46.62 56 Russian Federation ...................................................................................3.85 45.94 57 Ukraine .............................................................................................................3.85 45.92 58 Kenya ................................................................................................................ 3.84 45.52 59 Italy ......................................................................................................................3.83 45.45 60 Mongolia .........................................................................................................3.80 44.41 61 Mali ......................................................................................................................3.78 44.00 62 Honduras ........................................................................................................3.77 43.73 63 Cameroon .......................................................................................................3.74 43.01 64 Latvia .................................................................................................................3.73 42.62 65 Armenia............................................................................................................3.73 42.61 66 Zimbabwe ......................................................................................................3.72 42.53
Rank Country Value Score 67 Montenegro ..................................................................................................3.72 42.34 68 Ecuador ............................................................................................................3.72 42.33 69 Kazakhstan .....................................................................................................3.70 41.93 70 Senegal .............................................................................................................3.70 41.91 71 Cabo Verde ....................................................................................................3.70 41.79 72 Jordan................................................................................................................3.66 40.71 73 Slovakia ............................................................................................................3.65 40.62 74 Thailand ...........................................................................................................3.65 40.51 75 Burkina Faso ................................................................................................. 3.64 40.30 76 Mexico ..............................................................................................................3.63 39.92 77 Guatemala ......................................................................................................3.59 38.96 78 Bulgaria.............................................................................................................3.57 38.31 79 Panama .............................................................................................................3.50 36.63 80 Ghana ................................................................................................................3.50 36.54 81 South Africa ...................................................................................................3.50 36.44 82 Namibia ........................................................................................................... 3.44 35.05 83 Tanzania, United Rep. ............................................................................ 3.44 35.02 84 Hungary .......................................................................................................... 3.44 34.86 85 Argentina ........................................................................................................3.43 34.71 86 Tunisia................................................................................................................3.43 34.66 87 Rwanda ............................................................................................................3.42 34.44 88 Burundi .............................................................................................................3.39 33.59 89 Nepal ..................................................................................................................3.38 33.34 90 Turkey ................................................................................................................3.38 33.27 91 Eswatini ............................................................................................................3.36 32.90 92 Croatia ...............................................................................................................3.36 32.89 93 Côte d’Ivoire ..................................................................................................3.36 32.79 94 North Macedonia ......................................................................................3.36 32.78 95 Bolivia, Plurinational St. ..........................................................................3.35 32.46 96 El Salvador ......................................................................................................3.32 31.68 97 Iran, Islamic Rep. .........................................................................................3.32 31.64 98 Uruguay ...........................................................................................................3.31 31.59 99 Zambia ..............................................................................................................3.31 31.40 100 Moldova, Rep. ..............................................................................................3.30 31.12 101 Kuwait ...............................................................................................................3.30 31.10 102 Peru .....................................................................................................................3.29 31.02 103 Dominican Republic ................................................................................3.27 30.43 104 Venezuela, Bolivarian Rep. ...................................................................3.25 29.99 105 Brazil ...................................................................................................................3.24 29.60 106 Poland ...............................................................................................................3.23 29.50 107 Madagascar ...................................................................................................3.23 29.48 108 Kyrgyzstan ......................................................................................................3.23 29.28 109 Algeria ...............................................................................................................3.21 28.95 110 Lao PDR ............................................................................................................3.21 28.94 111 Morocco ........................................................................................................... 3.12 26.39 112 Lithuania .......................................................................................................... 3.12 26.35 113 Viet Nam .......................................................................................................... 3.10 25.83 114 Georgia .............................................................................................................3.09 25.62 115 Botswana ........................................................................................................3.08 25.43 116 Paraguay ..........................................................................................................3.08 25.40 117 Nicaragua ........................................................................................................3.08 25.38 118 Bangladesh ....................................................................................................3.06 24.81 119 Bosnia and Herzegovina .......................................................................3.02 23.75 120 Liberia ................................................................................................................3.02 23.73 121 Lesotho.............................................................................................................2.97 22.33 122 Congo, Dem. Rep. .....................................................................................2.94 21.60 123 Cambodia .......................................................................................................2.90 20.69 124 Ethiopia ............................................................................................................2.90 20.49 125 Malawi ...............................................................................................................2.85 19.23 126 Romania .......................................................................................................... 2.84 18.99 127 Uganda .............................................................................................................2.73 15.94 128 Nigeria ...............................................................................................................2.67 14.35 129 Egypt ..................................................................................................................2.61 12.77 130 Mozambique ................................................................................................2.53 10.69 131 Yemen ...............................................................................................................2.22 2.44 132 Angola............................................................................................................... 2.13 0.00
SOURCE: World Economic Forum, Executive Opinion Survey 2017–2018 (http://reports.weforum.org)For some countries, the latest year for which data are available may differ from the year that appears at the top of the page. The cut-off year is 2008.
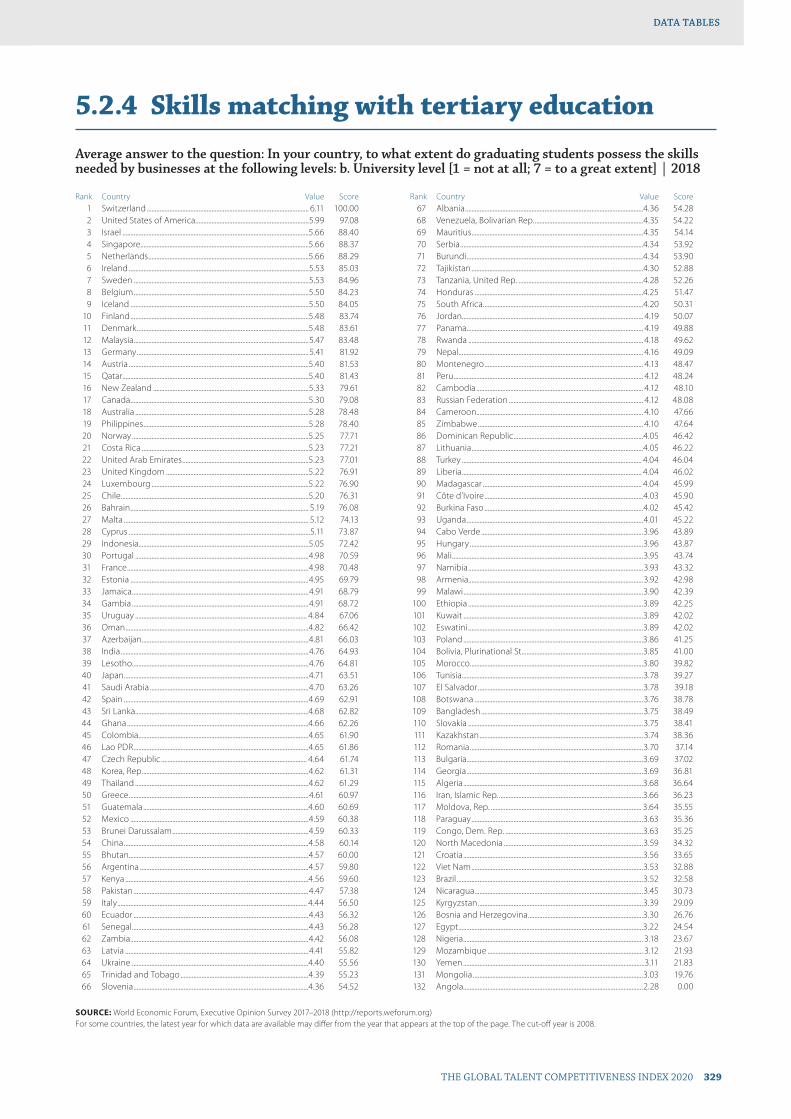
THE GLOBAL TALENT COMPETITIVENESS INDEX 2020 329
DATA TABLESDATA TABLES
5.2.4 Skills matching with tertiary education
Average answer to the question: In your country, to what extent do graduating students possess the skills needed by businesses at the following levels: b. University level [1 = not at all; 7 = to a great extent] | 2018
Rank Country Value Score 1 Switzerland .................................................................................................... 6.11 100.00 2 United States of America......................................................................5.99 97.08 3 Israel ...................................................................................................................5.66 88.40 4 Singapore........................................................................................................5.66 88.37 5 Netherlands ...................................................................................................5.66 88.29 6 Ireland ...............................................................................................................5.53 85.03 7 Sweden ............................................................................................................5.53 84.96 8 Belgium ............................................................................................................5.50 84.23 9 Iceland ..............................................................................................................5.50 84.05 10 Finland ..............................................................................................................5.48 83.74 11 Denmark ..........................................................................................................5.48 83.61 12 Malaysia ............................................................................................................5.47 83.48 13 Germany ..........................................................................................................5.41 81.92 14 Austria ...............................................................................................................5.40 81.53 15 Qatar ...................................................................................................................5.40 81.43 16 New Zealand ................................................................................................5.33 79.61 17 Canada ..............................................................................................................5.30 79.08 18 Australia ...........................................................................................................5.28 78.48 19 Philippines ......................................................................................................5.28 78.40 20 Norway .............................................................................................................5.25 77.71 21 Costa Rica .......................................................................................................5.23 77.21 22 United Arab Emirates ..............................................................................5.23 77.01 23 United Kingdom ........................................................................................5.22 76.91 24 Luxembourg .................................................................................................5.22 76.90 25 Chile ....................................................................................................................5.20 76.31 26 Bahrain .............................................................................................................. 5.19 76.08 27 Malta .................................................................................................................. 5.12 74.13 28 Cyprus ................................................................................................................5.11 73.87 29 Indonesia.........................................................................................................5.05 72.42 30 Portugal ...........................................................................................................4.98 70.59 31 France ................................................................................................................4.98 70.48 32 Estonia ..............................................................................................................4.95 69.79 33 Jamaica .............................................................................................................4.91 68.79 34 Gambia .............................................................................................................4.91 68.72 35 Uruguay .......................................................................................................... 4.84 67.06 36 Oman .................................................................................................................4.82 66.42 37 Azerbaijan .......................................................................................................4.81 66.03 38 India ....................................................................................................................4.76 64.93 39 Lesotho.............................................................................................................4.76 64.81 40 Japan ..................................................................................................................4.71 63.51 41 Saudi Arabia ..................................................................................................4.70 63.26 42 Spain ..................................................................................................................4.69 62.91 43 Sri Lanka ...........................................................................................................4.68 62.82 44 Ghana ................................................................................................................4.66 62.26 45 Colombia .........................................................................................................4.65 61.90 46 Lao PDR ............................................................................................................4.65 61.86 47 Czech Republic .......................................................................................... 4.64 61.74 48 Korea, Rep. ......................................................................................................4.62 61.31 49 Thailand ...........................................................................................................4.62 61.29 50 Greece ...............................................................................................................4.61 60.97 51 Guatemala ......................................................................................................4.60 60.69 52 Mexico ..............................................................................................................4.59 60.38 53 Brunei Darussalam ....................................................................................4.59 60.33 54 China ..................................................................................................................4.58 60.14 55 Bhutan...............................................................................................................4.57 60.00 56 Argentina ........................................................................................................4.57 59.80 57 Kenya .................................................................................................................4.56 59.60 58 Pakistan ............................................................................................................4.47 57.38 59 Italy ..................................................................................................................... 4.44 56.50 60 Ecuador ............................................................................................................4.43 56.32 61 Senegal .............................................................................................................4.43 56.28 62 Zambia ..............................................................................................................4.42 56.08 63 Latvia .................................................................................................................4.41 55.82 64 Ukraine .............................................................................................................4.40 55.56 65 Trinidad and Tobago ...............................................................................4.39 55.23 66 Slovenia ............................................................................................................4.36 54.52
Rank Country Value Score 67 Albania ..............................................................................................................4.36 54.28 68 Venezuela, Bolivarian Rep. ...................................................................4.35 54.22 69 Mauritius ..........................................................................................................4.35 54.14 70 Serbia .................................................................................................................4.34 53.92 71 Burundi .............................................................................................................4.34 53.90 72 Tajikistan ..........................................................................................................4.30 52.88 73 Tanzania, United Rep. .............................................................................4.28 52.26 74 Honduras ........................................................................................................4.25 51.47 75 South Africa ...................................................................................................4.20 50.31 76 Jordan................................................................................................................ 4.19 50.07 77 Panama ............................................................................................................. 4.19 49.88 78 Rwanda ............................................................................................................ 4.18 49.62 79 Nepal .................................................................................................................. 4.16 49.09 80 Montenegro .................................................................................................. 4.13 48.47 81 Peru ..................................................................................................................... 4.12 48.24 82 Cambodia ....................................................................................................... 4.12 48.10 83 Russian Federation ................................................................................... 4.12 48.08 84 Cameroon ....................................................................................................... 4.10 47.66 85 Zimbabwe ...................................................................................................... 4.10 47.64 86 Dominican Republic ................................................................................4.05 46.42 87 Lithuania ..........................................................................................................4.05 46.22 88 Turkey ............................................................................................................... 4.04 46.04 89 Liberia ............................................................................................................... 4.04 46.02 90 Madagascar .................................................................................................. 4.04 45.99 91 Côte d’Ivoire ..................................................................................................4.03 45.90 92 Burkina Faso ..................................................................................................4.02 45.42 93 Uganda .............................................................................................................4.01 45.22 94 Cabo Verde ....................................................................................................3.96 43.89 95 Hungary ...........................................................................................................3.96 43.87 96 Mali ......................................................................................................................3.95 43.74 97 Namibia ............................................................................................................3.93 43.32 98 Armenia............................................................................................................3.92 42.98 99 Malawi ...............................................................................................................3.90 42.39 100 Ethiopia ............................................................................................................3.89 42.25 101 Kuwait ...............................................................................................................3.89 42.02 102 Eswatini ............................................................................................................3.89 42.02 103 Poland ...............................................................................................................3.86 41.25 104 Bolivia, Plurinational St. ..........................................................................3.85 41.00 105 Morocco ...........................................................................................................3.80 39.82 106 Tunisia................................................................................................................3.78 39.27 107 El Salvador ......................................................................................................3.78 39.18 108 Botswana ........................................................................................................3.76 38.78 109 Bangladesh ....................................................................................................3.75 38.49 110 Slovakia ............................................................................................................3.75 38.41 111 Kazakhstan .....................................................................................................3.74 38.36 112 Romania ...........................................................................................................3.70 37.14 113 Bulgaria.............................................................................................................3.69 37.02 114 Georgia .............................................................................................................3.69 36.81 115 Algeria ...............................................................................................................3.68 36.64 116 Iran, Islamic Rep. .........................................................................................3.66 36.23 117 Moldova, Rep. ............................................................................................. 3.64 35.55 118 Paraguay ..........................................................................................................3.63 35.36 119 Congo, Dem. Rep. .....................................................................................3.63 35.25 120 North Macedonia ......................................................................................3.59 34.32 121 Croatia ...............................................................................................................3.56 33.65 122 Viet Nam ..........................................................................................................3.53 32.88 123 Brazil ...................................................................................................................3.52 32.58 124 Nicaragua ........................................................................................................3.45 30.73 125 Kyrgyzstan ......................................................................................................3.39 29.09 126 Bosnia and Herzegovina .......................................................................3.30 26.76 127 Egypt ..................................................................................................................3.22 24.54 128 Nigeria ............................................................................................................... 3.18 23.67 129 Mozambique ................................................................................................ 3.12 21.93 130 Yemen ................................................................................................................3.11 21.83 131 Mongolia .........................................................................................................3.03 19.76 132 Angola...............................................................................................................2.28 0.00
SOURCE: World Economic Forum, Executive Opinion Survey 2017–2018 (http://reports.weforum.org)For some countries, the latest year for which data are available may differ from the year that appears at the top of the page. The cut-off year is 2008.

DATA TABLES
THE GLOBAL TALENT COMPETITIVENESS INDEX 2020 331
DATA TABLES
Pillar 6Global Knowledge Skills
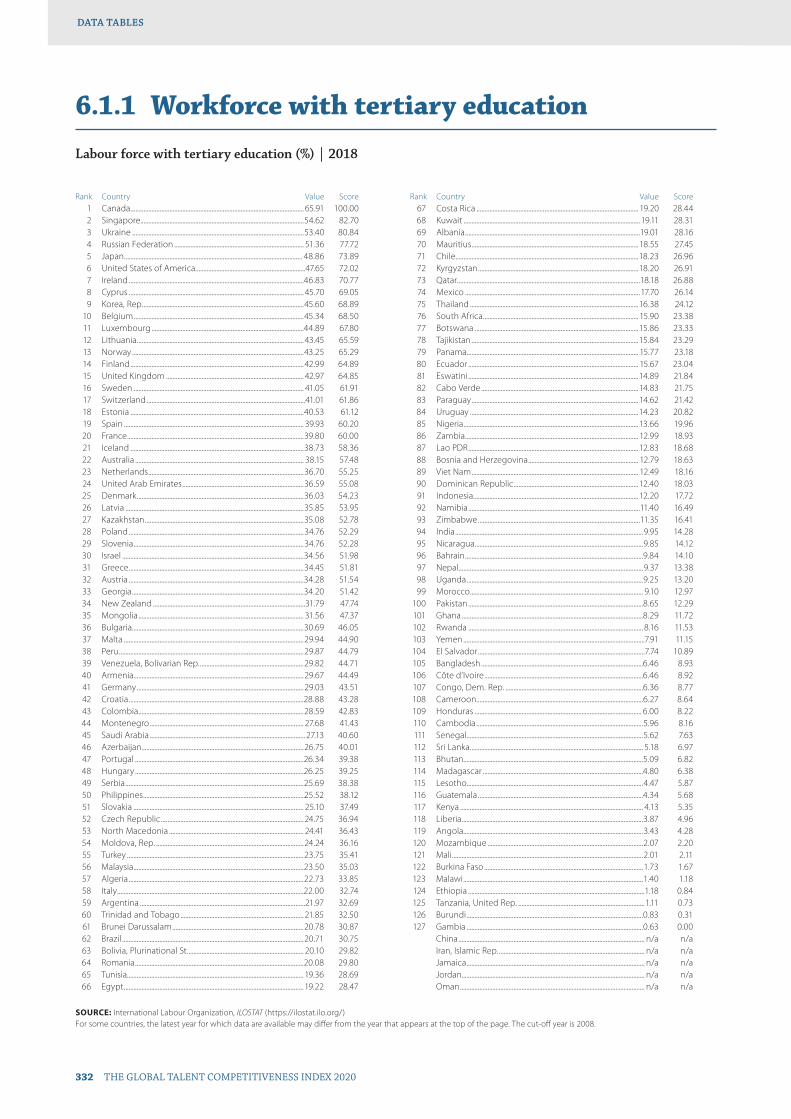
332 THE GLOBAL TALENT COMPETITIVENESS INDEX 2020
DATA TABLESDATA TABLES
6.1.1 Workforce with tertiary education
Labour force with tertiary education (%) | 2018
Rank Country Value Score 1 Canada ........................................................................................................... 65.91 100.00 2 Singapore.....................................................................................................54.62 82.70 3 Ukraine ..........................................................................................................53.40 80.84 4 Russian Federation ................................................................................ 51.36 77.72 5 Japan .............................................................................................................. 48.86 73.89 6 United States of America....................................................................47.65 72.02 7 Ireland ............................................................................................................46.83 70.77 8 Cyprus ............................................................................................................ 45.70 69.05 9 Korea, Rep. ...................................................................................................45.60 68.89 10 Belgium .........................................................................................................45.34 68.50 11 Luxembourg ..............................................................................................44.89 67.80 12 Lithuania ....................................................................................................... 43.45 65.59 13 Norway ..........................................................................................................43.25 65.29 14 Finland ...........................................................................................................42.99 64.89 15 United Kingdom ..................................................................................... 42.97 64.85 16 Sweden ......................................................................................................... 41.05 61.91 17 Switzerland ..................................................................................................41.01 61.86 18 Estonia ...........................................................................................................40.53 61.12 19 Spain ............................................................................................................... 39.93 60.20 20 France .............................................................................................................39.80 60.00 21 Iceland ...........................................................................................................38.73 58.36 22 Australia ........................................................................................................ 38.15 57.48 23 Netherlands ................................................................................................36.70 55.25 24 United Arab Emirates ...........................................................................36.59 55.08 25 Denmark .......................................................................................................36.03 54.23 26 Latvia ..............................................................................................................35.85 53.95 27 Kazakhstan ..................................................................................................35.08 52.78 28 Poland ............................................................................................................34.76 52.29 29 Slovenia .........................................................................................................34.76 52.28 30 Israel ................................................................................................................34.56 51.98 31 Greece ............................................................................................................34.45 51.81 32 Austria ............................................................................................................34.28 51.54 33 Georgia ..........................................................................................................34.20 51.42 34 New Zealand ..............................................................................................31.79 47.74 35 Mongolia ...................................................................................................... 31.56 47.37 36 Bulgaria..........................................................................................................30.69 46.05 37 Malta ...............................................................................................................29.94 44.90 38 Peru ..................................................................................................................29.87 44.79 39 Venezuela, Bolivarian Rep. ................................................................29.82 44.71 40 Armenia.........................................................................................................29.67 44.49 41 Germany .......................................................................................................29.03 43.51 42 Croatia ............................................................................................................28.88 43.28 43 Colombia ......................................................................................................28.59 42.83 44 Montenegro ............................................................................................... 27.68 41.43 45 Saudi Arabia ................................................................................................ 27.13 40.60 46 Azerbaijan ....................................................................................................26.75 40.01 47 Portugal ........................................................................................................26.34 39.38 48 Hungary ........................................................................................................26.25 39.25 49 Serbia ..............................................................................................................25.69 38.38 50 Philippines ...................................................................................................25.52 38.12 51 Slovakia ......................................................................................................... 25.10 37.49 52 Czech Republic ........................................................................................ 24.75 36.94 53 North Macedonia ................................................................................... 24.41 36.43 54 Moldova, Rep. ........................................................................................... 24.24 36.16 55 Turkey .............................................................................................................23.75 35.41 56 Malaysia .........................................................................................................23.50 35.03 57 Algeria ............................................................................................................22.73 33.85 58 Italy ...................................................................................................................22.00 32.74 59 Argentina ......................................................................................................21.97 32.69 60 Trinidad and Tobago ............................................................................ 21.85 32.50 61 Brunei Darussalam .................................................................................20.78 30.87 62 Brazil ................................................................................................................20.71 30.75 63 Bolivia, Plurinational St. ....................................................................... 20.10 29.82 64 Romania ........................................................................................................20.08 29.80 65 Tunisia............................................................................................................. 19.36 28.69 66 Egypt ............................................................................................................... 19.22 28.47
Rank Country Value Score 67 Costa Rica .................................................................................................... 19.20 28.44 68 Kuwait ............................................................................................................. 19.11 28.31 69 Albania ............................................................................................................19.01 28.16 70 Mauritius ....................................................................................................... 18.55 27.45 71 Chile .................................................................................................................18.23 26.96 72 Kyrgyzstan ...................................................................................................18.20 26.91 73 Qatar .................................................................................................................18.18 26.88 74 Mexico ............................................................................................................17.70 26.14 75 Thailand ........................................................................................................16.38 24.12 76 South Africa ................................................................................................ 15.90 23.38 77 Botswana .....................................................................................................15.86 23.33 78 Tajikistan .......................................................................................................15.84 23.29 79 Panama .......................................................................................................... 15.77 23.18 80 Ecuador ......................................................................................................... 15.67 23.04 81 Eswatini .........................................................................................................14.89 21.84 82 Cabo Verde .................................................................................................14.83 21.75 83 Paraguay ....................................................................................................... 14.62 21.42 84 Uruguay ........................................................................................................14.23 20.82 85 Nigeria ............................................................................................................13.66 19.96 86 Zambia ........................................................................................................... 12.99 18.93 87 Lao PDR ......................................................................................................... 12.83 18.68 88 Bosnia and Herzegovina .................................................................... 12.79 18.63 89 Viet Nam ....................................................................................................... 12.49 18.16 90 Dominican Republic .............................................................................12.40 18.03 91 Indonesia......................................................................................................12.20 17.72 92 Namibia ..........................................................................................................11.40 16.49 93 Zimbabwe ....................................................................................................11.35 16.41 94 India ....................................................................................................................9.95 14.28 95 Nicaragua ........................................................................................................9.85 14.12 96 Bahrain ..............................................................................................................9.84 14.10 97 Nepal ..................................................................................................................9.37 13.38 98 Uganda .............................................................................................................9.25 13.20 99 Morocco ........................................................................................................... 9.10 12.97 100 Pakistan ............................................................................................................8.65 12.29 101 Ghana ................................................................................................................8.29 11.72 102 Rwanda ............................................................................................................ 8.16 11.53 103 Yemen ................................................................................................................7.91 11.15 104 El Salvador .......................................................................................................7.74 10.89 105 Bangladesh ....................................................................................................6.46 8.93 106 Côte d’Ivoire ..................................................................................................6.46 8.92 107 Congo, Dem. Rep. .....................................................................................6.36 8.77 108 Cameroon .......................................................................................................6.27 8.64 109 Honduras ....................................................................................................... 6.00 8.22 110 Cambodia .......................................................................................................5.96 8.16 111 Senegal .............................................................................................................5.62 7.63 112 Sri Lanka ........................................................................................................... 5.18 6.97 113 Bhutan...............................................................................................................5.09 6.82 114 Madagascar ...................................................................................................4.80 6.38 115 Lesotho.............................................................................................................4.47 5.87 116 Guatemala ......................................................................................................4.34 5.68 117 Kenya ................................................................................................................. 4.13 5.35 118 Liberia ................................................................................................................3.87 4.96 119 Angola...............................................................................................................3.43 4.28 120 Mozambique ................................................................................................2.07 2.20 121 Mali ......................................................................................................................2.01 2.11 122 Burkina Faso ..................................................................................................1.73 1.67 123 Malawi ...............................................................................................................1.40 1.18 124 Ethiopia .............................................................................................................1.18 0.84 125 Tanzania, United Rep. ..............................................................................1.11 0.73 126 Burundi .............................................................................................................0.83 0.31 127 Gambia .............................................................................................................0.63 0.00 China ................................................................................................................... n/a n/a Iran, Islamic Rep. .......................................................................................... n/a n/a Jamaica .............................................................................................................. n/a n/a Jordan................................................................................................................. n/a n/a Oman .................................................................................................................. n/a n/a
SOURCE: International Labour Organization, ILOSTAT (https://ilostat.ilo.org/)For some countries, the latest year for which data are available may differ from the year that appears at the top of the page. The cut-off year is 2008.
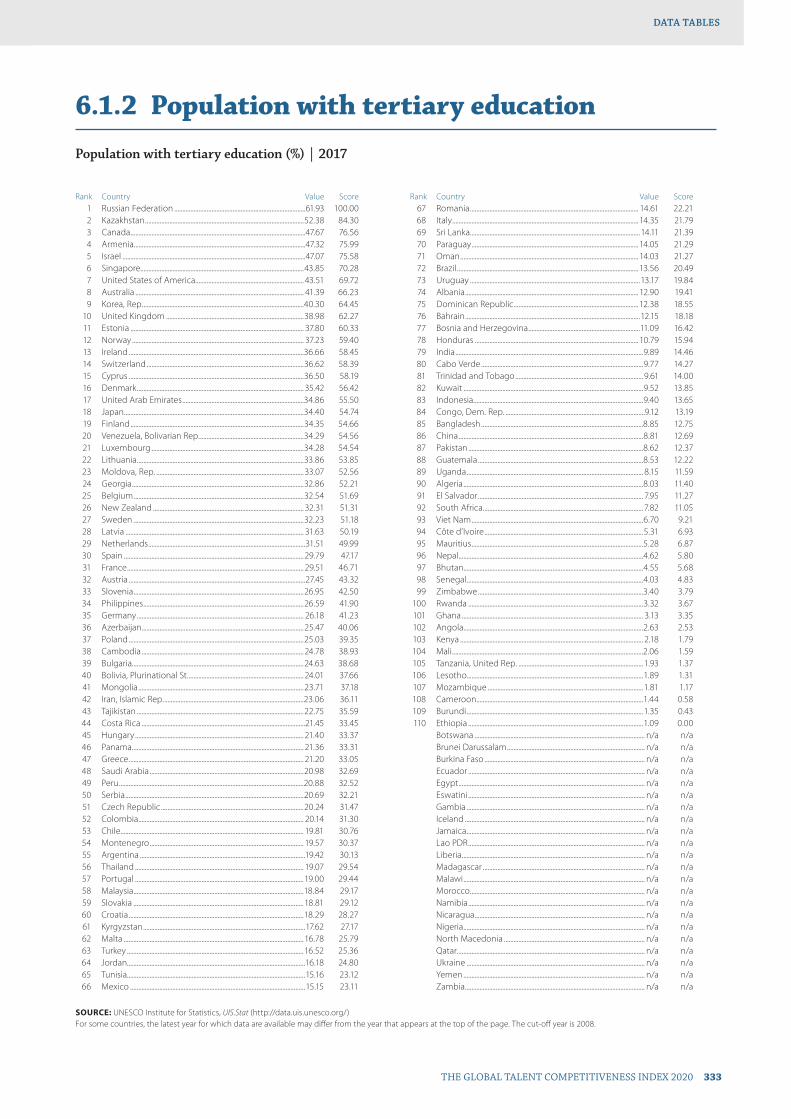
THE GLOBAL TALENT COMPETITIVENESS INDEX 2020 333
DATA TABLESDATA TABLES
6.1.2 Population with tertiary education
Population with tertiary education (%) | 2017
Rank Country Value Score 1 Russian Federation .................................................................................61.93 100.00 2 Kazakhstan ..................................................................................................52.38 84.30 3 Canada ............................................................................................................47.67 76.56 4 Armenia..........................................................................................................47.32 75.99 5 Israel .................................................................................................................47.07 75.58 6 Singapore.....................................................................................................43.85 70.28 7 United States of America................................................................... 43.51 69.72 8 Australia ........................................................................................................ 41.39 66.23 9 Korea, Rep. ...................................................................................................40.30 64.45 10 United Kingdom .....................................................................................38.98 62.27 11 Estonia ........................................................................................................... 37.80 60.33 12 Norway .......................................................................................................... 37.23 59.40 13 Ireland ............................................................................................................36.66 58.45 14 Switzerland .................................................................................................36.62 58.39 15 Cyprus ............................................................................................................36.50 58.19 16 Denmark ....................................................................................................... 35.42 56.42 17 United Arab Emirates ...........................................................................34.86 55.50 18 Japan ...............................................................................................................34.40 54.74 19 Finland ...........................................................................................................34.35 54.66 20 Venezuela, Bolivarian Rep. ................................................................34.29 54.56 21 Luxembourg ..............................................................................................34.28 54.54 22 Lithuania .......................................................................................................33.86 53.85 23 Moldova, Rep. ...........................................................................................33.07 52.56 24 Georgia ..........................................................................................................32.86 52.21 25 Belgium .........................................................................................................32.54 51.69 26 New Zealand ............................................................................................. 32.31 51.31 27 Sweden .........................................................................................................32.23 51.18 28 Latvia .............................................................................................................. 31.63 50.19 29 Netherlands .................................................................................................31.51 49.99 30 Spain ...............................................................................................................29.79 47.17 31 France ............................................................................................................. 29.51 46.71 32 Austria .............................................................................................................27.45 43.32 33 Slovenia .........................................................................................................26.95 42.50 34 Philippines ...................................................................................................26.59 41.90 35 Germany ....................................................................................................... 26.18 41.23 36 Azerbaijan ....................................................................................................25.47 40.06 37 Poland ............................................................................................................25.03 39.35 38 Cambodia .................................................................................................... 24.78 38.93 39 Bulgaria..........................................................................................................24.63 38.68 40 Bolivia, Plurinational St. ....................................................................... 24.01 37.66 41 Mongolia ......................................................................................................23.71 37.18 42 Iran, Islamic Rep. ......................................................................................23.06 36.11 43 Tajikistan .......................................................................................................22.75 35.59 44 Costa Rica .....................................................................................................21.45 33.45 45 Hungary ........................................................................................................ 21.40 33.37 46 Panama .......................................................................................................... 21.36 33.31 47 Greece ............................................................................................................ 21.20 33.05 48 Saudi Arabia ...............................................................................................20.98 32.69 49 Peru ..................................................................................................................20.88 32.52 50 Serbia ..............................................................................................................20.69 32.21 51 Czech Republic ........................................................................................20.24 31.47 52 Colombia ...................................................................................................... 20.14 31.30 53 Chile ................................................................................................................. 19.81 30.76 54 Montenegro ............................................................................................... 19.57 30.37 55 Argentina ......................................................................................................19.42 30.13 56 Thailand ........................................................................................................ 19.07 29.54 57 Portugal ........................................................................................................19.00 29.44 58 Malaysia .........................................................................................................18.84 29.17 59 Slovakia ......................................................................................................... 18.81 29.12 60 Croatia ............................................................................................................18.29 28.27 61 Kyrgyzstan ....................................................................................................17.62 27.17 62 Malta ............................................................................................................... 16.78 25.79 63 Turkey .............................................................................................................16.52 25.36 64 Jordan..............................................................................................................16.18 24.80 65 Tunisia..............................................................................................................15.16 23.12 66 Mexico ............................................................................................................15.15 23.11
Rank Country Value Score 67 Romania ........................................................................................................ 14.61 22.21 68 Italy ................................................................................................................... 14.35 21.79 69 Sri Lanka .........................................................................................................14.11 21.39 70 Paraguay .......................................................................................................14.05 21.29 71 Oman .............................................................................................................. 14.03 21.27 72 Brazil ................................................................................................................ 13.56 20.49 73 Uruguay .........................................................................................................13.17 19.84 74 Albania ........................................................................................................... 12.90 19.41 75 Dominican Republic ............................................................................. 12.38 18.55 76 Bahrain ............................................................................................................12.15 18.18 77 Bosnia and Herzegovina .....................................................................11.09 16.42 78 Honduras ..................................................................................................... 10.79 15.94 79 India ....................................................................................................................9.89 14.46 80 Cabo Verde ....................................................................................................9.77 14.27 81 Trinidad and Tobago ...............................................................................9.61 14.00 82 Kuwait ...............................................................................................................9.52 13.85 83 Indonesia.........................................................................................................9.40 13.65 84 Congo, Dem. Rep. ......................................................................................9.12 13.19 85 Bangladesh ....................................................................................................8.85 12.75 86 China ..................................................................................................................8.81 12.69 87 Pakistan ............................................................................................................8.62 12.37 88 Guatemala ......................................................................................................8.53 12.22 89 Uganda ............................................................................................................. 8.15 11.59 90 Algeria ...............................................................................................................8.03 11.40 91 El Salvador ...................................................................................................... 7.95 11.27 92 South Africa ................................................................................................... 7.82 11.05 93 Viet Nam ..........................................................................................................6.70 9.21 94 Côte d’Ivoire ..................................................................................................5.31 6.93 95 Mauritius ..........................................................................................................5.28 6.87 96 Nepal ..................................................................................................................4.62 5.80 97 Bhutan...............................................................................................................4.55 5.68 98 Senegal .............................................................................................................4.03 4.83 99 Zimbabwe ......................................................................................................3.40 3.79 100 Rwanda ............................................................................................................3.32 3.67 101 Ghana ................................................................................................................ 3.13 3.35 102 Angola...............................................................................................................2.63 2.53 103 Kenya ................................................................................................................. 2.18 1.79 104 Mali ......................................................................................................................2.06 1.59 105 Tanzania, United Rep. ............................................................................. 1.93 1.37 106 Lesotho.............................................................................................................1.89 1.31 107 Mozambique ................................................................................................1.81 1.17 108 Cameroon .......................................................................................................1.44 0.58 109 Burundi .............................................................................................................1.35 0.43 110 Ethiopia ............................................................................................................1.09 0.00 Botswana ......................................................................................................... n/a n/a Brunei Darussalam ..................................................................................... n/a n/a Burkina Faso ................................................................................................... n/a n/a Ecuador ............................................................................................................. n/a n/a Egypt ................................................................................................................... n/a n/a Eswatini ............................................................................................................. n/a n/a Gambia .............................................................................................................. n/a n/a Iceland ............................................................................................................... n/a n/a Jamaica .............................................................................................................. n/a n/a Lao PDR ............................................................................................................. n/a n/a Liberia ................................................................................................................. n/a n/a Madagascar .................................................................................................... n/a n/a Malawi ................................................................................................................ n/a n/a Morocco ............................................................................................................ n/a n/a Namibia ............................................................................................................. n/a n/a Nicaragua ......................................................................................................... n/a n/a Nigeria ................................................................................................................ n/a n/a North Macedonia ....................................................................................... n/a n/a Qatar .................................................................................................................... n/a n/a Ukraine .............................................................................................................. n/a n/a Yemen ................................................................................................................ n/a n/a Zambia ............................................................................................................... n/a n/a
SOURCE: UNESCO Institute for Statistics, UIS.Stat (http://data.uis.unesco.org/)For some countries, the latest year for which data are available may differ from the year that appears at the top of the page. The cut-off year is 2008.
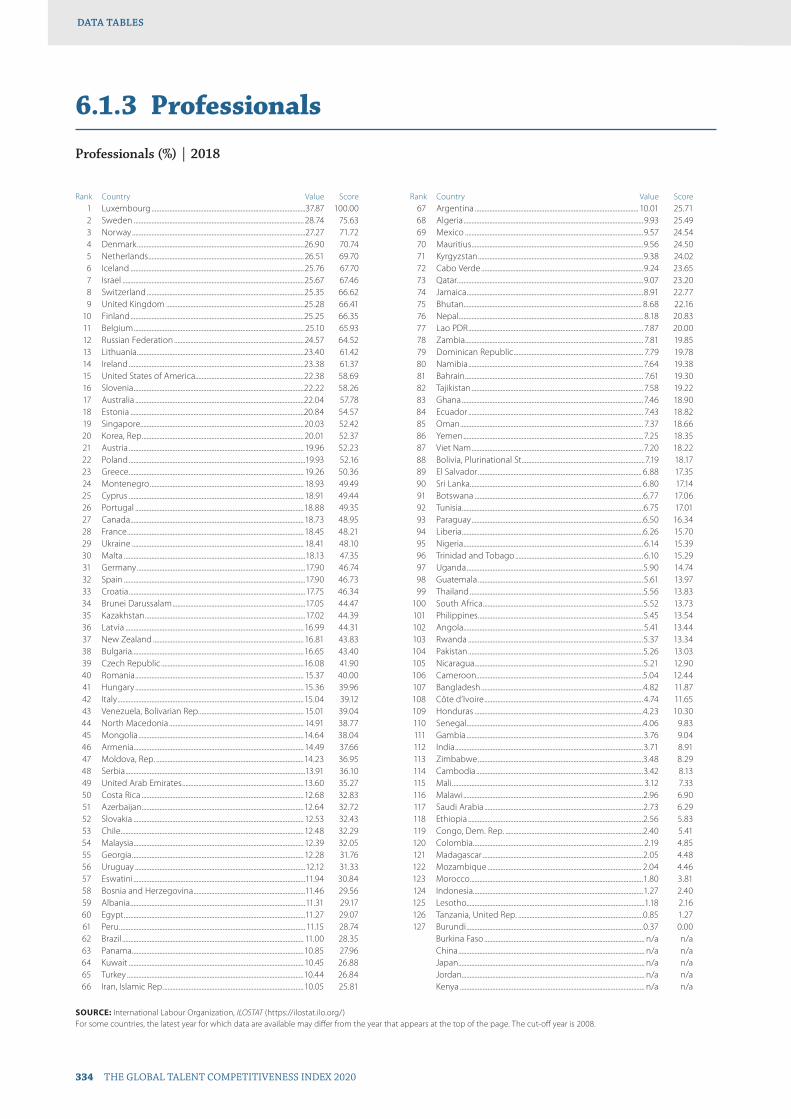
334 THE GLOBAL TALENT COMPETITIVENESS INDEX 2020
DATA TABLESDATA TABLES
6.1.3 Professionals
Professionals (%) | 2018
Rank Country Value Score 1 Luxembourg ...............................................................................................37.87 100.00 2 Sweden ......................................................................................................... 28.74 75.63 3 Norway ...........................................................................................................27.27 71.72 4 Denmark .......................................................................................................26.90 70.74 5 Netherlands ................................................................................................26.51 69.70 6 Iceland ...........................................................................................................25.76 67.70 7 Israel ................................................................................................................25.67 67.46 8 Switzerland .................................................................................................25.35 66.62 9 United Kingdom .....................................................................................25.28 66.41 10 Finland ...........................................................................................................25.25 66.35 11 Belgium ......................................................................................................... 25.10 65.93 12 Russian Federation ................................................................................24.57 64.52 13 Lithuania .......................................................................................................23.40 61.42 14 Ireland ............................................................................................................23.38 61.37 15 United States of America...................................................................22.38 58.69 16 Slovenia .........................................................................................................22.22 58.26 17 Australia ........................................................................................................22.04 57.78 18 Estonia ...........................................................................................................20.84 54.57 19 Singapore.....................................................................................................20.03 52.42 20 Korea, Rep. ...................................................................................................20.01 52.37 21 Austria ............................................................................................................ 19.96 52.23 22 Poland .............................................................................................................19.93 52.16 23 Greece ............................................................................................................ 19.26 50.36 24 Montenegro ............................................................................................... 18.93 49.49 25 Cyprus ............................................................................................................ 18.91 49.44 26 Portugal ........................................................................................................18.88 49.35 27 Canada ...........................................................................................................18.73 48.95 28 France ............................................................................................................. 18.45 48.21 29 Ukraine .......................................................................................................... 18.41 48.10 30 Malta ................................................................................................................18.13 47.35 31 Germany ........................................................................................................17.90 46.74 32 Spain ................................................................................................................17.90 46.73 33 Croatia .............................................................................................................17.75 46.34 34 Brunei Darussalam ..................................................................................17.05 44.47 35 Kazakhstan ...................................................................................................17.02 44.39 36 Latvia ..............................................................................................................16.99 44.31 37 New Zealand ............................................................................................. 16.81 43.83 38 Bulgaria..........................................................................................................16.65 43.40 39 Czech Republic ........................................................................................16.08 41.90 40 Romania ........................................................................................................ 15.37 40.00 41 Hungary ........................................................................................................ 15.36 39.96 42 Italy ...................................................................................................................15.04 39.12 43 Venezuela, Bolivarian Rep. ................................................................ 15.01 39.04 44 North Macedonia ................................................................................... 14.91 38.77 45 Mongolia ......................................................................................................14.64 38.04 46 Armenia......................................................................................................... 14.49 37.66 47 Moldova, Rep. ...........................................................................................14.23 36.95 48 Serbia ...............................................................................................................13.91 36.10 49 United Arab Emirates ...........................................................................13.60 35.27 50 Costa Rica ....................................................................................................12.68 32.83 51 Azerbaijan ....................................................................................................12.64 32.72 52 Slovakia ......................................................................................................... 12.53 32.43 53 Chile .................................................................................................................12.48 32.29 54 Malaysia ......................................................................................................... 12.39 32.05 55 Georgia .......................................................................................................... 12.28 31.76 56 Uruguay .........................................................................................................12.12 31.33 57 Eswatini ..........................................................................................................11.94 30.84 58 Bosnia and Herzegovina .....................................................................11.46 29.56 59 Albania ............................................................................................................11.31 29.17 60 Egypt ................................................................................................................11.27 29.07 61 Peru ................................................................................................................... 11.15 28.74 62 Brazil ................................................................................................................ 11.00 28.35 63 Panama ..........................................................................................................10.85 27.96 64 Kuwait ............................................................................................................ 10.45 26.88 65 Turkey .............................................................................................................10.44 26.84 66 Iran, Islamic Rep. ......................................................................................10.05 25.81
Rank Country Value Score 67 Argentina ..................................................................................................... 10.01 25.71 68 Algeria ...............................................................................................................9.93 25.49 69 Mexico ..............................................................................................................9.57 24.54 70 Mauritius ..........................................................................................................9.56 24.50 71 Kyrgyzstan ......................................................................................................9.38 24.02 72 Cabo Verde ....................................................................................................9.24 23.65 73 Qatar ...................................................................................................................9.07 23.20 74 Jamaica .............................................................................................................8.91 22.77 75 Bhutan.............................................................................................................. 8.68 22.16 76 Nepal .................................................................................................................. 8.18 20.83 77 Lao PDR ............................................................................................................ 7.87 20.00 78 Zambia .............................................................................................................. 7.81 19.85 79 Dominican Republic ................................................................................ 7.79 19.78 80 Namibia ............................................................................................................7.64 19.38 81 Bahrain .............................................................................................................. 7.61 19.30 82 Tajikistan .......................................................................................................... 7.58 19.22 83 Ghana ................................................................................................................7.46 18.90 84 Ecuador ............................................................................................................ 7.43 18.82 85 Oman ................................................................................................................. 7.37 18.66 86 Yemen ...............................................................................................................7.25 18.35 87 Viet Nam ..........................................................................................................7.20 18.22 88 Bolivia, Plurinational St. ...........................................................................7.19 18.17 89 El Salvador ..................................................................................................... 6.88 17.35 90 Sri Lanka .......................................................................................................... 6.80 17.14 91 Botswana ........................................................................................................6.77 17.06 92 Tunisia................................................................................................................6.75 17.01 93 Paraguay ..........................................................................................................6.50 16.34 94 Liberia ................................................................................................................6.26 15.70 95 Nigeria ............................................................................................................... 6.14 15.39 96 Trinidad and Tobago ............................................................................... 6.10 15.29 97 Uganda .............................................................................................................5.90 14.74 98 Guatemala ......................................................................................................5.61 13.97 99 Thailand ...........................................................................................................5.56 13.83 100 South Africa ...................................................................................................5.52 13.73 101 Philippines ......................................................................................................5.45 13.54 102 Angola...............................................................................................................5.41 13.44 103 Rwanda ............................................................................................................5.37 13.34 104 Pakistan ............................................................................................................5.26 13.03 105 Nicaragua ........................................................................................................5.21 12.90 106 Cameroon .......................................................................................................5.04 12.44 107 Bangladesh ....................................................................................................4.82 11.87 108 Côte d’Ivoire ..................................................................................................4.74 11.65 109 Honduras ........................................................................................................4.23 10.30 110 Senegal .............................................................................................................4.06 9.83 111 Gambia .............................................................................................................3.76 9.04 112 India ....................................................................................................................3.71 8.91 113 Zimbabwe ......................................................................................................3.48 8.29 114 Cambodia .......................................................................................................3.42 8.13 115 Mali ...................................................................................................................... 3.12 7.33 116 Malawi ...............................................................................................................2.96 6.90 117 Saudi Arabia ..................................................................................................2.73 6.29 118 Ethiopia ............................................................................................................2.56 5.83 119 Congo, Dem. Rep. .....................................................................................2.40 5.41 120 Colombia ......................................................................................................... 2.19 4.85 121 Madagascar ...................................................................................................2.05 4.48 122 Mozambique ............................................................................................... 2.04 4.46 123 Morocco ...........................................................................................................1.80 3.81 124 Indonesia.........................................................................................................1.27 2.40 125 Lesotho..............................................................................................................1.18 2.16 126 Tanzania, United Rep. .............................................................................0.85 1.27 127 Burundi .............................................................................................................0.37 0.00 Burkina Faso ................................................................................................... n/a n/a China ................................................................................................................... n/a n/a Japan ................................................................................................................... n/a n/a Jordan................................................................................................................. n/a n/a Kenya .................................................................................................................. n/a n/a
SOURCE: International Labour Organization, ILOSTAT (https://ilostat.ilo.org/)For some countries, the latest year for which data are available may differ from the year that appears at the top of the page. The cut-off year is 2008.

THE GLOBAL TALENT COMPETITIVENESS INDEX 2020 335
DATA TABLESDATA TABLES
6.1.4 Researchers
Full-time equivalent researchers (per million population) | 2017
Rank Country Value Score 1 Israel ......................................................................................................... 8,250.47 100.00 2 Denmark ................................................................................................ 7,896.85 95.71 3 Sweden ...................................................................................................7,592.50 92.01 4 Korea, Rep. ............................................................................................. 7,514.39 91.07 5 Singapore.............................................................................................. 6,729.68 81.54 6 Finland .....................................................................................................6,707.49 81.27 7 Iceland .....................................................................................................6,635.11 80.40 8 Norway ....................................................................................................6,477.76 78.49 9 Japan ........................................................................................................5,304.90 64.25 10 Switzerland ...........................................................................................5,257.36 63.68 11 Austria .......................................................................................................5,157.52 62.46 12 Germany .................................................................................................5,036.18 60.99 13 Netherlands ..........................................................................................5,007.06 60.64 14 Belgium ...................................................................................................4,941.98 59.85 15 Luxembourg ....................................................................................... 4,682.45 56.70 16 Australia ..................................................................................................4,539.49 54.96 17 Slovenia .................................................................................................. 4,467.84 54.09 18 France .......................................................................................................4,441.07 53.77 19 United Kingdom .............................................................................. 4,376.96 52.99 20 Portugal .................................................................................................4,290.82 51.95 21 Canada .....................................................................................................4,274.70 51.75 22 United States of America............................................................4,256.29 51.53 23 Ireland ...................................................................................................... 4,107.60 49.72 24 New Zealand ...................................................................................... 4,052.42 49.05 25 Czech Republic ................................................................................. 3,689.92 44.65 26 Estonia ....................................................................................................3,568.94 43.18 27 Greece ......................................................................................................3,152.84 38.13 28 Lithuania ................................................................................................. 3,013.19 36.44 29 Hungary ..................................................................................................2,924.02 35.36 30 Spain .........................................................................................................2,873.41 34.74 31 Russian Federation ..........................................................................2,851.71 34.48 32 Slovakia .................................................................................................. 2,794.96 33.79 33 Poland .....................................................................................................2,528.04 30.55 34 United Arab Emirates ....................................................................2,406.57 29.08 35 Malaysia ...................................................................................................2,357.92 28.49 36 Italy ............................................................................................................2,294.55 27.72 37 Bulgaria....................................................................................................2,130.55 25.73 38 Serbia ....................................................................................................... 2,079.20 25.11 39 Malta ........................................................................................................ 2,075.04 25.05 40 Tunisia.......................................................................................................1,964.97 23.72 41 Croatia .....................................................................................................1,865.44 22.51 42 Latvia ........................................................................................................1,785.94 21.55 43 Turkey .......................................................................................................1,385.76 16.69 44 Georgia ....................................................................................................1,339.71 16.13 45 China ........................................................................................................ 1,234.78 14.86 46 Argentina .............................................................................................. 1,232.60 14.83 47 Thailand ..................................................................................................1,210.35 14.56 48 Cyprus .......................................................................................................1,174.45 14.12 49 Morocco ................................................................................................. 1,068.96 12.84 50 Ukraine .......................................................................................................994.08 11.94 51 Romania ......................................................................................................890.17 10.67 52 Brazil ............................................................................................................. 881.38 10.57 53 Algeria ......................................................................................................... 820.75 9.83 54 Mauritius ....................................................................................................778.49 9.32 55 North Macedonia ................................................................................728.95 8.72 56 Moldova, Rep. ........................................................................................723.88 8.66 57 Montenegro ............................................................................................ 714.27 8.54 58 Viet Nam ....................................................................................................700.78 8.38 59 Iran, Islamic Rep. ....................................................................................671.02 8.02 60 Egypt ............................................................................................................669.39 8.00 61 Uruguay ..................................................................................................... 667.68 7.97 62 Kazakhstan ................................................................................................661.59 7.90 63 Qatar ............................................................................................................. 603.79 7.20 64 Jordan.......................................................................................................... 601.09 7.17 65 Senegal ....................................................................................................... 549.32 6.54 66 Costa Rica ..................................................................................................529.93 6.30
Rank Country Value Score 67 Chile ...............................................................................................................502.10 5.97 68 South Africa ............................................................................................. 493.72 5.86 69 Kuwait ..........................................................................................................491.81 5.84 70 Bosnia and Herzegovina .................................................................463.90 5.50 71 Ecuador ......................................................................................................400.71 4.73 72 Bahrain ........................................................................................................368.90 4.35 73 Pakistan .......................................................................................................354.13 4.17 74 Venezuela, Bolivarian Rep. ............................................................. 283.93 3.32 75 Mexico .........................................................................................................244.18 2.84 76 Oman ........................................................................................................... 243.96 2.83 77 Kenya ...........................................................................................................225.03 2.60 78 India ...............................................................................................................216.18 2.50 79 Indonesia....................................................................................................215.73 2.49 80 Philippines .................................................................................................187.66 2.15 81 Botswana ...................................................................................................179.47 2.05 82 Bolivia, Plurinational St. .....................................................................165.95 1.89 83 Albania .........................................................................................................156.10 1.77 84 Namibia .......................................................................................................143.32 1.61 85 Paraguay .................................................................................................... 122.05 1.35 86 Eswatini ........................................................................................................119.14 1.32 87 Sri Lanka ..................................................................................................... 106.98 1.17 88 Zimbabwe ...................................................................................................88.72 0.95 89 Colombia ......................................................................................................88.48 0.95 90 El Salvador ...................................................................................................65.88 0.67 91 Cabo Verde ................................................................................................. 49.21 0.47 92 Malawi ............................................................................................................48.27 0.46 93 Burkina Faso ................................................................................................47.58 0.45 94 Angola............................................................................................................ 47.48 0.45 95 Ethiopia .........................................................................................................44.97 0.42 96 Mozambique ............................................................................................. 41.48 0.38 97 Zambia ...........................................................................................................40.97 0.37 98 Panama ..........................................................................................................39.08 0.35 99 Ghana .............................................................................................................38.37 0.34 100 Gambia ..........................................................................................................33.56 0.28 101 Mali ...................................................................................................................32.81 0.27 102 Madagascar ................................................................................................30.62 0.24 103 Cambodia ....................................................................................................30.37 0.24 104 Uganda ..........................................................................................................26.47 0.19 105 Lesotho..........................................................................................................22.83 0.15 106 Honduras .....................................................................................................22.77 0.15 107 Guatemala ....................................................................................................22.15 0.14 108 Tanzania, United Rep. ..........................................................................18.34 0.09 109 Rwanda ......................................................................................................... 12.35 0.02 110 Congo, Dem. Rep. ..................................................................................10.57 0.00 Armenia............................................................................................................. n/a n/a Azerbaijan ........................................................................................................ n/a n/a Bangladesh ..................................................................................................... n/a n/a Bhutan................................................................................................................ n/a n/a Brunei Darussalam ..................................................................................... n/a n/a Burundi .............................................................................................................. n/a n/a Cameroon ........................................................................................................ n/a n/a Côte d’Ivoire ................................................................................................... n/a n/a Dominican Republic ................................................................................. n/a n/a Jamaica .............................................................................................................. n/a n/a Kyrgyzstan ....................................................................................................... n/a n/a Lao PDR ............................................................................................................. n/a n/a Liberia ................................................................................................................. n/a n/a Mongolia .......................................................................................................... n/a n/a Nepal ................................................................................................................... n/a n/a Nicaragua ......................................................................................................... n/a n/a Nigeria ................................................................................................................ n/a n/a Peru ...................................................................................................................... n/a n/a Saudi Arabia ................................................................................................... n/a n/a Tajikistan ........................................................................................................... n/a n/a Trinidad and Tobago ................................................................................ n/a n/a Yemen ................................................................................................................ n/a n/a
SOURCE: UNESCO Institute for Statistics, UIS.Stat (http://data.uis.unesco.org/)For some countries, the latest year for which data are available may differ from the year that appears at the top of the page. The cut-off year is 2008.

336 THE GLOBAL TALENT COMPETITIVENESS INDEX 2020
DATA TABLESDATA TABLES
6.1.5 Senior officials and managers
Legislators, senior officials, and managers (%) | 2018
Rank Country Value Score 1 Philippines ................................................................................................... 16.01 100.00 1 Saudi Arabia ................................................................................................28.13 100.00 3 Singapore..................................................................................................... 15.33 95.68 4 New Zealand ............................................................................................. 13.67 85.10 5 Estonia ...........................................................................................................12.46 77.36 6 Egypt ................................................................................................................11.79 73.10 7 United Kingdom ......................................................................................11.31 70.05 8 Australia ......................................................................................................... 11.13 68.91 9 Lao PDR ......................................................................................................... 10.78 66.66 10 United States of America................................................................... 10.76 66.54 11 Trinidad and Tobago ............................................................................10.44 64.49 12 Malta ...............................................................................................................10.33 63.83 13 Iceland ...........................................................................................................10.27 63.40 14 Latvia .................................................................................................................9.96 61.44 15 Israel ...................................................................................................................9.89 61.00 16 Brunei Darussalam ....................................................................................9.83 60.63 17 Switzerland ....................................................................................................9.44 58.11 18 Lithuania .......................................................................................................... 9.18 56.46 19 South Africa .................................................................................................. 8.88 54.54 20 Norway ............................................................................................................ 8.80 54.04 21 United Arab Emirates ............................................................................. 8.80 54.03 22 Ireland ...............................................................................................................8.65 53.10 23 Canada .............................................................................................................. 8.16 49.98 24 Bahrain .............................................................................................................. 8.10 49.59 25 Ukraine .............................................................................................................8.07 49.40 26 Belgium ............................................................................................................ 7.95 48.66 27 Slovenia ............................................................................................................7.29 44.41 28 France ................................................................................................................7.25 44.15 29 India .....................................................................................................................7.16 43.62 30 Indonesia..........................................................................................................7.16 43.59 31 Jamaica ..............................................................................................................7.12 43.35 32 Sri Lanka ...........................................................................................................6.83 41.50 33 Tunisia................................................................................................................6.62 40.16 34 Russian Federation ...................................................................................6.57 39.84 35 Mongolia .........................................................................................................6.55 39.74 36 Moldova, Rep. ..............................................................................................6.35 38.41 37 Poland ...............................................................................................................6.21 37.53 38 Sweden ............................................................................................................ 6.18 37.33 39 Armenia............................................................................................................6.09 36.77 40 Colombia .........................................................................................................5.75 34.61 41 Portugal ...........................................................................................................5.58 33.51 42 Georgia .............................................................................................................5.57 33.44 43 Bulgaria.............................................................................................................5.53 33.20 44 Panama .............................................................................................................5.44 32.66 45 Montenegro ..................................................................................................5.40 32.39 46 Kazakhstan .....................................................................................................5.23 31.30 47 Turkey ................................................................................................................ 5.17 30.94 48 Netherlands ................................................................................................... 5.16 30.83 49 Namibia ............................................................................................................4.98 29.73 50 Argentina ........................................................................................................4.97 29.64 51 Croatia ...............................................................................................................4.91 29.25 52 Kuwait ...............................................................................................................4.71 27.98 53 Germany ..........................................................................................................4.71 27.98 54 Austria ...............................................................................................................4.66 27.66 55 Malaysia ............................................................................................................4.65 27.60 56 Czech Republic ...........................................................................................4.63 27.46 57 Brazil ...................................................................................................................4.47 26.49 58 Hungary ...........................................................................................................4.42 26.13 59 Slovakia ............................................................................................................4.39 25.92 60 Paraguay ..........................................................................................................4.29 25.29 61 Venezuela, Bolivarian Rep. ................................................................... 4.16 24.48 62 Spain .................................................................................................................. 4.14 24.33 63 Cyprus ...............................................................................................................3.91 22.89 64 North Macedonia ......................................................................................3.89 22.78 65 Mauritius ..........................................................................................................3.77 21.96 66 Italy ......................................................................................................................3.72 21.67
Rank Country Value Score 67 Thailand ...........................................................................................................3.68 21.42 68 Oman .................................................................................................................3.68 21.42 69 Botswana ........................................................................................................3.35 19.31 70 Finland ..............................................................................................................3.33 19.21 71 Mexico ..............................................................................................................3.20 18.33 72 Algeria ............................................................................................................... 3.17 18.17 73 Cabo Verde .................................................................................................... 3.14 17.98 74 Iran, Islamic Rep. .........................................................................................2.97 16.89 75 Honduras ........................................................................................................2.95 16.77 76 Cameroon .......................................................................................................2.94 16.73 77 Serbia .................................................................................................................2.88 16.31 78 Greece ...............................................................................................................2.85 16.13 79 Tajikistan ..........................................................................................................2.72 15.28 80 Denmark ..........................................................................................................2.68 15.04 81 Uruguay ...........................................................................................................2.51 13.99 82 Bosnia and Herzegovina .......................................................................2.47 13.68 83 Bolivia, Plurinational St. ..........................................................................2.43 13.45 84 Pakistan ............................................................................................................2.36 13.01 85 Chile ....................................................................................................................2.28 12.52 86 Qatar ...................................................................................................................2.24 12.24 87 Dominican Republic ................................................................................ 2.15 11.69 88 Ghana ................................................................................................................ 2.15 11.67 89 Luxembourg ................................................................................................. 2.13 11.51 90 Bhutan...............................................................................................................2.02 10.84 91 Japan ..................................................................................................................2.01 10.77 92 Zambia ..............................................................................................................2.00 10.72 93 Nicaragua ........................................................................................................1.99 10.67 94 Eswatini ............................................................................................................1.99 10.64 95 Costa Rica ....................................................................................................... 1.93 10.27 96 Angola...............................................................................................................1.90 10.07 97 Romania ...........................................................................................................1.89 10.00 98 El Salvador ......................................................................................................1.73 8.96 99 Bangladesh ....................................................................................................1.64 8.40 100 Yemen ...............................................................................................................1.63 8.36 101 Kyrgyzstan ...................................................................................................... 1.61 8.22 102 Korea, Rep. ......................................................................................................1.56 7.90 103 Rwanda ............................................................................................................1.40 6.88 104 Lesotho.............................................................................................................1.38 6.76 105 Congo, Dem. Rep. .....................................................................................1.34 6.50 106 Uganda .............................................................................................................1.27 6.06 107 Liberia ................................................................................................................1.25 5.93 108 Azerbaijan .......................................................................................................1.25 5.93 109 Côte d’Ivoire ..................................................................................................1.21 5.66 110 Ecuador ............................................................................................................1.20 5.63 111 Albania ..............................................................................................................1.20 5.61 112 Nepal ...................................................................................................................1.19 5.57 113 Nigeria ................................................................................................................1.16 5.38 114 Viet Nam ...........................................................................................................1.14 5.26 115 Mali .......................................................................................................................1.13 5.16 116 Zimbabwe ......................................................................................................1.05 4.65 117 Cambodia .......................................................................................................0.91 3.73 118 Senegal ............................................................................................................ 0.86 3.45 119 Guatemala ......................................................................................................0.80 3.08 120 Madagascar ...................................................................................................0.75 2.77 121 Peru .....................................................................................................................0.72 2.53 122 Morocco ...........................................................................................................0.70 2.42 123 Ethiopia ............................................................................................................0.65 2.11 124 Malawi ...............................................................................................................0.55 1.49 125 Gambia .............................................................................................................0.46 0.86 126 Tanzania, United Rep. .............................................................................0.45 0.84 127 Mozambique ................................................................................................0.34 0.16 128 Burundi .............................................................................................................0.32 0.00 Burkina Faso ................................................................................................... n/a n/a China ................................................................................................................... n/a n/a Jordan................................................................................................................. n/a n/a Kenya .................................................................................................................. n/a n/a
SOURCE: International Labour Organization, ILOSTAT (https://ilostat.ilo.org/)For some countries, the latest year for which data are available may differ from the year that appears at the top of the page. The cut-off year is 2008.
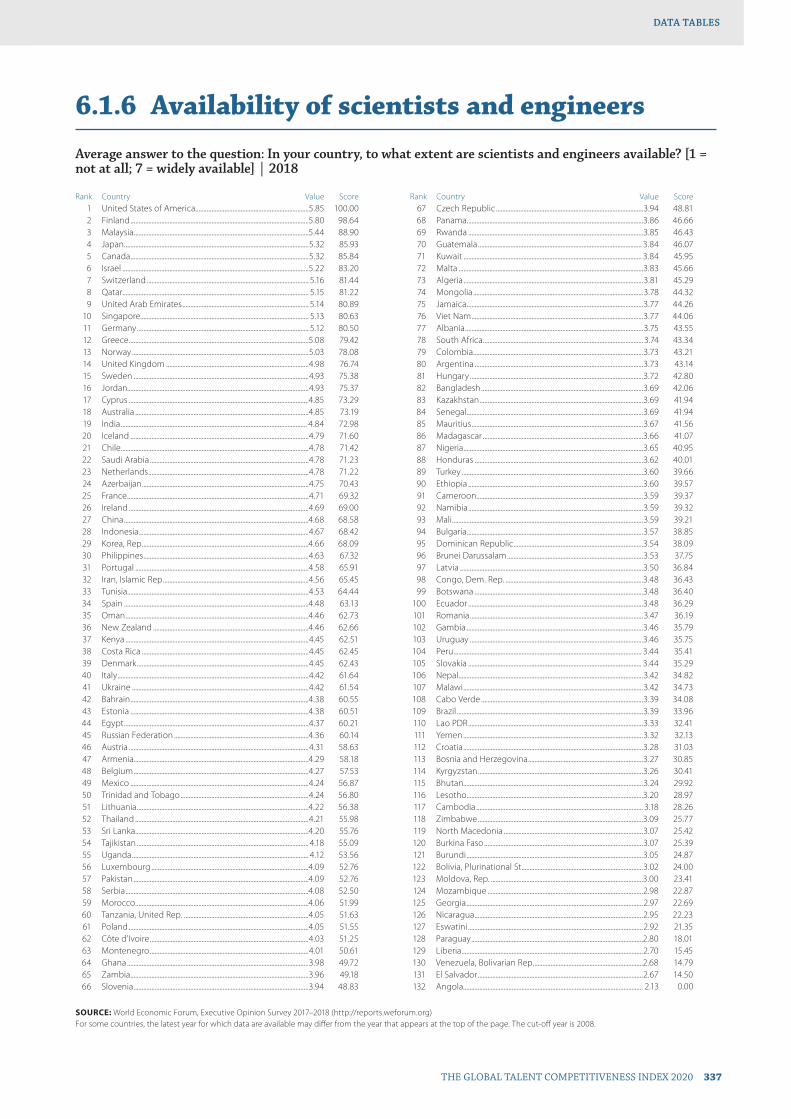
THE GLOBAL TALENT COMPETITIVENESS INDEX 2020 337
DATA TABLESDATA TABLES
6.1.6 Availability of scientists and engineers
Average answer to the question: In your country, to what extent are scientists and engineers available? [1 = not at all; 7 = widely available] | 2018
Rank Country Value Score 1 United States of America......................................................................5.85 100.00 2 Finland ..............................................................................................................5.80 98.64 3 Malaysia ............................................................................................................5.44 88.90 4 Japan ..................................................................................................................5.32 85.93 5 Canada ..............................................................................................................5.32 85.84 6 Israel ...................................................................................................................5.22 83.20 7 Switzerland .................................................................................................... 5.16 81.44 8 Qatar ................................................................................................................... 5.15 81.22 9 United Arab Emirates .............................................................................. 5.14 80.89 10 Singapore........................................................................................................ 5.13 80.63 11 Germany .......................................................................................................... 5.12 80.50 12 Greece ...............................................................................................................5.08 79.42 13 Norway .............................................................................................................5.03 78.08 14 United Kingdom ........................................................................................4.98 76.74 15 Sweden ............................................................................................................4.93 75.38 16 Jordan................................................................................................................4.93 75.37 17 Cyprus ...............................................................................................................4.85 73.29 18 Australia ...........................................................................................................4.85 73.19 19 India ................................................................................................................... 4.84 72.98 20 Iceland ..............................................................................................................4.79 71.60 21 Chile ....................................................................................................................4.78 71.42 22 Saudi Arabia ..................................................................................................4.78 71.23 23 Netherlands ...................................................................................................4.78 71.22 24 Azerbaijan .......................................................................................................4.75 70.43 25 France ................................................................................................................4.71 69.32 26 Ireland ...............................................................................................................4.69 69.00 27 China ..................................................................................................................4.68 68.58 28 Indonesia.........................................................................................................4.67 68.42 29 Korea, Rep. ......................................................................................................4.66 68.09 30 Philippines ......................................................................................................4.63 67.32 31 Portugal ...........................................................................................................4.58 65.91 32 Iran, Islamic Rep. .........................................................................................4.56 65.45 33 Tunisia................................................................................................................4.53 64.44 34 Spain ..................................................................................................................4.48 63.13 35 Oman .................................................................................................................4.46 62.73 36 New Zealand ................................................................................................4.46 62.66 37 Kenya .................................................................................................................4.45 62.51 38 Costa Rica .......................................................................................................4.45 62.45 39 Denmark ..........................................................................................................4.45 62.43 40 Italy ......................................................................................................................4.42 61.64 41 Ukraine .............................................................................................................4.42 61.54 42 Bahrain ..............................................................................................................4.38 60.55 43 Estonia ..............................................................................................................4.38 60.51 44 Egypt ..................................................................................................................4.37 60.21 45 Russian Federation ...................................................................................4.36 60.14 46 Austria ...............................................................................................................4.31 58.63 47 Armenia............................................................................................................4.29 58.18 48 Belgium ............................................................................................................4.27 57.53 49 Mexico ..............................................................................................................4.24 56.87 50 Trinidad and Tobago ...............................................................................4.24 56.80 51 Lithuania ..........................................................................................................4.22 56.38 52 Thailand ...........................................................................................................4.21 55.98 53 Sri Lanka ...........................................................................................................4.20 55.76 54 Tajikistan .......................................................................................................... 4.18 55.09 55 Uganda ............................................................................................................. 4.12 53.56 56 Luxembourg .................................................................................................4.09 52.76 57 Pakistan ............................................................................................................4.09 52.76 58 Serbia .................................................................................................................4.08 52.50 59 Morocco ...........................................................................................................4.06 51.99 60 Tanzania, United Rep. .............................................................................4.05 51.63 61 Poland ...............................................................................................................4.05 51.55 62 Côte d’Ivoire ..................................................................................................4.03 51.25 63 Montenegro ..................................................................................................4.01 50.61 64 Ghana ................................................................................................................3.98 49.72 65 Zambia ..............................................................................................................3.96 49.18 66 Slovenia ............................................................................................................3.94 48.83
Rank Country Value Score 67 Czech Republic ...........................................................................................3.94 48.81 68 Panama .............................................................................................................3.86 46.66 69 Rwanda ............................................................................................................3.85 46.43 70 Guatemala ..................................................................................................... 3.84 46.07 71 Kuwait .............................................................................................................. 3.84 45.95 72 Malta ..................................................................................................................3.83 45.66 73 Algeria ...............................................................................................................3.81 45.29 74 Mongolia .........................................................................................................3.78 44.32 75 Jamaica .............................................................................................................3.77 44.26 76 Viet Nam ..........................................................................................................3.77 44.06 77 Albania ..............................................................................................................3.75 43.55 78 South Africa ...................................................................................................3.74 43.34 79 Colombia .........................................................................................................3.73 43.21 80 Argentina ........................................................................................................3.73 43.14 81 Hungary ...........................................................................................................3.72 42.80 82 Bangladesh ....................................................................................................3.69 42.06 83 Kazakhstan .....................................................................................................3.69 41.94 84 Senegal .............................................................................................................3.69 41.94 85 Mauritius ..........................................................................................................3.67 41.56 86 Madagascar ...................................................................................................3.66 41.07 87 Nigeria ...............................................................................................................3.65 40.95 88 Honduras ........................................................................................................3.62 40.01 89 Turkey ................................................................................................................3.60 39.66 90 Ethiopia ............................................................................................................3.60 39.57 91 Cameroon .......................................................................................................3.59 39.37 92 Namibia ............................................................................................................3.59 39.32 93 Mali ......................................................................................................................3.59 39.21 94 Bulgaria.............................................................................................................3.57 38.85 95 Dominican Republic ................................................................................3.54 38.09 96 Brunei Darussalam ....................................................................................3.53 37.75 97 Latvia .................................................................................................................3.50 36.84 98 Congo, Dem. Rep. .....................................................................................3.48 36.43 99 Botswana ........................................................................................................3.48 36.40 100 Ecuador ............................................................................................................3.48 36.29 101 Romania ...........................................................................................................3.47 36.19 102 Gambia .............................................................................................................3.46 35.79 103 Uruguay ...........................................................................................................3.46 35.75 104 Peru .................................................................................................................... 3.44 35.41 105 Slovakia ........................................................................................................... 3.44 35.29 106 Nepal ..................................................................................................................3.42 34.82 107 Malawi ...............................................................................................................3.42 34.73 108 Cabo Verde ....................................................................................................3.39 34.08 109 Brazil ...................................................................................................................3.39 33.96 110 Lao PDR ............................................................................................................3.33 32.41 111 Yemen ...............................................................................................................3.32 32.13 112 Croatia ...............................................................................................................3.28 31.03 113 Bosnia and Herzegovina .......................................................................3.27 30.85 114 Kyrgyzstan ......................................................................................................3.26 30.41 115 Bhutan...............................................................................................................3.24 29.92 116 Lesotho.............................................................................................................3.20 28.97 117 Cambodia ....................................................................................................... 3.18 28.26 118 Zimbabwe ......................................................................................................3.09 25.77 119 North Macedonia ......................................................................................3.07 25.42 120 Burkina Faso ..................................................................................................3.07 25.39 121 Burundi .............................................................................................................3.05 24.87 122 Bolivia, Plurinational St. ..........................................................................3.02 24.00 123 Moldova, Rep. ..............................................................................................3.00 23.41 124 Mozambique ................................................................................................2.98 22.87 125 Georgia .............................................................................................................2.97 22.69 126 Nicaragua ........................................................................................................2.95 22.23 127 Eswatini ............................................................................................................2.92 21.35 128 Paraguay ..........................................................................................................2.80 18.01 129 Liberia ................................................................................................................2.70 15.45 130 Venezuela, Bolivarian Rep. ...................................................................2.68 14.79 131 El Salvador ......................................................................................................2.67 14.50 132 Angola............................................................................................................... 2.13 0.00
SOURCE: World Economic Forum, Executive Opinion Survey 2017–2018 (http://reports.weforum.org)For some countries, the latest year for which data are available may differ from the year that appears at the top of the page. The cut-off year is 2008.
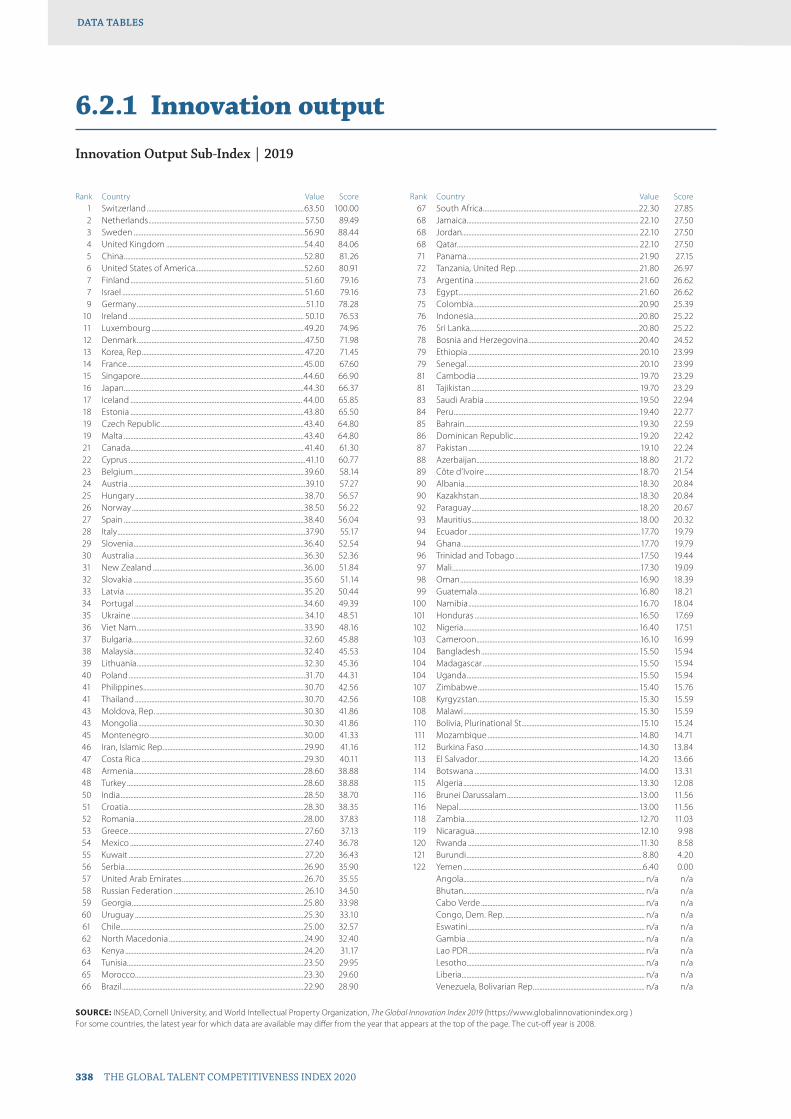
338 THE GLOBAL TALENT COMPETITIVENESS INDEX 2020
DATA TABLESDATA TABLES
6.2.1 Innovation output
Innovation Output Sub-Index | 2019
Rank Country Value Score 1 Switzerland .................................................................................................63.50 100.00 2 Netherlands ................................................................................................ 57.50 89.49 3 Sweden .........................................................................................................56.90 88.44 4 United Kingdom .....................................................................................54.40 84.06 5 China ...............................................................................................................52.80 81.26 6 United States of America...................................................................52.60 80.91 7 Finland ........................................................................................................... 51.60 79.16 7 Israel ................................................................................................................ 51.60 79.16 9 Germany ........................................................................................................51.10 78.28 10 Ireland ............................................................................................................ 50.10 76.53 11 Luxembourg ..............................................................................................49.20 74.96 12 Denmark ........................................................................................................47.50 71.98 13 Korea, Rep. ................................................................................................... 47.20 71.45 14 France .............................................................................................................45.00 67.60 15 Singapore.....................................................................................................44.60 66.90 16 Japan ...............................................................................................................44.30 66.37 17 Iceland .......................................................................................................... 44.00 65.85 18 Estonia ...........................................................................................................43.80 65.50 19 Czech Republic ........................................................................................43.40 64.80 19 Malta ...............................................................................................................43.40 64.80 21 Canada ........................................................................................................... 41.40 61.30 22 Cyprus .............................................................................................................41.10 60.77 23 Belgium .........................................................................................................39.60 58.14 24 Austria .............................................................................................................39.10 57.27 25 Hungary ........................................................................................................38.70 56.57 26 Norway ..........................................................................................................38.50 56.22 27 Spain ...............................................................................................................38.40 56.04 28 Italy ....................................................................................................................37.90 55.17 29 Slovenia .........................................................................................................36.40 52.54 30 Australia ........................................................................................................36.30 52.36 31 New Zealand .............................................................................................36.00 51.84 32 Slovakia .........................................................................................................35.60 51.14 33 Latvia ..............................................................................................................35.20 50.44 34 Portugal ........................................................................................................34.60 49.39 35 Ukraine .......................................................................................................... 34.10 48.51 36 Viet Nam .......................................................................................................33.90 48.16 37 Bulgaria..........................................................................................................32.60 45.88 38 Malaysia .........................................................................................................32.40 45.53 39 Lithuania .......................................................................................................32.30 45.36 40 Poland .............................................................................................................31.70 44.31 41 Philippines ...................................................................................................30.70 42.56 41 Thailand ........................................................................................................30.70 42.56 43 Moldova, Rep. ...........................................................................................30.30 41.86 43 Mongolia ......................................................................................................30.30 41.86 45 Montenegro ...............................................................................................30.00 41.33 46 Iran, Islamic Rep. ......................................................................................29.90 41.16 47 Costa Rica ....................................................................................................29.30 40.11 48 Armenia.........................................................................................................28.60 38.88 48 Turkey .............................................................................................................28.60 38.88 50 India .................................................................................................................28.50 38.70 51 Croatia ............................................................................................................28.30 38.35 52 Romania ........................................................................................................28.00 37.83 53 Greece ............................................................................................................ 27.60 37.13 54 Mexico ........................................................................................................... 27.40 36.78 55 Kuwait ............................................................................................................ 27.20 36.43 56 Serbia ..............................................................................................................26.90 35.90 57 United Arab Emirates ...........................................................................26.70 35.55 58 Russian Federation ................................................................................ 26.10 34.50 59 Georgia ..........................................................................................................25.80 33.98 60 Uruguay ........................................................................................................25.30 33.10 61 Chile .................................................................................................................25.00 32.57 62 North Macedonia ...................................................................................24.90 32.40 63 Kenya ..............................................................................................................24.20 31.17 64 Tunisia.............................................................................................................23.50 29.95 65 Morocco ........................................................................................................23.30 29.60 66 Brazil ................................................................................................................22.90 28.90
Rank Country Value Score 67 South Africa ................................................................................................22.30 27.85 68 Jamaica .......................................................................................................... 22.10 27.50 68 Jordan............................................................................................................. 22.10 27.50 68 Qatar ................................................................................................................ 22.10 27.50 71 Panama .......................................................................................................... 21.90 27.15 72 Tanzania, United Rep. .......................................................................... 21.80 26.97 73 Argentina ..................................................................................................... 21.60 26.62 73 Egypt ............................................................................................................... 21.60 26.62 75 Colombia ......................................................................................................20.90 25.39 76 Indonesia......................................................................................................20.80 25.22 76 Sri Lanka ........................................................................................................20.80 25.22 78 Bosnia and Herzegovina ....................................................................20.40 24.52 79 Ethiopia ......................................................................................................... 20.10 23.99 79 Senegal .......................................................................................................... 20.10 23.99 81 Cambodia .................................................................................................... 19.70 23.29 81 Tajikistan ....................................................................................................... 19.70 23.29 83 Saudi Arabia ............................................................................................... 19.50 22.94 84 Peru .................................................................................................................. 19.40 22.77 85 Bahrain ........................................................................................................... 19.30 22.59 86 Dominican Republic ............................................................................. 19.20 22.42 87 Pakistan ..........................................................................................................19.10 22.24 88 Azerbaijan ....................................................................................................18.80 21.72 89 Côte d’Ivoire ............................................................................................... 18.70 21.54 90 Albania ...........................................................................................................18.30 20.84 90 Kazakhstan ..................................................................................................18.30 20.84 92 Paraguay .......................................................................................................18.20 20.67 93 Mauritius .......................................................................................................18.00 20.32 94 Ecuador ..........................................................................................................17.70 19.79 94 Ghana ..............................................................................................................17.70 19.79 96 Trinidad and Tobago .............................................................................17.50 19.44 97 Mali ....................................................................................................................17.30 19.09 98 Oman ..............................................................................................................16.90 18.39 99 Guatemala ...................................................................................................16.80 18.21 100 Namibia ......................................................................................................... 16.70 18.04 101 Honduras .....................................................................................................16.50 17.69 102 Nigeria ............................................................................................................16.40 17.51 103 Cameroon .....................................................................................................16.10 16.99 104 Bangladesh ................................................................................................. 15.50 15.94 104 Madagascar ................................................................................................ 15.50 15.94 104 Uganda .......................................................................................................... 15.50 15.94 107 Zimbabwe ................................................................................................... 15.40 15.76 108 Kyrgyzstan ................................................................................................... 15.30 15.59 108 Malawi ............................................................................................................ 15.30 15.59 110 Bolivia, Plurinational St. ........................................................................15.10 15.24 111 Mozambique .............................................................................................14.80 14.71 112 Burkina Faso ...............................................................................................14.30 13.84 113 El Salvador ...................................................................................................14.20 13.66 114 Botswana .....................................................................................................14.00 13.31 115 Algeria ............................................................................................................13.30 12.08 116 Brunei Darussalam .................................................................................13.00 11.56 116 Nepal ...............................................................................................................13.00 11.56 118 Zambia ........................................................................................................... 12.70 11.03 119 Nicaragua ......................................................................................................12.10 9.98 120 Rwanda ..........................................................................................................11.30 8.58 121 Burundi ............................................................................................................ 8.80 4.20 122 Yemen ...............................................................................................................6.40 0.00 Angola................................................................................................................ n/a n/a Bhutan................................................................................................................ n/a n/a Cabo Verde ..................................................................................................... n/a n/a Congo, Dem. Rep. ...................................................................................... n/a n/a Eswatini ............................................................................................................. n/a n/a Gambia .............................................................................................................. n/a n/a Lao PDR ............................................................................................................. n/a n/a Lesotho.............................................................................................................. n/a n/a Liberia ................................................................................................................. n/a n/a Venezuela, Bolivarian Rep. .................................................................... n/a n/a
SOURCE: INSEAD, Cornell University, and World Intellectual Property Organization, The Global Innovation Index 2019 (https://www.globalinnovationindex.org )For some countries, the latest year for which data are available may differ from the year that appears at the top of the page. The cut-off year is 2008.

THE GLOBAL TALENT COMPETITIVENESS INDEX 2020 339
DATA TABLESDATA TABLES
6.2.2 High-value exports
High technology manufactures (%) | 2017
Rank Country Value Score 1 Lao PDR .........................................................................................................33.58 100.00 1 Philippines ....................................................................................................57.77 100.00 1 Singapore......................................................................................................49.17 100.00 4 Brunei Darussalam .................................................................................29.90 89.03 5 Viet Nam .......................................................................................................29.49 87.82 6 Malaysia ..........................................................................................................28.15 83.82 7 China ...............................................................................................................23.81 70.91 8 France .............................................................................................................23.55 70.11 9 Kazakhstan ..................................................................................................22.70 67.60 10 Thailand .........................................................................................................21.51 64.06 11 Malta ................................................................................................................21.47 63.94 12 United Kingdom .....................................................................................20.71 61.67 13 Ireland .............................................................................................................19.17 57.09 14 Netherlands ................................................................................................18.58 55.32 15 Latvia ..............................................................................................................18.52 55.16 16 Norway .......................................................................................................... 18.43 54.89 17 Ethiopia ..........................................................................................................17.24 51.35 18 Mexico ........................................................................................................... 16.01 47.66 19 Estonia ........................................................................................................... 15.77 46.95 20 Korea, Rep. ....................................................................................................14.18 42.23 21 Germany ....................................................................................................... 13.90 41.40 22 Israel ................................................................................................................13.84 41.22 23 United States of America................................................................... 13.82 41.15 24 Japan ............................................................................................................... 13.81 41.11 25 Hungary ........................................................................................................13.80 41.08 26 Czech Republic ........................................................................................13.34 39.73 27 Canada ........................................................................................................... 12.85 38.27 28 Australia ........................................................................................................ 12.79 38.09 29 Cyprus ............................................................................................................ 12.73 37.91 30 Sweden .........................................................................................................12.48 37.16 31 Brazil ................................................................................................................ 12.28 36.57 32 Rwanda ......................................................................................................... 12.28 36.57 33 Russian Federation .................................................................................11.52 34.31 34 Lithuania ........................................................................................................11.51 34.28 35 Denmark ........................................................................................................11.24 33.47 36 Malawi ............................................................................................................. 11.13 33.15 37 Switzerland .................................................................................................10.99 32.73 38 Slovakia ......................................................................................................... 10.93 32.55 39 Greece ............................................................................................................10.83 32.25 40 Iceland ........................................................................................................... 10.75 32.00 41 Austria ...............................................................................................................9.78 29.13 42 Paraguay ..........................................................................................................9.64 28.70 43 Belgium ............................................................................................................9.49 28.24 44 Romania ...........................................................................................................9.27 27.59 45 Argentina ........................................................................................................8.95 26.65 46 New Zealand ................................................................................................8.77 26.12 47 Kyrgyzstan ......................................................................................................8.71 25.92 48 Colombia .........................................................................................................8.69 25.87 49 Ghana ................................................................................................................ 8.13 24.22 50 Poland ................................................................................................................7.74 23.03 51 Dominican Republic ................................................................................ 7.73 23.00 52 Bulgaria............................................................................................................. 7.58 22.56 53 Croatia ............................................................................................................... 7.45 22.18 54 Uruguay ........................................................................................................... 7.42 22.10 55 Costa Rica ........................................................................................................7.41 22.05 56 Finland .............................................................................................................. 7.32 21.79 57 Spain .................................................................................................................. 7.05 20.97 58 India .................................................................................................................... 7.01 20.87 59 Italy ..................................................................................................................... 6.84 20.38 60 Luxembourg .................................................................................................6.71 19.99 61 Armenia............................................................................................................6.47 19.27 62 Slovenia ............................................................................................................6.32 18.82 63 Chile .................................................................................................................... 6.13 18.24 64 Panama .............................................................................................................5.73 17.04 65 Indonesia.........................................................................................................5.69 16.93 66 Mozambique ................................................................................................5.64 16.79
Rank Country Value Score 67 Tunisia................................................................................................................5.24 15.58 68 Burkina Faso .................................................................................................. 5.18 15.42 69 Moldova, Rep. .............................................................................................. 5.15 15.32 70 Guatemala ......................................................................................................5.06 15.05 71 El Salvador ......................................................................................................5.04 15.00 72 Ukraine .............................................................................................................4.98 14.82 73 Bolivia, Plurinational St. ..........................................................................4.86 14.46 74 Yemen ...............................................................................................................4.70 13.98 75 Cameroon .......................................................................................................4.67 13.89 76 Peru .....................................................................................................................4.66 13.86 77 Ecuador ............................................................................................................4.65 13.85 78 South Africa .................................................................................................. 4.64 13.82 79 Côte d’Ivoire ..................................................................................................4.57 13.61 80 Portugal ...........................................................................................................4.25 12.65 81 Kuwait ...............................................................................................................4.20 12.50 82 North Macedonia ......................................................................................3.69 10.98 83 Morocco ...........................................................................................................3.62 10.76 84 Mongolia .........................................................................................................3.20 9.53 85 Kenya ................................................................................................................. 3.15 9.38 86 Honduras ........................................................................................................3.02 8.98 87 Georgia .............................................................................................................2.97 8.84 88 Bosnia and Herzegovina .......................................................................2.93 8.71 89 Saudi Arabia ..................................................................................................2.82 8.40 90 Montenegro ..................................................................................................2.54 7.55 91 Turkey ................................................................................................................2.53 7.53 92 Tanzania, United Rep. .............................................................................2.37 7.04 93 United Arab Emirates ..............................................................................2.32 6.90 94 Mauritius ..........................................................................................................2.23 6.64 95 Qatar ...................................................................................................................2.20 6.54 96 Pakistan ............................................................................................................ 2.13 6.34 97 Zimbabwe ......................................................................................................2.01 5.98 98 Zambia .............................................................................................................. 1.97 5.86 99 Azerbaijan .......................................................................................................1.95 5.81 100 Nigeria ...............................................................................................................1.90 5.65 101 Jordan................................................................................................................1.80 5.36 102 Uganda .............................................................................................................1.79 5.32 103 Burundi .............................................................................................................1.46 4.33 104 Iran, Islamic Rep. ......................................................................................... 1.31 3.91 105 Namibia ............................................................................................................1.24 3.68 106 Nepal ...................................................................................................................1.16 3.43 107 Venezuela, Bolivarian Rep. ....................................................................1.13 3.36 108 Oman ..................................................................................................................1.12 3.32 109 Senegal ..............................................................................................................1.10 3.27 110 Bahrain ..............................................................................................................1.05 3.11 111 Mali ......................................................................................................................0.89 2.65 112 Sri Lanka ...........................................................................................................0.89 2.64 113 Botswana ........................................................................................................0.89 2.64 114 Egypt ..................................................................................................................0.87 2.57 115 Algeria ...............................................................................................................0.54 1.61 116 Madagascar ...................................................................................................0.54 1.60 117 Nicaragua ........................................................................................................0.54 1.59 118 Jamaica .............................................................................................................0.45 1.33 119 Cambodia .......................................................................................................0.43 1.28 120 Bangladesh ....................................................................................................0.30 0.88 121 Eswatini ............................................................................................................0.29 0.85 122 Lesotho............................................................................................................. 0.19 0.57 123 Trinidad and Tobago ............................................................................... 0.13 0.37 124 Albania ..............................................................................................................0.09 0.25 125 Gambia .............................................................................................................0.08 0.23 126 Bhutan...............................................................................................................0.02 0.06 127 Cabo Verde ....................................................................................................0.00 0.00 Angola................................................................................................................ n/a n/a Congo, Dem. Rep. ...................................................................................... n/a n/a Liberia ................................................................................................................. n/a n/a Serbia .................................................................................................................. n/a n/a Tajikistan ........................................................................................................... n/a n/a
SOURCE: World Bank, World Development Indicators (http://data.worldbank.org/data-catalog/world-development-indicators). The classification of exports is based on Lall, S. (2000), The Technological Structure and Performance of Developing Country Manufactured Exports, Oxford Development Studies, 28(3), 1985–1989
For some countries, the latest year for which data are available may differ from the year that appears at the top of the page. The cut-off year is 2008.
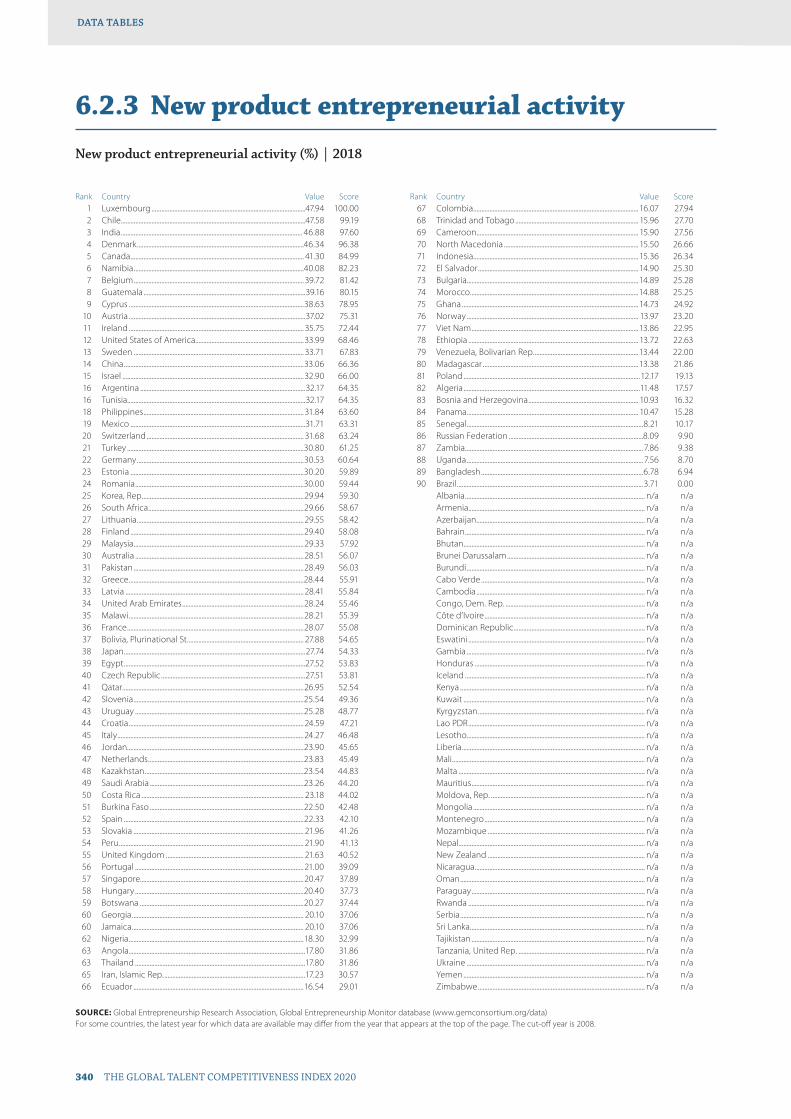
340 THE GLOBAL TALENT COMPETITIVENESS INDEX 2020
DATA TABLESDATA TABLES
6.2.3 New product entrepreneurial activity
New product entrepreneurial activity (%) | 2018
Rank Country Value Score 1 Luxembourg ...............................................................................................47.94 100.00 2 Chile ..................................................................................................................47.58 99.19 3 India ................................................................................................................ 46.88 97.60 4 Denmark .......................................................................................................46.34 96.38 5 Canada ........................................................................................................... 41.30 84.99 6 Namibia .........................................................................................................40.08 82.23 7 Belgium .........................................................................................................39.72 81.42 8 Guatemala ....................................................................................................39.16 80.15 9 Cyprus ............................................................................................................38.63 78.95 10 Austria .............................................................................................................37.02 75.31 11 Ireland ............................................................................................................ 35.75 72.44 12 United States of America...................................................................33.99 68.46 13 Sweden ......................................................................................................... 33.71 67.83 14 China ...............................................................................................................33.06 66.36 15 Israel ................................................................................................................32.90 66.00 16 Argentina ......................................................................................................32.17 64.35 16 Tunisia..............................................................................................................32.17 64.35 18 Philippines ...................................................................................................31.84 63.60 19 Mexico ............................................................................................................31.71 63.31 20 Switzerland ................................................................................................. 31.68 63.24 21 Turkey .............................................................................................................30.80 61.25 22 Germany .......................................................................................................30.53 60.64 23 Estonia ...........................................................................................................30.20 59.89 24 Romania ........................................................................................................30.00 59.44 25 Korea, Rep. ...................................................................................................29.94 59.30 26 South Africa ................................................................................................29.66 58.67 27 Lithuania .......................................................................................................29.55 58.42 28 Finland ...........................................................................................................29.40 58.08 29 Malaysia .........................................................................................................29.33 57.92 30 Australia ........................................................................................................28.51 56.07 31 Pakistan .........................................................................................................28.49 56.03 32 Greece ............................................................................................................28.44 55.91 33 Latvia .............................................................................................................. 28.41 55.84 34 United Arab Emirates ...........................................................................28.24 55.46 35 Malawi ............................................................................................................28.21 55.39 36 France .............................................................................................................28.07 55.08 37 Bolivia, Plurinational St. ....................................................................... 27.88 54.65 38 Japan ................................................................................................................27.74 54.33 39 Egypt ................................................................................................................27.52 53.83 40 Czech Republic .........................................................................................27.51 53.81 41 Qatar ................................................................................................................26.95 52.54 42 Slovenia .........................................................................................................25.54 49.36 43 Uruguay ........................................................................................................25.28 48.77 44 Croatia ............................................................................................................ 24.59 47.21 45 Italy ...................................................................................................................24.27 46.48 46 Jordan.............................................................................................................23.90 45.65 47 Netherlands ................................................................................................23.83 45.49 48 Kazakhstan ..................................................................................................23.54 44.83 49 Saudi Arabia ...............................................................................................23.26 44.20 50 Costa Rica .................................................................................................... 23.18 44.02 51 Burkina Faso ...............................................................................................22.50 42.48 52 Spain ...............................................................................................................22.33 42.10 53 Slovakia ......................................................................................................... 21.96 41.26 54 Peru .................................................................................................................. 21.90 41.13 55 United Kingdom ..................................................................................... 21.63 40.52 56 Portugal ........................................................................................................ 21.00 39.09 57 Singapore.....................................................................................................20.47 37.89 58 Hungary ........................................................................................................20.40 37.73 59 Botswana .....................................................................................................20.27 37.44 60 Georgia .......................................................................................................... 20.10 37.06 60 Jamaica .......................................................................................................... 20.10 37.06 62 Nigeria ............................................................................................................18.30 32.99 63 Angola.............................................................................................................17.80 31.86 63 Thailand .........................................................................................................17.80 31.86 65 Iran, Islamic Rep. .......................................................................................17.23 30.57 66 Ecuador .........................................................................................................16.54 29.01
Rank Country Value Score 67 Colombia ...................................................................................................... 16.07 27.94 68 Trinidad and Tobago ............................................................................ 15.96 27.70 69 Cameroon .................................................................................................... 15.90 27.56 70 North Macedonia ................................................................................... 15.50 26.66 71 Indonesia...................................................................................................... 15.36 26.34 72 El Salvador ...................................................................................................14.90 25.30 73 Bulgaria..........................................................................................................14.89 25.28 74 Morocco ........................................................................................................14.88 25.25 75 Ghana ............................................................................................................. 14.73 24.92 76 Norway .......................................................................................................... 13.97 23.20 77 Viet Nam .......................................................................................................13.86 22.95 78 Ethiopia ......................................................................................................... 13.72 22.63 79 Venezuela, Bolivarian Rep. ................................................................13.44 22.00 80 Madagascar ................................................................................................ 13.38 21.86 81 Poland .............................................................................................................12.17 19.13 82 Algeria .............................................................................................................11.48 17.57 83 Bosnia and Herzegovina .................................................................... 10.93 16.32 84 Panama .......................................................................................................... 10.47 15.28 85 Senegal .............................................................................................................8.21 10.17 86 Russian Federation ...................................................................................8.09 9.90 87 Zambia ..............................................................................................................7.86 9.38 88 Uganda ............................................................................................................. 7.56 8.70 89 Bangladesh ....................................................................................................6.78 6.94 90 Brazil ...................................................................................................................3.71 0.00 Albania ............................................................................................................... n/a n/a Armenia............................................................................................................. n/a n/a Azerbaijan ........................................................................................................ n/a n/a Bahrain ............................................................................................................... n/a n/a Bhutan................................................................................................................ n/a n/a Brunei Darussalam ..................................................................................... n/a n/a Burundi .............................................................................................................. n/a n/a Cabo Verde ..................................................................................................... n/a n/a Cambodia ........................................................................................................ n/a n/a Congo, Dem. Rep. ...................................................................................... n/a n/a Côte d’Ivoire ................................................................................................... n/a n/a Dominican Republic ................................................................................. n/a n/a Eswatini ............................................................................................................. n/a n/a Gambia .............................................................................................................. n/a n/a Honduras ......................................................................................................... n/a n/a Iceland ............................................................................................................... n/a n/a Kenya .................................................................................................................. n/a n/a Kuwait ................................................................................................................ n/a n/a Kyrgyzstan ....................................................................................................... n/a n/a Lao PDR ............................................................................................................. n/a n/a Lesotho.............................................................................................................. n/a n/a Liberia ................................................................................................................. n/a n/a Mali ....................................................................................................................... n/a n/a Malta ................................................................................................................... n/a n/a Mauritius ........................................................................................................... n/a n/a Moldova, Rep. ............................................................................................... n/a n/a Mongolia .......................................................................................................... n/a n/a Montenegro ................................................................................................... n/a n/a Mozambique ................................................................................................. n/a n/a Nepal ................................................................................................................... n/a n/a New Zealand ................................................................................................. n/a n/a Nicaragua ......................................................................................................... n/a n/a Oman .................................................................................................................. n/a n/a Paraguay ........................................................................................................... n/a n/a Rwanda ............................................................................................................. n/a n/a Serbia .................................................................................................................. n/a n/a Sri Lanka ............................................................................................................ n/a n/a Tajikistan ........................................................................................................... n/a n/a Tanzania, United Rep. .............................................................................. n/a n/a Ukraine .............................................................................................................. n/a n/a Yemen ................................................................................................................ n/a n/a Zimbabwe ....................................................................................................... n/a n/a
SOURCE: Global Entrepreneurship Research Association, Global Entrepreneurship Monitor database (www.gemconsortium.org/data)For some countries, the latest year for which data are available may differ from the year that appears at the top of the page. The cut-off year is 2008.
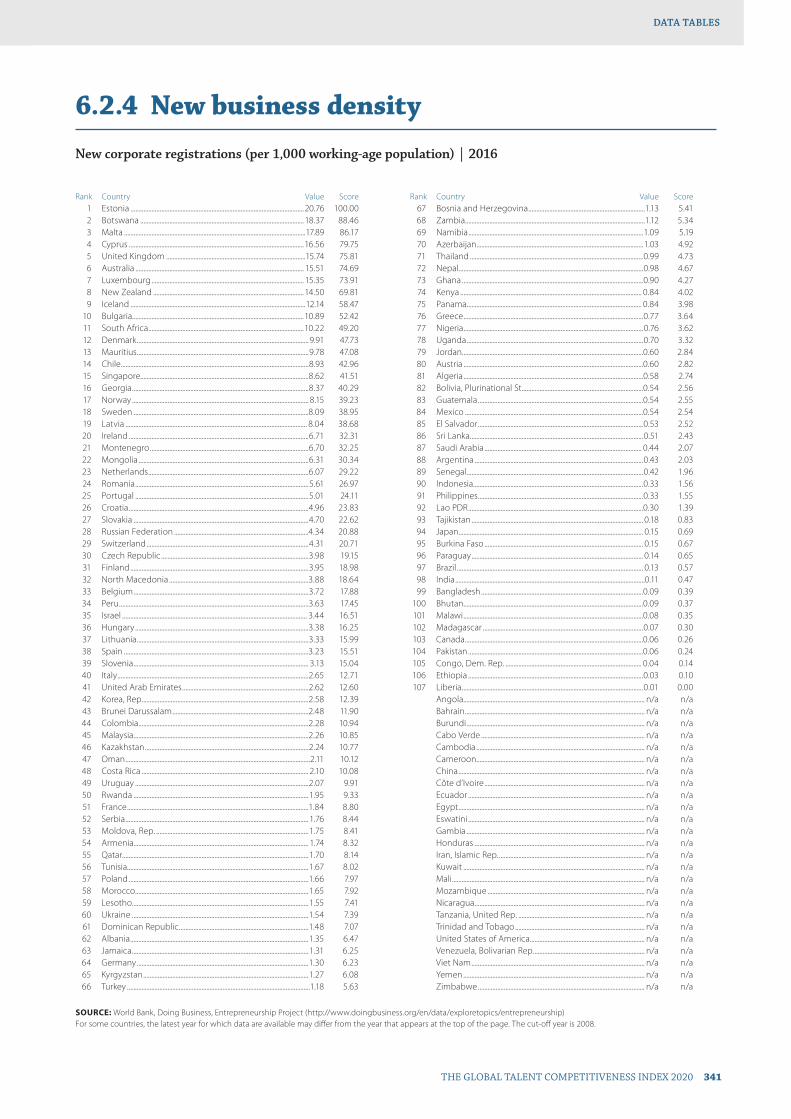
THE GLOBAL TALENT COMPETITIVENESS INDEX 2020 341
DATA TABLESDATA TABLES
6.2.4 New business density
New corporate registrations (per 1,000 working-age population) | 2016
Rank Country Value Score 1 Estonia ...........................................................................................................20.76 100.00 2 Botswana ..................................................................................................... 18.37 88.46 3 Malta ................................................................................................................17.89 86.17 4 Cyprus ............................................................................................................16.56 79.75 5 United Kingdom ......................................................................................15.74 75.81 6 Australia ........................................................................................................ 15.51 74.69 7 Luxembourg .............................................................................................. 15.35 73.91 8 New Zealand .............................................................................................14.50 69.81 9 Iceland ............................................................................................................12.14 58.47 10 Bulgaria..........................................................................................................10.89 52.42 11 South Africa ................................................................................................10.22 49.20 12 Denmark ..........................................................................................................9.91 47.73 13 Mauritius ..........................................................................................................9.78 47.08 14 Chile ....................................................................................................................8.93 42.96 15 Singapore........................................................................................................8.62 41.51 16 Georgia .............................................................................................................8.37 40.29 17 Norway ............................................................................................................. 8.15 39.23 18 Sweden ............................................................................................................8.09 38.95 19 Latvia ................................................................................................................ 8.04 38.68 20 Ireland ...............................................................................................................6.71 32.31 21 Montenegro ..................................................................................................6.70 32.25 22 Mongolia .........................................................................................................6.31 30.34 23 Netherlands ...................................................................................................6.07 29.22 24 Romania ...........................................................................................................5.61 26.97 25 Portugal ...........................................................................................................5.01 24.11 26 Croatia ...............................................................................................................4.96 23.83 27 Slovakia ............................................................................................................4.70 22.62 28 Russian Federation ...................................................................................4.34 20.88 29 Switzerland ....................................................................................................4.31 20.71 30 Czech Republic ...........................................................................................3.98 19.15 31 Finland ..............................................................................................................3.95 18.98 32 North Macedonia ......................................................................................3.88 18.64 33 Belgium ............................................................................................................3.72 17.88 34 Peru .....................................................................................................................3.63 17.45 35 Israel .................................................................................................................. 3.44 16.51 36 Hungary ...........................................................................................................3.38 16.25 37 Lithuania ..........................................................................................................3.33 15.99 38 Spain ..................................................................................................................3.23 15.51 39 Slovenia ............................................................................................................ 3.13 15.04 40 Italy ......................................................................................................................2.65 12.71 41 United Arab Emirates ..............................................................................2.62 12.60 42 Korea, Rep. ......................................................................................................2.58 12.39 43 Brunei Darussalam ....................................................................................2.48 11.90 44 Colombia .........................................................................................................2.28 10.94 45 Malaysia ............................................................................................................2.26 10.85 46 Kazakhstan .....................................................................................................2.24 10.77 47 Oman ..................................................................................................................2.11 10.12 48 Costa Rica ....................................................................................................... 2.10 10.08 49 Uruguay ...........................................................................................................2.07 9.91 50 Rwanda ............................................................................................................1.95 9.33 51 France ................................................................................................................1.84 8.80 52 Serbia ................................................................................................................. 1.76 8.44 53 Moldova, Rep. ..............................................................................................1.75 8.41 54 Armenia............................................................................................................ 1.74 8.32 55 Qatar ...................................................................................................................1.70 8.14 56 Tunisia................................................................................................................1.67 8.02 57 Poland ...............................................................................................................1.66 7.97 58 Morocco ...........................................................................................................1.65 7.92 59 Lesotho.............................................................................................................1.55 7.41 60 Ukraine .............................................................................................................1.54 7.39 61 Dominican Republic ................................................................................1.48 7.07 62 Albania ..............................................................................................................1.35 6.47 63 Jamaica .............................................................................................................1.31 6.25 64 Germany ..........................................................................................................1.30 6.23 65 Kyrgyzstan ......................................................................................................1.27 6.08 66 Turkey .................................................................................................................1.18 5.63
Rank Country Value Score 67 Bosnia and Herzegovina ........................................................................1.13 5.41 68 Zambia ...............................................................................................................1.12 5.34 69 Namibia ............................................................................................................1.09 5.19 70 Azerbaijan .......................................................................................................1.03 4.92 71 Thailand ...........................................................................................................0.99 4.73 72 Nepal ..................................................................................................................0.98 4.67 73 Ghana ................................................................................................................0.90 4.27 74 Kenya ................................................................................................................ 0.84 4.02 75 Panama ............................................................................................................ 0.84 3.98 76 Greece ...............................................................................................................0.77 3.64 77 Nigeria ...............................................................................................................0.76 3.62 78 Uganda .............................................................................................................0.70 3.32 79 Jordan................................................................................................................0.60 2.84 80 Austria ...............................................................................................................0.60 2.82 81 Algeria ...............................................................................................................0.58 2.74 82 Bolivia, Plurinational St. ..........................................................................0.54 2.56 83 Guatemala ......................................................................................................0.54 2.55 84 Mexico ..............................................................................................................0.54 2.54 85 El Salvador ......................................................................................................0.53 2.52 86 Sri Lanka ...........................................................................................................0.51 2.43 87 Saudi Arabia ................................................................................................. 0.44 2.07 88 Argentina ........................................................................................................0.43 2.03 89 Senegal .............................................................................................................0.42 1.96 90 Indonesia.........................................................................................................0.33 1.56 91 Philippines ......................................................................................................0.33 1.55 92 Lao PDR ............................................................................................................0.30 1.39 93 Tajikistan .......................................................................................................... 0.18 0.83 94 Japan .................................................................................................................. 0.15 0.69 95 Burkina Faso .................................................................................................. 0.15 0.67 96 Paraguay .......................................................................................................... 0.14 0.65 97 Brazil ................................................................................................................... 0.13 0.57 98 India .....................................................................................................................0.11 0.47 99 Bangladesh ....................................................................................................0.09 0.39 100 Bhutan...............................................................................................................0.09 0.37 101 Malawi ...............................................................................................................0.08 0.35 102 Madagascar ...................................................................................................0.07 0.30 103 Canada ..............................................................................................................0.06 0.26 104 Pakistan ............................................................................................................0.06 0.24 105 Congo, Dem. Rep. .................................................................................... 0.04 0.14 106 Ethiopia ............................................................................................................0.03 0.10 107 Liberia ................................................................................................................0.01 0.00 Angola................................................................................................................ n/a n/a Bahrain ............................................................................................................... n/a n/a Burundi .............................................................................................................. n/a n/a Cabo Verde ..................................................................................................... n/a n/a Cambodia ........................................................................................................ n/a n/a Cameroon ........................................................................................................ n/a n/a China ................................................................................................................... n/a n/a Côte d’Ivoire ................................................................................................... n/a n/a Ecuador ............................................................................................................. n/a n/a Egypt ................................................................................................................... n/a n/a Eswatini ............................................................................................................. n/a n/a Gambia .............................................................................................................. n/a n/a Honduras ......................................................................................................... n/a n/a Iran, Islamic Rep. .......................................................................................... n/a n/a Kuwait ................................................................................................................ n/a n/a Mali ....................................................................................................................... n/a n/a Mozambique ................................................................................................. n/a n/a Nicaragua ......................................................................................................... n/a n/a Tanzania, United Rep. .............................................................................. n/a n/a Trinidad and Tobago ................................................................................ n/a n/a United States of America....................................................................... n/a n/a Venezuela, Bolivarian Rep. .................................................................... n/a n/a Viet Nam ........................................................................................................... n/a n/a Yemen ................................................................................................................ n/a n/a Zimbabwe ....................................................................................................... n/a n/a
SOURCE: World Bank, Doing Business, Entrepreneurship Project (http://www.doingbusiness.org/en/data/exploretopics/entrepreneurship)For some countries, the latest year for which data are available may differ from the year that appears at the top of the page. The cut-off year is 2008.

342 THE GLOBAL TALENT COMPETITIVENESS INDEX 2020
DATA TABLES
6.2.5 Scientific journal articles
Number of scientific and technical journal articles (per 10,000 inhabitants) | 2016
Rank Country Value Score 1 Switzerland .................................................................................................25.23 100.00 2 Denmark .......................................................................................................23.52 93.20 3 Australia ......................................................................................................... 21.11 83.66 4 Norway ..........................................................................................................20.49 81.20 5 Sweden .........................................................................................................20.09 79.62 6 Singapore.....................................................................................................20.07 79.53 7 Iceland ............................................................................................................19.43 77.00 8 Finland ............................................................................................................19.19 76.04 9 Netherlands .................................................................................................17.59 69.68 10 Slovenia .........................................................................................................16.50 65.37 11 New Zealand ..............................................................................................15.91 63.02 12 Canada ...........................................................................................................15.88 62.94 13 Czech Republic .........................................................................................15.11 59.86 14 United Kingdom .....................................................................................14.87 58.91 15 Belgium ......................................................................................................... 14.47 57.32 16 Ireland ............................................................................................................ 14.37 56.94 17 Austria .............................................................................................................14.15 56.08 18 Luxembourg ..............................................................................................14.05 55.68 19 Israel ................................................................................................................ 13.92 55.13 20 Portugal ........................................................................................................13.34 52.85 21 United States of America...................................................................12.66 50.15 22 Germany ....................................................................................................... 12.52 49.61 23 Korea, Rep. ................................................................................................... 12.31 48.75 24 Italy ....................................................................................................................11.40 45.17 25 Spain ................................................................................................................11.36 45.01 26 Estonia ............................................................................................................11.26 44.61 27 France .............................................................................................................10.38 41.13 28 Greece ...............................................................................................................9.95 39.42 29 Slovakia ............................................................................................................9.87 39.09 30 Croatia ...............................................................................................................9.72 38.48 31 Poland ...............................................................................................................8.69 34.39 32 Cyprus ...............................................................................................................8.31 32.92 33 Lithuania ..........................................................................................................7.60 30.11 34 Japan ..................................................................................................................7.60 30.10 35 Serbia ..................................................................................................................7.16 28.34 36 Malta ..................................................................................................................7.04 27.86 37 Malaysia ............................................................................................................6.63 26.23 38 Latvia .................................................................................................................6.41 25.39 39 Hungary ...........................................................................................................6.33 25.04 40 Romania ........................................................................................................... 5.17 20.47 41 Brunei Darussalam .................................................................................... 5.17 20.44 42 Iran, Islamic Rep. ......................................................................................... 5.15 20.38 43 Qatar ...................................................................................................................4.94 19.54 44 Tunisia................................................................................................................4.66 18.43 45 Turkey ................................................................................................................4.25 16.80 46 Montenegro .................................................................................................. 4.14 16.38 47 Russian Federation ................................................................................... 4.10 16.20 48 Chile ....................................................................................................................3.70 14.65 49 Bulgaria.............................................................................................................3.59 14.19 50 China ..................................................................................................................3.09 12.22 51 Saudi Arabia ..................................................................................................2.85 11.24 52 Brazil ...................................................................................................................2.60 10.27 53 Uruguay ...........................................................................................................2.36 9.33 54 United Arab Emirates ..............................................................................2.33 9.20 55 North Macedonia ......................................................................................2.32 9.16 56 South Africa ....................................................................................................2.11 8.34 57 Argentina ........................................................................................................1.98 7.83 58 Kuwait ...............................................................................................................1.87 7.36 59 Oman .................................................................................................................1.77 7.00 60 Armenia............................................................................................................1.77 6.99 61 Jordan................................................................................................................1.73 6.82 62 Ukraine .............................................................................................................1.64 6.46 63 Georgia .............................................................................................................1.55 6.12 64 Bosnia and Herzegovina .......................................................................1.50 5.91 65 Bahrain ..............................................................................................................1.48 5.82 66 Thailand ...........................................................................................................1.39 5.47
Rank Country Value Score 67 Trinidad and Tobago ...............................................................................1.34 5.29 68 Colombia .........................................................................................................1.27 5.00 69 Mauritius ..........................................................................................................1.23 4.85 70 Mexico ...............................................................................................................1.18 4.63 71 Morocco ............................................................................................................1.16 4.55 72 Egypt ...................................................................................................................1.14 4.50 73 Algeria ................................................................................................................1.10 4.31 74 Botswana ........................................................................................................1.05 4.12 75 Kazakhstan .................................................................................................... 0.88 3.44 76 India ....................................................................................................................0.83 3.26 77 Moldova, Rep. ..............................................................................................0.83 3.26 78 Costa Rica .......................................................................................................0.77 3.01 79 Albania ..............................................................................................................0.67 2.60 80 Ecuador ............................................................................................................0.66 2.59 81 Bhutan...............................................................................................................0.55 2.12 82 Azerbaijan .......................................................................................................0.49 1.91 83 Sri Lanka ...........................................................................................................0.49 1.89 84 Jamaica .............................................................................................................0.46 1.80 85 Namibia ............................................................................................................0.46 1.77 86 Pakistan ............................................................................................................0.45 1.75 87 Panama .............................................................................................................0.39 1.52 88 Mongolia .........................................................................................................0.37 1.42 89 Ghana ................................................................................................................0.34 1.33 90 Peru .....................................................................................................................0.33 1.25 91 Viet Nam ..........................................................................................................0.32 1.21 92 Indonesia.........................................................................................................0.30 1.13 93 Venezuela, Bolivarian Rep. ...................................................................0.29 1.10 94 Cameroon .......................................................................................................0.28 1.07 95 Eswatini ............................................................................................................0.28 1.06 96 Senegal .............................................................................................................0.24 0.89 97 Gambia .............................................................................................................0.22 0.82 98 Zimbabwe ......................................................................................................0.21 0.80 99 Nigeria ...............................................................................................................0.21 0.77 100 Nepal ..................................................................................................................0.20 0.76 101 Kenya .................................................................................................................0.20 0.76 102 Kyrgyzstan ...................................................................................................... 0.17 0.62 103 Bangladesh .................................................................................................... 0.16 0.60 104 Cabo Verde .................................................................................................... 0.15 0.56 105 Philippines ...................................................................................................... 0.15 0.56 106 Uganda ............................................................................................................. 0.14 0.53 107 Paraguay .......................................................................................................... 0.14 0.52 108 Lao PDR ............................................................................................................ 0.12 0.45 109 Burkina Faso .................................................................................................. 0.12 0.43 110 Malawi ............................................................................................................... 0.12 0.43 111 Lesotho..............................................................................................................0.11 0.40 112 Zambia ...............................................................................................................0.11 0.39 113 Ethiopia .............................................................................................................0.11 0.39 114 Tanzania, United Rep. ............................................................................. 0.10 0.36 115 Rwanda ............................................................................................................ 0.10 0.35 116 Bolivia, Plurinational St. ..........................................................................0.09 0.30 117 Côte d’Ivoire ..................................................................................................0.07 0.25 118 Cambodia .......................................................................................................0.07 0.25 119 Nicaragua ........................................................................................................0.06 0.18 120 Tajikistan ..........................................................................................................0.05 0.18 121 Guatemala ......................................................................................................0.05 0.16 122 Mali ......................................................................................................................0.05 0.15 123 El Salvador ..................................................................................................... 0.04 0.14 124 Madagascar .................................................................................................. 0.04 0.12 125 Yemen .............................................................................................................. 0.04 0.12 126 Liberia ............................................................................................................... 0.04 0.10 127 Mozambique ............................................................................................... 0.04 0.10 128 Honduras ....................................................................................................... 0.04 0.10 129 Dominican Republic ................................................................................0.03 0.07 130 Congo, Dem. Rep. .....................................................................................0.01 0.02 131 Angola...............................................................................................................0.01 0.01 132 Burundi .............................................................................................................0.01 0.00
SOURCE: World Bank, World Development Indicators based on National Science Foundation, Science and Engineering Indicators; population data come from World Bank, World Development Indicators
For some countries, the latest year for which data are available may differ from the year that appears at the top of the page. The cut-off year is 2008.

Appendices


Appendix ITechnical Notes

TECHNICAL NOTES
Scientific and Cultural Organization (UNESCO), the United Nations Conference on Trade and Development (UNCTAD), the International Labour Organization (ILO), the World Bank, the OECD, and The Conference Board. Most variables were al-ready scaled at their source and therefore did not need to be re-scaled.
IndicesThe 14 variables measured as indices come from sources such as the World Bank (the World Governance Indicators and the Doing Business report series), the International Telecommunication Union, and Transparency International. They also come from other composite indicators such as the Social Progress Index, the Global Innovation Index (Cornell, INSEAD, and the World Intellectual Property Organization), and the Environmental Performance Index (Yale University and Columbia University). There are two main concerns about using ‘indices within an in-dex’: (1) doubts over its methodology to derive a single score; and (2) the risk of duplicating variables. Despite these concerns, the GTCI team determined that the gains outweighed the down-sides, as there are certain phenomena that are best captured by a multi-dimensional index. To address these concerns, only indices that transparently indicate their methodology and are widely well received were included in the GTCI. Additionally, to avoid double-counting, only indices with a narrow focus were selected.
Survey DataThe 29 variables based on survey data were mainly extracted from the World Economic Forum’s Executive Opinion Survey. Qualitative information tends to provide the most current assessment of certain areas related to talent competitiveness for which hard data either do not exist or have low country coverage.
Country Coverage and Missing DataThe 132 countries covered in the GTCI 2020 were selected based on an aggregate data availability threshold of at least 80% (56 out of 70 variables) and a sub-pillar level data availability threshold of at least 40%. The most recent data points for each country were considered in the calculation, with 2008 as the cut-off year. Meanwhile, each variable had to pass a country-based availability threshold of 50% (66 out of 132 countries). In order to provide transparency and replicability, there was no imputation effort to fill in missing values in the data set. Missing values were noted with ‘n/a’ and were not considered in the calculation of sub-pillar scores.
Audit by the Joint Research Centre of the European CommissionThe Joint Research Centre (JRC) of the European Commission has conducted extensive research on the development of com-posite indicators, most notably publishing the Handbook on Constructing Composite Indicators: Methodology and User Guide in collaboration with the Organisation for Economic Co-operation and Development (OECD). For the seventh consecutive edition of the Global Talent Competitiveness Index (GTCI), the GTCI de-velopment team engaged the JRC to conduct an audit.1 This ex-ercise has provided external validation and further improved the statistical analyses to ensure the consistency and rigour of the GTCI model.
In July 2019, an earlier version of the index model for the GTCI 2020 was submitted to the JRC team. The results from the preliminary audit were taken into account and are reflected in the final version of the index model, as appropriate. The final audit was then completed in October 2019 based on the latest model, the results of which can be found in Chapter 6.
Composite IndicatorsThe GTCI framework builds on six pillars: (1) Enable, (2) Attract, (3) Grow, (4) Retain, (5) Vocational and Technical Skills, and (6) Global Knowledge Skills. Each pillar consists of two to three sub-pillars. Each sub-pillar is composed of three to six variables. Each sub-pillar score is derived from the simple arithmetic aver-age of its individual variables. The successive arithmetic aggrega-tion continues at the pillar level.
Overall, the GTCI includes three indices:
• The Talent Competitiveness Input sub-index is the simple average of the first four pillars.
• The Talent Competitiveness Output sub-index is the sim-ple average of the last two pillars.
• The Global Talent Competitiveness Index is the simple av-erage of the six pillars.
Individual VariablesThe GTCI 2020 model includes 70 variables, which fall within the following categories:2
1. Hard/quantitative data (27 variables)2. Index/composite indicator data (14 variables)3. Survey/qualitative data (29 variables)
Hard DataThe 27 variables based on hard data were drawn from a vari-ety of public sources, such as the United Nations Educational,
Technical Notes
TECHNICAL NOTES
THE GLOBAL TALENT COMPETITIVENESS INDEX 2020 347
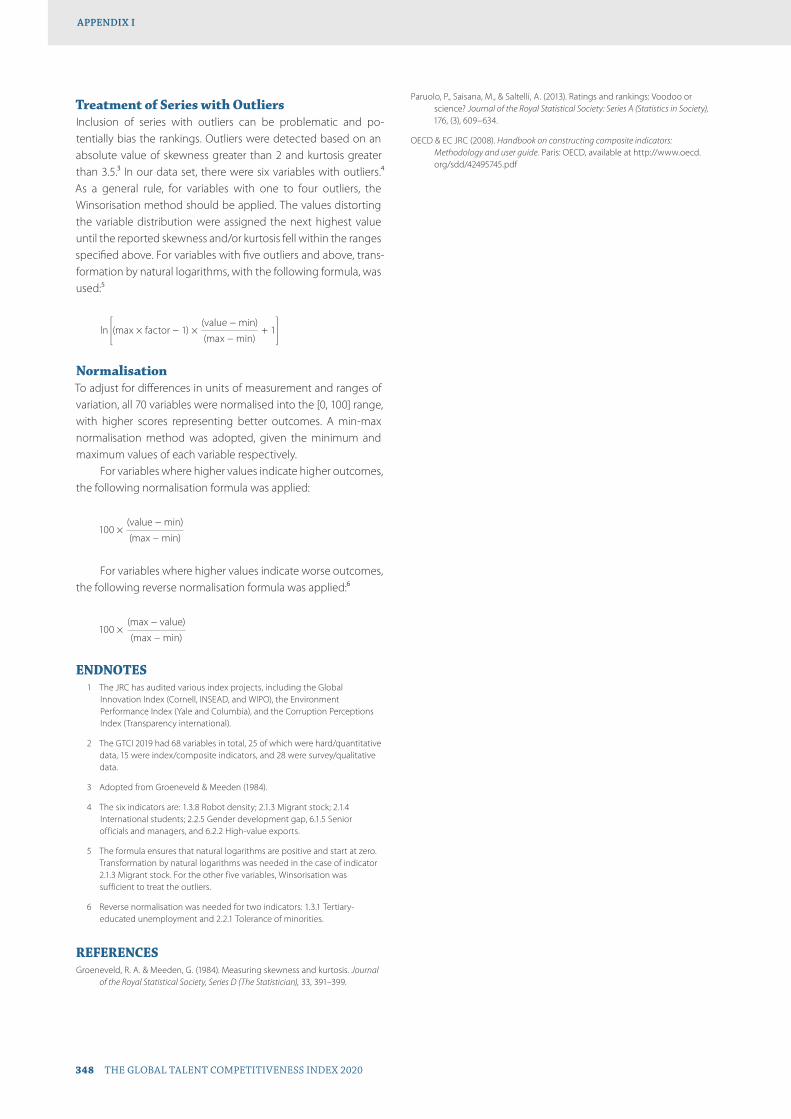
Treatment of Series with OutliersInclusion of series with outliers can be problematic and po-tentially bias the rankings. Outliers were detected based on an absolute value of skewness greater than 2 and kurtosis greater than 3.5.3 In our data set, there were six variables with out liers.4 As a general rule, for variables with one to four outliers, the Winsorisation method should be applied. The values distorting the variable distribution were assigned the next highest value until the reported skewness and/or kurtosis fell within the ranges specified above. For variables with five outliers and above, trans-formation by natural logarithms, with the following formula, was used:5
ln (max × factor − 1) × (value − min)
+ 1 (max − min)
NormalisationTo adjust for differences in units of measurement and ranges of variation, all 70 variables were normalised into the [0, 100] range, with higher scores representing better outcomes. A min-max normalisation method was adopted, given the minimum and maximum values of each variable respectively.
For variables where higher values indicate higher outcomes, the following normalisation formula was applied:
100 × (value − min)
(max − min)
For variables where higher values indicate worse outcomes, the following reverse normalisation formula was applied:6
100 × (max − value)
(max − min)
ENDNOTES 1 The JRC has audited various index projects, including the Global
Innovation Index (Cornell, INSEAD, and WIPO), the Environment Performance Index (Yale and Columbia), and the Corruption Perceptions Index (Transparency international).
2 The GTCI 2019 had 68 variables in total, 25 of which were hard/quantitative data, 15 were index/composite indicators, and 28 were survey/qualitative data.
3 Adopted from Groeneveld & Meeden (1984).
4 The six indicators are: 1.3.8 Robot density; 2.1.3 Migrant stock; 2.1.4 International students; 2.2.5 Gender development gap, 6.1.5 Senior officials and managers, and 6.2.2 High-value exports.
5 The formula ensures that natural logarithms are positive and start at zero. Transformation by natural logarithms was needed in the case of indicator 2.1.3 Migrant stock. For the other five variables, Winsorisation was sufficient to treat the outliers.
6 Reverse normalisation was needed for two indicators: 1.3.1 Tertiary-educated unemployment and 2.2.1 Tolerance of minorities.
REFERENCESGroeneveld, R. A. & Meeden, G. (1984). Measuring skewness and kurtosis. Journal
of the Royal Statistical Society, Series D (The Statistician), 33, 391–399.
Paruolo, P., Saisana, M., & Saltelli, A. (2013). Ratings and rankings: Voodoo or science? Journal of the Royal Statistical Society: Series A (Statistics in Society), 176, (3), 609–634.
OECD & EC JRC (2008). Handbook on constructing composite indicators: Methodology and user guide. Paris: OECD, available at http://www.oecd.org/sdd/42495745.pdf
APPENDIX I
348 THE GLOBAL TALENT COMPETITIVENESS INDEX 2020

Appendix IISources and Definitions


1 ENABLE1.1 Regulatory Landscape1.1.1 Government effectiveness
Government effectiveness indicator | 2017
The government effectiveness indicator captures perceptions of the quality of public services, the quality of the civil service and the degree of its independence from political pressures, the quality of policy formulation and implementation, and the credibility of the government’s commitment to such policies. Scores are standardised.
Source: World Bank, Worldwide Governance Indicators 2018 Update (www.govindicators.org)
1.1.2 Rule of lawRule of law indicator | 2017
The rule of law indicator ‘reflects perceptions of the extent to which agents have confidence in and abide by the rules of society, and in particular the quality of contract enforcement, property rights, the police, and the courts, as well as the likelihood of crime and violence’. Scores are standardised.
Source: World Bank, Worldwide Governance Indicators 2018 Update (www.govindicators.org)
1.1.3 Political stabilityPolitical stability and absence of violence indicator | 2017
The political stability and absence of violence indicator meas-ures perceptions of the likelihood of political instability and/or politically motivated violence, including terrorism. Scores are standardised.
Source: World Bank, Worldwide Governance Indicators 2018 Update (www.govindicators.org)
1.1.4 Regulatory qualityRegulatory quality indicator | 2017
The regulatory quality indicator captures perceptions of the ability of the government to formulate and implement sound policies and regulations that permit and promote private sector development. Scores are standardised.
Source: World Bank, Worldwide Governance Indicators 2018 Update (www.govindicators.org)
1.1.5 CorruptionCorruption Perceptions Index | 2018
The Corruption Perceptions Index aggregates data from a num-ber of different sources that provide perceptions of business people and country experts of the level of corruption in the public sector.
Source: Transparency International, The Corruption Perceptions Index 2018 (http://www.transparency.org/research/cpi)
1.2 Market Landscape1.2.1 Competition intensity
Average answer to the question: In your country, how intense is competition in the local markets? [1 = not intense at all; 7 = ex-tremely intense] | 2018
The World Economic Forum’s Executive Opinion Survey (EOS) is conducted on an annual basis to gather information from busi-ness leaders on topics for which hard data sources are scarce or nonexistent. It is part of the effort to supplement The Global Competitiveness Report in assessing issues that drive national competitiveness.
Source: World Economic Forum, Executive Opinion Survey 2017–2018 (http://reports.weforum.org)
1.2.2 Ease of doing businessEase of doing business index | 2018
The ease of doing business index aggregates a country’s per-centile rankings on 10 topics covered in the World Bank’s Doing Business report series. The topics are: starting a business, deal-ing with construction permits, getting electricity, registering property, getting credit, protecting minority investors, paying taxes, trading across borders, enforcing contracts, and resolv-ing insolvency. A high ranking indicates that the regulatory en-vironment is more conducive to setting up business.
Source: World Bank, Doing Business 2019: Training for Reform (http://www.doingbusiness.org/en/reports/global-reports/doing-business-2019)
Sources and Definitions
THE GLOBAL TALENT COMPETITIVENESS INDEX 2020 351
SOURCES AND DEFINITIONS

1.2.3 Cluster developmentAverage answer to the question: In your country, how wide-spread are well-developed and deep clusters (geographic con-centrations of firms, suppliers, producers of related products and services, and specialized institutions in a particular field)? [1 = nonexistent; 7 = widespread in many fields] | 2018
The World Economic Forum’s Executive Opinion Survey (EOS) is conducted on an annual basis to gather information from busi-ness leaders on topics for which hard data sources are scarce or nonexistent. It is part of the effort to supplement The Global Competitiveness Report in assessing issues that drive national competitiveness.
Source: World Economic Forum, Executive Opinion Survey 2017–2018 (http://reports.weforum.org)
1.2.4 R&D expenditureGross expenditure on R&D (%) | 2017
R&D expenditure refers to the total domestic intramural ex-penditure on research and development (R&D) during a given period as a percentage of GDP. Intramural R&D expenditure is all expenditure for R&D performed within a statistical unit or sector of the economy during a specific period, whatever the source of funds.
Source: UNESCO Institute for Statistics, UIS.Stat (http://data.uis.unesco.org/)
1.2.5 ICT infrastructureICT access index | 2017
The ICT access index is a composite indicator that aggregates five ICT indicators (at 20% each): (1) Fixed-telephone sub-scriptions per 100 inhabitants, (2) Mobile-cellular telephone subscriptions per 100 inhabitants, (3) International internet bandwidth (bit/s) per internet user, (4) Percentage of house-holds with a computer, and (5) Percentage of households with internet access. It is the first sub-index in ITU’s ICT Development Index (IDI).
Source: International Telecommunication Union, Measuring the Information Society Report 2017, ICT Development Index 2017 (http://www.itu.int/en/ITU-D/Statistics/Pages/publications/mis2017.aspx)
1.2.6 Urban populationPopulation of urban areas (%) | 2018
Urban population refers to people living in urban areas as de-fined by national statistical offices. The data are collected and smoothed by the United Nations Population Division.
Source: United Nations, Department of Economic and Social Affairs, Population Division, World Urbanization Prospects: The 2018 Revision (https://population.un.org/wup/)
1.3 Business and Labour Landscape
Labour Market1.3.1 Tertiary-educated unemployment
Unemployment rate with tertiary education (%) | 2018
This indicator refers to the percentage of the labour force with an advanced level of education who are unemployed. Ad-vanced education comprises short-cycle tertiary education, a bachelor’s degree or equivalent education level, a master’s degree or equivalent education level, or a doctoral degree or equivalent education level according to the International Standard Classification of Education 2011 (ISCED 2011).
Source: International Labour Organization, ILOSTAT (https://ilostat.ilo.org/)
1.3.2 Active labour market policiesAverage answer to the question: In your country, to what extent do labour market policies help unemployed people to reskill and find new employment (including skills matching, retrain-ing, etc.)? [1 = not at all; 7 = to a great extent] | 2018
The World Economic Forum’s Executive Opinion Survey (EOS) is conducted on an annual basis to gather information from busi-ness leaders on topics for which hard data sources are scarce or nonexistent. It is part of the effort to supplement The Global Competitiveness Report in assessing issues that drive national competitiveness.
Source: World Economic Forum, Executive Opinion Survey 2017–2018 (http://reports.weforum.org)
1.3.3 Labour-employer cooperationAverage answer to the question: In your country, how do you characterize labor-employer relations? [1 = generally confronta-tional; 7 = generally cooperative] | 2018
The World Economic Forum’s Executive Opinion Survey (EOS) is conducted on an annual basis to gather information from busi-ness leaders on topics for which hard data sources are scarce or nonexistent. It is part of the effort to supplement The Global Competitiveness Report in assessing issues that drive national competitiveness.
Source: World Economic Forum, Executive Opinion Survey 2017–2018 (http://reports.weforum.org)
Management Practice1.3.4 Professional management
Average answer to the question: In your country, who holds senior management positions in companies? [1 = usually rela-tives or friends without regard to merit; 7 = mostly professional managers chosen for merit and qualifications] | 2018
The World Economic Forum’s Executive Opinion Survey (EOS) is conducted on an annual basis to gather information from busi-ness leaders on topics for which hard data sources are scarce or nonexistent. It is part of the effort to supplement The Global Competitiveness Report in assessing issues that drive national competitiveness.
Source: World Economic Forum, Executive Opinion Survey 2017–2018 (http://reports.weforum.org)
SOURCES AND DEFINITIONSAPPENDIX II
352 THE GLOBAL TALENT COMPETITIVENESS INDEX 2020
1.3.5 Relationship of pay to productivityAverage answer to the question: In your country, to what extent is pay related to employee productivity? [1 = not at all; 7 = to a great extent] | 2018
The World Economic Forum’s Executive Opinion Survey (EOS) is conducted on an annual basis to gather information from busi-ness leaders on topics for which hard data sources are scarce or nonexistent. It is part of the effort to supplement The Global Competitiveness Report in assessing issues that drive national competitiveness.
Source: World Economic Forum, Executive Opinion Survey 2017–2018 (http://reports.weforum.org)
Technology Adoption1.3.6 Technology utilisation
Average answer to the question: In your country, to what ex-tent do businesses adopt the latest technologies? [1 = not at all; 7 = to a great extent] | 2018
The World Economic Forum’s Executive Opinion Survey (EOS) is conducted on an annual basis to gather information from busi-ness leaders on topics for which hard data sources are scarce or nonexistent. It is part of the effort to supplement The Global Competitiveness Report in assessing issues that drive national competitiveness.
Source: World Economic Forum, Executive Opinion Survey 2017–2018 (http://reports.weforum.org)
1.3.7 Investment in emerging technologiesAverage answer to the question: In your country, to what extent do companies invest in emerging technologies (e.g. Internet of Things, advanced analytics and artificial intelligence, augment-ed virtual reality and wearables, advanced robotics, 3D print-ing)? [1 = not at all; 7 = to a great extent] | 2018
The World Economic Forum’s Executive Opinion Survey (EOS) is conducted on an annual basis to gather information from busi-ness leaders on topics for which hard data sources are scarce or nonexistent. It is part of the effort to supplement The Global Competitiveness Report in assessing issues that drive national competitiveness.
Source: World Economic Forum, Executive Opinion Survey 2017–2018 (http://reports.weforum.org)
1.3.8 Robot densityNumber of robots in operation per 10,000 employees in the manufacturing industry | 2019
Robot density refers to the estimated number of multipurpose industrial robots per 10,000 persons employed in the manu-facturing industry (ISIC rev.4: C). The International Federation of Robotics (IFR) collects country-level data on operational stock of industrial robots and, for some countries, computes robot densities. The computed robot densities are published in the annual World Robotics report.
Source: Data on robot density and operational stock of industrial robots for 2019 kindly provided by the International Federation of Robotics (https://ifr.org). Data on employment in manufacturing in the countries for which IFR has not computed robot densities are sourced from the International Labour Organization, ILOSTAT (https://ilostat.ilo.org/)
2 ATTRACT2.1 External Openness
Attract Business2.1.1 FDI and technology transfer
Average answer to the question: To what extent does foreign direct investment (FDI) bring new technology into your coun-try? [1 = not at all; 7 = to a great extent] | 2018
The World Economic Forum’s Executive Opinion Survey (EOS) is conducted on an annual basis to gather information from busi-ness leaders on topics for which hard data sources are scarce or nonexistent. It is part of the effort to supplement The Global Competitiveness Report in assessing issues that drive national competitiveness.
Source: World Economic Forum, Executive Opinion Survey 2017–2018 (http://reports.weforum.org)
2.1.2 Prevalence of foreign ownershipAverage answer to the question: In your country, how prevalent is foreign ownership of companies? [1 = extremely rare; 7 = ex-tremely prevalent] | 2018
The World Economic Forum’s Executive Opinion Survey (EOS) is conducted on an annual basis to gather information from busi-ness leaders on topics for which hard data sources are scarce or nonexistent. It is part of the effort to supplement The Global Competitiveness Report in assessing issues that drive national competitiveness.
Source: World Economic Forum, Executive Opinion Survey 2017–2018 (http://reports.weforum.org)
Attract People2.1.3 Migrant stock
Adult migrant stock (%) | 2017
Adult migrant stock refers to the number of the migrant stock population above 25 years old as a percentage of the total pop-ulation of the same age group.
Source: United Nations Population Division, Trends in International Migrant Stock: Migrants by Age and Sex (www.un.org/en/development/desa/population/migration/data/estimates2/estimates17.shtml)
2.1.4 International studentsTertiary inbound mobility ratio (%) | 2017
Tertiary inbound mobility ratio refers to the number of students from abroad studying in a given country as a percentage of the total tertiary enrolment in that country.
Source: UNESCO Institute for Statistics, UIS.Stat (http://data.uis.unesco.org/)
SOURCES AND DEFINITIONS
THE GLOBAL TALENT COMPETITIVENESS INDEX 2020 353
APPENDIX II

2.1.5 Brain gainAverage answer to the question: To what extent does your country attract talented people from abroad? [1 = not at all; 7 = to a great extent—the country attracts the best and bright-est from around the world] | 2018
The World Economic Forum’s Executive Opinion Survey (EOS) is conducted on an annual basis to gather information from busi-ness leaders on topics for which hard data sources are scarce or nonexistent. It is part of the effort to supplement The Global Competitiveness Report in assessing issues that drive national competitiveness.
Source: World Economic Forum, Executive Opinion Survey 2017–2018 (http://reports.weforum.org)
2.2 Internal Openness
Social Inclusion2.2.1 Tolerance of minorities
Discrimination and violence against minorities | 2019
Tolerance of minorities is based on the Group Grievance indica-tor included in the Fragile States Index published by The Fund for Peace. Group Grievance ‘focuses on divisions and schisms between different groups in society—particularly divisions based on social or political characteristics—and their role in access to ser-vices or resources, and inclusion in the political process’. Its dimen-sions include post-conflict response, equality, divisions, and communal violence. It is measured on a scale of 0 (low pres-sures) to 10 (very high pressures).
Source: The Fund for Peace, Fragile States Index 2019 (https://fragilestatesindex.org/)
2.2.2 Tolerance of immigrantsThe percentage of respondents answering ‘Good place’ to the question: Is the city or area where you live a good place or not a good place to live for immigrants from other countries? | 2018
The Gallup World Poll is an annual survey carried out in more than 140 countries. One of the topics included in the poll con-cerns social issues, where the question related to the Tolerance of immigrants indicator is one of four questions asked.
Source: The Gallup World Poll (2006–2018). Data kindly provided by Gallup, Inc. (https://www.gallup.com/analytics/232838/world-poll.aspx)
2.2.3 Social mobilityAverage answer to the question: In your country, to what extent do individuals have the opportunity to improve their economic situation through their personal efforts regardless of the socio-economic status of their parents? [1 = not at all; 7 = to a great extent] | 2018
The World Economic Forum’s Executive Opinion Survey (EOS) is conducted on an annual basis to gather information from busi-ness leaders on topics for which hard data sources are scarce or nonexistent. It is part of the effort to supplement The Global Competitiveness Report in assessing issues that drive national competitiveness.
Source: World Economic Forum, Executive Opinion Survey 2017–2018 (http://reports.weforum.org)
Gender Equality2.2.4 Female graduates
Female tertiary graduates (%) | 2018
Female tertiary graduates refers to the percentage of female graduates whose highest educational attainment is the tertiary level. The tertiary level is based on International Standard Clas-sification of Education (ISCED) levels 5–8.
Source: UNESCO Institute for Statistics, UIS.Stat (http://data.uis.unesco.org/)
2.2.5 Gender development gapGender Development Index | 2017
The Gender Development Index (GDI) refers to disparities be-tween women and men in three basic dimensions of human development—health, knowledge, and living standards. Based on the same methodology and component indicators as the Human Development Index (HDI), the GDI is a direct measure of gender gap showing the female HDI as a percentage of the male HDI.
Source: United Nations Development Programme (UNDP), Human Development Indices and Indicators: 2018 Statistical Update (http://hdr.undp.org/en/content/gender-development-index-gdi)
2.2.6 Leadership opportunities for womenAverage answer to the question: In your country, to what extent do companies provide women with the same opportunities as men to rise to positions of leadership? [1 = not at all; 7 = to a great extent] | 2018
The World Economic Forum’s Executive Opinion Survey (EOS) is conducted on an annual basis to gather information from busi-ness leaders on topics for which hard data sources are scarce or nonexistent. It is part of the effort to supplement The Global Competitiveness Report in assessing issues that drive national competitiveness.
Source: World Economic Forum, Executive Opinion Survey 2017–2018 (http://reports.weforum.org)
3 GROW3.1 Formal Education
Enrolment3.1.1 Vocational enrolment
Vocational enrolment (%) | 2018
Vocational enrolment refers to the total number of students enroled in vocational programmes in secondary education, expressed as a percentage of the total number of students en-roled in all programmes (vocational and general) at that level. The secondary level is based on International Standard Classifi-cation of Education (ISCED) levels 2–4.
Source: UNESCO Institute for Statistics, UIS.Stat (http://data.uis.unesco.org/)
SOURCES AND DEFINITIONSAPPENDIX II
354 THE GLOBAL TALENT COMPETITIVENESS INDEX 2020
3.1.2 Tertiary enrolmentTertiary enrolment (%) | 2018
Tertiary enrolment refers to the ratio of total tertiary enrolment, regardless of age, to the population of the age group that of-ficially corresponds to the tertiary level of education. Tertiary education, whether or not to an advanced research qualifica-tion, normally requires as a minimum condition of admission the successful completion of education at the secondary level. The tertiary level is based on International Standard Classifica-tion of Education (ISCED) levels 5–8.
Source: UNESCO Institute for Statistics, UIS.Stat (http://data.uis.unesco.org/)
Quality3.1.3 Tertiary education expenditure
Government expenditure on tertiary education (%) | 2018
Government expenditure on tertiary education as a percentage of GDP. Tertiary education is based on International Standard Classification of Education (ISCED) levels 5–8.
Source: UNESCO Institute for Statistics, UIS.Stat (http://data.uis.unesco.org/)
3.1.4 Reading, maths, and sciencePISA average scores in reading, mathematics, and science | 2015
The OECD Programme for International Student Assessment (PISA) develops triennial surveys that examine 15-year-old students’ performance in reading, mathematics, and science. The scores are calculated so that the mean is 500 and the standard deviation is 100. The scores for China come from Beijing-Shanghai-Jiangsu-Guangdong.
Source: OECD Programme for International Student Assessment (PISA) (www.oecd.org/pisa)
3.1.5 University rankingQS World University Ranking | 2019
The QS World University Ranking is based on six indicators (with their weights in parentheses): (1) Academic reputation from global survey (40%), (2) Employer reputation from global survey (10%), (3) Citations per faculty from Elsevier’s Scopus database (20%), (4) Faculty-student ratio (20%), (5) Proportion of interna-tional students (5%), and (6) Proportion of international faculty (5%). The value is derived from the average score of the top three universities per country. A country without any university in the ranking is given a score of 0.
Source: Quacquarelli Symonds Ltd (QS), QS World University Ranking 2020, Top Universities (www.topuniversities.com/university-rankings/world-university-rankings)
3.2 Lifelong Learning3.2.1 Quality of management schools
Average answer to the question: In your country, how do you assess the quality of business schools? [1 = extremely poor—among the worst in the world; 7 = excellent—among the best in the world] | 2018
The World Economic Forum’s Executive Opinion Survey (EOS) is conducted on an annual basis to gather information from busi-ness leaders on topics for which hard data sources are scarce or nonexistent. It is part of the effort to supplement The Global Competitiveness Report in assessing issues that drive national competitiveness.
Source: World Economic Forum, Executive Opinion Survey 2017–2018 (http://reports.weforum.org)
3.2.2 Prevalence of training in firmsProportion of firms offering formal training (%) | 2019
The Enterprise Survey is a firm-level survey of a representative sample of an economy’s private sector. The survey covers a broad range of business environment topics including access to finance, corruption, infrastructure, crime, competition, and performance measures. Since 2005–06, under its developed Global Methodology, the World Bank’s Enterprise Analysis Unit has collected these data based on over 135,000 interviews with top managers and business owners in 139 economies.
Source: World Bank, Enterprise Surveys (www.enterprisesurveys.org)
3.2.3 Employee developmentAverage answer to the question: In your country, to what extent do companies invest in training and employee development? [1 = not at all; 7 = to a great extent] | 2018
The World Economic Forum’s Executive Opinion Survey (EOS) is conducted on an annual basis to gather information from busi-ness leaders on topics for which hard data sources are scarce or nonexistent. It is part of the effort to supplement the The Global Competitiveness Report in assessing issues that drive national competitiveness.
Source: World Economic Forum, Executive Opinion Survey 2017–2018 (http://reports.weforum.org)
3.3 Access to Growth Opportunities
Empowerment3.3.1 Delegation of authority
Average answer to the question: In your country, to what extent does senior management delegate authority to subordinates? [1 = not at all; 7 = to a great extent] | 2018
The World Economic Forum’s Executive Opinion Survey (EOS) is conducted on an annual basis to gather information from busi-ness leaders on topics for which hard data sources are scarce or nonexistent. It is part of the effort to supplement The Global Competitiveness Report in assessing issues that drive national competitiveness.
Source: World Economic Forum, Executive Opinion Survey 2017–2018 (http://reports.weforum.org)
SOURCES AND DEFINITIONS
THE GLOBAL TALENT COMPETITIVENESS INDEX 2020 355
APPENDIX II

3.3.2 Personal rightsPersonal rights indicator | 2019
Personal Rights are a component in the Opportunity dimension of the Social Progress Index. This component is based on four variables: Political rights, Freedom of expression, Freedom of religion, Access to justice, and Property rights for women.
Source: Social Progress Imperative, The Social Progress Index 2019 (https://www.socialprogress.org/)
Collaboration3.3.3 Use of virtual social networks
Average answer to the question: In your country, how widely are virtual social networks used (e.g., Facebook, Twitter, Linked-In)? [1 = not at all used; 7 = used extensively] | 2018
The World Economic Forum’s Executive Opinion Survey (EOS) is conducted on an annual basis to gather information from busi-ness leaders on topics for which hard data sources are scarce or nonexistent. It is part of the effort to supplement The Global Competitiveness Report in assessing issues that drive national competitiveness.
Source: World Economic Forum, Executive Opinion Survey 2017–2018 (http://reports.weforum.org)
3.3.4 Use of virtual professional networksLinkedIn users (per 1,000 labour force) | 2018
LinkedIn users refers to the number of registered LinkedIn ac-counts per 1,000 labour force (15–64 years old).
Source: Data on LinkedIn users kindly provided by LinkedIn. Data on labour force are sourced from the International Labour Organization, ILOSTAT (https://ilostat.ilo.org/)
3.3.5 Collaboration within organisationsAverage answer to the question: In your country, to what ex-tent do people collaborate and share ideas within a company? [1 = not at all; 7 = to a great extent] | 2018
The World Economic Forum’s Executive Opinion Survey (EOS) is conducted on an annual basis to gather information from busi-ness leaders on topics for which hard data sources are scarce or nonexistent. It is part of the effort to supplement The Global Competitiveness Report in assessing issues that drive national competitiveness.
Source: World Economic Forum, Executive Opinion Survey 2017–2018 (http://reports.weforum.org)
3.3.6 Collaboration across organisationsAverage answer to the question: In your country, to what ex-tent do companies collaborate in sharing ideas and innovating? [1 = not at all; 7 = to a great extent] | 2018
The World Economic Forum’s Executive Opinion Survey (EOS) is conducted on an annual basis to gather information from busi-ness leaders on topics for which hard data sources are scarce or nonexistent. It is part of the effort to supplement The Global Competitiveness Report in assessing issues that drive national competitiveness.
Source: World Economic Forum, Executive Opinion Survey 2017–2018 (http://reports.weforum.org)
4 RETAIN4.1 Sustainability4.1.1 Pension system
Workforce contributing to pension system (%) | 2015
Pension system refers to old-age effective coverage in terms of contributors. It is reported as the percentage of people who are 15 years old or above who contribute to a pension scheme.
Source: International Labour Organization, World Social Protection Report 2017–19 (https://www.social-protection.org)
4.1.2 Social protectionAverage answer to the question: In your country, to what extent does a formal social safety net provide protection to the gener-al population from economic insecurity in the event of job loss or disability? [1 = not at all; 7 = provides full protection] | 2018
The World Economic Forum’s Executive Opinion Survey (EOS) is conducted on an annual basis to gather information from busi-ness leaders on topics for which hard data sources are scarce or nonexistent. It is part of the effort to supplement The Global Competitiveness Report in assessing issues that drive national competitiveness.
Source: World Economic Forum, Executive Opinion Survey 2017–2018 (http://reports.weforum.org)
4.1.3 Brain retentionAverage answer to the question: To what extent does your country retain talented people? [1 = not at all—the best and brightest leave to pursue opportunities abroad; 7 = to a great extent—the best and brightest stay and pursue opportunities in the country] | 2018
The World Economic Forum’s Executive Opinion Survey (EOS) is conducted on an annual basis to gather information from busi-ness leaders on topics for which hard data sources are scarce or nonexistent. It is part of the effort to supplement The Global Competitiveness Report in assessing issues that drive national competitiveness.
Source: World Economic Forum, Executive Opinion Survey 2017–2018 (http://reports.weforum.org)
4.2 Lifestyle4.2.1 Environmental performance
Environmental Performance Index | 2018
The Environmental Performance Index (EPI) ranks how well countries perform in two fundamental dimensions of sustain-able development: environmental health and ecosystem vi-tality. Indicators in the EPI measure how close countries are to meeting internationally established targets or, in the absence of agreed-upon targets, how they compare relative to the best-performing countries.
Source: Wendling, Z. A., Emerson, J. W., Esty, D. C., Levy, M. A., de Sherbinin, A., et al. (2018). 2018 Environmental Performance Index. New Haven, CT: Yale Center for Environmental Law & Policy (https://epi.envirocenter.yale.edu/)
SOURCES AND DEFINITIONSAPPENDIX II
356 THE GLOBAL TALENT COMPETITIVENESS INDEX 2020
4.2.2 Personal safetyPersonal safety indicator | 2019
Personal safety is a component in the Basic Human Needs di-mension of the Social Progress Index. This component is based on four variables: Homicide rate, Perceived criminality, Political killings and torture, and Traffic deaths.
Source: Social Progress Imperative, The Social Progress Index 2019 (https://www.socialprogress.org/)
4.2.3 Physician densityPhysicians (per 1,000 people) | 2016
Physician density refers to the number of medical doctors (physi-cians), including generalist and specialist medical prac titioners, per 1,000 people.
Source: World Bank, World Development Indicators based on World Health Organization, Global Atlas of the Health Workforce; OECD; and country data (http://data.worldbank.org/data-catalog/world-development-indicators)
4.2.4 SanitationPopulation with access to improved sanitation facilities (%) | 2015
This indicator refers to the percentage of the population using at least basic sanitation services—that is, improved sanitation facilities that are not shared with other households. This indica-tor encompasses both people using basic sanitation services as well as those using safely managed sanitation services. Im-proved sanitation facilities include flush/pour-flush to piped sewer systems, septic tanks or pit latrines; ventilated improved pit latrines, compositing toilets or pit latrines with slabs.
Source: World Bank, World Development Indicators based on WHO/UNICEF Joint Monitoring Programme (JMP) for Water Supply, Sanitation and Hygiene (http://data.worldbank.org/data-catalog/world-development-indicators)
5 VOCATIONAL AND TECHNICAL SKILLS
5.1 Mid-Level Skills5.1.1 Workforce with secondary education
Labour force with secondary education (%) | 2018
Workforce with secondary education refers to the percentage of the labour force (above 15 years old) whose highest educa-tional attainment is at the secondary level. Secondary level in-cludes both upper secondary and post-secondary non-tertiary education based on International Standard Classification of Education (ISCED) levels 3–4.
Source: International Labour Organization, ILOSTAT (https://ilostat.ilo.org/)
5.1.2 Population with secondary educationPopulation with secondary education (%) | 2018
Population with secondary education refers to the percentage of the population (above 25 years old) whose highest educational attainment is at the secondary level. This is based on Interna-tional Standard Classification of Education (ISCED) levels 3–4.
Source: UNESCO Institute for Statistics, UIS.Stat (http://data.uis.unesco.org/)
5.1.3 Technicians and associate professionalsTechnicians and associate professionals (%) | 2018
Technicians and associate professionals refers to the number of technicians and associate professionals as a share of the total workforce. The employment by occupation is based on the International Standard Classification of Occupation (ISCO) Re-vision 2008 (data based on ISCO Rev. 1988 is used for those countries where ISCO Rev. 2008 is not available). It includes physical and engineering science associate professionals, life science and health associate professionals, teaching associate professionals, and other associate professionals (finance and sales, social work, artistic, entertainment and sports, religious associate professionals, police inspectors and detectives, ad-ministrative, customs, and tax and related government associ-ate professionals).
Source: International Labour Organization, ILOSTAT (https://ilostat.ilo.org/)
5.1.4 Labour productivity per employeeLabour productivity per person employed (2018 US$) | 2019
The Conference Board provides two calculations of its esti-mates on output, labour, and labour productivity: an original version based on official GDP data and an adjusted version based on GDP growth and levels that take into account rapidly falling ICT prices. Labour productivity per employee is based on the estimates of the adjusted version.
Source: The Conference Board, Total Economy Database™ (Adjusted version) (www.conference-board.org/data/economydatabase)
5.2 Employability5.2.1 Ease of finding skilled employees
Average answer to the question: In your country, to what extent can companies find people with the skills required to fill their vacancies? [1 = not at all; 7 = to a great extent] | 2018
The World Economic Forum’s Executive Opinion Survey (EOS) is conducted on an annual basis to gather information from busi-ness leaders on topics for which hard data sources are scarce or nonexistent. It is part of the effort to supplement The Global Competitiveness Report in assessing issues that drive national competitiveness.
Source: World Economic Forum, Executive Opinion Survey 2017–2018 (http://reports.weforum.org)
SOURCES AND DEFINITIONS
THE GLOBAL TALENT COMPETITIVENESS INDEX 2020 357
APPENDIX II
5.2.2 Relevance of education system to the economyAverage answer to the question: In your country, how well does the education system meet the needs of a competitive econo-my? [1 = not well at all; 7 = extremely well] | 2018
The World Economic Forum’s Executive Opinion Survey (EOS) is conducted on an annual basis to gather information from busi-ness leaders on topics for which hard data sources are scarce or nonexistent. It is part of the effort to supplement The Global Competitiveness Report in assessing issues that drive national competitiveness.
Source: World Economic Forum, Executive Opinion Survey 2017–2018 (http://reports.weforum.org)
5.2.3 Skills matching with secondary educationAverage answer to the question: In your country, to what extent do graduating students possess the skills needed by businesses at the following levels: a. Secondary education [1 = not at all; 7 = to a great extent] | 2018
The World Economic Forum’s Executive Opinion Survey (EOS) is conducted on an annual basis to gather information from busi-ness leaders on topics for which hard data sources are scarce or nonexistent. It is part of the effort to supplement The Global Competitiveness Report in assessing issues that drive national competitiveness.
Source: World Economic Forum, Executive Opinion Survey 2017–2018 (http://reports.weforum.org)
5.2.4 Skills matching with tertiary educationAverage answer to the question: In your country, to what extent do graduating students possess the skills needed by businesses at the following levels: b. University level [1 = not at all; 7 = to a great extent] | 2018
The World Economic Forum’s Executive Opinion Survey (EOS) is conducted on an annual basis to gather information from busi-ness leaders on topics for which hard data sources are scarce or nonexistent. It is part of the effort to supplement The Global Competitiveness Report in assessing issues that drive national competitiveness.
Source: World Economic Forum, Executive Opinion Survey 2017–2018 (http://reports.weforum.org)
6 GLOBAL KNOWLEDGE SKILLS
6.1 High-Level Skills6.1.1 Workforce with tertiary education
Labour force with tertiary education (%) | 2018
Workforce with tertiary education refers to the percentage of the labour force (above 15 years old) whose highest educational attainment is at the tertiary level. The tertiary level is based on International Standard Classification of Education (ISCED) levels 5–8.
Source: International Labour Organization, ILOSTAT (https://ilostat.ilo.org/)
6.1.2 Population with tertiary educationPopulation with tertiary education (%) | 2017
Population with tertiary education refers to the percentage of the population (above 25 years old) whose highest educational attainment is at the tertiary level. The tertiary level is based on International Standard Classification of Education (ISCED) levels 5–8.
Source: UNESCO Institute for Statistics, UIS.Stat (http://data.uis.unesco.org/)
6.1.3 ProfessionalsProfessionals (%) | 2018
Professionals refers to the number of professionals as a share of the total workforce. The employment by occupation is based on the International Standard Classification of Occupation (ISCO) Revision 2008 (data based on ISCO Rev. 1988 is used for those countries where ISCO Rev. 2008 is not available). It includes physical, mathematical, and engineering science pro-fessionals; life science and health professionals; teaching pro-fessionals; and other professionals (business, legal, archivists, librarians, social science, religious professionals, writers, and creative or performing artists).
Source: International Labour Organization, ILOSTAT (https://ilostat.ilo.org/)
6.1.4 ResearchersFull-time equivalent researchers (per million population) | 2017
Researchers are professionals engaged in the conception or creation of new knowledge, products, processes, methods, or systems, as well as the management of these projects. Full-time equivalence (FTE) R&D data are a measure of the actual volume of human resources devoted to R&D and are especially useful for international comparisons. ‘One FTE may be thought of as one person-year. Thus, a person who normally spends 30% of time on R&D and the rest on other activities (such as teaching, university administration, and student counselling) should be considered as 0.3 FTE. Similarly, if a full-time R&D worker is employed at an R&D unit for only six months, this results in an FTE of 0.5.’ The data are reported per million population.
Source: UNESCO Institute for Statistics, UIS.Stat (http://data.uis.unesco.org/)
6.1.5 Senior officials and managersLegislators, senior officials, and managers (%) | 2018
This variable measures the percentage of legislators, senior offi-cials, and managers within total employment. The employment by occupation is based on the International Standard Classifica-tion of Occupation (ISCO) Revision 2008 (data based on ISCO Rev. 1988 is used for those countries where ISCO Rev. 2008 is not available).
Source: International Labour Organization, ILOSTAT (https://ilostat.ilo.org/)
SOURCES AND DEFINITIONSAPPENDIX II
358 THE GLOBAL TALENT COMPETITIVENESS INDEX 2020

6.1.6 Availability of scientists and engineersAverage answer to the question: In your country, to what extent are scientists and engineers available? [1 = not at all; 7 = widely available] | 2018
The World Economic Forum’s Executive Opinion Survey (EOS) is conducted on an annual basis to gather information from busi-ness leaders on topics for which hard data sources are scarce or nonexistent. It is part of the effort to supplement The Global Competitiveness Report in assessing issues that drive national competitiveness.
Source: World Economic Forum, Executive Opinion Survey 2017–2018 (http://reports.weforum.org)
6.2 Talent Impact6.2.1 Innovation output
Innovation Output Sub-Index | 2019
The Global Innovation Index (GII), developed jointly by INSEAD and the World Intellectual Property Organization, aims to cap-ture the richness of innovation in society. Innovation output is one of the two sub-indices in the GII, which is derived by ag-gregating two output pillars: Knowledge and Technology Out-puts and Creative Outputs. The first pillar covers elements of knowledge creation, impact, and diffusion, while the second pillar includes creative intangibles, creative goods and services, and online creativity.
Source: INSEAD, Cornell University, and World Intellectual Property Organization, The Global Innovation Index 2019 (https://www.globalinnovationindex.org)
6.2.2 High-value exportsHigh technology manufactures (%) | 2017
High-value exports here refers to high technology manufactures (electronic and electrical and other), as calculated according to the Lall classification, over exports of all manufactured goods.
Source: World Bank, World Development Indicators (http://data.worldbank.org/data-catalog/world-development-indicators). The classification of exports is based on Lall, S. (2000), The Technological Structure and Performance of Developing Country Manufactured Exports, Oxford Development Studies 28(3), 1985–1989
6.2.3 New product entrepreneurial activityNew product entrepreneurial activity (%) | 2018
New product entrepreneurial activity refers to the percentage of total early-stage entrepreneurs who indicate that their product or service is new to at least some customers AND that few/no other businesses offer the same product. The Global Entrepre-neurship Monitor project is an annual assessment of the en-trepreneurial activity, aspirations, and attitudes of individuals across a wide range of countries.
Source: Global Entrepreneurship Research Association, Global Entrepreneurship Monitor database (www.gemconsortium.org/data)
6.2.4 New business densityNew corporate registrations (per 1,000 working-age popula-tion) | 2016
New business density is defined as the number of newly regis-tered firms with limited liability per 1,000 working-age people (between 15 and 64 years old) per calendar year.
Source: World Bank, Doing Business, Entrepreneurship Project (http://www.doingbusiness.org/en/data/exploretopics/entrepreneurship)
6.2.5 Scientific journal articlesNumber of scientific and technical journal articles (per 10,000 inhabitants) | 2016
Scientific and technical journal articles refers to the number of scientific and engineering articles published in the following fields: physics, biology, chemistry, mathematics, clinical medi-cine, biomedical research, engineering and technology, and earth and space sciences. The data are reported per 10,000 inhabitants.
Source: World Bank, World Development Indicators based on National Science Foundation, Science and Engineering Indicators; population data come from World Bank, World Development Indicators (http://data.worldbank.org/data-catalog/world-development-indicators)
SOURCES AND DEFINITIONS
THE GLOBAL TALENT COMPETITIVENESS INDEX 2020 359
APPENDIX II

Appendix IIIAbout the Contributors and Partners

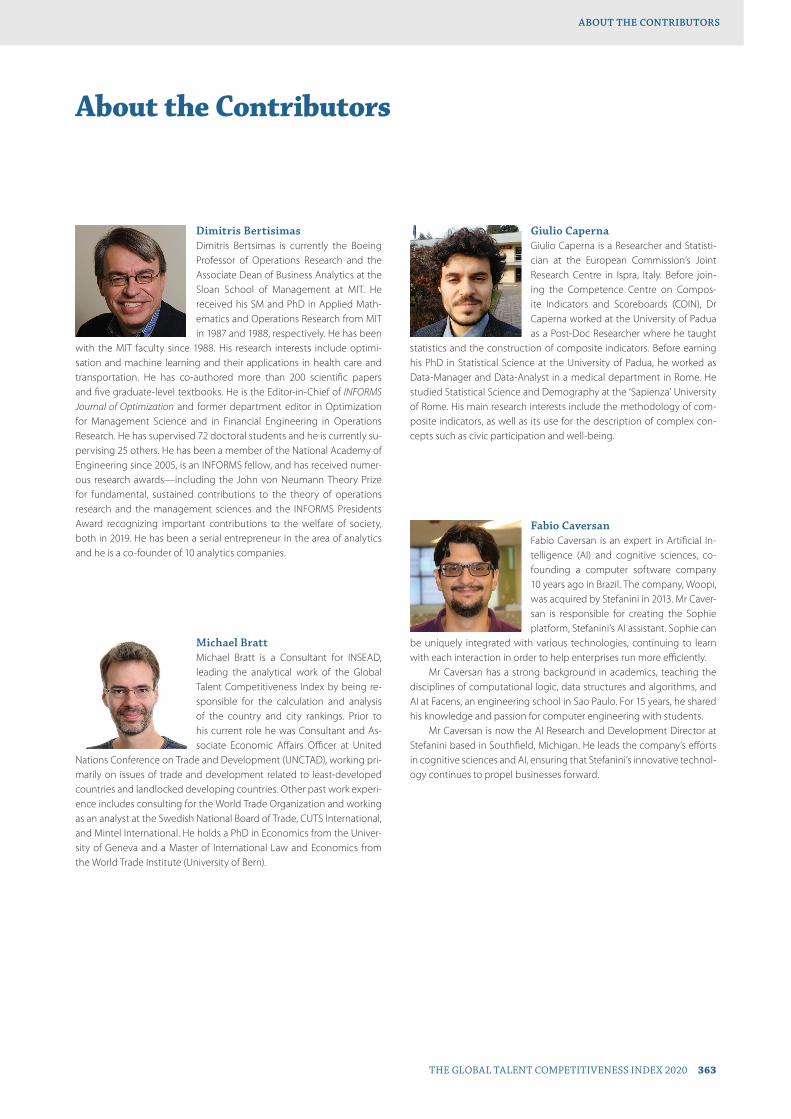
Dimitris BertisimasDimitris Bertsimas is currently the Boeing Professor of Operations Research and the Associate Dean of Business Analytics at the Sloan School of Management at MIT. He received his SM and PhD in Applied Math-ematics and Operations Research from MIT in 1987 and 1988, respectively. He has been
with the MIT faculty since 1988. His research interests include optimi-sation and machine learning and their applications in health care and transportation. He has co-authored more than 200 scientific papers and five graduate-level textbooks. He is the Editor-in-Chief of INFORMS Journal of Optimization and former department editor in Optimization for Management Science and in Financial Engineering in Operations Research. He has supervised 72 doctoral students and he is currently su-pervising 25 others. He has been a member of the National Academy of Engineering since 2005, is an INFORMS fellow, and has received numer-ous research awards—including the John von Neumann Theory Prize for fundamental, sustained contributions to the theory of operations research and the management sciences and the INFORMS Presidents Award recognizing important contributions to the welfare of society, both in 2019. He has been a serial entrepreneur in the area of analytics and he is a co-founder of 10 analytics companies.
Michael BrattMichael Bratt is a Consultant for INSEAD, leading the analytical work of the Global Talent Competitiveness Index by being re-sponsible for the calculation and analysis of the country and city rankings. Prior to his current role he was Consultant and As-sociate Economic Affairs Officer at United
Nations Conference on Trade and Development (UNCTAD), working pri-marily on issues of trade and development related to least-developed countries and landlocked developing countries. Other past work experi-ence includes consulting for the World Trade Organization and working as an analyst at the Swedish National Board of Trade, CUTS International, and Mintel International. He holds a PhD in Economics from the Univer-sity of Geneva and a Master of International Law and Economics from the World Trade Institute (University of Bern).
Giulio CapernaGiulio Caperna is a Researcher and Statisti-cian at the European Commission’s Joint Research Centre in Ispra, Italy. Before join-ing the Competence Centre on Compos-ite Indicators and Scoreboards (COIN), Dr Caperna worked at the University of Padua as a Post-Doc Researcher where he taught
statistics and the construction of composite indicators. Before earning his PhD in Statistical Science at the University of Padua, he worked as Data-Manager and Data-Analyst in a medical department in Rome. He studied Statistical Science and Demography at the ‘Sapienza’ University of Rome. His main research interests include the methodology of com-posite indicators, as well as its use for the description of complex con-cepts such as civic participation and well-being.
Fabio CaversanFabio Caversan is an expert in Artificial In-telligence (AI) and cognitive sciences, co-founding a computer software company 10 years ago in Brazil. The company, Woopi, was acquired by Stefanini in 2013. Mr Caver-san is responsible for creating the Sophie platform, Stefanini’s AI assistant. Sophie can
be uniquely integrated with various technologies, continuing to learn with each interaction in order to help enterprises run more efficiently.
Mr Caversan has a strong background in academics, teaching the disciplines of computational logic, data structures and algorithms, and AI at Facens, an engineering school in Sao Paulo. For 15 years, he shared his knowledge and passion for computer engineering with students.
Mr Caversan is now the AI Research and Development Director at Stefanini based in Southfield, Michigan. He leads the company’s efforts in cognitive sciences and AI, ensuring that Stefanini’s innovative technol-ogy continues to propel businesses forward.
About the Contributors
ABOUT THE CONTRIBUTORS
THE GLOBAL TALENT COMPETITIVENESS INDEX 2020 363
Anja HendelSince 2017, Anja Hendel has been Direc-tor of Innovation Management and Digital Transformation for Finance at Porsche AG and she works alongside Dr Mahdi Derakh-shanmanesh to head up the Porsche Digital Lab in Berlin. This technical laboratory is a platform for collaborating with technology
companies, start-ups, and scientific institutions, and deals with the prac-tical application of concepts such as blockchain, Artificial Intelligence, and the internet of things at Porsche. With a degree in Business Data Pro-cessing, Anja Hendel worked as Assistant to the Chief Financial Officer at Porsche from 2015 onwards, and was responsible for the IT portfolio and strategy from 2013 onwards.
Before joining Porsche, she managed various departments at former pharmaceutical company Celesio AG (now known as McKesson Europe AG) from 2007 onwards, including the ‘SAP services’ and ‘IT project port-folio’ departments. Prior to these roles, Ms Hendel worked at Stuttgart-based consulting firm Capgemini Deutschland GmbH for six years.
Ivan Jiménez AiraVersatile director and dedicated, Ivan Jimé-nez Aira has eight years of experience as Managing Director in Bizkaia Talent, an or-ganisation with international expansion and a close relationship with the entire Basque network of science and technology and building connections with European and
worldwide organisations focused on Talent Attraction. With the support of the Department for Economic Development of the Provincial Council of Bizkaia, and the largest Basque enterprises, technology and research centres, and all the Basques universities, Bizkaia Talent was established in 2005 as a non-profit organisation with a clear mission: to foster and facilitate the implementation of the necessary conditions for attracting, connecting, and retaining in the Basque Country highly qualified people in the areas of knowledge and innovation. Mr Jiménez Aira has been a participant in many international conferences as a speaker and author of different articles in the international press about territorial talent man-agement and the different services and tools of Bizkaia Talent as one of the best examples worldwide. He is also the promoter and creator of the ‘Bebasquetalentnetwork’, the largest network of professionals related to the Basque Country, with more than 13,000 people in more than 100 countries around the world. Finally, he is also the promoter and creator of the Basque Talent Observatory, Be Basque Career Development and Headhunting support centres, and of the first Dual Career Centre in the Spanish State, ‘Bebasque Dual Career Centre’.
Alain DehazeAlain Dehaze is CEO of the Adecco Group, the world’s leading HR solutions company. Through its international brands Adecco, Adia, Modis, Badenoch & Clark, General Assembly, Lee Hecht Harrison, Pontoon, Spring Professional, Vettery, and YOSS, the Adecco Group delivers on its mission to
make the future work for everyone.As a Fortune 500 Company, the Adecco Group enables around
3.5 million people to participate in the world of work and assists more than 100,000 organisations successfully navigate the work-life cycle. With 34,000 full-time team members in 60 countries, the Adecco Group ranked 11th on the 2019 World’s Best Workplaces list, the only HR solu-tions company in the top 25.
The 55-year-old Belgian national graduated as a Commercial Engi-neer from the ICHEC Brussels Management School before rising through the ranks at Henkel and ISS. He joined the workforce solutions sector in 2000, when he was appointed Managing Director of Creyf’s Interim in Belgium. His path took him to the CEO position at Solvus, COO of USG People—when the latter took over Solvus—and CEO of the Dutch staff-ing services company Humares between 2007 and 2009.
Mr Dehaze joined the Adecco Group in 2009 as a member of the Executive Committee, responsible first for Northern Europe, then for the Group’s largest market, France, before taking on the CEO position in September 2015. Mr Dehaze plays an active role in shaping the labour markets of tomorrow as board member of the Global Apprenticeship Network (GAN), a member of the ILO Global Commission on the Future of Work, and as Steward of the World Economic Forum’s System Initiative ‘Shaping the Future of Education, Work and Gender’.
Before leading the Adecco Group, he held board positions at the sector level with the World Employment Confederation, including the Vice-Presidency of the World Employment Confederation Europe (for-merly EUROCIETT).
Theodoros (Theos) EvgeniouProfessor Evgeniou has been working on Machine Learning and AI for more than 20 years, in areas ranging from computer vision to marketing, project management, healthcare, and finance, among others. He received four degrees from MIT: two BS degrees simultaneously, one in Computer
Science, and one in Mathematics, also graduating first in the MIT dual degrees in Mathematics class; he also earned master’s and PhD degrees in Computer Science in the field of machine learning and AI. At INSEAD he has been developing and teaching courses on Data Science and Machine Learning/AI for Managers and Executives, on Decision-Making, and on IT strategies. Professor Evgeniou gives talks and consults for a number of organisations in his areas of expertise. In recent years he has been also an advisor for hedge funds. More recently his interests focus on the broader topic of AI, business, and society, working on areas ranging from AI and regulation to AI innovations for business process optimisation to new methodologies—for example, for explainable AI. He is particularly interested in innovative ‘Human+Machine’ models to improve business decisions and performance.
ABOUT THE CONTRIBUTORSAPPENDIX III
364 THE GLOBAL TALENT COMPETITIVENESS INDEX 2020
Valentina MontaltoValentina Montalto has 10 years of profes-sional experience, combining work in the private sector as researcher and project manager, and in the public sector as policy analyst, with a focus on the potential of culture for economic and social well-being. She is currently a Research Fellow at the
Competence Centre on Composite Indicators and Scoreboards (COIN) of the Joint Research Centre of the European Commission (Italy), where she is coordinating the team developing the ‘Cultural and Creative Cities Monitor’ project. Prior to joining the European Commission, she worked at the Brussels-based research and advisory company KEA where she co-authored policy-oriented reports assessing the potential of culture for local and regional development and evaluating the relevance and accuracy of available cultural statistics, on behalf of both European insti-tutions and city authorities. Her educational background is in Statistics for the Social Sciences (KU Leuven – QASS Master Degree, 2015), Cultural Economics and Management (University of Bologna – GIOCA Master Degree, 2009), and Tourism Economics (University of Palermo – EGST Bachelor Degree 2006). Dr Montalto was a student at the Collegio Su-periore – Excellence School of the University of Bologna, and a visiting student at Carnegie Mellon University (CMU) in Pittsburgh (USA) and at the Ecole Normale Supérieure in Lyon (France).
Felipe MonteiroFelipe Monteiro is the Academic Director of the GTCI, Senior Affiliate Professor of Strat-egy at INSEAD, France, and a Senior Fellow of the Wharton School Mack Institute for Innovation Management. Before joining INSEAD, he was a standing faculty member at the Wharton School. He has also worked
as a Senior Researcher at the Harvard Business School’s Latin American Research Center in Brazil and taught at the London School of Econom-ics (LSE).
His research explaining the patterns of inter- and intra-firm knowl-edge-sourcing processes in multinational organisations has been published in top academic journals such as the Strategic Management Journal, Organization Science, Research Policy, and the Journal of Inter-national Business Studies, among others. His research has also received prestigious awards from the Strategic Management Society, the Acad-emy of Management, and the Academy of International Business. He has received multiple teaching awards and published several case studies at Harvard Business School, London Business School, and INSEAD.
Professor Monteiro obtained his PhD in Strategic and Interna-tional Management at the London Business School. He also has an LLB (JD equivalent) degree, cum laude, from the Federal University of Rio de Janeiro, an MSc in Business Administration from COPPEAD/UFRJ, Brazil, and an MRes in Business Studies from London Business School.
Leire Lagunilla RamosLeire Lagunilla is the Innovation Manager at Bizkaia Talent. She is also the coordinator of the Be Basque Talent Conferences, inter-national professional networking meetings, which bring together a number of Basque players coming from industry and aca-demia, as well as from public administration
with highly qualified professionals working abroad. She also participates in various international projects, such as The Wellbeing Project.
In 2018 Ms Lagunilla was appointed President of Seber Altube Ikas-tola, S.Coop., an educational cooperative that is part of the European Cooperative Ikastolen Elkartea that coalesces around 110 educational centres and 56,000 pupils and students. Its educational model is based on the pedagogy of trust; that is, putting the children and youngsters in the centre, providing them the tools to believe in themselves, to trust others and the environment.
Before joining Bizkaia Talent, she developed professionally at the finance department of a big aluminium multinational, a BigFour consul-tancy providing advice to a public sector entity and within the Human Resources area at Airbus Operations GmbH in Germany. Ms Lagunilla holds a Business Administration and Management degree and an MBA in Managerial Development from the Deusto Business School - Deusto University and a Master’s degree on Open Innovation and Intrapreneur-ship from MTA – Mondragon Team Academy, Mondragon University.
Bruno LanvinBruno Lanvin is the Executive Director of INSEAD’s Global Indices (the Networked Readiness Index of the Global Information Technology Report, the Global Innovation Index, and the Global Talent Competitive-ness Index). Before joining INSEAD, he worked for the World Bank, where he was
inter alia Senior Advisor for E-strategies, Regional Coordinator (Europe and Central Asia) for ICT and e-government issues, and Chairman of the Bank’s e-Thematic Group.
Since 2002 he has been co-authoring the Global Information Tech-nology Report (INSEAD-World Economic Forum); he is currently (and has been since 2007) the co-editor of the Global Innovation Index Report (INSEAD-WIPO-Cornell University).
From June 2001 to December 2003, he was the Manager of the Information for Development Program (infoDev) at the World Bank. In 2000, Dr Lanvin was appointed Executive Secretary of the G8-DOT Force. Until then, he occupied several high-level positions at the United Nations in Geneva and New York, including that of Chief of Cabinet of the Director General.
Dr Lanvin holds a BA in Mathematics and Physics from the University of Valenciennes (France), an MBA from Ecole des Hautes Etudes Com-merciales (HEC) in Paris, and a PhD in Economics from the University of Paris I (La Sorbonne) in France. He is also an INSEAD alumnus (IDP-C). A frequent speaker at high-level meetings, he advises a number of global companies and governments and has been a member of nu-merous boards, including those of IDA Infocomm (Singapore), ICANN, GovTech (Singapore), the Mohammed Bin Rashid Center for Government Innovation (United Arab Emirates), IPWatch, and the Association for Ac-countability and Internet Democracy (AAID).
ABOUT THE CONTRIBUTORSAPPENDIX III
THE GLOBAL TALENT COMPETITIVENESS INDEX 2020 365

Alistair NolanAlistair Nolan is a Senior Policy Analyst in the OECD’s Directorate for Science, Tech-nology and Innovation. He is currently coordinating various streams of OECD sub-stantive work on artificial intelligence. For the past two years he has also managed OECD work on the impacts of emerging
technologies on production, leading to the 2017 book The Next Produc-tion Revolution: Implications for Governments and Business. This work was referenced at the start of the G7 Action Plan, at the 2017 meeting of the G7 in Taormina. Mr. Nolan authored the chapter on ‘Artificial Intelligence in the Next Production Revolution’ in the 2018 edition of the OECD’s Sci-ence, Technology and Innovation Outlook. He is also the editor and co-author of the forthcoming book The Digitalisation of Science, Technology and Innovation: Key Developments and Policies.
Hedvig NorlénHedvig Norlén is a Statistician at the Com-petence Centre on Composite Indicators and Scoreboards (COIN) of the Joint Re-search Centre of the European Commission (Italy). She conducts research on multi-dimensional measures for evidence-based policymaking on social, economic, and
health issues. She has also experience as biostatistician and has worked with statistical data analysis in genomics, proteomics, and alternative approaches to predictive toxicology. Her previous work experience includes academia, the private sector, and the European Commission. Ms Norlén has a Bachelor and Master of Science degree with a major in Mathematical Statistics from Stockholm University and has done doc-toral studies in Biostatistics at Stockholm University and Royal Institute of Technology, Stockholm.
Karine PersetKarine Perset is Economist and Policy Ana-lyst on Artificial Intelligence Policy at the Or-ganisation for Economic Co-operation and Development (OECD), in the Division for Digital Economy Policy in Paris. She focuses on trends in development and diffusion of AI, on opportunities and challenges that
AI raises for public policy, and oversees OECD.AI, the OECD’s AI Policy Observatory. She was previously Senior Director and Advisor to ICANN’s Governmental Advisory Committee (GAC) in Los Angeles and yet before that was the Counsellor of the OECD’s Directors for Science, Technology and Innovation. She has a dual master’s in Telecommunications and in International Economics from the University of Paris Dauphine.
Michaela SaisanaMichaela Saisana is Acting Head of the Monitoring, Indicators and Impact Evalua-tion Unit and she also leads the European Commission’s Competence Centre on Composite Indicators and Scoreboards (COIN) at the Joint Research Centre in Italy. She has been working at the JRC since 1998,
where she obtained a prize as ‘best young scientist of the year’ in 2004 and together with her team the ‘JRC policy impact award’ for the So-cial Scoreboard of the European Pillar of Social Rights in 2018. She col-laborates, by auditing performance indices, with over 150 international organisations and world-class universities, including the United Nations, Transparency International, Oxfam, the World Economic Forum, INSEAD, the World Intellectual Property Organization, Yale University, Columbia University, and Harvard University. She is a highly cited scientist with over 11,000 citations in Google Scholar and is a co-author of two books: 2008 OECD/JRC Handbook on Constructing Composite Indicators and 2008 Global Sensitivity Analysis: The Primer (Wiley).
Nicolas SchmitNicolas Schmit is a politician from Luxem-bourg who has been serving as a Member of the European Parliament since the 2019 European elections. A member of the Lux-embourg Socialist Workers’ Party (LSAP), he was previously a member of the govern-ment of Luxembourg from 2004 until 2019.
Mr Schmit studied Economics in France at Sciences Po Aix. He be-gan his political and diplomatic career in 1979 as an attaché in the Prime Minister’s office in Luxembourg, followed by the Foreign Ministry, and has held various government positions ever since.
Since the 2019 European elections, Mr Schmit has been a Member of the European Parliament, where he belongs to the Progressive Alli-ance of Socialists and Democrats (S&D) group. He has since been serving on the Committee on Employment and Social Affairs. On 10 September 2019, Nicolas Schmit was nominated to be the European Commissioner for Jobs and Social Rights. He agreed to receive the GTCI team on that same day and gave his first interview on the theme of AI and Talent Com-petitiveness. The first part of the interview focused on Luxembourg, and the second on prospects and challenges for the European Union.
ABOUT THE CONTRIBUTORSAPPENDIX III
366 THE GLOBAL TALENT COMPETITIVENESS INDEX 2020

Marco StefaniniSince its inauguration, the history of Stefanini, one of the largest national technology companies, portrays the entre-preneurial spirit of its founder and global CEO, Marco Antônio Stefanini. After gradu-ating from USP University in Geology, Marco Stefanini began his career in computer sci-
ence as a trainee at Bradesco, Brazil’s largest private bank. As the leader of Stefanini, he fielded several economic crises, dis-
puting the market with multinational giants, always with an early vision of the business. Thanks to this, he detected niches and acquired experi-ences that gave Stefanini continuous growth over its 30 years of opera-tion and geographic expansion both in Brazil and abroad, transforming the company into the fifth most internationalized multinational, accord-ing to the Dom Cabral Foundation Ranking.
Always active in its segment, he was one of the founders of the Brazilian Association of Software Companies and Services for Export (BRASSCOM). Mr Stefanini received some important acknowledgements in the area of technology. He has been in the ranks of Nearshore Ameri-cas twice as one of the most influential executives in the outsourcing industry and has been nominated for the IAOP Hall of Fame (the Interna-tional Association of Outsourcing Professionals). In 2013, he was named Entrepreneur of the Year by Ernst & Young Terco, and recently he was invited by INSEAD to talk about the company’s trajectory, which will be transformed into a successful case.
Kent WalkerKent Walker is Senior Vice President, Global Affairs, at Google. He has worked at the nexus of cutting-edge technology, policy, and legal issues for over 20 years. He cur-rently oversees Google’s legal, policy, and compliance affairs, product policies, philan-thropic efforts, and work with governments
around the world.Before joining Google, Mr Walker held executive positions at lead-
ing technology companies, including eBay, Netscape, AOL, and Airtouch Communications. He served as an Assistant US Attorney with the US De-partment of Justice and advised the Attorney General on technology policy issues. At the start of his career, he worked as a litigator specialis-ing in government and public law issues.
Mr Walker graduated with honors from Harvard College and Stan-ford Law School. He has served on the boards of a variety of industry associations and currently serves on the Harvard Board of Overseers. He is a member of the Council on Foreign Relations.
Andrew WyckoffAndrew W. Wyckoff is the Director of the OECD’s Directorate for Science, Technol-ogy and Innovation (STI) where he oversees OECD’s work on innovation, business dy-namics, science and technology, informa-tion and communication technology policy as well as the statistical work associated
with each of these areas. His experience prior to the OECD includes posi-tions at the US Congressional Office of Technology Assessment (OTA), the US National Science Foundation (NSF), and The Brookings Institu-tion. He has served as an expert on various advisory groups and panels that include joining the Global Board of Trustees of Digital Future Society (DFS), being a member of the Research Advisory Network for the Global Commission on Internet Governance, the International Advisory Board of the Research Council of Norway, and Head of OECD’s Delegation at the G20 and G7 meetings on ICT and Digital Economy.
Houlin ZhaoHoulin Zhao was first elected 19th Secre-tary-General of the ITU at the Busan Pleni-potentiary Conference in October 2014. He took up his post on 01 January 2015. ITU Member States re-elected Mr Zhao as ITU Secretary-General on 01 November 2018, and he began his second four-year term on
01 January 2019.Prior to his election, he served two terms of office as ITU Deputy
Secretary-General (2007–2014), as well as two terms as elected Direc-tor of ITU’s Telecommunication Standardization Bureau (1999–2006). Mr Zhao is committed to further streamlining ITU’s efficiency, to strengthening its membership base through greater involvement of the academic community and of small- and medium-sized enterprises, and to broadening multistakeholder participation in ITU’s work.
ABOUT THE CONTRIBUTORSAPPENDIX III
THE GLOBAL TALENT COMPETITIVENESS INDEX 2020 367

About INSEAD, The Business School for the World (www.insead.edu)As one of the world’s leading and largest graduate business schools, INSEAD brings together peo-ple, cultures and ideas to develop responsible leaders who transform business and society. Our research, teaching and partnerships reflect this global perspective and cultural diversity.
With campuses in Europe (France), Asia (Singapore) and the Middle East (Abu Dhabi), INSEAD’s business education and research spans three continents. Our 165 renowned Faculty members from 41 countries inspire more than 1,300 degree participants annually in our MBA, Global Execu-tive MBA, Specialised Master’s degrees (Executive Master in Finance, Executive Master in Change) and PhD programmes. In addition, more than 11,000 executives participate in INSEAD Executive Education programmes each year.
INSEAD continues to conduct cutting-edge research and innovate across all our pro-grammes. We provide business leaders with the knowledge and awareness to operate anywhere. These core values drive academic excellence and serve the global community as The Business School for the World.
More information about INSEAD can be found at www.insead.edu.
The Adecco Group (www.adeccogroup.com)The Adecco Group is the world’s leading HR solutions company. We believe in making the future work for everyone, and every day enable more than 3.5 million careers. We skill, develop, trans-form and hire talent in 60 countries, enabling organizations to embrace the future of work. As a Fortune Global 500 company, we lead by example, creating shared value that fuels economies and builds better societies. Our culture of inclusivity, entrepreneurship and teamwork empow-ers our 34,000 employees, who voted us number 11 on the Great Place to Work® - World’s Best Workplaces 2019 list. The Adecco Group AG is headquartered in Zurich, Switzerland and listed on the SIX Swiss Exchange (ADEN). The group is powered by ten global lead brands: Adecco, Adia, Badenoch & Clark, General Assembly, Lee Hecht Harrison, Modis, Pontoon, Spring Professional, Vettery and YOSS.
About Google Inc. (https://about.google/)Google is a global technology leader focused on improving the ways people connect with infor-mation. Google’s innovations in web search and advertising have made its website a top Internet property and its brand one of the most recognized in the world. Google is a trademark of Google Inc. All other company and product names may be trademarks of the respective companies with which they are associated.
For information about Google in the Middle East, please visit our Official Google Arabia Blog: http://google-arabia.blogspot.com/
About the Partners
ABOUT THE PARTNERS
THE GLOBAL TALENT COMPETITIVENESS INDEX 2020 369


The full report can be downloaded at https://www.insead.edu/global-indices