built environment performance plan 2015-16 - MFMA
64
ADOPTED BUILT ENVIRONMENT PERFORMANCE PLAN 2015-16 MAY 2015 PART A - Introduction PART B - Strategic Review of the Built Environment PART C - Strategies and Programs PART D - Outcomes and Outputs PART E - Institutional and Financial Arrangements
-
Upload
khangminh22 -
Category
Documents
-
view
0 -
download
0
Transcript of built environment performance plan 2015-16 - MFMA
ADOPTED
BUILT ENVIRONMENT PERFORMANCE PLAN 2015-16
MAY 2015
PART A - IntroductionPART B - Strategic Review of the Built EnvironmentPART C - Strategies and ProgramsPART D - Outcomes and OutputsPART E - Institutional and Financial Arrangements
EThekwini BEPP 20115-16, Adopted, May 2015
Page 2
PART A - IntroductionPURPOSE5APPROACH 5DEFINITIONS OF INFRASTRUCTURE 5FOCUS OF THE 2015-16 BEPP 6RELATIONSHIP TO OTHER MUNICIPAL PLANS 6BEPP PREPARATION PROCESS 6MILESTONES FOR THE PREPARATION OF THE 2015-16 BEPP 7ADOPTION OF THE BEPP BY THE ETHEKWINI COUNCIL 7REFERENCES 7ACRONYMS 9
PART B - Strategic Review of the Built EnvironmentKEY SPATIAL AND LOCATIONAL FEATURES 12PUBLIC PERCEPTIONS OF THE BUILT ENVIRONMENT 15ECONOMIC INFRASTRUCTURE 16
Key features of the Local Economy 16Snapshot Economic Indicators 16Economic Activity by Sector 16Uses Trends by Location 17Land Currently Serviced and Zoned for Economic Uses18National and Provincial Competition in the Industrial Land Market 18Constraints to Land Production for Economic Uses 18Constraints to Intensification and Redevelopment of Land for Economic Uses 18
RESIDENTIAL INFRASTRUCTURE 19MOVEMENT SYSTEM 23
IRPTN 23Key Challenges 24
COMMUNITY SERVICES24SUSTAINABLE DEVELOPMENT 25
Biodiversity 25Climate Change 25Free Eco-System Services25Bio-deiversity loss 25Conservation Targets 26D’MOSS Implications 26
CORE INFRASTRUCTURE 27Piped Water Network 27Raw Water Supply 27Water Supply Reconciliation Strategy Study for the KZN Coastal Metropolitan Area 28River Classes 28Wasterwater Treatment Works28Water Use Licences 28Existing Sewer Infrastructure 28Bulk Electricity Supply 29Eskom Supply Challenge 29Alternative Energy Sources 29Current Service Delivery to Existing Residential Uses 29Un-served Residential Demand 30Current Service Delivery to Existing Formal Economic Uses 30Current Service Delivery to Existing Informal Economic Uses 30
EThekwini BEPP 20115-16, Adopted, May 2015
Page 3
IMPACTS OF TRENDS, DEMANDS & FEATURES 31LONG TERM VISION AND THE SPATIAL DEVELOPMENT STRATEGY 32
The Eight IDP Plans 33Relationships of Metropolitan Program Groups to Metropolitan Planning Instruments 33
INFRASTRUCTURE ASSET MANAGEMENT 34INCREMENTAL PROGRAMS 35
Interim Services 35Engineering Infrastructure to Social Facilities 36Subsidised Housing - Departure Points36Housing Program Groups 36Housing Projects and Integration Zones 37Housing Spatial Prioritisation Model (HSPM) for Projects Entering the Pipeline 38Densification 39Social Facilities 39
SUSTAINABLE DEVELOPMENT 40
PART C - Strategies and ProgramsURBAN NETWORK (UN) 41
Integration Zones 41Dense Urban IZ’s Composition, Features, and Broad Development Strategy41Suburban IZ’s Composition, Features, and Broad Development Strategy 42Non-Urban IZ’s Composition, Features, and Broad Development Strategy 42Development Intentions per IZ 43Developmental Strategies for Different Parts of the Dense Urban IZ 44Primary & Secondary Urban Network 45
CATALYTIC PROJECTS 46FIRST GENERATION OF OWN CATALYTIC PROJECTS 47
Cornubia South & Cornubia North 48IRPTN Phase 1 – Corridor 3 (C3) on MR 577 from Bridge City to Pinetown Error!Bookmark not defined.Keystone 51Remaining Own Projects in the First Generation 51
CATALYTIC PROJECTS LED BY OTHER SPHERES 52Rail Corridor C2 52Greater DTP 53SIP 2 – Phase 1 – Port Redevelopment 53SIP 2 – Phase 1 – Freight Routes 54SIP 2 – Phase 1 – Back of Port and Cato Ridge 54Second Generation of Own Catalytic Projects 54
ADJUSTMENTS TO OTHER SPATIAL TARGETING INSTRUMENTS 55Priority Housing Development Area (PHDA) 55Social Housing Restructuring Zone (SHRZ) 55Urban Development Zone (UDZ) 55Special Economic Zone (SEZ) 55Industrial Development Zone (IDZ)55Adjustments to SDF and Land Use Management System (LUMS) 56
INSTITUTIONAL ARRANGEMENTS 56ICDG FORUM - COMPOSITION AND REPORTING56
ICDG Secretariat 56Teams for Catalytic Projects 56Request for TA 57
EThekwini BEPP 20115-16, Adopted, May 2015
Page 4
PART D - Outcomes and OutputsHigh Level / City-Wide Development Objectives and Desired Outcomes 58Sector Development Outcomes and Outputs as per Sector Plans 58Outcomes and Impact for Each integration Zone 59
PART E - Institutional and Financial ArrangementsINSTITUTIONAL ARRANGEMENTS FOR CAPITAL PROGRAM MANAGEMENT 60
Supply Chain Management and Procurement Plan 60
PARTNERSHIPS 61Community Services 61Education 61Health 61Home Affairs 61Human Settlement 61Multi-use and Economic 61
FINANCIAL 62The Value of Program and Projects By Sector 62The Value of Programs and Projects per Integration Zone 63Catalytic Projects’ Links to Urban Network Elements 64The Application of Grant Resources by Grant Program & Municipal Project 64
AnnexuresBEPP to EXCO Covering Report signed May 2015IDP Review 2015-2016 adopted May 2015SDF Review 2015-2016 adopted May 2015EThekwini Housing Sector Plan adopted Jan 2012EThekwini ITP 2010-11 to 2014-14 Annual Update adopted May 2013Water Services Development Plan adopted March 2012SDBIP
EThekwini BEPP 20115-16, Adopted, May 2015
Page 5
PURPOSE
The purpose of the BEPP is to provide a single overview of eThekwini’s current and plannedinvestment into its built environment. The BEPP supports the core national policy objective ofmore compact cities that are Equitable, Efficient, and Prosperous.
APPROACH
The BEPP approach is to spatially target, integrate and align the spatial investment programs ofthe key sectors of the economy, transport and housing. [1] The BEPP is intended to be a referencepoint for national and provincial spheres and other key stakeholders to make informed decisionsand investments in the built environment. The BEPP not only facilitates these investments, but is acompulsory pre-requisite for the disbursement of very significant DORA [2] allocations for numerouscapital grants, namely the Urban Settlements Development Grant, the Integrated City DevelopmentGrant, the Human Settlements Development Grant, the Public Transport Infrastructure Grant, thePublic Transport Operations Grant, the Integrated National Electrification Program, and theNeighbourhood Development Partnership Grant. Six of these are capital grants, and make upabout 60% of eThekwini’s Capital Budget, while the Public Transport Operations Grant appears inthe Operating Budget.
DEFINITIONS OF INFRASTRUCTURE
The BEPP has “Infrastructure”, in its broader meanings, as a central focus.
Though there is not a legislated definition of infrastructure, in practice it includes the production ofall physical assets (land, engineering services, and buildings) that serve as the platform foreconomic, social, and residential activities. The NDP refers to infrastructure in this broader sense.At a more specific level, the Division of Revenue Act (DORA) 2014-15 makes numerousreferences to infrastructure in text and tables, in a wide range of capital grants, and over numeroussocial and technical sectors.
Infrastructure includes Core Infrastructure, Economic Infrastructure, Social Infrastructure, andMixed Use. [3] The following are regarded as Infrastructure Projects: [4]
• Economic Infrastructure is the result of own investment and that of other spheres and theprivate sector in Land Production, Public Spaces, and Buildings for Industry, Retail, Office,Mining, Ports, Airports, Freight Systems, and Agriculture developments. EconomicInfrastructure also includes PPP’s and site-sharing where public and private investments willresult in a range of public and private services being offered on the same site (e.g. commercialand social services being offered at transport interchanges).
• Social Infrastructure is the result of own investment and that of other spheres and the privatesector (including households) in Land Production, Public Spaces, and Buildings for:Residential Uses; the provision of Municipal Social and Emergency Services, and; theprovision of Other Government Services (particularly Safety & Security, all levels of Educationand Health care, justice, Social Grants Pay-Points, Basic Recreation, clusters of SocialFacilities, and Government Malls)
1 Guidance Note for the Built Environment Performance Plans for 2014-15. NT. Nov 20132 Division of Revenue Bill. Government Gazette No. 38458. Feb 20153 Guidance Note for the Built Environment Performance Plan 2015/16 – 2017/18. Oct 2014, National Treasury4 Cities-PPF Policy Framework. NT and DBSA. Draft. Apr 2015
PART A - Introduction
EThekwini BEPP 20115-16, Adopted, May 2015
Page 6
• Mixed Use Infrastructure includes projects aimed at accommodating a mix of Economic andSocial uses, either vertically or adjacent to each other, in either Brownfields projects such asurban redevelopment, or in Greenfields locations.
• Core Infrastructure includes construction or expansion of: Sewer or Water Treatment Works.Sewer or Water Trunk Mains, Water Reservoirs, Pump Stations, Electrical Substations,Alternative Energy Installations, Freeway Interchanges, Road Bridges, Arterial and CollectorRoads, Public Transport Routes and Facilities, and ICT networks, all aimed at social,economic or mixed uses.
The project cycles of all infrastructure projects include associated statutory planning, building andenvironmental approvals
FOCUS OF THE 2015-16 BEPP
The focus of the 2014-15 BEPP was on planning for spatial transformation. In 2015-16 the focusshifts to catalytic projects, and the development of informal settlements and other marginalisedareas. [5]
RELATIONSHIP TO OTHER MUNICIPAL PLANS
The BEPP is intended to contribute to and enhance existing statutory plans, and it does notduplicate or replace them. The other statutory plans that relate this BEPP relates to are:
• The IDP• Sector Plans for human settlements, transport, and economic development.• The Long Term Development Framework• The Spatial Development Framework• The Capital Investment Framework (as defined by SPLUMA)• The Medium Term Revenue and Expenditure Framework (MTERF)• The Service Delivery and Budget Implementation Plans (SDBIP)
The BEPP is placed in between the SDF and IDP with an explicit focus on the social and economicinfrastructure components of the built environment. [6]
BEPP PREPARATION PROCESS
The BEPP preparation process follows the annual municipal integrated development planning andbudget cycle, and culminates with Council approval.
Accountability for preparing the 2015-16 BEPP rests with the Secretariat of the Integrated CityDevelopment Forum. It represents a collective of key municipal entities, and is co-chaired by twoDCM's, and enjoys the support of the Ethekwini CSP Coordinator from NT. The Forum wasdeliberately and consciously used as the internal institution to develop the BEPP. That rationale isthat integration begins at home, and that integrated analysis and decision-making will result inbetter-integrated development
For the production of this BEPP, the ICDG Forum focused on:
• Refinement of the UNS and Integration Zones• Catalytic projects
5 Guidance Note for the Built Environment Performance Plans for 2014-15. NT. Nov 20136 Guidance Note for the Built Environment Performance Plans for 2014-15. NT. Nov 2013
EThekwini BEPP 20115-16, Adopted, May 2015
Page 7
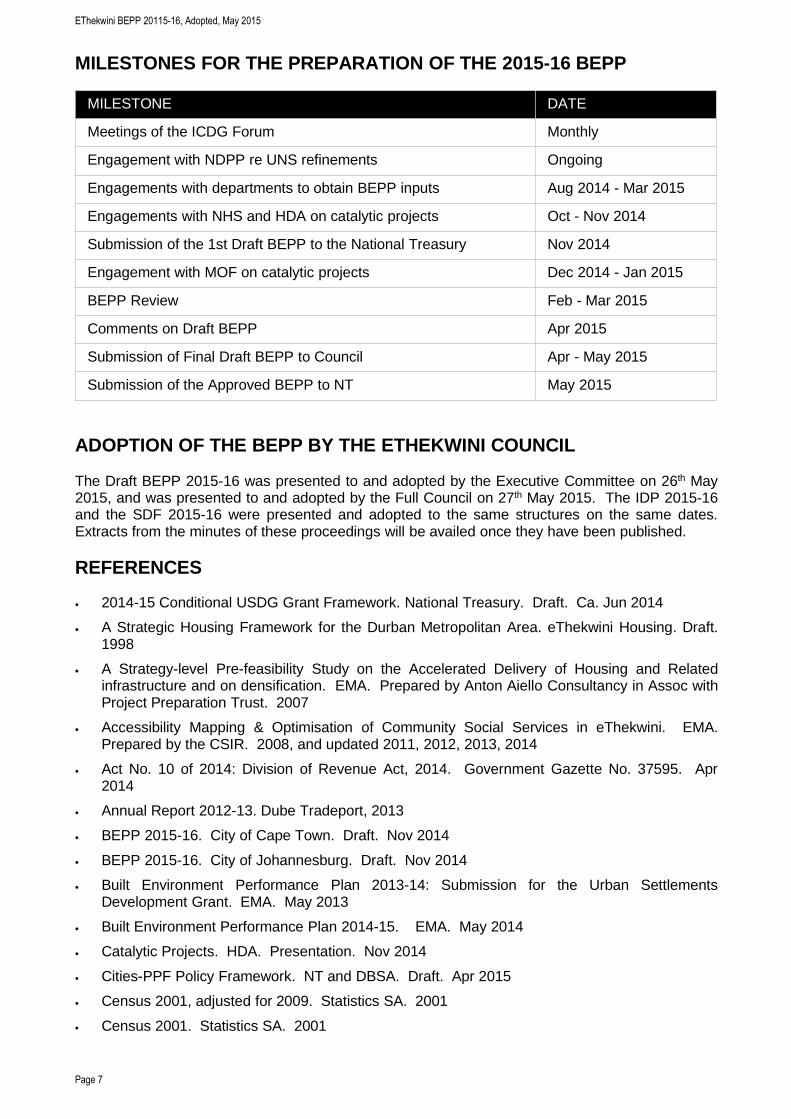
MILESTONES FOR THE PREPARATION OF THE 2015-16 BEPP
MILESTONE DATE
Meetings of the ICDG Forum Monthly
Engagement with NDPP re UNS refinements Ongoing
Engagements with departments to obtain BEPP inputs Aug 2014 - Mar 2015
Engagements with NHS and HDA on catalytic projects Oct - Nov 2014
Submission of the 1st Draft BEPP to the National Treasury Nov 2014
Engagement with MOF on catalytic projects Dec 2014 - Jan 2015
BEPP Review Feb - Mar 2015
Comments on Draft BEPP Apr 2015
Submission of Final Draft BEPP to Council Apr - May 2015
Submission of the Approved BEPP to NT May 2015
ADOPTION OF THE BEPP BY THE ETHEKWINI COUNCIL
The Draft BEPP 2015-16 was presented to and adopted by the Executive Committee on 26th May2015, and was presented to and adopted by the Full Council on 27th May 2015. The IDP 2015-16and the SDF 2015-16 were presented and adopted to the same structures on the same dates.Extracts from the minutes of these proceedings will be availed once they have been published.
REFERENCES
• 2014-15 Conditional USDG Grant Framework. National Treasury. Draft. Ca. Jun 2014
• A Strategic Housing Framework for the Durban Metropolitan Area. eThekwini Housing. Draft.1998
• A Strategy-level Pre-feasibility Study on the Accelerated Delivery of Housing and Relatedinfrastructure and on densification. EMA. Prepared by Anton Aiello Consultancy in Assoc withProject Preparation Trust. 2007
• Accessibility Mapping & Optimisation of Community Social Services in eThekwini. EMA.Prepared by the CSIR. 2008, and updated 2011, 2012, 2013, 2014
• Act No. 10 of 2014: Division of Revenue Act, 2014. Government Gazette No. 37595. Apr2014
• Annual Report 2012-13. Dube Tradeport, 2013
• BEPP 2015-16. City of Cape Town. Draft. Nov 2014
• BEPP 2015-16. City of Johannesburg. Draft. Nov 2014
• Built Environment Performance Plan 2013-14: Submission for the Urban SettlementsDevelopment Grant. EMA. May 2013
• Built Environment Performance Plan 2014-15. EMA. May 2014
• Catalytic Projects. HDA. Presentation. Nov 2014
• Cities-PPF Policy Framework. NT and DBSA. Draft. Apr 2015
• Census 2001, adjusted for 2009. Statistics SA. 2001
• Census 2001. Statistics SA. 2001
EThekwini BEPP 20115-16, Adopted, May 2015
Page 8
• Concept Document. National Human Settlements Spatial Plan. Dept Human Settlements. Aug2014
• Conceptual Proposals for CBD to Bridge City - Public Transport & Integrated Land UseCorridor. EMA. Prepared by Anton Aiello Consultancy. 2010
• Cornubia [South] Framework Presentation. Tongaat Hullett and EMA. Dec 2010
• Cornubia North Framework Presentation. Tongaat Hullett and EMA. Nov 2013
• CSP: Built Environment Performance Plans In relation to financial governance and servicedelivery. Presentation. NT. May 2014
• Demand and Supply of Rental Accommodation in South Africa. Social Housing Foundation.2008
• Economic Development and Job-Creation Strategy 2013-2014. EMA. Oct 2013
• Economic Development and Job Creation Plan. Draft. EMA. Prepared by Urban Econ. Oct2014
• Economic Situation Assessment: Northern Urban Development Corridor. EMA. Prepared bySSI, Glen Robbins, Vancometrics, Urban Studies. 2009
• EThekwini Densities. EMA. Prepared by Anton Aiello Consultancy. Unpublished. 2010
• EThekwini City Density Strategy. EMA. Prepared by SSI. May 2013
• EThekwini Housing Sector Plan: The Housing Chapter of the IDP. EMA. Prepared by MXAand A Aiello. Dec 2011
• EThekwini Municipality 2011 Dwelling Count. EMA. Jan 2013
• EThekwini’s NDPG Urban Networks. EMA. Oct 2014
• EThekwini Municipality Industrial Land Study and Land Strategy Development: ConceptualFramework 1G-10205. EMA. Prepared by The Planning Initiative Team. Mar 2014
• EThekwini Municipality Industrial Land Study and Land Strategy Development: Phase 2: LandStudy Analysis. EMA. Prepared by The Planning Initiative Team. Mar 2014
• Exploring Ecosystem-Based Climate Change Adaptation in Durban, South Africa: ‘Learning-By-Doing’ at the Local Government Coal Face. Environment and Urbanization 24 (1): 167-195.Roberts, D., Boon, R., Diederichs, N et al
• Geographic Accessibility Study of Social Facility and Government Service Points for theMetropolitan Cities of Johannesburg and eThekwini 2011-12: Part A: Strategic Overview andKey Findings. DPSA. Prepared by the CSIR. Feb 2013
• Guidance Note for the Built Environment Performance Plan 2015-16 – 2017-18. NT. Oct 2014
• Guidance Note for the Built Environment Performance Plans for 2014-15. NT. Nov 2013
• Informal Settlement Eradication Strategy. KZN Department Human Settlements. Prepared byPPT. Draft. 2011
• Integrated Development Plan - 5-Year Plan: 2012-13 to 2016-17 – 2013-14 Annual Review.EMA. Mar 2014
• Integrated Development Plan Review 2010-2011. EMA. 2010
• Integrated Housing Development Plan. EMA. Apr 2006
• Integrated Transportation Plan. ETA. 2010
• Investing in Natural assets. A Business Case for the Environment in the City of Cape Town.De Wit, M., at al. 2009
• July 2011 eThekwini Housing Stats
• Long Term Development Framework. EMA. 2010
• MTERF 2013-14 to 2015-16. EMA. May 2013
EThekwini BEPP 20115-16, Adopted, May 2015
Page 9
• MTERF 2013-14 to 2015-16. EMA. May 2013
• MTERF 2014-15 to 2016-17. EMA. May 2014
• MTERF 2015-16 to 2017-18. EMA. Draft. Mar 2015
• Municipal Services and Living Conditions Survey - 3 year Trends. EMA. 2014
• National Development Plan: Vision for 2030. NPC. Nov 2011
• NDPG Guidance Note: Municipal Guidance on the Identification of the Urban NetworkElements. NT. Jan 2014
• NDPG Guidance Note: Municipal Guidance on the Identification of the Urban NetworkElements. NT. Sep 2013
• Planetary boundaries: exploring the safe operating space for humanity. Ecology and Society.Rockström, J et al. 2009
• Social Development Strategy 2014 – 2020. EMA. Draft. Sep 2014
• Social Facility Pre-Implementation Plan Phase 3: Non-Urban Social Nodes. Draft. EMA. Dec2014
• Spatial Development Framework 2014-15 Review. EMA. May 2014
• Strategy-Level Pre-Feasibility on the Accelerated Delivery of Housing and RelatedInfrastructure, and on Densification. EMA. Prepared by Anton Aiello in association with PPT.Unpublished. 2006
• The Comprehensive Plan on the Development of Sustainable Human Settlement. NationalDepartment of Human Settlements. 2004
• The National Housing Code, 2009: Part 1 Simplified Guide to the National Housing Code.Department of Human Settlements. 2009
• http:--cargoterminal.dubetradeport.co.za. Accessed Feb 204
• http:--www.acsa.co.za-home.asp?pid=8048. Accessed Feb 204
• http:--www.conservation.org-where-priority_areas-hotspots-Pages-hotspots_defined.aspx
• http:--www.newscientist.com-special-ocean-to-ozone-earths-nine-life-support-systems
ACRONYMS
BEPP Built Environment Performance PlanBNG Breaking New GroundBoP Back of PortCBD Central Business DistrictCBO Community-Based OrganisationCIF Capital Investment FrameworkCMDA Cato Manor Development AssociationCMPR Central Municipal Planning RegionCRU Community Residential UnitsCSIR Council for Scientific and Industrial ResearchCSP Cities Support ProgramDCM Deputy City ManagerD'MOSS Durban Metropolitan Open Space SystemDBSA Development Bank of South AfricaDCM Deputy City ManagerDORA Division of Revenue ActDPSA Department of Public Service Administration
EThekwini BEPP 20115-16, Adopted, May 2015
Page 10
DSW Durban Solid WasteDTP Dube Trade PortDWA Department of Water AffairsEIA Environmental Impact AssessmentEMA eThekwini Metropolitan AuthorityEMF Environmental Management FrameworkEPWP Expanded Public Works ProgrammeETA eThekwini Transport AuthorityEWS eThekwini Water ServicesFAP Functional Area PlansFAR Floor Area RatioGDP Gross Domestic ProductHDA Housing Development AgencyHPPTN High Priority Public Transport NetworkHSDG Human Settlements Development GrantIAMP Integrated Infrastructure Asset Management PlanICDG Integrated Cities Development GrantICT Information & Communications TechnologyIDP Integrated Development PlanILO International Labour OrganisationIMR Infant Mortality RateINEPG Integrated National Electrification Programme GrantINK Inanda Ntuzuma KwaMashuIRPTN Integrated Rapid Public Transport NetworkITP Integrated Transport PlanIZ Integration ZoneKPI Key Performance IndicatorKSIA King Shaka International AirportKZN KwaZulu-NatalKZNPGDS KwaZulu-Natal Provincial Growth and Development StrategyLED Local Economic DevelopmentLEFTEA Less Formal Township Establishment ActLUF Land Use FrameworkLUMS Land Use Management SystemMCPP Municipal Climate Protection ProgrammeMetro Metropolitan MunicipalityMFMA Municipal Financial Management ActMSA Municipal System ActMTERF Medium Term Expenditure and Revenue FrameworkNDP National Development PlanNDPG Neighbourhood Development Partnership GrantNDPP Neighbourhood Development Partnership ProgramNEMA National Environmental Management ActNGO Non-Government OrganisationNHBRC National Home Builders Registration CouncilNHRA National Heritage Resource ActNMPR Northern Municipal Planning RegionNMT Non-Motorised Transport
EThekwini BEPP 20115-16, Adopted, May 2015
Page 11
MOF Ministry of FinanceNPC National Planning CommissionNSDP National Spatial Development PerspectiveNT National TreasuryPPF Project Preparation FacilityPPP Public-Private PartnershipPPT Project Preparation TrustPSP Professional Service ProviderPTIG Public Transport Infrastructure GrantRFP Request for ProposalsROI Return on InvestmentSCM Supply Change ManagementSCM Supply Chain ManagementSDBIP Service Delivery Business Implementation PlanSDF Spatial Development FrameworkSDP Spatial Development PlanSEZ Special Economic ZoneSIP Strategic Infrastructure ProjectsSMME Small, Micro and Medium EnterprisesSMPR Southern Municipal Planning RegionSOE State Owned Entity / EnterpriseSPLUMA Spatial Planning and Land Use Management ActTEU Twenty Foot EquivalentUDL Urban Development LineUN Urban NetworkUNS Urban Network StrategyUSDG Urban Settlements Development GrantWMPR Western Municipal Planning RegionWSA Water Services AuthorityWSDP Water Services Development PlanWTW Water Treatment WorksWWTW Wastewater Treatment Works
EThekwini BEPP 20115-16, Adopted, May 2015
Page 12
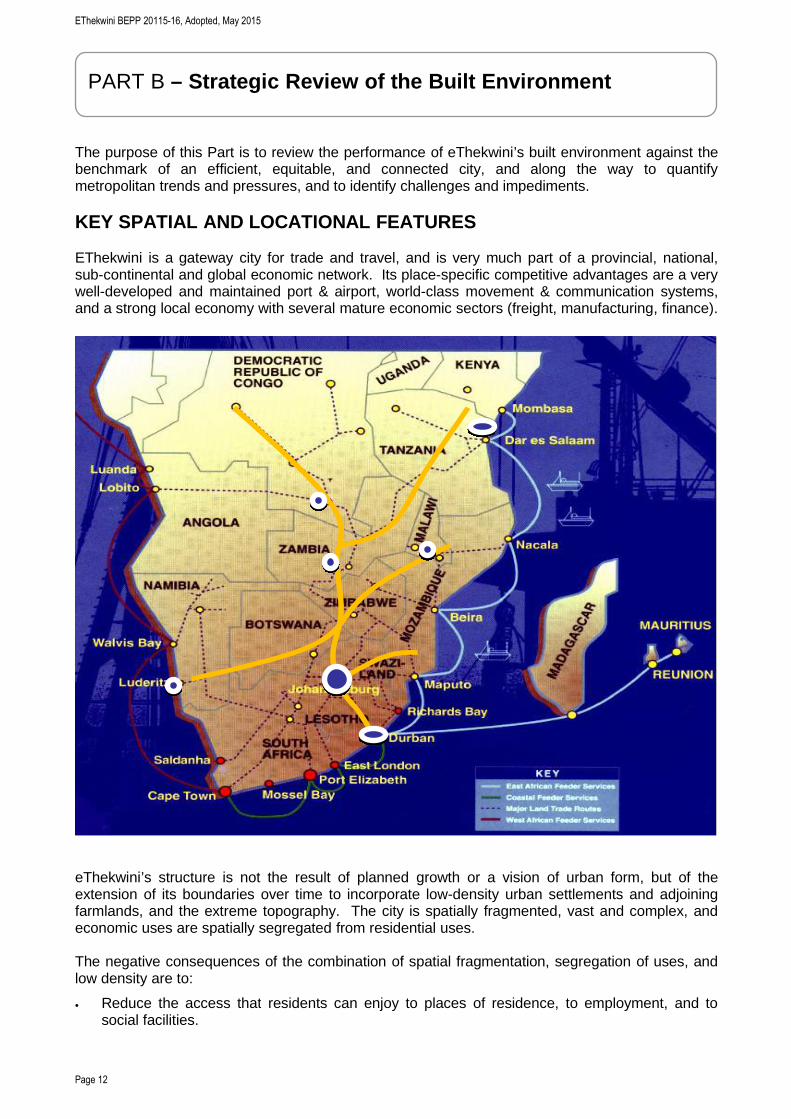
The purpose of this Part is to review the performance of eThekwini’s built environment against thebenchmark of an efficient, equitable, and connected city, and along the way to quantifymetropolitan trends and pressures, and to identify challenges and impediments.
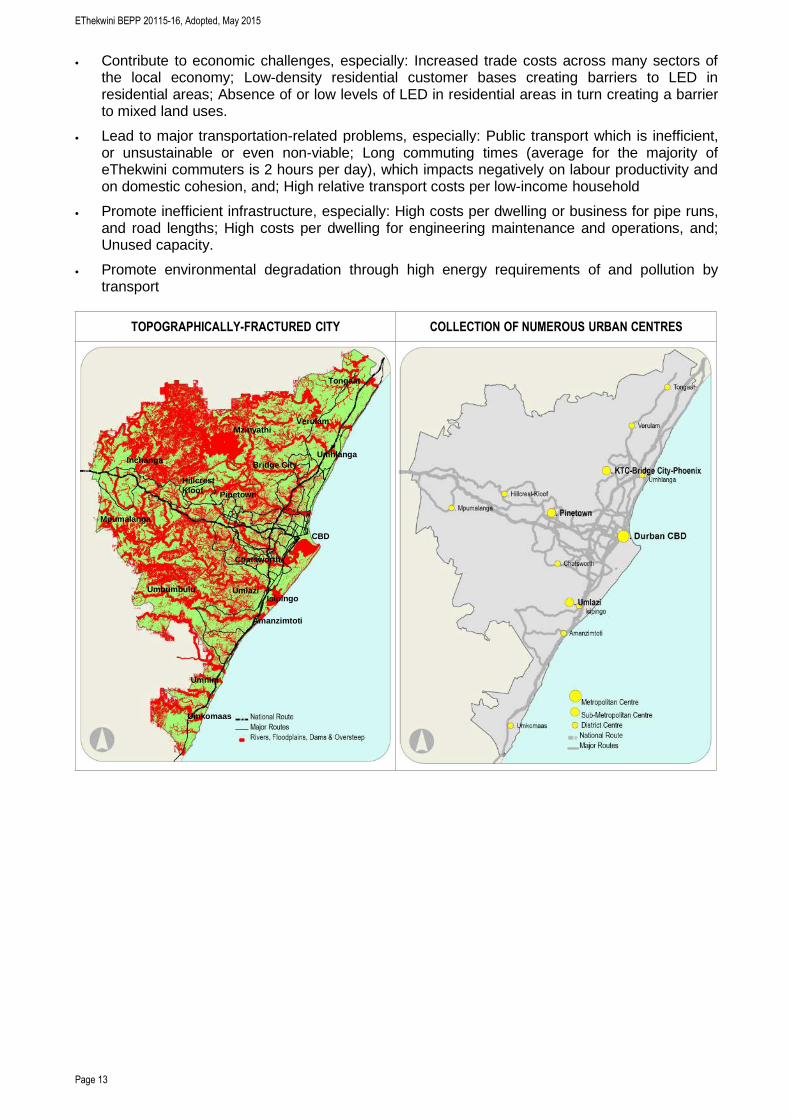
KEY SPATIAL AND LOCATIONAL FEATURES
EThekwini is a gateway city for trade and travel, and is very much part of a provincial, national,sub-continental and global economic network. Its place-specific competitive advantages are a verywell-developed and maintained port & airport, world-class movement & communication systems,and a strong local economy with several mature economic sectors (freight, manufacturing, finance).
eThekwini’s structure is not the result of planned growth or a vision of urban form, but of theextension of its boundaries over time to incorporate low-density urban settlements and adjoiningfarmlands, and the extreme topography. The city is spatially fragmented, vast and complex, andeconomic uses are spatially segregated from residential uses.
The negative consequences of the combination of spatial fragmentation, segregation of uses, andlow density are to:
• Reduce the access that residents can enjoy to places of residence, to employment, and tosocial facilities.
PART B – Strategic Review of the Built Environment
EThekwini BEPP 20115-16, Adopted, May 2015
Page 13
• Contribute to economic challenges, especially: Increased trade costs across many sectors ofthe local economy; Low-density residential customer bases creating barriers to LED inresidential areas; Absence of or low levels of LED in residential areas in turn creating a barrierto mixed land uses.
• Lead to major transportation-related problems, especially: Public transport which is inefficient,or unsustainable or even non-viable; Long commuting times (average for the majority ofeThekwini commuters is 2 hours per day), which impacts negatively on labour productivity andon domestic cohesion, and; High relative transport costs per low-income household
• Promote inefficient infrastructure, especially: High costs per dwelling or business for pipe runs,and road lengths; High costs per dwelling for engineering maintenance and operations, and;Unused capacity.
• Promote environmental degradation through high energy requirements of and pollution bytransport
TOPOGRAPHICALLY-FRACTURED CITY COLLECTION OF NUMEROUS URBAN CENTRES
Amanzimtoti
Umbumbulu
CBD
Isipingo Umlazi
Chatsworth
Umnini
Umkomaas
Inchanga
Hillcrest Kloof Pinetown
Bridge City
Verulam
Tongaat
Umhlanga
Mzinyathi
Mpumalanga
EThekwini BEPP 20115-16, Adopted, May 2015
Page 14
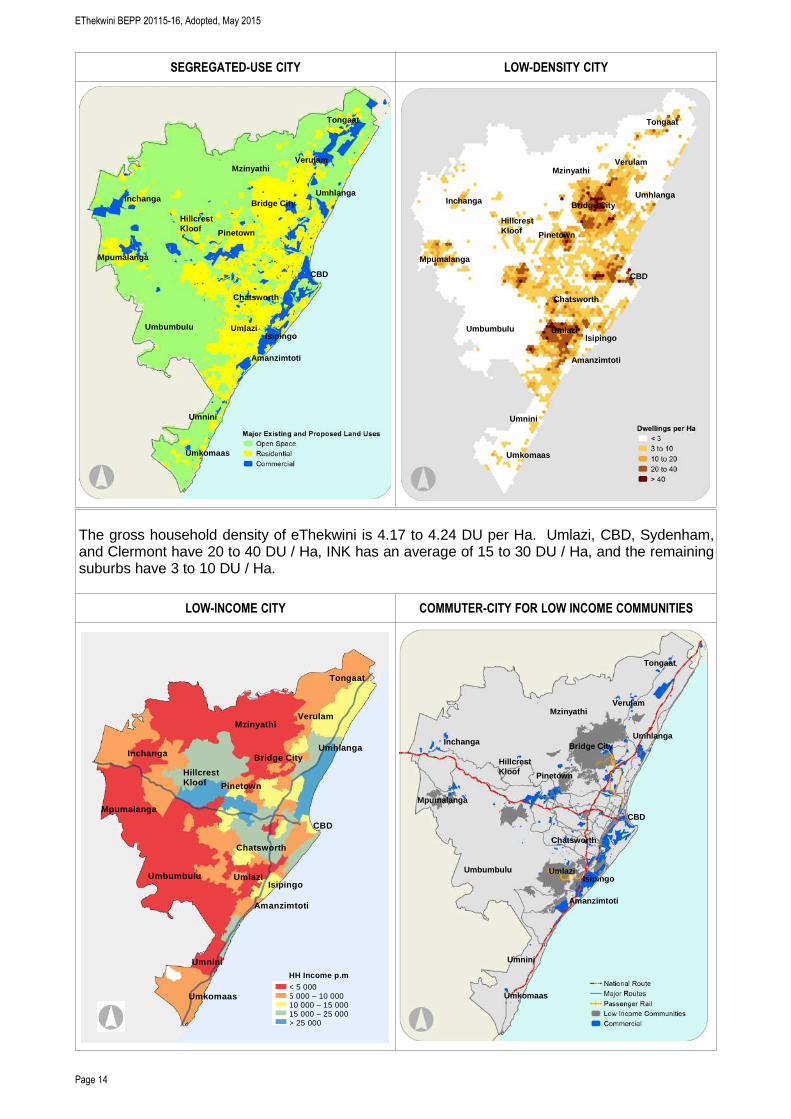
SEGREGATED-USE CITY LOW-DENSITY CITY
The gross household density of eThekwini is 4.17 to 4.24 DU per Ha. Umlazi, CBD, Sydenham,and Clermont have 20 to 40 DU / Ha, INK has an average of 15 to 30 DU / Ha, and the remainingsuburbs have 3 to 10 DU / Ha.
LOW-INCOME CITY COMMUTER-CITY FOR LOW INCOME COMMUNITIES
Mpumalanga
Amanzimtoti
Umbumbulu
CBD
Isipingo Umlazi
Chatsworth
Umnini
Umkomaas
Inchanga
Hillcrest Kloof Pinetown
Bridge City
Verulam
Tongaat
Umhlanga
Mzinyathi
Mpumalanga
Amanzimtoti
Umbumbulu
CBD
Isipingo Umlazi
Chatsworth
Umnini
Umkomaas
Inchanga
Hillcrest Kloof Pinetown
Bridge City
Verulam
Tongaat
Umhlanga
Mzinyathi
Mpumalanga
Amanzimtoti
Umbumbulu
CBD
Isipingo Umlazi
Chatsworth
Umnini
Umkomaas
Inchanga
Hillcrest Kloof Pinetown
Bridge City
Verulam
Tongaat
Umhlanga
Mzinyathi
Mpumalanga
Amanzimtoti
Umbumbulu
CBD
Isipingo Umlazi
Chatsworth
Umnini
Umkomaas
Inchanga
Hillcrest Kloof Pinetown
Bridge City
Verulam
Tongaat
Umhlanga
Mzinyathi
HH Income p.m
< 5 000 5 000 – 10 000 10 000 – 15 000 15 000 – 25 000 > 25 000
EThekwini BEPP 20115-16, Adopted, May 2015
Page 15
EThekwini is a low-income city. It has a high GINI Co-efficient of 0.63 [7] (the same as the SAaverage), and the average per capita income is a little over R 4,000 p.m., lower than most ofeThekwini’s metro peers. Of the 3,871,409 population and 974,572 households [8], almost a thirdlive below the food poverty line.
The spatial aspects of eThekwini as a low-income city are the marked spatial separation betweenincome groups, and how they relate to economic uses, which traces back to race-based planning.Except for Umlazi and Clermont, low-income suburbs have been the furthest away from majoremployers, middle-income suburbs have been somewhat closer, and high-income suburbs havebeen closest to employment, except for Hillcrest Kloof. This pattern is starting to be mitigated byimproved connectivity afforded by the new sub-metropolitan route MR 577 linking INK to Pinetown,and the upgrade of Inanda Road from INK to Hillcrest. The pattern of lowest income furthest awayis also starting to be reversed in two locations, by Greater DTP and Greater Cornubia, which intime to come will offer significant employment opportunities close to INK, and by the Keystonedevelopment close to Mpumalanga. The establishment of major retail centres in Umlazi, BridgeCity, and Mpumalanga go some way to improve trip efficiencies for consumption and to bring retail,finance, and service industries closer to low-income households. However, there is still a long wayto go to creating a highly connected and better integrated city, and there will always be a degree ofseparation of higher-order economic uses from residential settlement.
PUBLIC PERCEPTIONS OF THE BUILT ENVIRONMENT[9]
Though there are noticeable expressions of dissatisfaction around informal settlements and non-formal dwellings, the majority of citizens reported satisfaction with the built environment’sperformance. This contrasts sharply with dissatisfaction with living standards. Though perhapsnot explicit, there is a built environment connection, in that living standards are adversely affectedby inefficient urban form, particularly long and expensive commutes to employment or education.Living standards are linked also to the economic performance of the city, which itself has a spatialdimension. The system for income distribution, as another key influence in living standards, ismore of an issue for economic policy, and less so for the built environment.
7 Census 2011. Statistics SA. 20128 Ethekwini Municipality 2011 Dwelling Count. Projected to 2014. EMA. Jan 2013.9 Municipal Services and Living Conditions Survey - 3 year Trends. Corporate Policy Unit. 2014
2014 rating For Improvement or decline since 2011
Satisfied Basic Household Services (all areas) - Unchanged
Very Dissatisfied Management of informal settlements - Unchanged
Dissatisfied Informal and traditional dwellings Significant decline
Dissatisfied Law Enforcement Significant decline
Satisfied Toilets Slight decline
Satisfied Water Slight improvememt
Satisfied Refuse Slight decline
Satisfied Electricity - Unchanged
Satisfied Dwellings Slight decline
Satisfied Public Transport - Unchanged
Dissatisfied Roads Maintenance Slight decline
Satisfied Interface between Citizenry and Municipality Slight decline
Satisfied Access to Community Facilities - Unchanged
Satisfied Mainrtenance of Community Facilities - Unchanged
Satisfied Emergency Services - Unchanged
Satisfied Clinics - Unchanged
EThekwini BEPP 20115-16, Adopted, May 2015
Page 16
ECONOMIC INFRASTRUCTURE
Key features of the Local Economy
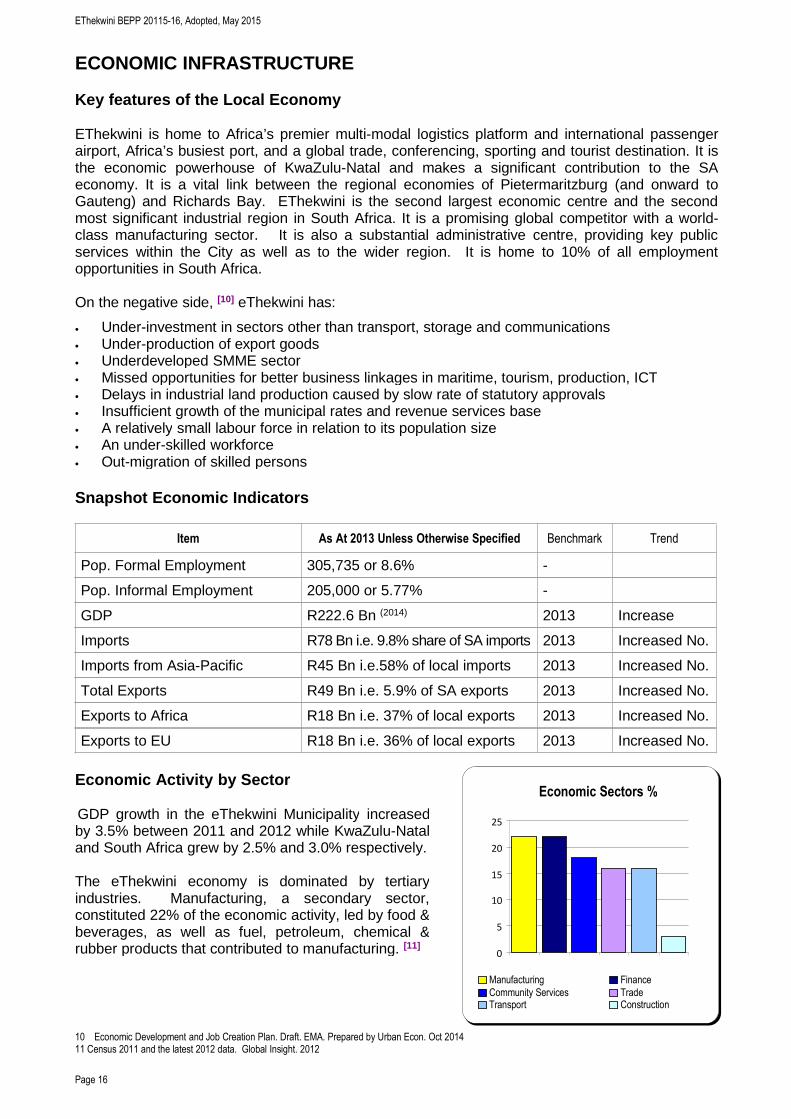
EThekwini is home to Africa’s premier multi-modal logistics platform and international passengerairport, Africa’s busiest port, and a global trade, conferencing, sporting and tourist destination. It isthe economic powerhouse of KwaZulu-Natal and makes a significant contribution to the SAeconomy. It is a vital link between the regional economies of Pietermaritzburg (and onward toGauteng) and Richards Bay. EThekwini is the second largest economic centre and the secondmost significant industrial region in South Africa. It is a promising global competitor with a world-class manufacturing sector. It is also a substantial administrative centre, providing key publicservices within the City as well as to the wider region. It is home to 10% of all employmentopportunities in South Africa.
On the negative side, [10] eThekwini has:
• Under-investment in sectors other than transport, storage and communications• Under-production of export goods• Underdeveloped SMME sector• Missed opportunities for better business linkages in maritime, tourism, production, ICT• Delays in industrial land production caused by slow rate of statutory approvals• Insufficient growth of the municipal rates and revenue services base• A relatively small labour force in relation to its population size• An under-skilled workforce• Out-migration of skilled persons
Snapshot Economic Indicators
Item As At 2013 Unless Otherwise Specified Benchmark Trend
Pop. Formal Employment 305,735 or 8.6% -
Pop. Informal Employment 205,000 or 5.77% -
GDP R222.6 Bn (2014) 2013 Increase
Imports R78 Bn i.e. 9.8% share of SA imports 2013 Increased No.
Imports from Asia-Pacific R45 Bn i.e.58% of local imports 2013 Increased No.
Total Exports R49 Bn i.e. 5.9% of SA exports 2013 Increased No.
Exports to Africa R18 Bn i.e. 37% of local exports 2013 Increased No.
Exports to EU R18 Bn i.e. 36% of local exports 2013 Increased No.
Economic Activity by Sector
GDP growth in the eThekwini Municipality increasedby 3.5% between 2011 and 2012 while KwaZulu-Nataland South Africa grew by 2.5% and 3.0% respectively.
The eThekwini economy is dominated by tertiaryindustries. Manufacturing, a secondary sector,constituted 22% of the economic activity, led by food &beverages, as well as fuel, petroleum, chemical &rubber products that contributed to manufacturing. [11]
10 Economic Development and Job Creation Plan. Draft. EMA. Prepared by Urban Econ. Oct 201411 Census 2011 and the latest 2012 data. Global Insight. 2012
Economic Sectors %
0
5
10
15
20
25
Manufacturing Finance
Community Services TradeTransport Construction
EThekwini BEPP 20115-16, Adopted, May 2015
Page 17
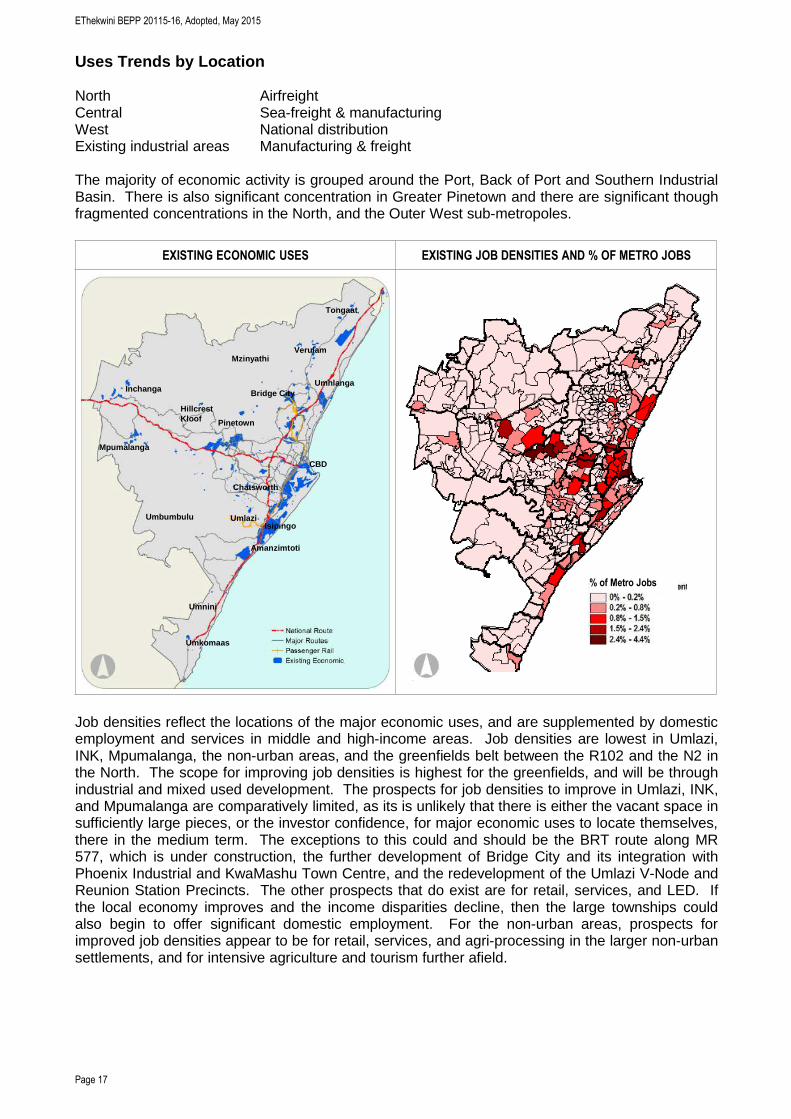
Uses Trends by Location
North AirfreightCentral Sea-freight & manufacturingWest National distributionExisting industrial areas Manufacturing & freight
The majority of economic activity is grouped around the Port, Back of Port and Southern IndustrialBasin. There is also significant concentration in Greater Pinetown and there are significant thoughfragmented concentrations in the North, and the Outer West sub-metropoles.
EXISTING ECONOMIC USES EXISTING JOB DENSITIES AND % OF METRO JOBS
Job densities reflect the locations of the major economic uses, and are supplemented by domesticemployment and services in middle and high-income areas. Job densities are lowest in Umlazi,INK, Mpumalanga, the non-urban areas, and the greenfields belt between the R102 and the N2 inthe North. The scope for improving job densities is highest for the greenfields, and will be throughindustrial and mixed used development. The prospects for job densities to improve in Umlazi, INK,and Mpumalanga are comparatively limited, as its is unlikely that there is either the vacant space insufficiently large pieces, or the investor confidence, for major economic uses to locate themselves,there in the medium term. The exceptions to this could and should be the BRT route along MR577, which is under construction, the further development of Bridge City and its integration withPhoenix Industrial and KwaMashu Town Centre, and the redevelopment of the Umlazi V-Node andReunion Station Precincts. The other prospects that do exist are for retail, services, and LED. Ifthe local economy improves and the income disparities decline, then the large townships couldalso begin to offer significant domestic employment. For the non-urban areas, prospects forimproved job densities appear to be for retail, services, and agri-processing in the larger non-urbansettlements, and for intensive agriculture and tourism further afield.
Mpumalanga
Amanzimtoti
Umbumbulu
CBD
Isipingo Umlazi
Chatsworth
Umnini
Umkomaas
Inchanga
Hillcrest Kloof Pinetown
Bridge City
Verulam
Tongaat
Umhlanga
Mzinyathi
% of Metro Jobs
EThekwini BEPP 20115-16, Adopted, May 2015
Page 18
Land Currently Serviced and Zoned for Economic Uses[12]
A key spatial expression of the metropolitan economy is industrial land (used interchangeably herewith ‘land for economic uses’). 16,730 Ha of land is currently serviced and zoned for economicuses. Of this, 14,400 Ha have been built up. 2,700 Ha is vacant. Current demand is in the rangeof 30 - 50 Ha p.a.. At these rates, the fallow land could theoretically satisfy supply for 30 - 50 yearsThere is however a perception by developers and property investors of un-served demand. Latentdemand may be higher than this if serviced land was readily available, as demonstrated throughthe rapid sales at Cornubia.
For 700 Ha of the fallow land is in the Outer West, take up is likely to be quick, as it has onlyrecently been developed and enjoys good access to the N3, and will deal with localised demandfor national distribution centres. For the fallow industrial land elsewhere, the prospects of take-upare not as optimistic, for the probable reason that this land is not well located and-or notappropriately serviced for the current demand (e.g. high speed broad band access, or roads thatcan accommodate interlinked vehicles). This raises the question of how to manage this land:should it be rezoned to a more suitable use or; should it be upgraded to meet new demand trends,and-or; should urban management issues be addressed that may be affecting the attractiveness ofthe area for investors and businesses.
National and Provincial Competition in the Industrial Land Market
What could be influencing the lack of take-up is land-price competition with Johannesburg, CapeTown, Richards Bay, and Pietermaritzburg. The average rentals of R 36-40 per m² on eThekwini’sindustrial land are similar to the average rentals in competing cities, but at R 1,250 per m² itsaverage land value is 30% (Jozi &CT), 200% (Richards Bay) to 400% (Pmb) respectively higherthan competing cities. High land prices compared to competing cities drags down the ROI fordeveloping industrial land. For sectors that are not location-bound, this is likely to result ininvestors preferring to invest in competing cities. For industries that are tied to eThekwini (e.g. Port& airport operations, major businesses where moving costs are too high, and aspects of theFreight Industry), price is an indicator of high demand relative to available supply.
Constraints to Land Production for Economic Uses
The overriding constraint is the time it takes to deliver serviced land. The business expectation isthat serviced land should be delivered within two years from project inception. The land productioncycle in eThekwini including identification of land, planning processes & approvals, and servicing,takes 8 to 10 years. Reasons include:
• Red tape / regulations/ delays / re-active planning/ EIA’s / Act 70 of 1970• Core infrastructure costs / limited municipal finance / developers contributions / Difficulties in
agreeing and coordinating contributions to core infrastructure by other spheres• Lack of internal co-ordination between departments
The other constraints include:
• Land prices are perceived as too high• Significant land holdings in the hands of a few owners• Lack of clear rates incentives• Variable investor confidence.
Constraints to Intensification and Redevelopment of Land for Economic Uses
Constraints include crime & grime, lack of urban management, and lack of impetus by publicentities to re-develop or upgrade of existing engineering & communications infrastructure.
12 Industrial Land Study & Land Strategy Development: Phase 2: Land Study Analysis. EMA. Prepared by The Planning Initiative Team. Mar 2014
EThekwini BEPP 20115-16, Adopted, May 2015
Page 19
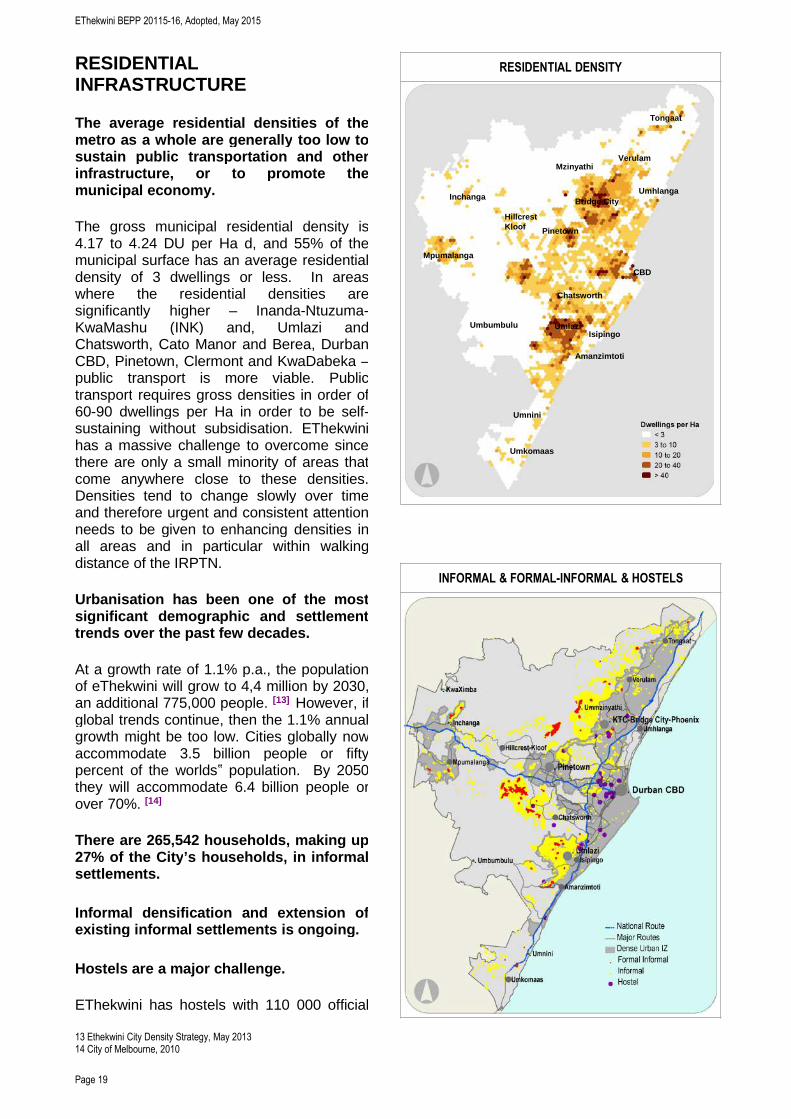
RESIDENTIALINFRASTRUCTURE
The average residential densities of themetro as a whole are generally too low tosustain public transportation and otherinfrastructure, or to promote themunicipal economy.
The gross municipal residential density is4.17 to 4.24 DU per Ha d, and 55% of themunicipal surface has an average residentialdensity of 3 dwellings or less. In areaswhere the residential densities aresignificantly higher – Inanda-Ntuzuma-KwaMashu (INK) and, Umlazi andChatsworth, Cato Manor and Berea, DurbanCBD, Pinetown, Clermont and KwaDabeka –public transport is more viable. Publictransport requires gross densities in order of60-90 dwellings per Ha in order to be self-sustaining without subsidisation. EThekwinihas a massive challenge to overcome sincethere are only a small minority of areas thatcome anywhere close to these densities.Densities tend to change slowly over timeand therefore urgent and consistent attentionneeds to be given to enhancing densities inall areas and in particular within walkingdistance of the IRPTN.
Urbanisation has been one of the mostsignificant demographic and settlementtrends over the past few decades.
At a growth rate of 1.1% p.a., the populationof eThekwini will grow to 4,4 million by 2030,an additional 775,000 people. [13] However, ifglobal trends continue, then the 1.1% annualgrowth might be too low. Cities globally nowaccommodate 3.5 billion people or fiftypercent of the worlds‟ population. By 2050they will accommodate 6.4 billion people orover 70%. [14]
There are 265,542 households, making up27% of the City’s households, in informalsettlements.
Informal densification and extension ofexisting informal settlements is ongoing.
Hostels are a major challenge.
EThekwini has hostels with 110 000 official
13 Ethekwini City Density Strategy, May 201314 City of Melbourne, 2010
RESIDENTIAL DENSITY
INFORMAL & FORMAL-INFORMAL & HOSTELS
Mpumalanga
Amanzimtoti
Umbumbulu
CBD
Isipingo Umlazi
Chatsworth
Umnini
Umkomaas
Inchanga
Hillcrest Kloof Pinetown
Bridge City
Verulam
Tongaat
Umhlanga
Mzinyathi
EThekwini BEPP 20115-16, Adopted, May 2015
Page 20
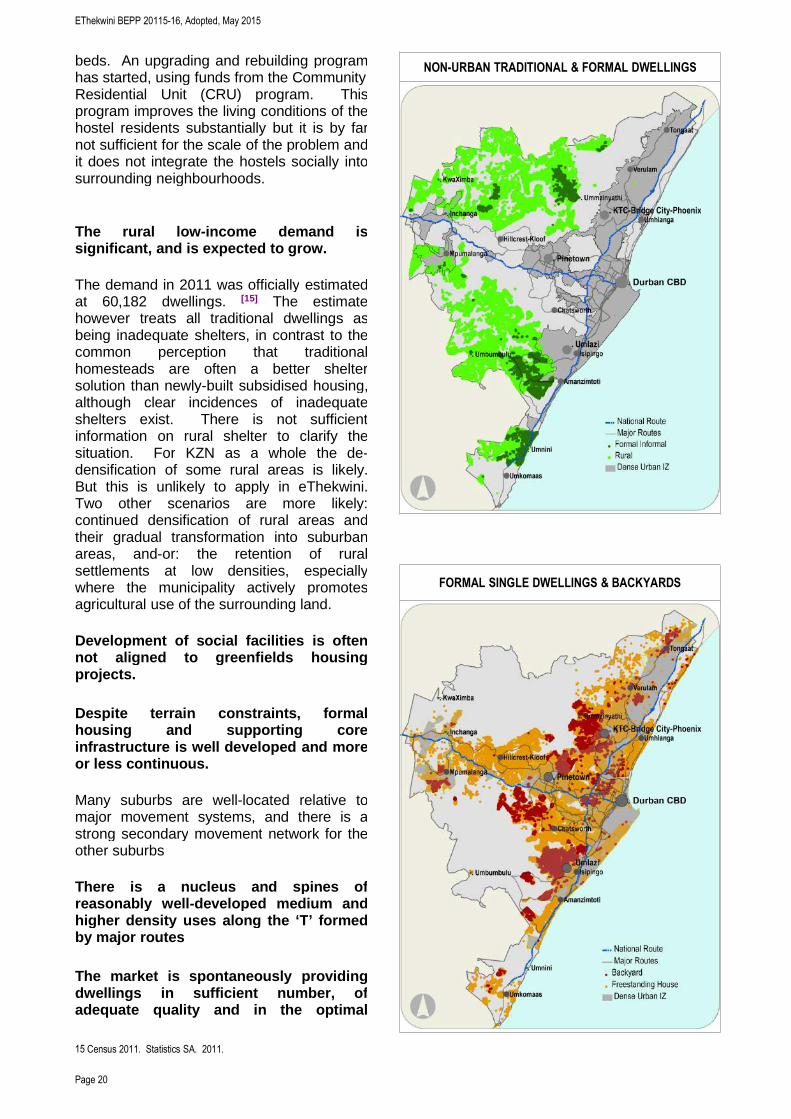
beds. An upgrading and rebuilding programhas started, using funds from the CommunityResidential Unit (CRU) program. Thisprogram improves the living conditions of thehostel residents substantially but it is by farnot sufficient for the scale of the problem andit does not integrate the hostels socially intosurrounding neighbourhoods.
The rural low-income demand issignificant, and is expected to grow.
The demand in 2011 was officially estimatedat 60,182 dwellings. [15] The estimatehowever treats all traditional dwellings asbeing inadequate shelters, in contrast to thecommon perception that traditionalhomesteads are often a better sheltersolution than newly-built subsidised housing,although clear incidences of inadequateshelters exist. There is not sufficientinformation on rural shelter to clarify thesituation. For KZN as a whole the de-densification of some rural areas is likely.But this is unlikely to apply in eThekwini.Two other scenarios are more likely:continued densification of rural areas andtheir gradual transformation into suburbanareas, and-or: the retention of ruralsettlements at low densities, especiallywhere the municipality actively promotesagricultural use of the surrounding land.
Development of social facilities is oftennot aligned to greenfields housingprojects.
Despite terrain constraints, formalhousing and supporting coreinfrastructure is well developed and moreor less continuous.
Many suburbs are well-located relative tomajor movement systems, and there is astrong secondary movement network for theother suburbs
There is a nucleus and spines ofreasonably well-developed medium andhigher density uses along the ‘T’ formedby major routes
The market is spontaneously providingdwellings in sufficient number, ofadequate quality and in the optimal
15 Census 2011. Statistics SA. 2011.
NON-URBAN TRADITIONAL & FORMAL DWELLINGS
FORMAL SINGLE DWELLINGS & BACKYARDS
EThekwini BEPP 20115-16, Adopted, May 2015
Page 21
locations for the upper-middle and upperincome markets.
Formal property markets are not workingefficiently for the low income andaffordable housing income groups.
One reason is that formal transfer processesare expensive and time consuming. Poorhouseholds often rely on the informalproperty market. The informal propertymarket is insufficiently recognised andregulated by the state and other decision-makers. This leaves the poor exposed toexploitation.
Low-income housing tends to distort thehousing market. The typical RDP housecosts around R120,000 but is provided free,and consequently perceived as having a lowmarket value. Secondly, the prevalence ofsubsidised housing can make it difficult fordevelopers to differentiate a lower-marketproduct from subsidised housing.
In addition, though the housing policy seeksto support households in the affordablemarket segment, affordability is significantlyover-estimated, whilst the cost of delivering such housing is typically under-estimated.
Some Bad Buildings exist in the inner city.
Some buildings have been taken over by Social Housing Institutions (SHI) who have refurbishedthem as rental units.
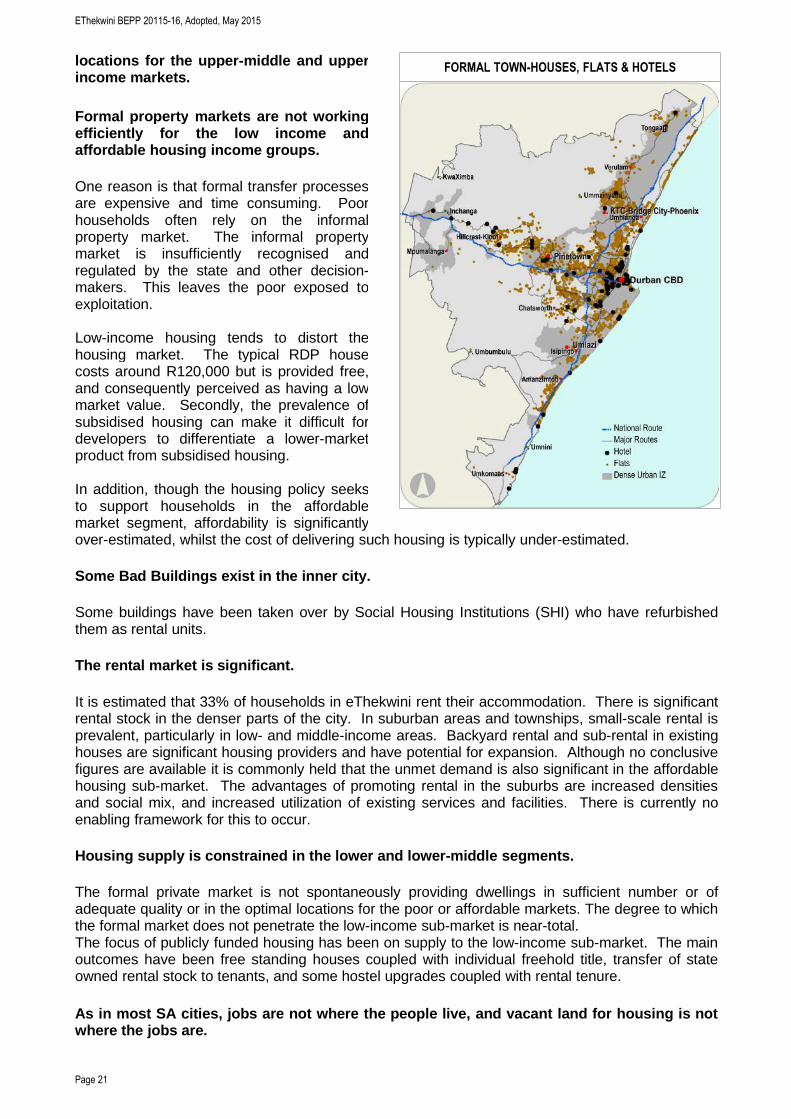
The rental market is significant.
It is estimated that 33% of households in eThekwini rent their accommodation. There is significantrental stock in the denser parts of the city. In suburban areas and townships, small-scale rental isprevalent, particularly in low- and middle-income areas. Backyard rental and sub-rental in existinghouses are significant housing providers and have potential for expansion. Although no conclusivefigures are available it is commonly held that the unmet demand is also significant in the affordablehousing sub-market. The advantages of promoting rental in the suburbs are increased densitiesand social mix, and increased utilization of existing services and facilities. There is currently noenabling framework for this to occur.
Housing supply is constrained in the lower and lower-middle segments.
The formal private market is not spontaneously providing dwellings in sufficient number or ofadequate quality or in the optimal locations for the poor or affordable markets. The degree to whichthe formal market does not penetrate the low-income sub-market is near-total.The focus of publicly funded housing has been on supply to the low-income sub-market. The mainoutcomes have been free standing houses coupled with individual freehold title, transfer of stateowned rental stock to tenants, and some hostel upgrades coupled with rental tenure.
As in most SA cities, jobs are not where the people live, and vacant land for housing is notwhere the jobs are.
FORMAL TOWN-HOUSES, FLATS & HOTELS
EThekwini BEPP 20115-16, Adopted, May 2015
Page 22
Most jobs in the manufacturing, warehousing and transport industry are located in the centre, southand west of the municipality but a large number of workers live in the north. Vacant land for low-income settlements has predominantly been identified in the north. The long distances betweenresidences and employment need to be addressed. The economic and residential growth axis is inthe North. It has been occurring for the last decade and this momentum will increase with thedevelopment of the Greater DTP and Greater Cornubia.
There are obstacles to densification
Construction costs are higher per top-structure than provided for in the subsidy schemes. If unitsare not subsidised, then they are unaffordable for the poor and lower-middle income. The sub-markets that can afford higher density unsubsidised or partly subsidised rental or ownership stockare very small and already stable in terms of current demand and supply.
Land acquisition for housing has distribution and acquisition challenges and opportunities
Approximately 205,000 Ha of Ethekwini’s extents are ‘undeveloped’ non-Forestry and Non-Agricultural land. Of this 71,000 hectares is deemed developable. Based on the need forapproximately 2,000 hectares of land for greenfields projects, the low income and affordablehousing market will require 3 % of the total amount of developable land in the municipality.
Most of the appropriately located land is in the North area under private ownership, and much ofthat in the hands of Tongaat Properties. The large holding by a single owner has contributed to asimpler land acquisition process. The impact on price of absence of competing land supply isunknown.
Vacant land also exists in the West. Land in the South is quite scarce with the remainingundeveloped land being unsuitable or too costly to develop due to the steep terrain. In Central,vacant land is limited, and what remains has already been informally settled. Central doeshowever provide excellent opportunities for small infill development as well as the development ofmedium density housing projects.
Land owned by the municipality can and often has been used for housing purposes, but is usuallysubject to intense competition for other uses.
The processes to use land owned by other spheres of government for housing tend to becomplicated and time consuming. In addition SOE’s treat their land as balance sheet assets andconsequently sell or let at market prices. Even at market price, acquisition of private land is oftenthe faster option. Where there are multiple land-owners, the situation can be complex if a privatetreaty approach is followed. Private treaties tend to collapse if some of the unwilling owners holdout for expropriation.
There are other significant non-technical challenges to housing delivery
Environmental Impact Assessments rarely stop housing projects but frequently delay them, as dothe procedures to release agricultural land.
Town planning requirements are principally township establishment. This often requires rezoningof the land. SPLUMA enables the municipality to carry out rezoning and township establishment inits own right without engagement with Province. The municipality would be interested to explore astreamlined town planning process, with cadaster being formally defined only for commercial andsocial sites and for roads, and with a less formal process for the definition of individual residentialsites.
Slow repayments to eThekwini for bridging finance on subsidised projects, coupled with increasinginternal resistance to availing bridging finance.
EThekwini BEPP 20115-16, Adopted, May 2015
Page 23
The funding portion for top-structures isinsufficient for medium-density developmentssuch as double-storey row-houses, especiallyif they are located on steep sites. Medium-density developments are required toimplement the spatial and housing strategiesof eThekwini. A top-up of approximately R40,000 per unit is required to enable theconstruction of double-storey duplexes.
The housing subsidy provisions for difficultgeo-technical conditions are insufficient forbuilding on steep land and for geotechnicallydifficult land. A top-up of approximately R15,000 per unit is required to enableadditional earthworks, embankments,retaining, slope stabilisation, and stormwatercontrol.
The city is gearing up capacity for dedicatedproject preparation.
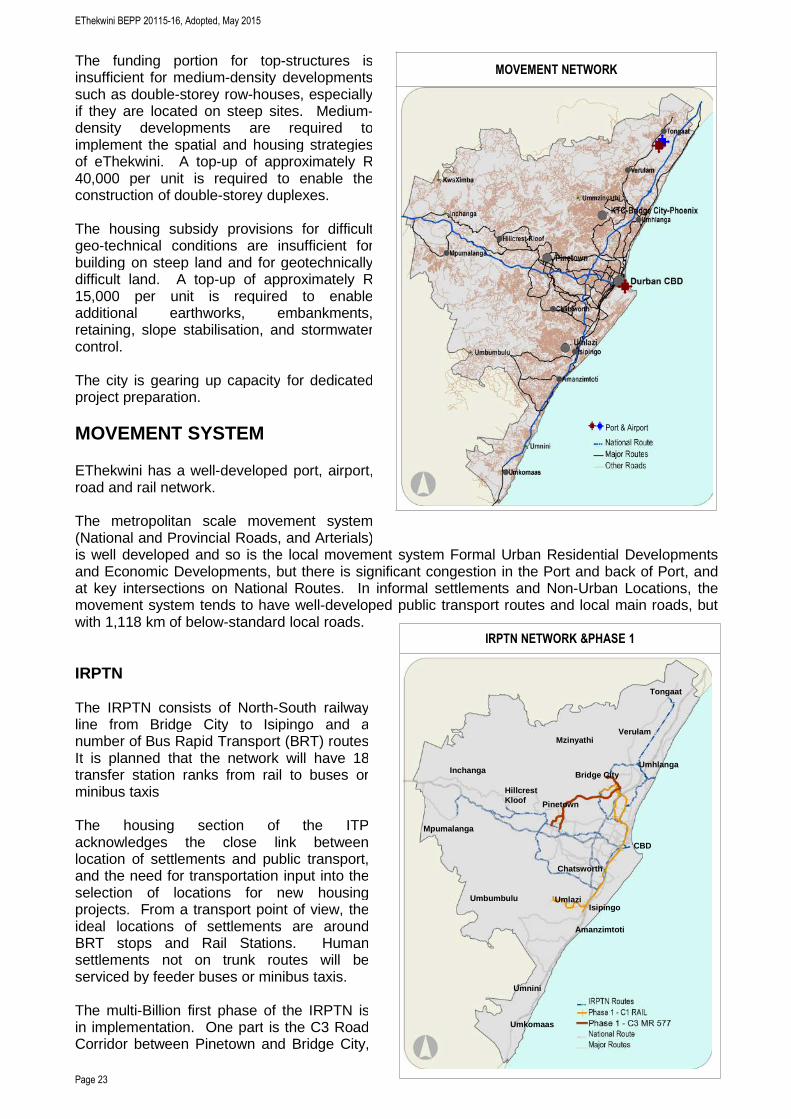
MOVEMENT SYSTEM
EThekwini has a well-developed port, airport,road and rail network.
The metropolitan scale movement system(National and Provincial Roads, and Arterials)is well developed and so is the local movement system Formal Urban Residential Developmentsand Economic Developments, but there is significant congestion in the Port and back of Port, andat key intersections on National Routes. In informal settlements and Non-Urban Locations, themovement system tends to have well-developed public transport routes and local main roads, butwith 1,118 km of below-standard local roads.
IRPTN
The IRPTN consists of North-South railwayline from Bridge City to Isipingo and anumber of Bus Rapid Transport (BRT) routes.It is planned that the network will have 18transfer station ranks from rail to buses orminibus taxis
The housing section of the ITPacknowledges the close link betweenlocation of settlements and public transport,and the need for transportation input into theselection of locations for new housingprojects. From a transport point of view, theideal locations of settlements are aroundBRT stops and Rail Stations. Humansettlements not on trunk routes will beserviced by feeder buses or minibus taxis.
The multi-Billion first phase of the IRPTN isin implementation. One part is the C3 RoadCorridor between Pinetown and Bridge City,
MOVEMENT NETWORK
Port & Airport
IRPTN NETWORK &PHASE 1
Amanzimtoti
Umbumbulu
CBD
Isipingo Umlazi
Chatsworth
Umnini
Umkomaas
Inchanga
Hillcrest Kloof Pinetown
Bridge City
Verulam
Tongaat
Umhlanga
Mzinyathi
Mpumalanga
EThekwini BEPP 20115-16, Adopted, May 2015
Page 24
a BRT route with BRT Stops and a major Transfer Station Rank at Bridge City. The BRT Routeand Stops are under construction. The other part is the C1 Rail Corridor from Bridget City toUmlazi Station. This involves Station Upgrades, line and signalling improvements, and new rollingstock. ETA is responsible for C3, and PRASA for C1. Both projects are regarded as CatalyticCore Infrastructure Projects.
Key Challenges
• Congestion, particularly around the Port and on key National Interchanges, is loweringeconomic productivity, and the important Freight sector is particularly affected.
• Congestion contributes over 50% of atmospheric emissions in cities – the highest source ofpollution.
• High accident rates involving pedestrians and high numbers of fatalities increase the burdenon hospitals and on medical and social services and decrease economic productivity.
• Maintenance backlogs translate to longer trip times and higher vehicle repair costs.
• Many of the poorest households live far from employment. Transport costs constitute asignificant percentage of their household expenses.
COMMUNITY SERVICES
The Access Model [16] maps the served and un-served demand for selected local and districtcommunity services of the population including informal settlements. The Model found a generaltrend of under-provision, with particularly low access to schooling and primary health care.
The cost of meeting the un-served demand was first calculated to be in the order of R 7.2 Bn (atcurrent value). [17] When the constrained funding environment was taken into view, it prompted theEssential Services to be differentiated from Desirable Services, and to lower accessibility levels forDesirable Services. This reduced the requirement to R 3.4 Bn.
The process of interpreting the Access Model also identified other key issues that need resolving:
• The need for multi-MTEF spatial planning and budgeting• Funding mandates re Fire and Libraries• Funding commitments of other spheres• Coordination with other spheres• Population thresholds and space standards for Local and Regional Parks• Management with Dept Education of school sports facilities as community facilities
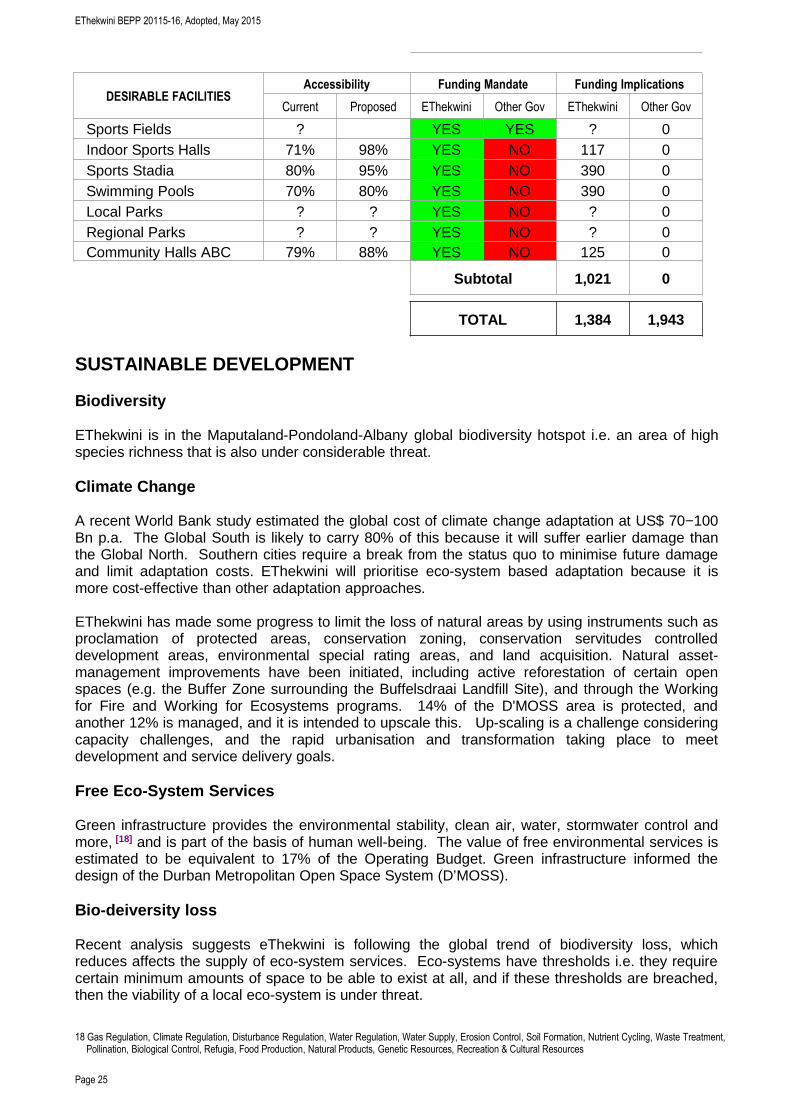
ESSENTIAL FACILITIESAccessibility Funding Mandate Funding Implications
Current Proposed EThekwini Other Gov EThekwini Other Gov
Clinics 56% 93% NO YES 0 168CHC's 56% 93% NO YES 0 123Primary Schools 83% 100% NO YES 0 624
Secondary Schools 77% 99% NO YES 0 900
SAPS Police Station ? ? NO YES ? 0Fire Stations 72% 85% ? ? 234 ?Libraries 70% 92% YES YES 129 129Cemeteries - - YES NO ? 0Metro Police Station ? ? YES NO ? 0
Subtotal 362 1,943
16 Accessibility Mapping & Optimisation of Community Social Services In Ethekwini. Ethekwini Municipality. Prepared by CSIR. 2008. Updated 2010, 2013, 2014.17 This figure excludes local and regional parks, for which the standards require review.
EThekwini BEPP 20115-16, Adopted, May 2015
Page 25
DESIRABLE FACILITIESAccessibility Funding Mandate Funding Implications
Current Proposed EThekwini Other Gov EThekwini Other Gov
Sports Fields ? YES YES ? 0Indoor Sports Halls 71% 98% YES NO 117 0Sports Stadia 80% 95% YES NO 390 0Swimming Pools 70% 80% YES NO 390 0Local Parks ? ? YES NO ? 0Regional Parks ? ? YES NO ? 0Community Halls ABC 79% 88% YES NO 125 0
Subtotal 1,021 0
TOTAL 1,384 1,943
SUSTAINABLE DEVELOPMENT
Biodiversity
EThekwini is in the Maputaland-Pondoland-Albany global biodiversity hotspot i.e. an area of highspecies richness that is also under considerable threat.
Climate Change
A recent World Bank study estimated the global cost of climate change adaptation at US$ 70−100Bn p.a. The Global South is likely to carry 80% of this because it will suffer earlier damage thanthe Global North. Southern cities require a break from the status quo to minimise future damageand limit adaptation costs. EThekwini will prioritise eco-system based adaptation because it ismore cost-effective than other adaptation approaches.
EThekwini has made some progress to limit the loss of natural areas by using instruments such asproclamation of protected areas, conservation zoning, conservation servitudes controlleddevelopment areas, environmental special rating areas, and land acquisition. Natural asset-management improvements have been initiated, including active reforestation of certain openspaces (e.g. the Buffer Zone surrounding the Buffelsdraai Landfill Site), and through the Workingfor Fire and Working for Ecosystems programs. 14% of the D'MOSS area is protected, andanother 12% is managed, and it is intended to upscale this. Up-scaling is a challenge consideringcapacity challenges, and the rapid urbanisation and transformation taking place to meetdevelopment and service delivery goals.
Free Eco-System Services
Green infrastructure provides the environmental stability, clean air, water, stormwater control andmore, [18] and is part of the basis of human well-being. The value of free environmental services isestimated to be equivalent to 17% of the Operating Budget. Green infrastructure informed thedesign of the Durban Metropolitan Open Space System (D’MOSS).
Bio-deiversity loss
Recent analysis suggests eThekwini is following the global trend of biodiversity loss, whichreduces affects the supply of eco-system services. Eco-systems have thresholds i.e. they requirecertain minimum amounts of space to be able to exist at all, and if these thresholds are breached,then the viability of a local eco-system is under threat.
18 Gas Regulation, Climate Regulation, Disturbance Regulation, Water Regulation, Water Supply, Erosion Control, Soil Formation, Nutrient Cycling, Waste Treatment,Pollination, Biological Control, Refugia, Food Production, Natural Products, Genetic Resources, Recreation & Cultural Resources
EThekwini BEPP 20115-16, Adopted, May 2015
Page 26
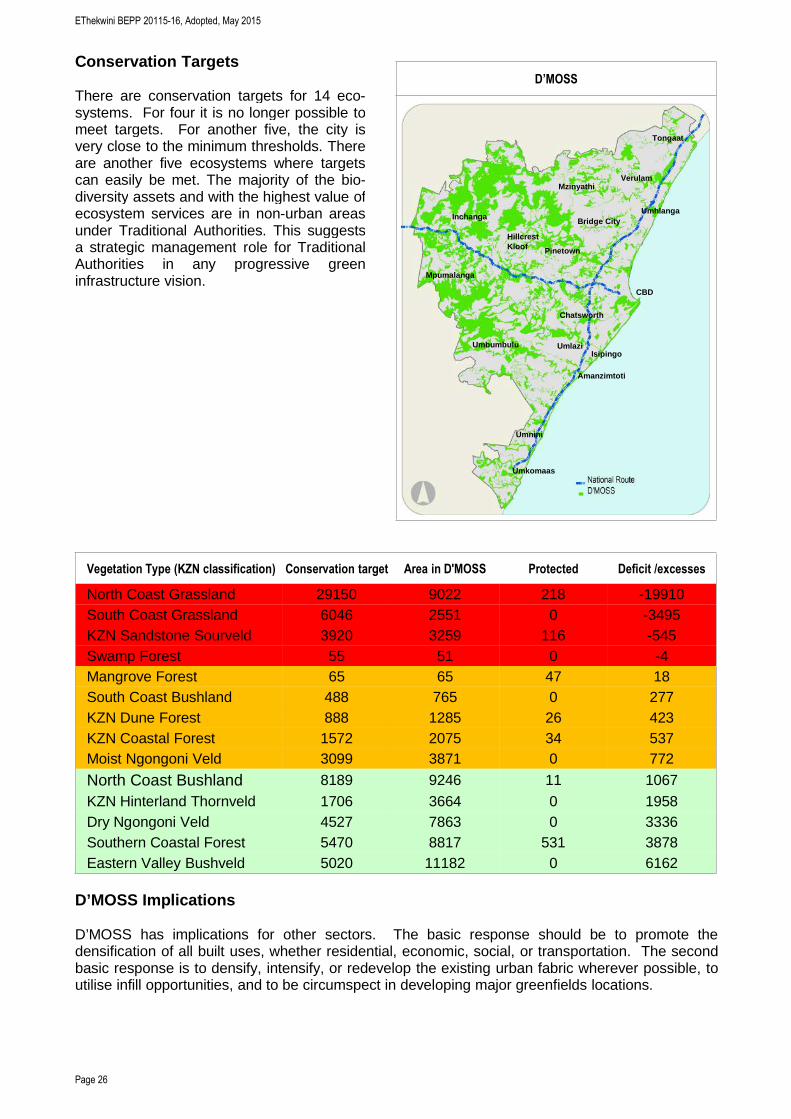
Conservation Targets
There are conservation targets for 14 eco-systems. For four it is no longer possible tomeet targets. For another five, the city isvery close to the minimum thresholds. Thereare another five ecosystems where targetscan easily be met. The majority of the bio-diversity assets and with the highest value ofecosystem services are in non-urban areasunder Traditional Authorities. This suggestsa strategic management role for TraditionalAuthorities in any progressive greeninfrastructure vision.
Vegetation Type (KZN classification) Conservation target Area in D'MOSS Protected Deficit /excesses
North Coast Grassland 29150 9022 218 -19910South Coast Grassland 6046 2551 0 -3495KZN Sandstone Sourveld 3920 3259 116 -545Swamp Forest 55 51 0 -4Mangrove Forest 65 65 47 18South Coast Bushland 488 765 0 277KZN Dune Forest 888 1285 26 423KZN Coastal Forest 1572 2075 34 537Moist Ngongoni Veld 3099 3871 0 772
North Coast Bushland 8189 9246 11 1067KZN Hinterland Thornveld 1706 3664 0 1958Dry Ngongoni Veld 4527 7863 0 3336Southern Coastal Forest 5470 8817 531 3878Eastern Valley Bushveld 5020 11182 0 6162
D’MOSS Implications
D’MOSS has implications for other sectors. The basic response should be to promote thedensification of all built uses, whether residential, economic, social, or transportation. The secondbasic response is to densify, intensify, or redevelop the existing urban fabric wherever possible, toutilise infill opportunities, and to be circumspect in developing major greenfields locations.
D’MOSS
Mpumalanga
Amanzimtoti
Umbumbulu
CBD
Isipingo
Umlazi
Chatsworth
Umnini
Umkomaas
Inchanga
Hillcrest Kloof
Pinetown
Bridge City
Verulam
Tongaat
Umhlanga
Mzinyathi
EThekwini BEPP 20115-16, Adopted, May 2015
Page 27
CORE INFRASTRUCTURE
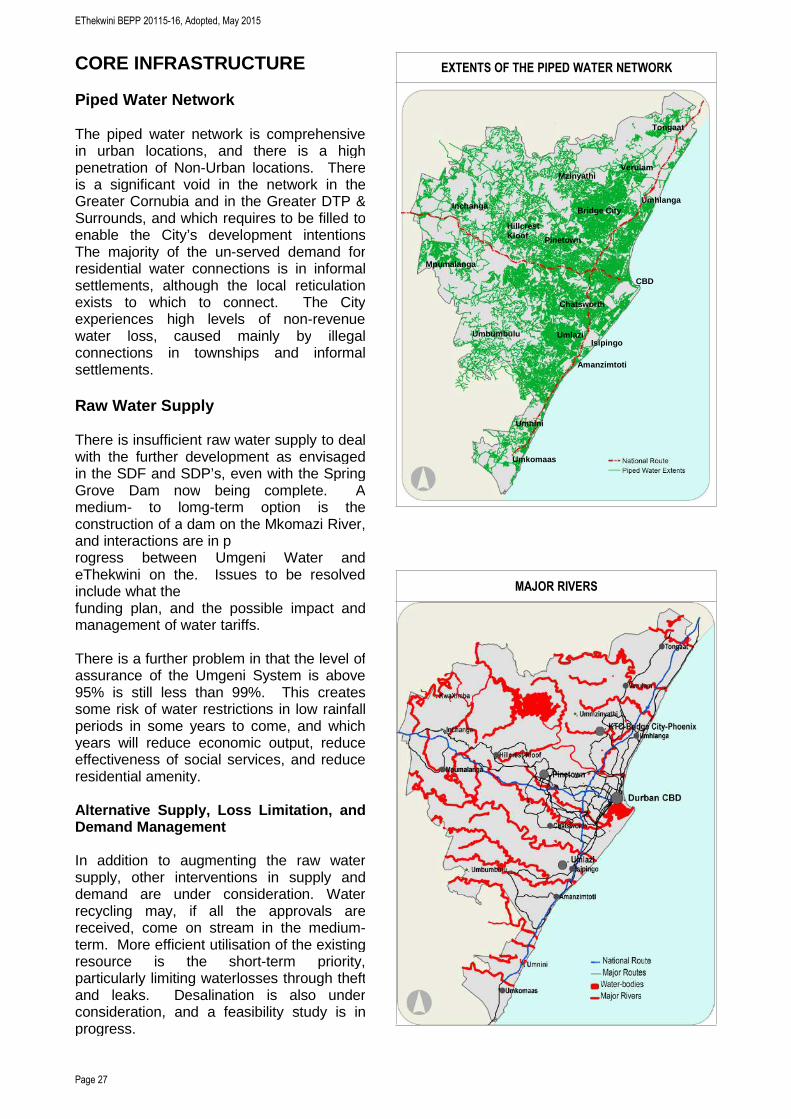
Piped Water Network
The piped water network is comprehensivein urban locations, and there is a highpenetration of Non-Urban locations. Thereis a significant void in the network in theGreater Cornubia and in the Greater DTP &Surrounds, and which requires to be filled toenable the City’s development intentionsThe majority of the un-served demand forresidential water connections is in informalsettlements, although the local reticulationexists to which to connect. The Cityexperiences high levels of non-revenuewater loss, caused mainly by illegalconnections in townships and informalsettlements.
Raw Water Supply
There is insufficient raw water supply to dealwith the further development as envisagedin the SDF and SDP’s, even with the SpringGrove Dam now being complete. Amedium- to lomg-term option is theconstruction of a dam on the Mkomazi River,and interactions are in progress between Umgeni Water andeThekwini on the. Issues to be resolvedinclude what thefunding plan, and the possible impact andmanagement of water tariffs.
There is a further problem in that the level ofassurance of the Umgeni System is above95% is still less than 99%. This createssome risk of water restrictions in low rainfallperiods in some years to come, and whichyears will reduce economic output, reduceeffectiveness of social services, and reduceresidential amenity.
Alternative Supply, Loss Limitation, andDemand Management
In addition to augmenting the raw watersupply, other interventions in supply anddemand are under consideration. Waterrecycling may, if all the approvals arereceived, come on stream in the medium-term. More efficient utilisation of the existingresource is the short-term priority,particularly limiting waterlosses through theftand leaks. Desalination is also underconsideration, and a feasibility study is inprogress.
EXTENTS OF THE PIPED WATER NETWORK
MAJOR RIVERS
Mpumalanga
Amanzimtoti
Umbumbulu
CBD
Isipingo Umlazi
Chatsworth
Umnini
Umkomaas
Inchanga
Hillcrest Kloof Pinetown
Bridge City
Verulam
Tongaat
Umhlanga
Mzinyathi
EThekwini BEPP 20115-16, Adopted, May 2015
Page 28
Water Supply Reconciliation Strategy Study for the KZN Coastal Metropolitan Area
The objective of this DWA study is to identify, evaluate, and prioritise interventions to reconcile thewater requirements with the available water resources up to the year 2030. The study area is fromPietermaritzburg in the west to Durban and from KwaDukuza in the north to Amanzimtoti in thesouth. It includes the eThekwini Metropolitan and Msunduzi and Ilembe Municipalities.
River Classes
Related to the Reconciliation Strategy is an exercise by DWA to classify the rivers in the KZNCoastal Metropolitan Area. The Classes, once gazetted, will set what can be extracted from them,what can be discharged into them, and how must be managed environmentally. The exercise hasa strong emphasis on environmental considerations, and in upgrading of rivers. High-levelinteractions are in progress between DWA and eThekwini on how to modify the exercise to takeinto greater consideration the future growth of the City, and also the cost and technologyimplications of the infrastructure needed to sustain the River Classes.
Wasterwater Treatment Works
There is some urgency to upgrade existing and build new WWTW’s, oarticularly in the North.Obtaining approvals for doing so is linked to the finalisation of the River Classes exercise, and toobtaining Water Use Licences, and currently these are delay factors that need to be consideredand where possible mitigated.
Water Use Licences
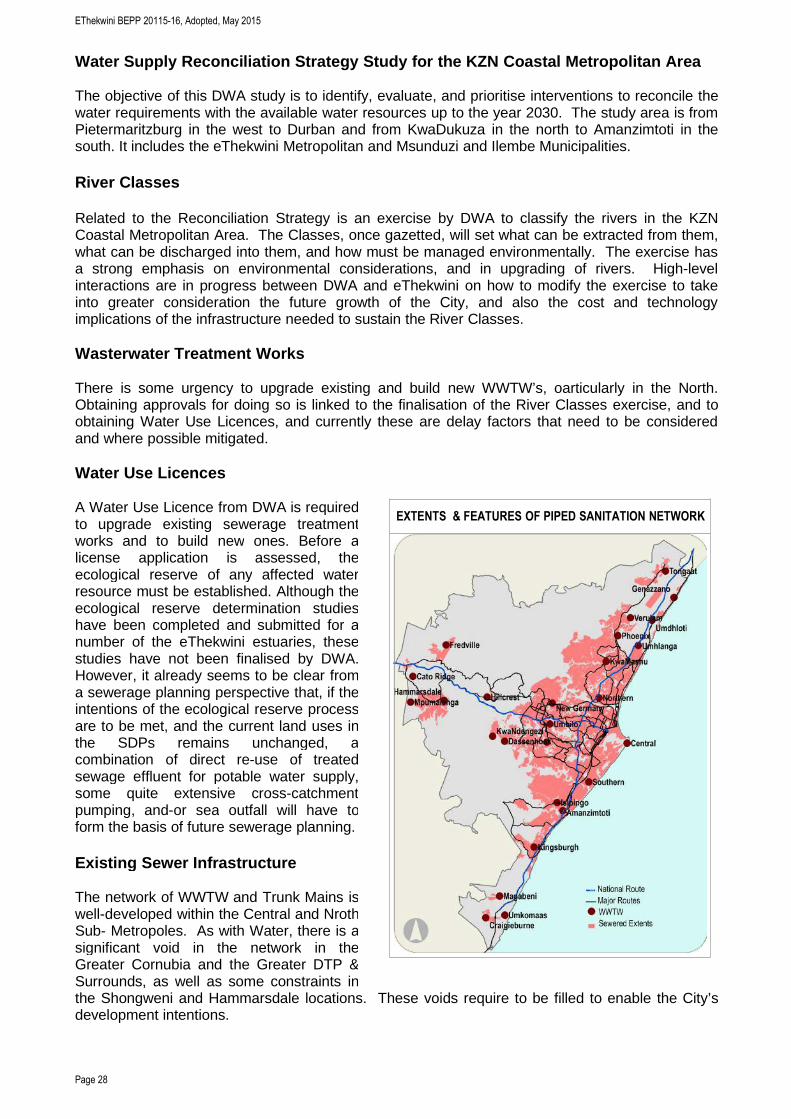
A Water Use Licence from DWA is requiredto upgrade existing sewerage treatmentworks and to build new ones. Before alicense application is assessed, theecological reserve of any affected waterresource must be established. Although theecological reserve determination studieshave been completed and submitted for anumber of the eThekwini estuaries, thesestudies have not been finalised by DWA.However, it already seems to be clear froma sewerage planning perspective that, if theintentions of the ecological reserve processare to be met, and the current land uses inthe SDPs remains unchanged, acombination of direct re-use of treatedsewage effluent for potable water supply,some quite extensive cross-catchmentpumping, and-or sea outfall will have toform the basis of future sewerage planning.
Existing Sewer Infrastructure
The network of WWTW and Trunk Mains iswell-developed within the Central and NrothSub- Metropoles. As with Water, there is asignificant void in the network in theGreater Cornubia and the Greater DTP &Surrounds, as well as some constraints inthe Shongweni and Hammarsdale locations. These voids require to be filled to enable the City’sdevelopment intentions.
EXTENTS & FEATURES OF PIPED SANITATION NETWORK

EThekwini BEPP 20115-16, Adopted, May 2015
Page 29
Bulk Electricity Supply
EThekwini’s electrical networks havesufficient bulk capacity, with localisedconstraints in the Westmead, Springfield,and Assagay-Shongweni. Plans are in placeto rectify these by 2023. The 20-year loadforecasts are being revised and will then beused to update the 2011 Masterplan, anexercise that is scheduled for completion in2016.
Eskom Supply Challenge
The interrupted bulk supply through Eskom’sload-shedding, which was recentlyannounced as being likely to end only in2018, is a significant impediment todevelopment, and particularly for EconomicDevelopment.
Alternative Energy Sources
In line with Green Economy objectives, theCity is rolling out the methane harvesting onrecently closed landfill sites, and has beguninvestigations into:
• The feasibility of a Peak Power Gas Turbine Electrical Generation Plant. The Gas Turbinewould kick in during load-shedding, to eliminate the impact of load-shedding on commercialusers and other large clients (such as hospitals and tertiary institutions)
• The generation potential pf photovoltaic arrays on land-fill sites where methane levels havefallen to below being feasible for harvesting
• The generation potential of a range of hydro-turbine projects at reservoir inlets and outlets
Current Service Delivery to Existing Residential Uses
Service % of eThekwini households served at applicable Service Standards
Water 92.23 %Sanitation 76.05 %Solid Waste Removal 100.00 %Electrical Connection 66.40 %
There is a Service Standard for each main typology of residential development.
• Rural service standards: One ground tank per household supplied with 300 L per day; Urinediversion toilet; Electrification only of densely clustered pockets; All weather surface to allpublic transport routes within communities having a density greater than 15 persons per Ha
• Informal Settlement standards: Communal ablution blocks (toilets and showers) within 200m ofserved households; High mast lighting for security; Prepaid electrical connections [19]; Accessroads for waste removal, fire and emergency vehicles.
• Formal Urban service standards: Semi pressure water house connections; Waterbornesanitation; Metered electricity connections; All weather surface roads.
19 The above map shows the demand for household connections to formal households only. In addition, there is extensive demand arising from the policy decision toelectrify al informal settlements as well
MAJOR ELEMENTS OF THE ELECTRICAL NETWORK
EskomInfeed PointsEthekwini Main Lines
EThekwini BEPP 20115-16, Adopted, May 2015
Page 30
Un-served Residential Demand
Compared to the service standards, the spatial distribution of demand is most concentrated inInformal Settlements, and with some demand in Non-Urban locations.
ELECTRICAL CONNECTIONS WATER CONNECTIONS ROADS SEWER CONNECTIONS
Mpumalanga
Amanzimtoti
Umbumbulu
CBD
Isipingo Umlazi
Chatsworth
Umnini
Umkomaas
Inchanga
Hillcrest Kloof Pinetown
Bridge City
Verulam
Tongaat
Umhlanga
Mzinyathi
Current Service Delivery to Existing Formal Economic Uses
Service % of eThekwini households served
Water 100.00 %Sanitation 100.00 %Solid Waste Removal 100.00 %Electrical Connection 100.00 %
Current Service Delivery to Existing Informal Economic Uses
No comprehensive information available.
Mpumalanga
Amanzimtoti
Umbumbulu
CBD
Isipingo Umlazi
Chatsworth
Umnini
Umkomaas
Inchanga
Hillcrest Kloof Pinetown
Bridge City
Verulam
Tongaat
Umhlanga
Mzinyathi
EThekwini BEPP 20115-16, Adopted, May 2015
Page 31
IMPACTS OF TRENDS, DEMANDS & FEATURES
ECONOMIC & SOCIAL IMPACTS
SPATIAL IMPACTS
Connectivity
Efficiency
Density
Prosperity
Inclusivity
TRENDS & FEATURES (SORTED IN DESCENDING ORDER FROM HIGHEST NO. OF POSITIVEIMPACTS)
Well-developed port & airport, movement & communication systems Y Y Y Y YCatalytic Greater Cornubia, Greater DTP, Keystone in implementation Y Y Y Y YPhase 1 IRPTN (i.e. C3 MR 577 and C1 Rail) under construction Y Y Y Y YNucleus and spines of medium & higher density residential Y Y Y Y YWestern & Northern Aqueducts under construction 0 Y Y Y 0Apparently keen interest in industrial land production in new locations 0 Y ? Y YExtensive eco-system 0 Y Y Y 0Sufficient supply, in ok locations, of middle &upper income residential 0 Y Y Y ?High incidence of informal settlements in & near low income suburbs Y Y Y X XGateway-city for trade and travel Y 0 0 Y 0Strong local economy, especially freight, manufacturing, trade, finance 0 0 0 Y YRapid pace of communal ablution block construction in informal settlements 0 0 0 Y YUrbanisation, mainly by the poor, mainly into informal settlements 0 ? Y ? ?Increasing un-serviced formal non-urban housing next to urban uses 0 X X Y 0Significant and growing non-urban residential demand ? X X Y ?Congestion in Port & BoP, and at key intersections on National Routes. 0 X 0 X 0Bio-diversity loss 0 X ? X 0Shortage of skilled and semi-skilled labour 0 X 0 X XUnreliable electricity supply 0 X X X 0Constraint in raw water supply 0 X X X 0Significant basic residential services backlogs for informal settlements X 0 0 X XExcept ablution bocks, slow addressing of basic res. services backlogs X 0 0 X XWUL’s not to hand to support growth in key areas 0 X X X 0Fallow industrial land 0 X X X XLong time-frames to approve and service industrial land 0 X X X XDevelopment of social facilities not aligned to housing projects X X 0 X XSignificant community services backlogs X X ? X XLack of IG planning and budget co-ordination X X X 0 XSegregated-use city X X X X XLow-density city X X X X XLow-income city X X X X XCommuter-city for low income communities X X X X XUnder-developed ICT networks X X X X XInsufficient capital available to municipality X X X X X
The trend / feature inhibits (X) promotes (Y), has unclear, unknown, or mixed impact (?), or does nothing positive (0)
EThekwini BEPP 20115-16, Adopted, May 2015
Page 32
“One of the main expectations of the 2015/16 – 2017/18 BEPP is the identification, packaging andimplementation of catalytic urban development projects within the Integration Zones. In additionthere is a specific focus on the upgrading and development of informal settlements and othermarginalised areas.” [20]
LONG TERM VISION AND THE SPATIAL DEVELOPMENT STRATEGY
Key themes of the LTDF
• Creating a safe city• Promoting an accessible city• Creating a prosperous city where all
enjoy sustainable livelihoods
CITY VISION
“By 2020 the eThekwini Municipality willenjoy the reputation of being Africa’smost caring and liveable city, where allcitizens live in harmony.”
•••• Celebrating our cultural• diversity, arts and heritage• Ensuring a more environmentally sustainable city• Fostering a caring and empowering city.
IDP
The IDP aims to realise the CityVision by “growing its economy andmeeting people’s needs so that allcitizens enjoy a high quality of lifewith equal opportunities, in a city thatthey are truly proud of.”
SDF
• Where protection is needed, includingnatural, heritage and environmentalkey assets as well as agricultural andrural assets
• Where integration & restructuring isneeded
• Where economic growth and• investment will be pursued• Where social investment will take preference• Where integration & restructuring is needed• Where economic growth and investment will be pursued• Where social investment will take preference• Where infill, densification and urban renewal should be pursued• Where new growth areas is desired• Where there is existing infrastructure capacity to support integration and
densification,• Correcting and enhancing the hierarchy of roads, transport corridors and nodes
20 Guidance Note for the Built Environment Performance Plan 2015/16 – 2017/18. National Treasury, Oct 2014
PART C - Strategies and Programs
EThekwini BEPP 20115-16, Adopted, May 2015
Page 33
The Eight IDP Plans
The IDP has eight plans. Each plan has objectives.
While all eight plans and their objectives are significant and essential, the ones with a direct spatialoutput are shown in bold text, the ones with indirect spatial output are shown in regular text, andthe ones with little spatial relevance in greyed out small text.
PLAN OBJECTIVE
1 Develop & Sustainour Spatial, Natural &Built Environment
Develop, manage and regulate the Built & Natural Environment
Plan for climate protection
2 Develop aProsperous, DiverseEconomy andEmployment Creation
Provide Economic Leadership and Intelligence
Facilitate Private Sector Investment and Partnerships
Facilitate Key Infrastructure Development & Maximise LocalBenefit
Facilitate Development in Priority Nodes and Corridors
Enterprise and Sector Development
Develop a Competitive Tourism Sector
Facilitate Sustainable Livelihoods
3 Create a QualityLiving Environment
Meet infrastructure and household service needs and backlogs
Address community service backlogs
4 Foster a SociallyEquitable Environment
Promote the safety of citizens
Promote the health of citizens
5 Create a Platform for Growth,Empowerment and Skills Development
Human Capital Development
Develop City as a learning City
Foster healthy and productive employees
6 Embrace our CulturalDiversity, Arts andHeritage
Promote Access and Inclusivity
Create economic participation through socio-cultural empowerment
7 Promote Good Governance &Responsive Local Government
Ensure accessibility and promote governance
Create an efficient, effective and accountable administration
8 Be a FinanciallyAccountable andSustainable City
Budget strategically and sustainably
Grow and diversify revenues
Ensure value for money expenditure
Follow sound financial management & reporting
Relationships of Metropolitan Program Groups to Metropolitan PlanningInstruments
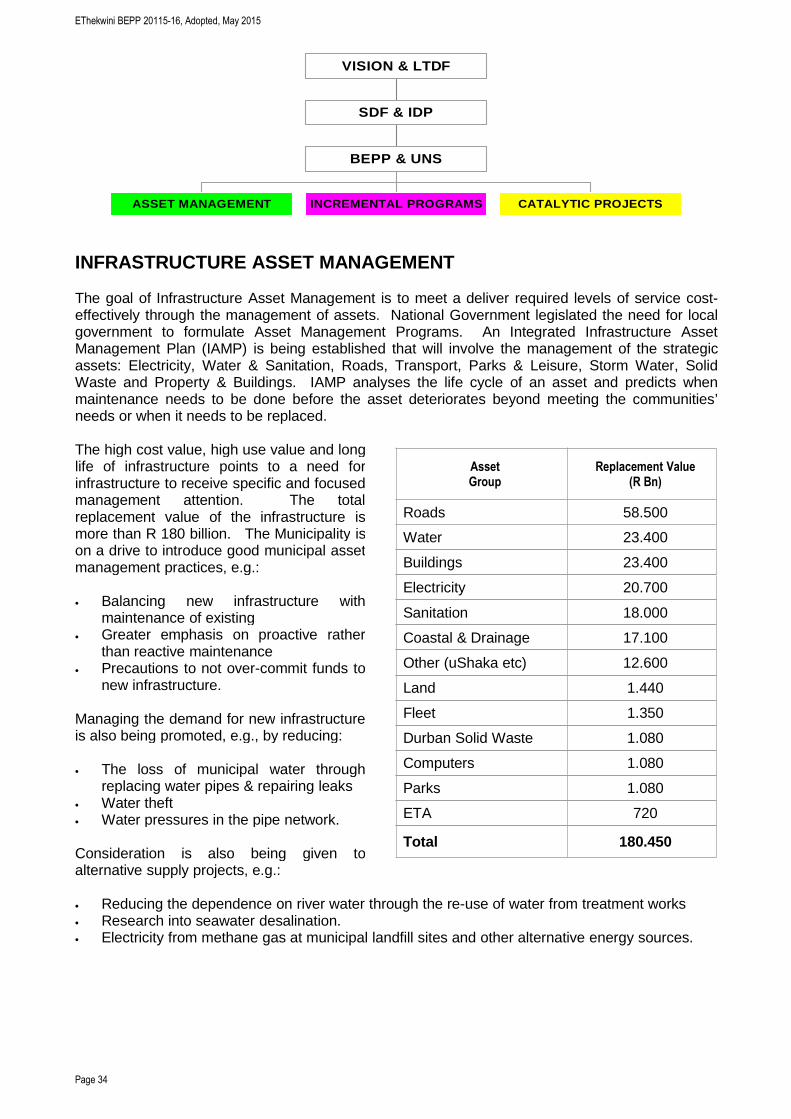
Cutting across the plans and objectives, the IDP emphasises:
• Asset Management• Incremental Development Programs• Catalytic Projects
EThekwini BEPP 20115-16, Adopted, May 2015
Page 34
INFRASTRUCTURE ASSET MANAGEMENT
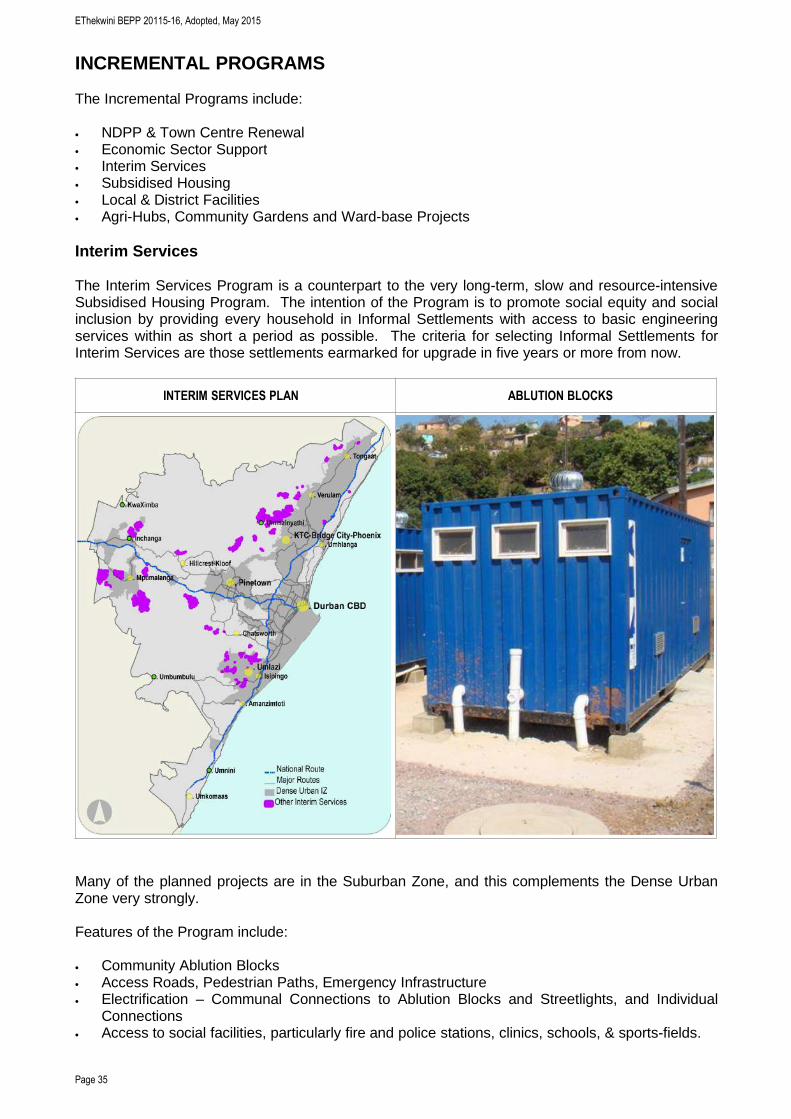
The goal of Infrastructure Asset Management is to meet a deliver required levels of service cost-effectively through the management of assets. National Government legislated the need for localgovernment to formulate Asset Management Programs. An Integrated Infrastructure AssetManagement Plan (IAMP) is being established that will involve the management of the strategicassets: Electricity, Water & Sanitation, Roads, Transport, Parks & Leisure, Storm Water, SolidWaste and Property & Buildings. IAMP analyses the life cycle of an asset and predicts whenmaintenance needs to be done before the asset deteriorates beyond meeting the communities’needs or when it needs to be replaced.
The high cost value, high use value and longlife of infrastructure points to a need forinfrastructure to receive specific and focusedmanagement attention. The totalreplacement value of the infrastructure ismore than R 180 billion. The Municipality ison a drive to introduce good municipal assetmanagement practices, e.g.:
• Balancing new infrastructure withmaintenance of existing
• Greater emphasis on proactive ratherthan reactive maintenance
• Precautions to not over-commit funds tonew infrastructure.
Managing the demand for new infrastructureis also being promoted, e.g., by reducing:
• The loss of municipal water throughreplacing water pipes & repairing leaks
• Water theft• Water pressures in the pipe network.
Consideration is also being given toalternative supply projects, e.g.:
• Reducing the dependence on river water through the re-use of water from treatment works• Research into seawater desalination.• Electricity from methane gas at municipal landfill sites and other alternative energy sources.
AssetGroup
Replacement Value(R Bn)
Roads 58.500
Water 23.400
Buildings 23.400
Electricity 20.700
Sanitation 18.000
Coastal & Drainage 17.100
Other (uShaka etc) 12.600
Land 1.440
Fleet 1.350
Durban Solid Waste 1.080
Computers 1.080
Parks 1.080
ETA 720
Total 180.450
ASSET MANAGEMENT INCREMENTAL PROGRAMS CATALYTIC PROJECTS
BEPP & UNS
SDF & IDP
VISION & LTDF
EThekwini BEPP 20115-16, Adopted, May 2015
Page 35
INCREMENTAL PROGRAMS
The Incremental Programs include:
• NDPP & Town Centre Renewal• Economic Sector Support• Interim Services• Subsidised Housing• Local & District Facilities• Agri-Hubs, Community Gardens and Ward-base Projects
Interim Services
The Interim Services Program is a counterpart to the very long-term, slow and resource-intensiveSubsidised Housing Program. The intention of the Program is to promote social equity and socialinclusion by providing every household in Informal Settlements with access to basic engineeringservices within as short a period as possible. The criteria for selecting Informal Settlements forInterim Services are those settlements earmarked for upgrade in five years or more from now.
INTERIM SERVICES PLAN ABLUTION BLOCKS
Many of the planned projects are in the Suburban Zone, and this complements the Dense UrbanZone very strongly.
Features of the Program include:
• Community Ablution Blocks• Access Roads, Pedestrian Paths, Emergency Infrastructure• Electrification – Communal Connections to Ablution Blocks and Streetlights, and Individual
Connections• Access to social facilities, particularly fire and police stations, clinics, schools, & sports-fields.
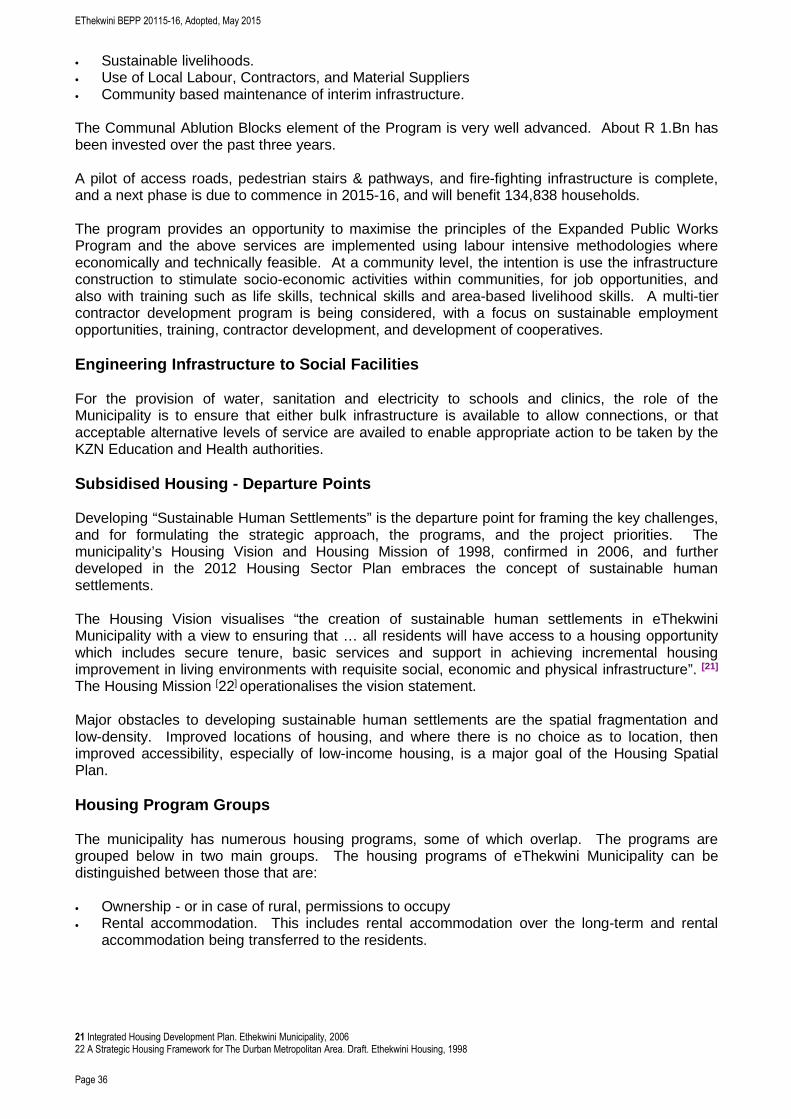
EThekwini BEPP 20115-16, Adopted, May 2015
Page 36
• Sustainable livelihoods.• Use of Local Labour, Contractors, and Material Suppliers• Community based maintenance of interim infrastructure.
The Communal Ablution Blocks element of the Program is very well advanced. About R 1.Bn hasbeen invested over the past three years.
A pilot of access roads, pedestrian stairs & pathways, and fire-fighting infrastructure is complete,and a next phase is due to commence in 2015-16, and will benefit 134,838 households.
The program provides an opportunity to maximise the principles of the Expanded Public WorksProgram and the above services are implemented using labour intensive methodologies whereeconomically and technically feasible. At a community level, the intention is use the infrastructureconstruction to stimulate socio-economic activities within communities, for job opportunities, andalso with training such as life skills, technical skills and area-based livelihood skills. A multi-tiercontractor development program is being considered, with a focus on sustainable employmentopportunities, training, contractor development, and development of cooperatives.
Engineering Infrastructure to Social Facilities
For the provision of water, sanitation and electricity to schools and clinics, the role of theMunicipality is to ensure that either bulk infrastructure is available to allow connections, or thatacceptable alternative levels of service are availed to enable appropriate action to be taken by theKZN Education and Health authorities.
Subsidised Housing - Departure Points
Developing “Sustainable Human Settlements” is the departure point for framing the key challenges,and for formulating the strategic approach, the programs, and the project priorities. Themunicipality’s Housing Vision and Housing Mission of 1998, confirmed in 2006, and furtherdeveloped in the 2012 Housing Sector Plan embraces the concept of sustainable humansettlements.
The Housing Vision visualises “the creation of sustainable human settlements in eThekwiniMunicipality with a view to ensuring that … all residents will have access to a housing opportunitywhich includes secure tenure, basic services and support in achieving incremental housingimprovement in living environments with requisite social, economic and physical infrastructure”. [21]
The Housing Mission [22] operationalises the vision statement.
Major obstacles to developing sustainable human settlements are the spatial fragmentation andlow-density. Improved locations of housing, and where there is no choice as to location, thenimproved accessibility, especially of low-income housing, is a major goal of the Housing SpatialPlan.
Housing Program Groups
The municipality has numerous housing programs, some of which overlap. The programs aregrouped below in two main groups. The housing programs of eThekwini Municipality can bedistinguished between those that are:
• Ownership - or in case of rural, permissions to occupy• Rental accommodation. This includes rental accommodation over the long-term and rental
accommodation being transferred to the residents.
21 Integrated Housing Development Plan. Ethekwini Municipality, 200622 A Strategic Housing Framework for The Durban Metropolitan Area. Draft. Ethekwini Housing, 1998
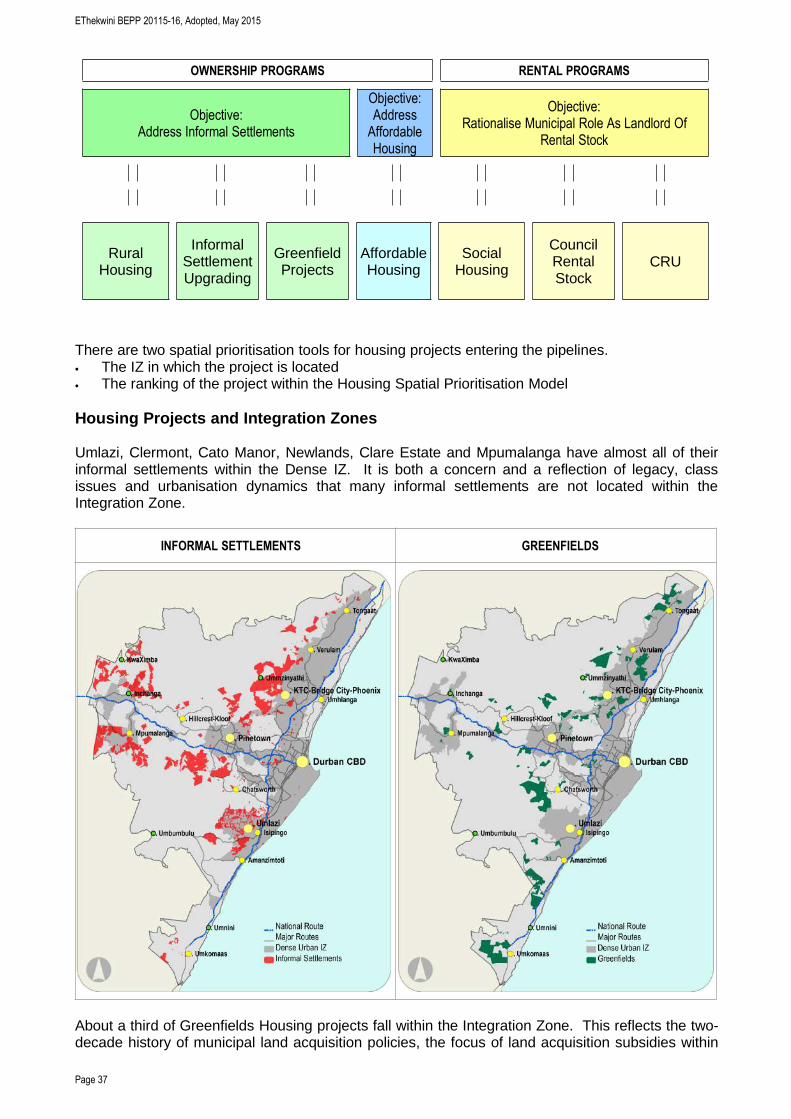
EThekwini BEPP 20115-16, Adopted, May 2015
Page 37
OWNERSHIP PROGRAMS RENTAL PROGRAMS
Objective:Address Informal Settlements
Objective:AddressAffordableHousing
Objective:Rationalise Municipal Role As Landlord Of
Rental Stock
There are two spatial prioritisation tools for housing projects entering the pipelines.• The IZ in which the project is located• The ranking of the project within the Housing Spatial Prioritisation Model
Housing Projects and Integration Zones
Umlazi, Clermont, Cato Manor, Newlands, Clare Estate and Mpumalanga have almost all of theirinformal settlements within the Dense IZ. It is both a concern and a reflection of legacy, classissues and urbanisation dynamics that many informal settlements are not located within theIntegration Zone.
INFORMAL SETTLEMENTS GREENFIELDS
About a third of Greenfields Housing projects fall within the Integration Zone. This reflects the two-decade history of municipal land acquisition policies, the focus of land acquisition subsidies within
RuralHousing
InformalSettlementUpgrading
GreenfieldProjects
AffordableHousing
SocialHousing
CouncilRentalStock
CRU
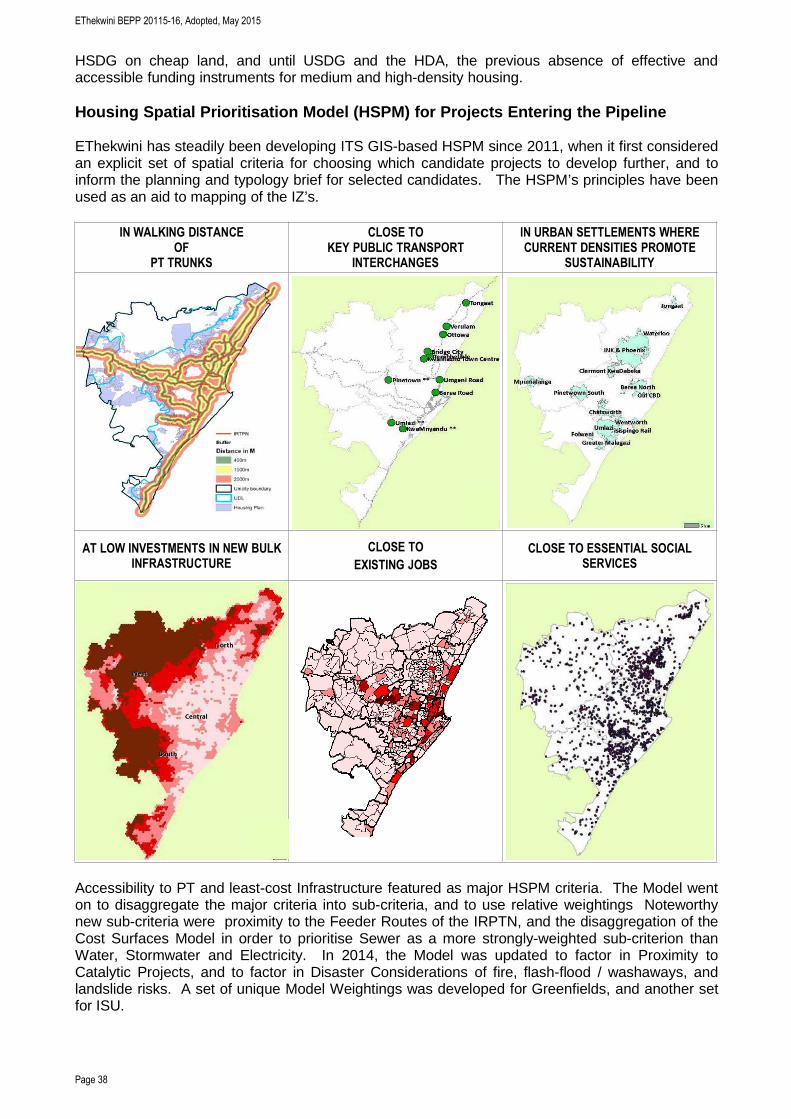
EThekwini BEPP 20115-16, Adopted, May 2015
Page 38
HSDG on cheap land, and until USDG and the HDA, the previous absence of effective andaccessible funding instruments for medium and high-density housing.
Housing Spatial Prioritisation Model (HSPM) for Projects Entering the Pipeline
EThekwini has steadily been developing ITS GIS-based HSPM since 2011, when it first consideredan explicit set of spatial criteria for choosing which candidate projects to develop further, and toinform the planning and typology brief for selected candidates. The HSPM’s principles have beenused as an aid to mapping of the IZ’s.
IN WALKING DISTANCEOF
PT TRUNKS
CLOSE TOKEY PUBLIC TRANSPORT
INTERCHANGES
IN URBAN SETTLEMENTS WHERECURRENT DENSITIES PROMOTE
SUSTAINABILITY
AT LOW INVESTMENTS IN NEW BULKINFRASTRUCTURE
CLOSE TO
EXISTING JOBS
CLOSE TO ESSENTIAL SOCIALSERVICES
Accessibility to PT and least-cost Infrastructure featured as major HSPM criteria. The Model wenton to disaggregate the major criteria into sub-criteria, and to use relative weightings Noteworthynew sub-criteria were proximity to the Feeder Routes of the IRPTN, and the disaggregation of theCost Surfaces Model in order to prioritise Sewer as a more strongly-weighted sub-criterion thanWater, Stormwater and Electricity. In 2014, the Model was updated to factor in Proximity toCatalytic Projects, and to factor in Disaster Considerations of fire, flash-flood / washaways, andlandslide risks. A set of unique Model Weightings was developed for Greenfields, and another setfor ISU.
EThekwini BEPP 20115-16, Adopted, May 2015
Page 39
Densification
The main strategy to support denser housing projects in better locations is to change the types oftop-structures and service levels of roads. eThekwini uses its “Housing Typologies Study” as abenchmark. It set design and cost standards for housing typologies that could be unfunded usingthe available subsidies. The key findings were that a pedestrianisd development of double storyduplex typologies was the most cost- effective to achieve higher densities. They also promotesimple property management by individual owners or by landlords. This typology can yield 60 to100 dwellings per Ha net.
Social Facilities
The Review described backlogs in Social Facilities. About R 3.4 Bn would be required to extendexisting facilities or build new ones to optimally respond to the under-provision, of which roughlyhalf would be for eThekwini’s account. Additional funds will be needed for equipment, staffing, andother operating costs, and in numerous cases, for land acquisition.
In response, there is a need to decide:
• A commonly held IGR plan and budget• Funding mandates where there appear to be overlapping mandates or unfunded mandates.• Different space standards for different spaces (e.g. standards for schools in the Dense Urban
IZ should differ from other IZ’s)• Planning thresholds for Essential Services• Reduced space standards and-or planning thresholds for Desirable Services, particularly basic
recreation.• Clustering standards (e.g. multi-use buildings, or site-sharing)• Alternative methods to provide social services (e.g. greater multi-use of existing facilities,
clustering of facilities, greater use of cellphones for citizen contact• Increased opening hours, increased opening days, equipment improvements, and process
improvements at existing facilities• Relative investment priorities of the different types of facilities• Land acquisition needs and land acquisition processes.
The Municipality is in the process of establishing a Social Development Strategy [23]. It’s maincomponents are:
• Social Policing to address both preventative and reactive policing• Social Health aimed at marginalised and vulnerable groups and to complement Community
Health• Socio-Economic Development aimed at self-reliance through sustainable livelohoods• Contribute to Sustainable Human Settlements through the provision of social services• Social Cohesion through Arts, Sports, Culture and Heritage programmes.
From a spatial perspective, these strategies are to be supported by a Social Development Infra-Structure Masterplan or Implementation Plan. The Masterplan will also have non-spatial aspects.
The intended outcomes of the Plan require coordinated and collective planning, budgeting andoperating responses from all spheres. A process has already been facilitated by National Treasuryto improve IGR between eThekwini and KZN. The initial IGR is likely to focus on Health andEducation facilities.
Progress includes:
• Design of Education, Health, Sports, Libraries, Halls to form Local Social Hubs in Cornubia• Agreement with KZNDoE on the new clustering standards of primary and secondary schools,
on clustering of the schools with the other social facilities, on revised space standards for
23 Social Development Strategy 2014 – 2020. Draft. EMA, Sep 2014
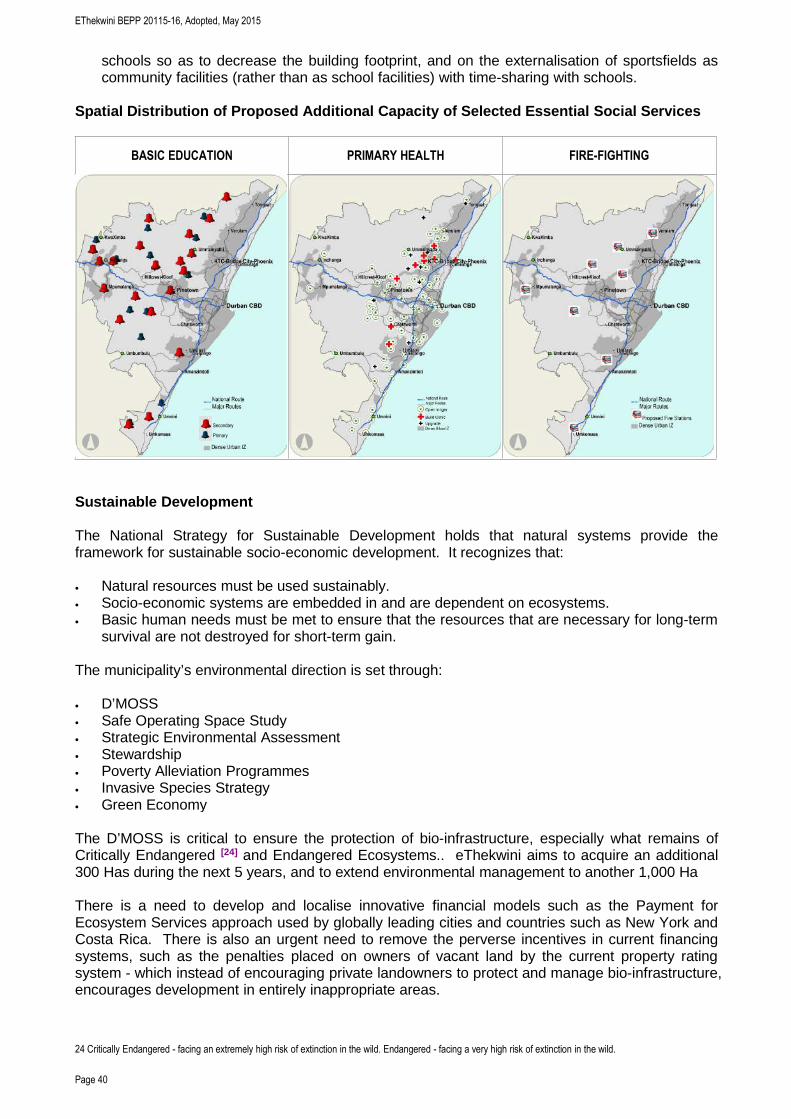
EThekwini BEPP 20115-16, Adopted, May 2015
Page 40
schools so as to decrease the building footprint, and on the externalisation of sportsfields ascommunity facilities (rather than as school facilities) with time-sharing with schools.
Spatial Distribution of Proposed Additional Capacity of Selected Essential Social Services
BASIC EDUCATION PRIMARY HEALTH FIRE-FIGHTING
Sustainable Development
The National Strategy for Sustainable Development holds that natural systems provide theframework for sustainable socio-economic development. It recognizes that:
• Natural resources must be used sustainably.• Socio-economic systems are embedded in and are dependent on ecosystems.• Basic human needs must be met to ensure that the resources that are necessary for long-term
survival are not destroyed for short-term gain.
The municipality’s environmental direction is set through:
• D’MOSS• Safe Operating Space Study• Strategic Environmental Assessment• Stewardship• Poverty Alleviation Programmes• Invasive Species Strategy• Green Economy
The D’MOSS is critical to ensure the protection of bio-infrastructure, especially what remains ofCritically Endangered [24] and Endangered Ecosystems.. eThekwini aims to acquire an additional300 Has during the next 5 years, and to extend environmental management to another 1,000 Ha
There is a need to develop and localise innovative financial models such as the Payment forEcosystem Services approach used by globally leading cities and countries such as New York andCosta Rica. There is also an urgent need to remove the perverse incentives in current financingsystems, such as the penalties placed on owners of vacant land by the current property ratingsystem - which instead of encouraging private landowners to protect and manage bio-infrastructure,encourages development in entirely inappropriate areas.
24 Critically Endangered - facing an extremely high risk of extinction in the wild. Endangered - facing a very high risk of extinction in the wild.
Secondary
Primary
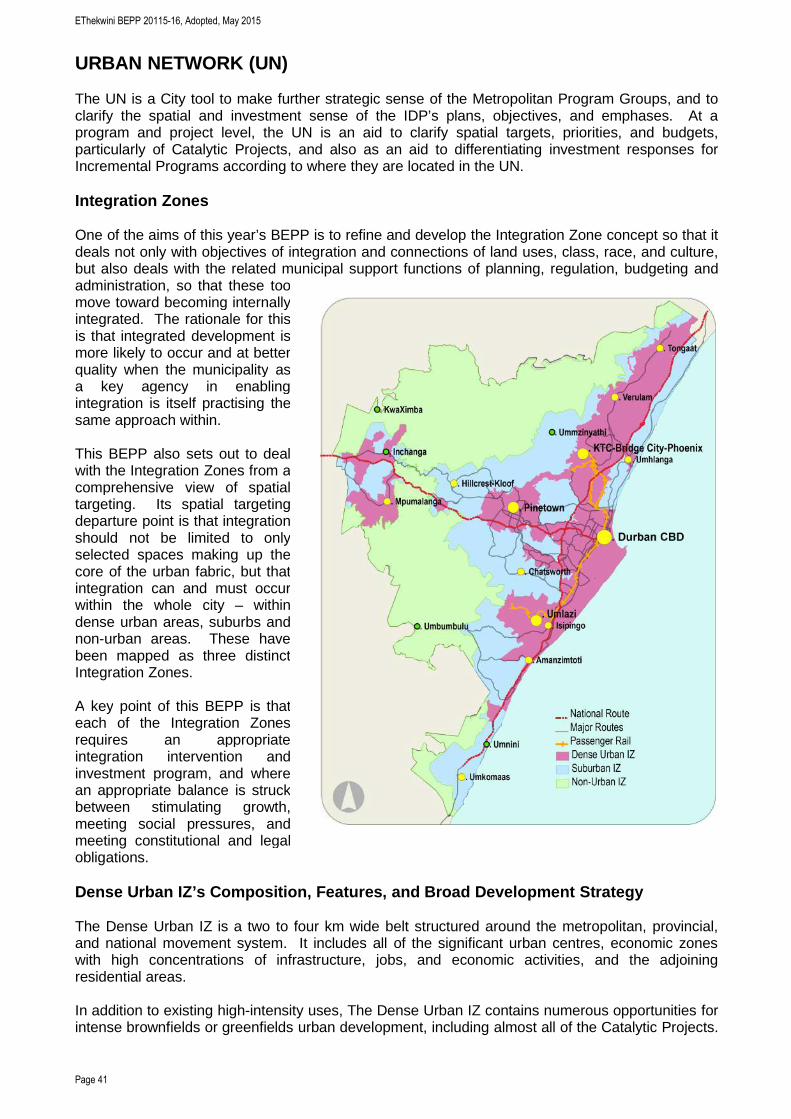
EThekwini BEPP 20115-16, Adopted, May 2015
Page 41
URBAN NETWORK (UN)
The UN is a City tool to make further strategic sense of the Metropolitan Program Groups, and toclarify the spatial and investment sense of the IDP’s plans, objectives, and emphases. At aprogram and project level, the UN is an aid to clarify spatial targets, priorities, and budgets,particularly of Catalytic Projects, and also as an aid to differentiating investment responses forIncremental Programs according to where they are located in the UN.
Integration Zones
One of the aims of this year’s BEPP is to refine and develop the Integration Zone concept so that itdeals not only with objectives of integration and connections of land uses, class, race, and culture,but also deals with the related municipal support functions of planning, regulation, budgeting andadministration, so that these toomove toward becoming internallyintegrated. The rationale for thisis that integrated development ismore likely to occur and at betterquality when the municipality asa key agency in enablingintegration is itself practising thesame approach within.
This BEPP also sets out to dealwith the Integration Zones from acomprehensive view of spatialtargeting. Its spatial targetingdeparture point is that integrationshould not be limited to onlyselected spaces making up thecore of the urban fabric, but thatintegration can and must occurwithin the whole city – withindense urban areas, suburbs andnon-urban areas. These havebeen mapped as three distinctIntegration Zones.
A key point of this BEPP is thateach of the Integration Zonesrequires an appropriateintegration intervention andinvestment program, and wherean appropriate balance is struckbetween stimulating growth,meeting social pressures, andmeeting constitutional and legalobligations.
Dense Urban IZ’s Composition, Features, and Broad Development Strategy
The Dense Urban IZ is a two to four km wide belt structured around the metropolitan, provincial,and national movement system. It includes all of the significant urban centres, economic zoneswith high concentrations of infrastructure, jobs, and economic activities, and the adjoiningresidential areas.
In addition to existing high-intensity uses, The Dense Urban IZ contains numerous opportunities forintense brownfields or greenfields urban development, including almost all of the Catalytic Projects.
EThekwini BEPP 20115-16, Adopted, May 2015
Page 42
This IZ also contains 90% of jobs (i.e. almost all), and 48% of the residences (i.e. roughly half).This IZ occupies about a quarter of the municipal extents.
The broad development strategy is to:
• Install core infrastructure and establish institutional arrangements and funding models to drivethe City’s own Catalytic Projects and to enable the Catalytic Projects led by others
• Commission the first phase of the IRPTN and improve regional routes• Maximise residential densities, and promote higher levels of LED to support the new densities• Fully upgrade informal settlements• Maintain existing infrastructure and buildings• Find opportunities to expand, intensify or redevelop properties for economic uses and high
density residential.
Suburban IZ’s Composition, Features, and Broad Development Strategy
The Suburban IZ is a one to two km wide low-density residential belt beyond the Dense UrbanZone. It is home to 1.6 million people (about 43% of the population), on a third of the municipalextents. Commuting to work and higher order social facilities is the norm. There tends to be areasonable level of local engineering services. This IZ comprises are townships and informalsettlements which came about through apartheid planning which rely on public transport, andwhich tend to suffer from backlogs or inefficiencies in local social facilities. This IZ also comprisesformer Indian and white suburbs that rely on private transport.
The broad development strategy is to:
•••• Improve the connectivity of the suburbs to the Dense Urban Zone.• Improve the quality and effectiveness of existing facilities and in some cases to build new ones.• Promote higher densities through typologies that are appropriate for residential suburbs• Promote LED• Quickly provide informal settlements with universal access to basic services alongside the
slower upgrading program.
Non-Urban IZ’s Composition, Features, and Broad Development Strategy
The Non-Urban Zone comprises low-density traditional areas, as well as densifying traditionalareas, commercial farming and other open space and which in the past used to be isolated fromthe other parts of the city. Typically there are very basic services only, and poor or expensiveconnectivity to the city is a constant feature. The Non-Urban IZ supports traditional lifestyles,agriculture and nature conservation, and is home to 8% of the population (one in every twelvepersons) 313 000 people in total, and about 43% (or nearly half) of the municipal extents.
The broad development strategy is to:
• Improve local social facilities and access to basic households engineering services (water,electricity, sanitation) according to the applicable non-urban standards
• Provide higher order social facilities and economic opportunities in selected nodes• Improve connectivity (roads and internet)•••• Encourage sustainable livelihoods and access to agri-processing and distribution.
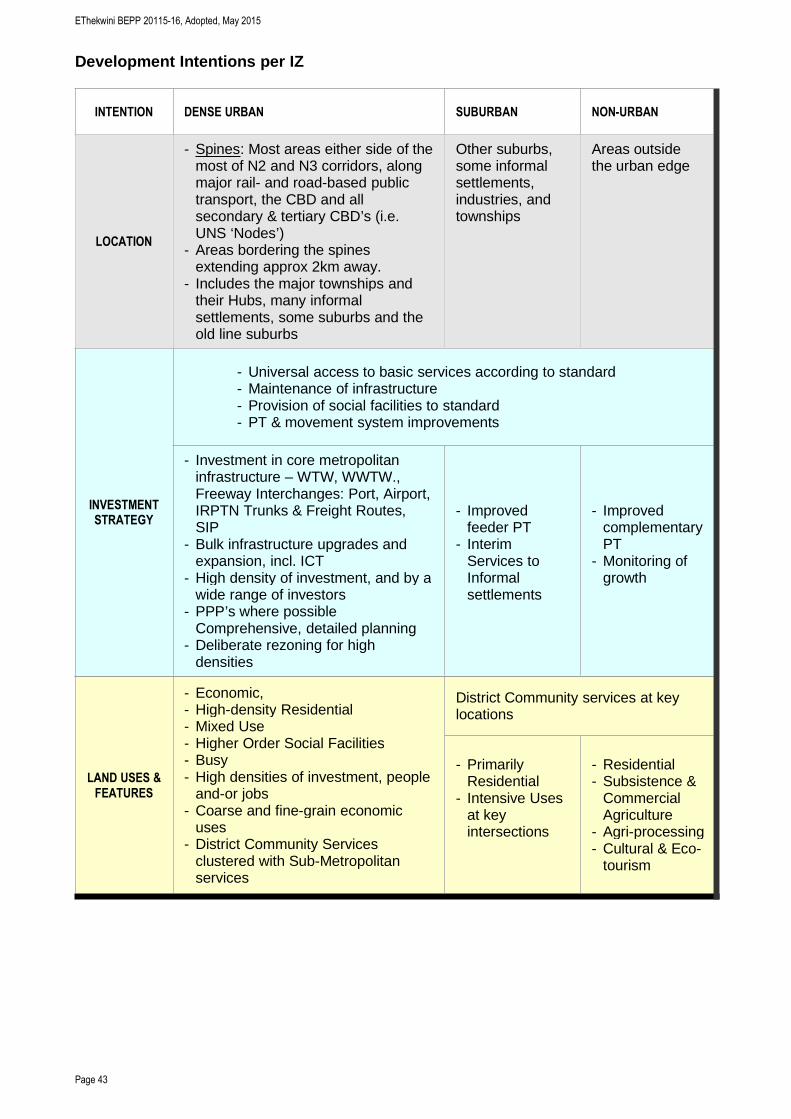
EThekwini BEPP 20115-16, Adopted, May 2015
Page 43
Development Intentions per IZ
INTENTION DENSE URBAN SUBURBAN NON-URBAN
LOCATION
- Spines: Most areas either side of themost of N2 and N3 corridors, alongmajor rail- and road-based publictransport, the CBD and allsecondary & tertiary CBD’s (i.e.UNS ‘Nodes’)
- Areas bordering the spinesextending approx 2km away.
- Includes the major townships andtheir Hubs, many informalsettlements, some suburbs and theold line suburbs
Other suburbs,some informalsettlements,industries, andtownships
Areas outsidethe urban edge
INVESTMENTSTRATEGY
- Universal access to basic services according to standard- Maintenance of infrastructure- Provision of social facilities to standard- PT & movement system improvements
- Investment in core metropolitaninfrastructure – WTW, WWTW.,Freeway Interchanges: Port, Airport,IRPTN Trunks & Freight Routes,SIP
- Bulk infrastructure upgrades andexpansion, incl. ICT
- High density of investment, and by awide range of investors
- PPP’s where possibleComprehensive, detailed planning
- Deliberate rezoning for highdensities
- Improvedfeeder PT
- InterimServices toInformalsettlements
- ImprovedcomplementaryPT
- Monitoring ofgrowth
LAND USES &FEATURES
- Economic,- High-density Residential- Mixed Use- Higher Order Social Facilities- Busy- High densities of investment, people
and-or jobs- Coarse and fine-grain economic
uses- District Community Services
clustered with Sub-Metropolitanservices
District Community services at keylocations
- PrimarilyResidential
- Intensive Usesat keyintersections
- Residential- Subsistence &
CommercialAgriculture
- Agri-processing- Cultural & Eco-
tourism
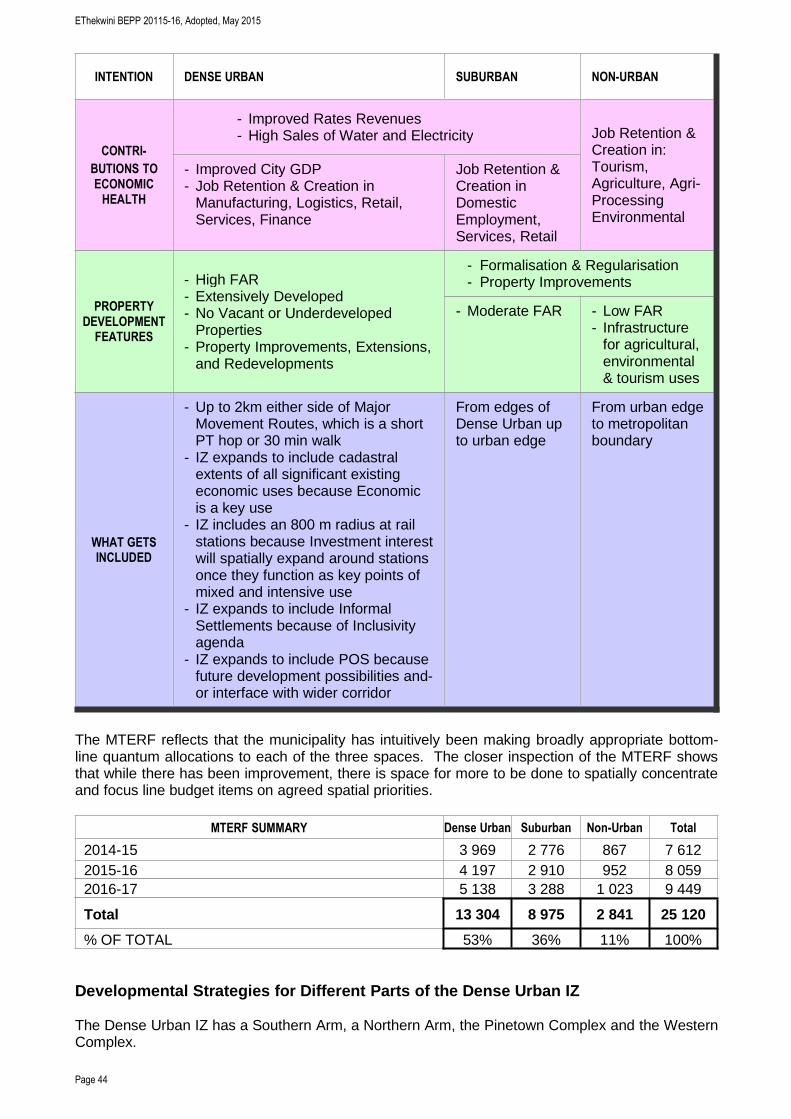
EThekwini BEPP 20115-16, Adopted, May 2015
Page 44
INTENTION DENSE URBAN SUBURBAN NON-URBAN
CONTRI-
BUTIONS TOECONOMICHEALTH
- Improved Rates Revenues- High Sales of Water and Electricity Job Retention &
Creation in:Tourism,Agriculture, Agri-ProcessingEnvironmental
- Improved City GDP- Job Retention & Creation in
Manufacturing, Logistics, Retail,Services, Finance
Job Retention &Creation inDomesticEmployment,Services, Retail
PROPERTYDEVELOPMENTFEATURES
- High FAR- Extensively Developed- No Vacant or Underdeveloped
Properties- Property Improvements, Extensions,
and Redevelopments
- Formalisation & Regularisation- Property Improvements
- Moderate FAR - Low FAR- Infrastructure
for agricultural,environmental& tourism uses
WHAT GETSINCLUDED
- Up to 2km either side of MajorMovement Routes, which is a shortPT hop or 30 min walk
- IZ expands to include cadastralextents of all significant existingeconomic uses because Economicis a key use
- IZ includes an 800 m radius at railstations because Investment interestwill spatially expand around stationsonce they function as key points ofmixed and intensive use
- IZ expands to include InformalSettlements because of Inclusivityagenda
- IZ expands to include POS becausefuture development possibilities and-or interface with wider corridor
From edges ofDense Urban upto urban edge
From urban edgeto metropolitanboundary
The MTERF reflects that the municipality has intuitively been making broadly appropriate bottom-line quantum allocations to each of the three spaces. The closer inspection of the MTERF showsthat while there has been improvement, there is space for more to be done to spatially concentrateand focus line budget items on agreed spatial priorities.
MTERF SUMMARY Dense Urban Suburban Non-Urban Total
2014-15 3 969 2 776 867 7 6122015-16 4 197 2 910 952 8 0592016-17 5 138 3 288 1 023 9 449
Total 13 304 8 975 2 841 25 120
% OF TOTAL 53% 36% 11% 100%
Developmental Strategies for Different Parts of the Dense Urban IZ
The Dense Urban IZ has a Southern Arm, a Northern Arm, the Pinetown Complex and the WesternComplex.
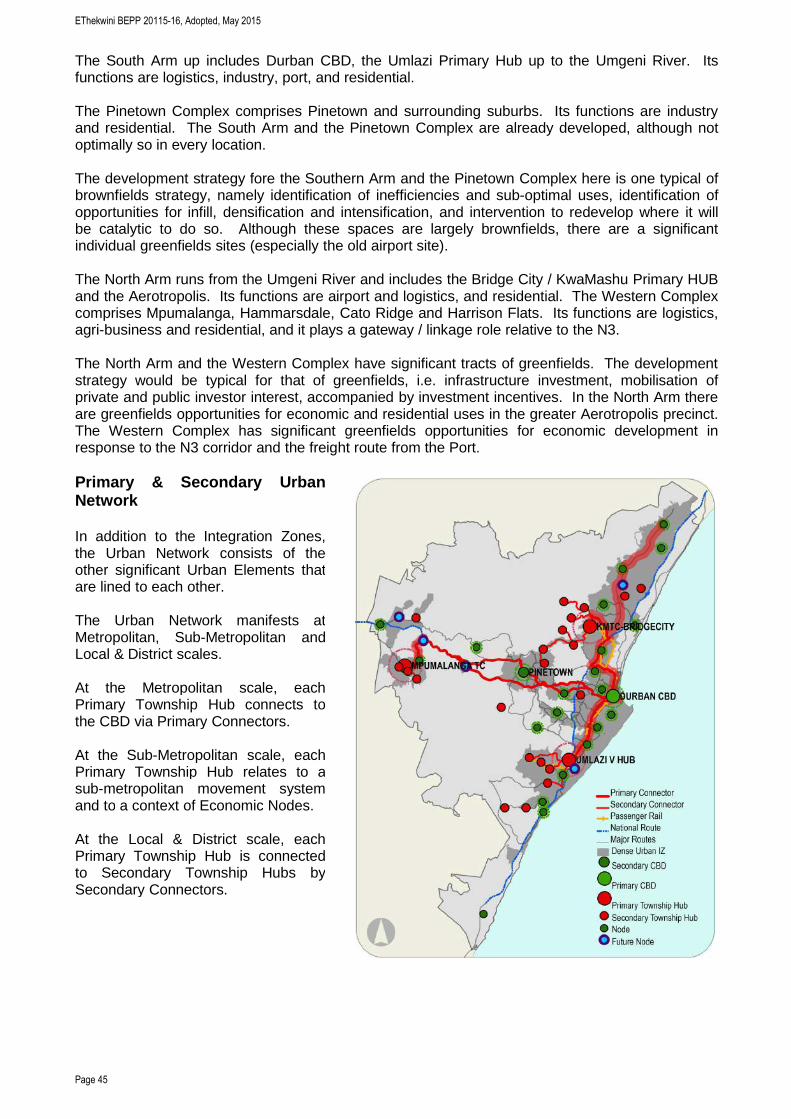
EThekwini BEPP 20115-16, Adopted, May 2015
Page 45
The South Arm up includes Durban CBD, the Umlazi Primary Hub up to the Umgeni River. Itsfunctions are logistics, industry, port, and residential.
The Pinetown Complex comprises Pinetown and surrounding suburbs. Its functions are industryand residential. The South Arm and the Pinetown Complex are already developed, although notoptimally so in every location.
The development strategy fore the Southern Arm and the Pinetown Complex here is one typical ofbrownfields strategy, namely identification of inefficiencies and sub-optimal uses, identification ofopportunities for infill, densification and intensification, and intervention to redevelop where it willbe catalytic to do so. Although these spaces are largely brownfields, there are a significantindividual greenfields sites (especially the old airport site).
The North Arm runs from the Umgeni River and includes the Bridge City / KwaMashu Primary HUBand the Aerotropolis. Its functions are airport and logistics, and residential. The Western Complexcomprises Mpumalanga, Hammarsdale, Cato Ridge and Harrison Flats. Its functions are logistics,agri-business and residential, and it plays a gateway / linkage role relative to the N3.
The North Arm and the Western Complex have significant tracts of greenfields. The developmentstrategy would be typical for that of greenfields, i.e. infrastructure investment, mobilisation ofprivate and public investor interest, accompanied by investment incentives. In the North Arm thereare greenfields opportunities for economic and residential uses in the greater Aerotropolis precinct.The Western Complex has significant greenfields opportunities for economic development inresponse to the N3 corridor and the freight route from the Port.
Primary & Secondary UrbanNetwork
In addition to the Integration Zones,the Urban Network consists of theother significant Urban Elements thatare lined to each other.
The Urban Network manifests atMetropolitan, Sub-Metropolitan andLocal & District scales.
At the Metropolitan scale, eachPrimary Township Hub connects tothe CBD via Primary Connectors.
At the Sub-Metropolitan scale, eachPrimary Township Hub relates to asub-metropolitan movement systemand to a context of Economic Nodes.
At the Local & District scale, eachPrimary Township Hub is connectedto Secondary Township Hubs bySecondary Connectors.
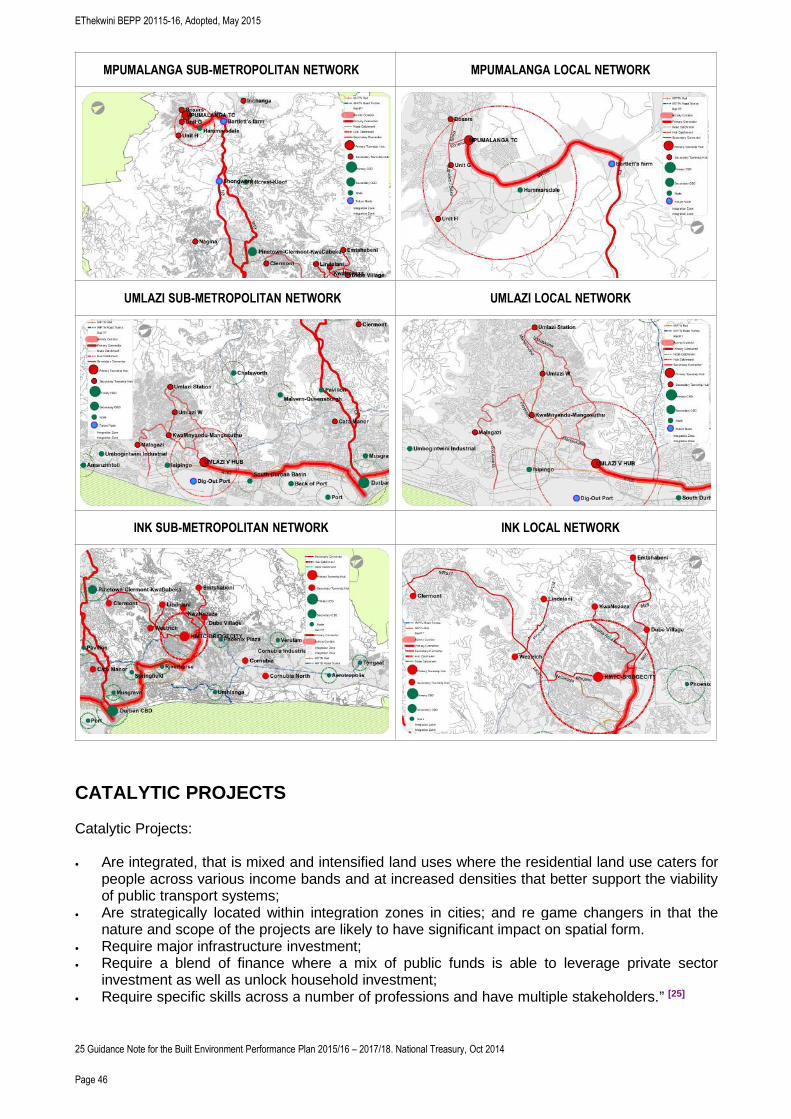
EThekwini BEPP 20115-16, Adopted, May 2015
Page 46
MPUMALANGA SUB-METROPOLITAN NETWORK MPUMALANGA LOCAL NETWORK
UMLAZI SUB-METROPOLITAN NETWORK UMLAZI LOCAL NETWORK
INK SUB-METROPOLITAN NETWORK INK LOCAL NETWORK
CATALYTIC PROJECTS
Catalytic Projects:
• Are integrated, that is mixed and intensified land uses where the residential land use caters forpeople across various income bands and at increased densities that better support the viabilityof public transport systems;
• Are strategically located within integration zones in cities; and re game changers in that thenature and scope of the projects are likely to have significant impact on spatial form.
• Require major infrastructure investment;• Require a blend of finance where a mix of public funds is able to leverage private sector
investment as well as unlock household investment;• Require specific skills across a number of professions and have multiple stakeholders.” [25]
25 Guidance Note for the Built Environment Performance Plan 2015/16 – 2017/18. National Treasury, Oct 2014
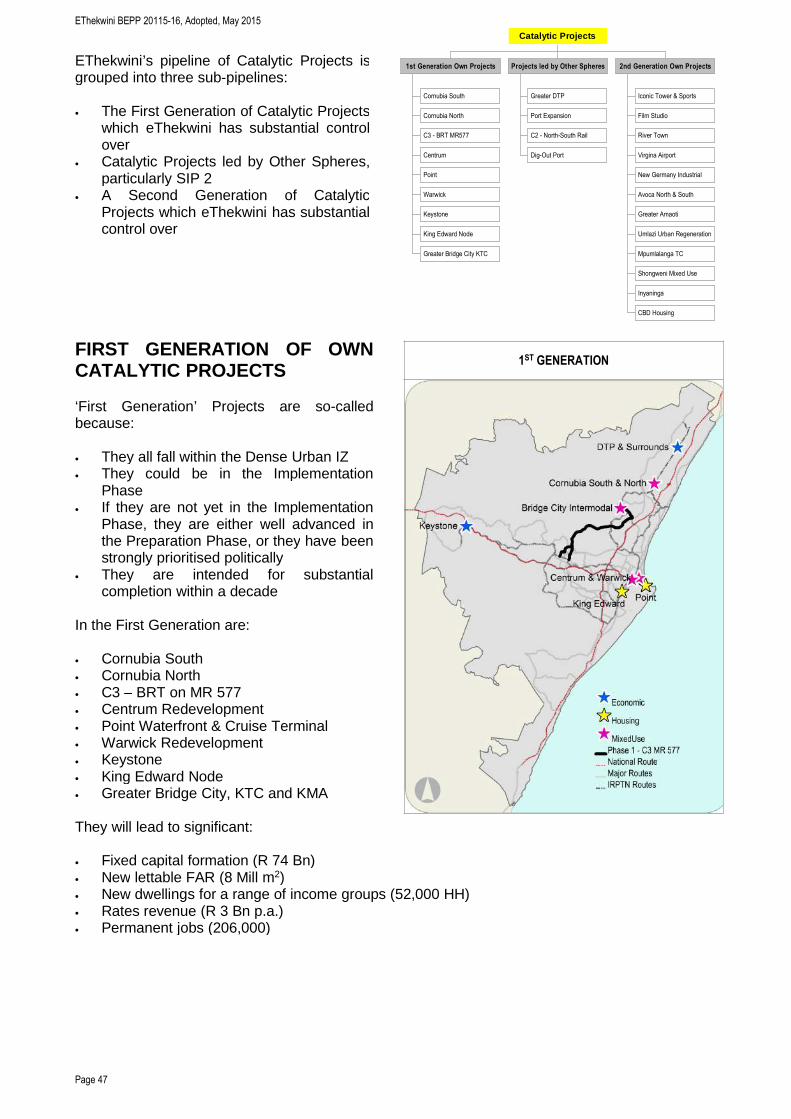
EThekwini BEPP 20115-16, Adopted, May 2015
Page 47
Cornubia South
Cornubia North
C3 - BRT MR577
Centrum
Point
Warwick
Keystone
King Edward Node
Greater Bridge City KTC
1st Generation Own Projects
Greater DTP
Port Expansion
C2 - North-South Rail
Dig-Out Port
Projects led by Other Spheres
Iconic Tower & Sports
Film Studio
River Town
Virgina Airport
New Germany Industrial
Avoca North & South
Greater Amaoti
Umlazi Urban Regeneration
Mpumlalanga TC
Shongweni Mixed Use
Inyaninga
CBD Housing
2nd Generation Own Projects
Catalytic Projects
EThekwini’s pipeline of Catalytic Projects isgrouped into three sub-pipelines:
• The First Generation of Catalytic Projectswhich eThekwini has substantial controlover
• Catalytic Projects led by Other Spheres,particularly SIP 2
• A Second Generation of CatalyticProjects which eThekwini has substantialcontrol over
FIRST GENERATION OF OWNCATALYTIC PROJECTS
‘First Generation’ Projects are so-calledbecause:
• They all fall within the Dense Urban IZ• They could be in the Implementation
Phase• If they are not yet in the Implementation
Phase, they are either well advanced inthe Preparation Phase, or they have beenstrongly prioritised politically
• They are intended for substantialcompletion within a decade
In the First Generation are:
• Cornubia South• Cornubia North• C3 – BRT on MR 577• Centrum Redevelopment• Point Waterfront & Cruise Terminal• Warwick Redevelopment• Keystone• King Edward Node• Greater Bridge City, KTC and KMA
They will lead to significant:
• Fixed capital formation (R 74 Bn)• New lettable FAR (8 Mill m2)• New dwellings for a range of income groups (52,000 HH)• Rates revenue (R 3 Bn p.a.)• Permanent jobs (206,000)
1ST GENERATION
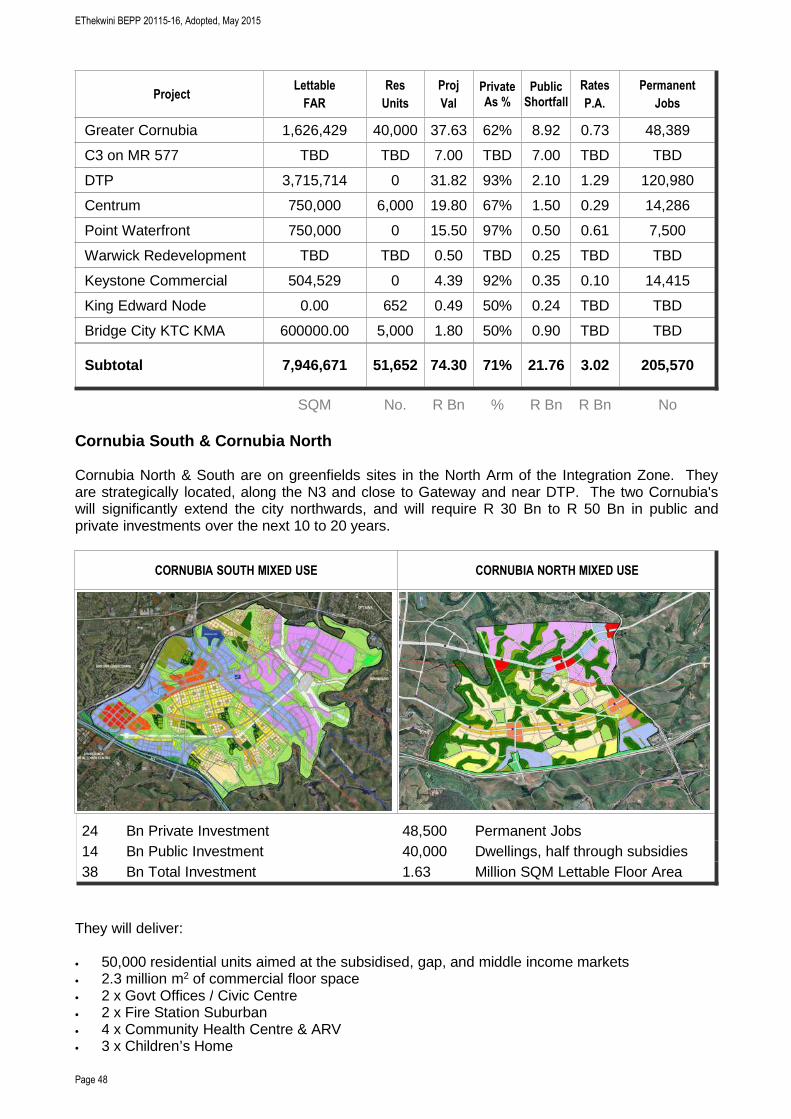
EThekwini BEPP 20115-16, Adopted, May 2015
Page 48
ProjectLettable
FAR
Res
Units
Proj
Val
PrivateAs %
PublicShortfall
Rates
P.A.
Permanent
Jobs
Greater Cornubia 1,626,429 40,000 37.63 62% 8.92 0.73 48,389
C3 on MR 577 TBD TBD 7.00 TBD 7.00 TBD TBD
DTP 3,715,714 0 31.82 93% 2.10 1.29 120,980
Centrum 750,000 6,000 19.80 67% 1.50 0.29 14,286
Point Waterfront 750,000 0 15.50 97% 0.50 0.61 7,500
Warwick Redevelopment TBD TBD 0.50 TBD 0.25 TBD TBD
Keystone Commercial 504,529 0 4.39 92% 0.35 0.10 14,415
King Edward Node 0.00 652 0.49 50% 0.24 TBD TBD
Bridge City KTC KMA 600000.00 5,000 1.80 50% 0.90 TBD TBD
Subtotal 7,946,671 51,652 74.30 71% 21.76 3.02 205,570
SQM No. R Bn % R Bn R Bn No
Cornubia South & Cornubia North
Cornubia North & South are on greenfields sites in the North Arm of the Integration Zone. Theyare strategically located, along the N3 and close to Gateway and near DTP. The two Cornubia'swill significantly extend the city northwards, and will require R 30 Bn to R 50 Bn in public andprivate investments over the next 10 to 20 years.
CORNUBIA SOUTH MIXED USE CORNUBIA NORTH MIXED USE
24 Bn Private Investment 48,500 Permanent Jobs14 Bn Public Investment 40,000 Dwellings, half through subsidies38 Bn Total Investment 1.63 Million SQM Lettable Floor Area
They will deliver:
• 50,000 residential units aimed at the subsidised, gap, and middle income markets• 2.3 million m2 of commercial floor space• 2 x Govt Offices / Civic Centre• 2 x Fire Station Suburban• 4 x Community Health Centre & ARV• 3 x Children’s Home
EThekwini BEPP 20115-16, Adopted, May 2015
Page 49
• 3 x Police Station• 2 x Swimming Pool• 3 x Old age Home• 5 x Local Library• 7 x Primary Health Clinic• 6 x Community Centre• 15 x Secondary School• 30 x Primary School• 18 clusters x Sports Fields & Park Space
There is a formal development co-operation agreement between the municipality and the TongaatHullett Developments (THD). The planning costs are shared and there is engagement around costsharing of bulk infrastructure and the phasing of this infrastructure to enable low-income housingand industrial land to be developed at the same time.
THD, Sanral and eThekwini have been sharing movement network costs. For the N2-M41interchange where KZN DoT was a significant contributor. eThekwini’s traffic generation modelsindicate that the provincial contribution should be 40-50%, but agreement has not been reachedwith KZN DoT, who propose to contribute about 5%. This has contributed to some delays in thedevelopment of Cornubia South, and as well as placing strain on the co-operation agreementbetween eThekwini and THD.
Cornubia South will be fully developed over 20 years but the human settlement component is likelyto be complete in 7-10 years. Of its design yields of 25 700 units, about 11,500 will be low costunits and the balance will be gap housing of 7,000 units and 6,000 middle-income units. [26] Phase1A is complete and consists of approximately 480 low cost units, and in respect of the industrialland, rapid take-up has been experienced with almost all of the 80 hectares already sold.
Cornubia South has gone through the legislative submission process and an environmentalapproval is expected by mid 2014. Cornubia North is the land between Cornubia South and theDTP. A Framework Plan [27] has been formulated and is currently in the process of discussioninternally and with provincial departments.
RPTN Phase 1 – Corridor 3 (C3) on MR 577 from Bridge City to Pinetown
Most of employment opportunities are along the N2 and N3 including the CBD, Pinetown, theSouth Durban Basin, and the Northern Employment Cluster. There are 600,000 PT passengers inthe peak. High levels of ridership are key to public transport viability. The highest residentialsettlement concentrations are INK, Phoenix, Umlazi and Chatsworth.
EThekwini intends to have a “world-class transport system with a public transport focus, providinghigh levels of mobility and accessibility for the movement of people and goods in a safe,sustainable and affordable manner. The strategy focuses on reducing overall demand for roadspace whilst maximizing the effective utilization and efficient operation of road infrastructure forpurposes of private and public transport use. It also places an emphasis on strategies whichsupport and encourage use of public transport.” [28]
he IRPTN consists of North-South railbackbone from Bridge City to Isipingo and anumber of BRT routes. There will be 18transfer station ranks from rail to road.Currently, 50% of the population are within800m (10-15min walk) of a scheduled publictransport service. With the implementationof the IRPTN, this number is forecast to rise
26 Cornubia [South] Framework Presentation. Tongaat Hullett and eThekwini, Dec 201027 Cornubia North Framework Presentation. Tongaat Hullett and EThekwini, Nov 201328 Integrated Development Plan - 5 Year Plan: 2012-13 to 2016-17 – 2013-14 Annual Review. EMA, 2014
R 3.2 Bn RoadsR 2.6 Bn Depots, StockR 5.8 Bn Total Investment
Bridge City Intermodal - CompleteRoads - Underway
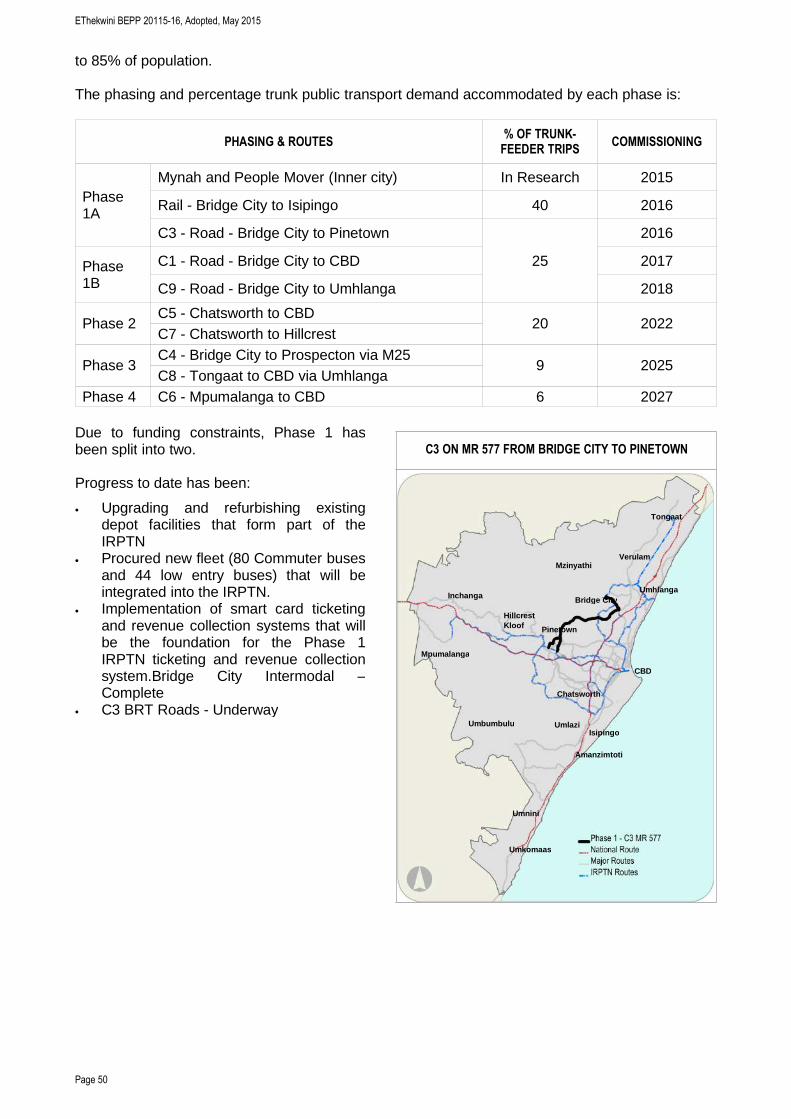
EThekwini BEPP 20115-16, Adopted, May 2015
Page 50
to 85% of population.
The phasing and percentage trunk public transport demand accommodated by each phase is:
PHASING & ROUTES% OF TRUNK-FEEDER TRIPS
COMMISSIONING
Phase1A
Mynah and People Mover (Inner city) In Research 2015
Rail - Bridge City to Isipingo 40 2016
C3 - Road - Bridge City to Pinetown
25
2016
Phase1B
C1 - Road - Bridge City to CBD 2017
C9 - Road - Bridge City to Umhlanga 2018
Phase 2C5 - Chatsworth to CBD
20 2022C7 - Chatsworth to Hillcrest
Phase 3C4 - Bridge City to Prospecton via M25
9 2025C8 - Tongaat to CBD via Umhlanga
Phase 4 C6 - Mpumalanga to CBD 6 2027
Due to funding constraints, Phase 1 hasbeen split into two.
Progress to date has been:
• Upgrading and refurbishing existingdepot facilities that form part of theIRPTN
• Procured new fleet (80 Commuter busesand 44 low entry buses) that will beintegrated into the IRPTN.
• Implementation of smart card ticketingand revenue collection systems that willbe the foundation for the Phase 1IRPTN ticketing and revenue collectionsystem.Bridge City Intermodal –Complete
• C3 BRT Roads - Underway
C3 ON MR 577 FROM BRIDGE CITY TO PINETOWN
Mpumalanga
Amanzimtoti
Umbumbulu
CBD
IsipingoUmlazi
Chatsworth
Umnini
Umkomaas
Inchanga
HillcrestKloof Pinetown
Bridge City
Verulam
Tongaat
Umhlanga
Mzinyathi
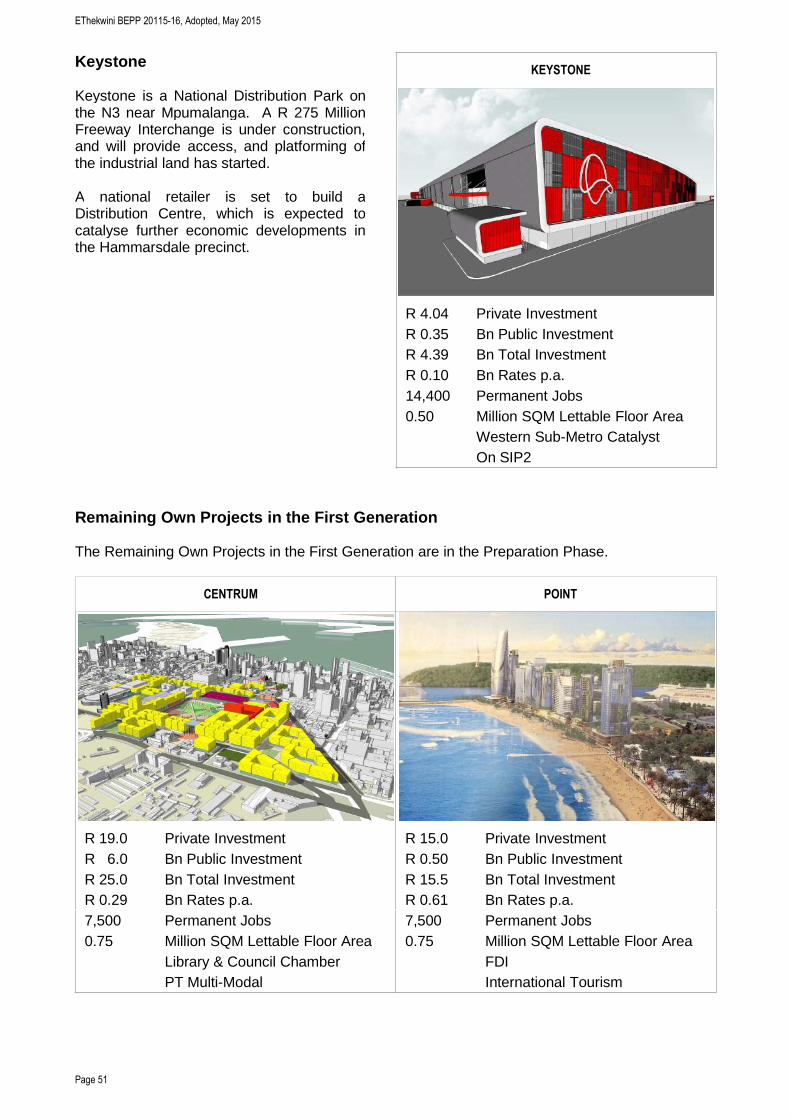
EThekwini BEPP 20115-16, Adopted, May 2015
Page 51
Keystone
Keystone is a National Distribution Park onthe N3 near Mpumalanga. A R 275 MillionFreeway Interchange is under construction,and will provide access, and platforming ofthe industrial land has started.
A national retailer is set to build aDistribution Centre, which is expected tocatalyse further economic developments inthe Hammarsdale precinct.
Remaining Own Projects in the First Generation
The Remaining Own Projects in the First Generation are in the Preparation Phase.
CENTRUM POINT
R 19.0 Private Investment R 15.0 Private InvestmentR 6.0 Bn Public Investment R 0.50 Bn Public InvestmentR 25.0 Bn Total Investment R 15.5 Bn Total InvestmentR 0.29 Bn Rates p.a. R 0.61 Bn Rates p.a.7,500 Permanent Jobs 7,500 Permanent Jobs0.75 Million SQM Lettable Floor Area 0.75 Million SQM Lettable Floor Area
Library & Council Chamber FDIPT Multi-Modal International Tourism
KEYSTONE
R 4.04 Private InvestmentR 0.35 Bn Public InvestmentR 4.39 Bn Total InvestmentR 0.10 Bn Rates p.a.14,400 Permanent Jobs0.50 Million SQM Lettable Floor Area
Western Sub-Metro CatalystOn SIP2
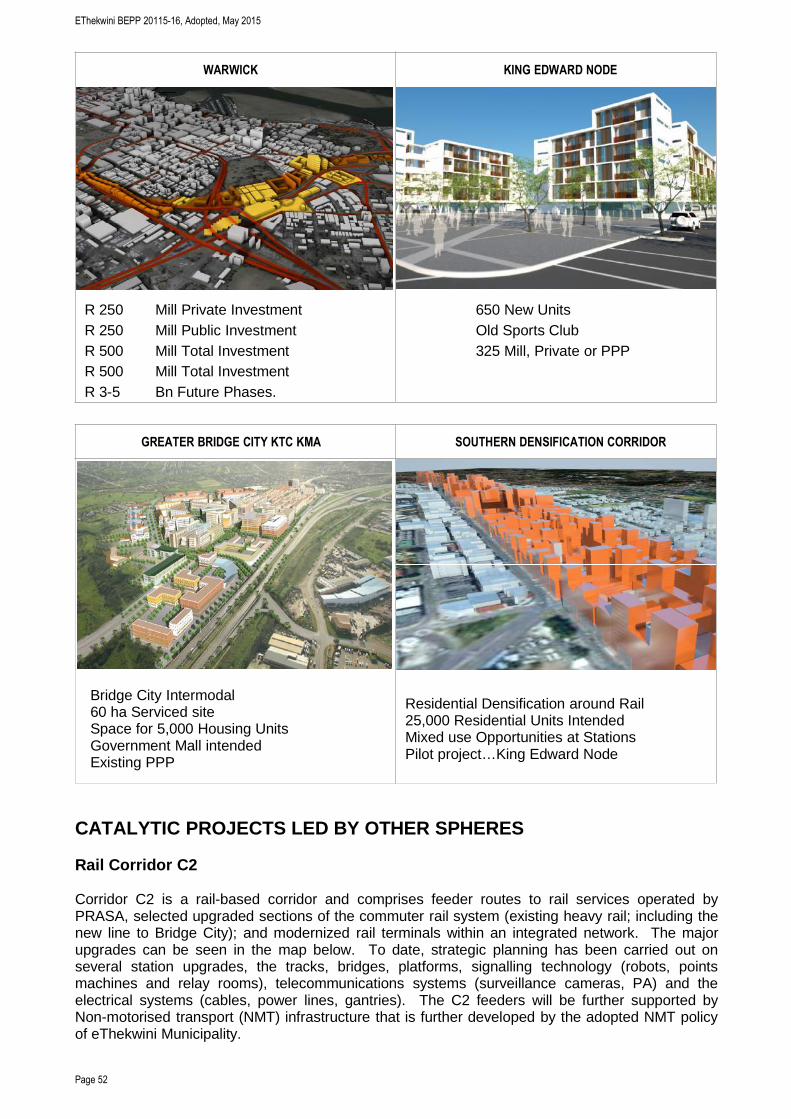
EThekwini BEPP 20115-16, Adopted, May 2015
Page 52
WARWICK KING EDWARD NODE
R 250 Mill Private Investment 650 New UnitsR 250 Mill Public Investment Old Sports ClubR 500 Mill Total Investment 325 Mill, Private or PPPR 500 Mill Total InvestmentR 3-5 Bn Future Phases.
GREATER BRIDGE CITY KTC KMA SOUTHERN DENSIFICATION CORRIDOR
Bridge City Intermodal60 ha Serviced siteSpace for 5,000 Housing UnitsGovernment Mall intendedExisting PPP
Residential Densification around Rail25,000 Residential Units IntendedMixed use Opportunities at StationsPilot project…King Edward Node
CATALYTIC PROJECTS LED BY OTHER SPHERES
Rail Corridor C2
Corridor C2 is a rail-based corridor and comprises feeder routes to rail services operated byPRASA, selected upgraded sections of the commuter rail system (existing heavy rail; including thenew line to Bridge City); and modernized rail terminals within an integrated network. The majorupgrades can be seen in the map below. To date, strategic planning has been carried out onseveral station upgrades, the tracks, bridges, platforms, signalling technology (robots, pointsmachines and relay rooms), telecommunications systems (surveillance cameras, PA) and theelectrical systems (cables, power lines, gantries). The C2 feeders will be further supported byNon-motorised transport (NMT) infrastructure that is further developed by the adopted NMT policyof eThekwini Municipality.
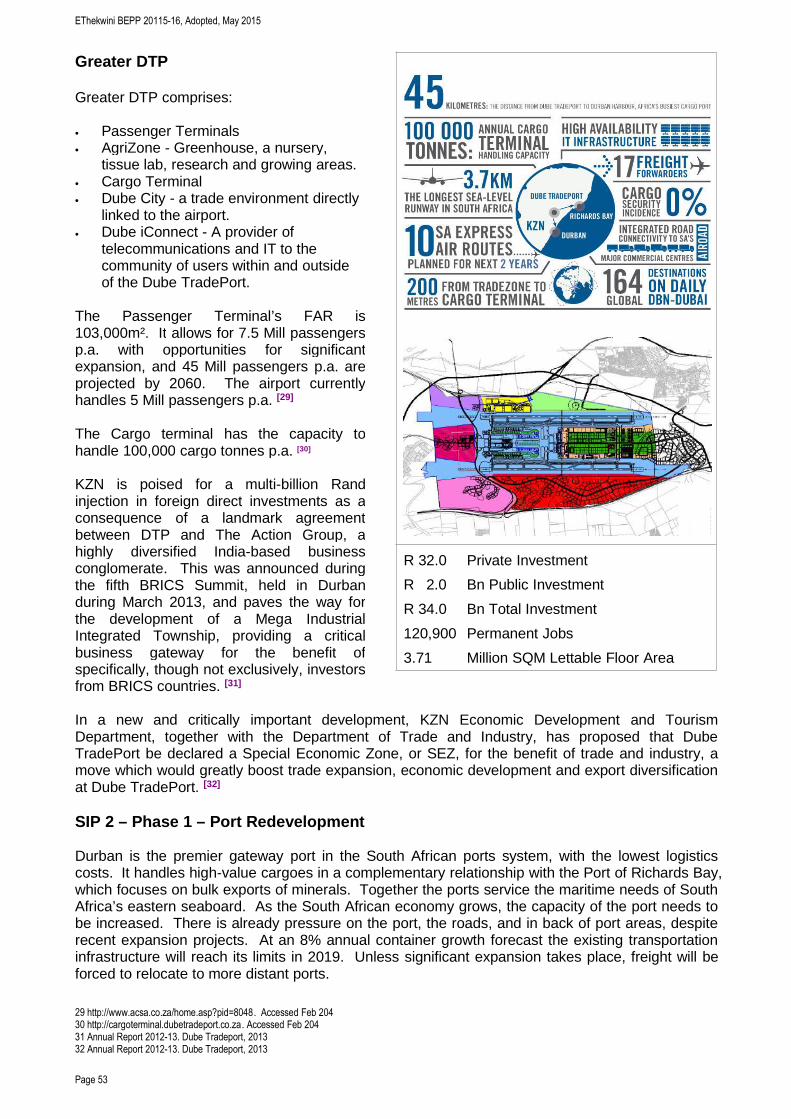
EThekwini BEPP 20115-16, Adopted, May 2015
Page 53
Greater DTP
Greater DTP comprises:
• Passenger Terminals• AgriZone - Greenhouse, a nursery,
tissue lab, research and growing areas.• Cargo Terminal• Dube City - a trade environment directly
linked to the airport.• Dube iConnect - A provider of
telecommunications and IT to thecommunity of users within and outsideof the Dube TradePort.
The Passenger Terminal’s FAR is103,000m². It allows for 7.5 Mill passengersp.a. with opportunities for significantexpansion, and 45 Mill passengers p.a. areprojected by 2060. The airport currentlyhandles 5 Mill passengers p.a. [29]
The Cargo terminal has the capacity tohandle 100,000 cargo tonnes p.a. [30]
KZN is poised for a multi-billion Randinjection in foreign direct investments as aconsequence of a landmark agreementbetween DTP and The Action Group, ahighly diversified India-based businessconglomerate. This was announced duringthe fifth BRICS Summit, held in Durbanduring March 2013, and paves the way forthe development of a Mega IndustrialIntegrated Township, providing a criticalbusiness gateway for the benefit ofspecifically, though not exclusively, investorsfrom BRICS countries. [31]
In a new and critically important development, KZN Economic Development and TourismDepartment, together with the Department of Trade and Industry, has proposed that DubeTradePort be declared a Special Economic Zone, or SEZ, for the benefit of trade and industry, amove which would greatly boost trade expansion, economic development and export diversificationat Dube TradePort. [32]
SIP 2 – Phase 1 – Port Redevelopment
Durban is the premier gateway port in the South African ports system, with the lowest logisticscosts. It handles high-value cargoes in a complementary relationship with the Port of Richards Bay,which focuses on bulk exports of minerals. Together the ports service the maritime needs of SouthAfrica’s eastern seaboard. As the South African economy grows, the capacity of the port needs tobe increased. There is already pressure on the port, the roads, and in back of port areas, despiterecent expansion projects. At an 8% annual container growth forecast the existing transportationinfrastructure will reach its limits in 2019. Unless significant expansion takes place, freight will beforced to relocate to more distant ports.
29 http://www.acsa.co.za/home.asp?pid=8048. Accessed Feb 20430 http://cargoterminal.dubetradeport.co.za. Accessed Feb 20431 Annual Report 2012-13. Dube Tradeport, 201332 Annual Report 2012-13. Dube Tradeport, 2013
R 32.0 Private Investment
R 2.0 Bn Public Investment
R 34.0 Bn Total Investment
120,900 Permanent Jobs
3.71 Million SQM Lettable Floor Area
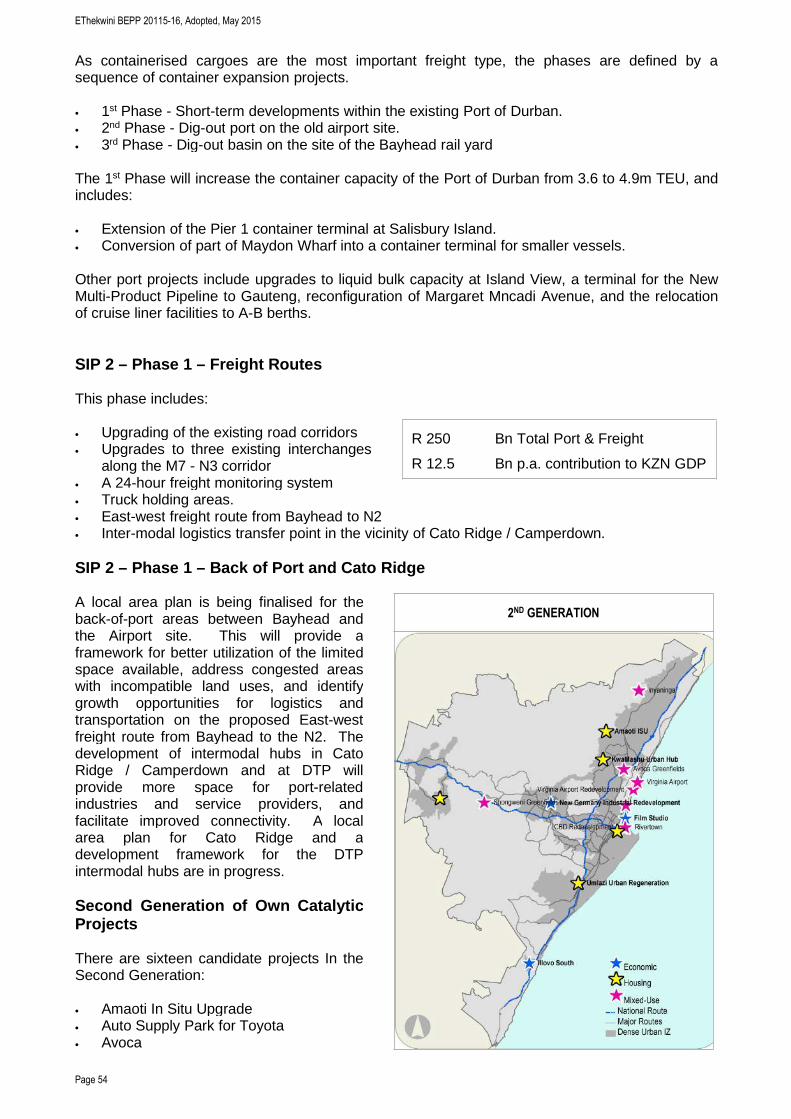
EThekwini BEPP 20115-16, Adopted, May 2015
Page 54
As containerised cargoes are the most important freight type, the phases are defined by asequence of container expansion projects.
• 1st Phase - Short-term developments within the existing Port of Durban.• 2nd Phase - Dig-out port on the old airport site.• 3rd Phase - Dig-out basin on the site of the Bayhead rail yard
The 1st Phase will increase the container capacity of the Port of Durban from 3.6 to 4.9m TEU, andincludes:
• Extension of the Pier 1 container terminal at Salisbury Island.• Conversion of part of Maydon Wharf into a container terminal for smaller vessels.
Other port projects include upgrades to liquid bulk capacity at Island View, a terminal for the NewMulti-Product Pipeline to Gauteng, reconfiguration of Margaret Mncadi Avenue, and the relocationof cruise liner facilities to A-B berths.
SIP 2 – Phase 1 – Freight Routes
This phase includes:
• Upgrading of the existing road corridors• Upgrades to three existing interchanges
along the M7 - N3 corridor• A 24-hour freight monitoring system• Truck holding areas.• East-west freight route from Bayhead to N2• Inter-modal logistics transfer point in the vicinity of Cato Ridge / Camperdown.
SIP 2 – Phase 1 – Back of Port and Cato Ridge
A local area plan is being finalised for theback-of-port areas between Bayhead andthe Airport site. This will provide aframework for better utilization of the limitedspace available, address congested areaswith incompatible land uses, and identifygrowth opportunities for logistics andtransportation on the proposed East-westfreight route from Bayhead to the N2. Thedevelopment of intermodal hubs in CatoRidge / Camperdown and at DTP willprovide more space for port-relatedindustries and service providers, andfacilitate improved connectivity. A localarea plan for Cato Ridge and adevelopment framework for the DTPintermodal hubs are in progress.
Second Generation of Own CatalyticProjects
There are sixteen candidate projects In theSecond Generation:
• Amaoti In Situ Upgrade• Auto Supply Park for Toyota• Avoca
R 250 Bn Total Port & Freight
R 12.5 Bn p.a. contribution to KZN GDP
2ND GENERATION
EThekwini BEPP 20115-16, Adopted, May 2015
Page 55
• Film Studio• Greater Mpumalanga Urban Redevelopment• Greater Umlazi Urban Redevelopment• Greyville Race-course Greenfields• Iconic Tower & Sports Precinct• Inyaninga• Mpumalanga Town Centre• New Germany Industrial Redevelopment• Rivertown Precinct Redevelopment• Shongweni Mixed Use• Umlazi Urban Regeneration• Virginia Airport Greenfields
The Second Generation could yield substantial development returns.
LETTABLEFAR SQM
RESIDENTIALUNITS NO.
INVESTMENTVALUE R BN
R BN PUBLICINVESTMENT
R BN PRIVATEINVESTMENT
RATES INCOMEP.A. R BN
PERMANENTJOBS NO.
4,241,626 48,000 49.03 12.36 36.67 0.37 60,475
ADJUSTMENTS TO OTHER SPATIAL TARGETING INSTRUMENTS
Priority Housing Development Area (PHDA)
Cornubia is a designated PHDA. Confirmation will be obtained internally if there are other PHDAs.Because Cornubia Is wholly contained with the Phase 1 Integration one and is also a High-Intensity Zone within the Integration Zone, no adjustment to the spatial definition of PHDA ispresently suggested.
Catalytic Housing Projects in the Second generation will be proposed as PHDA’s.
Social Housing Restructuring Zone (SHRZ)
EThekwini has numerous SHRZs. They were designated in two Phases several years apart. Allfall within the Dense Urban IZ, except Chatsworth, which is in the Suburban IZ. A further SHRZwill be proposed to amalgamate the existing SHRZ’s and to extend it.
Urban Development Zone (UDZ)
The greater part of the Durban CBD is a UDZ. Because the Durban CBD Is wholly contained withthe Phase 1 Integration one and is also a High-Intensity Zone within the Integration Zone, noadjustment to the spatial definition of the UDZ is presently suggested.
Special Economic Zone (SEZ)
EThekwini does not presently have an SEZ, although the Aerotropolis has been identified locallyand nationally as a candidate. If it were to be designated as an SEZ, it would fall wholly within theHigh-Intensity Zone.
Industrial Development Zone (IDZ)
EThekwini does not have an IDZ. It appears unlikely that government will support new IDZ’s, andinstead is likely to consider converting existing IDZ’s to SEZ’s. Consequently, no IDZ is proposedfor eThekwini.
Adjustments to SDF and Land Use Management System (LUMS)
EThekwini BEPP 20115-16, Adopted, May 2015
Page 56
One of the principles for the definition of the Dense IZ is that its extents should be based onintensifying and prioritising already intense and-or approved economic, mixed, and intenseresidential land uses as described in the SDF, Sub-metropolitan Spatial Development Plans(SDP’s), and LUMS.
This principle has been applied, to the SDF, but SDP’s and LUMS have not yet been reviewed fortheir alignment with the IZ’s. The assumption that the IZ’s accurately and comprehensivelyinterpret the other planning instruments has not been deeply tested,
Pending exercises are:
• The sideways integration of Sector Plans to each other• The upward integration of sector Plans into the IDP, SDF, SDP’s and BEPP• Review of LUMS to check and correct its alignment with the Integration Zone.
INSTITUTIONAL ARRANGEMENTS
ICDG Forum - Composition and Reporting
EThekwini has an ICDG Forum co-chaired by two Deputy City Managers (Treasury, and EconomicDevelopment & Planning) and attended by senior staff from Planning, Human Settlements,Economic Development, Transport, Water Services, Roads & Stormwater, Treasury, andCorporate Strategy. The Forum is served by a part-time Secretariat comprising two senior staff,and supported by a resource person availed by National Treasury. The City Manager isperiodically briefed on the progress of the Forum.
The Forum inputs and reviews the work of the Secretariat on the identification of the UNS and IZ’s,the itemising of the ICDG budget, and presentations to NT.
ICDG Secretariat
The Secretariat needs additional resources. There are two temporary contract appointments, butpermanent staff and a panel of consultants are needed (alternatively easy access to the CSP panel)
Teams for Catalytic Projects
An issue has been identified around how to best drive the development within the Dense Urban IZ,but particularly the mechanisms for Catalytic Projects. It is suggested that each catalytic Projecthas its own dedicated team, and that the best suited form of the team chosen for each projectbased on its scope and stakeholders.
There are known precedents that need to be unpacked and analysed:
• The project matrix model, which features the establishment of a Project Steering Committee• The CMDA model, an agency of different spheres of government• The ABM model, primarily a planning and referral agency of municipal line departments (and
consequently not in control of significant capital budgets)• Strategic Projects, a municipal entity set up to coordinate 2010 projects• The International Convention centre, a company wholly-owned by the municipality, for the
specific purpose of developing and operating a municipal asset• The Durban Investment Promotion Agency, a municipal agency for the specific purpose as
described by its name.• The Effingham Development Company, a joint venture of the municipality and private sector,
for the purpose of developing Riverhorse Industrial and Bridge City• An international case study with which the municipality is familiar is the IPOC model from
Curitiba.
EThekwini BEPP 20115-16, Adopted, May 2015
Page 57
Interim arrangements have been made to focus staff resources on the Catalytic Projects. For each,a team of two or more staff have been assigned, though several members serve more than oneProject.
Request for TA
The municipality requests Technical Assistance to assess the precedents listed above and others,and to formulate an institutional response for the managing the development of the Catalyticprojects and Dense Urban IZ.
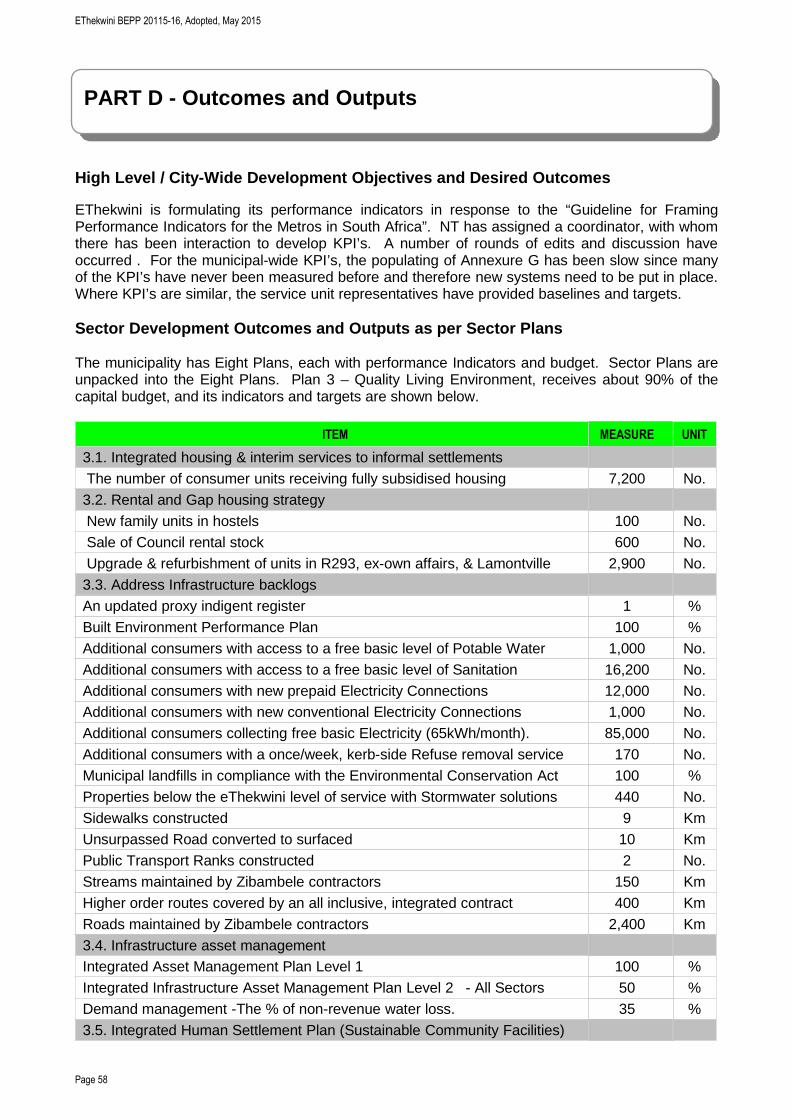
EThekwini BEPP 20115-16, Adopted, May 2015
Page 58
High Level / City-Wide Development Objectives and Desired Outcomes
EThekwini is formulating its performance indicators in response to the “Guideline for FramingPerformance Indicators for the Metros in South Africa”. NT has assigned a coordinator, with whomthere has been interaction to develop KPI’s. A number of rounds of edits and discussion haveoccurred . For the municipal-wide KPI’s, the populating of Annexure G has been slow since manyof the KPI’s have never been measured before and therefore new systems need to be put in place.Where KPI’s are similar, the service unit representatives have provided baselines and targets.
Sector Development Outcomes and Outputs as per Sector Plans
The municipality has Eight Plans, each with performance Indicators and budget. Sector Plans areunpacked into the Eight Plans. Plan 3 – Quality Living Environment, receives about 90% of thecapital budget, and its indicators and targets are shown below.
ITEM MEASURE UNIT
3.1. Integrated housing & interim services to informal settlementsThe number of consumer units receiving fully subsidised housing 7,200 No.3.2. Rental and Gap housing strategyNew family units in hostels 100 No.Sale of Council rental stock 600 No.Upgrade & refurbishment of units in R293, ex-own affairs, & Lamontville 2,900 No.3.3. Address Infrastructure backlogsAn updated proxy indigent register 1 %Built Environment Performance Plan 100 %Additional consumers with access to a free basic level of Potable Water 1,000 No.Additional consumers with access to a free basic level of Sanitation 16,200 No.Additional consumers with new prepaid Electricity Connections 12,000 No.Additional consumers with new conventional Electricity Connections 1,000 No.Additional consumers collecting free basic Electricity (65kWh/month). 85,000 No.Additional consumers with a once/week, kerb-side Refuse removal service 170 No.Municipal landfills in compliance with the Environmental Conservation Act 100 %Properties below the eThekwini level of service with Stormwater solutions 440 No.Sidewalks constructed 9 KmUnsurpassed Road converted to surfaced 10 KmPublic Transport Ranks constructed 2 No.Streams maintained by Zibambele contractors 150 KmHigher order routes covered by an all inclusive, integrated contract 400 KmRoads maintained by Zibambele contractors 2,400 Km3.4. Infrastructure asset managementIntegrated Asset Management Plan Level 1 100 %Integrated Infrastructure Asset Management Plan Level 2 - All Sectors 50 %Demand management -The % of non-revenue water loss. 35 %3.5. Integrated Human Settlement Plan (Sustainable Community Facilities)
PART D - Outcomes and Outputs
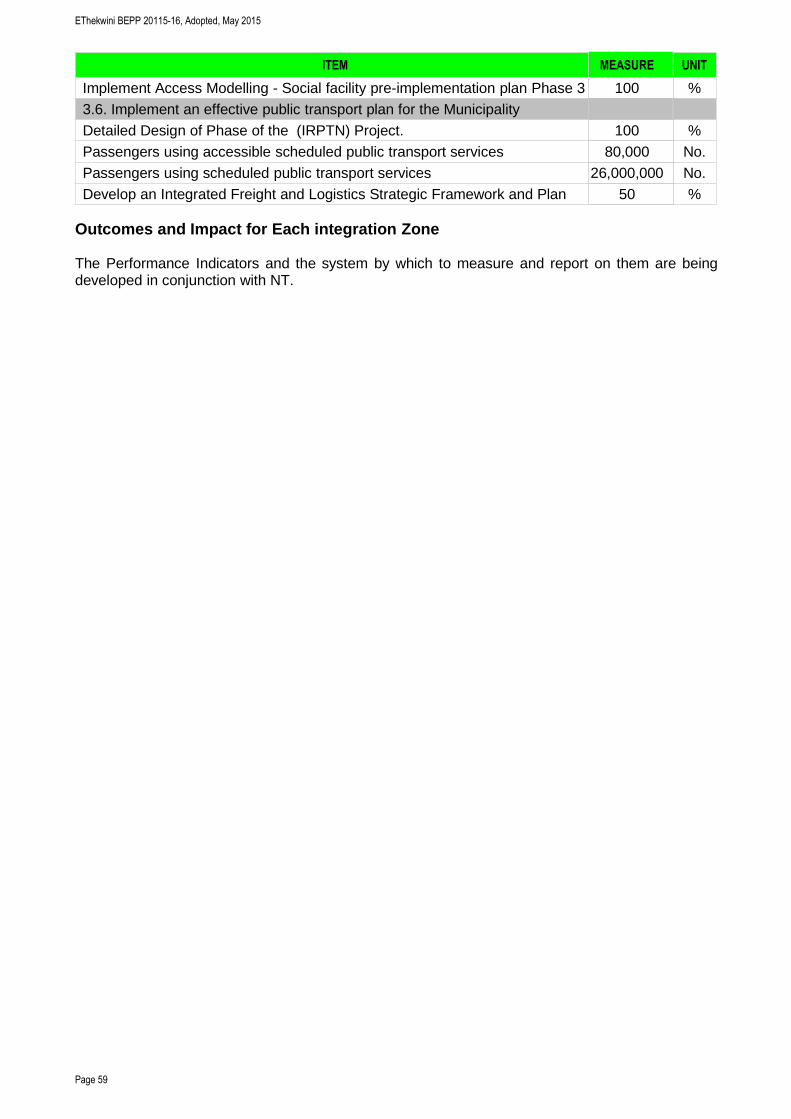
EThekwini BEPP 20115-16, Adopted, May 2015
Page 59
ITEM MEASURE UNIT
Implement Access Modelling - Social facility pre-implementation plan Phase 3 100 %3.6. Implement an effective public transport plan for the MunicipalityDetailed Design of Phase of the (IRPTN) Project. 100 %Passengers using accessible scheduled public transport services 80,000 No.Passengers using scheduled public transport services 26,000,000 No.Develop an Integrated Freight and Logistics Strategic Framework and Plan 50 %
Outcomes and Impact for Each integration Zone
The Performance Indicators and the system by which to measure and report on them are beingdeveloped in conjunction with NT.
EThekwini BEPP 20115-16, Adopted, May 2015
Page 60
Institutional Arrangements for Integrated Planning
See Section C.
INSTITUTIONAL ARRANGEMENTS FOR CAPITAL PROGRAM MANAGEMENT
EThekwini has a capital monitoring entity (Capmon) in the office of the City Manager whichmonitors the capital spend of the municipality, and which also monitors a key precursor to spend,namely the procurement process. Capmon holds weekly budget meetings with multiple serviceunits, to coordinate spend, procurement, and related processes.
The City Manager’s office is also monitoring the “Top 150” capital projects. These projects havebeen selected because of their budget quantum and-or because of their urgency. The Top 150follows a similar process as Capmon. In parallel to Capmon and Top 150, the municipality ispreparing itself to implement IDMS, which is concerned not only with spend and procurement, butalso with the remainder of the project cycle and with comprehensive program management.
Intended for the forthcoming twelvemonth is the formulation of a single corporate spatial planlinked to the budget. The ICDG process is the fulcrum for this. The single corporate spatial planwill demand a synthesis of and a spatialisation of sector plans, and refinement and simplification ofthe SDF and SDPs. At present, service units determine their own budgets with loose reference tothe IDP and other corporate strategy instruments. An intention of the single spatial plan is toensure the conscious and corporate selection and prioritisation of programs.
Supply Chain Management and Procurement Plan
Like many other municipalities, eThekwini uses a three-committee system for making decisions onthe award of expenditure over R 200,000:
• Bid Specification• Bid Evaluation• Bid Adjudication
Each committee is independent of the other.
The SCM process shifted over to Treasury during 2012, and one of the first actions after the shiftwas the process to compile a single procurement schedule. Service units were requested tosubmit procurement planning information for the remainder of the 2012-13 financial year as well asthe procurement plans for the 2013-14 financial year. This information was consolidated into asingle plan.
In order to assist with the process of recording procurement plan information, as well as trackingthe procurement through the bid committee process, an IT system was configured using the JDEdwards software. The system is ready for use and can be used to assist with the continuingprocurement scheduling and tracking of procurement status.
In the interim (prior to system readiness), in order to monitor the procurement for the top 150capital budget line items, a spreadsheet system was used in order to record and monitorprocurement information. This information was reviewed at frequent top 150 Capital projectmeetings chaired by the City Manager.
PART E - Institutional and Financial Arrangements
EThekwini BEPP 20115-16, Adopted, May 2015
Page 61
PARTNERSHIPS
Community Services
Because the function for community services falls across several government units, there is anopportunity for partnership between the municipality and provincial departments in Health,Education, Emergency Services, and Social Grants. The DPSA’s “Geographic Accessibility Studyof Social Facility and Government Service Points for the Metropolitan Cities of Johannesburg andeThekwini” points to the need for greater partnerships and coordination between other governmentdepartments (e.g. Labour, Social Development) to establish and maintain a presence at ThusongCentres.
Education
There is an existing Memorandum of Agreement with the Department of Education whereby themunicipality acts as Implementing Agent on infrastructure at schools, and on the management ofschools sportsfields as community facilities. The implementation agency and the managementarrangement on fields are not general throughout the city, but rather on a case by case. TheMOA’s ad hoc secretariat is not currently functioning due to no resources being available, and thisneeds to be corrected if the content of the MOA is to be acted upon, and if it is to be upscaledspatially and extended functionally into school upgrades through fund-raising from private sector,and to examine the possibility for utilising USDG funding to improve schools. In addition, theMOA’s ad hoc secretariat should also be exploring the potentials for utilising halls, parking, andclassrooms as community facilities, and the secretariat should also examine how new communityfacilities, particularly libraries, parks, clinics, and supportive facilities such as crèches and publictransport stops could be located on (preferably) or adjacent to school grounds. The secretariatshould also be examining how schools could benefit from existing community halls and librariesrun by the municipality.
Health
There is also an agency arrangement between the municipality and Health around primary healthcare for the construction and operation of clinics. This arrangement seems to be functional when itcomes to construction, but there appear to be areas of duplication on the operations side, arisingprimarily from pre-democracy when the former City of Durban ran its own clinics. A strongerpartnership seems to be needed to clarify and coordinate roles, and as with education, to exploreand arrange how best to cluster clinics with other uses.
Home Affairs
There appears to be functional partnership with Home Affairs on the sharing of office space withthe municipality to offer a wider range of public services at one place, via the Thusong Centres.
Human Settlement
For the development of Cornubia South (underway) and Cornubia North (proposed), a functionalpartnership has been established between municipality, landowner, Housing Development Agency,and DHS. The partnership is served by a full-time secretariat comprising municipal officials.
Multi-use and Economic
Mention is made elsewhere in this document about the joint venture with private sector aroundBridge City and Riverhorse Industrial. Riverhorse Industrial is complete, and at Bridge City the JVsucceeded to attract significant private and state investment, and aims to continue to do so untilthe project is complete.
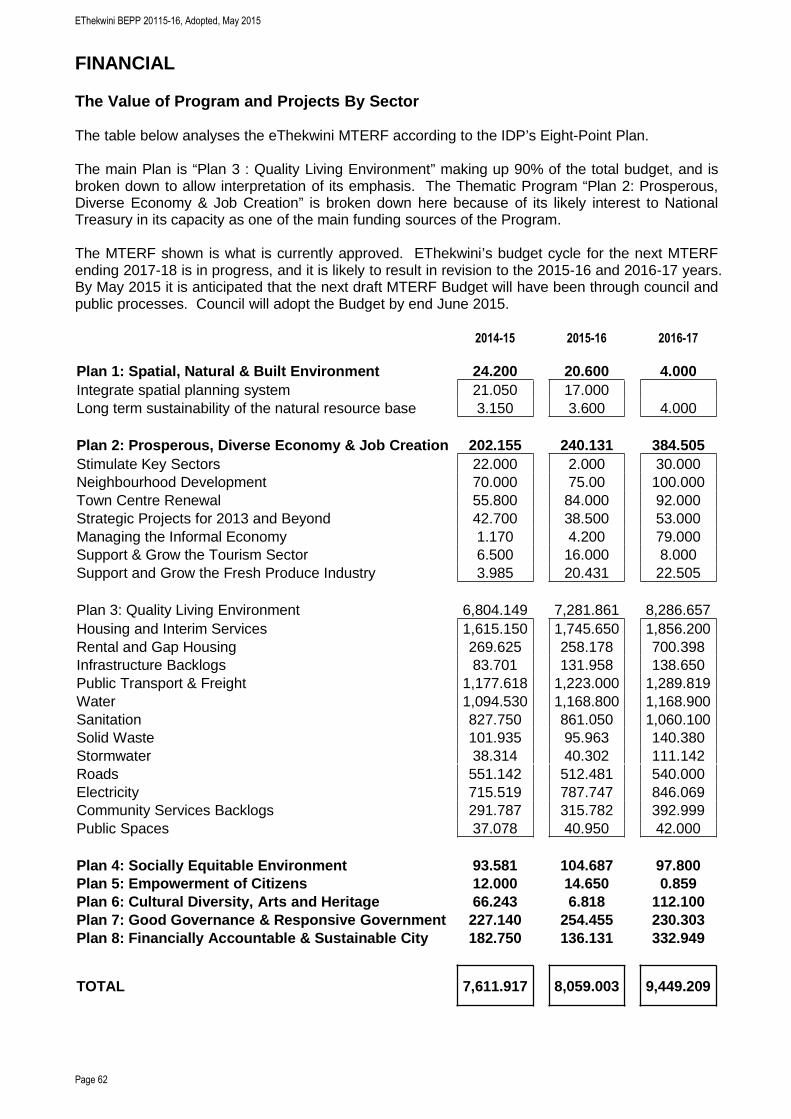
EThekwini BEPP 20115-16, Adopted, May 2015
Page 62
FINANCIAL
The Value of Program and Projects By Sector
The table below analyses the eThekwini MTERF according to the IDP’s Eight-Point Plan.
The main Plan is “Plan 3 : Quality Living Environment” making up 90% of the total budget, and isbroken down to allow interpretation of its emphasis. The Thematic Program “Plan 2: Prosperous,Diverse Economy & Job Creation” is broken down here because of its likely interest to NationalTreasury in its capacity as one of the main funding sources of the Program.
The MTERF shown is what is currently approved. EThekwini’s budget cycle for the next MTERFending 2017-18 is in progress, and it is likely to result in revision to the 2015-16 and 2016-17 years.By May 2015 it is anticipated that the next draft MTERF Budget will have been through council andpublic processes. Council will adopt the Budget by end June 2015.
2014-15 2015-16 2016-17
Plan 1: Spatial, Natural & Built Environment 24.200 20.600 4.000Integrate spatial planning system 21.050 17.000Long term sustainability of the natural resource base 3.150 3.600 4.000
Plan 2: Prosperous, Diverse Economy & Job Creation 202.155 240.131 384.505Stimulate Key Sectors 22.000 2.000 30.000Neighbourhood Development 70.000 75.00 100.000Town Centre Renewal 55.800 84.000 92.000Strategic Projects for 2013 and Beyond 42.700 38.500 53.000Managing the Informal Economy 1.170 4.200 79.000Support & Grow the Tourism Sector 6.500 16.000 8.000Support and Grow the Fresh Produce Industry 3.985 20.431 22.505
Plan 3: Quality Living Environment 6,804.149 7,281.861 8,286.657Housing and Interim Services 1,615.150 1,745.650 1,856.200Rental and Gap Housing 269.625 258.178 700.398Infrastructure Backlogs 83.701 131.958 138.650Public Transport & Freight 1,177.618 1,223.000 1,289.819Water 1,094.530 1,168.800 1,168.900Sanitation 827.750 861.050 1,060.100Solid Waste 101.935 95.963 140.380Stormwater 38.314 40.302 111.142Roads 551.142 512.481 540.000Electricity 715.519 787.747 846.069Community Services Backlogs 291.787 315.782 392.999Public Spaces 37.078 40.950 42.000
Plan 4: Socially Equitable Environment 93.581 104.687 97.800Plan 5: Empowerment of Citizens 12.000 14.650 0.859Plan 6: Cultural Diversity, Arts and Heritage 66.243 6.818 112.100Plan 7: Good Governance & Responsive Government 227.140 254.455 230.303Plan 8: Financially Accountable & Sustainable City 182.750 136.131 332.949
TOTAL 7,611.917 8,059.003 9,449.209
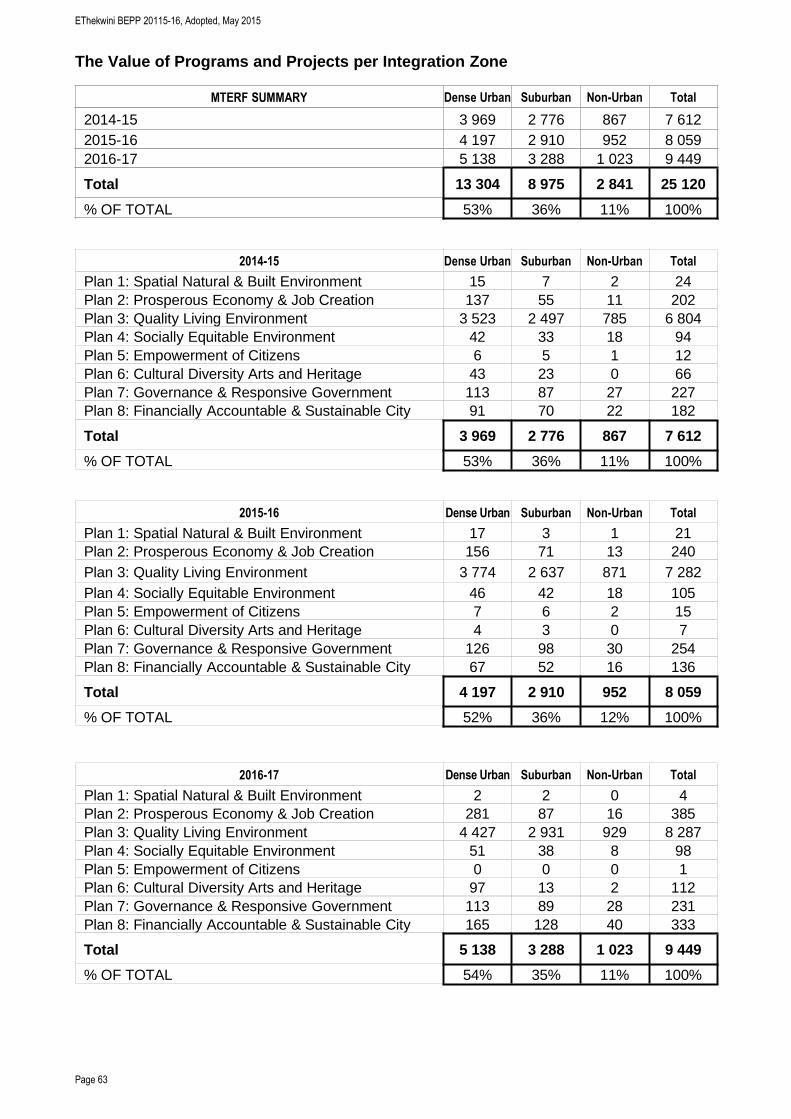
EThekwini BEPP 20115-16, Adopted, May 2015
Page 63
The Value of Programs and Projects per Integration Zone
MTERF SUMMARY Dense Urban Suburban Non-Urban Total
2014-15 3 969 2 776 867 7 6122015-16 4 197 2 910 952 8 0592016-17 5 138 3 288 1 023 9 449
Total 13 304 8 975 2 841 25 120
% OF TOTAL 53% 36% 11% 100%
2014-15 Dense Urban Suburban Non-Urban Total
Plan 1: Spatial Natural & Built Environment 15 7 2 24Plan 2: Prosperous Economy & Job Creation 137 55 11 202Plan 3: Quality Living Environment 3 523 2 497 785 6 804Plan 4: Socially Equitable Environment 42 33 18 94Plan 5: Empowerment of Citizens 6 5 1 12Plan 6: Cultural Diversity Arts and Heritage 43 23 0 66Plan 7: Governance & Responsive Government 113 87 27 227Plan 8: Financially Accountable & Sustainable City 91 70 22 182
Total 3 969 2 776 867 7 612
% OF TOTAL 53% 36% 11% 100%
2015-16 Dense Urban Suburban Non-Urban Total
Plan 1: Spatial Natural & Built Environment 17 3 1 21Plan 2: Prosperous Economy & Job Creation 156 71 13 240Plan 3: Quality Living Environment 3 774 2 637 871 7 282Plan 4: Socially Equitable Environment 46 42 18 105Plan 5: Empowerment of Citizens 7 6 2 15Plan 6: Cultural Diversity Arts and Heritage 4 3 0 7Plan 7: Governance & Responsive Government 126 98 30 254Plan 8: Financially Accountable & Sustainable City 67 52 16 136
Total 4 197 2 910 952 8 059
% OF TOTAL 52% 36% 12% 100%
2016-17 Dense Urban Suburban Non-Urban Total
Plan 1: Spatial Natural & Built Environment 2 2 0 4Plan 2: Prosperous Economy & Job Creation 281 87 16 385Plan 3: Quality Living Environment 4 427 2 931 929 8 287Plan 4: Socially Equitable Environment 51 38 8 98Plan 5: Empowerment of Citizens 0 0 0 1Plan 6: Cultural Diversity Arts and Heritage 97 13 2 112Plan 7: Governance & Responsive Government 113 89 28 231Plan 8: Financially Accountable & Sustainable City 165 128 40 333
Total 5 138 3 288 1 023 9 449
% OF TOTAL 54% 35% 11% 100%
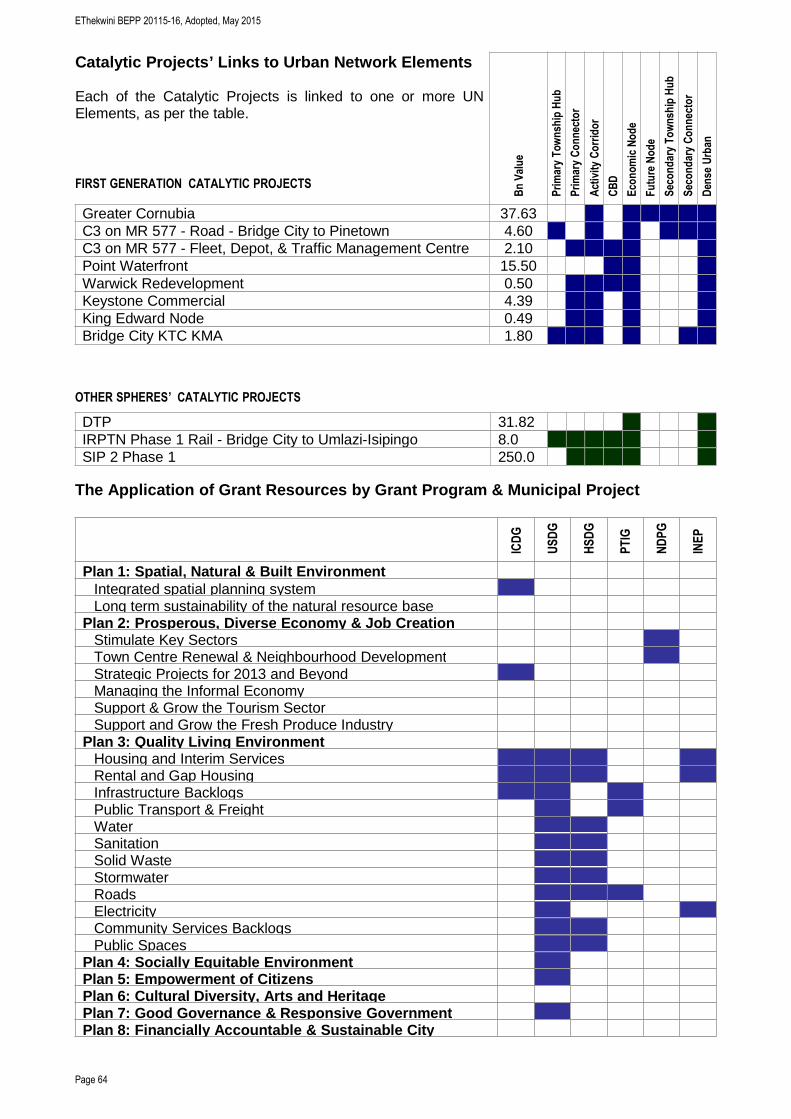
EThekwini BEPP 20115-16, Adopted, May 2015
Page 64
Catalytic Projects’ Links to Urban Network Elements
Each of the Catalytic Projects is linked to one or more UNElements, as per the table.
FIRST GENERATION CATALYTIC PROJECTS
BnValue
PrimaryTownshipHub
PrimaryConnector
ActivityCorridor
CBD
EconomicNode
FutureNode
SecondaryTownshipHub
SecondaryConnector
Dense
Urban
Greater Cornubia 37.63C3 on MR 577 - Road - Bridge City to Pinetown 4.60C3 on MR 577 - Fleet, Depot, & Traffic Management Centre 2.10Point Waterfront 15.50Warwick Redevelopment 0.50Keystone Commercial 4.39King Edward Node 0.49Bridge City KTC KMA 1.80
OTHER SPHERES’ CATALYTIC PROJECTS
DTP 31.82IRPTN Phase 1 Rail - Bridge City to Umlazi-Isipingo 8.0SIP 2 Phase 1 250.0
The Application of Grant Resources by Grant Program & Municipal Project
ICDG
USDG
HSDG
PTIG
NDPG
INEP
Plan 1: Spatial, Natural & Built EnvironmentIntegrated spatial planning systemLong term sustainability of the natural resource base
Plan 2: Prosperous, Diverse Economy & Job CreationStimulate Key SectorsTown Centre Renewal & Neighbourhood DevelopmentStrategic Projects for 2013 and BeyondManaging the Informal EconomySupport & Grow the Tourism SectorSupport and Grow the Fresh Produce Industry
Plan 3: Quality Living EnvironmentHousing and Interim ServicesRental and Gap HousingInfrastructure BacklogsPublic Transport & FreightWaterSanitationSolid WasteStormwaterRoadsElectricityCommunity Services BacklogsPublic Spaces
Plan 4: Socially Equitable EnvironmentPlan 5: Empowerment of CitizensPlan 6: Cultural Diversity, Arts and HeritagePlan 7: Good Governance & Responsive GovernmentPlan 8: Financially Accountable & Sustainable City