
Improving Security Using Refined 16 X 16 Playfair Cipher for ...

PATCH USE AND PATCH DEPLETION BY THE SPIDER AND HOWLING MONKEYS OF SANTA ROSA NATIONAL PARK,
COSTA RICA
by
COLIN CHAPMAN1)2)
(Departments of Anthropology and Zoology, University of Alberta, Edmonton, Alb. Canada T6G 2E1)
(With 7 Figures) (Acc. 14-XII-1987)
Introduction
Many of the models proposed to explain aspects of foraging behaviour, group size, or social structure assume animals use resources that occur in patches, and that through such use the patches become depleted. For
instance, a number of models developed to predict group size suggest that the costs and benefits of using patches vary with group size, such that for a given resource state there is an optimal group size which tends to maximize foraging efficiency (S. ALTMANN, 1974; BRADBURY & VEHREN-
CAMP, 1976a, b, 1977; CARACO & WOLF, 1975; HORN, 1968; KLEIN &
KLEIN, 1975, 1977; LEIGHTON, 1982; LEIGHTON & LEIGHTON, 1982;
STACEY, 1986; TERBORGH, 1983; VAN SCHAIK et al., 1983; WARD &
ZAHAVI, 1973). In opposition to the assumption of patch depletion, is the
suggestion that the food resources used by primates are superabundant
(CARPENTER, 1965; COELHO et al., 1976; STRUHSAKER, 1978). If resources
are superabundant, the assumption of patch depletion would likely be invalid. Thus, the application to primate species of models of foraging
1) Present address: Dept. of Biology, McGill University, 1205 Dr. Penfield Ave., Montreal, Quebec, Canada H3A lB1.
2) This research was funded by an NSERC Post-Graduate Scholarship, a Province of Alberta Scholarship, and a University of Alberta Dissertation Fellowship. I wish to
express my gratitude to the National Parks Service of Costa Rica and the park guards of Santa Rosa for allowing me to conduct my research in the park and for providing logistical support. I am grateful to L. FEDIGAN and K. GLANDER for providing me access to individually marked animals. I particularly thank Lauren CHAPMAN and Dr D. H.
JANZEN for their invaluable assistance with the field work. Finally, I would like to thank the following people for helpful comments and criticisms on the project: J. ADDICOTT, L.
J. CHAPMAN, L. FEDIGAN, L. M. FEDIGAN, K. GLANDER, W. H. HALLWACHS, C. H.JAN- SON, D. H. JANZEN, B. MONTGOMERIE, J. MURIE, and two reviewers.
100 COLIN CHAPMAN
behaviour and group size, which rely on this assumption, are unlikely to
accurately represent the animal's behaviour. In addition, primates may deplete only certain types of patches, or deplete patches only in specific circumstances. For instance, patches may not be depleted if food toxins, digestibility, nutrient requirements, or the actions of competitors cause a group to leave a tree prior to its depletion. Since patches may not be
depleted because of reasons such as these, it is essential to determine if
primates deplete the food patches they use prior to applying any of the
foraging models that incorporate this assumption. The objective of this investigation was to examine under what cir-
cumstances the spider (Ateles geoffroyi) and howling monkeys (Alouatta palliata) of Santa Rosa National Park, Costa Rica likely deplete the pat- ches they use. Defining what constitutes a patch has proven difficult in field situations. This is partially because food resources may be
aggregated on a number of spatial and temporal scales (PIELOU, 1969). Thus, an appropriate scale must be defined for each situation and
species. Temporal predictability is represented as the persistence of food resources at a given location once the food resource is available (COL? WELL, 1974; WARNER, 1980); however, it is difficult to determine when resources are available and if an animal has sampled its environment suf-
ficiently to know the location of the resource. The selection of an
appropriate spatial and temporal scale for a given species and situation will depend on many factors including the animal's movement
capabilities, foraging strategies (including energetic and nutrient needs), digestive efficiencies, and the spatial and temporal patterning of resources in its environment. A number of theoretical or conceptual definitions of patches have been proposed (S. ALTMANN, 1974; HASSELL
& SOUTHWOOD, 1978). For the purpose of this study a patch was con- sidered as an aggregation of food items structured such that animals could use the area without interrupting their feeding activity. In opera- tionalizing this definition a patch was assumed to be a single tree (or under rare circumstances the food trees of the same species with adjoin- ing canopies; this usage is examined below).
It is difficult to count the individual food items remaining in a tree after a primate group has left it. Thus, for the purpose of this investiga- tion, patch depletion was inferred from the actions of individual
monkeys. Their behaviour was monitored in situations where their actions could be predicted if they were depleting the patches in which
they fed. For example, if a primate group was depleting a food patch, the
acquisition of food items per individual in a patch should be negatively
PATCH USE AND PATCH DEPLETION 101
related to the time the group has spent in the patch. Also, the time the
study group spends in a patch will be a function of the size of the patch and the number of individuals in the group (i.e. if depletion occurs large groups should stay in equally sized patches for less time than small
groups and small patches should be left sooner than large patches). Theoretically, a patch may be considered depleted when the feeding activities of consumers have led to the disappearance of all food items
(CANT & TEMERIN, 1984). However, once food items become rare within a tree, they become progressively harder to obtain, and thus a patch will be functionally depleted before all of the food items are eaten. From this
perspective, patches have been considered depleted when the rate of intake of food items in a patch equals the average of the environment
(CHARNOV, 1976; PYKE, 1984).
Methods
The study was carried out in Santa Rosa National Park, Costa Rica during four field seasons encompassing 24 months (July and August 1983, January to August 1984, January to July 1985, and February to August 1986). In the last season only spider monkeys were studied. Rectangular in shape and covering approximately 10,800 ha, Santa Rosa consists of a series of plateaus which start at an elevation of 300 m and drop to the ocean. The vegetation of the park is a mosaic of grassland (Hyparrhenia rufa), dry deciduous forest in which Spondias mombin, Luehea candida, L. speciosa, Guazuma ulmifolia, Bursera simaruba, and Chlorophora tinctoria are common, and small fragments of semi- evergreen forest containing Hymenenaea courbaril, Mastichodendron capiri, Castilla elastica, and Manilkara chicle (BONOFF & JANZEN, 1980; JANZEN, 1986; CHAPMAN, unpubl. data).
The climate of the region is characterized by two distinct seasons; the dry season that extends from approximately mid December to late May, and the wet season which encompasses the remainder of the year. Rainfall in the park ranges from 900 to 2400 mm annually, almost all of which falls in the wet season. Thus, during the dry season the majority of the non-riparian trees lose their leaves.
The howling monkey study group consisted of 40 individuals; 7-8 adult males, 16-18 adult females, 1-2 large immature males, 1 large immature female, 4-6 small immatures, and 6-9 infants. An exact count of the size of the spider monkey community was not possible, because of the fission-fusion type of social organization exhibited by spider monkeys. However, a minimum estimate of the size of the community was obtained by summing the maximum counts of all age/sex classes seen in any one year. Using this method the community was estimated to consist of 42 individuals; 4 adult males, 17 adult females, 2 large immature males, 4 large immature females, 7 small immatures, and 8 infants. Counts were made repeatedly over the study period and the total group sizes presented here represent means of these counts.
Behavioural sampling. Behavioural data were collected using a focal animal sampling regime with 10-minute sessions (J. ALTMANN, 1974). When possible the subject chosen for sampling was selected according to a fixed rotation between age and sex classes. Normally, the species chosen to be sampled was alternated each day. Also, an attempt was made to obtain a complete
102 COLIN CHAPMAN
record of each species' activity during a 3-week sample period so that at the end of each
period an equal number of observations were made in each hour of the day. Using this
sampling regime, 394 hours of focal animal data were collected on the howling monkey group and 335 hours on the spider monkeys. Whenever all food items handled by an individual could easily be seen, counts were made of the rate of ingestion. The Diameter at Breast HEIGHT (DBH) of the trees used by the monkeys was estimated visually (error in estimation of DBH was + 1.6 cm, n = 46, mean DBH of trees used was 43.1 cm for
spiders and 62.6 cm for howling monkeys). Simultaneous to the taking of focal animal data, a continuous record of the group's activity was collected (e.g. the number of animals
feeding in a tree, the first animal to arrive in a patch, the time the last animal left the
patch). These observations allowed the calculation of interpatch movement times and the estimation of the average time spent feeding in a patch.
Both the spider and howling monkey groups frequently formed subgroups. The members of a subgroup tended to coordinate their activities, maintain relatively close
spatial contact, and be spatially discrete from other subgroups. This type of association was similar to that typically described for spider monkeys, but was a radical departure from the relatively stable cohesive social groups typically described for howling monkeys (CHIVERS, 1969; ESTRADA, 1984; GLANDER, 1980; MILTON, 1980; SMITH, 1977). The
howling monkey study group frequently fragmented into 2 or more subgroups that were
spatially separated by up to 2 km, for periods that lasted as long as 4 weeks. The howling monkeys were in subgroups, rather than in a single group, for 84% of the time. The
group tended to split into two approximately equally sized subgroups. Occasionally, one of these subgroups would also fission (mean subgroup size 19.3 individuals, n = 324
sightings). The composition of the subgroups changed frequently as animals moved between them. Adult males were the most mobile age/sex class; recognizable males were often seen moving between subgroups (solitary animals when moving between subgroups were not considered in the calculation of mean subgroup size). When subgroups united, agonistic behaviours were rarely seen. Similarly fragmentation of howling monkey social
groups have been observed on Barro Colorado Island, Panama (K. MILTON, pers. comm.). To determine the size and composition of howling monkey subgroups, counts were normally made once each time a subgroup was observed and the composition was assumed to be stable over the period of observation. Since the location and size of all
howling monkey subgroups were usually known, a count of any single subgroup was
thought to be accurate since the sum of all subgroups closely approximated the total
group size. In an effort to obtain an accurate estimate of the size of spider monkey subgroups, whenever a subgroup was sighted the immediate area was searched for unseen animals. Also, only subgroups that were followed for more than 30 minutes were used in the following analyses. Inactive and unseen individuals would likely have been seen prior to the end of that time. The spider monkey subgroups changed composition approximately every 2.0 hours.
Ecological sampling. To determine the size and distribution of the food resources eaten by each species, the most commonly used plant species were determined from the preceding 3 weeks of behavioural observations, and the location, size, and phenological status of all adult trees of these species were determined in three 4-hectare grids. Each grid was 200 m by 200 m and consisted of 400 cells, each 10 m by 10 m in size. Corners of the cells were marked with steel posts. An adult tree was considered as any individual tree with a DBH greater than the smallest individual seen to bear fruit. The size of a patch would ideally be
represented as the number of food items it contained; however, the large number of pat- ches used by both of these species precluded the counting of food items, so patch size was
represented by DBH. Several previous studies have demonstrated that DBH accurately predicts the reproductive capacity of fruiting individuals for a number of tropical tree

PATCH USE AND PATCH DEPLETION 103
species (LEIGHTON, 1982; LEIGHTON & LEIGHTON, 1982; MCDIARMID et al., 1977). The
phenological information recorded involved assessing the stage of leaf development and
noting the presence or absence of fruit and flowers. In 1984, phenological data were recorded on the major plant species used by either of the monkey species during the
preceding 3 weeks of behavioural sampling. In 1985 and 1986, the phenological status of all individuals of all major plant species used by either the howlers or spiders any time
during the study were assessed. When a plant species was used that had not been eaten in the past, phenological data were recorded for it in all subsequent ecological sampling periods.
A 3-week sampling period was chosen because within this period an adequate sample of each species' behaviour could be obtained and the phenological cycles of the majority of the food plants used by the monkeys bore food items for over 3 weeks; thus individual trees possessing food items at the beginning of a 3-week period usually possessed them at the end of the sample period. Individuals of the few species of plants that were excep- tions to this rule (e.g. flowering Tabebuia ochracea) could be identified by looking for food items that had fallen to the ground. Thus, food resources were not so ephemeral that they could not be accurately sampled in a 3-week period or that the two primate species could not respond to the changes.
The distributions of all variables used were examined for normality, and when values were not normally distributed an appropriate transformation was applied. The reverse transformations were corrected for bias (see BEAUCHAMP & OLSON, 1973; MILLAR, 1984).
Results
Does a tree equal a patch? To determine if the resources used by these primates can be considered to occur in patches and whether or not it is a typical situation for one tree
to represent a patch, the time spent moving between food trees
(excluding rest stops) was determined for each instance where a subgroup was followed from one tree to another. This sampling procedure tended to bias the sample in favour of short movements because subgroups were
more likely to be lost or abandoned during long movements. For spider
monkeys the average time spent moving from one food tree to another
was 703 seconds (range = 5 to 3660 seconds, in 172 movements). Fewer than 15% of these movements were less than 1 minute in duration and
of these short travel bouts 76 % involved foraging bouts occurring in one
area with a number of Muntingia calabura trees growing close together. In 90 observed movements of howlers, the average time spent moving between food trees was 402 seconds (range from 10 to 1421 seconds). Fewer than 13 % of these movements involved travel bouts of less than
1 minute. Spider monkeys spent significantly more time moving between
food patches than did howlers (t = 3.5, P = 0.032). Relative to the time
spent moving between trees, both species tended to have movements of
short duration within a tree (94% of the movements made by howlers
104 COLIN CHAPMAN
within a tree were of shorter duration than 30 seconds, 97% of the spider movements within a tree were less than 30 seconds).
To further examine this assumption, the grid location of all individuals of the major food plant species was determined in all of the sample periods for both of the monkey species. Many of the resources used by both species (e.g., Ficus spp., Swartzia cubensis, Mastichodendron capiri) occurred at low densities. Resources occurring at low density tended to be spatially separated, and thus an individual tree was likely to represent a patch. The average density of the food plants that were used by the
howling monkeys for greater than 1 % of their feeding time was low (7.96 trees/ha) and 63 % of these plant species occurred at a density of less than 1 individual per hectare. Similarly, food plants constituting greater than 1 % of the spider monkey's feeding time were found at an average density of 4.76 individuals per hectare and 52.9% of these species occurred at a
density of less than 1 individual per hectare. For both species it was com- mon for only 1 individual food bearing tree of a particular species (e.g., Ficus spp., Swartzia cubensis) to occur in the 12 ha gridded area.
Foraging behaviour as related to patch use.
The howling monkeys studied in Santa Rosa spent 49.0% of their
feeding time eating leaves, compared to 28.5% and 22.5% of their
feeding time eating fruit or flowers, respectively. In contrast, spider monkeys spent 77.7 % of their feeding time eating fruit, and patches con-
taining fruit represented 88.0% of the total number of patches visited.
Feeding on flowers and leaves constituted 9.0% and 11.9% of the
spider's feeding time, respectively. On average, spider monkeys spent 810 seconds feeding in a patch they
visited (range = 10-5021 seconds, n= 147). The time spent feeding in a
patch did not differ between the types of patches being used. Spiders on
average used flower patches for 729 seconds (n = 13), and used patches containing fruit (n = 121) or leaves (n= 13) for 814 seconds and 853 seconds, respectively (F = 0.058, P = 0.943). The time spent feeding in a patch was related to the season; spiders spent significantly less time in each patch visited in the dry season (mean = 643 seconds, n = 78) than in the wet season (mean = 999 seconds, n = 69, t =2.17, P = 0.032). Howling monkeys spent an average of 1275 seconds feeding in a patch (n = 78), which tended to be a longer period than that of spider monkeys (t = 1.87, P = 0.068). The time that howlers spent feeding in a
patch did not differ between the types of patches they were using (fruit

PATCH USE AND PATCH DEPLETION 105
1638 seconds n = 44, flower 684 seconds n= 24, leaves 906 seconds n = 20, F = 1.397. P = 0.262). The howlers spent longer in patches in the
dry season (mean = 30.1 minutes) than in the wet season (mean = 12.9 minutes, t = 7.927, P<0.001).
The average DBH of the food trees used by spider monkeys was 43.1 cm with a range of 7 cm to 185 cm. The patches used to obtain flowers had on average the largest DBH (mean DBH = 56.6 cm, n= 13), fol- lowed by fruit patches (mean DBH = 37.8 cm, n = 121), and leaf patches (mean DBH = 33 cm, n = 13), but these differences were not significant (F = 0.651, P = 0.438). Although time spent feeding in patches showed seasonal variability, patch size showed no significant change with season
(mean patch size, dry season 39.2 cm DBH n = 79, wet season 47.0 cm DBH n = 69, t = 1.39, P = 0.167). The howling monkey group used pat- ches with an average DBH of 62.6 cm, which was significantly larger than the size of the patches used by the spider monkeys (t = 3.39, P < 0.001). The average sizes of the different types of food patches used
by the howlers were similar (fruit, mean DBH = 63.8, n = 44; flowers, 63.9 n = 24; leaves, 59.0 n = 20). Unlike spiders, the size of the patches used in the wet season by the howlers (mean DBH = 79.4 cm, n = 34) was
significantly larger than the size of those used in the dry season (mean DBH =44.9 cm, n = 54, t = 22.4, P<0.001).
Do these primates deplete the patches they use?
One line of evidence suggesting that both spiders and howlers generally deplete the trees they use in a single visit is that they were frequently observed to feed in a number of individual trees of the same species in direct succession. This occurred even if the individual trees were far
apart. For instance, spider monkeys on average spent 821 seconds mov-
ing between different individual Sloanea terniflora trees, and it was not uncommon for them to visit four or five different trees in direct succes- sion. One explanation for these observations is that the monkeys were
feeding in a tree and depleted its food resources to a level where it was more profitable for the animals to travel to a new tree where presumably the rate of intake of food items would be higher than if they remained
feeding in the original tree. Other explanations for the observed pattern, such as a need to travel in order to adequately defend territorial bound- aries, cannot be ruled out by these observations.
A second line of evidence of patch depletion is that for most tree species the rate of intake of food items during a feeding bout in a single patch

106 COLIN CHAPMAN
was higher at the start of the feeding bout than later in the same feeding session (paired t-test howlers t=5.51, P=0.005, spiders t=4.32, P<0.001, average length of feeding session for spiders was 810 seconds and for howlers 1275 seconds). One possible interpretation of this result is that food items are easier to find when a subgroup first enters a tree than after they have been feeding in it for some time. An alternative
explanation for the decrease in the number of food items obtained over the duration of the feeding bout is that the animals are becoming satiated. If this explanation were true one might expect a decrease in the rate of acquiring food items obtained with all types of plants. However, that was not the case. For instance, the rate of intake of leaves eaten by howling monkeys did not change over the length of a feeding bout
(t = 0.780, P = 0.717, n = 20), nor did the rate of intake of fig fruit by spider monkeys decrease (t = 0.39, P= 0.359, n = 17), but the rate of
acquiring other fruits by spiders, such as Bursera simaruba (t= 11.0, P = 0.029, n= 23), Muntingia calabura (t= 9.00, P= 0.035, n= 17), or
Dipterodendron costaricensis (t = 6.43, P = 0.012, n = 12) did change over the
length of the feeding bout. An alternative method of assessing the validity of the patch depletion
assumption is to assume that primates deplete patches and examine rela-
tionships that should be true if the assumption of patch depletion were correct. For instance, if patches were depleted by primate exploitation, larger groups should spend less time than smaller groups in patches of
equal size, and thus individuals in a larger group should have to travel farther to obtain their daily ration. Consequently, individuals in large groups might spend more time feeding per day than individuals in small
groups to compensate for the added energy expended in travel. There was a significant positive correlation between subgroup size and the time
spent travelling for both howlers (r=0.4829, P<0.001) and spiders (r = 0.461, P = 0.027). Similarly, there was a significant positive relation-
ship between subgroup size and the amount of time spent feeding for howlers (r=0.491, P<0.001) and spiders (r=0.565, P=0.007). An alternative explanation for this relationship is that members of large subgroups obtain fewer food items per minute, possibly associated with increased interference. For both primate species in Santa Rosa intake rate was not related to subgroup size (howler r = 0.197, P = 0.250; spiders r = 0.054, P = 0.417), so members of differently sized subgroups obtained food items at approximately the same rate.
If patches were depleted by primate use, one would expect that the time spent feeding in a patch would be a function of the size of the patch

PATCH USE AND PATCH DEPLETION 107
3-
2- · .2
vu . . e.e .... · 5 . . . . .. .
*" -1- · .ee e . e
.
2 .
3- 1 1 i 6 i I 3
Patch Size
Fig. 1. A standardized partial regression plot which expresses the influence of the size of the patches used by the spider monkeys of Santa Rosa National Park, Costa Rica on the time spent in patches when the subgroup size is held constant. This analysis uses all
types of trees. Dot size represents the number of observations of that value.
2 ' *. : .9
Cu 1 .. ·
eu . *
._ . o
-3 - -1 0 I 3 Subgroup Size
Fig. 2. A standardized partial regression plot which expresses the influence of the size of the subgroup of the spider monkeys of Santa Rosa National Park, Costa Rica on the time they spent in patches when the size of the patch is held constant. This analysis used
all types of patches. Dot size represents the number of observations of that value.
and the number of animals using the patch, such that equal sized groups would spend more time in large patches than in small patches, and small groups would spend more time in a patch of a given size than would a
larger group. A multiple regression to predict the time that spiders spent feeding in a patch from the size of the patch (all types of trees) and the number of individuals feeding in the patch produced a significant rela- tionship (R2=0.421, P<0.001, log time in a patch= 1.11 + 1.11 log patch size - 0.25 log subgroup size). The relative influence of these two variables on the time that spider monkeys spent in a patch can be assessed in a number of ways. A partial correlation analysis of feeding time versus patch size and the number of individuals using the patch sug- gests that the size of the patch has a stronger influence on the time spent

108 COLIN CHAPMAN
in a patch than does the number of individuals using it (log transformed
feeding time versus patch size, controlling for subgroup size, r = 0.644, P<0.001, feeding time versus subgroup size, controlling for patch size, r=0.151, P = 0.028). A more precise means to show the relative influ- ence of the dependent variables on the time the spider monkeys spent in
patches, which shows the actual data used, is to construct standardized
partial regression plots (Fig. 1, 2). Comparing the scatter in Figs 1 and 2 illustrates that the influence of patch size on feeding time is stronger than the influence of subgroup size on feeding time in a patch.
For howling monkeys, using all types of patches, the size of the patch and the number of animals feeding within the patch explained little of the variation in time spent feeding in a patch (R2 = 0.093, P = 0.860, log of time in a patch = 2.27 - 0.31 log subgroup size + 0.55 log patch size).
It is possible to examine what types of patches are depleted by primate use. Although the time howlers spent feeding in all types of patches could not be predicted well by patch size and the size of the subgroup, if only fruit patches are used in this analysis, the relationship is significant (R2 = 0.333, P = 0.011, log of time in a patch = 1.00 + 1.46 log patch size - 0.46 log subgroup size). The relative influence of these variables on the time howling monkeys spent in patches was assessed in two ways. In a
partial correlation analysis both the number of individuals using a fruit
patch and the size of the patch were significantly related to the amount of time spent feeding in that patch (partial correlations of feeding time versus patch size controlling for subgroup size log transformed r = 0.577, P = 0.002; feeding time versus subgroup size controlling for the size of the
patch, r = 0.267, P = 0.050). By plotting the standardized partial regres- sions, the data can be presented and the relative influence of each depen- dent variable on the time spent in a patch when the other dependent variable is held constant (Figs 3, 4).
In contrast to when howlers fed on fruit, when they fed on leaves, patch size and the number of individuals in the subgroup did not predict feeding time in the patch (R2 =0.249, P = 0.366, log of time in a
patch = 4.61-0.69 log patch size - 0.51 log subgroup size). Different subgroups of spiders occasionally used large fruiting trees
soon after they were abandoned by a previous subgroup, or one
subgroup would return to a large fruiting tree repeatedly throughout the
day e.g. Ficus spp.). These observations suggest that large fruiting trees
may not have been depleted by the spider monkeys. A multiple regres- sion of the time in a patch versus patch size and subgroup size was con- ducted using only trees of specific size. This relationship became non-

PATCH USE AND PATCH DEPLETION 109
2 *2
Patch Size
Fig. . A standardized partial regression plot which expresses the influence of the size
of the patches used by the howling monkeys of Santa Rosa National Park, Costa Rica on the time they spent in patches when the subgroup size is held constant. This analysis used only the fruiting trees used by the howling monkeys. Dot size represents the number
of observations of that value.
. .. .
> -1
-2
-3 -2 -T 0 1 2 3
Patch Size of Subgroup
Fig. 3. A standardized partial regression plot which expresses the influence of the size of the patches used bygroup of the howling monkeys of Santa Rosa National Park, Costa Rica on the on the time they spent in patches when the subgroup size of the patch is held constant. This analysis uses used only the fruiting ptrees used by the howling monkeys. Dot size represents the number
of observations of that value.
significant only when trees with a DBH greater than 60 cm were used
(log transformed >60 cm R2=0.103, P=0.135, <60 cm DBH
E -2
Size of Subgroup
ig. 4. A standardized partial regression plot which exprees the influence of than 60 cm DBHsize of the subgroup of the howling monkeys. Trees with a DBHNational Park, Costa Rica on the time they spent in patches when the sizefor 20.5 of the patch s held constant. This analysis usesd and 36.5%only the fruiting pathese occurred by the howing mone sample period. Similar to howlers,ents the number
~depletion ~of patches by spider monkeys was a function of that valuetype of
significant only when trees with a DBH greater than 60 cm were used
(log transformed >60 cm R2=0.103, P=0.135, <60 cm DBH R2 = 0.408, P = 0.001). This suggests that trees larger than 60 cm DBH were not depleted by spider monkeys. Trees with a DBH larger than 60 cm only accounted for 20.5% of the patches that spiders visited and 36.5% of these occurred in one sample period. Similar to howlers, the depletion of patches by spider monkeys was a function of the type of
patch they used. When spiders fed on leaves, the time they spent in a
patch could not be predicted by its size and the size of the subgroup using

110 COLIN CHAPMAN
it (log transformed leaves R2 = 0.052, P= 0.389). However, when
spiders fed in fruit or flower patches the multiple regressions were highly significant (flowers R2 = 0.705, P = 0.007, log of time in a patch = 0.53 + 1.60 log patch size - 0.37 log subgroup size, fruit R2 = 0.448, P = 0.001, log of time in a patch = 1.08 + 1.13 log of patch size - 0.27 log subgroup size).
The question of when patches are depleted can be asked for each tree
species that the spiders used by examining if the time a subgroup spends in a patch can be predicted from the tree's size and the subgroup's size.
However, since many of the trees the spiders used were found at a low
density, there was little variation in the size of the patch for many tree
species, and thus the number of tree species for which this multiple regression can be examined is small. The time that spiders spent in Sloanea terniflora (R2 =0.554, P=0.030, n=10), Bursera simaruba
(R2 = 0.455, P = 0.011, n = 23), and Muntingia calabura trees (R2 = 0.391, P = 0.020, n = 17) was related to the size of the tree and subgroup size, but for Ficus spp. (R2=0.121, P=0.216, n= 17) and Dipterodendron costaricensis (R2 = 0.009, P= 0.480, n= 12) that relationship was not
significant.
Discussion
For both species, an increase in the time spent travelling associated with
membership in large subgroups corresponded closely to an increase in
feeding time. That suggests that animals may attempt to obtain a cons- tant amount of energy after varying expenditures are accounted for.
Large subgroups may spend more energy on travel, but ingest more over the course of the day, so that the energy gained minus the energy expended is the same regardless of subgroup size. If these primates attempt to reach a certain net energy level every day, both the amount of food in a patch and the distance between patches, could set the optimal group size to maximize feeding efficiency.
I used the multiple regression equation of feeding time in a patch versus patch size and the number of individuals using the patch, and set
patch size to the average, to calculate the expected feeding time of
subgroups of different sizes (for howlers only fruit patches were used). This procedure simulates the effect of repeatedly adding members to a
feeding subgroup and reveals that the effect on feeding time of adding an additional member is greater for small subgroups than for large subgroups (Fig. 5). This trend could result from an exponential increase

PATCH USE AND PATCH DEPLETION
2 24* Spider 120 Howler
e 20- 100-
= c 16- \ 80-
; 12- 60-
- 8- 40-
. 4- 20-
0 i I i i 0 - 0 10 20 30 40 0 10 20 30 40
Subgroup Size
Fig. 5. For the spider and howling monkeys of Santa Rosa National Park, Costa Rica the effect on expected feeding time of adding group members to a subgroup was simulated by using a multiple regression equation of feeding time versus the patch size and
the size of the subgroup and setting patch size to the average.
in interference as subgroup size increases. KLEIN (1972) observed that when a spider monkey subgroup fed in a tree, all members were
dispersed evenly throughout the canopy, and when one member moved to a different location, the other members tended to move to maintain equal spacing. This cost of repeatedly maintaining personal space would increase dramatically in a large subgroup. Thus, in larger subgroups where interference is high, animals would not deplete the patches as
rapidly as they would if there was no interference, for they repeatedly spend time avoiding conspecifics that would otherwise be spent eating. This tendency would result in the group staying in the patch longer than predicted based on the size of the patch. A number of researchers have found a relationship between the level of aggression and the size of the
patch. WASER (1977) found increased aggression in small patches as the size of mangabey groups increased. Similarly, KLEIN & KLEIN (1977) found an increase in aggression when spider monkeys fed in small trees, and CHIVERS (1977) observed the same relationship with siamangs. SUSSMAN & RICHARD (1974) found that lemurs were aggressive when food
occurred in limited areas. However, for the spider monkeys of Santa Rosa there was no relationship between agonistic behaviour and patch size (Spearman Rank Correlation, rs =0.112, P=0.210).
By substituting the average patch size and subgroup size into the same
regression equation, the average feeding time can be calculated. Subse-
quently, the effect of different patch sizes on the expected feeding gain
111
112 COLIN CHAPMAN
Spider 110- 12-
90- A 9- B
.X 70- / 6- 6
a 50f- .3-
30- 0-
10 -3-
-10 -6 i 30 6o 0 9'0 120 150 180 6 0 2'0 3b 40 50
Patch Size with# of Subgroup Size with
IndividualsConstant Patch Size Constant
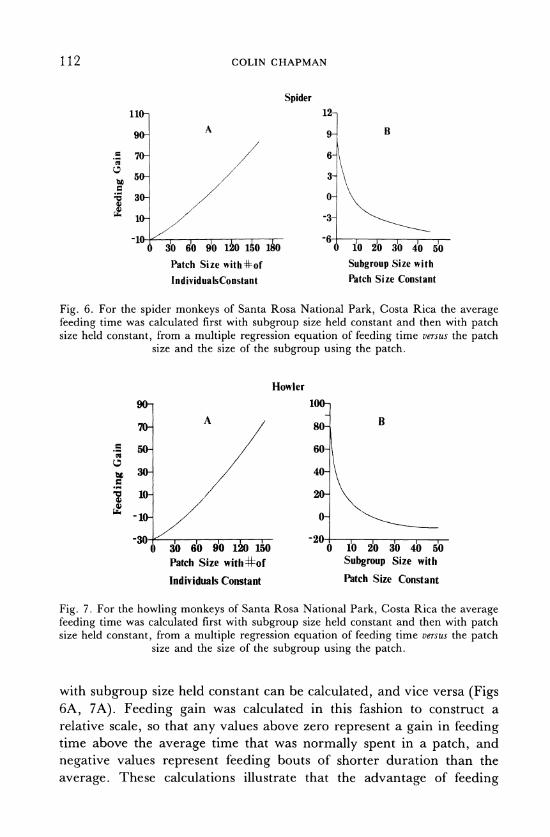
Fig. 6. For the spider monkeys of Santa Rosa National Park, Costa Rica the average feeding time was calculated first with subgroup size held constant and then with patch size held constant, from a multiple regression equation of feeding time versus the patch
size and the size of the subgroup using the patch.
Howler
90- 10-
70- A
80 B
50- ' 60-
30- 40- \
10- / 20-
-30 -20 60 30 60 90120150 0 10 20 30 40 50
Patch Size withzof Subgroup Size with
Individuals Constant Patch Size Constant
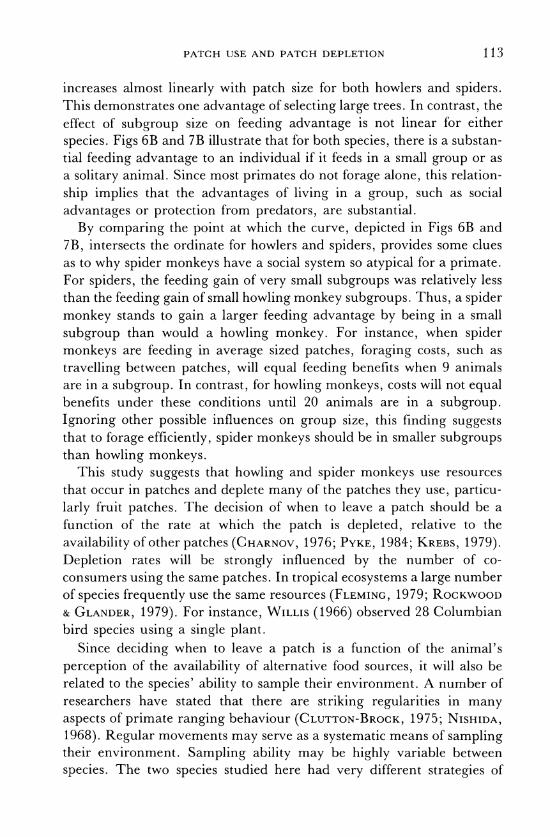
Fig. 7. For the howling monkeys of Santa Rosa National Park, Costa Rica the average feeding time was calculated first with subgroup size held constant and then with patch size held constant, from a multiple regression equation of feeding time versus the patch
size and the size of the subgroup using the patch.
with subgroup size held constant can be calculated, and vice versa (Figs 6A, 7A). Feeding gain was calculated in this fashion to construct a relative scale, so that any values above zero represent a gain in feeding time above the average time that was normally spent in a patch, and
negative values represent feeding bouts of shorter duration than the
average. These calculations illustrate that the advantage of feeding
PATCH USE AND PATCH DEPLETION 113
increases almost linearly with patch size for both howlers and spiders. This demonstrates one advantage of selecting large trees. In contrast, the effect of subgroup size on feeding advantage is not linear for either
species. Figs 6B and 7B illustrate that for both species, there is a substan- tial feeding advantage to an individual if it feeds in a small group or as a solitary animal. Since most primates do not forage alone, this relation-
ship implies that the advantages of living in a group, such as social
advantages or protection from predators, are substantial.
By comparing the point at which the curve, depicted in Figs 6B and 7B, intersects the ordinate for howlers and spiders, provides some clues as to why spider monkeys have a social system so atypical for a primate. For spiders, the feeding gain of very small subgroups was relatively less than the feeding gain of small howling monkey subgroups. Thus, a spider monkey stands to gain a larger feeding advantage by being in a small
subgroup than would a howling monkey. For instance, when spider monkeys are feeding in average sized patches, foraging costs, such as
travelling between patches, will equal feeding benefits when 9 animals are in a subgroup. In contrast, for howling monkeys, costs will not equal benefits under these conditions until 20 animals are in a subgroup. Ignoring other possible influences on group size, this finding suggests that to forage efficiently, spider monkeys should be in smaller subgroups than howling monkeys.
This study suggests that howling and spider monkeys use resources that occur in patches and deplete many of the patches they use, particu- larly fruit patches. The decision of when to leave a patch should be a function of the rate at which the patch is depleted, relative to the
availability of other patches (CHARNOV, 1976; PYKE, 1984; KREBS, 1979).
Depletion rates will be strongly influenced by the number of co- consumers using the same patches. In tropical ecosystems a large number of species frequently use the same resources (FLEMING, 1979; ROCKWOOD & GLANDER, 1979). For instance, WILLIS (1966) observed 28 Columbian
bird species using a single plant. Since deciding when to leave a patch is a function of the animal's
perception of the availability of alternative food sources, it will also be related to the species' ability to sample their environment. A number of researchers have stated that there are striking regularities in many aspects of primate ranging behaviour (CLUTTON-BROCK, 1975; NISHIDA,
1968). Regular movements may serve as a systematic means of sampling their environment. Sampling ability may be highly variable between
species. The two species studied here had very different strategies of

114 COLIN CHAPMAN
sampling. The spider monkeys used resources that appeared relatively ephemeral in comparison to the howlers. The longer day ranges of the
spiders may represent their attempt to sample the environment. Also, the
sleeping trees of the spider monkeys, which were used at night by the
subgroups that had been foraging separately throughout the day, may serve as "information centers" as proposed by WARD & ZAHAVI (1973) for colonial birds. Since the evidence presented suggest that these
primates generally deplete the patches they use, and since the patches they use are relatively discrete and easily located, they may prove to be
good subjects for the investigation of sampling behaviour.
Summary Patch depletion is an assumption that underlies many behavioural ecological models, yet it has rarely been examined. The evidence presented here suggests that the spider and howling monkeys of Santa Rosa National Park, Costa Rica use food resources that occur in patches and generally deplete the patches they use. However, some types of patches (e.g. large fruiting trees for spider monkeys, and trees used as sources of leaves for howlers) are not depleted by the feeding activity of primates. An examination of which types of patches are depleted and the manner in which depletion likely occurs, allows an assessment of possible factors underlying the different types of social organizations in these species.
References
ALTMANN, J. (1974). Observational study of behavior: sampling methods. - Behaviour 49, p. 227-267.
ALTMANN, S. (1974). Baboons, space, time, and energy. - Amer. Zool. 14, p. 221-248. BEAUCHAMP, J. J. & OLSON, J. S. (1973). Corrections for bias in regression estimates after
logarithmic transformations. - Ecology 54, p. 1403-1407. BONOFF, M. B. & JANZEN, D. H. (1980). Small terrestrial rodents in eleven habitats in
Santa Rosa National Park, Costa Rica. - Brenesia 17, p. 163-174. BRADBURY, J. W. & VEHRENCAMP, S. (1976a). Social organization and foraging in
emballonurid bats. I. Field studies. - Behav. Ecol. Sociobiol. 1, p. 337-381. -- & -- (1976b). Idem. II. A model for the determination of group size. - Behav.
Ecol. Sociobiol. 1, p. 383-404. - & -- (1977). Idem. III. Mating systems. - Behav. Ecol. Sociobiol. 2, p. 1-17.
CANT,J. G. H. & TEMERIN, L. A. (1984). A conceptual approach to foraging adaptations in primates. - In: Adaptations for foraging in nonhuman primates (RODMAN, P. S. & CANT, J. G. H., eds), p. 304-342. Columbia University Press, New York.
CARACO, T. & WOLF, L. L. (1975). Ecological determinants of groups size in foraging lions. - Am. Nat. 109, p. 343-352.
CARPENTER, C. R. (1965). The howlers of Barro Colorado Island. - In: Primate behaviour: Field studies of monkeys and apes (I. DEVORE, ed.), p. 250-291. Holt, New York, pp. 250-291.
CHARNOV, E. L. (1976). Optimal foraging: the marginal value theory. - Theor. Pop. Biol. 9, p. 129-136.
CHIVERS, D. J. (1969). On the daily behavior and spacing of howling monkey groups. - Folia Primatol. 10, p. 48-102.

PATCH USE AND PATCH DEPLETION 115
-- (1977). The feeding of siamang (Synphalangus syndactylus). - In: Primate ecology (T. H. CLUTTON-BROCK ed.). Academic Press, p. 355-382. New York.
CLUTTON-BROCK, T. H. (1975). Ranging behaviour of red colobus (Colobus badius tephrosceles) in the Gombe National Park. - Anim. Behav. 23, p. 706-722.
COELHO, A. M., COELHO, L. S., BRAMBLETT, C. A., BRAMBLETT, S. S. & QUICK, L. B.
(1976). Ecology, population characteristics, and sympatric association in primates: a socio-bioenergetic analysis of howler and spider monkeys in Tikal, Guatemala. Yearbook. Phys. Anthro. 20, p. 95-135.
COLWELL, R. E. (1974). Predictability, constancy and contingency in periodic phenomena. - Ecology 55, p. 1148-1153.
ESTRADA, A. (1984). Resource use by the howler monkeys (Alouatta palliata) in the rain forest of Los Tuxtlas, Veracruz, Mexico. - Int. J. Primatol. 5, p. 105-131.
FLEMING, T. H. (1979). Do tropical frugivores compete for food? - Amer. Zool. 19, p. 1157-1172.
GLANDER, K. E. (1980). Reproduction and population growth in free-ranging mantled
howling monkeys. - Amer. J. Phys. Anthro. 53, p. 25-36. HASSELL, M. P. & SOUTHWOOD, T. R. E. (1978). Foraging strategies of insects. - Ann.
Rev. Ecol. Syst. 9, p. 75-98. HORN, H. S. (1968). The adaptive significance of colonial nesting in the Brewer's
blackbird (Euphagus cyanocephalus). - Ecology 49, p. 682-694.
JANZEN, D. H. (1986). Guanacaste National Park: Tropical ecological and cultural restoration. - Editorial Univ. Estatal a Distancia, Costa Rica.
KLEIN, L. L. (1972). The ecology and social organization of the spider monkeys (Ateles belzebuth). - Unpublished Ph.D. Dissertation. Univ. of California, Berkely.
- & KLEIN, D. J. (1975). Social and ecological contrasts between four taxa of
neotropical primates. - In: Socio-ecology and psychology of primates (R. H. TUT- TLE ed.), p. 59-85. Mouton, Hague.
- & -- (1977). Feeding behaviour of the Columbian spider monkey. - In: Primate
ecology (T. H. CLUTTON-BROCK ed.), p. 153-181. Academic Press, New York.
KREBS, J. R. (1979). Foraging strategies and their social significance. - In: Handbook of behavioural neurobiology (P. MARLER & J. G. VANDENBERGH eds), p. 225-270. Plenum Press, New York.
LEIGHTON, M. (1982). Fruit resources and patterns of feeding, spacing and grouping among sympatric Bornean hornbills (Bucerotidae). - Ph.D. Dissertation. Univ. of
California, Davis. -- & LEIGHTON, D. R. (1982). The relationship of size of feeding aggregate to size of
food patch: howler monkeys (Alouatta palliata) feeding in Trichilia cipo fruit trees on Barro Colorado Island. - Biotrop. 14, p. 81-90.
McDIARMID, R. W., RICKLEFS, R. E. & FOSTER, M. S. (1977). Dispersal of Stemmadenia donnell-smithii (Apocynaceae) by birds. - Biotrop. 9, p. 9-25.
MILLAR, D. M. (1984). Reducing transformation bias in curve fitting. - Amer. Stat.
38, p. 124-126. MILTON, K. (1980). The foraging strategy of howler monkeys. - Columbia University
Press, New York. NISHIDA, T. (1968). The social group of wild chimpanzees in the Mahali Mountains. -
Primates 9, p. 167-224. PIELOU, E. C. (1969). An introduction to mathematical ecology. - Wiley, New York. PYKE, G. H. (1984). Optimal foraging theory: a critical review. - Ann. Rev. Ecol. Syst.
15, p. 523-576. ROCKWOOD, L. L. & GLANDER, K. E. (1979). Howling monkeys and leaf cutting ants:
comparative foraging in a tropical deciduous forest. - Biotrop. 11, p. 1-10. SCHAIK, C. P. VAN, NOORDWIJK, M. A. VAN, BOER, J. R. DE & TONKELAAR, I. DEN (1983).
The effect of group size on time budgets and social behaviour in wild long-tailed macaques (Macacafascicularis). - Behav. Ecol. Sociobiol. 13, p. 173-181.

116 COLIN CHAPMAN
SMITH, C. C. (1977). Feeding behaviour and social organization in howling monkeys. -In: Primate ecology (T. H. CLUTTON-BROCK ed.), p. 97-126. Academic Press,
London. STACEY, P. B. (1986). Group size and foraging efficiency in yellow baboons. - Behav.
Ecol. Sociobiol. 18, p. 175-187. STRUHSAKER, T. T. (1978). Food habits of five monkey species in the Kibale forest
Uganda. - In: Recen advances in primatology (D. J. CHIVERS &J. HERBERT eds), p. 225-248. Academic Press, New York.
SUSSMAN, R. W. & RICHARD, A. (1974). The role of aggression among diurnal prosi- mians. - In: Primate aggression, territoriality, and xenophobia. A comparative perspective (R. HOLLOWAY ed.), p. 49-76. Academic Press, New York.
TERBORGH, J. (1983). Five new world primates. A study in comparative ecology. - Princeton University Press, Princeton.
WARD, P. & ZAHAVI, A. (1973). The importance of certain assemblages of birds as "infor- mation centers" for food finding. - Ibis 115, p. 517-534.
WARNER, R. R. (1980). The coevolution of behaviour and life-history characteristics. - In: Sociobiology: Beyond nature/nuture (G. W. BARLOW & S. SILVERBERG eds), p. 151-187. Westview Press, Boulder.
WASER, P. M. (1977). Feeding, ranging and group size in the mangabey (Cercocebus albigena). - In: Primate ecology (T. H. CLUTTON-BROCK ed.), p. 183-222. Academic Press, New York.
WILLIS, E. 0. (1966). Competitive exclusion and birds feeding in trees in Western Col- umbia. - Auk 83, p. 479-480.
Copyright © 2022 FDOKUMEN