Midvaal Local Municipality 1 - National Treasury. MFMA
406
Midvaal Local Municipality 1
-
Upload
khangminh22 -
Category
Documents
-
view
0 -
download
0
Transcript of Midvaal Local Municipality 1 - National Treasury. MFMA

Midvaal Local Municipality 1

Midvaal Local Municipality 2
CONTENTS
CHAPTER 1 – MAYOR’S FOREWORD AND EXECUTIVE SUMMARY ................................................ 7
COMPONENT A: MAYOR’S FOREWORD .......................................................................................... 7
COMPONENT B: EXECUTIVE SUMMARY ....................................................................................... 15
1.1. MUNICIPAL MANAGER’S OVERVIEW ............................................................................... 15
1.2. MUNICIPAL FUNCTIONS, POPULATION AND ENVIRONMENTAL OVERVIEW .............. 21
1.3. SERVICE DELIVERY OVERVIEW ....................................................................................... 27
1.4. FINANCIAL HEALTH OVERVIEW........................................................................................ 30
1.5. ORGANISATIONAL DEVELOPMENT OVERVIEW ............................................................. 36
1.6. AUDITOR GENERAL REPORT ............................................................................................ 36
1.7. STATUTORY ANNUAL REPORT PROCESS ...................................................................... 37
CHAPTER 2 – GOVERNANCE ............................................................................................................. 39
COMPONENT A: POLITICAL AND ADMINISTRATIVE GOVERNANCE ......................................... 41
2.1 POLITICAL GOVERNANCE ................................................................................................. 41
2.2 ADMINISTRATIVE GOVERNANCE ..................................................................................... 51
COMPONENT B: INTERGOVERNMENTAL RELATIONS ................................................................ 55
2.2 INTERGOVERNMENTAL RELATIONS ............................................................................... 55
COMPONENT C: PUBLIC ACCOUNTABILITY AND PARTICIPATION ............................................ 63
2.4 PUBLIC MEETINGS ............................................................................................................. 63
2.5 IDP PARTICIPATION AND ALIGNMENT ............................................................................. 69
COMPONENT D: CORPORATE GOVERNANCE ............................................................................. 70
2.6 RISK MANAGEMENT ........................................................................................................... 70
2.7 ANTI-CORRUPTION AND FRAUD ...................................................................................... 71
2.8 SUPPLY CHAIN MANAGEMENT(SCM) .............................................................................. 72
2.9 BY-LAWS .............................................................................................................................. 73
WEBSITES .................................................................................................................................... 74
2.11 PUBLIC SATISFACTION ON MUNICIPAL SERVICES ....................................................... 75
CHAPTER 3 – SERVICE DELIVERY PERFORMANCE (PERFORMANCE REPORT PART I) .......... 77
COMPONENT A: BASIC SERVICES ................................................................................................. 77
3.1. WATER PROVISION ............................................................................................................ 77
3.2 WASTE WATER (SANITATION) PROVISION ..................................................................... 83
Midvaal Local Municipality 3
3.3 ELECTRICITY ....................................................................................................................... 88
3.4 WASTE MANAGEMENT (THIS SECTION TO INCLUDE: REFUSE COLLECTIONS, WASTE
DISPOSAL, STREET CLEANING AND RECYCLING) ................................................................ 93
3.5 HOUSING ........................................................................................................................... 100
3.6 FREE BASIC SERVICES AND INDIGENT SUPPORT ...................................................... 102
COMPONENT B: ROAD TRANSPORT ........................................................................................... 106
3.7 ROADS ............................................................................................................................... 106
3.8 TRANSPORT (INCLUDING VEHICLE LICENSING & PUBLIC BUS OPERATION) ......... 111
3.9 WASTE WATER (STORMWATER DRAINAGE) ................................................................ 111
COMPONENT C: PLANNING AND DEVELOPMENT ..................................................................... 114
3.10 PLANNING .......................................................................................................................... 115
3.11 LOCAL ECONOMIC DEVELOPMENT (INCLUDING TOURISM AND MARKET PLACES)117
COMPONENT D: COMMUNITY & SOCIAL SERVICES ................................................................. 121
3.12 LIBRARIES; ARCHIVES; MUSEUMS; GALLERIES; COMMUNITY FACILITIES; OTHER
(THEATRES, ZOOS, ETC) ......................................................................................................... 121
3.13 CEMETORIES AND CREMATORIUMS ............................................................................. 125
3.14 CHILD CARE; AGED CARE; SOCIAL PROGRAMMES .................................................... 127
COMPONENT E: ENVIRONMENTAL PROTECTION ..................................................................... 129
3.15 POLLUTION CONTROL ..................................................................................................... 129
3.16 BIO-DIVERSITY; LANDSCAPE (INCL. OPEN SPACES); AND OTHER ........................... 132
COMPONENT F: HEALTH ............................................................................................................... 134
3.17 CLINICS .............................................................................................................................. 134
3.18 AMBULANCE SERVICES .................................................................................................. 137
3.19 HEALTH INSPECTION; FOOD AND ABBATOIR LICENSING AND INSPECTION; ETC 137
COMPONENT G: SECURITY AND SAFETY ................................................................................... 141
3.20 POLICE ............................................................................................................................... 141
3.21 FIRE .................................................................................................................................... 145
3.22 OTHER (DISASTER MANAGEMENT, ANIMAL LICENsING AND CONTROL, CONTROL OF
PUBLIC NUISANCES AND OTHER) .......................................................................................... 149
COMPONENT H: SPORT AND RECREATION ............................................................................... 151
3.23 SPORT AND RECREATION .............................................................................................. 151

Midvaal Local Municipality 4
COMPONENT I: CORPORATE POLICY OFFICES AND OTHER SERVICES ............................... 153
3.24 EXECUTIVE AND COUNCIL .............................................................................................. 154
3.25 FINANCIAL SERVICES ...................................................................................................... 155
3.26 HUMAN RESOURCE SERVICES ...................................................................................... 159
3.26 HUMAN RESOURCE SERVICES ...................................................................................... 160
3.27 INFORMATION AND COMMUNICATION TECHNOLOGY (ICT) SERVICES ................... 162
3.28 PROPERTY; LEGAL; RISK MANAGEMENT AND PROCUREMENT SERVICES ............ 165
COMPONENT J: MISCELLANEOUS ............................................................................................... 167
COMPONENT K: ORGANISATIONAL PERFOMANCE SCORECARD .......................................... 167
CHAPTER 4 – ORGANISATIONAL DEVELOPMENT PERFORMANCE ............................................ 169
(PERFORMANCE REPORT PART II) ................................................................................................. 169
COMPONENT A: INTRODUCTION TO THE MUNICIPAL PERSONNEL ....................................... 169
4.1 EMPLOYEE TOTALS, TURNOVER AND VACANCIES .................................................... 169
COMPONENT B: MANAGING THE MUNICIPAL WORKFORCE ................................................... 171
4.2 POLICIES ............................................................................................................................ 174
4.3 INJURIES, SICKNESS AND SUSPENSIONS .................................................................... 175
4.4 PERFORMANCE REWARDS ............................................................................................. 178
COMPONENT C: CAPACITATING THE MUNICIPAL WORKFORCE ............................................ 179
4.5 SKILLS DEVELOPMENT AND TRAINING ......................................................................... 181
COMPONENT D: MANAGING THE WORKFORCE EXPENDITURE ............................................. 183
4.6 EMPLOYEE EXPENDITURE .............................................................................................. 183
CHAPTER 5 – FINANCIAL PERFORMANCE .................................................................................... 186
COMPONENT A: STATEMENTS OF FINANCIAL PERFORMANCE .............................................. 186
5.1 STATEMENTS OF FINANCIAL PERFORMANCE ............................................................. 188
5.2 GRANTS ............................................................................................................................. 190
5.3 ASSET MANAGEMENT ..................................................................................................... 191
5.4 FINANCIAL RATIOS BASED ON KEY PERFORMANCE INDICATORS .......................... 194
COMPONENT B: SPENDING AGAINST CAPITAL BUDGET ......................................................... 198
5.5 CAPITAL EXPENDITURE’ .................................................................................................. 199
5.6 SOURCES OF FINANCE ................................................................................................... 199

Midvaal Local Municipality 5
5.7 CAPITAL SPENDING ON 5 LARGEST PROJECTS .......................................................... 201
5.8 BASIC SERVICE AND INFRASTRUCTURE BACKLOGS – OVERVIEW ......................... 202
COMPONENT C: CASH FLOW MANAGEMENT AND INVESTMENTS ......................................... 204
5.9 CASH FLOW ....................................................................................................................... 205
5.10 BORROWING AND INVESTMENTS .................................................................................. 206
5.11 PUBLIC PRIVATE PARTNERSHIPS ................................................................................. 210
COMPONENT D: OTHER FINANCIAL MATTERS .......................................................................... 210
5.12 SUPPLY CHAIN MANAGEMENT ....................................................................................... 210
5.13 GRAP COMPLIANCE ......................................................................................................... 210
CHAPTER 6 – AUDITOR GENERAL AUDIT FINDINGS.................................................................... 211
COMPONENT A: AUDITOR-GENERAL OPINION OF FINANCIAL STATEMENTS 2012/13 ......... 211
6.1 AUDITOR GENERAL REPORTS Year -1 (Previous year) ................................................... 211
COMPONENT B: AUDITOR-GENERAL OPINION 2013/14 ............................................................ 213
6.2 AUDITOR GENERAL REPORT 2013/14 .............................................................................. 213
GLOSSARY ......................................................................................................................................... 220
APPENDICES ...................................................................................................................................... 223
APPENDIX A – COUNCILLORS; COMMITTEE ALLOCATION AND COUNCIL ATTENDANCE ... 223
APPENDIX B – COMMITTEES AND COMMITTEE PURPOSES .......................................................... 225
APPENDIX C –THIRD TIER ADMINISTRATIVE STRUCTURE ............................................................ 226
APPENDIX D – FUNCTIONS OF MUNICIPALITY / ENTITY ................................................................. 227
APPENDIX E – WARD REPORTING ......................................................................................................... 228
APPENDIX F – WARD INFORMATION ..................................................................................................... 231
APPENDIX G – RECOMMENDATIONS OF THE MUNICIPAL AUDIT COMMITTEE YEAR 0 ........ 236
APPENDIX H – LONG TERM CONTRACTS AND PUBLIC PRIVATE PARTNERSHIPS ................. 239
APPENDIX I – MUNICIPAL ENTITY/ SERVICE PROVIDER PERFORMANCE SCHEDULE .......... 240
APPENDIX J – DISCLOSURES OF FINANCIAL INTERESTS .............................................................. 241
APPENDIX K: REVENUE COLLECTION PERFORMANCE BY VOTE AND BY SOURCE ............. 245
APPENDIX K (i): REVENUE COLLECTION PERFORMANCE BY VOTE ........................................... 245

Midvaal Local Municipality 6
APPENDIX K (ii): REVENUE COLLECTION PERFORMANCE BY SOURCE .................................... 246
APPENDIX L: CONDITIONAL GRANTS RECEIVED: EXCLUDING MIG ........................................... 247
APPENDIX M: CAPITAL EXPENDITURE – NEW & UPGRADE/RENEWAL PROGRAMMES ....... 248
APPENDIX M (i): CAPITAL EXPENDITURE - NEW ASSETS PROGRAMME ................................... 248
APPENDIX M (ii): CAPITAL EXPENDITURE – UPGRADE/RENEWAL PROGRAMME ................... 250
APPENDIX N – CAPITAL PROGRAMME BY PROJECT 2013/14 ........................................................ 252
APPENDIX O – CAPITAL PROGRAMME BY PROJECT BY WARD YEAR 0 .................................... 256
APPENDIX P – SERVICE CONNECTION BACKLOGS AT SCHOOLS AND CLINICS ..................... 257
APPENDIX Q – SERVICE BACKLOGS EXPERIENCED BY THE COMMUNITY WHERE ANOTHER SPHERE OF GOVERNMENT IS RESPONSIBLE FOR SERVICE PROVISION ................................ 258
APPENDIX R – DECLARATION OF LOANS AND GRANTS MADE BY THE MUNICIPALITY ........ 259
APPENDIX S – NATIONAL AND PROVINCIAL OUTCOMES FOR LOCAL GOVERNMENT .......... 260
APPENDIX T – ANNUAL PERFORMANCE REPORT 2013/2104 ……………………………………264
VOLUME II: ANNUAL FINANCIAL STATEMENTS ................................................................................ 344
Midvaal Local Municipality 7
CHAPTER 1 – MAYOR’S FOREWORD AND EXECUTIVE SUMMARY
COMPONENT A: MAYOR’S FOREWORD
MAYOR’S FOREWORD
Executive Mayor Cllr. Bongani Baloyi a. Vision: MIDVAAL LOCAL MUNICIPALITY “VISION” STATEMENT
MIDVAAL WILL BE RENOWNED FOR ROBUST ECONOMIC GROWTH AND A HIGH QUALITY OF LIFE FOR ALL. PRINCIPLES OF THE VISION: The Vision is a reflection of:
A Municipality that “Works”
o Well Governed and Managed o Financially Viable and Sustainable o Open, Transparent and Accountable o Accessible, Responsive and Caring o Efficient, Effective and Capable o Creating a Conducive Environment for Growth
A Southern Focal Point as the fastest Growing and Developing Municipality
o Sustainable Delivery of Quality, Affordable Services, including Free Basic Services o An Integrated and Diverse Economy that Provides Opportunities for All o Integrated Spatial Planning that Promotes Economic and Social Inclusion o Well Planned and Controlled Environment

Midvaal Local Municipality 8
A Place to Be
o High Quality of Life o Universal Access to Basic Services o Energy Efficient and Environmentally Conscious o Sustainable and Integrated Communities o Safe and Secure Environment
MIDVAAL LOCAL MUNICIPALITY “MISSION” STATEMENT WE STRIVE TO ENHANCE AND SUSTAIN THE QUALITY OF LIFE IN OUR URBAN AND RURAL AREAS, PROMOTING AN OPEN OPPORTUNITY SOCIETY FOR ALL THAT WILL RESULT IN ROBUST ECONOMIC GROWTH. MISSION’S GOALS: Our Mission responds to the objectives of government as stipulated in Section 152 of the Constitution. Improving and sustaining the “Quality of Life” in urban and rural areas forms the core of our mission, which will manifest itself through an efficient, effective and capable Municipality that delivers quality affordable services to all. Our transparent and accountable culture will create a conducive environment for economic growth and an open opportunity society. STRATEGIC FOCUS AREAS In terms of the Gauteng Growth and Development Strategy, Midvaal is aligned to all of the focus areas. The Midvaal IDP document reflects alignment to National and Provincial KPA’s, with the Midvaal IDP focussing specifically on Outcome 9 from the National Government’s 12 Outcomes: “A responsive, accountable, effective and efficient local government system”. The 7 Outputs of Outcome 9 are directed at local government, and through its KPA’s, Midvaal attempts to address these 9 Outputs, which include a differentiated approach to municipal financing, planning and support (link to KPA 5), Implementation of the Community Work Programme (link to KPA 3), Improving access to basic services (link to KPA 4), Deepen democracy through a refined Ward Committee model(link to KPA 1) etc. MIDVAAL’S KEY PERFORMANCE AREAS: KPA 1: Governance and Stakeholder: Participation To promote proper governance and public participation. KPA 2: Safety and Environment: To contribute to the safety of communities in Midvaal through the pro‐active identification, prevention, mitigation and management of environmental health, fire and disaster risks. KPA 3: Social and Community Development: To assist and facilitate with the development and empowerment of the poor and the most vulnerable. These include the elderly, youth and disabled. KPA 4: Institutional Transformation: To provide an effective and efficient workforce by aligning our institutional arrangements to our overall strategy in order to deliver quality services.
Midvaal Local Municipality 9
KPA 5: Financial Sustainability: To ensure the financial sustainability of the municipality in order and to adhere to statutory requirements. KPA 6: Physical Infrastructure and Energy Efficiency: To ensure efficient infrastructure and energy supply that will contribute to the improvement of quality of life for all citizens within Midvaal. KPA 7: Services and Customer Care to improve our public relations thereby pledging that our customers are serviced with dignity and care. KPA 8: Economic Growth and Development: To facilitate sustainable economic empowerment for all communities within Midvaal and enabling a viable and conducive economic environment through the development of related initiatives including job creation and skills development. To ensure that these Strategic Objectives as stipulated in the IDP are being met, Midvaal has implemented various actions designed to facilitate their implementation:
A Disability Desk was created at the Social Services Department to ensure that KPA 3 could be met, as without a dedicated and skilled resource to address the needs of that community, Midvaal was struggling to adequately assist them. One employee will now handle all concerns from the disabled community, liaise with the Social Services Department to better meet their needs, and also offer counselling services.
A capital spending committee was appointed to assist in meeting KPAs 3, 5 and 6. The role of this committee will be to oversee capital expenditure, and to take a more pro-active approach to controlling the budget, so that planning and reporting becomes more efficient. The committee should ensure that the capital budget is spent as soon as it becomes available, rather than several months later, as used to be the case in the past.
A single implementing agent (Thembalethu) has been hired to oversee the running of the CWP
programme. In the past, there were various challenges relating to the implementation of the CWP, not least of which was the fact that various implementing agents existed from national, provincial and local level. By appointing a single agent, there has been more cohesion and coordination, and the scope of the programme should increase in the coming financial year in order to meet the target of 1000 employees at local level.
A large proportion of the capital budget was allocated to addressing the Sewer and Waste
Water Treatment Systems around Midvaal to meet KPAs 6 and 8, as low capacity is affecting potential for expansion.
Midvaal has introduced an electronic billing system which is faster, cheaper and
environmentally friendly compared to the old postal system. This is part of the drive to meet KPAs 5 and 7. The website and facebook page are also used as additional platforms to provide better services, as they allow for instant distribution of public notices, and an avenue for residents to lodge queries or complaints. In addition, Council has a formal complaints system, which is monitored by the Executive on a weekly basis.

Midvaal Local Municipality 10
DEMOCRATIC ALLIANCE MANIFESTO (DA):
VISION:
“AN OPEN OPPORTUNITY SOCIETY FOR ALL.”
“By ‘open’, we mean a society in which people have the right to be themselves and follow their own path in life. An open society is founded on a bill of rights, the rule of law, democratic decision making, transparency, accountability and tolerance. In an open society, independent institutions protect you from power abuse, the media is free and civil society is independent.”
“By ‘opportunity’, we mean a society in which people are given the means to use their rights and improve their circumstances so that they can live lives they value. The state recognises its duty to do for people what they cannot be expected to do for themselves. We believe this includes creating opportunities for redress. We cannot, and do not, ignore the legacy of apartheid. At the same time, we believe every citizen must take responsibility for using the opportunities provided.”
“By ‘for all’, we mean a society which truly belongs to all who live in it, in which all South Africans – regardless of the colour of their skin or the circumstances of their upbringing – have the same rights and access to the opportunities that they need to improve their lives. In a society for all, redress of past discrimination is essential, and is aimed at those who still suffer the effects of that discrimination.” REDUCING POVERTY THROUGH GROWTH AND JOBS There is no opportunity like a job opportunity. A job is a passport out of poverty and opens a pathway to prosperity. That is why job creation is the DA‟s number one priority wherever it governs. The DA understands that jobs can only be created sustainably through a growing economy. When international companies start businesses in our towns and cities, they create jobs. And when local entrepreneurs start up their own businesses, whether large, medium, small or micro, they create jobs. Our role in government – whether at national, provincial or local level – is to create an environment that attracts people with skills and capital, and enables them to start or expand their businesses.
ENSURING CLEAN AND TRANSPARENT GOVERNMENT
Governments that create an enabling environment for growth and job creation are clean governments. They understand that corruption chases away investment. They know that corruption makes poor people poorer.
ENSURING EFFICIENT AND EFFECTIVE GOVERNMENT
Clean and corruption-free government is essential to create the conditions for economic growth, but it is not enough. Efficient financial management is crucial for collecting revenue and spending money effectively.
PLANNING AND REGULATING FOR GROWTH
Every city and town needs a spatial development plan that makes sustainable growth possible. And regulations are necessary to ensure orderly living. However, in order to overcome poverty by creating growth and jobs, planning regimes must seek to encourage investment while taking into account the need to protect the environment and fund service delivery. Reasonable regulations must be administered efficiently and quickly, with as little hassle as possible.

Midvaal Local Municipality 11
BUILDING AND MAINTAINING INFRASTRUCTURE
Job-creating economic growth cannot happen without the right infrastructure in the right places. No one invests in a town or city where the lights go out, toilets don’t flush and taps run dry. Well-maintained roads are vital for the transport of goods and people. Reliable and affordable public transport connects people to economic opportunities. An efficient telecommunications network helps businesses to communicate with their customers, and people to communicate with each other. Government-owned assets should be used to attract investment, development and skills. MAKING GOVERNMENT ACCESSIBLE
Accountable governments understand the importance of making it easier, not harder, for people and businesses to interact with government. Stonewalling officials, complicated bureaucratic processes and endless red tape all hinder growth and job creation. BUILDING STRATEGIC PARTNERSHIPS
If municipalities are to play their part in boosting growth and creating jobs, they cannot work in a vacuum. Working with strategic partners in the public and private sectors is crucial for developing best practice, co-ordinating policies and reducing costs.
USING RESOURCES SUSTAINABILITY
If growth is not environmentally sustainable, it will grind to a halt. This is why the DA is paying special attention to the Green Economy, particularly renewable energy, water-management and pollution reduction.
BUILDING HUMAN SETTLEMENTS
Everybody has the right to decent shelter. And everybody should be afforded the opportunity to live in a place with access to schools, social amenities, commercial activity and transport links. The DA is committed to creating human settlements, not just providing low cost housing.
FIGHTING CRIME
Rampant crime robs people of their right to live without fear. High crime rates are impediments to growth and job creation. Local governments have an important role to play in fighting crime and improving the quality of life through policing relevant by-laws. A good traffic department can help the South African Police Services reduce crime and assist provincial traffic officials to improve safety on our roads. Municipalities also have a vital role to play in eradicating the social decay that leads to crime by drafting and implementing appropriate by–laws.
DELIVERING SERVICES FOR ALL
Very often, the poorest of our people are unable to take advantage of the rights and freedoms enshrined in the Constitution. The DA believes it is government’s moral duty to combat poverty by ensuring everyone has access to the basic and social services they need to improve their lives, including those who cannot afford to pay for them.

Midvaal Local Municipality 12
b. Key Policy Developments:
This is based on Strategic alignment to the Provincial Growth and Development Strategy, and the IDP strategies included in the IDP especially with focus on impact and outcome achieved – bearing in mind that foreword provides details that should be included in the chapters to follow.
c. Key Service Delivery Improvements:
430 additional housing units approved for Sicelo with construction that began in November 2013 – Two show houses already built.
With the approval of Savanna City, Midvaal will see an additional 18 444 houses constructed over the next 12 years in what will be a flagship integrated housing development. Work in Progress throughout 2014.
Phase 4 of the upgrade to Meyerton CBD has been completed
Extension and upgrade of the Kookrus Cemetery has been completed.
The upgrading of intersections on Mimosa and Verwoerd Roads respectively, as well as the rebuilding of Jan Neethling Street have all been completed, to ease peak-hour traffic.
d. Public Participation:
Public Participation in Midvaal has been improved through increasing the number of platforms where interaction can occur, and also by improving the quality of these interactions. An IDP Representative Forum was introduced in 2014, and ad hoc public meetings are called at the request of the Mayor or MMC’s. The entire Mayoral Committee and Heads of Department attended public meetings such as Budget or IDP meetings to ensure that the relevant decision-makers could speak directly to the community, understand their queries and address some of their concerns. The following are public participation activities:
14 Ward Committees (all are functional and meet on a quarterly basis as per programme).
People’s Assembly annually. The People’s Assembly will be referred to as the State of the Municipality Address (SOMA) in future (from the 2015/16 Budget).
Budget and IDP meetings.
Annual IDP Representative Forum
Annual Business Breakfast
Quarterly Newsletter.
Calls for input through notices and advertisements in newspapers and on the Municipal website, in compliance with Municipal Systems Act. ]
Meetings with relevant stakeholders and affected groups (e.g. business, media, community organisations, etc.).
Suggestion box in Rates Hall.

Midvaal Local Municipality 13
e. Future Actions:
Construction on the Lakeside Library is complete, and R1.2 million which will go into Phase 2 of the Lakeside library; this money will be used for furniture and IT infrastructure. The Library is expected to be operational by late 2014. Work on phase one of the Lakeside Sports Centre has begun, and roads in the surrounding area will be paved during the 2014/2015 financial year. The Council has committed themselves to constructing a well designed and resourced centre that will become the community’s pride similar to those constructed in Bantu Bonke and Sicelo.
In the Meyerton Waste Water Treatment Works upgrade, the contractor should be working on site in September 2014. Construction period is expected to take two years, and this upgrade is of key importance for business expansion in Midvaal.
The Valley Settlements Reservoir is well into its planning phase and construction is expected to begin mid-2015. The reservoir will not only cater for the increased demand for industrial land along the R59 but also for the planned housing developments in Sicelo and Meyerton Farms.
For the Daleside sewer network expansion, tenders are being evaluated and the contractor will be on site in September 2014. This will involve an upgrade to the Pump Station and sewers in the portion between Adelaar & Visarend. Provision will be made to complete the project in 2016/17.
The preliminary designs for the Kidson Weir in Henley-on-Klip have been completed; once the Water Use Licence is approved, demolition of the bridge will begin. Upgrading of the water supply to Henley on Klip is expected to be complete in October 2014.
The Gravel to Paving Project in 2014/15 will focus on Wards 8 and 10, where there is the greatest need for road improvements.
Sicelo Football Field will be completed by October 2014, as well as the outdoor gym.
The Sicelo Reservoir and Main is a long term project which involves the construction of a new 10 mega litre reservoir and bulk water mains. In terms of Bulk Sewer Connections to Sicelo, work was done the Nyala Street and Joos Williamson Street sections in 2013/14. Further work will be done in 2014/15 in Joos Williamson Street. This project is linked to the Upgrading of Sicelo sewers in that the two projects will allow the development of additional housing in the greater Sicelo area.
Four electricity sub-stations will be upgraded to improve security of supply. These projects will improve the availability of electricity which will allow for additional housing and development in Midvaal. A project for the provision of electricity to stands 78 and 204 to electrify the homes to be constructed in those areas of Sicelo is also in planning.
The two most important projects for the coming years will be the development of housing for the residents of Mamello & Sicelo. A new Mamello Township has been approved which will accommodate approximately 550 households and eliminate the current informal settlement. The main issue that must be resolved is the sourcing of adequate funding for the installation of bulk and internal electricity services. The rollout of the Sicelo Development is receiving attention.

Midvaal Local Municipality 14
A public participation process is currently underway regarding the renaming of Verwoerd Road to
Pierneef Boulevard and Les Maximes Street to L J Malia Street.
f. Agreements / Partnerships: Announcements on special partnerships initiated.
Partnership with Province in respect of future Housing development earmarked for Mamello. Partnership with Province, Basil Read and Old Mutual regarding future envisaged Savanna
City Housing Development. Partnership / funding agreement with DWA (Department of Water Affairs) for the Southern
Regional Sanitation Scheme is being used for the upgrading of the Meyerton Waste Water Treatment Works
g. Conclusion:
Public Participation has been the key behind everything we do as a Council. Through our budget meetings, IDP meetings, People’s Assembly and inaugural IDP Representative Forum, our team has interacted with communities to understand their concerns, and decide how to lay our path for the coming financial years in a way that will best meet the needs of the people we serve. Our IDP objectives and Medium Term Expenditure Framework clearly reflect Midvaal’s commitment to keep service delivery at the heart of everything we do. Midvaal has made huge strides in service delivery levels and development objectives over the fourteen years of its existence, and aims to increase this success each year.
Executive Mayor Cllr. B. Baloyi T 1.0.1
Midvaal Local Municipality 15
COMPONENT B: EXECUTIVE SUMMARY
1.1. MUNICIPAL MANAGER’S OVERVIEW
MUNICIPAL MANAGER’S OVERVIEW
The 2013/14 Annual Report represents the first time that Midvaal Local Municipality has adopted an electronic Performance Management System. The negative opinion expressed by the Auditor General for the period 2012/13 necessitated the re-development of the Performance Management System, as well as compliance with the requirements of the Annual Report (Section 46 of Systems Act). The focus for the year under review has shifted to focus on the implementation of strategies and policies which were developed during 2012/13. The focus was towards the implementation of the “IDP” and ensuring that these strategies as contained in the various chapters are consolidated into action which was performance measured.
Mr. ASA De Klerk Municipal Manager The slowdown in the economy necessitated that the further curtailment of cost was maintained throughout the year. The delay in the regional sanitation project has forced the Municipality to review the timelines for some of the bigger developments in the jurisdiction of the Meyerton outfall works. There were also several results which indicated that Midvaal Local Municipality still remains a top performing municipality. The municipality gave access to water to 98.2% of its community and is able to assist in local economic development projects that maintain the unemployment rate at below 12% in Midvaal The fire fighters in Midvaal competed at National level in Cape Town and our team was able to finish within the top 10 teams. This department, although not as big as those against whom they competed, through resilience and dedication was able to compete against the best of the best in the country. This spirit is evident in the service delivery over the majority of services delivered to the communities in Midvaal. The Municipality has shared services with neighbouring Emfuleni and Sedibeng Municipalities. The services shared with Emfuleni relate to water, sewer and electricity for Ward 2 residents. The service from Sedibeng is IT related and includes staff seconded in terms of a service level agreement. Due to capacity constraints at ERWAT, the cross border service agreement with the Ekurhuleni Metropolitan Municipality could not be implemented yet. RISK MANAGEMENT The Risk Management Policy of Midvaal Local Municipality was updated and approved by Council on 30 January 2014 per item C1035/01/2014. The Strategic Risk Register is fully aligned to the IDP and SDBIP of the Municipality and all the objectives of the IDP are addressed. A functional Risk Committee (technical) has been established and is chaired by the Deputy Chief Financial Officer/Chief Risk Officer. The Risk Committee consists of Risk Management Co-ordinators which are senior personnel in each Department in the Municipality.

Midvaal Local Municipality 16
The role of the co-ordinators is to:
Co-ordinate risk management activities within functional areas in the municipality; Assist in embedding risk management within the municipality Arrange and facilitate risk meetings, presentations and workshops involving staff within the
functional area; Providing risk management training and development where required; Assist in collating and reporting on risk information; and Provide guidance on matters relating to risk management
This Committee ensures that risks are relevant and it keeps the Operational Risks Registers up to date. Status Quo reports are submitted to the Risk Management Committee (oversight) on a quarterly basis highlighting the various risks facing the municipality. The Risk Management Committee is attended by the Chairperson of the Audit Committee. Quarterly Reports are submitted to Council on the progress on management of strategic and operational risks. Risk Management is audited for completeness and effectiveness on an annual basis. The Five Top Strategic risks are:
1. Inadequate provision of housing
2. Water pollution from urban and industrial run-off
3. Insufficient municipal capacity (retainment of skilled employees due to municipal grading)
4. Collapse of IT infrastructure due to inadequate and outdated IT Systems
5. Non-compliance with legislation (licenced landfill site).
Midvaal Local Municipality’s (MLM) risk Maturity Level is 4 on a scale of 1 to 6. The average level is 3. It is our firm intention to progress to a level 5 maturity as soon as circumstances and resources allow. To this end risk tolerance parameters have been established for all categories of risk. Management of risk is subjected to close monitoring to ensure prudent risk taking. Risk management is to be an inherent aspect in our control environment on the way forward.
Financial Sustainability Financial sustainability remains one of the highest priorities of the municipality. During the year a lot of attention was given to financial sustainability and, amongst others, the following were done:
- Compilation of a funding plan to determine both source and application of funding. This policy now informs the compilation and funding of the budget to ensure appropriate tariff setting.
- Compilation and implementation of a cost curtailment plan. This plan was based on guidance provided by the National Treasury and resulted in savings on the operational budget of Council. The cost curtailment plan mainly targeted the general cost category and a saving of more than 15% against the budget was achieved.

Midvaal Local Municipality 17
- Compilation and implementation of a cash management plan. This cash management plan
led to the highest closing cash balance over the last four financial years. The liquidity ratio was 1,75:1 as at 30 June 2014.
- Compilation and implementation of revenue enhancement strategy. MFMA Circular 64 describes revenue management as a “routine financial management function” and in municipal terms, effective revenue management means that all consumers are billed correctly for all services received and all properties owners are levied the correct property rates in accordance with the Local Government Municipal Systems Act, 2000 (Act 32 of 2000) and Municipal Property Rates Act, 2004, respectively. Revenue, as a product of service delivery and the municipal valuation roll, is dependent on the extent and use of land and services provided, as well as on the municipality’s ability to accurately and comprehensively identify, record and manage all its revenue sources. As part of this strategy, all customer accounts were tested against actual billing data. Anomalies found were corrected and back-billing was processed.
Analysis of financial position as at 30 June 2014
Statement of Financial Performance for the year ended 30 June 2014
The municipality had a surplus of R7.2m for the year under review. The surpluses for the last two financial years are as a result of specific accounting requirements. During the 2012/2013 financial year infrastructure of R55m was recognised as revenue which led to an accounting surplus. During the 2013/2014 financial year, the benefits for the payment of post-retirement benefits were amended which led to a credit of R34m being processed to the salary cost to reduce the provision. It is anticipated that the next few financial years will again have significant accounting deficits. The deficits are driven by the depreciation cost which are currently not factored into the setting of tariffs. The municipality has started with the phasing in of the inclusion of depreciation in the tariff setting process which will both lead to reduced deficits and improved asset management as funding will become
Midvaal Local Municipality 18
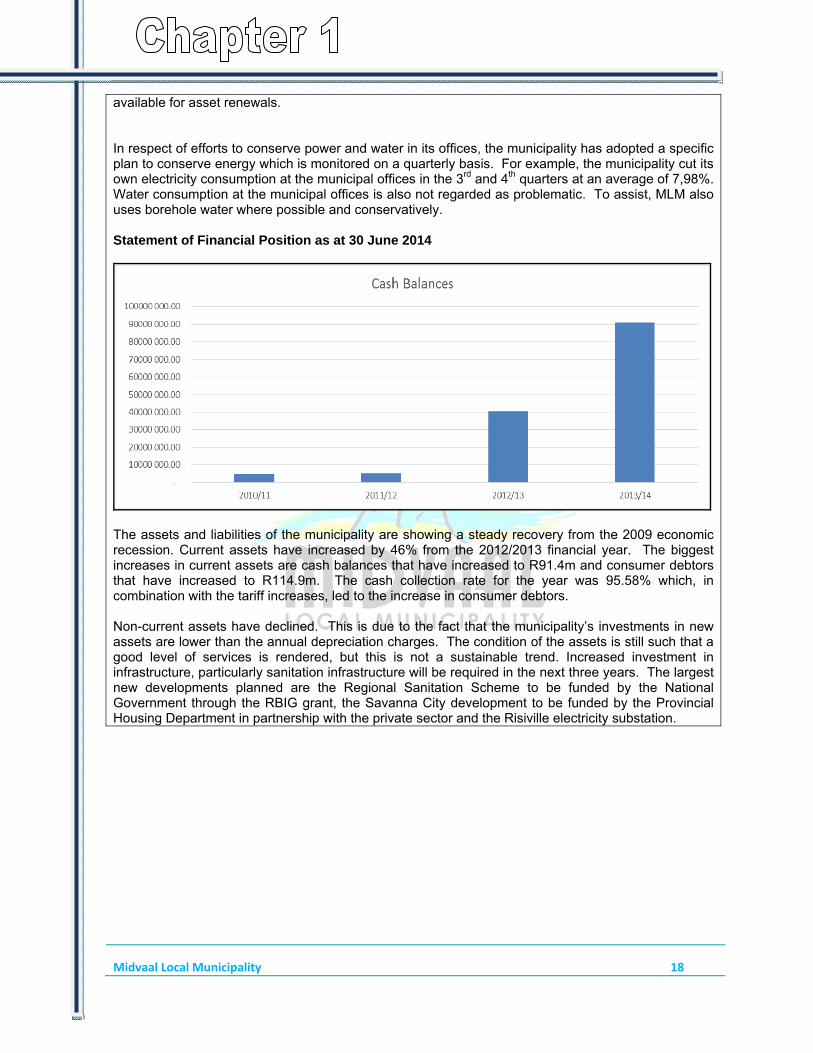
available for asset renewals. In respect of efforts to conserve power and water in its offices, the municipality has adopted a specific plan to conserve energy which is monitored on a quarterly basis. For example, the municipality cut its own electricity consumption at the municipal offices in the 3rd and 4th quarters at an average of 7,98%. Water consumption at the municipal offices is also not regarded as problematic. To assist, MLM also uses borehole water where possible and conservatively. Statement of Financial Position as at 30 June 2014
The assets and liabilities of the municipality are showing a steady recovery from the 2009 economic recession. Current assets have increased by 46% from the 2012/2013 financial year. The biggest increases in current assets are cash balances that have increased to R91.4m and consumer debtors that have increased to R114.9m. The cash collection rate for the year was 95.58% which, in combination with the tariff increases, led to the increase in consumer debtors. Non-current assets have declined. This is due to the fact that the municipality’s investments in new assets are lower than the annual depreciation charges. The condition of the assets is still such that a good level of services is rendered, but this is not a sustainable trend. Increased investment in infrastructure, particularly sanitation infrastructure will be required in the next three years. The largest new developments planned are the Regional Sanitation Scheme to be funded by the National Government through the RBIG grant, the Savanna City development to be funded by the Provincial Housing Department in partnership with the private sector and the Risiville electricity substation.

Midvaal Local Municipality 19
The repairs and maintenance budget of the municipality is also not in line with the National Treasury norm of 8% of the asset values. This is being addressed through higher than inflation tariff increases in the 2014/2015 financial year and a corresponding increase in the maintenance cost. The protection of the municipality’s asset base is regarded as a high priority as it is both the base of our service delivery mandate as well as our revenue base. Current liabilities have increased by 25% due to increases received from our service providers, and, in addition to the normal inflationary increases, the municipality recognised a liability towards Eskom for a billing error made by them in 2008 which led to an amount of R17m to be paid to Eskom. This amount is being paid over 36 month’s interest free. Non-current liabilities increased by 2%, which is made up of an increase of 38% on external loans and a decrease of 87% in the provision for post-retirement benefits. Council approved an R80 million loan for infrastructure during the 2011/2012 financial year and R60m of this loan was drawn during the 2013/2014 financial year. Of this amount, R37 million was unspent as at 30 June 2014 and will be spent in the next two years. Lease agreements were also entered into for the financing of movable assets. The provision for post-retirement benefits was significantly reduced after Council resolved to adopt the SALGA HR working group’s recommendations on the provision of post-retirement benefits only to employees who were already aged 55 on the 1st January 2004. General key performance indicators The Local Government Municipal Systems Act, 2000 (Act 32 of 2000) prescribes certain general key performance indicators to be included in the performance management system. The results of these ratio’s are as follows:

Midvaal Local Municipality 20
Section Indicator 2013 2014 10(a) Percentage of households with access to basic level
of:
water 91% 98% sanitation 78% 82% electricity 79% 80% solid waste 84% 89% 10(b) Percentage of households earning less than R1 100
per month with access to free basic services Note: The 100% refers to number of households who have registered as indigents (earning less than R3 500 per month) and are entitled to free basic services.
100% 100%
10(c) Percentage of a municipality’s capital budget actually spent on capital projects identified for a particular financial year in terms of the municipality’s integrated development plan
86% 89%
10(d) Number of jobs created through municipality’s local economic development initiatives including capital projects
145 871
10(e) Number of people from employment equity target groups employed in the three highest levels of management in compliance with a municipality’s approved employment equity plan
4 1
10(f) Percentage of a municipality’s budget actually spent on implementing its workplace skills plan
80.5% 81%
10(g) Financial Viability Debt Coverage 22 16 Total (net) outstanding service debtors to
revenue 20 22
Cost Coverage 0.94 2 Audit Opinion
Midvaal has an excellent record of achieving unqualified audits. Since the establishment of the Midvaal Local Municipality in 2000, the municipality had two qualified audit opinions with unqualified audits in the other 11 years. In an effort to achieve a clean audit, an Operation Clean Audit (OPCA) Plan was compiled with an OPCA task team monitoring its implementation, chaired by the Accounting Officer. The municipality achieved a Clean Audit in the 2013/2014 year.
The municipality had 45 audit findings during the 2012/2013 audit, of which 14 related to IT matters, 13 to the audit of pre-determined objectives, 17 to the financial audit and 1 to the IDP. Of the 45 findings, only 9 impacted on the audit report. By the end of the financial year, all these findings had been resolved and there were no repeat findings carried over to the 2013/2014 audit.
As an illustration of the improvement in audit outcomes, it can be mentioned that the AG raised 52 issues in the 2012 management letter, in 2013 it reduced to 45 and in 2014 it further reduced to only 16. In my brief overview I have touched on some of the achievements and challenges facing the Municipality. The rest of the Annual Report deals in detail with the departments and individual performance of these departments within Council.

Midvaal Local Municipality 21
Finally I wish to thank the Executive Mayor and Mayoral Committee Members, Councillors and Heads of Department and all other staff members for making Midvaal Local Municipality a top performer.
T 1.1.1
1.2. MUNICIPAL FUNCTIONS, POPULATION AND ENVIRONMENTAL OVERVIEW
INTRODUCTION TO BACKGROUND DATA In this Chapter it is evident that the Midvaal Local Municipality has succeeded in enhancing the quality of life of all its citizens, through the improved delivery of basic services in both the urban and rural areas. Working hand in glove with other service providers such as Eskom and Rand Water, the Midvaal Local Municipality has further reduced service delivery back logs. The Council also provides other support services such as refuse removal, health facilities, cemeteries, libraries, parks and sports facilities.
The built environment is enhanced through the rapid service delivery by the Land use and the building control sections through reduced turnaround times in approving land use and building applications. The housing backlog has been identified and the Midvaal Local Municipality has facilitated the initiation of new projects to reduce the housing backlogs. The housing projects are planned to be established in a phased approached.
Population The Midvaal Local Municipality has a total population of 95,300 (Source StatsSA: 2011 Census). The total population grew from 52,679 in 1996 to 95,300 in 2011, according to the 1996 and 2011 census data. The year on year growth for the total population for this period was 2.78%. The Black or African population grew at a rate of 3.5% and the White or European population grew by 1.46%. Sectoral Analysis • Primary Sector The primary sector of the economy consists of the agricultural and mining sectors. Mining
contributes 0.3% whilst agriculture contributes 1.34% to the Midvaal GVA. The contribution by agriculture towards the GVA is minor, but plays a major role in the provision of food security and the creation of employment for unskilled and semi-skilled workers. It is with this in mind
Midvaal Local Municipality 22
that Midvaal has recognised the potential that the agricultural sector could contribute and therefore adopted an agricultural policy to protect agricultural land (food security).
• Secondary Sector The secondary sector of the economy consists of manufacturing, electricity generation and construction. The manufacturing sector grown to become the largest contributor to the Midvaal Local Municipality”s GVA, which contributes 24,06% overall. The Midvaal Local Municipality recognised the potential of this sector and therefore adopted the R59 Strategic Framework to promote the R59 Development Corridor. • Tertiary Sector
The tertiary sector is basically the services sector as well as the governmental sector which contributes 61,59% to the GVA of the Midvaal Local Municipality. T 1.2.1
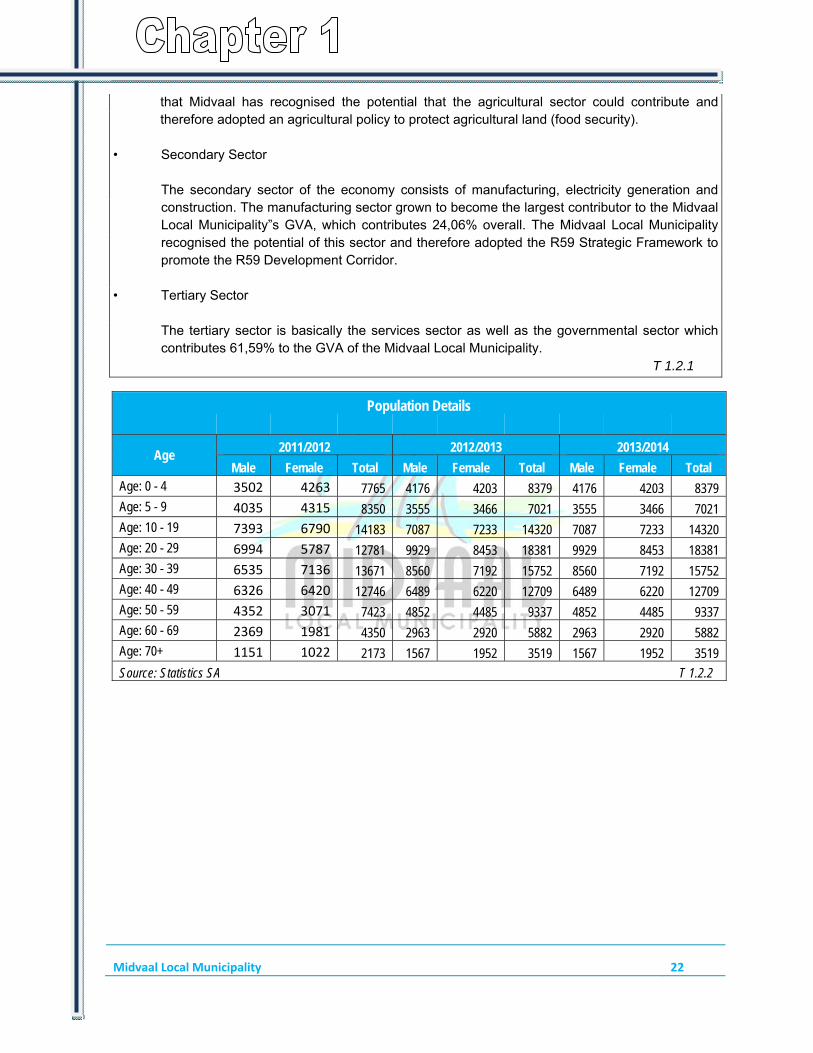
Population Details
Age 2011/2012 2012/2013 2013/2014
Male Female Total Male Female Total Male Female Total Age: 0 - 4 3502 4263 7765 4176 4203 8379 4176 4203 8379 Age: 5 - 9 4035 4315 8350 3555 3466 7021 3555 3466 7021 Age: 10 - 19 7393 6790 14183 7087 7233 14320 7087 7233 14320 Age: 20 - 29 6994 5787 12781 9929 8453 18381 9929 8453 18381 Age: 30 - 39 6535 7136 13671 8560 7192 15752 8560 7192 15752 Age: 40 - 49 6326 6420 12746 6489 6220 12709 6489 6220 12709 Age: 50 - 59 4352 3071 7423 4852 4485 9337 4852 4485 9337 Age: 60 - 69 2369 1981 4350 2963 2920 5882 2963 2920 5882 Age: 70+ 1151 1022 2173 1567 1952 3519 1567 1952 3519
Source: Statistics SA T 1.2.2

Midvaal Local Municipality 23
T1.2.3
Year Housing Backlog as
proportion of current demand
Unemployment Rate
Proportion of Households
with no Income
Proportion of Population in
Low-skilled Employment
HIV/AIDS Prevalence
Illiterate people
older than 14 years
2011/12 100% 19% 15% 12%
2012/13 100% 19% 15% 4%
2013/14 100% 19% 15% 4%
Socio Economic Status
T 1.2.4
* see note
*Note: The statistical information on these matters are not available at the date of compilation of
this draft Annual Report. It is however foreseen that the figures may be obtained by the date of approval of the final Annual Report in March 2015.

Midvaal Local Municipality 24
T 1.2.5

Midvaal Local Municipality 25
Neighbourhoods within Midvaal Local Municipality
Settlement Type Households Population
Towns
Vaal Marina SP 231 402
Noldick 183 531
Highbury 201 558
Klipw ater 177 639
Meyerton Ext 6 201 696
De Deur Estate 216 702
Ohenimuri 219 744
Balmoral Estate 234 768
Kookrus 378 1266
Riversdale 384 1383
Daleside 630 2076
Rothdene 594 2106
Meyerton South 663 2223
Golf Park 768 2472
Meyerton Central 1074 3339
Risiville 1170 3858
Henley on Klip 1596 5010
Lakeside 2787 9231
Meyerton Park 3264 11145
(Source STATSSA 2011 Census) Sub-Total 14970 49149
Townships
Not applicable 0
Sub-Total 0 0
Rural settlements
Risiville 54 150
Kliprivier 66 168
Rietspruit AH 63 210
Pendale AH 87 228
Van Der Westhuizen AH 78 240
Green Valley AH 69 243
Klipview AH SP 84 285
Ironside AH 114 309
Voster Park AH 105 324
Harveston AH 120 336
Schoongezicht AH 102 339
Sherman Park AH 93 375
McKay Estate 129 384
Koolfontein AH 105 390
Garthdale AH 111 396
Goedehoop AH 168 477
Hartzenberg AH 180 510
Midvaal Local Municipality 26
Gardenvale AH 150 516
Henley on Klip 168 522
Glen Donald AH 183 600
Golf View AH 192 630
Valley Settlements AH 267 675
Tedderfield AH 240 720
Ophir AH 201 786
Walkerville AH 291 810
Nooitgedacht AH 249 879
Drumblade AH 300 966
Bolton Wold AH 276 975
Homelands AH 321 984
Buyscelia AH 300 1023
Blignautsrus AH 390 1050
Nelsonia AH 276 1065
Mooilande AH 354 1086
Elandsfontein AH 429 1122
Riversdale 339 1146
De Deur Estate 381 1533
Homestead AH 573 1713
Walker Fruit Farms AH 747 2151
Midvaal NU 888 2913
Midvaal NU Farms 1873 8167
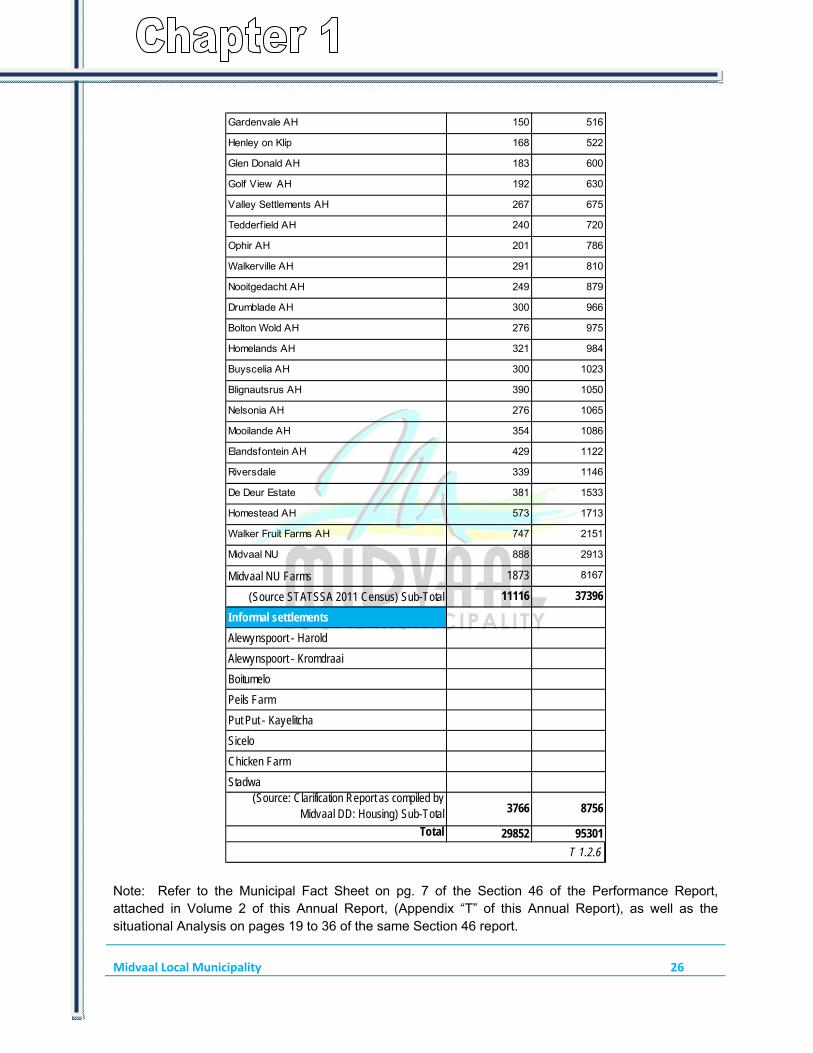
(Source STATSSA 2011 Census) Sub-Total 11116 37396
Informal settlements
Alewynspoort - Harold
Alewynspoort - Kromdraai
Boitumelo
Peils Farm
Put Put - Kayelitcha
Sicelo
Chicken Farm
Stadwa(Source: Clarification Report as compiled by
Midvaal DD: Housing) Sub-Total 3766 8756
Total 29852 95301
T 1.2.6 Note: Refer to the Municipal Fact Sheet on pg. 7 of the Section 46 of the Performance Report, attached in Volume 2 of this Annual Report, (Appendix “T” of this Annual Report), as well as the situational Analysis on pages 19 to 36 of the same Section 46 report.

Midvaal Local Municipality 27
Major Natural Resource Relevance to Community
Dolomite Active mine at Glen Douglas, Artisans programme and employer of several Midvaal residents
Coal Coal and other mineral deposits in the eastern part of Midvaaland adjoining municipalities. Environmental risk, negative impacton Midvaal infrastructure, limited employment potential
Nature Suikerbosrand
Water Klipriver, Vaal River, Vaal Dam
T 1.2.7
Natural Resources
COMMENT ON BACKGROUND DATA: The following challenges are highlighted by the above information: - Unemployment rate - Level of indigence - Growth and pressure to provide bulk infrastructure - Expansiveness of municipality and ready accessibility to all areas in quick response need to
improve quality of life of our residents In order to address the challenges, Midvaal Local Municipality has:- - EPWP, CWP and LED projects - Revised indigent policy - Reached agreements with developers to contribute to bulk infrastructure - Coordinated planning to enhance responsiveness - An effective complaints system to address concerns of residents.
T 1.2.8
1.3. SERVICE DELIVERY OVERVIEW
SERVICE DELIVERY INTRODUCTION The information on basic service delivery, achievements and challenges, including information on service delivery to indigents, are dealt with in Chapter 3. Applications for electricity connections to households only came from people who could afford it. All the requests for which payment was made were completed. Indigents in the formal housing areas were given free basic units (30kwh) if they were registered with the municipality. An application for funding of bulk supplying to Sicelo and Mamello was made. In this section, specific reference is made to Waste Management Services. The other services are addressed in chapter 3
Midvaal Local Municipality 28
BACKGROUND: WASTE MANAGEMENT Midvaal’s history with regards to waste management is not that different to the South African situation in general. The issue of waste as with most local, provincial and national departments has many facets including economic, physical, social and political. The Council provides a “boundary-to-boundary” waste management service in public areas which it is responsible for, within its geographic area of jurisdiction. Property owners, or organisations, business entities or individuals who occupy premises, are responsible for maintaining cleanliness and hygiene standards on their premises (on-site inside property boundaries), in keeping with the norms determined by applicable by-laws. All stakeholders may contract on-site waste management services at their own expense. The Council’s own services are clustered by the following categories, and the suite of services required for managing waste through an internal service mechanism include: - General waste collection services, including the transportation of waste to a transfer station, Material Recovery Facility (MRF) or drop-off site for recyclables, a special processing/treatment installation, or a disposal facility; - Cleaning/cleansing, consisting of a wide range of cleaning services for all public spaces and streets under the Council’s jurisdiction. This includes litter bin provision and servicing, street sweeping, litter picking, the clearing of illegal dumping and animal carcasses, and the cleaning of industrial pollution, waste and debris generated by natural disasters and processes; - Disposal services, which include the maintenance and operation of special processing and collection facilities, waste transfer stations and landfill sites; - Technical support services: The Council operates a fleet of vehicles that are specially equipped for the tasks of waste collection, cleaning and transportation of waste to landfill sites. A variety of support infrastructure, such as depots and workshops are required and must be provided to house and support the different functions; - General management, contract management, customer relations, information, administrative and planning support. Various services are also provided to manage and provide additional support for the operational services.
Waste Management Service Delivery
As per the Stats SA 2011 Census, the estimated 95 300 people living in MLM can be divided into 29 852 households. Households currently receiving refuse removal services total 89%, amounting to 17 531 households; of these, 6890 households receive the Free Basic Refuse Removal (FBRR) service, which represents 39.3% of households served. The Commercial and Industrial Sector is partially serviced by MLM, whereas the rest of these sectors have their own Waste Management Plans and are serviced by the private sector. The MLM currently provides services to the towns and areas in its jurisdictional area. The Municipal area has been divided into fourteen wards, numbered from 1 to 14 as indicated in the document. Service delivery for the entire MLM is coordinated from the Community Centre located in De Deur, and the operation is managed from the Galloway Depot located in Galloway Street, Meyerton.
T 1.3.1
Midvaal Local Municipality 29
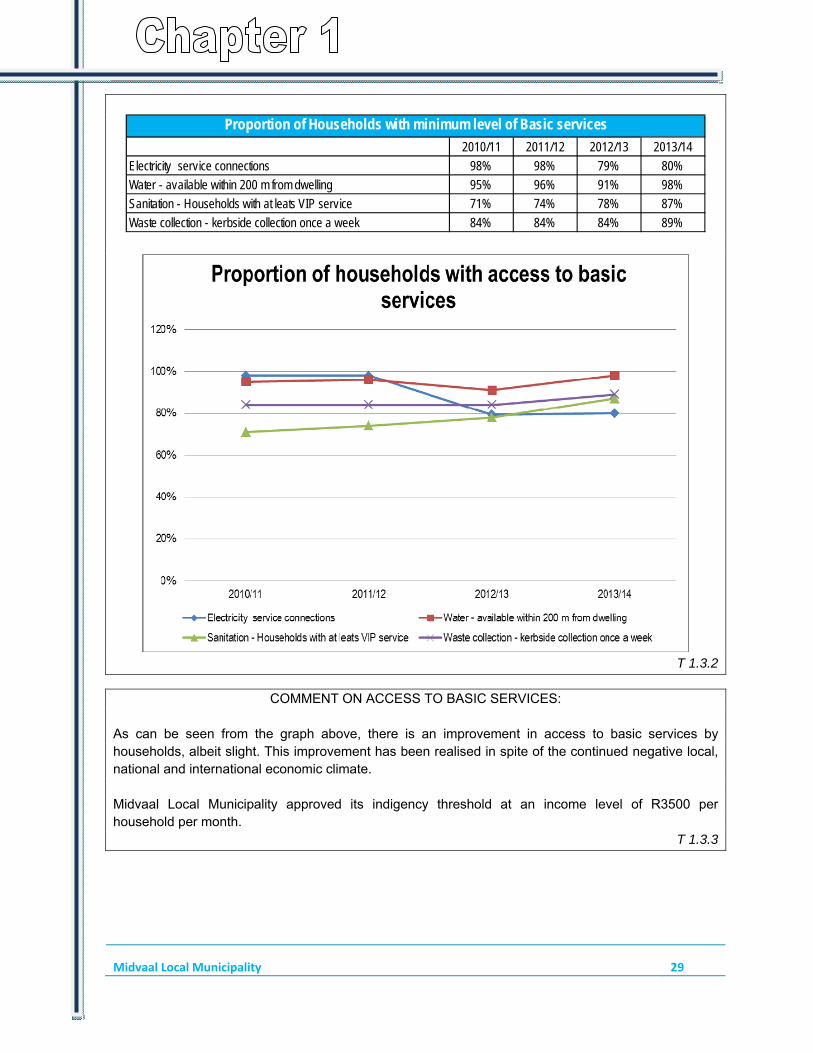
2010/11 2011/12 2012/13 2013/14
Electricity service connections 98% 98% 79% 80%
Water - available within 200 m from dwelling 95% 96% 91% 98%
Sanitation - Households with at leats VIP service 71% 74% 78% 87%
Waste collection - kerbside collection once a week 84% 84% 84% 89%
Proportion of Households with minimum level of Basic services
T 1.3.2
COMMENT ON ACCESS TO BASIC SERVICES:
As can be seen from the graph above, there is an improvement in access to basic services by households, albeit slight. This improvement has been realised in spite of the continued negative local, national and international economic climate. Midvaal Local Municipality approved its indigency threshold at an income level of R3500 per household per month.
T 1.3.3

Midvaal Local Municipality 30
1.4. FINANCIAL HEALTH OVERVIEW
FINANCIAL OVERVIEW Financial Sustainability Financial sustainability remains of the highest priorities of the municipality. During the year a lot of attention was given to financial sustainability and, amongst others, the following were done:
- Compilation of a funding plan to determine both source and application of funding sources. This policy now informs the compilation and funding of the budget to ensure appropriate tariff setting.
- Compilation and implementation of a cost curtailment plan. This plan was based on guidance provided by the National Treasury and resulted in savings on the operational budget of Council. The cost curtailment plan mainly targeted the general cost category and a saving of more than 15% against the budget was achieved.
- Compilation and implementation of a cash management plan. This cash management plan led to the highest closing cash balance over the last four financial years. The liquidity ratio was 1,75:1 as at 30 June 2014.
- Compilation and implementation of revenue enhancement strategy. MFMA Circular 64 describes revenue management as a “routine financial management function” and in municipal terms, effective revenue management means that all consumers are billed correctly for all services received and all properties owners are levied the correct property rates in accordance with the Local Government Municipal Systems Act, 2000 (Act 32 of 2000) and Municipal Property Rates Act, 2004, respectively. Revenue, as a product of service delivery and the municipal valuation roll, is dependent on the extent and use of land and services provided, as well as on the municipality’s ability to accurately and comprehensively identify, record and manage all its revenue sources. As part of this strategy, all customer accounts were tested against actual billing data. Anomalies found were corrected and back-billing was processed.
Cost Saving The Council has adopted a Cost Containment Plan and Policy. Cost containment measures were introduced in the following areas:
Facilities Hiring of plant and equipment Catering Use of council vehicles Energy savings Stationery Overtime Review of business processes to maximise efficiencies Ringfencing of trading services to better understanding funding of activities Travel and entertainment

Midvaal Local Municipality 31
Office furniture and equipment Use of telephones and internet Petrol and diesel
The implementation of these measures led to significant savings against the operating budget of Council. The general expenditure category, where most of the overhead costs are charged against, had a saving of more than 15% at the end of the financial year. Analysis of financial position as at 30 June 2014
Statement of Financial Performance for the year ended 30 June 2014
The municipality had a surplus of R7.2m for the year under review. The surpluses for the last two financial years are as a result of specific accounting requirements. During the 2012/2013 financial year infrastructure of R55m was recognised as revenue which led to an accounting surplus. During the 2013/2014 financial year, the benefits for the payment of post-retirement benefits were amended which led to a credit of R34m being processed to the salary cost to reduce the provision. It is anticipated that the next few financial years will again have significant accounting deficits. The deficits are driven by the depreciation cost which are currently not factored into the setting of tariffs. The municipality has started with the phasing in of the inclusion of depreciation in the tariff setting process which will both lead to reduced deficits and improved asset management as funding will become available for asset renewals. In respect of efforts to conserve power and water in its offices, the municipality has adopted a specific plan to conserve energy which is monitored on a quarterly basis. For example, the municipality cut its own electricity consumption at the municipal offices in the 3rd and 4th quarters at an average of 7,98%. Water consumption at the municipal offices is also not regarded as problematic. To assist, MLM also

Midvaal Local Municipality 32
uses borehole water where possible and conservatively. Statement of Financial Position as at 30 June 2014
The assets and liabilities of the municipality are showing a steady recovery from the 2009 economic recession. Current assets have increased by 46% from the 2012/2013 financial year. The biggest increases in current assets are cash balances that have increased to R91.4m and consumer debtors that have increased to R114.9m. The cash collection rate for the year was 95.58% which, in combination with the tariff increases, led to the increase in consumer debtors. Non-current assets have declined. This is due to the fact that the municipality’s investments in new assets are lower than the annual depreciation charges. The condition of the assets is still such that a good level of services is rendered, but this is not a sustainable trend. Increased investment in infrastructure, particularly sanitation infrastructure will be required in the next three years. The largest new developments planned are the Regional Sanitation Scheme to be funded by the National Government through the RBIG grant, the Savanna City development to be funded by the Provincial Housing Department in partnership with the private sector and the Risiville electricity substation.

Midvaal Local Municipality 33
The repairs and maintenance budget of the municipality is also not in line with the National Treasury norm of 8% of the asset values. This is being addressed through higher than inflation tariff increases in the 2014/2015 financial year and a corresponding increase in the maintenance cost. The protection of the municipality’s asset base is regarded as a high priority as it is both the base of our service delivery mandate as well as our revenue base. Current liabilities have increased by 25% due to increases received from our service providers, and, in addition to the normal inflationary increases, the municipality recognised a liability towards Eskom for a billing error made by them in 2008 which led to an amount of R17m to be paid to Eskom. This amount is being paid over 36 month’s interest free. Non-current liabilities increased by 2%, which is made up of an increase of 38% on external loans and a decrease of 87% in the provision for post-retirement benefits. Council approved an R80 million loan for infrastructure during the 2011/2012 financial year and R60m of this loan was drawn during the 2013/2014 financial year. Of this amount, R37 million was unspent as at 30 June 2014 and will be spent in the next two years. Lease agreements were also entered into for the financing of movable assets. The provision for post-retirement benefits was significantly reduced after Council resolved to adopt the SALGA HR working group’s recommendations on the provision of post-retirement benefits only to employees who were already aged 55 on the 1st January 2004. Audit Opinion
Midvaal has an excellent record of achieving unqualified audits. Since the establishment of the Midvaal Local Municipality in 2000, the municipality had two qualified audit opinions with unqualified audits in the other 11 years. In an effort to achieve a clean audit, an Operation Clean Audit (OPCA) Plan was compiled with an OPCA task team monitoring its implementation, chaired by the Accounting Officer. The municipality achieved a Clean Audit in the 2013/2014 year.

Midvaal Local Municipality 34
The municipality had 45 audit findings during the 2012/2013 audit, of which 14 related to IT matters, 13 to the audit of pre-determined objectives, 17 to the financial audit and 1 to the IDP. Of the 45 findings, only 9 impacted on the audit report. By the end of the financial year, all these findings had been resolved and there were no repeat findings carried over to the 2013/2014 audit.
As an illustration of the improvement in audit outcomes, it can be mentioned that the AG raised 52 issues in the 2012 management letter, in 2013 it reduced to 45 and in 2014 it further reduced to only 16. The Gauteng Provincial Government is actively involved in the monitoring of the OPCA progress and the municipality is participating in the district and provincial structures to maximize knowledge sharing and application of best practice.
T1.4.1
R' 000Details Original budget Adjustment Budget Actual
Income:Grants 155 601 107 601 104 564Taxes, Levies and tariffs 587 433 531 299 527 695Other 45 885 42 739 84 198Sub Total 738 919 681 640 716 457
Less: Expenditure (738 712) (736 073) (709 262)Net Total* 207 (54 433) 7 195
* Note: surplus/(defecit) T 1.4.2
Financial Overview: 2013/14
Detail %Employee Cost 18%Repairs & Maintenance 5%Finance Charges & Impairment 2%
T 1.4.3
Operating Ratios
COMMENT ON OPERATING RATIOS:
Employee costs are within acceptable norms. The organogram of Council is reviewed on an annual basis and only positions that are affordable are funded on the structure. The municipality has serious capacity constraints in certain function areas and additional positions have been created for the 2014/2015 financial year. Repairs and Maintenance expenditure are not at acceptable levels and as part of the multi-year budget, increased allocations will be made to repairs and maintenance. The National Treasury norm is that 8% of the carrying value of assets must be provided for as repairs and maintenance. Whilst

Midvaal Local Municipality 35
allocations for repairs and maintenance are increased on an annual basis, it is unlikely that these targets will be met over the medium term. Finance charges remains low due to the relatively low gearing level. A R80 million loan has been approved of which R60million has been drawn during the 2013/2014 year. In addition, vehicle purchases are funded using financial leases. This ratio will thus increase in future years. T 1.4.3
R'000Detail 2011/2012 2012/2013 2013/2014
Original Budget 41 524 194 730 152 467Adjustment Budget 41 781 115 281 96 907Actual 42 457 98 612 86 172
Total Capital Expenditure: 2011/12 to 2013/14
T 1.4.4
50 000
100 000
150 000
200 000
250 000
2011/2012 2012/2013 2013/2014
Total Capital Expenditure
Original Budget Adjustment Budget Actual
T 1.4.5
COMMENT ON CAPITAL EXPENDITURE:
Capital expenditure is lower than the previous financial year, primarily due to the capitalisation of infrastructure for the Eye of Africa development during the 2012/2013 financial year. These

Midvaal Local Municipality 36
infrastructure were funded by public donations. The capital budget for the 2013/2014 financial year was reduced from an original budget of R152m to an adjusted budget of R96m due to the removal of the RBIG grant of R50m. This project will be implemented by Rand Water and not Midvaal Local Municipality as originally anticipated. The municipality achieved an 89% spending level on the capital budget, but when unpacking the 11% of the budget that was not spent, it becomes evident that at least 95% of the capital projects budgeted for were implemented. Savings of more than 5% were achieved were projects were delivered within time, but below budget. This is encouraging as all departments are now implementing their projects in a most cost effective manner as opposed to spending just for the sake of chasing a 100% spending level. Projects not completed at financial year end will be carried forward to the 2014/2015 financial year for completion. All projects funded from government grants were fully implemented and no carry overs on government grants are required.
T 1.4.5.1
1.5. ORGANISATIONAL DEVELOPMENT OVERVIEW
ORGANISATIONAL DEVELOPMENT PERFORMANCE
The Municipal Structure for 2013/2014 was amended and approved by the Midvaal Local Council during 2013/2014. Midvaal Local Municipality has seen a growth of 60 employees during the 2013/2014 financial year across all departments within the Municipality.
In June 2013, there was a total number of 34 vacancies that have not been filled, primarily due to resignations and the creation of new positions after the approval of the 2013/2014 budget. T 1.5.1
1.6. AUDITOR GENERAL REPORT
AUDITOR GENERAL REPORT: 2013/14 (CURRENT YEAR)
The municipality achieved a clean audit report for the 2013/2014 financial year. The matters of emphasis raised in the audit report (additional information for the attention of the users) included the following: Contingent liabilities – the AG emphasized that the municipality is involved in litigation of which the outcome is not certain. These cases are detailed in the notes to the financial statements under the contingent liability note. Restatement of corresponding figures – the audited figures for the 2012/2013 financial year were restated due to a billing correction done by Eskom. The creditor figure for the previous financial year were thus amended. Full details are contained in the prior year adjustment note in the financial statements.

Midvaal Local Municipality 37
Material losses – the water and electricity losses of the municipality as disclosed in the material losses note are shown in the Audit Report as additional information. T 1.6.1
1.7. STATUTORY ANNUAL REPORT PROCESS No Activity Timeframe
1
Consideration of next financial year’s Budget and IDP process plan. Except for the legislative content, the process plan should confirm in-year reporting formats to ensure that reporting and monitoring feeds seamlessly into the Annual Report process at the end of the Budget/IDP implementation period
30 Aug 2014 2 Implementation and monitoring of approved Budget and IDP commences (In-year financial reporting).
3 Finalise the 4th quarter Report for previous financial year
4 Submit draft 2013/14 Annual Report to Internal Audit and Auditor-General
5 Municipal entities submit draft annual reports to MM
6 Audit/Performance committee considers draft Annual Report of municipality and entities (where relevant)
29 Aug 2014
8 Mayor tables the unaudited Annual Report
9 Municipality submits draft Annual Report including consolidated annual financial statements and performance report to Auditor General
10 Annual Performance Report as submitted to Auditor General to be provided as input to the IDP Analysis Phase
11 Auditor General audits Annual Report including consolidated Annual Financial Statements and Performance data
30 Sept – 30 Nov 2014
12 Municipalities receive and start to address the Auditor General’s comments
30 Nov 2014 13
Mayor tables Annual Report and audited Financial Statements to Council complete with the Auditor- General’s Report
14 Audited Annual Report is made public and representation is invited 15 Oversight Committee assesses Annual Report
16 Council adopts Oversight report
30 Jan 2015 17 Oversight report is made public
18 Oversight report is submitted to relevant provincial councils
19 Commencement of draft Budget/ IDP finalisation for next financial year. Annual Report and Oversight Reports to be used as input
September 2014
T 1.7.1
COMMENT ON THE ANNUAL REPORT PROCESS:
The municipality endeavours to comply with the MFMA Circular 63 dealing with the Annual Report.

Midvaal Local Municipality 38
The Municipality has implemented an electronic Performance Management System (PMS) called e-Perform to ensure that there is alignment between the IDP, Budget and Service Delivery Budget Implementation Plans (SDBIP’s) and the PMS. Planning and Monitoring of activities in achieving the municipality’s targets and objectives are thus aligned and focussed. This alignment is important in order to comply with legislation. The importance hereof is also highlighted in the Municipal Manager’s foreword.
T 1.7.1
Midvaal Local Municipality | CHAPTER 2 – GOVERNANCE 39
CHAPTER 2 – GOVERNANCE
INTRODUCTION TO GOVERNANCE
1. Sections 40 and 41 of our Constitution provide:-
“40 Government of the Republic (1) In the Republic, government is constituted as national, provincial and local spheres of government
which are distinctive, interdependent and interrelated. (2) All spheres of government must observe and adhere to the principles in this Chapter and must
conduct their activities within the parameters that the Chapter provides. 41 Principles of co-operative government and intergovernmental relations (1) All spheres of government and all organs of state within each sphere must -
(a) Preserve the peace, national unity and the indivisibility of the Republic; (b) Secure the well-being of the people of the Republic; (c) Provide effective, transparent, accountable and coherent government for the Republic as a
whole; (d) Be loyal to the Constitution, the Republic and its people; (e) Respect the constitutional status, institutions, powers and functions of government in the other
spheres; (f) Not assume any power or function except those conferred on them in terms of the
Constitution; (g) Exercise their powers and perform their functions in a manner that does not encroach on the
geographical, functional or institutional integrity of government in another sphere; and (h) Co-operate with one another in mutual trust and good faith by -
(i) Fostering friendly relations; (ii) Assisting and supporting one another; (ii) Informing one another of, and consulting one another on, matters of common interest; (iv) Coordinating their actions and legislation with one another; (v) Adhering to agreed procedures; and (vi) Avoiding legal proceedings against one another.
(2) An Act of Parliament must -
(a) establish or provide for structures and institutions to promote and facilitate intergovernmental relations; and
(b) provide for appropriate mechanisms and procedures to facilitate settlement of Intergovernmental disputes.

Midvaal Local Municipality 40
(3) An organ of state involved in an intergovernmental dispute must make every reasonable effort to settle the dispute by means of mechanisms and procedures provided for that purpose, and must exhaust all other remedies before it approaches a court to resolve the dispute.
(4) If a court is not satisfied that the requirements of subsection (3) have been met, it may refer a
dispute back to the organs of state involved.” 2. Broad Powers and functions of the municipality Section 151(2) of the Constitution: The Executive and Legislative authority of a municipality is
vested in its municipal council. Section 156(1) of the Constitution: A municipality has executive authority in respect of, and has the
right to administer –
• the local government matters listed in Part B of Schedule 4 and Part B of Schedule 5 (of the Constitution); and
• any other matter assigned to it by national or provincial legislation.
Section 156(5) of the Constitution: A municipality has the right to exercise any power concerning a
matter reasonably necessary for, or incidental to, the effective performance of its functions. 3. Governance is about “how” an organisation is run. In the running of Midvaal, a clear distinction is
made between the politically elected structure (Councillors serving on the Council which is responsible for the oversight and legislative function of the municipality, as well as those matters which it has retained as its own functions. Other elected Councillors serve as full time office bearers involved in the day-to-day running of the Municipal Council from the political perspective, namely the Executive Mayor with his Mayoral Committee and the Speaker) and the administration.
The Council is chaired by the Speaker. The executive is headed by the Executive Mayor with his Mayoral Committee of five(5) members. The structure of Council is set out in greater detail later in this chapter.
The Administration is headed by the Municipal Manager, who is also the organisation’s Accounting Officer. Powers have been delegated to the different functions within the organisation to ensure that roles, responsibilities and decision-making powers are clear and unambiguous (see the notes below).
T 2.0.1

Midvaal Local Municipality 41
COMPONENT A: POLITICAL AND ADMINISTRATIVE GOVERNANCE
INTRODUCTION TO POLITICAL AND ADMINISTRATIVE GOVERNANCE The political and administrative functions in Midvaal operate on a clearly differentiated and identified role clarification basis. The final decision-making processes are also designed to obtain and consider stakeholder inputs requests and needs within the framework of available resources
T 2.1.0
2.1 POLITICAL GOVERNANCE
INTRODUCTION TO POLITICAL GOVERNANCE Midvaal Local Municipality made extra efforts to include the Ward Committees and Councillors to the maximum of administrative functions and outputs at all levels. Any inputs or comments from the committees are reflected or accommodated in the reports pertaining to Council matters.
Ward Committees are also involved in commenting on reports, with the purpose of being kept abreast of (and in turn to inform the community with regard to) changes and developments within the municipality. This ensures a high level of public participation and promotes the principle of accountability.
A report has to follow a lengthy process to ensure all role-players are aware and supportive of the recommendations before it appears on the Council agenda.
Reports are forwarded from the meeting of the Municipal Manager and Heads of Department to the relevant Ward Councillors and Ward Committees, if applicable, who can then comment as indicated above. Thereafter the reports are submitted to the Section 80 Portfolio Committee Meeting where a full-time Councillor (MMC) chairs the meeting in collaboration with part time Councillors of Midvaal. After a report has been noted and commented on by the Section 80 Committee, it is then forwarded to the Mayoral Committee for resolution or comments according to delegated powers.
After a final resolution has been approved by either the Mayoral Committee or Council, it is captured in a resolution register which is regularly updated. The notification for implementation of the resolution is sent to the relevant role-player responsible for the execution and it is followed up. Feedback of the final resolution to the Ward Committee is the final phase of this process of community participation.
Division of Legislative and Executive Functions
In terms of Chapter 7 of the Constitution of the Republic of South Africa, the legislative and executive functions of a municipality are vested within its Municipal Council. Following the introduction of an Executive Mayoral System, Midvaal initiated the process of splitting the executive and legislative functions by delegating certain executive powers to its Executive Mayor. With the introduction of the Municipal Public Accounts and Oversight Committee (MPAC) and its implied oversight role, there has been a further implied split between the two functions. The MPAC as a structure of the legislative function (the Council) is expected to assist with oversight over the executive function (the Executive Mayor).

Midvaal Local Municipality 42
The principle of good governance requires that the legislative and oversight function that is to be exercised by a municipal council should be independent of the executive function that has been delegated to the Executive Mayor. This is to avoid undue influence and pressure being exerted by one function upon another and to allow each function the opportunity to operate freely within its delegations. It is in pursuance of the notion of having sound checks and balances in place in the governance model. The Legislative Function of Council
The legislative (and oversight) function of the Council is vested within the full Council with the Speaker as its chairperson. The passing of by-laws, policies on functions retained by Council and frameworks within which delegated powers must be exercised, remain the function of the full Council except where certain express delegations have been made in this regard.
The Speaker is also responsible for the Whippery (see below), training of Councillors (e.g. modular training, etc.), Councillor capacitation, Junior Council, specific mentorship programmes (e.g. women's mentorship programme), Ward Committees etc. The Section 79: Ethics and Disciplinary Committee To assist the Speaker with the performance of the delegated functions relating to investigating misconduct of Councillors, enforcing the Code of Conduct for Councillors and enforcing the Standing Orders of Council, a Section 79 Disciplinary and Ethics Committee was established. The Section 79: Municipal Public Accounts and Oversight Committee (MPAC), Petitions Committee and Public Place Naming Committee To assist the Council with its oversight function, a Section 79 Municipal Public Accounts and Oversight Committee (MPAC) was established with specific terms of reference. The MPAC (Municipal Public Accounts and Oversight Committee) functions as the Oversight Committee of Council in respect of the Annual Report, and its Oversight Report is submitted and published in accordance with the MFMA requirements and guidance. The MPAC is chaired by a member nominated by the official opposition to enhance the principle of having adequate checks and balances. The Petitions Committee has been established as a Section 79 Committee reporting directly to Council in terms of Council’s Petitions Policy. The Public Place Naming Committee is also a Section 79 Committee that considers and advises Council on the names for public places (such as streets, parks, etc.) or the changing of any such names.

Midvaal Local Municipality 43
Powers of and Delegations to Executive Mayor: Besides the powers and functions accorded to and imposed on the Executive Mayor in terms of legislation (e.g. the Municipal Systems Act, Municipal Finance Management Act, etc.), the executive function of the Council is delegated to the Executive Mayor as the appointed head of the executive function insofar as the Constitution and practicalities allow. The Executive Mayor is to exercise political oversight of the administration, except for the administrative unit known as "The Office of the Speaker". In executing and performing the executive functions of Council and the Municipality, the Executive Mayor is assisted by five Members of the Mayoral Committee each with a particular portfolio. The Sect 80 Committees contemplated in Annexure A constitute these specific portfolios. Whippery The Council has a Whippery which comprises the Chief Whip of Council and the Whip of the official opposition represented in Council. The Whippery mainly deals with inter-party relations, party discipline and issues of mutual interest.
Specific Programmes
Certain projects are championed by the political offices directly. Examples are the public participation processes to engage the residents in formal structures (e.g. Ward Committees, People's Assembly or State of the Municipality Address (SOMA), Petitions, etc) and less formal personal interaction (public meetings, discussions with interest groups, etc). Another example is the establishment of the Junior Council which comprises scholars from within Midvaal. The Junior Council functions well as a formalised structure and meets regularly to deliberate on issues of concern to the Youth. The Junior Council is also a mechanism to expose the scholars to governance issues. Attendance of Meetings The attendance of meetings is reflected in Appendix A.
T 2.1.1

Midvaal Local Municipality 44
POLITICAL STRUCTURE
EXECUTIVE MAYOR Cllr. B.M. Baloyi
(PR) DA
SPEAKER Cllr. A.R. McLouglin (From July 2013 to May 2014)
(PR) DA
SPEAKER Cllr. F. Peters (From May 2014 to June 2014)
(PR) DA
CHIEF WHIP
Cllr. D.R. Ryder (From July 2013 to May 2014) (WARD 2) DA

Midvaal Local Municipality 45
CHIEF WHIP
Cllr. P.C. Pretorius (From May 2014 to June 2014) (WARD 14) DA
MAYORAL COMMITTEE
Alderman. C.P. Hartman MMC: Social Services (From July 2013 to May 2014)
(WARD 9) DA
Cllr. R.F. Jones MMC: Social Services (From May 2014 to June 2014)
(WARD 5) DA
Cllr. F. Peters MMC : Development Planning and Housing (From August
2013 to May 2014) (PR) DA

Midvaal Local Municipality 46
Cllr. S. Nkhi
MMC : Development Planning and Housing (From May 2014 to June 2014)
(PR) DA
Cllr. P.D. Hutcheson
MMC: Finance and Corporate Services (PR) DA
Cllr. M.S. Hack MMC: Engineering Services (From July 2013 to May 2014)
(WARD 7) DA
Cllr. D.R. Ryder MMC: Engineering Services (From May 2014 to June 2014)
(WARD 2) DA
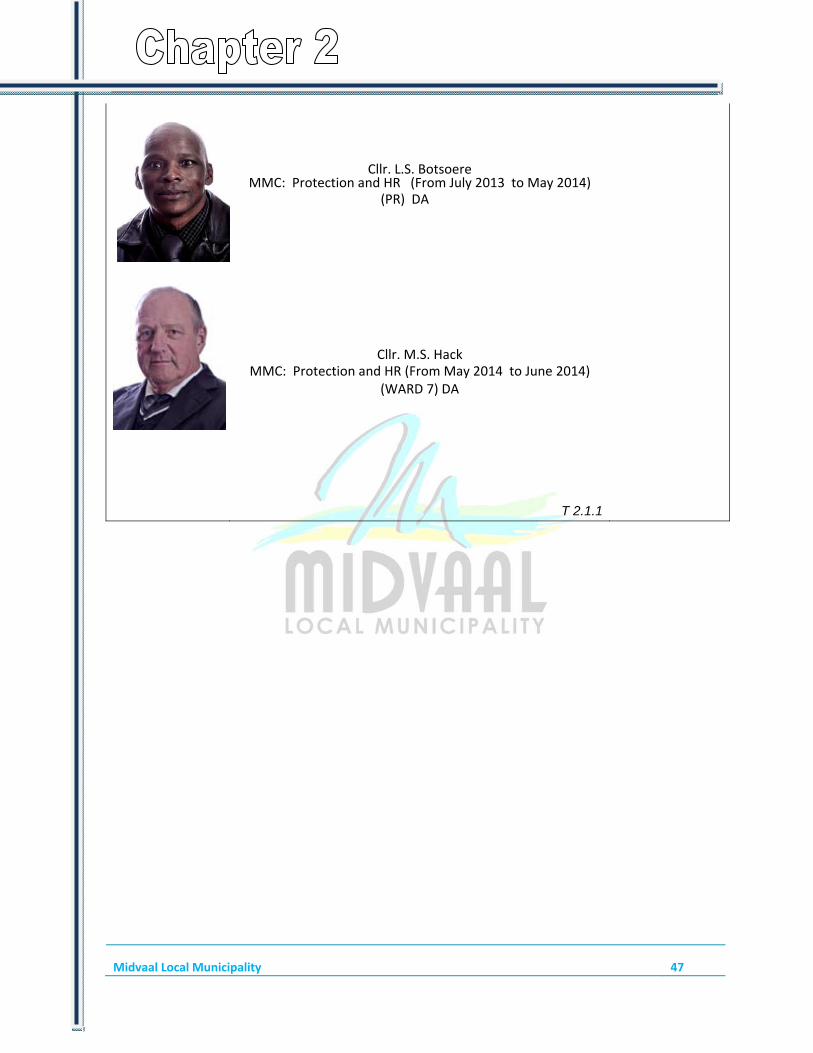
Midvaal Local Municipality 47
Cllr. L.S. Botsoere MMC: Protection and HR (From July 2013 to May 2014)
(PR) DA
Cllr. M.S. Hack MMC: Protection and HR (From May 2014 to June 2014)
(WARD 7) DA
T 2.1.1

Midvaal Local Municipality 48
COUNCILLORS
Midvaal has 27 Councillors consisting of 14 ward councillors and 13 proportional representation Councillors.
Cllr. W.F. De Agrella
(WARD 1) DA
Cllr. D.R Ryder (WARD 2) DA
Cllr. M.S. Schoeman (WARD 3) DA
Cllr. L.S. Parsonson (WARD 4) DA
Cllr. R.F. Jones (WARD 5) DA
Cllr. M.L. Modikeng (WARD 6) ANC
Cllr.M.S .Hack (WARD 7) DA
Cllr. M.M. Ndebele (WARD 8) ANC
Ald. C.P Hartman (WARD 9) DA
Cllr. M.Z.P. Boland ( WARD 10)ANC
Cllr. S.E. Hlengwa (WARD 11) ANC
Cllr. I.M. Matsose (WARD 12) ANC

Midvaal Local Municipality 49
Cllr. A.J. Van Tonder (WARD 13) DA
Cllr. P.C. Pretorius (WARD 14) DA
Cllr. B.M. Baloyi
(PR) DA
Cllr. L.S. Botsoere(PR) DA
Cllr. M.M. Magagula (PR) ANC
Cllr. T.S. Maphalla (PR) ANC
Cllr. H.J. Mokoena
(PR) ANC Cllr. E. Moleko
(PR) ANC Cllr. M.G.I. Ngcobo
(PR) ANC Cllr. S. Nkhi
(PR) DA
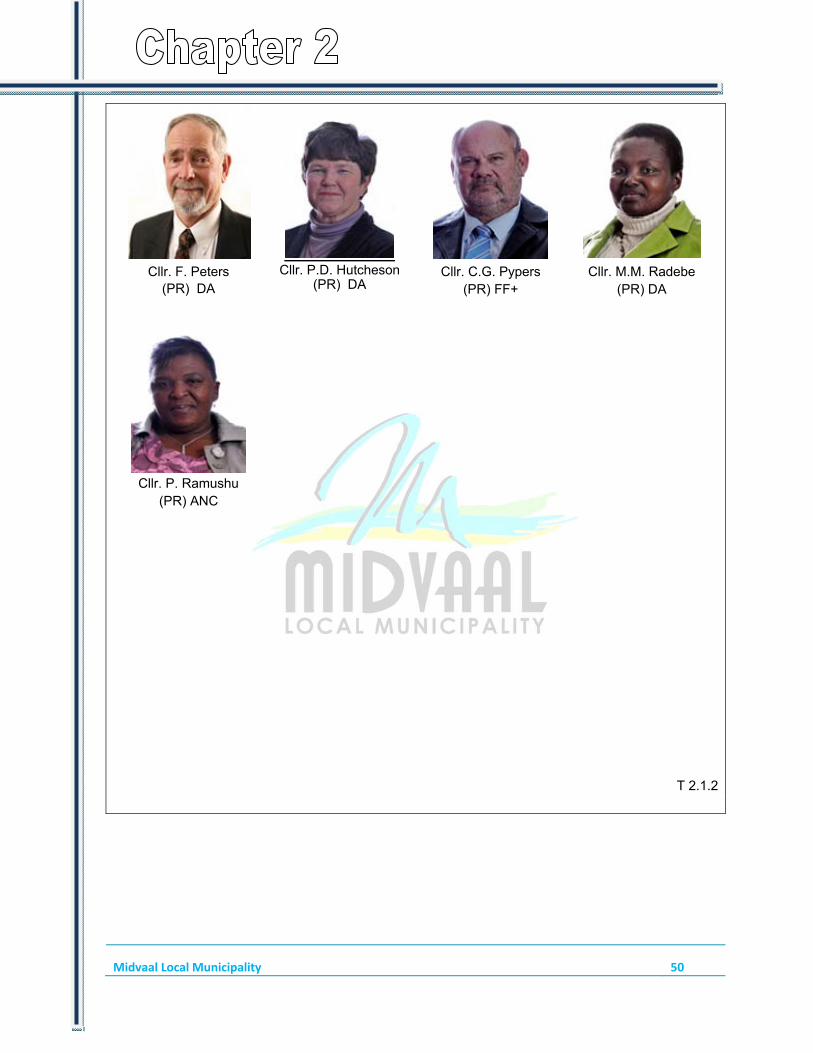
Midvaal Local Municipality 50
Cllr. F. Peters
(PR) DA
Cllr. P.D. Hutcheson(PR) DA
Cllr. C.G. Pypers (PR) FF+
Cllr. M.M. Radebe (PR) DA
Cllr. P. Ramushu (PR) ANC
T 2.1.2

Midvaal Local Municipality 51
POLITICAL DECISION-MAKING Political decisions are taken in a formal Council meeting where all participating political parties in Council have equal opportunity to deliberate the items as per the agenda, after which a resolution is adopted. Where consensus cannot be achieved, items are put to the vote after debate. The process is governed by Standing Orders of Council which have been formally adopted and duly promulgated.
T 2.1.3
2.2 ADMINISTRATIVE GOVERNANCE
INTRODUCTION TO ADMINISTRATIVE GOVERNANCE Note: MFMA section 60 (b): The Municipal Manager of a municipality is the accounting officer of the municipality for the purposes of this Act and must provide guidance on compliance with this Act to political structures; political office bearers, and officials of the municipality and any entity under the sole or shared control of the municipality.
The MM and HOD's meet formally every Tuesday to deliberate on service delivery issues and reports that must be submitted to the Mayoral Committee or Council in terms of Delegated Powers, as well as on organisational management matters. The management team also engages the Mayoral Committee on a weekly basis to ensure that the decision-making process is expedited to enhance service delivery. Each HOD also interacts with his/her MMC on a more regular basis for the same purpose.
T 2.2.1

Midvaal Local Municipality 52
TOP ADMINISTRATIVE STRUCTURE TIER 1
MUNICIPAL MANAGER Mr A.S.A De Klerk TIERS 2 AND 3
EXECUTIVE DIRECTOR: CORPORATE SERVICES Mr. T. Peeters Director: Legal Mrs. N. Ameer‐van Wyk
Function
EXECUTIVE DIRECTOR: DEVELOPMENTPLANNING AND HOUSING Mr. H. Human DIRECTOR: Development Planning and Housing (vacant)

Midvaal Local Municipality 53
EXECUTIVE DIRECTOR: ENGINEERINGSERVICES Mr. S. Coetzee
Director: PMU Mr. B. Welchman
Director: Electrical Vacant
Director: Civil Engineering Services Mr. N. Mashele
EXECUTIVE DIRECTOR: FINANCE Mrs. A. Van Schalkwyk
DEPUTY CFO Mrs. W. Van Niekerk Director: Expenditure Vacant Director: Income Mr. S. Letshabo
EXECUTIVE DIRECTOR: HUMAN RESOURCES Mr. B. Motsukunyane

Midvaal Local Municipality 54
EXECUTIVE DIRECTOR: PROTECTION SERVICES Mr. E. Lensley
EXECUTIVE DIRECTOR: COMMUNITY SERVICES Mr. S. Mosidi
Director: Parks, MHS and Cemeteries Mr. J. Venter Director: Waste Management and Environmental Mrs. S. Mali Note: * The Executive Directors are appointed on fixed term employment contracts and they report to the Municipal Manager in terms of the Municipal Systems Act Section 57.
T2.2.2

Midvaal Local Municipality 55
COMPONENT B: INTERGOVERNMENTAL RELATIONS
INTRODUCTION TO CO-OPERATIVE GOVERNANCE AND INTERGOVERNMENTAL RELATIONS Note: MSA section 3 requires that municipalities exercise their executive and legislative authority within the constitutional system of co-operative governance envisaged in the Constitution (section 41).
The Council does not function in a vacuum and strives to maintain good intergovernmental relations with its neighbouring municipalities, the Provincial Authority, National Government and other agencies and intergovernmental bodies, such as SALGA, the Premier’s Coordinating forum, MEC–MMC IGR fora, administrative working committees and so forth. A few of the intergovernmental platforms are reflected below.
T 2.3.0
2.2 INTERGOVERNMENTAL RELATIONS
NATIONAL INTERGOVERNMENTAL STRUCTURES
IGR Purpose Frequency of meetings
Community Safety Forum Community safety Quarterly
Institute of Traffic & Metro Police of South Africa.
Traffic & Police Annually
Presidential/Provincial Hotline Complaints Quarterly
Accountant General CFO Forum
To interact on matters related to accounting standards and financial reporting
Quarterly
IMFO CFO Forum To interact on a national level (Metro’s and select local municipalities) on matters related to legal compliance, financial reporting and other financial management issues
Bi monthly
Environmental management forum (Department of Environment)
Share information on environmental management best practices
Ad hoc (As and when required)
Department of arts & culture Report on discussions held with National Arts and Culture as well as new developments
Quarterly
NERSA Electricity Annually
Three Sphere Meeting Interaction between Province and National to keep them posted on MIG projects & policies and other related issues.
Monthly
SRSS To coordinate the Sewerage Treatment Monthly

Midvaal Local Municipality 56
Project in the Sedibeng district. Province, National, District and Local
Norms and Standards
An elected group of managers out of Gauteng working on the standardization of the Norms and Standards of the Fire Services.
Monthly 2nd Thursday
NKP(National Key Point) Management met with National Key Point representatives regarding safety and security issues of the Key Points doing evacuation drill etc.
meetings – Monthly
GUFPA (Gauteng Umbrella Fire Protection Association)
Management met with Gauteng Umbrella of the Fire Protection Association discussing issues and compliance with the National Veld and Forest Fire Act 101 of 1998
Meetings – Quarterly Fridays or Saturdays
Disaster Management Advisory Management met on District and Provincial level discussing Disaster Management Plans ensuring preparedness and readiness of personnel in case of any disasters and serves as a point of reference regarding International disasters and how arising problems should or can be managed.
Meetings – Quarterly
T2.3.1
PROVINCIAL INTERGOVERNMENTAL STRUCTURE
IGR Purpose Frequency of meetings
DHA Stakeholders Forum Home Affairs Quarterly
Technical Task Team Meetings (Fire Safety/Operational/PIER)
Management of different sections in Fire Department met with Province ensuring operational functionality of each section.
Monthly 2nd Friday
Premiers Coordinating
Internal Audit & Risk Forum
Premiers & MM’s Internal Audit & Risk Forum
Ad-hoc
CRDP FORUM
Dept. of Agriculture
Rural Development Quarterly
Premiers Coordinating Forum All Mayors in Gauteng raise and discuss critical issues with the Premier directly
Quarterly
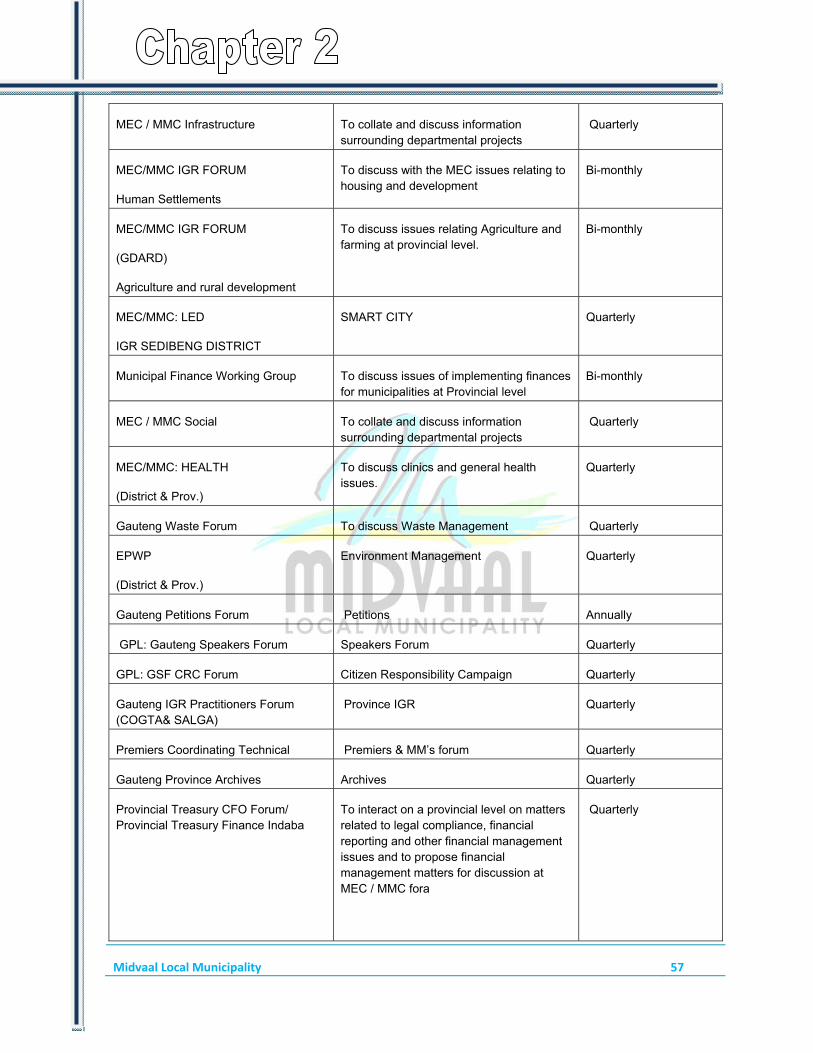
Midvaal Local Municipality 57
MEC / MMC Infrastructure To collate and discuss information surrounding departmental projects
Quarterly
MEC/MMC IGR FORUM
Human Settlements
To discuss with the MEC issues relating to housing and development
Bi-monthly
MEC/MMC IGR FORUM
(GDARD)
Agriculture and rural development
To discuss issues relating Agriculture and farming at provincial level.
Bi-monthly
MEC/MMC: LED
IGR SEDIBENG DISTRICT
SMART CITY Quarterly
Municipal Finance Working Group To discuss issues of implementing finances for municipalities at Provincial level
Bi-monthly
MEC / MMC Social To collate and discuss information surrounding departmental projects
Quarterly
MEC/MMC: HEALTH
(District & Prov.)
To discuss clinics and general health issues.
Quarterly
Gauteng Waste Forum To discuss Waste Management Quarterly
EPWP
(District & Prov.)
Environment Management Quarterly
Gauteng Petitions Forum Petitions Annually
GPL: Gauteng Speakers Forum Speakers Forum Quarterly
GPL: GSF CRC Forum Citizen Responsibility Campaign Quarterly
Gauteng IGR Practitioners Forum (COGTA& SALGA)
Province IGR Quarterly
Premiers Coordinating Technical Premiers & MM’s forum Quarterly
Gauteng Province Archives Archives Quarterly
Provincial Treasury CFO Forum/ Provincial Treasury Finance Indaba
To interact on a provincial level on matters related to legal compliance, financial reporting and other financial management issues and to propose financial management matters for discussion at MEC / MMC fora
Quarterly

Midvaal Local Municipality 58
Provincial Treasury Risk Management and Internal Audit Indaba
To interact on a provincial level on matters related to Risk Management and Internal Audit
Quarterly
SALGA Finance Working Group (Technical)
To establish a Local Government position on financial management matters (as representative of LG)
Bi-monthly
Provincial Treasury compliance monitoring meeting
To report on the municipality’s level of compliance with the MFMA and Regulations
Quarterly
Provincial Treasury Budget Monitoring Meetings
To evaluate the Annual budget submission of the municipality as well as to review the mid-year performance of the municipality
Annually
Rand Water Board meeting To compare the water results from the Municipalities in the Gauteng Region
Quarterly
DHC Technical committee for DHC Monthly
Social Development Technical Committee
Preparation for MEC and MMC’S Meeting Quarterly
Community Development
Working group
Technical-portfolio
Community Development
Quarterly
Health and Social Development
Working group
Technical-portfolio
Health and Social Development
Quarterly
Netball planner Y IGR Technical
Provincial department and Midvaal Local Municipality; establish netball structures (Jerome Koeithing Sport & Recreation Officer attended)
As and When Required
Boxing Planner Y IGR Technical Provincial formalize the boxing structures (Jerome Koeithing Sport & Recreation officer to attend)
As and When Required
Hub re-engineering IGR Technical (Provincial Sport Hub SRAC)
Memorandum of understanding between Provincial government and Midvaal Local Municipality is housing the Provincial Sport at Sicelo stadium (Jerome Koeithing Sport & Recreation Officer attended)
As and When Required
OR Tambo games Midvaal Local MunicipalitySalga Committee are planning the OR Tambo games (Jerome Koeithing Sport & Recreation officer attended)
On-going
Gauteng waste forum (GDARD) To strengthen cooperative governance on waste management in the Province and to
Monthly

Midvaal Local Municipality 59
share information on waste management best practices
Environment & culture sector meeting (EPWP) (GDARD)
EPWP reporting and management on environment
Quarterly
Infrastructure sector meeting (EPWP) (Department of Public works)
EPWP reporting and management on infrastructure
Quarterly
Intergovernmental Relations Forum: Infrastructure
To interact on matters related to Infrastructure
Quarterly
FESH
All Fire and Emergency Section Heads meet with Gauteng Province on all sections of the Fire and Rescue Services and National issues
Monthly 3rd Thursday
White Paper/ Fire Brigade Act.
Chief Fire Officers and Chairman of task teams Nationally get together to workshop the white paper for standardization of Fire Services and amending of the Fire Brigade Act.
Bi –annually
Training / USAR Management / training sections met with Province ensuring preparedness and readiness of personnel in case of any disasters
Monthly
GPGDED; MEC-MMC IGR MEETING Proposed alignment of economic development initiatives, strategies and programmes- discussions with MMC and HOD,s (ED’s) Political
Quarterly
GPGDED; MEC-TEC IGR, MEETING Proposed alignment of economic development initiatives, strategies and programmes- discussions with HOD,s (ED’s), Directors More technical
Quarterly
GPG INFRASTRUCTURE DEVELOPMENT; MEC-MMC IGR
Alignment of provincial wide and cross border infrastructure programmes. Political Discussion between MEC-MMC’s (and HOD’s)
Quarterly
GDARD MEC-MMC IGR FORUM Environmental Conservation, agricultural development programme alignment Political Discussion between MEC-MMC’s (and HOD’s)
Quarterly
GDARD MEC-TEC IGR FORUM Environmental Conservation, agricultural development programme alignment Technical Discussion between MEC- HOD’s (and Dir)
Quarterly
GPG HOUSING MEC-MMC IGR Alignment of housing sector, eradication of Quarterly

Midvaal Local Municipality 60
MEETING backlogs and improved service delivery Political Discussion between MEC-MMC’s (and HOD’s)
GPG HOUSING MEC-TEC IGR MEETING
Alignment of housing sector, eradication of backlogs and improved service delivery. Technical Discussion between MEC- HOD’s (and Dir)
Quarterly
SALGA LED WORKING GROUP Forum to discuss and resolve issues in Local Government pertaining to LED. Political and Technical. Attended by MMC and ED (Dir/DD)
Quarterly
T2.3.2
RELATIONSHIPS WITH MUNICIPAL ENTITIES
Midvaal Local Municipality does not have any municipal entities
T 2.3.3
DISTRICT INTERGOVERNMENTAL STRUCTURES
IGR Purpose Frequency of meetings
District IGR: Administration Corporate Annually Employment Equity- sub committee Preparatory work like research and doing
technical work before the main forum meetings.
Monthly
Sedibeng Sec 80 Infrastructure To collate and discuss information surrounding departmental projects
Monthly
Sedibeng Sec 80 Transport To collate and discuss information surrounding departmental projects
Monthly
Section 80 DP and Housing To discuss, research and report on projects and objectives with neighbouring municipalities
Monthly
Sedibeng Sec 80 Environmental To collate and discuss information surrounding departmental projects
Monthly
Sedibeng Sec 80 Health and Social Development
To collate and discuss information surrounding departmental projects
Monthly
Sedibeng Sec 80 Community Safety, SRAC and Heritage
To collate and discuss information surrounding departmental projects
Monthly
Sedibeng District Aids Council To collate and discuss information surrounding departmental projects
Monthly
Joint PMT
To coordinate activities of the district and local municipalities.
Quarterly
Sedibeng District Geographic Place Naming committee (forum) Sec. 79
Geographic Place naming Annually
Sedibeng District Petitions Committee. Sec. 79
Petitions Annually
Sedibeng District Technical IGR forum District IGR technical issues Quarterly Sedibeng MM’s Forum Municipal Manager’s in the district Quarterly Sedibeng Records Forum Record-keeping Bi-monthly

Midvaal Local Municipality 61
Sedibeng IGR Legal Legal Quarterly Sedibeng District CFO Forum To co-ordinate finance related matters
within the district Quarterly
Municipal Health Services (Sedibeng) To discuss issues relating to Environmental Health
Once a month
District Reviews Review Sub-District Performances Quarterly Sedibeng ECD Forum ECD Service Plenary Meeting Monthly HAST Turnaround Strategy for HIV Management Monthly Sedibeng HR/LR Forum The forum is meant to promote the best
Human Resources practices in the region, share information and map out strategies and interventions on matters of mutual interest.
Monthly
Human Resource Development- sub committee
Preparatory work like research and doing technical work before the main forum meetings. Discuss reports from neighboring Municipalities.
Monthly
Personnel Administration-sub committee Preparatory work like research and doing technical work before the main forum meetings. Discuss reports from neighboring Municipalities.
Monthly
Labour Relations- sub committee Preparatory work like research and doing technical work before the main forum meetings. Discuss reports from neighboring Municipalities.
Monthly
Individual PMS- sub committee Preparatory work like research and doing technical work before the main forum. Discuss reports from neighboring Municipalities.
Monthly
Skill Development Forum- sub committee
Preparatory work like research and doing technical work before the main forum meetings. Discuss reports from neighboring Municipalities.
Quarterly
SRAC, Heritage & Community Safety Section 80
Sedibeng District Council sec 80 Portfolio Committee – Parks Superintendent H M Kriel
Monthly
Dep. Roads and Transport planning meeting
To interact on matter related to roads planning in Midvaal, Emfuleni and Lisedi.
Quarterly
SDM DISTRICT IGR MEETING IDP Alignment of IDP’s between municipalities and DM Political and technical discussions regarding IDP content and processes
Quarterly
SDM SECTION 80; HOUSING Political/technical meeting to discuss items regarding district wide housing issues prior to tabling at District Council
Monthly
SDM SECTION 80; LED & TOURISM Political/technical meeting to discuss items regarding district wide LED & Tourism related issues prior to tabling at District Council
Monthly
Kago-ya-bana Hollard foundation forum ECD Quarterly IMPA forum Municipalities HR & Performance Annually Klipriver Forum To report on the water quality by different Quarterly

Midvaal Local Municipality 62
stakeholders IMT Operational Management Meetings Monthly Steercom Forum
Monthly
Organizational Development- sub committee
Preparatory work like research and doing technical work before the main forum meetings.
Monthly
Sport & Recreation IGR Technical Midvaal Local Municipality is part of the IGR and planning together for the sport programs (Jerome Koeithing Sport & Recreation Officer attended)
Monthly Basis
Human Rights IGR Technical Midvaal Local Municipality is part of the human rights task team in planning the Human rights month programs (Jerome Koeithing Sport & Recreation officer attended)
January to March
Arts and Culture Technical Midvaal Youth Stakeholder Forum Quarterly Water Quality liaison Meeting To monitor the quality of water that Rand
Water sells to Midvaal. Also check TAPS programme in Midvaal. Discuss Blue-Drop Issues
Bi-monthly
Community Safety Forum Community safety Quarterly SECT 14 (5) NEW VAAL METRO IGR COMMITTEES:
Political Steering Committee Executive Mayor
Extended Political Steercom Executive Mayor, Speaker, Chief Whip, ANC Chief Whip, FF+ Rep
Technical Steercom MM
Technical Task Team
(i) HR and Change Management
Dept HR
(ii) Integrated Planning Dept DP (iii) Finance and ICT CFO (iv) Governance and Legal ED: Corporate Service (v) Communication Dept Corporate Service (vi) Service Delivery and
Infrastructure Dept’s Community Service and Engineering
Note:
Frequency of meetings and specific departmental nominees will only be finalized as the Sect 14 (5) process unfolds.
All Premier’s fora are subject to approval by the new Premier of Gauteng.
T 2.3.4

Midvaal Local Municipality | CHAPTER 2 – GOVERNANCE 63
COMPONENT C: PUBLIC ACCOUNTABILITY AND PARTICIPATION
OVERVIEW OF PUBLIC ACCOUNTABILITY AND PARTICIPATION
The Municipality actively pursues meaningful public participation and has structured its activities relevant to the IDP, Budget and Ward issues accordingly. It also engages on feedback sessions and not only information gathering. This enhances transparency and accountability. Note: In summary on the overview of public accountability and participation, council extensively embarks on public participation at its ward committee meetings, IDP and Budget public ward meetings, IDP representative Forum, the People’s Assembly (which will in future become the State of the Municipality Address (SOMA), Petitions Committee and other stakeholder engagements. The oversight report is also widely publicised. The Municipal Public Accounts Committee is operational and measures are in place to protect personal information.
T 2.4.0
2.3 PUBLIC MEETINGS COMMUNICATION, PARTICIPATION AND FORUMS
All documents to be made public are placed on the municipal website. All public meetings are also advertised on the website. This includes Council meetings, Ward Committee Meetings, Budget and IDP meetings, Bid Adjudication Committee meetings etc. The Bid Adjudication Committee meetings (in respect of tenders) are open to the public. The Council interacts with its stakeholders at Ward Committee, Budget and IDP meetings, the People’s Assembly (in future the State of the Municipality Address) and many other meetings and gatherings. These engagements are ongoing throughout the year. Most meetings are well attended, resulting in meaningful engagement.
T 2.4.1
WARD COMMITTEES Ward Committees have been established in all fourteen wards and all the ward committees are functional and meet according to the year planner (which is available on the website www.midvaal.gov.za). Appendix E contains more detail on ward committee governance and Appendix F reflects ward information.
T 2.4.2

Midvaal Local Municipality 64
Nature and purpose of meetingDate of events
Number of Participating
Municipal Councillors
Number of Participating
Municipal Administrato
rs
Number of Community
members attending
Issue addressed (Yes/No)Dates and manner of
feedback given to community
IDP Public Meeting - to solicit input from Community members thus improving
Council's prioritisation, effective planning, budgeting and service
delivery (Ward 1)
1-Oct-13 4 6 7 Ward based budget
allocation:Matter referred to
Council for consideration.
2 Nov 2013 - disseminated at Ward
Committee Meeting.
Project specific funding:Matter
referred to Council for
consideration and addressed by
Budget
Funding for social facilities:Matter
referred to Council for
consideration
Infrastructure upgrade and
development:Matter referred to
Council for consideration
Land use permission:Matter
referred to Council for
consideration
IDP Public Meeting - to solicit input from Community members thus improving
Council's prioritisation, effective planning, budgeting and service
delivery (Ward 2)
2-Nov-13 4 12 16 Ward based budget
allocation:Matter referred to
Council for consideration.
6 Nov 2013 – disseminated at Ward
Committee Meeting.
Project specific funding:Matter
referred to Council for
consideration and addressed by
Budget
Funding for social facilities:Matter
referred to Council for
consideration
Infrastructure upgrade and
development:Matter referred to
Council for consideration
Land use permission:Matter
referred to Council for
consideration
IDP Public Meeting - to solicit input from Community members thus improving
Council's prioritisation, effective planning, budgeting and service
delivery (Ward 3)
9-Oct-13 3 8 23 Ward based budget
allocation:Matter referred to
Council for consideration.
13 Nov 2013 – disseminated at Ward
Committee Meeting.
Project specific funding:Matter
referred to Council for
consideration and addressed by
Budget
Funding for social facilities:Matter
referred to Council for
consideration
Public Meetings

Midvaal Local Municipality 65
Infrastructure upgrade and
development:Matter referred to
Council for consideration
Land use permission:Matter
referred to Council for
consideration
IDP Public Meeting - to solicit input from Community members thus improving
Council's prioritisation, effective planning, budgeting and service
delivery (Ward 4)
16-Oct-13 2 7 52 Ward based budget
allocation:Matter referred to
Council for consideration.
20 Nov 2013 – disseminated at Ward
Committee Meeting.
Project specific funding:Matter
referred to Council for
consideration and addressed by
Budget
Funding for social facilities:Matter
referred to Council for
consideration
Infrastructure upgrade and
development:Matter referred to
Council for consideration
Land use permission:Matter
referred to Council for
consideration
IDP Public Meeting - to solicit input from Community members thus improving
Council's prioritisation, effective planning, budgeting and service
delivery (Ward 5)
01-Oct-13 1 1 23 Ward based budget
allocation:Matter referred to
Council for consideration.
5 Nov 2013 – disseminated at Ward
Committee Meeting.
Project specific funding:Matter
referred to Council for
consideration and addressed by
Budget
Funding for social facilities:Matter
referred to Council for
consideration
Infrastructure upgrade and
development:Matter referred to
Council for consideration
Land use permission:Matter
referred to Council for
consideration
IDP Public Meeting - to solicit input from Community members thus improving
Council's prioritisation, effective planning, budgeting and service
delivery (Ward 6)
12-Oct-14 3 1 109 Ward based budget
allocation:Matter referred to
Council for consideration.
16 Nov 2013 – disseminated at Ward
Committee Meeting.
Project specific funding:Matter
referred to Council for
consideration and addressed by
Budget
Funding for social facilities:Matter
referred to Council for
consideration
Funding for social facilities:Matter
referred to Council for
consideration
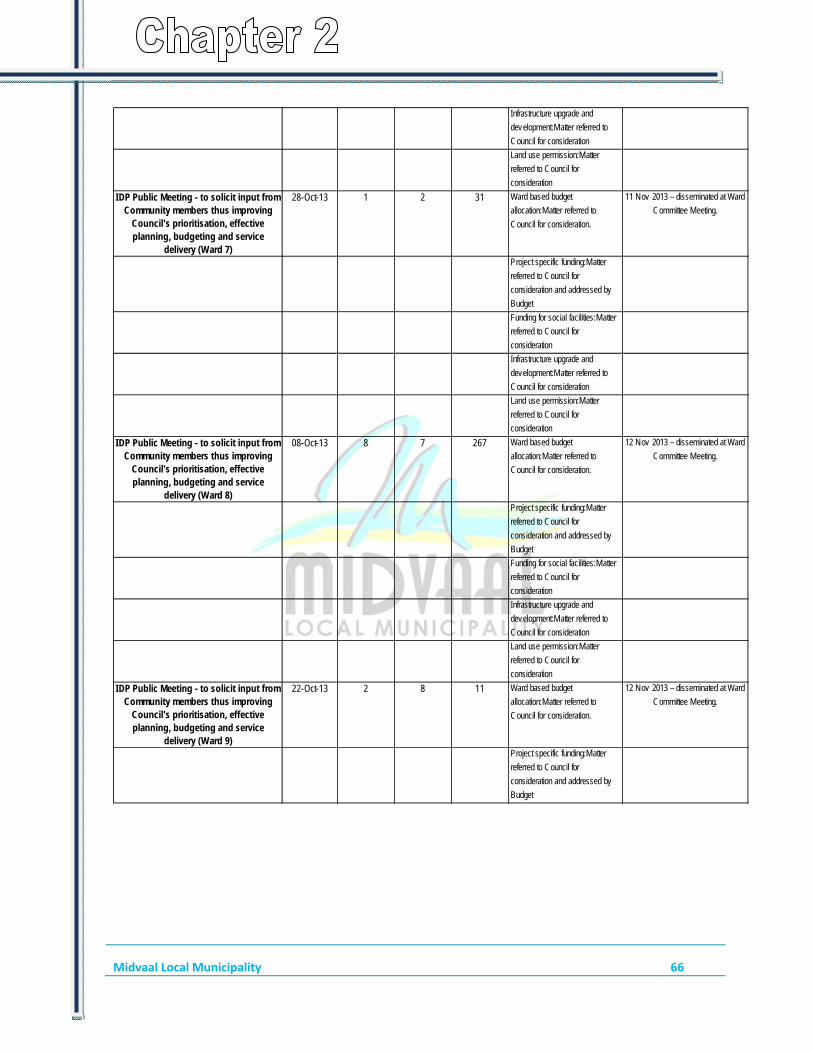
Midvaal Local Municipality 66
Infrastructure upgrade and
development:Matter referred to
Council for consideration
Land use permission:Matter
referred to Council for
consideration
IDP Public Meeting - to solicit input from Community members thus improving
Council's prioritisation, effective planning, budgeting and service
delivery (Ward 7)
28-Oct-13 1 2 31 Ward based budget
allocation:Matter referred to
Council for consideration.
11 Nov 2013 – disseminated at Ward
Committee Meeting.
Project specific funding:Matter
referred to Council for
consideration and addressed by
Budget
Funding for social facilities:Matter
referred to Council for
consideration
Infrastructure upgrade and
development:Matter referred to
Council for consideration
Land use permission:Matter
referred to Council for
consideration
IDP Public Meeting - to solicit input from Community members thus improving
Council's prioritisation, effective planning, budgeting and service
delivery (Ward 8)
08-Oct-13 8 7 267 Ward based budget
allocation:Matter referred to
Council for consideration.
12 Nov 2013 – disseminated at Ward
Committee Meeting.
Project specific funding:Matter
referred to Council for
consideration and addressed by
Budget
Funding for social facilities:Matter
referred to Council for
consideration
Infrastructure upgrade and
development:Matter referred to
Council for consideration
Land use permission:Matter
referred to Council for
consideration
IDP Public Meeting - to solicit input from Community members thus improving
Council's prioritisation, effective planning, budgeting and service
delivery (Ward 9)
22-Oct-13 2 8 11 Ward based budget
allocation:Matter referred to
Council for consideration.
12 Nov 2013 – disseminated at Ward
Committee Meeting.
Project specific funding:Matter
referred to Council for
consideration and addressed by
Budget

Midvaal Local Municipality 67
Funding for social facilities:Matter
referred to Council for
consideration
Infrastructure upgrade and
development:Matter referred to
Council for consideration
Land use permission:Matter
referred to Council for
consideration
IDP Public Meeting - to solicit input from Community members thus improving
Council's prioritisation, effective planning, budgeting and service
delivery (Ward 10)
07-Oct-13 1 4 130 Ward based budget
allocation:Matter referred to
Council for consideration.
25 Nov 2013 – disseminated at Ward
Committee Meeting.
Project specific funding:Matter
referred to Council for
consideration and addressed by
Budget
Funding for social facilities:Matter
referred to Council for
consideration
Infrastructure upgrade and
development:Matter referred to
Council for consideration
Land use permission:Matter
referred to Council for
consideration
IDP Public Meeting - to solicit input from Community members thus improving
Council's prioritisation, effective planning, budgeting and service
delivery (Ward 11)
03-Oct-13 1 7 63 Ward based budget
allocation:Matter referred to
Council for consideration.
14 Nov 2013 – disseminated at Ward
Committee Meeting.
Project specific funding:Matter
referred to Council for
consideration and addressed by
Budget
Funding for social facilities:Matter
referred to Council for
consideration
Infrastructure upgrade and
development:Matter referred to
Council for consideration
Land use permission:Matter
referred to Council for
consideration
IDP Public Meeting - to solicit input from Community members thus improving
Council's prioritisation, effective planning, budgeting and service
delivery (Ward 12)
20-Oct-13 1 7 32 Ward based budget
allocation:Matter referred to
Council for consideration.
12 Nov 2013 – disseminated at Ward
Committee Meeting.
Project specific funding:Matter
referred to Council for
consideration and addressed by
Budget

Midvaal Local Municipality 68
Funding for social facilities:Matter
referred to Council for
consideration
Infrastructure upgrade and
development:Matter referred to
Council for consideration
Land use permission:Matter
referred to Council for
consideration
IDP Public Meeting - to solicit input from Community members thus improving
Council's prioritisation, effective planning, budgeting and service
delivery (Ward 13)
24-Oct-14 4 7 9 Ward based budget
allocation:Matter referred to
Council for consideration.
29 Nov 2013 – disseminated at Ward
Committee Meeting.
Project specific funding:Matter
referred to Council for
consideration and addressed by
Budget
Funding for social facilities:Matter
referred to Council for
consideration
Infrastructure upgrade and
development:Matter referred to
Council for consideration
Land use permission:Matter
referred to Council for
consideration
IDP Public Meeting - to solicit input from Community members thus improving
Council's prioritisation, effective planning, budgeting and service
delivery (Ward 14)
29-Oct-13 6 10 8 Ward based budget
allocation:Matter referred to
Council for consideration.
26 Nov 2013 – disseminated at Ward
Committee Meeting.
Project specific funding:Matter
referred to Council for
consideration and addressed by
Budget
Funding for social facilities:Matter
referred to Council for
consideration
Infrastructure upgrade and
development:Matter referred to
Council for consideration
Land use permission:Matter
referred to Council for
consideration
14 IDP Community Participation Ward meetings
Oct/Nov 2013 41 87 781 Yes Issues included in Revised IDP.
Budget Presentation - to solicit input from Community members thus improving Council's prioritisation and budgeting (Ward 5)
08-Apr-14 6 17 40 13 May 2014 - Feeedback
disseminated at Ward Committee
Meeting

Midvaal Local Municipality 69
Budget Presentation - to solicit input from Community members thus improving Council's prioritisation and budgeting (Ward 6)
17-Apr-14 1 1 322 15 May 2014 - Feeedback
disseminated at Ward Committee
Meeting
Budget Presentation - to solicit input from Community members thus improving Council's prioritisation and budgeting (Ward 8)
15-Apr-2014 2 9 171 6 May 2014 - Feeedback
disseminated at Ward Committee
Meeting
Budget Presentation - to solicit input from Community members thus improving Council's prioritisation and budgeting (Ward 10)
16-Apr-14 1 1 51 5 May 2014 - Feeedback
disseminated at Ward Committee
Meeting
Budget Presentation - to solicit input from Community members thus improving Council's prioritisation and budgeting (Ward 11)
10-Apr-14 4 7 8 8 May 2014 - Feeedback
disseminated at Ward Committee
Meeting
People's Assembly 12-Apr-14 16 13 96Public Meeting regarding Housing and Toilets (Ward 1)
03-Nov-13 3 1 35
Public Meeting regarding Housing and Toilets (Ward 6)
15-Aug-13 2 2 261
Public Meeting regarding Housing and Toilets (Ward 6)
03-Nov-13 1 2 239
Public Meeting regarding Housing and Toilets (Ward 8)
30-Sep-13 1 2 147
Public Meeting regarding Housing and Toilets (Ward 12)
05-Nov-13 1 2 89
T 2.4.3
COMMENT ON THE EFFECTIVENESS OF THE PUBLIC MEETINGS HELD: Meetings were held according to the year planner and most were well attended resulting in greater impact and effectiveness. Issues were listed and feedback was communicated to the community
T 2.4.3.1
2.5 IDP PARTICIPATION AND ALIGNMENT
IDP Participation and Alignment Criteria* Yes/No
Does the municipality have impact, outcome, input, output indicators? Yes
Does the IDP have priorities, objectives, KPIs, development strategies? Yes
Does the IDP have multi-year targets? Yes
Are the above aligned and can they calculate into a score? Yes
Does the budget align directly to the KPIs in the strategic plan? Yes
Do the IDP KPIs align to the section 57 Managers Yes
Do the IDP KPIs lead to functional area KPIs as per the SDBIP? Yes
Were the indicators communicated to the public? Yes
Were the four quarter aligned reports submitted within stipulated time frames? Yes
* Section 26 of Municipal Systems Act 2000 T 2.5.1

Midvaal Local Municipality 70
COMPONENT D: CORPORATE GOVERNANCE
OVERVIEW OF CORPORATE GOVERNANCE In Midvaal, the principles of good corporate governance as expounded in the King III report are embraced and applied within the organisation. To the extent that these King III principles are not directed by legislation (e.g. the MFMA and Municipal Systems Act), they are applied as far as possible in the context that these principles indicate the “right way to do things”. These principles relate amongst others to ethical governance, implementation of controls to prevent fraud and corruption, management of risk, etc.
T 2.6.0
2.6 RISK MANAGEMENT
RISK MANAGEMENT Note: MFMA section 62 (i) (c) requires a municipality to have and maintain an effective, efficient and transparent system of risk management.
MLM established a Risk Committee and Risk Management Committee. The Risk Committee is represented by the departmentally appointed Risk Management Co-ordinators and tasked with the following responsibilities: 1. Co-ordinate risk management activities with functional areas; 2. Assist in embedding risk management; 3. Arrange and facilitate risk meetings, presentations and workshops involving staff within the
functional areas; 4. Providing risk management training and development where required; 5. Assist in collating and reporting on risk information; 6. Provide guidance on matters relating to risk management. Meetings were held on 17 July 2013 and 13 February 2014. The Risk Management Committee is represented by the heads of department, chaired by the Chief Risk Officer and also attended by the Chairperson of the Performance & Audit Committee. The Risk Management Committee is responsible for assisting the accounting officer in addressing the oversight requirements of risk management and evaluating and monitoring the municipality’s performance with regards to risk management. Meetings were held on 17 July 2013, 27 November 2013, 19 February 2014 and 22 May 2014 and minutes of the meetings were submitted to Council.
Council approved the Policy & Procedures in terms of Risk Management and the Risk Management Committee Charter, which is reviewed annually.
Quarterly progress reports were submitted to Council in terms of the Strategic & Operational Risk Registers. The Strategic Risk Register is aligned with the IDP and annually reviewed. The five top strategic identified risks are:

Midvaal Local Municipality 71
1. Inadequate provision of housing; 2. Water pollution from urban and industrial run-off; 3. Insufficient municipal capacity; 4. Collapse of IT Infrastructure; 5. Non-compliance with legislation (Licenced Landfill Sites). The ten top operational identified risks are: 1. Lack of resources; 2. Preventative maintenance (Negative impact on service delivery); 3. Theft / Misuse of Council’s property; 4. Fruitless & Wasteful Expenditure (Injuries on Duty); 5. Non-compliance to Water Services Act in terms of Blue Drop Award; 6. Computer system may crash; 7. Officials may not take responsibility and are not accountable for their actions; 8. Disruptions in service delivery (financial loss); 9. Controls not adhered to; 10. Conditional risk that unspent grant monies may have to be sent back to government. Gauteng Provincial Treasury (GPT) conducted a risk maturity survey in terms of the Financial Management Capability Maturity Model (FMCMM) to establish the extent to which Enterprise Risk Management (ERM) has been implemented in Council. A subset of questions for risk management was used to assess the level of risk management maturity. The subset model consists of six (6) levels. Council was assessed to be at a maturity level 4, that is to say risk management is firmly embedded in the institution. The average level is 3. The officials are in an advanced stage of completing the risk e-learning programme.
T 2.6.1
2.7 ANTI-CORRUPTION AND FRAUD
FRAUD AND ANTI-CORRUPTION STRATEGY Note: See Chapter 4 details of Disciplinary Action taken on cases of financial mismanagement (T 4.3.6). MSA 2000 s 83 (c) requires providers to be chosen through a process which minimizes the possibility of fraud and corruption. Council adopted a zero tolerance attitude towards fraud, theft and corruption, as contained in the Fraud Awareness & Prevention Policy. This resulted in the implementation of a fraud reporting hot line, 0860-268-624. Ten reports were received via the Fraud Reporting Hotline of which 2 reports were detected, 3 reports were undetected, 1 report with insufficient information and 4 reports are still under investigation. The signing of a commitment by all municipal employees formed part of the implementation of the policy, and management accepted the responsibility to ensure that all employees are made aware of the policy and receive appropriate training and education on a regular basis. All newly appointed
Midvaal Local Municipality 72
employees undergo induction, which includes the acceptance of the zero tolerance attitudes towards fraud, theft and corruption. Council has a very strong attitude towards legislative compliance, specifically supply chain management principles, and also the proper functioning of the Performance and Audit Committee, without councillor and/or political interference. All positive results are reported to the SAPS where required, for further investigation and prosecution. These measures have discouraged acts of fraud, theft and corruption. From 1 July 2014 the operation of the hotline will be outsourced, resulting in an enhanced framework to protect whistleblowers and management of the function.
T 2.7.1
2.8 SUPPLY CHAIN MANAGEMENT(SCM)
OVERVIEW SUPPLY CHAIN MANAGEMENT Note: MFMA section 110 - 119; SCM Regulations 2005; and relevant MFMA circulars set out required processes and guidance manuals to help ensure that SCM arrangements provide appropriate goods and services, offer best value for money and minimize the opportunities for fraud and corruption. Supply Chain Management Processes are being updated on an ongoing basis to ensure full compliance with the MFMA and the Regulations issued under the MFMA. The SCM policy was again reviewed during 2013/2014. To further strengthen controls, a policy dealing with the acceptance of grants, donations and sponsorships was reviewed during the year. This policy will guide all SCM role-players relative to sections 47 and 48 of the MFMA SCM Regulations. No councillors serve on any SCM committee. A total of 52 full bids and 39 formal written quotations were processed during the year under review. The average turnaround time on the awarding of bids is 2 months. Deviations from policy must comply with the requirements and be reported to Council. In the limited number of cases that this occurred, it was for justifiable reason and all such cases are reported to Council. The Bid Adjudication Committee meetings are open to the public.
T 2.8.1

Midvaal Local Municipality 73
2.9 BY-LAWS
Newly Developed Revised Public Participation
Conducted Prior to Adoption of By-Laws (Yes/No)
Dates of Public Participation
By-Laws Gazetted* (Yes/No)
Date of Publication
Fire Safety By-law Yes 14.10.2013 Yes 26.03.2014Credit Control and Debt Collection Yes 03.06.2014 Yes 13.06.2014
Rates By-law Yes 03.06.2014 Yes 13.06.2014
Tariff By-law Yes 03.06.2014 Yes 13.06.2014
By-laws Introduced during Year 2013/14
T 2.9.1*Note: See MSA section 13.
COMMENT ON BY-LAWS: Note: MSA 2000 s11 (3) (m) provides municipal councils with the legislative authority to pass and implement by-laws for the betterment of the community within the terms of the legislation. The draft amendments to the abovementioned by-laws were approved by the Council as part of its draft 2014/2015 budget at its meeting held on 30 January 2014 and 27 March 2014. Comments on the amendments were invited from the public by way of the following: 1. Advertisements on notice boards at all the libraries, head office and satellite offices of the
municipality. 2. Advertisements in the local newspapers namely the Midvaal Ster, Sedibeng Ster , Vaal Weekblad
and the Midvaal Observer. 3. On the municipal website, www.midvaal.gov.za. The amendments to the by-laws approved by the Council are finally promulgated in the Provincial Gazette. The by-laws are enforced by the officials of the different departments. At present, no dedicated by-law unit has been established.
T2.9.1.1

Midvaal Local Municipality 74
WEBSITES
Documents published on the Municipality's / Entity's Website Yes / No Publishing Date
Current annual and adjustments budgets and all budget-related documents (2013/14) Yes 31-May-13
All current budget-related policies Yes 31-May-13
The previous annual report (2012/13) Yes 31-Jan-14
The annual report (2013/14) published/to be published Yes 30-Aug-14
All current performance agreements required in terms of section 57(1)(b) of the Municipal Systems Act (2013/14) and resulting scorecards Yes 1-Jul-13
All service delivery agreements (2013/14) Yes 1-Jul-13
All long-term borrowing contracts (2013/14) Yes 1-Jul-13
All supply chain management contracts above a prescribed value for(2013/14) Yes 1-Jul-13
An information statement containing a list of assets over a prescribed value that have been disposed of in terms of section 14 (2) or (4) during Year 1 Yes 1-Jul-14Contracts agreed in Year 0 to which subsection (1) of section 33 apply, subject to subsection (3) of that section Yes 1-Jul-14
Public-private partnership agreements referred to in section 120 made in (2013/14) Yes 1-Jul-14
All quarterly reports tabled in the council in terms of section 52 (d) during (2013/14) Yes
1st Quarter Yes 15-Nov-13
2nd Quarter Yes 31-Jan-14
3rd Quarter Yes 30-Apr-14
4th Quarter Yes 1-Aug-14
T 2.10.1
Municipal Website: Content and Currency of Material
Note: MFMA s75 sets out the information that a municipality must include in its website as detailed above. Municipalities are, of course encouraged to use their websites more extensively than this to keep their community and stakeholders abreast of service delivery arrangements and municipal developments.
COMMENT MUNICIPAL WEBSITE CONTENT AND ACCESS:
Midvaal’s website complies with all requirements of Section 75 of the MFMA. A new website was designed on Joomla and launched in 2013/14 financial year. The Council’s website address is www.midvaal.gov.za.
All Council’s Libraries have computers with free internet access to which the public has access to Council’s website and the information thereon e.g. Meyerton, De Deur, Henley on Klip, Daleside and Sicelo Libraries
T 2.10.1.1

Midvaal Local Municipality 75
2.11 PUBLIC SATISFACTION ON MUNICIPAL SERVICES
PUBLIC SATISFACTION LEVELS
Certain Surveys are undertaken internally on a quarterly basis, and are based on a random sample of at least 10% of complainants. The surveys intend to establish the satisfactory resolution of complaints as far as is practical and realistically feasible, and with the ultimate goal of addressing the community needs.
With reference to the survey, 72.2 % of the Midvaal public is satisfied with services delivered T 2.11.1
Subject matter of survey Survey method Survey date
No. of people included in
survey
Survey results indicating satisfaction or better
(%)*
Overall satisfaction with:
(a) Municipality Telephonic 166 75
(b) Municipal Service Delivery Telephonic 166 75
(c) Mayor
Satisfaction with:
(a) Refuse Collection Complaints Register 41 63%
(b) Road Maintenance Complaints Register
(c) Electricity Supply Complaints Register
(d) Water Supply Complaints Register
(e) Information supplied by municipality to the public Complaints Register 47 72%(f) Opportunities for consultation on municipal affairs
T 2.11.2
Satisfaction Surveys Undertaken during: 2012/13 and 2013/14
* The percentage indicates the proportion of those surveyed that believed that relevant performance was at least satisfactory
30-Jun-14
30-Jun-14
100 87%
Concerning T 2.11.2: - Sample size of other complainants: 166 - Feedback received by 56 % - The percentage satisfied: 76% - Other service delivery areas include issues such as overgrown stands, illegal businesses operating in our areas. - Petitions are also accepted.
T 2.11.2.1
Midvaal Local Municipality 76
COMMENT ON SATISFACTION LEVELS: - Public is invited to complain via the Complaints Desk, the website, e-mail or walk-in’s - Other complaints are received via the Premier's Hotline and Presidential Hotline - Complaints / enquiry numbers are listed on the external newsletter known as the Midvaal News - Councillors receive complaints from residents on an ad hoc basis and also via the Ward Committee
meetings - A toll free telephone facility has been installed in Sicelo to enable the community members to communicate much more conveniently with the municipality on issues relevant to service delivery.
T 2.11.2.2
Midvaal Local Municipality | CHAPTER 3 – SERVICE DELIVERY PERFORMANCE (PERFORMANCE REPORT PART I)
77
CHAPTER 3 – SERVICE DELIVERY PERFORMANCE (PERFORMANCE REPORT PART I)
INTRODUCTION
Services rendered by Midvaal include water; waste water (sanitation); electricity; waste management; and housing services.
T 3.0.1
COMPONENT A: BASIC SERVICES
This component includes: water; waste water (sanitation); electricity; waste management; and housing services; and a summary of free basic services.
INTRODUCTION TO BASIC SERVICES
There are a large number of households located in informal areas, where water is delivered by tanker or stand pipes, but sanitation is restricted to biochemical installations, chemical toilets and other systems of sanitation. Formal areas should be developed where services can be provided in an economically sustainable way. Some of the rural areas utilise boreholes to provide water for consumption.
T 3.1.0
3.1. WATER PROVISION
INTRODUCTION TO WATER PROVISION Note: Recent legislation includes the Water Services Act 1997 and the General Enabling Act 2005 Water section work The potable water supply services consist of the Bulk water purifications, Bulk distributions to water storage reservoirs, reticulations to different levels of consumers and metering of individual consumer’s consumption and customer services. A water section involves nine types of operations and maintenance work. These are leak repairs, installation of meters, responding to meter leakages, pump station operations and maintenance, pressure reducing valve maintenance, reservoir operations maintenance and water treatment plant operations and maintenance, potable water quality management. It is also responsible for water supply processes management that are measured through Blue drop certification process by Department of Water and Sanitation. This feeds into the blue drop system (BDS) which informs Department of water affairs (DWA) on the state of risk and quality management of water in Midvaal local municipality. It is also involved in the revenue protection services of the municipality in conjunction with Midvaal’s department of Finance.

Midvaal Local Municipality 78
Bulk water purification and distribution Approximately 22938 households are provided bulk water from the two bulk potable water purification works namely Vaal Marina water purification works owned by Midvaal municipality and Zuikerbosch water purification plant owned by Rand Water Board. Raw water is extracted from the Vaal River and pumped into the two water purification works. Midvaal municipality has appointed Rand Water to operate the Vaal Marina purification works on its behalf. The Vaal Marina water purification works has design capacity of 10 ML/day and currently operating within its design capacity. It delivered the average 2 ML/day and the balance of the bulk water were supplied by Rand Water Zuikerbosch plant. Midvaal municipality entered into the service level agreement which is used to evaluate the performance of the service provider. Purified water is pumped into different reservoirs owned by Midvaal municipality and reticulated to households through pipelines. All households within developed urban and peri-urban areas are supplied with a water meter which is used to determine the quantity of water consumed by the particular household. Informal settlements that are not reticulated receive water through the mobile water tankers. Plastic tanks positioned around the settlements are used as a storages for community to fetch water. Complaints Engineering department operates the complaints desk during working hours and supported by fire services after hours. The complaints received are escalated to operating teams in water services for attendance. Complaints are either registered by the public telephonically and also those lodged in person. Operating teams attend to registered complaints as per priority depending on the work load for the day. The complaints include pipe bursts, water meter leaks, faulty meters, water shortages, etc. Water quality and risk management blue drop Engineering services has two complementary sampling programs. One is done in partnership with Randwater and is called the TAPS program. The other is for rural areas and is done by external service provider. The quality of the potable water supplied conformed to the standards of drinking water quality regulated by the department of Water Affairs. The TAP samples are analysed by Rand Water and the rural area samples are analysed by contractor's lab. This data is uploaded into the BDS system operated by DWA. Meetings are held on a quarterly basis with Rand Water and DWA. This is our water safety meeting and water quality is discussed. Various maintenance programs, service level agreements, chlorine levels, communication protocols and TAP sampling program are also discussed There is also a water safety plan that must be reviewed once a year. This has a risk register that must be acted on. The maintenance of pump stations, PRVs and reservoir cleaning are sourced from this register.

Midvaal Local Municipality 79
Revenue protection support
Water section also helps revenue protection. Acting on leaks and maintenance of reservoirs and PRVs will prevent water losses. Water section also helps with troubleshooting of meters. Water section helps with the creation of tenders for service providers that will assist in auditing bulk meters and doing water balances.
T 3.1.1
Agriculture Forestry Industrial DomesticUnaccountable water
losses
2011/12 397,345 0 3,743,978 4,041,067 3,152,787
2012/13 513,973 0 4,293,685 5,767,921 3,399,994
2013/14 490,233 0 3,937,693 5,980,860 4,538,080
Total Use of Water by Sector (cubic meters)
T 3.1.2
T 3.1.2.1
COMMENT ON WATER USE BY SECTOR:
Although there are many farms in the Municipal area, most of them do not use Municipal water. The water allocated to agriculture is thus low. The biggest portion of the water demand is evenly spread between domestic and industrial. Water demand for both of these sectors will rise in the near future seeing that there are plans for both industrial and housing developments, especially on the R59 corridor.
T 3.1.2.2

Midvaal Local Municipality 80
2010/2011 2011/2012 2012/2013
Actual Actual Actual Actual
No. No. No. No.Water: (above min level)
Piped water inside dwelling 20,750 20,763 20,823 21,046Piped water inside yard (but not in dwelling) 438 438 438 438Using public tap (within 200m from dwelling ) 3,930 3,950 3,950 5,892Other water supply (within 200m) 3,990 4,000 1,892 1,892Minimum Service Level and Above sub-total 29,108 29,151 27,103 29,268Minimum Service Level and Above Percentage 91% 91% 90% 98%
Water: (below min level)Using public tap (more than 200m from dwelling) 940 949 949 584Other water supply (more than 200m from dwelling 1,780 1,797 1,913 0No water supply 0 0 0 0 Below Minimum Service Level sub-total 2,720 2,746 2,862 584
Below Minimum Service Level Percentage 9% 9% 10% 2%Total number of households* 31,828 31,897 29,965 29,852* - To include informal settlements T 3.1.3
Water Service Delivery LevelsHouseholds
Description2013/14
Description 2010/11 2011/12 2012/13
Actual Actual ActualOriginal Budget
Adjusted Budget
Actual
No. No. No. No. No. No.
Formal Settlements
Total households 26,280 26,280 26,280 26,086 26,086 26,086
Households below minimum service level 0 0 0 0 0 0%Proportion of households below minimum service level 0% 0% 0% 0% 0% 0%
Informal Settlements
Total households 3,500 3,572 3,685 3,766 3,766 3,766
Households ts below minimum service level 980 949 949 584 584 584Proportion of households ts below minimum service level #REF! 28% 27% 16% 16% 16%
Households - Water Service Delivery Levels below the minimum
2013/14Households
T 3.1.4

Midvaal Local Municipality 81
* Means access to 25 liters of potable water per day supplied within 200m of a household and with a minimum flow of 10 liters per minute # 6,000 liters of potable water supplied per formal connection per month
T 3.1.5
Service Objectives Year 1Target Actual Actual
Service Indicators *Previous Year
*Previous Year *Current Year*Current Year *Current Year *Following
Year(i) (ii) (iii) (iv) (v) (vi) (vii) (viii) (ix) (x)
T 3.1.6
Service Objective xxx
Note: This statement should include no more than the top four priority service objectives, including milestones that relate to the blue water drop status as set out by the Water Affairs department. The indicators and targets specified above (columns (i) and (ii)) must be incoporated in the indicator set for each municipality to which they apply. These are 'universal municipal indicators'. * 'Previous Year' refers to the targets that were set in the Year -1 Budget/IDP round; *'Current Year' refers to the targets set in the Year 0 Budget/IDP round. *'Following Year' refers to the targets set in the Year 1 Budget/IDP round. Note that all targets in the IDP must be fundable within
Water Service Policy Objectives Taken From IDPOutline Service
TargetsYear -1 Year 0 Year 3
Target Target
See Annexure T

Midvaal Local Municipality 82
2012/13Employees Posts Employees Vacancies (fulltime
equivalents)Vacancies (as a % of
total posts)
No. No. No. No. %0 - 34 - 6 2 3 3 0 0%7 - 9 7 5 5 0 0%
10 - 12 3 3 3 0 0%13 - 15 28 29 29 0 0%16 - 1819 - 20Total 40 40 40 0
Employees: Water Services
Job Level
2013/14
Totals should equate to those included in the Chapter 4 total employee schedule. Employees and Posts numbers are as at 30 June. *Posts must be established and funded in the approved budget or adjustments budget. Full-time equivalents are calculated by taking the total number of working days lost (excluding weekends and public holidays) while a post remains vacant and adding together all such days lost by all posts within the same set (e.g. ‘senior management’) then dividing that total by 250 to give the number of posts equivalent to the accumulated days. T3.1.7
2012/13Actual Original Budget Adjustment
BudgetActual Variance to
BudgetTotal Operational Revenue 136 641 139 352 142 352 147 795 6%Expenditure: Employees 8 979 8 590 7 540 7 540 -14% Repairs and Maintenance 1 340 1 817 1 902 1 902 4% Other 88 703 95 522 100 319 98 022 3%
Total Operational Expenditure 99 023 105 929 109 761 107 464 1%Net Operational Expenditure 99 023 105 929 109 761 107 464 1%
T 3.1.8
Financial Performance 2013/14: Water Services
Details2013/14
R'000
Net expenditure to be consistent with summary T 5.1.2 in Chapter 5. Variances are calculated by dividing the difference between the Actual and Original Budget by the Actual.
Budget Adjustment Budget
Actual Expenditure
Variance from
Adjustment budget
Total Project Value
Total All 7 800 7 437 7 341 1%
Water Meter Revenue Protection Programme 1 000 1 000 909 9%Sicelo/Highbury (Valley Settlements) Reservoir & Main (MIG) 5 500 5 500 5 500 0%Sicelo/Highbury Reservoir (MIG) 400 400 0%Mamello Water Network (MIG) 500 250 250 0%Water services development plan 200 200 196 2%KSB Pumps Highbury Pump Station 100 87 86 1%Sicelo Water Meters\Connections 500
Capital ExpenditureWater Services
Capital Projects
2013/14
Total project value represents the estimated cost of the project on approval by council (including past and future expenditure as appropriate.

Midvaal Local Municipality 83
COMMENT ON WATER SERVICES PERFORMANCE OVERALL: The IDP and budget is linked and therefore IDP targets are attainable. Performance targets were met for the current year. There was no other big project for the financial year. The portion of the budget which was spent amounts to 95%.
T 3.1.10
3.2 WASTE WATER (SANITATION) PROVISION
INTRODUCTION TO SANITATION PROVISION
WASTE WATER (SANITATION) PROVISION The provision of sanitation services is broken down into Water borne(Flush toilets) system connected to Waste Water Treatment works(WWTW - sewerage), Water borne system connected to septic tanks, chemical toilets, VIP toilets, and pit latrines. The pit toilet sanitation system is regarded as the lowest level of service which is not acceptable standard and Water borne connected to WWTW is highest. Midvaal area does not bucket sanitation system. Water borne (Flush toilets) connected to sewerage There are 22 477 households with flush toilets connected to sewerage system. Waste water is collected from households that are connected to the system through the reticulation pipelines into different smaller sewer pump stations around the municipality. These pump stations are pumping into the main Rothdene pump station that pumps to Meyerton WWTW. There are approximately 35 sewer pump stations within the municipality and their condition differ from fair to bad. There is a shortage of experienced Millwrights within the municipality and a decision to appoint an external service provider was taken to assist with the repairs and maintenance of the pump stations. There are three Waste Water Treatment Works within Midvaal municipality being Meyerton WWTW, Vaal Marina WWTW and Ohenimuri. Meyerton WWTW is the largest in the municipality and has a design capacity of 10ML/day. It services the areas of Meyerton, Daleside, Sicelo, Meyerton farms, Kliprivier, Rothdene, Henlry On Klip, Riversdale, Rustervaal/Roshnee(Emfuleni). The plant is currently overloaded and treats up to 17ML/day. An approximate total of 6 254ML were treated during the 2013/14 financial year. This situation is not health for the plant and it is evident that it is conforming to the DWA waste water treatment effluent standards. There is currently unacceptably high level of COD, phosphates, Ammonia, etc that are discharged into the Fourie spruit. This resulted in conflicts between the Midvaal municipality and the adjacent property owners who claim that their animals and ecology at large are negatively impacted by this. The aerobic zone of the plant has been experiencing low level of oxygen due to the breakdown of aerators in the plant. These aerators have been broken for almost a year and have been declared redundant and need to be replaced. New aerators have ordered and are currently manufactured in

Midvaal Local Municipality 84
Belgium. They are expected to be delivered by not later than end August 2014. The consequences of low oxygen are the diminishing of bacterias and other aquatic life animals that are essential for smooth operation of the plant. Sludge ponds have run out of capacity to be able to handle the quantity of sludge produced from the plant. Bacterias are being overfed and decomposition of organic materials is composed. There is a planned Phase 2 upgrading of the plant that will be implemented by Rand Water funded by RBIG. Ohenimuri WWTW has a design capacity of 0.5ML/day. It services the areas of Walkerville. The plant is operating within its design capacity. The plant is in fairly health state and it is complying with the prescripts of DWA for waste water effluent. The WWTW is not metered and plans are place to install the meters. Vaal Marina WWTW has a design capacity of 2ML/day. It services the areas of Vaal Marina. The plant is operating within its design capacity. The plant is in fairly health state and it is complying with the prescripts of DWA for waste water effluent. The WWTW is not metered and plans are place to install the meters. Flush toilets connected to Septic tanks There are 12 350 households with flushing toilets that are connected to septic tanks. These tanks are property of individual households who are responsible for their operation and maintenance. These are mainly found in areas where there are no municipal sewer reticulation services. Midvaal assisted these households with the emptying of tanks as and when they are full and a tariff is levied against such households requiring emptying. The administration of this service became difficult to manage and Council resolution was taken to allow the households to access the service direct from the service providers operating vacuum tanks. Chemical toilets There are 3511 households that are connected to chemical toilets. These are mainly found in areas where there are no municipal sewer reticulation services. Owners are advised through the Engineering land use section to provide their own mode of sanitation of which chemical toilets system is still the preferred due to low maintenance requirements. Ventilated improved Pit (VIP) toilets There are 52 households provided with VIP toilets. This system of sanitation is found in areas where there is neither sewerage system nor enough water to transport the waste. It is normally well designed to meet the minimum standards as prescribed by the Department of Water and Sanitation. The operation and maintenance of the system is the sole responsibility of the property owner. Shared toilet facilities (informal areas) There are 3712 households that are provided with toilets facilities that are for public use. These are chemical toilets that are maintained and emptied by the municipality.
T 3.2.1
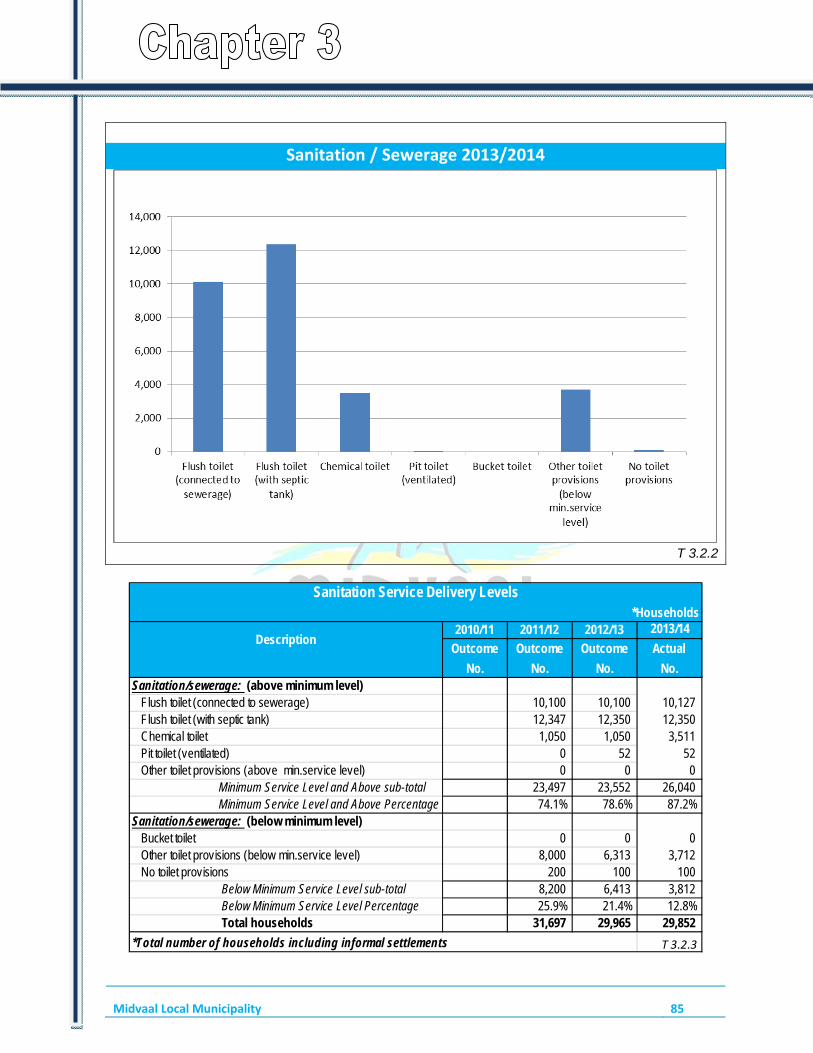
Midvaal Local Municipality 85
Sanitation / Sewerage 2013/2014
T 3.2.2
2010/11 2011/12 2012/13
Outcome Outcome Outcome Actual
No. No. No. No.Sanitation/sewerage: (above minimum level)
Flush toilet (connected to sewerage) 10,100 10,100 10,127Flush toilet (with septic tank) 12,347 12,350 12,350Chemical toilet 1,050 1,050 3,511Pit toilet (ventilated) 0 52 52Other toilet provisions (above min.service level) 0 0 0 Minimum Service Level and Above sub-total 23,497 23,552 26,040 Minimum Service Level and Above Percentage 74.1% 78.6% 87.2%
Sanitation/sewerage: (below minimum level)Bucket toilet 0 0 0Other toilet provisions (below min.service level) 8,000 6,313 3,712No toilet provisions 200 100 100 Below Minimum Service Level sub-total 8,200 6,413 3,812 Below Minimum Service Level Percentage 25.9% 21.4% 12.8%
Total households 31,697 29,965 29,852
T 3.2.3*Total number of households including informal settlements
Sanitation Service Delivery Levels*Households
Description2013/14
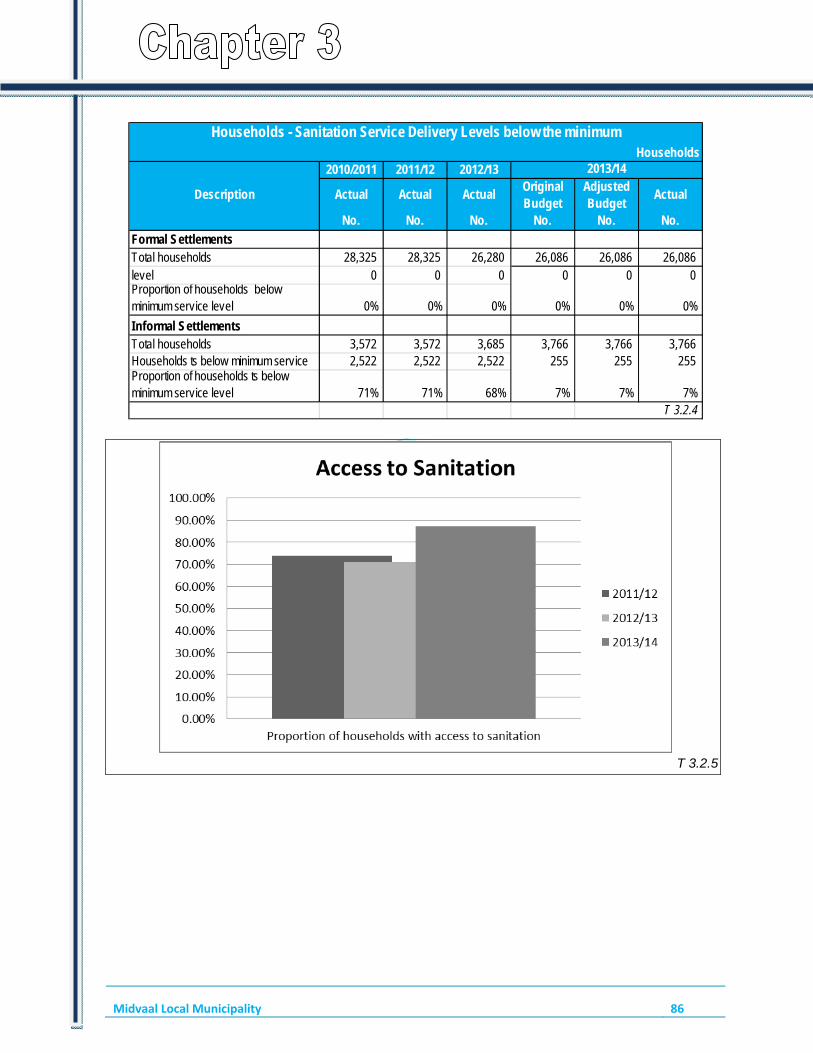
Midvaal Local Municipality 86
2010/2011 2011/12 2012/13
Actual Actual ActualOriginal Budget
Adjusted Budget
Actual
No. No. No. No. No. No.
Formal SettlementsTotal households 28,325 28,325 26,280 26,086 26,086 26,086level 0 0 0 0 0 0Proportion of households below minimum service level 0% 0% 0% 0% 0% 0%
Informal SettlementsTotal households 3,572 3,572 3,685 3,766 3,766 3,766Households ts below minimum service 2,522 2,522 2,522 255 255 255Proportion of households ts below minimum service level 71% 71% 68% 7% 7% 7%
Households - Sanitation Service Delivery Levels below the minimum
2013/14Households
T 3.2.4
Description
T 3.2.5

Midvaal Local Municipality 87
Service Objectives Year 1
Target Actual Actual
Service Indicators *Previous Year
*Previous Year *Current Year*Current Year *Current Year *Following
Year
(i) (ii) (iii) (iv) (v) (vi) (vii) (viii) (ix) (x)
T 3.2.6
Note: This statement should include no more than the top four priority service objectives, including milestones that relate to the green drop status as set out by the Water Affairs department. The indicators and targets specified above (columns (i) and (ii)) must be incoporated in the indicator set for each municipality to which they apply. These are 'universal municipal indicators'. * 'Previous Year' refers to the targets that were set in the Year -1 Budget/IDP round; *'Current Year' refers to the targets set in the Year 0 Budget/IDP round. *'Following Year' refers to the targets set in the Year 1 Budget/IDP round. Note that all targets in the IDP must be fundable within approved budget
Waste Water (Sanitation) Service Policy Objectives Taken From IDPOutline Service
Targets
Service Objective xxx
Year -1 Year 0 Year 3
Target Target
See Annexure T
2012/13Employees Posts Employees Vacancies (fulltime
equivalents)Vacancies (as a % of
total posts)
No. No. No. No. %0 - 34 - 6 4 4 3 1 25%7 - 9 7 9 9 0 0%
10 - 12 14 14 12 2 14%13 - 15 22 22 21 1 5%16 - 1819 - 20Total 47 49 45 4 8%
Employees: Sanitation Services
Job Level
2013/14
Totals should equate to those included in the Chapter 4 total employee schedule. Employees and Posts numbers are as at 30 June. *Posts must be established and funded in the approved budget or adjustments budget. Full-time equivalents are calculated by taking the total number of working days lost (excluding weekends and public holidays) while a post remains vacant and adding together all such days lost by all posts within the same set (e.g. ‘senior management’) then dividing that total by 250 to give the number of posts equivalent to the accumulated days. T 3.2.7
2012/13Actual Original Budget Adjustment
BudgetActual Variance to
Budget
Total Operational Revenue 79 242 107 755 48 755 48 327 -123%
Expenditure:
Employees 8 594 9 673 7 753 7 663 -26%
Repairs and Maintenance 2 580 2 416 3 064 2 868 16%
Other 20 385 21 512 24 351 17 159 -25%
Total Operational Expenditure 31 559 33 600 35 168 27 690 -21%
Net Operational Expenditure 31 559 33 600 35 168 27 690 -21%
T 3.2.8
Financial Performance 2013/14: Sanitation Services R'000
Details
2013/14
Net expenditure to be consistent with summary T 5.1.2 in Chapter 5. Variances are calculated by dividing the difference between the Actual and Original Budget by the Actual.

Midvaal Local Municipality 88
Budget Adjustment Budget
Actual Expenditure
Variance from Adjustment
budget
Total Project Value
Total All 64 540 14 519 13 505 7%
Tipper Truck (HP) 500 426 15%Security & Telemetry pump stations 29 26 9%Power Rodder 51 51 0%Mamello Bulk Sewer servitute 50 50 42 15%Upgrade of sanitation Sicelo and Informal 3 000 2 690 2 675 1%Crane for Crane Truck 200 240 209 13%Drilling machine 400 400 100%Rothdene Operator House 40 -Handheld Compactor 50 50 37 25%Upgrade Sewer Pump Stations & Rising Mains 500 -Sewer connections and extentions 500 500 431 14%Upgrade of sewers Sicelo (MIG) 6 000 8 500 8 500 0%Extention to Daleside Sewer (MIG) 3 000 400 400 0%Mamello Bulk Sewer (MIG) 300 300 300 0%Debottlenecking Meyerton Waste Water Treatment Works 500 810 407 50%Expansion of Meyerton Waste Water Treatment Works (RBIG) 50 000 0%
T 3.2.9
Total project value represents the estimated cost of the project on approval by council (including past and future expenditure as appropriate.
Capital Expenditure : Sanitation Services
Capital Projects
2013/14
COMMENT ON SANITATION SERVICES PERFORMANCE OVERALL: Huge amounts are currently being spent to increase the capacity of the Meyerton Waste Water Treatment Works. This will ensure better compliance figures and will reflect positively in the next Green Drop Assessment. Upgrading work to pump stations is also in progress which ensure that the overall performance is on an upward trend. Twenty million rand (R20m) was originally budgeted for the Meyerton Waste Water Treatment Works but the Department of Water Affairs stopped this project and a revised amount of eight million rand (R8m) was subsequently included in the revised budget. Subsequent to this, it was announced that Rand Water will implement the project and not Midvaal and as such only R2.9m was spent in the 2013/2014 financial year.
T 3.2.10
3.3 ELECTRICITY
INTRODUCTION TO ELECTRICITY Note: Recent legislation includes the Electricity Amendment Acts 1989; 1994; 1995; and the Electricity Regulation Act 2006. 2013-14 financial year:
All formal households in the Municipal Licenced supply area have been provided with electricity. In the rest of the Midvaal supply area, Eskom is the service provider. All formal households in the Eskom

Midvaal Local Municipality 89
area are electrified. None of the informal areas are also provided with electricity. The Council applied to the Department of Energy for funding to the amount R60 million for the Bulk supply into those areas, but the request has been turned down. Without these funds the completion of electricity to the Sicelo area will be delayed. As an interim, Council provided funding on the next year’s budget for a feeder line to the Sicelo housing development. A number of housing developments have been developed in Meyerton and Riversdale and from the request for electricity it seems as if there will be more in the new financial year.
T 3.3.1
Electricity 2013/2014
T 3.3.2
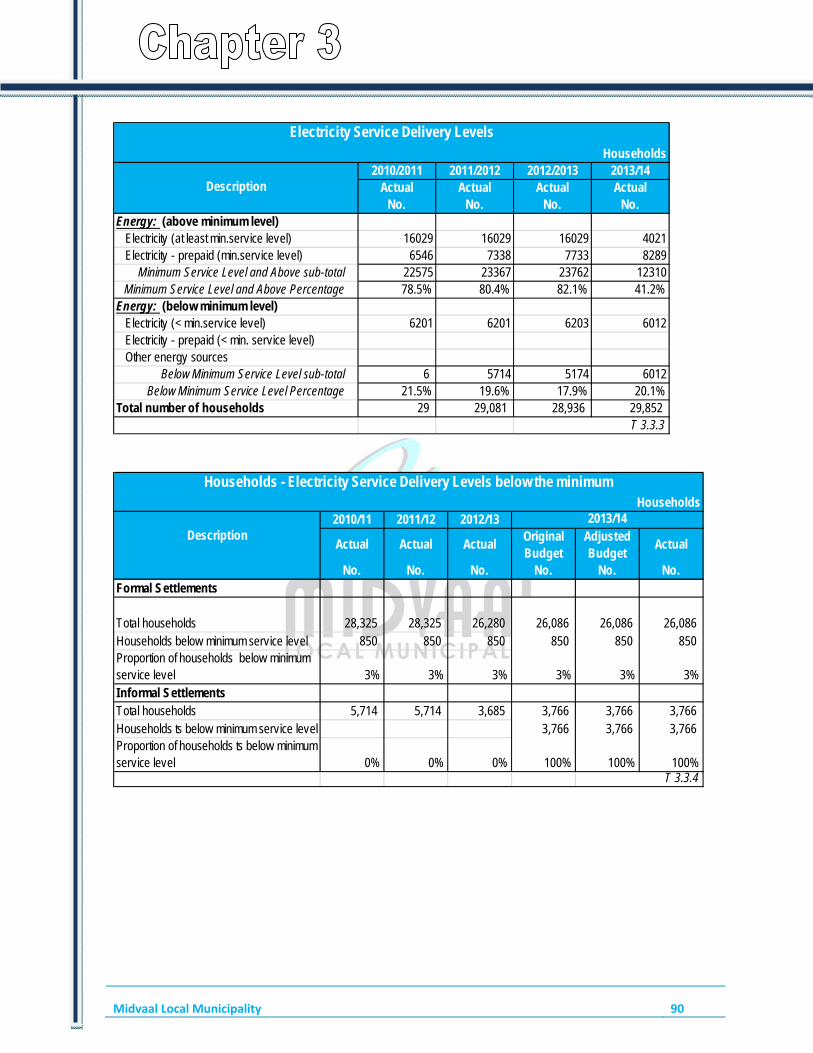
Midvaal Local Municipality 90
2010/2011 2011/2012 2012/2013 2013/14Actual Actual Actual Actual
No. No. No. No.Energy: (above minimum level)
Electricity (at least min.service level) 16029 16029 16029 4021Electricity - prepaid (min.service level) 6546 7338 7733 8289
Minimum Service Level and Above sub-total 22575 23367 23762 12310Minimum Service Level and Above Percentage 78.5% 80.4% 82.1% 41.2%
Energy: (below minimum level)Electricity (< min.service level) 6201 6201 6203 6012Electricity - prepaid (< min. service level)Other energy sources
Below Minimum Service Level sub-total 6 5714 5174 6012Below Minimum Service Level Percentage 21.5% 19.6% 17.9% 20.1%
Total number of households 29 29,081 28,936 29,852
Electricity Service Delivery LevelsHouseholds
Description
T 3.3.3
2010/11 2011/12 2012/13
Actual Actual ActualOriginal Budget
Adjusted Budget
Actual
No. No. No. No. No. No.Formal Settlements
Total households 28,325 28,325 26,280 26,086 26,086 26,086Households below minimum service level 850 850 850 850 850 850Proportion of households below minimum service level 3% 3% 3% 3% 3% 3%Informal SettlementsTotal households 5,714 5,714 3,685 3,766 3,766 3,766Households ts below minimum service level 3,766 3,766 3,766Proportion of households ts below minimum service level 0% 0% 0% 100% 100% 100%
Households - Electricity Service Delivery Levels below the minimum
2013/14
T 3.3.4
Households
Description

Midvaal Local Municipality 91
Service Objectives Year 1Target Actual Actual
Service Indicators *Previous Year
*Previous Year *Current Year*Current Year *Current Year *Following
Year(i) (ii) (iii) (iv) (v) (vi) (vii) (viii) (ix) (x)
T 3.3.5
Service Objective xxx
Note: This statement should include no more than the top four priority service objectives. The indicators and targets specified above (columns (i) and (ii)) must be incoporated in the indicator set for each municipality to which they apply. These are 'universal municipal indicators'. * 'Previous Year' refers to the targets that were set in the Year -1 Budget/IDP round; *'Current Year' refers to the targets set in the Year 0 Budget/IDP round. *'Following Year' refers to the targets set in the Year 1 Budget/IDP round. Note that all targets in the IDP must be fundable within approved budget provision. MSA 2000 chapter 5 sets out the purpose and character of
Electricity Service Policy Objectives Taken From IDPOutline Service
TargetsYear -1 Year 0 Year 3
Target Target
See Annexure T
2012/13Employees Posts Employees Vacancies (fulltime
equivalents)Vacancies (as a % of
total posts)
No. No. No. No. %0 - 3 1 1 0 1 100%4 - 6 6 6 6 0%7 - 9 12 12 11 1 8%
10 - 12 9 10 10 0%13 - 15 18 19 19 0%16 - 1819 - 20Total 46 48 46 2
Employees: Electricity Services
Job Level
2013/14
Totals should equate to those included in the Chapter 4 total employee schedule. Employees and Posts numbers are as at 30 June. *Posts must be established and funded in the approved budget or adjustments budget. Full-time equivalents are calculated by taking the total number of working days lost (excluding weekends and public holidays) while a post remains vacant and adding together all such days lost by all posts within the same set (e.g. ‘senior management’) then dividing that total by 250 to give the number of posts equivalent to the accumulated days. T 3.3.6
2012-13Actual Original Budget Adjustment
BudgetActual Variance to
Budget
Total Operational Revenue 256 171 269 153 272 293 265 861 -1%
Expenditure:
Employees 10 771 12 120 10 353 9 452 -28%
Repairs and Maintenance 3 656 3 464 3 864 3 257 -6%
Other 223 389 238 256 239 594 230 030 -4%
Total Operational Expenditure 237 815 253 840 253 812 242 739 -5%
Net Operational Expenditure 237 815 253 840 253 812 242 739 -5%
T 3.3.7
Financial Performance Year 2013/14: Electricity Services R'000
Details
2013-14
Net expenditure to be consistent with summary T 5.1.2 in Chapter 5. Variances are calculated by dividing the difference between the Actual and Original Budget by the Actual.

Midvaal Local Municipality 92
Budget Adjustment Budget
Actual Expenditure
Variance from Adjustment
budget
Total Project Value
Total All 29 084 23 190 20 717 11%
Sicelo bulk network (erf 78 to 204) 3 000 2 000 1 540 23%Sicelo reticulation network (erf 204) 6 000 3 500 3 401 0%Crane truck (hp) 750 959 959 22%Street lights hok 1 000 638 0%1 x land cruiser (hp) 487 487 100%Streetlights daleside 489 476 0%Cable fault detector 90 69 69 0%Installation of auto re-closers 900 750 570 0%Purchase of ground under the kookfontein 300 300 0%Upgrade of ablutions facilities - elec w 100 100 98 -2%Quality supply instruments nersa 700 700 586 -19%Aircons new 24 16 16 -48%2 x new half ton ldv's (replacement) 320 320 295 0%Sandrivier upgrade cables to improve vol 900 900 578 0%Streetlights de deur 1 600 1 436 0%Rissiville substation (bulk contribution 9 000 1 000 637 0%Energy efficiency (Eedsmg) 7 000 9 000 8 931 0%
T 3.3.8
Total project value represents the estimated cost of the project on approval by council (including past and future expenditure as appropriate.
Capital Expenditure: Electricity Services
Capital Projects
2013/14
COMMENT ON ELECTRICITY SERVICES PERFORMANCE OVERALL: Funds were made available for only three projects: Project 1: An amount of R1 290 000 was made available for the urgent installation of Auto-Re-closers The project was done within the budgeted amount and with very small variation. Project 2: An amount of R1 000 000 was made available for the purchase of land under the Kookfontein Sicelo Line. Total cost amounted to R834 000. Project 3: An amount of R1.4 million was made available in the revised budget for Streetligts, of which R1 061 000 was spend. The number of projects and requests in the IDP out-strips the amount of funds available from Council funds 200 to 1.
T 3.3.9
Midvaal Local Municipality 93
3.4 WASTE MANAGEMENT (THIS SECTION TO INCLUDE: REFUSE COLLECTIONS, WASTE DISPOSAL, STREET CLEANING AND RECYCLING)
INTRODUCTION TO WASTE MANAGEMENT 1. BACKGROUND: WASTE MANAGEMENT SERVICE The Council provides a “boundary-to-boundary” waste management service in public areas which it is responsible for, in its geographic area of jurisdiction. Property owners, or organizations, business entities or individuals who occupy premises, are responsible for maintaining cleanliness and hygiene standards on their premises (on-site inside property boundaries), in keeping with the norms determined by applicable by-laws. All stakeholders may contract on-site waste management services at their own expense.
The Council’s own services are clustered per the following categories and the suite of services required for managing waste through an internal service mechanism: a. General waste collection services, including the transportation of waste to a transfer station, Material Recovery Facility (MRF) or drop-off site for recyclables, a special processing/treatment installation, or a disposal facility;
b. Cleaning/cleansing, consisting of a wide range of cleaning services for all public spaces and streets under the Council’s jurisdiction. This includes litter bin provision and servicing, street sweeping, litter picking, the clearing of illegal dumping and animal carcasses, and the cleaning of industrial pollution, waste and debris generated by acts of nature and processes;
c. Disposal services, which include the maintenance and operation of special processing and collection facilities, waste transfer stations and landfill sites;
d. Technical support services: The Council operates a fleet of vehicles that are specially equipped for the task of waste collection, cleaning and transportation of waste to landfill sites. A variety of support infrastructure, such as depots and workshops, is required and must be provided to house and support the different functions.
e. General management, contract management, customer relations, information, administrative and planning support: These are various services that are provided to manage and provide additional support for the operational services.
The MLM has a responsibility to abide by statutes, policies and guidelines that are introduced by National and Provincial Departments from time to time. In this regard, the council acknowledges the regulatory oversight that must be exercised in terms of legislative compliance as well as the allocation of funds in aid of achieving National and Provincial objectives at the local government level.
Conversely, these Departments have a responsibility to ensure that timeous communication and the intergovernmental transfer of funds enables the Council to execute its duties and obligations.

Midvaal Local Municipality 94
The standard service level for residential waste collection in informal settlements is aligned with the Council’s Indigent Policy. This is a once-a-week, door-to-door waste collection service provided to indigent families per dwelling, according to a Council approved contract. “Emergency” waste services may be provided temporarily while existing service provision plans are amended. Black plastic refuse bags for utilisation in clean-up campaigns may be provided at no cost subject to the availability of funds, at the discretion of the Director: Waste and Environmental Management.
2. SERVICE DELIVERY
As per the Stats SA 2011 Census, the estimated 95 300 people living in MLM can be divided into 29 852 households. Households currently receiving refuse removal services total 89%, amounting to 17 531 households; of these, 6890 households receive the Free Basic Refuse Removal (FBRR) service, which represents 39.3% of households served. The Commercial and Industrial sector is partially serviced by MLM whereas the rest of these sectors have their own Waste Management Plans and are serviced by the private sector. The MLM currently provides services to the towns and areas in its jurisdictional area. The Municipal area has been divided into fourteen wards, numbered from 1 to 14. Service delivery for the entire MLM is coordinated from the Community Centre located in De Deur and operations are managed from the Galloway Depot located in Galloway Street, Meyerton. 3. MAJOR SUCCESSES ACHIEVED AND CHALLENGES FACED IN 2011/12 3.1. CHALLENGES The following are some of the challenges impacting on service delivery:- a. Interruption of service due to mechanical breakdowns on vehicles. b. Limited environmental education and awareness due to financial constraints and non-availability of environmental management officers. c. Lack of environmental control co-ordination. d. Lack of basic infrastructure such as storage bins, transfer stations etc. e. Partial and non-compliance of landfill sites. 3.2. DETAILS OF ACHIEVEMENT a. Extension of street cleansing services to areas not previously serviced since December 2009. b. The approval of by-laws by Council for Midvaal Local Municipality as a measure to ensure compliance and policing. c. Extension of waste services to previously un-serviced areas increased by 40.36%. d. Increase in waste removal income. 4. PROGRESS MADE WITH WASTE DISPOSAL, STREET CLEANING AND RECYCLING:
2011- 2014 a. Successfully obtained Waste Management Licenses for the Walkerville Landfill Site
from GDARD.

Midvaal Local Municipality 95
b. Application for waste management license for the Vaal Marina Landfill Site is in progress.
c. Successfully obtained the Closure License for Henley on Klip Landfill Site. d. Review of the Integrated Waste Management Plan (IWMP) completed. e. Expansion of street cleansing services through the EPWP Grant to rural areas for a
period March - June 2014. 5. TOP 3 SERVICE DELIVERY PRIORITIES AND THE IMPACT ON COMMUNITIES DURING
THE YEAR. 5.1. Top 3 Service Delivery Priorities (2013/14) * Illegal Dumping, Street Cleansing and Litter Programmes * Acquisition of Waste Management Fleet. * Expansion of Domestic Waste Removal services in rural areas.
5.1.1. Impact on Communities
* Cleaner Environment * Job Creation * Poverty Alleviation * Skills Development * Improved infrastructure * Compliance with License Conditions * Purchase of Plant and Machinery for waste collection service. * ±84% of residents have access to basic refuse removal service. * Compliance to waste collection standards 6. INDICATE HOW YOUR MUNICIPALITY IDENTIFIES AND RESPONDS TO THOSE
COMMUNITIES THAT ARE LIVING IN POVERTY AND ARE DEFICIENT IN THIS BASIC SERVICE.
* The basic refuse services are rendered to communities living in poverty and these communities are assisted through the Indigent Grant in line with the Council's Indigent Policy.
7. NAME AND EXTENT OF SERVICE PROVISION OF ANY MUNICIPAL ENTITY (IES) RESPONSIBLE FOR RENDERING REFUSE SERVICES WITHIN THE MUNICIPALITY.
* None. The refuse services are rendered by Midvaal Local Municipality.
T 3.4.1

Midvaal Local Municipality 96
2010/2011 2011/2012 2012/13 2013/14Actual Actual Actual Actual
No. No. No. No.Solid Waste Removal: (Minimum level)
Removed at least once a week 15,000 15,000 15,195 17,531Minimum Service Level and Above sub-total 15,000 15,000 15,195 17,531
Minimum Service Level and Above percentage 71.4% 71.4% 100.0% 100.0%Solid Waste Removal: (Below minimum level)
Removed less frequently than once a week 0 0 0 0Using communal refuse dump 3,150 3,150 0 0Using own refuse dump 2,500 2,500 0 0Other rubbish disposal 350 350 0 0No rubbish disposal 0 0 0 0
Below Minimum Service Level sub-total 6,000 6,000 0 0Below Minimum Service Level percentage 28.6% 28.6% 0.0% 0.0%
Total number of households 21,000 21,000 15,195 17,531T 3.4.2
Solid Waste Service Delivery Levels
Description
Households
Note: Although there are 29 852 households in Midvaal, 24 896 households receive the waste removal service. Of this figure, only 17 531 are billed, and the rest constitute informal and indigent households.
2010/2011 2011/12 2013/13
Actual Actual ActualOriginal Budget
Adjusted Budget
Actual
No. No. No. No. No. No.Formal SettlementsTotal households 15,000 15,000 15,195 15,195 17,531 17,531Households below minimum service level 6,000 6,000 6,890 6,890 6,890 6,890Proportion of households below minimum service level 40% 40% 45% 39%Informal SettlementsTotal households 1,807 1,807 2,697 2,697 2,615 2,615Households ts below minimum service level 1,807 1,807 2,697 2,697 2,615 2,615Proportion of households ts below minimum service level 100% 100% 100% 100%
Households - Solid Waste Service Delivery Levels below the minimumHouseholds
Description2013/14
T 3.4.3

Midvaal Local Municipality | CHAPTER 3 – SERVICE DELIVERY PERFORMANCE (PERFORMANCE REPORT PART I)
97
Service Objectives Year 1Target Actual Actual
Service Indicators *Previous Year
*Previous Year *Current Year*Current Year *Current Year *Following Year
(i) (ii) (iii) (iv) (v) (vi) (vii) (viii) (ix) (x)
T 3.4.4
Service Objective xxx
Note: This statement should include no more than the top four priority service objectives. The indicators and targets specified above (columns (i) and (ii)) must be incoporated in the indicator set for each municipality to which they apply. These are 'universal municipal indicators'. * 'Previous Year' refers to the targets that were set in the Year -1 Budget/IDP round; *'Current Year' refers to the targets set in the Year 0 Budget/IDP round. *'Following Year' refers to the targets set in the Year 1 Budget/IDP
Waste Management Service Policy Objectives Taken From IDPOutline Service
TargetsYear -1 Year 0 Year 3
Target Target
See Annexure T
2012/13Employees Posts Employees Vacancies (fulltime
equivalents)Vacancies (as a % of
total posts)
No. No. No. No. %0 - 3 1 1 1 0 0%4 - 6 3 3 3 0 0%7 - 9 10 10 10 0 0%
10 - 12 17 18 18 0 0%13 - 15 51 52 52 0 0%16 - 1819 - 20Total 82 84 84 0 0%
Employees: Solid Waste Management Services
Job Level
2013/14
Totals should equate to those included in the Chapter 4 total employee schedule. Employees and Posts numbers are as at 30 June. *Posts must be established and funded in the approved budget or adjustments budget. Full-time equivalents are calculated by taking the total number of working days lost (excluding weekends and public holidays) while a post remains vacant and adding together all such days lost by all posts within the same set (e.g. ‘senior management’) then dividing that total by 250 to give the number of posts equivalent to the accumulated days. T3.4.5
2012/13Employees Posts Employees Vacancies (fulltime
equivalents)Vacancies (as a % of
total posts)
No. No. No. No. %0 - 3 04 - 6 07 - 9 0
10 - 12 013 - 15 016 - 18 019 - 20 0Total 0 0 0 0
Employees: Waste Disposal and Other Services
Job Level
2013/14
Totals should equate to those included in the Chapter 4 total employee schedule. Employees and Posts numbers are as at 30 June. *Posts must be established and funded in the approved budget or adjustments budget. Full-time equivalents are calculated by taking the total number of working days lost (excluding weekends and public holidays) while a post remains vacant and adding together all such days lost by all posts within the same set (e.g. ‘senior management’) then dividing that total by 250 to give the number of posts equivalent to the accumulated days. T3.4.6
infomration captured under waste management/solid waste

Midvaal Local Municipality 98
2012-13Actual Original Budget Adjustment
BudgetActual Variance to
Budget
Total Operational Revenue 33 603 38 600 38 600 38 219 -1%
Expenditure:
Employees 15 225 14 308 12 388 12 383 -16%
Repairs and Maintenance 1 299 2 214 1 600 848 -161%
Other 21 929 17 853 21 393 21 370 16%
Total Operational Expenditure 38 453 34 375 35 382 34 601 1%
Net Operational Expenditure 38 453 34 375 35 382 34 601 1%
T 3.4.7
Financial Performance 2013/14: Solid Waste Management Services R'000
Details
2013/14
Net expenditure to be consistent with summary T 5.1.2 in Chapter 5. Variances are calculated by dividing the difference between the Actual and Original Budget by the Actual.
2012/13Actual Original Budget Adjustment
BudgetActual Variance to
Budget
Total Operational Revenue
Expenditure:
Employees
Repairs and Maintenance
Other
Total Operational Expenditure
Net Operational Expenditure
T 3.4.8
Financial Performance 2013/14: Waste Disposal and Other ServicesR'000
Details
2013/14
Net expenditure to be consistent with summary T 5.1.2 in Chapter 5. Variances are calculated by dividing the difference between the Actual and Original Budget by the Actual.
None
Budget Adjustment Budget
Actual Expenditure
Variance from Adjustment
budget
Total Project Value
Total All 1 810 3 250 3 158 43%
1 X Tipper Truck (Hp) 1 500 1 077 1 077 0%1 X New Compactor (Hp) 1 873 1 873 0%1 X Ldv 250 250 198 21%Security System (Galloway/Kliprivi 60 50 10 80%
T 3.4.9Total project value represents the estimated cost of the project on approval by council
Capital Expenditure: Waste Management Services
Capital Projects
2013/14
Midvaal Local Municipality 99
COMMENT ON WASTE MANGEMENT SERVICE PERFORMANCE OVERALL: 1. Priority of the four largest capital projects 1.1. Priority projects identified as per the IDP refer to the: * Upgrading of transfer stations and landfill sites to comply with the required legislative framework. * Provision of plant and machinery for waste management services to build up the fleet to ensure that all residents receive a basic refuse removal service. * Provision of storage bins for businesses and households to ensure a cleaner and healthier environment. 1.2. Five (5) targets set out in the IDP schedule * The targets set out in the IDP schedule cannot be attained within approved budget provision due to financial constraints. Every year, during the budget preparation processes, the Council will prioritise projects and programmes subject to availability of funds. Some of the programmes will be implemented in phases. 1.2.1. How does the municipality intend to rectify the matter? * To apply for MIG funding for the upgrading of infrastructure such as landfill sites and transfer stations. * To apply for long/short term loans to invest in the prioritised capital programmes. * To investigate the feasibility of establishing public-private partnership and Municipal Service Partnerships. 1.2.2. Variances from budget for net operating and capital expenditure. * The variances from the budget for the net operating and capital expenditure may have been caused by unforeseen factors such as escalation of prices in the market, non-payment of services due to recession, cross subsidisation of services within the municipality and the general cost of living.
T 3.4.10

Midvaal Local Municipality 100
3.5 HOUSING
INTRODUCTION TO HOUSING One of the eight Key Performance Areas (PPA’s) of Midvaal Local Municipality is KPA 3: Social and Community Development. This KPA is supported by four Key Focus Areas, of which KFA 15: Sustainable Human Settlements , deals with amongst others Housing. The key objective is “Community Development” and “Sustainable”. This objective is supported by the following three programmes i.e; - Facilitating the provision of Housing - Midvaal is not an accredited housing agency, but plays a vital role in the facilitating of several
housing projects which includes Erf 204 Sicelo, Mamello Ext. 1 and Savanna city. - Enabling Access to land and security of tenure. - Midvaal Local Municipality as land owner made erf 54 and 55 Meyerton Farms and erf 78 Meyerton
farms as well as a portion of Portion 400 of the farm Koppiesfontein available to the Department of Human Settlements for various housing projects.
- Formalising and upgrading of informal settlements - Midvaal Local Municipality initiated specialist studies in respect of the Sicelo Informal settlement to
facilitate the formalisation/in-situ upgrading of the community. Midvaal Local Municipality had as KPI requesting for a migration plan, not only did Midvaal Local Municipality receive the grant, we also executed the project and are now the first municipality in Gauteng to have a migration plan. The implementation of the plan will assist Midvaal local Municipality to deal with the challenges resulting from rapid growth as a result of migration. The 2011 Stats SA survey outcome will be utilised to update the 2013/2014 annual report.
Of the 29 852 Households residing in Midvaal 87, 4% stays in formal settlements, small holdings and farms.
T 3.5.1
Year end Total households (including in formal and
informal settlements)
Households in formal settlements
Percentage of HHs in formal settlements
2010/11 29965 26193 87.4%2011/12 29852 26086 87.4%2012/13 29965 26086 87.1%2013/14 29965 26086 87.1%
T 3.5.2
Percentage of households with access to basic housing
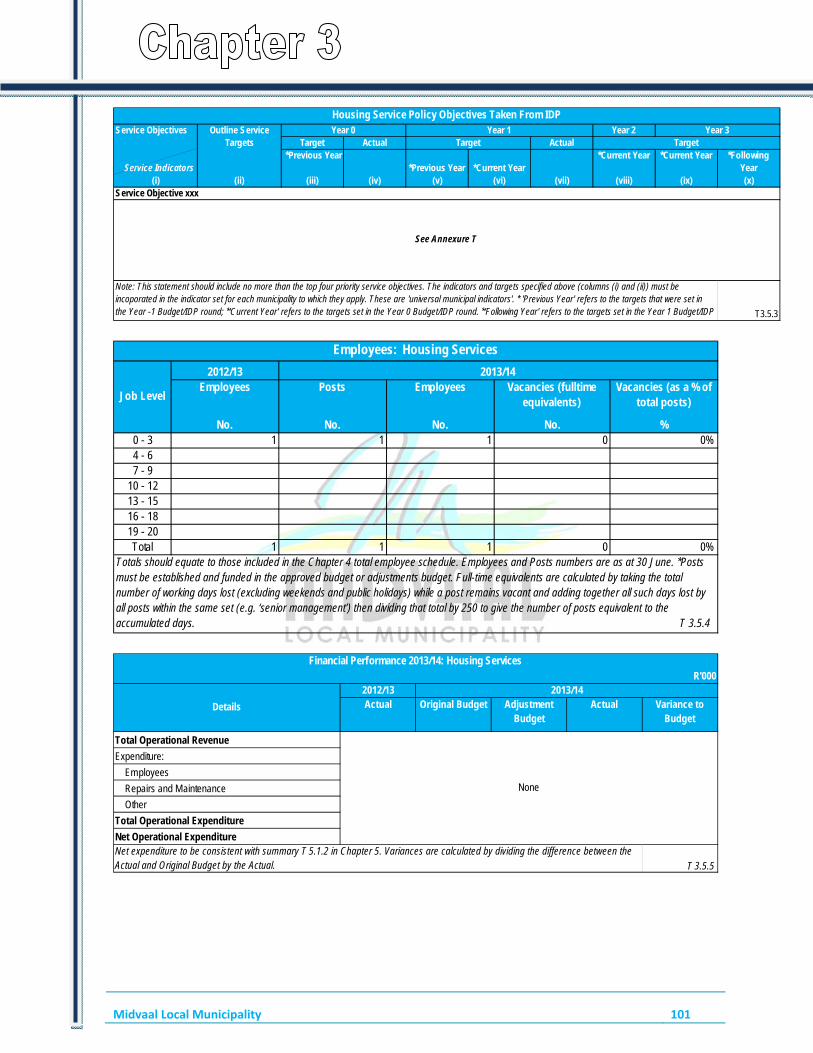
Midvaal Local Municipality 101
Service Objectives Year 2Target Actual Actual
Service Indicators *Previous Year
*Previous Year *Current Year*Current Year *Current Year *Following
Year(i) (ii) (iii) (iv) (v) (vi) (vii) (viii) (ix) (x)
T3.5.3
Service Objective xxx
Note: This statement should include no more than the top four priority service objectives. The indicators and targets specified above (columns (i) and (ii)) must be incoporated in the indicator set for each municipality to which they apply. These are 'universal municipal indicators'. * 'Previous Year' refers to the targets that were set in the Year -1 Budget/IDP round; *'Current Year' refers to the targets set in the Year 0 Budget/IDP round. *'Following Year' refers to the targets set in the Year 1 Budget/IDP
Housing Service Policy Objectives Taken From IDPOutline Service
TargetsYear 0 Year 1 Year 3
Target Target
See Annexure T
2012/13Employees Posts Employees Vacancies (fulltime
equivalents)Vacancies (as a % of
total posts)
No. No. No. No. %0 - 3 1 1 1 0 0%4 - 67 - 9
10 - 1213 - 1516 - 1819 - 20Total 1 1 1 0 0%
Employees: Housing Services
Job Level
2013/14
Totals should equate to those included in the Chapter 4 total employee schedule. Employees and Posts numbers are as at 30 June. *Posts must be established and funded in the approved budget or adjustments budget. Full-time equivalents are calculated by taking the total number of working days lost (excluding weekends and public holidays) while a post remains vacant and adding together all such days lost by all posts within the same set (e.g. ‘senior management’) then dividing that total by 250 to give the number of posts equivalent to the accumulated days. T 3.5.4
2012/13Actual Original Budget Adjustment
BudgetActual Variance to
Budget
Total Operational Revenue
Expenditure:
Employees
Repairs and Maintenance
Other
Total Operational Expenditure
Net Operational Expenditure
T 3.5.5
Financial Performance 2013/14: Housing Services R'000
Details
2013/14
Net expenditure to be consistent with summary T 5.1.2 in Chapter 5. Variances are calculated by dividing the difference between the Actual and Original Budget by the Actual.
None
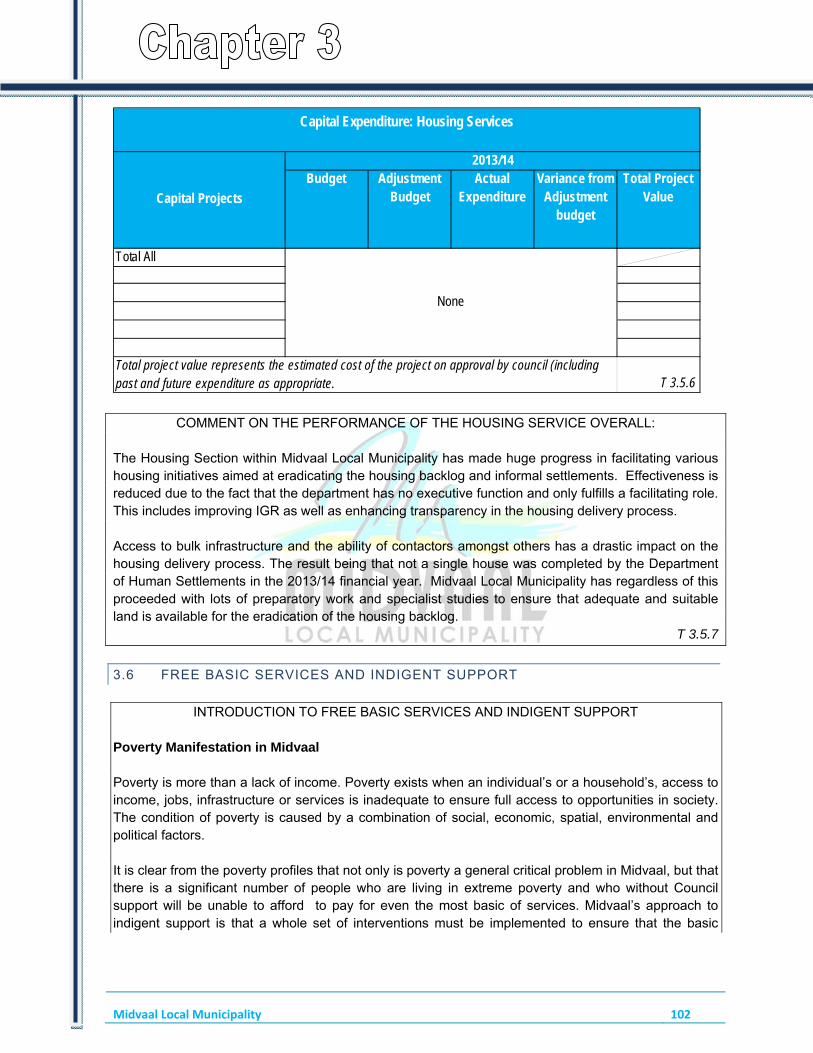
Midvaal Local Municipality 102
Budget Adjustment Budget
Actual Expenditure
Variance from Adjustment
budget
Total Project Value
Total All
T 3.5.6
Capital Expenditure: Housing Services
Capital Projects
2013/14
Total project value represents the estimated cost of the project on approval by council (including past and future expenditure as appropriate.
None
COMMENT ON THE PERFORMANCE OF THE HOUSING SERVICE OVERALL: The Housing Section within Midvaal Local Municipality has made huge progress in facilitating various housing initiatives aimed at eradicating the housing backlog and informal settlements. Effectiveness is reduced due to the fact that the department has no executive function and only fulfills a facilitating role. This includes improving IGR as well as enhancing transparency in the housing delivery process. Access to bulk infrastructure and the ability of contactors amongst others has a drastic impact on the housing delivery process. The result being that not a single house was completed by the Department of Human Settlements in the 2013/14 financial year. Midvaal Local Municipality has regardless of this proceeded with lots of preparatory work and specialist studies to ensure that adequate and suitable land is available for the eradication of the housing backlog.
T 3.5.7
3.6 FREE BASIC SERVICES AND INDIGENT SUPPORT
INTRODUCTION TO FREE BASIC SERVICES AND INDIGENT SUPPORT Poverty Manifestation in Midvaal Poverty is more than a lack of income. Poverty exists when an individual’s or a household’s, access to income, jobs, infrastructure or services is inadequate to ensure full access to opportunities in society. The condition of poverty is caused by a combination of social, economic, spatial, environmental and political factors. It is clear from the poverty profiles that not only is poverty a general critical problem in Midvaal, but that there is a significant number of people who are living in extreme poverty and who without Council support will be unable to afford to pay for even the most basic of services. Midvaal’s approach to indigent support is that a whole set of interventions must be implemented to ensure that the basic
Midvaal Local Municipality 103
needs of the poor are met, and their rights upheld while protecting resources for use by the next generation. Indigents are defined as those people, due to a number of factors, who are unable to make monetary contribution towards basic services, no matter how small the amounts seem to be. Any household, earning less than the R3 500.00 qualify to be registered as indigents. Examples are pensioners, unemployed, child headed families and students. The policy covers a wide range of indigent benefits such as but not limited to: - Indigent rates and tax rebates - Indigent burials - Expanded Social Package (indigent exit programmes, life skills programmes, unemployed database, Counselling by Social Workers). At the end of the financial year, there was 1 267 registered indigents in the database of the Midvaal Local Municipality. These indigents benefited from their accrued municipal debt being written off (totaling R7m for the year), free basic water of 6kl, free basic sanitation, free refuse collection, 50kwh free basic electricity and no assessment rates for the first R500 000 of their property values. Many indigents were also given temporary work during the year. Registered indigents making use of Eskom electricity also receives free basic electricity. The municipality annual pays Eskom for free basic electricity provided to our residents. In addition, poor people not living in formal households and thus not registered as indigents, are benefitting from water tankers providing water at no cost, portable toilets and refuse collection in informal settlements. Indigent registration campaigns are held on an ongoing basis. As in the current financial year, campaigns will again be held in the 2014/2015 financial year as we believe that all indigent households are not yet registered. Many indigent customers are not willing to come forward to be registered as the properties in which they live are in many cases not registered in their names. The cost of doing a property registration inhibitive for most indigent households (even though there will be no transfer duties, the legal cost is not within their reach). Based on the Stats SA Census data, it is expected that there should be approximately 3 000 registered indigent households in the Midvaal area.
T 3.6.1

Midvaal Local Municipality 104
T 3.6.2
Total Access % Access % Access % Access % 2011/2012 29 852 367 367 100% 367 100% 367 100% 367 100%2012/2013 29 852 756 756 100% 756 100% 756 100% 756 100%2013/2014 29 852 1 267 1 267 100% 1 267 100% 1 267 100% 1 267 100%
T 3.6.3
Free Basic RefuseHouseholds earning less than R1,100 per month
Number of householdsFree Basic Services To Low Income Households
Total Free Basic Water Free Basic Sanitation Free Basic Electricity
2012/13Actual Budget Adjustment
BudgetActual Variance to
BudgetWater 4 515 5 016 5 016 4 446 -13%Waste Water (Sanitation) 1 379 1 532 1 532 1 642 7%Electricity 152 169 169 154 -10%Waste Management (Solid Waste) 561 623 623 760 18%Total 6 607 7 340 7 340 7 002 -5%
Financial Performance 2013/14: Cost to Municipality of Free Basic Services Delivered
Services Delivered 2013/14
T 3.6.4
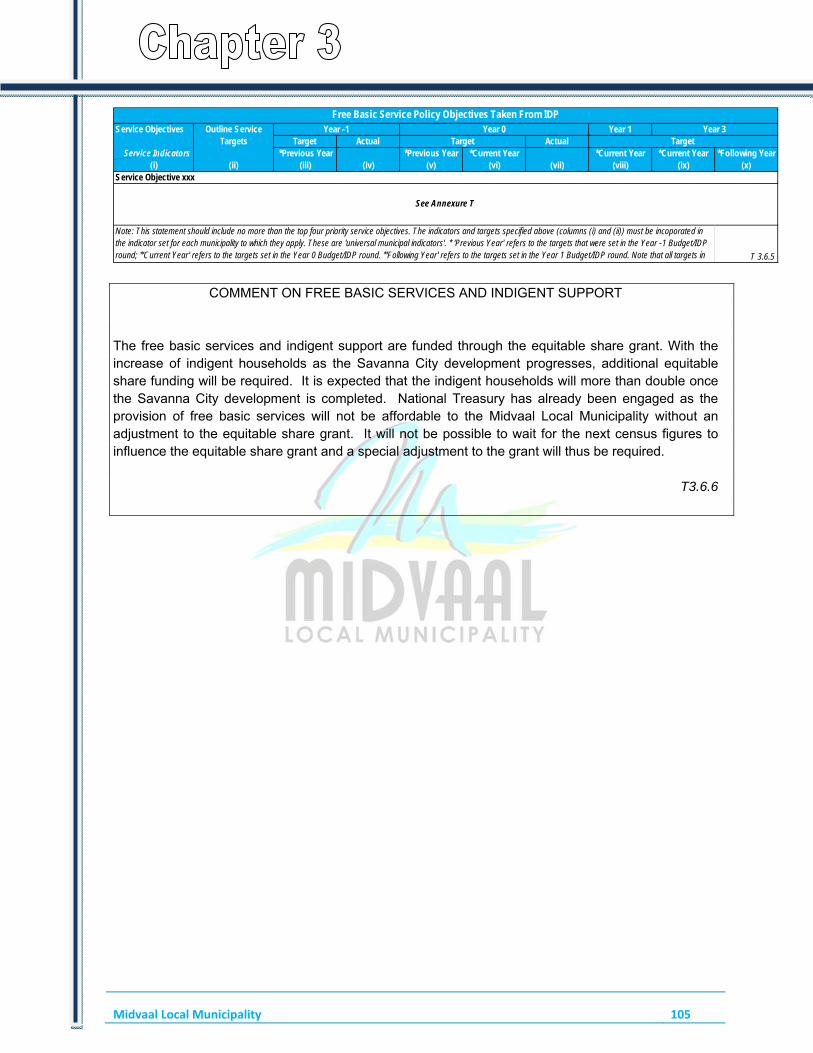
Midvaal Local Municipality 105
Service Objectives Year 1Target Actual Actual
Service Indicators *Previous Year *Previous Year *Current Year *Current Year *Current Year *Following Year(i) (ii) (iii) (iv) (v) (vi) (vii) (viii) (ix) (x)
T 3.6.5
Service Objective xxx
Note: This statement should include no more than the top four priority service objectives. The indicators and targets specified above (columns (i) and (ii)) must be incoporated in the indicator set for each municipality to which they apply. These are 'universal municipal indicators'. * 'Previous Year' refers to the targets that were set in the Year -1 Budget/IDP round; *'Current Year' refers to the targets set in the Year 0 Budget/IDP round. *'Following Year' refers to the targets set in the Year 1 Budget/IDP round. Note that all targets in
Free Basic Service Policy Objectives Taken From IDPOutline Service
TargetsYear -1 Year 0 Year 3
Target Target
See Annexure T
COMMENT ON FREE BASIC SERVICES AND INDIGENT SUPPORT The free basic services and indigent support are funded through the equitable share grant. With the increase of indigent households as the Savanna City development progresses, additional equitable share funding will be required. It is expected that the indigent households will more than double once the Savanna City development is completed. National Treasury has already been engaged as the provision of free basic services will not be affordable to the Midvaal Local Municipality without an adjustment to the equitable share grant. It will not be possible to wait for the next census figures to influence the equitable share grant and a special adjustment to the grant will thus be required.
T3.6.6

Midvaal Local Municipality | CHAPTER 3 – SERVICE DELIVERY PERFORMANCE (PERFORMANCE REPORT PART I)
106
COMPONENT B: ROAD TRANSPORT
This component includes: roads; transport; and waste water (stormwater drainage).
INTRODUCTION TO ROAD TRANSPORT The municipal road network consists of approximately 660km of surfaced roads and 640 km of gravel roads. A big number of these are in sparsely populated rural areas. The surfacing of these is thus not economically viable. Roads are maintained to a very high standard. Potholes are repaired as a matter of priority as and when they develop and gravel roads are graded once or twice a year depending on the condition of the particular road and rainfall patterns for the particular season.
T 3.7
3.7 ROADS
INTRODUCTION TO ROADS Potholes Potholes are attended to according to the complaints received, However Roads teams attending on a complaint are required to fix every pothole within that area where the complaint was reported to avoid further complaints and to prevent more potential potholes to develop thereof. Beginning of February this financial year Roads and Storm Water experiences heavy and elongated rainfalls that resulted in a massive backlog of potholes within the municipal boundary. The backlog was cleared completely by the end of June 2014. Gravel roads A gravel maintenance program is generated every quarter indicating planned grading program per suburb/farm. This program forms the basis of the gravel road maintenance. Complaints that come while the grading teams are focused on other areas are noted and attended to after the planned work has been completed unless the severity of the road complained about is critical. In such cases the program is diverted from and the complaint is attended to immediately, however all other roads closer to roads that was complained about are then graded as well. Midvaal municipality has a challenge with regards to obtaining a Borrow-pit where graded material can be obtained to upgrade gravel roads and to supply sub-base layers for new roads without sourcing from external sources.

Midvaal Local Municipality 107
Re-sealing The Pavement Management System developed shows the expected life span of roads that have been tarred and the recommended surface treatment to be applied in future. This PMS is also supported by the visual inspections carried out Quarterly by the sectional manager or PMU manager to confirm and prioritize which roads are resealed every financial year. The prioritizations seek political concurrence before resealing can be done. Road Cleaning Every tarred road is cleaned of loose sand, stones, vegetation and application of weed-killer/vegetation control chemical is applied. A road is cleaned at least 3 times a year by a dedicated contractor hiring 90% of his staff as the local labour. Roads are cleaned 500mm on both sides as well as intersections to avoid point-loading to the surface by foreign objects if not cleaned. The section identifies roads that need attention and also relies on complaints from the public to attend to these roads. Storm water The Henley Weir bridge is cleaned of all debris every month as per the program. This work is not measurable in terms of quantities however in the future we will calculate the costs using the labour and machinery resources used every month from now on. Storm water targets are set quarterly accompanied by a storm water maintenance program where every channel, v-drain ditches( earth drains), headwalls and manholes are cleaned per suburb. Teams focus on that suburb cleaning all these assets and repairing them according to the severity of the damages.
T 3.7.1
KilometersTotal gravel roads New gravel roads
constructedGravel roads upgraded
to tarGravel roads
graded/maintained2011/12 566 2 2 5662012/13 565 1 1 5652013/14 562 0 4 562
T 3.7.2
Gravel Road Infrastructure
Total tarred roads New tar roadsExisting tar roads
re-tarredExisting tar roads
re-sheetedTar roads
maintained2011/12 603 4 26 0 6032012/13 606 3 20 0 6062013/14 610 3.526 12 0 610
T 3.7.3
Tarred Road InfrastructureKilometers

Midvaal Local Municipality 108
New Gravel - Tar Maintained New Re-worked Maintained2011/12 100 7,523 7,260 11,078 0 11,2652012/13 120 8,275 9,497 11,042 0 12,3422013/14 0 7,504 5,137 7,504 11,111 15,144
T 3.7.4
Cost of Construction/Maintenance
Gravel Tar
T 3.7.5

Midvaal Local Municipality | CHAPTER 3 – SERVICE DELIVERY PERFORMANCE (PERFORMANCE REPORT PART I)
109
Service Objectives Year 1Target Actual Actual
Service Indicators *Previous Year
*Previous Year *Current Year*Current Year *Current Year *Following Year
(i) (ii) (iii) (iv) (v) (vi) (vii) (viii) (ix) (x)
T 3.7.6
Service Objective xxx
Note: This statement should include no more than the top four priority service objectives. The indicators and targets specified above (columns (i) and (ii)) must be incoporated in the indicator set for each municipality to which they apply. These are 'universal municipal indicators'. * 'Previous Year' refers to the targets that were set in the Year -1 Budget/IDP round; *'Current Year' refers to the targets set in the Year 0 Budget/IDP round. *'Following Year' refers to the targets set in the Year 1 Budget/IDP round. Note
Road Service Policy Objectives Taken From IDPOutline Service
TargetsYear -1 Year 0 Year 3
Target Target
See Annexure T
2012/13Employees Posts Employees Vacancies (fulltime
equivalents)Vacancies (as a % of
total posts)
No. No. No. No. %0 - 34 - 6 4 4 4 0 0%7 - 9 6 6 5 1 17%
10 - 12 8 8 7 1 13%13 - 15 25 26 26 0 0%16 - 1819 - 20Total 43 44 42 2 5%
Employees: Road Services
Job Level
2013/14
Totals should equate to those included in the Chapter 4 total employee schedule. Employees and Posts numbers are as at 30 June. *Posts must be established and funded in the approved budget or adjustments budget. Full-time equivalents are calculated by taking the total number of working days lost (excluding weekends and public holidays) while a post remains vacant and adding together all such days lost by all posts within the same set (e.g. ‘senior management’) then dividing that total by 250 to give the number of posts equivalent to the accumulated days. T3.7.7
2012/13Actual Original Budget Adjustment
BudgetActual Variance to
Budget
Total Operational Revenue 12 125 7 058 7 058 8 085 13%
Expenditure:
Employees 6 504 6 944 6 754 5 212 -33%
Repairs and Maintenance 17 308 18 571 18 516 18 073 -3%
Other 37 334 43 538 42 952 39 602 -10%
Total Operational Expenditure 61 146 69 053 68 221 62 886 -10%
Net Operational Expenditure 61 146 69 053 68 221 62 886 -10%
T 3.7.8
Financial Performance 2013/14: Road Services
R'000
Details2013/14
Net expenditure to be consistent with summary T 5.1.2 in Chapter 5. Variances are calculated by dividing the difference between the Actual and Original Budget by the Actual.
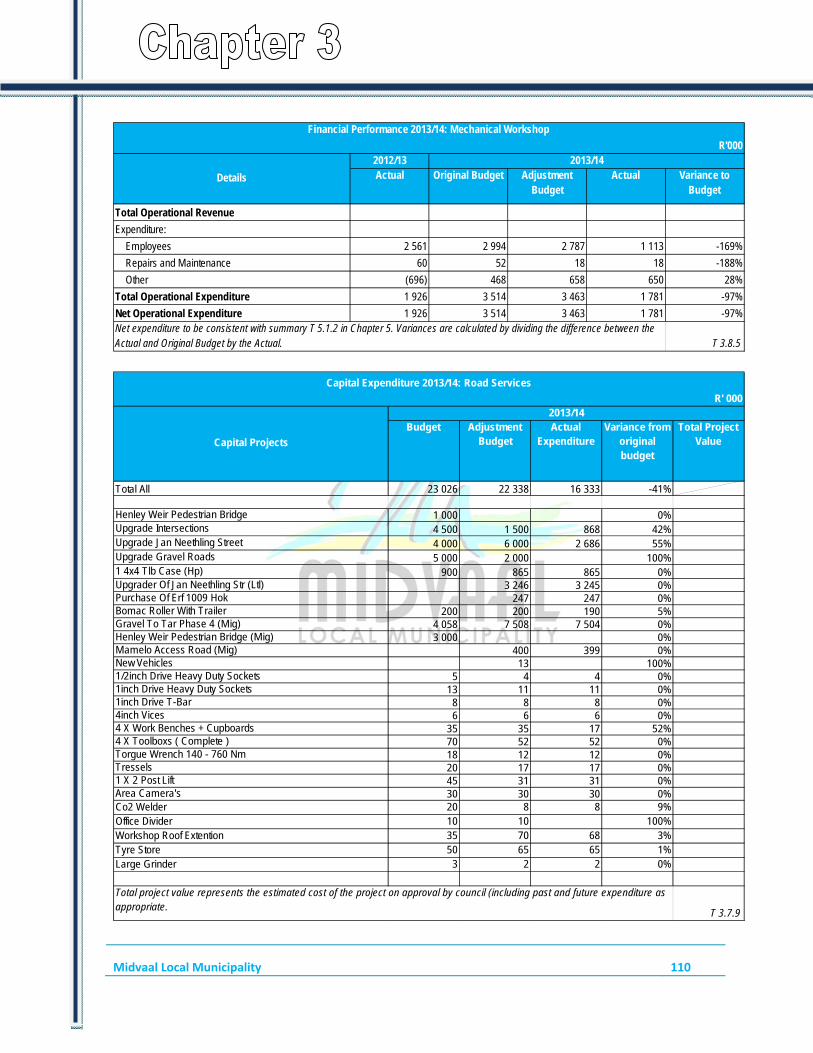
Midvaal Local Municipality 110
2012/13Actual Original Budget Adjustment
BudgetActual Variance to
Budget
Total Operational Revenue
Expenditure:
Employees 2 561 2 994 2 787 1 113 -169%
Repairs and Maintenance 60 52 18 18 -188%
Other (696) 468 658 650 28%
Total Operational Expenditure 1 926 3 514 3 463 1 781 -97%
Net Operational Expenditure 1 926 3 514 3 463 1 781 -97%
T 3.8.5
Financial Performance 2013/14: Mechanical Workshop
R'000
Details
2013/14
Net expenditure to be consistent with summary T 5.1.2 in Chapter 5. Variances are calculated by dividing the difference between the Actual and Original Budget by the Actual.
Budget Adjustment Budget
Actual Expenditure
Variance from original budget
Total Project Value
Total All 23 026 22 338 16 333 -41%
Henley Weir Pedestrian Bridge 1 000 0%Upgrade Intersections 4 500 1 500 868 42%Upgrade Jan Neethling Street 4 000 6 000 2 686 55%Upgrade Gravel Roads 5 000 2 000 100%1 4x4 Tlb Case (Hp) 900 865 865 0%Upgrader Of Jan Neethling Str (Ltl) 3 246 3 245 0%Purchase Of Erf 1009 Hok 247 247 0%Bomac Roller With Trailer 200 200 190 5%Gravel To Tar Phase 4 (Mig) 4 058 7 508 7 504 0%Henley Weir Pedestrian Bridge (Mig) 3 000 0%Mamelo Access Road (Mig) 400 399 0%New Vehicles 13 100%1/2inch Drive Heavy Duty Sockets 5 4 4 0%1inch Drive Heavy Duty Sockets 13 11 11 0%1inch Drive T-Bar 8 8 8 0%4inch Vices 6 6 6 0%4 X Work Benches + Cupboards 35 35 17 52%4 X Toolboxs ( Complete ) 70 52 52 0%Torgue Wrench 140 - 760 Nm 18 12 12 0%Tressels 20 17 17 0%1 X 2 Post Lift 45 31 31 0%Area Camera's 30 30 30 0%Co2 Welder 20 8 8 9%Office Divider 10 10 100%Workshop Roof Extention 35 70 68 3%Tyre Store 50 65 65 1%Large Grinder 3 2 2 0%
T 3.7.9
Total project value represents the estimated cost of the project on approval by council (including past and future expenditure as appropriate.
Capital Expenditure 2013/14: Road Services
R' 000
Capital Projects
2013/14
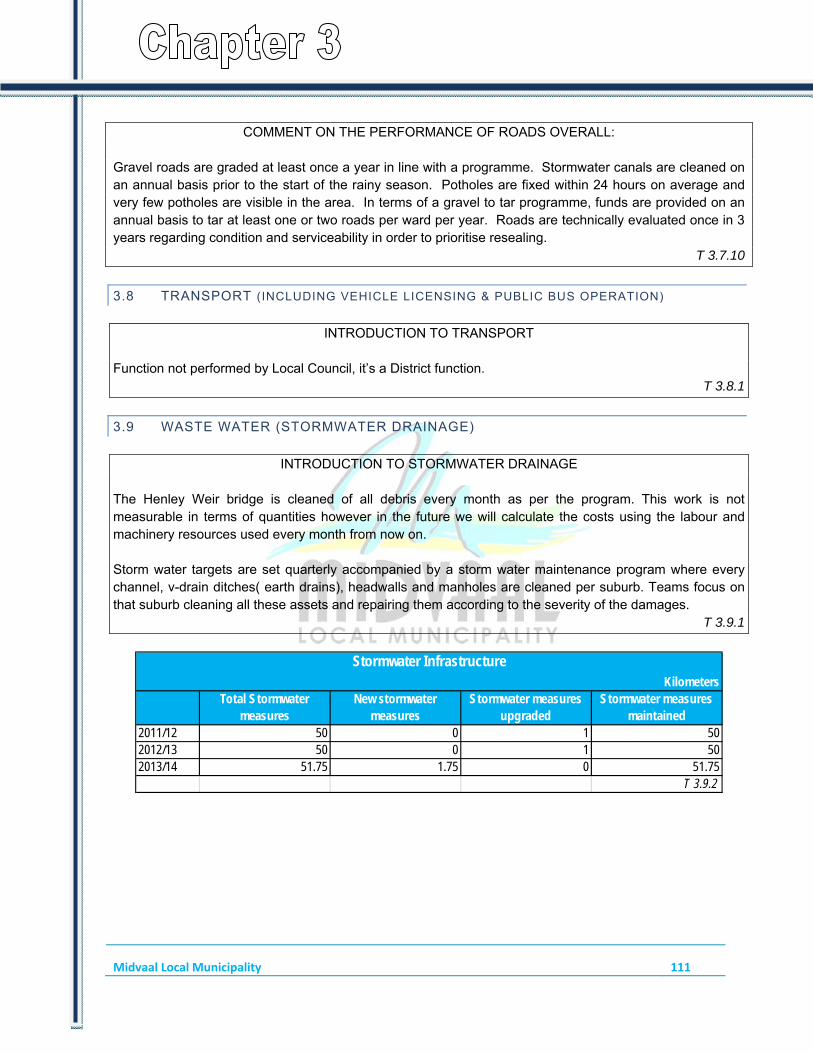
Midvaal Local Municipality 111
COMMENT ON THE PERFORMANCE OF ROADS OVERALL: Gravel roads are graded at least once a year in line with a programme. Stormwater canals are cleaned on an annual basis prior to the start of the rainy season. Potholes are fixed within 24 hours on average and very few potholes are visible in the area. In terms of a gravel to tar programme, funds are provided on an annual basis to tar at least one or two roads per ward per year. Roads are technically evaluated once in 3 years regarding condition and serviceability in order to prioritise resealing.
T 3.7.10
3.8 TRANSPORT (INCLUDING VEHICLE LICENSING & PUBLIC BUS OPERATION)
INTRODUCTION TO TRANSPORT Function not performed by Local Council, it’s a District function.
T 3.8.1
3.9 WASTE WATER (STORMWATER DRAINAGE)
INTRODUCTION TO STORMWATER DRAINAGE The Henley Weir bridge is cleaned of all debris every month as per the program. This work is not measurable in terms of quantities however in the future we will calculate the costs using the labour and machinery resources used every month from now on. Storm water targets are set quarterly accompanied by a storm water maintenance program where every channel, v-drain ditches( earth drains), headwalls and manholes are cleaned per suburb. Teams focus on that suburb cleaning all these assets and repairing them according to the severity of the damages.
T 3.9.1
Total Stormwater measures
New stormwater measures
Stormwater measures upgraded
Stormwater measures maintained
2011/12 50 0 1 502012/13 50 0 1 502013/14 51.75 1.75 0 51.75
T 3.9.2
Stormwater InfrastructureKilometers
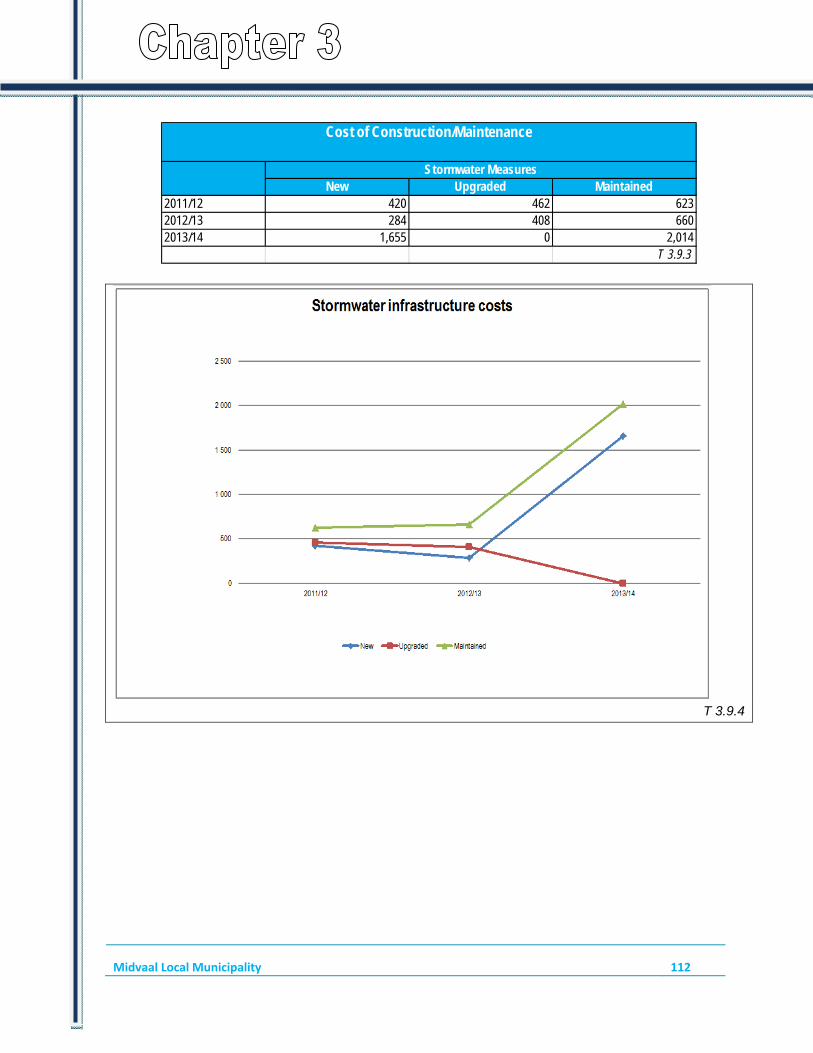
Midvaal Local Municipality 112
New Upgraded Maintained2011/12 420 462 6232012/13 284 408 6602013/14 1,655 0 2,014
T 3.9.3
Cost of Construction/Maintenance
Stormwater Measures
T 3.9.4

Midvaal Local Municipality 113
Service Objectives Year 1Target Actual Actual
Service Indicators *Previous Year
*Previous Year *Current Year*Current Year *Current Year *Following Year
(i) (ii) (iii) (iv) (v) (vi) (vii) (viii) (ix) (x)
T 3.9.5
Service Objective xxx
Note: This statement should include no more than the top four priority service objectives. The indicators and targets specified above (columns (i) and (ii)) must be incoporated in the indicator set for each municipality to which they apply. These are 'universal municipal indicators'. * 'Previous Year' refers to the targets that were set in the Year -1 Budget/IDP round; *'Current Year' refers to the targets set in the Year 0 Budget/IDP round. *'Following Year' refers to the targets set in the Year 1 Budget/IDP round. Note that all targets in the IDP must be fundable within approved budget provision. MSA 2000 chapter 5 sets out the purpose and character of Intergrated Development Plans (IDPs) and chapter 6 sets out the
Stormwater Policy Objectives Taken From IDPOutline Service Targets Year -1 Year 0 Year 3
Target Target
See Annexure T
2012/13Employees Posts Employees Vacancies (fulltime
equivalents)Vacancies (as a % of
total posts)
No. No. No. No. %0 - 34 - 67 - 9
10 - 1213 - 1516 - 1819 - 20Total 0 0 0 0
Employees: Stormmwater Services
Job Level
2013/14
Totals should equate to those included in the Chapter 4 total employee schedule. Employees and Posts numbers are as at 30 June. *Posts must be established and funded in the approved budget or adjustments budget. Full-time equivalents are calculated by taking the total number of working days lost (excluding weekends and public holidays) while a post remains vacant and adding together all such days lost by all posts within the same set (e.g. ‘senior management’) then dividing that total by 250 to give the number of posts equivalent to the accumulated days. T 3.9.6
captured as part of roads employees
2012-13Actual Original Budget Adjustment
BudgetActual Variance to Budget
Total Operational Revenue 1 000 1 355 1 355 1 355 0%
Expenditure:
Employees 5 229 6 364 5 271 3 779 -68%
Repairs and Maintenance 103 112 77 70 -60%
Other 2 566 3 836 4 817 3 780 -1%
Total Operational Expenditure 7 898 10 311 10 164 7 628 -35%
Net Operational Expenditure 7 898 10 311 10 164 7 628 -35%
T 3.9.7
Financial Performance 2013/14: Engineering AdminR'000
Details
2013/14
Net expenditure to be consistent with summary T 5.1.2 in Chapter 5. Variances are calculated by dividing the difference between the Actual and Original Budget by the Actual.

Midvaal Local Municipality 114
Budget Adjustment Budget
Actual Expenditure
Variance from original budget
Total Project Value
Total All
T 3.9.8
Capital Expenditure 2013/14: Stormwater ServicesR' 000
Capital Projects
2013/14
Total project value represents the estimated cost of the project on approval by council (including past and future expenditure as appropriate.
None
COMMENT ON THE PERFORMANCE OF STORMWATER DRAINAGE OVERALL: Two capital projects for storm water was done during the year. A channel was paved at Winchester Road at a cost of R284 000 in order to reduce erosion and at Seymore Road a channel and kerbing was done at a cost of R408 000 to stop flooding into residential properties. These two projects formed part of a combined budget for roads and storm water upgrading and a portion of this budget was allocated for these two projects. The final cost was the same as the estimate
T3.9.9
COMPONENT C: PLANNING AND DEVELOPMENT This component includes: planning; and local economic development.
INTRODUCTION TO PLANNING AND DEVELOPMENT Midvaal Local Municipality has a Spatial Development Framework that is supported by well-informed land-use policies, and aligned with the IDP. Most of the urban development is situated in close proximity to the main routes, such as the R82 and the R59. The R59 presents the opportunity to be developed as a modern development corridor that supports some of the existing communities in Midvaal Local Municipality. The rural population forms 64% of the Midvaal population, and is one of the biggest weaknesses from an economic development and physical planning point of view. The result is unsatisfactory service levels and socio-economic development in the rural areas. Future food security is important to Midvaal Local Municipality and a lot of effort is being directed to protect the integrity of the agricultural areas.
T 3.10

Midvaal Local Municipality 115
3.10 PLANNING
INTRODUCTION TO PLANNING The essence of the Midvaal Local Municipality’s service delivery objectives are captured in the economic growth and development focus area, and is encapsulated in Objective 1A: Planning and Regulating Growth. This objective comprises 13 programmes, and includes: 1. Maintain a well planned and implementable spatial development framework and related land use policies and
strategies. 2. Promotion of spatial integration and diversity of economic activities. 3. Discourage urban sprawl. 4. Protect and actively manage the environment. 5. Protect economically viable agricultural land. 6. Promote tourism development. 7. Protect the central business district (CBD). 8. Promote compact towns. 9. Formulate a uniform land use management scheme. 10. Maintain good turn around times on land use applications and building plan approvals. 11. Enforcement of legislation and by-laws. 12. Protection of vacant land. 13. Design and review land use policies
T 3.10.1
2012/13 2013/14 2012/13 2013/14 2012/13 2013/14
Planning application received 3 4 36 31 616 653
Determination made in year of receipt 0 0 3 3 535 411
Determination made in following year 0 3 0 1 81 69
Applications withdrawn 0 0 2 0 12 0
Applications outstanding at year end 3 4 31 28 70 242T 3.10.2
Applications for Land Use DevelopmentFormalisation of Townships Rezoning Built EnviromentDetail
Service Objectives Year 1Target Actual Actual
Service Indicators *Previous Year
*Previous Year *Current Year*Current Year *Current Year *Following Year
(i) (ii) (iii) (iv) (v) (vi) (vii) (viii) (ix) (x)
T 3.10.3
Note: This statement should include no more than the top four priority service objectives. The indicators and targets specified above (columns (i) and (ii)) must be incoporated in the indicator set for each municipality to which they apply. These are 'universal municipal indicators'. * 'Previous Year' refers to the targets that were set in the Year -1 Budget/IDP round; *'Current Year' refers to the targets set in the Year 0 Budget/IDP round. *'Following Year' refers to the targets set in the Year 1 Budget/IDP round. Note that all targets in the IDP must be fundable within approved budget provision. MSA 2000 chapter 5 sets out the purpose and character of Intergrated Development Plans (IDPs) and chapter 6 sets
Planning Policy Objectives Taken From IDPOutline Service
TargetsYear -1 Year 0 Year 3
Target Target
See Annexure T

Midvaal Local Municipality 116
2012/13Employees Posts Employees Vacancies (fulltime
equivalents)Vacancies (as a % of
total posts)
No. No. No. No. %0 - 3 3 5 4 1 20%4 - 6 11 13 10 3 23%7 - 9 7 6 6 0 0%
10 - 12 0 0 0 013 - 15 2 2 2 0 0%16 - 18 019 - 20Total 23 26 22 4 15%
Employees: Planning Services
Job Level
2013/14
Totals should equate to those included in the Chapter 4 total employee schedule. Employees and Posts numbers are as at 30 June. *Posts must be established and funded in the approved budget or adjustments budget. Full-time equivalents are calculated by taking the total number of working days lost (excluding weekends and public holidays) while a post remains vacant and adding together all such days lost by all posts within the same set (e.g. ‘senior management’) then dividing that total by 250 to give the number of posts equivalent to the accumulated days. T 3.10.4
2012/13Actual Original Budget Adjustment
BudgetActual Variance to
Budget
Total Operational Revenue 1 897 1 841 1 997 1 906 3%
Expenditure:
Employees 12 081 12 915 11 844 9 684 -33%
Repairs and Maintenance 41 85 164 130 35%
Other 4 189 10 445 6 303 4 937 -112%
Total Operational Expenditure 16 310 23 444 18 312 14 751 -59%
Net Operational Expenditure 16 310 23 444 18 312 14 751 -59%
T 3.10.5
Financial Performance 2013/14: Planning Services R'000
Details
2013/14
Net expenditure to be consistent with summary T 5.1.2 in Chapter 5. Variances are calculated by dividing the difference between the Actual and Original Budget by the Actual.
Budget Adjustment Budget
Actual Expenditure
Variance from original budget
Total Project Value
Total All 38 36 36
Computer replacements 38 36 36 -4%
T 3.10.6Total project value represents the estimated cost of the project on approval by council (including past and future expenditure as appropriate.
Capital Expenditure 2013/14: Planning Services
R' 000
Capital Projects
2013/14

Midvaal Local Municipality 117
COMMENT ON THE PERFORMANCE OF PHYSICAL PLANNING OVERALL: Physical planning in Midvaal has been further enhanced through the integration of the new Midvaal SDF with the Midvaal IDP. Direction is given to sector departments and developers alike through the implementation of the three Regional SDF’s and the various precinct plans and policies that were developed. Two additional Precinct Plans were adopted by Council. The Building Control section has increased the law enforcement component of the Municipality and is working closely with Council’s panel of attorneys to ensure that cases are expedited. Systems such as an electronic tracking system are being put in place on an on-going basis to ensure that the turn-around times dealing with applications are reduced.
T 3.10.7
3.11 LOCAL ECONOMIC DEVELOPMENT (INCLUDING TOURISM AND MARKET PLACES)
INTRODUCTION TO ECONOMIC DEVELOPMENT Paramount to the improvement of the quality of life for Midvaal residents is the creation of employment opportunities. Employment opportunities are normally associated with a sustainable growing economy, which creates employment opportunities. Midvaal Local Municipality promotes local economic empowerment through the implementation of the Expanded Public Works Programme (EPWP), and the Community Works Programme (CWP) The importance of Local Economic Development as part the growing of the economic sector is entrenched in the following definition of Local Economic Development: “The purpose of Local Economic Development (LED) is to build up the economic capacity of a local area to improve its economic future and the quality of life for all. It is a process by which public, business and non-governmental sector partners work collectively to create better conditions for economic growth and employment generation”. It is by building up the economic capacity of a local area to improve its economic future and the quality of life for all that this definition is being fulfilled. It is a process by which public, business and non-governmental sector partners work collectively to create better conditions for economic growth and employment generation (Reference - World Bank). Job creation and eradication of poverty remain some of the highest priorities for South Africa. The problem however remains that job creation is occurring in the secondary and tertiary industries, while many people lack the necessary skills and education to benefit from this. This necessitates a focus on specific projects that would benefit the poorest of the poor, people with insufficient education and skill levels and more particularly people in rural areas, who are most adversely affected by poverty. Efforts in this regard however have to be sustainable and viable in the long term and therefore have to move away from the “subsistence mentality” focusing on conventional sewing, poultry and vegetable garden projects. The Council adopted the Draft Midvaal LED Strategy in 2013/14 and Midvaal Local Municipality facilitated the training of 507 individuals. Through the assistance of the Department of Rural Development and Land

Midvaal Local Municipality 118
Reform as a consultant appointed to compile a full economic analysis for Midvaal. The project commenced in 2013/14 and will be completed in the 2014/15 financial year. The economic analysis will guide best practice initiatives that could be implemented to facilitate the sustainable growth in the economy. Midvaal Local Municipality are implementing various spatial development initiatives to strengthen the Urban Development Boundaries and corridors, within the bigger Gauteng City Region concept.
T 3.11.1
Sector 2011/2012 2012/13 2013/14Agric, forestry and fishing 43,400 43,400 43,400Mining and quarrying 6,970 6,970 6,970Manufacturing 779,272 779,272 779,272Wholesale and retail trade 426,111 426,111 426,111Finance, property, etc. 681,028 681,028 681,028Govt, community and social services 667,814 667,814 667,814Infrastructure services 219,890 219,890 219,890
Total 2,824,485 2,824,485 2,824,485T 3.11.2
Economic Activity by Sector
Jobs2010/2011 2011/2012 2012/13
No. No. No.Agric, forestry and fishingMining and quarryingManufacturingWholesale and retail trade Information not availableFinance, property, etc.Govt, community and social servicesInfrastructure servicesTotal
T 3.11.3
Economic Employment by Sector
Sector
COMMENT ON LOCAL JOB OPPORTUNITIES: The Midvaal Local Municipality fully understands the importance of eradicating unemployment through the creation of sustainable job opportunities. Short term initiatives include the EPWP, and the CWP. The importance of the second economy has been recognised. Formal employment opportunities in the first economy are continually being provided along the R59 corridor as this is where the most of the new commercial and industrial developments are being established. There is a decline in agricultural practices with a resultant decline in employment in this sector. The most recent development is Paramount Trailers and Chinese Animal Food manufacturing and distribution. Savanna City agreements will be concluded during August 2013 and many job opportunities will present itself during 2013/2014
T 3.11.4

Midvaal Local Municipality 119
Jobs created Jobs lost/displaced by other initiatives
Net total jobs created in year
Method of validating jobs created/lost
No. No. No.Total (all initiatives)
2011/12 22 0 22Members employed on Bantu Bonke Agrivillage Project
2012/13 812 0 812 CWP, Matla Foundation, Bantu Bonke2013/14 871 0 871 CWP & Savanna city
T 3.11.5
Jobs Created by LED Initiatives (Excluding EPWP projects)Total Jobs created / Top 3
initiatives
EPWP Projects Jobs created through EPWP projects
No. No.
2011/12 13 602012/13 13 932013/14 15 297* - Extended Public Works Programme T 3.11.6
Job creation through EPWP* projects
Details
Service Objectives Year 1Target Actual Actual
Service Indicators *Previous Year
*Previous Year *Current Year*Current Year *Current Year *Following Year
(i) (ii) (iii) (iv) (v) (vi) (vii) (viii) (ix) (x)
T 3.11.7
Note: This statement should include no more than the top four priority service objectives. The indicators and targets specified above (columns (i) and (ii)) must be incoporated in the indicator set for each municipality to which they apply. These are 'universal municipal indicators'. * 'Previous Year' refers to the targets that were set in the Year -1 Budget/IDP round; *'Current Year' refers to the targets set in the Year 0 Budget/IDP round. *'Following Year' refers to the targets set in the Year 1 Budget/IDP round. Note
Local Economic Development Policy Objectives Taken From IDPOutline Service
TargetsYear -1 Year 0 Year 3
Target Target
See Annexure T

Midvaal Local Municipality 120
2012/13Employees Posts Employees Vacancies (fulltime
equivalents)Vacancies (as a % of
total posts)
No. No. No. No. %0 - 3 0 0 0 04 - 6 1 1 1 0 0%7 - 9 0 0 0 0
10 - 12 0 0 0 013 - 15 0 0 0 016 - 18 0 0 0 019 - 20 0 0 0 0Total 1 1 1 0 0%
Employees: Local Economic Development Services
Job Level
2013/14
Totals should equate to those included in the Chapter 4 total employee schedule. Employees and Posts numbers are as at 30 June. *Posts must be established and funded in the approved budget or adjustments budget. Full-time equivalents are calculated by taking the total number of working days lost (excluding weekends and public holidays) while a post remains vacant and adding together all such days lost by all posts within the same set (e.g. ‘senior management’) then dividing that total by 250 to give the number of posts equivalent to the accumulated days. T 3.11.8
2012/13Actual Original Budget Adjustment
BudgetActual Variance to
Budget
Total Operational Revenue
Expenditure:
Employees
Repairs and Maintenance
Other
Total Operational Expenditure
Net Operational Expenditure
T 3.11.9
Financial Performance 2013/14: Local Economic Development Services R'000
Details2013/14
Net expenditure to be consistent with summary T 5.1.2 in Chapter 5. Variances are calculated by dividing the difference between the Actual and Original Budget by the Actual.
Budget Adjustment Budget
Actual Expenditure
Variance from original budget
Total Project Value
Total All
T 3.11.10
Capital Expenditure 2013/14: Economic Development ServicesR' 000
Capital Projects
2013/14
Total project value represents the estimated cost of the project on approval by council (including past and future expenditure as appropriate.
None

Midvaal Local Municipality 121
COMMENT ON LOCAL ECONOMIC DEVELOPMENT PERFORMANCE OVERALL: The LED section of Midvaal played an important role in promoting IGR and developing opportunities for local SMME’s. The section developed a marketing brochure that will be used to attract investors to Midvaal. The LED officer was directly involved in the Bantu Bonke project and provided an important liaison function between the stakeholders, community and the Midvaal Local Municipality. The implementation of the Community Works Programme has been enhanced through the establishment of a good working relationship between the Midvaal LED Officer, Ward Councillors and Committees and the Local Implementing Agent. It is anticipated that the newly adopted LED Strategy will give direction to new sustainable initiatives throughout the Municipal area. In terms of social responsibility the public sector is also contributing towards training and skills transferred to SMME’s.
T 3.11.11
COMPONENT D: COMMUNITY & SOCIAL SERVICES
This component includes: libraries and archives; museums arts and galleries; community halls; cemeteries and crematoria; child care; aged care; social programmes, theatres.
INTRODUCTION TO COMMUNITY AND SOCIAL SERVICES
Community and Social Services strives to improve the quality of life for all Midvaal residents, from the cradle to the grave, by ensuring access to health, information and recreation in a safe, secure, clean and sustainable environment and by providing the core principles, mechanisms and processes that are necessary to empower and uplift previously disadvantaged communities.
T 3.52
3.12 LIBRARIES; ARCHIVES; MUSEUMS; GALLERIES; COMMUNITY FACILITIES; OTHER (THEATRES, ZOOS, ETC)
INTRODUCTION TO LIBRARIES; ARCHIVES; MUSEUMS; GALLERIES; COMMUNITY FACILITIES Libraries can be regarded as both social and community facilities. A community library is the local gateway to knowledge. It provides basic conditions for lifelong learning, independent decision making and cultural development. Libraries and Information Services enable intellectual freedom by providing access to information, ideas and works of imagination. Libraries seek to provide information and ideas that are fundamental to function successfully in today's information and knowledge-based society. Community Libraries are also actively involved in community development through programmes, projects and activities that facilitate capacity building and empowerment opportunities. Midvaal library services are also actively involved in early childhood development through the provision of educational toy-library services.

Midvaal Local Municipality 122
Midvaal libraries consist of 5 library facilities (Meyerton, Henley-on-Klip, Randvaal, De Deur and Sicelo) ) Lakeside Library is still in a building process and will be operational from October 2014, as well as several library outreach services to the rural and disadvantaged communities of Lakeside, Bantu Bonke, Mamello, Tikello and Alewynspoort.
T3.12.1
SERVICE STATISTICS FOR LIBRARIES; ARCHIVES; MUSEUMS; GALLERIES; COMMUNITY FACILITIES; OTHER
The provision of library and information services within the municipality includes the following:
Leisure reading, general enquiries, assistance with school projects and homework, study areas, photocopying services, computing services, assisting people in need of help, creating and strengthening reading habits in children, facilitation of reading activities and story hours, community information, supporting individual and self-conducted education, providing access to local, regional, national and global resources, providing information for knowledge, understanding, imagination and enjoyment, non-formal education, informal education, outreach services, extension services and community development work. Service Statistics for libraries (registered members) Meyerton Library - 19280 Henley on Klip Library - 8857 De Deur Library - 5340 Randvaal Library - 3750 Sicelo Library - 2926 Vaal Marina Depot - 40 Meyerton Old Age Home - 64 Randvaal Old Age Home - 15 De Deur Old Age Home – 12 Outreach Services (Attendance) Alewynspoort Outreach - 151 Bantu Bonke Outreach -577 Lakeside Outreach – 1124 Tikelo School Outreach -558 Educational Toy Library - 900
T 3.12.2

Midvaal Local Municipality 123
Service Objectives Year 1Target Actual Actual
Service Indicators *Previous Year
*Previous Year *Current Year*Current Year *Current Year *Following
Year(i) (ii) (iii) (iv) (v) (vi) (vii) (viii) (ix) (x)
T 3.12.3
Note: This statement should include no more than the top four priority service objectives. The indicators and targets specified above (columns (i) and (ii)) must be incoporated in the indicator set for each municipality to which they apply. These are 'universal municipal indicators'. * 'Previous Year' refers to the targets that were set in the Year -1 Budget/IDP round; *'Current Year' refers to the targets set in the Year 0 Budget/IDP round. *'Following Year' refers to the targets set in the Year 1
Libraries; Archives; Museums; Galleries; Community Facilities; Other Policy Objectives Taken From IDPOutline Service
TargetsYear -1 Year 0 Year 3
Target Target
See Annexure T
2012/13Employees Posts Employees Vacancies (fulltime
equivalents)Vacancies (as a % of
total posts)
No. No. No. No. %0 - 3 04 - 6 4 6 6 0 0%7 - 9 13 13 12 1 8%
10 - 12 5 0 0 013 - 15 5 5 5 5 100%16 - 18 019 - 20 0Total 22 24 23 6 25%
Employees: Libraries; Archives; Museums; Galleries; Community Facilities; Other
Job Level
2013/14
Totals should equate to those included in the Chapter 4 total employee schedule. Employees and Posts numbers are as at 30 June. *Posts must be established and funded in the approved budget or adjustments budget. Full-time equivalents are calculated by taking the total number of working days lost (excluding weekends and public holidays) while a post remains vacant and adding together all such days lost by all posts within the same set (e.g. ‘senior management’) then dividing that total by 250 to give the number of posts equivalent to the accumulated days. T 3.12.4
2012/13Actual Original Budget Adjustment
BudgetActual Variance to
Budget
Total Operational Revenue 4 326 7 741 7 741 7 788 1%Expenditure:
Employees 4 770 5 320 4 798 3 838 -39% Repairs and Maintenance 113 197 137 126 -56% Other 1 925 1 987 2 498 1 855Total Operational Expenditure 6 808 7 505 7 432 5 819 -29%
Net Operational Expenditure 6 808 7 505 7 432 5 819 -29%
T 3.12.5
Financial Performance Year 2013/14: Libraries; Archives; Museums; Galleries; Community Facilities; OtherR'000
2012-13
2013/14
Net expenditure to be consistent with summary T 5.1.2 in Chapter 5. Variances are calculated by dividing the difference between the Actual and Original Budget by the Actual.

Midvaal Local Municipality 124
2012/13Actual Original Budget Adjustment
BudgetActual Variance to
Budget
Total Operational Revenue 185 269 269Expenditure:
Employees 3 419 3 446 2 935 2 904 -19% Repairs and Maintenance 16 163 124 38 -334% Other 957 886 1 569 1 392Total Operational Expenditure 4 392 4 496 4 628 4 333 -4%Net Operational Expenditure 4 392 4 496 4 628 4 333 -4%
T 3.12.5A
Financial Performance Year 2013/14: Social Services AdminR'000
2012-13
2013/14
Net expenditure to be consistent with summary T 5.1.2 in Chapter 5. Variances are calculated by dividing the difference between the Actual and Original Budget by the Actual.
Budget Adjustment Budget
Actual Expenditure
Variance from original budget
Total Project Value
Total All 5 250 5 450 5 123 -2%
Lakeside Library (Mig) 5 050 5 350 4 826 -5%
Furniture & Equipment (Dsrac) 100 100 87 -14%
Library books 100 210 52%
T 3.12.6
Capital Expenditure 2013/14: Libraries; Archives; Museums; Galleries; Community Facilities; Other
R' 000
Capital Projects
2013/14
Total project value represents the estimated cost of the project on approval by council (including past and future expenditure as appropriate.
COMMENT ON THE PERFORMANCE OF LIBRARIES; ARCHIVES; MUSEUMS; GALLERIES; COMMUNITY FACILITIES; OTHER (THEATRES, ZOOS, ETC) OVERALL:
Midvaal libraries have been able to spend all Conditional Grant Allocations received according to the approved business plans and provisional time frames since the initiation of the Conditional Grant in 2007. Therefore all Conditional Grant Projects have been implemented successfully with all funds spent within the specific Financial Year.
T 3.12.7

Midvaal Local Municipality 125
3.13 CEMETORIES AND CREMATORIUMS
INTRODUCTION TO CEMETORIES & CREMATORIUMS To provide accessible, safe cemeteries to all residents of Midvaal. To maintain all cemeteries at an acceptable standard. Implementing by-laws on cemeteries. Managing and Providing burial function / admin and providing bookings for paupers and indigents.
T 3.13.1
SERVICE STATISTICS FOR CEMETORIES & CREMATORIUMS The Maintenance and operational service is delivered via a contractor - Budget: R 268 800. Total financial activities: Total Income: R 568 351.47; Total count 505 (Includes all cemeteries activities such as graves dug, head stones and other). Provision of R 750 00.00 was however made on the Capital Expenditure Budget for the expansion and development of existing and new burial sites to ensure the sustainable compliance to the ever increasing demand for more and safe cemeteries. The expansion and development was completed and burials started 1 Aug 2013. Irrigation was installed and trees were planted.
T 3.13.2
Service Objectives Year 1Target Actual Actual
Service Indicators *Previous Year
*Previous Year *Current Year*Current Year *Current Year *Following Year
(i) (ii) (iii) (iv) (v) (vi) (vii) (viii) (ix) (x)
T 3.13.3
Note: This statement should include no more than the top four priority service objectives. The indicators and targets specified above (columns (i) and (ii)) must be incoporated in the indicator set for each municipality to which they apply. These are 'universal municipal indicators'. * 'Previous Year' refers to the targets that were set in the Year -1 Budget/IDP round; *'Current Year' refers to the targets set in the Year 0 Budget/IDP round. *'Following Year' refers to the targets set in the Year 1 Budget/IDP round. Note that all targets in the IDP must be fundable within approved budget provision. MSA 2000 chapter 5 sets out the purpose and character of Intergrated Development Plans
Cemetories and Crematoriums Policy Objectives Taken From IDPOutline Service
TargetsYear -1 Year 0 Year 3
Target Target
See Annexure T

Midvaal Local Municipality 126
2012/13Employees Posts Employees Vacancies (fulltime
equivalents)Vacancies (as a % of
total posts)
No. No. No. No. %0 - 3 04 - 6 07 - 9 0
10 - 12 013 - 15 016 - 18 019 - 20 0Total 0 0 0 0
Employees: Cemetories and Cremotoriums
Job Level
2013/14
Totals should equate to those included in the Chapter 4 total employee schedule. Employees and Posts numbers are as at 30 June. *Posts must be established and funded in the approved budget or adjustments budget. Full-time equivalents are calculated by taking the total number of working days lost (excluding weekends and public holidays) while a post remains vacant and adding together all such days lost by all posts within the same set (e.g. ‘senior management’) then dividing that total by 250 to give the number of posts equivalent to the accumulated days. T 3.13.4
2012/13Actual Original Budget Adjustment
BudgetActual Variance to
Budget
Total Operational Revenue 482 615 615 499 -23%Expenditure: Employees 0% Repairs and Maintenance 4 21 21 0% Other 355 280 379 376 25%Total Operational Expenditure 358 302 401 376 20%Net Operational Expenditure 358 302 401 376 20%
T 3.13.5
Financial Performance 2013/14: Cemetories and Crematoriums R'000
Details
2013/14
Net expenditure to be consistent with summary T 5.1.2 in Chapter 5. Variances are calculated by dividing the difference between the Actual and Original Budget by the Actual.
Budget Adjustment Budget
Actual Expenditure
Variance from original budget
Total Project Value
Total All 1 250 750 729 -71%
Extension of Kookrus Cemetry 1 250 750 729 -71%
T 3.13.6
Capital Expenditure 2013/14: Cemetories and Crematoriums R' 000
Capital Projects2013/14
Total project value represents the estimated cost of the project on approval by council (including past and future expenditure as appropriate.

Midvaal Local Municipality 127
COMMENT ON THE PERFORMANCE OF CEMETORIES & CREMATORIUMS OVERALL: Midvaal L/M succeeded in providing a high standard of well-maintained and sustainable cemetery services to all communities in Midvaal. The operational maintenance of the cemeteries (grass cutting, cleaning of the area etc.) is done partly in-house and partly by an external service provider. The actual cemetery function (digging of graves, burial site layout etc.) is being performed by an external service provider as provided for on the operational expenditure budget.
T 3.13.7
3.14 CHILD CARE; AGED CARE; SOCIAL PROGRAMMES
INTRODUCTION TO CHILD CARE; AGED CARE; SOCIAL PROGRAMMES Process for database creation for people with disabilities is in process. An exit programme for indigent people who have been earmarked for tissue manufacturing training (women) is in place. There are also youth programmes with Midvaal Youth Development Centre for business skills, Information Technology Training and other skills T 3.14.1
SERVICE STATISTICS FOR CHILD CARE T 3.14.2
Service Objectives Year 1
Target Actual Actual
Service Indicators *Previous Year
*Previous Year *Current Year*Current Year *Current Year *Following
Year(i) (ii) (iii) (iv) (v) (vi) (vii) (viii) (ix) (x)
T 3.14.3
Note: This statement should include no more than the top four priority service objectives. The indicators and targets specified above (columns (i) and (ii)) must be incoporated in the indicator set for each municipality to which they apply. These are 'universal municipal indicators'. * 'Previous Year' refers to the targets that were set in the Year -1 Budget/IDP round; *'Current Year' refers to the targets set in the Year 0 Budget/IDP round. *'Following Year' refers to the targets set in the Year 1 Budget/IDP round. Note that all targets in the IDP must be fundable within approved budget provision. MSA 2000 chapter 5 sets out the purpose and character of
Child Care; Aged Care; Social Programmes Policy Objectives Taken From IDPOutline Service
TargetsYear -1 Year 0 Year 3
Target Target
See Annexure T

Midvaal Local Municipality 128
2012/13Employees Posts Employees Vacancies (fulltime
equivalents)Vacancies (as a % of
total posts)
No. No. No. No. %0 - 3 04 - 6 07 - 9 0
10 - 12 013 - 15 016 - 18 019 - 20 0Total 0 0 0 0
Employees: Child Care; Aged Care; Social Programmes
Job Level
2013/14
Totals should equate to those included in the Chapter 4 total employee schedule. Employees and Posts numbers are as at 30 June. *Posts must be established and funded in the approved budget or adjustments budget. Full-time equivalents are calculated by taking the total number of working days lost (excluding weekends and public holidays) while a post remains vacant and adding together all such days lost by all posts within the same set (e.g. ‘senior management’) then dividing that total by 250 to give the number of posts equivalent to the accumulated days. T 3.14.4
2012/13Actual Original Budget Adjustment
BudgetActual Variance to
Budget
Total Operational Revenue
Expenditure:
Employees
Repairs and Maintenance
Other
Total Operational Expenditure
Net Operational Expenditure
T 3.14.5
Financial Performance Year 0: Child Care; Aged Care; Social ProgrammesR'000
Details
2013/14
Net expenditure to be consistent with summary T 5.1.2 in Chapter 5. Variances are calculated by dividing the difference between the Actual and Original Budget by the Actual.
Budget Adjustment Budget
Actual Expenditure
Variance from original budget
Total Project Value
Total All 200 183 183 9%
Sosial Admin: 1 x LDV Replacement 200 183 183 9%
T 3.14.6
Capital Expenditure 2013/14: Child Care; Aged Care; Social ProgrammesR' 000
Capital Projects
20103/14
Total project value represents the estimated cost of the project on approval by council (including past and future expenditure as appropriate.
Midvaal Local Municipality 129
COMMENT ON THE PERFORMANCE OF CHILD CARE; AGED CARE; SOCIAL PROGRAMMES OVERALL:
1. Service level agreement with Hollard foundation signed. 2. Data base for children (indigent) who are not on the Municipal indigent system was created with Hollard Foundation.
T 3.14.7
COMPONENT E: ENVIRONMENTAL PROTECTION This component includes: pollution control; biodiversity and landscape;
INTRODUCTION TO ENVIRONMENTAL PROTECTION Environmental Protection strives to protect and sustain our environment for the present and future generations. The aim is to ensure a comprehensive and sustainable environment for all communities. It will ensure safe food, water, air and land usage. The unit will coordinate the It aims to coordinate the implementation of pollution control strategies for all environmental pollution, as well as promote sustainable utilisation and conservation of biological diversity and natural processes for the development of all communities.
T 3.15
3.15 POLLUTION CONTROL
INTRODUCTION TO POLLUTION CONTROL The Constitution of the Republic of South Africa defines the provision of Municipal Health Services (non personal health) as a function of local government in terms of Schedule 4 B. Section 84 of the Municipal Structures Act further determines that Districts must render Municipal Health Services (MHS) for the District as a whole. The Sedibeng District Council resolved to render MHS on an agency basis through a Service Level Agreement with the respective local municipalities within its area of jurisdiction as from 1 July 2004. Given that MHS is currently either regarded as the same as or part of Environmental Health Services (EHS), The World Health Organization (WHO) perceives environmental health as addressing: “all the physical, chemical and biological factors external to a person and all the related factors impacting behaviours”. Thus MHS also means the assessment, monitoring, correction, control and prevention of environmental health factors that can adversely affect human health. The National Health Act, 61 of 2003, further defines MHS as services that include:
1. Water quality monitoring 2. Food control

Midvaal Local Municipality 130
3. Waste management 4. Health surveillance of premises 5. Surveillance and prevention of communicable diseases 6. Vector control 7. Environmental pollution control 8. Disposal of the dead and 9. Chemical safety
Pollution control further relates to the identification, evaluation, monitoring and prevention of land, soil, water, noise and air pollution. Environmental pollution control is included in the definition of Municipal Health Services in the National Health Act, 60 of 2003, and is a core function of all spheres of Government in protecting the environment for future generations.
T 3.15.1
SERVICE STATISTICS FOR POLLUTION CONTROL
• Pollution control is a core function of the Environmental Health Section and thus forms part of their daily routine.
• Air pollution, ambient monitoring and licensing is currently managed by the Environmental Management Section of the Sedibeng District Council in liaison with the National Department of Environmental Affairs.
• The Environmental Health Section samples borehole water and municipal water on a monthly basis. Samples of rivers, dams and streams are conducted in liaison with the National Department of Water Affairs and the Department of Health.
• Surveillance of industrial premises with regard to possible environmental pollution activities are conducted weekly.
• Public complaints related to pollution control are investigated immediately and acted upon by issuing statutory notices for compliance.
• All statistics on various pollution factors are compiled in monthly and quarterly reports to the District and Local municipalities
• The Environmental Health Section is operationally funded by the Sedibeng District Council in terms of a Service Level Agreement to the amount of R 2 543 414.
• Capital funding is not available and all education and awareness projects and campaigns are managed under the operational budget.
T 3.15.2
Service Objectives Year 2Target Actual Actual
Service Indicators *Previous Year *Previous Year *Current Year *Current Year *Current Year *Following Year(i) (ii) (iii) (iv) (v) (vi) (vii) (viii) (ix) (x)
T 3.15.3
Note: This statement should include no more than the top four priority service objectives. The indicators and targets specified above (columns (i) and (ii)) must be incoporated in the indicator set for each municipality to which they apply. These are 'universal municipal indicators'. * 'Previous Year' refers to the targets that were set in the Year -1 Budget/IDP round; *'Current Year' refers to the targets set in the Year 0 Budget/IDP round. *'Following Year' refers to the targets set in the Year 1 Budget/IDP round. Note that
Pollution Control Policy Objectives Taken From IDPOutline Service
TargetsYear 0 Year 1 Year 3
Target Target
See Annexure T

Midvaal Local Municipality 131
2012/13Employees Posts Employees Vacancies (fulltime
equivalents)Vacancies (as a % of
total posts)
No. No. No. No. %0 - 3 04 - 6 07 - 9 0
10 - 12 013 - 15 016 - 18 019 - 20 0Total 0 0 0 0
Employees: Pollution Control
Job Level
2013/14
Totals should equate to those included in the Chapter 4 total employee schedule. Employees and Posts numbers are as at 30 June. *Posts must be established and funded in the approved budget or adjustments budget. Full-time equivalents are calculated by taking the total number of working days lost (excluding weekends and public holidays) while a post remains vacant and adding together all such days lost by all posts within the same set (e.g. ‘senior management’) then dividing that total by 250 to give the number of posts equivalent to the accumulated days. T 3.15.4
2012/13Actual Original Budget Adjustment
BudgetActual Variance to
Budget
Total Operational RevenueExpenditure: Employees Repairs and Maintenance OtherTotal Operational ExpenditureNet Operational Expenditure
T 3.15.5
Financial Performance 2013/14: Pollution ControlR'000
Details
2013/14
Net expenditure to be consistent with summary T 5.1.2 in Chapter 5. Variances are calculated by dividing the difference between the Actual and Original Budget by the Actual.
None
Budget Adjustment Budget
Actual Expenditure
Variance from original budget
Total Project Value
Total All
T 3.15.6
Capital Expenditure 2013/14: Pollution ControlR' 000
Capital Projects2013/14
Total project value represents the estimated cost of the project on approval by council (including past and future expenditure as appropriate.
None

Midvaal Local Municipality 132
COMMENT ON THE PERFORMANCE OF POLLUTION CONTROL OVERALL:
The position of the Environmental Manager is currently vacant. The Environmental Health Section continues to assist in the performance of those functions as well as with environmental health related issues pertaining to pollution control.
The vast geographical area in the jurisdiction of the local municipality creates challenges in terms of controlling in particular land pollution such as illegal dumping and illegal oil spills However, with proper controlling systems and mechanisms implemented, improved control can be exercised. Frequent follow up inspections and the issuing of statutory notices and of billing the perpetrators further assists in managing the problems.
Environmental health education and awareness programmes and environmental cleaning campaigns at primary schools, informal settlements and at previously disadvantaged communities assists in the prevention and control of environmental pollution.
T 3.15.7
3.16 BIO-DIVERSITY; LANDSCAPE (INCL. OPEN SPACES); AND OTHER
INTRODUCTION TO BIO-DIVERSITY AND LANDSCAPE To provide accessible and safe parks and open spaces To maintain all parks and open spaces at an acceptable standard To promote urban greening and forestry To create awareness of the environment through awareness campaigns, national days and weeks Tree maintenance and planting Public Open Spaces By-laws implementation
T 3.16.1
SERVICE STATISTICS FOR BIO-DIVERSITY AND LANDSCAPE Total Budget R5 411 200.00 Contracted Services R 96,000.00 Contracted Services: EPWP R1,000,000.00 Contracted Services: Grass Cutting R3,078,720.00 Contracted Services: Flowerbed Maintenance R316,800.00 Contracted Services: Tree Cutting R76,800.00 Contracted Services: Pest Control R 28,800.00 Contracted Services: Parks Reclaim R 814,080.00
T 3.16.2

Midvaal Local Municipality 133
Service Objectives Year 1Target Actual Actual
Service Indicators *Previous Year
*Previous Year *Current Year*Current Year *Current Year *Following
Year(i) (ii) (iii) (iv) (v) (vi) (vii) (viii) (ix) (x)
T 3.16.3
Note: This statement should include no more than the top four priority service objectives. The indicators and targets specified above (columns (i) and (ii)) must be incoporated in the indicator set for each municipality to which they apply. These are 'universal municipal indicators'. * 'Previous Year' refers to the targets that were set in the Year -1 Budget/IDP round; *'Current Year' refers to the targets set in the Year 0 Budget/IDP round. *'Following Year' refers to the targets set in the Year 1 Budget/IDP round. Note that all targets in the IDP must be fundable within approved budget provision. MSA 2000 chapter 5 sets out the purpose and character of Intergrated Development Plans (IDPs) and chapter 6 sets out the requirements for the reduction of performance management arrangement by municipalities in which IDPs play a key role.
Bio-Diversity; Landscape and Other Policy Objectives Taken From IDPOutline Service
TargetsYear -1 Year 0 Year 3
Target Target
See Annexure T
2012/13Employees Posts Employees Vacancies (fulltime
equivalents)Vacancies (as a % of
total posts)
No. No. No. No. %0 - 3 1 1 1 04 - 6 4 5 5 0 0%7 - 9 2 3 3 0 0%
10 - 12 30 30 29 1 3%13 - 15 6 7 7 0 0%16 - 1819 - 20Total 43 46 45 1 2%
Employees: Bio-Diversity; Landscape and Other
Job Level
2013/14
Totals should equate to those included in the Chapter 4 total employee schedule. Employees and Posts numbers are as at 30 June. *Posts must be established and funded in the approved budget or adjustments budget. Full-time equivalents are calculated by taking the total number of working days lost (excluding weekends and public holidays) while a post remains vacant and adding together all such days lost by all posts within the same set (e.g. ‘senior management’) then dividing that total by 250 to give the number of posts equivalent to the accumulated days. T 3.16.4
2012-13Actual Original Budget Adjustment
BudgetActual Variance to
Budget
Total Operational Revenue 3 775 3 117 3 117 2 426 -28%Expenditure:
Employees 1 684 2 187 2 205 1 599 -37% Repairs and Maintenance 5 185 45 42 -343% Other 663 743 865 682 -9%Total Operational Expenditure 2 352 3 115 3 115 2 322 -34%Net Operational Expenditure 2 352 3 115 3 115 2 322 -34%
T 3.16.5
Financial Performance 2013/14: Bio-Diversity; Landscape and OtherR'000
Details
2013/14
Net expenditure to be consistent with summary T 5.1.2 in Chapter 5. Variances are calculated by dividing the difference between the Actual and Original Budget by the Actual.

Midvaal Local Municipality 134
Budget Adjustment Budget
Actual Expenditure
Variance from original budget
Total Project Value
Total All 1 159 1 384 1 290 10%
2 X Large Chainsaws 30 26 26 -17%1 X 2.0 Ldv 220 217 217 -1%1 X Linemarker 15 12 12 -24%4 X Slashers 154 154 112 -38%1 X 3 Ton Trucks With Canopy (Hp) 440 380 328 -34%1 X Tractors (Hp) 300 245 245 -22%1 3 Ton Truck With Canopy(Hp) 351 351 100%
T 3.16.6
Capital Expenditure 2013/14: Bio-Diversity; Landscape and Other
R' 000
Capital Projects
2013/14
Total project value represents the estimated cost of the project on approval by council (including past and future expenditure as appropriate.
COMMENT ON THE PERFORMANCE OF BIO-DIVERSITY; LANDSCAPE AND OTHER OVERALL: Capital Project: None for the year 2013/2014.
T 3.16.7
COMPONENT F: HEALTH
This component includes: clinics; ambulance services; and health inspections.
INTRODUCTION TO HEALTH The Act gives guidance and definition to Provincial Health Care (PHC) services and Municipal Health Services. It provides decentralisation and legal structures for the operation of the district Health System.
T 3.17
3.17 CLINICS
INTRODUCTION TO CLINICS The Municipality provides PHC Services through four established clinics (one provincial) and outreach services through mobile services and health posts.
T 3.17.1

Midvaal Local Municipality 135
2012/13 2014/15Actual No. Estimate No. Actual No. Estimate No.
1 Average number of Patient visits on an average day 581 672 700
2 Total Medical Staff available on an average day 31 34 35
3 Average Pateint waiting time 2 - 3 hrs mins 2-3 hrs 2-3 hrs
4 Number of HIV/AIDS tests undertaken in the year 6108 7153 7500
5 Number of tests in 4 above that proved positive 1504 1542 1200
6 Number of children that are immunised at under 1 year of age 1279 1309 1500
7 Child immunisation s above compared with the child population under 1 year of age 72.00% % 76.00% %
Service Data for ClinicsDetails 2013/14
T 3.17.2
Concerning T 3.17.2 The National norm for waiting time for a Community Health Clinic is three to four hours. The waiting time for our clinics is reduced to maximum two hours because staff in our clinics as indicated by the staff establishment is complimented by provincial staff. The patient-staff ratio is one to fourty.
T 3.17.2.1
Service Objectives Year 2Target Actual Actual
Service Indicators *Previous Year
*Previous Year *Current Year*Current Year *Current Year *Following Year
(i) (ii) (iii) (iv) (v) (vi) (vii) (viii) (ix) (x)
T 3.17.3
Note: This statement should include no more than the top four priority service objectives. The indicators and targets specified above (columns (i) and (ii)) must be incoporated in the indicator set for each municipality to which they apply. These are 'universal municipal indicators'. * 'Previous Year' refers to the targets that were set in the Year -1 Budget/IDP round; *'Current Year' refers to the targets set in the Year 0 Budget/IDP round. *'Following Year' refers to the targets set in the Year 1 Budget/IDP round. Note that all targets in the IDP must be fundable within approved budget provision. MSA 2000 chapter 5 sets out the purpose and character of Intergrated
Clinics Policy Objectives Taken From IDPOutline Service
TargetsYear 0 Year 1 Year 3
Target Target
See Annexure T

Midvaal Local Municipality 136
2012/13Employees Posts Employees Vacancies (fulltime
equivalents)Vacancies (as a % of
total posts)
No. No. No. No. %0 - 34 - 6 57 - 9 7
10 - 1213 - 15 316 - 1819 - 20Total 15 0 0 0
Employees: Clinics
Job Level
2013/14
Totals should equate to those included in the Chapter 4 total employee schedule. Employees and Posts numbers are as at 30 June. *Posts must be established and funded in the approved budget or adjustments budget. Full-time equivalents are calculated by taking the total number of working days lost (excluding weekends and public holidays) while a post remains vacant and adding together all such days lost by all posts within the same set (e.g. ‘senior management’) then dividing that total by 250 to give the number of posts equivalent to the accumulated days. T 3.17.4
PROVINCIALISATION
2012/13Actual Original Budget Adjustment
BudgetActual Variance to
Budget
Total Operational Revenue 4 674 6 494 6 494 4 417 -47%
Expenditure:
Employees 3 807 3 749 3 642 3 119 -20%
Repairs and Maintenance 108 600 591 155 -287%
Other 1 395 1 794 1 700 1 076 -67%
Total Operational Expenditure 5 309 6 144 5 934 4 349 -41%
Net Operational Expenditure 5 309 6 144 5 934 4 349 -41%
T 3.17.5
Financial Performance 2013/14: ClinicsR'000
Details
2013/14
Net expenditure to be consistent with summary T 5.1.2 in Chapter 5. Variances are calculated by dividing the difference between the Actual and Original Budget by the Actual.

Midvaal Local Municipality | CHAPTER 3 – SERVICE DELIVERY PERFORMANCE (PERFORMANCE REPORT PART I)
137
Budget Adjustment Budget
Actual Expenditure
Variance from original budget
Total Project Value
Total All
T 3.17.6
Capital Expenditure 2013/14: Clinics
R' 000
Capital Projects2013/14
Total project value represents the estimated cost of the project on approval by council (including past and future expenditure as appropriate.
None
COMMENT ON THE PERFORMANCE OF CLINICS OVERALL: The Municipality renders the provision of Primary Health Care Services on an agency basis. The MOU with Gauteng Province gave directives for capital projects to be carried out by the provincial sphere of government, therefore no capital projects were undertaken in the last two financial years
T 3.17.7
3.18 AMBULANCE SERVICES
INTRODUCTION TO AMBULANCE SERVICES Not a Local Function, function handled by Sedibeng District Municipality.
T 3.18.1
3.19 HEALTH INSPECTION; FOOD AND ABBATOIR LICENSING AND INSPECTION; ETC
INTRODUCTION TO HEALTH INSPECTIONS; FOOD AND ABATTOIR LICENCING AND INSPECTIONS, ETC
The Constitution of the Republic of S A defines the provision of Municipal Health Services MHS (non- personal health) as a function of local government in terms of Schedule 4 B. Section 84 of the Municipal Structures Act further determines that Districts must render Municipal Health Services (MHS) for the District as a whole.

Midvaal Local Municipality 138
The Sedibeng District Council resolved to render MHS on an agency basis through a Service Level Agreement with the respective local municipalities within its area of jurisdiction as from 1 July 2004. Given that MHS is currently either regarded as the same as or part of Environmental Health Services (EHS), The World Health Organization (WHO) perceives environmental health as addressing: “all the physical, chemical and biological factors external to a person and all the related factors impacting behaviours”. Thus MHS also means the assessment, monitoring, correction, control and prevention of environmental health factors which can adversely affect human health. The National Health Act, 61 of 2003, further defines MHS as services that include:
1. Water quality monitoring 2. Food control 3. Waste management 4. Health surveillance of premises 5. Surveillance and prevention of communicable diseases 6. Vector control 7. Environmental pollution control 8. Disposal of the dead and 9. Chemical safety Thus all aspects of Environmental Health such as inspections, surveillance of premises and food control is being conducted under the National Health Act and relevant environmental health legislation.
T 3.19.1
SERVICE STATISTICS FOR HEALTH INSPECTION, ETC • The nine elements of Municipal Health Services as listed in the National Health Act are core function of the Environmental Health Section and thus form part of their daily routine. • All statistics on the various environmental health elements are compiled in monthly and quarterly reports to the District and Local municipalities • The Environmental Health Section is operationally funded by the Sedibeng District Council in terms of a Service Level Agreement to the amount of R 2 543 414. • Capital funding is not available and all education and awareness projects and campaigns are
managed under the operational budget. Thus there was no capital projects conducted.
T 3.19.2

Midvaal Local Municipality 139
Service Objectives Year 2Target Actual Actual
Service Indicators *Previous Year
*Previous Year *Current Year*Current Year *Current Year *Following
Year(i) (ii) (iii) (iv) (v) (vi) (vii) (viii) (ix) (x)
T 3.19.3
Note: This statement should include no more than the top four priority service objectives. The indicators and targets specified above (columns (i) and (ii)) must be incoporated in the indicator set for each municipality to which they apply. These are 'universal municipal indicators'. * 'Previous Year' refers to the targets that were set in the Year -1 Budget/IDP round; *'Current Year' refers to the targets set in the Year 0 Budget/IDP round. *'Following Year' refers to the targets set in the Year 1 Budget/IDP round. Note that all targets in the IDP must be fundable within approved budget provision. MSA 2000 chapter 5 sets out the purpose and character of Intergrated Development Plans (IDPs) and chapter 6 sets out the requirements for the reduction of performance management arrangement by municipalities in which IDPs play a key role.
Health Inspection and Etc Policy Objectives Taken From IDPOutline Service
TargetsYear 0 Year 1 Year 3
Target Target
See Annexure T
2012/13Employees Posts Employees Vacancies (fulltime
equivalents)Vacancies (as a % of
total posts)
No. No. No. No. %0 - 3 04 - 6 4 5 5 0 0%7 - 9 0 1 1 0 0%
10 - 12 0 1 1 013 - 15 016 - 18 019 - 20 0Total 4 7 7 0 0%
Employees: Health Inspection and Etc
Job Level
2013/14
Totals should equate to those included in the Chapter 4 total employee schedule. Employees and Posts numbers are as at 30 June. *Posts must be established and funded in the approved budget or adjustments budget. Full-time equivalents are calculated by taking the total number of working days lost (excluding weekends and public holidays) while a post remains vacant and adding together all such days lost by all posts within the same set (e.g. ‘senior management’) then dividing that total by 250 to give the number of posts equivalent to the accumulated days. T 3.19.4

Midvaal Local Municipality | CHAPTER 3 – SERVICE DELIVERY PERFORMANCE (PERFORMANCE REPORT PART I)
140
2012/13Actual Original Budget Adjustment
BudgetActual Variance to
Budget
Total Operational RevenueExpenditure: Employees Repairs and Maintenance OtherTotal Operational ExpenditureNet Operational Expenditure
T 3.19.5
Financial Performance 2013/14: Health Inspection and EtcR'000
Details
2013/14
Net expenditure to be consistent with summary T 5.1.2 in Chapter 5. Variances are calculated by dividing the difference between the Actual and Original Budget by the Actual.
Budget Adjustment Budget
Actual Expenditure
Variance from original budget
Total Project Value
Total All
T 3.19.6
Capital Expenditure 2013/14: Health Inspection and EtcR' 000
Capital Projects
2013/14
Total project value represents the estimated cost of the project on approval by council (including past and future expenditure as appropriate.
None
COMMENT ON THE PERFORMANCE OF HEALTH INSPECTIONS, ETC. OVERALL:
• The nine elements of Municipal Health Services as listed in the National Health Act are core functions of the Environmental Health Section and thus form part of their daily routine functions. These functions are performed by four operationally functional Environmental Health Practitioners and one Chief Environmental Health Practitioner responsible for strategic planning and operational implementation of strategies.
• All statistics on the various environmental health elements are compiled in monthly and quarterly reports to the District and Local municipalities
• The Environmental Health Section is operationally funded by the Sedibeng District Council in terms of a Service Level Agreement to the amount of R 2 543 414.
• Capital funding is not available and all education and awareness projects and campaigns are managed under the operational budget.
T 3.19.7
Midvaal Local Municipality 141
COMPONENT G: SECURITY AND SAFETY
This component includes: police; fire; disaster management, licensing and control of animals, and control of public nuisances, etc.
INTRODUCTION TO SECURITY & SAFETY Public Safety Traffic Police The Traffic Polices functions include traffic control and Road traffic Law enforcement. The Traffic road safety services extend to R59 Freeway but do not take account of the Vereeniging / Emfuleni area. Traffic police are mandated in addition to road safety, enforce Municipality By-Laws, Social Crime Prevention, the minimising road accidents, maintenance of law and order and the promotion of peace. Total number of Infringements issued: 10231 Duly structured and formalised Community Policing Fora are supported to the extent appropriate and feasible.
T 3.20
3.20 POLICE
INTRODUCTION TO POLICE
1. Freight/Heavy vehicle Operation Special Operations to check driver and vehicle fitness on Heavy motor vehicles. Stopped and screened: 3198 Prosecuted: 1090 2. Public Transport Operation Special Operations to check driver and vehicle fitness on Public vehicles. Stopped and screened: 1437 Prosecuted: 574 3. Special Operations with SAPS Planned special operations with the different SAPS in the Vereeniging Cluster to check driver and vehicle fitness. Stopped and screened: 2702 Total Operations: 500 4. Scholar patrol and School Training In January 2014 emphasis on scholar patrol and road safety training. Visiting schools and pre-schools training the children on road safety.
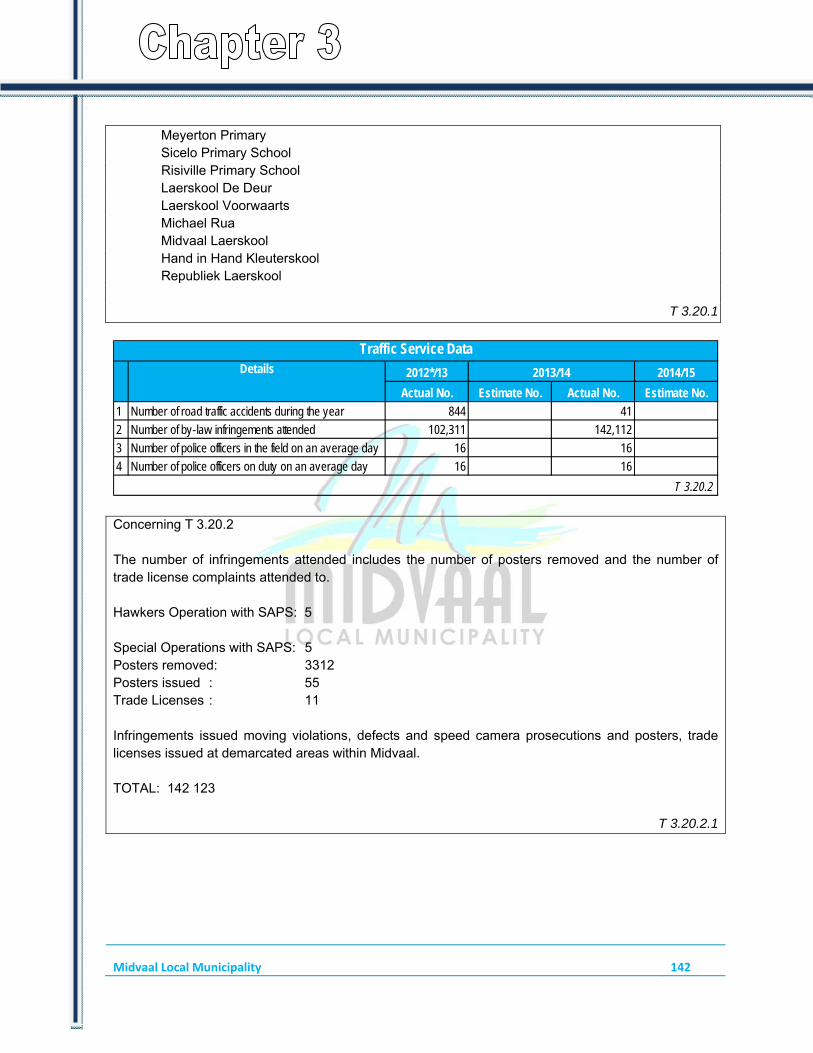
Midvaal Local Municipality 142
Meyerton Primary Sicelo Primary School Risiville Primary School Laerskool De Deur Laerskool Voorwaarts Michael Rua Midvaal Laerskool Hand in Hand Kleuterskool Republiek Laerskool
T 3.20.1
2012*/13 2014/15
Actual No. Estimate No. Actual No. Estimate No.
1 Number of road traffic accidents during the year 844 41
2 Number of by-law infringements attended 102,311 142,112
3 Number of police officers in the field on an average day 16 16
4 Number of police officers on duty on an average day 16 16
Traffic Service DataDetails 2013/14
T 3.20.2 Concerning T 3.20.2 The number of infringements attended includes the number of posters removed and the number of trade license complaints attended to. Hawkers Operation with SAPS: 5 Special Operations with SAPS: 5 Posters removed: 3312 Posters issued : 55 Trade Licenses : 11 Infringements issued moving violations, defects and speed camera prosecutions and posters, trade licenses issued at demarcated areas within Midvaal. TOTAL: 142 123
T 3.20.2.1

Midvaal Local Municipality 143
Service Objectives Year 1Target Actual Actual
Service Indicators *Previous
Year *Previous Year *Current Year*Current Year *Current Year *Following
Year(i) (ii) (iii) (iv) (v) (vi) (vii) (viii) (ix) (x)
T 3.20.3
Note: This statement should include no more than the top four priority service objectives. The indicators and targets specified above (columns (i) and (ii)) must be incoporated in the indicator set for each municipality to which they apply. These are 'universal municipal indicators'. * 'Previous Year' refers to the targets that were set in the Year -1 Budget/IDP round; *'Current Year' refers to the targets set in the Year 0 Budget/IDP round. *'Following Year' refers to the targets set in the Year 1 Budget/IDP round. Note that all targets in the IDP must be fundable within approved budget provision. MSA 2000 chapter 5 sets out the purpose and character of
Traffic Policy Objectives Taken From IDPOutline Service
TargetsYear -1 Year 0 Year 3
Target Target
See Annexure T
Job Level 2012/13Traffic Employees Posts Employees Vacancies (fulltime
equivalents)Vacancies (as a % of
total posts)
Administrators No. No. No. No. %0 - 3 2 1 1 0%4 - 6 8 8 8 0%7 - 9 20 21 21 0%
10 - 12 2 1 1 0%13 - 15 3 3 3 0%
Temp Contract 8 8 8 0%Temporary 8 8 8 0%
Total 51 50 50 0 0%
Employees: Traffic Officers
2013/14
Totals should equate to those included in the Chapter 4 total employee schedule. Employees and Posts numbers are as at 30 June. *Posts must be established and funded in the approved budget or adjustments budget. Full-time equivalents are calculated by taking the total number of working days lost (excluding weekends and public holidays) while a post remains vacant and adding together all such days lost by all posts within the same set (e.g. ‘senior management’) then dividing that total by 250 to give the number of posts equivalent to the accumulated days. T 3.20.4
2012/13Actual Original Budget Adjustment
BudgetActual Variance to
Budget
Total Operational Revenue 7 164 9 107 14 267 49 254 82%Expenditure: Police Officers 11 256 12 780 12 320 10 068 -27% Repairs and Maintenance 189 370 266 165 -124% Other 11 439 11 605 13 803 47 903 76%Total Operational Expenditure 22 885 24 755 26 389 58 137 57%Net Operational Expenditure 22 885 24 755 26 389 58 137 57%
T 3.20.5
Financial Performance Year 13/14: TrafficR'000
Details
Year 0
Net expenditure to be consistent with summary T 5.1.2 in Chapter 5. Variances are calculated by dividing the difference between the Actual and Original Budget by the Actual.
Midvaal Local Municipality | CHAPTER 3 – SERVICE DELIVERY PERFORMANCE (PERFORMANCE REPORT PART I)
144
Budget Adjustment Budget
Actual Expenditure
Variance from original budget
Total Project Value
Total All
T 3.20.6
Capital Expenditure: TrafficR' 000
Capital ProjectsYear 0
Total project value represents the estimated cost of the project on approval by council (including past and future expenditure as appropriate.
None
COMMENT ON THE PERFORMANCE OF POLICE OVERALL: Priority 1: Highway Patrol and Speed measuring The Department use new Traffic vehicles there has been an improved response time and freeway R59 Traffic is better managed to ensure high visibility of Law Enforcement. Priority 2: Law enforcement activities as well as Drinking and Driving Operations conducted with other law enforcement agencies including National Prosecuting Authority Magistrate Court. Priority 3: School Road Safety Education, Scholar Patrols and Road Safety compliance. Roadworthy vehicles and valid driver’s licences. Priority 4 Road markings and signs. Street names and proper signage to minimize confusion and possibility of collusions. Effective Technical and Maintenance programme in place to cover all municipality wards. T 3.20.7
Midvaal Local Municipality 145
3.21 FIRE
INTRODUCTION TO FIRE SERVICES
1. Fire Operations:
Appointment of one fire fighter and a control room operator.
2. Fire Safety:
The following were conducted to ensure achievement of compliance to the Fire Safety Plan:
Inspections: 2014 Building Plans: 572 Land-use application: 159 Fire Risk Assessment: 2
Pre-schools Primary and High schools: 77 Old age homes: 19 High Risk Industries: 40
3. FPA (Fire Protection Association)
- FPA is divided into eight sectors which fall under the Gauteng umbrella and each sector is responsible for its own area. - The FPA have a total of 461 members. - The FPA attended to 227 grassfires.
4. PIER (Public Information, Education and Relations):
- PIER was held through 55 events by visiting crèches, pre-schools and schools by demonstrating fire awareness programs evacuation drills and “learn not to burn” lectures to assist in early childhood development.
- A total of 6 646 people were reached with these events throughout the 14 wards of Midvaal.
- Implementation of the Fireball project in Sicelo was conducted to assist in combatting of fires in the informal settlements.
- Training was done with the community members on first aid and basic fire fighting. - The high risk areas were identified and provided with the fireballs.
5. Training
Midvaal Protection Services started a training centre in assisting with training to the community and to ensure that a high level of service delivery is maintained throughout the area.
The following training was conducted:
- FPA Grass and Wild-land fires - Fire Fighter 1 & 2 - Hazmat Awareness & Operations - Vehicle rescue training - First aid level 1 to 3
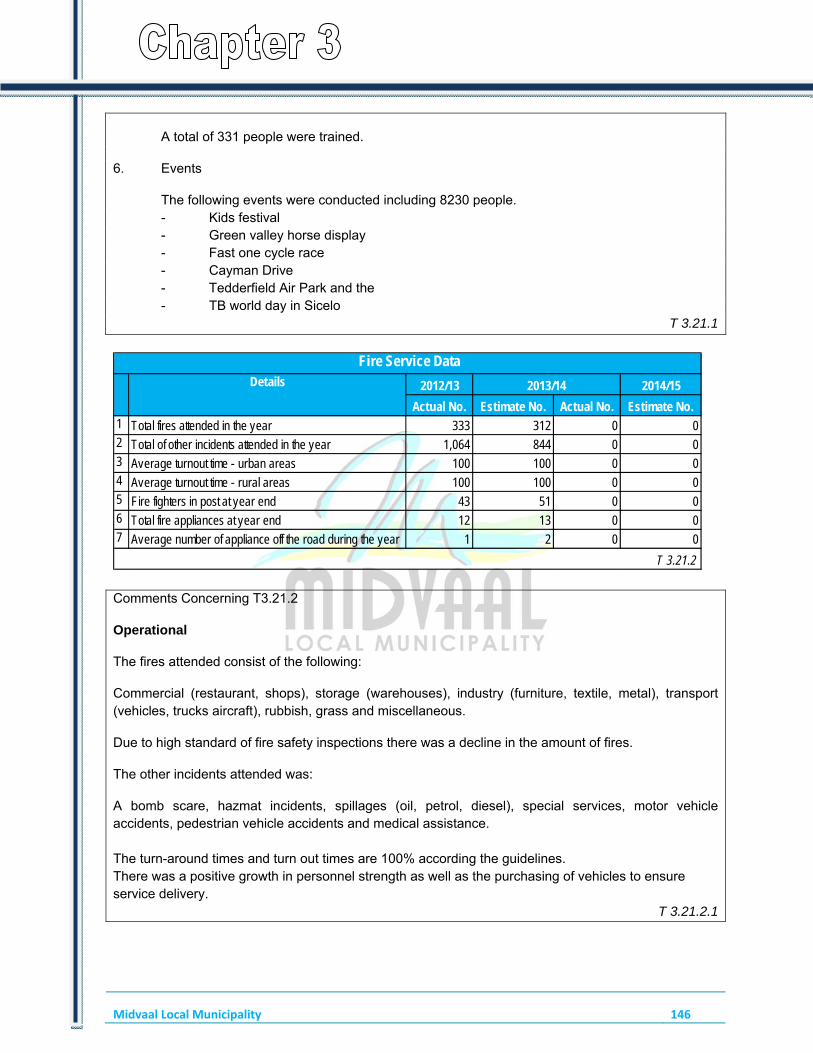
Midvaal Local Municipality 146
A total of 331 people were trained.
6. Events
The following events were conducted including 8230 people. - Kids festival - Green valley horse display - Fast one cycle race - Cayman Drive - Tedderfield Air Park and the - TB world day in Sicelo
T 3.21.1
2012/13 2014/15
Actual No. Estimate No. Actual No. Estimate No.1 Total fires attended in the year 333 312 0 02 Total of other incidents attended in the year 1,064 844 0 03 Average turnout time - urban areas 100 100 0 04 Average turnout time - rural areas 100 100 0 05 Fire fighters in post at year end 43 51 0 06 Total fire appliances at year end 12 13 0 07 Average number of appliance off the road during the year 1 2 0 0
Fire Service DataDetails 2013/14
T 3.21.2 Comments Concerning T3.21.2
Operational
The fires attended consist of the following:
Commercial (restaurant, shops), storage (warehouses), industry (furniture, textile, metal), transport (vehicles, trucks aircraft), rubbish, grass and miscellaneous.
Due to high standard of fire safety inspections there was a decline in the amount of fires.
The other incidents attended was:
A bomb scare, hazmat incidents, spillages (oil, petrol, diesel), special services, motor vehicle accidents, pedestrian vehicle accidents and medical assistance. The turn-around times and turn out times are 100% according the guidelines. There was a positive growth in personnel strength as well as the purchasing of vehicles to ensure service delivery. T 3.21.2.1

Midvaal Local Municipality 147
Service Objectives Year 1Target Actual Actual
Service Indicators *Previous Year
*Previous Year *Current Year*Current Year *Current Year *Following Year
(i) (ii) (iii) (iv) (v) (vi) (vii) (viii) (ix) (x)
T 3.21.3
Note: This statement should include no more than the top four priority service objectives. The indicators and targets specified above (columns (i) and (ii)) must be incoporated in the indicator set for each municipality to which they apply. These are 'universal municipal indicators'. * 'Previous Year' refers to the targets that were set in the Year -1 Budget/IDP round; *'Current Year' refers to the targets set in the Year 0 Budget/IDP round. *'Following Year' refers to the targets set in the Year 1 Budget/IDP round. Note that all targets in the IDP must be fundable within approved budget provision. MSA 2000 chapter 5 sets out the purpose and character of Intergrated Development Plans (IDPs) and chapter 6 sets
t th i t f th d ti f f t t b i i liti i hi h IDP l k l
Fire Service Policy Objectives Taken From IDPOutline Service
TargetsYear -1 Year 0 Year 3
Target Target
See Annexure T
Job Level 2012/13Fire Fighters Employees Posts Employees Vacancies (fulltime
equivalents)Vacancies (as a % of
total posts)
Administrators No. No. No. No. %Chief Fire Officer & Deputy 2 2 2 0 0%Other Fire Officers 0
0 - 3 04 - 6 3 3 3 0 0%7 - 9 31 31 29 2 6%
10 - 12 13 13 12 1 8%13 - 15 1 1 1 0 0%16 - 1819 - 20
Total 50 50 47 3 6%
Employees: Fire Services
2013/14
Totals should equate to those included in the Chapter 4 total employee schedule. Employees and Posts numbers are as at 30 June. *Posts must be established and funded in the approved budget or adjustments budget. Full-time equivalents are calculated by taking the total number of working days lost (excluding weekends and public holidays) while a post remains vacant and adding together all such days lost by all posts within the same set (e.g. ‘senior management’) then dividing that total by 250 to give the number of posts equivalent to the accumulated days. T 3.21.4
2012/13Actual Original Budget Adjustment
BudgetActual Variance to
Budget
Total Operational Revenue 511 1 127 1 227 1 790 37%Expenditure:
Fire fighters 12 853 14 868 12 189 10 513 -41% Repairs and Maintenance 244 501 517 468 -7% Other 2 751 4 727 6 946 4 677 -1%Total Operational Expenditure 15 848 20 096 19 652 15 658 -28%Net Operational Expenditure 15 848 20 096 19 652 15 658 -28%
T 3.21.5
Financial Performance 2013/14: Fire Services
R'000
Details2013/14
Net expenditure to be consistent with summary T 5.1.2 in Chapter 5. Variances are calculated by dividing the difference between the Actual and Original Budget by the Actual.

Midvaal Local Municipality 148
Budget Adjustment Budget
Actual Expenditure
Variance from adjustment
budget
Total Project Value
Total All 1 987 1 351 1 207 -65%
1 X Toyota Land Cruiser Grassfire Vehicl 550 440 439 0%1 X Land Cruiser 424 424 0%2 X Containers For Training Area (Simula 70 70 51 27%5x Fire Trailers 125 125 125 0%Fire Ball From Verifire Cc 100 100 100%18 Inch Ppv Monitor 28 17 15 12%Blitzfire Oscillating Portable Monitor 35 46 41 13%Upgrading Of Cctv (Ups-15kva 15 Mins) 48 51 50 1%Upgrading Of Cctv (Ups-10kva 15 Mins) 31 29 25 13%Fire Station Vaal Marina (Mig) 1 000 50 39 23%
T 3.21.6
Capital Expenditure 2013/14: Fire Services
R' 000
Capital Projects
2013/14
Total project value represents the estimated cost of the project on approval by council (including past and future expenditure as appropriate.
COMMENT ON THE PERFORMANCE OF FIRE SERVICES OVERALL Priority 1 The following equipment was purchased to improve service delivery: Three Sedan Vehicles, One LDV, One Land Cruiser, Disaster Container and tents, a smoke cloak for training purposes and 6 BA- sets.
Priority 2
Implementation of the Fire ball project in Sicelo was conducted to assist in combatting of fires in the informal settlements. - Training was done with the community members on first aid and basic fire fighting. - The high risk areas were identified and provided with the fireball that is replaced as soon as it is used
to ensure continuity of this service and assistance. Priority 3
An EPWP program is established with W.o.F (Working on Fire) to uplift the manning levels of the shifts to ensure a high standard of service delivery and provide work opportunities for those members. EPWP consists of two teams, one structural fire team consisting out of 24 personnel and one grassfire team consisting of 22 Personnel.
T 3.21.7

Midvaal Local Municipality 149
3.22 OTHER (DISASTER MANAGEMENT, ANIMAL LICENSING AND CONTROL, CONTROL OF PUBLIC NUISANCES AND OTHER)
INTRODUCTION TO DISASTER MANAGEMENT, ANIMAL LICENSING AND CONTROL, CONTROL OF PUBLIC NUISANCES, ETC
Disaster Management is a District function but is managed by the Chief Fire Officer in Midvaal.
T 3.22.1
SERVICE STATISTICS FOR DISASTER MANAGEMENT, ANIMAL LICENCING AND CONTROL, CONTROL OF PUBLIC NUISANCES, ETC
T 3.22.2
Service Objectives Year 2Target Actual Actual
Service Indicators *Previous Year
*Previous Year *Current Year*Current Year *Current Year *Following
Year(i) (ii) (iii) (iv) (v) (vi) (vii) (viii) (ix) (x)
T 3.22.3
Note: This statement should include no more than the top four priority service objectives. The indicators and targets specified above (columns (i) and (ii)) must be incoporated in the indicator set for each municipality to which they apply. These are 'universal municipal indicators'. * 'Previous Year' refers to the targets that were set in the Year -1 Budget/IDP round; *'Current Year' refers to the targets set in the Year 0 Budget/IDP round. *'Following Year' refers to the targets set in the Year 1 Budget/IDP round. Note that all targets in the IDP must be fundable within approved budget provision. MSA 2000 chapter 5 sets out the purpose and character of Intergrated Development Plans (IDP ) d h t 6 t t th i t f th d ti f f t t b i i liti i hi h IDP l k l
Disater Management, Animal Licencing and Control, Control of Public Nuisances, Etc Policy Objectives Taken From IDPOutline Service
TargetsYear 0 Year 1 Year 3
Target Target
See Annexure T
2012/13Employees Posts Employees Vacancies (fulltime
equivalents)Vacancies (as a % of
total posts)
No. No. No. No. %0 - 3 04 - 6 07 - 9 0
10 - 12 013 - 15 016 - 18 019 - 20 0Total 0 0 0 0
Employees: Disater Management, Animal Licencing and Control, Control of Public Nuisances, Etc
Job Level
2013/14
Totals should equate to those included in the Chapter 4 total employee schedule. Employees and Posts numbers are as at 30 June. *Posts must be established and funded in the approved budget or adjustments budget. Full-time equivalents are calculated by taking the total number of working days lost (excluding weekends and public holidays) while a post remains vacant and adding together all such days lost by all posts within the same set (e.g. ‘senior management’) then dividing that total by 250 to give the number of posts equivalent to the accumulated days. T 3.22.4

Midvaal Local Municipality 150
2012-13Actual Original Budget Adjustment
BudgetActual Variance to
Budget
Total Operational Revenue
Expenditure:
Employees
Repairs and Maintenance
Other
Total Operational Expenditure
Net Operational Expenditure
T 3.22.5
Financial Performance 2013/14: Disater Management, Animal Licencing and Control, Control of Public Nuisances, EtcR'000
Details
2013/14
Net expenditure to be consistent with summary T 5.1.2 in Chapter 5. Variances are calculated by dividing the difference between the Actual and Original Budget by the Actual.
None
Budget Adjustment Budget
Actual Expenditure
Variance from original budget
Total Project Value
Total All
T 3.22.6
Capital Expenditure 2013/14: Disater Management, Animal Licencing and Control, Control of Public Nuisances, Etc
R' 000
Capital Projects
2013/14
Total project value represents the estimated cost of the project on approval by council (including past and future expenditure as appropriate.
None
COMMENT ON THE PERFORMANCE OF DISASTER MANAGEMENT, ANIMAL LICENCING AND CONTROL OF PUBLIC NUISANCES, ETC OVERALL:
Disaster Management is a District function as it gets funded by Provincial Government. The Local Authority is responsible for the implementation of the Disaster Management plan. The District has assisted the Local Authority with tents and blankets that were handed out to families within Midvaal who were victims of fire related calls as well as floods; disaster management also supplied these families with food parcels. We had a total of 15 households that were assisted.
T 3.22.7

Midvaal Local Municipality 151
COMPONENT H: SPORT AND RECREATION
This component includes: community parks; sports fields; sports halls; stadiums; swimming pools; and camp sites.
INTRODUCTION TO SPORT AND RECREATION
The Strategic objective of The Sport and Recreation Section will be: • To promote total well-being by facilitating and coordinating equal access to sports and recreational facilities. • To facilitate and encourage participation in various sporting codes, thereby unifying diverse cultures. • To improve the quality of life of Midvaal residents with special focus on disadvantaged and rural communities • Providing and Maintaining Sports and Recreational facilities and infrastructure with special emphasis on the disadvantaged and rural communities. • To liaise with the Gauteng Department of Sport and Recreation and the Sedibeng District Municipality in order to ensure the promotion and facilitation of Sport Development in Midvaal. • To ensure the sustainable establishment of a sports hub at the Sicelo MPC with the specific intention of promoting and developing sport amongst previously disadvantaged communities. • To develop certain sporting programmes to assist the youth to develop in specific sporting codes (i.e. gymnastics, ringball, soccer and table tennis)
T 3.23
3.23 SPORT AND RECREATION
SERVICE STATISTICS FOR SPORT AND RECREATION Although this Section is more focussed on the provision of sport and recreation facilities and infrastructure, it does generate a small income from the entrance fees of the Meyerton Swimming pool. Thus, for this financial year, an income of R 94 021.00 was generated from entrance fees. Consideration must be given to the fact that the swimming pool is seasonally operated and only available to the public from 1 September to 31 March. Six (6) informal soccer fields were established at Pontsong, Piels Farm, Boitumelo, Schoongesigcht, Khayelitsha and Whitehouse. Four (4) informal netball fields were established at Schoongesigcht, Pontsong, Bantu Bonke and Khayalitsha.
T 3.23.1

Midvaal Local Municipality 152
Service Objectives Year 2Target Actual Actual
Service Indicators *Previous Year *Previous Year *Current Year *Current Year *Current Year *Following Year(i) (ii) (iii) (iv) (v) (vi) (vii) (viii) (ix) (x)
T 3.23.2
Note: This statement should include no more than the top four priority service objectives. The indicators and targets specified above (columns (i) and (ii)) must be incoporated in the indicator set for each municipality to which they apply. These are 'universal municipal indicators'. * 'Previous Year' refers to the targets that were set in the Year -1 Budget/IDP round; *'Current Year' refers to the targets set in the Year 0 Budget/IDP round. *'Following Year' refers to the targets set in the Year 1 Budget/IDP round. Note that all targets in the IDP must be fundable within approved budget provision. MSA 2000 chapter 5 sets out the purpose and character of Intergrated Development Plans (IDPs) and chapter 6 sets
Sport and Recreation Policy Objectives Taken From IDPOutline Service
TargetsYear 0 Year 1 Year 3
Target Target
See Annexure T
2012/13Employees Posts Employees Vacancies (fulltime
equivalents)Vacancies (as a % of
total posts)
No. No. No. No. %0 - 34 - 6 1 1 1 0 0%7 - 9
10 - 12 2 2 2 0 0%13 - 1516 - 1819 - 20Total 3 3 3 0 0%
Employees: Sport and Recreation
Job Level
2013/14
Totals should equate to those included in the Chapter 4 total employee schedule. Employees and Posts numbers are as at 30 June. *Posts must be established and funded in the approved budget or adjustments budget. Full-time equivalents are calculated by taking the total number of working days lost (excluding weekends and public holidays) while a post remains vacant and adding together all such days lost by all posts within the same set (e.g. ‘senior management’) then dividing that total by 250 to give the number of posts equivalent to the accumulated days. T 3.23.3
2012/13Actual Original Budget Adjustment
BudgetActual Variance to
Budget
Total Operational Revenue 94 4 756 4 760 4 755 0%
Expenditure:
Employees 8 325 8 632 7 834 6 527 -32%
Repairs and Maintenance 758 902 815 798 -13%
Other 7 701 9 821 9 436 8 329 -18%
Total Operational Expenditure 16 784 19 355 18 085 15 654 -24%
Net Operational Expenditure 16 784 19 355 18 085 15 654 -24%
T 3.23.4
Financial Performance 2013/14: Sport and Recreation
R'000
Details
2013/14
Net expenditure to be consistent with summary T 5.1.2 in Chapter 5. Variances are calculated by dividing the difference between the Actual and Original Budget by the Actual.

Midvaal Local Municipality 153
Capital Expenditure 2013/14: Sport and Recreation R' 000
Capital Projects
2013/14 Budget Adjustment
Budget Actual
Expenditure Variance from
original budget
Total Project Value
Total All 3 000 3 250 3 054 2%
Sicelo Football Field (MIG) 1 000 1 750 1 750 43%
Lakeside Sport Centre (MIG) 2 000 1 500 1 304 -53%
Total project value represents the estimated cost of the project on approval by council (including past and future expenditure as appropriate. T 3.23.5
COMMENT ON THE PERFORMANCE OF SPORT AND RECREATION OVERALL: Sport and Recreation has two capital projects namely: Sicelo Soccer field: R3 000 000.00, should be completed by end of August 2014, Lakeside Soccer field: R3 000 000.00 Earthworks should be completed by end October 2014. These projects are funded by the Municipal Infrastructure Grant. The establishing of an outdoor gym in at the Sicelo Centre should be completed end September 2014.
T 3.23.6
COMPONENT I: CORPORATE POLICY OFFICES AND OTHER SERVICES
This component includes: corporate policy offices, financial services, human resource services, ICT services, property services.
INTRODUCTION TO CORPORATE POLICY OFFICES, Etc Due to the small category of municipality and a small staff complement, this council does not have a corporate policy office. Policies are developed by the various departments, management and/or political wing as may be appropriate. These policies are submitted for approval. A control file is maintained containing all policies. The Policy file is reviewed at specified intervals.
T 3.24

Midvaal Local Municipality 154
3.24 EXECUTIVE AND COUNCIL This component includes: Executive office (mayor; councillors; and municipal manager).
INTRODUCTION TO EXECUTIVE AND COUNCIL The Council (headed by the Speaker) is the legislative and oversight authority in the municipality. The executive function and day-to-day running of the municipality is dealt with by the Executive Mayor and his Mayoral Committee together with the Municipal Manager and his Top Management Team. The clear role clarification streamlines service delivery and enhances efficiency and effectiveness of performance. A clear distinction has been drawn between these functions and is regulated by Council’s System of Delegations.
T 3.24.1
SERVICE STATISTICS FOR THE EXECUTIVE AND COUNCIL In view of the fact that Midvaal Local Municipality does not have a corporate policy office, the service delivery priorities are set out in the various departmental activities, reflected in the different sections in this report (e.g. see chapter 3)
T 3.24.2
Service Objectives Year 1Target Actual Actual
Service Indicators *Previous Year
*Previous Year *Current Year*Current Year *Current Year *Following
Year(i) (ii) (iii) (iv) (v) (vi) (vii) (viii) (ix) (x)
T 3.24.3
Note: This statement should include no more than the top four priority service objectives. The indicators and targets specified above (columns (i) and (ii)) must be incoporated in the indicator set for each municipality to which they apply. These are 'universal municipal indicators'. * 'Previous Year' refers to the targets that were set in the Year -1 Budget/IDP round; *'Current Year' refers to the targets set in the Year 0 Budget/IDP round. *'Following Year' refers to the targets set in the Year 1 Budget/IDP
The Executive and Council Policy Objectives Taken From IDPOutline Service
TargetsYear -1 Year 0 Year 3
Target Target
See Annexure T
Year -1Employees Posts Employees Vacancies (fulltime
equivalents)Vacancies (as a % of
total posts)
No. No. No. No. %0 - 34 - 67 - 9
10 - 1213 - 1516 - 1819 - 20Total 0 0 0 0
Employees: The Executive and Council
Job Level
Year 0
Totals should equate to those included in the Chapter 4 total employee schedule. Employees and Posts numbers are as at 30 June. *Posts must be established and funded in the approved budget or adjustments budget. Full-time equivalents are calculated by taking the total number of working days lost (excluding weekends and public holidays) while a post remains vacant and adding together all such days lost by all posts within the same set (e.g. ‘senior management’) then dividing that total by 250 to give the number of posts equivalent to the accumulated days. T 3.24.4
None. Staff are reflected in the department Corporate
Services.
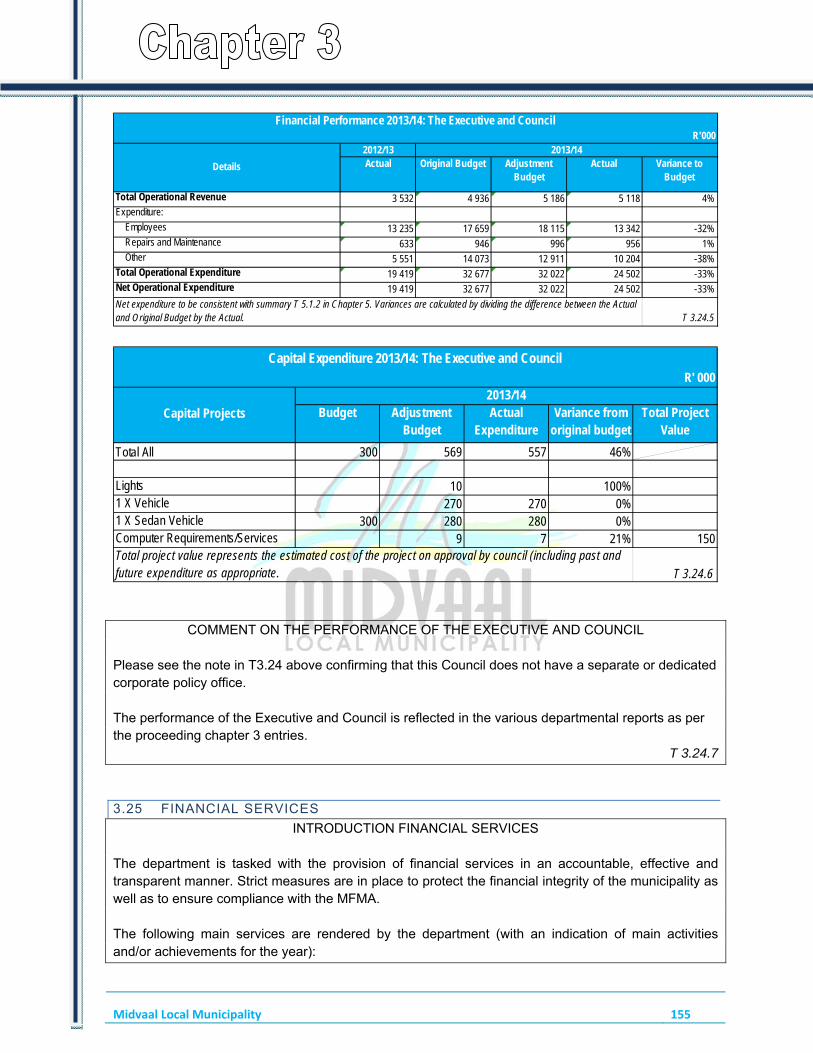
Midvaal Local Municipality 155
2012/13Actual Original Budget Adjustment
BudgetActual Variance to
Budget
Total Operational Revenue 3 532 4 936 5 186 5 118 4%Expenditure:
Employees 13 235 17 659 18 115 13 342 -32% Repairs and Maintenance 633 946 996 956 1% Other 5 551 14 073 12 911 10 204 -38%Total Operational Expenditure 19 419 32 677 32 022 24 502 -33%Net Operational Expenditure 19 419 32 677 32 022 24 502 -33%
T 3.24.5
Financial Performance 2013/14: The Executive and CouncilR'000
Details
2013/14
Net expenditure to be consistent with summary T 5.1.2 in Chapter 5. Variances are calculated by dividing the difference between the Actual and Original Budget by the Actual.
Budget Adjustment Budget
Actual Expenditure
Variance from original budget
Total Project Value
Total All 300 569 557 46%
Lights 10 100%1 X Vehicle 270 270 0%1 X Sedan Vehicle 300 280 280 0%Computer Requirements/Services 9 7 21% 150
T 3.24.6
Capital Expenditure 2013/14: The Executive and CouncilR' 000
Capital Projects2013/14
Total project value represents the estimated cost of the project on approval by council (including past and future expenditure as appropriate.
COMMENT ON THE PERFORMANCE OF THE EXECUTIVE AND COUNCIL Please see the note in T3.24 above confirming that this Council does not have a separate or dedicated corporate policy office. The performance of the Executive and Council is reflected in the various departmental reports as per the proceeding chapter 3 entries.
T 3.24.7
3.25 FINANCIAL SERVICES
INTRODUCTION FINANCIAL SERVICES The department is tasked with the provision of financial services in an accountable, effective and transparent manner. Strict measures are in place to protect the financial integrity of the municipality as well as to ensure compliance with the MFMA. The following main services are rendered by the department (with an indication of main activities and/or achievements for the year):

Midvaal Local Municipality 156
Asset Management Completion of full asset verification (including condition assessment). Investment property matched with valuation roll to ensure completeness of register. Financial Reporting Financial Statements finalised and submitted as required – unqualified audits achieved for the 2011/2012 and 2012/2013 financial years. OPCA plan compiled and implemented. Budget tabled and approved in line with legislative deadlines. Monthly and quarterly reports submitted in line with legislative deadlines. All financial policies reviewed. Stock system with fleet management system fully implemented. Revenue Management, including billing and collection of municipal rates and service charges A cash collection rate of 95% was achieved during the year. The graph below shows the collection rate per month, the annual target as well as a moving two month collection average.
Meter readings is a particular challenge in a municipal environment and as most others, Midvaal strives to improve meter reading. During the year the electricity and water meter readings improved from the previous year. Expenditure Management, including the rendering of a payroll function Expenditure management is an ongoing function with the aim of improving creditor’s efficiency by ensuring all creditors are paid within 30 days. More than 98% of all invoices are paid within 30 days with only invoices that are in dispute being paid later. A single pay-roll function is rendered where employees are paid via EFT’s on a monthly basis. All statutory deductions are paid over to the relevant bodies within the prescribed timeframes. No penalties or interest were paid to suppliers. No instances of unauthorised, fruitless, wasteful or irregular expenditure were recorded.
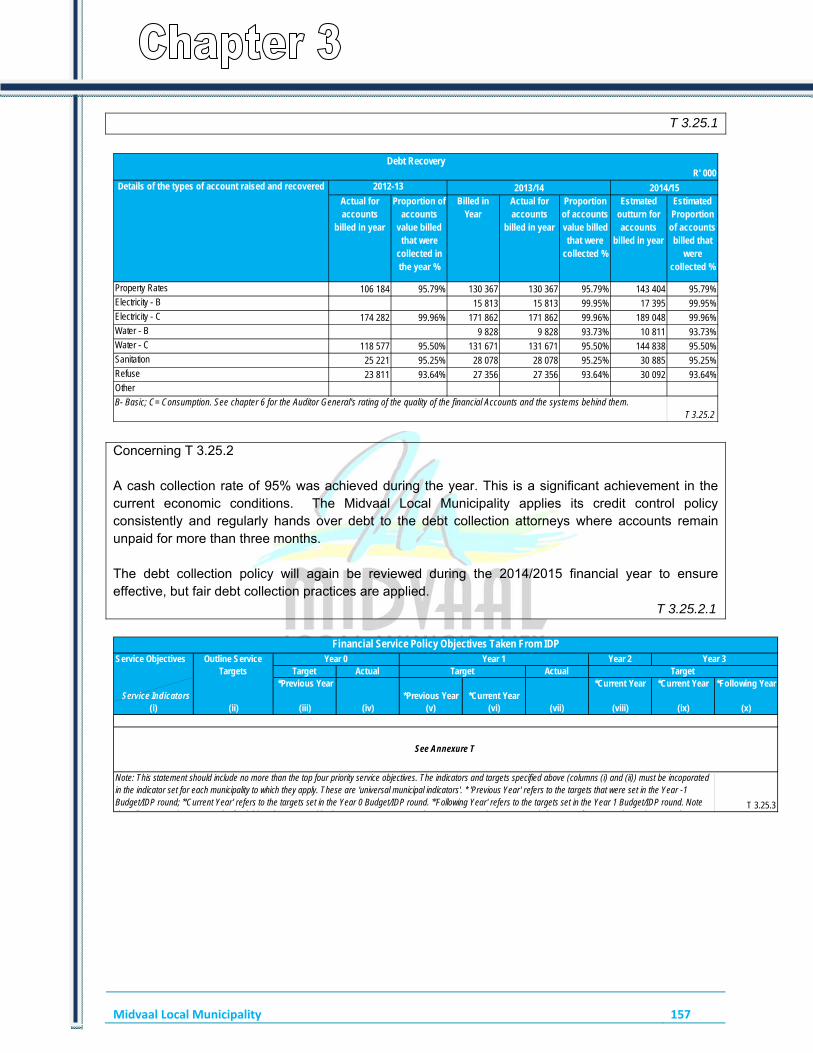
Midvaal Local Municipality 157
T 3.25.1
Actual for accounts
billed in year
Proportion of accounts
value billed that were
collected in the year %
Billed in Year
Actual for accounts
billed in year
Proportion of accounts value billed that were
collected %
Estmated outturn for accounts
billed in year
Estimated Proportion
of accounts billed that
were collected %
Property Rates 106 184 95.79% 130 367 130 367 95.79% 143 404 95.79%Electricity - B 15 813 15 813 99.95% 17 395 99.95%Electricity - C 174 282 99.96% 171 862 171 862 99.96% 189 048 99.96%Water - B 9 828 9 828 93.73% 10 811 93.73%Water - C 118 577 95.50% 131 671 131 671 95.50% 144 838 95.50%Sanitation 25 221 95.25% 28 078 28 078 95.25% 30 885 95.25%Refuse 23 811 93.64% 27 356 27 356 93.64% 30 092 93.64%Other
T 3.25.2B- Basic; C= Consumption. See chapter 6 for the Auditor General's rating of the quality of the financial Accounts and the systems behind them.
2014/15
R' 000Debt Recovery
Details of the types of account raised and recovered 2012-13 2013/14
Concerning T 3.25.2 A cash collection rate of 95% was achieved during the year. This is a significant achievement in the current economic conditions. The Midvaal Local Municipality applies its credit control policy consistently and regularly hands over debt to the debt collection attorneys where accounts remain unpaid for more than three months. The debt collection policy will again be reviewed during the 2014/2015 financial year to ensure effective, but fair debt collection practices are applied. T 3.25.2.1
Service Objectives Year 2Target Actual Actual
Service Indicators *Previous Year
*Previous Year *Current Year*Current Year *Current Year *Following Year
(i) (ii) (iii) (iv) (v) (vi) (vii) (viii) (ix) (x)
T 3.25.3
Note: This statement should include no more than the top four priority service objectives. The indicators and targets specified above (columns (i) and (ii)) must be incoporated in the indicator set for each municipality to which they apply. These are 'universal municipal indicators'. * 'Previous Year' refers to the targets that were set in the Year -1 Budget/IDP round; *'Current Year' refers to the targets set in the Year 0 Budget/IDP round. *'Following Year' refers to the targets set in the Year 1 Budget/IDP round. Note th t ll t t i th IDP t b f d bl ithi d b d t i i MSA 2000 h t 5 t t th d h t f I t t d D l t Pl
Financial Service Policy Objectives Taken From IDPOutline Service
TargetsYear 0 Year 1 Year 3
Target Target
See Annexure T

Midvaal Local Municipality 158
2012/13Employees Posts Employees Vacancies (fulltime
equivalents)Vacancies (as a % of
total posts)
No. No. No. No. %0 - 3 3 4 4 0 0%4 - 6 12 14 14 0 0%7 - 9 31 31 30 1 3%
10 - 12 1 1 1 013 - 15 3 3 3 0 0%
Temp Contract 5 5 4 1 20%Temp 4 4 4 0 0%Total 59 62 60 2 3%
Employees: Financial Services
Job Level
2013/14
Totals should equate to those included in the Chapter 4 total employee schedule. Employees and Posts numbers are as at 30 June. *Posts must be established and funded in the approved budget or adjustments budget. Full-time equivalents are calculated by taking the total number of working days lost (excluding weekends and public holidays) while a post remains vacant and adding together all such days lost by all posts within the same set (e.g. ‘senior management’) then dividing that total by 250 to give the number of posts equivalent to the accumulated days. T 3.25.4
2012-13Actual Original Budget Adjustment
BudgetActual Variance to
Budget
Total Operational Revenue 116 873 134 065 123 931 127 617 -5%Expenditure: Employees 15 915 16 502 14 795 13 453 -23% Repairs and Maintenance 144 146 191 136 -8% Other 43 098 42 696 42 512 41 337 -3%Total Operational Expenditure 59 158 59 345 57 498 54 926 -8%Net Operational Expenditure 59 158 59 345 57 498 54 926 -8%
T 3.25.5
Financial Performance 2013/14: Financial ServicesR'000
Details
2013/14
Net expenditure to be consistent with summary T 5.1.2 in Chapter 5. Variances are calculated by dividing the difference between the Actual and Original Budget by the Actual.
Budget Adjustment Budget
Actual Expenditure
Variance from original budget
Total Project Value
Total All 118 216 214 45%
Scm: Office Furniture (New Vacancies) 60 60 59 1% 280Scm: Stores Upgrade 100 99 1% 150Scm: Computers (Replacements) (Fmg) 30 30 30 0%Scm: Computers (New Vacancies) (Fmg) 20 20 20 0% 320Scm: Recording System (Fmg) 8 6 6 0% 90
T 3.25.6
Capital Expenditure 2013/14: Financial ServicesR' 000
Capital Projects
2013/14
Total project value represents the estimated cost of the project on approval by council (including past and future expenditure as appropriate.
COMMENT ON THE PERFORMANCE OF FINANCIAL SERVICES OVERALL: The department performed well. Debt collection targets were met and more than 100% of the budgeted total revenue were realized. Expenditure were kept within the budget and no over-expenditures were incurred.

Midvaal Local Municipality 159
The department still has a number of matters to address and the following areas will be prioritized during the next financial year: Improved Revenue Management • Ongoing improvements in revenue management, including quarterly reconciliations between the
valuation roll, metered services and billing • Collection rate of 96% targeted • Reduction of outstanding debt - Analysis of outstanding debt and debt write off linked with a
payment incentive scheme • Reduction in interim billings (i.e. improved meter reading) • Analysis of outstanding debt and debt write off linked with a payment incentive scheme • Improved indigent management – additional campaigns to be held in Sicelo and Lakeside Improved Expenditure Management • Ongoing implementation of Cost Containment measures • Electronic Contract Management System introduced • Compliance with SCM turn-around time standards Improved Liquidity Management • Cash Management Plan compiled and implemented • Increased cash holdings as measured through the, liquidity ratio, cost coverage ratio and number
of days cash holdings Improved Governance • Top risks managed and mitigated via risk management process – updated strategic and
operational risk registers to form the basis of risk management processes • GRAP 17 compliance to improved • Improved Budgeting methodologies to be applied (compilation and implementation) • Increased R and M budget (increased allocations in the budget)
T 3.25.7
3.26 HUMAN RESOURCE SERVICES
INTRODUCTION TO HUMAN RESOURCE SERVICES Since the beginning of the year, there has been tremendous achievement in terms of Human Resources’ operations. All relevant HR-Policies are in place. There is a fully functional Local Labour Forum which serves as the custodian of employer and employee relations. There is a bursary scheme in the form of “Study Assistance” which has helped employees to achieve their academic dreams, including immense utilisation of training resources which assisted immensely in developing employees. Employees Assistance Programmes are also in place which have contributed substantially towards the social and psychological upliftment of employee’s morale and sense of belonging.

Midvaal Local Municipality 160
Having achieved all that, the road is still long and the challenges will always be addressed through effective Human Resources’ intervention.
T 3.26.1
SERVICE STATISTICS FOR HUMAN RESOURCE SERVICES
Human Resources main functions (services) include amongst others the following: • Recruitment & Selection • Training & Development • Employee Assistance Programmes, including: Leave, Benefits, HIV Workplace Programme and Attendance Management • Labour Relations & Occupational Health & Safety
T 3.26.2
3.26 HUMAN RESOURCE SERVICES
INTRODUCTION TO HUMAN RESOURCE SERVICES Since the beginning of the year, there has been tremendous achievement in terms of Human Resources’ operations. All relevant HR-Policies are in place. There is a fully functional Local Labour Forum which serves as the custodian of employer and employee relations. There is a bursary scheme in the form of “Study Assistance” which has helped employees to achieve their academic dreams, including immense utilisation of training resources which assisted immensely in developing employees. Employees Assistance Programmes are also in place which have contributed substantially towards the social and psychological upliftment of employee’s morale and sense of belonging. Having achieved all that, the road is still long and the challenges will always be addressed through effective Human Resources’ intervention.
T 3.26.1
SERVICE STATISTICS FOR HUMAN RESOURCE SERVICES
Human Resources main functions (services) include amongst others the following: • Recruitment & Selection • Training & Development • Employee Assistance Programmes, including: Leave, Benefits, HIV Workplace Programme and Attendance Management • Labour Relations & Occupational Health & Safety
T 3.26.2
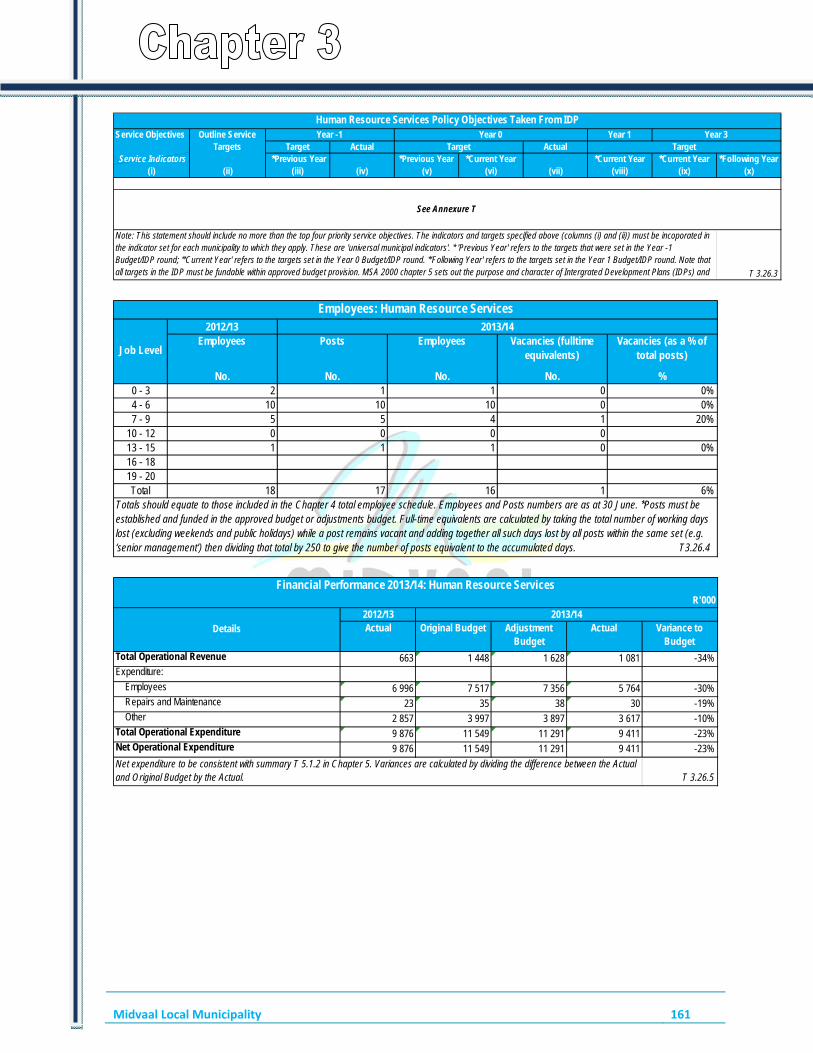
Midvaal Local Municipality 161
Service Objectives Year 1Target Actual Actual
Service Indicators *Previous Year *Previous Year *Current Year *Current Year *Current Year *Following Year(i) (ii) (iii) (iv) (v) (vi) (vii) (viii) (ix) (x)
T 3.26.3
Note: This statement should include no more than the top four priority service objectives. The indicators and targets specified above (columns (i) and (ii)) must be incoporated in the indicator set for each municipality to which they apply. These are 'universal municipal indicators'. * 'Previous Year' refers to the targets that were set in the Year -1 Budget/IDP round; *'Current Year' refers to the targets set in the Year 0 Budget/IDP round. *'Following Year' refers to the targets set in the Year 1 Budget/IDP round. Note that all targets in the IDP must be fundable within approved budget provision. MSA 2000 chapter 5 sets out the purpose and character of Intergrated Development Plans (IDPs) and
Human Resource Services Policy Objectives Taken From IDPOutline Service
TargetsYear -1 Year 0 Year 3
Target Target
See Annexure T
2012/13Employees Posts Employees Vacancies (fulltime
equivalents)Vacancies (as a % of
total posts)
No. No. No. No. %0 - 3 2 1 1 0 0%4 - 6 10 10 10 0 0%7 - 9 5 5 4 1 20%
10 - 12 0 0 0 013 - 15 1 1 1 0 0%16 - 1819 - 20Total 18 17 16 1 6%
Employees: Human Resource Services
Job Level
2013/14
Totals should equate to those included in the Chapter 4 total employee schedule. Employees and Posts numbers are as at 30 June. *Posts must be established and funded in the approved budget or adjustments budget. Full-time equivalents are calculated by taking the total number of working days lost (excluding weekends and public holidays) while a post remains vacant and adding together all such days lost by all posts within the same set (e.g. ‘senior management’) then dividing that total by 250 to give the number of posts equivalent to the accumulated days. T3.26.4
2012/13Actual Original Budget Adjustment
BudgetActual Variance to
Budget
Total Operational Revenue 663 1 448 1 628 1 081 -34%Expenditure:
Employees 6 996 7 517 7 356 5 764 -30% Repairs and Maintenance 23 35 38 30 -19% Other 2 857 3 997 3 897 3 617 -10%Total Operational Expenditure 9 876 11 549 11 291 9 411 -23%Net Operational Expenditure 9 876 11 549 11 291 9 411 -23%
T 3.26.5
Financial Performance 2013/14: Human Resource ServicesR'000
Details2013/14
Net expenditure to be consistent with summary T 5.1.2 in Chapter 5. Variances are calculated by dividing the difference between the Actual and Original Budget by the Actual.

Midvaal Local Municipality 162
Budget Adjustment Budget
Actual Expenditure
Variance from original budget
Total Project Value
Total All 30 143 135 -6%
Building Renovations 115 111 -3%1 X Laptop 10 8 8 0%1 X Printer (Payday Reports) 20 20 16 -21%
T 3.26.6
Capital Expenditure 2013/14: Human Resource ServicesR' 000
Capital Projects2013/14
Total project value represents the estimated cost of the project on approval by council (including past and future expenditure as appropriate.
COMMENT ON THE PERFORMANCE OF HUMAN RESOURCE SERVICES OVERALL Since the beginning of the year, there has been tremendous achievement in terms of Human Resources’ operations. All relevant HR-Policies are in place. There is a fully functional Local Labour Forum which serves as the custodian of employer and employee relations. There is a bursary scheme in the form of “Study Assistance” which has helped employees to achieve their academic dreams, including immense utilisation of training resources which assisted immensely in developing employees. Employees Assistance Programmes are also in place which have contributed substantially towards the social and psychological upliftment of employee’s morale and sense of belonging. Having achieved all that, the road is still long and the challenges will always be addressed through effective Human Resources’ intervention.
T 3.26.7
3.27 INFORMATION AND COMMUNICATION TECHNOLOGY (ICT) SERVICES This component includes: Information and Communication Technology (ICT) services.
INTRODUCTION TO INFORMATION AND COMMUNICATION TECHNOLOGY (ICT) SERVICES The overall ICT function is a District function, with the local municipalities being responsible for internal network management. For this reason the internal IT function is rendered by a strategic assistant and two staff members seconded by the Sedibeng District Council (SDC) and four own junior technicians. The Midvaal Local Municipality is invoiced for the seconded staff costs by the SDC on a monthly basis. Midvaal Local Municipality is also responsible for the cost applicable its own staff and to the internal function (i.e. hardware and software). The Midvaal Local Municipality operates on the Novell system and is linked to the SDC and Emfuleni Local Municipality via Wide Area Network. This linkage creates a back-up and off-site storage facility which is important for disaster recovery purposes. The main focus for the ICT function is to provide a secure, speedy and reliable service to the users. Resources have been allocated to support these performance targets. Because of the relatively distant different offices, Midvaal Local Municipality had to resolve connectivity problems in the year under
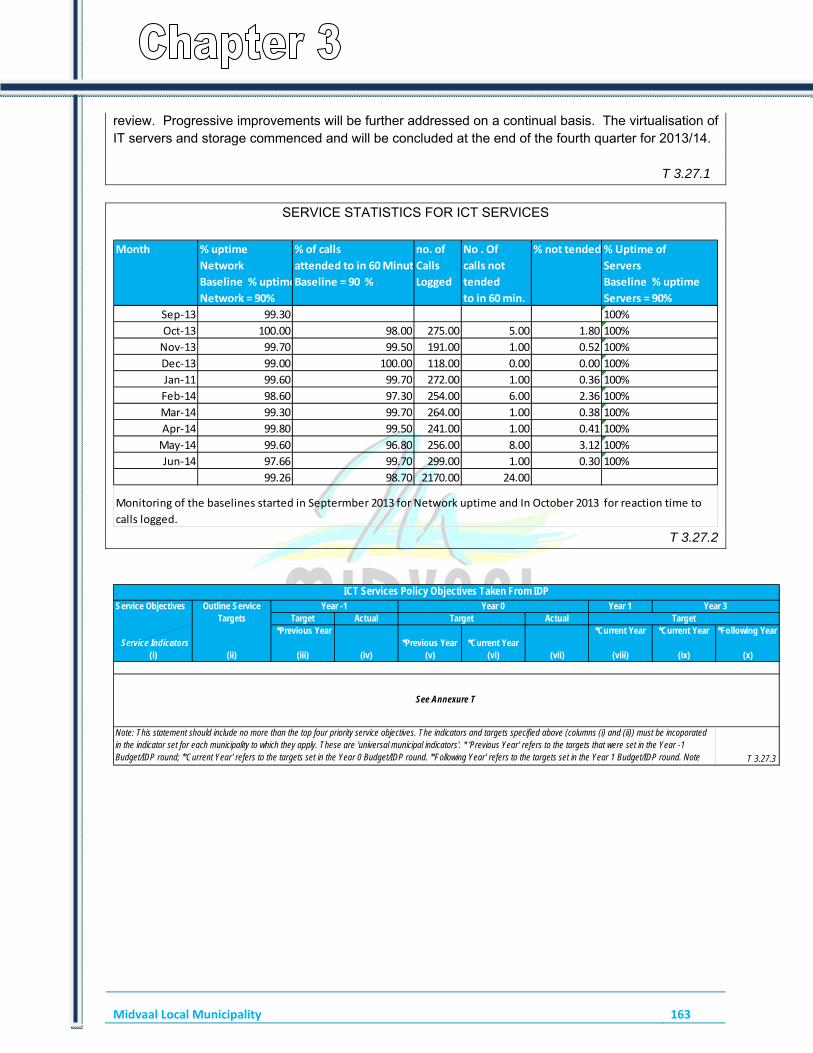
Midvaal Local Municipality 163
review. Progressive improvements will be further addressed on a continual basis. The virtualisation of IT servers and storage commenced and will be concluded at the end of the fourth quarter for 2013/14. T 3.27.1
SERVICE STATISTICS FOR ICT SERVICES
Month % uptime % of calls no. of No . Of % not tended % Uptime of
Network attended to in 60 Minut Calls calls not Servers
Baseline % uptimeBaseline = 90 % Logged tended Baseline % uptime
Network = 90% to in 60 min. Servers = 90%
Sep‐13 99.30 100%
Oct‐13 100.00 98.00 275.00 5.00 1.80 100%
Nov‐13 99.70 99.50 191.00 1.00 0.52 100%
Dec‐13 99.00 100.00 118.00 0.00 0.00 100%
Jan‐11 99.60 99.70 272.00 1.00 0.36 100%
Feb‐14 98.60 97.30 254.00 6.00 2.36 100%
Mar‐14 99.30 99.70 264.00 1.00 0.38 100%
Apr‐14 99.80 99.50 241.00 1.00 0.41 100%
May‐14 99.60 96.80 256.00 8.00 3.12 100%
Jun‐14 97.66 99.70 299.00 1.00 0.30 100%
99.26 98.70 2170.00 24.00
Monitoring of the baselines started in Septermber 2013 for Network uptime and In October 2013 for reaction time to
calls logged. T 3.27.2
Service Objectives Year 1Target Actual Actual
Service Indicators *Previous Year
*Previous Year *Current Year*Current Year *Current Year *Following Year
(i) (ii) (iii) (iv) (v) (vi) (vii) (viii) (ix) (x)
T 3.27.3
Note: This statement should include no more than the top four priority service objectives. The indicators and targets specified above (columns (i) and (ii)) must be incoporated in the indicator set for each municipality to which they apply. These are 'universal municipal indicators'. * 'Previous Year' refers to the targets that were set in the Year -1 Budget/IDP round; *'Current Year' refers to the targets set in the Year 0 Budget/IDP round. *'Following Year' refers to the targets set in the Year 1 Budget/IDP round. Note
ICT Services Policy Objectives Taken From IDPOutline Service
TargetsYear -1 Year 0 Year 3
Target Target
See Annexure T
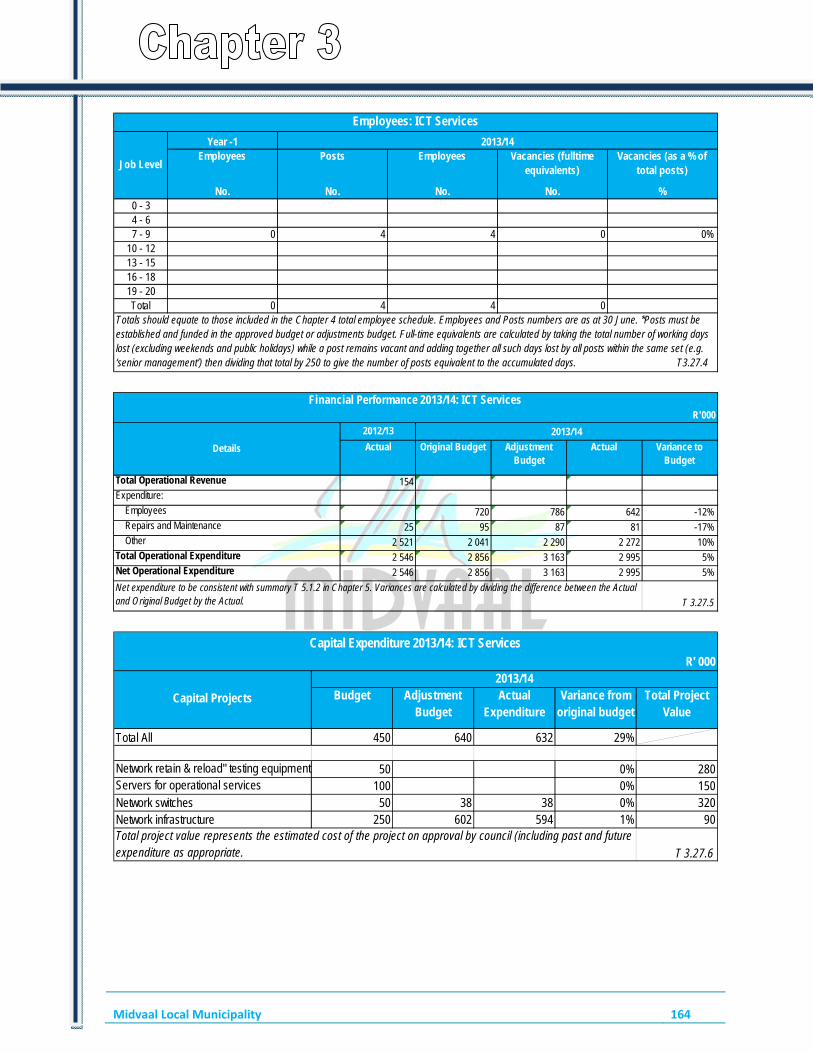
Midvaal Local Municipality 164
Year -1Employees Posts Employees Vacancies (fulltime
equivalents)Vacancies (as a % of
total posts)
No. No. No. No. %0 - 34 - 67 - 9 0 4 4 0 0%
10 - 1213 - 1516 - 1819 - 20Total 0 4 4 0
Employees: ICT Services
Job Level
2013/14
Totals should equate to those included in the Chapter 4 total employee schedule. Employees and Posts numbers are as at 30 June. *Posts must be established and funded in the approved budget or adjustments budget. Full-time equivalents are calculated by taking the total number of working days lost (excluding weekends and public holidays) while a post remains vacant and adding together all such days lost by all posts within the same set (e.g. ‘senior management’) then dividing that total by 250 to give the number of posts equivalent to the accumulated days. T3.27.4
2012/13
Actual Original Budget Adjustment Budget
Actual Variance to Budget
Total Operational Revenue 154Expenditure:
Employees 720 786 642 -12% Repairs and Maintenance 25 95 87 81 -17% Other 2 521 2 041 2 290 2 272 10%Total Operational Expenditure 2 546 2 856 3 163 2 995 5%Net Operational Expenditure 2 546 2 856 3 163 2 995 5%
T 3.27.5
Financial Performance 2013/14: ICT Services R'000
Details
2013/14
Net expenditure to be consistent with summary T 5.1.2 in Chapter 5. Variances are calculated by dividing the difference between the Actual and Original Budget by the Actual.
Budget Adjustment Budget
Actual Expenditure
Variance from original budget
Total Project Value
Total All 450 640 632 29%
Network retain & reload" testing equipment 50 0% 280Servers for operational services 100 0% 150Network switches 50 38 38 0% 320Network infrastructure 250 602 594 1% 90
T 3.27.6
Capital Expenditure 2013/14: ICT ServicesR' 000
Capital Projects
2013/14
Total project value represents the estimated cost of the project on approval by council (including past and future expenditure as appropriate.
Midvaal Local Municipality 165
COMMENT ON THE PERFORMANCE OF ICT SERVICES OVERALL: Although occasional connectivity problems were experienced, these were identified, addressed and resolved. Further improvements will be affected on a continual basis in terms of inter alia the service objectives and targets as reflected in T.3.27.3 above.
T3.27.7
3.28 PROPERTY; LEGAL; RISK MANAGEMENT AND PROCUREMENT SERVICES This component includes: property; legal; risk management and procurement services.
INTRODUCTION TO PROPERTY; LEGAL; RISK MANAGEMENT AND PROCUREMENT SERVICES The functions relevant to legal matters and the legal aspects of property matters rest with the Department of Corporate Services. The alienation of Council property rests with the Department of Development Planning and Housing. Therefore, in respect of property issues, there is a close liaison between the Departments of Corporate Services and Development Planning and Housing. Other line departments may also become involved in the acquisition of land if it relates to a service delivery aspect within such function. Once again, there is close liaison between the relevant line departments and the Department of Corporate Services.
The risk management and procurement of goods and services is dealt with by the Department Finance Services. MLM established a Risk Committee and Risk Management Committee, and approved a Risk Management Committee Charter and the Enterprise Risk Management Policy. The five top strategic identified risks are: 1. Proper management of distribution losses; 2. Sustainable community development focused on the less privileged; 3. Legalising of existing and new landfill sites; 4. Legal compliance; 5. Proper management and maintenance of assets. In respect of legal services, Council has a panel of attorneys appointed on the basis of a tender process. These services are subject to performance monitoring which takes place quarterly on the basis of progress reports by the attorneys to the Department of Corporate Services or the relevant department making use of such services (e.g. Human Resources on labour matters and Development Planning and Housing on land use transgressions)
T3.28.1
SERVICE STATISTICS FOR PROPERTY; LEGAL; RISK MANAGEMENT AND PROCUREMENT SERVICES
T 3.28.2

Midvaal Local Municipality 166
Service Objectives Year 1Target Actual Actual
Service Indicators *Previous Year
*Previous Year *Current Year*Current Year *Current Year *Following
Year(i) (ii) (iii) (iv) (v) (vi) (vii) (viii) (ix) (x)
T 3.28.3
Note: This statement should include no more than the top four priority service objectives. The indicators and targets specified above (columns (i) and (ii)) must be incoporated in the indicator set for each municipality to which they apply. These are 'universal municipal indicators'. * 'Previous Year' refers to the targets that were set in the Year 0 Budget/IDP round; *'Current Year' refers to the targets set in the Year 1 Budget/IDP round. *'Following Year' refers to the targets set in the Year 2 Budget/IDP round. Note that all targets in the IDP must be fundable within approved budget provision. MSA 2000 chapter 5 sets out the purpose and character of Intergrated
Property; Legal; Risk Management; and Procurement Services Policy Objectives Taken From IDPOutline Service
TargetsYear -1 Year 0 Year 3
Target Target
See Annexure T
2012/13Employees Posts Employees Vacancies (fulltime
equivalents)Vacancies (as a % of
total posts)
No. No. No. No. %0 - 3 1 1 1 0 0%4 - 6 3 3 3 0 0%7 - 9
10 - 1213 - 1516 - 1819 - 20Total 4 4 4 0 0%
Employees: Property; Legal; Risk Management; and Procurement Services
Job Level
2013/14
Totals should equate to those included in the Chapter 4 total employee schedule. Employees and Posts numbers are as at 30 June. *Posts must be established and funded in the approved budget or adjustments budget. Full-time equivalents are calculated by taking the total number of working days lost (excluding weekends and public holidays) while a post remains vacant and adding together all such days lost by all posts within the same set (e.g. ‘senior management’) then dividing that total by 250 to give the number of posts equivalent to the accumulated days. T 3.28.4
2012/13Actual Original Budget Adjustment
BudgetActual Variance to
Budget
Total Operational Revenue 1 453 130 134 164 21%
Expenditure:
Employees 7 956 7 726 6 767 6 144 -26%
Repairs and Maintenance 20 40 90 43 6%
Other 5 444 4 491 5 323 5 050 11%
Total Operational Expenditure 13 420 12 258 12 181 11 238 -9%
Net Operational Expenditure 13 420 12 258 12 181 11 238 -9%
T 3.28.5
Financial Performance 2013/14: Property; Legal; Risk Management and Procurement ServicesR'000
Details
2013/14
Net expenditure to be consistent with summary T 5.1.2 in Chapter 5. Variances are calculated by dividing the difference between the Actual and Original Budget by the Actual.

Midvaal Local Municipality 167
Budget Adjustment Budget
Actual Expenditure
Variance from original budget
Total Project Value
Total All 12 526 12 209 12 006 -4%
Furniture Savanna Project Manager 100 80 20%
1 x LDV replacement 190 190 164 14%
Records: Server & Software for Quidity sy 40 0%
Records: Randvaal storage 150 230 171 25%
Records: 1 Scanners 30 6 6 0%
Purchase of land Meyerton 861 861 0%
Records: Shelves for safe 30 15 15 0%
Committees: 1 x Laptop 10 10 10 0%
Palisade Fencing 75 68 9%
City Hall: Scaffolding/Ladder 9 M/Jonno 26 23 23 0%
PMS: Furniture (new employee) 20 0%
PMS: Shelves for safe 30 0%
CBD Phase 4 10 000 10 000 10 000 100%
Sicelo Basic Services 2 000 700 608 200%
T 3.28.6
Capital Expenditure 2012/13: Property; Legal; Risk Management and Procurement Services
R' 000
Capital Projects
2013/14
Total project value represents the estimated cost of the project on approval by council (including past and future expenditure as appropriate.
COMMENT ON THE PERFORMANCE OF PROPERTY SERVICES OVERALL The property and legal function have no capital items. The function is as per the entry under T3.28.2 above
T 3.28.7
COMPONENT J: MISCELLANEOUS
This component includes: the provision of Airports, Abattoirs, Municipal Courts and Forestry as municipal enterprises.
INTRODUCTION TO MISCELLANEOUS Functions of Sedibeng District Municipality and Gauteng Provincial Government.
T 3.29.0
COMPONENT K: ORGANISATIONAL PERFOMANCE SCORECARD
This component includes: Annual Performance Scorecard Report for the current year.

Midvaal Local Municipality | CHAPTER 3 – SERVICE DELIVERY PERFORMANCE (PERFORMANCE REPORT PART I)
168
No. Strategic Focus
Area (IDP)
Key Performance
Indicator
Baseline (Previous
years actual)
Demand Backlog Annual Target (Year)
5 Year Target
Means of verification
Unit of Measure
Quarterly Target
Quarterly actual
Status (Achieved/
Not Achieved)
Measures taken to improve
performance
Performance Monitoring
Quality Assurance comment
Management Response
Internal Audit
Comment
Portfolio of
Evidence
Plan Number: Plan Name
Note: Set out key plans as per performance scorecard e.g Plan 1: Sustain and build natural enviroment, Plan 2: Economic Development and job creation, Plan 3: Quality living enviroment, Plan 4: Safe, healthy and secure enviroment, Plan 5: Empowering our citizen, Plan 6: Promoting cultural diversity, Plan 7: Good governance, Plan 8: Financial viability and sustainability. T 3.30
All information is included in the organisational scorecards attached to this Annual Report (Annexure T1)

Midvaal Local Municipality | CHAPTER 4 – ORGANISATIONAL DEVELOPMENT PERFORMANCE 169
CHAPTER 4 – ORGANISATIONAL DEVELOPMENT PERFORMANCE (PERFORMANCE REPORT PART II)
INTRODUCTION
The Municipal Structure for 2013/2014 was amended and approved by the Midvaal Local Council during 2012/2013. Midvaal Local Municipality have recruited a total number of 76 employees (54 new appointments and 22 internal appointments) during the 2013/2014 financial year across all departments within the Municipality.
T 4.0.1
COMPONENT A: INTRODUCTION TO THE MUNICIPAL PERSONNEL
4.1 EMPLOYEE TOTALS, TURNOVER AND VACANCIES
2012/13
EmployeesApproved
PostsEmployees Vacancies Vacancies
No. No. No. No. %
Water 40 40 40 0 0.0%
Waste Water (Sanitation) 47 45 45 0 0.0%
Electricity 46 50 46 4 8.0%
Waste Management 82 84 84 0 0.0%
Housing 1 1 1 0 0.0%
Waste Water (Stormwater Drainage) 0 0 0 0 0.0%
Roads 43 43 42 1 2.3%
Transport 0 0 0 0 0.0%
Planning 23 32 29 3 9.4%
Local Economic Development 1 1 1 0 0.0%
Planning (Strategic & Regulatary) 5 5 5 0 0.0%
Community & Social Services 75 75 68 7 9.3%
Enviromental Proctection 4 7 7 0 0.0%
Health 15 15 15 0 0.0%
Security and Safety 101 101 97 4 4.0%
Sport and Recreation 3 3 3 0 0.0%
Corporate Policy Offices and Other 144 147 154 8 5.4%Totals 630 649 637 27 0
T 4.1.1
Employees
Description2013/14
Headings follow the order of services as set out in chapter 3. Service totals should equate to those included in the Chapter 3 employee schedules. Employee and Approved Posts numbers are as at 30 June, as per the approved organogram.
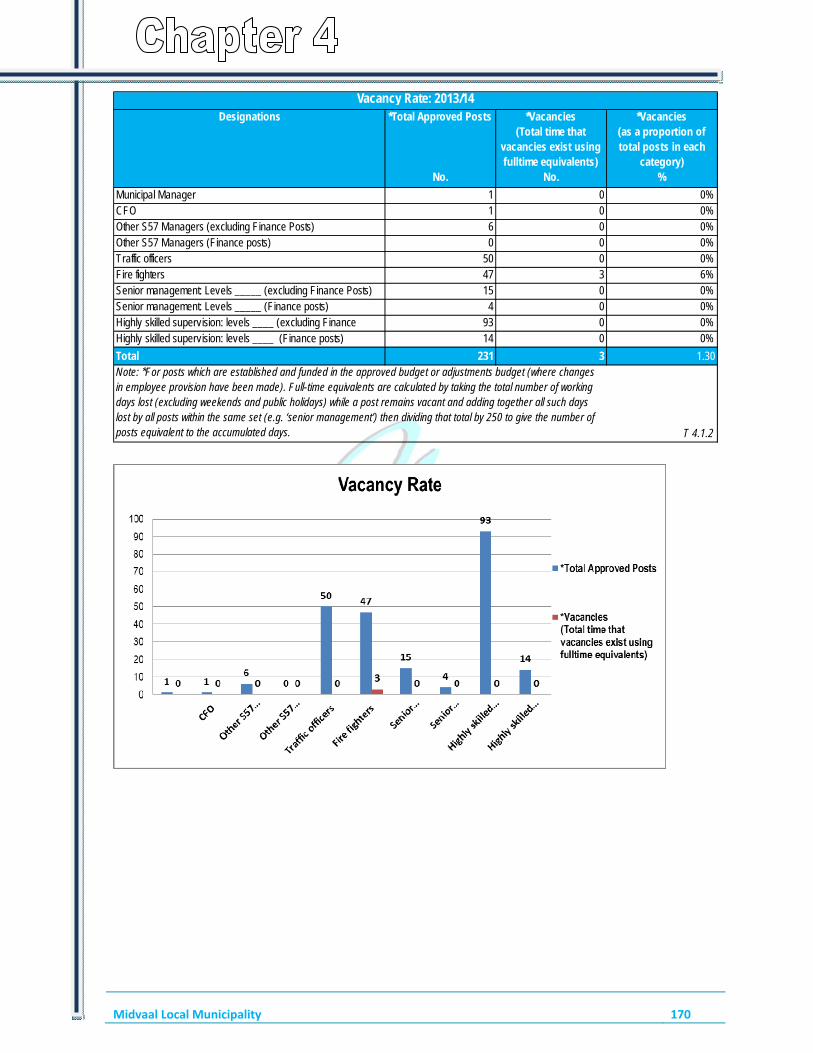
Midvaal Local Municipality 170
Designations *Total Approved Posts *Vacancies (Total time that
vacancies exist using fulltime equivalents)
*Vacancies (as a proportion of total posts in each
category)No. No. %
Municipal Manager 1 0 0%CFO 1 0 0%Other S57 Managers (excluding Finance Posts) 6 0 0%Other S57 Managers (Finance posts) 0 0 0%Traffic officers 50 0 0%Fire fighters 47 3 6%Senior management: Levels _____ (excluding Finance Posts) 15 0 0%Senior management: Levels _____ (Finance posts) 4 0 0%Highly skilled supervision: levels ____ (excluding Finance 93 0 0%Highly skilled supervision: levels ____ (Finance posts) 14 0 0%
Total 231 3 1.30
T 4.1.2
Note: *For posts which are established and funded in the approved budget or adjustments budget (where changes in employee provision have been made). Full-time equivalents are calculated by taking the total number of working days lost (excluding weekends and public holidays) while a post remains vacant and adding together all such days lost by all posts within the same set (e.g. ‘senior management’) then dividing that total by 250 to give the number of posts equivalent to the accumulated days.
Vacancy Rate: 2013/14
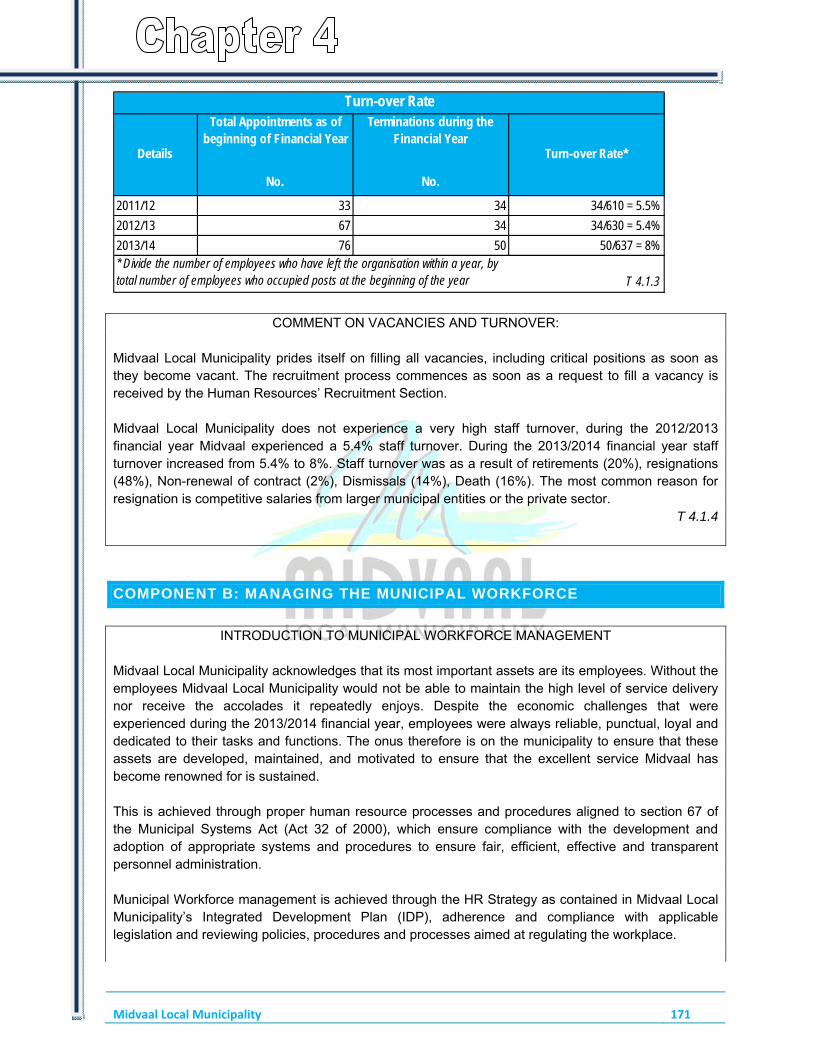
Midvaal Local Municipality 171
Total Appointments as of beginning of Financial Year
Terminations during the Financial Year
No. No.
2011/12 33 34 34/610 = 5.5%
2012/13 67 34 34/630 = 5.4%
2013/14 76 50 50/637 = 8%
T 4.1.3
Turn-over Rate
* Divide the number of employees who have left the organisation within a year, by total number of employees who occupied posts at the beginning of the year
Turn-over Rate*Details
COMMENT ON VACANCIES AND TURNOVER:
Midvaal Local Municipality prides itself on filling all vacancies, including critical positions as soon as they become vacant. The recruitment process commences as soon as a request to fill a vacancy is received by the Human Resources’ Recruitment Section. Midvaal Local Municipality does not experience a very high staff turnover, during the 2012/2013 financial year Midvaal experienced a 5.4% staff turnover. During the 2013/2014 financial year staff turnover increased from 5.4% to 8%. Staff turnover was as a result of retirements (20%), resignations (48%), Non-renewal of contract (2%), Dismissals (14%), Death (16%). The most common reason for resignation is competitive salaries from larger municipal entities or the private sector.
T 4.1.4
COMPONENT B: MANAGING THE MUNICIPAL WORKFORCE
INTRODUCTION TO MUNICIPAL WORKFORCE MANAGEMENT Midvaal Local Municipality acknowledges that its most important assets are its employees. Without the employees Midvaal Local Municipality would not be able to maintain the high level of service delivery nor receive the accolades it repeatedly enjoys. Despite the economic challenges that were experienced during the 2013/2014 financial year, employees were always reliable, punctual, loyal and dedicated to their tasks and functions. The onus therefore is on the municipality to ensure that these assets are developed, maintained, and motivated to ensure that the excellent service Midvaal has become renowned for is sustained. This is achieved through proper human resource processes and procedures aligned to section 67 of the Municipal Systems Act (Act 32 of 2000), which ensure compliance with the development and adoption of appropriate systems and procedures to ensure fair, efficient, effective and transparent personnel administration. Municipal Workforce management is achieved through the HR Strategy as contained in Midvaal Local Municipality’s Integrated Development Plan (IDP), adherence and compliance with applicable legislation and reviewing policies, procedures and processes aimed at regulating the workplace.

Midvaal Local Municipality 172
1. Policy Review and Development Midvaal Local Municipality, as an evolving local government institution regularly reviews its Policies,
process and procedures this is aimed at ensuring that all processes followed, implemented and advocated are open and transparent, aligned to legislative requirements and not unfairly discriminating against employees.
2. Workplace Programmes 2.1 Employee Assistance Programme (EAP) In its strive to sustain a healthy workforce, Midvaal Local Municipality has an Employee
Assistance Programme which is a workplace based programme designed to assist in the identification and resolution of productivity and psycho-social problems which may negatively affect the work performance of employees. Serious cases affecting employees and management are outsourced for professional assistance in appropriate circumstances.
Services rendered under it are:
Face to face counselling on:
- Work related issues such as absenteeism; - Stress management; - Alcohol and substance abuse; - Ill Health Management; - Psycho-social problems; - Financial life skills; - Trauma debriefing; - Bereavement counselling; - Marital and family distress; - Child Care; - HIV/AIDS Support and Counselling. It has proven to be a successful tool and many of our employees are voluntarily using it to their
benefit. 2.2 HIV/AIDS Workplace Forum Midvaal Local Municipality has a dedicated HIV/AIDS Committee whose main
objective is to promote the well-being of employees by providing the Municipality with the information of the employees’ various health and wellness issues but focussing mainly on HIV/AIDS and related illnesses.
This focus resolves around the following key elements of an Employee Wellness
Programme: - To be responsible for the Health & Wellbeing of employees through
awareness programmes, education, training, referral of employees, etc.

Midvaal Local Municipality 173
3. Labour Relations Workforce management is almost impossible in the absence of sound discipline within the
workplace. Midvaal Local Municipality's labour relations section, which is contained in the Human Resources Department, is effective and well recognised. In essence the objectives of this particular function are as follows:
- Ensure compliance with applicable relevant legislative requirements e.g. Labour
Relations, Basic Conditions of Employment Act, Employment Equity etc. - Maintain good work relations with recognised Unions within the workplace. - Ensure fully functional Local Labour forum and its operational systems. It consists of
sub committees dealing with Human Resources Development, Workplace and Services Restructuring and Basic Conditions.
- Ensure adherence to collective agreements applicable to Municipalities as agreed to at the Local Government Bargaining Council.
- Ensure that discipline is corrective and progressive, and not merely punitive - Processes and procedures are in place for the internal resolution of grievances which
have the potential for litigation against Council in the form of disputes. - Processes and procedures are in place for the effective administration of disciplinary
procedures in accordance with the Disciplinary Code. - Organisational Rights Agreements are adhered to by having Shop Stewards elected in
all the departments of the Municipality with all their activities regulated by the collective agreement.
4. Occupational Health and Safety
To ensure a healthy and safe working environment, Midvaal Local Municipality complies with
the Occupational Health and Safety Act and has a fully functional Health & Safety Committee which meets quarterly to address health and safety issues facing the municipality.
Furthermore, the municipality complies with legislation in terms of:
- Legal appointments of the Municipal Manager in terms of 16.1 of the Act, including Managers reporting directly to the Municipal Manager in terms of 16.2 of the Act, have been done.
- Health and Safety Representatives were trained and appointed for a period of three years as per the OHS Act.
5. Employment Equity
In compliance with the Employment Equity Act, Act 55 of 1998, Midvaal Local Municipality developed and submitted an updated five year Employment Equity Plan (2011-2016) to the Department of Labour. The Employment Equity Plan is updated on an annual basis and submitted with the EEA2 and EEA4 reports to the Department of Labour. The progress made with regard to Employment Equity is reported on a monthly basis to the Employment Equity Forum.
Note: MSA 2000 S67 requires municipalities to develop and adopt appropriate systems and procedures to ensure fair, efficient, effective, and transparent personnel administration in accordance with the Employment Equity Act 1998.
T 4.2.0

Midvaal Local Municipality 174
4.2 POLICIES
Name of Policy Completed Reviewed
% %1 Electronic Communications Policy and
Procedures100% 0% C206/11/2006 - 30/11/2006
2 Cell Phone Policy 100% 100% C1071/03/2014 - 27/03/2014
3 Membership Fees Policy 100% 0% C363/08/2008 - 28/08/2008
4 Parking Policy 100% 100% C412/01/2009 - 22/01/2009
5 Induction Programme Policy 100% 50% C414/01/2009 - 22/01/2009
6 Post Retirement Medical Aid Subsidies Policy 100% 100% C1078/03/2014 - 27/03/2014
7 Housing Loans: Municipal Employees 100% 100% C486/08/2009 - 27/08/2009
8 Performance Recognition Policy 100% 0% C489/08/2009 - 27/08/2009
9 Year End Function Policy 100% 0% C490/08/2009 - 27/08/2009
10 EAP Policy 100% 50% C493/08/2009 - 27/08/2009
Overtime Policy 100% 100% C750/12/2011 - 01/12/2011
12 Retirement Policy 100% 50% C749/12/2011 - 01/12/2011
13 Study Assistance Policy 100% 50% C751/12/2011 - 01/12/2011
14 Employment Equity Policy 100% 100% C920/05/2013 - 28/05/2013
15 Recruitment Policy 100% 100% C921/05/2013 - 28/05/2013
16 Sexual Harassment Policy 100% 100% C922/05/2013 - 28/05/2013
17 Succession Planning Policy 100% 50% MCB/4108/08/2013 - 20/08/2013
18 Affirmative Action Policy 100% 100% C954/08/2013 - 28/05/2013
19 Promotion Policy 100% 100% C955/08/2013 - 29/08/2013
20 Employee Transfer Policy 100% 100% C956/08/2013 - 29/08/2013
21 Allowance Policy 100% 100% C1071/03/2014 - 27/03/2014
22 Leave Policy 100% 100% C1072/03/2014 - 27/03/2014
23 Vehicle Policy 100% 100% C1073/03/2014 - 27/03/2014
24 Personal Protective Equipment and Clothing Policy
100% 100% C1074/03/2014 - 27/03/2014
25 Substance Abuse Policy 100% 100% C1075/03/2014 - 27/03/2014
26 Smoking Policy 100% 100% C1076/03/2014 -27/03/2014
27 Time & Attendance Policy 100% 100% C1077/03/2014 - 27/03/2014
33 Other:
T 4.2.1
HR Policies and PlansDate adopted by council or comment on
failure to adopt
Use name of local policies if different from above and at any other HR policies not listed.

Midvaal Local Municipality 175
COMMENT ON WORKFORCE POLICY DEVELOPMENT: Human Resources maintain and develop policies and procedures which comply with applicable legislation and provide the necessary guidelines and awareness to employees on issues related to the workplace. In light of this submission Midvaal Local Municipality has, during the 2013/2014 Financial Year, reviewed the following policies:
1. Succession Planning Policy (MC B/4108/08/2013) 2. Affirmative Action Policy (C954/08/2013) 3. Promotion Policy (C955/08/2013) 4. Employee Transfer Policy (C956/08/2013) 5. PDP (Professional Driving Permit) Policy (C1053/02/2014) 6. Allowance Policy (C1071/03/2014) 7. Leave Policy (C1072/03/2014) 8. Vehicle Policy (C1073/03/2014) 9. Personal Protective Clothing Policy (C1074/03/2014) 10. Substance Abuse Policy (C1075/03/2014) 11. Smoking Policy (C1076/03/2014) 12. Time & Attendance Policy (C1077/03/2014) 13. Post-Retirement Medical Aid Subsidies Policy (C1078/03/2014)
T 4.2.1.1
4.3 INJURIES, SICKNESS AND SUSPENSIONS
Injury Leave Taken
Employees using injury
leave
Proportion employees using sick
leave
Average Injury Leave
per employee
Total Estimated
Cost
Days No. % Days
Required basic medical attention only 123 71 52% 2
Temporary total disablement 146 1 100% 146Permanent disablement 0 0 0% 0 0
Fatal 0 0 0% 0 0
Total 269 72 27% 54 0
T 4.3.1
Number and Cost of Injuries on DutyType of injury
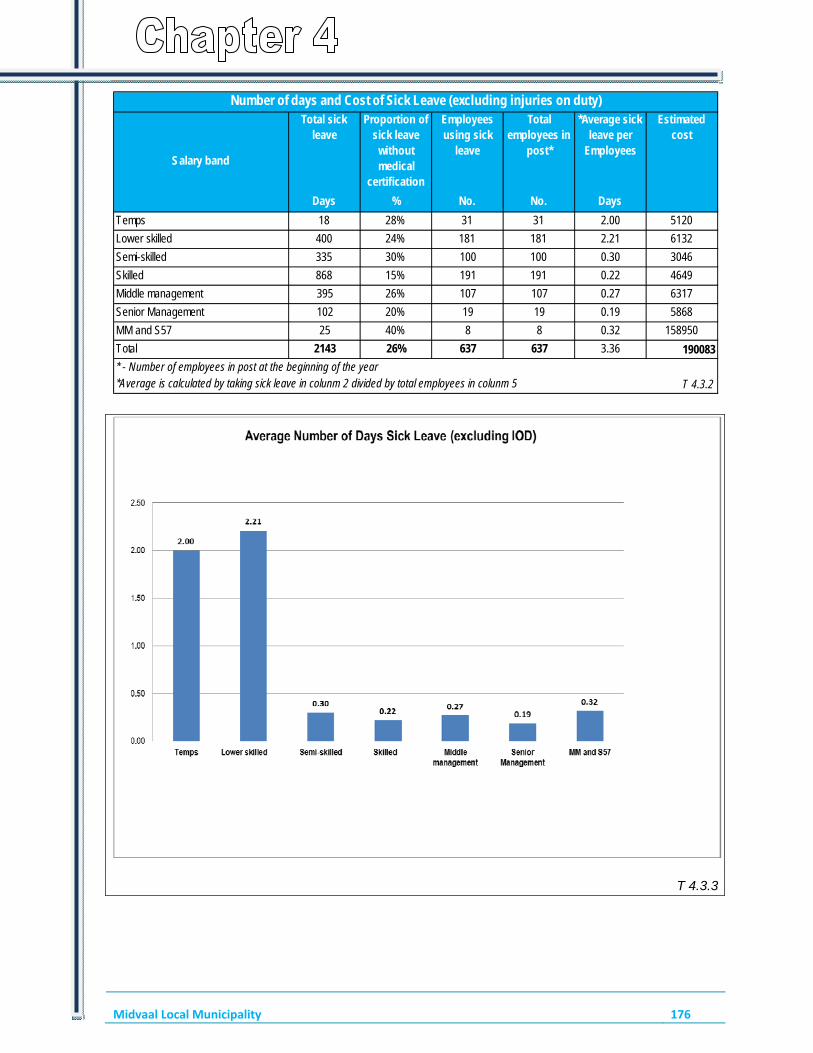
Midvaal Local Municipality 176
Total sick leave
Proportion of sick leave
without medical
certification
Employees using sick
leave
Total employees in
post*
*Average sick leave per
Employees
Estimated cost
Days % No. No. Days
Temps 18 28% 31 31 2.00 5120
Lower skilled 400 24% 181 181 2.21 6132
Semi-skilled 335 30% 100 100 0.30 3046
Skilled 868 15% 191 191 0.22 4649
Middle management 395 26% 107 107 0.27 6317
Senior Management 102 20% 19 19 0.19 5868
MM and S57 25 40% 8 8 0.32 158950
Total 2143 26% 637 637 3.36 190083
Number of days and Cost of Sick Leave (excluding injuries on duty)
* - Number of employees in post at the beginning of the year
Salary band
*Average is calculated by taking sick leave in colunm 2 divided by total employees in colunm 5 T 4.3.2
T 4.3.3

Midvaal Local Municipality 177
COMMENT ON INJURY AND SICK LEAVE: Employees who are injured on duty receive special leave. Incidents are reported to the Safety Officer, investigated and communicated to the relevant authorities including the local Central Safety Meeting and the Compensation Commissioner.
Serious injuries are referred to a Hospital that accepts Compensation cases and the required process is followed in terms of follow-up visits i.e. first medical report, progress report, resumption report and final medical report. For injuries where longer absence from work is expected or recommended, the municipality closely monitors the absence and the employee's Pension or Gratuity Fund is also informed that the employee has sustained a serious injury.
When an employee reports sick for work, the employee completes a sick leave form on his/her return. Sick leave is captured accordingly and closely monitored in specific cases where an employee shows signs of regular sick leave or pattern forming behaviour.
T 4.3.4
Position Nature of Alleged Misconduct
Date of Suspension
Details of Disciplinary Action taken or Status of Case and Reasons why not Finalised
Date Finalised
T 4.3.5
Number and Period of Suspensions
NONE
Position Nature of Alleged Misconduct and Rand value of any loss to the
municipality
Disciplinary action taken Date Finalised
T 4.3.6
Disciplinary Action Taken on Cases of Financial Misconduct
NONE
COMMENT ON SUSPENSIONS AND CASES OF FINANCIAL MISCONDUCT: Discipline is effectively managed and concluded within the relevant time-frames.
T 4.3.7
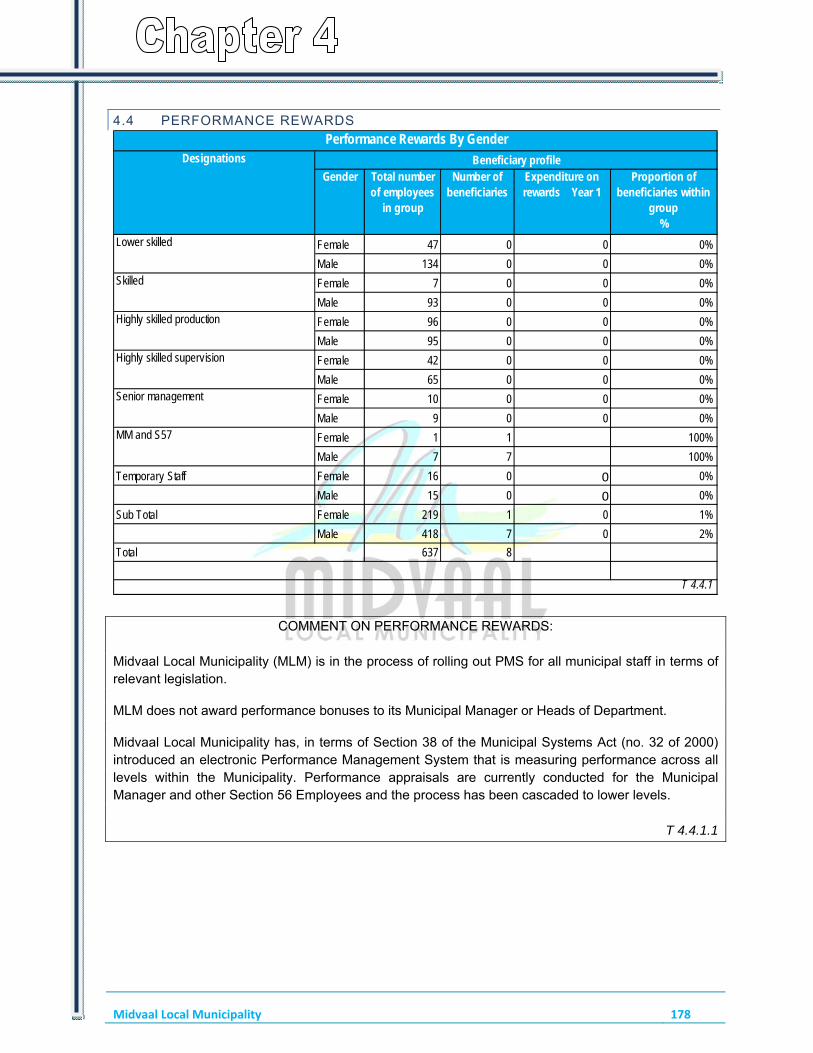
Midvaal Local Municipality 178
4.4 PERFORMANCE REWARDS
Expenditure on rewards Year 1
Proportion of beneficiaries within
group%
Female 47 0 0 0%
Male 134 0 0 0%
Female 7 0 0 0%
Male 93 0 0 0%
Female 96 0 0 0%
Male 95 0 0 0%
Female 42 0 0 0%
Male 65 0 0 0%
Female 10 0 0 0%
Male 9 0 0 0%
Female 1 1 100%
Male 7 7 100%
Temporary Staff Female 16 0 0 0%
Male 15 0 0 0%
Sub Total Female 219 1 0 1%
Male 418 7 0 2%
637 8
T 4.4.1
Highly skilled production
Performance Rewards By Gender
Lower skilled
Skilled
Beneficiary profileGender
Designations
Total number of employees
in group
Number of beneficiaries
Highly skilled supervision
Senior management
MM and S57
Total
COMMENT ON PERFORMANCE REWARDS:
Midvaal Local Municipality (MLM) is in the process of rolling out PMS for all municipal staff in terms of relevant legislation.
MLM does not award performance bonuses to its Municipal Manager or Heads of Department.
Midvaal Local Municipality has, in terms of Section 38 of the Municipal Systems Act (no. 32 of 2000) introduced an electronic Performance Management System that is measuring performance across all levels within the Municipality. Performance appraisals are currently conducted for the Municipal Manager and other Section 56 Employees and the process has been cascaded to lower levels.
T 4.4.1.1

Midvaal Local Municipality 179
C: CAPACITATING THE MUNICIPAL WORKFORCE
INTRODUCTION TO WORKFORCE CAPACITY DEVELOPMENT
Midvaal Local Municipality develops its workforce by facilitating skills programmes aimed at capacitating employees. The Skills Development Strategy is also aimed at providing career guidance and support to employees and coordinating their development through structured learning.
Capacity Development is linked to the annual Workplace Skills Plan (WSP). All training needs that have been identified through the Council’s Skills Audit and found to be a priority for the specific financial year (2013/2014) were addressed through formal, informal training programmes and skills programmes.
Midvaal Local Municipality annually submits a Workplace Skills Plan (WSP) and an Annual Training Report (ATR) as required by the Skills Development Act, to the Local Government Sector Education and Training Authority (LGSETA). During the 2013/2014 financial year these documents were submitted to LGSETA and Midvaal received the necessary mandatory grants to further skills development initiatives within the Municipality.
A total of 20 programmes were identified and 19 of them were completed. A total number of 126 employees received formal training. Midvaal Local Municipality have also assisted five employees to become qualified tradesmen within the Electrical and Plumbing environment. Since the attainment of the relevant qualifications, these employees have been appointed as Plumbers (03) and Electricians (02) within the respective sections.
Programmes identified include:
- Bushcutter - Bobcat - SAMTRAC - Management Orientation - Project Management - Public Speaking - Coaching & Mentoring - Electricians (Trade Test) - Plumber (Trade Test) - Motor Mechanic (Trade Test) - Pavement Repairs - Diversity Management - Record Keeping - First Aid Training - TLB Operator Course - Millwright (training) - Pipe Fitting (training) - Municipal Finance Management Programme - Traffic Diploma (18.2 Learners)
The total training budget for the 2013/2014 financial year amounted to R962 211.00 and of this amount, R 853 780.00 (89%) was spent.
Midvaal Local Municipality 180
Training conducted was not only WSP related as there were requests for other additional, but relevant for staff. These non-related training programmes include:
- Safe use of Hand & Power Tools - Municipal Development Programme (Councillors) - OHS Representative - RDA Systems (Libraries) - Events Safety Management Training - Legal Liability - Waste Water Treatment Training - Tractor Driver Training - Chlorine Handling Training - Fundamentals of Fire Safety Training - ORHVS – Electrical Training
To measure the impact of training that has been conducted a sample assessment is done by means of evaluation forms that are completed by trainees immediately after the training has been conducted.
MFMA Compliance to Minimum Competency Regulations
Midvaal Local Municipality received an extension on the 2013 deadline (through the special merit case provisions) to comply with the MFMA Competency Regulations. The deadline for compliance has been extended until September 2015 and plans are already in process to ensure that all relevant stakeholders from Midvaal Local Municipality are compliant by the deadline.
Study Assistance
Midvaal provides employees with an opportunity to further their formal studies through a study assistance/bursary scheme. This initiative motivates employees to further their studies within their respective vocations so as to enable them to perform their duties better and also promotes staff progression to higher levels within the organisation. The strategy is to link the study assistance/bursary scheme to the personal development plans of employees and by so doing ensure a sustainable, well developed and professionally qualified workforce.
A total of 10 employees participated in this scheme. Below is an outline of the employees' designation and courses for which they enrolled:
1.) Sub Accountant – National Diploma: Supply Chain Management 2.) Secretary – BA Degree: Government & Development 3.) Youth Development Officer – Diploma: Youth Development 4.) Communications Manager – Diploma: Business Management 5.) Events Coordinator – National Diploma: Events Management 6.) Ward Committee Officer – Local Government Management Certificate 7.) Technical Assistant – Diploma: Logistics 8.) Traffic Officer – Diploma: Traffic Management 9.) Traffic Officer – Diploma: Traffic Management 10.) Admin Clerk – Diploma: Human Resources Management
T 4.5

Midvaal Local Municipality | (PERFORMANCE REPORT PART II) 181
4.5 SKILLS DEVELOPMENT AND TRAINING
No.Actual: 30 Jun
2013
Actual: 30 Jun
2014
2013/14 Target
Actual: 30 Jun
2013
Actual: 30 Jun
2014
2013/14 Target
Actual: 30 Jun
2013
Actual: 30 Jun
2014
2013/14 Target
Actual: 30 Jun
2013
Actual: 30 Jun
2014
2013/14 Target
Female 1 0 0 0 0 1 0 0 0 0 1 0Male 7 0 0 0 0 0 0 0 0 0 0
Female 10 0 0 0 0 1 0 0 0 0 1 0
Male 9 0 0 0 0 0 1 0 1 0 0
Female 0 0 0 0 0 2 0 0 0 0 2
Male 0 0 0 0 0 2 1 0 1 0 2Female 42 0 0 0 0 11 2 0 0 0 11 2Male 65 0 0 0 0 12 2 1 0 1 12 2Female 53 0 0 0 0 13 4 0 0 0 13 4Male 81 0 0 0 0 12 4 3 0 3 12 4
Total 134 0 0 0 0 25 8 6 0 0 6 25 8T 4.5.1*Registered with professional Associate Body e.g CA (SA)
Skills MatrixManagement level Gender Employees
in post as at 30 June
2014
Number of skilled employees required and actual as at 30 June 2013
Learnerships Skills programmes & other short courses
Other forms of training Total
MM and s57
Councillors, senior officials and managers
Technicians and associate professionals*
Professionals
Sub total
Description A. Total number of officials employed by municipality (Regulation 14(4)(a) and (c))
B. Total number of officials employed by municipal entities (Regulation 14(4)(a) and (c)
Consolidated: Total of A and B
Consolidated: Competency assessments completed for A and B (Regulation 14(4)(b) and (d))
Consolidated: Total number of officials whose performance agreements comply with Regulation 16 (Regulation 14(4)(f))
Consolidated: Total number of officials that meet prescribed competency levels (Regulation 14(4)(e))
Financial Officials
Accounting officer 1 0 1 1 1 1
Chief financial officer 1 0 1 1 1 1
Senior managers 6 0 6 4 5 4
Any other financial officials 63 0 63 5 0 5
Supply Chain Management Officials
Heads of supply chain management units 1 0 1 1 0 1
Supply chain management senior managers 3 0 3 3 1 3
TOTAL 75 0 75 15 8 15T 4.5.2
Financial Competency Development: Progress Report*
* This is a statutory report under the National Treasury: Local Government: MFMA Competency Regulations (June 2007)
Note: The Municipal Manager, the Chief Financial Officer, four HOD’s and the head of Supply Chain Management Office is fully competent and compliant with the MFMA requirements. The other officials are all in process of training to fully comply as well.
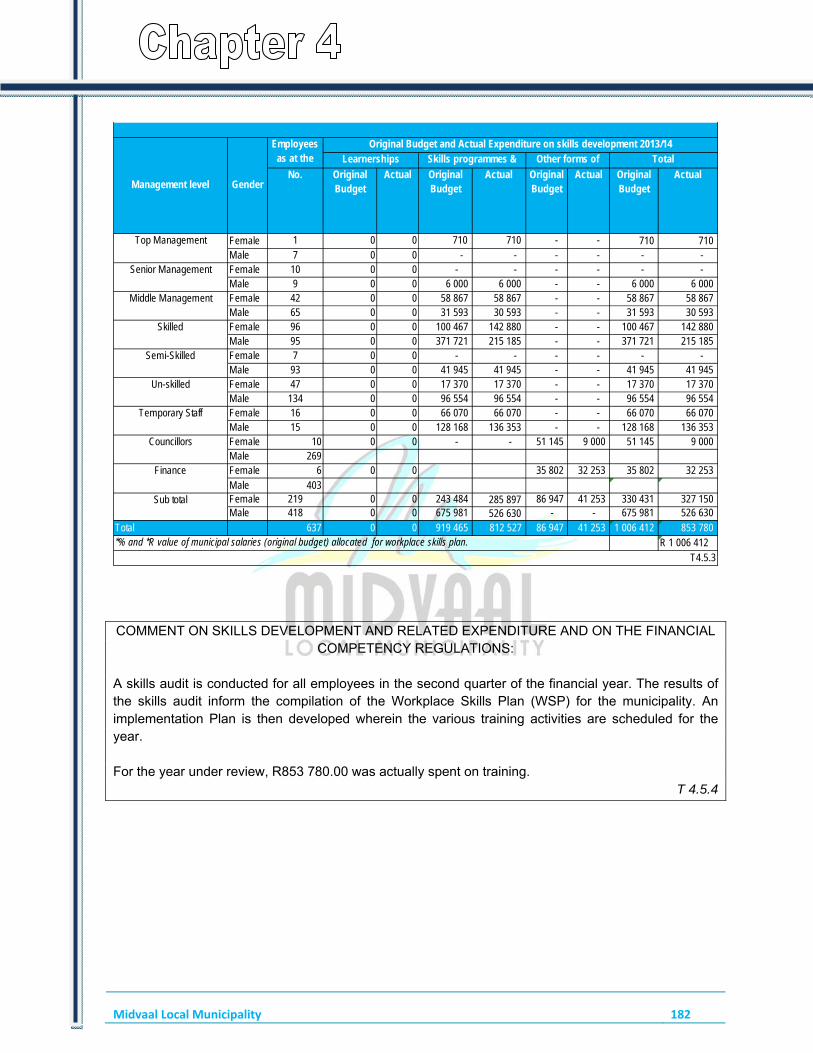
Midvaal Local Municipality 182
No. Original Budget
Actual Original Budget
Actual Original Budget
Actual Original Budget
Actual
Female 1 0 0 710 710 - - 710 710 Male 7 0 0 - - - - - - Female 10 0 0 - - - - - - Male 9 0 0 6 000 6 000 - - 6 000 6 000 Female 42 0 0 58 867 58 867 - - 58 867 58 867 Male 65 0 0 31 593 30 593 - - 31 593 30 593 Female 96 0 0 100 467 142 880 - - 100 467 142 880 Male 95 0 0 371 721 215 185 - - 371 721 215 185 Female 7 0 0 - - - - - - Male 93 0 0 41 945 41 945 - - 41 945 41 945 Female 47 0 0 17 370 17 370 - - 17 370 17 370 Male 134 0 0 96 554 96 554 - - 96 554 96 554 Female 16 0 0 66 070 66 070 - - 66 070 66 070 Male 15 0 0 128 168 136 353 - - 128 168 136 353 Female 10 0 0 - - 51 145 9 000 51 145 9 000 Male 269Female 6 0 0 35 802 32 253 35 802 32 253 Male 403Female 219 0 0 243 484 285 897 86 947 41 253 330 431 327 150 Male 418 0 0 675 981 526 630 - - 675 981 526 630
Total 637 0 0 919 465 812 527 86 947 41 253 1 006 412 853 780 R 1 006 412
T4.5.3
Management level Gender
Employees as at the
Original Budget and Actual Expenditure on skills development 2013/14Learnerships Skills programmes & Other forms of Total
Top Management
Senior Management
Middle Management
Skilled
Semi-Skilled
Un-skilled
Temporary Staff
Councillors
Finance
Sub total
*% and *R value of municipal salaries (original budget) allocated for workplace skills plan.
COMMENT ON SKILLS DEVELOPMENT AND RELATED EXPENDITURE AND ON THE FINANCIAL COMPETENCY REGULATIONS:
A skills audit is conducted for all employees in the second quarter of the financial year. The results of the skills audit inform the compilation of the Workplace Skills Plan (WSP) for the municipality. An implementation Plan is then developed wherein the various training activities are scheduled for the year. For the year under review, R853 780.00 was actually spent on training.
T 4.5.4

Midvaal Local Municipality 183
COMPONENT D: MANAGING THE WORKFORCE EXPENDITURE
INTRODUCTION TO WORKFORCE EXPENDITURE The workforce expenditure is controlled by ensuring that all vacancies that exist are budgeted for and that the vacancy appears on the organisational structure and prior to making an appointment the confirmation of appointment is approved by financial services, confirming that the position is budgeted for. All expenditure is aligned to the salary budget for the specific financial year.
T 4.6.0
4.6 EMPLOYEE EXPENDITURE
Source: MBRR SA22 T 4.6.1
COMMENT ON WORKFORCE EXPENDITURE: The workforce expenditure is in line with the national norms and increased in line with inflation. The decrease in the current year is as a direct result of the reduction in the post retirement benefit provision due to the change in the benefits available to staff members.
T 4.6.1.1
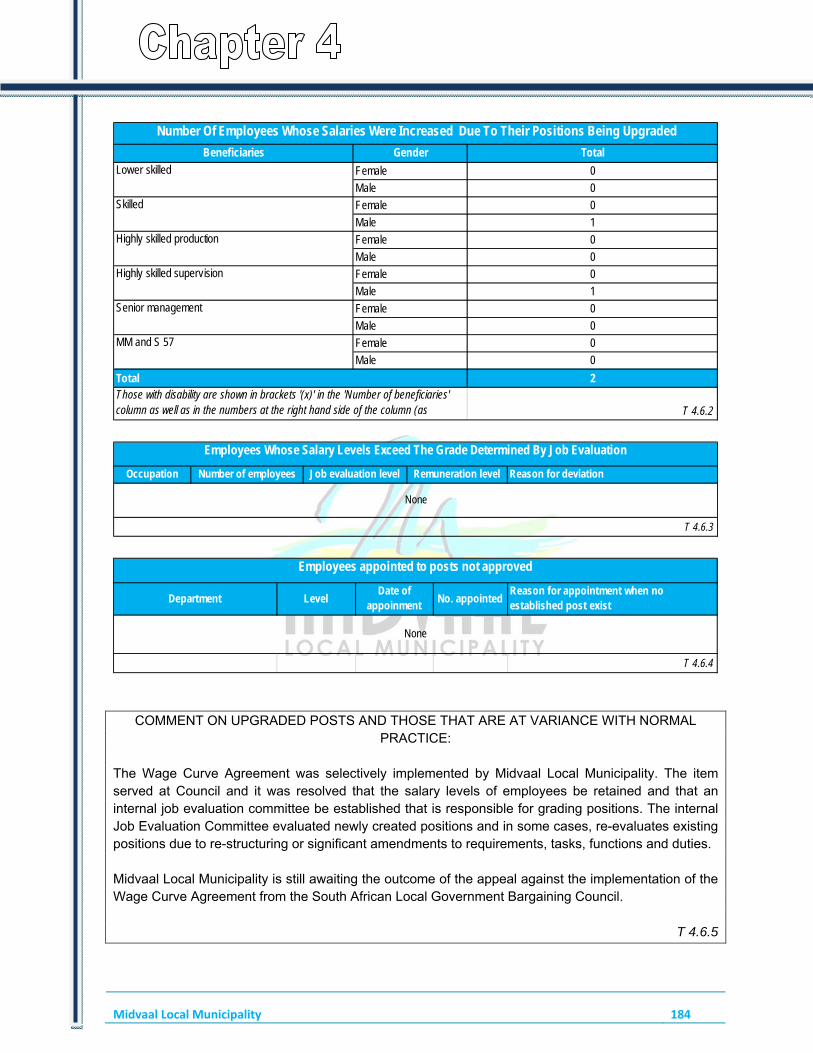
Midvaal Local Municipality 184
Beneficiaries Gender Total
Female 0
Male 0
Female 0
Male 1
Female 0
Male 0
Female 0
Male 1
Female 0
Male 0
Female 0
Male 0
2
T 4.6.2Those with disability are shown in brackets '(x)' in the 'Number of beneficiaries' column as well as in the numbers at the right hand side of the column (as
MM and S 57
Number Of Employees Whose Salaries Were Increased Due To Their Positions Being Upgraded
Lower skilled
Skilled
Highly skilled production
Highly skilled supervision
Senior management
Total
Occupation Number of employees Job evaluation level Remuneration level Reason for deviation
T 4.6.3
Employees Whose Salary Levels Exceed The Grade Determined By Job Evaluation
None
Department LevelDate of
appoinmentNo. appointed
Reason for appointment when no established post exist
T 4.6.4
Employees appointed to posts not approved
None
COMMENT ON UPGRADED POSTS AND THOSE THAT ARE AT VARIANCE WITH NORMAL PRACTICE:
The Wage Curve Agreement was selectively implemented by Midvaal Local Municipality. The item served at Council and it was resolved that the salary levels of employees be retained and that an internal job evaluation committee be established that is responsible for grading positions. The internal Job Evaluation Committee evaluated newly created positions and in some cases, re-evaluates existing positions due to re-structuring or significant amendments to requirements, tasks, functions and duties. Midvaal Local Municipality is still awaiting the outcome of the appeal against the implementation of the Wage Curve Agreement from the South African Local Government Bargaining Council.
T 4.6.5
Midvaal Local Municipality 185
DISCLOSURES OF FINANCIAL INTERESTS All councillors, Section 57-appointees and officials annually disclose their financial interests in terms of: 1. Shares and other financial interests; 2. Directorships and partnerships (spouse and family members included); 3. Remunerated work outside the municipality; 4. Consultancies and retainerships; 5. Sponsorships; 6. Gifts and hospitality from a source other than a family member 7. Land and property ownership; 8. Vehicle(s) owned; 9. Participation in elections.
T 4.6.6

Midvaal Local Municipality | CHAPTER 5 – FINANCIAL PERFORMANCE 186
CHAPTER 5 – FINANCIAL PERFORMANCE
INTRODUCTION Chapter 5 contains information regarding financial performance and highlights specific accomplishments. The chapter comprises of three components: Component A: Statement of Financial Performance Component B: Spending Against Capital Budget Component C: Other Financial Matters
T 5.0.1
COMPONENT A: STATEMENTS OF FINANCIAL PERFORMANCE
INTRODUCTION TO FINANCIAL STATEMENTS Note: Statements of Revenue Collection Performance by vote and by source are included at Appendix K. The purpose of the Statement of Financial Performance is to give an account of the results of the municipality’s operations for the third quarter. These transactions result from the operating budget of Council. The result is expressed as being either a surplus of a deficit (being the difference between Revenue and Expenditure). A surplus is indicative of Revenue being more than Expenditure and a deficit of Expenditure being more than Revenue. The purpose of the Statement of Financial Position is to give an account of the assets and liabilities of the municipality at the end of the financial year. Net assets are shown which the difference between the assets and the liabilities is. If the municipality has a net deficit, it is indicative that the municipality has more liabilities than assets, which could be interpreted as being insolvent. The cash flow statement shows the net CASH result. Here accruals are not applicable as the focus is on cash movements. Technically the statement starts with the accounting surplus as per the Statement of Financial Performance which gets adjusted for all non-cash transactions. All other cash transactions not resulting from the Statement of Financial Performance are recorded. These items can be referenced back to both the capital budget as well as the items reported as part of the quarterly Section 11 withdrawals reports submitted to Council. There are three main categories: Net cash resulting from operating activities – this section shows the result of the operations of Council in cash terms. It includes the rendering of municipal services, purchasing of inventory kept in stores, debtors and creditors transactions and interest paid and received.

Midvaal Local Municipality 187
Net cash resulting from investing activities – this section shows the result from amounts invested (either in assets through the capital budget or as cash investments) as well as investments withdrawn. Net cash resulting from financing activities – this section shows the result from financing activities, being mainly external loans taken up or redeemed. A healthy financial situation is one where the municipality has a net cash surplus resulting from operations as main source of revenue rather than from financing activities. A second important measure is to look for a correlation between cash generated from financing activities and investing activities which shows that funds borrowed were invested in capital infrastructure and not used for operations. A very dangerous situation would be where there is a net cash deficit from operations, no or limited cash invested but cash received from financing activities. That would be indicative of a municipality utilising borrowings to fund operations instead of infrastructure assets.
T 5.1.0

Midvaal Local Municipality 188
5.1 STATEMENTS OF FINANCIAL PERFORMANCE
2012/13Actual Original Budget Adjusted Budget Actual Original
BudgetAdjustments
Budget
Financial Performance
Property rates 94 353 118 112 108 978 106 157 -11% -3%
Service charges 377 171 419 322 422 322 421 538 1% 0%
Investment revenue 2 037 1 800 2 800 4 851 63% 42%
Transfers recognised - operational 64 200 71 285 71 285 68 249 -4% -4%
Other own revenue 37 405 34 085 38 939 76 683 56% 49%Total Revenue (excluding capital transfers and contributions) 575 166 644 603 644 324 677 478 5% 5%
Employee costs 151 170 165 305 149 053 125 998 -31% -18%
Remuneration of councillors 7 875 9 708 9 377 8 741 -11% -7%
Depreciation & asset impairment 110 580 117 353 128 756 115 484 -2% -11%
Finance charges 16 120 22 116 23 135 16 722 -32% -38%
Materials and bulk purchases 225 660 249 800 254 962 250 231 0% -2%
Transfers and grants 12 33 1 639 1 494 98% -10%
Other expenditure 142 175 174 397 169 150 190 592 8% 11%
Total Expenditure 653 590 738 712 736 073 709 262 -4% -4%
Surplus/(Deficit) (78 425) (94 109) (91 749) (31 784) -196% -189%
Transfers recognised - capital 32 006 84 316 36 316 36 316 -132% 0%
Contributions recognised - capital & contributed assets 57 394 10 000 1 000 2 664 -275% 62%
Surplus/(Deficit) after capital transfers & contributions 10 976 207 (54 433) 7 195 97% 856%
Share of surplus/ (deficit) of associate
Surplus/(Deficit) for the year 10 976 207 (54 433) 7 195 97% 856%
Capital expenditure & funds sources
Capital expenditure 98 130 152 467 96 907 86 172 -77% -12%Transfers recognised - capital 29 448 84 316 36 314 35 683 -136% -2%
Public contributions & donations 55 714 10 000 1 500 1 068 -836% -40%
Borrowing 3 112 45 440 43 046 35 919 -27% -20%
Internally generated funds 9 855 12 711 16 048 13 501 6% -19%
Total sources of capital funds 98 130 152 467 96 907 86 172 -77% -12%
Financial position
Total current assets 154 498 137 978 165 308 226 859 39% 27%
Total non current assets 2 151 315 2 106 455 2 122 148 2 116 095 0% 0%
Total current liabilities 103 826 109 550 108 131 129 888 16% 17%
Total non current liabilities 222 648 192 135 214 846 226 531 15% 5%
Community wealth/Equity 1 979 339 1 942 748 1 964 479 1 986 534 2% 1%
Cash flows
Net cash from (used) operating 75 783 117 855 63 333 86 495 -36% 27%
Net cash from (used) investing (53 274) (152 467) (96 907) (76 442) -99% -27%
Net cash from (used) financing 12 624 36 858 37 974 40 934 10% 7%
Cash/cash equivalents at the year end 40 484 22 600 44 884 91 471 75% 51%
Cash backing/surplus reconciliation
Cash and investments available 40 484 22 600 44 884 91 471 75% 51%
Application of cash and investments 77 683 17 219 50 318 85 306 80% 41%
Balance - surplus (shortfall) (37 199) 5 381 (5 434) 6 165 13% 188%
Asset management
Asset register summary (WDV) 2 145 871 2 106 455 2 122 148 2 094 779 -1% -1%
Depreciation & asset impairment 109 753 117 353 128 756 115 484 -2% -11%
Renewal of Existing Assets 28 89 36 35 -152% -1%
Repairs and Maintenance 28 676 32 934 33 126 30 203 -9% -10%
Free services
Cost of Free Basic Services provided 6 607 7 340 7 340 7 002 -5% -5%
Revenue cost of free services provided 64 091 71 213 80 346 107 084 33% 25%
Households below minimum service level
Water: 1 1 1 1 0% 0%
Sanitation/sewerage: 3 0 0 0 0% 0%
Energy: 5 4 4 4 0% 0%
Refuse: 10 10 10 10
T 5.1.1Variances are calculated by dividing the difference between actual and original/adjustments budget by the actual. This table is aligned to MBRR table A1
Financial SummaryR' 000
Description2013/14 2013/14 Variance

Midvaal Local Municipality 189
2012/13
ActualOriginal Budget
Adjustments Budget
ActualOriginal Budget
Adjustments Budget
Operating CostWater 98 811 105 929 109 761 107 464 1.43% -2.14%
Waste Water (Sanitation) 29 571 33 600 35 168 27 690 -21.35% -27.01%
Electricity 235 218 253 840 253 812 242 739 -4.57% -4.56%
Waste Management 38 447 34 375 35 382 34 601 0.65% -2.26%
HousingComponent A: sub-total 402 046 427 745 434 122 412 494 -3.70% -5.24%
Engineering Admin 7 898 10 311 10 164 7 628 -35.17% -33.25%
Roads 61 151 69 053 68 221 62 886 -9.81% -8.48%
Mechanical Workshop 1 911 3 514 3 463 1 781 -97.28% -94.43%
Component B: sub-total 70 960 82 878 81 849 72 296 -14.64% -13.21%
Planning 16 310 23 444 18 312 14 751 -58.93% -24.14%
Local Economic DevelopmentComponent B: sub-total 16 310 23 444 18 312 14 751 -58.93% -24.14%
Planning (Strategic & Regulatary)Local Economic DevelopmentComponent C: sub-total
Community & Social Services 26 230 12 194 12 060 10 153 -20.10% -18.79%
Enviromental Proctection 2 352 3 417 3 516 2 698 -26.63% -30.30%
Health (Clinics) 4 995 6 144 5 934 4 349 -41.26% -36.43%
Security and Safety (Traffic & Fire) 38 628 44 851 46 041 73 795 39.22% 37.61%
Sport and Recreation 1 976 19 355 18 085 15 654 -23.64% -15.53%
Corporate Policy Offices and Other 90 093 118 685 116 155 103 072 -15.15% -12.69%
Component D: sub-total 164 274 204 645 201 790 209 721 2.42% 3.78%
Total Expenditure 653 590 738 712 736 073 709 262 -4.15% -3.78%
T 5.1.2In this table operational income is offset agaist operational expenditure leaving a net operational expenditure total for each
2013/14 2013/14Variance
Financial Performance of Operational ServicesR '000
Description
COMMENT ON FINANCIAL PERFORMANCE: Financial performance for the year was satisfactory. 105% of the revenue as per the adjusted budget was received. The revenue for the year is an increase of 7.81% from the 2012/2013 financial year. Operating expenditure increased with 8.52% from the previous financial year. The year ended with a surplus of R7.2m.
T5.1.3
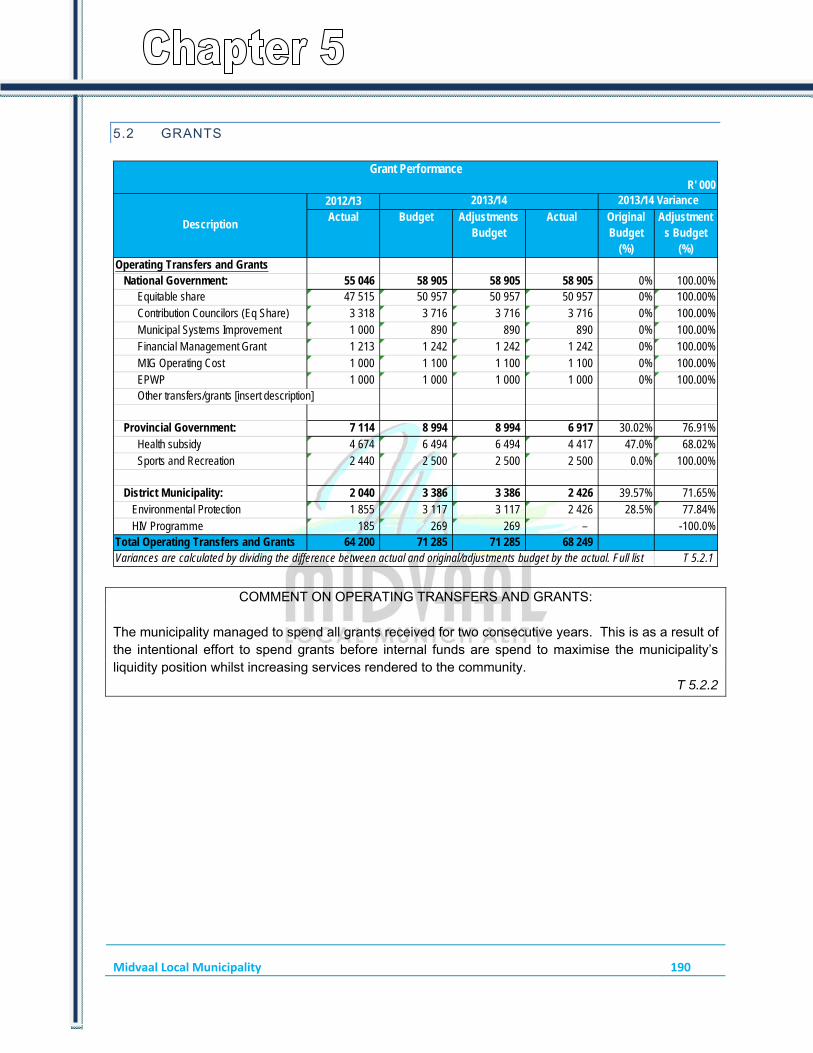
Midvaal Local Municipality 190
5.2 GRANTS
2012/13Actual Budget Adjustments
BudgetActual Original
Budget (%)
Adjustments Budget
(%)Operating Transfers and Grants
National Government: 55 046 58 905 58 905 58 905 0% 100.00% Equitable share 47 515 50 957 50 957 50 957 0% 100.00% Contribution Councilors (Eq Share) 3 318 3 716 3 716 3 716 0% 100.00% Municipal Systems Improvement 1 000 890 890 890 0% 100.00% Financial Management Grant 1 213 1 242 1 242 1 242 0% 100.00% MIG Operating Cost 1 000 1 100 1 100 1 100 0% 100.00% EPWP 1 000 1 000 1 000 1 000 0% 100.00% Other transfers/grants [insert description]
Provincial Government: 7 114 8 994 8 994 6 917 30.02% 76.91% Health subsidy 4 674 6 494 6 494 4 417 47.0% 68.02% Sports and Recreation 2 440 2 500 2 500 2 500 0.0% 100.00%
District Municipality: 2 040 3 386 3 386 2 426 39.57% 71.65%Environmental Protection 1 855 3 117 3 117 2 426 28.5% 77.84%HIV Programme 185 269 269 – -100.0%
Total Operating Transfers and Grants 64 200 71 285 71 285 68 249 T 5.2.1Variances are calculated by dividing the difference between actual and original/adjustments budget by the actual. Full list
Description
R' 000Grant Performance
2013/14 2013/14 Variance
COMMENT ON OPERATING TRANSFERS AND GRANTS: The municipality managed to spend all grants received for two consecutive years. This is as a result of the intentional effort to spend grants before internal funds are spend to maximise the municipality’s liquidity position whilst increasing services rendered to the community.
T 5.2.2
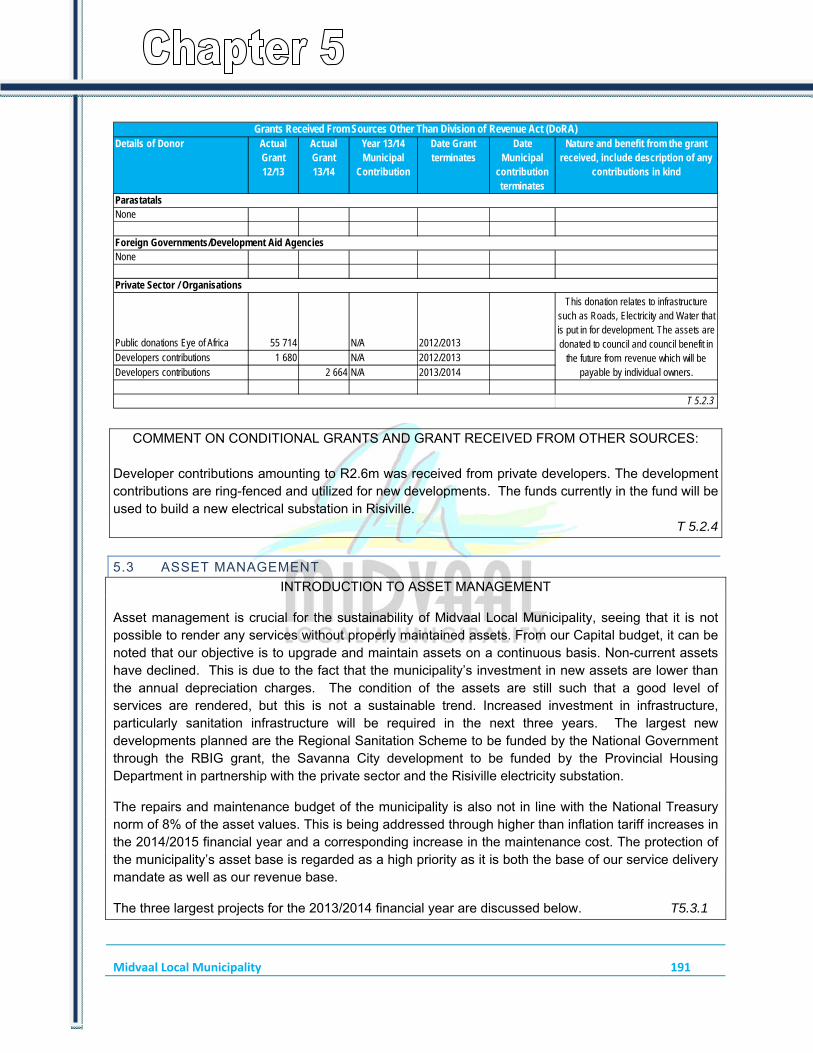
Midvaal Local Municipality 191
Details of Donor Actual Grant12/13
Actual Grant13/14
Year 13/14Municipal
Contribution
Date Grant terminates
Date Municipal
contribution terminates
Nature and benefit from the grantreceived, include description of any
contributions in kind
None
None
Public donations Eye of Africa 55 714 N/A 2012/2013Developers contributions 1 680 N/A 2012/2013Developers contributions 2 664 N/A 2013/2014
T 5.2.3
Grants Received From Sources Other Than Division of Revenue Act (DoRA)
Parastatals
Foreign Governments/Development Aid Agencies
Private Sector / Organisations
This donation relates to infrastructure such as Roads, Electricity and Water that is put in for development. The assets are donated to council and council benefit in
the future from revenue which will be payable by individual owners.
COMMENT ON CONDITIONAL GRANTS AND GRANT RECEIVED FROM OTHER SOURCES: Developer contributions amounting to R2.6m was received from private developers. The development contributions are ring-fenced and utilized for new developments. The funds currently in the fund will be used to build a new electrical substation in Risiville.
T 5.2.4
5.3 ASSET MANAGEMENT
INTRODUCTION TO ASSET MANAGEMENT
Asset management is crucial for the sustainability of Midvaal Local Municipality, seeing that it is not possible to render any services without properly maintained assets. From our Capital budget, it can be noted that our objective is to upgrade and maintain assets on a continuous basis. Non-current assets have declined. This is due to the fact that the municipality’s investment in new assets are lower than the annual depreciation charges. The condition of the assets are still such that a good level of services are rendered, but this is not a sustainable trend. Increased investment in infrastructure, particularly sanitation infrastructure will be required in the next three years. The largest new developments planned are the Regional Sanitation Scheme to be funded by the National Government through the RBIG grant, the Savanna City development to be funded by the Provincial Housing Department in partnership with the private sector and the Risiville electricity substation.
The repairs and maintenance budget of the municipality is also not in line with the National Treasury norm of 8% of the asset values. This is being addressed through higher than inflation tariff increases in the 2014/2015 financial year and a corresponding increase in the maintenance cost. The protection of the municipality’s asset base is regarded as a high priority as it is both the base of our service delivery mandate as well as our revenue base.
The three largest projects for the 2013/2014 financial year are discussed below. T5.3.1

Midvaal Local Municipality 192
NameDescriptionAsset TypeKey Staff Involved Project Management Unit and other Engineering Services SectionsStaff Responsibilities Maintain roads and business area
10/11 11/12 12/13 13/140 - 10 000 000 9 959 175
Capital ImplicationsFuture Purpose of AssetDescribe Key IssuesPolicies in Place to Manage Asset
NameDescriptionAsset TypeKey Staff Involved Project Management Unit and other Engineering Services SectionsStaff Responsibilities Maintain and operate network
10/11 11/12 12/13 13/148 930 672.4
Capital ImplicationsFuture Purpose of AssetDescribe Key IssuesPolicies in Place to Manage Asset
NameDescriptionAsset TypeKey Staff Involved Project Management Unit and other Engineering Services SectionsStaff Responsibilities Maintain and operate network
10/11 11/12 12/13 13/144 981 717 2 931 000 8 500 000
Capital ImplicationsFuture Purpose of AssetDescribe Key IssuesPolicies in Place to Manage Asset
T 5.3.2
To render a sufficient service on waste water treatmentCurrent works is overloaded therefore the need was identified.
Grant funding
Network
Asset ValueGrant fundingEnergy efficiencyOverloaded networkYes
Asset 3Sewer Connections and ExtensionsSewer Connections and ExtensionsNetwork
Asset Value
TREATMENT OF THE THREE LARGEST ASSETS ACQUIRED YEAR 13/14
Increase energy efficiency
Asset 1CBD Phase 4To upgrade the central business areaRoads
Asset ValueCapital Replacement ReserveInvestment opportunitiesUpgrading of central business areaYes
Asset 2Engergy Efficiency (EEDSMG)

Midvaal Local Municipality 193
COMMENT ON ASSET MANAGEMENT:
Asset Management is done in line with the requirements of GRAP 17 and best practices as per the National Treasury asset management guidelines. An external service provider has been appointed to both manage the asset register as well as to perform the annual asset verification and condition assessment. A prior year adjustment has been processed on investment assets during the year due to a reclassification between investment property and PPE. A number of assets were impaired as required by GRAP based on the asset condition assessments performed. The increased maintenance spending in future years should lead to reduced asset impairments in the coming years.
T 5.3.3
Original Budget Adjustment Budget Actual Budget variance
Repairs and Maintenance Expenditure 32 934 33 126 30 203 8%
T 5.3.4
Repair and Maintenance Expenditure: Year 13/14
R' 000
COMMENT ON REPAIR AND MAINTENANCE EXPENDITURE:
The repairs and maintenance budget of the municipality is not in line with the National Treasury norm of 8% of the asset values. This is being addressed through higher than inflation tariff increases in the 2014/2015 financial year and a corresponding increase in the maintenance cost. The protection of the municipality’s asset base is regarded as a high priority as it is both the base of our service delivery mandate as well as our revenue base.
T 5.3.4.1

Midvaal Local Municipality 194
5.4 FINANCIAL RATIOS BASED ON KEY PERFORMANCE INDICATORS
0.96 1.06
1.49
1.75
-
0.20
0.40
0.60
0.80
1.00
1.20
1.40
1.60
1.80
2.00
2010/2011 2011/2012 2012/2013 Current Year 2013/2014
Liquidity ratio
Liquidity Ratio – Measures the municipality’s ability to pay its bills and is calculated by dividing the monetary assets (due within one year ) by the municipality’s current liabilities. A higher ratio is better.
Data used from MBRR SA8
T 5.4.1
4.19 4.16
28.61
61.85
-
10.00
20.00
30.00
40.00
50.00
60.00
70.00
2010/2011 2011/2012 2012/2013 Current Year 2013/2014
Cost Coverage
Cost coverage
Cost Coverage– It explains how many months expenditure can be covered by the cash and other liquid assets available to the Municipality excluding utilisation of grants and is calculated
Data used from MBRR SA8
T 5.4.2
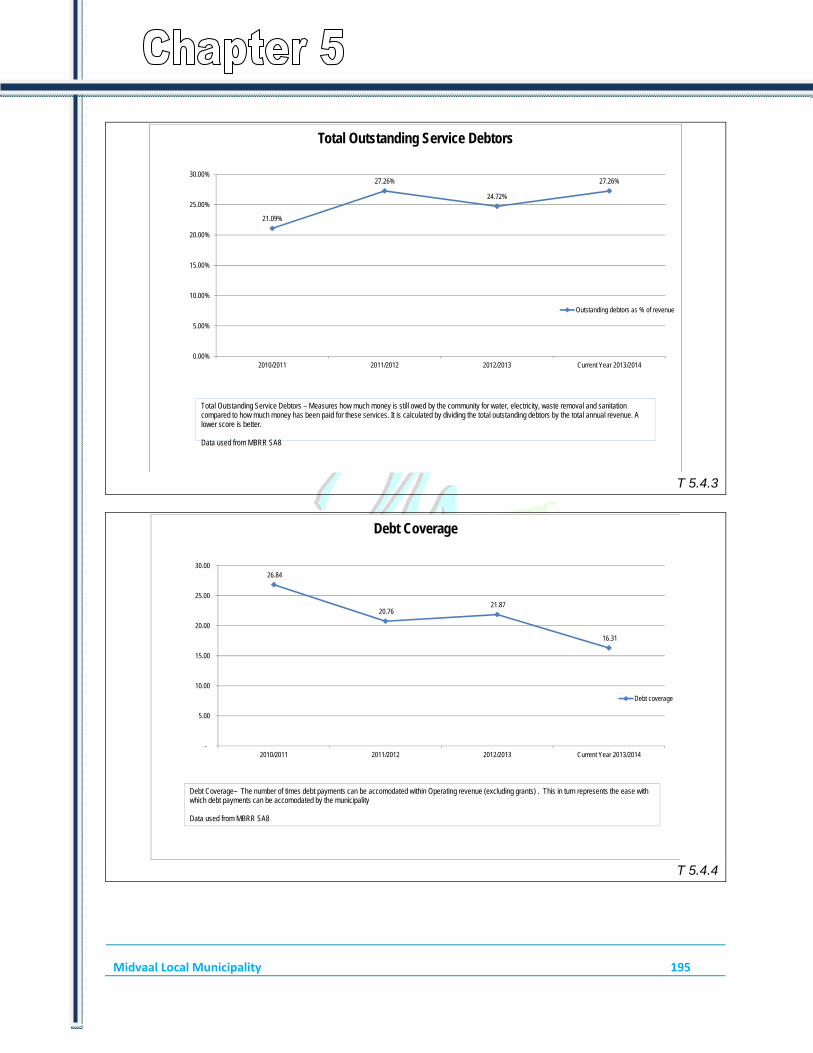
Midvaal Local Municipality 195
21.09%
27.26%
24.72%
27.26%
0.00%
5.00%
10.00%
15.00%
20.00%
25.00%
30.00%
2010/2011 2011/2012 2012/2013 Current Year 2013/2014
Total Outstanding Service Debtors
Outstanding debtors as % of revenue
Total Outstanding Service Debtors – Measures how much money is still owed by the community for water, electricity, waste removal and sanitation compared to how much money has been paid for these services. It is calculated by dividing the total outstanding debtors by the total annual revenue. A lower score is better.
Data used from MBRR SA8
T 5.4.3
26.84
20.76 21.87
16.31
-
5.00
10.00
15.00
20.00
25.00
30.00
2010/2011 2011/2012 2012/2013 Current Year 2013/2014
Debt Coverage
Debt coverage
Debt Coverage– The number of times debt payments can be accomodated within Operating revenue (excluding grants) . This in turn represents the ease with which debt payments can be accomodated by the municipality
Data used from MBRR SA8
T 5.4.4

Midvaal Local Municipality 196
83.59%
84.58%
90.11%
89.11%
80.00%
82.00%
84.00%
86.00%
88.00%
90.00%
92.00%
2010/2011 2011/2012 2012/2013 Current Year 2013/2014
Creditors System Efficiency
Creditors System Efficiency
Creditor System Efficiency – The proportion of creditors paid within terms (i.e. 30 days). This ratio is calculated by outstanding trade creditors divided by credit purchases
Data used from MBRR SA8
T 5.4.5
3.63%3.87% 3.98%
5.14%
0.00%
1.00%
2.00%
3.00%
4.00%
5.00%
6.00%
2010/2011 2011/2012 2012/2013 Current Year 2013/2014
Capital Charges to Operating Expenditure
Capital Charges to Operating Expenditure
Capital Charges to Operating Expenditure ratio is calculated by dividing the sum of capital interest and principle paid by the total operating expenditure.
Data used from MBRR SA8
T 5.4.6

Midvaal Local Municipality 197
27.25%26.47% 26.21%
19.52%
0.00%
5.00%
10.00%
15.00%
20.00%
25.00%
30.00%
2010/2011 2011/2012 2012/2013 Current Year 2013/2014
Employee Costs
Employee Cost
Employee cost – Measures what portion of the revenue was spent on paying employee costs. It is calculated by dividing the total employee cost by the difference between total revenue and capital revenue.
Data used from MBRR SA8
T 5.4.7
4.98%
5.10%
4.39%
5.04%
4.00%
4.20%
4.40%
4.60%
4.80%
5.00%
5.20%
2010/2011 2011/2012 2012/2013 Current Year 2013/2014
Repairs & Maintenance
Repairs and Maintenance
Repairs and Maintenance – This represents the propotion of operating expenditure spent and is calculated by dividing the total repairs and maintenace.
Data used from MBRR SA8
T5.4.8

Midvaal Local Municipality 198
COMMENT ON FINANCIAL RATIOS: With the exception of Repairs and Maintenance, the Midvaal Local Municipality is within broad norms and standards. As part of the medium term financial plan the allocations to repairs and maintenance and capital expenditure will be increased and operating cost reduced. A cost curtailment plan was introduced in the 2013/14 financial year. This plan was based on guidance provided by the National Treasury and resulted in savings on the operational budget of Council. The cost curtailment plan mainly targeted the general cost category and a saving of more than 15% against the budget was achieved. The liquidity position has increased substantially from the previous financial year. These ratios are being monitored on a monthly basis so that corrective actions can be implemented as soon as warning signals become evident.
T 5.4.9
COMPONENT B: SPENDING AGAINST CAPITAL BUDGET
INTRODUCTION TO SPENDING AGAINST CAPITAL BUDGET
The municipality achieved an 89% spending level on the capital budget, but when unpacking the 11% of the budget that was not spent, it becomes evident that at least 95% of the capital projects budgeted for were implemented. Savings of more than 5% were achieved were projects were delivered within time, but below budget. This is encouraging as all departments are now implementing their projects in a most cost effective manner as opposed to spending just for the sake of chasing a 100% spending level. Projects not completed at financial year end will be carried forward to the 2014/2015 financial year for completion. All projects funded from government grants were fully implemented and no carry overs on government grants are required.
T 5.5.0

Midvaal Local Municipality 199
5.5 CAPITAL EXPENDITURE’
T 5.5.1
5.6 SOURCES OF FINANCE

Midvaal Local Municipality 200
2012/13
Actual Original Budget (OB)
Adjustment Budget
Actual Adjustment to OB Variance
(%)
Actual to OB Variance (%)
Source of finance
External loans 3 112 45 440 43 046 35 919 20.95% 16.56%Public contributions and donations 55 714 10 000 1 500 1 068 89.32% 28.79%
Grants and subsidies 29 899 84 316 36 314 35 683 57.68% 1.74%
CRR 9 855 12 711 16 048 13 501 -6.22% 15.87%
Total 98 581 152 467 96 907 86 171 161.73% 62.95%
Percentage of finance
External loans 3.2% 29.8% 44.4% 41.7% 13.0% 26.3%Public contributions and donations 56.5% 6.6% 1.5% 1.2% 55.2% 45.7%
Grants and subsidies 30.3% 55.3% 37.5% 41.4% 35.7% 2.8%
Other 10.0% 8.3% 16.6% 15.7% -3.8% 25.2%
Capital expenditure
Water and sanitation 18 950 72 340 21 956 20 845 -69.65% -71.18%
Electricity 20 431 29 084 23 190 20 717 -20.26% -28.77%
Housing 0.00% 0.00%
Roads and storm water 13 869 22 658 21 965 29 837 -3.06% 31.69%
Other 45 331 28 385 29 795 14 771 4.97% -47.96%
Total 98 581 152 467 96 907 86 171 -88.00% -116.23%
Percentage of expenditure
Water and sanitation 19.2% 47.4% 22.7% 24.2% 79.1% 61.2%
Electricity 20.7% 19.1% 23.9% 24.0% 23.0% 24.8%
Housing 0.0% 0.0% 0.0% 0.0% 0.0% 0.0%
Roads and storm water 14.1% 14.9% 22.7% 34.6% 3.5% -27.3%
Other 46.0% 18.6% 30.7% 17.1% -5.6% 41.3%
T 5.6.1
Capital Expenditure - Funding Sources: Year 12/13 to Year 13/14
2013/14
Details
R' 000
COMMENT ON SOURCES OF FUNDING: The municipality is highly dependent on government grants for the implementation of capital programmes. Besides government grants, developer contributions and public donations are the biggest contributor to the capital budget, particularly with regard to new industrial developments along the R59 corridor.
A capital replacement reserve (fully cash backed) has been established to increase the amount that is spent on capital from own generated revenue. The balance of the reserve as at financial year end was just over R7.6 million. This is an internal reserve which forms part of the accumulated surplus on the Statement of Financial Position but is shown separately in the General Ledger. Borrowings were one of the largest funding sources for the year. A loan of R80 million has been approved by Council of which R20m was drawn in 2012/13 and the remaining R60m was drawn during

Midvaal Local Municipality 201
this year. R37m of the loan was unspent at the end of the financial year and will be utilized during 2014/2015 and 2015/2016 to fund capital projects. Hire Purchase agreements are used to finance movable assets with a 3 to 5 year repayment period.
T 5.6.1.1
5.7 CAPITAL SPENDING ON 5 LARGEST PROJECTS
Original Budget
Adjustment Budget
Actual Expenditure
Original Variance (%)
Adjustment variance (%)
Upgrade of sewers Sicelo (MIG) 6 000 8 500 8 500 -42% -42%Energy efficiency (Eedsmg) 7 000 9 000 8 931 -28% -29%Sicelo reticulation network (erf 204) 6 000 3 500 3 401 43% 42%Sicelo/Highbury (Valley Settlements) Reservoir & Main (MIG) 5 500 5 500 5 500 0% 0%CBD Phase 4 10 000 10 000 9 959 0% 0%
Upgrade of sewers SiceloObjective of ProjectDelaysFuture ChallengesAnticipated citizen benefitsEnergy efficiencyObjective of ProjectDelaysFuture ChallengesAnticipated citizen benefitsSicelo reticulation network (erf 204)Objective of ProjectDelaysFuture ChallengesAnticipated citizen benefits
Sicelo/Highbury (Valley Settlements) Reservoir & Main (MIG)Objective of ProjectDelaysFuture ChallengesAnticipated citizen benefitsCBD Phase 4Objective of ProjectDelaysFuture ChallengesAnticipated citizen benefits
Increasing volumes in networkReliable service delivery
Capital Expenditure of 5 largest projects*
None
Name of Project2013/14 Variance: 2013/14
To ensure sufficient services to area
R' 000
* Projects with the highest capital expenditure in 2013-2014
To ensure sufficient energy to areaNoneIncreasing volumes in networkReliable service delivery
To ensure sufficient services to areaNoneIncreasing volumes in network
Cost of operational activitiesImmediate emergency services on hand
To ensure a sufficient and effective sanitation serviceNone
Reliable service delivery
T 5.7.1
To upgrade the central business areaNoneCost of operational activitiesInvestor opportunities and confidence

Midvaal Local Municipality 202
COMMENT ON CAPITAL PROJECTS: The above projects were prioritised in terms of the challenges experienced in the Delivery of Services to our community. The projects were identified as being the largest based on the size of the original budget allocated towards the projects.
T 5.7.1.1
5.8 BASIC SERVICE AND INFRASTRUCTURE BACKLOGS – OVERVIEW
INTRODUCTION TO BASIC SERVICE AND INFRASTRUCTURE BACKLOGS The Midvaal municipal area is very large geographically, containing a lot of farms and agricultural holdings. Many of the children of farm workers settle in nearby informal settlements which results in the fact that there are 3572 informal households in the area. Most of these are far away from serviced areas which results in the backlog. The solution is to develop new townships near existing infrastructure. This process should however be driven by Provincial Department of Housing, with Midvaal in support. The municipality is busy upgrading existing bulk services and master plans to cater for this.
T 5.8.1
No. HHs % HHs No. HHs % HHsWater 29268 98% 584 2%Sanitation 26040 87% 3812 13%Electricity 24242 81% 5610 19%Waste management 10641 36% 6890 23%Housing 26026 87% 5444 18%
T 5.8.2% HHs are the service above/below minimum starndard as a proportion of total HHs. 'Housing' refrs to * formal and ** informal settlements.
Service Backlogs as at 30 June 2014Households (HHs)
*Service level above minimun standard **Service level below minimun standard
Note: Of the total number of households (i.e. 29 852) Midvaal provides waste management services to approximately 15 000 stands. The other properties are either vacant, open spaces or in other similar circumstances.

Midvaal Local Municipality 203
COMMENT ON BACKLOGS:
MIG funds have been used in the 2013/14 Financial year to reduce the backlogs in Basic Services in particular tarring/paving of roads, increasing capacity at the waste water treatment works, sewer reticulation, as well as upgrading a transfer station for waste removal, and the construction of sports facilities.
T 5.8.4

Midvaal Local Municipality 204
COMPONENT C: CASH FLOW MANAGEMENT AND INVESTMENTS
INTRODUCTION TO CASH FLOW MANAGEMENT AND INVESTMENTS The primary goal of the 2013/2014 adjustments budget was to continue to improve the cash flow. The adjustments budget reduced operating expenditure to more affordable levels as a result of a reduction in the projected income for property rates. The strict cash management regime was maintained even after the cash balances improved to ensure a culture of cost curtailment. The budget approved for the 2014/2015 – 2016/2017 years retained the focus on cash availability. Medium term projections show that the municipality should be able to maintain a cash balance of approximately R40 million per year over the medium term. The cash levels are not yet at the desired levels as all long term provisions are not yet backed by cash. In terms of the cash management policy the provision for the landfill site is only 75% cash-backed. The priority for the next will be to continue to phase our offset depreciation so that additional cash will be generated from operations for utilisation on repairs and maintenance and asset renewals.
T 5.9
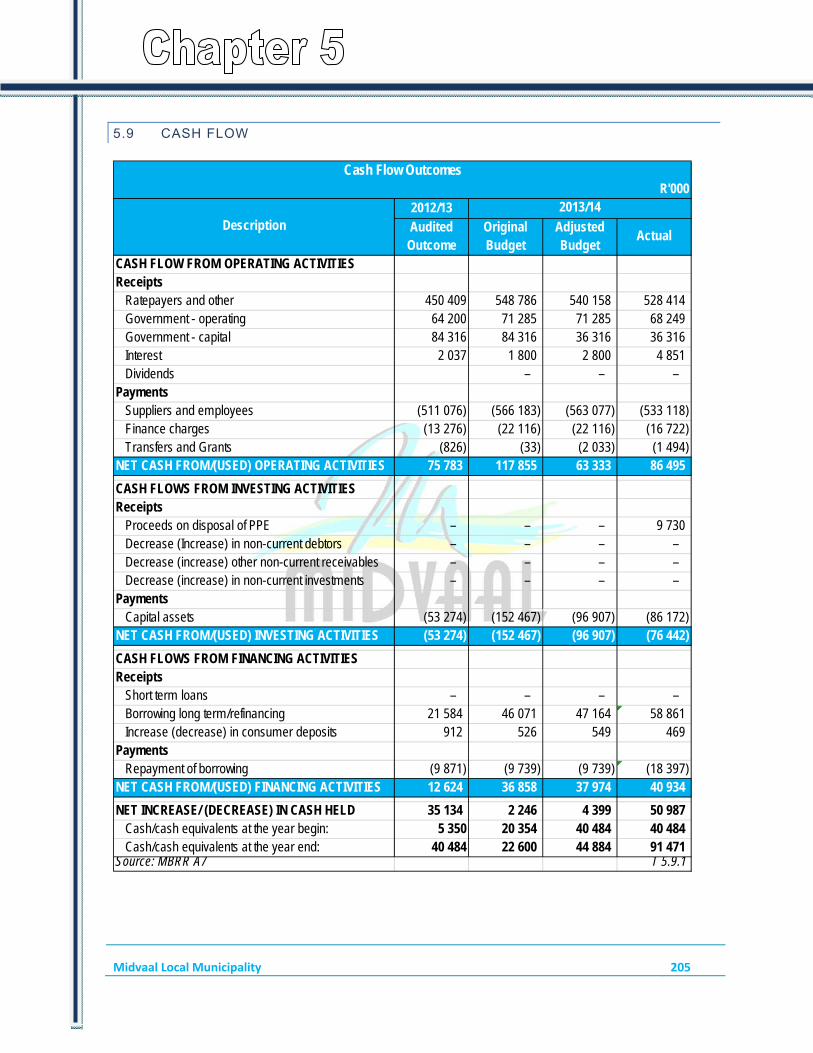
Midvaal Local Municipality 205
5.9 CASH FLOW
2012/13Audited
OutcomeOriginal Budget
Adjusted Budget
Actual
CASH FLOW FROM OPERATING ACTIVITIESReceipts
Ratepayers and other 450 409 548 786 540 158 528 414 Government - operating 64 200 71 285 71 285 68 249 Government - capital 84 316 84 316 36 316 36 316 Interest 2 037 1 800 2 800 4 851 Dividends – – –
PaymentsSuppliers and employees (511 076) (566 183) (563 077) (533 118)Finance charges (13 276) (22 116) (22 116) (16 722) Transfers and Grants (826) (33) (2 033) (1 494)
NET CASH FROM/(USED) OPERATING ACTIVITIES 75 783 117 855 63 333 86 495
CASH FLOWS FROM INVESTING ACTIVITIESReceipts
Proceeds on disposal of PPE – – – 9 730 Decrease (Increase) in non-current debtors – – – – Decrease (increase) other non-current receivables – – – – Decrease (increase) in non-current investments – – – –
PaymentsCapital assets (53 274) (152 467) (96 907) (86 172)
NET CASH FROM/(USED) INVESTING ACTIVITIES (53 274) (152 467) (96 907) (76 442)
CASH FLOWS FROM FINANCING ACTIVITIESReceipts
Short term loans – – – – Borrowing long term/refinancing 21 584 46 071 47 164 58 861 Increase (decrease) in consumer deposits 912 526 549 469
PaymentsRepayment of borrowing (9 871) (9 739) (9 739) (18 397)
NET CASH FROM/(USED) FINANCING ACTIVITIES 12 624 36 858 37 974 40 934
NET INCREASE/ (DECREASE) IN CASH HELD 35 134 2 246 4 399 50 987 Cash/cash equivalents at the year begin: 5 350 20 354 40 484 40 484 Cash/cash equivalents at the year end: 40 484 22 600 44 884 91 471
Source: MBRR A7 T 5.9.1
2013/14
Cash Flow OutcomesR'000
Description
Midvaal Local Municipality 206
COMMENT ON CASH FLOW OUTCOMES: Midvaal generated a healthy cash balance from operations. No cash from external loans or capital transfer payments were utilised for the payment of salaries. Cash from investing activities reduced by R76m due to the investment in new capital assets. Cash from financing activities increased by R41m being the net difference between new loans taken and redemption payments made on existing loans. The year closed with a cash balance of R91m, which equates a current ratio of 1.75:1 and a cost coverage of 2 months.
T 5.9.1.1
5.10 BORROWING AND INVESTMENTS
INTRODUCTION TO BORROWING AND INVESTMENTS Borrowings increased during the year due to the drawing of R60m against the infrastructure loan as well as the increased financial leases (R7.5m) that were used to fund new vehicles. No new infrastructure loan funding will be taken over the medium term, but the use of financial leases will continue as the municipality has insufficient internal funding for the procurement of vehicles.
T 5.10.1

Midvaal Local Municipality 207
Instrument 2011/12 2012/13 2013/14Municipality
Long-Term Loans (annuity/reducing balance) 116 486 129 105 174 716Long-Term Loans (non-annuity)Local registered stockInstalment CreditFinancial Leases 11 087 9 762 14 924PPP liabilitiesFinance Granted By Cap Equipment SupplierMarketable BondsNon-Marketable BondsBankers AcceptancesFinancial derivativesOther Securities
Municipality Total 127 573 138 867 189 640
Municipal EntitiesLong-Term Loans (annuity/reducing balance)Long-Term Loans (non-annuity)Local registered stockInstalment CreditFinancial LeasesPPP liabilitiesFinance Granted By Cap Equipment SupplierMarketable BondsNon-Marketable BondsBankers AcceptancesFinancial derivativesOther Securities
Entities Total 0 0 0T 5.10.2
Actual Borrowings: 2011-2014R' 000
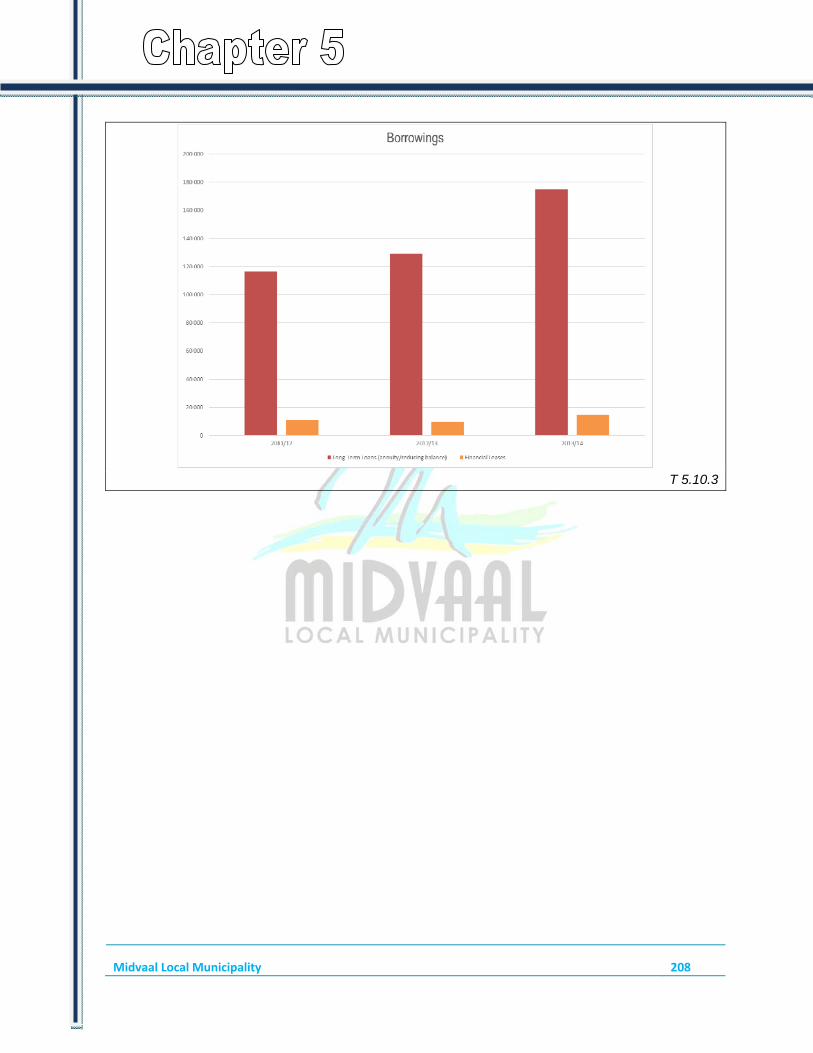
Midvaal Local Municipality 208
T 5.10.3

Midvaal Local Municipality 209
2011/12 2012/13 2013/14
Actual Actual Actual
MunicipalitySecurities - National GovernmentListed Corporate BondsDeposits - Bank 2 000 15 500 – Deposits - Public Investment CommissionersDeposits - Corporation for Public DepositsBankers Acceptance CertificatesNegotiable Certificates of Deposit - BanksGuaranteed Endowment Policies (sinking)Repurchase Agreements - BanksMunicipal BondsOther
Municipality sub-total 2 000 15 500 –
Municipal Entities N/A N/A N/ASecurities - National GovernmentListed Corporate BondsDeposits - BankDeposits - Public Investment CommissionersDeposits - Corporation for Public DepositsBankers Acceptance CertificatesNegotiable Certificates of Deposit - BanksGuaranteed Endowment Policies (sinking)Repurchase Agreements - BanksOther
Entities sub-total – – –
Consolidated total: 2 000 15 500 – T 5.10.4
Municipal and Entity Investments
Investment* type
R' 000
COMMENT ON BORROWING AND INVESTMENTS: The municipality only has short term investments at present. As the liquidity position continue to improve, more investments will be made. The ideal is that the municipality increases investments to such an extent that it no longer requires the use of HP financing for vehicles but that internal resources can be use. It is a sound financial principle to fund long term infrastructure with long term assets (user pay principle) and long term funding will thus remain an option for infrastructure funding (as affordability allows).
Midvaal Local Municipality 210
5.11 PUBLIC PRIVATE PARTNERSHIPS
PUBLIC PRIVATE PARTNERSHIPS None.
T 5.11.1
COMPONENT D: OTHER FINANCIAL MATTERS
5.12 SUPPLY CHAIN MANAGEMENT
SUPPLY CHAIN MANAGEMENT Supply Chain Management Processes are being updated on an ongoing basis to ensure full compliance with the MFMA and the Regulations issued under the MFMA. The SCM policy was again reviewed during 2013/2014. To further strengthen controls, a policy dealing with the acceptance of grants, donations and sponsorships was reviewed during the year. This policy will guide all SCM role-players relative to sections 47 and 48 of the MFMA SCM Regulations. No councillors serve on any SCM committee. A total of 52 full bids and 39 formal written quotations were processed during the year under review. The average turnaround time on the awarding of bids is 2 months. Deviations from policy must comply with the requirements and be reported to Council. In the limited number of cases that this occurred, it was for justifiable reason and all such cases are reported to Council. The Bid Adjudication Committee meetings are open to the public. The Head of Supply Chain Management Office is fully competent and compliant with the MFMA requirements. The other officials in the Supply Chain Management Office are all in process of training to fully comply as well.
T 5.12.1
5.13 GRAP COMPLIANCE
GRAP COMPLIANCE
A full GRAP review was performed during the 2013/2014 financial year. Certain prior year adjustments had to be performed to ensure full compliance with GRAP. Details of the prior year adjustments are contained in the notes to the Annual Financial Statements. The financial statements for the 2013/2014 financial draft is in accordance with the applicable GRAP standards, inclusive of the standards that became effective during the year under review.
T 5.13.1

Midvaal Local Municipality | CHAPTER 6 – AUDITOR GENERAL AUDIT FINDINGS 211
CHAPTER 6 – AUDITOR GENERAL AUDIT FINDINGS
INTRODUCTION Note: The Constitution S188 (1) (b) states that the functions of the Auditor-General includes the auditing and reporting on the accounts, financial statements and financial management of all municipalities. MSA section 45 states that the results of performance measurement must be audited annually by the Auditor-General. The Annual Financial Statements are set out in Volume II of the annual report. These statements have been audited by the Auditor General and a Clean Audit was achieved. The AG report is also included in this Annual Report.
T 6.0.1
COMPONENT A: AUDITOR-GENERAL OPINION OF FINANCIAL STATEMENTS 2012/13
6.1 AUDITOR GENERAL REPORTS YEAR -1 (PREVIOUS YEAR)
Audit Report Status*: UNQUALIFIEDNon-Compliance Issues Remedial Action Taken
None N/A
T 6.1.1
Auditor-General Report on Financial Performance: 2012-13
Note:*The report status is supplied by the Auditor General and ranges from unqualified (at best); to unqualified with other matters specified; qualified; adverse; and disclaimed (at worse)
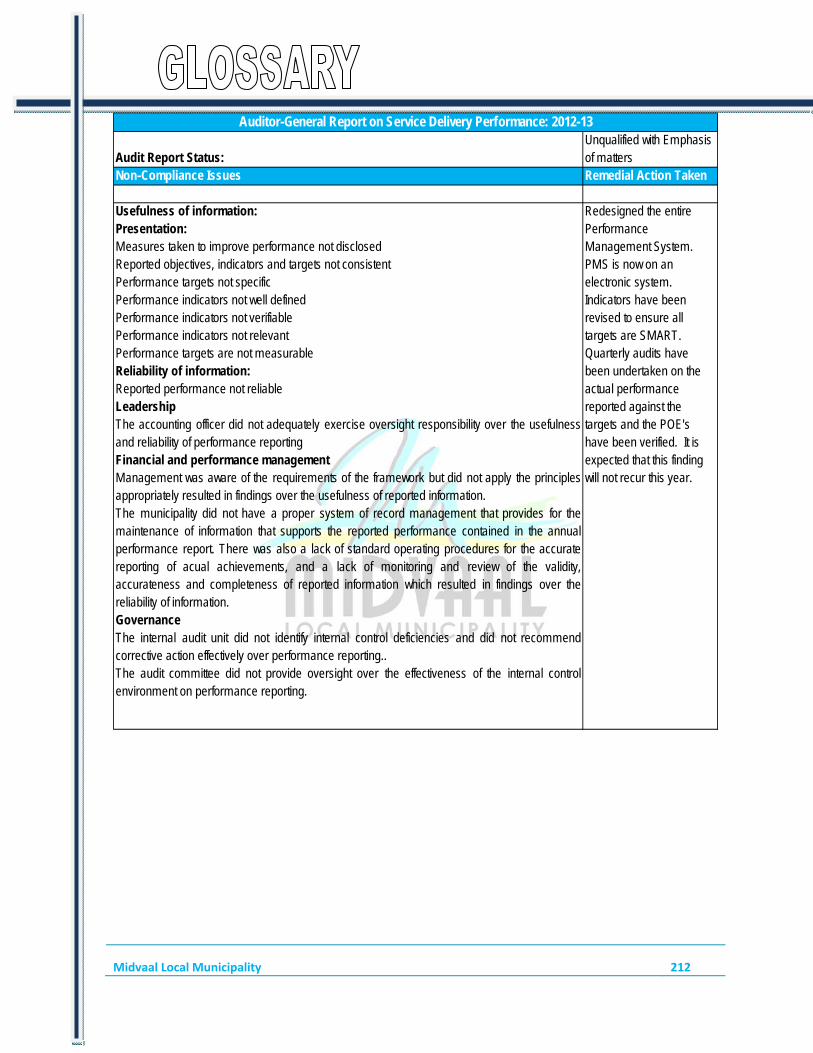
Midvaal Local Municipality 212
Audit Report Status:Unqualified with Emphasis of matters
Non-Compliance Issues Remedial Action Taken
Usefulness of information: Presentation:Measures taken to improve performance not disclosedReported objectives, indicators and targets not consistentPerformance targets not specificPerformance indicators not well definedPerformance indicators not verifiablePerformance indicators not relevantPerformance targets are not measurableReliability of information:Reported performance not reliableLeadershipThe accounting officer did not adequately exercise oversight responsibility over the usefulnessand reliability of performance reportingFinancial and performance managementManagement was aware of the requirements of the framework but did not apply the principlesappropriately resulted in findings over the usefulness of reported information.The municipality did not have a proper system of record management that provides for themaintenance of information that supports the reported performance contained in the annualperformance report. There was also a lack of standard operating procedures for the accuratereporting of acual achievements, and a lack of monitoring and review of the validity,accurateness and completeness of reported information which resulted in findings over thereliability of information.GovernanceThe internal audit unit did not identify internal control deficiencies and did not recommendcorrective action effectively over performance reporting..The audit committee did not provide oversight over the effectiveness of the internal controlenvironment on performance reporting.
Redesigned the entire Performance Management System. PMS is now on an electronic system. Indicators have been revised to ensure all targets are SMART. Quarterly audits have been undertaken on the actual performance reported against the targets and the POE's have been verified. It is expected that this finding will not recur this year.
Auditor-General Report on Service Delivery Performance: 2012-13

Midvaal Local Municipality 213
COMPONENT B: AUDITOR-GENERAL OPINION 2013/14
6.2 AUDITOR GENERAL REPORT 2013/14
Status of audit report**: UNQUALIFIED - CLEANNon-Compliance Issues Remedial Action Taken
None N/A
T 6.2.2
Auditor-General Report on Service Delivery Performance: Year 2013-14
* This table will be completed prior to the publication of the Annual report but following the receipt of the Auditor- General Report on Service Delivery Performance Year 0** Inclusion of "Status" depends on nature of AG's remarks on Performance Data.
AUDITOR GENERAL REPORT ON THE FINANCIAL STATEMENTS: 2013/14
Clean Audit – see page 215 for the full audit report T 6.2.3
COMMENTS ON AUDITOR-GENERAL’S OPINION 2013/14
The Midvaal Local Municipality has, through an active Operation Clean Audit (OPCA) project improved its audit outcomes over the last few years. This process led to the achievement of a Clean Audit in the 2013/2014 audit. The municipality has an active OPCA process that deals with all issues raised in the Management Letter of the Auditor General and not only the issues raised in the Audit Reports as the Management Letter contains systemic issues that can affect the outcome of future audits. The AG raised 52 issues in the 2012 management letter, in 2013 it reduced to 45 and in 2014 it further reduced to 16. Matters affecting the audit report are the most serious as these will lead to findings on the audit report and obviously the non-achievement of a clean audit (no findings for 2014). Other important matters are those that are not escalated to the audit report in the current year, but if not dealt with may be reported on future year audits. These must be dealt with as high priority (12 findings for 2014). Administrative matters are generally matters that contribute to good governance, but are not significant enough to impact on the audit report. If not dealt with at all, these matters could lead to more serious findings (as there are underlying control weaknesses) that in time could cause audit report findings (4 findings for 2014). There we no repeat findings in the 2014 management letter. The matters of emphasis raised in the audit report (additional information for the attention of the users) included the following:

Midvaal Local Municipality 214
Contingent liabilities – the AG emphasized that the municipality is involved in litigation of which the outcome is not certain. These cases are detailed in the notes to the financial statements under the contingent liability note. Restatement of corresponding figures – the audited figures for the 2012/2013 financial year were restated due to a billing correction done by Eskom. The creditor figure for the previous financial year were thus amended. Full details are contained in the prior year adjustment note in the financial statements. Material losses – the water and electricity losses of the municipality as disclosed in the material losses note are shown in the Audit Report as additional information.
T 6.2.4
COMMENTS ON MFMA SECTION 71 RESPONSIBILITIES: Section 71 of the MFMA requires municipalities to return a series of financial performance data to the National Treasury at specified intervals throughout the year. The Chief Financial Officer states that these data sets have been returned according to the reporting requirements. Signed (Chief Financial Officer)
T 6.2.5
Midvaal Local Municipality 215

Midvaal Local Municipality 216
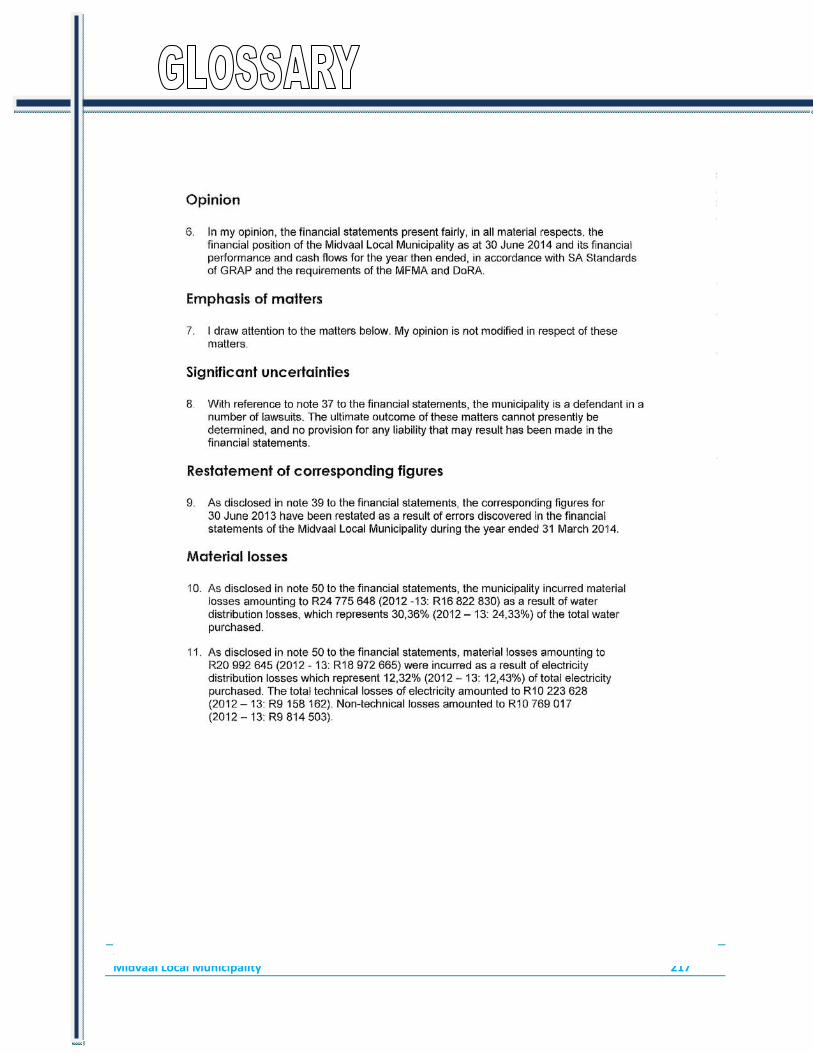
Midvaal Local Municipality 217

Midvaal Local Municipality 218

Midvaal Local Municipality 219

Midvaal Local Municipality 220
GLOSSARY
Accessibility indicators
Explore whether the intended beneficiaries are able to access services or outputs.
Accountability documents
Documents used by executive authorities to give “full and regular” reports on the matters under their control to Parliament and provincial legislatures as prescribed by the Constitution. This includes plans, budgets, in-year and Annual Reports.
Activities The processes or actions that use a range of inputs to produce the desired outputs and ultimately outcomes. In essence, activities describe "what we do".
Adequacy indicators
The quantity of input or output relative to the need or demand.
Annual Report A report to be prepared and submitted annually based on the regulations set out in Section 121 of the Municipal Finance Management Act. Such a report must include annual financial statements as submitted to and approved by the Auditor-General.
Approved Budget The annual financial statements of a municipality as audited by the Auditor General and approved by council or a provincial or national executive.
Baseline Current level of performance that a municipality aims to improve when setting performance targets. The baseline relates to the level of performance recorded in a year prior to the planning period.
Basic municipal service
A municipal service that is necessary to ensure an acceptable and reasonable quality of life to citizens within that particular area. If not provided it may endanger the public health and safety or the environment.
Budget year The financial year for which an annual budget is to be approved – means a year ending on 30 June.
Cost indicators The overall cost or expenditure of producing a specified quantity of outputs.
Distribution indicators
The distribution of capacity to deliver services.
Financial Statements
Includes at least a statement of financial position, statement of financial performance, cash-flow statement, notes to these statements and any other statements that may be prescribed.
General Key performance indicators
After consultation with MECs for local government, the Minister may prescribe general key performance indicators that are appropriate and applicable to local government generally.
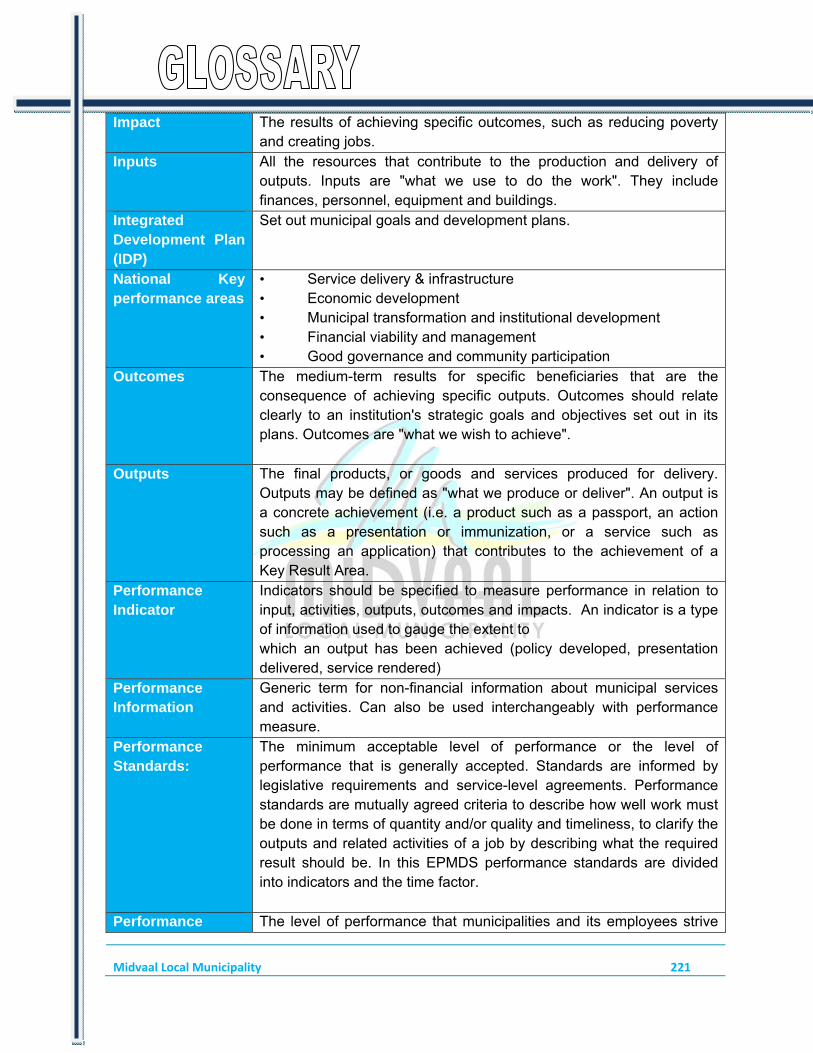
Midvaal Local Municipality 221
Impact The results of achieving specific outcomes, such as reducing poverty and creating jobs.
Inputs All the resources that contribute to the production and delivery of outputs. Inputs are "what we use to do the work". They include finances, personnel, equipment and buildings.
Integrated Development Plan (IDP)
Set out municipal goals and development plans.
National Key performance areas
• Service delivery & infrastructure • Economic development • Municipal transformation and institutional development • Financial viability and management • Good governance and community participation
Outcomes The medium-term results for specific beneficiaries that are the consequence of achieving specific outputs. Outcomes should relate clearly to an institution's strategic goals and objectives set out in its plans. Outcomes are "what we wish to achieve".
Outputs The final products, or goods and services produced for delivery. Outputs may be defined as "what we produce or deliver". An output is a concrete achievement (i.e. a product such as a passport, an action such as a presentation or immunization, or a service such as processing an application) that contributes to the achievement of a Key Result Area.
Performance Indicator
Indicators should be specified to measure performance in relation to input, activities, outputs, outcomes and impacts. An indicator is a type of information used to gauge the extent to which an output has been achieved (policy developed, presentation delivered, service rendered)
Performance Information
Generic term for non-financial information about municipal services and activities. Can also be used interchangeably with performance measure.
Performance Standards:
The minimum acceptable level of performance or the level of performance that is generally accepted. Standards are informed by legislative requirements and service-level agreements. Performance standards are mutually agreed criteria to describe how well work must be done in terms of quantity and/or quality and timeliness, to clarify the outputs and related activities of a job by describing what the required result should be. In this EPMDS performance standards are divided into indicators and the time factor.
Performance The level of performance that municipalities and its employees strive
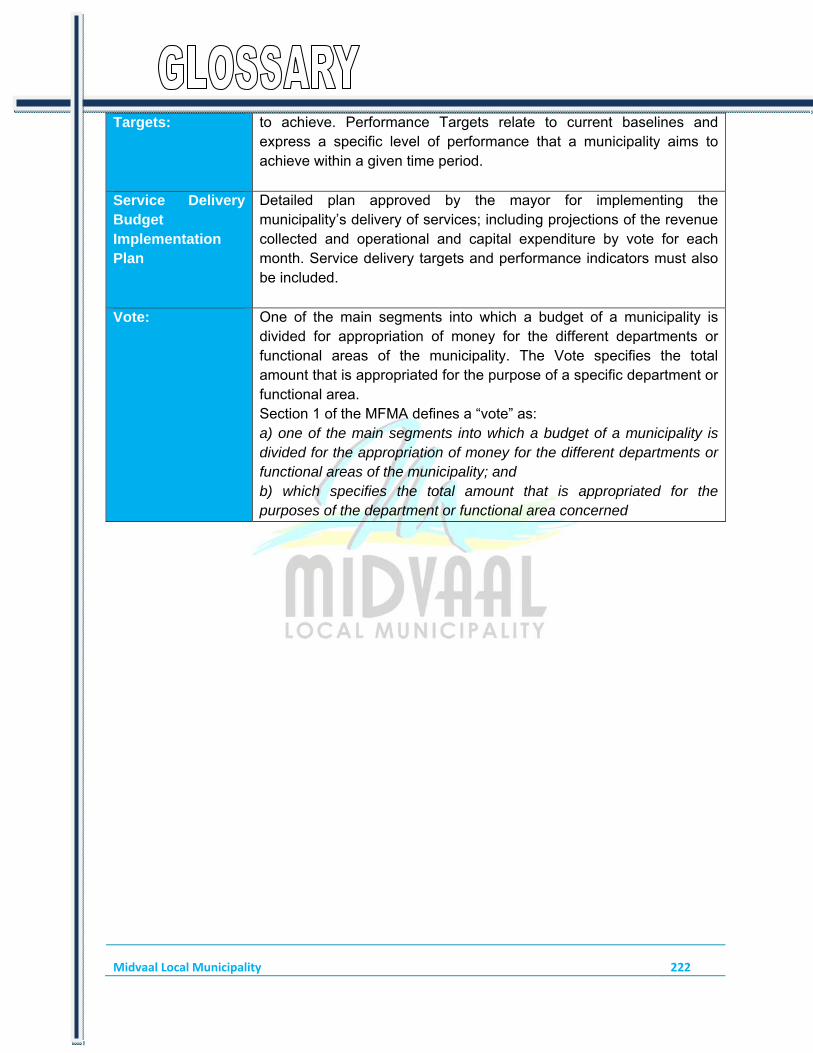
Midvaal Local Municipality 222
Targets: to achieve. Performance Targets relate to current baselines and express a specific level of performance that a municipality aims to achieve within a given time period.
Service Delivery Budget Implementation Plan
Detailed plan approved by the mayor for implementing the municipality’s delivery of services; including projections of the revenue collected and operational and capital expenditure by vote for each month. Service delivery targets and performance indicators must also be included.
Vote: One of the main segments into which a budget of a municipality is divided for appropriation of money for the different departments or functional areas of the municipality. The Vote specifies the total amount that is appropriated for the purpose of a specific department or functional area. Section 1 of the MFMA defines a “vote” as: a) one of the main segments into which a budget of a municipality is divided for the appropriation of money for the different departments or functional areas of the municipality; and b) which specifies the total amount that is appropriated for the purposes of the department or functional area concerned

Midvaal Local Municipality | APPENDICES 223
APPENDICES
APPENDIX A – COUNCILLORS; COMMITTEE ALLOCATION AND COUNCIL ATTENDANCE
Full Time / Part Time
FT/PT % %Cllr. T.K. Nast FT Mayoral Committee and Council DA 100% N/A
Cllr. A.R. Mcloughlin FT Section 80 Finace and Corporate Services PortfolioCommittee and Council
DA 100% N/A
Cllr. C.P. Hartman FT Section 80 Social Services Portfolio Committee,MayoralCommittee and Council
Ward 9 (DA) 77% 100%
Cllr. M.S.Hack FT Section 80 Engineering Services PortfolioCommittee,Mayoral Committee and Council
Ward 7 (DA) 100% N/A
Cllr. P.D. Pretorius FT Section 80 Finance and Corporate Services PortfolioCommittee,Mayoral Committee and Council
DA 92% 100%
Cllr. F. Peters FT Section 80 Development Planning & Housing PortfolioCommittee,Mayoral Committee and Council
DA 85% 100%
Cllr. B.M. Baloyi FT Section 80 Development Planning & Housing PortfolioCommittee,Mayoral Committee and Council
DA 100% N/A
Cllr. L.S. Botsoere FT Section 80 Protection and Human Resources PortfolioCommittee,Mayoral Committee and Council
DA 100% N/A
Cllr. D.R. Ryder FT Section 80 Engineering Services Portfolio Committee andCouncil
Ward 2 (DA) 92% 100%
Cllr. W.F. de Agrella PT Section 80 Engineering Services Portfolio and Council Ward 1 (DA) 100% N/A
Cllr. M.S. Schoeman PT Section 80 Development Planning & Housing Portfolio andCouncil
Ward 3 (DA) 100% N/A
Cllr. L. Parsonson PT Section 80 Protection and Human Resources Portfolio andCouncil
Ward 4 (DA) 100% N/A
Cllr. R.F. Jones PT Section 80 Social Services Portfolio and Council Ward 5 (DA) 100% N/A
Cllr. A.J. van Tonder PT Section 80 Development Planning & Housing Portfolio andCouncil
Ward 13 (DA) 92% 100%
Cllr. P.C. Pretorius PT Section 80 Finance and Corporate Services Portfolio andCouncil
Ward 14 (DA) 90% 100%
Cllr. M.M. Radebe PT Section 80 Social Services Portfolio and Council DA 100% N/A
Cllr. P. Ramushu PT Section 80 Finance and Corporate Services Portfolio andCouncil
ANC 85% 100%
Cllr. T.S. Maphalla PT Section 80 Finance and Corporate Services Portfolio andCouncil
ANC 69% 100%
Cllr. H.J. Mokoena PT Section 80 Protection and Human Resources Portfolio andCouncil
ANC 69% 100%
Councillors, Committees Allocated and Council AttendanceCommittees Allocated *Ward and/ or Party RepresentedCouncil Members Percentage
Council Meetings
Attendance
Percentage Apologies for non-
attendance

Midvaal Local Municipality | APPENDICES 224
Cllr. M.L. Modikeng PT Section 80 Social Services Portfolio and Council Ward 6 (ANC) 85% 100%
Cllr. M.M. Ndebele PT Section 80 Development Planning & Housing Portfolio andCouncil
Ward 8 (ANC) 100% N/A
Cllr. S.E. Hlengwa PT Section 80 Development Planning & Housing Portfolio andCouncil
Ward 11 (ANC) 100% N/A
Cllr. M.Z.P. Boland PT Section 80 Social Services Portfolio and Council Committee Ward 10 (ANC) 100% N/A
Cllr. I.M. Matsose PT Section 80 Protection and Human Resources Portfolio andCouncil
Ward 12 (ANC) 100% N/A
Cllr. M.M Magagula PT Section 80 Finance and Corporate Services Portfolio andCouncil
ANC 77% 100%
Cllr. E. Moleko PT Section 80 Engineering Services Portfolio and Council ANC 92% 100%
Cllr. M.G.I Ngcobo PT Section 80 Engineering Services Portfolio and Council ANC 85% 100%
Cllr. C.G. Pypers PT Section 80 Protection and Human Resources Portfolio andCouncil
FF 77% 10%
T ANote: * Councillors appointed on a proportional basis do not have wards allocated to them
Concerning Appendix A The above percentages are based on the attendance of scheduled ordinary Council meetings, as well as non-scheduled special Council meeting. The combined total amount of meetings is 13. The attendance of Section 80 and Section 79 Committees is not taken into account for the purpose of calculating the attendance percentages.
T A.1

Midvaal Local Municipality | APPENDICES 225
APPENDIX B – COMMITTEES AND COMMITTEE PURPOSES
SECTION 80 COMMITTEES Section 80 Committees – established to assist the Executive Mayor and Mayoral Committee. . The Executive mayor appoints the chairperson and may delegated power to these committees. The Mayoral Committee may vary or cancel any decisions taken by these committees. And Section 80 Committees report to the Mayoral Committee. In MLM there is 5 Mayoral Committee Members and thus 5 Section 80 Portfolio Committee: Corporate and Finance Services, Engineering Services ,Social Services, Protection and Human Resources and Development Planning and Housing.
MAYORAL COMMITTEE Mayoral Committee – It is the committee of the Executive Mayor and members of the Mayoral committee. Council may delegate certain functions to the Mayoral Committee. This is done in the system of delegations. The MC must report all decisions taken to Council. The functions not delegated must then be recommended to the full Council.
COUNCIL Council – Represented by all the Cllrs in the Municipality. It is chaired by the speaker of Council.
MUNICIPAL PUBLIC ACCOUNTS COMMITTEE (MPAC)
In assisting the Council with its oversight function a Section 79 Municipal Public Accounts and Oversight Committee(MPAC) was established with specific terms of references.
PERFORMANCE & AUDIT COMMITTEE Established in terms of Section 166 of the MFMA. Committee established per Council Resoluton M/155/09/2001 dated 30 Aug 2001
BID ADJUDICATION COMMITTEE Bid Adjudication Committee is last in the procedure for dealing with bids of the MLM, and is responsible for the final decisions regarding the adjudication of a bid. Proposals regarding the applicable and qualifying bids for each tender gets submitted from the Bid Evaluation Committee to the Bid Adjudication Committee, where the adjudication is finalized. The chairperson of the Bid Adjudication is the CFO, who is not allowed or involved in the Bid Evalution Committee at any stage.
IT STEERING COMMITTEE Consists of representatives from all Departments in Council. This committee manages the purchase of IT equipment and is also a channel for resolving IT issues within the Departments
SECTION 79 PLACE NAME COMMITTEE Established to deal with changing of street names
SECTION 79 PETITIONS COMMITTEE Established to deal with petitions
SECTION 79 ETHICS COMMITTEE Established to enforce and apply the code of conduct for Councillors
T B
Municipal Committees
Committees (other than Mayoral / Executive Committee) and Purposes of Committees
Purpose of Committee
Midvaal Local Municipality | APPENDICES 226
APPENDIX C –THIRD TIER ADMINISTRATIVE STRUCTURE
Directorate Director/Manager (State title and name)Not applicable. Included in T2.2.2
Use as a spill-over schedule if top 3 tiers cannot be accomodated in chapter 2 (T2.2.2). T C
Third Tier Structure

Midvaal Local Municipality | APPENDICES 227
APPENDIX D – FUNCTIONS OF MUNICIPALITY / ENTITY
MUNICIPAL FUNCTIONS Function Applicable to Municipality (Yes / No)*
Function Applicable to
Entity (Yes / No)
Constitution Schedule 4, Part B functions:Air pollution No N/ABuilding regulations Yes N/AChild care facilities Yes N/AElectricity and gas reticulation Yes N/AFirefighting services Yes N/ALocal tourism No N/AMunicipal airports No N/AMunicipal planning Yes N/AMunicipal health services Yes N/AMunicipal public transport No N/AMunicipal public works only in respect of the needs of municipalities in the discharge of their responsibilities to administer functions specifically assigned to them under this Constitution or any other law
Yes
N/APontoons, ferries, jetties, piers and harbours, excluding the regulation of international and national shipping and matters related thereto
No
N/AStormwater management systems in built-up areas Yes N/ATrading regulations Yes N/AWater and sanitation services limited to potable water supply systems and domestic waste-water and sewage disposal systems
YesN/A
Beaches and amusement facilities No N/ABillboards and the display of advertisements in public places Yes N/ACemeteries, funeral parlours and crematoria Yes N/ACleansing Yes N/AControl of public nuisances Yes N/AControl of undertakings that sell liquor to the public No N/AFacilities for the accommodation, care and burial of animals No N/AFencing and fences Yes N/ALicensing of dogs No N/ALicensing and control of undertakings that sell food to the public Yes N/ALocal amenities Yes N/ALocal sport facilities Yes N/AMarkets No N/AMunicipal abattoirs No N/AMunicipal parks and recreation Yes N/AMunicipal roads Yes N/ANoise pollution Yes N/APounds No N/APublic places Yes N/ARefuse removal, refuse dumps and solid waste disposal Yes N/AStreet trading Yes N/AStreet lighting Yes N/ATraffic and parking Yes N/A
T D
Municipal / Entity Functions
* If municipality: indicate (yes or No); * If entity: Provide name of entity
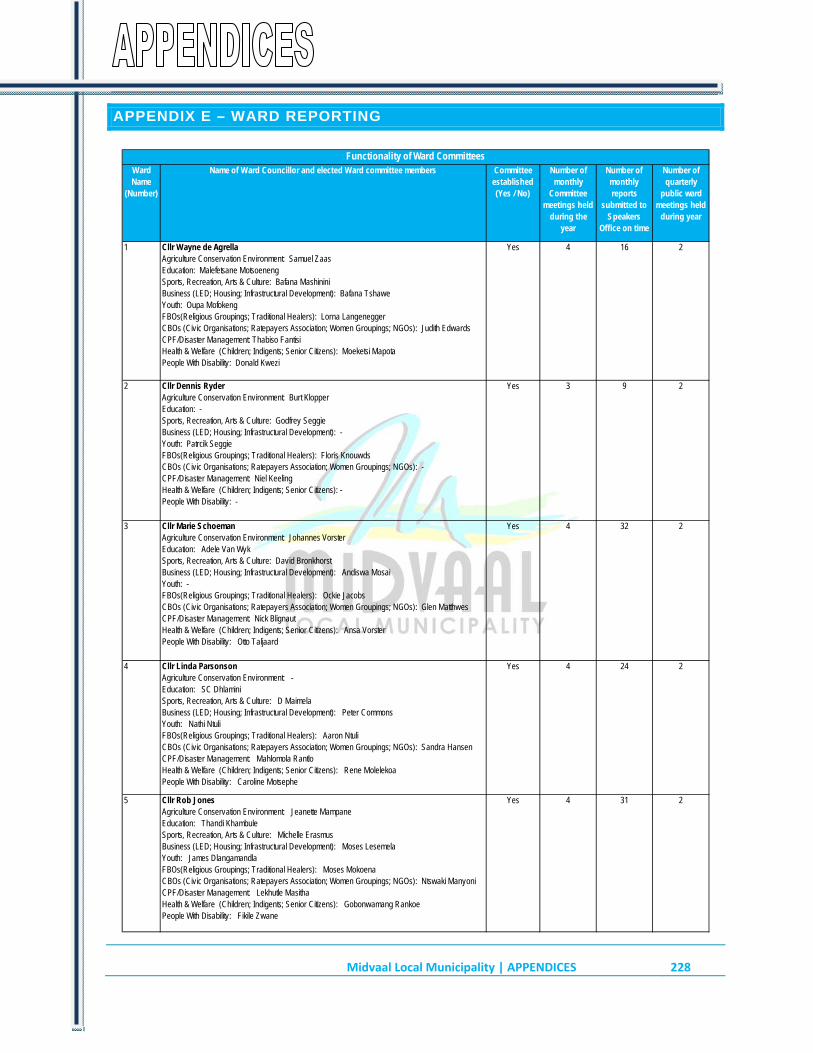
Midvaal Local Municipality | APPENDICES 228
APPENDIX E – WARD REPORTING
Ward Name
(Number)
Name of Ward Councillor and elected Ward committee members Committee established (Yes / No)
Number of monthly
Committee meetings held
during the year
Number of monthly reports
submitted to Speakers
Office on time
Number of quarterly
public ward meetings held
during year
1 Cllr Wayne de AgrellaAgriculture Conservation Environment: Samuel ZaasEducation: Malefetsane MotsoenengSports, Recreation, Arts & Culture: Bafana MashininiBusiness (LED; Housing; Infrastructural Development): Bafana TshaweYouth: Oupa Mofokeng FBOs(Religious Groupings; Traditional Healers): Lorna LangeneggerCBOs (Civic Organisations; Ratepayers Association; Women Groupings; NGOs): Judith EdwardsCPF/Disaster Management: Thabiso FantisiHealth & Welfare (Children; Indigents; Senior Citizens): Moeketsi MapotaPeople With Disability: Donald Kwezi
Yes 4 16 2
2 Cllr Dennis Ryder Agriculture Conservation Environment: Burt KlopperEducation: -Sports, Recreation, Arts & Culture: Godfrey SeggieBusiness (LED; Housing; Infrastructural Development): -Youth: Patrcik SeggieFBOs(Religious Groupings; Traditional Healers): Floris KnouwdsCBOs (Civic Organisations; Ratepayers Association; Women Groupings; NGOs): -CPF/Disaster Management: Niel KeelingHealth & Welfare (Children; Indigents; Senior Citizens): -People With Disability: -
Yes 3 9 2
3 Cllr Marie SchoemanAgriculture Conservation Environment: Johannes VorsterEducation: Adele Van WykSports, Recreation, Arts & Culture: David BronkhorstBusiness (LED; Housing; Infrastructural Development): Andiswa MosaiYouth: -FBOs(Religious Groupings; Traditional Healers): Ockie JacobsCBOs (Civic Organisations; Ratepayers Association; Women Groupings; NGOs): Glen MatthwesCPF/Disaster Management: Nick BlignautHealth & Welfare (Children; Indigents; Senior Citizens): Ansa VorsterPeople With Disability: Otto Taljaard
Yes 4 32 2
4 Cllr Linda ParsonsonAgriculture Conservation Environment: -Education: SC DhlaminiSports, Recreation, Arts & Culture: D MaimelaBusiness (LED; Housing; Infrastructural Development): Peter CommonsYouth: Nathi NtuliFBOs(Religious Groupings; Traditional Healers): Aaron NtuliCBOs (Civic Organisations; Ratepayers Association; Women Groupings; NGOs): Sandra HansenCPF/Disaster Management: Mahlomola RantloHealth & Welfare (Children; Indigents; Senior Citizens): Rene MolelekoaPeople With Disability: Caroline Motsephe
Yes 4 24 2
5 Cllr Rob JonesAgriculture Conservation Environment: Jeanette MampaneEducation: Thandi KhambuleSports, Recreation, Arts & Culture: Michelle Erasmus Business (LED; Housing; Infrastructural Development): Moses Lesemela Youth: James DlangamandlaFBOs(Religious Groupings; Traditional Healers): Moses MokoenaCBOs (Civic Organisations; Ratepayers Association; Women Groupings; NGOs): Ntswaki ManyoniCPF/Disaster Management: Lekhutle MasithaHealth & Welfare (Children; Indigents; Senior Citizens): Gobonwamang RankoePeople With Disability: Fikile Zwane
Yes 4 31 2
Functionality of Ward Committees
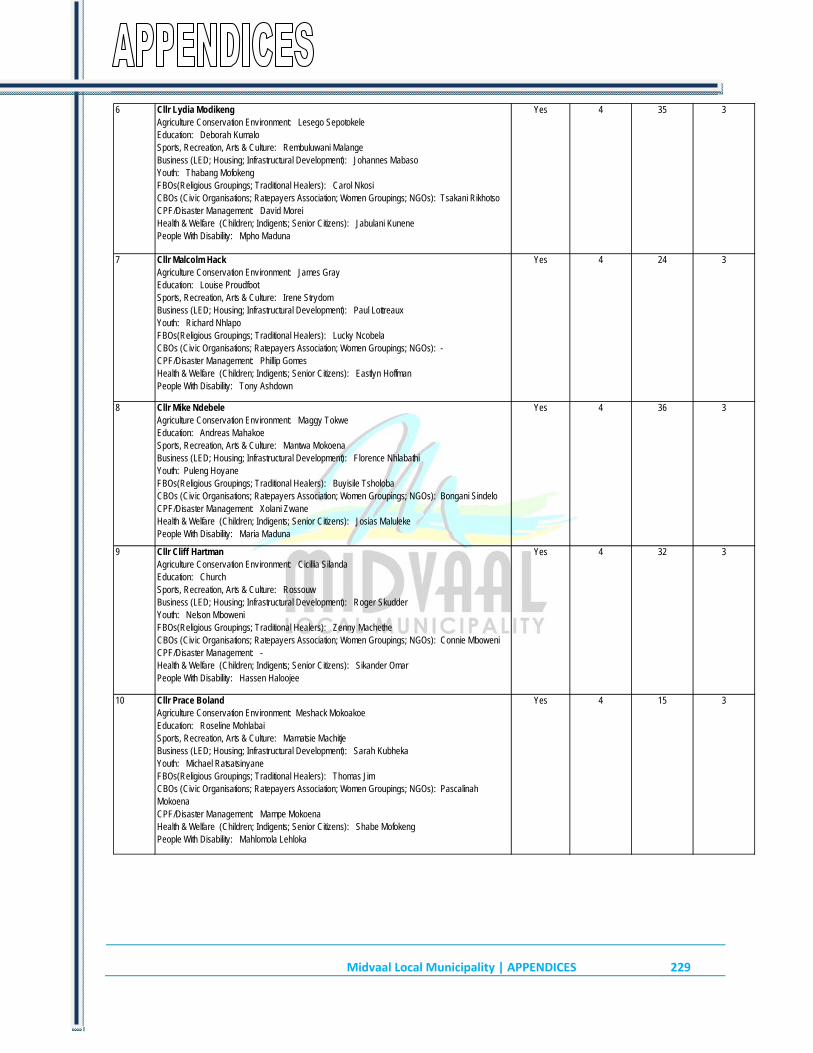
Midvaal Local Municipality | APPENDICES 229
6 Cllr Lydia ModikengAgriculture Conservation Environment: Lesego SepotokeleEducation: Deborah KumaloSports, Recreation, Arts & Culture: Rembuluwani MalangeBusiness (LED; Housing; Infrastructural Development): Johannes MabasoYouth: Thabang MofokengFBOs(Religious Groupings; Traditional Healers): Carol NkosiCBOs (Civic Organisations; Ratepayers Association; Women Groupings; NGOs): Tsakani RikhotsoCPF/Disaster Management: David MoreiHealth & Welfare (Children; Indigents; Senior Citizens): Jabulani KunenePeople With Disability: Mpho Maduna
Yes 4 35 3
7 Cllr Malcolm HackAgriculture Conservation Environment: James GrayEducation: Louise ProudfootSports, Recreation, Arts & Culture: Irene StrydomBusiness (LED; Housing; Infrastructural Development): Paul LottreauxYouth: Richard NhlapoFBOs(Religious Groupings; Traditional Healers): Lucky NcobelaCBOs (Civic Organisations; Ratepayers Association; Women Groupings; NGOs): -CPF/Disaster Management: Phillip GomesHealth & Welfare (Children; Indigents; Senior Citizens): Eastlyn HoffmanPeople With Disability: Tony Ashdown
Yes 4 24 3
8 Cllr Mike NdebeleAgriculture Conservation Environment: Maggy TokweEducation: Andreas MahakoeSports, Recreation, Arts & Culture: Mantwa MokoenaBusiness (LED; Housing; Infrastructural Development): Florence NhlabathiYouth: Puleng HoyaneFBOs(Religious Groupings; Traditional Healers): Buyisile TsholobaCBOs (Civic Organisations; Ratepayers Association; Women Groupings; NGOs): Bongani SindeloCPF/Disaster Management: Xolani ZwaneHealth & Welfare (Children; Indigents; Senior Citizens): Josias MalulekePeople With Disability: Maria Maduna
Yes 4 36 3
9 Cllr Cliff HartmanAgriculture Conservation Environment: Cicillia SilandaEducation: ChurchSports, Recreation, Arts & Culture: RossouwBusiness (LED; Housing; Infrastructural Development): Roger SkudderYouth: Nelson MboweniFBOs(Religious Groupings; Traditional Healers): Zenny MachetheCBOs (Civic Organisations; Ratepayers Association; Women Groupings; NGOs): Connie MboweniCPF/Disaster Management: -Health & Welfare (Children; Indigents; Senior Citizens): Sikander OmarPeople With Disability: Hassen Haloojee
Yes 4 32 3
10 Cllr Prace BolandAgriculture Conservation Environment: Meshack MokoakoeEducation: Roseline MohlabaiSports, Recreation, Arts & Culture: Mamatsie MachitjeBusiness (LED; Housing; Infrastructural Development): Sarah KubhekaYouth: Michael RatsatsinyaneFBOs(Religious Groupings; Traditional Healers): Thomas JimCBOs (Civic Organisations; Ratepayers Association; Women Groupings; NGOs): Pascalinah MokoenaCPF/Disaster Management: Mampe MokoenaHealth & Welfare (Children; Indigents; Senior Citizens): Shabe MofokengPeople With Disability: Mahlomola Lehloka
Yes 4 15 3

Midvaal Local Municipality | APPENDICES 230
11 Cllr Sebenzile HlengwaAgriculture Conservation Environment: Thalitha NtasiEducation: Maureen MoshanyaneSports, Recreation, Arts & Culture: Nhlanhla KubhekaBusiness (LED; Housing; Infrastructural Development): Muntu MasingaYouth: Bongiwe DumaFBOs(Religious Groupings; Traditional Healers): Joseph MoropaneCBOs (Civic Organisations; Ratepayers Association; Women Groupings; NGOs): Respect DubeCPF/Disaster Management: Daniel Maloisane Health & Welfare (Children; Indigents; Senior Citizens): Thabo MohalePeople With Disability: Martin Sithole
Yes 3 20 3
12 Cllr Isaac MatsoseAgriculture Conservation Environment: Roxanne Du ToitEducation: David MatsobaneSports, Recreation, Arts & Culture: -Sifiso NhlapoBusiness (LED; Housing; Infrastructural Development): Andre Du ToitYouth: Keketso MohapiFBOs(Religious Groupings; Traditional Healers): Modishi MofokengCBOs (Civic Organisations; Ratepayers Association; Women Groupings; NGOs): Catherine SinclairCPF/Disaster Management: Mark WinterbottomHealth & Welfare (Children; Indigents; Senior Citizens): Sophia MohapiPeople With Disability: Christinah Raboroko
Yes 4 21 2
13 Cllr Andre van TonderAgriculture Conservation Environment: Reinhardt VenterEducation: Marie BoshoffSports, Recreation, Arts & Culture: Brian TaylorBusiness (LED; Housing; Infrastructural Development): -Youth: Pieter DreyerFBOs(Religious Groupings; Traditional Healers): Nico Van EedenCBOs (Civic Organisations; Ratepayers Association; Women Groupings; NGOs): Naas SchutteCPF/Disaster Management: Ockert BritsHealth & Welfare (Children; Indigents; Senior Citizens): Jackie BritsPeople With Disability: Anel Vermeulen
Yes 4 40 2
14 Cllr Phil Pretorius Agriculture Conservation Environment: H OosthuysenEducation: Berlina JordaanSports, Recreation, Arts & Culture: Maryna BlokkerBusiness (LED; Housing; Infrastructural Development): SK AllertYouth: Gillian van WykFBOs(Religious Groupings; Traditional Healers): Andries PretoriusCBOs (Civic Organisations; Ratepayers Association; Women Groupings; NGOs): Christine MancerCPF/Disaster Management: Petrus NoethHealth & Welfare (Children; Indigents; Senior Citizens): Rosalina De BruynPeople With Disability: V Pretorius
Yes 4 20 2
T E

Midvaal Local Municipality | APPENDICES 231
APPENDIX F – WARD INFORMATION
R' 000
No. Project Name and detail Start Date End Date Total Value
1 CBD Phase 4 Aug-13 Jun-14 10 000
2 Energy efficiency (Eedsmg) Jul-13 Jun-14 7 000
3 Upgrade of sewers Sicelo (MIG) Jul-12 Sep-13 6 000
4 Sicelo/Highbury (Balley Settlements) Reservoir & Main (MIG) Jul-12 Sep-14 5 500
5 Sicelo reticulation network (erf 204) Jul-12 Jul-13 6 000
6 Gravel to Tar Jul-13 Jun-14 4 058
7 Lakeside Library Jul-12 Jun-14 5 350
8 Upgrade gravel roads Jan-14 Oct-14 5 000
9 Upgrade Jan Neethling street Jan-14 Oct-14 4 000
10 Upgrade intersections Jan-14 Oct-14 4 500
Ward Title: Ward Name (Number)
Capital Projects: Seven Largest in Year 0 (Full List at Appendix O)
T F.1
Note: Due to a lack of financial resources, not all wards have been allocated projects. Kindly refer to Appendix O
Detail Water Sanitation Electricity Refuse Housing
Households with minimum service delivery 29,268 26,040 24242 15000Households without minimum service delivery 584 3,812 5610 742
Total Households* 29852 29852 29852 15742
Houses completed in year
Shortfall in Housing units
T F.2
Basic Service Provision
*Including informal settlements
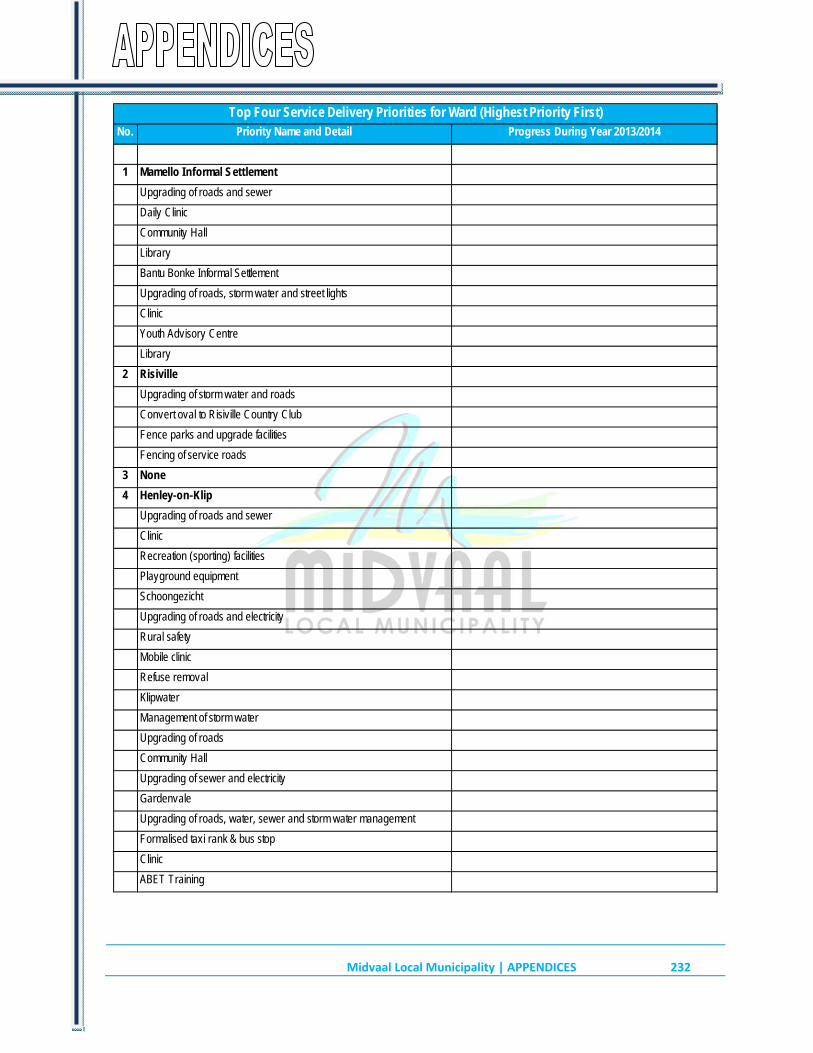
Midvaal Local Municipality | APPENDICES 232
No. Priority Name and Detail Progress During Year 2013/2014
1 Mamello Informal Settlement
Upgrading of roads and sewer
Daily Clinic
Community Hall
Library
Bantu Bonke Informal Settlement
Upgrading of roads, storm water and street lights
Clinic
Youth Advisory Centre
Library
2 Risiville
Upgrading of storm water and roads
Convert oval to Risiville Country Club
Fence parks and upgrade facilities
Fencing of service roads
3 None
4 Henley-on-Klip
Upgrading of roads and sewer
Clinic
Recreation (sporting) facilities
Playground equipment
Schoongezicht
Upgrading of roads and electricity
Rural safety
Mobile clinic
Refuse removal
Klipwater
Management of storm water
Upgrading of roads
Community Hall
Upgrading of sewer and electricity
Gardenvale
Upgrading of roads, water, sewer and storm water management
Formalised taxi rank & bus stop
Clinic
ABET Training
Top Four Service Delivery Priorities for Ward (Highest Priority First)
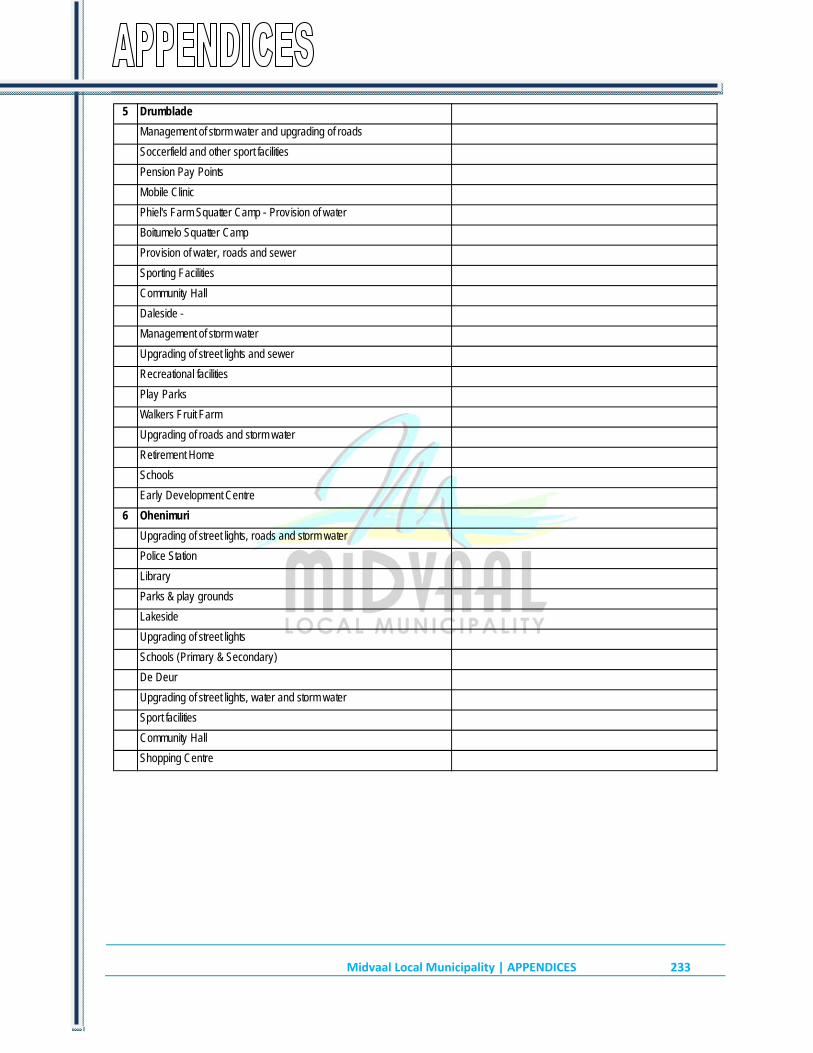
Midvaal Local Municipality | APPENDICES 233
5 Drumblade
Management of storm water and upgrading of roads
Soccerfield and other sport facilities
Pension Pay Points
Mobile Clinic
Phiel's Farm Squatter Camp - Provision of water
Boitumelo Squatter Camp
Provision of water, roads and sewer
Sporting Facilities
Community Hall
Daleside -
Management of storm water
Upgrading of street lights and sewer
Recreational facilities
Play Parks
Walkers Fruit Farm
Upgrading of roads and storm water
Retirement Home
Schools
Early Development Centre
6 Ohenimuri
Upgrading of street lights, roads and storm water
Police Station
Library
Parks & play grounds
Lakeside
Upgrading of street lights
Schools (Primary & Secondary)
De Deur
Upgrading of street lights, water and storm water
Sport facilities
Community Hall
Shopping Centre

Midvaal Local Municipality | APPENDICES 234
7 Blignautsrus, Tedderfield, Hartzenbergfontein, Alewynspoort and Walker Fruit FarmsUpgrading of roads
Mobile clinic
Satellite EMS & SAPS
Community Centre
8 None
Housing
Street lights
Water
Sanitation
School
9 Meyerton
Upgrading of storm water, sewer, roads and refuse removal
Play parks in Verwoerd Road
Cycle Lanes
Unemployment Centre
10 Sicelo Informal Settlement
Upgrading of roads, street lights and management of storm water
Place of public worship
Police Station
Local policing forum / committee
11 Street lights
Sport Facilities
Secondary School
Retail Shopping Centre
12 Housing
Water (Replace water tanks with taps)
Sanitation
Land for development
13 Upgrading of Roads (Gravel to tar)
Upgrading of sewer network
Public ablution at park
Improved and safer access to Jim Fouche Street
14 Traffic Calming measures at schools (Painting/Signs/Speed Control)
Fence next to Erna Church Street
ACTIVITY PARKS FOR THE YOUTH (SKATEBOARD PARKS) Park was developed adjacent to Pierneef Street
MEYERTON SPORTS CLUB PHASE 2 – PALISADE & PAVING Project completed
T F.3

Midvaal Local Municipality | APPENDICES 235
ELECTED WARD MEMBERS (STATING NUMBER OF MEETING ATTENDED – MAXIMUM 12 MEETINGS) Note: The table in Appendix E provides all the details of ward committee members and the meetings held by the relevant ward committee. T F.3

Midvaal Local Municipality | APPENDICES 236
APPENDIX G – RECOMMENDATIONS OF THE MUNICIPAL AUDIT COMMITTEE 2013/14
Date of Committee Committee recommendations during 2013/2014-Financial Year
Recommendations adopted (enter Yes) If not adopted (provide explanation)
23-Oct-13 Execution of the Annual Audit Plan 2012/2013 (Status of the implementation of rectification measures in terms of previous audit findings
Yes
Execution of Annual Audit Plan 2013/2014 Yes
Follow-up audit of Vehicles (FR117) Yes
Follow-up audit of Water & Electricity Income (FR185) Yes
Follow-up audit of the Town Planning Section (FR186) Yes
Follow-up audit on Fixed Assets (FR195) Yes
Follow-up audit of Stock Control (FR197) Yes
Follow-up auidt of Procurement Process (FR201) Yes
Follow-up audit on Human Resources (Recruitment & Termination of Employment) (FR204)
Yes
Election of Chairperson & Deputy Chairperson Yes
Audit of Overtime (FR206) Yes
Audit of MFMA Compliance: Apr - Jun 2013 (FR209) Yes
Audit on Cash Counts & Receipts Deposit Test (FR210) Yes
Audit of MFMA Compliance: Jul 2013 (FR211) Yes
Audit of MFMA Compliance: Aug 2013 (FR212) Yes
Audit on complaints received for Engineering Services (Eng) (FR213A)
Yes
Audit on complaints received for Engineering Services (Corp) (FR213B)
Yes
Audit of MFMA Compliance: Sept 2013 (FR214) Yes
Audit of Information Technology (IT) Services (FR215) Yes
Audit of the Auditor-General's Report (FR216) Yes
Audit of the Performance Management System (FR217) Yes
Approval of the Performance & Audit Committee Charter 2013 - 2016 and the Internal Audit Charter 2013 - 2016
Yes
Approval of three year internal audit rolling plan 2014 - 2016 and Annual Audit Plan 2013 - 2014
Yes
Operation Clean Audit 2014 (OPCA) Yes
Quarterly Report: Internal Audit Function (Connaughton Miller Smith)
Yes
Approved SDBIP & Performance Agreements: 1 Jul 2013 - 30 Jun 2014
Yes
Strategic Risk Assessment Report & Strategic Risk Register
Yes
Fraud Prevention Committee: Progress Report Yes
Municipal Audit Committee Recommendations

Midvaal Local Municipality | APPENDICES 237
19-Feb-14 Compliance to Annual Audit Plan 2013 - 2014 Yes
Status of the implementation of rectification measures in terms of previous audit findings
Yes
Audit of MFMA Compliance: Oct & Nov 2013 (FR218) Yes
Audit of MFMA Compliance: Dec 2013 (FR221) Yes
Audit of the accuracy of tariffs loaded on the system (FR219)
Yes
Audit of the Trade Licence & Poster Income (FR220) Yes
Audit of Cash Counts & Receipts Deposit Test (Traffic) (FR223A)
Yes
Audit of Cash Counts & Receipts Deposit Test (Finance) (FR223B)
Yes
Gauteng Province: Report on the Audit Committee & Internal Audit Activity Evaluation
Yes
Request from the Municipal Public Accounts Committee (MPAC) to attend the Internal Audit Committee Meetings as observers
Yes
Operation Clean Audit 2014 (OPCA) Yes
Quarterly Report: Internal Audit Function (Connaughton Miller Smith)
Yes
Performance Management System Yes
Strategic Risk Assessment Report & Operational Risk Registers
Yes
Fraud Prevention Committee: Progress Report Yes
26-Mar-14Status of the reviewed SDBIPs to implement and address the preliminary audit findings YesResponsibilities of the committee in terms of performance management YesStatus quo in terms of the Auditor-General's findings on the Predetermined Objectives (2012/2013) Yes
22-May-14 Amended Annual Audit Plan 2013/2014 Yes
Execution of Annual Audit Plan 2013/2014 YesStatus of the implementation of rectification measures in terms of previous audit findings Yes
Draft Annual Audit Plan 2014/2015 Yes
Audit of MFMA Compliance: Jan & Feb 2014 (FR224) Yes
Audit of MFMA Compliance: Mar 2014 (FR228) Yes
Audit of MFMA Compliance: Apr 2014 (FR233) Yes

Midvaal Local Municipality | APPENDICES 238
Audit of User Access to Computer Systems: Oct - Dec 2013 (FR227) YesAudit of User Access to Computer Systems: Jan - Feb 2014 (FR230) Yes
Audit of Access to Computer Systems: Mar 2014 (FR234) Yes
Audit of Cash Counts & Receipts Deposit Test (FR232) Yes
Audit of Indigent Debtors (FR229) Yes
Audit of Leave (FR226) YesSpecial Request: Fruitless & Wasteful Expenditure (FR231) Yes
Operation Clean Audit 2014 (OPCA) YesQuarterly Report: Internal Audit Function (Connaughton Miller Smith) Yes
Performance Management System: 1st Q Yes
Performance Management Sytem: 2nd Q YesStatus quo report: Strategic Risk Register & Operational Risk Registers Yes
T G

Midvaal Local Municipality | APPENDICES 239
APPENDIX H – LONG TERM CONTRACTS AND PUBLIC PRIVATE PARTNERSHIPS
Name of Service Provider (Entity or Municipal Department)
Description of Services Rendered by the Service Provider
Start Date of Contract
Expiry date of Contract Project manager Contract Value
Sivhidzho Advanced Projects CC Maintenance Electrical networks in Vaal Marina 01/01/2014 30/06/2016 Engineering Services R1 086 135.00
Tecroveer Projects(Pty)LtdMaintenance and Operation of waste water treatment works at Vaal Marina
01/09/2013 30/06/2016 Engineering Services R 1 800 000.00
Balfour Landini Heavy Duty Vehicles 01/02/2014 31/12/2018 Social Services R279 300.00
Vaal Triangle Motors Heavy Duty Vehicles 01/02/2014 31/12/2018 Social Services/EngineeringServices R2 322 034.08
Barlow world Equipment Heavy Duty Vehicles 01/02/2014 31/12/2018 Engineering Services R986 100.00
Mariri Trading 138 cc Rental of Plant and Equipment 01/12/2013 30/06/2016 Engineering Services R 3 000 000.00
Midmar Plant Hire cc Rental of Plant and Equipment 01/12/2013 30/06/2016 Engineering Services
Rantoa Service Providers Rental of Plant and Equipment 01/12/2013 30/06/2016 Engineering Services
Zwangavho Trading CC Rental of Plant and Equipment 01/12/2013 30/06/2016 Engineering Services
Mjodi Facilities Management Rental of Plant and Equipment 01/12/2013 30/06/2016 Engineering Services
Advanced Products Technology Supply and delivery of cable and electrical items 01/09/2013 30/06/2016 Engineering Services R 8 000 000.00
Aberdare Cables Supply and delivery of cable and electrical items 01/09/2013 30/06/2016 Engineering Services
Beka(Pty)Ltd Supply and delivery of cable and electrical items 01/09/2013 30/06/2016 Engineering Services
Cox and McKay Electrical Supply and delivery of cable and electrical items 01/09/2013 30/06/2016 Engineering Services
Els Electrical Supply and delivery of cable and electrical items 01/09/2013 30/06/2016 Engineering Services
Ilanga Lightning Distribution company Supply and delivery of cable and electrical items 01/09/2013 30/06/2016 Engineering Services
P H Marketing Supply and delivery of cable and electrical items 01/09/2013 30/06/2016 Engineering Services
Itron Metering solutions Supply and delivery of cable and electrical items 01/09/2013 30/06/2016 Engineering Services
Starlight Electrical Supply and delivery of cable and electrical items 01/09/2013 30/06/2016 Engineering Services
Voltsing Electrical Supply and delivery of cable and electrical items 01/09/2013 30/06/2016 Engineering Services
Moreki Distributors CC Rendering of Vacuum Tank Services 01/08/2013 31/07/2016 Engineering Services R 3 897 600.00
Aqua Transport and Plant Hire Rendering of Vacuum Tank Services 01/08/2013 31/07/2016 Engineering Services
Gibb Engineering Consultant Tender 01/07/2014 30/06/2016 Engineering Services R 5 500 000.00
Themba Consultants Consultant Tender 01/07/2014 30/06/2016 Engineering Services
Delta Build Consultant Tender 01/07/2014 30/06/2016 Engineering Services
Ndodana Consulting Consultant Tender 01/07/2014 30/06/2016 Engineering Services
Thembakele Consulting Consultant Tender 01/07/2014 30/06/2016 Engineering Services
Aecom SA(Pty)Ltd Consultant Tender 01/07/2014 30/06/2016 Engineering Services
MPA/Zitholele JV Consultant Tender 01/07/2014 30/06/2016 Engineering Services
Zeal Consulting Consultant Tender 01/07/2014 30/06/2016 Engineering Services
Element Consulting Consultant Tender 01/07/2014 30/06/2016 Engineering Services
Hamsa Consultant Tender 01/07/2014 30/06/2016 Engineering Services
Lyon & Partners Consultant Tender 01/07/2014 30/06/2016 Engineering Services
Bau Architects Consultant Tender 01/07/2014 30/06/2016 Engineering Services
Zas Architects Consultant Tender 01/07/2014 30/06/2016 Engineering Services
Erascon Consultant Tender 01/07/2014 30/06/2016 Engineering Services
Anneke Bester Consultant Tender 01/07/2014 30/06/2016 Engineering Services
Lichenry/Mariri JVRehabilitation and maintenance of tarred and gravel roads
01/09/2013 31/08/2016 Engineering Services R 27 652 040.36
Tsakelane Construction Enterprize ccRendering of cleaning services of Roads and intersections
01/09/2013 30/06/2016 Engineering Services R 680 000.00
Ka ntle Trading Enterprise Supply and delivery of Butimen products 01/09/2013 30/06/2016 Engineering Services R 1 650 000.00
KPG Surfacing & Civils CC Supply and delivery of Butimen products 01/09/2013 30/06/2016 Engineering Services R 1 650 000.00
MaxiPrest t/a Max T Solutions Supply,Delivery and Fitment of Tyres 01/08/2013 31/07/2014 Engineering Services R 1 000 000.00
Tyre & Tube Hyper Supply,Delivery and Fitment of Tyres 01/08/2013 31/07/2014 Engineering Services
Tharochem DetergentsCC Cleaning materials and assessories 01/03/2014 30/06/2016 Financial services R 1 600 000.00
Kiloton Hydraulics General Hardware,tools and paint products 01/03/2014 30/06/2016 Financial services R 1 600 000.00
Sanitech Higiene items and services 01/03/2014 30/06/2016 Financial services R 1 800 000.00
Standard Bank Long Term Loan 01/04/2014 31/03/2019 Financial services R 4 440 000.00
Inkhokheli Business Enterprise(A 1&3) Grass Cutting Services 01/12/2013 30/06/2016 Social Services R 2 990 000.00Ka Maphumlo& sons Business Enterprise(A 2)
Grass Cutting Services 01/12/2013 30/06/2016 Social Services R 4 470 000.00
Mariri Trading 138 cc Rental of Plant and Equipment 01/08/2013 31/07/2016 Social Services R 4 935 000.00
Zwangavho Trading CC Rental of Plant and Equipment 01/08/2013 31/07/2016 Social Services
Aqua Transport and Plant Hire Rental of Plant and Equipment 01/08/2013 31/07/2016 Social Services
Kapoka Trading Enterprise 51 Rental of Plant and Equipment 01/08/2013 31/07/2016 Social Services
Segosedi Electrical and Projects(Pty)Ltd Rental of Plant and Equipment 01/08/2013 31/07/2016 Social Services
Commanders Logistic's(Pty)Ltd Rental of Plant and Equipment 01/08/2013 31/07/2016 Social Services
Price Waterhouse Coopers Performance Management System 23/09/2013 30/06/2016 Corporate R 2 100 000.00
T H.1
Long Term Contracts (20 Largest Contracts Entered into during Year 2013-2014)R' 000

Midvaal Local Municipality | APPENDICES 240
Name and Description of Project Name of Partner(s) Initiation Date Expiry date Project manager Value
Public Private Partnerships Entered into during 2013/14
None
T H.2
APPENDIX I – MUNICIPAL ENTITY/ SERVICE PROVIDER PERFORMANCE SCHEDULE
Name of Entity & Purpose (a) Service Indicators Year 2Target Actual Actual
*Previous Year *Previous Year *Current Year *Current Year *Current Year *Following Year(i) (ii) (iii) (iv) (v) (vi) (vii) (viii) (ix) (x)
T I
Note: This statement should include no more than the top four priority indicators. * 'Previous Year' refers to the targets that were set in the Year -1 Budget/IDP round; *'Current Year' refers to the targets set in the Year 0 Budget/IDP round. *'Following Year' refers to the targets set in the Year 1 Budget/IDP round. Note that all targets must be fundable within approved budget provision. In column (ii) set out the Service Indicator (I b ld i li ) h h S i T d h ( i b ld d d f ) d h diff
(b) Service Targets
Municipal Entity/Service Provider Performance ScheduleYear 0 Year 1 Year 3
Target Target
None

Midvaal Local Municipality | APPENDICES 241
APPENDIX J – DISCLOSURES OF FINANCIAL INTERESTS
Position Name Description of Financial interests*(Nil / Or details)
(Executive) Mayor Bongani Baloyi 23 Captain Hindon Street, Kookrus - Owner / Bond Standard Bank
Fund name: Sanlam Retirement AnnuityChairpersone of an NPO, Midvaal Youth Development forum and receive a transport allowance R120.00 a sitting/meeting.
Speaker FW Peeters JSE - Clover Industries - 3 500 shares
Meinfred Boerdery - Owner - Farming, sheep, cattle, milk production and other activities
Self employed - SDB and EE Reports consulting - temporary - Motor and security industry
Erf 152, Riversdal, Owner , Erf 158 Riversal, Owner, Erf 151/12 Riversdal - Owner, S h i ht LH 20/1 O S h i ht LH 20/RR O Schoongezicht 378 IR - Tenant - Deltrust & CC, Erf 158, Wolkopdorp, Joint Owner
Fund name: Municipal Councillors Pension Fund
M Hack Holding 65, Teddervield - Residence
Fund name: Municipal Councillors Pension Fund
Sanlam retirement
PD Pretorius 95 Granite Street, Valley Settlements X3, Randvaal - Owner
Fund Name: Councillors Pension Fund
SC Nkhi House owner
Fund name: Previous Gauteng Leglislature
tax) i.e. R8000.00 p.a. and R15 000.00 (before tax) per month from Alex forbes Investments
R12 000.00 (after tax) from my legslature Pension fund.
R Jones PPE Depot CK 2013/003497/07 - 5 % - Supply of personal protection equipment
Honeywell - Process Control Eng - Permanent - Process control electronics and computers
Honeywell - Salary - R455 000.00 (Process control electronics and computers)
Agricultural Holding - Owner
Fund name: Honeywell Provident Fund (Alexander Forbes)
Stanlib
Municipal Councillors Pension fund
DR Ryder Rohan Farms CC - 50 % - Dormant
Winding down
Midvaal Local Municipality - Cllr - Elected position
Sedebing District Municipality - Cllr - Deployed
Rohan Farms CC - Owner - Co-owner - Dormant
trading. Winding down.
Dormant, Ryder Foods CC - Previously owned a sausage saloon franchise. No longer
Erf 77, Blignautsrus Ah , Joint Owner with spouse, 50 %
Period 1 July to 30 June of 2013/14
Disclosures of Financial Interests
Member of MayCo / Exco

Midvaal Local Municipality | APPENDICES 242
Councillors CP Hartman PSG Pretoria East
Share on the JSE (as on March 2014) = R230 000.00
PSG Pretoria East
Retirement Annuity fund (as on March 2014) = R700 000.00
Rent income business building Meyerton = R360 000.00
Fentonstreet 13 Meyerton Erf 219 , Owner business
Fund name: Municipal Councillors Pension Fund
MS Schoeman Destinata school - Financial Administration Education
Midvaal Local Municipality - Councillor 2011-2016
Destinata school salary - R128 000.00 - Education
GSSC - Pension - R72 000 - Pension fund administrators
Hoffman Street 23, Kookrus, Owner
Fund name = GSSC
ABSA Bank - Investment
Standard Bank - Investment
L Parsonson Henley High School - Teacher - Permanent - R13 000.00
Fund = Municipal Councillors Pension Fund
P Pretorius NWU Vaal Lecturer - Permanent - Education
NWU Vaal - Salary - R380 000
Private home - owner - 5a Park Street, Meyerton
NWU - National Testing Pension fund
MM Ndebele Sibambisene Plumbing (Pty) Ltd 2013/02916/07 - Plumbing
Portion 58, Erf 185 MF, Owner
Fund name: Municipal Councillors Pension
Engagin parents organisation - Now active member
SE Hlengwa Fund name: Councillors Pension fund
IM Matsose Fund name: Councillors Pension fund
M Radebe 1838 Vaal Avenue, Lakeside Estate, House owner
S Maphalla Telkom - Ordinary - Shares 19
Sanlam - Ordinary - Sahres 13
Land & Building No 169 Kookrus - Owner

Midvaal Local Municipality | APPENDICES 243
J Mokoena None
M Magagula Fund name: Old Mutual
E Moleko Fund name: Municipal Provident Pension Fund
J Botsoere Midvaal Council - Councillor
House owner
Fund Name: Municipal Pension fund
PGA of SA - Golf lessons playing golf tournament
CG Pypers Corrie Pypers Boedery 2007/031522/23 - 50% Boerdery
Corrie Pypers Familie Turst 2112/90 - Trustee - Property owning
Fund name: Sanlam 019220649X8
Fund name: Sanlam 019231111x6
MGI Ngcobo Amway 971787 - Commission - Shares - unlimited
ABO 971787
GGNA KM Mafuze Services - 97/45978/23 - 50 % - Service
House 365/2 Jangroentjie Street, Randvaal - Joint owner
A van Tonder OVT Security - 2013/191712/07 - Executive Security
OVT Security - OJ O'Linsky - Security
House 16 Ligten Street, Meyerton, 1961 - Owner
I am part time concillor at Midvaal Area
P Boland Evertie Groups - Employee dividend - 160
Forever Living Product - 270533642
Fund Name: AC & BP Provident fund
Ekurhuleni
WF de Agrella Old Mutual PLC - Retirement policy - 1312
Now dormant sinde September 2009
Self employed - ODD Jobs - Temporary - Emergency repairs
Plot 104, Ring Road West, Vaal Marina, Vaaldam - Owner
Fund Name: AIMS Living annuity investment
P Ramushu 1213 Stanmore Rd, Henley on Klip
24 Gerrie Brand Rd, Kookrus
Modikeng None
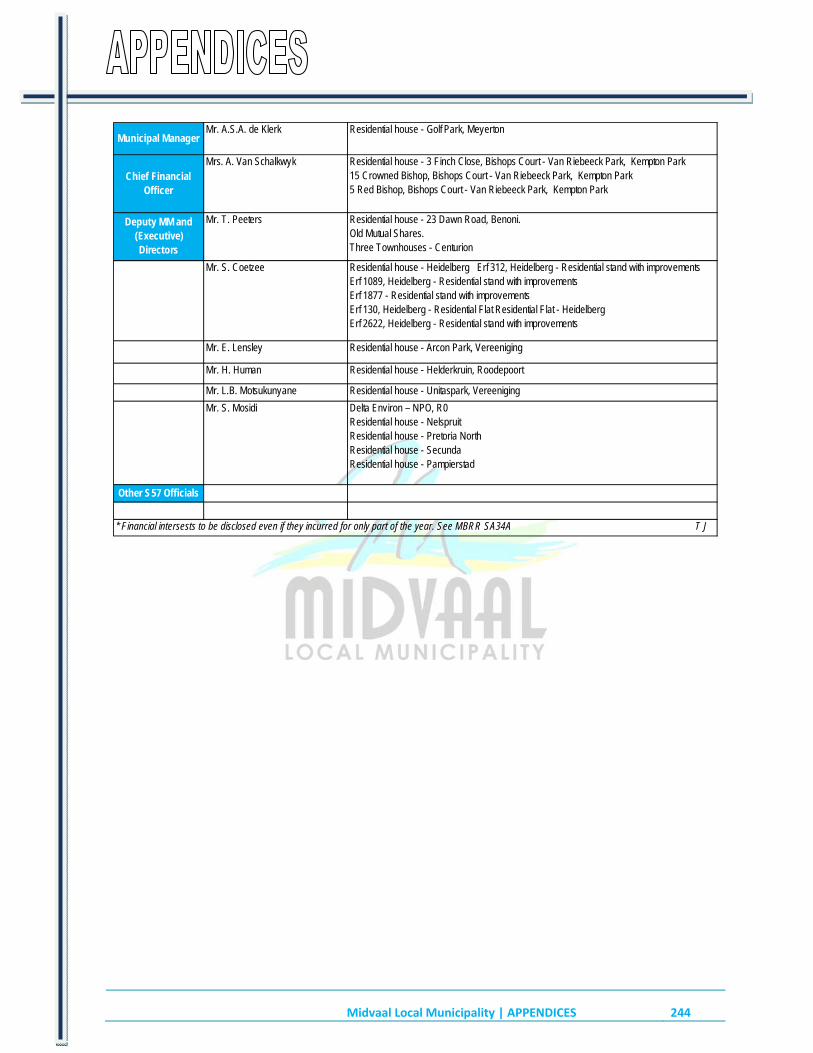
Midvaal Local Municipality | APPENDICES 244
Municipal ManagerMr. A.S.A. de Klerk Residential house - Golf Park, Meyerton
Chief Financial Officer
Mrs. A. Van Schalkwyk Residential house - 3 Finch Close, Bishops Court - Van Riebeeck Park, Kempton Park15 Crowned Bishop, Bishops Court - Van Riebeeck Park, Kempton Park5 Red Bishop, Bishops Court - Van Riebeeck Park, Kempton Park
Deputy MM and (Executive) Directors
Mr. T. Peeters Residential house - 23 Dawn Road, Benoni. Old Mutual Shares. Three Townhouses - Centurion
Mr. S. Coetzee Residential house - Heidelberg Erf 312, Heidelberg - Residential stand with improvements Erf 1089, Heidelberg - Residential stand with improvements Erf 1877 - Residential stand with improvements Erf 130, Heidelberg - Residential Flat Residential Flat - Heidelberg Erf 2622, Heidelberg - Residential stand with improvements
Mr. E. Lensley Residential house - Arcon Park, Vereeniging
Mr. H. Human Residential house - Helderkruin, Roodepoort
Mr. L.B. Motsukunyane Residential house - Unitaspark, Vereeniging
Mr. S. Mosidi Delta Environ – NPO, R0Residential house - Nelspruit Residential house - Pretoria North Residential house - Secunda Residential house - Pampierstad
Other S57 Officials
* Financial intersests to be disclosed even if they incurred for only part of the year. See MBRR SA34A T J

Midvaal Local Municipality | APPENDICES 245
APPENDIX K: REVENUE COLLECTION PERFORMANCE BY VOTE AND BY SOURCE
APPENDIX K (i): REVENUE COLLECTION PERFORMANCE BY VOTE
R' 000201/13Actual Original
BudgetAdjusted Budget
Actual Original Budget
Adjustments Budget
Exective Council 5 803 6 514 6 948 6 363 2% 8%Finance & Admin 116 873 134 065 123 931 127 617 5% -3%Development & Planning 1 897 1 841 1 997 1 906 -4% 5%Health 4 674 6 494 6 494 4 417 32% 32%Community Services 4 993 8 625 8 625 8 286 4% 4%Protection Services 7 675 10 233 15 493 51 044 -399% -229%Sport & Recreation 94 4 756 4 760 4 755 0% 0%Environmental Protection 3 775 3 117 3 117 2 426 22% 22%Waste water & Sanitation 79 242 107 755 48 755 48 327 55% 1%Waste Management 33 603 38 600 38 600 38 219 1% 1%Roads & stormwater 13 125 8 413 8 413 9 439 -12% -12%Water Services 136 641 139 352 142 352 147 795 -6% -4%Electricity 256 171 269 153 272 293 265 861 1% 2%
Total Revenue by Vote 664 566 738 919 681 780 716 457 3% -5%
T K.1
Revenue Collection Performance by Vote
2013/14 2013/14 VarianceVote Description
Variances are calculated by dividing the difference between actual and original/adjustments budget by the actual. This table is aligned to MBRR table A3

Midvaal Local Municipality | APPENDICES 246
APPENDIX K (ii): REVENUE COLLECTION PERFORMANCE BY SOURCE
2012/13Actual Original
BudgetAdjustments
BudgetActual Original
BudgetAdjustments
BudgetProperty rates 94 353 118 112 108 978 106 157 -11% -3%
Property rates - penalties & collection charges – – – 0% 0%
Service Charges - electricity revenue 213 950 242 148 242 148 235 074 -3% -3%
Service Charges - water revenue 117 586 125 329 128 329 133 849 6% 4%
Service Charges - sanitation revenue 24 319 26 277 26 277 27 252 4% 4%
Service Charges - refuse revenue 21 316 25 568 25 568 25 363 -1% -1%
Service Charges - other – – – – 0% 0%
Rentals of facilities and equipment 1 330 1 020 1 270 1 142 11% -11%
Interest earned - external investments 2 037 1 800 2 800 4 851 63% 42%
Interest earned - outstanding debtors 7 120 7 200 5 200 6 049 -19% 14%
Dividends received – – – – 0% 0%
Fines 7 020 9 000 14 000 48 726 82% 71%
Licences and permits – – – – 0% 0%
Agency services – – – – 0% 0%
Transfers recognised - operational 64 200 71 285 71 285 68 249 -4% -4%
Other revenue 21 815 16 865 18 470 20 310 17% 9%
Gains on disposal of PPE – – 456 100% 100%
Enviromental Proctection – – – 0% 0%Total Revenue (excluding capital transfers and contributions)
575 046 644 603 644 324 677 478 4.85% 4.89%
T K.2Variances are calculated by dividing the difference between actual and original/adjustments budget by the actual. This table is aligned to MBRR table A4.
Revenue Collection Performance by SourceR '000
Description2013/14 2013/14 Variance

Midvaal Local Municipality | APPENDICES 247
APPENDIX L: CONDITIONAL GRANTS RECEIVED: EXCLUDING MIG
Budget Adjustments Budget
Regional Bulk Infrastructure 50 000 Project implementation to be done by Rand WaterEEDSMG 9 000 9 000 100.0% 0.0% Implementation of Energy Efficiency projectsFinancial Management Grant 7 058 58 58 0.0% 100.0% Funding of finanical management reforms (Capex)Municipal Systems Improvement 890 890 890 0.0% 100.0% Funding of IT and governance systemsFinancial Management Grant 1 242 1 242 1 242 0.0% 100.0% Funding of finanical management reforms (Opex)EPWP 1 000 1 000 1 000 0.0% 100.0% Job creation using labour intensive methods
Environmental subsidy grant 3 117 3 117 2 426 -28.5% 77.8%Management of envionmental management function obo Sedibeng district municipality
HIV Programme 269 269 0.0% 0.0% Funding of HIV activities (Sedibeng Funding)DSRAC Grant 100 100 100 0.0% 100.0% Funding of libraries (Capex)Provincial Health Subsidy Grant 6 494 6 494 4 417 -47.0% 68.0% Rendering of a clinic service obo GPGDSRAC Grant 2 500 2 500 2 500 0.0% 100.0% Funding of libraries (Opex)
Total 72 670 24 670 21 633 0% 87.7%
T L
* This includes Neighbourhood Development Partnership Grant, Public Transport Infrastructure and Systems Grant and any other grant excluding Municipal Infrastructure Grant (MIG) which is dealt with in the main report, see T 5.8.3. Variances are calculated by dividing the difference between actual and original/adjustments budget by the actual. Obtain a list of grants from national and provincial government.
Conditional Grants: excluding MIGR' 000
Details
Original Budget
Adjustments Budget
Actual Variance Major conditions applied by donor (continue below if necessary)
COMMENT ON CONDITIONAL GRANTS EXCLUDING MIG: All government grants were spent. No roll-overs have been requested. The abovementioned table excludes both the MIG grant as well as the Equitable share grant (unconditional grant used for the funding of free basic services). T L.1
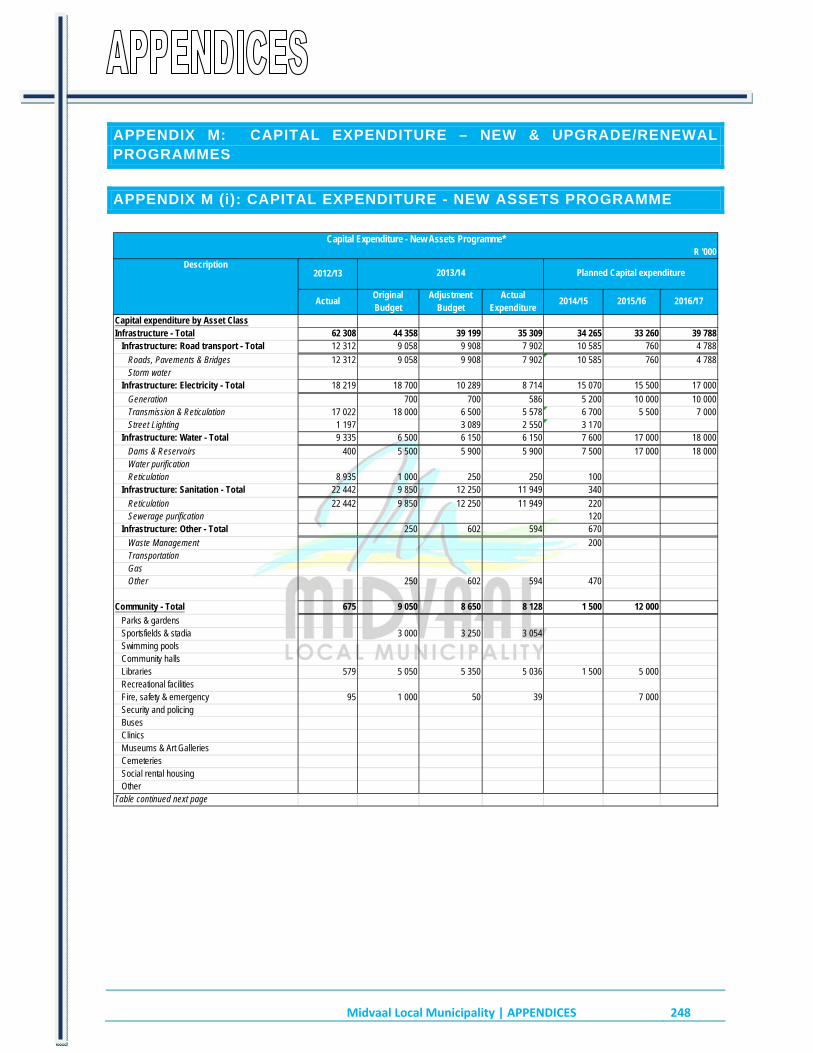
Midvaal Local Municipality | APPENDICES 248
APPENDIX M: CAPITAL EXPENDITURE – NEW & UPGRADE/RENEWAL PROGRAMMES
APPENDIX M (i): CAPITAL EXPENDITURE - NEW ASSETS PROGRAMME
2012/13
ActualOriginal Budget
Adjustment Budget
Actual Expenditure
2014/15 2015/16 2016/17
Capital expenditure by Asset ClassInfrastructure - Total 62 308 44 358 39 199 35 309 34 265 33 260 39 788
Infrastructure: Road transport - Total 12 312 9 058 9 908 7 902 10 585 760 4 788
Roads, Pavements & Bridges 12 312 9 058 9 908 7 902 10 585 760 4 788Storm water
Infrastructure: Electricity - Total 18 219 18 700 10 289 8 714 15 070 15 500 17 000
Generation 700 700 586 5 200 10 000 10 000Transmission & Reticulation 17 022 18 000 6 500 5 578 6 700 5 500 7 000Street Lighting 1 197 3 089 2 550 3 170
Infrastructure: Water - Total 9 335 6 500 6 150 6 150 7 600 17 000 18 000
Dams & Reservoirs 400 5 500 5 900 5 900 7 500 17 000 18 000Water purificationReticulation 8 935 1 000 250 250 100
Infrastructure: Sanitation - Total 22 442 9 850 12 250 11 949 340
Reticulation 22 442 9 850 12 250 11 949 220Sewerage purification 120
Infrastructure: Other - Total 250 602 594 670
Waste Management 200TransportationGasOther 250 602 594 470
Community - Total 675 9 050 8 650 8 128 1 500 12 000
Parks & gardensSportsfields & stadia 3 000 3 250 3 054Swimming poolsCommunity hallsLibraries 579 5 050 5 350 5 036 1 500 5 000Recreational facilitiesFire, safety & emergency 95 1 000 50 39 7 000Security and policingBusesClinicsMuseums & Art GalleriesCemeteriesSocial rental housingOther
Table continued next page
Capital Expenditure - New Assets Programme*R '000
Description2013/14 Planned Capital expenditure

Midvaal Local Municipality | APPENDICES 249
2012/13
ActualOriginal Budget
Adjustment Budget
Actual Expenditure
2014/15 2015/16 2016/17
Capital expenditure by Asset ClassHeritage assets - Total
BuildingsOther
Investment properties - Total
Housing developmentOther
Other assets 7 497 10 028 13 264 11 882 13 965 5 420 5 770
General vehicles 3 235 1 760 3 111 2 992 4 060 600 600Specialised vehiclesPlant & equipment 496 5 063 7 104 6 396 5 880 1 300 1 500Computers - hardware/equipment 135 481 275 229 752 110 110Furniture and other office equipment 974 274 296 243 711 2 810 2 810AbattoirsMarkets 500 600 750Civic Land and BuildingsOther Buildings 461 150 305 240Other Land 1 833 300 1 423 1 123 220Surplus Assets - (Investment or Inventory)Other 362 2 000 751 658 1 842
Agricultural assets
List sub-class
Biological assets
List sub-class
Intangibles 25
Computers - software & programming 25Other (list sub-class)
Total Capital Expenditure on new assets 70 480 63 436 61 113 55 319 49 755 50 680 45 558
Specialised vehicles
RefuseFireConservancyAmbulances
T M.1
Capital Expenditure - New Assets Programme*R '000
Description2013/14 Planned Capital expenditure
* Note: Information for this table may be sourced from MBRR (2009: Table SA34a)

Midvaal Local Municipality | APPENDICES 250
APPENDIX M (ii): CAPITAL EXPENDITURE – UPGRADE/RENEWAL PROGRAMME
2012/13
ActualOriginal Budget
Adjustment Budget
Actual Expenditure
2014/15 2015/16 2016/17
Capital expenditure by Asset ClassInfrastructure - Total 24 807 76 640 23 711 18 903 22 937 6 220 9 700
Infrastructure: Road transport -Total 1 754 12 500 10 746 6 800 1 000
Roads, Pavements & Bridges 1 754 12 500 10 746 6 800 1 000Storm water
Infrastructure: Electricity - Total 959 8 800 10 650 10 079 1 350 3 500
Generation 959 900 900 578 1 350Transmission & Reticulation 7 900 9 750 9 500 3 500Street Lighting
Infrastructure: Water - Total 1 615 1 300 1 287 1 191 7 450 1 200 1 200
Dams & ReservoirsWater purification 532 1 100 1 200 1 200Reticulation 1 083 1 300 1 287 1 191 6 350
Infrastructure: Sanitation - Total 19 499 54 040 1 029 833 13 137 200 5 000
Reticulation 1 748 3 540 429 426 12 500 200 5 000Sewerage purification 17 751 50 500 600 407 637
Infrastructure: Other - Total 979 4 820
Waste Management 4 820TransportationGasOther 979
Community 1 623 1 250 750 729 6 934 4 500 2 500
Parks & gardensSportsfields & stadia 6 000 4 500 2 500Swimming pools 100Community hallsLibraries 450Recreational facilitiesFire, safety & emergencySecurity and policingBusesClinicsMuseums & Art GalleriesCemeteries 1 623 1 250 750 729Social rental housingOther 384
Heritage assets
BuildingsOther
Table continued next page
Capital Expenditure - Upgrade/Renewal Programme*R '000
Description2013/14 Planned Capital expenditure
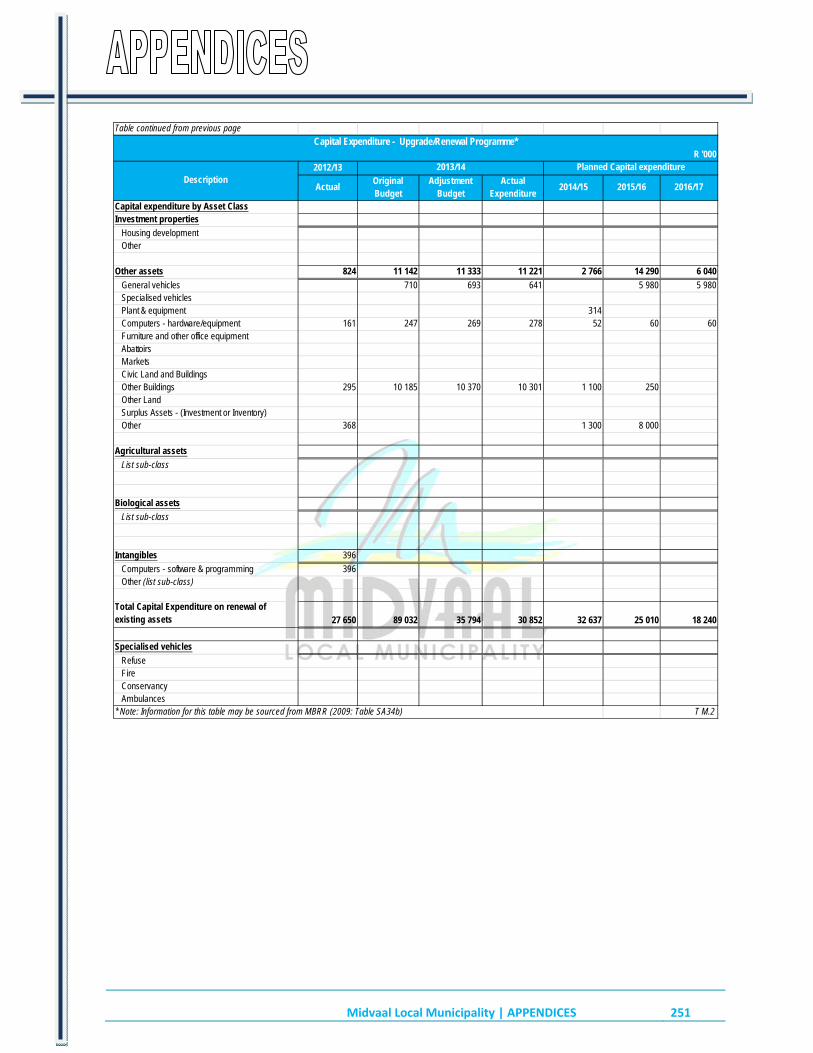
Midvaal Local Municipality | APPENDICES 251
Table continued from previous page
2012/13
ActualOriginal Budget
Adjustment Budget
Actual Expenditure
2014/15 2015/16 2016/17
Capital expenditure by Asset ClassInvestment properties
Housing developmentOther
Other assets 824 11 142 11 333 11 221 2 766 14 290 6 040
General vehicles 710 693 641 5 980 5 980Specialised vehiclesPlant & equipment 314Computers - hardware/equipment 161 247 269 278 52 60 60Furniture and other office equipmentAbattoirsMarketsCivic Land and BuildingsOther Buildings 295 10 185 10 370 10 301 1 100 250Other LandSurplus Assets - (Investment or Inventory)Other 368 1 300 8 000
Agricultural assets
List sub-class
Biological assets
List sub-class
Intangibles 396
Computers - software & programming 396Other (list sub-class)
Total Capital Expenditure on renewal of existing assets 27 650 89 032 35 794 30 852 32 637 25 010 18 240
Specialised vehicles
RefuseFireConservancyAmbulances
T M.2* Note: Information for this table may be sourced from MBRR (2009: Table SA34b)
Capital Expenditure - Upgrade/Renewal Programme*R '000
Description2013/14 Planned Capital expenditure

Midvaal Local Municipality | APPENDICES 252
APPENDIX N – CAPITAL PROGRAMME BY PROJECT 2013/14
Capital Project Original Budget
Adjustment Budget
Actual Variance (Act - Adj)
%
Variance (Act - OB) %
Water 7 800 7 437 7 341 -1% 6%
Water Meter Revenue Protection Programme 1 000 1 000 909 -10% 10%Sicelo/Highbury (Valley Settlements) Reservoir & Main (MIG) 5 500 5 500 5 500 0% 0%Sicelo/Highbury Reservoir (MIG) 400 400 0% -100%Mamello Water Network (MIG) 500 250 250 0% 100%Water services development plan 200 200 196 -2% 2%KSB pumps Highbury Pump Station 100 87 86 -1% 16%Sicelo Water Meters\Connections 500
Sanitation 64 540 14 519 13 505 -8% 378%
Tipper Truck (HP) 500 426 -17% -100%Security & Telemetry pump stations 29 26 -10% -100%Power Rodder 51 51 0% -100%Mamello Bulk Sewer servitute 50 50 42 -18% 18%Upgrade of sanitation Sicelo and Informal 3 000 2 690 2 675 -1% 12%Crane for Crane Truck 200 240 209 -15% -4%Drilling machine 400 400Rothdene Operator House 40Handheld Compactor 50 50 37Upgrade Sewer Pump Stations & Rising Mains 500Sewer connections and extentions 500 500 431 -16% 16%Upgrade of sewers Sicelo (MIG) 6 000 8 500 8 500 0% -29%Extention to Daleside Sewer (MIG) 3 000 400 400 0% 650%Mamello Bulk Sewer (MIG) 300 300 300 0% 0%Debottlenecking Meyerton Waste Water Treatment Works 500 810 407 -99% 23%Expansion of Meyerton Waste Water Treatment Works (RBIG) 50 000
Electricity 29 084 23 190 20 717 -12% 40%
Sicelo bulk network (erf 78 to 204) 3 000 2 000 1 540 -30% 95%Sicelo reticulation network (erf 204) 6 000 3 500 3 401 -3% 76%Crane truck (hp) 750 959 959 0% -22%Streetlights de deurStreet lights hok 1 000 638 -57% -100%1 x land cruiser (hp) 487 487 0% -100%Streetlights daleside 489 476 -3% -100%Cable fault detector 90 69 69 0% 30%Installation of auto re-closers 900 750 570 -32% 58%Purchase of ground under the kookfontein 300 300Upgrade of ablutions facilities - elec w 100 100 98 -2% 2%Quality supply instruments nersa 700 700 586 -19% 19%Aircons new 24 16 16 0% 48%2 x new half ton ldv's (replacement) 320 320 295 -9% 9%Sandrivier upgrade cables to improve vol 900 900 578 -56% 56%Streetlights de deur 1 600 1 436 -11% -100%Rissiville substation (bulk contribution 9 000 1 000 637 -57% 1313%Energy efficiency (Eedsmg) 7 000 9 000 8 931 -1% -22%
Capital Programme by Project: 2013/14R' 000

Midvaal Local Municipality | APPENDICES 253
Capital Project Original Budget
Adjustment Budget
Actual Variance (Act - Adj)
%
Variance (Act - OB) %
Waste Management Services 1 810 3 250 3 158 -3% -43%
1 X Tipper Truck (Hp) 1 500 1 077 1 077 0% 39%1 X New Compactor (Hp) 1 873 1 873 0% -100%1 X Ldv 250 250 198 -27% 27%Security System (Galloway/Kliprivier) 60 50 10 -390% 490%
Roads 22 658 21 965 16 004 -37% 42%
Henley Weir Pedestrian Bridge 1 000Upgrade Intersections 4 500 1 500 868 -73% 418%Upgrade Jan Neethling Street 4 000 6 000 2 686 -123% 49%Upgrade Gravel Roads 5 000 2 0001 4x4 Tlb Case (Hp) 900 865 865 0% 4%Upgrader Of Jan Neethling Str (Ltl) 3 246 3 245 0% -100%Purchase Of Erf 1009 Hok 247 247 0% -100%Bomac Roller With Trailer 200 200 190 -5% 5%Gravel To Tar Phase 4 (Mig) 4 058 7 508 7 504 0% -46%Henley Weir Pedestrian Bridge (Mig) 3 000Mamelo Access Road (Mig) 400 399 0% -100%
Mechanical Workshop 368 373 329 -13% 12%
New Vehicles 131/2inch Drive Heavy Duty Sockets 5 4 4 0% 16%1inch Drive Heavy Duty Sockets 13 11 11 0% 24%1inch Drive T-Bar 8 8 8 0% 3%4inch Vices 6 6 6 0% 8%4 X Work Benches + Cupboards 35 35 17 -107% 107%4 X Toolboxs ( Complete ) 70 52 52 0% 35%Torgue Wrench 140 - 760 Nm 18 12 12 0% 55%Tressels 20 17 17 0% 16%1 X 2 Post Lift 45 31 31 0% 44%Area Camera's 30 30 30 0% 2%Co2 Welder 20 8 8 -10% 164%Office Divider 10 10Workshop Roof Extention 35 70 68 -3% -49%Tyre Store 50 65 65 -1% -23%Large Grinder 3 2 2 0% 19%
Planning 38 36 36 0% 4%
Computer replacements 38 36 36 0% 4%
Libraries 5 150 5 450 5 123 -6% 1%
Lakeside Library (Mig) 5 050 5 350 4 826 -11% 5%Furniture & Equipment (Dsrac) 100 100 87 -14% 14%Library books 210
Cemetries 1 250 750 729 -3% 71%
Extension of Kookrus Cemetry 1 250 750 729 -3% 71%
Social Admin 200 183 183 0% 9%
Sosial Admin: 1 x LDV Replacement 200 183 183 0% 9%

Midvaal Local Municipality | APPENDICES 254
Capital Project Original Budget
Adjustment Budget
Actual Variance (Act - Adj)
%
Variance (Act - OB) %
Parks 1 159 1 384 1 290 -7% -10%
2 X Large Chainsaws 30 26 26 0% 17%1 X 2.0 Ldv 220 217 217 0% 1%1 X Linemarker 15 12 12 0% 24%4 X Slashers 154 154 112 -38% 38%1 X 3 Ton Trucks With Canopy (Hp) 440 380 328 -16% 34%1 X Tractors (Hp) 300 245 245 0% 22%1 3 Ton Truck With Canopy(Hp) 351 351 0% -100%
Fire 1 987 1 351 1 207 -12% 65%
1 X Toyota Land Cruiser Grassfire Vehicl 550 440 439 0% 25%1 X Land Cruiser 424 424 0% -100%2 X Containers For Training Area (Simula 70 70 51 -37% 37%5x Fire Trailers 125 125 125 0% 0%Fire Ball From Verifire Cc 100 10018 Inch Ppv Monitor 28 17 15 -14% 92%Blitzfire Oscillating Portable Monitor 35 46 41 -15% -14%Upgrading Of Cctv (Ups-15kva 15 Mins) 48 51 50 -1% -4%Upgrading Of Cctv (Ups-10kva 15 Mins) 31 29 25 -15% 25%Fire Station Vaal Marina (Mig) 1 000 50 39 -30% 2494%
Sport 3 000 3 250 3 054 -6% -2%
Sicelo Football Field (MIG) 1 000 1 750 1 750 0% -43%Lakeside Sport Centre (MIG) 2 000 1 500 1 304 -15% 53%
Executive and Council 300 560 550 -2% -45%
Lights 101 X Vehicle 270 270 0% -100%1 X Sedan Vehicle 300 280 280 0% 7%
Finance 118 216 214 -1% -45%
Scm: Office Furniture (New Vacancies) 60 60 59 -1% 1%Scm: Stores Upgrade 100 99 -1% -100%Scm: Computers (Replacements) (Fmg) 30 30 30 0% 0%Scm: Computers (New Vacancies) (Fmg) 20 20 20 0% 0%Scm: Recording System (Fmg) 8 6 6 0% 40%
HR 30 143 135 -6% -78%
Building Renovations 115 111 -4% -100%1 X Laptop 10 8 8 0% 23%1 X Printer (Payday Reports) 20 20 16 -26% 26%
ICT 450 640 632 -1% -29%
Network retain & reload" testing equipment 50Servers for operational services 100Network switches 50 38 38 0% 32%Network infrastructure 250 602 594 -1% -58%
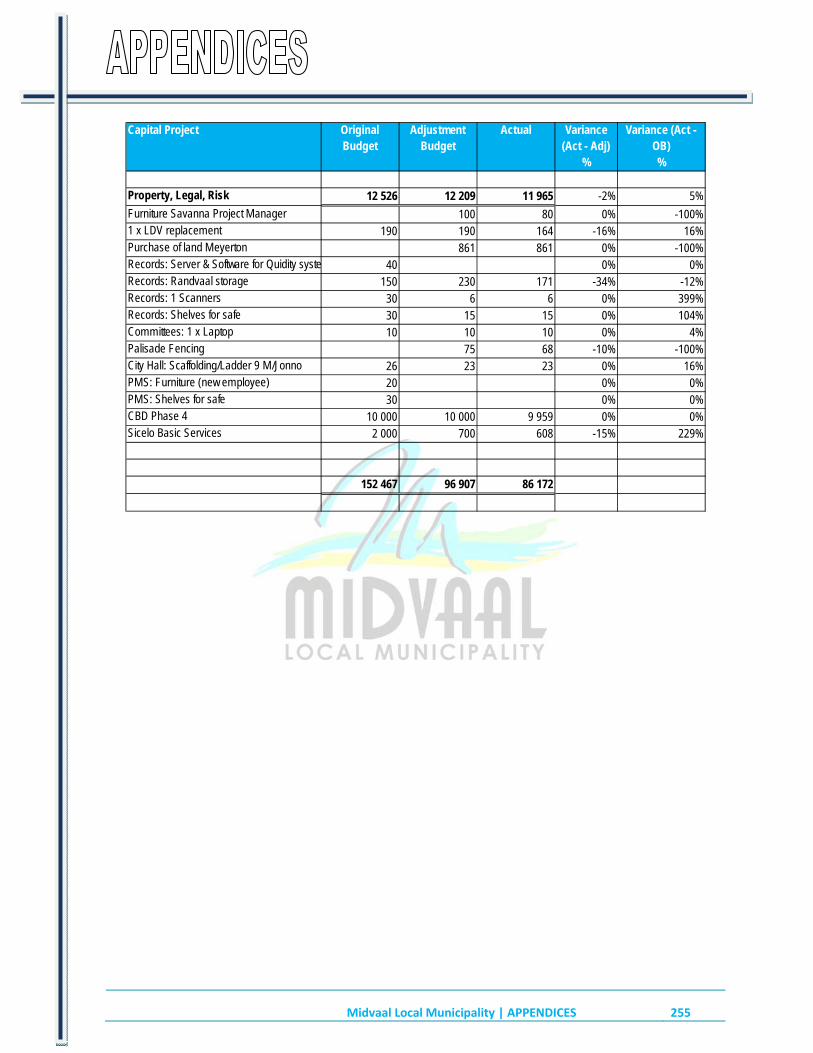
Midvaal Local Municipality | APPENDICES 255
Capital Project Original Budget
Adjustment Budget
Actual Variance (Act - Adj)
%
Variance (Act - OB) %
Property, Legal, Risk 12 526 12 209 11 965 -2% 5%
Furniture Savanna Project Manager 100 80 0% -100%1 x LDV replacement 190 190 164 -16% 16%Purchase of land Meyerton 861 861 0% -100%Records: Server & Software for Quidity syste 40 0% 0%Records: Randvaal storage 150 230 171 -34% -12%Records: 1 Scanners 30 6 6 0% 399%Records: Shelves for safe 30 15 15 0% 104%Committees: 1 x Laptop 10 10 10 0% 4%Palisade Fencing 75 68 -10% -100%City Hall: Scaffolding/Ladder 9 M/Jonno 26 23 23 0% 16%PMS: Furniture (new employee) 20 0% 0%PMS: Shelves for safe 30 0% 0%CBD Phase 4 10 000 10 000 9 959 0% 0%Sicelo Basic Services 2 000 700 608 -15% 229%
152 467 96 907 86 172

Midvaal Local Municipality | APPENDICES 256
APPENDIX O – CAPITAL PROGRAMME BY PROJECT BY WARD 2013/14
Capital Project Ward(s) affected Works completed (Yes/No)
Water
Mamello Bulk Water (MIG) 1 No
Sicello/Highbury Reservior & Mains (Loan & CRR) 4, 5, 8 & 10 No
Sicello/Highbury Reservior & Mains (MIG) 4, 5, 8 & 10 No
Water services development plan All No
Water meter Revenue Programme All No
Sanitation/Sewerage
Expansion of Meyerton WWTW (RIBIG) 3, 4, 5, 8, 9, 10, 11, 13 & 14 No
Debottlenecking Meyerton WWTW (MIG) 3, 4, 5, 8, 9, 10, 11, 13 & 14 No
Debottlenecking Meyerton WWTW (CRR) 3, 4, 5, 8, 9, 10, 11, 13 & 14 Yes
Mamello Bulk Sewer 1 No
Upgrading of Sewer Main 3, 4, 5, 8, 9, 10, 11, 13 & 14 No
Sicelo Sanitation 8 & 10 No
Electricity
Sicelo Bulk Network (Erf 78 to 204) 10
Sicelo Reticulation Network (Erf 204) 10
Streetlights - Daleside (Rollover) 5
Streetlights in De Deur 11
Streetlights Henley on Klip 4
Housing
Refuse removal
Roads and Stormwater
Gravel to Tar Phase 4 (MIG) 5,6,8,10,11 No
Upgrade Intersections 14 No
Upgrade Jan Neethling Street 13 No
Upgrade Gravel Roads 1 No
Upgrade of Jan Neethligh Street (TLT) (Rollover) 13 No
Mamelo Access Road (MIG) 1, 11 No
CBD Phase 4 9 Yes
Economic development
Sports, Arts & Culture
Sicelo Football field (MIG) 10 No
Lakeside Sport Centre (MIG) 6 No
Environment
Health
Safety and Security
Fire Station Vaal Marina 1 No
ICT and Other
Tyre store Yes
City Hall floor Yes
Sicelo basic services No
Palisade fencing (Rollover) Yes
Records: Randvaal storage 5 No
Workshop roof extention 10 Yes
Lakeside Library 6 Yes
Extension of Kookrus Cemetery 3 Yes
Capital Programme by Project by Ward: 2013/14
R' 000
T O

Midvaal Local Municipality | APPENDICES 257
APPENDIX P – SERVICE CONNECTION BACKLOGS AT SCHOOLS AND CLINICS
Establishments lacking basic services Water Sanitation Electricity Solid Waste Collection
Schools (NAMES, LOCATIONS)
Kudung, near Karan Beef Heidelberg No No No
Daleside Yes No No
Clinics (NAMES, LOCATIONS)
T P
Service Backlogs: Schools and Clinics
Names and locations of schools and clinics lacking one or more services. Use 'x' to mark lack of service at appropriate level for the number of people attending the school/clinic, allowing for the proper functioning of the establishment concerned.

Midvaal Local Municipality | APPENDICES 258
APPENDIX Q – SERVICE BACKLOGS EXPERIENCED BY THE COMMUNITY WHERE ANOTHER SPHERE OF GOVERNMENT IS RESPONSIBLE FOR SERVICE PROVISION
Services and Locations Scale of backlogs Impact of backlogs
Clinics:
new clinics, upgrading of clinincs, mobile clinics, upgrading of mobile to permanent Clinics
The need for upgrading and/or providing of clinics has been reported in wards 1, 4, 5, 6, 8, 10,11,12 and 13
There is a direct link between thehousing backlogs and need for clinics. The majority of wards that included one or more formal towns did not express a need for a clinic, whereas the majority of wards that had housing backlogs and'or informal settlements also indicated the need for either mobile clinics, upgraded clinics or new formal clinics.
Housing:
Community housing needs expressed correlated with the housing backlog as recorded by Council
The reported housing backlog excluding "shack-farming" is reported to be +/- 3000 units, located in Sicelos, Phiels farm, Boitumelo and Mammelo
The eradication of the housing backlog is being delayed due to budget constraints, inadequit access to bulk infrastructure, unfavourable soil conditions, unwillingness by the community to be relocated to more favourable conditions and the high number of people that does not qualify for government housing assistance
Licencing and Testing Centre: No backlog reported by the community
Reservoirs
When reservoirs are expressed as a community need, it can often refer to a need for internal reticulation, provision of link infrastructure, or pumping mains
The Midvaal has commissioned several new resevoirs in recent years including the Vaal Marina and Graceview reservoirs
Shortages exist that will need to be addressed. the challenge however is the need to improve service delivery through the upgrading of the multiple aspects of the entire water supply network, not only reservoirs
Schools (Primary and High):
Schools also include specialist schooling facilities such as Early Childhood development centres, schools and youth development centres
As with clinics a direct correlation exist between the proclamation status of the settlement and its accessibility to educational facilities.
The provision of ECD facilities in informal settlements, as with schools is hampered by the regulatory requirements pertaining to township establishment. It is the anticipation that these services would be delivered as and when the formalization is adressed and issues bertainig to land management could
Sports Fields:
A demand exist for a variety of sport and recreational facilities. It is mostly the newer settlements and more remote communities that has the biggest demand for these facilities, as most of the existing facilities are located in the bigger towns and nodes.
Recreational facilities play an integral part in building vibrant healthy communities. It creates a healthy platform for communuties to interact and build new relationships and children to develop physical and inter-personal skills, linked to sound values.
The lack in the development and maintanance, of new sport and recreational facilities, is as much a product of budgeterry constraints as that is of inefficient community initiative. This is exaggerated by the lack of access to suitable land.
T Q
Service Backlogs Experienced by the Commmunity where another Sphere of Government is the Service Provider
(where the municipality whether or not act on agency basis)

Midvaal Local Municipality | APPENDICES 259
APPENDIX R – DECLARATION OF LOANS AND GRANTS MADE BY THE MUNICIPALITY
All Organisation or Person in receipt of Loans */Grants* provided
by the municipality
Nature of project Conditions attached to funding
Value Year 13/14
R' 000
Total Amount committed over
previous and future years
Eskom supplied consumers in the Midvaal Local Municipality area Free basic electricity Must be an approved indigent 17 n/a
T R
Declaration of Loans and Grants made by the municipality: Year 2013/14
* Loans/Grants - whether in cash or in kind

Midvaal Local Municipality | APPENDICES 260
APPENDIX S – NATIONAL AND PROVINCIAL OUTCOMES FOR LOCAL GOVERNMENT
Outcome/Output Progress to date Number or Percentage Achieved
Output: Improving access to basic servicesOngoing projects to upgrade gravel roads to paved / tarr roads. Upgrading of Bulk outfall sewers. Planning and design of the expansion of the waste water treatment works and bulk water supply. All of these projects will improve in the long run. Unknown
Output: Implementation of the Community Work Programme
The project has been implemented in Midvaal Local Municipality in Wards 1, 6, 8 and 10 The programme has created a total of 1102 jobs within Midvaal LM of which 37 peole with Disability and 572 youth formed part of the programme. 100%
Output: Deepen democracy through a refined Ward Committee model
Note: The complete information is reflected in Chapter 2 par 2.4. The essence is that ward committees have been established in all 14 wards and all such committees are functional.
Output: Administrative and financial capability
The Council is fully operational and is chaired by a full-time Speaker. It has an independent Audit Committee. A Municipal Public Accounts Committee (MPAC) has been established and is chaired by a memer of the official opposition party in Council to enhance the credibility of the oversight function. The Executive Mayor is assisted by five full-time Members of the Mayoral Committee. The administration is headed by the Municipal Manager and seven Heads of Department. There are no vacancies in these key designations, other than one vacancy in the membership of the Audit and Performance Committee. This single vacancy is currently in the process of being filled. There are no pending suspensions or disciplinary process against any executive member. There is 100% compliance in respect of the MFMA requirements relating to Section 52 (d) reportss, Mid-year Section 72 reports, Monthly Section 71 reports and quarterly performance reports.
National and Provincial Outcomes for Local Government
* Note: Some of the outputs detailed on this table might have been reported for in other chapters, the information thereof should correspond with previously reported information.
T S

Midvaal Local Municipality | APPENDICES 261
APPENDIX T

Midvaal Local Municipality | APPENDICES 262
Midvaal Local Municipality | APPENDICES 263

Midvaal Local Municipality | APPENDICES 264

Midvaal Local Municipality | APPENDICES 265

Midvaal Local Municipality | APPENDICES 266
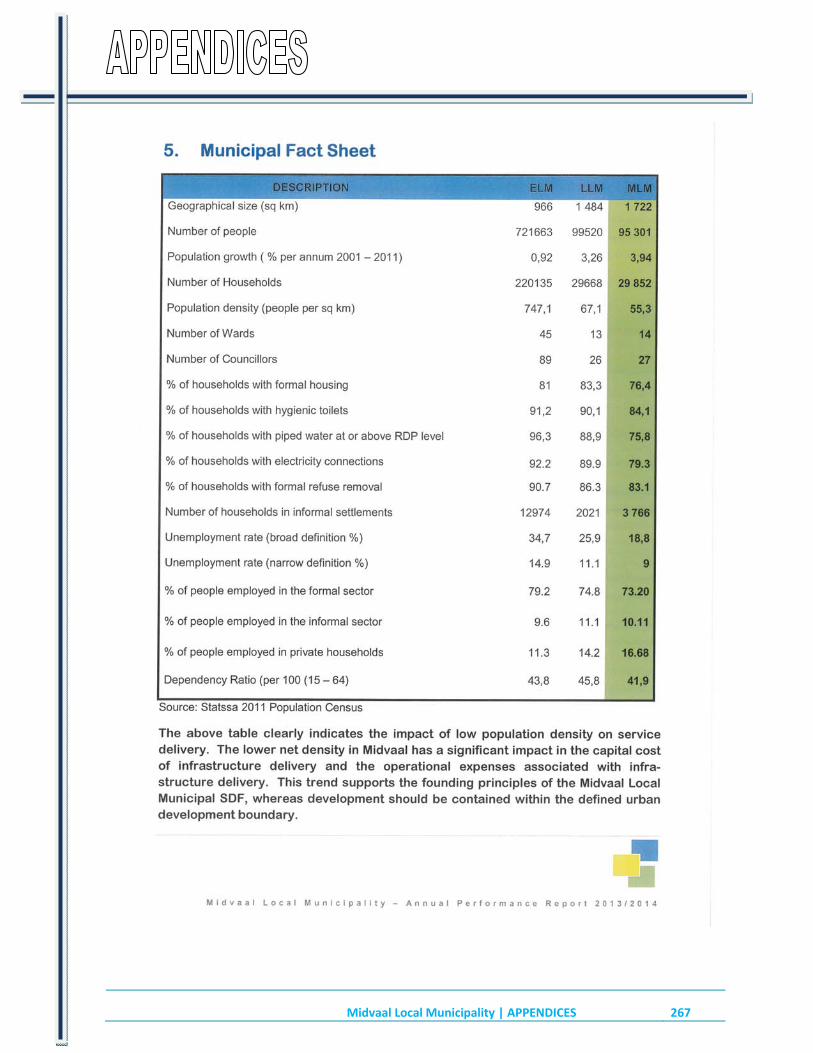
Midvaal Local Municipality | APPENDICES 267
Midvaal Local Municipality | APPENDICES 268
Midvaal Local Municipality | APPENDICES 269

Midvaal Local Municipality | APPENDICES 270

Midvaal Local Municipality | APPENDICES 271

Midvaal Local Municipality | APPENDICES 272
Midvaal Local Municipality | APPENDICES 273

Midvaal Local Municipality | APPENDICES 274

Midvaal Local Municipality | APPENDICES 275

Midvaal Local Municipality | APPENDICES 276

Midvaal Local Municipality | APPENDICES 277

Midvaal Local Municipality | APPENDICES 278

Midvaal Local Municipality | APPENDICES 279

Midvaal Local Municipality | APPENDICES 280
Midvaal Local Municipality | APPENDICES 281

Midvaal Local Municipality | APPENDICES 282
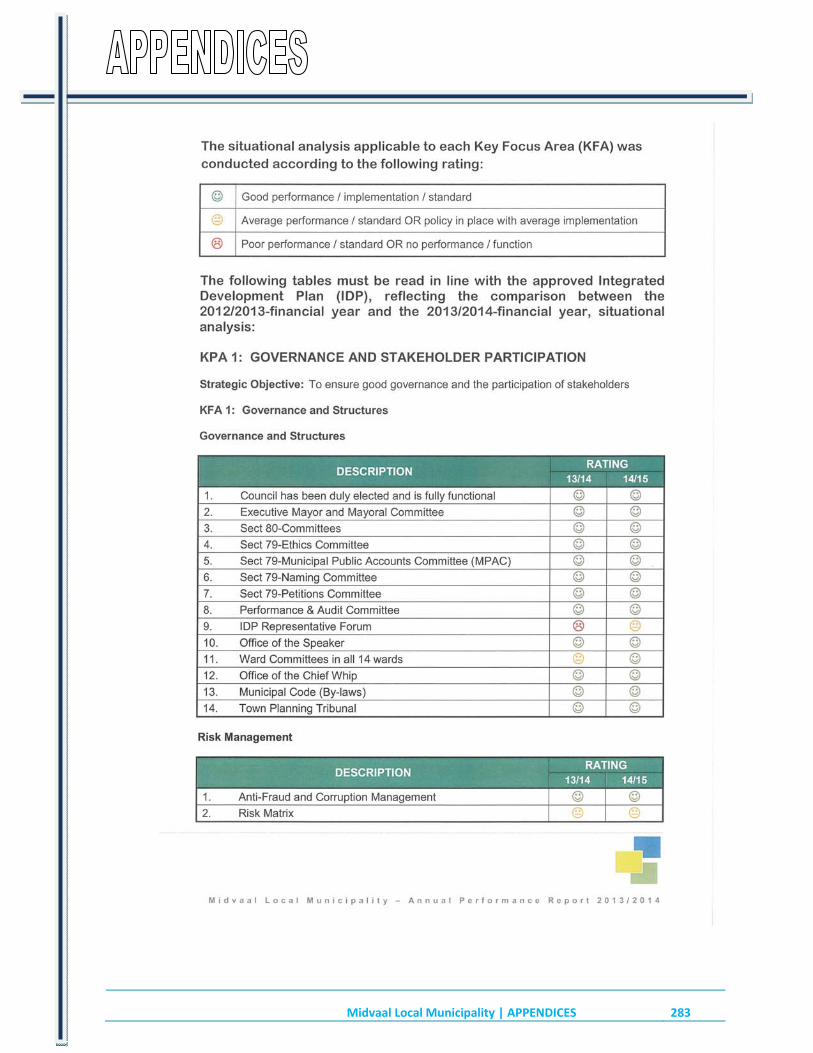
Midvaal Local Municipality | APPENDICES 283

Midvaal Local Municipality | APPENDICES 284

Midvaal Local Municipality | APPENDICES 285

Midvaal Local Municipality | APPENDICES 286

Midvaal Local Municipality | APPENDICES 287

Midvaal Local Municipality | APPENDICES 288

Midvaal Local Municipality | APPENDICES 289
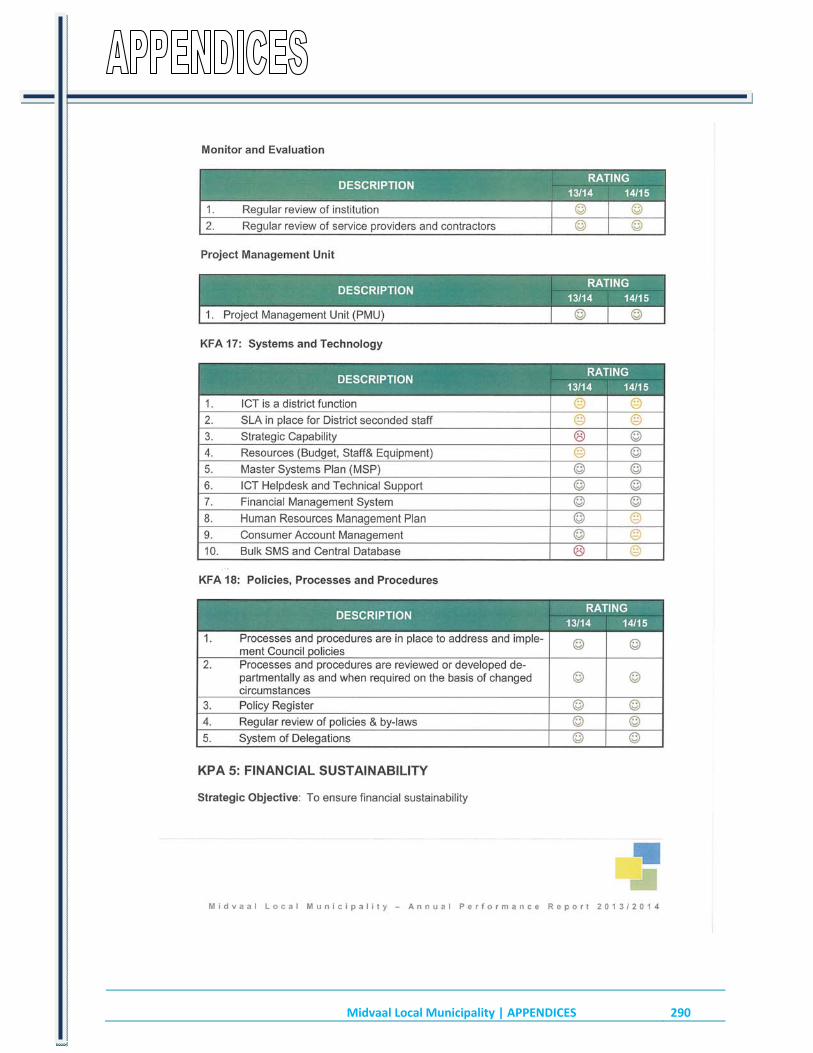
Midvaal Local Municipality | APPENDICES 290

Midvaal Local Municipality | APPENDICES 291

Midvaal Local Municipality | APPENDICES 292

Midvaal Local Municipality | APPENDICES 293

Midvaal Local Municipality | APPENDICES 294

Midvaal Local Municipality | APPENDICES 295

Midvaal Local Municipality | APPENDICES 296

Midvaal Local Municipality | APPENDICES 297

Midvaal Local Municipality | APPENDICES 298

Midvaal Local Municipality | APPENDICES 299

Midvaal Local Municipality | APPENDICES 300

Midvaal Local Municipality | APPENDICES 301

Midvaal Local Municipality | APPENDICES 302
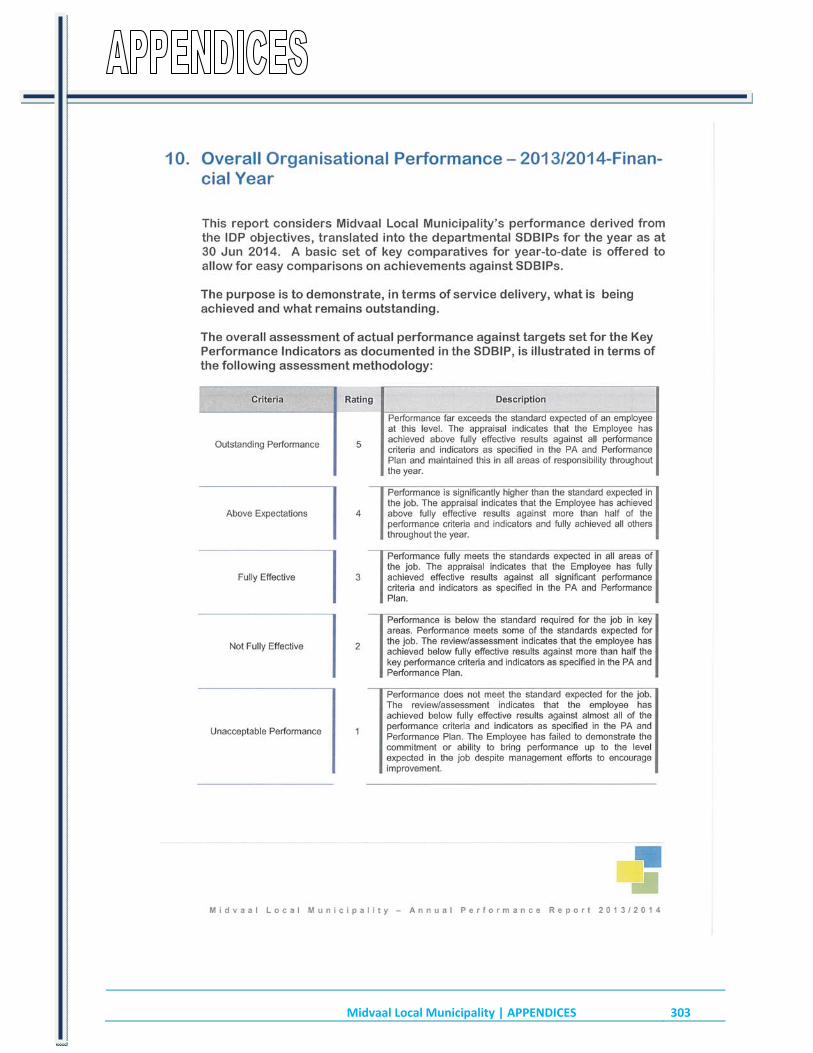
Midvaal Local Municipality | APPENDICES 303

Midvaal Local Municipality | APPENDICES 304

Midvaal Local Municipality | APPENDICES 305

Midvaal Local Municipality | APPENDICES 306
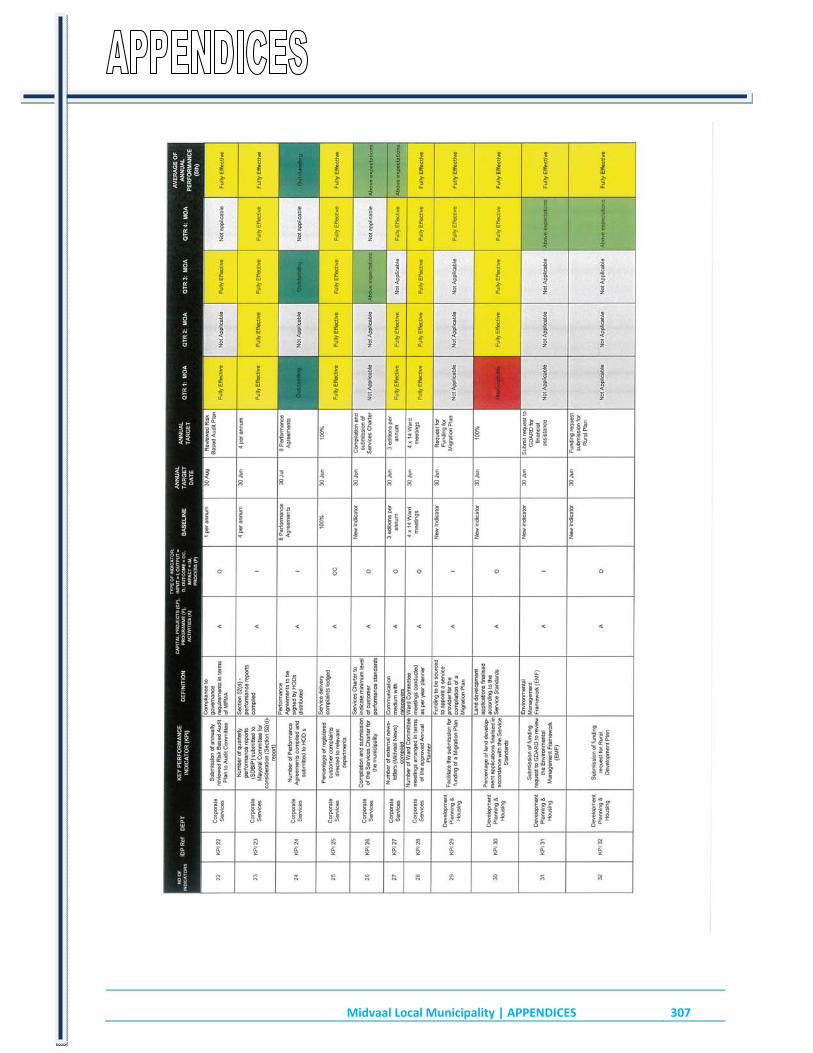
Midvaal Local Municipality | APPENDICES 307
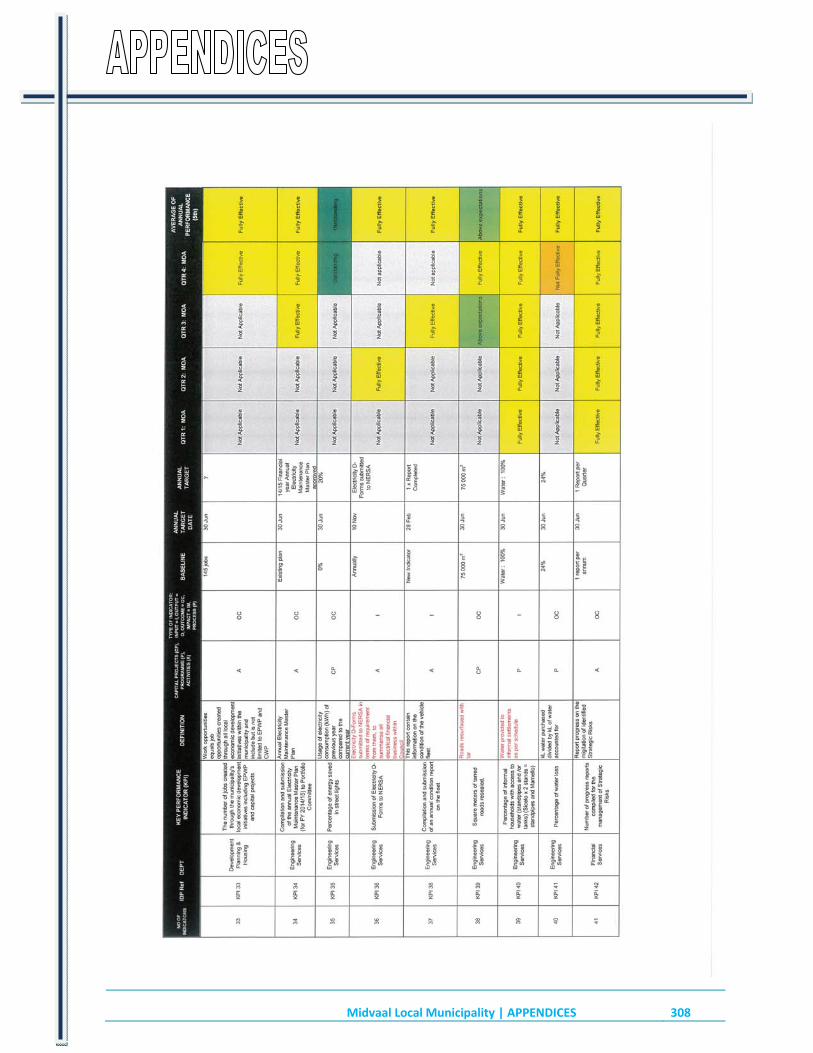
Midvaal Local Municipality | APPENDICES 308

Midvaal Local Municipality | APPENDICES 309
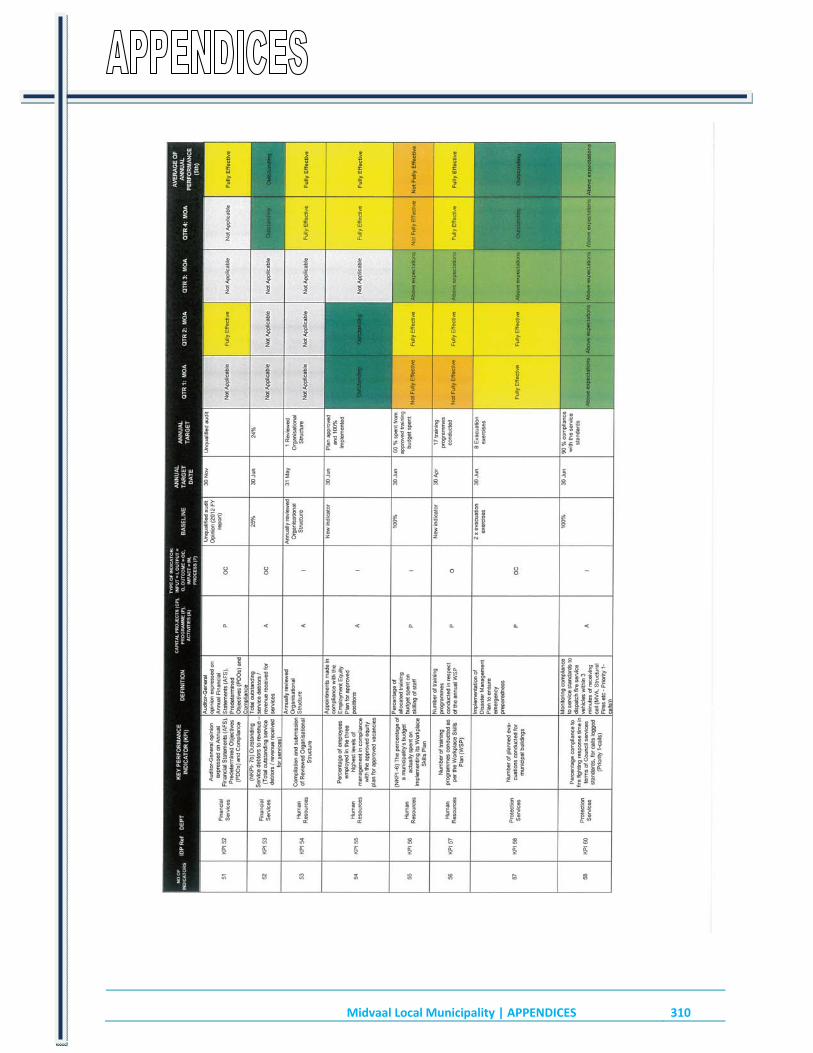
Midvaal Local Municipality | APPENDICES 310

Midvaal Local Municipality | APPENDICES 311

Midvaal Local Municipality | APPENDICES 312
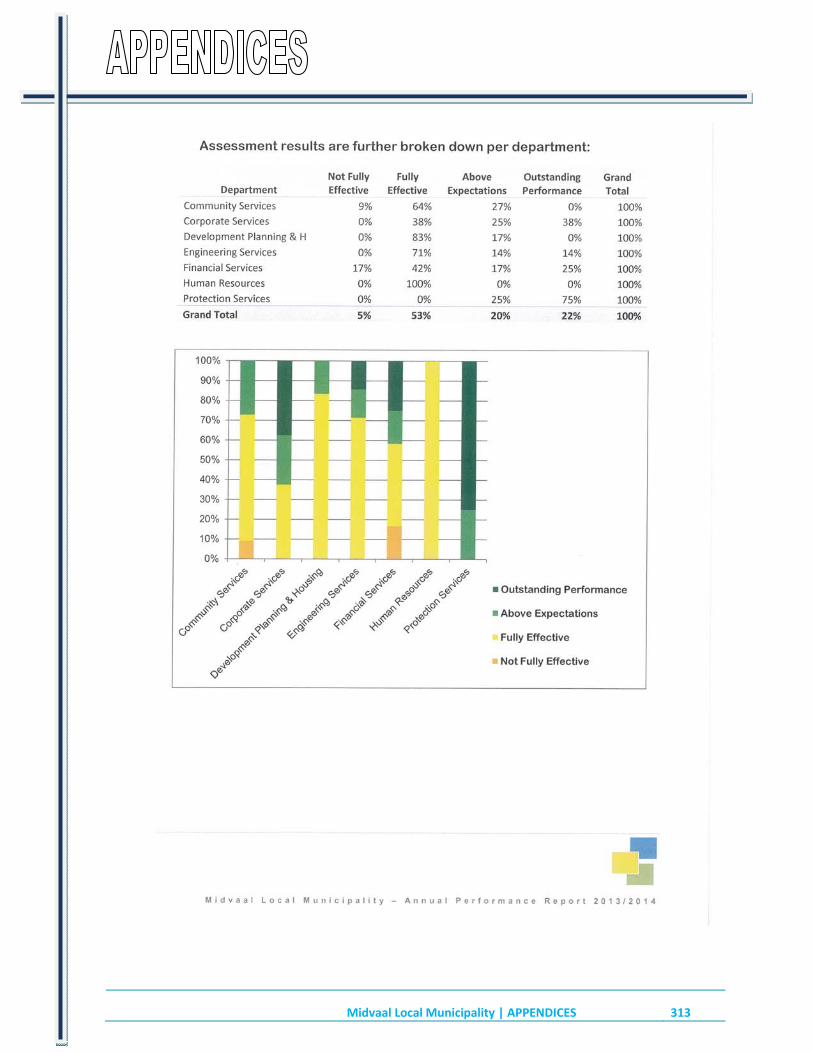
Midvaal Local Municipality | APPENDICES 313
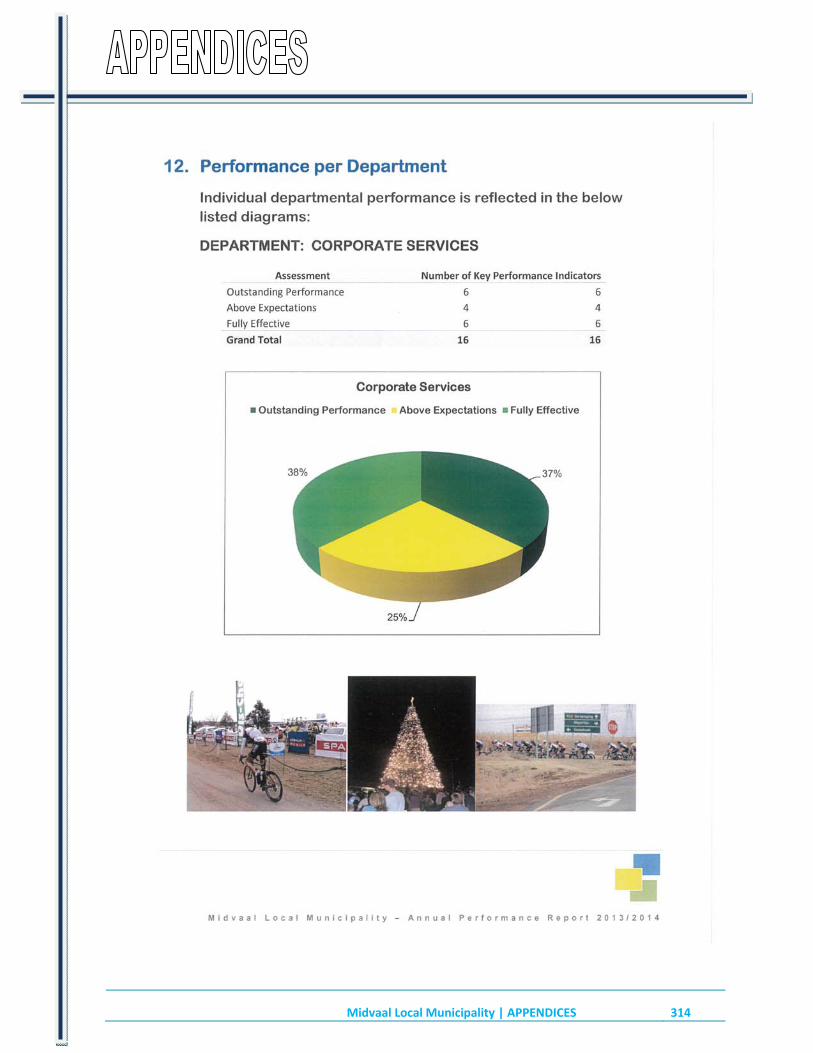
Midvaal Local Municipality | APPENDICES 314

Midvaal Local Municipality | APPENDICES 315

Midvaal Local Municipality | APPENDICES 316

Midvaal Local Municipality | APPENDICES 317
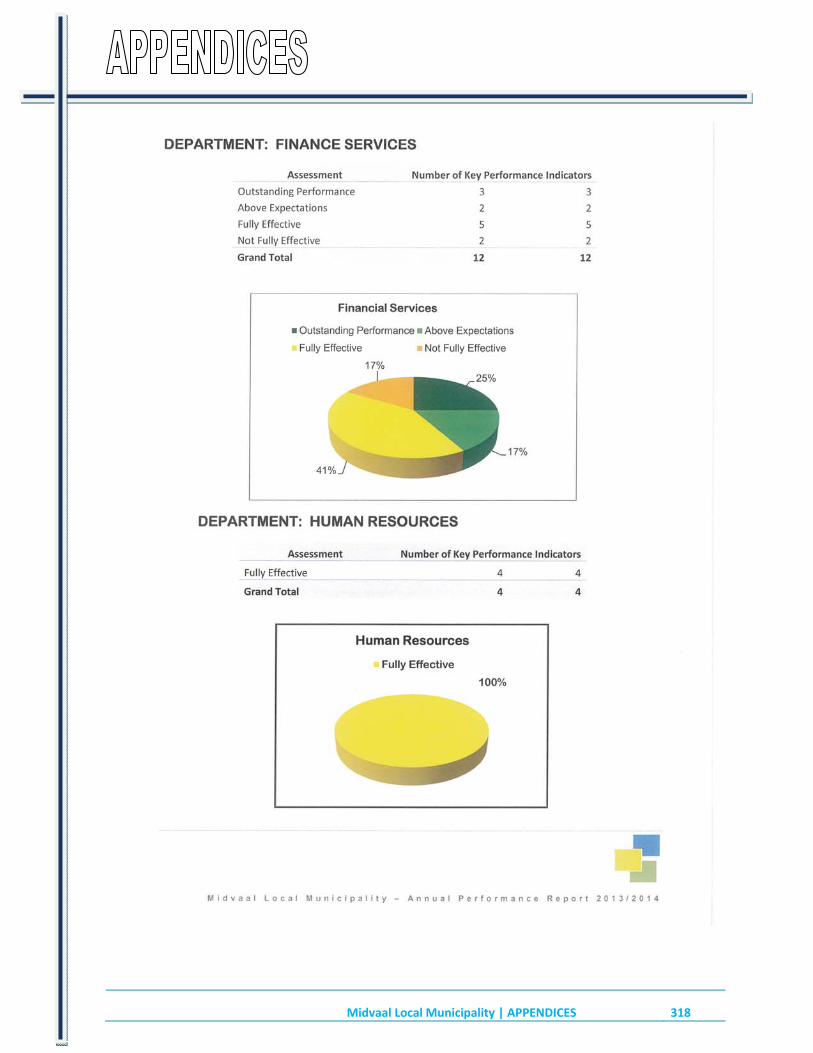
Midvaal Local Municipality | APPENDICES 318

Midvaal Local Municipality | APPENDICES 319

Midvaal Local Municipality | APPENDICES 320

Midvaal Local Municipality | APPENDICES 321

Midvaal Local Municipality | APPENDICES 322

Midvaal Local Municipality | APPENDICES 323

Midvaal Local Municipality | APPENDICES 324

Midvaal Local Municipality | APPENDICES 325

Midvaal Local Municipality | APPENDICES 326

Midvaal Local Municipality | APPENDICES 327

Midvaal Local Municipality | APPENDICES 328

Midvaal Local Municipality | APPENDICES 329
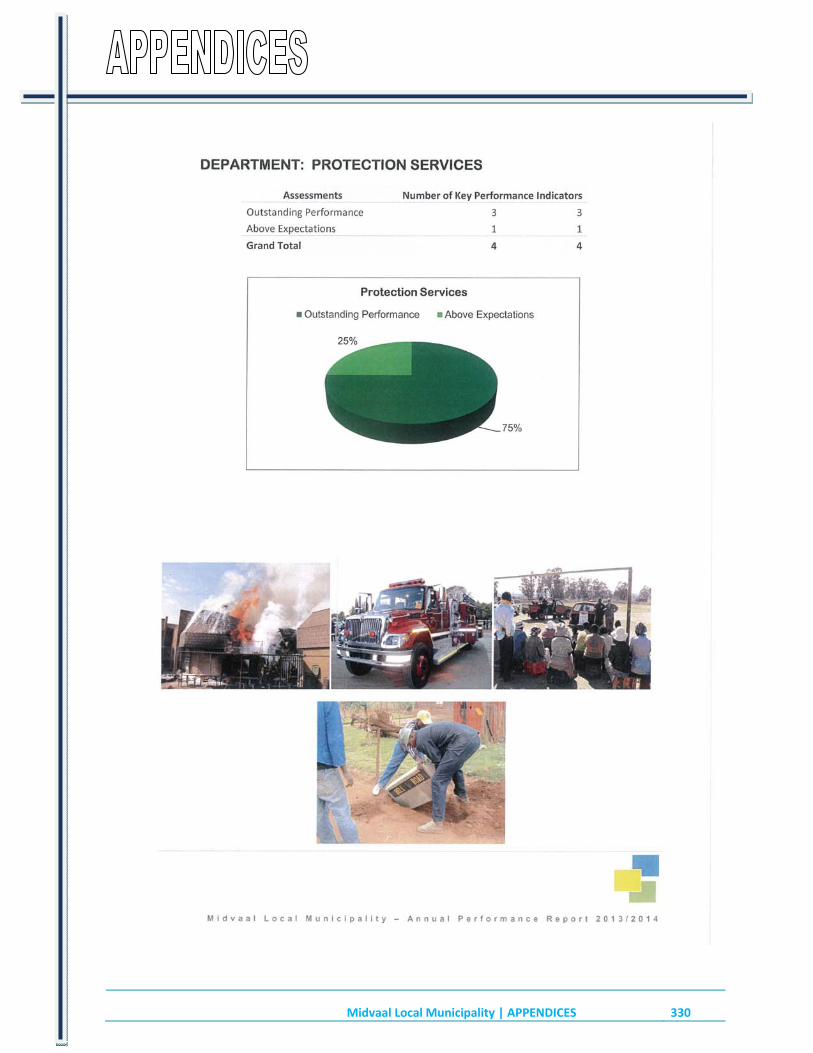
Midvaal Local Municipality | APPENDICES 330

Midvaal Local Municipality | APPENDICES 331

Midvaal Local Municipality | APPENDICES 332

Midvaal Local Municipality | APPENDICES 333

Midvaal Local Municipality | APPENDICES 334
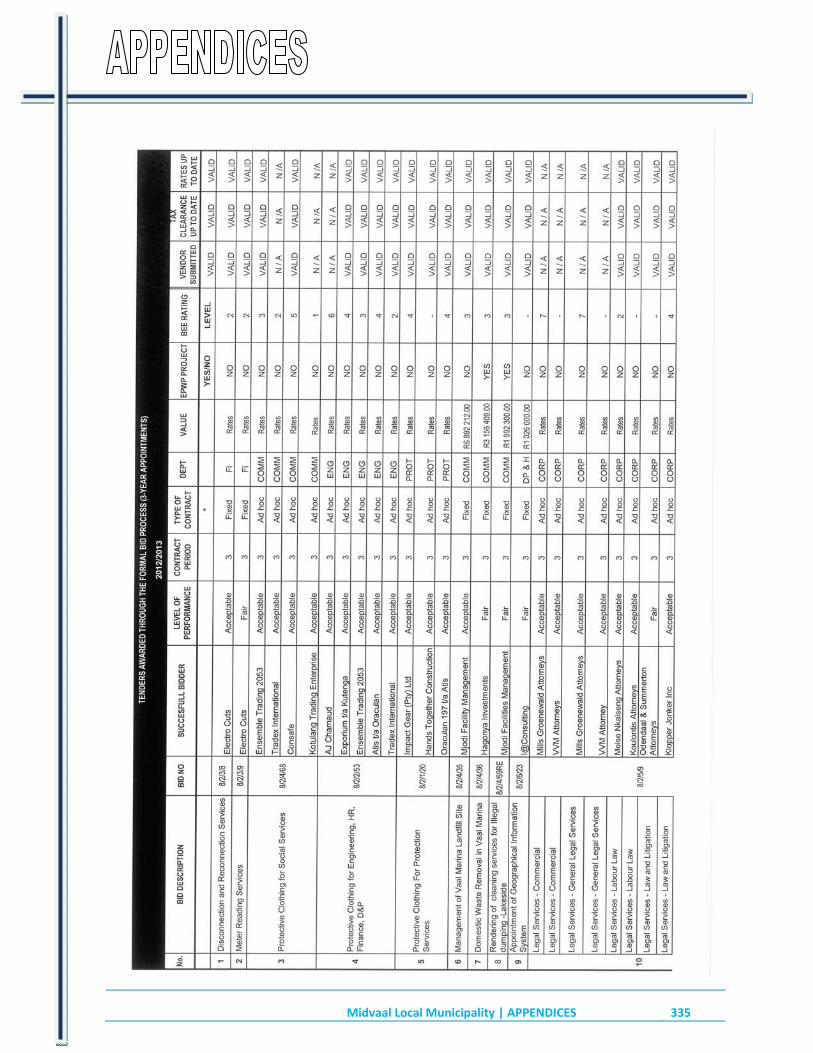
Midvaal Local Municipality | APPENDICES 335

Midvaal Local Municipality | APPENDICES 336

Midvaal Local Municipality | APPENDICES 337

Midvaal Local Municipality | APPENDICES 338

Midvaal Local Municipality | APPENDICES 339

Midvaal Local Municipality | APPENDICES 340

Midvaal Local Municipality | APPENDICES 341

Midvaal Local Municipality | APPENDICES 342

Midvaal Local Municipality | APPENDICES 343

Midvaal Local Municipality | APPENDICES 344
VOLUME II: ANNUAL FINANCIAL STATEMENTS

Midvaal Local MunicipalityAnnual Financial Statements
for the year ended 30 June 2014Auditor-General

Midvaal Local Municipality(Registration number GT 422)Annual Financial Statements for the year ended 30 June 2014
General Information
Legal form of entity Municipality
Municipal demarcation code - GT 422 - Governed by the MFMA (No.56 of 2003)
Mayoral committee
Executive Mayor B. Baloyi
Councillors Speaker:
F.W. Peters (From may 2014 to June 2014)
A.R. Mclouglin (From July 2013 to June 2014)
Chief Whip:
P. C. Pretorius (From May 2014 to June 2014)
D.R. Ryder (From July 2013 to June 2014)
Mayoral Committee:
S.Nkhi - Development Planning and Housing (From May 2014 to June2014)
F. Peters - Development Planning and Housing (From August 2013 toMay 2014)
P.D. Pretorius - Finance and Corporate Services
D. Ryder - Engineering Services (From May 2014 to June 2014)
M.S. Hack - Engineering Services (From July 2013 to May 2014)
R.F. Jones - Social Services (From May 2014 to June 2014)
C.P. Hartman - Social Services (From July 2013 to May 2014)
Councillors:
W.F De Agrella
M.S. Schoeman
L.S. Parsonson
M.L. Modiokeng
M.S. Hack
M.M. Ndebele
C.P. Hartman
M.Z.P. Boland
S.E. Hlengwa
I.M. Matsose
A.J. Van Tonder
L.S. Botsoere
M.M. Magagula
T.S. Maphalla
H.J. Mokoena
M.G.I. Ngcobo
F. Peters
C.G. Pypers
M.M. Radebe
P. Ramushu
Grading of local authority Grade 3 Local Municipality
Accounting Officer A.S.A. De Klerk
Chief Finance Officer (CFO) A.L. Van Schalkwyk
Registered office Civic Centre
C/O Junius & Mitchell Streets
1
Midvaal Local Municipality(Registration number GT 422)Annual Financial Statements for the year ended 30 June 2014
General Information
Meyerton
1960
Postal address P O Box 9
Meyerton
Gauteng
1960
Bankers ABSA Bank Limited
Auditors Auditor-General
Attorneys Meise Nkaiseng Inc / Odendaal & Summerton Inc / Klopper Jonker Inc
Poswa Inc / Koulountis Inc / Mills Inc / Van de Venter Mojapelo Inc /Malherbe, Rigg & Ranwell
2

Midvaal Local Municipality(Registration number GT 422)Annual Financial Statements for the year ended 30 June 2014
Index
The reports and statements set out below comprise the annual financial statements presented to the Council:
Index Page
Accounting Officer's Responsibilities and Approval 4
Statement of Financial Position 5
Statement of Financial Performance 6
Statement of Changes in Net Assets 7
Cash Flow Statement 8
Statement of Comparison of Budget and Actual Amounts 9 - 13
Accounting Policies 14
Notes to the Annual Financial Statements 32 - 60
Appendixes:
Appendix A: Disclosure of Grants and Subsidies in terms of the Municipal FinanceManagement Act
61
Abbreviations
DBSA Development Bank of South Africa
GRAP Generally Recognised Accounting Practice
MFMA Municipal Finance Management Act
MIG Municipal Infrastructure Grant
MLM Midvaal Local Municipality
SALGA South Afriacan Local Government Association
SAPS South Africa Police Services
3

Midvaal Local Municipality(Registration number GT 422)Annual Financial Statements for the year ended 30 June 2014
Accounting Officer's Responsibilities and Approval
The accounting officer is required by the Municipal Finance Management Act (Act 56 of 2003), to maintain adequateaccounting records and is responsible for the content and integrity of the annual financial statements and related financialinformation included in this report. It is the responsibility of the accounting officer to ensure that the annual financialstatements fairly present the state of affairs of the municipality as at the end of the financial year and the results of itsoperations and cash flows for the period then ended. The external auditors are engaged to express an independent opinionon the annual financial statements and was given unrestricted access to all financial records and related data.
The annual financial statements have been prepared in accordance with Standards of Generally Recognised AccountingPractice (GRAP) including any interpretations, guidelines and directives issued by the Accounting Standards Board.
The annual financial statements are based upon appropriate accounting policies consistently applied and supported byreasonable and prudent judgements and estimates.
The accounting officer acknowledges that he is ultimately responsible for the system of internal financial control establishedby the municipality and place considerable importance on maintaining a strong control environment. To enable theaccounting officer to meet these responsibilities, the accounting officer sets standards for internal control aimed at reducingthe risk of error or deficit in a cost effective manner. The standards include the proper delegation of responsibilities within aclearly defined framework, effective accounting procedures and adequate segregation of duties to ensure an acceptablelevel of risk. These controls are monitored throughout the municipality and all employees are required to maintain the highestethical standards in ensuring the municipality’s business is conducted in a manner that in all reasonable circumstances isabove reproach. The focus of risk management in the municipality is on identifying, assessing, managing and monitoring allknown forms of risk across the municipality. While operating risk cannot be fully eliminated, the municipality endeavours tominimise it by ensuring that appropriate infrastructure, controls, systems and ethical behaviour are applied and managedwithin predetermined procedures and constraints.
The accounting officer is of the opinion, based on the information and explanations given by management, that the system ofinternal control provides reasonable assurance that the financial records may be relied on for the preparation of the annualfinancial statements. However, any system of internal financial control can provide only reasonable, and not absolute,assurance against material misstatement or deficit.
The accounting officer has reviewed the municipality’s cash flow forecast for the year to 30 June 2015 and, in the light of thisreview and the current financial position, he is satisfied that the municipality has or has access to adequate resources tocontinue in operational existence for the foreseeable futur.
The annual financial statements set out on pages 5 to 60, which have been prepared on the going concern basis and wereapproved by the Accounting Officer on 29 August 2014.
A.S.A De KlerkMunicipal Manager - 29 August 2014
4

Midvaal Local Municipality(Registration number GT 422)Annual Financial Statements for the year ended 30 June 2014
Statement of Financial Position as at 30 June 2014Note(s) 2014 2013
Assets
Current Assets
Consumer debtors 3 114 926 707 95 151 227
Cash and cash equivalents 4 91 470 824 40 484 187
VAT receivable 5 8 822 049 6 425 749
Inventories 6 6 841 950 6 499 145
Other receivables from exchange transactions 7 2 498 398 4 432 511
Other receivables from non-exchange transactions 8 2 299 090 1 505 137
226 859 018 154 497 956
Non-Current Assets
Property, plant and equipment 9 2 067 227 722 2 102 550 646
Investment property 10 47 487 000 47 515 000
Intangible assets 11 1 361 431 1 231 000
Heritage assets 12 18 701 18 701
2 116 094 854 2 151 315 347
Total Assets 2 342 953 872 2 305 813 303
Liabilities
Current Liabilities
Trade and other payables from exchange transactions 13 94 289 681 71 517 986
VAT payable - consumer debtors 12 155 928 10 701 587
Consumer deposits 14 10 273 776 9 804 398
External loans 15 8 678 824 8 960 874
Finance lease obligation 16 4 064 002 2 841 369
Provisions 17 426 147 -
129 888 358 103 826 214
Non-Current Liabilities
External loans 15 166 037 087 120 144 593
Provisions 17 37 102 722 41 326 724
Finance lease obligation 16 10 859 806 6 920 797
Long-term liability 39 8 003 642 17 842 082
Employee benefit obligation 18 4 528 000 36 414 000
226 531 257 222 648 196
Total Liabilities 356 419 615 326 474 410
Net Assets 1 986 534 257 1 979 338 893
Accumulated surplus 1 986 534 257 1 979 338 893
5

Midvaal Local Municipality(Registration number GT 422)Annual Financial Statements for the year ended 30 June 2014
Statement of Financial PerformanceNote(s) 2014 2013
Revenue
Service charges 19 421 537 853 377 171 202
Property rates 20 106 157 365 94 353 113
Government grants & subsidies 21 104 564 405 96 206 274
Other income 22 20 249 489 21 935 058
Fines 48 726 013 7 020 166
Interest received - consumer debtors 6 048 615 7 119 810
Interest received - investment 23 4 850 916 2 036 636
Developers contributions 2 663 992 1 679 904
Rental of facilities & equipment 1 142 264 1 329 612
Public contributions and donations 60 114 55 714 394
Total revenue 716 001 026 664 566 169
Expenditure
Bulk purchases 24 (250 231 044) (225 659 653)
Employee related cost 25 (125 997 709) (151 169 694)
Depreciation and amortisation 26 (115 484 153) (109 753 182)
Contracted services 27 (56 015 080) (48 879 520)
General Expenses 28 (45 676 514) (37 308 670)
Repairs and maintenance (30 203 487) (28 675 654)
Debt impairment 29 (57 609 077) (27 322 871)
Finance costs 30 (16 722 328) (16 119 860)
Remuneration of councillors 31 (8 740 935) (7 874 951)
Grants and subsidies paid (1 494 313) (826 351)
Total expenditure (708 174 640) (653 590 406)
Operating surplus 7 826 386 10 975 763
Loss on disposal of assets (631 023) -
Surplus for the year 7 195 363 10 975 763
6

Midvaal Local Municipality(Registration number GT 422)Annual Financial Statements for the year ended 30 June 2014
Statement of Changes in Net AssetsAccumulated
surplusTotal netassets
Opening balance as previously reported 1 976 936 832 1 976 936 832AdjustmentsPrior period errors (8 573 702) (8 573 702)
Balance at 01 July 2012 as restated 1 968 363 130 1 968 363 130Changes in net assetsSurplus for the year 10 975 763 10 975 763
Total changes 10 975 763 10 975 763
Balance at 01 July 2013 1 979 338 894 1 979 338 894Surplus for the year 7 195 363 7 195 363Total changes 7 195 363 7 195 363Balance at 30 June 2014 1 986 534 257 1 986 534 257
7

Midvaal Local Municipality(Registration number GT 422)Annual Financial Statements for the year ended 30 June 2014
Cash Flow StatementNote(s) 2014 2013
Cash flows from operating activities
Receipts
Cash receipts from ratepayers, government and other 255 504 046 224 986 086
Cash receipts from services/charges 377 474 742 374 851 204
Interest income 4 850 916 2 036 636
637 829 704 601 873 926
Payments
Cash paid to employees (134 738 643) (159 044 644)
Cash paid to suppliers and other (399 873 937) (352 858 167)
Finance costs (16 722 328) (13 276 073)
(551 334 908) (525 178 884)
Net cash flows from operating activities 51 86 494 796 76 695 042
Cash flows from investing activities
Purchase of property, plant and equipment 9 (86 171 548) (53 273 637)
Proceeds from sale of property, plant and equipment 9 9 729 743 -
Net cash flows from investing activities (76 441 805) (53 273 637)
Cash flows from financing activities
Increase/(Decrease) in external loans 45 610 444 11 323 387
Increase/(Decrease) in finance leases 5 161 642 (904 861)
Increase/(Decrease) in other long term liabilities (9 838 440) 1 293 494
Net cash flows from financing activities 40 933 646 11 712 506
Net increase/(decrease) in cash and cash equivalents 50 986 637 35 133 911
Cash and cash equivalents at the beginning of the year 40 484 187 5 350 276
Cash and cash equivalents at the end of the year 4 91 470 824 40 484 187
8

Midvaal Local Municipality(Registration number GT 422)Annual Financial Statements for the year ended 30 June 2014
Statement of Comparison of Budget and Actual AmountsBudget on Accrual Basis
Approvedbudget
Adjustments Final Budget Actual amountson comparable
basis
Differencebetween finalbudget and
actual
Reference
Statement of Financial Performance
Revenue
Revenue from exchangetransactions
Service charges 419 321 638 3 000 000 422 321 638 421 537 853 (783 785) T5.1.1
Interest received (trading) 7 199 520 (2 000 000) 5 199 520 6 048 615 849 095 TK2
Rental of facilities and equipment 1 020 000 250 000 1 270 000 1 142 264 (127 736)
Other income 16 865 039 1 604 566 18 469 605 20 249 489 1 779 884
Interest received - investment 1 800 000 1 000 000 2 800 000 4 850 916 2 050 916 T5.1.1
Total revenue from exchangetransactions
446 206 197 3 854 566 450 060 763 453 829 137 3 768 374
Revenue from non-exchangetransactions
Taxation revenue
Property rates 118 111 500 (9 133 724) 108 977 776 106 157 365 (2 820 411) T5.1.1
Government grants & subsidies 155 601 167 (48 000 000) 107 601 167 104 564 405 (3 036 762) T5.9.1
Transfer revenue
Public contributions anddonations
- - - 60 114 60 114
Fines 9 000 000 5 000 000 14 000 000 48 726 013 34 726 013 TK2
Developers contribution 10 000 000 (9 000 000) 1 000 000 2 663 992 1 663 992 T5.22
Total revenue from non-exchange transactions
292 712 667 (61 133 724) 231 578 943 262 171 889 30 592 946
Total revenue 738 918 864 (57 279 158) 681 639 706 716 001 026 34 361 320
Expenditure
Personnel (166 731 918) 17 326 684 (149 405 234) (125 997 709) 23 407 525 T5.1.1
Remuneration of councillors (9 708 194) 331 049 (9 377 145) (8 740 935) 636 210 T5.1.1
Transfer payments (32 712) (2 000 000) (2 032 712) (1 494 313) 538 399
Depreciation and amortisation (117 353 402) (4 913 049) (122 266 451) (115 484 153) 6 782 298 T5.1.1
Finance costs (22 115 932) (1 427 763) (23 543 695) (16 722 328) 6 821 367 T5.1.1
Debt impairment (27 059 981) 2 008 093 (25 051 888) (57 609 077) (32 557 189) Other
Repairs and maintenance (32 933 910) (4 250 185) (37 184 095) (30 203 487) 6 980 608 T5.5.4.1
Bulk purchases (249 800 000) (5 162 239) (254 962 239) (250 231 044) 4 731 195 T5.1.1
Contracted Services (60 131 458) 2 319 873 (57 811 585) (56 015 080) 1 796 505 T5.11
General Expenses (52 844 596) (1 604 805) (54 449 401) (45 676 514) 8 772 887
Total expenditure (738 712 103) 2 627 658 (736 084 445) (708 174 640) 27 909 805
Operating surplus 206 761 (54 651 500) (54 444 739) 7 826 386 62 271 125
Loss on foreign exchange - - - (631 023) (631 023)
Surplus before taxation 206 761 (54 651 500) (54 444 739) 7 195 363 61 640 102
Actual Amount on ComparableBasis as Presented in theBudget and ActualComparative Statement
206 761 (54 651 500) (54 444 739) 7 195 363 61 640 102
9
Midvaal Local Municipality(Registration number GT 422)Annual Financial Statements for the year ended 30 June 2014
Statement of Comparison of Budget and Actual AmountsBudget on Accrual Basis
Approvedbudget
Adjustments Final Budget Actual amountson comparable
basis
Differencebetween finalbudget and
actual
Reference
Reconciliation
10
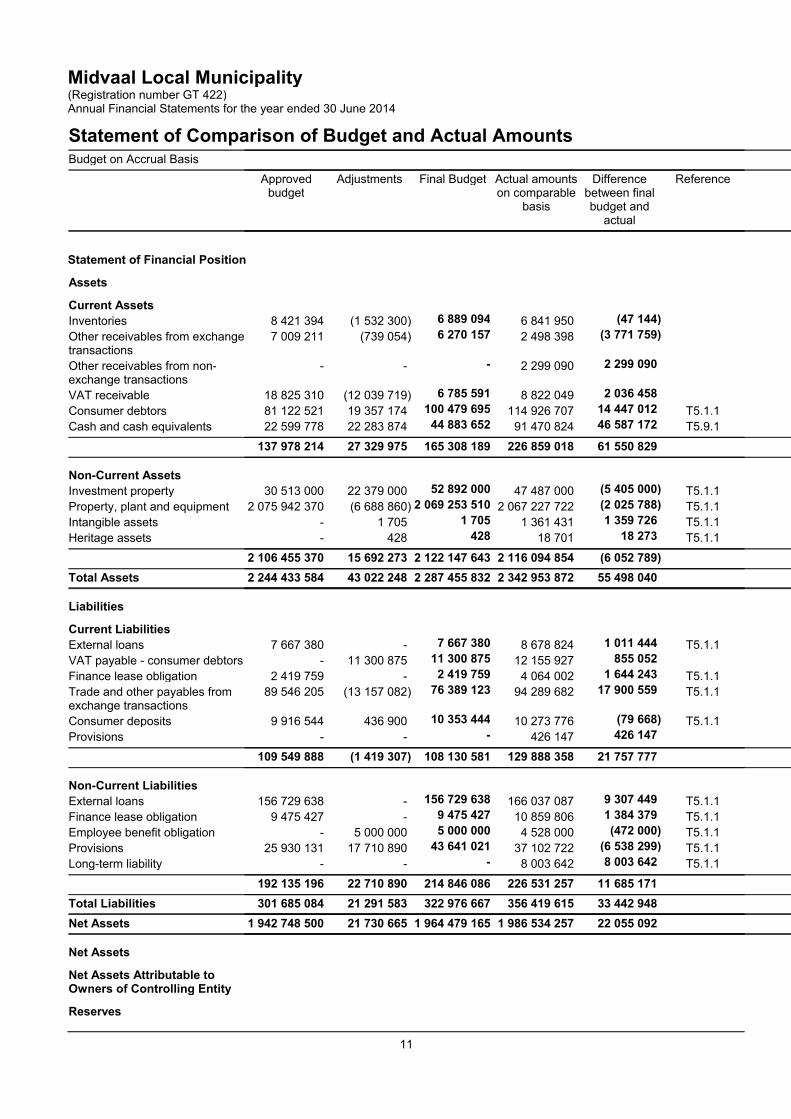
Midvaal Local Municipality(Registration number GT 422)Annual Financial Statements for the year ended 30 June 2014
Statement of Comparison of Budget and Actual AmountsBudget on Accrual Basis
Approvedbudget
Adjustments Final Budget Actual amountson comparable
basis
Differencebetween finalbudget and
actual
Reference
Statement of Financial Position
Assets
Current Assets
Inventories 8 421 394 (1 532 300) 6 889 094 6 841 950 (47 144)
Other receivables from exchangetransactions
7 009 211 (739 054) 6 270 157 2 498 398 (3 771 759)
Other receivables from non-exchange transactions
- - - 2 299 090 2 299 090
VAT receivable 18 825 310 (12 039 719) 6 785 591 8 822 049 2 036 458
Consumer debtors 81 122 521 19 357 174 100 479 695 114 926 707 14 447 012 T5.1.1
Cash and cash equivalents 22 599 778 22 283 874 44 883 652 91 470 824 46 587 172 T5.9.1
137 978 214 27 329 975 165 308 189 226 859 018 61 550 829
Non-Current Assets
Investment property 30 513 000 22 379 000 52 892 000 47 487 000 (5 405 000) T5.1.1
Property, plant and equipment 2 075 942 370 (6 688 860) 2 069 253 510 2 067 227 722 (2 025 788) T5.1.1
Intangible assets - 1 705 1 705 1 361 431 1 359 726 T5.1.1
Heritage assets - 428 428 18 701 18 273 T5.1.1
2 106 455 370 15 692 273 2 122 147 643 2 116 094 854 (6 052 789)
Total Assets 2 244 433 584 43 022 248 2 287 455 832 2 342 953 872 55 498 040
Liabilities
Current Liabilities
External loans 7 667 380 - 7 667 380 8 678 824 1 011 444 T5.1.1
VAT payable - consumer debtors - 11 300 875 11 300 875 12 155 927 855 052
Finance lease obligation 2 419 759 - 2 419 759 4 064 002 1 644 243 T5.1.1
Trade and other payables fromexchange transactions
89 546 205 (13 157 082) 76 389 123 94 289 682 17 900 559 T5.1.1
Consumer deposits 9 916 544 436 900 10 353 444 10 273 776 (79 668) T5.1.1
Provisions - - - 426 147 426 147
109 549 888 (1 419 307) 108 130 581 129 888 358 21 757 777
Non-Current Liabilities
External loans 156 729 638 - 156 729 638 166 037 087 9 307 449 T5.1.1
Finance lease obligation 9 475 427 - 9 475 427 10 859 806 1 384 379 T5.1.1
Employee benefit obligation - 5 000 000 5 000 000 4 528 000 (472 000) T5.1.1
Provisions 25 930 131 17 710 890 43 641 021 37 102 722 (6 538 299) T5.1.1
Long-term liability - - - 8 003 642 8 003 642 T5.1.1
192 135 196 22 710 890 214 846 086 226 531 257 11 685 171
Total Liabilities 301 685 084 21 291 583 322 976 667 356 419 615 33 442 948
Net Assets 1 942 748 500 21 730 665 1 964 479 165 1 986 534 257 22 055 092
Net Assets
Net Assets Attributable toOwners of Controlling Entity
Reserves
11

Midvaal Local Municipality(Registration number GT 422)Annual Financial Statements for the year ended 30 June 2014
Statement of Comparison of Budget and Actual AmountsBudget on Accrual Basis
Approvedbudget
Adjustments Final Budget Actual amountson comparable
basis
Differencebetween finalbudget and
actual
Reference
Accumulated surplus 1 942 748 500 21 730 665 1 964 479 165 1 986 534 257 22 055 092
12

Midvaal Local Municipality(Registration number GT 422)Annual Financial Statements for the year ended 30 June 2014
Statement of Comparison of Budget and Actual AmountsBudget on Accrual Basis
Approvedbudget
Adjustments Final Budget Actual amountson comparable
basis
Differencebetween finalbudget and
actual
Reference
Cash Flow Statement
Cash flows from operating activities
Receipts
Cash receipts from ratepayers,government and other
317 797 226 (61 279 158) 256 518 068 255 504 046 (1 014 022)
Cash receipts from servicecharges
387 115 569 4 674 315 391 789 884 377 474 742 (14 315 142)
Interest income 1 800 000 1 000 000 2 800 000 4 850 916 2 050 916 T5.9.1
706 712 795 (55 604 843) 651 107 952 637 829 704 (13 278 248)
Payments
Employee costs (175 013 123) 732 344 (174 280 779) (134 738 643) 39 542 136
Suppliers (391 202 612) (30 626 318) (421 828 930) (395 421 059) 26 407 871
Finance costs (22 115 932) - (22 115 932) (16 722 328) 5 393 604 T5.9.1
Other cash item - 31 000 000 31 000 000 (4 452 877) (35 452 877)
(588 331 667) 1 106 026 (587 225 641) (551 334 907) 35 890 734
Net cash flows from operatingactivities
118 381 128 (54 498 817) 63 882 311 86 494 797 22 612 486
Cash flows from investing activities
Purchase of property, plant andequipment
(152 467 000) 55 559 583 (96 907 417) (86 171 548) 10 735 869 T5.9.1
Proceedsondisposal of fixedassets
- - - 9 729 743 9 729 743
Net cash flows from investingactivities
(152 467 000) 55 559 583 (96 907 417) (76 441 805) 20 465 612
Cash flows from financing activities
Repayment of external loans 35 701 054 (409 504) 35 291 550 45 610 444 10 318 894
Movement in long-term liability - - - (9 838 440) (9 838 440) T5.10.2
Finance lease payments 630 805 1 502 215 2 133 020 5 161 642 3 028 622 T5.10.2
Net cash flows from financingactivities
36 331 859 1 092 711 37 424 570 40 933 646 3 509 076
Net increase/(decrease) in cashand cash equivalents
2 245 987 2 153 477 4 399 464 50 986 638 46 587 174 T5.9.1
Cash and cash equivalents atthe end of the year
22 599 778 22 283 874 44 883 652 91 470 824 46 587 174
Reconciliation
13

Midvaal Local Municipality(Registration number GT 422)Annual Financial Statements for the year ended 30 June 2014
Accounting Policies
1. Presentation of Annual Financial Statements
Basis of Preparation
The annual financial statements have been prepared in accordance with the Standards of Generally Recognised AccountingPractice (GRAP),including any interpretations, guidelines and directives issued by the Accounting Standards Board inaccordance with Section 122(3) of the Municipal Finance Management Act (Act 56 of 2003).
These annual financial statements have been prepared on an accrual basis of accounting and are in accordance withhistorical cost convention as the basis of measurement, unless specified otherwise.
In the absence of an issued and effective Standard of GRAP, accounting policies for material transactions, events orconditions were developed in accordance with paragraphs 8, 10 and 11 of GRAP 3 as read with Directive 5.
Assets, liabilities, revenues and expenses were not offset, except where offsetting is either required or permitted by aStandard of GRAP.
The principal accounting policies, applied in the preparation of these annual financial statements, are set out below. Theseaccounting policies are consistent with those applied in the preparation of the prior year annual financial statements, unlessspecified otherwise. Details of any changes in the accounting policies are provided in the note “Changes in accountingpolicy.”
1.1 Presentation currency
These annual financial statements are presented in South African Rand, which is the functional currency of the municipality.
1.2 Going concern assumption
These annual financial statements have been prepared on a going corcern basis.
1.3 Significant judgements and sources of estimation uncertainty
In preparing the annual financial statements, management is required to make estimates and assumptions that affect theamounts represented in the annual financial statements and related disclosures. Use of available information and theapplication of judgement is inherent in the formation of estimates. Actual results in the future could differ from theseestimates which may be material to the annual financial statements. These judgements and sources of estimationuncertainty have been covered in the relevant notes and relevant accounting policies. Significant judgments and underlyingassumptions are reviewed on a constant basis.
Trade receivables and receivables
The municipality assesses its trade receivables and receivables for impairment at the end of each reporting period. Indetermining whether an impairment loss should be recorded in surplus or deficit, the surplus makes judgements as towhether there is observable data indicating a measurable decrease in the estimated future cash flows from a financial asset.
The impairment for trade receivables and receivables is calculated on a portfolio basis, based on historical loss ratios,adjusted for national and industry-specific economic conditions and other indicators present at the reporting date thatcorrelate with defaults on the portfolio. These annual loss ratios are applied to loan balances in the portfolio and scaled tothe estimated loss emergence period.
Fair value estimation
The carrying value less impairment provision of trade receivables and payables are assumed to approximate their fair values
Impairment testing
The municipality reviews and tests the carrying value of assets when events or changes in circumstances suggest that thecarrying amount may not be recoverable. In addition, goodwill is tested on an annual basis for impairment. Assets aregrouped at the lowest level for which identifiable cash flows are largely independent of cash flows of other assets andliabilities. If there are indications that impairment may have occurred, estimates are prepared of expected future cash flowsfor each group of assets. Expected future cash flows used to determine the value in use of goodwill and tangible assets areinherently uncertain and could materially change over time. They are significantly affected by a number of factors includinguncontrollable ageing, together with economic factors such as inflation.
14

Midvaal Local Municipality(Registration number GT 422)Annual Financial Statements for the year ended 30 June 2014
Accounting Policies
1.3 Significant judgements and sources of estimation uncertainty (continued)
Provisions and contigencies
Provisions are recognised when:
* the entity has a present obligation as a result of a past event;
* it is probable that an outflow of resources embodying economic benefits or service potential will be required to settle theobligation; and
* a reliable estimate can be made of the obligation.
The amount of a provision is the best estimate of the expenditure expected to be required to settle the present obligation atthe reporting date.
Contingencies disclosed in the current year required estimates and judgements. Additional disclosure of these contingentliabilities is included in the relevant note.
Useful lives of assets
The municipality's management determines the estimated useful lives and related depreciation charges fof the municpality'sassets. The remaining useful lifes are reviewed at each reporting date.
Defined benefits
The present value of the post retirement obligation depends on a number of factors that are determined on an actuarial basisusing a number of assumptions. The assumptions used in determining the net cost (income) include the discount rate. Anychanges in these assumptions will impact on the carrying amount of post retirement obligations.
The municipality determines the appropriate discount rate at the end of each year. This is the interest rate that should beused to determine the present value of estimated future cash outflows expected to be required to settle the pensionobligations. In determining the appropriate discount rate, the municipality considers the interest rates of high-qualitycorporate bonds that are denominated in the currency in which the benefits will be paid, and that have terms to maturityapproximating the terms of the related pension liability.
Other key assumptions for pension obligations are based on current market conditions. Additional information is disclosed innotes in the financial statements.
Effective interest rate
The municipality used the prime interest rate to discount future cash flows.
Allowance for doubtful debts
On debtors an impairment loss is recognised in surplus and deficit when there is objective evidence that it is impaired. Theimpairment is measured as the difference between the debtors carrying amount and the present value of estimated futurecash flows discounted at the effective interest rate, computed at initial recognition.
1.4 Investment property
Investment property is property (land or a building - or part of a building - or both) held to earn rentals or for capitalappreciation or both, rather than for:
use in the production or supply of goods or services; or for administrative purposes, or sale in the ordinary course of operations.
Investment property is recognised as an asset when, it is probable that the future economic benefits or service potential thatare associated with the investment property will flow to the municipality, and the cost or fair value of the investment propertycan be measured reliably.
At initial recognition, the municipality measures investment property at cost, including transaction costs, once it meets thedefinition of investment property. Where an investment property was acquired through a non-exchange transaction, its cost isits fair value as at the date of acquisition.
15
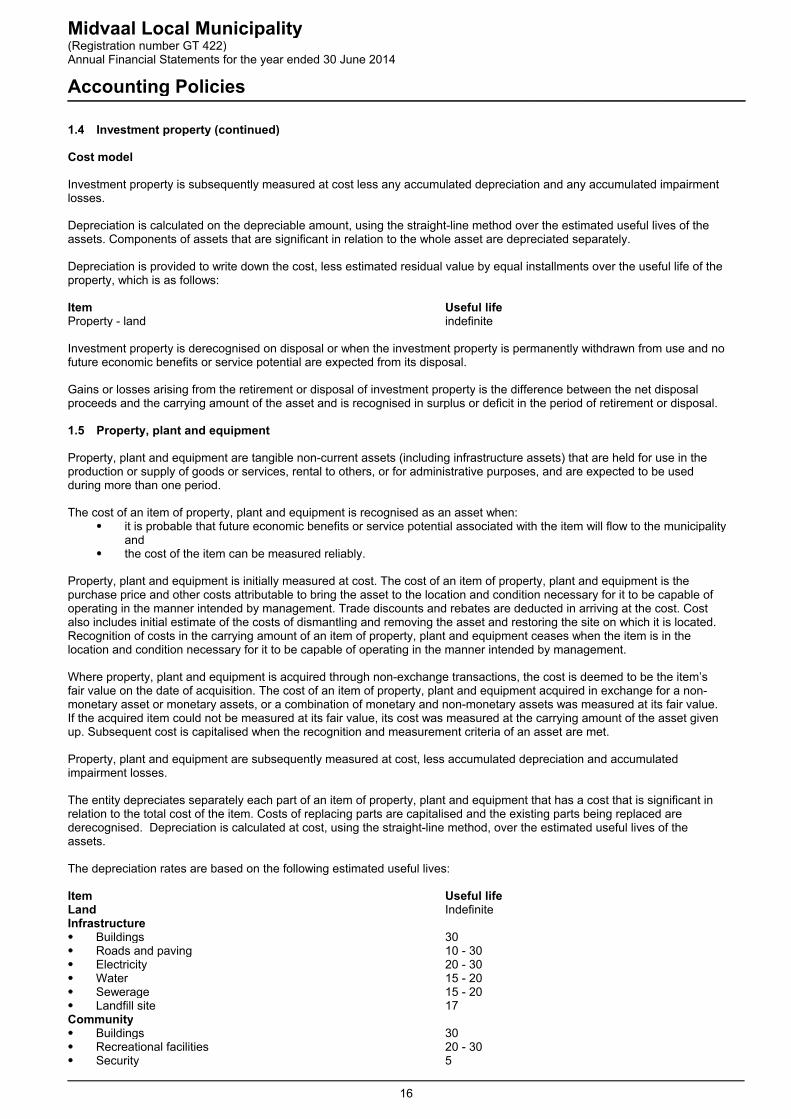
Midvaal Local Municipality(Registration number GT 422)Annual Financial Statements for the year ended 30 June 2014
Accounting Policies
1.4 Investment property (continued)
Cost model
Investment property is subsequently measured at cost less any accumulated depreciation and any accumulated impairmentlosses.
Depreciation is calculated on the depreciable amount, using the straight-line method over the estimated useful lives of theassets. Components of assets that are significant in relation to the whole asset are depreciated separately.
Depreciation is provided to write down the cost, less estimated residual value by equal installments over the useful life of theproperty, which is as follows:
Item Useful lifeProperty - land indefinite
Investment property is derecognised on disposal or when the investment property is permanently withdrawn from use and nofuture economic benefits or service potential are expected from its disposal.
Gains or losses arising from the retirement or disposal of investment property is the difference between the net disposalproceeds and the carrying amount of the asset and is recognised in surplus or deficit in the period of retirement or disposal.
1.5 Property, plant and equipment
Property, plant and equipment are tangible non-current assets (including infrastructure assets) that are held for use in theproduction or supply of goods or services, rental to others, or for administrative purposes, and are expected to be usedduring more than one period.
The cost of an item of property, plant and equipment is recognised as an asset when: it is probable that future economic benefits or service potential associated with the item will flow to the municipality
and the cost of the item can be measured reliably.
Property, plant and equipment is initially measured at cost. The cost of an item of property, plant and equipment is thepurchase price and other costs attributable to bring the asset to the location and condition necessary for it to be capable ofoperating in the manner intended by management. Trade discounts and rebates are deducted in arriving at the cost. Costalso includes initial estimate of the costs of dismantling and removing the asset and restoring the site on which it is located.Recognition of costs in the carrying amount of an item of property, plant and equipment ceases when the item is in thelocation and condition necessary for it to be capable of operating in the manner intended by management.
Where property, plant and equipment is acquired through non-exchange transactions, the cost is deemed to be the item’sfair value on the date of acquisition. The cost of an item of property, plant and equipment acquired in exchange for a non-monetary asset or monetary assets, or a combination of monetary and non-monetary assets was measured at its fair value.If the acquired item could not be measured at its fair value, its cost was measured at the carrying amount of the asset givenup. Subsequent cost is capitalised when the recognition and measurement criteria of an asset are met.
Property, plant and equipment are subsequently measured at cost, less accumulated depreciation and accumulatedimpairment losses.
The entity depreciates separately each part of an item of property, plant and equipment that has a cost that is significant inrelation to the total cost of the item. Costs of replacing parts are capitalised and the existing parts being replaced arederecognised. Depreciation is calculated at cost, using the straight-line method, over the estimated useful lives of theassets.
The depreciation rates are based on the following estimated useful lives:
Item Useful lifeLand IndefiniteInfrastructure Buildings 30 Roads and paving 10 - 30 Electricity 20 - 30 Water 15 - 20 Sewerage 15 - 20 Landfill site 17Community Buildings 30 Recreational facilities 20 - 30 Security 5
16
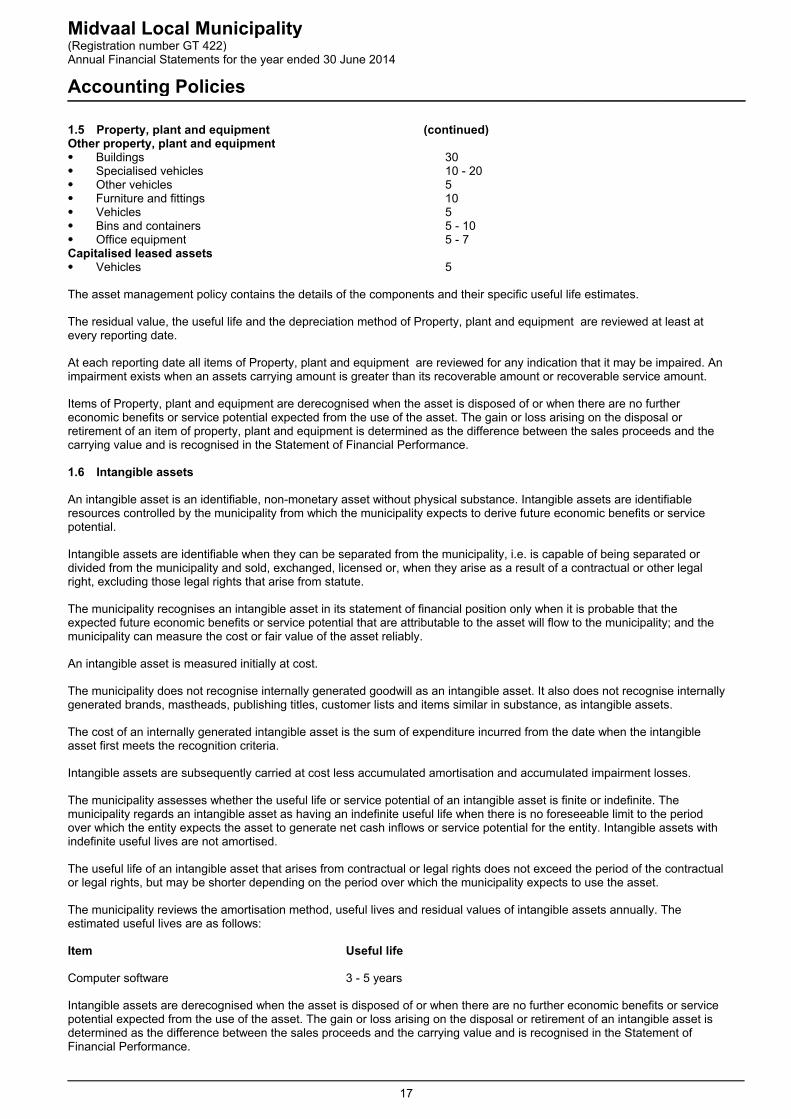
Midvaal Local Municipality(Registration number GT 422)Annual Financial Statements for the year ended 30 June 2014
Accounting Policies
1.5 Property, plant and equipment (continued)Other property, plant and equipment Buildings 30 Specialised vehicles 10 - 20 Other vehicles 5 Furniture and fittings 10 Vehicles 5 Bins and containers 5 - 10 Office equipment 5 - 7Capitalised leased assets Vehicles 5
The asset management policy contains the details of the components and their specific useful life estimates.
The residual value, the useful life and the depreciation method of Property, plant and equipment are reviewed at least atevery reporting date.
At each reporting date all items of Property, plant and equipment are reviewed for any indication that it may be impaired. Animpairment exists when an assets carrying amount is greater than its recoverable amount or recoverable service amount.
Items of Property, plant and equipment are derecognised when the asset is disposed of or when there are no furthereconomic benefits or service potential expected from the use of the asset. The gain or loss arising on the disposal orretirement of an item of property, plant and equipment is determined as the difference between the sales proceeds and thecarrying value and is recognised in the Statement of Financial Performance.
1.6 Intangible assets
An intangible asset is an identifiable, non-monetary asset without physical substance. Intangible assets are identifiableresources controlled by the municipality from which the municipality expects to derive future economic benefits or servicepotential.
Intangible assets are identifiable when they can be separated from the municipality, i.e. is capable of being separated ordivided from the municipality and sold, exchanged, licensed or, when they arise as a result of a contractual or other legalright, excluding those legal rights that arise from statute.
The municipality recognises an intangible asset in its statement of financial position only when it is probable that theexpected future economic benefits or service potential that are attributable to the asset will flow to the municipality; and themunicipality can measure the cost or fair value of the asset reliably.
An intangible asset is measured initially at cost.
The municipality does not recognise internally generated goodwill as an intangible asset. It also does not recognise internallygenerated brands, mastheads, publishing titles, customer lists and items similar in substance, as intangible assets.
The cost of an internally generated intangible asset is the sum of expenditure incurred from the date when the intangibleasset first meets the recognition criteria.
Intangible assets are subsequently carried at cost less accumulated amortisation and accumulated impairment losses.
The municipality assesses whether the useful life or service potential of an intangible asset is finite or indefinite. Themunicipality regards an intangible asset as having an indefinite useful life when there is no foreseeable limit to the periodover which the entity expects the asset to generate net cash inflows or service potential for the entity. Intangible assets withindefinite useful lives are not amortised.
The useful life of an intangible asset that arises from contractual or legal rights does not exceed the period of the contractualor legal rights, but may be shorter depending on the period over which the municipality expects to use the asset.
The municipality reviews the amortisation method, useful lives and residual values of intangible assets annually. Theestimated useful lives are as follows:
Item Useful life
Computer software 3 - 5 years
Intangible assets are derecognised when the asset is disposed of or when there are no further economic benefits or servicepotential expected from the use of the asset. The gain or loss arising on the disposal or retirement of an intangible asset isdetermined as the difference between the sales proceeds and the carrying value and is recognised in the Statement ofFinancial Performance.
17

Midvaal Local Municipality(Registration number GT 422)Annual Financial Statements for the year ended 30 June 2014
Accounting Policies
1.7 Heritage assets
Heritage assets are assets that have a cultural, environmental, historical, natural, scientific, technological or artisticsignificance and are held indefinitely for the benefit of present and future generations.
An inalienable item is an asset that a municipality is required by law or otherwise to retain indefinitely and cannot bedisposed of without consent.
Recognition
The municipality recognises a heritage asset as an asset if it is probable that future economic benefits or service potentialassociated with the asset will flow to the municipality, and the cost or fair value of the asset can be measured reliably.
Initial measurement
Heritage assets are measured at cost.
Where a heritage asset is acquired through a non-exchange transaction, its cost is measured at its fair value as at the dateof acquisition.
Subsequent measurement
After recognition as an asset, a class of heritage assets is carried at its cost less any accumulated impairment losses.
Impairment
The municipality assess at each reporting date whether there is an indication that it may be impaired. If any such indicationexists, the municipality estimates the recoverable amount or the recoverable service amount of the heritage asset.
Transfers
Transfers from heritage assets are only made when the particular asset no longer meets the definition of a heritage asset.
Transfers to heritage assets are only made when the asset meets the definition of a heritage asset.
Derecognition
The municipality derecognises heritage asset on disposal, or when no future economic benefits or service potential areexpected from its use or disposal.
The gain or loss arising from the derecognition of a heritage asset is determined as the difference between the net disposalproceeds, if any, and the carrying amount of the heritage asset. Such difference is recognised in surplus or deficit when theheritage asset is derecognised.
Transitional provision
The municipality changed its accounting policy for heritage assets in 2013. The change in accounting policy is made inaccordance with its transitional provision as per Directive 4 of the GRAP Reporting Framework.
According to the transitional provision, the municipality is not required to measure heritage assets for reporting periodsbeginning on or after a date within three years following the date of initial adoption of the Standard of GRAP on Heritageassets. Heritage assets have accordingly been recognised at provisional amounts, as disclosed in 12. The transitionalprovision expires on 2015/06/30.
Until such time as the measurement period expires and heritage assets are recognised and measured in accordance withthe requirements of the Standard of GRAP on Heritage assets, the municipality need not comply with the Standards ofGRAP on (to the extent that these Standards prescribe requirements for heritage assets):
Presentation of Financial Statements (GRAP 1), The Effects of Changes in Foreign Exchange Transactions (GRAP 4), Leases (GRAP 13), Segment Reporting (GRAP 18), Non-current Assets Held for Sale and Discontinued Operations (GRAP 100)
The exemption from applying the measurement requirements of the Standard of GRAP on Heritage assets implies that anyassociated presentation and disclosure requirements need not be complied with for heritage assets not measured inaccordance with the requirements of the Standard of GRAP on Heritage assets.
18

Midvaal Local Municipality(Registration number GT 422)Annual Financial Statements for the year ended 30 June 2014
Accounting Policies
1.8 Financial instruments
Financial instruments at amortised cost are non-derivative financial assets or non-derivative financial liabilities that havefixed or determinable payments, excluding those instruments that
(i) the entity designates at fair value at initial recognition or
(ii) are held for trading.
Financial instruments at cost are investments in residual interests that do not have a quoted market price in an activemarket, and whose fair value cannot be reliably measured.
Classification
The entity has the following types of financial assets (classes and category) as reflected on the face of the statement offinancial position or in the notes thereto:
`
Class CategoryOther receivables from exchange transactions Financial asset measured at amortised costOther receivables from non-excahange transactions Financial asset measured at amortised costConsumer debtors Financial asset measured at amortised costCash and cash equivalents Financial asset measured at amortised cost
The entity has the following types of financial liabilities (classes and category) as reflected on the face of the statement offinancial position or in the notes thereto:
`
Class CategoryLong-term liabilities/External loans Financial liability measured at amortised costPayables from exchange transactions Financial liability measured at amortised costFinance lease obligations Financial liability measured at amortised costConsumer deposits Financial liability measured at amortised cost
Initial recognition
The entity recognises a financial asset or a financial liability in its statement of financial position when the entity becomes aparty to the contractual provisions of the instrument.
The entity recognises financial assets using trade date accounting.
Initial measurement of financial assets and financial liabilities
The entity measures a financial asset and financial liability initially at its fair value plus transaction costs that are directlyattributable to the acquisition or issue of the financial asset or financial liability.
The entity first assesses whether the substance of a concessionary loan is in fact a loan. On initial recognition, the entityanalyses a concessionary loan into its component parts and accounts for each component separately. The entity accountsfor that part of a concessionary loan that is:
a social benefit in accordance with the Framework for the Preparation and Presentation of Financial Statements,where it is the issuer of the loan; or
non-exchange revenue, in accordance with the Standard of GRAP on Revenue from Non-exchange Transactions(Taxes and Transfers), where it is the recipient of the loan.
Subsequent measurement of financial assets and financial liabilities
The entity measures all financial assets and financial liabilities after initial recognition using the following category: Financial instruments at amortised cost.
All financial assets measured at amortised cost are subject to an impairment review.
Gains and losses
A gain or loss arising from a change in the fair value of a financial asset or financial liability measured at fair value isrecognised in surplus or deficit.
For financial assets and financial liabilities measured at amortised cost or cost, a gain or loss is recognised in surplus ordeficit when the financial asset or financial liability is derecognised or impaired, or through the amortisation process.
19

Midvaal Local Municipality(Registration number GT 422)Annual Financial Statements for the year ended 30 June 2014
Accounting Policies
1.8 Financial instruments (continued)
Impairment and uncollectibility of financial assets
The entity assess at the end of each reporting period whether there is any objective evidence that a financial asset or groupof financial assets is impaired.
Financial assets measured at amortised cost:
If there is objective evidence that an impairment loss on financial assets measured at amortised cost has been incurred, theamount of the loss is measured as the difference between the asset’s carrying amount and the present value of estimatedfuture cash flows (excluding future credit losses that have not been incurred) discounted at the financial asset’s originaleffective interest rate. The carrying amount of the asset is reduced directly or through the use of an allowance account. Theamount of the loss is recognised in surplus or deficit.
If, in a subsequent period, the amount of the impairment loss decreases and the decrease can be related objectively to anevent occurring after the impairment was recognised, the previously recognised impairment loss is reversed directly OR byadjusting an allowance account. The reversal does not result in a carrying amount of the financial asset that exceeds whatthe amortised cost would have been had the impairment not been recognised at the date the impairment is reversed. Theamount of the reversal is recognised in surplus or deficit.
Derecognition
Financial assets
The entity derecognises financial assets (or part of a financial assets) when the contractual rights to the cash flows from thefinancial asset expire, are settled or waived or when the entity has transferred all of the significant risks and rewards ofownership using trade date accounting.
On derecognition of a financial asset (or part of a financial asset), the difference between the carrying amount and the sumof the consideration received is recognised in surplus or deficit.
Financial liabilities
The entity removes a financial liability (or a part of a financial liability) from its statement of financial position when it isextinguished — i.e. when the obligation specified in the contract is discharged, cancelled, expires or waived.
The difference between the carrying amount of a financial liability (or part of a financial liability) extinguished or transferred toanother party and the consideration paid, including any non-cash assets transferred or liabilities assumed, is recognised insurplus or deficit. Any liabilities that are waived, forgiven or assumed by another entity by way of a non-exchange transactionare accounted for in accordance with the Standard of GRAP on Revenue from Non-exchange Transactions (Taxes andTransfers).
Presentation
Interest relating to a financial instrument or a component that is a financial liability is recognised as revenue or expense insurplus or deficit.
Losses and gains relating to a financial instrument or a component that is a financial liability is recognised as revenue orexpense in surplus or deficit.
A financial asset and a financial liability are only offset and the net amount presented in the statement of financial positionwhen the entity currently has a legally enforceable right to set off the recognised amounts and intends either to settle on anet basis, or to realise the asset and settle the liability simultaneously.
In accounting for a transfer of a financial asset that does not qualify for derecognition, the entity does not offset thetransferred asset and the associated liability.
1.9 Leases
A lease is classified as a finance lease if it transfers substantially all the risks and rewards incidental to ownership. A lease isclassified as an operating lease if it does not transfer substantially all the risks and rewards incidental to ownership.
When a lease includes both land and buildings elements, the entity assesses the classification of each element separately.
20

Midvaal Local Municipality(Registration number GT 422)Annual Financial Statements for the year ended 30 June 2014
Accounting Policies
1.9 Leases (continued)
Finance leases - lessee
Finance leases are recognised as assets and liabilities in the statement of financial position at amounts equal to the fairvalue of the leased property or, if lower, the present value of the minimum lease payments. The corresponding liability to thelessor is included in the statement of financial position as a finance lease obligation.
Minimum lease payments are apportioned between the finance charge and reduction of the outstanding liability. The financecharge is allocated to each period during the lease term so as to produce a constant periodic rate of on the remainingbalance of the liability.
Any contingent rents are expensed in the period in which they are incurred.
Operating leases - lessor
Operating lease revenue is recognised as revenue on a straight-line basis over the lease term.
Initial direct costs incurred in negotiating and arranging operating leases are added to the carrying amount of the leasedasset and recognised as an expense over the lease term on the same basis as the lease revenue.
The aggregate cost of incentives is recognised as a reduction of rental revenue over the lease term on a straight-line basis.
The aggregate benefit of incentives is recognised as a reduction of rental expense over the lease term on a straight-linebasis.
Income for leases is disclosed under revenue in statement of financial performance.
Operating leases - lessee
Operating lease payments are recognised as an expense on a straight-line basis over the lease term. The differencebetween the amounts recognised as an expense and the contractual payments are recognised as an operating lease assetor liability.
1.10 Inventories
Inventories are assets in the form of materials or supplies to be consumed or distributed in the rendering of services or heldfor distribution in the ordinary course of operations.
Inventories is recognised as an asset if it is probable that future economic benefits or service potential associated with theitem will flow to the municipality, and the cost of the inventories can be measured reliably.
Inventories are initially recognised at cost. Cost comprise all costs of purchase, costs of conversion and other costs incurredin bringing the inventories to their present location and condition. Where inventories are acquired at through a non-exchangetransaction, their cost is measured at their fair value as at the date of acquisition.
Inventories are subsequently measured at the lower of cost and net realisable value unless distributed through a non-exchange transaction or consumed in the production process of goods to be distributed at no charge or for a nominal charge,in which case they are measured at the lower of cost and current replacement cost.
The carrying amount of inventories is recognised as an expense in the period that the inventory was sold, distributed, writtenoff or consumed, unless that cost qualifies for capitalisation to the cost of another asset. The cost of inventories is assignedby using the first-in, first-out (FIFO) formula, except for water balance which is determined at cost at the reporting date due toit being measured at reporting date.
Redundant and slow-moving inventories are identified and written down/written off. Inventories identified for write down/writeoff, but for which a council resolution, to authorise the write down/write off, has not yet been obtained, is provided for as aprovision for obsolete stock. Differences arising on the valuation of inventory are recognised in the Statement of FinancialPerformance in the year in which they arise. The amount of any reversal of any write-down of inventories arising from anincrease in net realisable value or current replacement cost is recognised as a reduction in the amount of inventoriesrecognised as an expense in the period in which the reversal occurs.
1.11 Impairment of cash-generating and non-cash generating assets
Cash-generating assets are those assets held by the municipality with the primary objective of generating a commercialreturn. When an asset is deployed in a manner consistent with that adopted by a profit-orientated municipality, it generates acommercial return. Non-cash-generating assets are assets other than cash-generating assets.
21
Midvaal Local Municipality(Registration number GT 422)Annual Financial Statements for the year ended 30 June 2014
Accounting Policies
1.11 Impairment of cash-generating and non-cash generating assets (continued)
Impairment is a loss in the future economic benefits or service potential of an asset, over and above the systematicrecognition of the loss of the asset’s future economic benefits or service potential through depreciation (amortisation)
The municipality classifies all assets held with the primary objective of generating a commercial return as cash-generatingassets. All other assets are classified as non-cash-generating assets.
Identification
When the carrying amount of a cash-generating asset exceeds its recoverable amount or when the carrying amount of anon-cash-generating asset exceeds its recoverable service amount, it is impaired.
The municipality assesses at each reporting date whether there is any indication that an asset may be impaired. If any suchindication exists, the municipality estimates the recoverable amount or the recoverable service amount of the asset.
Irrespective of whether there is any indication of impairment, the municipality also test an intangible asset with an indefiniteuseful life or an intangible asset not yet available for use for impairment annually by comparing its carrying amount with itsrecoverable amount. This impairment test is performed at the same time every year. If an intangible asset was initiallyrecognised during the current reporting period, that intangible asset was tested for impairment before the end of the currentreporting period.
Value in use
Value in use of a cash-generating asset is the present value of the estimated future cash flows expected to be derived fromthe continuing use of an asset and from its disposal at the end of its useful life. Value in use of non-cash-generating assets isthe present value of the non-cash-generating assets remaining service potential
When estimating the value in use of a cash-generating asset, the municipality estimates the future cash inflows and outflowsto be derived from continuing use of the asset and from its ultimate disposal and the municipality applies the appropriatediscount rate to those future cash flows. The present value of the remaining service potential of a non-cash-generatingassets is determined using the most appropriate between the following approaches:
* Depreciated replacement cost approach
* Restoration cost approach
* Service units apporach
Recognition and measurement
If the recoverable amount or recoverable service amount of an asset is less than its carrying amount, the carrying amount ofthe asset is reduced to its recoverable amount or recoverable service amount. This reduction is an impairment loss.
An impairment loss is recognised immediately in surplus or deficit.
When the amount estimated for an impairment loss is greater than the carrying amount of the asset to which it relates, themunicipality recognises a liability only to the extent that is a requirement in the Standard of GRAP.
After the recognition of an impairment loss, the depreciation (amortisation) charge for the asset is adjusted in future periodsto allocate the asset’s revised carrying amount, less its residual value (if any), on a systematic basis over its remaining usefullife.
Reversal of impairment loss
The municipality assess at each reporting date whether there is any indication that an impairment loss recognised in priorperiods for an asset may no longer exist or may have decreased. If any such indication exists, the entity estimates therecoverable amount or recoverable service amount of that asset.
An impairment loss recognised in prior periods for an asset is reversed if there has been a change in the estimates used todetermine the asset’s recoverable amount or recoverable service amount since the last impairment loss was recognised.The carrying amount of the asset is increased to its recoverable amount or recoverable service amount. The increase is areversal of an impairment loss. The increased carrying amount of an asset attributable to a reversal of an impairment lossdoes not exceed the carrying amount that would have been determined (net of depreciation or amortisation) had noimpairment loss been recognised for the asset in prior periods.
A reversal of an impairment loss for an asset is recognised immediately in surplus or deficit.
22

Midvaal Local Municipality(Registration number GT 422)Annual Financial Statements for the year ended 30 June 2014
Accounting Policies
1.11 Impairment of cash-generating and non-cash generating assets (continued)
After a reversal of an impairment loss is recognised, the depreciation (amortisation) charge for the asset is adjusted in futureperiods to allocate the asset’s revised carrying amount, less its residual value (if any), on a systematic basis over itsremaining useful life.
Redesignation
The redesignation of assets from a cash-generating asset to a non-cash-generating asset or from a non-cash-generatingasset to a cash-generating asset only occur when there is clear evidence that such a redesignation is appropriate.
1.12 Employee benefits
Employee benefits are all forms of consideration given by an municiplality in exchange for service rendered by employees.
Short-term employee benefits
Short-term employee benefits are employee benefits that are due to be settled within twelve months after the end of theperiod in which the employees render the related service.
When an employee has rendered service to the entity during a reporting period, the entity recognise the undiscountedamount of short-term employee benefits expected to be paid in exchange for that service:
as a liability (accrued expense), after deducting any amount already paid. If the amount already paid exceeds theundiscounted amount of the benefits, the entity recognise that excess as an asset (prepaid expense) to the extentthat the prepayment will lead to, for example, a reduction in future payments or a cash refund; and
as an expense, unless another Standard requires or permits the inclusion of the benefits in the cost of an asset.
The expected cost of compensated absences is as an expense as the employees render services that increase theirentitlement or, in the case of non-accumulating absences, when the absence occurs. The entity measure the expected costof accumulating compensated absences as the additional amount that the entity expects to pay as a result of the unusedentitlement that has accumulated at the reporting date.
The entity recognise the expected cost of bonus, incentive and performance related payments when the entity has a presentlegal or constructive obligation to make such payments as a result of past events and a reliable estimate of the obligationcan be made. A present obligation exists when the entity has no realistic alternative but to make the payments.
Post-employment benefits
Post-employment benefits are employee benefits (other than termination benefits) which are payable after the completion ofemployment.
Post-employment benefit plans are formal or informal arrangements under which an entity provides post-employmentbenefits for one or more employees.
Multi-employer plans are defined contribution plans (other than state plans and composite social security programmes) ordefined benefit plans (other than state plans) that pool the assets contributed by various entities that are not under commoncontrol and use those assets to provide benefits to employees of more than one entity, on the basis that contribution andbenefit levels are determined without regard to the identity of the entity that employs the employees concerned.
Multi-employer plans
The entity classifies a multi-employer plan as a defined contribution plan or a defined benefit plan under the terms of the plan(including any constructive obligation that goes beyond the formal terms).
Where a plan is a defined contribution plan, the entity accounts for in the same way as for any other defined contributionplan.
Where a plan is a defined benefit plan, the entity account for its proportionate share of the defined benefit obligation, planassets and cost associated with the plan in the same way as for any other defined benefit plan.
When sufficient information is not available to use defined benefit accounting for a plan, that is a defined benefit plan, theentity account for the plan as if it was a defined contribution plan.
23

Midvaal Local Municipality(Registration number GT 422)Annual Financial Statements for the year ended 30 June 2014
Accounting Policies
1.12 Employee benefits (continued)
Post-employment benefits: Defined contribution plans
Defined contribution plans are post-employment benefit plans under which the entity pays fixed contributions into a separateentity (a fund) and will have no legal or constructive obligation to pay further contributions if the fund does not hold sufficientassets to pay all employee benefits relating to employee service in the current and prior periods.
When an employee has rendered service to the entity during a reporting period, the entity recognise the contribution payableto a defined contribution plan in exchange for that service:
as a liability (accrued expense), after deducting any contribution already paid. If the contribution already paidexceeds the contribution due for service before the reporting date, an entity recognise that excess as an asset(prepaid expense) to the extent that the prepayment will lead to, for example, a reduction in future payments or acash refund; and
as an expense, unless another Standard requires or permits the inclusion of the contribution in the cost of anasset.
Where contributions to a defined contribution plan do not fall due wholly within twelve months after the end of the reportingperiod in which the employees render the related service, they are discounted. The rate used to discount reflects the timevalue of money. The currency and term of the financial instrument selected to reflect the time value of money is consistentwith the currency and estimated term of the obligation.
Post-employment benefits: Defined benefit plans
Defined benefit plans are post-employment benefit plans other than defined contribution plans.
Actuarial gains and losses comprise experience adjustments (the effects of differences between the previous actuarialassumptions and what has actually occurred) and the effects of changes in actuarial assumptions. In measuring its definedbenefit liability the entity recognise actuarial gains and losses in surplus or deficit in the reporting period in which they occur.
Current service cost is the increase in the present value of the defined benefit obligation resulting from employee service inthe current period.
Interest cost is the increase during a period in the present value of a defined benefit obligation which arises because thebenefits are one period closer to settlement.
Past service cost is the change in the present value of the defined benefit obligation for employee service in prior periods,resulting in the current period from the introduction of, or changes to, post-employment benefits or other long-term employeebenefits. Past service cost may be either positive (when benefits are introduced or changed so that the present value of thedefined benefit obligation increases) or negative (when existing benefits are changed so that the present value of the definedbenefit obligation decreases). In measuring its defined benefit liability the entity recognise past service cost as an expense inthe reporting period in which the plan is amended.
The present value of a defined benefit obligation is the present value, without deducting any plan assets, of expected futurepayments required to settle the obligation resulting from employee service in the current and prior periods.
The entity account not only for its legal obligation under the formal terms of a defined benefit plan, but also for anyconstructive obligation that arises from the entity’s informal practices. Informal practices give rise to a constructive obligationwhere the entity has no realistic alternative but to pay employee benefits.
The amounts recognised as a defined benefit liability is the net total of the following amounts:
* the present value of the defined benefit obligation at the reporting date;
* minus the fair value at the reporting date of plan assets (if any) out of which the obligations are to be settled directly;
* plus any liability that may arise as a result of a minimum funding requirement.
The entity determine the present value of defined benefit obligations with sufficient regularity such that the amountsrecognised in the financial statements do not differ materially from the amounts that would be determined at the reportingdate.
The entity recognises the net total of the following amounts in surplus or deficit, except to the extent that another Standardrequires or permits their inclusion in the cost of an asset:
24

Midvaal Local Municipality(Registration number GT 422)Annual Financial Statements for the year ended 30 June 2014
Accounting Policies
1.12 Employee benefits (continued)
* current service cost;* interest cost;* actuarial pains and losses;* past service cost; and* the effect of any curtailments or settlements
The entity uses the Projected Unit Credit Method to determine the present value of its defined benefit obligations and therelated current service cost and, where applicable, past service cost. The Projected Unit Credit Method (sometimes knownas the accrued benefit method pro-rated on service or as the benefit/years of service method) sees each period of service asgiving rise to an additional unit of benefit entitlement and measures each unit separately to build up the final obligation.
In determining the present value of its defined benefit obligations and the related current service cost and, where applicable,past service cost, the entity attribute benefits to periods of service under the plan’s benefit formula. However, if anemployee’s service in later years will lead to a materially higher level of benefit than in earlier years, the entity attributes thebenefit on a straight-line basis from:* the date when service by the employee first leads to benefits under the plan (whether or not the benefitsareconditionalon further service); until* the date when further service by the employee will lead to no material amount of further benefits under the plan, other thanfrom further salary increases.
Actuarial valuations are conducted on an annual basis by independent actuaries. The results of the valuation are updated forany material transactions and other material changes in circumstances (including changes in market prices and interestrates) up to the reporting date.
Actuarial assumptions
Actuarial assumptions are unbiased and mutually compatible.
Financial assumptions are based on market expectations, at the reporting date, for the period over which the obligations areto be settled.
The rate used to discount post-employment benefit obligations (both funded and unfunded) reflect the time value of money.The currency and term of the financial instrument selected to reflect the time value of money is consistent with the currencyand estimated term of the post-employment benefit obligations.
Post-employment benefit obligations are measured on a basis that reflects: estimated future salary increases; the benefits set out in the terms of the plan (or resulting from any constructive obligation that goes beyond those
terms) at the reporting date; and estimated future changes in the level of any state benefits that affect the benefits payable under a defined benefit
plan, if, and only if, either: those changes were enacted before the reporting date; or past history, or other reliable evidence, indicates that those state benefits will change in some predictable manner,
for example, in line with future changes in general price levels or general salary levels.
Assumptions about medical costs take account of estimated future changes in the cost of medical services, resulting fromboth inflation and specific changes in medical costs.
The municipality provides post-retirement health care benefits upon retirement to some retirees. The entitlement to post-retirement health care benefits is based on the employee remaining in service up to retirement age and the completion of aminimum service period. The expected costs of these benefits are accrued over the period of employment. Independentqualified actuaries carry out valuations of these obligations.
1.13 Provisions and contingencies
Provisions are recognised when: the municipality has a present obligation as a result of a past event; it is probable that an outflow of resources embodying economic benefits or service potential will be required to
settle the obligation; and a reliable estimate can be made of the obligation.
The amount of a provision is the best estimate of the expenditure expected to be required to settle the present obligation atthe reporting date.
Provisions are reviewed at each reporting date and adjusted to reflect the current best estimate. Provisions are reversed if itis no longer probable that an outflow of resources embodying economic benefits or service potential will be required, to settlethe obligation.
25

Midvaal Local Municipality(Registration number GT 422)Annual Financial Statements for the year ended 30 June 2014
Accounting Policies
1.13 Provisions and contingencies (continued)
Contingent assets and contingent liabilities are not recognised. Contingencies are disclosed in the notes in the FinancialStatements.
A financial guarantee contract is a contract that requires the issuer to make specified payments to reimburse the holder for aloss it incurs because a specified debtor fails to make payment when due in accordance with the original or modified terms ofa debt instrument.
Decommissioning, restoration and similar liability
Changes in the measurement of an existing decommissioning, restoration and similar liability that result from changes in theestimated timing or amount of the outflow of resources embodying economic benefits or service potential required to settlethe obligation, or a change in the discount rate, is accounted for as follows:
changes in the liability is added to, or deducted from, the cost of the related asset in the current period. the amount deducted from the cost of the asset does not exceed its carrying amount. If a decrease in the liability
exceeds the carrying amount of the asset, the excess is recognised immediately in surplus or deficit. if the adjustment results in an addition to the cost of an asset, the entity consider whether this is an indication that
the new carrying amount of the asset may not be fully recoverable. If there is such an indication, the entity test theasset for impairment by estimating its recoverable amount or recoverable service amount, and account for anyimpairment loss, in accordance with the accounting policy on impairment of assets as described in accountingpolicy 1.11.
The adjusted depreciable amount of the asset is depreciated over its remaining useful life. Therefore, once the related assethas reached the end of its useful life, all subsequent changes in the liability is recognised in surplus or deficit as they occur.
The periodic unwinding of the discount is recognised in surplus or deficit as a finance cost as it occurs.
1.14 Revenue from exchange transactions
Revenue from exchange transactions refers to revenue that accrued to the municipality directly in return for servicesrendered/goods sold, the value of which approximates the consideration received or receivable.
Revenue is the gross inflow of economic benefits or service potential during the reporting period when those inflows result inan increase in net assets, other than increases relating to contributions from owners.
An exchange transaction is one in which the municipality receives assets or services, or has liabilities extinguished, anddirectly gives approximately equal value (primarily in the form of goods, services or use of assets) to the other party inexchange.
Revenue is measured at the fair value of the consideration received or receivable.
When the inflow of cash or cash equivalents is deferred and the fair value of the consideration is less than the nominalamount of cash received or receivable, the arrangement effectively constitutes a financing transaction. The fair value of theconsideration is determined by discounting all future receipts using an imputed rate of interest. The imputed rate of interest isthe more clearly determinable of either:
* The prevailing rate for a similar instrument of an issuer with a similar credit rating; or* A rate of interest that discounts the nominal amount of the instrument to the current cash sales price of the goods orservices. The difference between the fair value and the nominal amount of the consideration is recognised as interestrevenue.
Service charges relating to electricity and water are based on consumption. Meters are read on a periodic basis and revenueis recognised when invoiced. Provisional estimates of consumption are made monthly when meter readings have not beenperformed and are based on the consumption history. The provisional estimates of consumption are recognised as revenuewhen invoiced. Adjustments to provisional estimates of consumption are made in the invoicing period when meters havebeen read. These adjustments are recognised as revenue in the invoicing period. There are areas within the municipalitywere an un-metered water tariff is applied based on estimated consumption as per promulgated tariffs. Revenue for these isrecognised when invoiced.
Service charges relating to refuse removal are recognised on a monthly basis in arrears by applying the approved tariff toeach property. Tariffs are determined per category of property size, and are levied monthly. Service charges from sewerageand sanitation are based on the number of sewerage connections on each developed property using the tariffs approvedfrom Council and are levied monthly.
Interest revenue is recognised on a time proportion basis.
26

Midvaal Local Municipality(Registration number GT 422)Annual Financial Statements for the year ended 30 June 2014
Accounting Policies
1.14 Revenue from exchange transactions (continued)
Revenue from the rental of facilities and equipment is recognised on a straight-line basis over the term of the leaseagreement.
Revenue arising from the application of the approved tariff of charges is recognised when the relevant service is rendered byapplying the relevant gazetted tariff. This includes the issuing of licences and permits.
Income for agency services is recognised on a monthly basis once the income collected on behalf of agents has beenquantified. The income recognised is in terms of the agency agreement.
Revenue from the sale of goods is recognised when the following conditions have been satisfied:* The municipality has transferred to the buyer the significant risks and rewards of ownership.* The municipality retains neither continuing managerial involvement to the degree usually associated with ownership nor effective control over the goods sold.* The amount of revenue can be measured reliably.* It is probable that the economic benefits or service potential associated with the transaction will flow to the municipality.* The costs incurred or to be incurred in respect of the transaction can be measured reliably.
1.15 Revenue from non-exchange transactions
Revenue comprises gross inflows of economic benefits or service potential received and receivable by an municipality, whichrepresents an increase in net assets, other than increases relating to contributions from owners.
Conditions on transferred assets are stipulations that specify that the future economic benefits or service potential embodiedin the asset is required to be consumed by the recipient as specified or future economic benefits or service potential must bereturned to the transferor.
Control of an asset arise when the municipality can use or otherwise benefit from the asset in pursuit of its objectives andcan exclude or otherwise regulate the access of others to that benefit.
Exchange transactions are transactions in which one entity receives assets or services, or has liabilities extinguished, anddirectly gives approximately equal value (primarily in the form of cash, goods, services, or use of assets) to another entity inexchange.
Fines are economic benefits or service potential received or receivable by entities, as determined by a court or other lawenforcement body, as a consequence of the breach of laws or regulations.
Non-exchange transactions are transactions that are not exchange transactions. In a non-exchange transaction, anmunicipality either receives value from another municipality without directly giving approximately equal value in exchange, orgives value to another municipality without directly receiving approximately equal value in exchange.
Restrictions on transferred assets are stipulations that limit or direct the purposes for which a transferred asset may be used,but do not specify that future economic benefits or service potential is required to be returned to the transferor if not deployedas specified.
Stipulations on transferred assets are terms in laws or regulation, or a binding arrangement, imposed upon the use of atransferred asset by entities external to the reporting municipality.
The taxable event is the event that the government, legislature or other authority has determined will be subject to taxation.
Taxes are economic benefits or service potential compulsorily paid or payable to entities, in accordance with laws and orregulations, established to provide revenue to government. Taxes do not include fines or other penalties imposed forbreaches of the law.
Transfers are inflows of future economic benefits or service potential from non-exchange transactions, other than taxes.
Recognition
An inflow of resources from a non-exchange transaction recognised as an asset is recognised as revenue, except to theextent that a liability is also recognised in respect of the same inflow.
As the municipality satisfies a present obligation recognised as a liability in respect of an inflow of resources from a non-exchange transaction recognised as an asset, it reduces the carrying amount of the liability recognised and recognises anamount of revenue equal to that reduction.
27

Midvaal Local Municipality(Registration number GT 422)Annual Financial Statements for the year ended 30 June 2014
Accounting Policies
1.15 Revenue from non-exchange transactions (continued)
Measurement
Revenue from a non-exchange transaction is measured at the amount of the increase in net assets recognised by themunicipality.
When, as a result of a non-exchange transaction, the municipality recognises an asset, it also recognises revenue equivalentto the amount of the asset measured at its fair value as at the date of acquisition, unless it is also required to recognise aliability. Where a liability is required to be recognised it will be measured as the best estimate of the amount required to settlethe obligation at the reporting date, and the amount of the increase in net assets, if any, recognised as revenue. When aliability is subsequently reduced, because the taxable event occurs or a condition is satisfied, the amount of the reduction inthe liability is recognised as revenue.
Taxes (including property rates)
The municipality recognises an asset in respect of taxes when the taxable event occurs and the asset recognition criteria aremet.
Resources arising from taxes satisfy the definition of an asset when the municipality controls the resources as a result of apast event (the taxable event) and expects to receive future economic benefits or service potential from those resources.Resources arising from taxes satisfy the criteria for recognition as an asset when it is probable that the inflow of resourceswill occur and their fair value can be reliably measured. The degree of probability attached to the inflow of resources isdetermined on the basis of evidence available at the time of initial recognition, which includes, but is not limited to, disclosureof the taxable event by the taxpayer.
The municipality analyses the taxation laws to determine what the taxable events are for the various taxes levied.
The taxable event for property tax is the passing of the date on which the tax is levied, or the period for which the tax islevied, if the tax is levied on a periodic basis.
Taxation revenue is determined at a gross amount. It is not reduced for expenses paid through the tax system.
Transfers (including grants)
The municipality recognises an asset in respect of transfers when the transferred resources meet the definition of an assetand satisfy the criteria for recognition as an asset.
Transferred assets are measured at their fair value as at the date of acquisition.
Fines
Fines are recognised as revenue when the receivable meets the definition of an asset and satisfies the criteria forrecognition as an asset.
Assets arising from fines are measured at the best estimate of the inflow of resources to the municipality.
Where the municipality collects fines in the capacity of an agent, the fine is not revenue of the entity as collecting entity.
Bequests
Bequests that satisfy the definition of an asset are recognised as assets and revenue when it is probable that the futureeconomic benefits or service potential will flow to the municipality, and the fair value of the assets can be measured reliably.
Gifts and donations, including goods in-kind
Gifts and donations, including goods in kind, are recognised as assets and revenue when it is probable that the futureeconomic benefits or service potential will flow to the municipality and the fair value of the assets can be measured reliably.
Services in-kind
Services in-kind are not recognised.
1.16 Events after the reporting date
Events after the reporting date are those events, both favourable and unfavourable, that occur between the reporting dateand the date when the financial statements are authorised for issue. Two types of events can be identified:
* those that provide evidence of conditions that existed at the reporting date (adjusting events after the reporting date); and
28

Midvaal Local Municipality(Registration number GT 422)Annual Financial Statements for the year ended 30 June 2014
Accounting Policies
1.16 Events after the reporting date (continued)
* those that are indicative of conditions that arose after the reporting date (non-adjusting events after the reporting date).
The municipality adjusts the amounts recognised in its financial statements to reflect adjusting events after the reportingdate. The municipality does not adjust the amounts recognised in its financial statements to reflect non-adjusting events afterthe reporting date.
1.17 Commitments
The municipality discloses each class of capital assets (PPE, Investment properties, Intangible assets and Heritage assets)recognised in the financial statements, as well as future minimum lease payments under non-cancellable operating leases,for each of the following periods:
• Not later than one year,• Later than one year and not later than five years, and• Later than five years
1.18 Budget information
Municipality are typically subject to budgetary limits in the form of appropriations or budget authorisations (or equivalent),which is given effect through authorising legislation, appropriation or similar.
General purpose financial reporting by municipality should provide information on whether resources were obtained and usedin accordance with the legally adopted budget.
The approved budget is prepared on an accrual basis and presented y economic classification linked to performanceoutcome objectives.
The approved budget covers the fiscal period from 01 July 2013 to 30 June 2014.
The annual annual financial statements and the budget are on the same basis of accounting therefore a comparison withthe budgeted amounts for the reporting period have been included in the Statement of comparison of budget and actualamounts.
1.19 Related parties
A related party is a person or an entity with the ability to control or jointly control the other party, or exercise significantinfluence over the other party, or vice versa, or an entity that is subject to common control, or joint control. Related partyrelationships where control exists are disclosed regardless of whether any transactions took place between the parties duringthe reporting period.
In considering each possible related party relationship, attention is directed to the substance of the relationship, and notmerely the legal form.
Related parties include:
* Key management personnel, close members of the family of key management personnel and councillors.
Key management personnel include all directors or members of the municipal council of the reporting entity where thatcouncil has jurisdiction. The council, together with the Municipal Manager and Section 57 employees has authority andresponsibility to plan and control the activities of the municipality, to manage the resources and for the overall achievementof municipal objectives.
Close members of the family of an individual are close relatives of the individual or members of the individual’s immediatefamily who can be expected to influence, or be influenced by, that individual in their dealings with the entity.
Only transactions with related parties not at arm’s length or not in the ordinary course of business are disclosed.
29
Midvaal Local Municipality(Registration number GT 422)Annual Financial Statements for the year ended 30 June 2014
Accounting Policies
1.20 Borrowing costs
Borrowing costs that are directly attributable to the acquisition, construction or production of a qualifying asset are capitalisedas part of the cost of that asset until such time as the asset is ready for its intended use. The amount of borrowing costseligible for capitalisation is determined as follows:
* Actual borrowing costs on funds specifically borrowed for the purpose of obtaining a qualifying asset less any investment income on the temporary investment of those borrowings.
* Weighted average of the borrowing costs applicable to the municipality on funds generally borrowed for the purpose of obtaining a qualifying asset.
The capitalisation of borrowing costs commences when all the following conditions have been met:
* expenditures for the asset have been incurred;
* borrowing costs have been incurred; and
* activities that are necessary to prepare the asset for its intended use or sale are undertaken.
When the carrying amount or the expected ultimate cost of the qualifying asset exceeds its recoverable amount orrecoverable service amount or net realisable value or replacement cost, the carrying amount is written down or written off inaccordance with the accounting policy on impairment of assets. In certain circumstances the amount of the write-down orwrite-off is written back in accordance with the same accounting policy.
Capitalisation is suspended during extended periods in which active development is interrupted. Extend periods are periodsthat exceed 24 months.
Capitalisation ceases when substantially all the activities necessary to prepare the qualifying asset for its intended use orsale are complete.
When the municipality completes the construction of a qualifying asset in parts and each part is capable of being used whileconstruction continues on other parts, the municipality ceases capitalising borrowing costs when it completes substantially allthe activities necessary to prepare that part for its intended use or sale.
All other borrowing costs are recognised as an expense in the period in which they are incurred.
1.21 VAT
The municipality accounts for Value Added Tax (VAT) on the payments basis.
1.22 Comparative figures
Where necessary, comparative figures have been reclassified to conform to changes in presentation in the current year.
When the presentation or classification of items in the annual financial statements is amended, prior period comparativeamounts are restated. The nature and reason of reclassification is disclosed. Where material prior period errors have beenidentified in the current year, the correction is made retrospectively as far as is practicable and the prior year comparativesare restated accordingly.
1.23 Unauthorised expenditure
Unauthorised expenditure is expenditure that has not been budgeted for, expenditure that is not in terms of the conditions ofan allocation received from another sphere of government, economic entity or organ of state and expenditure in the form of agrant that is not permitted in terms of the Municipal Finance Management Act (Act No.56 of 2003). Unauthorised expenditureis accounted for as an expense in the Statement of Financial Performance and where recovered, it is subsequentlyaccounted for as revenue in the Statement of Financial Performance.
1.24 Fruitless and wasteful expenditure
Fruitless and wasteful expenditure is expenditure which was made in vain and would have been avoided had reasonablecare been exercised.
All expenditure relating to fruitless and wasteful expenditure is recognised as an expense in the statement of financialperformance in the year that the expenditure was incurred. The expenditure is classified in accordance with the nature of theexpense, and where recovered, it is subsequently accounted for as revenue in the statement of financial performance.
30

Midvaal Local Municipality(Registration number GT 422)Annual Financial Statements for the year ended 30 June 2014
Accounting Policies
1.25 Irregular expenditure
Irregular expenditure is expenditure that is contrary to the Municipal Finance Management Act (Act No.56 of 2003), theMunicipal Systems Act (Act No.32 of 2000), and the Public Office Bearers Act (Act No. 20 of 1998) or is in contravention ofthe economic entity’s supply chain management policy. Irregular expenditure excludes unauthorised expenditure. Irregularexpenditure is accounted for as expenditure in the Statement of Financial Performance and where recovered, it issubsequently accounted for as revenue in the Statement of Financial Performance.
31

Midvaal Local Municipality(Registration number GT 422)Annual Financial Statements for the year ended 30 June 2014
Notes to the Annual Financial Statements
2. New standards and interpretations
2.1 Standards and interpretations issued, but not yet effective
The municipality has not applied the following standards and interpretations, which have been published and are mandatoryfor the municipality’s accounting periods beginning on or after 01 July 2014 or later periods:
Standard/ Interpretation: Effective date:Years beginning on orafter
Expected impact:
GRAP 18: Segment Reporting 01 July 2014 Not material GRAP 105: Transfers of functions between entities under
common control01 July 2014 Not material
GRAP 106: Transfers of functions between entities notunder common control
01 July 2014 Not material
GRAP 107: Mergers 01 July 2014 Not material GRAP 20: Related parties 01 July 2014 Not material IGRAP 11: Consolidation – Special purpose entities 01 July 2014 Not material IGRAP 12: Jointly controlled entities – Non-monetary
contributions by ventures01 July 2014 Not material
GRAP 6 (as revised 2010): Consolidated and SeparateFinancial Statements
01 July 2014 Not material
GRAP 7 (as revised 2010): Investments in Associates 01 July 2014 Not material GRAP 8 (as revised 2010): Interests in Joint Ventures 01 July 2014 Not material GRAP32: Service Concession Arrangements: Grantor 01 July 2014 Not material GRAP108: Statutory Receivables 01 July 2014 Not material IGRAP17: Service Concession Arrangements where a
Grantor Controls a Significant Residual Interest in an Asset01 July 2014 Not material
3. Consumer debtors
Gross balancesRates 34 048 503 28 556 944Electricity 27 647 026 23 929 857Water 44 810 696 34 625 801Sewerage 13 636 893 12 302 518Refuse 11 113 050 9 373 565VAT 12 155 928 10 701 587Other 37 594 077 38 869 505
181 006 173 158 359 777
Less: Allowance for impairmentRates (13 881 542) (10 102 263)Electricity (3 769 340) (3 953 549)Water (15 288 189) (15 524 787)Sewerage (5 852 258) (6 445 264)Refuse (4 808 274) (4 488 345)Other (22 479 863) (22 694 342)
(66 079 466) (63 208 550)
Net balanceRates 20 166 961 18 454 681Electricity 23 877 686 19 976 308Water 29 522 507 19 101 014Sewerage 7 784 635 5 857 254Refuse 6 304 776 4 885 220VAT 12 155 928 10 701 587Other 15 114 214 16 175 163
114 926 707 95 151 227
RatesCurrent (0 -30 days) 5 826 724 5 175 32731 - 60 days 1 013 450 5 281 30161 - 90 days 1 283 203 148 85491 - 120 days 677 099 81 946121 - 365 days 3 069 969 2 042 086
32
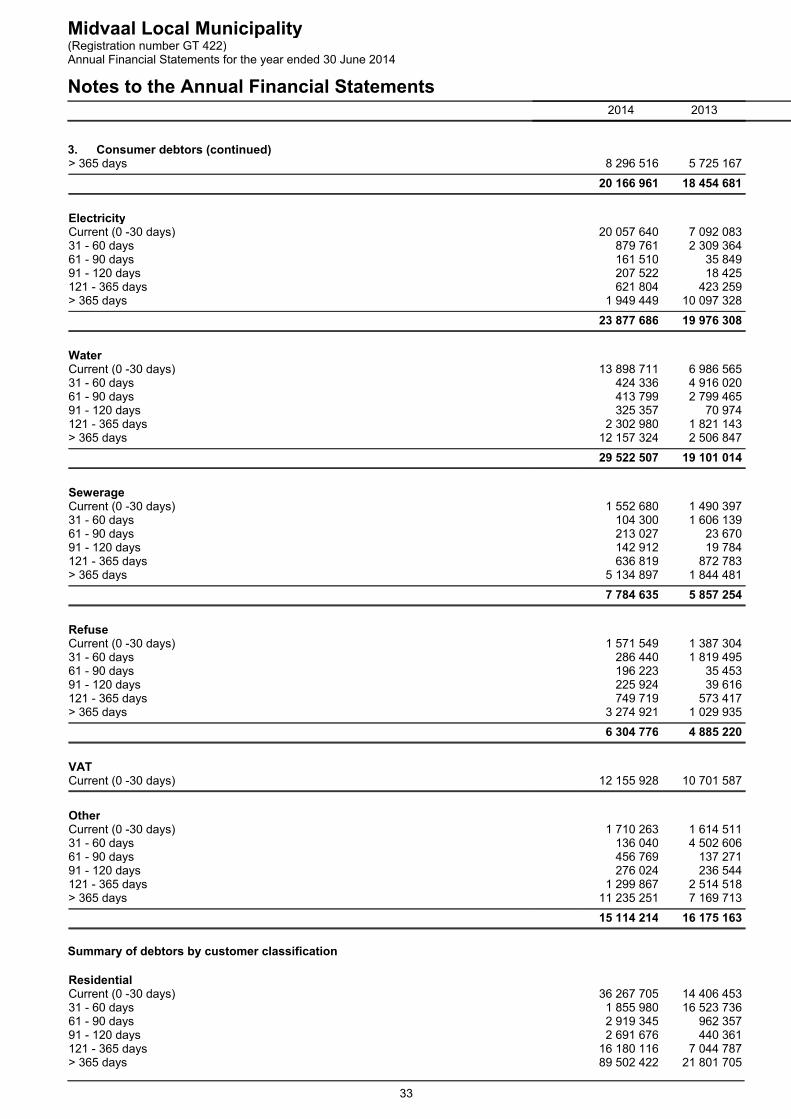
Midvaal Local Municipality(Registration number GT 422)Annual Financial Statements for the year ended 30 June 2014
Notes to the Annual Financial Statements2014 2013
3. Consumer debtors (continued)> 365 days 8 296 516 5 725 167
20 166 961 18 454 681
ElectricityCurrent (0 -30 days) 20 057 640 7 092 08331 - 60 days 879 761 2 309 36461 - 90 days 161 510 35 84991 - 120 days 207 522 18 425121 - 365 days 621 804 423 259> 365 days 1 949 449 10 097 328
23 877 686 19 976 308
WaterCurrent (0 -30 days) 13 898 711 6 986 56531 - 60 days 424 336 4 916 02061 - 90 days 413 799 2 799 46591 - 120 days 325 357 70 974121 - 365 days 2 302 980 1 821 143> 365 days 12 157 324 2 506 847
29 522 507 19 101 014
SewerageCurrent (0 -30 days) 1 552 680 1 490 39731 - 60 days 104 300 1 606 13961 - 90 days 213 027 23 67091 - 120 days 142 912 19 784121 - 365 days 636 819 872 783> 365 days 5 134 897 1 844 481
7 784 635 5 857 254
RefuseCurrent (0 -30 days) 1 571 549 1 387 30431 - 60 days 286 440 1 819 49561 - 90 days 196 223 35 45391 - 120 days 225 924 39 616121 - 365 days 749 719 573 417> 365 days 3 274 921 1 029 935
6 304 776 4 885 220
VATCurrent (0 -30 days) 12 155 928 10 701 587
OtherCurrent (0 -30 days) 1 710 263 1 614 51131 - 60 days 136 040 4 502 60661 - 90 days 456 769 137 27191 - 120 days 276 024 236 544121 - 365 days 1 299 867 2 514 518> 365 days 11 235 251 7 169 713
15 114 214 16 175 163
Summary of debtors by customer classification
ResidentialCurrent (0 -30 days) 36 267 705 14 406 45331 - 60 days 1 855 980 16 523 73661 - 90 days 2 919 345 962 35791 - 120 days 2 691 676 440 361121 - 365 days 16 180 116 7 044 787> 365 days 89 502 422 21 801 705
33

Midvaal Local Municipality(Registration number GT 422)Annual Financial Statements for the year ended 30 June 2014
Notes to the Annual Financial Statements2014 2013
3. Consumer debtors (continued)
149 417 244 61 179 399Less: Allowance for impairment (60 021 953) (57 563 060)
89 395 291 3 616 339
Industrial/ commercialCurrent (0 -30 days) 11 539 908 8 979 70631 - 60 days 1 389 628 3 574 67961 - 90 days 419 730 2 211 91491 - 120 days 138 536 10 904121 - 365 days 1 306 079 833 737> 365 days 8 969 736 3 023 280
23 763 617 18 634 220Less: Allowance for impairment (6 051 288) (5 627 500)
17 712 329 13 006 720
National and provincial governmentCurrent (0 -30 days) 390 071 360 03031 - 60 days 16 223 336 51061 - 90 days 55 684 6 29291 - 120 days 35 669 16 023121 - 365 days 637 720 368 682> 365 days 6 689 941 3 548 488
7 825 308 4 636 025Less: Allowance for impairment (6 225) (17 990)
7 819 083 4 618 035
TotalCurrent (0 -30 days) 48 197 687 45 410 50131 - 60 days 3 261 830 28 448 52361 - 90 days 3 394 760 3 446 70291 - 120 days 2 865 882 723 510121 - 365 days 18 123 915 19 210 731> 365 days 105 162 099 61 119 810
181 006 173 158 359 777Less: Allowance for impairment (66 079 466) (63 208 550)
114 926 707 95 151 227
Less: Provision for debt impairment31 - 60 days (600 823) (9 937 107)61 - 90 days (148 126) (266 139)91 - 120 days (450 918) (256 221)121 - 365 days (783 853) (10 963 526)> 365 days (64 095 746) (41 785 557)
(66 079 466) (63 208 550)
Reconciliation of allowance for impairmentBalance at beginning of the year (63 208 550) (51 621 740)Contributions to allowance (23 500 868) (27 322 872)Debt impairment written off against allowance 20 629 952 15 736 062
(66 079 466) (63 208 550)
Credit quality of consumer debtors
The credit quality of consumer debtors that are neither past nor due nor impaired can be assessed by reference to externalcredit ratings (if available) or to historical information about counterparty default rates:
Consumer debtors impaired
As of 30 June 2014, ageing consumer debtors of R 66 079 466 (2013: R 63 208 551) were impaired and provided for.
34

Midvaal Local Municipality(Registration number GT 422)Annual Financial Statements for the year ended 30 June 2014
Notes to the Annual Financial Statements2014 2013
3. Consumer debtors (continued)
Receivables from non-exchange transactions (included in consumer debtors)Property rates 20 166 961 18 454 681
All other receivables included in consumer debtors are receivables from exchange transactions.
4. Cash and cash equivalents
Cash and cash equivalents consist of:
Bank balances 91 069 048 24 608 922Short-term deposits - 15 500 000Other cash and cash equivalents 401 776 375 265
91 470 824 40 484 187
Current Account (Primary bank account)ABSA Bank Ltd - Public Gauteng East Branch - Account Number 405 320 3845.
Current Account (Traffic fines): First National Bank - Meyerton Branch - Account Number 620 8373 4262.
Credit quality of cash at bank and short term deposits, excluding cash on hand
The credit quality of cash at bank and short term deposits, excluding cash on hand that are neither past due nor impairedcan be assessed by reference to external credit ratings (if available) or historical information about counterparty default rates.
Guarantees held in lieu of Electricity and Water deposits:
2014 2013
Sedibeng breweries 7 109 000 7 109 000Other 185 200 185 200
Total 7 294 200 7 294 200
The municipality had the following bank accounts
`
Account number / description Bank statement balances Cash book balances30 June 2014 30 June 2013 30 June 2012 30 June 2014 30 June 2013 30 June 2012
ABSA Bank Ltd - PublicGauteng East Branch - Accountnumber 405 320 3845
90 432 855 23 494 117 2 947 530 90 330 311 23 266 483 2 947 530
FNB - Account number62083734262
738 737 1 342 439 9 401 738 737 1 342 439 9 401
Total 91 171 592 24 836 556 2 956 931 91 069 048 24 608 922 2 956 931
5. VAT receivable
VAT 8 822 049 6 425 749
6. Inventories
Maintenance materials - Electricity 4 914 679 4 233 565Maintenance materials - Water 1 523 831 1 850 547Water 275 729 269 279Fuel (Diesel, Petrol) 127 711 145 754
6 841 950 6 499 145
7. Other receivables from exchange transactions
Sundry debtors 2 382 213 4 414 691
35

Midvaal Local Municipality(Registration number GT 422)Annual Financial Statements for the year ended 30 June 2014
Notes to the Annual Financial Statements2014 2013
7. Other receivables from exchange transactions (continued)Rental 107 464 14 790Conditional bursaries repaid 7 734 3 030Traffic offences 900 -Cashier Shortfall 87 -
2 498 398 4 432 511
Credit quality of trade and other receivables
The credit quality of trade and other receivables that are neither past nor due nor impaired can be assessed by reference toexternal credit ratings (if available) or to historical information about counterparty default rates:
8. Other receivables from non-exchange transactions
Fines 1 364 580 928 095Government grants and subsidies 934 510 577 042
2 299 090 1 505 137
Credit quality of other receivables from non-exchange transactions
The credit quality of other receivables from non-exchange transactions that are neither past nor due nor impaired can beassessed by reference to external credit ratings (if available) or to historical information about counterparty default rates.
Other receivables from non-exchange transactions impaired
As of 30 June 2014, other receivables from non-exchange transactions of R 34 108 209 were impaired and provided for.
The amount of the provision was R 34 108 209 as of 30 June 2014 (2013: R -).
36

Midvaal Local Municipality(Registration number GT 422)Annual Financial Statements for the year ended 30 June 2014
Notes to the Annual Financial Statements
9. Property, plant and equipment
2014 2013
Cost /Valuation
Accumulateddepreciation
andaccumulatedimpairment
Carrying value Cost /Valuation
Accumulateddepreciation
andaccumulatedimpairment
Carrying value
Land 85 528 891 - 85 528 891 84 420 938 - 84 420 938Infrastructure 2 478 299 817 (615 419 671) 1 862 880 146 2 413 807 641 (515 140 513) 1 898 667 128Community 124 276 754 (38 513 551) 85 763 203 120 820 873 (29 104 040) 91 716 833Other property, plant and equipment 48 629 623 (29 664 062) 18 965 561 46 255 512 (26 385 370) 19 870 142Other leased Assets 17 874 198 (3 784 277) 14 089 921 10 401 185 (2 525 580) 7 875 605
Total 2 754 609 283 (687 381 561) 2 067 227 722 2 675 706 149 (573 155 503) 2 102 550 646
Reconciliation of property, plant and equipment and intangible assets - 2014
Openingbalance
Additions Disposals Transfers Otheradjustments
Depreciation Impairmentloss
Impairmentreversal
Total
Land 84 420 938 1 107 953 - - - - - - 85 528 891Infrastructure 1 898 667 128 64 736 529 (94 233) - - (99 962 013) (1 790 079) 1 322 814 1 862 880 146Community 91 716 833 8 713 197 (9 710 195) - 4 452 879 (9 409 511) (330 087) 330 087 85 763 203Other property, plant andequipment
19 870 142 5 310 309 (528 339) (1 383 729) - (4 306 569) (19 509) 23 256 18 965 561
Other leased Assets 7 875 605 6 087 782 - 1 383 729 - (1 257 195) - - 14 089 921
2 102 550 646 85 955 770 (10 332 767) - 4 452 879 (114 935 288) (2 139 675) 1 676 157 2 067 227 722
Reconciliation of property, plant and equipment and intangible assets - 2013
Openingbalance
Additions Depreciation Impairmentloss
Total
Land 84 420 938 - - - 84 420 938Infrastructure 1 906 229 999 88 421 116 (95 765 925) (218 062) 1 898 667 128Community 85 510 461 15 763 340 (8 971 933) (585 035) 91 716 833Other property, plant and equipment 20 222 112 3 473 059 (3 801 773) (23 256) 19 870 142Other leased Assets 7 757 371 1 311 812 (1 193 578) - 7 875 605
2 104 140 881 108 969 327 (109 733 209) (826 353) 2 102 550 646
37
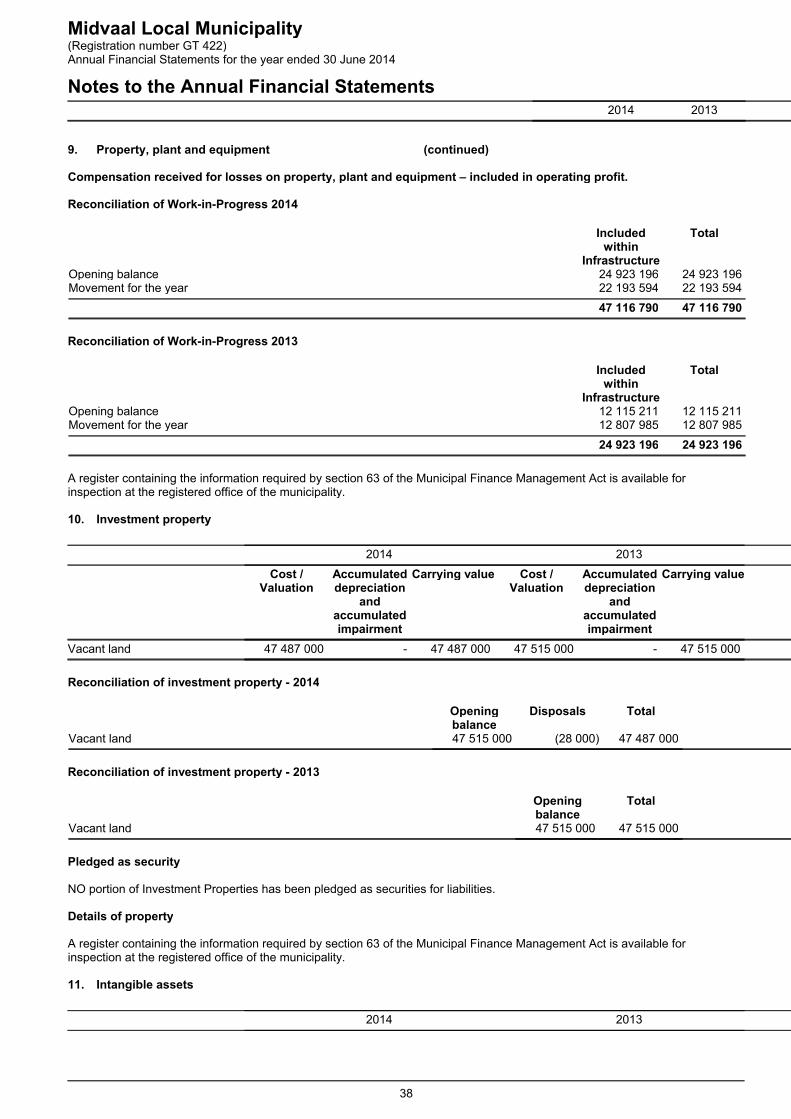
Midvaal Local Municipality(Registration number GT 422)Annual Financial Statements for the year ended 30 June 2014
Notes to the Annual Financial Statements2014 2013
9. Property, plant and equipment (continued)
Compensation received for losses on property, plant and equipment – included in operating profit.
Reconciliation of Work-in-Progress 2014
Includedwithin
Infrastructure
Total
Opening balance 24 923 196 24 923 196Movement for the year 22 193 594 22 193 594
47 116 790 47 116 790
Reconciliation of Work-in-Progress 2013
Includedwithin
Infrastructure
Total
Opening balance 12 115 211 12 115 211Movement for the year 12 807 985 12 807 985
24 923 196 24 923 196
A register containing the information required by section 63 of the Municipal Finance Management Act is available forinspection at the registered office of the municipality.
10. Investment property
2014 2013
Cost /Valuation
Accumulateddepreciation
andaccumulatedimpairment
Carrying value Cost /Valuation
Accumulateddepreciation
andaccumulatedimpairment
Carrying value
Vacant land 47 487 000 - 47 487 000 47 515 000 - 47 515 000
Reconciliation of investment property - 2014
Openingbalance
Disposals Total
Vacant land 47 515 000 (28 000) 47 487 000
Reconciliation of investment property - 2013
Openingbalance
Total
Vacant land 47 515 000 47 515 000
Pledged as security
NO portion of Investment Properties has been pledged as securities for liabilities.
Details of property
A register containing the information required by section 63 of the Municipal Finance Management Act is available forinspection at the registered office of the municipality.
11. Intangible assets
2014 2013
38

Midvaal Local Municipality(Registration number GT 422)Annual Financial Statements for the year ended 30 June 2014
Notes to the Annual Financial Statements2014 2013
11. Intangible assets (continued)Cost /
ValuationAccumulatedamortisation
andaccumulatedimpairment
Carrying value Cost /Valuation
Accumulatedamortisation
andaccumulatedimpairment
Carrying value
Computer software, other 1 498 970 (137 539) 1 361 431 1 283 195 (52 195) 1 231 000
Reconciliation of intangible assets - 2014
Openingbalance
Additions Amortisation Total
Computer software, other 1 231 000 215 775 (85 344) 1 361 431
Reconciliation of intangible assets - 2013
Openingbalance
Amortisation Total
Computer software, other 1 232 700 (1 700) 1 231 000
Pledged as security
NO portion of Intangible assets has been pledged as securities for liabilities.
A register containing the information required by section 63 of the Municipal Finance Management Act is available forinspection at the registered office of the municipality:
12. Heritage assets
2014 2013
Cost /Valuation
Accumulatedimpairment
losses
Carrying value Cost /Valuation
Accumulatedimpairment
losses
Carrying value
Other heritage assets 18 701 - 18 701 18 701 - 18 701
Reconciliation of heritage assets 2014
Openingbalance
Total
Other heritage assets 18 701 18 701
Reconciliation of heritage assets 2013
Openingbalance
Total
Other heritage assets 18 701 18 701
Pledged as security
NO portion of Heritage assets has been pledged as securities for liabilities.
A register containing the information required by section 63 of the Municipal Finance Management Act is available forinspection at the registered office of the municipality.
Transitional provisions
Heritage assets recognised at provisional amounts
In accordance with the transitional provisions as per Directive 4 of the GRAP Reporting Framework, certain heritage assetwas recognised at provisional amounts. Refer to the accounting policy on Heritage assets (policy note 1.7) for additionalinformation.
39

Midvaal Local Municipality(Registration number GT 422)Annual Financial Statements for the year ended 30 June 2014
Notes to the Annual Financial Statements2014 2013
13. Trade and other payables from exchange transactions
Trade payables 51 494 773 38 929 311Payments received in advanced 23 986 947 19 566 945Accrued leave pay 7 045 543 6 623 476Eskom 5 352 626 -Retenions 3 243 797 2 944 128Other payables 2 494 970 2 724 265Deposits received 671 025 671 025Sundry creditors - 58 836
94 289 681 71 517 986
The accrual for leave pay relates to vested leave pay to which employees may become entitled to upon leaving theemployment of the municipality. The provision arises as employees render a service that increases their entitlement tofuture compensated leave. The provision is utilised when employees who are entitled to leave pay, leave the employ of themunicipality or when the accrued leave due to an employee is utilised.
14. Consumer deposits
Consumer deposits - Electricity and water 10 273 776 9 804 398
15. External loans
At amortised costExternal loans 174 715 911 129 105 467
The loans are repayable in semi-annual installments. Interest is charged at rates varying between 6.75% and 15.26%
Non-current liabilitiesAt amortised cost 166 037 087 120 144 593
Current liabilitiesAt amortised cost 8 678 824 8 960 874
Loan Number Redeemable Balance at30 June 2013
Receivedduring the
period
Redeemedwritten offduring the
period
Balance at30 June 2014
LOAN 101 Lalf 15551,10 361 045 47 848 - 47 848 -LOAN 101 Lalf 15418,5 1 545 585 204 833 - 204 833 -LOAN 101 Lalf 154814,5 125 305 16 606 - 16 606 -LOAN 101 Lalf 15369,23 920 255 227 301 - 106 274 121 027L-023-M-101846/1 10 390 100 6 516 855 - 703 030 5 813 826L-024-M-101846/4 17 840 900 9 087 139 - 1 979 814 7 107 324L-25-M-103047/2 38 150 000 30 935 529 - 1 859 162 29 076 367L-026-M-103047/3 4 950 000 4 049 416 - 243 362 3 806 055L-027-M-103047/1 13 100 000 10 634 788 - 639 129 9 995 659L-28-M-103047/4 13 800 000 11 195 740 - 672 841 10 522 899L-032-M-103600/4 8 800 000 7 401 719 - 443 638 6 958 048L-030-M-103600/2 12 650 000 11 866 189 - 257 200 11 608 989L-029-M-103600/1 15 700 000 13 841 133 - 552 636 13 288 498L-031-M-103600/3 1 500 000 1 441 150 - 9 235 1 431 915L-033-103600/5 1 350 000 1 222 395 - 42 194 1 180 201INCA 2 600 000 132 067 - 132 067 -Standard 26 000 000 - 26 000 000 1 789 779 24 210 221Standard 34 000 000 - 34 000 000 3 354 149 30 645 851Standard 20 000 000 20 000 000 - 1 050 969 18 949 031
223 783 190 128 820 708 60 000 000 14 104 766 174 715 911
16. Finance lease obligation
40

Midvaal Local Municipality(Registration number GT 422)Annual Financial Statements for the year ended 30 June 2014
Notes to the Annual Financial Statements2014 2013
16. Finance lease obligation (continued)Minimum lease payments due - within one year 5 719 282 3 604 678 - in second to fifth year inclusive 11 628 350 7 638 214
17 347 632 11 242 892less: future finance charges (2 423 824) (1 480 726)
Present value of minimum lease payments 14 923 808 9 762 166
Non-current liabilities 10 859 806 6 920 797Current liabilities 4 064 002 2 841 369
14 923 808 9 762 166
It is municipality policy to lease certain motor vehicles and equipment under finance leases
The average lease term was 3-5 years and the average effective borrowing rate was 7%-10.70% (2013: 7%-10.70%).
The municipality's obligations under finance leases are secured by the lessor's charge over the leased assets.
Lease number Redeemable Balance at30 June 2013
Receivedduring the
period
Redeemedwrittem offduring the
period
Balance at30 June 2014
81086562 3 387 491 2 182 284 - 669 093 1 513 19181265513 645 332 425 790 - 126 572 299 218FLP01-0001H 2 676 851 1 695 369 - 540 717 1 154 652FLP021-0006S 2 046 208 1 321 152 - 408 400 912 752FLP021-003B 1 636 642 1 143 062 - 321 009 822 053WB004-0001B 205 080 199 927 - 63 884 136 043WB005-0002A 141 007 137 464 - 43 925 93 539WB006-0003T 208 976 203 882 - 63 142 140 740WB007-0004S 208 976 203 726 - 65 098 138 628WB008-0005L 205 080 199 927 - 63 884 136 043WB009-0006K 226 860 221 030 - 70 642 150 388WB010-0007J 159 064 159 064 - 49 262 109 80219977492-0001 1 074 031 913 415 - 192 705 720 71019977492-0002 486 027 413 345 - 87 201 326 14419977492-0003 402 938 342 729 - 72 295 270 43419977492-0004 554 705 - 554 705 69 353 485 35219974923-0005 476 716 - 476 716 59 603 417 11319977492-0006 399 931 - 399 931 50 419 349 51219977492-0007 2 134 741 - 2 134 741 230 882 1 903 85919977492-0008 5 000 754 - 500 754 13 643 487 11119977492-0009 1 228 213 - 1 228 213 33 459 1 194 75419977492-0010 10 093 820 - 1 093 820 31 379 1 062 44119977492-0011 279 300 - 279 300 8 080 271 22019977492-0012 986 100 - 986 100 10 977 975 12319977492-0013 373 534 - 373 534 5 890 367 64419977492-0014 485 342 - 485 342 - 485 342
35 723 719 9 762 166 8 513 156 3 351 514 14 923 808
17. Provisions
Reconciliation of provisions - 2014
OpeningBalance
Movements Total
Landfill rehabilitation 36 085 724 (5 917 855) 30 167 869Long service awards 5 241 000 2 120 000 7 361 000
41 326 724 (3 797 855) 37 528 869
Reconciliation of provisions - 2013
41

Midvaal Local Municipality(Registration number GT 422)Annual Financial Statements for the year ended 30 June 2014
Notes to the Annual Financial Statements2014 2013
17. Provisions (continued)OpeningBalance
Movements Total
Landfill rehabilition 23 252 887 12 832 837 36 085 724Long service awards 4 237 000 1 004 000 5 241 000
27 489 887 13 836 837 41 326 724
Non-current liabilities 37 102 722 41 326 724Current liabilities 426 147 -
37 528 869 41 326 724
Environmental rehabilitation provision - Landfill
Provisions are recognised when the Municipality has a present legal or constructive obligation as a result of past events, it isprobable that an outflow of resource embodying economic benefits or service potential will be required to settle the obligationand a reliable estimate of the provision can be made. Provisions are reviewed at reporting date and adjusted to reflect thecurrent best estimate of future outflows of resources. Where the effect is material, non-current provisions are discounted totheir present value using a discount rate that reflects the market’s current assessment of the time value of money,adjustedfor risks specific to the liability. The Municipality does not recognise a contingent liability or contingent asset. A contingentliability is disclosed unless the possibility of an outflow of resources embodying economic benefits or service potential isremote. A contingent asset is disclosed where an inflow of economic benefits or service potential is probable.
Future events that may affect the amount required to settle an obligation are reflected in the amount of a provision wherethere is sufficient objective evidence that they will occur. Gains from the expected disposal of assets are not taken intoaccount in measuring a provision. Provisions are not recognised for future operating losses. The present obligation under anonerous contract is recognised and measured as a provision. A provision for restructuring costs is recognised only when thefollowing criteria over and above the recognition criteria of a provision have been met:
(a) The Municipality has a detailed formal plan for the restructuring identifying at least:* The business or part of a business concerned;* The principal locations affected;* The location, function and approximate number of employees who will be compensated for terminating their services;* The expenditures that will be undertaken; and* When the plan will be implemented.(b) The Municipality has raised a valid expectation in those affected that it will carry out the restructuring by starting toimplement that plan or announcing its main features to those affected by it. The amount recognised as a provision is the bestestimate of the expenditure required to settle the present obligation at the reporting date. If it is no longer probable that anoutflow of resources embodying economic benefits or service potential will be required to settle the obligation, the provisionis de-recognised.
18. Employee benefit obligations
Defined benefit plan
Post retirement medical aid plan
Midvaal Municipality oparates on 5 accredited medical aid schemes, namely HOsmed, Key Health, SAMWU Med, Bonitasand LA Health.
Midvaal provides post-retirement benefits by subsidising the medical aid contributions of certain retired staff. According tothe rules of the medical aid funds, which the municipality is associated, a member (subject to the applicable conditions ofservice) on retirement, is entitled to remain a continued member of such medical fund, in which case the menber is liable forthe portion as determined by Council from time to time, of the medical aid membership fee, and the municipality for theremaining portion.
Management has revised their policy with regards staff that qualifies for post-retirement benefits. The Midvaal Municipalityhas resolved on the 19th September 2013 to not make post retirement medical benefits available to those who qualifies asper Salga's policy decission on post retirement medical and subsidies adopted by Salga Exco on 8 July 2004.
Pension benefits
Council and employees contribute towards the under-mentioned Pension Funds whose operations are subject to the Pension Fund Act, 1956. The municipality does not apply "defined benefit accounting" to defined benefit funds to which it is a member where thesefunds are classified in terms of GRAP25 as multi-employer plans, as sufficient information is not available to apply theprinciples involved. Information necessary to apply "defined benefit accounting" was requested from the various funds, but
42

Midvaal Local Municipality(Registration number GT 422)Annual Financial Statements for the year ended 30 June 2014
Notes to the Annual Financial Statements2014 2013
18. Employee benefit obligations (continued)information received from these funds were insufficient and in some instances no information could be obtained from thesefunds. This issue will be addressed in the future to ensure that these benefit plans could be accounted for as "defined benefitaccounting". As a result, GRAP25is applied and such funds are accounted for as defined contribution funds. The Council subscribes to the following pension funds:- Municipal Gratuity Fund- Municipal Employees Pension Fund - Joint Municipal Employees Pension Fund- Germiston Municipal Retirement Fund - Old Mutual Sala Pension Fund - National Fund For Municipal Workers- SAMWU National Provident Fund- Councillors Pension Fund- Germiston Defined Benefit Fund Germiston Municipal Retirement Fund (GMRF) is a defined contribution fund for active contributing memebers but a definedfund for certain pensioners under old rules taken up in the rules of the fund. During 2005 GMRF outsources the fulladministration of the pensioners component which relates to old rules of a defined benefit fund. To the extent that a surplusor deficit is in place, based on available information, this may affect the amount of the future contributions once these areassessed. In the case of surpluses, no change is made in the rate contributions. In the case of deficits, the municiaplity willincrease contributions on a phase in basis. To the extent that the full discounted value of obligations to the funds is not fullyaccounted for at year end, a contingent liability arises and is reported on accordingly.
Accrued Leave Pay
Liabilities for annual leave are recognised as they accrue to employees. The liability is based on the total accrued leave daysat the year end. Refer to Provisions note for leave pay provision
The amounts recognised in the statement of financial position are as follows:
Carrying valuePresent value of the defined benefit obligation-wholly unfunded (4 528 000) (36 414 000)
Changes in the present value of the defined benefit obligation are as follows:
Opening balance (36 414 000) (28 714 000)Benefits paid 180 000 663 080Net income/(expense) recognised in the statement of financial performance 31 706 000 (8 363 080)
(4 528 000) (36 414 000)
Net expense recognised in the statement of financial performance
Current service cost (3 045 000) (2 122 000)Interest cost (2 780 000) (2 000 000)Actuarial (gains) losses 37 531 000 (4 241 080)
31 706 000 (8 363 080)
Key assumptions used
Assumptions used at the reporting date:
Discount rates used %9,00 %7,40Consumer price inflation %7,10 %5,66Medical aid inflation %8,10 %6,66
19. Service charges
Sale of electricity 235 073 921 214 454 263Sale of water 133 849 287 117 082 272Sewerage and sanitation charges 27 251 888 24 318 753Refuse removal 25 362 757 21 315 914
421 537 853 377 171 202
43

Midvaal Local Municipality(Registration number GT 422)Annual Financial Statements for the year ended 30 June 2014
Notes to the Annual Financial Statements2014 2013
20. Property rates
Rates received
Residential 123 457 711 317 810 160Commercial 33 986 411 (236 783 144)State 3 456 451 9 221 835Other 885 646 2 190 117Agricultural 5 339 039 60 630 195Less: Income forgone (60 967 893) (58 716 050)
106 157 365 94 353 113
Valuations
Residential 11 499 164 11 931 418Agricultural 6 847 443 7 966 797Commercial 2 813 719 2 326 161Other 357 061 631 577Municipal 296 833 453 301State 292 183 300 354
22 106 403 23 609 608
Valuations on land and buildings are performed every 4 years. The last general valuation came into effect on 1 July 2011.Interim valuations are processed on an annual basis to take into account changes in individual property values due toalterations and subdivisions.
A general rate of R 0.0122 - (2013: R0.0110) is applied to property valuations to determine assessment rates. Rebates aregranted to residential and state property owners amounting to R60 967 8893.
Rates are levied on a monthly basis and interest is levied after due date.
21. Government grants and subsidies
Operating grants
Equitable Share 50 957 000 47 515 000Specific Contribution towards Councillors ( Equitable Share) 3 716 000 3 318 000Provincial Health Subsidies 4 417 389 4 674 378DSRAC Grant 2 500 000 2 440 000Environmental Subsidy Grant 2 426 316 1 854 735Financial Management Grant 1 242 000 1 213 000EPWP Grant 1 000 000 1 000 000Municpal System Improvement Grant 890 000 1 000 000HIV Grant - 185 000Efficient Energy Demand Management Side Grant 8 999 700 -
76 148 405 63 200 113
Capital grantsMunicipal Infrastructure Grant 27 158 000 26 711 000Financial Management Grant 1 158 000 1 037 000DSRAC Grant 100 000 1 000 000Regional Bulk Infrastracture Grant - 4 258 161
28 416 000 33 006 161
104 564 405 96 206 274
Equitable Share
In terms of the Constitution, this grant is used to subsidise the provision of basic services to indigent community members.
All registered indigents receive a monthly subsidy , which is funded from the grant.
Equitable Share
Current-year receipts (54 673 000) (50 833 000)Conditions met - transferred to revenue 54 673 000 50 833 000
44

Midvaal Local Municipality(Registration number GT 422)Annual Financial Statements for the year ended 30 June 2014
Notes to the Annual Financial Statements2014 2013
21. Government grants and subsidies (continued)- -
Financial Management Grant
Current-year receipts (2 821 700) (2 250 000)Conditions met - transferred to revenue 2 821 700 2 250 000
- -
Municipal System Improvement Grant
Current-year receipts (890 000) (1 000 000)Conditions met - transferred to revenue 890 000 1 000 000Other - -
- -
Municipal Infrasructure Grant
Current-year receipts (27 158 000) (26 711 000)Conditions met - transferred to revenue 27 158 000 26 711 000Other - -
- -
DCSAR
Current-year receipts (2 600 000) (3 440 000)Conditions met - transferred to revenue 2 600 000 3 440 000Other - -
- -
EPWP
Current-year receipts (1 000 000) (1 000 000)Conditions met - transferred to revenue 1 000 000 1 000 000Other - -
- -
Health
Current-year receipts (3 551 812) (4 674 378)Conditions met - transferred to revenue 3 551 812 4 674 378Other - -
- -
Environmental health
Current-year receipts (1 973 235) (1 854 735)Conditions met - transferred to revenue 1 973 235 1 854 735
- -
HIV programme
Current-year receipts - (185 000)
45

Midvaal Local Municipality(Registration number GT 422)Annual Financial Statements for the year ended 30 June 2014
Notes to the Annual Financial Statements2014 2013
21. Government grants and subsidies (continued)Conditions met - transferred to revenue - 185 000
- -
RBIG
Current-year receipts - (4 258 161)Conditions met - transferred to revenue - 4 258 161
- -
Efficient Energy Demand Management Side Grant
Current-year receipts (8 578 000) -Conditions met - transferred to revenue 8 578 000 -
- -
Changes in level of government grants
Based on the allocations set out in the Division of Revenue Act, no significant changes in the level of government grantfunding are expected over the forthcoming 3 financial years.
22. Other income
Reconnection fees 4 936 591 4 884 522Sundry Income 3 690 371 3 256 412Rehabilition fees (Landfill site) 2 910 777 2 677 248New connection fees 2 725 296 5 635 616Building Plans 1 485 716 1 567 984Vacuum tank services 1 315 891 1 427 843Service charges 785 304 384 426Cemetery Income 498 601 482 033Seta 400 678 662 708Planning fees and permits 380 153 276 901Advertising 420 762 68 797Telephone Income 157 185 143 419Final Readings 120 367 102 796Clearance / Caluation Certificates 109 816 119 605Entrance fees 94 021 94 222Cleaning of Stands 61 161 19 807Building plan copies and fees 50 129 53 076Reconnection fees 42 539 26 612Traffic Escourts 38 740 30 316Surplus Cash 6 651 2 173Meter test fees 5 250 4 973Impounding of Vehicles 5 042 3 884Lost and damage Liabary material 2 945 5 892Dishonoured Cheques 2 875 2 219Membership fees 2 312 1 004Lost tokens 316 570
20 249 489 21 935 058
23. Investment revenue
Interest received - InvestmentsBank 4 850 916 2 036 636
24. Bulk purchases
Electricity 168 068 806 155 477 814Water 82 162 238 70 181 839
250 231 044 225 659 653
46

Midvaal Local Municipality(Registration number GT 422)Annual Financial Statements for the year ended 30 June 2014
Notes to the Annual Financial Statements2014 2013
25. Employee related costs
Basic 60 159 205 87 982 288Pension costs 19 694 882 18 301 408Medical aid - company contributions 8 329 304 7 882 100Overtime payments 7 098 477 6 927 021Leave bonus 6 971 281 6 890 205Travel, motor car, accommodation, subsistence and other allowances 5 806 106 6 093 538Acting allowances 2 348 641 2 127 788Leave pay 1 169 695 1 108 266Skills development levy 1 123 713 1 143 155Cell phone allowance 1 092 983 927 752UIF 885 004 847 417Housing benefits and allowances 743 477 828 522Group insurance 222 604 230 040Other payroll levies 45 869 42 456
115 691 241 141 331 956
Remuneration of Municipal Manager- A.S.A De Klerk
Annual Remuneration 1 128 362 1 126 013Car Allowance 168 000 120 000Contributions to UIF, Medical and Pension Funds 172 174 162 907Other 52 246 -
1 520 782 1 408 920
Remuneration of Chief Financial Officer - A.L. Van Schalkwyk
2013
The position of the chief financial officer was held by W Van Niekerk for the period July 2012 to April 2013. A.L. VanSchalkwyk was appointed as chief financial officer on 1 May 2013.
Annual Remuneration 874 031 912 979Car Allowance 144 000 84 000Contributions to UIF, Medical and Pension Funds 193 185 254 333Other 33 572 -
1 244 788 1 251 312
Remuneration of the ED Community Services - S.M. Mosidi
Annual Remuneration 811 720 713 616Car Allowance 216 168 180 000Contributions to UIF, Medical and Pension Funds 183 496 154 279Other 24 000 -
1 235 384 1 047 895
Remuneration ofthe ED Engineering Services - S. Coetzee
Annual Remuneration 865 575 928 271Car Allowance 157 466 156 000Contributions to UIF, Medical and Pension Funds 187 905 185 069Other 24 000 -
1 234 946 1 269 340
Remunreration of the ED Corporate Services - T.W. Peters
Annual Remuneration 1 276 935 1 225 390Car Allowance 60 834 60 000Contributions to UIF, Medical and Pension Funds 1 784 13 689Other 24 150 -
1 363 703 1 299 079
47

Midvaal Local Municipality(Registration number GT 422)Annual Financial Statements for the year ended 30 June 2014
Notes to the Annual Financial Statements2014 2013
25. Employee related costs (continued)
Remuneration of the ED Human Resources - B. Motsukunyane
Annual Remuneration 974 212 991 129Car Allowance 60 000 60 000Contributions to UIF, Medical and Pension Funds 177 004 175 959Other 24 000 -
1 235 216 1 227 088
Remuneration of the ED Protection Services - E. Lensley
Annual Remuneration 977 514 1 020 087Car Allowance 30 000 30 000Contributions to UIF, Medical and Pension Funds 203 701 246 574Other 24 150 -
1 235 365 1 296 661
Remuneration of the ED Development Planning and Housing - H. Human
Annual Remuneration 924 191 938 280Car Allowance 145 068 144 000Contributions to UIF, Medical and Pension Funds 143 025 144 808Other 24 000 -
1 236 284 1 227 088
26. Depreciation and amortisation
Property, plant and equipment 115 484 153 109 753 182
27. Contracted services
Specialist Services 49 172 325 48 879 520Other Contractors 6 842 755 -
56 015 080 48 879 520
28. General expenses
Advertising 1 136 679 1 323 308Auditors remuneration 2 140 825 2 787 065Bank charges 1 276 757 1 234 066Community development and training 1 487 865 1 339 382Computer expenses 198 840 230 046Consulting and professional fees 2 283 195 2 151 202Consumables 3 471 589 7 155 169Convention bureau - 11 762Delivery expenses 1 704 399 1 939 072Donations 227 746 237 010Entertainment 469 640 373 825Fleet 5 081 063 -Gifts 99 327 100 720Insurance 1 721 049 896 791Magazines, books and periodicals 239 365 56 250Medical expenses 380 915 23 790Motor vehicle expenses 200 575 217 969Non-capital Assets expensed 700 087 873 319Other expenses 2 111 632 1 589 749Packaging 496 20 911Postage and courier 892 079 955 038Printing and stationery 2 747 644 1 008 556Protective clothing 1 401 234 1 367 904Rental 7 575 589 6 961 289Secretarial fees 334 689 496 619
48

Midvaal Local Municipality(Registration number GT 422)Annual Financial Statements for the year ended 30 June 2014
Notes to the Annual Financial Statements2014 2013
28. General expenses (continued)Services to informal settlements 1 772 636 347 357Subscriptions and membership fees 2 834 730 503 785Telephone and fax 993 353 1 064 862Training 853 780 853 959Transport and freight 30 502 -Travel - local 1 074 725 975 331Valuation Roll 233 509 212 564
45 676 514 37 308 670
29. Debt impairment
Debt impairment - Traffic fines 34 108 209 -Contributions to debt impairment provision 23 500 868 27 322 871
57 609 077 27 322 871
30. Finance costs
Non-current borrowings 16 038 571 13 276 071Unwinding of discount - landfill site provision 683 757 2 843 789
16 722 328 16 119 860
31. Remuneration of councillors
Councillors 8 740 935 7 874 951
The Executive Mayor, Speaker and Mayoral Committee Members are full-time employees.
Each is provided with an office and secretarial support at cost of the council. Remuneration of the Mayor:
2014 2013
Allowance 508 370 484 162Travel 169 457 161 387Telephone 20 868 19 872
Subtotal 698 695 665 421
Remuneration of the MMC's:
2014 2013
Allowance 1 906 388 1 815 608Travel 635 463 605 203Telephone 104 340 99 360
Subtotal 2 646 191 2 520 171
Remuneration of the Speaker:
2014 2013
Allowance 406 696 387 329Travel 135 565 129 710Telephone 20 868 19 872
Subtotal 563 129 536 911
Remuneration of Section 79 Committee Members:
2014 2013
49
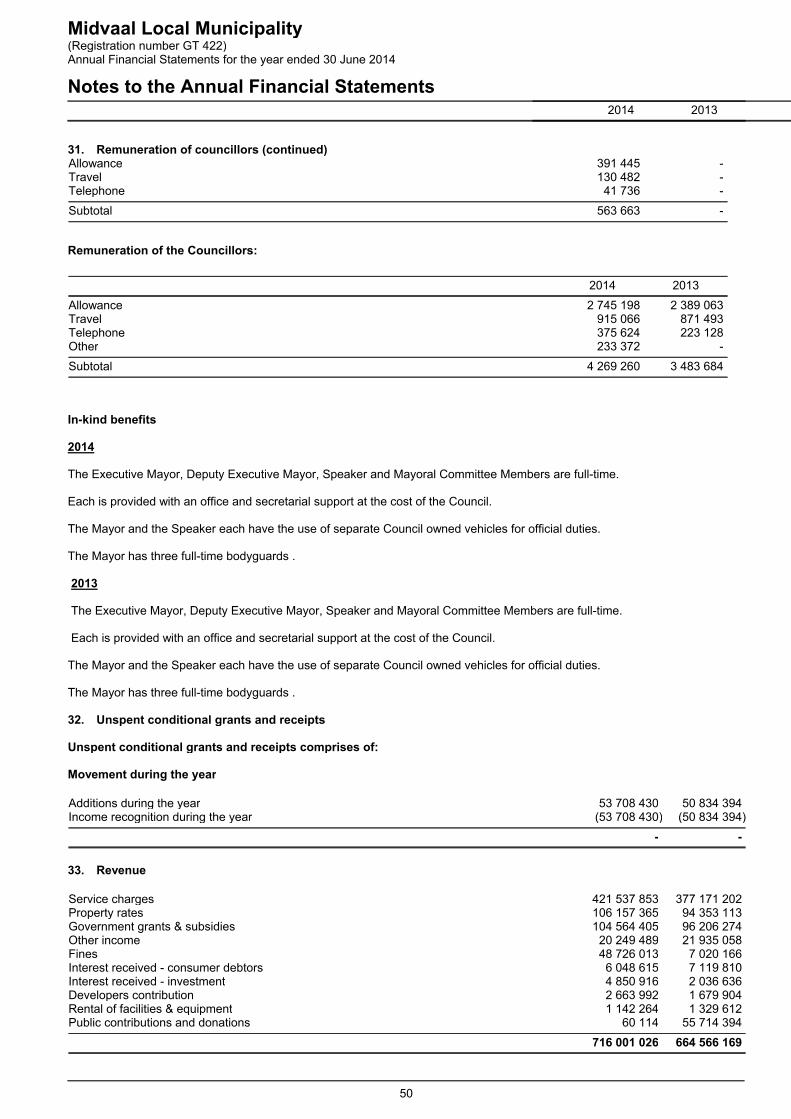
Midvaal Local Municipality(Registration number GT 422)Annual Financial Statements for the year ended 30 June 2014
Notes to the Annual Financial Statements2014 2013
31. Remuneration of councillors (continued)Allowance 391 445 -Travel 130 482 -Telephone 41 736 -
Subtotal 563 663 -
Remuneration of the Councillors:
2014 2013
Allowance 2 745 198 2 389 063Travel 915 066 871 493Telephone 375 624 223 128Other 233 372 -
Subtotal 4 269 260 3 483 684
In-kind benefits
2014
The Executive Mayor, Deputy Executive Mayor, Speaker and Mayoral Committee Members are full-time.
Each is provided with an office and secretarial support at the cost of the Council.
The Mayor and the Speaker each have the use of separate Council owned vehicles for official duties.
The Mayor has three full-time bodyguards .
2013
The Executive Mayor, Deputy Executive Mayor, Speaker and Mayoral Committee Members are full-time.
Each is provided with an office and secretarial support at the cost of the Council.
The Mayor and the Speaker each have the use of separate Council owned vehicles for official duties.
The Mayor has three full-time bodyguards .
32. Unspent conditional grants and receipts
Unspent conditional grants and receipts comprises of:
Movement during the year
Additions during the year 53 708 430 50 834 394Income recognition during the year (53 708 430) (50 834 394)
- -
33. Revenue
Service charges 421 537 853 377 171 202Property rates 106 157 365 94 353 113Government grants & subsidies 104 564 405 96 206 274Other income 20 249 489 21 935 058Fines 48 726 013 7 020 166Interest received - consumer debtors 6 048 615 7 119 810Interest received - investment 4 850 916 2 036 636Developers contribution 2 663 992 1 679 904Rental of facilities & equipment 1 142 264 1 329 612Public contributions and donations 60 114 55 714 394
716 001 026 664 566 169
50

Midvaal Local Municipality(Registration number GT 422)Annual Financial Statements for the year ended 30 June 2014
Notes to the Annual Financial Statements2014 2013
33. Revenue (continued)The amount included in revenue arising from exchanges of goods or services areas follows:Service charges 421 537 853 377 171 202Other income 20 249 489 21 935 058Interest received - consumer debtors 6 048 615 7 119 810Interest received - investment 4 850 916 2 036 636Rental of facilities & equipment 1 142 264 1 329 612
453 829 137 409 592 318
The amount included in revenue arising from non-exchange transactions is asfollows:Taxation revenueProperty rates 106 157 365 94 353 113Transfer revenueGovernment grants & subsidies 104 564 405 96 206 274Public contributions and donations 60 114 55 714 394Fines 48 726 013 7 020 166Developers contributions 2 663 992 1 679 904
262 171 889 254 973 851
34. Financial instruments disclosure
Categories of financial instruments
2014
Financial assets
At amortisedcost
Total
Other receivables 4 797 488 4 797 488Consumer debtors 114 926 707 114 926 707Cash and cash equivalents 91 470 824 91 470 824
211 195 019 211 195 019
Financial liabilities
At amortisedcost
Total
Other financial liabilities 175 000 667 175 000 667Payables from exchange transactions 94 289 681 94 289 681Consumer Deposits 10 273 776 10 273 776Finanace lease obligation 14 923 808 14 923 808
294 487 932 294 487 932
2013
Financial assets
At amortisedcost
Total
Other receivables 5 937 648 5 937 648Consumer debtors 95 151 227 95 151 227Cash and cash equivalents 40 484 187 40 484 187
141 573 062 141 573 062
Financial liabilities
At amortisedcost
Total
Other financial liabilities 129 105 467 129 105 467Payables from exchange transactions 71 517 986 71 517 986
51

Midvaal Local Municipality(Registration number GT 422)Annual Financial Statements for the year ended 30 June 2014
Notes to the Annual Financial Statements2014 2013
34. Financial instruments disclosure (continued)Consumer Deposits 9 804 398 9 804 398Finance lease obligation 9 762 166 9 762 166
220 190 017 220 190 017
Financial instruments in Statement of financial performance
2014
At amortisedcost
Total
Interest income (calculated using effective interest method) for financial instruments atamortised cost
10 899 531 10 899 531
Interest expense (calculated using effective interest method) for financial instruments atamortised cost
(17 007 084) (17 007 084)
Impairment loss (23 500 868) (23 500 868)
(29 608 421) (29 608 421)
2013
At amortisedcost
Total
Interest income (calculated using effective interest method) for financial instruments atamortised cost
9 156 446 9 156 446
Interest expense (calculated using effective interest method) for financial instruments atamortised cost
(16 119 860) (16 119 860)
Impairment loss (27 322 871) (27 322 871)
(34 286 285) (34 286 285)
35. Auditors' remuneration
Fees 2 140 825 2 787 065
36. Commitments
Authorised capital expenditure
Already contracted for but not provided for Property, plant and equipment 8 254 383 8 942 049
Not yet contracted for and authorised by accounting officer Property, plant and equipment 82 391 545 152 467 000
This committed expenditure relates to property, plant and equipment and will be financed by available bank facilities,retained surpluses, existing cash resources and funds internally generated.
The municipalty approved the implementation of the 2014/15 carry over adjustment budget as allowed by section 28 of theMunicipal Finance Management Act as well as section 23 of the Municipal Budget and Reporting regulations (projects fromthe 2013/2014 financial year to be carried over to the 2014/2015 financial year).
With the promulgation of the Municipal Budget and Reporting Regulations, the approval of an Adjustments Budget for carryover projects by 25 August annually is allowable.
The MFMA as well as the budgeting and reporting regulations makes provision for carry over’s to be approved as anadjustment budget in August annually.
Section 28(2)(e) of the MFMA states the following:
“An adjustments budget may authorize the spending of funds that were unspent at the end of the past financial year wherethe under-spending could not reasonably have been foreseen at the time to include projected roll-overs when the annualbudget for the current year was approved by the council'.
52

Midvaal Local Municipality(Registration number GT 422)Annual Financial Statements for the year ended 30 June 2014
Notes to the Annual Financial Statements2014 2013
36. Commitments (continued)
Section 23(5) of the Regulations as published in volume 526 of the Government Gazette No 32141 dated 17 April 2009,states the following:
“An adjustment budget referred to in section 28(2)(e) of the Act may only be tabled after the end of the financial year to whichthe roll-overs relate, and must be approved by the municipal council by 25 August of the financial year following the financialyear to which the roll-over relate.”
37. Contingencies
On 20 May 2011 the State President issued a proclamation establishing the SIU to investigate certain alligations in respectof the Midvaal Local Municipality. The report on the outcome of the investigation has not yet been issued. However, in themean time the SIU has issued accounts to be paid for the work it is set to have done. Council resolved under item C1137/06/2014 that National or Provincial Treasury be approached for the exemption of the payment of the fees in terms ofSection 5(1a) of the Special Investigation Units and Special Tribunals Act (74 of 1996) - R 869 876.25.
Contingent liabilities arising from third party claims and litigation
Name Case no 2014 2013
Mr Delport - 102 984Mr Nijland 0510-1173 - 124 989Mr Delport 0813-12014 Accident manhole 200 000 -Mrs Kok 0213-11813 Motor Accident 31 310 31 310Mrs Jordaan - 35 000Mrs van Kraayenburg 0111-11924 Pothole Genl Hertzog 36 619 36 619Mrs Modise 0413-11980 - 25 000Mr Visagie 0313-11864 - 5 000 000Telkom - 187 785Mrs Jordaan 0813-12114 House build on wrong
property2 000 000 -
Mrs du Toit 12238 Stolen electrical cable 4 500 000 -Mr N G Damane Stolen electrical cable 8 620 -Mrs Q van Wyk 0114-12239 Stolen electrical cable 10 000 -Mrs C Enslin Tree fell on vehicle 160 000 -
Subtotal - - 6 946 549 5 543 687
6 946 549 5 543 687
Plaintiff applicant Defendantapplicant
Case no Claim against /action by Council
Description ofinstruction given
to AttorneysStatus
Status
Eskom Nersa /MLM
18234/2011 Not stipulated -Quantum notknown
To defend case -Oppose reviewapplication - Awaitinginstruction
Awaitingsupplementaryaffidavit fromapplicant
MLM MeyertonGolf Club
Application todemolish illegalstructure -Quantum notknown
Malherbe Rigg &Ranwell
Appeal lodged
Telkom SA Ltd MLM 21445/2011 R187 784,83 plusinterest (Damageto cables)
Deffend claim Court date set for23/07/2014 hasbeen cancelled -Matter postponed"sinedie"(Indefinitely)
M A Ramaoke MLM /SAPS
38281/2010 Claim fordamages R 643388,64
Matter transferedfrom WebberWentzel to MillsGroenewald
Matter postponed
53

Midvaal Local Municipality(Registration number GT 422)Annual Financial Statements for the year ended 30 June 2014
Notes to the Annual Financial Statements2014 2013
37. Contingencies (continued)
Contingent assets
Plaintiff applicant Defendantapplicant
Case no Claim against /action by Council
Description ofinstruction given
to AttorneysStatus
Status
MLM John West 24744/2010 Action by CouncilR 130 000,00plus interest onlegal cost
Odendaal andSummerton Inc
Companyliquidated
38. Related parties
`
RelationshipsClose family member of key management Management remuneration - Refer to employee
Related Costs and Remuneration of Councillors notesJoint venture of key management NoneAssociate of close family member of key management As per scheduleMembers of key management Refer to note on employee related cost for information
Associate of close familymember of keymanagement
Contract value
Company Staff member 2014 2013
Jumanji Industrial supplies G S Herholdt - 29 868Voster Doenighede E Pienaar 300 1 560Se Gosedi Electrical and Projects PTY Ltd P Malherbe 3 942 -
Subtotal - 4 242 31 428
4 242 31 428
Previously employed byOrgan of State
Contract value
Company Staff member 2014 2013
Paul Ernst Paul Ernst 484 559 300 000
Subtotal - 484 559 300 000
39. Prior period errors
2014 During an audit conducted by the Energy Loss Programme staff of Eskom it was found that Midvaal Municipality was notbilled for one day on 1 August 2009 that lead to an under recovery of R 137 923.09. An amount of R 630 102.21 was underrecover due to metering changes that have not been excepted by the Eskom system for 36 days. Eskom utilized MidvaalMunicipality's current transformers for the period 1 March 2010 to 30 September 2010 to retrieve data for Eskom billingpurposes. An amount of R 11 847 855 was under recovered based on the Energy Loss Programme audit findings for theperiod March to September 2010.An amount of R 5 226 207 was under recover due to phases that were swopped on themetering installation and phasing problems were experienced on meter panel 1 and 4 for the period May 2011 to July 2011.Council agreed to enter into an agreement with Eskom to pay of the principal debt of R 17 842 087.30 over a period of 36months.
EskomOpening balance - 17 842 087Long term portion 8 003 643 -Short term portion 5 352 626 -
54
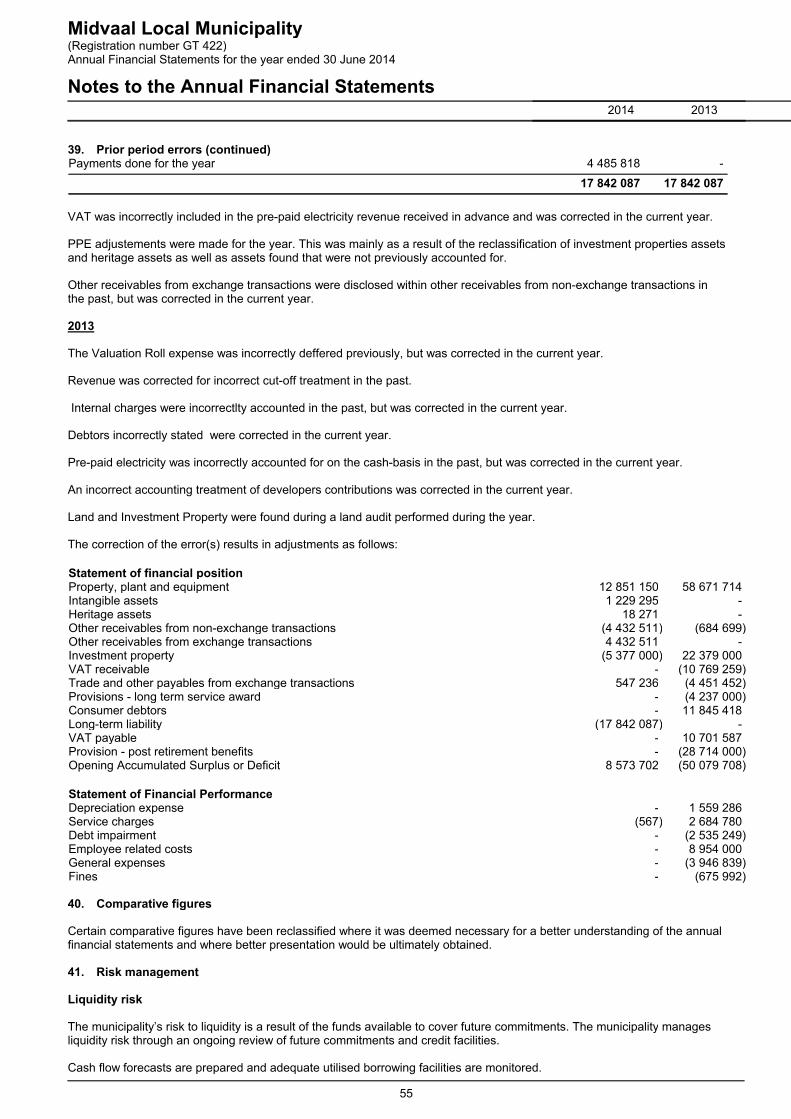
Midvaal Local Municipality(Registration number GT 422)Annual Financial Statements for the year ended 30 June 2014
Notes to the Annual Financial Statements2014 2013
39. Prior period errors (continued)Payments done for the year 4 485 818 -
17 842 087 17 842 087
VAT was incorrectly included in the pre-paid electricity revenue received in advance and was corrected in the current year.
PPE adjustements were made for the year. This was mainly as a result of the reclassification of investment properties assetsand heritage assets as well as assets found that were not previously accounted for.
Other receivables from exchange transactions were disclosed within other receivables from non-exchange transactions inthe past, but was corrected in the current year.
2013
The Valuation Roll expense was incorrectly deffered previously, but was corrected in the current year.
Revenue was corrected for incorrect cut-off treatment in the past.
Internal charges were incorrectlty accounted in the past, but was corrected in the current year.
Debtors incorrectly stated were corrected in the current year.
Pre-paid electricity was incorrectly accounted for on the cash-basis in the past, but was corrected in the current year.
An incorrect accounting treatment of developers contributions was corrected in the current year.
Land and Investment Property were found during a land audit performed during the year.
The correction of the error(s) results in adjustments as follows:
Statement of financial positionProperty, plant and equipment 12 851 150 58 671 714Intangible assets 1 229 295 -Heritage assets 18 271 -Other receivables from non-exchange transactions (4 432 511) (684 699)Other receivables from exchange transactions 4 432 511 -Investment property (5 377 000) 22 379 000VAT receivable - (10 769 259)Trade and other payables from exchange transactions 547 236 (4 451 452)Provisions - long term service award - (4 237 000)Consumer debtors - 11 845 418Long-term liability (17 842 087) -VAT payable - 10 701 587Provision - post retirement benefits - (28 714 000)Opening Accumulated Surplus or Deficit 8 573 702 (50 079 708)
Statement of Financial PerformanceDepreciation expense - 1 559 286Service charges (567) 2 684 780Debt impairment - (2 535 249)Employee related costs - 8 954 000General expenses - (3 946 839)Fines - (675 992)
40. Comparative figures
Certain comparative figures have been reclassified where it was deemed necessary for a better understanding of the annualfinancial statements and where better presentation would be ultimately obtained.
41. Risk management
Liquidity risk
The municipality’s risk to liquidity is a result of the funds available to cover future commitments. The municipality managesliquidity risk through an ongoing review of future commitments and credit facilities.
Cash flow forecasts are prepared and adequate utilised borrowing facilities are monitored.
55

Midvaal Local Municipality(Registration number GT 422)Annual Financial Statements for the year ended 30 June 2014
Notes to the Annual Financial Statements2014 2013
41. Risk management (continued)
Interest rate risk
As the municipality has no significant income from interest-bearing assets, the municipality’s income and operating cashflows are substantially independent of changes in market interest rates. Loans are taken at fixed interest rates to minimiseinterest rate risk.
Credit risk
Credit risk consists mainly of cash deposits, cash equivalents, derivative financial instruments and trade debtors. Themunicipality only deposits cash with major banks with high quality credit standing and limits exposure to any one counter-party.
Trade receivables comprise a widespread customer base. Management evaluated credit risk relating to customers on anongoing basis. If customers are independently rated, these ratings are used. Otherwise, if there is no independent rating, riskcontrol assesses the credit quality of the customer, taking into account its financial position, past experience and otherfactors. Individual risk limits are set based on internal or external ratings in accordance with limits set by the board. Theutilisation of credit limits is regularly monitored. Sales to retail customers are settled in cash or using major credit cards.
42. Going concern
We draw attention to the fact that at 30 June 2014, the municipality had a positive accumulated surplus and that themunicipality's total assets exceeds its liabilities.
The financial statements have been prepared on the basis of accounting policies applicable to a going concern.
This basis presumes that funds will be available to finance future operations and that the realisation of assets and settlementof liabilities, contingent obligations and commitments will occur in the ordinary course of business.
43. Events after the reporting date
None
44. Unauthorised expenditure
Opening balance 48 736 -Unauthorised expenditure for the year - 48 736Unauthorised expenditure - written off by the council (48 736) -
- 48 736
The amount of R 48 736 that was recorded as unauthorised expenditure in the 2012/2013 financial year, has been wriiten offas irrecoverable debt as per Council resolution MC A/2920/05/2014.
45. In-kind donations and assistance
2014
The Municipality received the following in-kind donations and assistance:
Gauteng Provincial Treasury has provided assistance in the preparation of the 2012/2013 Annual financial statements, bydeploying officials to the municipality.
2013
The Municipality received the following in-kind donations and assistance:
Gauteng Provincial Treasury has provided assistance in the preparation of the 2011/2012 as well as 2012/2013 Annualfinancial statements, by deploying officials to the municipality.
46. Additional disclosure in terms of Municipal Finance Management Act
Contributions to organised local government
Opening balance 1 388 603 706 861Current year subscription / fee 1 437 744 1 170 707Amount paid - current year (2 826 347) (538 965)
56

Midvaal Local Municipality(Registration number GT 422)Annual Financial Statements for the year ended 30 June 2014
Notes to the Annual Financial Statements2014 2013
46. Additional disclosure in terms of Municipal Finance Management Act (continued)
- 1 338 603
Audit fees
Amount paid - current year 2 140 825 2 787 065
PAYE and UIF
Amount paid - current year 20 576 913 18 681 176
Pension and Medical Aid Deductions
Amount paid - current year - Pension 28 145 455 25 809 763Amount paid - current year - Medical 14 371 026 12 673 488
42 516 481 38 483 251
VAT
VAT receivable 8 822 049 6 425 749
All VAT returns have been submitted by the due date throughout the year.
Councillors' arrear consumer accounts
2014
There were no arrear accounts outstanding for more than 90 days for Councillors at 30 June 2014.
2013
The following Councillors had arrear accounts outstanding for more than 90 days at 30 June 2013:
30 June 2013 Outstandingless than 90
daysR
Outstandingmore than 90
daysR
TotalR
ML Modikeng 307 1 142 1 449P & MW Ramushu 258 - 258P & MW Ramushu 352 - 352MGI Ncobo - 1 434 1 434MM Radebe - 1 559 1 559MJ Tsotesi - 64 64MZP Boland - 558 558
917 4 757 5 674
47. Utilisation of Long-term liabilities reconciliation
Long-term liabilities raised 183 592 669 138 867 633Used to finance property, plant and equipment (145 838 507) (132 667 768)
37 754 162 6 199 865
Long-term liabilities have been utilized in accordance with the Municipal Finance Management Act. Sufficient cash has beenset aside to ensure that long-term liabilities can be repaid on redemption date.
48. Deviation from supply chain management regulations
Paragraph 12(1)(d)(i) of Government gazette No. 27636 issued on 30 May 2005 states that a supply chain managementpolicy must provide for the procurement of goods and services by way of a competitive bidding process.
57

Midvaal Local Municipality(Registration number GT 422)Annual Financial Statements for the year ended 30 June 2014
Notes to the Annual Financial Statements2014 2013
48. Deviation from supply chain management regulations (continued)
Paraph 36 of the same gazette states that the accounting officer may dispense with the official procurement process incertain circumstances, provided that he records the reasons for any deviations and reports them to the next meeting of theaccounting officer and includes a note to the financial statements.
The majority of items mentioned had to be addressed in short notice and the response times did not allow for the completeprocurement process to be followed. The balance of items were due to emergency circumstances or uneconomic benefits forthe municipality.
Class 2014 2013
Emergency 4 400 477 1 837 948Sole suppliers 3 821 599 4 855 140Impractical or impossible to follow the process 4 687 044 1 944 182
Total 12 909 120 8 637 270
49. Budget differences
Material differences between budget and actual amounts
The total expenditure for the year was less than the approves expenditure budget.
Changes from the approved budget to the final budget
The changes between the approved and final budget are a consequence of reallocations within the approved budgetparameters.
50. Unaccounted water and electricity
Electricity technical losses:
Technical loss / Non technicalloss
Electricity Units Amounts Percentage
Technical loss 14 499 543 10 223 628 %6,00Non technical loss 15 273 035 10 769 017 %6,32
Subtotal 29 772 578 20 992 645 12
29 772 578 20 992 645 %12,32
Electricity:
Electricity
Year Unitspurchased
Units sold Loss indistribution
Percentage
2013/2014 - - - %-Units 241 639 650 211 867 072 29 772 578 %12,32Amount 170 380 117 149 387 472 20 992 645 %-2012/2013 - - - %-Units 237 547 769 208 027 519 29 520 250 %12,43Amount 152 671 951 133 699 286 18 972 665 %-
The unit sold amount is calculated according to the unit purchased amount.
Water:
Water
58
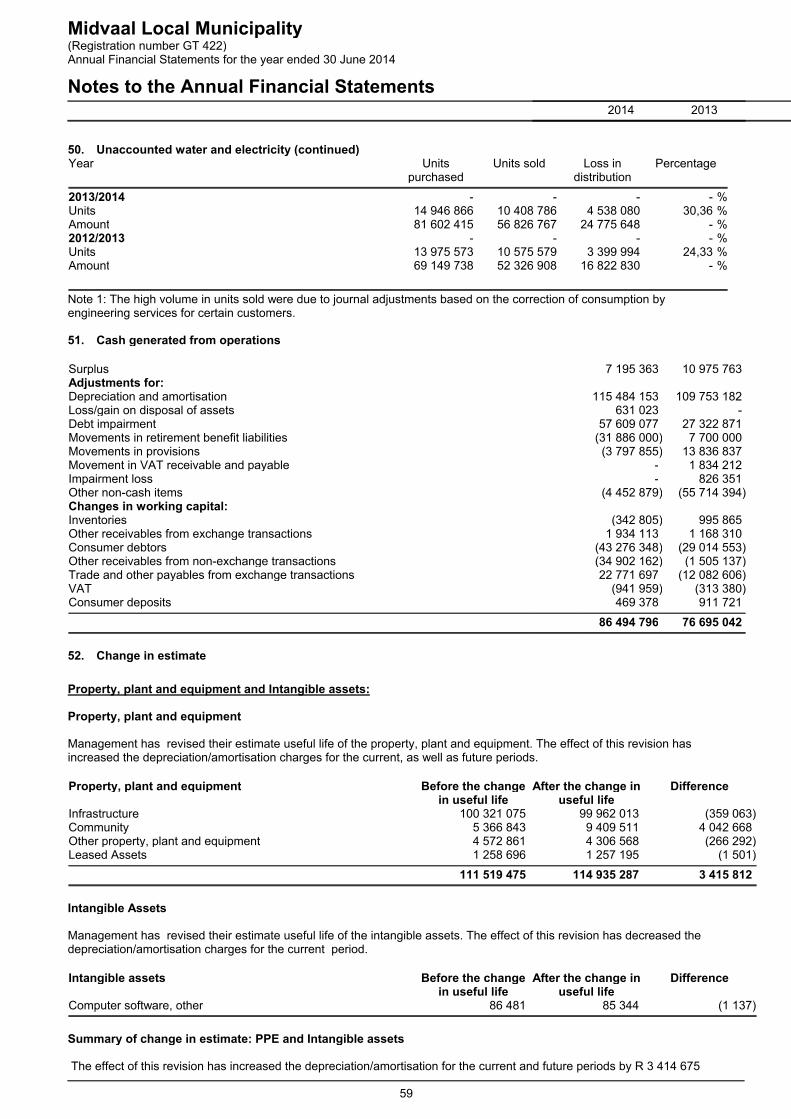
Midvaal Local Municipality(Registration number GT 422)Annual Financial Statements for the year ended 30 June 2014
Notes to the Annual Financial Statements2014 2013
50. Unaccounted water and electricity (continued)Year Units
purchasedUnits sold Loss in
distributionPercentage
2013/2014 - - - %-Units 14 946 866 10 408 786 4 538 080 %30,36Amount 81 602 415 56 826 767 24 775 648 %-2012/2013 - - - %-Units 13 975 573 10 575 579 3 399 994 %24,33Amount 69 149 738 52 326 908 16 822 830 %-
Note 1: The high volume in units sold were due to journal adjustments based on the correction of consumption byengineering services for certain customers.
51. Cash generated from operations
Surplus 7 195 363 10 975 763Adjustments for:Depreciation and amortisation 115 484 153 109 753 182Loss/gain on disposal of assets 631 023 -Debt impairment 57 609 077 27 322 871Movements in retirement benefit liabilities (31 886 000) 7 700 000Movements in provisions (3 797 855) 13 836 837Movement in VAT receivable and payable - 1 834 212Impairment loss - 826 351Other non-cash items (4 452 879) (55 714 394)Changes in working capital:Inventories (342 805) 995 865Other receivables from exchange transactions 1 934 113 1 168 310Consumer debtors (43 276 348) (29 014 553)Other receivables from non-exchange transactions (34 902 162) (1 505 137)Trade and other payables from exchange transactions 22 771 697 (12 082 606)VAT (941 959) (313 380)Consumer deposits 469 378 911 721
86 494 796 76 695 042
52. Change in estimate
Property, plant and equipment and Intangible assets:
Property, plant and equipment
Management has revised their estimate useful life of the property, plant and equipment. The effect of this revision hasincreased the depreciation/amortisation charges for the current, as well as future periods.
Property, plant and equipment Before the changein useful life
After the change inuseful life
Difference
Infrastructure 100 321 075 99 962 013 (359 063)Community 5 366 843 9 409 511 4 042 668Other property, plant and equipment 4 572 861 4 306 568 (266 292)Leased Assets 1 258 696 1 257 195 (1 501)
111 519 475 114 935 287 3 415 812
Intangible Assets
Management has revised their estimate useful life of the intangible assets. The effect of this revision has decreased thedepreciation/amortisation charges for the current period.
Intangible assets Before the changein useful life
After the change inuseful life
Difference
Computer software, other 86 481 85 344 (1 137)
Summary of change in estimate: PPE and Intangible assets
The effect of this revision has increased the depreciation/amortisation for the current and future periods by R 3 414 675
59

Midvaal Local Municipality(Registration number GT 422)Annual Financial Statements for the year ended 30 June 2014
Notes to the Annual Financial Statements2014 2013
52. Change in estimate (continued)
Asset type Before the changein useful life
After the change inuseful life
Difference
Property, plant and equipment 111 519 475 114 935 287 3 415 812Intangible Assets 86 481 85 344 (1 137)
111 605 956 115 020 631 3 414 675
Employee benefit obligation
Management has revised their policy with regards staff that qualifies for post-retirement benefits. The Midvaal Municipalityhas resolved on the 19th September 2013 to not make post retirement medical benefits available to those who qualifies asper SALGa's policy decission on post retirement medical and subsidies adopted by Salga Exco on 8 July 2004. The effect ofthis revision, as well as other changes to the obligation, has decreased the benefit for the current period.
Before the changein employee benefit
obligation
After the change inemployee benefit
obligation
Difference
Defined benefit obligation (medical aid) 36 414 000 4 528 000 (31 886 000)
60

Midvaal Local Municipality
Appendix ADisclosures of Grants and Subsidies in terms of Section 123 MFMA, 56 of 2003
June 2014
Name of Grants Name of organof state or
municipal entity
Quarterly Receipts Quarterly Expenditure
Sep Dec Mar Jun Sep Dec Mar Jun
- - - - - - - -NATIONALTREASURY-CAPITAL
MIG 4 370 000 12 650 000 10 138 000 - 4 354 037 5 270 749 6 146 772 7 458 651
NATIONALTREASURY-CAPITAL
FMG 58 000 - - - - 35 227 20 470 -
NATIONALTREASURY-CAPITLA
EEDSMG 421 700 3 000 000 5 578 000 - - 213 669 377 105 8 313 269
PROVINCIAL -CAPITAL
DSCAR 100 000 - - - - - - 87 485
NATIONALTREASURY -OPERATIONAL
Equitable Share 22 783 000 18 227 000 13 663 000 - - - - -
NATIONALTREASURY -OPERATIONAL
MSIG 890 000 - - - 134 375 244 349 108 117 403 159
NATIONALTREASURY -OPERATIONAL
FMG 1 242 000 - - - 172 761 365 635 397 566 306 039
NATIONALTREASURY -OPERATIONALNATIONAL TREASURY -OPERATIONAL
MIG 1 100 000 - - - 248 825 262 199 260 460 285 803
NATIONALTREASURY -OPERATIONAL
EPWP 400 000 300 000 300 000 - 323 515 597 061 79 424 -
PROVINCE -OPERATIONAL
Prov Health - 1 577 314 1 244 238 1 595 838 1 132 128 1 299 736 1 148 397 621 176
PROVINCE -OPERATIONAL
DSCAR 2 500 000 - - - 527 557 473 201 492 560 914 976
- - - - - - - -DISTRICT -OPERATIONAL
Environmental Health 146 260 728 994 422 397 1 128 665 489 894 593 375 672 530 246 374
- - - - - - - -- - - - - - - -- - - - - - - -
34 010 960 36 483 308 31 345 635 2 724 503 7 383 092 9 355 201 9 703 401 18 636 932
Note: A municipality should provide additional information on how a grant was spent per Vote. This excludes allocations from the Equitable Share.
Section 5 - Page 61 - 24 November 2014 - 01:29 PM