INTSIKA YETHU LOCAL MUNICIPALITY - National Treasury ...
213
INTSIKA YETHU LOCAL MUNICIPALITY INTEGRATED DEVELOPMENT PLAN 2012-2017
-
Upload
khangminh22 -
Category
Documents
-
view
1 -
download
0
Transcript of INTSIKA YETHU LOCAL MUNICIPALITY - National Treasury ...

INTSIKA YETHU LOCAL MUNICIPALITY
INTEGRATED DEVELOPMENT PLAN
2012-2017

i
Foreword by the Mayor
To the people of Intsika Yethu, I wish to present this Integrated Development Plan (IDP) as our strategy
for service delivery and development over the next five (5) years. I’d like to take this opportunity to further
affirm our commitment to meeting your needs, as mandated to this Council. As we fully embrace the
national outcomes of developmental local government, we shall strive to put you first in all our
endeavours. This IDP will be the guiding spirit behind our efforts for the next five years. And to the public,
it is an opportunity to hold us accountable for what we have set out to achieve.
Having said this, our region is plagued by ills such as high unemployment, low income levels, a high
learner dropout rate and HIV and AIDS. Stimulation of the local economy is therefore of paramount
importance in addressing some of our major challenges. Not uniquely a challenge to IYLM is the issue of
lower than desired revenue, as a result of our significantly high indigent base. This remains a systematic
and structural weakness for the Municipality, but it also reminds us of the immense challenge of poverty
and the hardship it brings to people. This reinforces in us the need to work even harder with an undying
commitment to improved service delivery and sustainable development.
Our collective efforts across Intsika Yethu must seek to bring meaningful and real improvements to the
lives of our people. As the Council of IYLM, we believe that our people want tangible things that improve
the quality of their lives and advance a brighter future for them and their children. In striving towards this
noble cause we hold to the words of Samora Machel, a true son of Africa, when he spoke about the reasons
people support post-liberation movements, he noted: ‘Our people support tangible things, not abstractions
or theories, a school or a hospital, clinics and roads are all tangible things.’
In the same vain I wish to indicate that this IDP serves as the strategy by which we intend to deliver
tangible outputs informed by the needs of our people. We are satisfied that the people of Intsika Yethu
have fully participated in the identification of their development needs, in the construction of this IDP.
This has seen contributions from wards as part of the initial ward based planning processes across the
municipality, and subsequent presentations and interactions through our IDP representatives’ forum and
council.
I hereby present to you the IDP 2012-2017 for Intsika Yethu Local Municipality.
Sincerely,

ii
Table of Contents
Executive Summary ................................................................................................................................. 1
The Process Plan ...................................................................................................................................... 1
Situational Analysis ................................................................................................................................. 1
Institutional Review ................................................................................................................................. 1
The Development Context and Socio-Economic Profile ......................................................................... 1
Spatial Analysis and Rational .................................................................................................................. 2
The Service Delivery Profile ..................................................................................................................... 2
Development strategies, projects and programmes ................................................................................ 3
Performance Management System .......................................................................................................... 3
Financial Plan and Budget ....................................................................................................................... 3
Chapter 1: Introduction and Planning Process ........................................................................................ 5
(Part A) Introduction ............................................................................................................................... 5
(Part B) The Planning Process ................................................................................................................. 6
1. The IDP Process Plan ........................................................................................................................... 6
1.1 Mechanisms and Procedures for Public Participation ..................................................................... 12
1.1.1 Ward committees and CDWs ......................................................................................................... 13
1.1.2 Issues identified by Wards within IYLM ....................................................................................... 13
Chapter 2: Situational Analysis ............................................................................................................. 16
(Part A) An Institutional Review ........................................................................................................... 16
Introduction ........................................................................................................................................... 16
2. Institutional Profile ............................................................................................................................ 16
2.1 Municipal Powers and Functions ..................................................................................................... 16
2.2 Municipal Council and institutional governance............................................................................. 19
2.3 Committees of Council .................................................................................................................... 20
2.4 Community Development Workers (CDWs) ................................................................................... 21
2.5 Ward Committees ............................................................................................................................ 21
2.6 Finances and Financial Management .............................................................................................. 21
2.7 Human resources ............................................................................................................................. 24
2.8 Employment Equity ......................................................................................................................... 34
2.9 Skills development ........................................................................................................................... 34
(Part B) The Development Context and Socio-Economic Profile .......................................................... 35
3. Socio-Economic Profile ...................................................................................................................... 35
3.1 Demographic Profile ........................................................................................................................ 35
3.2 Poverty Rate in IYLM ....................................................................................................................... 36
3.3 Income and Employment data......................................................................................................... 38
3.4 Human Development Index ............................................................................................................ 41
3.5 Inequality ......................................................................................................................................... 42

iii
3.6 Economic Data ................................................................................................................................. 43
(Part C) Spatial Orientation ................................................................................................................... 46
4. Spatial Analysis and Rationale .......................................................................................................... 46
4.1 Spatial Overview ............................................................................................................................... 46
4.2 Prioritized Secondary Nodes ...........................................................................................................48
4.3 Development Corridors ................................................................................................................... 50
(Part D) Service Delivery Profile ............................................................................................................ 56
5. Service Delivery Profile and the Clusters .......................................................................................... 56
5.1 Cluster Model integration and coordination .................................................................................... 56
5.2 Technical Service Cluster ................................................................................................................. 57
5.2.1 Free Basic Services and Social Infrastructure ............................................................................... 57
5.2.2 Human settlements ....................................................................................................................... 64
5.3 Social Needs Cluster ......................................................................................................................... 66
5.3.1 Education levels ............................................................................................................................. 66
5.3.2 Health Care Issues ....................................................................................................................... 68
5.3.3 Community Facilities .................................................................................................................... 69
5.3.4 Safety and Security ........................................................................................................................ 69
5.3.5 Cremation and Cemeteries ............................................................................................................ 70
5.3.6 Waste Management ...................................................................................................................... 70
5.3.7 Disaster Management ................................................................................................................... 71
5.3.8 Environmental Management ........................................................................................................ 74
5.4 Economic Development and Planning Cluster ................................................................................ 74
5.4.1 Local Economic Development ....................................................................................................... 74
5.4.2 Chris Hani Growth and Development Summit ............................................................................ 75
5.4.3 Economic opportunities within IYLM .......................................................................................... 76
5.4.4 Tourism ......................................................................................................................................... 76
5.4.5 Agriculture ....................................................................................................................................82
5.4.6 Forestry ......................................................................................................................................... 85
5.4.7 Environment Management ........................................................................................................... 87
Chapter 3: Development Priorities, Strategic Objectives, Strategies and Projects .............................. 88
6. Vision, Mission, and Key Performance Areas ................................................................................... 88
6.1 Vision and Mission .......................................................................................................................... 89
6.2 Principles and Values of IYLM ....................................................................................................... 89
6.3 Key Performance Areas, Clusters, and Goals.................................................................................. 90
6.4 Goals and Strategic Objectives ........................................................................................................ 91
6.4.1 Institutional development ............................................................................................................. 91
6.4.2 Municipal planning, maintenance & infrastructure provision ..................................................... 92
6.4.3 Provide social infrastructure and quality social services .............................................................. 92

iv
6.4.4 Job creation, enterprise formation, business retention and expansion ....................................... 93
6.4.5 Building financial viability ............................................................................................................ 93
6.4.6 Good governance and oversight ................................................................................................... 93
6.5 The Five Year Implementation Plan ................................................................................................ 96
6.5.1 KPA 1: Municipal Transformation and Organisational Development .......................................... 97
6.5.2 KPA 2: Basic Services and Infrastructure ................................................................................... 101
6.5.3 KPA 3: Local Economic Development ........................................................................................ 109
6.5.4 KPA 4: Financial Management and Viability .............................................................................. 112
6.5.5 KPA 5: Good Governance and Public Participation .....................................................................116
6.6 Projects and Programmes ...............................................................................................................119
6.6.1 KPA 1: Municipal Transformation and Organisational Development .........................................119
6.6.2 KPA 2: Basic Services and Infrastructure ................................................................................... 120
6.6.3 KPA 3: Local Economic Development ........................................................................................ 130
6.6.4 KPA 4: Financial Management and Viability ............................................................................. 134
6.6.5 KPA 5: Good Governance and Public Participation ................................................................... 135
6.7 Unfunded Projects and Programmes ............................................................................................. 137
6.7.1 KPA 1: Municipal Transformation & Organisational Development............................................ 137
6.7.2 KPA 2: Basic Services and Infrastructure ................................................................................... 138
6.7.3 KPA 3: Local Economic Development ........................................................................................ 143
6.7.4 KPA 4: Financial Management and Viability .............................................................................. 146
6.7.5 KPA 5: Good Governance and Public Participation .................................................................... 147
Chapter 4: Performance Management System .................................................................................... 148
7. Introduction ..................................................................................................................................... 148
7.1 Legislative background ................................................................................................................... 148
7.2 IYLM’s Performance Management System ................................................................................... 150
7.2.1 Role of the Council ...................................................................................................................... 150
7.2.2 Role of the community ................................................................................................................ 150
7.2.3 Performance Indicators ............................................................................................................... 151
7.2.4 Performance Targets ................................................................................................................... 152
7.2.5 Publishing of Performance Reports and the Annual Reports ..................................................... 153
7.2.6 The PMS in relation to the IDP ................................................................................................... 154
7.3 Institutional Performance Management........................................................................................ 155
7.4 Individual Performance Management ........................................................................................... 155
7.4.1 The Performance Assessment process ........................................................................................ 156
7.4.2 Rewarding and correcting good and poor performance ............................................................. 157
7.5 Performance Audit ......................................................................................................................... 157
7.6 First Draft High Level Service Delivery Budget Implementation Plan (SDBIP) ........................... 159
7.6.1 Quarterly service delivery targets of the SDBIP 2012/2013 ....................................................... 164

v
7.6.1.1 KPA 1: Municipal Transformation and Organisational Development ..................................... 164
7.6.1.2 KPA 2: Basic Services and Infrastructure ................................................................................ 168
7.6.1.3 KPA 3: Local Economic Development ...................................................................................... 176
7.6.1.4 KPA 4: Financial Management and Viability ........................................................................... 179
7.6.1.5 KPA 5: Good Governance and Public Participation ................................................................. 183
Chapter 5: Financial Plan and Budget ................................................................................................. 186
8. Financial Viability ............................................................................................................................ 186
8.1 Financial risks ................................................................................................................................ 186
8.2 Key Challenges ............................................................................................................................... 186
8.3 Financial Strategies ....................................................................................................................... 187
8.3.1 Revenue Enhancement and Maximisation Strategy ................................................................... 187
8.3.2 Subsidies and Grants .................................................................................................................. 187
8.3.3 Credit Control and Debt Collection Policy.................................................................................. 188
8.3.4 Tariff Policy ................................................................................................................................. 188
8.4 Asset Management ........................................................................................................................ 188
8.4.1 Asset Management Strategies ..................................................................................................... 188
8.4.2 Asset Management Policy ........................................................................................................... 188
8.4.3 Asset Movement System ............................................................................................................. 189
8.5 Financial Management Strategies ................................................................................................. 189
8.5.1 Budget and Finance Reform ........................................................................................................ 189
8.5.2 Operational Financing Strategies ............................................................................................... 190
8.5.3 Strategies to Enhance Cost Effectiveness ................................................................................... 190
8.5.4 Benchmarking and Performance Indicators .............................................................................. 190
8.5.6 Training and Development of Staff ............................................................................................ 190
8.5.7 Cost Effectiveness ....................................................................................................................... 190
8.6 Free Basic Services ......................................................................................................................... 190
8.6.1 The indigent support policy ........................................................................................................ 190
8.7 Actual expenditure and revenue for 2010/2011 .............................................................................191
8.9 Financial Plan and Budget Statement ............................................................................................191
8.10 Financial Policies ......................................................................................................................... 198
8.10.1 Amendments to Budget Related Policies .................................................................................. 198
8.10.2 New Policies proposed .............................................................................................................. 198
8.11 History of Audit Reports............................................................................................................... 198
Chapter 6: Approval ............................................................................................................................ 200
Annexure A: Strategy and Sector Plan Overview ................................................................................. 201

vi
Acronym List
ABET Adult Basic Education and Training AIDS Acquired Immune Deficiency Syndrome ASGISA Accelerated and Shared Growth Initiatives for South Africa BOP Best Operating Practices CBP Community Based Plan CDW Community Development Worker CFO Chief Financial Officer CFO Chief financial Officer CHDM Chris Hani District Municipality CIP Comprehensive Infrastructure Plan COGTA Department of Corporative Governance and Traditional Affairs CPF Community Policing Forum DBSA Development Bank of Southern Africa DGDS District Growth and Development Strategy DLA Department of Land Affairs DLGTA Department of Local Government and Traditional Affairs DWAF Department of Water and Forestry EAP Employee Assistance Programme EC Eastern Cape EC-DoE Eastern Cape Provincial Department of Education ECSECC Eastern Cape Social and Economic Consultative Council EHP Environmental Health Practitioners FBS Free Basic Services FET Further Education and Training FMG Financial Management Grant FS Free State GP Gauteng Province GRAP Generally Recognised Accounting Practice GVA Gross Value Added HDI Human Development Index HIV Human Immune Deficiency Virus HOD Head of Department HV High Voltage IDP Integrated Development Plan IeC Integrated Energy Centre IGR Intergovernmental Relations ISD Integrated Service Delivery IYLM Intsika Yelthu Local Municipality KPA Key Performance Area
KPI Key Performance Information KZN Kwa-Zulu Natal LAC Local Aids Council LED Local Economic Development LRAD Land Redistribution for Agriculture Development LTO Local Tourism Organisation MDG Millennium Development Goals MEC Member of the Executive Committee MFMA Municipal Finance Management Act MHS Municipal Health Service MIG Municipal Infrastructure Grant MM Municipal Managers
MoU Memorandum of Understanding MP Mpumalanga MPAC Municipal Public Accounts Committee MPRA Municipal Property Rates Act MSA Municipal Systems Act

vii
MSIG Municipal Systems Improvement Grant MTEF Medium Term Expenditure Framework
MTREF Medium Term Revenue and Expenditure Framework NC Northern Cape NP Northern Province NSDP National Spatial Development Plan NW North West OHS Organisational Health and Safety PDP Personal Development Plan PMS Performance Management System PSDV Provincial Spatial Development Plan RBIG Regional Bulk Infrastructure Grant RED Regional Electricity Distribution RSA Republic of South Africa SALGA South African Local Government Associations SANAC South African National Aids Council SARS South African Revenue Services SCCIP School Community Co-operative Ilima Programmes SCM Supply Chain Management SDBIP Service Delivery Budget Implementation Plan SDF Spatial Development Framework SDL Skills Development Levies SETA Sector Education and Training Facilities SLA Service Level Agreement SMME Small Medium and Micro Enterprise SPU Special Programmes Unit SWOT Strengths, Weaknesses, Opportunities and Threats TADA Treatment Against Drugs and Alcohol UIF Unemployment Insurance Fund VAT Value Added Tax VIP Ventilated Improvement Pit (dry sanitation facility) WC Western Cape WSA Water Service Authority WSP Water Service Provider

viii
List of Tables
Table 1: Distribution of Roles and Responsibilities in the IDP process ......................................................................................... 6 Table 2: IYLM IDP Action Plan ....................................................................................................................................................... 8 Table 3: Participation mechanisms for different Phases............................................................................................................... 12 Table 4: Division of Powers and functions between CHDM and IYLM ....................................................................................... 18 Table 5: Voting results of the Local Government Elections of May 2011 for IYLM ..................................................................... 19 Table 6: Municipal Councillors for IYLM ..................................................................................................................................... 20 Table 7: IYLM Budget Allocations 2010-2013 .............................................................................................................................. 22 Table 8: Audit outcomes for IYLM from 2006-2011 .................................................................................................................... 22 Table 9: Financial Policies of IYLM ...............................................................................................................................................23 Table 10: Approved posts per Department circa 2010 ................................................................................................................. 24 Table 11: Existing Manuals of IYLM...............................................................................................................................................32 Table 12: Existing Institutional Policies of IYLM ..........................................................................................................................33 Table 13: Employment equity* within IYLM as at 13 January 2012............................................................................................ 34 Table 14: IYLM population estimates over the previous term with forecasts for 2010/11 .......................................................... 35 Table 15: Poverty rates from 1995-2010 ........................................................................................................................................ 37 Table 16: Social Grants recipients as a percentage of total population ....................................................................................... 39 Table 17: HDI for the Eastern Cape, District and IYLM ................................................................................................................ 41 Table 18: Prioritised Secondary Nodes ......................................................................................................................................... 49 Table 19: Development Zones ........................................................................................................................................................ 52 Table 20: Cluster approach ............................................................................................................................................................ 56 Table 21: Progress against backlogs within IYLM ........................................................................................................................ 58 Table 22: Funding sources for addressing service delivery backlog ............................................................................................. 59 Table 23: Household access to water within IYLM ...................................................................................................................... 62 Table 24: Household access to energy within IYLM .................................................................................................................... 62 Table 25: Household access to refuse removal within IYLM ....................................................................................................... 63 Table 26: Household access to sanitation in IYLM ...................................................................................................................... 63 Table 27: Educational qualification levels within IYLM .............................................................................................................. 68 Table 28: IYLM Waste Generation Rates in relation to population growth trends ..................................................................... 71 Table 29: Tourism Facilities in IYLM ............................................................................................................................................ 77 Table 30: Tabulation of strength, weaknesses, opportunities and threats ................................................................................... 78 Table 31: Heritage Tourism initiatives ........................................................................................................................................... 79 Table 32: Sports and Recreation ................................................................................................................................................... 80 Table 33: Agriculture SWOT Analysis ........................................................................................................................................... 82 Table 34: Forestry SWOT analysis ................................................................................................................................................ 85 Table 35: Comprehensive table displaying the different roles in the PMS process ................................................................... 151 Table 36: Integration of the strategic planning with the PMS .................................................................................................... 154 Table 37: Institution Performance Achievement Rating ............................................................................................................. 155 Table 38: Appraisal schedule of the IYLM PMS .......................................................................................................................... 156 Table 39: Performance Rating Scale of the IYLM PMS ............................................................................................................... 156 Table 40: Monthly revenue projections by source 2012/2013.................................................................................................... 160 Table 41: Monthly revenue projections by source 2012/2013 continued ................................................................................... 161 Table 42: Monthly expenditure projections by type of payment 2012/2013 ............................................................................. 162 Table 43: IYLM budgeted expenditure versus actual expenditure 2010/2011 .......................................................................... 191 Table 44: IYLM budgeted revenue versus actual revenue 2010/2011 ........................................................................................ 191 Table 45: Indicative 3 Year MTEF Budget for IYLM ................................................................................................................... 192

ix
List of Charts
Chart 1: Frequency of issues identified across Wards ................................................................................................................... 14 Chart 2: Ward issues identified with weighting by rank ............................................................................................................... 15 Chart 3: Age Distribution within IYLM (2011 Forecast) .............................................................................................................. 36 Chart 4: Proportion of monthly income of IYLM residents by income bracket .......................................................................... 38 Chart 5: Employment opportunities across economic sectors ..................................................................................................... 39 Chart 6: Employment opportunities within the informal sector ................................................................................................. 40 Chart 7: Inequality within CHDM with special focus on IYLM ................................................................................................... 42 Chart 8: Gross Value Added contribution (2010) as a percentage per Local Municipality within Chris Hani District ............ 43 Chart 9: GVA contribution of IYLM across economic sectors ..................................................................................................... 43 Chart 10: Access to Communication (2010 forecasts) .................................................................................................................. 64 Chart 11: Distribution of housing across IYLM ............................................................................................................................. 65 Chart 12: Educational levels of over-21 year olds .......................................................................................................................... 67
List of Figures
Figure 1: Municipal Manager’s Office organisational structure.................................................................................................... 25 Figure 2: Corporate Services’ organisational structure ................................................................................................................ 26 Figure 3: Finances organisational structure .................................................................................................................................. 27 Figure 4: Local Economic Development organisational structure .............................................................................................. 28 Figure 5: Community Services organisational structure .............................................................................................................. 29 Figure 6: Technical Services organisational structure ................................................................................................................. 30 Figure 7: Water and Sanitation Provisioning organisational structure ........................................................................................ 31 Figure 8: Availability of activities within Provinces ...................................................................................................................... 79 Figure 9: A visual representation of the hierarchy of strategic intent of IYLM .......................................................................... 89 Figure 10: The convergence of KPAs, Clusters, and Goals for the IDP 2012-2017 ..................................................................... 90
List of Maps
Map 1: Spatial Priorities ................................................................................................................................................................ 47 Map 2: Key nodes and corridors of IYLM ..................................................................................................................................... 48 Map 3: Special Development Areas ............................................................................................................................................... 51 Map 4: Development Zones ........................................................................................................................................................... 54 Map 5: Land Reform Zone ............................................................................................................................................................. 55 Map 6: Water Resources ................................................................................................................................................................ 61 Map 7: Overviews of empty land and flood lines within IYLM ..................................................................................................... 72 Map 8: Tourism .............................................................................................................................................................................. 81 Map 9: Proposals Local Economic Development (Agriculture – Crops and Forestry) .............................................................. 83 Map 10: Forestry ........................................................................................................................................................................... 86

1
Executive Summary
Intsika Yethu Local Municipality (IYLM) has undertaken a consultative and responsive planning process
in the development of the Integrated Development Plan (IDP) 2012-2017. The municipality has developed
a credible strategic document as the basis for development within the municipal area over the medium
term. The following overview includes a brief on the process followed, a summary of the municipal status
quo, the high level strategic intentions of the municipality, some of the financial and operational
considerations going forward, as well as the role of performance management within IYLM.
The Process Plan
In line with Section 28 and Section 29 of the Municipal Systems Act (MSA) of 2000, IYLM adopted a
process plan on 17 August of 2011 which outlined the programme, processes, and institutional
arrangements for the development of the IDP 2012-2017. In line with statutory requirements, provision
was made for public participation and community commentary and was considered integral to the
development of the document. Community identified priority issues are the point of departure for this
document and as such, a presentation of those issues and their comparative weighting is presented at the
end of the section on process.
Situational Analysis
The IDP 2012-2017 includes an in depth assessment of IYLM’s current situation with regards to both the
institutional arrangements of the municipality and the socio-economic profile of its inhabitants. The
objective of a comprehensive situational analysis in an IDP is to give a clear picture of the prevalent
circumstances in the municipality which in turn assists with the identification of priorities, opportunities
or short-comings in the municipality on both an institutional and societal level.
Institutional Review
The situational analysis elaborates on the institutional profile of the local municipality through presenting
a breakdown of the municipal powers and functions of the municipality as informed by The Constitution of
the Republic of South Africa (Act 108 of 1996), Section 156, Section 229 and the Municipal Structures Act
(Act 117 of 1998, Section 84). The situational analysis further presents a breakdown of the powers and
functions of the Local Municipality in relation to the District Municipality.
The situational analysis also gives information regarding the organisational structure of IYLM, including
the Municipal Managers office, the Corporate Services Directorate, the Finances Directorate, Local
Economic Development Directorate, Community Services Directorate, as well as the Technical Services
Directorate and Water and Sanitation Provisioning Services are presented. Brief consideration of the
municipality’s financial position and performance, as well as key considerations relating to vacancy and
funding are included. In addition, a list of institutional policies and manuals in IYLM is presented in the
chapter. Issues pertaining to human resources such as Employment Equity and Skills Development are
also briefly touched on in this section. The institutional review is considered representative of the
institution’s Finance, Governance and Administration cluster.
The Development Context and Socio-Economic Profile
The socio-economic profile of IYLM forms an integral part of the situational analysis; the profile provides a
detailed analysis of the population of IYLM and further provides some key insights into demographics,
socio-economic conditions, infrastructural service levels in the Municipal area and environmental issues.
The analysis lends weight to prioritisation of identified issues in IYLM and conveys some urgency with
regards to what needs to be done first.

2
The socio-economic profile elucidates many of the social issues which characterise IYLM. The data
demonstrates that IYLM has a relatively young and rural population which is characterised by high levels
of poverty and relatively low levels of literacy. The people of IYLM are also generally low income earners
with many of them having no regular income at all. The data further shows population decreases in recent
years which point to the possible outward migration of many people in search of better employment and
education opportunities in more urbanised areas outside of the region. IYLM performs poorly in terms of
the Human Development Index (HDI) measures of life expectancy, literacy and education. Thus the
demographic profile of the municipality highlights a number of social-economic issues which hamper the
overall development of the IYLM community and must be considered as part of evidence-based planning
for the municipality.
Economic indicators in the situational analysis illustrate that IYLM has considerable potential for
economic growth. The tertiary sector is the biggest sector in terms of employment and economic output
with the secondary and primary sectors producing significantly less. This is problematic since it is the
latter sectors that tend to drive economic growth in poorly developed rural municipalities such as IYLM.
Chapter 3 of the IDP later elaborates further on the specific projects undertaken by the municipality that
seek to rectify the imbalances between economic sectors through stimulating growth in both the primary
and secondary sectors.
Spatial Analysis and Rational
The spatial analysis reflects the strategies, policies and maps that assist the municipality to plan
strategically in terms of the implementation of projects. The spatial analysis adds detail to the situational
analysis through presenting a geographical outline of the situation in the municipality. To this end the
Spatial Development Framework (SDF) for IYLM is currently under review and will be adopted by the
Council in the 2012/2013 financial year.
The following are regarded as key issues of spatial development within IYLM:
Dispersed settlements patterns and pockets of development at urban centres surrounded by
scattered underdeveloped rural villages, which implies great costs to achieve access to basic
services and infrastructure;
Need to systematically address the fragmented nature of development to promote the integration
of urban and rural areas over time (phased development approach which will optimise on existing
capacity and resources to generate the most spin-off effects from investment);
Prioritisation of different levels of investment to ensure ongoing sustainable development and
spin-off effects for continued economic growth in the IYLM area; and
Limited economic activity outside of urban centres.
The Service Delivery Profile
The service delivery profile of IYLM takes a clustered approach in considering the municipal status quo
with regards to existing backlogs, levels of service provision, and institutional arrangements within the
District and Local Municipality. Service delivery is differentiated between that of Technical Services, Social
Needs, Economic Planning and Development, and the Finance, Governance and Administration clusters.
Each cluster is examined in depth, considering the municipality’s position in relation to services aligned to
each cluster, as well as those areas where the municipality faces specific challenges, such as financing the
requisite backlogs eradication within Technical Services. Other challenges related to Disaster Management
arrangements with the District Municipality and considerations related to environmental health are also
noted.

3
Development strategies, projects and programmes
As part of the IDP process Council undertook an exercise to develop a vision for its current term of office.
A product of the political leadership of the municipality, the following Vision was formulated:
“A people centred, developmentally focused rural local municipality in which all of its inhabitants have
access to quality service delivery and participate in vibrant and well-balanced social and economic
development”.
This institutional Vision was supported with the institutional raison d’etre, its Mission for being. That
Mission is as follows:
“Endeavours to advance its developmental local government mandate through a sustained focus on
sound and accountable governance, physical and social infrastructure appropriate for sustainable
development in our Municipal area”.
IYLM adopts the “Batho Pele Principles”, together with other underlying principles aligned to this value
framework, which include the following: Democracy, as realised through consultation, transparency, and
accountability; Respect & Courtesy; Responsiveness; Quality Services; Redress; and Value for Money.
These strategic intentions are supported by a clear alignment between organisational goals and objectives,
and service delivery targets across each of the five key performance areas of local government. This section
provides a detailed breakdown of the high-level service delivery targets and is substantiated with a list of
funded and unfunded projects over the Medium Term Expenditure Framework (MTEF) to advance these
objectives. It also represents the integration of various National, Provincial, District, and Local imperatives
in that Provincial projects within the municipal area are also clearly identified. The formulation of strategic
objectives in particular takes cognisance of those priorities and strategies already being advanced across
the three spheres of government and reinforces them.
Performance Management System
The IDP 2012/2013-2016/2017 includes Performance Management System (PMS) requirements
applicable to IYLM. These are derived from legislation relevant to the local municipality and with
consideration of the service level outputs prioritised annually by the municipality.
In this chapter the current IYLM PMS is assessed. Through this process, it is established that IYLM seeks
to review its current PMS and develop a new system during the 2012/2013 financial year. A framework for
the development of a comprehensive PMS is consequently included, which covers issues such as: roles of
stakeholders, performance indicators, performance targets, publishing of performance reports and the
PMS in relation to the IDP.
A first draft of the performance information component of the Service Delivery Budget Implementation
Plan (SDBIP) is also provided as these service delivery targets broken down over four quarters provide the
basis for Section 57 Performance Agreements, as per the MSA.
Financial Plan and Budget
The Municipality has developed a financial strategy in order to respond to the various priorities and
initiatives which are budgeted for as part of the IDP process. The council’s overall Financial Strategy is
structured into the following core components to allow for a clearer understanding of the overall task:
Revenue enhancement and maximisation strategies;
Asset management strategies;
ENGAGEMENT
Local
SITUATIONAL
ANALYSIS

4
Financial management strategies;
Capital financing strategies;
Operational financing strategies;
Strategies to enhance cost‐effectiveness; and
Free Basic Services and indigent support.
IYLM has recognised that there are other factors that could impact on the success of their financial
strategy such as financial risks which can be summarised as follows:
Limitation on revenue raising capacity due to high poverty indices;
Growth within debt composition associated with low level service offerings;
Financial distress- ratio analysis- specific on working capital elements;
Containment of personnel costs within set benchmarks as established within the budget process;
Governance and administration costs as a percentage of own revenue;
Increases associated with deferred maintenance and backlog eradication.
The section ends with a breakdown of the municipal budget over the MTEF and a brief overview of the
organisations audit history.
Overall, the IDP 2012/2013-2016/2017 represents the collective efforts of IYLM staff, Council, and citizens
in the crafting of a strategic plan for the development of the municipal area, responsive to the needs and
aspirations of its citizens, informed by the technical skills and abilities of the administration, and within the
limitations of the scarce resource available to it.

5
Chapter 1: Introduction and Planning Process
(Part A) Introduction
The IDP is the key planning instrument available to local government in the pursuit of decentralised,
strategic, participatory, implementation-orientated, coordinated and integrated development. Preparing
an IDP is not only a legal requirement in terms of the legislation but it is an imperative towards realising
the municipality’s major developmental responsibility to improve the quality of life of its citizens. The IDP
process creates platforms to enhance service delivery by securing the buy-in of all relevant role-players and
provides government departments and other social partners with a clear framework for realising the
municipality’s developmental goals and objectives.
Section 25 of the Municipal Systems Act, No 32, 2000 prescribes the following:
“Each municipal council must, within a prescribed period after the start of its elected term, adopt a single,
inclusive and strategic plan for the development of the municipality which:
(a) Links, integrates and co-ordinates plans and takes into account proposals for the development of the
municipality;
(b) Aligns the resources and capacity of the municipality with the implementation of the plan;
(c) Forms the policy framework and general basis on which annual budgets must be based;
(d) Complies with the provisions of this Chapter; and
(e) Is compatible with national and provincial development plans and planning requirements binding on
the municipality in terms of’ legislation.”
In accordance with the aforementioned prescript, Intsika Yethu Local Municipality (IYLM) has compiled
an Integrated Development Plan (IDP) in document form. This document is the sum of all the various
plans, strategies and goals that IYLM shall pursue over the next five years. The document takes into
consideration pertinent issues within the municipality and plots a way forward in terms of responding to
these issues which are of paramount importance to the well-being of the IYLM community.
IYLM therefore seeks to present in this document an integrated plan that will:
Link all of the municipal plans across the sectors in a coherent and effective manner;
Present the way forward through outlining the municipality’s goals, strategies, and objectives over the next five years;
Be a source of information regarding the current situation in the municipality especially with regard to the social circumstances of the municipality’s inhabitants and the institutional situation within the municipal structures; and
Link the municipality’s plans and strategies to provincial and national mandates.
Ultimately the IDP of IYLM should act as the pillar upon which the municipality’s developmental approach
rests. The plan should inform and guide all projects that are focused on improving the lives of the
community; this is in keeping with national government’s “Batho Pele” approach of putting people first.

6
(Part B) The Planning Process
1. The IDP Process Plan
In order to ensure certain minimum quality standards and proper coordination between and within
spheres of government in development of Integrated Development Plan (IDP), Section 28(1) and 29(1) (a)
and (b) of Municipal Systems Act of 2000 prescribes that the Council of the municipality must within the
prescribed period after the start of its elected term, “adopt a process set out in writing to guide the
planning, drafting, adoption and review of its IDP. This plan must include the following:
A programme specifying the time frames for the different planning steps;
Appropriate mechanisms, processes and procedures for consultation and participation of local communities, organs of state, traditional authorities and other role players in the IDP drafting process;
An indication of the organisation arrangements for the IDP process;
Mechanisms for integration and alignment.”
In compliance with the provisions of the Act as stipulated above, the LED and Planning Department of
IYLM submitted the following breakdown as part of the preparation for the crafting of the Integrated
Development Plan of the new Council for their term of office.
Table 1: Distribution of Roles and Responsibilities in the IDP process
Actors Role and Responsibilities
Executive Committee Recommends the Process Plan to Council;
Overall management, coordination and monitoring of
process and drafting of IDP;
Approves nominated persons to be in charge of the
different roles, activities and responsibilities;
Overall management and coordination of planning
process;
Public Participation; and
Ensures the annual business plans, budget and land use
management decisions are linked to and based on the
IDP
Municipal Council Political decision making body;
Oversees the development and review of the IDP;
Considers, adopts and approves process plan and IDP;
and
Adopts the Integrated Development Plan, Budget and
SDBIP.
Municipal Manager (MM) The MM utilized the Section 59 provisions of the
Municipal Systems Act to delegate the responsibility to
the Economic Development and Planning Director.
In terms of the process plan the IDP Manager was

7
Actors Role and Responsibilities
tasked to:
Prepare the Process Plan for adoption by the
Municipal Council;
Manage the local municipal IDP by ensuring that all
daily planning activities were performed within an
efficient and effective consideration of available time,
financial and human resources;
Encourage an inclusive participatory planning
process and compliance with the action programme;
Facilitate the horizontal and vertical alignment of the
various internal and external departmental
programmes;
Ensure that the planning process outcomes were
properly documented;
Manage service providers engaged in the municipal
IDP process;
Chair the IDP Steering Committee;
Nominate persons in charge of different roles;
Respond to comments on the draft reviewed IDP
from the public;
Adjust the IDP in accordance with the comments of
the MEC for Local Government & Traditional Affairs;
and
Coordinate with various government departments
and other HODs to ensure that all the projects,
strategies and objectives of the local municipality are
shared and distributed amongst government
departments so that they might incorporate them in
their planning process and vice versa.
Chris Hani District Participate in the IYLM IDP Representative Forum; and
Provide relevant documentation and budget
information for planned projects and locations within
Intsika Yethu Municipal Area for the IDP 2012-2017.
Councillors/Ward Committees and
CDWs Major link between municipal government and
residents;
Link the planning process to their wards or
constituencies;
Set out a Municipal Vision, Mission, and Values;
Contribute to the Goal and Strategic Objective
formulation for the term of office;
Organise public consultation and participation;
Coordinate participation of Ward Committees in the
IDP Representative Forum;
Ensure proper documentation of the results of the
planning of the IDP document; and
Adjust the IDP in accordance with the MEC for Local
Government’s proposals.

8
Actors Role and Responsibilities
Municipal and Government officials Provide relevant technical, sector and financial
information for analysis for determining priority issues;
Contribute technical expertise in the consideration and
finalisation of Strategic Objectives, Strategies,
Performance Indicators, and identification of Projects;
Provide departmental operational and capital
budgetary information;
Responsibility for the preparation of project proposals,
the integration of projects and sector programmes;
Responsibility for preparing amendments to the draft
IDP for submission to the municipal Council for
approval and the MEC for Local Government for
alignment; and
Preparation of all business plans for different
programmes and Projects for the IDP 2012-2017.
Community at large Represent their interests, contribute knowledge and
ideas (Rep forum);
Inform interest groups, communities and
organisations;
Analyse issues, determine priorities, and reach
consensus;
Participate in designing project proposals;
Discuss and comment on the draft IDP;
Monitor performance in implementation; and
Conduct meetings with groups, other communities, and
Traditional Leaders to prepare for follow up on relevant
planning activities.
The IYLM Process Plan was presented and approved by Council on the 19 August 2011 and submitted to
the Department of Local Government and Traditional Affairs. Although there has been considerable
deviation from the adopted process plan, the following presents the schedule applied to the drafting of the
Integrated Development Plan, and continues to apply to the public consultation process going forward.
The details of the activities for the Process Plan are included in the table below.
Table 2: IYLM IDP Action Plan
Item Activities Deliverables Responsible
person
Dates
PLANNING PHASE
1. Develop draft IDP Process
Plan guiding the planning,
drafting, adoption and
review of the IDP
Table IDP and Budget
Process Plan to the
Executive Committee
IDP Manager/MM August
2011
2. Presentation of IDP
Process Plan and Budget
Plan to Council
Adoption by the Council MM 24 August
2011
3. Notice to local community The Advert was issued MM September

9
Item Activities Deliverables Responsible
person
Dates
of particulars of the
Process Plan
first week of September
2011.
2011
4. Consider
comments/proposals
received from MEC
DPLGTA, and any other
comments received from
Councillors, Ward
Committees and other
various role players
IGR cluster meeting
LED Coordinator 30th
September
2011
ANALYISIS PHASE
5. Hold a self assessment
dialogue to review
performance of
municipality and
determine shortcomings
and weaknesses
Identification and
plugging of gaps as
identified by Auditor
General and Internal
Audit Committee.
IDP Manager, Chief
Financial Officer
(CFO) and MM
19th
September
2011
6. Public consultation (visits)
to all wards to collect
information i.e.
community needs and their
expectations
Community needs
identified and ranked.
IDP Manager/ MM 17th - 25st
October
2011
7. HODs to present strategic
agendas in light of the
focus of the new term of
the Council and also taking
into account community
needs
Refined planning of the
IDP development.
All Cluster
Heads(HODs)
30
October
2011
8. Establish Budget Steering
Committees and
Consultation Forum
Budget steering
committee and
consultation forum in
place
CFO/ MM 31st
October
2011
9. Assess provincial strategic
plans as well as sector
plans
Steering Committee
Meeting
MM
HODs
31st
October
2011
STRATEGIES PHASE (REVIEW OF VISION, MISSION, STRATEGIC OBJECTIVES AND
PROGRAMMES/ PROJECTS)
10. Executive Committee/
Council lekgotla to review
and update the Vision,
Mission, Objectives and
Strategies for the new
Council
New strategic agenda for
IDP of the new Council
set.
Mayor/Speaker
through
Representative Forum
/ Workshop
22
February
2012
11. Refining municipal
strategies, objectives,
KPAs, KPIs and targets so
as to influence the budget.
Projects, Strategies,
KPAs and KPIs in place.
MM
CFO
HOD
March
2012

10
Item Activities Deliverables Responsible
person
Dates
Set and agree on IDP
priority
programmes/projects
12. IDP technical committee
and budget steering
committee to determine
revenue projections and
proposed rates , service
charges for municipal
services
Review of budget
policies and rates.
CFO and IDP
Manager
March
2012
13. IDP Representative Forum Present IDP Draft
Situational Analysis
IDP Manager & CFO 12 March
2012
14. Draft IDP and Budget
presentation to Council
Draft budget/IDP in
place
IDP Manager/CFO 27 March
2012
ALIGNMENT & INTEGRATION PHASE
Horizontal and Vertical
alignment with District,
Province, National projects
and programmes
Integration and
alignment
IDP Manager March
2012
15. Tabling and adoption of
Draft IDP by Council
Draft IDP in place Mayor/MM 30 March
2012
REVIEW OF THE DRAFT IDP
(Integration of projects programmes from Provincial/National departments)
16. Publication of the draft
IDP/Budget and invitation
to local community and
stakeholders for comments
and inputs and submission
to Provincial Treasury
Draft IDP/Budget
advertised for public
comment for 21 days
IDP Manager/CFO 02 April
2012
17. IDP/Budget Road shows-
public hearings
Engage Communities Mayor/Executive
Committee
April 2012
18. IDP and Budget steering
committee meeting to
consider the revisions and
amendments to IDP and
Budget
IDP Rep Forum meeting MM/IDP Manager May 2012
19. Council Meeting to adopt
final Budget and IDP
Table to the council for
adoption.
Mayor 30 May
2012
20. Submission of IDP to
Office of MEC
IDP Manager 4th June
2012
21. IDP Steering Committee Finalise Draft Budget Municipal Manager June 2012
SDBIP and PMS Plan

11
Item Activities Deliverables Responsible
person
Dates
22. Submit to the Mayor a
draft of the SDBIP and
annual performance
agreements within 14 days
after approval of budget
Final Submission Municipal Manager June 2012
23. Approval of SDBIP within
28 days after approval of
the budget and ensure that
annual performance
contracts are concluded
and are linked to the
measurable performance
objectives approved with
the budget and SDBIP
SDBIP and PMS Mayor July 2012
24. Public awareness within 14
days after approval
Advertisement notice Municipal Manager July 2012
The above process plan is in compliance with the provision of Chapter 4 of the MSA, as amended, and
allows for meaningful participation in IDP processes via the established forums. In terms of Section 32(2)
of the MSA, the Provincial MEC for Local Government and Traditional Affairs is authorised to provide
suggestions and advice based on the findings of the IDP analysis. In this regard MEC comments for
2011/12 IDP have been instrumental in guiding the planning process in writing up the 2012/13-2016/17
IDP. The MEC comments received by IYLM on 17 August 2011 were helpful in addressing gaps during the
drafting of the IDP. The municipality has considered the comments, although the specific municipal
responses were not necessarily captured in the IDP. Accordingly the IDP has been prepared in accordance
with the assessment of IYLM as required in terms of Section 41 of the MSA.

12
1.1 Mechanisms and Procedures for Public Participation
One of the most exciting opportunities of the planning and budgeting process is the potential for
involvement of community and stakeholder organisations in the process. This insures that the IDP
addresses the real issues that are experienced by the citizens of IYLM. The Constitution stipulates that one
of the objectives of the municipality is “to encourage the involvement of communities and community
organisations in the matters of local government”. The White Paper on Local Government also puts
emphasis on the role and significance of public participation. Participation varies from internal to external
stakeholders inclusive of IGR clusters (various municipal departments) Portfolio Committees, Community
Development Workers, Ward Councillors, Ward Committees, Local Tourism Organisation, the Executive
Committee and Council, Traditional Councils, IDP Representatives Forums, etc. Regardless of the
stakeholder, the engagement and participation creates an opportunity for more robust engagement,
ownership, and ultimately a more credible IDP going forward.
The aforementioned stakeholders have already interacted with the document and will continue to be
engaged in the process of refining the draft IDP in the following manner:
Use the IDP Representative Forum to critique, verify, and add additional information;
Use the IDP Representative Forum to ensure that community priorities are adequately reflected in the IDP;
Engage Councillors’ and Community Development Workers to call meetings to keep communities informed on the IDP processes;
Request feedback on municipal progress;
Use newspaper advertisements to inform communities of the process;
Distribute pamphlets/summary books on IDP’s & budget;
Make the IDP & budget available for public comment; and
Make the IDP & budget documents accessible to all members of the public.
The following table provides an overview of the various participation mechanisms employed across the
different phases of the IDP process.
Table 3: Participation mechanisms for different Phases
Planning Phase Participation Mechanism
Analysis Community meetings
Stakeholder meetings
CBP/ward committees
Strategies Technical committee craft strategies
Project Technical committees with selected representatives of
stakeholder organisation
Integration IDP Representative Forum
Approval IDP Representative Forum
Public discussion, consultation process
Community meetings

13
Planning Phase Participation Mechanism
Stakeholder meeting
Opportunity for comments from the public
Monitoring of implementation IDP representative Forum
Community meetings
Stakeholder meetings
The municipality’s Community Participation Strategy has informed this process and provided for the
involvement of the public in identification of key issues that inform the resources the production of a
credible IDP. Furthermore, public comment and engagement on the draft document has further enhanced
its credibility in this regard.
1.1.1 Ward committees and CDWs
One of the intrinsic features of the Integrated Development Planning process undertaken by the IYLM is
the involvement of community and stakeholder organisations in the process. Participation of affected and
interested parties ensures that the Integrated Development Plan (IDP) addresses the core developmental
issues experienced by the citizens of a municipality. To further strengthen community engagement the
municipality has in collaboration with its constituencies established 21 Ward Committees of ten members
each, with Ward Councillors acting as Chairpersons.
Through the engagements with the Ward Councillors, Ward Committee members and CDWs, the following
issues were identified as having the potential to negatively affect their functionality:
Lack of understanding and clarity on the roles and responsibilities;
The different literacy levels and the general understanding of Local Government between Ward Committees, CDWs and Ward Councillors;
Poor coordination of Ward Committees and community meetings;
Lack of commitment of some of the Ward Committee members and support staff; and
Lack of reports and/or attendance registers.
Ward Committees are central to the IDP planning process, as supported by legislation. As representatives
of the developmental aspirations and needs of the Wards, they also form an information
assimilation/dissemination mechanism between a municipal Council and the community. The Ward
Committees are also crucial to the development, implementation, monitoring and reporting of municipal
performance on the service delivery targets and planned interventions as presented in the municipal IDPs.
1.1.2 Issues identified by Wards within IYLM
This section of the Situational Analysis is required by Chapter 4 of the Municipal Systems Act of 2000.
IYLM has been actively involved in the community participation meetings and has considered all the needs
identified in previous IDP Reviews and consultation at various ward level. The Municipality is in a process
of preparing local area plans (Ward Based Plans) which serve as a good base for the IDP and helps the
municipality in making well informed planning and budget decisions. The local area plan is the process of
facilitation where communities are assisted in developing plans. This process serves to enhance the public
participation in the IDP process; hence the plans are articulated in the IDPs of the municipalities. The
following graph reflects the community identified issues as reflected by frequency of identification across
the 21 Wards.

14
Chart 1 identifies the frequency with which an issue was identified across IYLM’s twenty-one (21) Wards.
During the process of community consultation, each Ward could identify up to ten issues, as well as
proposed projects, and rank the issues on a scale of one (1) to ten (10), as presented in Chart 2. These
issues were then consolidated into discrete, mutually exclusive groups. The frequency with which each
issue was cited across the Wards was then collated into a table, and graphically presented above to identify
the issues most commonly cited across IYLM’s Wards.
Chart 1: Frequency of issues identified across Wards
Agriculture (including Livestock Development) was the most commonly cited issue, occurring 32 times,
and on average appearing more than once within each Ward’s needs identification. Key considerations and
proposals in this regard were related to crop irrigation, livestock dipping tanks and shearing sheds, as well
as stock dams for animal access to water.
This issue was closely followed by Road Infrastructure, cited twenty-six (26) times, which was inclusive of
bridges as well as storm water drainage. Commonly proposed projects and suggestions included internal
street access, bridges, as well as traffic calming and storm water drainage facilities.
Education and Skills Development was the third most cited issue, identified twenty-one (21) times,
effectively once across all of the Local Municipality’s Wards. Specifically, the construction and renovation
of existing schools was a key proposal emanating from the community consultations, as well as emphasis
on the need for early childhood development facilities in the way of pre-schools for learners prior to
entering primary school.
Issues that only received passing and limited mention during the Ward consultations included
telecommunications, mentioned only once. Safety and Security, with specific requests for mobile or
permanent police stations, was identified as in issue in three (3) Wards. Similarly, Social and Cultural
Heritage was only identified in three (3) Wards, where requests for the construction of a cultural village
within the communities were made.

15
Chart 2: Ward issues identified with weighting by rank
Chart 2 represents the weighting of issues identified in the Ward consultations based upon their frequency
and ranking by community members. In order to weight the rankings, a scale was applied from 1-10, with
10 representing the greatest prioritisation of the issue, and 1 the issue of least prioritisation. Thus, if a
community ranked Health Clinics and Facilities as their first priority, it received a weighting of 10. The
total weighting for the issue was then the sum of its ranked weights across the twenty-one (21) Wards,
divided by the maximum weighting score achieved for a given issue (different aspects of the same issue
were sometimes identified multiple times within the same ward, thus meaning certain issues appeared
more than twenty-one times), and adjusted to a 1o-point scale. In this way, the issue with the greatest
weighting based upon its rank and frequency, was the only issue identified as achieving a 10 on the
weighting of issues.
Based on the 10-point scale devised for issues identified across Wards, Road Infrastructure (inclusive of
Bridges and Stormwater Drainage) was weighted as the greatest priority across the Wards, despite
Agriculture (including Livestock Development) being more frequently cited. It therefore received a ranking
of 10, with Agriculture and Livestock Development falling behind with a ranking of 6.88, and those trailed
by Land Use Management and Fencing, which was tied for third priority with Water & Sanitation, both
receiving a weighting of 5.71. This was closely followed by Electrification and Energy Access, which was
ranked as the fifth priority overall, and received a weighting of 4.24.
In terms of issues given the least priority emanating from Wards, Telecommunications Infrastructure,
Poverty Alleviation, and Social and Cultural Heritage, were the three issues of least weighting.
Surprisingly, the issue of Human Settlements was of a relatively low weighting, despite the high percentage
of residents within IYLM that live in traditional housing. Other issues such as Education and Skills
Development, Health Clinics and Facilities, as well as Community Facilities were of medium-level priority
based across wards when considering their ranked weighting.
These issues identified by IYLM communities provide a firm starting point for a more robust examination
of the developmental status quo as part of the Situational Analysis of the IDP 2012-2017.

16
Chapter 2: Situational Analysis
(Part A) An Institutional Review
Introduction
This section of the Integrated Development Plan provides an overview of the current status quo within
IYLM. The section is aimed at painting a picture of the current situation in IYLM that has assisted in the
identification of key issues to be addressed over the medium term as well as their prioritisation. The
Situational Analysis covers information such as demographics, employment information, socio-economic
data, economic data, governance and organisational information, and service delivery. In addition, this
section elaborates upon crucial spatial considerations identified within IYLM’s Spatial Development
Framework (SDF). It is hoped that after reading this section the reader will have gained a comprehensive
understanding of the current situation in IYLM and the challenges and opportunities facing the
municipality.
It should be noted that comprehensive information about rural municipalities such as IYLM is often quite
scarce, and as a result much of the information which is publicly available is slightly outdated. The data
used in this Situational Analysis is sourced primarily from the Eastern Cape Social and Economic
Consultative Council (ECSECC) Statistics Database. This data was collected up until 2009 and uses
forecasted estimates for 2010 and at times 2011, and is particularly useful for trend analysis. For more
recent data, Gaffney’s Local Government in South Africa – Official Yearbook 2011-2013 has been utilised
to provide the most updated projections regarding key social and service delivery considerations. While
there are minor discrepancies between the two data sources, where substantial contradictions existed data
has been omitted and the situation presented is mutually reinforced by the two data sources. But before
going into further detail of socio-economic status quo, it is important to contextualise the municipality’s
situation by presenting the various municipal powers and functions.
2. Institutional Profile
2.1 Municipal Powers and Functions
In order to develop a fully functional Municipality in line with the developmental mandate of Local
Government, it is necessary to be aware of the municipal powers and functions as they were Gazetted, and
directed by the MEC of Local Government and Traditional Affairs in the Eastern Cape Province.
The Constitution of the Republic of South Africa (Act 108 of 1996), Section 156, Section 229 and the
Municipal Structures Act (Act 117 of 1998, Section 84) provides a broad framework for the allocation of
powers, duties and functions between District and Local Municipalities. Since a Municipality has executive
authority in respect of, and has the right to administer the local government matters listed in Part B of
Schedule 4 and Part B of Schedule 5. Much confusion still prevails regarding which of the two tiers of Local
Government is responsible for various functions. This confusion not only lies between the District
Municipality and Local Municipality, but also between the District Municipality and Provincial and
National Departments.
Firstly, the powers of municipalities as institutions of Local Government, one of the three spheres of
government, are recognized and protected in the Constitution. Secondly, the exercise of municipal
legislative power is no longer a delegated function subject to administrative review, but a political process,
influenced by the considerations and input of elected Councillors, representing the will of the municipal
residents. The Constitution provides that municipalities have legislative and executive powers over the
functional areas listed in Schedules 4B and 5B of the Constitution. Section 156(1) and (2) and the two lists
of functional areas in Schedules 4B and 5B constitute the primary source of power for Local Government.

17
The constitutional allocation of ‘original powers’ to Local Government produces at least two areas of
overlap, namely supervisory overlap and overlap between matters listed in the Schedules. The Constitution
does not allocate the matters in Schedule 4B and 5B exclusively to Local Government; National and
Provincial Government may also regulate those matters. The Local Government matters listed in Schedule
4B are part of the concurrent provincial and national legislative competence “to the extent set out in
section 155(6) (a) and (7)”. Similarly, the Local Government matters listed in Schedule 5B are part of the
exclusive provincial competence “to the extent set out for provinces in section 155(6) (a) and (7)”. National
and Provincial Governments have the authority to ensure that municipalities adequately perform in
respect of these matters. The Constitution provides that, subject to section 151(4), a by-law that conflicts
with national or provincial legislation is invalid.
Section 155(6) (a) of the Constitution states that Provincial Government has a duty to monitor and support
Local Government in its jurisdiction. The Province must assert legislative and executive power in order to
promote the development of local government’s capacity to perform its functions and manage its affairs
and they may do so by regulating municipal executive authority, thus ensuring the municipalities’ effective
performance of their functions in respect of listed local government matters. Taken together, these
competencies are considerable and facilitate a measure of Provincial Government control over the manner
in which municipalities administer those matters in Part B of Schedules 4 and 5. This control is not purely
administrative. It could encompass control over municipal legislation to the extent that such legislation
impacts on the manner of administering Local Government matters.
Another consideration relates to the role and function of traditional leaders and how they are to be
incorporated into the Local Government structures and procedures in future. The Traditional Leadership
and Governance Framework Act (Act 41 of 2003) provides that the MEC for Local Government and
Traditional Affairs appoint representatives of traditional leaders to participate in the Council as provided
in the Municipal Systems Act (Act 32 of 2000). In this regard the issue of land administration between the
Municipality and the traditional leaders is a challenge that needs to be addressed. The challenge arises
when traditional leaders continue to allocate land to communities without engaging the municipality to
ascertain issues relating to township establishment and land development requirements generally. This
may result in communities occupying sites in which no services have been provided and where no formal
procedures are followed.
This situation leads to a host of other challenges which including health related problems, occupation of
land not suitable for human settlement, compounding existing challenges of poverty eradication. IYLM
and relevant traditional leadership structures must devise a system of engagement and cooperation in
order to address this challenge.
It is obvious that without clarity on power, duties and functions (responsibilities) between these
institutions it becomes very difficult to design strategies and formulate projects and budget accordingly.
This has been a significant problem in the IYLM IDP development process in the past. It is in this regard
that, this issue is identified by IYLM and is essential that a concerted effort be sustained in order to resolve
matters pertaining to the allocation of powers, duties and functions pertaining to all disciplines.
As far as powers and functions are concerned, CHDM performs certain functions within IYLM.
Additionally, due to existing low capacity in some areas, CHDM will, in consultation with Local
Municipalities, enter into a contract with the external service provider to supplement capacity. It remains a
two-way commitment between a Local Municipality and the District Municipality to build adequate
capacity for accelerated service delivery. Below is a table of the Powers and Functions distributed between
CHDM and IYLM as authorised, and as per the status quo.

18
Table 4: Division of Powers and functions between CHDM and IYLM
Services CHDM
authorised
powers
IYLM
authorised
powers
IYLM Status
Quo
Part B of Schedule 4
of the Constitution of
RSA
Air Pollution No Yes No
Building regulation No Yes Yes
Child care facilities No Yes Yes
Electricity and gas
reticulation
Yes No No (Eskom)
Fire fighting Yes Yes No
Local Tourism Yes Yes Yes (Resolve
w/ CHDM)
Municipal Airports Yes Yes No
Municipal Health Yes Yes No SLA
Municipal planning Yes Yes Yes
Municipal Public Works Yes Yes Yes
Pontoons and Ferries No Yes Yes
Municipal public transport Yes Yes Yes (only Infra.
Provision)
Sanitation Yes Yes Yes (SLA)
Storm water No Yes Yes
Trading regulation No Yes Yes
Water Yes Yes Yes (SLA)
Part B of Schedule 5
of the Constitution of
RSA
Beaches & amusement
facilities
No Yes No
Billboards &
advertisements
No Yes Yes
Cemeteries, parlours &
crematoria
No Yes Yes
Cleansing No Yes Yes
Control of public nuisance No Yes Yes
Control of undertakings
that sell liquor
No Yes Yes
Facilities for
accommodation, care &
burial of animals
No Yes Yes
Fences & Fencing No Yes Yes
Licensing and controlling
of undertakings that sell
food to the public
No Yes Yes
Licensing of dogs No Yes No
Local amenities No Yes Yes
Local Sports facilities Yes Yes Yes
Markets Yes Yes Yes
Municipal abattoirs Yes Yes No

19
Services CHDM
authorised
powers
IYLM
authorised
powers
IYLM Status
Quo
Municipal parks &
recreational facilities
No Yes Yes
Municipal roads Yes Yes Yes
Noise pollution No Yes Yes
Pounds No Yes Yes
Public places No Yes Yes
Refuse removal dumps &
solid waste disposal
Yes Yes Yes
Street lighting No Yes Yes
Street trading No Yes Yes
Traffic and parking No Yes Yes
From Section 84(1)
of Municipal
Structures Act of
1998
Receipt, distribution and
allocation of grants
Yes No No
Imposition and collection
of taxes, levies, and duties
Yes No Yes
The above table illustrates the powers and functions that IYLM is authorised to perform (in the second
column) against the functions and responsibilities actually performed (in the third column) the last
column present a status quo, the CHDM functional responsibilities are shown in first column. Where a
yes appears in both columns, it means that the function is shared between District and Local municipality.
2.2 Municipal Council and institutional governance
The Local Government Elections of May 2011 saw the African National Congress (ANC) retain its control
of the Intsika Yethu Municipal Council, receiving nearly 90% of the total votes cast in the election. Of the
72,149 registered voters, 43,716 turned out for the election across all 21 wards, a total of 60.59% of the
potential electorate. Twenty-one Councillors were elected to represent their Wards while another twenty-
one were elected from a Proportional Representation ballot, bringing the Municipal Council to 42 in total.
Table 5: Voting results of the Local Government Elections of May 2011 for IYLM
Leading parties Ward votes and
%
Party votes and % Ward Prop. Rep Total
1st ANC 37165 87.83% 37956 88.35% 21 16 37
2nd COPE 1908 4.51% 1958 4.56% - 2 2
3rd UDM 1656 3.91% 1466 3.41% - 2 2
4th PAC 517 1.22% 555 1.29% - 1 1
Others 1068 2.52% 1025 2.39% - - -
Total 42314 100.00% 42960 100.00% 21 21 42
Within the Municipal Council, Councillors elected from the Proportional Representation list make-up the
Executive Committee of Municipality and hold various portfolio positions to which they apply political
leadership and guidance towards the delivery of services to the citizens of IYLM.

20
The following positions are currently held within IYLM:
Mayor: Ms K Vimbayo
Speaker: Mr AZ Mbotoloshi
Mayoral Executive Committee Members-
Infrastructure, Development & Planning: Mr S Myataza
Community Services: Ms NA Tshangana-Nkota
Local Economic Development: Mr W Mdwayingana
Corporate Services: Ms N Ntsaluba
Treasury & Budget: Ms K Mdleleni
Special Programmes: Mr J Cengani
In addition to the 8 Councillors above, 34 other Councillors make-up the Intsika Yethu Local Municipal
Council. The total list of Ward and Proportional Representation Councillors follows below.
Table 6: Municipal Councillors for IYLM
Ward Councillors Wards Proportional Representation
Councillors
Cllr Holta Mhlaweyoti Hew 1 1 Cllr Koliswa Vimbayo
Cllr Neliswa Portia Gadeni 2 2 Cllr Anderson Zukile Mbotoloshi
Cllr Madoda Lawrence Papiyana 3 3 Cllr Ntombazipheli Nkota-Tshangana
Cllr Manyewu Shasha 4 4 Cllr Noloyiso Kolosa Ntsaluba
Cllr Dudu Kaspile 5 5 Cllr Jongumzi Cengani
Cllr Mahkwenkwane Henry Mahali 6 6 Cllr Kanyiswa Florence Mdleleni
Cllr Nophelo Magaga 7 7 Cllr Saziso Myataza
Cllr Nozuko Sygnoria Mafanya 8 8 Cllr William Ndamthini Mdwayingana
Cllr Monde Armon Mbotshane 9 9 Cllr Bongolethu Mboniswa
Cllr Mwezi Innocent Bikitsha 10 10 Cllr Noloyiso Ntloko
Cllr Zweloxolo Mxi 11 11 Cllr Zonwabele Shepher Matshikiza
Cllr Vuyokazi Gladys Matomela 12 12 Cllr Mandisi Merryman Mbebe
Cllr Siphiwo Mkunyana 13 13 Cllr Phumzile Nqandela
Cllr Malibongwe Gulubela 14 14 Cllr Nobom Bani
Cllr Albertinah Nokwetu Royi 15 15 Cllr Edth Nonkoliseko Matshukula-Stata
Cllr Noloyiso Mto 16 16 Cllr Nokwakha Jada
Cllr Noxolo Faith Nowandile
Dangazela
17 17 Cllr Nayisile Headman Mgodeli
Cllr Noxolile Mavis Hexana 18 18 Cllr Nomgcobo Albertina Somdyala
Cllr Mayenzeke Yamile 19 19 Cllr Monwabisi Zulu
Cllr Zukiswa Qayiya 20 20 Cllr Humphrey Sangolibanzi Nobongoza
Cllr Nolundi Gertrude Futiso 21 21 Cllr Sizwe Tame
Supportive of the good governance function within IYLM are a number of structures and positions that
fulfil a variety of roles and functions. An overview of these bodies and groups will also highlight some of
the achievements of the previous term.
2.3 Committees of Council
IYLM has both Section 79 and Section 80 Committees established as per legislative requirements to
support the good governance function of Council. Within the municipality Section 79 Committees fall
under the Speaker’s Office and fulfil key governance functions of predominantly an administrative
oversight nature, whereas Section 80 Committees are standing committees aligned to the various
functional areas for service delivery within the municipality under the Mayor’s office. In the previous term

21
some of the Section 79 Committees were unable to fulfil their duties adequately, in part because of a failure
to delegate responsibilities adequately as required in Section 79 of the Municipal Finance Management Act
(MFMA).
2.4 Community Development Workers (CDWs)
CDWs within IYLM are the foot-soldiers for service delivery and accountable governance. Based within the
Local Municipality’s LMs 21 wards, these workers compile monthly reports for submission to the Speaker’s
Office and to the Department of Local Government and Traditional Affairs detailing the conditions on the
ground.
In the previous term, CDWs played an instrumental role in the identification of service delivery
shortcomings and assisted in ensuring a number of interventions were carried out to address these issues.
They also played a prominent role in publicising and mobilising residents to target part in government
sector gatherings and meetings.
2.5 Ward Committees
Following the re-demarcation process conducted by the Demarcation Board during the previous term,
IYLM saw its Ward composition change from 23 Wards to the current 21 Wards. Each Ward has
representation of ten committee members of which the Ward Councillor acts as Chairperson at meetings
and is responsible for holding meetings within their respective Wards.
Every Ward Committee within Intsika Yethu Municipal Area is considered functional and active, partially
due to the successes of the previous term in which each Ward had its own programme of action. Ward
Councillors regularly furnish reports on meetings and service delivery progress to the Speaker’s Office to
keep the municipality informed and ensure accountability.
2.6 Finances and Financial Management
Given the poverty rate within the municipality and the high grant dependency of many IYLM citizens, the
municipality is not yet financially viable in terms of a local revenue base, and remains reliant upon its
Equitable Share allocations and MIG funding to undertake its core functions in the area of basic services
and infrastructure provision. Capital expenditure has remained a priority within IYLM and has been
bolstered in recent years by a growing and increasingly capable staffing complement.
The information provided below gives an overview of IYLM’s finances over the previous two years as well
as a projection for 2012/2013. It details a considerable increase in operational expenditure while showing
a relatively stable allocation for capital projects.
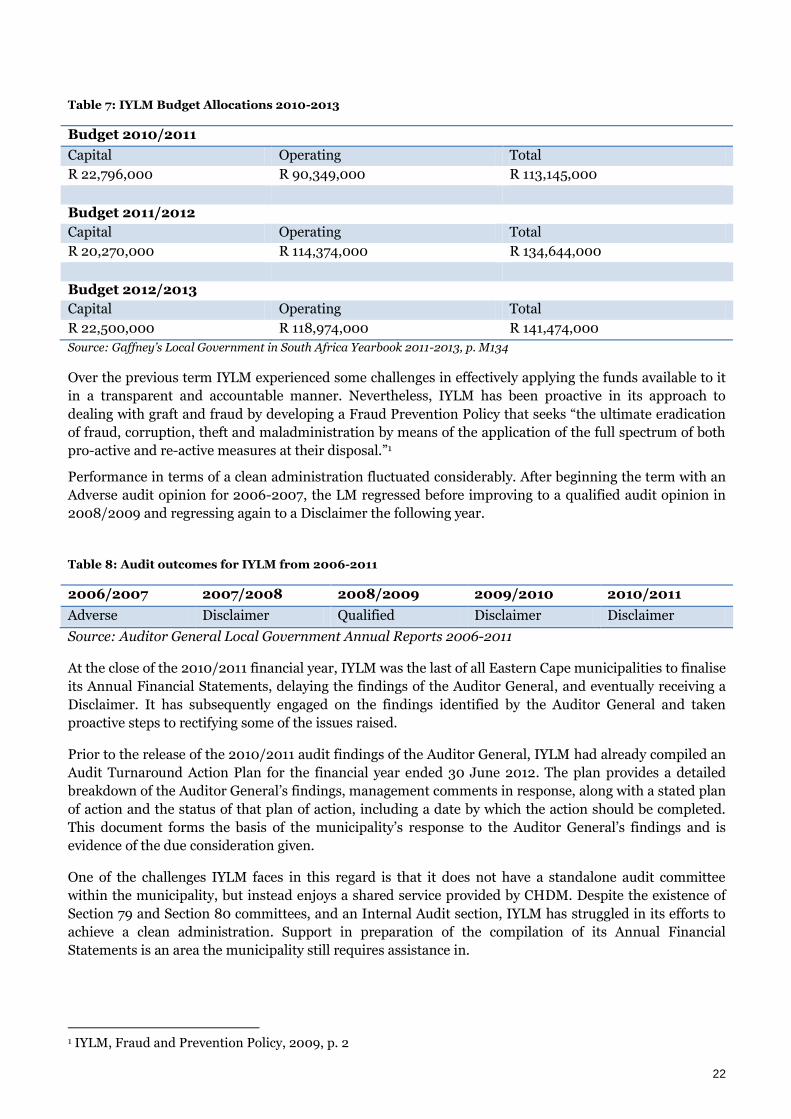
22
Table 7: IYLM Budget Allocations 2010-2013
Budget 2010/2011
Capital Operating Total
R 22,796,000 R 90,349,000 R 113,145,000
Budget 2011/2012
Capital Operating Total
R 20,270,000 R 114,374,000 R 134,644,000
Budget 2012/2013
Capital Operating Total
R 22,500,000 R 118,974,000 R 141,474,000
Source: Gaffney’s Local Government in South Africa Yearbook 2011-2013, p. M134
Over the previous term IYLM experienced some challenges in effectively applying the funds available to it
in a transparent and accountable manner. Nevertheless, IYLM has been proactive in its approach to
dealing with graft and fraud by developing a Fraud Prevention Policy that seeks “the ultimate eradication
of fraud, corruption, theft and maladministration by means of the application of the full spectrum of both
pro-active and re-active measures at their disposal.”1
Performance in terms of a clean administration fluctuated considerably. After beginning the term with an
Adverse audit opinion for 2006-2007, the LM regressed before improving to a qualified audit opinion in
2008/2009 and regressing again to a Disclaimer the following year.
Table 8: Audit outcomes for IYLM from 2006-2011
2006/2007 2007/2008 2008/2009 2009/2010 2010/2011
Adverse Disclaimer Qualified Disclaimer Disclaimer
Source: Auditor General Local Government Annual Reports 2006-2011
At the close of the 2010/2011 financial year, IYLM was the last of all Eastern Cape municipalities to finalise
its Annual Financial Statements, delaying the findings of the Auditor General, and eventually receiving a
Disclaimer. It has subsequently engaged on the findings identified by the Auditor General and taken
proactive steps to rectifying some of the issues raised.
Prior to the release of the 2010/2011 audit findings of the Auditor General, IYLM had already compiled an
Audit Turnaround Action Plan for the financial year ended 30 June 2012. The plan provides a detailed
breakdown of the Auditor General’s findings, management comments in response, along with a stated plan
of action and the status of that plan of action, including a date by which the action should be completed.
This document forms the basis of the municipality’s response to the Auditor General’s findings and is
evidence of the due consideration given.
One of the challenges IYLM faces in this regard is that it does not have a standalone audit committee
within the municipality, but instead enjoys a shared service provided by CHDM. Despite the existence of
Section 79 and Section 80 committees, and an Internal Audit section, IYLM has struggled in its efforts to
achieve a clean administration. Support in preparation of the compilation of its Annual Financial
Statements is an area the municipality still requires assistance in.
1 IYLM, Fraud and Prevention Policy, 2009, p. 2

23
As the municipality forges onwards into the new term, the failure to comply and continued
maladministration will be a focal area requiring sustained effort to ensure improvement towards the
achievement of a clean audit for 2014, as per the national target of COGTA.
Table 9: Financial Policies of IYLM
Financial Policies
Title In existence
Tariffs Policy Yes
Rates Policy Yes
Credit Control and Debt Collection Yes
Borrowing Policy No
Funding and Reserves Policy No
Long-Term Financial Plan No
Fraud Prevention Policy Yes
Supply Chain Management Policy Yes
Asset Management and Disposal Policy Yes
Indigent Support Policy Yes
Infrastructure Investment and Capital Projects No
The table of policies above identifies those financial policies currently in existence. Crucially, despite a
clear Supply Chain Management Policy and a functional unit comprising 8 permanent staff members,
compliance to the MFMA has proved elusive and remains a priority for IYLM going forward. IYLM’s three
Bid Committees (Specification, Adjudication, and Evaluation) will face the enduring challenging of
managing procurement as per the letter of the law and the municipality’s internal policy.
In other areas, the municipality has improved its implementation of policy in pursuit of a clean
administration. The municipal efforts to update its valuation roll are evidence of such as the municipality
completed the valuation update in July of 2011 and has since undertaken two supplementary valuations. In
the absence of a Land Asset Register, the valuation roll has proven useful to the municipality in
considering the acquisition of property for developmental purposes.

24
2.7 Human resources
Given the various developmental challenges facing IYLM, a robust and capacitated human resource base is
a necessity for driving local government’s developmental mandate. In this respect, IYLM has shown
considerable progress over the previous term, positioning the municipality well for the 2012-2017 period
ahead. As a recipient of two VUNA Awards for its success and professionalism in hiring and retaining
skilled staff, the municipality has made remarkable progress towards making capacity shortcomings a
thing of the past.
Table 10: Approved posts per Department circa 2010
Administration Community
Services
LED Finances Corp.
Services
Planning &
Infrastructure
Total
15 96 15 29 30 67 252
Source: IYLM HR Strategy 2009-2010
In 2010 IYLM had a vacancy rate of 27%, and it has since made considerable progress in filling posts
through an annual prioritisation process that identifies key vacancies within the institution for
recruitment. This approach has yielded considerable successes for the organisation as it has continuously
increased its staffing complement in scarce skills areas and prioritised functional areas such as Technical
Services. On an annual basis IYLM considers the funded vacancies within the organisation and prioritises
critical posts for service provision before advertising posts and embarking on a planned recruitment
process. However, given the current employee expenses, no new posts have been prioritised for the
2012/2013 financial year.
Despite these achievements, the Technical Services directorate (inclusive of Water & Sanitation
Provisioning) held the highest vacancy rate within the organisation, with 46% of all approved posts left
vacant in 2010. Subsequently, this vacancy rate has been lowered to approximately 25%, attributed to the
post prioritisation process undertaken by Corporate Services, with only one critical post appointment still
outstanding for the new term of Council. Recent progress in appointing staff will assist this crucial
Directorate in carrying out its key powers and functions more effectively, so as to avoid the shortfall in
spending of MIG allocations that has been a challenge for the department in the past.
At present, IYLM’s Human Resource Strategy 2009/2010 is currently under review for updating and
revision. It is anticipated the revised strategy will go to Council within the 2012/2013 financial year so that
the organisation’s HR plans are more closely reflective of the current developmental trajectory of IYLM.
This revised document, coupled with the extensive policies and manuals already established by the
Corporate Services Directorate, will provide a firm basis for a responsive and critical post- prioritised,
recruitment of staff.
The following figures provide a representation of the existing organisational structures within IYLM per
Directorate. The following provides a visual representation and breakdown of the posts, as well as some
brief narrative speaking to the functions and responsibilities that the two highest levels of management
within the municipality are responsible for.

25
Figure 1: Municipal Manager’s Office organisational structure
The organisational structure provided above shows the Municipal Manager’s responsibilities within IYLM inclusive of oversight for institutional
Communications, Internal Audit, Monitoring and Evaluation, as well as the Special Programmes Unit and Mayoral support.

26
Figure 2: Corporate Services’ organisational structure
The Director of Corporate Services is the technical head of two divisional functions, namely human resource management and administration, inclusive of
Information and Communication Technology, Council Committee Administration, as well as Customer Care and Records Management.

27
Figure 3: Finances organisational structure
The following organisational structure shows the Chief Financial Officer as the senior manager responsible for the collection and management of organisational
revenue, as well as tasked with the responsibility of overseeing the financial arrangements for the provisioning of Free Basic Services to indigent households. In
addition, the CFO oversees all Supply Chain Management within IYLM and is responsible for the registry of institutional assets and fleet management. The CFO
is also responsible for five internships that are not currently provided for within the above organisational structure.

28
Figure 4: Local Economic Development organisational structure

29
The Director of Local Economic Development has responsibilities inclusive of the Integrated Development Plan formulation and consultation process, as well as
some performance management responsibilities. LED related projects and programmes focus upon Agriculture, Forestry, Tourism, and Enterprise
Development, while the directorate also has some research capabilities and functions, as well as includes some interns.
Figure 5: Community Services organisational structure
The Director of Community Services oversees a broad set of services aimed at addressing social needs within the Intsika Yethu Municipal area. Responsibility for Traffic Safety and
enforcement is one of the key responsibilities, along with management of Environmental Health and Waste Removal services. Further functions and services are include a special
coordinator for HIV/AIDS, Fire and Disaster Management, as well as responsibilities for Pounds and Animal Control.

30
Figure 6: Technical Services organisational structure
The following shows the range of positions and functions which the Director of Technical Services oversees. This is inclusive of Electricity and Energy Access,
construction and maintenance of IYLM’s built infrastructure, including Community Facilities, Public Works, and Integrated Human Settlements. At the time of

31
compilation of the IDP, the Directorate was only challenged with the filling of one critical post and considered itself relatively capacitated, given the
approximate 25% vacancy rate.
Figure 7: Water and Sanitation Provisioning organisational structure
The Director Technical Services is also the head of the IYLM’s Water & Sanitation Provisioning, which has infrastructural responsibilities specifically
addressing water and sanitation, in close cooperation with CHDM, which is the Water Services Authority.

32
Throughout IYLM’s back-offices, a range of well-developed institutional policies inform and prescribe key
organisational processes and functions crucial to its successful operations. This extensive policy set,
entailing more than 27 policies and 2 manuals, and the manner in which the policies are implemented and
adhered to, provides some explanation as to how the municipality has been so successful of late in this
regard.
Table 11: Existing Manuals of IYLM
The table on the following page provides an overview of all of the institutional policies for IYLM. Despite
this extensive list, there continue to be some policy gaps for consideration in the 2012-2017 period of the
IDP. Possible policies for consideration based on a benchmarking with other municipalities include:
Relocation Policy;
Private Work and Business Policy;
Job Evaluation Policy;
Sexual Harassment Policy;
Scarce Skills Policy; and
Succession Planning for Critical Posts Policy.
Notable in this list of potential policies is that of planning for the succession of critical posts. IYLM has had
the good fortune of relative stability amongst its senior management, but planning for the eventuality of
succession is inevitable to ensure a smooth administrative transition at the end of a contract or following
the departure of a Section 57 Manager.
Existing Manuals
Number Titles Year
IYLM-MAN 1 Delegation of Power Manual 2008/2009
IYLM- MAN 2 Access to Information Manual 2008/2009

33
Table 12: Existing Institutional Policies of IYLM
Existing Institutional Policies
Policy Number Policy Year
IYLM-HR 1 Recruitment Policy 2008/2009
IYLM-HR 2 Code of Conduct Policy 2008/2009
IYLM-HR 3 Draft Acting Policy 2008/2009
IYLM-HR 4 Subsistence and Travel Policy 2008/2009
IYLM-HR 5 Performance Management Policy 2008/2009
IYLM-HR 6 Remuneration Policy 2008/2009
IYLM-HR 7 Reward and Recognition Policy 2008/2009
IYLM-HR 8 Overtime and Work on Sundays Policy 2008/2009
IYLM-HR 9 Standby Policy 2008/2009
IYLM-HR 10 Training and Development Policy 2008/2009
IYLM-HR 11 Leave of Absence Policy 2008/2009
IYLM-HR 12 Integrated Disciplinary and Grievance Policy 2008/2009
IYLM-HR 13 Staff Movement Policy 2008/2009
IYLM-HR 14 Employee Assistance Programme Policy 2008/2009
IYLM-HR 15 Occupational Health and Safety Policy 2008/2009
IYLM-HR 16 Housing Policy 2008/2009
IYLM-HR 17 Telephone Usage Policy 2008/2009
IYLM-HR 18 HIV/AIDS Policy 2008/2009
IYLM-HR 19 Motor Vehicle Policy 2008/2009
IYLM-HR 20 Abscondment Policy 2008/2009
IYLM-HR 21 Attraction and Retention Strategy 2008/2009
IYLM-HR 22 Smoking Policy 2008/2009
IYLM-HR 23 Transport Policy 2008/2009
IYLM-HR 24 Funeral Policy 2008/2009
IYLM-HR 25 Records Management Policy 2008/2009
IYLM-HR 26 Farewell's Policy 2008/2009
IYLM-HR 27 Night Work and Shift Policy 2008/2009

34
2.8 Employment Equity
In terms of Employment Equity, IYLM boasts Senior Management and a staffing complement consistent
with its organizational Employment Equity Plan, with only an under-representation of people with
disabilities, whereby there are currently not any within the organizational structure. There is also a slight
gender imbalance within the organization, with 59% of all staff male and 41% female. IYLM is currently
addressing employment equity through awareness raising initiatives including: formal written
communication, a policy statement including reference to employment equity, a summary of the
Employment Equity Act publically displayed, Employment Equity training, diversity management
programmes and discrimination awareness programmes. An existing Employment Equity and Skills
Development Forum within IYLM is the ideal and appropriate route to allow support from the
management to monitor the municipality’s status in this regard. The table below provides an
organizational snap-shot of the Employment Equity status quo within IYLM.
Table 13: Employment equity* within IYLM as at 13 January 2012
OCCUPATIONAL LEVELS MALE FEMALE
TOTAL
A C W I PWD A C W I PWD Top Management 1 0 0 0 0 0 0 0 0 0 1 Senior Management 3 0 0 0 0 2 0 0 0 0 5
Professionally qualified and experienced specialists and mid-management
19 0 0 0 0 17 0 0 0 0 36
Skilled technical and academically qualified workers, Jnr. Management; Superintendents and Supervisors
22 0 0 0 0 25 0 0 0 0 47
Semi-Skilled & Discretionary Decision making
55 0 0 0 0 33 0 0 0 0 88
Unskilled and defined decision making
59 0 0 0 0 30 0 0 0 0 89
TOTAL PERMANAENT 159 0 0 0 0 107 0 0 0 0 266
Temporary employees 31 0 0 0 0 26 0 0 0 0 57
GRAND TOTAL 190 0 0 0 0 133 0 0 0 0 323 *A denotes African; C denotes Coloured; W denotes White; I denotes Indian; and PWD denotes People With Disabilities.
2.9 Skills development
Another strong point for IYLM over the previous term was its skills development and training
programmes, as informed by its Training and Development Policy (IYLM-HR 10/08-09). In this area, the
municipality has set out on developing of its human resources component through the establishment of
structures and procedures enabling the realisation of staff and Council’s innate potential.
A Municipal Skills Development Forum exists to assist and advise the organisation on human resource
related matters, including skills auditing and monitoring of training. Furthermore, the municipality has
provided for extensive skills development opportunities that include: in-service training; experiential
training and internships; learnerships; Adult Basic Education and Training (ABET); and undertaking
further studies. It also provides study assistance for staff as well as bursaries for both undergraduate and
postgraduate studies on the condition of returning for service as equivalent to the duration of the studies.

35
(Part B) The Development Context and Socio-Economic Profile
3. Socio-Economic Profile
3.1 Demographic Profile
This section provides a detailed analysis of the population of IYLM and provides some key insights into
demographics, socio-economic conditions, infrastructural service levels within the Municipal area and
environmental issues. The analysis lends weight to prioritisation of identified issues within the IYLM and
conveys some urgency with regards to what needs to be done first.
The primary source of information is the Eastern Cape Social and Economic Consultative Council
(ECSECC). This information was selected due to its comprehensive nature, free access and availability for
public scrutiny. Global Insight, Census 2001 and Community Survey data is also utilised particularly where
CHDM used this information or collected new information regarding the water and sanitation backlogs
that exist in the District Municipal area.
Table 14: IYLM population estimates over the previous term with forecasts for 2010/11
Population distribution over the previous term Population estimates
Area 2006 2007 2008 2009 2010 2011
Inxuba
Yethemba
56,354 54,562 52,750 52,079 51,782 51,236
Tsolwana 31,554 30,871 30,206 30,023 29,982 29,846
Inkwanca 18,230 17,413 16,615 16,350 16,265 16,059
Lukanji 202,209 206,154 209,803 211,921 213,234 215,084
Intsika
Yethu
184,308 185,211 185,843 186,044 185,934 186,031
Emalahleni 129,197 128,921 128,506 128,366 128,208 128,062
Engcobo 147,131 144,962 142,658 141,707 141,149 140,329
Sakhisizwe 60,505 59,243 58,017 57,710 57,686 57,473
Chris Hani
DM
829,646 827,491 824,545 824,346 824,383 824,263
Eastern Cape 6,627,460 6,669,749 6,703,452 6,728,955 6,743,823 6,765,781
Source: ECSECC, Statistics Database, 2011.
The table above shows us IYLM’s total population in relation to other LMs in the Chris Hani District
(CHDM) and the greater Eastern Cape Province. IYLM is the second largest LM in CHDM following the
Lukanji LM in terms of the size of its population. The table illustrates a marginal growth in the total
population of IYLM from 2006 to 2009. As a district CHDM seems to be experiencing a decline in the total
number of inhabitants. Apart from IYLM, only Lukanji seems to be growing in terms of population size
(albeit very marginal growth). In 2009, Lukanji and IYLM combined constituted 48% of the entire
population of CHDM. IYLM therefore remains a relatively highly populated LM in a District which is
characterised by small and declining populations.
Residents of IYLM are predominantly rural, living in small villages which cluster around the relatively
larger towns such as Cofimvaba and Tsomo. isiXhosa is the most spoken language as a mother tongue
within the municipality; in 2009 surveys showed that around 87% of the people in the municipality were
Xhosa 1st language speakers. IYLM is an almost racially homogenous municipality; ECSECC estimates for

36
2011 put the percentage of Blacks/Africans in IYLM at 99%. IYLM has a higher female than male
population, as is the case with the most other LMs in CHDM. The larger female population may be
attributed to the general tendency of males of working age to migrate to other areas where employment
opportunities are more available. Further research is required before we can conclude that the disparities
between the male and female populations of IYLM and CHDM are due to outward migration of males, but
such a trend is widely acknowledged throughout rural municipalities.
Chart 3: Age Distribution within IYLM (2011 Forecast)
Source: ECSECC, Statistics Database, 2011.
The above graph demonstrates that IYLM has a relatively young population with the majority of
inhabitants falling under the age of 30. The graph shows a very sharp dip in numbers after the teens with
very few people falling in the middle age category. For example the number of people aged 15-19 is roughly
5 times larger than the number of people in the 40-44 category. There are a number of factors that can be
associated with the youthful population of IYLM including high mortality rates amongst middle-aged
people caused by diseases such as HIV/AIDS and the out-migration of working age adults out of the area
in search of employment opportunities elsewhere. These factors are recognizable in many other
municipalities that have similar demographics to IYLM; however, there is no conclusive research within
IYLM to explain the youth bulge.
3.2 Poverty Rate in IYLM
The level of poverty in IYLM remains worryingly high. The table below, taken from ECSECC data, shows us
that the majority of people in the municipality can be classified as poor or living in poverty. The table
shows that the percentage levels of poverty in IYLM have decreased over time, and this is a trend that is
visible not only in IYLM but also in CHDM and the Eastern Cape province as a whole. Poverty in the
municipality seems to have been at its most acute point in the year 2000 when South Africa was
experiencing significant economic problems. The poverty rate then dropped after the country had
recovered to reach its lowest rate of since the democratic transition.

37
Table 15: Poverty rates from 1995-2010
Poverty rates from 1995-2010 Estimate
YEAR 1995 2000 2005 2010 Eastern Cape Province
50% 58.03% 56.26% 53.48%
Chris Hani District Municipality
57% 64% 60.26% 57.03%
Intsika Yethu Local Municipality
63.3% 68.8% 61.6% 56.4%
It is extremely important to note that measurements and perceptions of what poverty is vary from source
to source thus another source may see far more or far less poverty in the same area based on the normative
judgment which is driven by a certain understanding of what constitutes poverty. In addition there are
always various levels of poverty. The most severe level of poverty in South Africa is known as “indigent”,
this refers to a person who lacks the most basic necessities of a decent life such as:
Water;
Sanitation;
Energy;
Refuse removal;
Food and clothing; and
Housing.
IYLM maintains an Indigent Policy from 2009 which aims to ensure that households that cannot afford
municipal services are given access to the most basic municipal functions. The policy elaborates upon what
exactly constitutes an indigent household in the IYLM context. Given the historical legacies of
underdevelopment from the pre-democratic era, IYLM carries a heavy burden in terms of an indigent
population. Further socio-economic analysis provides more insights into the dynamics of IYLM.

38
3.3 Income and Employment data
The tables and graphs provided below tell us that the majority of people within IYLM do not receive any
income at all. However, this could be misleading because youth of school going age are also included in the
measurement and they generally do not receive income. Of those who do receive an income, most receive
between R801 to R1 600. This is considered to be very low income by national standards.
IYLM is a low income area; however, income levels alone do not sufficiently convey the full range of social
circumstances that people are facing. It should also be noted that many of the people listed as having an
income in this graph are not formally employed but receive government grants which are classified as
income.
Chart 4: Proportion of monthly income of IYLM residents by income bracket
Source: Gaffney’s Local Government in South Africa Yearbook 2011-2013, p. M134

39
Table 16: Social Grants recipients as a percentage of total population
Type of grant No. of recipients % of total population
Old age pension 8420 5.60%
Disability Grant 2922 1.75%
Child support grant 21 767 13.80%
Care dependency grant 540 0.32%
Foster care grant 34 0.02%
Grant in aid 99 0.05%
Social relief 2 0.00%
Multiple social grants 0 0%
Institutions 331 19%
Source: Gaffneys Local Government in South Africa-Official Yearbook, 2011-2013. Pg: M135
The number of people who receive grants in IYLM is substantial, even considering the extent of IYLM’s
indigent population. The table above tells us that the largest grant is the Child support grant which covers
21 767 people or 13.80% of IYLM’s entire population. Although there is a heavy concentration of youth
across the country’s age distribution, the distribution of grants suggests that fewer of these households
receive social welfare support than one would be inclined to believe. However, updated information from
the South African Social Security Agency indicates that more than 51,000 people receive grants within
IYLM, meaning more than a quarter of the population is grant dependent.
Chart 5: Employment opportunities across economic sectors
Source: ECSECC, Statistics Database, 2011
IYLM is characterised by high unemployment rates with 44% of the working population being officially
unemployed in 2009, as in seeking work opportunities but unable to find them. ECSECC estimated that
this number would decrease slightly in 2010 to around 42%. There has been a reasonable drop in the rate
of unemployment over the last 10 years since 2002 when unemployment stood at 54%. The largest
employment sector in IYLM is the tertiary sector which employs 74% of all employed people within the
formal sector. The largest numbers of people employed within the tertiary sector are involved in general
government. ECSECC estimated that there would be about 4263 people working in general government in
2010.

40
Chart 6: Employment opportunities within the informal sector
Source: ECSECC, Statistics Database, 2011.
When looking at employment figures in the South African context one should always consider analysis of
the informal sector. In IYLM, the informal sector remains a significant source of income for many of the
residents and therefore deserves to be mentioned in any analysis of income and employment within the
IYLM. According to Chart 6, the tertiary sector is the biggest source of income within the informal sector.
ECSECC explains that the majority of individuals earning an income from the tertiary sector of the
informal sector in IYLM are involved in the wholesale and retail trade 61%. The secondary sector
accounted for an estimated 24.44% of employment within the informal sector, the biggest industry within
this sector is the construction industry which accounts for 67% of all employment within the secondary
sector of the informal economy.
The primary sector accounted for only 8.40% of all employment within the informal sector. Agriculture
and fishing accounted for 100% of all employment opportunities within the primary sub-sector of the
informal sector. It is interesting to note that the informal sector mirrors the formal sector in terms of the
predominance of the tertiary sector as a means of employment and the inability of the 2nd and especially
the 3rd sectors to create employment. Furthermore ECSECC data shows that primary sector industries such
as agriculture and fishing have been contracting in terms of their ability to create employment. In 1995 the
agriculture and fishing industry employed 30% and 25% of all working people in IYLM within the formal
and informal sectors respectively; in 2010 ECSECC data forecasted that this industries share of the
workforce would fall to 8% in the formal sector and 13.8% in the informal sector. This is problematic in
that IYLM has not seen convincing growth in any other sector that could supplement the decline in the
agricultural and fishing industries.

41
3.4 Human Development Index
The level of development is a complex measure to capture in any society. Indeed much of the data
previously presented in this situational analysis speaks to aspects of development. Nevertheless there are
important internationally recognised indicators of development that should be looked at in order for one
to gain a good understanding of what kind of society is being analysed. The Human Development Index
(HDI) is possibly the most internationally recognised measure of a society’s standards of living. This is a
comparative measure which looks at indicators such as life expectancy, literacy and education.
Table 17: HDI for the Eastern Cape, District and IYLM
FORECAST
1995 2000 2005 2010
Eastern Cape
Province
0.4757 0.4968 0.5171 0.4828
Chris Hani
District
Municipality
0.4156
0.4296 0.4512 0.4126
Intsika Yethu
Local
Municipality
0.3712 0.3891 0.4123 0.3731
Source: ECSECC, Statistics Database, 2011
The HDI of a particular group is displayed by a measurement between 1 and 0, the closer to 1 a society is,
the higher the level of development on the other groups that measure closer to 0 are classified as less
developed. The HDI looks specifically at life expectancy, education and income per capita in order to
calculate the level of development of a given society or group.
The table above presents development indicators spanning over a number of years for IYLM, CHDM and
the Eastern Cape Province. The ECSECC data shows that IYLM maintains a relatively low HDI, well
beneath the national average. In 2010 ECSECC forecasted that IYLM’s HDI would be 0.3731 which is
below the national and the provincial averages of 0.5501 and 0.4828 respectively. This means that IYLM is
a poorly developed society by local and international standards.

42
3.5 Inequality Chart 7: Inequality within CHDM with special focus on IYLM
Source: Chris Hani Municipality Demographic Profile, 2009
The Gini Coefficient is a statistic which measures inequality in a society. The measurement varies from “0”
(a perfectly equal society) to “1” a society in which one household or individual possesses complete wealth
whilst everyone else earns nothing. In reality there are no completely equal or unequal societies i.e. “0” or
“1”. Most societies will have a measurement ranging between 0.25 (fairly equal) and 0.75 (highly unequal).
Nationally South Africa ranks as one of the most unequal societies on earth with a gini co-efficient score of
0.67 according to the World Bank. IYLM has a gini co-efficient of 0,58 which could be considered fairly
unequal by international standards but is rather low by national standards, indeed IYLM is the least
unequal municipality within CHDM. Whilst the relatively lower levels of inequality in IYLM may be
interpreted as positive in the sense that higher inequality has the potential to cause social instability, it is
important to remember that lower levels of inequality in IYLM could be caused by general poverty, in
other words many people are equally poor.

43
3.6 Economic Data Chart 8: Gross Value Added contribution (2010) as a percentage per Local Municipality within Chris Hani District
Source: ECSECC, Statistics Database, 2011.
Chart 9: GVA contribution of IYLM across economic sectors
Source: ECSECC, Statistics Database, 2011.
The above graphs illustrate the Gross Value added (GVA) with regards to IYLM. GVA basically refers to the
measure of the value of goods and services in a certain area. Chart 8 illustrates the GVA contribution of the
different local municipalities to the CHDM whilst Chart 9 shows IYLM GVA across different economic

44
sectors: namely primary, secondary and tertiary sectors. The primary sector of an economy includes all
economic activities that are concerned with extracting or harvesting products from the earth. In IYLM
these products include primarily the following:
Agriculture;
Fishing and forestry; and
Mining and quarrying.
The secondary sector of an economy includes all those activities concerned with manufacturing finished
goods. Prominent IYLM secondary economic activities include the following:
Food;
Beverages and tobacco;
Textiles;
Clothing and leather goods;
Wood;
Paper;
Publishing and printing;
Petroleum products;
Chemicals;
Rubber and plastic;
Metals, metal products;
Machinery and equipment;
Electrical machinery and apparatus, Radio and TV, instruments, watches and clocks;
Transport equipment, Furniture and other manufacturing, Electricity;
Water; and
Construction.
The tertiary sector of the economy is concerned with providing services. The tertiary sector of IYLM
includes the following:
Wholesale and retail trade;
Catering and accommodation services;
Transport and storage;
Communication;
Finance and insurance;
Business services;

45
Community;
Social and personal services; and
General government.
Notably, Chart 9 illustrates that the tertiary sector is the primary contributor in terms of GVA of IYLM
with the secondary and primary sectors contributing significantly less. Such a bias towards the tertiary
sector hinders economic growth in an area such as IYLM because it is the primary and secondary sectors
that should drive the growth of the local economy since they are far more labour intensive and have far
greater capacity to stimulate beneficiation. This is not to say that the tertiary sector is not important
however it is the primary and particularly the secondary sectors that can grow the economy.

46
(Part C) Spatial Orientation
4. Spatial Analysis and Rationale
This section necessitates that, the strategies, policy and maps reflect spatial implication with regard to
ward investment in urban and rural setting. It is inherent therefore that, the principles of the National
Spatial Development Planning (NSDP) and Provincial Spatial development Planning (PSDP) be applied to
ensure sustainable planning e.g. densification, mixed use as well as mitigation and adaption strategies
relating to climate change.
The Spatial Development Framework for IYLM is being reviewed and will be adopted by the Council in
2012. This is in response to requirements of Section 26 (e ) of the Municipal Systems Act, 2000 (Act No 32
of 2000), that requires every municipality to formulate a spatial development framework (SDF) as part of
the contents of its IDP to provide basic guidelines for a land use management systems of the municipality.
This further necessitates that, the spatial analysis must consider the broad economic sectors and key
structuring elements (nodes & corridors) since it is important that areas of need, potential (existing and
latent) and decline are shown spatially. The IYLM‘s Reviewed SDF: 2009/2010 illustrates future
development perspectives and desired growth, direction and pattern of spatial development and growth in
the municipality.
There are two types of settlement patterns in IYLM, namely rural and urban, with urban centres in
Cofimvaba and Tsomo. These urban centres possess a relative level of urban sprawl. Within IYLM there
are approximately 213 rural settlements which are sparsely scattered all over the 21 wards within the
municipal area with the largest concentration pockets found along the main access routes.
4.1 Spatial Overview
There are several issues that relate to IYLM with regard to spatial development, the following are regarded
as key issues:
Dispersed settlements patterns and pockets of development at urban centres surrounded by scattered underdeveloped rural villages, which implies great costs to achieve access to basic services and infrastructure;
Need to systematically address the fragmented nature of development to promote the integration of urban and rural areas over time (phased development approach which will optimise on existing capacity and resources to generate the most spin-off effects from investment);
Prioritisation of different levels of investment to ensure ongoing sustainable development and spin-off effects for continued economic growth in the IYLM area; and
Limited economic activity outside of urban centres.
There is a need to build on the agricultural and tourism potential of the area and target investment to other
LED related initiatives and programmes taking place outside of the urban centres that have potential for
growth and to generate economic spin-off.

47
Map 1: Spatial Priorities
Source: IYLM Spatial Development Framework Review, 2010/11

48
4.2 Prioritized Secondary Nodes
IYLM has rural nodes that are the focus for development planning of the livelihoods support in
agricultural development. These rural nodes are forming a key target area for land reform and rural
housing development projects. It is reported that, the rural settlements were not formally planned and the
need for rationalisation has been identified.
Map 2: Key nodes and corridors of IYLM
According to the IYLM the SDF identifies Cofimvaba and Tsomo as special development areas or most
important development nodes that are to receive attention for development given their roles as service
centres to 327 rural settlements within 23 wards. The two towns are to be complemented by prioritised
secondary nodes spread across the local municipality. These are rural nodes, which will be the focus for
promoting sustainable livelihoods; agricultural development, land reform and rural housing development.
Development issues identified in relation to the rural secondary nodes relate to the densification of these
areas to create the economies that will make it possible to provide services in these areas. The economic
sectors identified critical to stimulating economic development in these areas are agriculture and tourism.
Within proximity to Cofimvaba the following rural nodes have been identified: Qamata, Bilatye, Sabalele
and Lubisi. These areas are within reasonable travelling distance from Cofimvaba, with Qamata and
Bilatye being only 15 km away, Sebalele 20 km away and Lubisi 25 km away. Ncora is the only rural node
identified in the SDF which is within 20 km from Tsomo and just more than 20 km from Cofimvaba

49
Table 18: Prioritised Secondary Nodes
NCORA QAMATA BILATYE SABALALE LUBISI
The area has
history and
is being
earmarked
for
agricultural
development
There is a
need for
funding of
irrigation
schemes
There is
existing
infrastructur
e which
could be
improved
and utilized
for training
and
development
of skills for
the nearby
communities
There is a
need for
funding to
improve
existing
irrigation
schemes
Fish farming
will have to
be
investigated
The area has a lot
of agricultural
potential and will be
developed for maize
production
Construction of
shearing sheds
Piggery
Establish of
community gardens
The need for
Environmental
Impact Assessment
as part of planning
for all proposed
developments which
have potential to
change the current
land uses as well as
upgrading of
infrastructure
Protection and
preservation of
natural vegetation is
suggested
There is also a need
to investigate
possibly of a game
reserve coupled with
proper management
and fencing
The area has
been
earmarked
for wheat
production
and
development
of an
agricultural
village
Other
projects like
construction
of dipping
tanks and
piggery will
add value to
the livelihood
of the
community.
The following
has to be
considered;
Assessment
of the
available
resources like
dams and
making
proper use for
the proposed
development
Investigations
of possible
land suitable
for wheat
production
This area has
a potential for
tourism
development
but it needs to
be improved
through the
proposed
national
Monument.
Other tourist
attractions
areas will
have to be
identified and
developed to
ensure a
holistic
tourism route
There provisions
for all relevant
environmental
legislation would
have to be complied
with
Source: IYLM Spatial Development Framework Review, 2010/11

50
4.3 Development Corridors
Development corridors are characterized by higher order ribbon-like development along routes that would
otherwise be classified as movement corridors. Different types of corridors can be distinguished such as
development corridors, movement corridors, and activity corridors. The R61 from Queenstown through
Cofimvaba, Ngcobo to Mthatha has been identified as the East Corridor, one of the four major
development corridors in the Chris Hani District SDF.
This section deals with the synopsis of key issues contained within the IYLM SDF. The municipality has
resolved to make use of the cluster approach to the implement and facilitate the Integrated Development
Plan, through the utilisation of the following clusters; Technical Service Cluster, Social Needs Cluster,
Economic Development Cluster and Finance, Governance and Administration Cluster. The later cluster is
cuts across all other clusters thus ensuring the effective and efficient operation over the cluster system.
The development nodes approach links to the small towns’ development strategy.

51
Map 3: Special Development Areas
Source: IYLM Spatial Development Framework Review, 2010/11

52
Table 19: Development Zones
Settlement Zone
Type
Locality and
description
Rational for Zone
Development
Key proposal
Cofimvaba and Surrounds (Formalisation/ Densification Settlement Zone)
Located at Cofimvaba town and surrounds, the area encompasses some 8 settlements including Cofimvaba town and houses about 16 000 people.
The zone is identified to emphasize the strategic objective of concentrating new settlement development in a planned and formalized fashion within the urban precincts of the existing town. Greenfields development as well as upgrading of informal settlements.
Formalisation and development of Model 1- type settlement in areas outwards from the central urban precincts of Cofimvaba as guided by the Municipal SDF. Local planning processes (formalization / institutional upgrade) are proposed t0 accommodate growing pressures and institute land use management system. Formulation of a Commonage Management Plan is prioritized.
Tsomo (Formalisation/ Densification Settlement Zone)
Located at Tsomo town. Tsomo town is to provide a spatial indication that formal urban settlement should be prioritised in the existing urban centres. Note that little or no demand for residential units is registered at Tsomo town and the area should not be developed prior to efforts being concentrated at Cofimvaba in the short medium term (5-year planning period) unless a specific need arise.
Formalization and development of small-scale Model 1-type settlement in suitable areas outwards from the central urban precincts of Tsomo as guided by the Municipal SDF. Little pressure for growth is identified at Tsomo, therefore should continue as a minor service centre with no large scale housing development.
Mtshingeni Area (Development Support Zone)
Located at Mtshingeni area, which encompasses 2 rural settlements, accommodating about 4,000 people.
Area is identified as a Development Support Zone as it has been gazetted as a valid restitution claim. Zone identified to receive Local Planning Processes in collaboration RLCC for appropriate investment of development funds in the area.
Need for development planning to direct capital investment programmes for local development based on the gazetted land claim. Local planning processes aimed at formalization and development of existing Model 2 type settlement.

53
Settlement Zone
Type
Locality and
description
Rational for Zone
Development
Key proposal
Area to support settlement, rural livelihood initiative, tourism and agricultural development.
Bilatye and Qamata (Development Support Zone)
Located in portions of Wards 4 and 5, in the irrigation scheme areas of Bilayte and Qamata and includes some 4 settlements with an estimated population of 13 000 people.
Area is identified as a Development Support Zone because of the importance of the irrigation schemes of Bilatye and Qamata, which represent areas of significant investment in infrastructure over a period of time to realize commercial benefit from agriculture. Revitalisation of these irrigation schemes is a priority development initiative and the resolution of land rights issues in these areas is of great importance in achieving sustainable development outcomes.
Local planning processes aimed at investigating land rights The area is a LED/agricultural development focus area and the realisation of the value of investments in infrastructure in the Zone is linked to the resolution of land rights issues in the local areas.
Lubisi “cluster” (Development Support Zone)
Portions of Wards 6 and 7, and encompassing the Lubisi Dam and some 13 settlements, which house 15 000 people.
IYLM identified this area as where LED initiatives have been prioritized. Lubisi is identified to support Local Planning Processes in the area, aimed at integrating with LED initiatives (tourism potential)and enhancing development outcomes.
Local planning processes aimed at the formalisation of Model 2- type settlements and the resolution of land rights issues The area has been identified by the LM as a focus area for LED activities, including Small Business Development.

54
Map 4: Development Zones
Source: IYLM Spatial Development Framework Review, 2010/11

55
Map 5: Land Reform Zone
Source: IYLM Spatial Development Framework Review, 2010/11

56
(Part D) Service Delivery Profile
5. Service Delivery Profile and the Clusters
This section provides an analysis of the service delivery profile of IYLM with specific reference to the
backlogs facing the municipality. The National government has set out the National target for eradication
of service delivery backlogs. These targets are aligned to Millennium development goals (MDG’s) and
outcomes approach targets, hence a consistent effort should be made to achieving the targets. Access to
social and economic services enables people to participate more meaningfully in their economy.
5.1 Cluster Model integration and coordination
The municipality has resolved to make use of the cluster approach to the implement and facilitate the
Integrated Development Plan, through the utilisation of the following clusters; (1) Technical Service
Cluster, (2) Social Needs Cluster, (3) Economic Development Cluster and (4) Finance, Governance and
Administration Cluster. The latter cluster cuts across all other clusters thus ensuring the effective and
efficient operation over the cluster system. It is recommended that all these clusters have a programme of
action which culminates into the Performance Score Card and SDBIP. Cluster system can allow more
involvement of (s57 Managers), Portfolio Committee Members of the municipality who are responsible for
the availability of quality and relevance of information provided under their respective Key Performance
Areas in the IDP. Consequently the cluster system allows the (s57 Managers) to prioritise the support to
the IDP and increase efforts towards improving the quality of information and input to the IDP regarding
their KPAs. It is through the improvement on individual KPAs that the quality of IDPs will improve and
enhanced by the same commitment from Council Portfolio Committees. Such commitment should be
present throughout the duration of the IDP-Cycle since the ultimate quality of forward planning (IDP) is
best informed by the situational analysis which is the mirror of the municipality in as far as its existing
conditions is concerned.
The cluster approach in this regard deals with the following issues:
Table 20: Cluster approach
Technical
Service Cluster
Social Needs
Cluster
Finance, Governance
& Admin Cluster
Economic Development
and Planning Cluster
Infrastructure
Planning &
Development
Senior Manager
Community Service
Senior Manager
Municipal Manager Economic Development &
Planning Senior Manger
Water supply
provision
Sanitation
service provision
Electricity
Street lighting
Roads and
Storm Water
Land
Administration
and Housing
Municipal Public
Education (early
childhood &adult
learning
programmes)
Municipal Health
(Health) &
Hygiene
promotion)
Special
Programmes
(including Aids,
Disabled, Youth
Functional
Administration/
Administration
oversight
Intergovernmental
Relations
Policies & By laws
Public
Participation
Support to Council
political
leadership and
Local Economic
Development
(Agriculture, Forestry,
Tourism, SMME’s)
Poverty alleviation
Markets
Street trading
Local Tourism
Environmental
Management
Municipal planning (IDP,
SDF, PMS,SDBIP & LED)

57
Technical
Service Cluster
Social Needs
Cluster
Finance, Governance
& Admin Cluster
Economic Development
and Planning Cluster
Works
Facilitation of
EPWP
implementation
&Women)
Public Safety &
Traffic (Safety
and Security)
Public space and
Parks
Disaster
Management-Fire
fighting
Waste
Management
Refuse Removal
& transfer
stations
Public Transport
Community
Facilities
Cremation and
Cemeteries
Cleansing
Pound
Management
Licensing of
liquor selling
outlets
Licensing of dogs
Control and
inspection of food
& beverage
outlets
CDWs
Financial viability
Budgeting
Financial reporting
and credit control
Property Valuation
and billing
systems
Risk & Asset
Management Plan
Equity Plan and
Transformation
Telecomm nation
5.2 Technical Service Cluster
5.2.1 Free Basic Services and Social Infrastructure
In the provision of basic services and social infrastructure IYLM has increased its capacity and staffing
complement steadily over the years, expanding the breadth and depth of its service delivery. However,
serious gaps remain in the integration of its infrastructure provision. At this time the municipality does
not have an Integrated Service Delivery (ISD) Unit, nor does it have a Comprehensive Infrastructure
Plan (CIP) outlining the institutional requirements and financial viability of service delivery at this time.
However, it does have a Community Liaison Office tasked with interfacing with the public around
service delivery matters and it has initiated the process to engage a service provider to assist in the
development of a CIP for the municipality. It is expected that such a plan will be adopted by Council over
the new term. For the time being, IYLM takes an issue-to-issue approach to addressing its service
delivery backlogs and challenges. The following is an overview of the municipality’s status quo in this
regard.

58
Water and Sanitation: IYLM has not yet assumed its position as a Water Service Authority, hence it
has appointed an external service provider for rural water scheme maintenance and provides water supply
services to the towns of Cofimvaba and Tsomo.
IYLM has ongoing concerns regarding the water and sanitation backlogs of CHDM which invariably affect
it. Consequently within IYLM there are villages that do not have bulk services and schemes for basic
supply forcing the municipality to cart water from the centres to these villages and that remains to be a
costly exercise. This challenge is exacerbated by challenges to provide adequate funding for bulk services
for infrastructure.
Sanitation backlogs: High backlogs exist in the rural areas. Regarding the service level provision, 0, 9%
of the households have access to full waterborne and sanitation, with only 53.2% from peri-urban and
informal settlements. Rural villages have access to dry on site sanitation services in the form of VIP.
Approximately 0, 2% of the households depend on the bucket systems while 4.7% have no proper
sanitation. Where household access to sanitation by type is observed the following is evident: waterborne
0.9%, VIP 53.2%, Bucket 0.2%, non services access 45.7%. According to the CHDM’s Water Services
Development Plan (2010), estimates are that a total amount of R32.1 million is needed to address the
current sanitation backlogs.
Refusal Removal or disposal: The provision of the refuse removal is only provided in the urban areas
of Cofimvaba and Tsomo and is collected on weekly basis. Only 2% of households have access to weekly
refuse removal services, and only 1% receives regular or ad-hoc collection from the municipality. Another
1% is reported to be using communal dumps while 36% is underserved. About 60% in mostly rural areas
burn their waste or dispose it within their yards.
Roads and Transport: IYLM’s road network is mainly made of gravel roads which need upgrading and
maintenance services. Tarred roads are found along the R61 linking major Towns of Queenstown and
Mthatha through Tsomo to the N2 in the East London direction. The municipality is also conscious of the
number of citizens that rely on walking and has undertaken an expansion and upgrading of walkways
throughout public areas and along certain public paths, complete with the expansion of community
lighting, as provided for under the Projects and Programmes section of this document. IYLM currently
makes use of the CHDM Integrated Transport Plan (ITP) in supporting transport service provision
throughout the municipal area. The municipality currently lacks a Roads Master Plan but is giving due
consideration to the development of such a plan for the new term. A Storm Water Management Plan is
currently in draft, and still being revised before being submitted to Council in the new term.
5.2.1.1 Summary of existing backlogs within IYLM circa 2010
Table 21: Progress against backlogs within IYLM
Type of backlog Backlogs Census
2001
Backlogs eradicated up
to 2008/2009
Remaining backlogs
Backlogs eradicated
at the end of 2008/2009
Backlogs at the start of 2009/2010
Road infrastructure (incl. Storm Water)
1320 kms 85 kms 1235 kms 40 kms 1195 kms
Refuse Removal 23 Wards 2 Wards 21 Wards 0 Wards 21 Wards Street Lighting 240 Villages 1 Village 239 Villages 1 Village 238 villages Community facilities
56 buildings 12 buildings 44 buildings 0 buildings 44 buildings

59
The above table indicates the existing infrastructure backlogs within IYLM and considers a backlog to be
any infrastructure needs that were there before 1994.
Municipal service delivery on these issues is challenged by the low revenue base of the municipality from
which it finances the provision of these services. At this time, approximately 20% of IYLM’s own revenue
is used to fund capital projects and infrastructure developments, with the remainder financed by
government grants. However, given the backlogs detailed above, IYLM will need to expand its revenue
base while increasing and effectively applying all government grants if it seeks to make a serious indent
into the extensive backlogs it faces over the new term. At this time, the municipality does not have any
other sources of infrastructure investment but the potential to pursue the possibility of public/private
partnerships remains.
Table 22: Funding sources for addressing service delivery backlog
SOURCE OF FUNDING
2009/2010 2010/2011 2011/2012 TOTAL AVAILABLE
FUNDING REQUIRED
SHORTFALL/ Surplus
MIG R 18,586,171 R 21,563,804
R 25,934,894
R 66,085,000 R 1,471,751,360
R 1,405,666,360
DWAF R 26,000,000
R 27,000,000
R 28,000,000
R 81,000,000
MUNICIPAL R 10,400,000
R 12,000,000
R 15,000,000
R 37,400,000
TOTAL R 54,986,000
R 60,564,000
R 68,935,000
R 184,485,000
R 1,471,751,360
-R 1,287,266,360
Electricity: IYLM receives the supply of electricity through Eskom; the major towns of Cofimvaba and
Tsomo are served with electricity. The High Voltage (HV) Electrical Power line extends from
Komani/Qamata 1132KV to Qolweni/Manzana 166KV. Another power line extends from Cala/Elliot 166kv
to Butterworth/Noora 166kv. About 66% households have access to electricity. According to RSS (2006)
surveys the electricity backlog amounted to 44% of total demand, which has subsequently declined. The
municipality is challenged in this area in that it is not the authority, nor the provider, and therefore it
remains reliant on Eskom for the provision of electricity rollout to villages. This is further challenged by a
funding shortage to address the existing backlogs.
Housing: In terms of IYLM Housing Sector Plan (2008-2012) the area has municipal commonage land
which is available for future housing developments. The sites are well located in relation to work
opportunities and social services. IYLM is currently in the process of drafting a new Housing Sector Plan
which will provide a more updated and comprehensive outline of the trajectory of the municipality in this
regard. In particular, informal settlements were previously omitted from the Housing Sector Plan, but are
now being duly considered along with the migratory patterns of the municipal area which has seen at
worst, a considerable out-migration of young people, and at best, a stasis in population growth. A
Migration Plan is also proposed for consideration as part of Annexure A to this document.
One of the bigger challenges in this regard is in the implementation of housing provision which IYLM does
not have the power to do. Municipal capacity is said to be sufficient to support the provision and
expansion of most bulk services in this regard, but the onus for actual implementation of housing
provision rests with the Provincial Department of Human Settlements. For example, the municipality
currently has plans for approximately 1500 households submitted to the provincial department (608 in
Joe Slovo, 283 in Tsomo, 400+ in Cofimvaba, etc). It has made financial provision for the roll-out and
extension of bulk services to these areas but remains reliant on approval from the Provincial Department
in order to proceed.
Land reform: The existence of communal and informal land ownership systems in some rural areas is a
major challenge to development because it locks land which is needed for improving the lives of rural
people. There is a commitment by the Department of Land Affairs to transform land tenure so that rural
households living on traditional or communal lands can have access to land ownership.

60
Without a credible Land Asset Register IYLM has relied on its valuation roll to identify land potentially
available for development throughout the municipal area. A recent valuation in July of 2011 and two
subsequent supplementary valuations have provided a credible basis for which IYLM has been considering
future land development. The imminent completion of a more updated SDF will further inform the
municipality in this regard.
With regards to addressing land degradation and revitalisation, the municipality currently lacks an
existing plan in this regard, but is undertaking work to address this issue. It has been prioritised and
provided for as part of the high-level service delivery targets identified later in this document.
Consideration is being given towards the development of a plan in this regard.
One of the challenges in this regard has been that of land invasion, of which the municipality has
experienced at least one incident recently. Although IYLM does not have any formal mechanisms in place
in the event of land invasions, its past experience has made it familiar with the process of approaching the
Courts and following due process of the law prior to enforcing removals from illegally occupied land. As a
result of this process IYLM has identified alternative housing but the relocation of households from
invaded land to alternative accommodation has yet to be finalised.
In relation to Land Reform, Section 10 (1) (c) of Land and Assistance Act, 1993 (126 of 1993), as amended,
provides that the Minister may, from money appropriated by parliament, on such conditions as she/he
may determine, grant an advance or subsidy to municipalities to acquire land to be used as a commonage
or extent an existing commonage.
Following from the above background it is suggested that the municipality should consider the following
issue:
Identification and purchase of private agricultural land within the area of municipal jurisdiction for commonage purposes;
Identification of all state land (SADT farms, RSA farms and National Government of SA farms) within the area of municipal jurisdiction for redistribution purposes;
Creation of mechanisms through which both commonage and land reform (LRAD projects in particular) beneficiaries could access support such as provision of necessary farm infrastructure, training and capacity building, marketing and business development, and information and knowledge management; and
Establishment of leasehold or freehold small family farms (as opposed to large farms) to enhance access and security of tenure to land for the majority of those who have interest in farming in order to ensure secured and increased household food production and production for local markets.
The Department of Land Affairs (DLA) has also stated that, “In terms of the policy framework document
for the Land Redistribution for Agriculture Development (LRAD), it is crucial that municipalities should
create mechanisms within its programmes to allow rural communities to express their needs for land
reform (LRAD in particular), and to respond to these demands. It further provides that the local
Department of Agriculture in collaboration with the District and Local Municipalities should ensure the
congruence of LRAD projects with the IDPs. DLA is expected to expand support services to emerging
farmers who are mainly characterised as being resource poor farmers. The services that are rendered by
the Department to farmers that are engaged primary in subsistence farming on communal land will also
continue to receive attention. The communal lands of the Province contribute significantly to the social
safety net in food security and village survival strategies.

61
Map 6: Water Resources
Source: IYLM Spatial Development Framework Review, 2010/11

62
The availability of services such as water, energy and transport allow people to become more profitable in
their work, while communication establishes a vital link between people and the outside world. One of the
Millennium Development Goals (MDG) is to halve the proportion of the population who have no
sustainable access to safe drinking water and basic sanitation by 2015.
Table 23: Household access to water within IYLM
Household access to water from 2005-2010 Projection
Type of access to water 2005 2006 2007 2008 2009 2010
Basic access (In home, yard, or within 200m)
7,819 7,733 7,624 7,996 8,040 8,084
Piped water on community stand (distance greater than 200m from dwelling)
4,931 4,898 4,846 6,198 6,544 6,890
Borehole/rain-water tank/well
2,440 2,415 2,382 2,644 2,700 2,755
Dam/river/stream/spring 23,206 22,853 22,428 22,130 21,808 21,486
Water-carrier/Tanker/Water vendor
229 227 224 201 194 186
Other/Unspecified 514 509 501 538 545 551
Total 39,139 38,636 38,005 39,707 39,830 39,953
Source: ECSECC, Statistics Database, 2011.
Table 22 presents data regarding IYLM’s resident’s access to water from 2005 to 2009 with the estimate
for 2010 according to ECSECC. The data shows that the majority of IYLM (53%) residents still obtained
their water from Dam/river/stream/spring sources in 2010. Only 20% of residents in the area had basic
access in to water in 2010 (by basic access we refer to households that have access to piped water in their
homes or on a community stand within 200m from the place of dwelling). The basic access figure has
remained fairly constant since 2005 when 19.97% of residents had basic access to water. The number of
households using dam/river/stream/spring sources of water has fallen since 2005 when 59.29% of the
population used this method to obtain water.
It is important to remember that it is the district and not IYLM which bears primary responsibility to
ensure that people have access to water. In terms of the water supply arrangements in the Intsika Yethu
the district has appointed rural water scheme maintenance contractor – Maluti GSM – to operate and
maintain rural schemes while the DM provides on its own in the town areas of Cofimvaba and Tsomo.
Table 24: Household access to energy within IYLM
Household access to energy 2005-2010 Projection
Access to energy 2005 2006 2007 2008 2009 2010
Solar/other/unspecified 389 393 396 359 351 344
Electricity 10,687 10,560 10,391 12,959 13,571 14,184
Gas 167 163 158 119 106 92
Paraffin 18,063 17,767 17,417 15,907 15,295 14,684
Candles 9,833 9,753 9,643 10,363 10,507 10,650
Total 39,139 38,636 38,005 39,707 39,830 39,953
Source: ECSECC, Statistics Database, 2011.
IYLM remains behind much of the province and the rest of the country with regards to electrification.
Only 35.50 % of households were estimated to be using electrical energy in 2010. This falls well below the
district level of electrified households which was 52.55 for the same period. Paraffin remains the most

63
used form of energy in IYLM with an estimated 36.75% of households using it for energy. It is also
noteworthy that 26% of households use candles as a main source of lighting.
Eskom is the only electricity provider in IYLM. In the table solar energy which is an alternative energy
source supported by IYLM is categorized together with “unspecified” and “other” forms of energy. The
municipality’s role is currently to facilitate the implementation and communicate with Eskom regarding
areas of priority for connections. Backlogs in electricity connections remain high for most areas in the
municipality.
Table 25: Household access to refuse removal within IYLM
Household access to refuse removal 2005-2010 Projection
Means of refuse removal
2005 2006 2007 2008 2009 2010
Removed by local authority at least once a week
814 807 796 882 901 921
Removed by local authority less often
239 235 231 206 197 187
Communal refuse dump
246 244 241 237 235 233
Own refuse dump 22,370 22,062 21,678 23,963 24,373 24,783
No rubbish disposal 15,373 15,195 14,973 14,446 14,185 13,925
Unspecified / other 97 92 87 83 78 73
Total 39,139 38,636 38,005 39,707 39,830 39,953
Source: ECSECC, Statistics Database, 2011.
Table 24 shows that 62% of households in IYLM reported having to dump their refuse themselves instead
of it being removed by authorities. 34% of households reported having no rubbish dumping facilities at all.
Only 2% reported having their refuse removed on a weekly basis by a local authority. Such a situation has
serious implications for the overall hygiene of residents in the area, especially because table 22 shows us
that many people use river and dams as their only source of water, therefore posing a great health risk
since water which is used for drinking and cooking could become exposed to harmful substances
associated with refuse.
IYLM is responsible for providing refuse removal services to its areas of jurisdiction. Since the
establishment of IYLM municipality in 2000, this service has generally been provided to the urban areas
of Cofimvaba and Tsomo only. Rural areas generally use a range of temporary mechanisms such as their
own dumps within the yard, illegal dumping sites and mobile tankers.
Table 26: Household access to sanitation in IYLM
Household access to sanitation 2000-2010 Projection
Means of household sanitation
2000 2005 2010
Flush or chemical toilet 1,382 1,468 1,795
Pit latrine 14,490 13,786 13,260
Bucket latrine 381 343 270
None of the above 23,404 23,491 22,144
Unspecified 99 52 39
Total 39,755 39,139 39,953
Source: ECSECC, Statistics Database, 2011

64
The table above gives a breakdown of the situation in IYLM regarding sanitation. The table expands on the
various types of sanitation being used by residents over three years namely 2000, 2005 and the estimated
forecasts for 2010. Unfortunately this data lacks conclusiveness since the largest category over all three
years is the “none of the above” category which does not explain in enough detail what kind of sanitation is
actually being used for that group of households. Looking at the 2010 estimates we can see that the second
largest group is the pit latrine category which accounted for 33.18% of the toilets in use. Only 4.49% of
people were believed to be using flush or chemical toilets by 2010 estimates. While there has been a steady
decrease in the proportionate numbers of people using bucket latrines from 0.95% in 2000 to an
estimated 0.67 in 2010.
Chart 10: Access to Communication (2010 forecasts)
Source: ECSECC, Statistics Database, 2011
According to the ECSECC data, only 11% of residents in IYLM had access to a telephone in their own home
or access to their own cell phone. The largest proportion of households in IYLM (28%), rely on using a
nearby public phone for communication. Interestingly, 26% of households could only be categorised as
“unspecified” or “not applicable”, meaning that there is no information on what mode of communication
these households use. Either way what is striking about these statistics is the fact that an estimated 56% of
households in IYLM were still believed to be leaving their houses in order to communicate with others far
away because they have no other access within their houses e.g. cell phones, telephones etc..
Communication has become a vital part of life and business and a lack thereof easily impedes not only the
quality of life but also inhibits the ability of entrepreneurs, students, and other working professionals to
maximise opportunities that may come their way.
5.2.2 Human settlements
The Chart below illustrates that 71% of houses in IYLM are Traditional dwellings. Only 21% of houses in
the municipality are brick structures. It is important to remember that many households in areas such as
IYLM prefer traditional dwellings rather than formal brick structures for cultural reasons. The

65
municipality maintains a formal housing waiting list which indicates that there are in excess of 2000
families which require housing in IYLM. Just what role the municipality will play in meeting the demand
for housing is yet to be clarified since IYLM is not a housing authority. The municipality is yet to formalise
Land Administration and Housing function.
Settlements in IYLM are typically clustered on ridges and along the roads with a variety of housing
structures built out of mud brick, block and brick walls. Roofing varies from thatch to tiles or to
corrugated iron. In the two towns of Tsomo and Cofimvaba, there are informal structures and back yard
shacks behind larger houses built from brick and blocks.
Chart 11: Distribution of housing across IYLM
Source: ECSECC, Statistics Database, 2011.

66
5.3 Social Needs Cluster
5.3.1 Education levels
In terms of Stats SA (2001) National Census education IYLM fairs very poorly in terms of education.
About 36, 7% of the population has no formal education while 24% have some primary schooling and 7%
have completed their primary schooling. About 23% are recorded to have secondary schooling and only
9% of the population have completed matric (Std.10 / Grade 12) and Higher education. There are a
number of reasons for the low levels of education in IYLM which include:
Parents lack the money to send children to school;
Lack of scholar transport (which is critical in providing mobility to scholars to access their educational institutions) this results in poor scholar attendance and increased dropout rates in many remote rural areas;
Regarding Scholar Transport Assistance, the policy guidelines from the Eastern Cape Provincial Department of Education stipulates that public school learners who stay 5km (grade 4-12) as well as 2,5lm (grade R-3 and physically challenged learners) or more away from nearest and appropriate school should be provided with a subsidized transport to attend school, priority should be given to learners in the most disadvantaged communities; and
Another dimension of the problem relates to inadequate School Nutrition program in rural schools and farm schools and possible expansion to cater for all needy learners. According to MEC’s School Community Co-operative Ilima Programmes (SCCIP), “learners who are hungry do not have equal access to high quality education, and do not have access to opportunities for equal education achievement and will ultimately not have access to further education and employment opportunities that will change their social and economic circumstances”.
It should be acknowledge that in terms of Schedule 4 Part A of the Constitution, education at all levels,
excluding tertiary education falls under function areas of concurrent National and Provincial legislative
competence. This implies that all education related issues in the CHDM are dealt with by the Eastern Cape
Provincial Department of Education (EC-DoE). In recognising that education is a means of promoting
good citizenship as well as preparing our people for needs of a modern economy and democratic society,
the government must ensure progressive realisation of universal schooling, improving quality education
and eliminating disparities and inequalities. This requires a major renewal of schooling and education
system, by taking the following steps:
Work together with educators, learners, parents, school governing bodies and other stakeholders, to make education the priority for all;
Making education free and compulsory for all children as well as ensuring increase in no-fee schools particularly in impoverished areas;
Introduce a sustainable Early Childhood Education system that spans both public and private sectors and gives children a head start on numeracy and literacy as well as strengthen support for crèches and pre-schools in rural villages and urban centres;
Improve the quality of schooling, particularly performance in mathematics, science and technology and language development. Measures should include provision of incentives for mathematics and science teachers;
Promote the status of teachers, ensuring the employment of adequate numbers, and improving their remuneration and training, as an important part of the drive to ensure that quality teaching becomes the norm;

67
Increase graduate output in areas of skills shortages. This must include measure to streamline Sector Education and Training Authorities (SETAs), Further Education and Training (FET’s) and other institutions to address existing and forecast skills shortages;
Place Further Education and Training colleges at the centre of a popular drive to transfer skills;
Encourage government to embark on the re-opening of teacher training colleges within the District or where appropriate in IYLM;
Revive the role of state owned enterprises in skills development to support the economy;
Extend School feeding schemes to all poor primary and high schools, particularly in the remote rural impoverished areas, provision of scholar transport and exemption of school fees to needy children;
Conducting vigorous education and awareness programme to tackle the HIV and AIDS pandemic;
Profile new education facilities in the growth points of the IYLM;
Engage private sector to be more involved in ABET; and
Strengthen safety and security at schools.
Judging from the above, it is clear that, lack of facilities and basic services at schools may have significant
negative impact on the development of learners at schools, which could be partly manifest in low pass
rates. Thus, for these challenges to be adequately addressed there needs to be greater alignment,
coordination and support between Local Municipality, District and EC-DoE.
Chart 12: Educational levels of over-21 year olds
Chart 12 gives the percentage breakdown of the level of education of over 21 year olds. From the
information we can see that the biggest portion (39%) of over-21 year olds in IYLM have gone only as far
as primary school whilst 31% have gone as far as secondary school. 21 % of over 21 year olds have no
formal schooling, these individuals together with those who have not completed primary school would be
viewed as functionally illiterate (functional literacy in South Africa is often viewed as the ability to read

68
and write in an everyday context, an ability that one usually obtains at grade 7 level under normal
circumstances). The high levels of illiteracy and low levels of educational achievement in IYLM have an
impact upon the kind and nature of employment that the potential workforce aims to find. Generally
poorly educated and uneducated people will seek lower skilled jobs especially in the primary sector, this is
problematic in an area such as IYLM where we have learnt from previous graphs that it is in fact the
tertiary sector and not the primary sector which is offering the most jobs (these jobs tend to be higher
skilled jobs).
Table 27: Educational qualification levels within IYLM
Qualification Number of individuals
Degree 508
Post-matric diploma/certificate 242
Matric 4860
Diploma/certificate (without matric) 1078
Secondary Schooling (without matric) 22,818
Primary schooling 29164
No schooling 15160
Source: Gaffney’s Local Government in South Africa Yearbook 2011-2013, p. M134
5.3.2 Health Care Issues
According to CHDM: IDP Review 2010/11 and in reference to Global Insight (2007), a graph depicting a
population growth trends during 1996 to 2007 where population with and without HIV and AIDS reflects
a decline in HIV/AIDS infection rate and anticipated mortality rates. The CHDM: IDP Review 2010/11
further provides that, the epidemiological analysis conducted reflects that, “Gastrointestinal diseases are
most prevalent for which adult patients are admitted to hospitals, making up some 20% of the cases
followed by respiratory conditions, which contribute 18%”. In terms of health care capacity the National
norm is one clinic per 10 000 people and the national average figure for nurses per 100 000 people is 12
nurses. Within IYLM there is are 2.7 nurses per 100 000 people which is well below the adequate ratio.
Furthermore the analysis of available beds per 1000 population indicates that IYLM (1:1482) is below the
national average of 1:750. This indicates a low bed occupancy rate. Regarding the access to emergency
services, IYLM experiences serious problems in transporting urgent patients, it is reported that it takes
more than 3 hours to secure transport.
The area is adequately served with primary health care facilities as per RSS (2006) survey. 72.3% of the
households have access to clinics. There are 37 clinics, 4 mobile service points supporting 86 points and a
single district hospital. The main challenge is to improve the quality of specialist doctors and reliable
supply of medication.
Irrespective of the above status quo, the government is determining to end the huge inequalities that exist
in public and private sector by making sure that these sectors work together. It should be mentioned that,
as promulgated in the Constitution, Schedule 4 Part A, and the health service is a functional area of
National and Provincial legislative competence. In terms of Section 155 (6) (a) the Provincial government
must provide for the monitoring and support of local government in the Province, this function can be
assigned to a municipality in terms of Section 156 of the Constitution. The District municipalities have a
function of rendering Municipal Health Services (MHS) traditionally known as Environmental Health
Services) in the areas of their jurisdiction as promulgated in the Municipal Structures Act of 1998 and
National Health Act 2003. According to the CHDM IDP Review 2010/11, there is an uneven distribution of
environmental health services in the District, this situation is expected to be addressed when the power

69
and function of Municipal Health Service (MHS) becomes a District power and function. It is reported
that, the MHS-devolution processes is currently under way in CHDM as envisaged by the Section 78
Investigation and the developed Strategic Plan in respect of the provision of the Municipal Health Services
in the district will result into the transfer of the provincially employed Environmental Health Practitioners
(EHP) to CHDM. The major challenge confronting South Africa, CHDM and IYLM, today is the scourge of
HIV/AIDS epidemic, which is likely to pose a severe challenge for development for many years to come. In
the on-going attempts to actively manage the HIV/AIDS pandemic, the CHDM has facilitated the support
and strengthening of the Local AIDS Councils (LACs). IYLM should consider eliminating risks associated
with their high water quality degradation in streams and rivers. This can constitute an influencing factor
in the spread of cholera epidemic or infection hence sanitation and water projects should be augmented by
Assessment studies of quality and condition. This brings us to the dire need to monitor the quality of both
water and sewerage treatment works discharges to main water course.
Again the government has identified the following priorities that must inform a major improvement in the
health care system:
Reduce the impact of HIV/AIDS on individual, families, communities and society by expanding
access to appropriate treatment, care and support;
Strengthen fight against AIDS through collaboration with partners at all levels of society and
accelerate implementation of HIV and AIDS and STI plans;
Strengthen formal partnership against AIDS at all levels of our society including the strengthening the
South African National AIDS Council (SANAC);
Improve quality of health services and physical infrastructure revitalization; and
Increase the employment of community health workers, which will be linked to improvement of the
district health system.
In relation to health issues within IYLM it is evident that, in order to effectively and equitable provide the
Municipal Health Services (MHS) the CHDM will have to sign Service Level Agreements (SLA) and
Memorandum of Agreement (MoU) with the municipality and the Eastern Cape Department of Health
(EC-DoH) in reference to the Section 78 investigation that is underway. In return the CHDM will also,
have to find funding sources towards performing functions assigned to it, of which one of those functions
will be the development, implementation and monitoring of MHS by-laws.
5.3.3 Community Facilities
According to IYLM SDF, IYLM has 16 community halls but the quality of some of the facilities needs to be
improved and maintained. The Municipality intends to provide each ward with a community hall. Intsika
Yethu is in great need of library facilities. There are currently no library facilities for the community to
access important information. Provision of these libraries is vital and should be considered. There are
sports and recreation grounds in the Intsika Yethu area but majority of the sports fields are in a poor state
and need to be renovated. Community halls provides local communities with recreational facilities and
may be used as pension payouts, while libraries enables learners to access important information required
for their studies. Sport and recreation facilities promote the health and welfare of the people living in an
area.
5.3.4 Safety and Security
According to IYLM SDF, there are 3 police stations to look after the safety and security of the community.
These are located in Bolotwa, Cofimvaba and Tsomo. The municipality participates in local Community
Policing Forums aimed at mobilizing all affected stakeholders against incidences of crime. In terms of

70
policing facilities there are three 3 police station in IYLM located in Cofimvaba, Tsomo and Bolotwa. The
Municipality participates in community policing forums aimed at mobilising all affected stakeholders
against incidents of crime. In order to maintain low levels of crime in IYLM, more safety and security
services such as mobile police services need to be provided. In this regard the Eastern Cape Provincial
Crime Prevention Strategy has a key focus area which is strengthening Communities against crime
through community- based, primary prevention approaches: e.g. Innovative public education “messaging”
strategies, community-based interventions programmes and community-based activities aimed at
increasing the strength, capacity and resilience of individuals, families and communities in relation to the
known risk factor for crime.
5.3.5 Cremation and Cemeteries
According to Intsika Yethu SDF: May 2010, There are a total of 146 unlicensed/ unregistered cemeteries
distributed within the wards of the municipal area which need some improvement and re-organization to
ensure effective delivery. It should be acknowledged that most of these cemeteries have not undergone
geo-technical investigation to avoid the likelihood to underground water contamination.
5.3.6 Waste Management
Waste is an undesirable or superfluous by-product, emission, or residue of nay process or activity, that has
been discarded, accumulated or been stored for the purpose of discarding or processing. Waste products
may be gaseous, liquid or solid or any combination thereof and may originate from domestic, commercial
or industrial activities and include sewages sludge, radioactive waste. In this regard the municipality must
put measures in place to ensure that all the landfill sites are equipped with facilities such as weigh bridges
and other data capturing equipments, security and other essentials, this is in compliance with the
Department of Water and Forestry (DWAF) minimum standards. In relation to economic development
through waste management a Waste Recycling projects has potential economic impact i.e. whist reducing
the amount of municipal solid waste generated and disposed off at the municipal waste disposal sites by
encourage waste avoidance, minimizing reclamation and recycling.
According to IYLM’s Integrated Waste Management Plan (2005) it was reported that waste generation
growth estimates should be linked to economic growth, population wealth and population growth, thus
population dynamics determines a waste generation growth patterns.
The table below indicates population growth trends in relation to Waste Generation Rate (Kgs per person)
in IYLM. The Municipality is also considering the alignment of its Integrated Waste Management Plan and
Waste Management Strategy with that of the CHDM, this is currently underway.

71
Table 28: IYLM Waste Generation Rates in relation to population growth trends
Expected population growth trends
Area 2006 2007 2008 2009 2010 2011
IYLM 184,308 185,211 185,843 186,044 185,934 186,031
Growth Rate
(1.40%)
184,308 185,211 185,843 186,044 185,932 186,031
Expected waste generation rates in IYLM
Area 2006 2007 2008 2009 2010 2011
IYLM 147869.8 150087.8 152339.1 154624.2 156943.6 159297.7
Generation
Rate (0.75%)
147869.8 150087.8 152339.1 154624.2 156943.6 159297.7
TOTAL 147870 150088 152339 154624 156944 5159298
Source: IYLM Integrated Waste Management Plan, 20o5.
In light of the above reflection of waste generation trends, it is clear that IYLM needs to better differentiate
its approach to waste management in order to provide information on the types of waste disposed and
track the volumes of waste recycled in the area. The main challenge in this regard is the management of
the illegal dumping activities and enforcement of by-laws. Currently IYLM is facilitating a waste recycling
co-opt project in its attempt to minimize waste and stimulate local economic development.
The municipality is operating a licensed landfill site, licensed number: EC/CH/A/15/001-2011, located in
Cofimvaba and used for waste disposal. The license of the landfill site was granted in terms of Section
49(1) (a) of the National Environmental Management: Waste Act, Act no. 59 of 2008. Furthermore, there
are clear regulations regarding the kind waste which may not be accepted on the landfill site. IYLM has
developed an environmental by-law relating to Dumping, Littering and Waste Collection. The by-law
regulates all “waste-management activities,” that involves the generation, reduction and minimisation of
waste and waste handling. This includes the separation, storage, collection, and transfer of waste, and
waste treatment. Waste treatment includes the recovery of waste, recovery being the recycling,
reclamation and re-use of waste, and disposal of waste. The by-law further provides for the separation of
waste into different kinds determined by the nature of the waste. It also allows for charges to be made
payable for the removal of waste from premises or dumping of waste at a disposal site under the control of
the Municipality. The by-law further regulates potential illegal dumping through the control of all
dumping, littering, and other pre-determined contraventions. The by-law provides various offences
clauses which can result in financial penalties and in the most extreme instances, convictions. The by-law
is further enhanced by the existence of the Peace Officers employed by the municipality in order to enforce
it and ensure citizens act within the parameters of the law.
5.3.7 Disaster Management
Disaster Management remains a District Municipality function as per provision of the section 156, section
229 and the Municipal Structures Act (Act 117 of 1998), however IYLM is operating a disaster
management centre within the municipality.

72
Map 7: Overviews of empty land and flood lines within IYLM
Strategic Density Increases:
- Densification and infill development at strategic points provide the opportunity of ensuring increased activity in the centre and ensure that necessary thresholds to support business activity is present in the centre.
- New developments of various income levels must therefore be promoted in area C,D and E.
Flood Line Protection:
- The protection of the flood line is critical for safety reasons and for protecting the river and maximising the tourism opportunities that can be realised for the rivers natural value.

73
IYLM is not immune to emergencies and disasters and occasionally suffers the impact of various human-
induced and natural hazards that have the potential to kill, injure, destroy and disrupt. In terms of Section
54 (1) b of the Disaster Management Act, “the council of Chris Hani District Municipality, acting after
consultation with the relevant Local Municipality, is primarily responsible for the co-ordination and
management of local disasters that occur in its area”. Furthermore, Section 54 (2) states that a District
Municipality and the relevant Local Municipality may, despite subsection 54 (1) (b), agree that the Council
of the Local Municipality assumes primary responsibility for the coordination and management of a local
disaster that has occurred or may occur in the area of the Local Municipality”. Within the region, the
primary responsibility of coordination rest with local municipalities.
Regarding a Disaster Management Centre, Section 43 of the Disaster Management Act of 2002 states that
“each District municipality must establish in its administration a disaster management centre for its
municipal area in consultation with and operate such a centre in partnership with local municipalities”. In
this respect IYLM is reliant primarily on CHDM in the event of a disaster for managing the rollout of
disaster relief and mitigation.
IYLM has initiated the development of a Fire Response Plan and Fire and Emergency Guide Plan that will
assist in the overall preparation and management of fires. Primarily, the plans aim:
To prevent and combat veld, forest, mountain and chemical fires throughout the municipality;
To minimize the impact of veld fires where occurrences cannot be prevented;
To determine the various role players in cases of veld fires;
Determine a practical approach to be adopted by the municipality in endeavour of minimizing fires
through prevention, including early warning systems, mitigation and response strategies;
To provide guidance on the provision of fire fighting services including fighting of specialized fires
such as mountain, veld and chemical fires; and
To provide a standard regulation through by-laws for the prevention, management and controlling of
fires in the region.
However, there are considerable impediments for IYLM in the total preparation for fire and emergency
eventualities. These challenges include:
Building sufficient fire fighting and rescue capacity;
Improving the response time;
Establishing a local Disaster Management Centre;
Capacitating the Fire Protection Associations; and
Identification of suitable land in the event of temporary or permanent relocations.
IYLM currently has a central database for the tracking of fires across locations, dates and times. The main
challenge in this regard in the prevention and mitigation of veld fires as they remain the most serious
threat in this regard.

74
5.3.8 Environmental Management
IYLM has a functional environmental unit in place lead by the Assistant Manager: Environmental
Management and an Environmental Management Officer, dealing with environmental challenges within
the municipal area. Currently the Environmental Management Unit is implementing a R5 million
Greening and Beautification Project within Tsomo and Cofimvaba. The project is sponsored by the
Department of Economic Development Environmental Affairs and Tourism.
In addition to these specific initiatives, IYLM is also cognisant of the global issue of climate change which
may have important implications on all climatic variables, especially temperature and rainfall. Although
the direction and degree of climate change and its impact at municipal level is still unknown, it is expected
that temperatures may increase and while rainfalls may become less frequent, yet more intense, leading to
a greater frequency and intensity of draughts and floods. Given the rural nature of the municipality,
climate change has a potentially serious impact on agricultural activities. IYLM’s proactive role in local
economic development thus means that drought resistant crops may need to be investigated in mitigation
of the potential effects of climate change. Consequently a disaster management plan for the municipality
will also have to respond to severe climate conditions e.g. thunder storms’, lightning and hail.
A Climate Change Strategy has become a necessity in IDPs for the category A (Metros) and C (District
Municipalities). It is however advisable that category B (Local Municipalities) also adopt the District
Climate Change Strategy Framework and determine exactly how they integrate into the District’s plans.
Climate change is however defined in the National Climate Change Response Policy as an ongoing trend of
changes in the earth’s general weather conditions because of an average rise in the temperature of the
earth’s surface often referred to as global warming. This rise in the average temperature is due, primarily,
to the increased concentration of gases known as greenhouse gases (GHG) in the atmosphere that are
emitted by human activities. These gases intensify a natural phenomenon called the “greenhouse effect” by
forming an insulating layer in the atmosphere that reduces the amount of the sun’s heat that radiates back
into space and therefore has the effect of making the earth warmer.
5.4 Economic Development and Planning Cluster
5.4.1 Local Economic Development
Local Economic development (LED) occurs when communities, government and the business sector act in
partnership to engage in local activities to improve local social-economic conditions by making use of local
resources and opportunities. In the MFMA Municipal Budget Circular No.58 for 2012/13, for the Medium
Term Revenue and Expenditure Framework, it suggests that municipalities focus on maximizing their
contribution to job creation by supporting labour intensive LED projects. This necessitates that, the
municipality plays a critical role in creating an enabling environment for investments and other activities
that lead to job creation: This can be obtained by;
Ensuring that service providers use labour intensive approaches;
Ensuring that service delivery and capital projects use labour intensive methods wherever
appropriate;
Participating fully in the Expanded Public Works Programme; and
Implementing interns programmes to provide young people with on-the-job training.

75
IYLM and all its stakeholders and civil society have commitment in creating an enabling environment for
local economic; this is captured in the LED Strategy and Implementation Plan: 2020 has a Vision for the
municipal area.
The Vision for LED:
‘A vibrant developmental municipality that seeks to provide sound governance and ensure sustainable
development of its economy and people in an effective and efficient manner.’
The following are the strategic pillars for driving economic development within IYLM:
Coherent agrarian system that promotes agro-processing;
Institutional innovation and good governance that is complimentary to economic growth and
development;
Promote SMME development biased towards rural industrialisation;
Increased forestry productivity and creation of processing hubs; and
Develop human capability through training and skills development.
The following are the Anchor Projects identified within the Local Economic Development Strategy for
implementation within the Municipal area:
High value crop production and processing;
Livestock (Beef & sheep) Improvement and commercialisation;
Fruit(Stone Fruit) production, processing and packaging;
Furniture Incubator;
Promotion of cultural activities utilising available indigenous knowledge; and
Develop and market tourist destination.
5.4.2 Chris Hani Growth and Development Summit
As part of the National Growth and Development Summit Agreement provinces and district municipalities
were tasked with convening inclusive district and provincial summits. CHDM was the first to hold its
summit in the Eastern Cape Province. The CHDM identified six priority sectors, namely: a) Agriculture
and Agro-processing; b) Forestry and wood processing; c) Tourism; d) Construction; e) Manufacturing;
Trade and Business Services. These sectors are consistent with the sectors that the Intsika Yethu LED
Strategy has identified.
The priority actions identified in the District Growth and Development Strategy (DGDS) include the
following: Land and Agrarian Reform, Forestry, Timber and Wood Processing, Tourism Development,
Exploitation of Mining Resources, Manufacturing, Construction, Trade Services, Enabling Business
Environment

76
5.4.3 Economic opportunities within IYLM
Beside the recommendations indicated in the Intsika Yethu LED Strategy 2020 concerning institutional
arrangements, the municipality should explore the rich tourism potential by developing of priority tourism
clusters, which could become the key journey components in the IYLM LED Strategy 2020 action plan.
5.4.4 Tourism
According to the White paper on Development and Promotion of Tourism in South Africa (1996), Local
Municipality has the responsibility of planning, development and maintenance of Tourism product in
their areas of Jurisdiction. In line with this principles, the Tourism plan for IYLM, Responsible Tourism
Sector Plan (2008). The vision for tourism development in the IYLM area is:
Vision for Tourism
‘A responsible and sustainable tourism destination of choice for historical and adventurous experiences
in the Eastern Cape’
Mission for Tourism
‘To become a responsible and sustainable tourism destination of choice in the Eastern Cape, providing
historical and adventurous experiences by 2020 to benefit the local communities’.
The focus of the strategy is on marketing, product development, infrastructure development, human
resource development and an appropriate institutional framework that will support tourism development
in the area. This is achieved through the following Strategic goals and objectives:
Goal 1: To develop new tourism products to grow the destination;
Goal 2: To increase the participation of Local Communities in the tourism industry of the IYLM;
Goal 3: To ensure a high quality visitor experience in the IYLM; and
Goal 4: To extensively market IYLM as a tourism destination.
The following table details the tourism offerings, location, and type to provide an overview of tourism
within IYLM.

77
Table 29: Tourism Facilities in IYLM
Number Facility Name Town Sector/Type of Product
1 St Marks Town Centre Cofimvaba Historical 2 Lumanyano Cultural Group Cofimvaba Cultural Group 3 Old St Marks Church Cofimvaba Old Church Building 152 years old 4 Lumanyano Sewing Project Cofimvaba Sewing Project 5 Mava's Pottery Cofimvaba Pottery Art & Design 6 Nobandla Gospel Group Cofimvaba Music Entertainment & Gospel
music 7 Nomayisi Project St Marks Sewing, beading & clay pots
8 Sijongile Adult Project Tsomo Traditional Garments 9 Vuyisile Mini Youth Dev
Forum Tsomo Woodwork, furniture
manufacturing 10 Vukani Catering & Baking Co-
op LTD Qwili Location/Tsomo
Catering, cultural dancers, traditional healers, gospel choir
11 Sijongile Adult Project Mtshabe/Tsomo Cultural Group 12 Someleze Sewing Project Tsomo Cultural, Heritage, Historical
13 Mzamomhle Gospel Group Tsomo Gospel Group & Carpentry 14 St Joseph Apostolic Church of
SA Tsomo Historical church
15 Qwili Ilitha Sewing Co-operative
Tsomo Cultural &
16 Masizakhe Boomplas Cofimvaba Cultural 17 Qamata Irrigation Canals Qamata Agricultural 18 Zanoxolo Bolotwa Cultural
19 Zenzeleni Cultural Group Bolotwa Cultural 20 Siyavuya Bolotwa Cultural 21 Zimele Rural Development Qamata Cultural & Heritage
22 Ndungwana Vukani Arts & Craft
Qutsa Cultural
23 Amigo Catering Cofimvaba Cultural
24 Cultural activities & moral regeneration
Komkhulu Location/Tsomo
Cultural
25 Qamata Tourism Centre Cofimvaba Historical
26 Qamata Traditional Council Qamata Cultural, heritage 27 Masakhane Project Cofimvaba Cultural
28 Nosilence Tonjeni Tsomo Cultural 29 Mr Zamile Nyeka Tsomo Cultural 30 Mpakamisi Kunene Tsomo Cultural 31 Nosimo Crafters Tsomo Cultural 32 Nothembile Mdlekeza Tsomo Cultural 33 Nothusile Jam-Jam Tsomo Cultural 34 Nothembile Sonyabashe Tsomo Heritage 35 Mateke Mazomba Tsomo Cultural 36 Mbulukweza Crafters Tsomo Cultural 37 Mncedi Kunene Tsomo Cultural 38 Qwili Junior Secondary
School Tsomo Cultural, heritage
39 St Marks Town Centre Cofimvaba Historical 40 Lumanyano Cultural Group Cofimvaba Cultural Group
Source: IYLM TSP: 2008

78
5.4.4.1 Tourism sector SWOT analysis
This section discusses the strengths, weaknesses, opportunities and threats (SWOT) of the tourism sector
of Intsika Yethu identified as critical in transforming the local economy. The information below has been
extracted from the Responsible Tourism Sector Plan.
Table 30: Tabulation of strength, weaknesses, opportunities and threats
STRENGTHS WEAKNESSES
Heritage sites
Rich political history
Availability of human capacity
Government support
Poor marketing of the area
Lack of product development
Unavailability of tourism statistics
Lack of adequate infrastructure to promote sports and recreation
Lack of adequate skills for tourism management, tour guiding, tour operation, sport management and promotion of cultural activities Limited Access to funds
Lack of Infrastructure
Lack of Co-ordination & Integration
OPPORTUNITIES THREATS
Hiking and horse trails
Events
Fishing opportunities in the major dams (Lubisi and Ncora)
Lubisi dam provide opportunities for development of water sports
R61
Linkages with the liberation route
Crime levels poses a huge threat to potential tourists
Global change
The potential tourism cluster’s to be identified in IYLM will be aimed at improving tourism spread within
the area. The potential clusters are; Mining Cluster (show casing local mining activities & tours), Eco-
Nature Cluster ( enhancing Nature Reserve and surrounding s areas), Cultural, Historical & Political
cluster and utilization of heritage sites: and Rural Conference facility Cluster (exploiting potential of
conference market, team building exercise venues logistically positioned around Cofimvaba and Tsomo.
5.4.4.2 Tourism demand
The demand side of tourism focuses on those needs and motivations that drive individuals to become
tourists, how these needs and motivations are shared by other people and how this becomes the basis for
defining tourist segments and markets, and how these tourist segments ultimately drive the movements of
tourists from one country and region to the next. Tourists take holidays in the hope that these holidays will
satisfy, either partially or wholly, various needs and desires. It is the task of the marketer to transform
needs into desires by making the individual aware of the various ways in which his or her needs can be
satisfied.
The following diagram indicates the specific interests of international visitors to South Africa from
Europe, Asia and the USA with regards to tourism.

79
Figure 8: Availability of activities within Provinces
Existing tourism facilities are currently under-utilized and under-developed, the upgrading of the
associated infrastructure, revitalization and expansion of tourism facilities, enhancing economic
development with regional significance and relevance, especially for the previously disadvantaged
community areas. This can be achieved through development of Tourism Belt- development as one of the
anchor projects of the LED Strategy development aimed at unlocking the tourism development potential
of the area. The following table indicates heritage tourism initiatives within IYLM.
Table 31: Heritage Tourism initiatives
Programme Name Location (Ward & Village)
Nature of Activities
Lubisi Development Centre
Lubisi (Ward 6) Accommodation Craft Youth Training
Sabalele Heritage Sabalele (Ward 2) Heritage Site Caves
Tsomo Old Prison Tsomo Town Tourist Centre
St Marks Anglican Church St Marks
Ngcongcolorha Falls
Chris Hani Memorial lane & Statue
In addition to tourism initiatives, IYLM boasts a strong range of sports and recreational tournaments and
events. The following table provides a brief overview of annual events and activities, including the
infamous Mayor’s Cup.

80
Table 32: Sports and Recreation
Programme Name Location (Ward & Village)
Nature of Activities
Mayor’s Cup
Wards 1 – 23 Netball Soccer
Sport Hubs Magwala All Codes Traditional Dance & Music
Wards 5, 6 & 13 Traditional Dance Indigenous / Traditional Music
The existing tourism initiatives have a potential in creating jobs, and can be seen as integral to the existing
Tourism Strategy. The upgrading of the associated infrastructure has a potential to unlock the Small
Medium and Micro Enterprise (SMMEs), which have a massive potential where cooperative formations
are a form of economic emancipation.

81
Map 8: Tourism
Source: IYLM Spatial Development Framework Review, 2010/11

82
5.4.5 Agriculture
Agriculture is the largest industry within the primary sector in IYLM. However this industry remains small
and underdeveloped when compared to the entire economy of the municipality. What is most notable
about the Agricultural sector in IYLM is the fact that as an industry, agriculture is decreasing in terms of
the absolute size that it contributes to the IYLM economic output. In 1996, The Agricultural sector
contributed 18.6% to the local economy; this figure had fallen to 14.6 by 2005. Subsequently the
Agriculture industry is also offering fewer employment opportunities in recent years. Currently only
around 0.4% of employed individuals in IYLM are employed in the Agricultural industry.
Opportunities in the agricultural sector are prevalent despite the fact that the industry continues to
perform poorly. As stated in the SWOT analysis, IYLM has good grazing land and soil which is suitable for
intense commercial grazing. There are a number of projects that have been embarked upon by the IYLM
with the intension of harnessing the potential of the agriculture industry. These include:
Irrigation and agricultural projects from Lubisi to Ncora Dams; and
ASGISA driven agricultural projects, projects, fruit growing (peaches/plums nectarines) in
Cofimvaba.
Table 33: Agriculture SWOT Analysis
Strengths Weaknesses
Organised farmers union Support System from government Expertise within government and private sector
Availability of land for various agricultural commodities
Established irrigation infrastructure
Lack of Information Lack of Integration towards
agricultural development
Poor co-ordination amongst the various role players
Poor planning Poor infrastructure
Opportunities Threats
High potential soils and grazing land for intensive commercial farming systems;
Value addition Market Linkages Job Creation
Partnerships (PPP) Stone Fruit Intensive Goat Production Programme
Natural disasters (Veld Fires, Storm, Dry spells);
Source: IYLM 2020 LED Strategy and Implementation Plan, 2007

83
Map 9: Proposals Local Economic Development (Agriculture – Crops and Forestry)
Source: IYLM Spatial Development Framework Review, 2010/11

84
Map 10: Livestock Potential Areas
Source: IYLM Spatial Development Framework Review, 2010/11

85
5.4.6 Forestry
Forestry is the second largest industry within the primary sector after agriculture in IYLM. According to
ECSECC data, forestry is an industry that has been declining over the past 10 years; this reflects a general
trend of economic contraction within the primary sector. Just as with Agriculture, there is great potential
within the forestry industry despite the fact that it continues to perform poorly in terms of economic
output. IYLM has available natural forests which could be utilised for forestry. Furthermore there is also
open land that could be used for expansion of current forests. As an industry, forestry has the potential to
stimulate growth of secondary sector industries such as furniture manufacturing.
The potential of IYLM to develop a flourishing forestry industry is something which has been recognised
not only by the local municipality, but also by the District Municipality. CHDM has categorised the
growth of a forestry, timber and wood processing industry as one of its priorities in terms of the Growth
and development summit. Forestry within IYLM features prominently within CHDM plans for the district,
for example CHDM plans to establish medium size sawmill to benefit Intsika Yethu and Engcobo
Municipalities. The district also plans to facilitate aforestation in IYLM among other areas.
Table 34: Forestry SWOT analysis
Strengths Weaknesses
Availability of Natural forests Availability of land for forestry expansion
purposes
Pro-poor biased government legislation and policies;
Availability of labour force
Private sector interest in partnering with communities
Lack of information and knowledge of
government policy on forestry expansion, transfer of Category B and C plantations
No clearly defined role of the municipality in forestry development including woodlots and commercial plantations
Poor road network and other infrastructure;
Lack of funding to expand current production scale;
Shortage of appropriate skills; Poor co-ordination resulting in lack of
implementation Poor leadership in forestry development
by the municipality
Complex land tenure system Opportunities Threats
Furniture manufacturing DWAF programmes to support
community afforestation initiatives Willingness of well-established forestry
companies to enter into partnerships and invest in community afforestation programmes
Integration of forestry development into agriculture
Increasing forestry market
Natural disasters Manmade disasters such as fires, arson
Environment hazards Complex tenure arrangements
Source: IYLM 2020 LED Strategy and Implementation Plan, 2007

86
Map 10: Forestry
Source: IYLM Spatial Development Framework Review, 2010/11

87
5.4.7 Environment Management
It is essential that, the District Municipality assist the municipality in both technical and financially to
develop and implement the environmental management function, the state of air, water, waste, bio-
diversity and land are some of the key elements in determining the state of environment. Linked to
tourism potential of the area, endangered areas are even spread throughout the Municipality as the
original ecosystem has been reduced and that the functioning or existence is under threat land cannot with
stand loss of natural area through disturbance or development. The following wards have been earmarked
as some of endangered areas in IYLM: Ward; 1, 13, 14, 16, 17, and 18.
Environmental Sensitivity areas: IYLM has least areas covered by sensitive landscape compared
with other local municipality in the District Municipality area. This results into priority environmental
management issues within the municipal area to cover slope gradient, vegetation, conservation and
degraded land. There are factors which identify the sensitivity of the environment as prescribed are ( areas
of with sheet erosion and gully erosion present, degraded land, wetlands (including dams), vegetation
types sensitive to development ( e.g. South Eastern Mountain Grassland and sub-arid Thorn Bushveld)
The need for development of environmental management policy is:
To enhance a safe and healthy environment;
To direct sustainability and responsible planning decision-making;
To spearhead sustainable development;
To improve environmental governance throughout the Municipality; and
To create environmental awareness and commitment within the Municipality.

88
Chapter 3: Development Priorities, Strategic Objectives, Strategies and Projects
6. Vision, Mission, and Key Performance Areas
This chapter of the IDP provides an overview of the strategic intentions of IYLM and presents prioritised
issues which the municipality seeks to address over the medium term. This section therefore
systematically prioritizes all the issues that have surfaced from the situational analysis and community
consultations and presents what the organisation seeks to achieve in relation to these issues over the next
five years.
Although local government is the sphere closest to communities at the heart of government’s development
agenda, the Constitution requires that governance at the local level be subject to national and provincial
legislation. Section 25 (1) (e) of the Municipal Systems Acts clearly states that an IDP adopted by a
Municipal Council must be compatible with national and provincial development plans and planning
requirements binding on the municipality in terms of legislation. The synergy, alignment and coordination
between the various development plans and strategic imperatives of the three spheres of government (i.e.
IDP, PGDP, NSDP, National Outcomes Approach, etc) is vital in order to achieve proper coordination and
alignment of development initiatives within the region and locality.
In order to ensure that local government interventions drive the desired socio-economic changes in line
with government’s development agenda, integrated planning, monitoring and reporting of municipal
initiatives is crucial. Government’s emphasis upon an outcomes orientation for all interventions, inclusive
of projects implemented by Sector Departments, necessitates that strategic considerations regarding the
allocation of scarce resources are made to best address prioritised issues. This section contributes towards
a shared understanding of the priority issues of communities, and how this has informed the broader
strategic developmental trajectory of the municipality, ultimately in pursuit of better coordination,
alignment of programmes and improved impact on the ground.
As the Council elected in May 2011 has sought to ensure direction and guidance in driving local
development, it has produced a renewed Vision, Mission, and Values for the IYLM. But in order to ensure
these strategic intentions translate into the achievement of outcomes on the ground for citizens, it needs to
be clear how Council’s political directions cascade through a clear organisational logic towards the
realisation of IYLM’s constitutional mandate of developmental local government.
The figure below provides a visual representation of the logic that informs how the strategic direction of
IYLM, as formulated by Council, finds expression from the Vision statement of the municipality, down to
the Projects on the ground. The apex strategic statement is that of the Vision of IYLM, derived from the
shared Values of its people and political leadership, and articulating a future in which the Priority Issues
have been sufficiently addressed. Institutional purpose in relation to the stated Vision is expressed
through the organisation’s Mission, articulating what shall be done towards the realisation of that desired
future. This Mission is then supported by a set of Goals, roughly aligned to the Key Performance Areas of
local government. These Goals are unpacked and expressed at a lower level as Strategic Objective
statements, identifying the intended benefits of IYLM’s course of action over the medium term, as
informed by the Priority Issues identified by communities, staff, Council, and through compilation of the
Situational Analysis. These Priority Issues emanate from the ground up, and are addressed through all
levels of the organisation’s strategic intentions, although most directly at the Strategic Objectives level.
How the Strategic Objectives are realised is thereby dependent upon the Strategies employed by the

89
municipality, and specifically the Projects through which these Strategies are operationalised and
implemented on the ground. In this manner, a clear logic of strategic intention flows from the top of the
organisation down, all along the way informed by other practical, legislated, and political imperatives
ranging from broader policy positions to budget and financial considerations.
Figure 9: A visual representation of the hierarchy of strategic intent of IYLM
6.1 Vision and Mission
The Vision:
“A people centred, developmentally focused rural local municipality in which all of its inhabitants have
access to quality service delivery and participate in vibrant and well-balanced social and economic
development”.
The Mission:
“Endeavours to advance its developmental local government mandate through a sustained focus on
sound and accountable governance, physical and social infrastructure appropriate for sustainable
development in our Municipal area”.
6.2 Principles and Values of IYLM
IYLM adopts the “Batho Pele Principles”, together with other underlying principles aligned to this value
framework, which include the following: Democracy, as realised through consultation, transparency, and
accountability; Respect & Courtesy; Responsiveness; Quality Services; Redress; and Value for Money.

90
The IYLM in consultation with its local communities, as part of its Council and IDP representative
processes, adopted the following set of values, in line with the above. These values are to guide how the
Municipality performs its mandate, as well as how it interacts with those who remain the owners of
development (i.e. its inhabitants as the beneficiaries of development and service delivery).
To be responsive to the needs of citizens and partner-local municipalities.
To be transparent, accountable and participative in our dealings with each other and our partners.
To cultivate a work ethic focused on performance, achievement and results.
To promote and pursue key National, Provincial and local development goals.
To ensure a representative organisation.
To be democratic in the pursuance of our objectives.
To show mutual respect, trust and ensure high levels of co-operation and discipline in our dealing
with one another.
6.3 Key Performance Areas, Clusters, and Goals
The clustering within the Situational Analysis distinguished between external service provision across
three clusters, that of Technical Services; Social Needs; and Economic Development and Planning. These
externally oriented clusters are intersected by the fourth cross-cutting cluster, that of the Finance,
Governance, and Administration Cluster, which has a more inward orientation. These clusters are
consistent with the five Key Performance Areas of local government, with the caveats that Municipal
Transformation, Finance, and Good Governance are within one cluster together, whereas Social Needs
and Technical Services represent the separation of the Basic Service Delivery Key Performance Area into
two distinct clusters.
Figure 10: The convergence of KPAs, Clusters, and Goals for the IDP 2012-2017
KPAs
1. Municipal Transformation &
Organisational Development
2. Basic Services and
Infrastructure
3. Local Economic Development
4. Municipal Financial Viability
& Management
5. Good Governance & Public
Participation
CLUSTERS
1. Technical Services
2. Social Needs
3. Economic Development and
Planning
4. Finance, Governance, and
Administration
GOALS
1. Institutional development
2. Municipal planning,
maintenance & infrastructure
provision
3. Provide social infrastructure
4. Job creation through
enterprise formations,
business retention & expansion
5. Building financial viability
6. Good governance & oversight
IYLM Strategic
Nexus

91
In terms of alignment and addressing priority issues identified across the five (5) KPAs and four (4)
Clusters, IYLM set six (6) Goals consistent with each of its main administrative functions over the medium
term. These Goals are aligned to each of the 5 KPAs, except where Basic Services and Infrastructure is
separated into two distinct Goals, one addressing Social Needs and the other addressing Infrastructure
and Technical Services. Meanwhile, Finance, Governance and Administration all have their own respective
Goals, within this single Cluster. IYLM therefore presents in subsequent sections of this chapter details of
how its organisational Goals and Strategic Objectives will address Priority Issues through the
implementation of specific Strategies and the tracking of progress via performance indicators. In order to
focus on a developmental trajectory that will ensure progressive realization of the Vision of the Council as
stated above, and derived from the institutional Mission, the Council has resolved to focus on six (6) Goals
as follows:
To provide effective and efficient human resource and administrative services within IYLM towards
institutional development and good governance, supported by enhanced information and
communication technology;
To provide sound municipal planning, maintenance, and infrastructure provision that delivers for the
needs and aspirations of IYLM citizens;
To provide quality social services and social infrastructure for the communities of IYLM, while
ensuring public safety, promoting improved public health, and supporting sustainable environmental
management;
To support enterprise formations, retention and expansion of businesses and initiatives that provides
job opportunities and income to the people of IYLM;
To build the financial viability of IYLM through integrated planning, management, and good
governance for a clean administration; and
To ensure good governance and effective oversight within IYLM.
6.4 Goals and Strategic Objectives
6.4.1 Institutional development
Goal- To provide effective and efficient human resource and administrative services within IYLM towards
institutional development and good governance, supported by enhanced information and communications
technology.
This Goal will be realised through the achievement of the following Strategic Objectives within the Key
Performance Area of Municipal Transformation and Organisational Development and the Finance,
Governance and Administration Cluster:
To improve the skills sets of IYLM Council and staff in line with their Personal Development Plans
(PDPs).
To improve the well-being of IYLM staff and Council for better service delivery.
To improve the institutional performance of IYLM through the cascading of the institutional
performance management system.
To improve access to information for Council, staff, and citizens of IYLM.

92
To increase the satisfaction levels of citizens with regards to IYLM services.
To enhance governance through application of standing rules and orders of IYLM.
To increase the organisational capacity of IYLM in annual prioritised work areas.
To achieve equitable representation of Municipal staff in line with organisation’s transformation
agenda.
6.4.2 Municipal planning, maintenance & infrastructure provision
Goal – To provide sound municipal planning, maintenance, and infrastructure provision that delivers for
the needs and aspirations of IYLM citizens.
This Goal will be realised through the achievement of the following Strategic Objectives within the Key
Performance Area of Basic Services & Infrastructure and the Technical Services Cluster:
To improve road infrastructure networks within IYLM for greater mobility of people, goods, and
services.
To achieve integrated land-use for sustainable human settlements within IYLM.
To improve access to basic water & sanitation to citizens of IYLM.
To improve access to electricity to citizens of IYLM.
6.4.3 Provide social infrastructure and quality social services
Goal- To provide quality social services and social infrastructure for the communities of IYLM, while
ensuring public safety, promoting improved public health, and supporting sustainable environmental
management.
This Goal will be realised through the achievement of the following Strategic Objectives that fall with the
Key Performance Area of Basic Services & Infrastructure and the Social Needs Cluster:
To improve the well-being of vulnerable groups within IYLM.
To reduce HIV/AIDS related mortalities within IYLM.
To reduce the incidence of road accidents within IYLM.
To increase household access to refuse removal services within IYLM.
To limit the risk of fires and disasters to communities within IYLM.
To improve the environmental sustainability of IYLM.
To improve access to public amenities and recreational facilities for people within IYLM.
To improve the security and care of all animals within IYLM.
To reduce the incidence of crime within IYLM.

93
6.4.4 Job creation, enterprise formation, business retention and expansion
Goal- To support enterprise formations, retention and expansion of businesses and initiatives that
provides job opportunities and income to the people of IYLM.
This Goal will be realised through the achievement of the following Strategic Objectives that fall within the
Key Performance Area of Local Economic Development and the Economic Development and Planning
Cluster:
To improve the agricultural sector contribution to the local economy of IYLM.
To improve the forestry sub-sector’s contribution to the local economy of IYLM.
To enhance tourism sector’s contribution to the local economy of IYLM.
To grow enterprises involved in beneficiation and value-addition within IYLM.
To increase employment opportunities (temporal and permanent) within IY Municipal area.
To contribute to the environment sustainability of Instika Yethu through prevention of soil erosion
and removal of alien species.
6.4.5 Building financial viability
Goal- To build the financial viability of IYLM through integrated planning, management, and good
governance for a clean administration.
This Goal will be realised through the achievement of the following Strategic Objectives that fall within the
Key Performance Area of Financial Management and Viability and the Finance, Governance, and
Administration Cluster:
To improve the accuracy of the IYLM’s financial planning and reporting.
To achieve best value for money through effective supply chain management within IYLM.
To improve financial management capacity within IYLM.
To strengthen the governance and control environment over all financial matters within IYLM.
To achieve an unqualified audit opinion in the Municipality by 2014 and beyond.
To increase revenue generation within IY Municipal area.
6.4.6 Good governance and oversight
Goal- To ensure good governance and oversight within IYLM.
This Goal will be realised through the achievement of the following Strategic Objectives within Good
Governance and Public Participation Key Performance Area and the Finance, Governance and
Administration Cluster:
To strengthen the functionality of Ward Committees within IYLM.

94
To improve communication within the IYLM.
To improve Council Oversight and support to the political leadership within IYLM.
To ensure codification, implementation of the by-laws, powers and functions.
To ensure effective Integrated Development Planning within the Municipality.
To ensure the participation of traditional leaders in service delivery.

95
PR
IOR
ITY
IS
SU
E
IMPROVE SERVICE DELIVERY SOCIO-ECONOMIC DEVELOPMENT BUILDING INSTITUTIONAL CAPACITY AND
FINANCIAL VIABILITY
Water shortages & drought
Limited infrastructure
Vast distances between places
Poor road and transport infrastructure
Low employment opportunities
HIV & AIDS social impact
Dependency on social grants
Access to services
Low revenue base
Indigent population
Reliance on grants
Skills limitations
Greater intergovernmental coordination for
service delivery
Land use management
Community facilities
Road and storm water drainage
Implementation of free basic services
Need for clinics
Programme dealing with Vulnerable Groups
Lack of coordination with sectors/ partners
Roles and responsibilities
Implementation of by-laws
Non-compliance with MFMA
Filling prioritised posts
1. Infrastructure
Development and Service Delivery
1. Local Economic Development
2. Integrated Development
Planning Implementation
within and Inter-Spherical
Planning
1. Basic service provision
and pro-poor planning
2. Skills development and
community capacity
building
1. Good Governance, Community
Participation and
Intergovernmental Relations
2. Municipal Financial Viability and
Management
3. Performance Management,
Monitoring & Evaluation
TECHINCAL SERVICE CLUSTER ECONOMIC DEVELOPMENT AND
PLANNING CLUSTER SOCIAL NEEDS CLUSTER
FINANCE GOVERNANCE & ADM
CLUSTER
LGTAS/Outcome 9
P
LGTAS/Outcome 9/CHDM Priorities
P
NSDP / PGDP/ DGDS
PRINCIPLES
P
ENGAGEMENT
Local
Municipality
SITUATIONAL
ANALYSIS

96
6.5 The Five Year Implementation Plan
This section of the Integrated Development Plan outlines detailed Strategic Objectives, Strategies and
Performance Indicators meant to track progress in addressing Priority Issues and realising the Goals
across, and within, each of the Key Performance Areas over the next five years. The targets set over the
medium term become the strategic basis for later cascading into the organisations Performance
Management System (PMS). Furthermore, these indicators and their targets are specifically informed by
existing District, Provincial, and National imperatives and considerations. Some of the indicators included
are taken directly from the Local Government Performance Management Regulations, Schedule to the
Municipal Systems Act. Also, note there is a distinction between the Technical Service Cluster and the
Social Needs Cluster within the Basic Services & Infrastructure Key Performance Area, as both Clusters
have their own respective Goals.
The Five Year Implementation Plan is then followed by the Projects and Programmes section, which
provides a brief breakdown of the different projects and programmes planned for the Medium Term
Expenditure Framework (MTEF). This section presents an integrated presentation of all of the scheduled
projects and programmes to be implemented, including their spatial distribution, cost and source of
funding, as well as duration over the next three years. In instances where funding was unavailable for
some projects, but their potential to address an identified issue in line with organisational Goals and
Strategic Objectives, these projects were included under the banner of ‘Unfunded’. These project tables
represent an attempt to integrate and align all planned initiatives within IYLM in terms of addressing the
issues identified as part of the Situational Analysis, and emanating from the public participation.

97
6.5.1 KPA 1: Municipal Transformation and Organisational Development
Cluster: Finance, Governance and Administration
Goal- To provide effective and efficient human resource and administrative services within IYLM towards institutional development and good governance,
supported by enhanced information and communications technology.
Strategic Objective: To improve the skills sets of IYLM Council and staff in line with their Personal Development Plans (PDPs).
Annual Targets
Priority Issue Strategy Performance
Indicator Baseline 2012-2013 2013-2014 2014-2015 2015-2016 2016-2017
Staff Responsible
Skills limitations
Skills development
Number of staff completed a training programme or course as per their PDPs
50 staff trained within 2011/2012
65 staff trained
50 staff trained
100 staff trained
50 staff trained
100 staff trained
Dir. Corp. Services
Number of Councillors completed a training programme or course as per their PDPs
15 Councillors trained within 2011/2012
15 Councillors trained
15 Councillors trained
30 Councillors trained
15 Councillors trained
30 Councillors trained
Dir. Corp. Services
Percentage of municipality's budget spent on implementing workplace skills plan
0.44% (R450000 out of R102189738 in 2011/2012)
0.50% (R650 000 of 2012/2013 budget)
0.50% 0.50% 0.50% 0.50% Dir. Corp. Services

98
Strategic Objective: To improve the well-being of IYLM staff and Council for better service delivery.
Annual Targets
Priority Issue Strategy Performance
Indicator Baseline 2012-2013 2013-2014 2014-2015 2015-2016 2016-2017
Staff Responsible
Employee Assistance
Health and awareness sessions
Average utilisation rate of Sick Leave
New indicator 26 days or less
26 days or less
26 days or less
26 days or less
26 days or less
Dir. Corp. Services
Strategic Objective: To improve the institutional performance of IYLM through the cascading of the institutional performance management system.
Annual Targets
Priority Issue Strategy Performance
Indicator Baseline 2012-2013 2013-2014 2014-2015 2015-2016 2016-2017
Staff Responsible
Organisational performance
Reviewing and cascading the PMS
Level of staff to which the PMS is cascaded
Section 57 Manager Level
Assistant Managers
Supervisors General Staff
All Staff All Staff Dir. Corp. Services
Strategic Objective: To improve access to information for Council, staff, and citizens of IYLM.
Annual Targets
Priority Issue Strategy Performance
Indicator Baseline 2012-2013 2013-2014 2014-2015 2015-2016 2016-2017
Staff Responsible
Information and Knowledge Management
Utilising and upholding existing policies and procedures
Average turnaround time for resolving request to access information
Within 24 hours
Within 24 hours
Within 24 hours
Within 24 hours
Within 24 hours
Within 24 hours
Dir. Corp. Services

99
Strategic Objective: To enhance governance through application of standing rules and orders of IYLM.
Annual Targets
Priority Issue Strategy Performance
Indicator Baseline 2012-2013 2013-2014 2014-2015 2015-2016 2016-2017
Staff Responsible
Council and committees services
Monitoring and enforcement of standing rules and orders
Number of Councillors signed for receipt of all Council Agendas seven days in advance
42 Councillors signed for receipt of all Council Agendas seven days in advance
42 Councillors signed for receipt of all Council Agendas seven days in advance
42 Councillors signed for receipt of all Council Agendas seven days in advance
42 Councillors signed for receipt of all Council Agendas seven days in advance
42 Councillors signed for receipt of all Council Agendas seven days in advance
42 Councillors signed for receipt of all Council Agendas seven days in advance
Dir. Corp. Services
Strategic Objective: To increase the organisational capacity of IYLM in annual prioritised work areas.
Annual Targets
Priority Issue Strategy Performance
Indicator Baseline 2012-2013 2013-2014 2014-2015 2015-2016 2016-2017
Staff Responsible
Organisational capacity
Recruitment and retention as per IYLM Policies
Organisational vacancy rate
20% vacancy rate in 2011/2012
17% 14% 11% 8% 5% Dir. Corp. Services
Number of funded vacancies filled as per identification in annual prioritised work areas
15 prioritised posts filled in 2011/2012
15 prioritised posts filled
15 prioritised posts filled
15 prioritised posts filled
15 prioritised posts filled
15 prioritised posts filled
Dir. Corp. Services
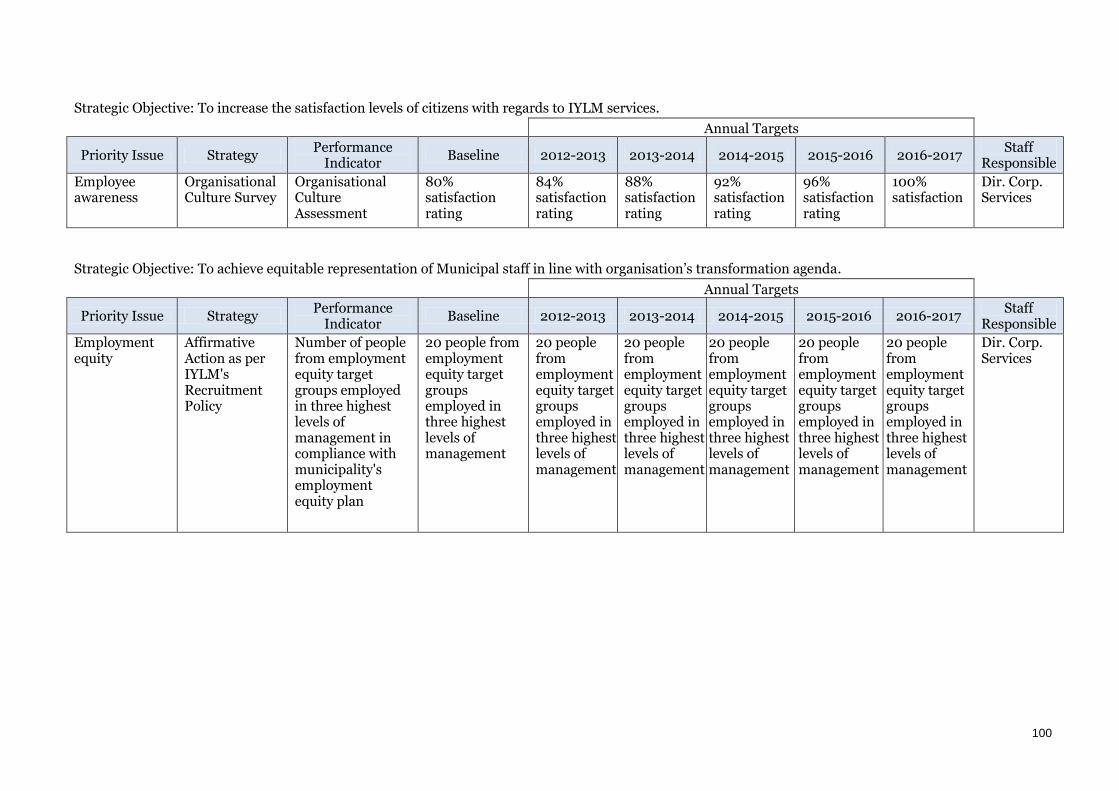
100
Strategic Objective: To increase the satisfaction levels of citizens with regards to IYLM services.
Annual Targets
Priority Issue Strategy Performance
Indicator Baseline 2012-2013 2013-2014 2014-2015 2015-2016 2016-2017
Staff Responsible
Employee awareness
Organisational Culture Survey
Organisational Culture Assessment
80% satisfaction rating
84% satisfaction rating
88% satisfaction rating
92% satisfaction rating
96% satisfaction rating
100% satisfaction
Dir. Corp. Services
Strategic Objective: To achieve equitable representation of Municipal staff in line with organisation’s transformation agenda.
Annual Targets
Priority Issue Strategy Performance
Indicator Baseline 2012-2013 2013-2014 2014-2015 2015-2016 2016-2017
Staff Responsible
Employment equity
Affirmative Action as per IYLM's Recruitment Policy
Number of people from employment equity target groups employed in three highest levels of management in compliance with municipality's employment equity plan
20 people from employment equity target groups employed in three highest levels of management
20 people from employment equity target groups employed in three highest levels of management
20 people from employment equity target groups employed in three highest levels of management
20 people from employment equity target groups employed in three highest levels of management
20 people from employment equity target groups employed in three highest levels of management
20 people from employment equity target groups employed in three highest levels of management
Dir. Corp. Services

101
6.5.2 KPA 2: Basic Services and Infrastructure
Cluster: Technical Services Cluster
Goal- To provide sound municipal planning, maintenance, and infrastructure provision that delivers for the needs and aspirations of IYLM citizens.
Strategic Objective: To improve road infrastructure networks within IYLM for greater mobility of people, goods, and services.
Annual Targets
Priority Issue Strategy Performance
Indicator Baseline 2012-2013 2013-2014 2014-2015 2015-2016 2016-2017
Staff Responsible
Roads infrastructure (including Storm Water Drainage)
Accelerate infrastructure provision and utilise all available funding
Kms of road constructed
Backlog of 1195kms at the end of 2009/2010
70 kms 80 kms 80 kms 80 kms 80 kms Dir. Plan. & Infra.

102
Strategic Objective: To achieve integrated land-use for sustainable human settlements within IYLM.
Annual Targets
Priority Issue Strategy Performance
Indicator Baseline 2012-2013 2013-2014 2014-2015 2015-2016 2016-2017
Staff Responsible
Land use planning and management
Land reform Number of Wards surveyed
1 Ward surveyed
0 Wards surveyed
4 Wards surveyed
4 Wards surveyed
4 Wards surveyed
4 Wards surveyed
Dir. Plan. & Infra.
Integrated human settlements
Strengthen coordination across spheres
Percentage housing needs met according to the Housing Sector Plan
New indicator 90% 90% 90% 90% 90% Dir. Plan. & Infra.
Infrastructure provision
Number of sports facilities upgraded
None 1 sports facility (Cofimvaba)
1 sports facility (Tsomo)
1 sports facility
1 sports facility
1 sports facility
Dir. Plan. & Infra.
Number of community facilities built
2 community facilities built
0 new community facilities
2 community facilities built
2 community facilities built
2 community facilities built
2 community facilities built
Dir. Plan. & Infra.
Strategic Objective: To improve access to basic water & sanitation to citizens of IYLM.
Annual Targets
Priority Issue Strategy Performance
Indicator Baseline 2012-2013 2013-2014 2014-2015 2015-2016 2016-2017
Staff Responsible
Water New water connections from sustainable sources
Number of villages received reticulation extensions
13 villages (Drought relief fund)
8 villages 20 villages 20 villages 20 villages 20 villages Dir. Plan. & Infra.
Sanitation New sanitation connections
Number of locations connected to the waterborne sewerage systems
1 location connected (approx. 400 households)
1 location connected
1 location connected
1 location connected
1 location connected
1 location connected
Dir. Plan. & Infra.

103
Strategic Objective: To improve access to electricity to citizens of IYLM.
Annual Targets
Priority Issue Strategy Performance
Indicator Baseline 2012-2013 2013-2014 2014-2015 2015-2016 2016-2017
Staff Responsible
Electricity & Energy Access
New electrical connections
Number of extensions received street lighting
25 extensions (approximately)
100 extensions
50 extensions
50 extensions
50 extensions
50 extensions
Dir. Plan. & Infra.

104
Cluster: Social Needs Cluster (within the Basic Services & Infrastructure KPA)
Goal- To provide quality social services and social infrastructure for the communities of IYLM, while ensuring public safety, promoting improved public health,
and supporting sustainable environmental management.
Strategic Objective: To improve the well-being of vulnerable groups within IYLM.
Annual Targets
Priority Issue Strategy Performance
Indicator Baseline 2012-2013 2013-2014 2014-2015 2015-2016 2016-2017
Staff Responsible
Special Programmes (Vulnerable Groups)
Community capacity development
Number of designated vulnerable individuals participated in IYLM programmes
840 individuals approximately in 2011/2012
1000 individuals
1250 individuals
1500 individuals
1750 individuals
2000 individuals
Special Programmes Unit (SPU) Head & Municipal Manager
Develop & capacitate vulnerable groups
Number of vulnerable groups capacitated
New indicator 5 groups 5 groups 5 groups 5 groups 5 groups SPU Head & Municipal Manager
Special Programmes
Establish SPU-Strategy Plan, Structure, Programmes, Projects
SPU Strategic Plan adopted by the Council
New indicator 1 Strategic Plan
1 Strategic Plan
1 Strategic Plan
1 Strategic Plan
1 Strategic Plan
SPU Head & Municipal Manager
Mainstreaming of Special programmes
Number of mainstreaming SPU programmes completed across departments
2 programmes 3 program-mes
6 program-mes
6 program-mes
6 program-mes
6 program-mes
SPU Head & Municipal Manager
Special Programmes (Youth)
Recreational Tournament
Mayor's Cup Tournament
1 tournament 1 tournament
1 tournament
1 tournament
1 tournament
1 tournament
SPU Head & Municipal Manager
Special Programmes (Heritage)
Celebration of National Days
Number of special day celebrations
1 celebration 6 celebrations
6 celebrations
6 celebrations
6 celebrations
6 celebrations
SPU Head & Municipal Manager

105
Strategic Objective: To improve the well-being of vulnerable groups within IYLM.
Annual Targets
Priority Issue Strategy Performance
Indicator Baseline 2012-2013 2013-2014 2014-2015 2015-2016 2016-2017
Staff Responsible
Indigent households
Provide free basic services
Number of households earning less than R1100 per month receiving free services
500 households approximately
750 households
1000 households
1250 households
1500 households
1750 households
CFO; MM; and Dir. Com. Services
Strategic Objective: To reduce HIV/AIDS related mortalities within IYLM.
Annual Targets
Priority Issue Strategy Performance
Indicator Baseline 2012-2013 2013-2014 2014-2015 2015-2016 2016-2017
Staff Responsible
HIV/AIDS By providing education
Number of participants of IYLM coordinated HIV/AIDS forums and support groups
420 participants
500 participants
700 participants
980 participants
1380 participants
1932 participants
Dir. Com. Services
Strategic Objective: To reduce the incidence of road accidents within IYLM.
Annual Targets
Priority Issue Strategy Performance
Indicator Baseline 2012-2013 2013-2014 2014-2015 2015-2016 2016-2017
Staff Responsible
Traffic Safety Education & awareness training to upgrading of infrastructure relevant to traffic safety
Reported incidence of road accidents on municipal roads
265 accidents 230 accidents or less
195 accidents or less
160 accidents or less
125 accidents or less
90 accidents or less
Dir. Com. Services

106
Strategic Objective: To increase household access to refuse removal services within IYLM.
Annual Targets
Priority Issue Strategy Performance
Indicator Baseline 2012-2013 2013-2014 2014-2015 2015-2016 2016-2017
Staff Responsible
Waste Management
Refurbishment of disposal site; Strengthen waste management cooperation; Community education for cleaning campaigns
Number of households with access to refuse removal services
1396 households
1626 households
1856 households
2086 households
2316 households
2546 households
Dir. Com. Services
Strategic Objective: To limit the risk of fires and disasters to communities within IYLM.
Annual Targets
Priority Issue Strategy Performance
Indicator Baseline 2012-2013 2013-2014 2014-2015 2015-2016 2016-2017
Staff Responsible
Fire-fighting and disaster management
Fire prevention and mitigation as per CHDM Disaster Management Plan
Incidence of Fire 22 fires in first half of 2011/2012
36 fires or less
30 fires or less
30 fires or less
20 fires or less
20 fires or less
Dir. Com. Services

107
Strategic Objective: To improve the environmental sustainability of IYLM.
Annual Targets
Priority Issue Strategy Performance
Indicator Baseline 2012-2013 2013-2014 2014-2015 2015-2016 2016-2017
Staff Responsible
Environmental management
Enforcing and maintaining environmental standards
Number of Environmental Impact Assessments completed prior to Project initiation
2 EIAs 4 EIAs 4 EIAs 2 EIAs 2 EIAs 3 EIAs Dir. Com. Services
Strategic Objective: To improve the security and care of all animals within IYLM.
Annual Targets
Priority Issue Strategy Performance
Indicator Baseline 2012-2013 2013-2014 2014-2015 2015-2016 2016-2017
Staff Responsible
Livestock and animal care
By complying with set standards of National animal care
Number of all animals impounded
240 animals 300 animals
350 animals
400 animals
450 animals
500 animals
Dir. Com. Services
Strategic Objective: To reduce the incidence of crime within IYLM.
Annual Targets
Priority Issue Strategy Performance
Indicator Baseline 2012-2013 2013-2014 2014-2015 2015-2016 2016-2017
Staff Responsible
Public safety To have functionality of police forum Municipal enforcement
Number of Community Policing Forums (CPFs) attended by at least one Councillor or Sect. 57 Manager
12 CPFs 12 CPFs 12 CPFs 12 CPFs 12 CPFs 12 CPFs Dir. Com. Services

108
Strategic Objective: To improve access to public amenities and recreational facilities for people within IYLM.
Annual Targets
Priority Issue Strategy Performance
Indicator Baseline 2012-2013 2013-2014 2014-2015 2015-2016 2016-2017
Staff Responsible
Community facilities
Upgrade existing and establish new facilities
Number of new community facilities opened
Backlog of 44 community facilities at the end of 2009/2010
4 community facilities
4 community facilities
6 community facilities
6 community facilities
4 community facilities
Dir. Com. Services

109
6.5.3 KPA 3: Local Economic Development
Cluster: Economic Development and Planning
Goal- To support enterprise formations, retention and expansion of businesses and initiatives that provides job opportunities and income to the people of
IYLM.
Strategic Objective: To improve the agricultural sector contribution to the local economy of IYLM
Annual Targets
Priority Issue Strategy Performance
Indicator Baseline 2012-2013 2013-2014 2014-2015 2015-2016 2016-2017
Staff Responsible
Agriculture Targeted support and market access for all IYLM farmers
Number of IYLM farmers that receive financial support, training, and market access support
100 farmers 200 farmers
300 farmers
400 farmers
500 farmers
600 farmers
Dir: LED
Strategic Objective: To improve the forestry sub-sector’s contribution to the local economy of IYLM.
Annual Targets
Priority Issue Strategy Performance
Indicator Baseline 2012-2013 2013-2014 2014-2015 2015-2016 2016-2017
Staff Responsible
Forestry Facilitate funding and partnerships for forestry development
Number of communities supported before entering agreements with Private Investors
New indicator 1 community
1 community
1 community
1 community
1 community
Dir: LED
Development of Forestry Value Adding activities
Number of furniture incubators (Cumulative over the term)
New indicator 1 furniture incubator
2 furniture incubators
3 furniture incubators
4 furniture incubator
5 furniture incubators
Dir: LED

110
Strategic Objective: To enhance tourism sector’s contribution to the local economy of IYLM.
Annual Targets
Priority Issue Strategy Performance
Indicator Baseline 2012-2013 2013-2014 2014-2015 2015-2016 2016-2017
Staff Responsible
Tourism Promote IYLM as a Heritage, Sports and Recreation destination
Number of visitors to Local tourism sites in IYLM
New indicator Establish baseline
10% annual increase
10% annual increase
10% annual increase
10% annual increase
Dir: LED
Strategic Objective: To grow enterprises involved in beneficiation and value-addition within IYLM.
Annual Targets
Priority Issue Strategy Performance
Indicator Baseline 2012-2013 2013-2014 2014-2015 2015-2016 2016-2017
Staff Responsible
SMMEs Greater retention and circulation of local currency support of Local SMMEs
Number of SMMEs registered within IYLM
204 SMMEs 214 (>5%) 224 (>5%) 236 (>5%) 247 (>5%) 260 (>5%) Dir: LED
Strategic Objective: To increase employment opportunities (temporal and permanent) within IY Municipal area.
Annual Targets
Priority Issue Strategy Performance
Indicator Baseline 2012-2013 2013-2014 2014-2015 2015-2016 2016-2017
Staff Responsible
Job creation Maximise expanded public works and LED employment opportunities
Number of jobs created through municipal LED initiatives (including capital projects)
662 1362 1430 (>5%) 1498 (>5%) 1566 (>5%) 1634 (>5%) Dir: LED

111
Strategic Objective: To contribute to the environmental sustainability of Instika Yethu through prevention of soil erosion and removal of alien species.
Annual Targets
Priority Issue Strategy Performance Indicator Baseline 2012-2013 2013-2014 2014-2015 2015-2016 2016-2017 Staff
Responsible
Conservation of
natural resources
Arrest land
degradation
Number of Wards in
which land is
rehabilitated against
soil erosion
4 Wards 9 Wards 14 Wards 17 Wards 21 Wards 21 Wards Dir: LED
Clear alien
species
Number of hectares of
land cleared of alien
species of plant and
tree
1200 hectares 1800 hectares 2400
hectares
3000
hectares
3600
hectares
4200
hectares
Dir: LED

112
6.5.4 KPA 4: Financial Management and Viability
Cluster: Finance, Governance, and Administration
Goal- To build the financial viability of IYLM through integrated planning, management, and good governance for a clean administration.
Strategic Objective: To improve the accuracy of the IYLM’s financial planning and reporting.
Annual Targets
Priority Issue Strategy Performance
Indicator Baseline 2012-2013 2013-2014 2014-2015 2015-2016 2016-2017
Staff Responsible
Inter-departmental integration and communication
Build internal capacity
% spending variance between approved budget and actual expenditure
10% 5% 5% 5% 5% 5% CFO
% of IYLM Capital expenditure on projects identified for the financial year within the IDP
New indicator (prescribed as schedule to the MSA)
100% 95% 95% 95% 95% CFO
Strategic Objective: To achieve best value for money through effective supply chain management within IYLM.
Annual Targets
Priority Issue Strategy Performance
Indicator Baseline 2012-2013 2013-2014 2014-2015 2015-2016 2016-2017
Staff Responsible
Value for money
Vetting of all suppliers
Percentage of all suppliers vetted
New indicator 100% (1 annual data cleansing)
100% (1 annual data cleansing)
100% (1 annual data cleansing)
100% (1 annual data cleansing)
100% (1 annual data cleansing)
CFO

113
Training of all suppliers
Number of local suppliers workshopped on procurement procedures
50 service providers
100 service providers
100 service providers
100 service providers
100 service providers
100 service providers
CFO

114
Strategic Objective: To improve financial management capacity within IYLM.
Annual Targets
Priority Issue Strategy Performance
Indicator Baseline 2012-2013 2013-2014 2014-2015 2015-2016 2016-2017
Staff Responsible
Capacity limitations
Build internal capacity
Number of interns completed annual internship with Finance Dept.
5 for 2011/2012
5 interns completed internship
5 interns completed internship
5 interns completed internship
5 interns completed internship
5 interns completed internship
CFO
Strategic Objective: To strengthen the governance and control environment over all financial matters within IYLM.
Annual Targets
Priority Issue Strategy Performance
Indicator Baseline 2012-2013 2013-2014 2014-2015 2015-2016 2016-2017
Staff Responsible
Legislative compliance
Build SCM credibility
R-value of all fruitless, wasteful, unauthorised, and irregular expenditure
R2 million R 0 R 0 R 0 R 0 R 0 CFO
Strategic Objective: To achieve an unqualified audit opinion in the Municipality by 2014 and beyond.
Annual Targets
Priority Issue Strategy Performance
Indicator Baseline 2012-2013 2013-2014 2014-2015 2015-2016 2016-2017
Staff Responsible
Clean audit challenges (GRAP-17 standards)
Build internal controls
Auditor General Audit Opinion
Disclaimer (2010/2011)
Unqualified Unqualified Unqualified Unqualified Unqualified CFO

115
Strategic Objective: To increase revenue generation within the Intsika Yethu Municipal area.
Annual Targets
Priority Issue Strategy Performance
Indicator Baseline 2012-2013 2013-2014 2014-2015 2015-2016 2016-2017
Staff Responsible
Low revenue base
Implementation of Municipal Property Rates Act (MPRA); Review of existing leases; VAT Reviewal
R-value of all revenue generated within IYLM (excluding grants)
R10 million (approximately)
R15 million R 18 million
R21 million R 24 million
R 27 million
CFO

116
6.5.5 KPA 5: Good Governance and Public Participation
Cluster: Finance, Governance, and Administration
Goal- To ensure good governance and oversight within IYLM.
Strategic Objective: To strengthen the functionality of Ward Committees within IYLM.
Annual Targets
Priority Issue Strategy Performance
Indicator Baseline 2012-2013 2013-2014 2014-2015 2015-2016 2016-2017
Staff Responsible
Ward Committees & Community Participation
Capacitation of Ward and community members
Number of Ward Committee Clusters trained
1 training completed
6 Clusters trained
6 Clusters trained
6 Clusters trained
6 Clusters trained
6 Clusters trained
Municipal Manager
Strategic Objective: To improve communication within the IYLM.
Annual Targets
Priority Issue Strategy Performance
Indicator Baseline 2012-2013 2013-2014 2014-2015 2015-2016 2016-2017
Staff Responsible
Local Government Communication
Conduct survey for citizen feedback
Customer care survey rating
55% approval rating
60% 65% 70% 75% 80% Municipal Manager
Strategic Objective: To improve Council Oversight and support to the political leadership within IYLM.
Annual Targets
Priority Issue Strategy Performance
Indicator Baseline 2012-2013 2013-2014 2014-2015 2015-2016 2016-2017
Staff Responsible
Council Support and Oversight
Regular reporting to all Section 79 Committees
Number of reports tabled to Municipal Public Accounts Committee
2 reports for 2011/2012
4 reports 4 reports 4 reports 4 reports 4 reports Municipal Manager

117
(MPAC)

118
Strategic Objective: To ensure codification, implementation of the by-laws, powers and functions.
Annual Targets
Priority Issue Strategy Performance
Indicator Baseline 2012-2013 2013-2014 2014-2015 2015-2016 2016-2017
Staff Responsible
Effective Legislation, By-laws, Powers and functions
Tracking of resolutions and by-laws
Number of new by-laws adopted by Council
3 by-laws in 2011/2012
3 by-laws 2 by-laws 2 by-laws 2 by-laws 2 by-laws Municipal Manager
Compliance with statutory planning and reporting
Annual Report 1 Annual Report
1 Annual Report
1 Annual Report
1 Annual Report
1 Annual Report
1 Annual Report
Municipal Manager
Strategic Objective: To ensure effective Integrated Development Planning within the Municipality.
Annual Targets
Priority Issue Strategy Performance
Indicator Baseline 2012-2013 2013-2014 2014-2015 2015-2016 2016-2017
Staff Responsible
Integrated Development Planning
Compliance with statutory planning and reporting
Rating of the MEC’s IDP Assessment
High High High High High High Municipal Manager
Strategic Objective: To ensure the participation of traditional leaders in service delivery.
Annual Targets
Priority Issue Strategy Performance
Indicator Baseline 2012-2013 2013-2014 2014-2015 2015-2016 2016-2017
Staff Responsible
Participation and Cooperation with Traditional Leadership
Formalise involvement of Traditional Leaders
Attendance rate of traditional leaders at meetings of Council
8 leaders in attendance per quarter
5 leaders in attendance per quarter
5 leaders in attendance per quarter
5 leaders in attendance per quarter
5 leaders in attendance per quarter
5 leaders in attendance per quarter
Municipal Manager

119
6.6 Projects and Programmes
The projects and programmes provided below are planned initiatives that will be undertaken within the municipal area within the MTEF. They represent the
vehicles which will drive the progress towards those service delivery targets set in the previous section, as well as give a clear indication of which Provincial
Departments plan to implement programmes or projects within the area. Financial allocations and budgets for the MTEF are provided for those projects that
have been prioritised and identified for IYLM, whereas other projects and programmes that do not yet have funding are noted in the next section.
6.6.1 KPA 1: Municipal Transformation and Organisational Development
KPA: Municipal Transformation & Organisational Development
Financial Years & Estimated Costs
Dept. Issue Project/Programme 2012/2013 2013/2014 2014/2015 Source of Funding Ward/Locations
Staff Responsible
IYLM Corporate Services
Skills development
Training Expense 2,010,000 2,122,560 2,237,178 Municipal Systems Improvement Grant (MSIG)
N/A Dir. Corp Services
Staff well-being
Organisational Health and Safety (OHS) & Employee Assistance Programme (EAP)
200,000 211,200 222,605 MSIG N/A Dir. Corp Services
Wellness 200,000 211,200 222,605 MSIG N/A Dir. Corp Services
Human Resources Systems (includ. Organisational Culture Survey and Organisational Impact Analysis)
300,000 316,800 333,907 Internal funding, equitable share
N/A Dir. Corp Services

120
KPA: Municipal Transformation & Organisational Development
Financial Years & Estimated Costs
Dept. Issue Project/Programme 2012/2013 2013/2014 2014/2015 Source of Funding Ward/Locations
Staff Responsible
IYLM Municipal Manager's Office
Performance Management
Performance Man.System 400,000 422,400 445,210 MSIG N/A MM
6.6.2 KPA 2: Basic Services and Infrastructure
KPA: Basic Services and Infrastructure (Technical Cluster)
Financial Years & Estimated Costs
Dept.
Issue Project/Programme 2012/2013 2013/2014 2014/2015
Source of Funding Ward/Locations
Staff Responsibl
e
Chris Hani District Municipality
Water
Tsomo RDP 2 Water supply 3,000,000 1,000,000 N/A MIG N/A N/A
Tsomo RDP 3 1,000,000 0 N/A MIG N/A N/A
Cofimvaba Ward 15 - Water Reticulation Phase 2
1,500,000 0 N/A MIG Ward 15 N/A
Luthuli water supply 1,500,000 0 N/A MIG N/A N/A
Qamata water Project(877) 10,000,000 8,000,000 6,500,000 MIG N/A N/A
Intsika Yethu Ward (6,9,12,21 old phase 2) Water Supply
1,000,000 4,000,000 3,000,000 MIG Ward 6,9,12,21 old phase 2
N/A
Cofimvaba water reticulation 2,000,000 0 0 MIG N/A N/A
Cluster 2 Water backlog(Ward1,4,5,6,7)
9,000,000 13,000,000 15,000,000 MIG Ward1,4,5,6,7 N/A
Cluster 4 Water backlog(Ward 21,22)
5,000,000 6,106,000 10,000,000 MIG Ward 21,22 N/A
Cluster 9 Water backlog (Ward 4,500,000 7,000,000 13,000,000 MIG Ward 13 N/A

121
KPA: Basic Services and Infrastructure (Technical Cluster)
Financial Years & Estimated Costs
Dept.
Issue Project/Programme 2012/2013 2013/2014 2014/2015
Source of Funding Ward/Locations
Staff Responsibl
e 13)
Upgrading of Tsojana Treatment Works and Bulkline
0 0 0 MIG N/A N/A
Tsomo Bulk Services( New Housing Development In Tsomo)
8,000,000 6,000,000 6,000,000 MIG N/A N/A
Cluster 9 Water backlog (Ward 13)
35,200,000 35,000,000 35,000,000 Regional Bulk Infrastructure Grant (RBIG)
Ward 13 N/A
Cluster 4 Water Backlog 20,000,000 20,000,000 32,000,000 RBIG N/A N/A
Refurbishment of Pump station
3,000,000 N/A N/A CHDM Equitable Share
N/A N/A
Refurbishment of Tsojana wtw 2,000,000 N/A N/A CHDM Equitable Share
N/A N/A
Augmentation of water line from landfill site
1,200,000 N/A N/A CHDM Equitable Share
N/A N/A
Sanitation
Cofimvaba Sewer (Bulk line and treatmworks)
5,000,000 500,000 0 MIG N/A N/A
Ward 8 Sanitation 2,000,000 500,000 1,000,000 MIG Ward 8 N/A
Ward 3 Sanitation 2,000,000 500,000 1,000,000 MIG Ward 3 N/A
Intsika Yethu Sanitation Ward 4, 7,8 & 23-Amanzabantu
2,000,000 500,000 0 MIG Ward 4, 7,8 & 23 N/A
Cluster 6 Sanitation (Wards 1,2,3,6,9&22 )
9,500,000 13,000,000 15,000,000 MIG Wards 1,2,3,6,9&22 N/A
Cluster 7 Sanitation (Wards 10,11,12,14 & 20)
10,500,000 13,000,000 15,000,000 MIG Wards 10,11,12,14 & 20 N/A
Cluster 8 Sanitation (Wards 15,16,17,18,19)
12,000,000 13,000,000 15,000,000 MIG Wards 15,16,17,18,19 N/A
Roads and Stormwater
Cofimvaba - Roads in Wards 7, 9, 12, 14(528)
1,000,000 0 N/A MIG Wards 7, 9, 12, 14 N/A

122
KPA: Basic Services and Infrastructure (Technical Cluster)
Financial Years & Estimated Costs
Dept.
Issue Project/Programme 2012/2013 2013/2014 2014/2015
Source of Funding Ward/Locations
Staff Responsibl
e
ESKOM
Electrification
Mcambalala/Bolotwa 2a (736h/h)
11,776,000 N/A N/A ESKOM
Mcambalala/Bolotwa 2a
N/A
Mcambalala/Bolotwa 2a (600h/h)
9,600,000 N/A N/A ESKOM
Mcambalala/Bolotwa 2a
N/A
Tsomo Rural Ph 3A (794h/h) 12,711,000 N/A N/A ESKOM Tsomo rural N/A
Tsomo Rural Ph 3B (576h/h) 9,218,900 N/A N/A ESKOM Tsomo rural N/A
IYLM Municipal Manager's Office
Electrification
Free Basic Services -Electricity 2,000,000 2,112,000 2,226,048 Internal funding from Equitable Share
All Wards MM & CFO
Free Basic Services -Alternative energy
4,000,000 4,224,000 4,452,096 Internal funding from Equitable Share
All Wards MM & CFO
IYLM Planning and Infrastructure
Roads and Stormwater
Upgrading Gravel Roads to Surface (Cofimvaba Stormwater)
6,000,000 0 0 MIG Ward 14 (Joe Slovo) Dir. Plan. & Infra.
Upgrading Gravel to Surface (Tsomo and Cofimvaba Roads)
2,000,000 2,112,000 2,226,048 MIG Cofimvaba Ext 1 (Blacktop); Tsomo Ext 1 (Blacktop)
Dir. Plan. & Infra.
Sports and recreational facilities
Cofimvaba Stadium 4,461,000 N/A N/A MIG Comfimvaba Dir. Plan. & Infra.
Town Planning and Land Use

123
KPA: Basic Services and Infrastructure (Technical Cluster)
Financial Years & Estimated Costs
Dept.
Issue Project/Programme 2012/2013 2013/2014 2014/2015
Source of Funding Ward/Locations
Staff Responsibl
e
Street scapping and furniture 1,000,000 1,056,000 1,113,024 MIG Ward 14 and Tsomo Town
Dir. Plan. & Infra.
Town planning and land use 600,000 633,600 667,814 MIG Ward 14 and Tsomo Town
Dir. Plan. & Infra.
Road construction submissions
MIG Access Roads(In house plant)Rehabilitation of Bolana Access Road , Lubisi to Mampondweni Access Road, Ndlunkulu to Ntwashini Access Roads, Rehabilitation of Daza Access Road, Holi Access Road, Sikhobeni Access Road
21,000,000 Matanga Access Road,Mampungutyeni, T544 Nqumakala, Mangunkone Access Road, Sikhobeni Access Road, Ntshingeni - Camama Access Road, T48- Mission Access Road, Lower Seplan Access Road
N/A MIG Ward 16, Ward 20, Ward 11, Ward 08, Ward 04, Ward 15
Dir. Plan. & Infra.

124
KPA: Basic Services and Infrastructure (Social Needs Cluster)
Financial Years & Estimated Costs
Dept. Issue Project/Programme 2012/2013 2013/2014 2014/2015 Source of Funding Ward/Locations Staff
Responsible
Eastern Cape Department of Social Development
Vulnerable Groups (Youth Development)
Imizamo Yethu Youth Project
500,000 N/A N/A EC Dept. Social Development
Qombolo, Ward 10 N/A
Imizamo Yethu Youth Project
119,000 N/A N/A EC Dept. Social Development
Qombolo, Ward 10 N/A
Vulnerable Groups (Women Development)
Masincedane Poultry Project
500,000 N/A N/A EC Dept. Social Development
Rwantsana, Ward 20 N/A
Siphamandla Poultry Project
500,000 N/A N/A EC Dept. Social Development
Woodhouse, Ward 15 N/A
Laphumilang Project 250,000 N/A N/A EC Dept. Social Development
Qombolo, Ward 13 N/A
Mzingisi Project 250,000 N/A N/A EC Dept. Social Development
Qutsa, Ward 7 N/A
HIV/AIDS
Uncedo HCBC-Mcambala, Cofimvaba
N/A N/A N/A EC Department of Social Development, subject to availability of operational funds
Ward 21 N/A
Masibambane Women's Organisationa- Qumanco, Cofimvaba
N/A N/A N/A EC Department of Social Development, subject to availability of operational funds
Ward 17 N/A
Malibongwe Consortium of Women Trust- Lower Woodhouse, Cofimvaba
N/A N/A N/A EC Department of Social Development, subject to availability of operational funds
Ward 15 N/A

125
KPA: Basic Services and Infrastructure (Social Needs Cluster)
Financial Years & Estimated Costs
Dept. Issue Project/Programme 2012/2013 2013/2014 2014/2015 Source of Funding Ward/Locations Staff
Responsible
Vulnerable Groups (VEP & Families)
Bholothwa Domestic Violence Project, Comfimvaba
N/A N/A N/A EC Department of Social Development, subject to availability of operational funds
Ward 3 N/A
Masiphuthane Single Parents Association- Mdletyeni, Tsomo
N/A N/A N/A EC Department of Social Development, subject to availability of operational funds
Ward 13 N/A
Tsomo Family Resource Centre- Tsomo Town
N/A N/A N/A EC Department of Social Development, subject to availability of operational funds
Ward 8 N/A
Crime Prevention
Crime Prevention Support Programme
N/A N/A N/A EC Department of Social Development, subject to availability of operational funds
N/A N/A
Diversion Programme N/A N/A N/A EC Department of Social Development, subject to availability of operational funds
N/A N/A
Ex-Offenders Mediation Programme
N/A N/A N/A EC Department of Social Development, subject to availability of operational funds
N/A N/A
Substance Abuse Programme

126
KPA: Basic Services and Infrastructure (Social Needs Cluster)
Financial Years & Estimated Costs
Dept. Issue Project/Programme 2012/2013 2013/2014 2014/2015 Source of Funding Ward/Locations Staff
Responsible
Treatment Against Drugs and Alcohol (TADA)
N/A N/A N/A EC Department of Social Development, subject to availability of operational funds
N/A N/A
Vulnerable Groups (Care for Older Persons)
Sinenjongo Adult Association- Mablubini, Tsomo
N/A N/A N/A EC Department of Social Development, subject to availability of operational funds
Ward 10 N/A
Sinako Adult Association- Upper Woodhouse, Cofimvaba
N/A N/A N/A EC Department of Social Development, subject to availability of operational funds
Ward 5 N/A
Tsomo Elderly- Mzomhle, Tsomo
N/A N/A N/A EC Department of Social Development, subject to availability of operational funds
Ward 8 N/A
Nonkathalo Service Cetnre- Xume, Tsomo
N/A N/A N/A EC Department of Social Development, subject to availability of operational funds
Ward 8 N/A
Makukhanye Service Center- Sgubudwini, Tsomo
N/A N/A N/A Applications for funding still awaiting approval
Ward 6 N/A
Masithembe Service Center- Tsojana, Tsomo
N/A N/A N/A Applications for funding still awaiting approval
Ward 10 N/A
Ncedolwethu Service Center- Hoita, Cofimvaba
N/A N/A N/A Applications for funding still awaiting approval
Ward 1 N/A
Sikhulile Service Center- Tyelerha, Cofimvaba
N/A N/A N/A Applications for funding still awaiting approval
Ward 2 N/A

127
KPA: Basic Services and Infrastructure (Social Needs Cluster)
Financial Years & Estimated Costs
Dept. Issue Project/Programme 2012/2013 2013/2014 2014/2015 Source of Funding Ward/Locations Staff
Responsible
Masakhane Service Center- Elalini, St Marks, Cofimvaba
N/A N/A N/A Applications for funding still awaiting approval
Ward 2 N/A
Masincedane Service Center- Maya, Cofimvaba
N/A N/A N/A Applications for funding still awaiting approval
Ward 4 N/A
Sikhanyisel Service Center- Lower Woodhouse, Cofimvaba
N/A N/A N/A Applications for funding still awaiting approval
Ward 15 N/A
Vulnerable Groups (Care and support to people with disabilities)
Masincedane Mawushe Disabled Project- Mawusheni, Cofimvaba
N/A N/A N/A EC Department of Social Development, subject to availability of operational funds
Ward 13 N/A
Camama Cheshire Home- Camama, Cofimvaba
N/A N/A N/A Applications for funding still awaiting approval
Ward 1 N/A
South African Social Security Agency
Vulnerable Groups
Social Grants Recipients (51,645 people)
518,528,544 N/A N/A SASSA All Wards N/A
Social relief and distress food parcels
426,000 N/A N/A SASSA All Wards N/A
Counter Services N/A N/A N/A SASSA Bolotwa; Lubisi; Qitsi; Xolobe; Zigudu
N/A
Eastern Cape Department of Education
Learner Performance
Autumn School (470 learners)
N/A N/A N/A DoE/DLGTA
N/A N/A
Incubation (300 learners)
N/A N/A N/A DoE
N/A N/A

128
KPA: Basic Services and Infrastructure (Social Needs Cluster)
Financial Years & Estimated Costs
Dept. Issue Project/Programme 2012/2013 2013/2014 2014/2015 Source of Funding Ward/Locations Staff
Responsible
Syllabus Coverage Camps (450 learners)
N/A N/A N/A
DoE/Schools
N/A N/A
Winter Schools (650 learners)
N/A N/A N/A IYLM/DoE
N/A N/A
Revision Camps (867 learners)
N/A N/A N/A DoE
N/A N/A
Ilima Camps (1608 learners)
N/A N/A N/A IYLM/Ilima/DoE/ Church
N/A N/A
Educational infrastructure
Eradication of unsafe schools
N/A N/A N/A ASIDI N/A N/A
Water and Sanitation N/A N/A N/A DoE N/A N/A
Electrification N/A N/A N/A ESKOM N/A N/A
Access roads to schools N/A N/A N/A IYLM/Dept. Public Works
N/A N/A
ICT and Telecommunications
N/A N/A N/A DoE N/A N/A
Safety and Security N/A N/A N/A DoE N/A N/A
ECD Classes N/A N/A N/A Dept. Public Works/ DoE
N/A N/A
Sporting Fields N/A N/A N/A IYLM/Dept. Public Works/Dept. Sports, Recreation, Arts, and Culture
N/A N/A
Office Block 25000000 (over MTEF) DoE/ Dept. Public Works
N/A N/A
School Nutrition
GET Q1-3 Schools N/A N/A N/A DoE N/A N/A
FET Q1-3 Schools N/A N/A N/A DoE N/A N/A
School Transport Program
20 Schools Transport Project (1943 leaners)
N/A N/A N/A DoE N/A N/A

129
KPA: Basic Services and Infrastructure (Social Needs Cluster)
Financial Years & Estimated Costs
Dept. Issue Project/Programme 2012/2013 2013/2014 2014/2015 Source of Funding Ward/Locations Staff
Responsible
IYLM Community Services
Waste management
Waste Equipment 150,000 158,400 166,954 MIG N/A Dir. Com Services

130
6.6.3 KPA 3: Local Economic Development
KPA: Local Economic Development
Financial Years & Estimated Costs
Dept. Issue Project/Programme 2012/2013 2013/2014 2014/2015 Source of Funding Ward/Locations Staff
Responsible
Eastern Cape Department of Rural Development and Agrarian Reform
Agriculture
Lukhanji Poultry Project (Siyazondla Project)
60,000 N/A N/A EC Dept. Rural Development and Agrarian Reform
Qamata
N/A
Siyazama Agricultural Co-operative (Siyazondla Project)
100,000 N/A N/A EC Dept. Rural Development and Agrarian Reform
St Marks
N/A
Thaleni Poultry Project (Siyazondla Project)
60,000 N/A N/A EC Dept. Rural Development and Agrarian Reform
Ncora Flats N/A
Fameni Vegetable Project (Siyazondla Project)
100,000 N/A N/A EC Dept. Rural Development and Agrarian Reform
Fameni N/A
Lingelethu Poultry Project (Siyazondla Project)
60,000 N/A N/A EC Dept. Rural Development and Agrarian Reform
Mthigwewu N/A
Isolomzi Vegetable Project (Siyazondla Project)
100,000 N/A N/A EC Dept. Rural Development and Agrarian Reform
Ndlunkulu N/A
Khanyisa Yase Qwini (Siyazondla Project)
100,000 N/A N/A EC Dept. Rural Development and Agrarian Reform
Tsojana N/A
Ekuphumleni Poultry Project (Siyazondla Project)
60,000 N/A N/A EC Dept. Rural Development and Agrarian Reform
Gqoquora N/A

131
KPA: Local Economic Development
Financial Years & Estimated Costs
Dept. Issue Project/Programme 2012/2013 2013/2014 2014/2015 Source of Funding Ward/Locations Staff
Responsible
Nqumakalala Maize Project (Siyakhula Project)
25,579 N/A N/A EC Dept. Rural Development and Agrarian Reform
Ward 21- Nqumakala N/A
Hoyana Maize Project (Siyakhula Project)
140,459 N/A N/A EC Dept. Rural Development and Agrarian Reform
Lower Mncuncuzo (formerly Ward 23)
N/A
Nyoka Maize Project (Siyakhula Project)
109,985 N/A N/A EC Dept. Rural Development and Agrarian Reform
Ward 2- Nyoka Village N/A
Mhlahlana Maize Project (Siyakhula Project)
255,612 N/A N/A EC Dept. Rural Development and Agrarian Reform
Ward 11- Mhlahlane N/A
Mgxobozweni Maize Project (Siyakhula Project)
37,870 N/A N/A EC Dept. Rural Development and Agrarian Reform
Ward 12- Mgxobhozweni
N/A
Gcibhala Maize Project (Siyakhula Project)
25,561 N/A N/A EC Dept. Rural Development and Agrarian Reform
Ward 12- Mgxobhozweni
N/A
Luthuli Maize Project (Siyakhula Project)
22,720 N/A N/A EC Dept. Rural Development and Agrarian Reform
Ward 12- Mgxobhozweni
N/A
Ngceza Landcare Project 100,000 N/A N/A EC Dept. Rural Development and Agrarian Reform
Nqceza N/A
Bolotwa Landcare Project 100,000 N/A N/A EC Dept. Rural Development and Agrarian Reform
Bolotwa N/A
Ncora Irrigation Scheme (Letsima Project)
2,000,000 N/A N/A EC Dept. Rural Development and Agrarian Reform
Ncora N/A
Qamata Irrigation Scheme (Letsima Project)
2,000,000 N/A N/A EC Dept. Rural Development and Agrarian Reform
Qamata N/A

132
KPA: Local Economic Development
Financial Years & Estimated Costs
Dept. Issue Project/Programme 2012/2013 2013/2014 2014/2015 Source of Funding Ward/Locations Staff
Responsible
Eastern Cape Department of Social Development
Sustainable Livelihoods
Hluthamhlali (Legacy for the District)
1,000,000 N/A N/A EC Dept. Social Development
Ngceza, Ward 13 N/A
Mtyhintyini Project 1,500,000 N/A N/A EC Dept. Social Development
Mtyhintyini A/A, Ward 4
N/A
Masiphuhle Development Project
750,000 N/A N/A EC Dept. Social Development
Mkhwinti A/A, Ward 13
N/A
Lutholoncedo Women in Agriculture
375,000 N/A N/A EC Dept. Social Development
Qamata, Ward 4 N/A
IYLM Local Economic Development
Agriculture
Wool Improvement Project 650,000 686,400 723,466 Internal funding, equitable share
N/A Dir. LED
Dryland crop production project
2,000,000 2,112,000 2,226,048 Internal funding, equitable share
N/A Dir. LED
Intsika Yethu Egg Producers
300,000 316,800 333,907 Internal funding, equitable share
N/A Dir. LED
Information Day 40,000 42,240 44,521 Internal funding, equitable share
N/A Dir. LED
Income Generating Progamme
100,000 105,600 111,302 Internal funding, equitable share
N/A Dir. LED
Feasibility study for wool Improvement
100,000 105,600 111,302 Internal funding, equitable share
N/A Dir. LED
CWP Programme 11, 000,000 N/A N/A Dept. Corporate Governance and Traditional Affairs, Dept. Local Government & Traditional Affair
All Wards Dir. LED

133
KPA: Local Economic Development
Financial Years & Estimated Costs
Dept. Issue Project/Programme 2012/2013 2013/2014 2014/2015 Source of Funding Ward/Locations Staff
Responsible Soil Rehabilitation 18,000,000 N/A N/A Environmental
Affairs 6,9,18,20 Dir. LED
Eradication of Alien Species
8,000,000 N/A N/A Environmental Affairs
2,3,5 Dir. LED
Technology for Rural Enovation & Education Development (Arthur Mfebe SSS)
6,000,000 N/A N/A National Department of Science & Technology
1,2,4,5 Dir, LED
Tourism
Local Tourism Organisation (LTO)
120,000 126,720 133,563 Internal funding, equitable share
N/A Dir. LED
Lubisi Dam Development Project
400,000 422,400 445,210 Internal funding, equitable share
N/A Dir. LED
Feasibility study for Heritage Route
100,000 105,600 111,302 Internal funding, equitable share
N/A Dir. LED
Tourism SMME Support 100,000 105,600 111,302 Internal funding, equitable share
N/A Dir. LED
Tourism development & Marketing
200,000 211,200 222,605 Internal funding, equitable share
N/A Dir. LED
Mnqanga/ Ntlonze Heritage Project
170,000 N/A N/A National Heritage Council
Ward 4 Dir.LED
SMMEs and Cooperatives
Hawkers Stalls 100,000 105,600 111,302 Internal funding, equitable share
N/A Dir. LED
Integrated Energy Centre (IeC)
300,000 316,800 333,907 Internal funding, equitable share
N/A Dir. LED
Forestry
Tree Nursery Project 100,000 105,600 111,302 Internal funding, equitable share
N/A Dir. LED

134
6.6.4 KPA 4: Financial Management and Viability
KPA: Financial Management and Viability
Financial Years & Estimated Costs
Dept. Issue Project/Programme 2012/2013 2013/2014 2014/2015 Source of Funding Ward/Locations Staff
Responsible
IYLM Finance
Revenue generation
Valuation Roll 1,200,000 1,267,200 1,335,629 MSIG All Wards CFO
Internal capacity
Training of Ward Committes(Support)
0 0 0 Unfunded All Wards CFO
Interns (Training & Salaries)
1,140,000 1,203,840 1,268,847 Finance Management Grant
N/A CFO
Audit outcomes
Asset Register (Revaluation of assets & asset register)
1,200,000 1,267,200 1,335,629 MSIG All Wards CFO
Financial Statements 550,000 580,800 612,163 Finance Management Grant
N/A CFO

135
6.6.5 KPA 5: Good Governance and Public Participation
KPA: Good Governance and Public Participation
Financial Years & Estimated Costs
Dept. Issue Project/Programme 2012/2013 2013/2014 2014/2015 Source of Funding Ward/Locations Staff
Responsible
IYLM Finance
Council committees and support
Advance Councillor Training
200,000 211,200 222,605 Internal funding from Equitable Share
All Wards CFO
IYLM Municipal Manager's Office
Communication and public participation
Annual Report 100,000 105,600 111,302 Internal funding from Equitable Share
All Wards MM
National day Celebration 100,000 105,600 111,302 Internal funding from Equitable Share
All Wards MM
Mayors Cup 350,000 369,600 389,558 Internal funding from Equitable Share
All Wards MM
Corporate Branding 30,000 31,680 33,391 Internal funding from Equitable Share
All Wards MM
Imbizo 200,000 211,200 222,605 Internal funding from Equitable Share
All Wards MM
IYLM Local Economic Development
Credible Integrated Development Planning
IDP 200,000 211,200 222,605 Internal funding, equitable share
N/A Dir. LED

136

137
6.7 Unfunded Projects and Programmes
The following section provides a breakdown of those proposed projects and their locations currently without
budget allocations or secured funding. Despite the absence of funding, these projects represent an expressed
interest and possible project for inclusion and funding in the outer years of the MTEF.
6.7.1 KPA 1: Municipal Transformation & Organisational Development
KPA: Municipal Transformation & Organisational Development
Dept. Issue Project/Programme Ward/ Locations Staff
Responsible
IYLM Corporate Services
Performance Management
Cascading of PMS and capacity building to lower levels (performance recognition and rewards)
N/A Dir. Corp Services
Access to information
Development of Master System plan N/A Dir. Corp Services
Archive centre N/A Dir. Corp Services
Electronic document management system
N/A Dir. Corp Services
Organisational capacity
Job description reviews and job evaluations
N/A Dir. Corp Services
Recruitment of staff N/A Dir. Corp Services
Attraction and retention strategy to draw diverse staff to IYLM
N/A Dir. Corp Services
Skills development
Organisational development plan implementation (training etc.)
N/A Dir. Corp Services
Skills audit N/A Dir. Corp Services
Staff well-being
Wellness centre N/A Dir. Corp Services

138
6.7.2 KPA 2: Basic Services and Infrastructure
KPA: Basic Services and Infrastructure (Technical Cluster)
Dept. Issue Project/Programme Ward/ Locations
Staff Responsible
IYLM Planning and Infrastructure
Road construction submissions
Upgrading Gravel Roads to Surface Nyanisweni and Nyanisweni Ext; Ext 2; Polly; Thabo Village; Ext 1; Tsomo Ext 2; Mzomhle Bridge; Tsomo Town; Main Street to Landfill Site (Cofimvaba); Tsomo Internal Facilities; Bholility Access Road/Bridge; From 40 to Mawusheni; Mthwaku Bridge; Rehabilitation of Stormwater Infrastructure; Mdlokolo to Sijugongolweni
Dir. Plan. & Infra.
Building Control and Municipal Public Works
Tsomo Offices N/A Dir. Plan. & Infra.
Paving of Urban Centres N/A Dir. Plan. & Infra.
Restoration of Cofimvaba Community Hall
N/A Dir. Plan. & Infra.
Provision of Community Halls N/A Dir. Plan. & Infra.
St. Marks Community Lighting N/A Dir. Plan. & Infra.
Housing and Estate
Nyanisweni Extension Lighting N/A Dir. Plan. & Infra.
Thabo Village Community Lighting N/A Dir. Plan. & Infra.
Street Lights along R61 (Traffic Dep to Town)
N/A Dir. Plan. & Infra.
Nyanisweni Extension and Nyanisweni
N/A Dir. Plan. & Infra.
Joe Slovo N/A Dir. Plan. & Infra.
Ext 7 (Cofimvaba) N/A Dir. Plan. & Infra.
Land Fill Site N/A Dir. Plan. & Infra.
Ext 4 & Section C N/A Dir. Plan. & Infra.
IYLM Municipal Manager's Office
Customer care and satisfaction
Customer care survey (asses the satisfaction of the customers)
N/A MM & Dir. Corp Services

139
KPA: Basic Services and Infrastructure (Technical Cluster)
Dept. Issue Project/Programme Ward/ Locations
Staff Responsible
Town Planning and Land Use
Rural Housing (Voucher) N/A Dir. Plan. & Infra.
Rural Housing (Veteran) N/A Dir. Plan. & Infra.
Planning and Survey Rural Roads N/A Dir. Plan. & Infra.
Emergency Housing N/A Dir. Plan. & Infra.
Project Management Unit N/A Dir. Plan. & Infra.
Water & Sanitation
Ext 4 & Section C (Water & Sewer) N/A Dir. Plan. & Infra.
Upgrading Sewer Plant (Cofimvaba & Tsomo)
N/A Dir. Plan. & Infra.
Nyanisweni Ext Internal Services (Water & Sewer)
N/A Dir. Plan. & Infra.
Extension 7 N/A Dir. Plan. & Infra.
Thabo Village Sewer Reticulation N/A Dir. Plan. & Infra.
Augmentation of Water & Sewer from Landfill Site to Water Reticulation Cofimvaba
N/A Dir. Plan. & Infra.
Alternative Waterline from Tsjoana to Cofimvaba Town
N/A Dir. Plan. & Infra.
Tsomo (Mzomhle Water & Sewer) Reticulation
N/A Dir. Plan. & Infra.
Tsomo Ext 2 to Tsomo Town (Bulk Line)
N/A Dir. Plan. & Infra.
Rehabilitation of Road to Tsojana Water Treatment Plant
N/A Dir. Plan. & Infra.
Surfacing of Road from Town to Water Treatment Plant
N/A Dir. Plan. & Infra.
Tshacana Water Scheme N/A Dir. Plan. & Infra.
Mtingweni Water Scheme N/A Dir. Plan. & Infra.
Eradication of Backlog Sanitation & Water
N/A Dir. Plan. & Infra.
Electrification
Electrification of Wards Ward 3; Ward 9; Ward 11; Ward 19; Ward 20; Ward 21; Ward 8; Ward 6; Ward 14
Dir. Plan. & Infra.
Electrification Extensions All Wards Dir. Plan. & Infra.
Clinics
Tsomo Town Ward 8 Dir. Plan. & Infra.
Qwili Ward 11 Dir. Plan. & Infra.
Mhlahlane Ward 10 Dir. Plan. & Infra.

140
KPA: Basic Services and Infrastructure (Technical Cluster)
Dept. Issue Project/Programme Ward/ Locations
Staff Responsible
Road construction submissions
Ward 1 (6 km) Ngxwashu=3km; Mmnqweni/Banzi=3km
Dir. Plan. & Infra.
Ward 2 (11km) Bolokoldlela=4km; Nomphimgelo to Mpomvane= 4km; Mr Samfumfu to Graveyard= 3km
Dir. Plan. & Infra.
Ward 3 (13km) Mtwaku= 3km; Bolotwa=5km; Bilatye= 5km
Dir. Plan. & Infra.
Ward 4 (14km) Ntlonze= 3km; Holi= 11km Dir. Plan. & Infra.
Ward 5 (30km) Deckets Hills to Cube=8km; Qamata Basin to Mampingweni=10km; Jarha Access Road=12km
Dir. Plan. & Infra.
Ward 6 (13km) Mbulukweza Clinic to J.S.S.=3km; Mphathiswa Shop to Emarahleni= 5km; Pagel Shop to Mtshanyane
Dir. Plan. & Infra.
Ward 7 (7km) Lower Qutsa to Mdenne=3km; Kwebulana from Tar Road via Clinic to Kwebulana J.S.S.=3km; Camama Ceshire Home=1km
Dir. Plan. & Infra.
Ward 8 (19km) Maduma to Frystad= 16km; Miya Access Road= 3km
Dir. Plan. & Infra.
Ward 9 (38,5km) Xume to Mobhokwe= 19,5km; Catshile to Diphini= 19km;
Dir. Plan. & Infra.
Ward 10 (63km) Nomfenazana to Bolitye=20km; Mnyangule to Mfihlaneni=20km; Ngozini=4km; From Tar Road to Bishop Mboniswa= 19km
Dir. Plan. & Infra.
Ward 11 (22km) Somawala via Sgubudinini to Ntabeni=4km' Ndwamkulu via Khekhe to Mdibaniso=3km; Makwababa to Kose=15km
Dir. Plan. & Infra.
Ward 12 (13km) Ngqwara to Zwelixolile=3km; Barrini to Kose Bridge=7km; Ephikweni to Malalane= 3km
Dir. Plan. & Infra.
Ward 13 (45km) Zicubeni Access Road=4km; Nkomfeni Access Road= 4km; From forty to Mawusheni then Branch Turn-off to Lukhanyisweni S.S.S.=30km; Hange to Chiteka= 7km
Dir. Plan. & Infra.
Ward 14 (7km) Ezintlanti=1km; Polly=3km; Nyanisweni=3km
Dir. Plan. & Infra.
Ward 15 (12km) Isikhoba=5km; Cube=4km; Qolweni=3km
Dir. Plan. & Infra.

141
KPA: Basic Services and Infrastructure (Technical Cluster)
Dept. Issue Project/Programme Ward/ Locations
Staff Responsible
Ward 16 (45km) Ncunguzo S.S.S. & J.S.S.=3km; Mahlatini Access Road= 3km; Nqcaza Access Road=4km; From T255 Tsojana to R61 Qombolo= 30km; Ngonyama= 5km
Dir. Plan. & Infra.
Ward 17 (13km) Qumanco Access Road=4km; Sgangeni Access Road=3km; Matafeni to Ndenna= 6km
Dir. Plan. & Infra.
Ward 18 (13km) Ndmanambe Access Road=5km; Lower Neora Access Road=4km; Kulongqayi Access Road=4km
Dir. Plan. & Infra.
Ward 19 (19km) Mission Access Road=8km; Dikeni Access Road=6km; Mnqanqeni Access Road= 5km
Dir. Plan. & Infra.
Ward 20 (16km); Mtetuvumile Access Road=7km; Lower Seplan to Emhlonyaneni=5km; Lubisi to Mampondweni=4km
Dir. Plan. & Infra.
Ward 21 (55km) Mcambalala Access Road= 15km; Nxelesa to Mtshanyane= 10km; Ngxabangu to Nongqongwana=5km; Hoyana Access Road=5km
Dir. Plan. & Infra.
KPA: Basic Services and Infrastructure (Social Needs Cluster)
Dept. Issue Project/Programme Ward/ Locations Staff
Responsible
IYLM Community Services
Vulnerable Groups
Public-private partnerships N/A Dir. Com Services
Food Security Projects N/A Dir. Com Services
Traffic Safety
Traffic Equipment
N/A Dir. Com Services
Vehicle Pound N/A Dir. Com Services
Traffic learning centre N/A Dir. Com Services
Vehicle Testing Centre N/A Dir. Com Services
By-law development
N/A Dir. Com Services

142
KPA: Basic Services and Infrastructure (Social Needs Cluster)
Dept. Issue Project/Programme Ward/ Locations Staff
Responsible
Properly marked signs and roads N/A Dir. Com Services
Waste management
Establish a buy-back centre
N/A Dir. Com Services
Upgrade waste disposal site infrastructure
N/A Dir. Com Services
Waste processing plant
N/A Dir. Com Services
Environmental management & municipal health
Regular checks and sampling of businesses
N/A Dir. Com Services
SLA with the District
N/A Dir. Com Services
Fire and Disaster Risk Management
Fire committee capacity building
N/A Dir. Com Services
Acquire new fire and disaster resources
N/A Dir. Com Services
Establishment of a satellite disaster and fire station
N/A Dir. Com Services
Public amenities
Community and Sport Committee briefings and fora
N/A Dir. Com Services
Upgrade existing halls N/A Dir. Com Services
ECD Centres N/A Dir. Com Services
New sports facilities N/A Dir. Com Services
Upgrade public amenities N/A Dir. Com Services
Clean and Green Cofimvaba N/A Dir. Com Services
Public safety
Functional Community Safety Forums
N/A Dir. Com Services
Street lighting in urban areas N/A Dir. Com Services
Fully equiped security and response unit
N/A Dir. Com Services
By-law development N/A Dir. Com Services
Animal care
Outreach N/A Dir. Com Services
143
KPA: Basic Services and Infrastructure (Social Needs Cluster)
Dept. Issue Project/Programme Ward/ Locations Staff
Responsible
New sites and re-location of existing Pounds
N/A Dir. Com Services
Place of safety for stray animals N/A Dir. Com Services
Eastern Cape Department of Health
Community facilities
Community Hospitals (2) Ncora & Tsomo N/A
Clinics (3) Mahlubini; Ntshingeni; Ngxabanyu
N/A
6.7.3 KPA 3: Local Economic Development
KPA: Local Economic Development
Dept. Issue Project/Programme Ward/ Locations Staff
Responsible
IYLM Local Economic Development
Agriculture
Expansion of Nguni Beef Production Programme
N/A Dir. LED
Goat Improvement Project N/A Dir. LED
Support to poultry and piggery projects with processing potential
N/A Dir. LED
Feedlot establishments and marketing/auction pans
N/A Dir. LED
High Value Crop Production Programmes (at Qamata, Ncora, Bilatye)
Qamata, Ncor, and Bilatye Dir. LED
Massive Food Production Programmes( Maize and Sorghum in almost all wards)
N/A Dir. LED
Intensive Cash Crop Production Programme under dryland conditions( e.g Potatoes, Butternuts, Pumpkins, Beans)
N/A Dir. LED

144
KPA: Local Economic Development
Dept. Issue Project/Programme Ward/ Locations Staff
Responsible
Establishment of the Fruit Cluster(Stone Fruit) with processing and Packaging plants.
N/A Dir. LED
Related Value-adding Programmes for all the aboe i.e Agro-processing plants (Milling Plants, Wool processing plants, etc)
N/A Dir. LED
Farmer's Day N/A Dir. LED
SMME and Cooperative Support
SMMEs and Cooperative Information and Support Programme
N/A Dir. LED
Business Information Centre N/A Dir. LED
Feasibility Study and Development of an Incubator and/or Local Industrial Park
N/A Dir. LED
Refurbishment and proper management of former TRANSIDO Units
N/A Dir. LED
Develop a Small Mining Support programme in partnership with DME
N/A Dir. LED
Market development for various goods and services produced at Intsika Yethu.
N/A Dir. LED
Tourism
Tourism information centre N/A Dir. LED
Craft development N/A Dir. LED
Mbulu waterfalls N/A Dir. LED
Forestry Development
Dissemination of information to communities on Forestry Protocols
N/A Dir. LED

145
KPA: Local Economic Development
Dept. Issue Project/Programme Ward/ Locations Staff
Responsible
Mapping of potential areas and issuing of licenses to communities
N/A Dir. LED
Facilitate funding and partnerships for forestry development
N/A Dir. LED
Facilitate transfer of Categories B & C Plantations
N/A Dir. LED
Development of forestry value adding activities:
N/A Dir. LED
Charcoal Production N/A Dir. LED
Small scale furniture making ventures N/A Dir. LED

146
6.7.4 KPA 4: Financial Management and Viability
KPA: Financial Management and Viability
Dept. Issue Project/Programme Ward/ Locations Staff
Responsible
IYLM Finance
Revenue generation
Lease review N/A CFO
VAT Review N/A CFO
Customer care and service
Data cleansing N/A CFO
Supply Chain Management
Credible Supplier Database N/A CFO
Suppliers Training N/A CFO
Legislative compliance
Review and Document Internal Controls
N/A CFO
Review of all finance and related policies for MFMA and GRAP 17 alignment
N/A CFO
Development of a procedure manual N/A CFO

147
6.7.5 KPA 5: Good Governance and Public Participation
KPA: Good Governance and Public Participation
Dept. Issue Project/Programme Ward/ Locations Staff
Responsible
IYLM Corporate Services
Council committees and support
Reviewal of standing rules and standing rules of order
N/A Dir. Corp Services
Reviewal of all workshops and by-laws
N/A Dir. Corp Services
Councillor workshops on policies N/A Dir. Corp Services
IYLM Finance
Audit outcomes
Operation Clean Audit N/A CFO
IYLM Municipal Manager's Office
Heritage
Vulnerable Groups Project N/A SPU Head & Com. Serv
Media Management and Liaising
N/A
MM

148
Chapter 4: Performance Management System
7. Introduction
According to the Municipal Planning and Performance Management Regulations (2001), a Performance
Management System (PMS):
“entails a framework that describes and represents how the municipality's cycle and processes of
performance planning, monitoring, measurement, review, reporting and improvement will be
conducted, organised and managed, including determining the roles of the different role-players”.
PMS is therefore integral to the realisation of the IDP’s strategic objectives since it elaborates upon the
level of performance that will be required in order for the municipality to reach its objectives. In addition
to this, the PMS also inculcates better performance into the organisation. The practice of using
performance information to identify shortcomings in a municipality’s strategy and doing regular and
continual reporting becomes central to the municipal functioning when done regularly and
comprehensively. A PMS therefore has other positive spin-offs such as promoting a culture of
performance management among the municipality’s office bearers and councillors and in its
administration of affairs in a manner that is economical, efficient, effective and accountable (this
according to Section 38 of the Municipal Systems Act). This chapter seeks to give a broad overview of the
performance management framework currently in place in IYLM.
Some of the issues that will be covered in this chapter include different roles and responsibilities of the
council and the municipal manager in terms of the PMS. The chapter shall also look at the various core
components of the PMS which include institutional performance management framework on the one hand
and individual performance model on the other. The chapter shall also cover key concepts relating to PMS
such as performance indicators and targets and expand on why these concepts are so important to a
comprehensive PMS. Possibly the most important aspect that this chapter will cover will be the link
between PMS and the IDP. This chapter will demonstrate how the PMS in IYLM will help to better realise
the strategic objectives and goals that have been discussed in other chapters of this IDP.
It is important that the reader notes the fact that IYLM has plans to develop a new comprehensive PMS.
This new PMS will be an improvement on the current performance management framework which
emerges from the Performance Management Policy of 2008/09.
Before presenting IYLM performance management framework it is important that the reader gains a sense
of the importance of PMS for all municipalities. This shall be done by briefly giving a legislative
background to PMS which is the foundation upon which performance management within local
government rests.
7.1 Legislative background
The importance of PMS for local government is important to the point that government has adopted
legislation making it part and parcel of governance at the local level. The two main pieces of legislation
that shall be presented in this regard are the:
Municipal Systems Act No 32 of 2000; and
The Municipal Planning and Performance Management Regulations of 2001 (Schedule to the MSA).

149
These two pieces of legislation are what informs IYLM performance management framework from which
the new PMS will eventually emerge. Throughout this chapter reference will be made to these two pieces
of legislation in order to motivate IYLM’s stance on PMS. In addition to legislation, IYLM has produced
the Performance Management Policy of 2008/09 which in itself references the two aforementioned
legislation as a source of opinion.
In accordance with section 38 of the Municipal Systems Act 32 of 2000, “A municipality must establish a
Performance Management System”. Section 39 dictates further that “The executive committee or
executive mayor of a municipality must:
a) Manage the development of the municipality’s Performance Management System;
b) Assign responsibilities in this regard to the municipal manager; and
c) Submit the proposed system to the municipal council for adoption.
In order to monitor its PMS, a municipality should implement a number of activities. The Municipal
Systems Act sets out a number of activities that would assist the municipality in achieving this end. These
activities are referred to as core components and are located in section 49 of the act. Beneath is a summary
of these core components.
IYLM is expected to set appropriate key performance indicators as a yardstick for measuring performance,
including outcomes and impact, with regard to the municipality’s development priorities and objectives
set out in its IDP.
a) Set measurable performance targets with regards to each of those development priorities and
objectives;
b) Monitor performance, and measure and review performance at least once a year;
c) Take steps to improve performance with regards to those priorities and objectives where
performance targets are not met; and
d) Establish a process of reporting.
The Municipal Planning and Performance Management Regulations of 2001 elaborates on the details of
what the Performance Management System should entail. According to these regulations “A
municipality's performance management system entails a framework that describes and represents how
the municipality's cycle and processes of performance planning, monitoring, measurement, review,
reporting and improvement will be conducted, organised and managed, including determining the roles of
the different role-players”.
The Municipal Planning and Performance Management Regulations provide for the following
requirements that a Performance Management System should meet in order for it to be credible. The
following are listed as primary requirements of the regulations:
a) PMS complies with all the requirements set out in the Act
b) Demonstrates how it is to operate and be managed from the planning stage up to the stages of
performance and reporting;

150
c) Clarifies the roles and responsibilities of each role-player, including the local community, in the functioning of the system;
d) Clarifies the processes of implementing the system within the framework of the Integrated
Development Planning process;
e) Determines the frequency of reporting and the lines of accountability for performance;
f) Relates to the municipality's employee performance management processes; and
g) Provides for the procedure by which the system is linked to the municipality's integrated development planning processes.
7.2 IYLM’s Performance Management System
IYLM has an existing Performance Management System policy which was developed in the 2008/09
financial year. It should be noted that the municipality seeks to review its PMS and develop a new system
during the 2012/13 financial year. This section shall amongst other things seek to craft a framework that
shall be used as a base for the development of a comprehensive PMS. The council has committed itself to
prioritising the development of the new comprehensive PMS in the current financial year. Performance
Management is already taking place within IYLM as will become apparent in the following section.
7.2.1 Role of the Council
In line with the Municipal Systems Act (Act No. 32 of 2000), the Municipal Council commits to
participating in the development of its performance management system through the Executive
Committee and shall:
a) Oversee the development of the municipality’s performance management system.
b) Assign responsibilities in this regard to the Municipal Manager who shall submit the proposed
system to the Municipal Council for adoption, and establish mechanisms to monitor and review the performance management system.
Through the development of the new PMS, the Municipal council will set out clear roles and
responsibilities with regard to the key elements of a sound PMS which are planning, monitoring,
measurement, review, reporting and performance assessment. The council, The Municipal Manager,
section 57 managers and the audit committee shall all have distinct roles in terms of the key elements
given above.
7.2.2 Role of the community
In addition to developing distinct responsibilities for officials, IYLM also envisages a key role for the
community to play in terms of the development process of the PMS. Measures shall be put in place in
order to allow the community to have a role in terms of setting performance indicators and targets.
Community involvement is in keeping with section 42 of the Municipal Systems Act which stipulates the
following:
“A municipality, through appropriate mechanisms, processes and procedures established in terms of
Chapter4, must involve the local community in the development, implementation and review of the
municipality’s performance, management system. 30 and, in particular, allow the community to
participate in the setting of appropriate key performance indicators and performance targets for the
municipality.”

151
One of the key challenges moving forward will be for the IYLM to develop a comprehensive mechanism for
distinguishing between different roles and responsibilities of the municipality within its PMS. The table
beneath aims to give a broad outline of what a more comprehensive take on role and responsibilities
would look like.
Table 35: Comprehensive table displaying the different roles in the PMS process
Actor Roles and Responsibilities
Role of the council Participates in strategic planning and agenda
setting, endorses targets, and reviews reports.
Role of the Municipal manager Plans, monitors, reviews, reports, and ensures
effective performance assessments.
Role of the s57 managers Plans, sets targets, signs agreements, implements,
reports, and assessed, learning from the review.
Role of the Audit Committee Quality assures and monitors the planning,
reporting, verification, and assessments.
Role of the community Contributes to identification of issues and receives
reports back on progress made.
As you can see from the table above, the roles responsibilities have not yet been fully defined. The table
thus presents a broad framework for the manner in which roles and responsibilities will be organised
when the comprehensive PMS is operational.
7.2.3 Performance Indicators
The regulations inform us that performance indicators should be set by the council within the PMS. These
indicators should be derived from the priorities and objectives of the municipality as stated in the IDP.
The performance indicators in question should be measurable, relevant, objective and precise. The council
shall ensure that the performance indicators apply to all its units and all service providers that it enters
into a service delivery agreement with. As mentioned earlier the council also has a responsibility to ensure
that the performance indicators used shall also reflect the input of the community. The council shall
comply with all these requirements stated above in accordance with section 9 of the Municipal Planning
and Performance Management Regulations, 2001. Section 9 goes further to inform us that all
municipalities should be cognisant of the General Key indicators which apply to all municipalities, they are
listed beneath:
The following general key performance indicators are prescribed in terms of section 43 of the Act:
a) The percentage of households with access to basic level of water, sanitation, electricity and solid waste removal.
b) The percentage of households earning less than R1100 per month with access to free basic services
c) The percentage of a municipality's capital budget actually spent on capital projects identified for a particular financial year in terms of the municipality's integrated development plan.
d) The number of jobs created through municipality's local economic development initiatives including capital projects.
e) The number of people from employment equity target groups employed in the three highest levels of management in compliance with a municipality's approved employment equity plan.

152
f) The percentage of a municipality's budget actually spent on implementing its workplace skills plan; and
g) Financial viability as expressed by the following ratios:
(i) Where- 'A' represents debt coverage 'B' represents total operating revenue received 'C' represents operating grants 'D' represents debt service payments (i.e. interest + redemption) due within the financial year (ii) Where- 'A' represents outstanding service debtors to revenue 'B' represents total outstanding service debtors 'C' represents annual revenue actually received for services (iii) Where- 'A' represents cost coverage 'B' represents all available cash at a particular time 'C' represents investments 'D' represents monthly fixed operating expenditure. After considering the general performance indicators as stated above, the council shall formulate a
number of performance indicators for its PMS based on inputs that they have received from the
community regarding issues which are of paramount importance to them. Performance indicators shall be
reviewed on an annual basis.
7.2.4 Performance Targets
After developing a set of performance indicators, the council shall develop relevant targets for those
indicators. Performance targets should have the following qualities according to section 12 of the
Municipal Planning and Performance Management Regulations, 2001:
(a) Be practical and realistic;
(b) Measure the efficiency, effectiveness, quality and impact of the performance of the municipality,
administrative component, structure, body or person for whom a target has been set; (c) Be commensurate with available resources; (d) Be commensurate with the municipality's capacity; and (e) Be consistent with the municipality's development priorities and objectives set out in its integrated
development.
A= B-C
D
A= B
C
A= B+C
D

153
The setting of targets shall assist the municipality in terms of measuring performance because these
targets shall be audited annually as part of the municipality’s internal auditing processes determined by
the Auditor-General.
7.2.5 Publishing of Performance Reports and the Annual Reports
IYLM acknowledges the importance of publishing the results of its performance to the broader public.
This is not only a democratic imperative but also a healthy tool for performance management since it
facilitates accountability and builds a culture of performance drives work into the organisation. A number
of different platforms shall be used in order to bring performance management closer to the broader
community. Publicising performance information is also a legal requirement and is clearly stated in the
Municipal Systems act section 41 (e), which stipulates:
A Municipality must-establish a process of regular reporting to:
a) The council, other political structures, political office bearers and staff of the municipality; and
b) The public and appropriate organs of state.
An annual report of PMS should also be compiled and made available to the general public. The annual
report should include a detailed report of the municipality’s performance and the performance of any
service provider that was contracted to the municipality during the financial period under scrutiny. The
annual report also gives details regarding performance indicators to be set for the following year. Lastly
the annual report will highlight all those areas in which the municipality is in need of improvement. In
addition to the annual report are quarterly reports which IYLM compiles and releases which support the
findings of the annual report. These key documents ensure that continuous monitoring of performance is
taking place. Ideally the annual report which reflects performance management should not stand alone
but should rather form part of the overall municipal annual report so that it may gain centrality and be
seen as crucial to the municipality’s strategy.

154
7.2.6 The PMS in relation to the IDP
Any credible PMS should be based on the IDP of that same municipality. As mentioned before, the performance indicators that are formulated within a
municipality’s PMS should be based on the priorities and objectives that emerge from that same municipality’s IDP or SDBIP. Thus the council’s PMS shall
be informed by the IDP. In other words, if the IDP fulfils the planning role, then the PMS fulfils implementation and monitoring role.
The table beneath is an example of how Key Priority Areas have been classified in IYLM’s IDP we can see from the table that from each priority emerges an
objective and a strategy to achieve that objective. From the objectives emerge indicators which are given details in terms of time and amount under the
targets. The indicators and targets are the responsibility of the accounting officer whose duties it is to ensure that the targets are met. The table therefore
demonstrates the link between the IDP and the PMS. This link is created through the progression from the key elements of integrated planning i.e.
prioritising, strategic objectives, and setting strategies to the key elements of performance management i.e. indicators, measurement, performance targets
and detailing roles and responsibilities.
Table 36: Integration of the strategic planning with the PMS
STRATEGIC PLANNING (IDP) PERFORMANCE MANANGEMENT (PMS)
Strategic Objective Strategic Objective is a statement of intention that seeks to identify the intended benefit and beneficiaries within IYLM
in relation to the organisation’s functions and provision of services.
Priority Issue Strategy Indicator Baseline
Annual Targets
Staff responsible
2012/13
2013/14
2014/15
2015/16
2016/17
The Priority Issues are those issues identified through the Situational Analysis and community consultations to ensure responsive planning that provides a common basis for action.
The strategy represents how the municipality is going to achieve the objective in relation to the identified priority.
The measurement of performance that is used to track progress towards achieving an objective.
Refers to the status quo of the given indicator, prior to the beginning of the new IDP cycle, usually an approximation for the financial year 2011/2012 or most recent available data.
This is the expression of the specific level of performance that an institution or individual aims to achieve on a year by year basis, and can be further broken down into quarterly targets within a given financial year.
The post responsible for ensuring that the performance indicators are tracked and the targets are achieved.

155
7.3 Institutional Performance Management
At the beginning of every financial year IYLM shall compile a balanced scorecard which will be specifically meant for assessing the performance of the municipality as an organisation. The balanced scorecard shall be reviewed by the municipality’s Balanced Scored Card Review Forum/Structure. This structure shall sit quarterly to assess the progress of the municipality in terms of reaching its targets. The institutional performance management approach is important because it allows for an overall picture of the municipality and how managers are working together as an organisation in order to reach their targets. The challenge for IYLM is to develop a comprehensive mechanism that will allow for the entire institution to be properly assessed on a continuous basis in a manner that will provide credible information that can be used to improve the municipality’s all-round performance. At present the municipality uses a method that ranks the municipality’s performance according to three levels. As seen from the table beneath municipal performance can fall under the “RED” bracket which represents poor performance that needs urgent attention; The “AMBER” bracket which represents delivery that is only just meets the needs of the municipality and is therefore close to poor performance; or the green bracket which bracket represents satisfactory performance. One should bear in mind that the table in question is a simplification of the actual process which in reality would involve the assessment of many indicators and targets based on the municipality’s strategic objectives and KPA’s. Table 37: Institution Performance Achievement Rating
KEY ROBOT LIGHT ACHIEVEMENT
PERCENTAGE
PERFORMANCE
DESCRIPTION
RED 50% and Lower Problem Area - Delivery below
par (Needs urgent attention)
AMBER Lower than 100% but
Higher than 50%
Delivery borders on danger area -
If performance does not improve
will turn red
GREEN 100% and Above Delivery levels acceptable - keep
momentum, sustain and improve
where there is room
7.4 Individual Performance Management
Assessing individual performance is an integral part of performance managements as it presents details
about a municipality’s performance that may not necessarily by visible from an institutional perspective.
Individual performance management elucidates upon specific areas of excellence, competence and
shortfalls within the municipality. IYLM uses a performance agreement to document the agreement
between the employee of the municipality and the manager on behalf of the municipality. The
performance agreement document possesses the details of what exactly is expected of the employee for the
financial year in question. It is also an opportunity for the strategic objectives and goals as stated in the
IDP of the municipality to be cascaded into the actual work of officials and managers.
The core components of a performance agreement include the following: Output Plan: details the outputs which the employee has to deliver upon. Targets are crafted in
relation to the performance indicators that will demonstrate the employees progress in terms of
achieving his/her outputs.
Competency plan: this refers to the skills and knowledge that an employee should acquire in order to
achieve the outputs as set out in the output plan.

156
Personal Development plan: these are the interventions that are needed to reduce or eliminate the
shortfall between the skills and knowledge that the employee possesses and the skills and knowledge
needed to dispense his/her duties in such a way that the outputs of the position in question are met.
7.4.1 The Performance Assessment process
This section highlights the current performance process which is being utilised within the IYLM
institution. The current process should be seen as a benchmark for the planned comprehensive PMS that
is going to be realised in the coming term.
According to the Performance management policy, quarterly performance appraisals are conducted for all
contracted staff of the municipality. The table beneath is a representation of the schedule of when the
appraisals take place throughout the year. The table shows us that the appraisal schedule will be set in
accordance with schedule that the municipality uses. Appraisals shall be conducted for all staff members
by their immediate superiors, and will be based on the performance indicators as explained in the output
plan of the employee.
Table 38: Appraisal schedule of the IYLM PMS
INTERVAL PERIOD EVALUATION DEADLINE
First quarter (July – September) 2nd week of October
*Second quarter (October – December) 2nd week of January
Third quarter (January – March) 2nd week of April
*Fourth (last) quarter (April – June) 2nd week of July
A rating scale is used to show the employees performance in terms of the indicators. The table beneath is an example of how an employee would be rated. Table 39: Performance Rating Scale of the IYLM PMS
PERFORMANCE RATING
SCALE (score)
Rating (%) Rating Definition
1 0 – 49 Unacceptable Performance
2 50 – 99 Performance NOT fully effective
3 100 – 149 Fully Effective
4 150 – 199 Performance Significantly above
expectation
5 200 + Outstanding Performance
The table demonstrates how an employee is rated on a score of 1 to 5. A score of 1 is the lowest score and
thus is categorised as unacceptable performance on the part of the employee. This indicates that the
employee has failed to satisfy the requirements for his or her duties as outlined by the indicators attached
to the performance agreement which the employee signed. In most cases managers will have to take action
to try and motivate the employee to improve performance because it is well below an acceptable standard.
A score of 5 is indicative of outstanding or excellent performance. As a percentage this score is represented
by 200% which is well above what is expected from the employee. Technically speaking a score of 5 means
that the employee went beyond what was expected of him or her in terms of the Performance Agreement.
In such cases managers will usually reward the employee for such outstanding performance in order to
incentivise the sustenance of the high work standards that the employee has demonstrated.

157
7.4.2 Rewarding and correcting good and poor performance
This is an important step in terms of maintaining good performance on the one hand and eliminating poor
performance on the other. Currently, IYLM has a number of performance incentives for good
performance. A performance bonus ranging from 5% to 14% of the all-inclusive remuneration package
may be paid to a Municipal Manager and Managers directly accountable to him or her. The breakdown
according to performance is as follows:
A score of 130% to 149% shall be awarded a performance bonus ranging from 5% to 9%.
A score of 150% and above shall be awarded a performance bonus ranging from 10% to 14%.
In terms of poor performance the council will usually implement training in order to get the employees
performance to the necessary levels, assistance shall be given to the employee with the intention of
imparting the necessary skills and knowledge so that the employee could be able to meet the objectives as
set out in his or her performance agreement. Where performance is consistently poor to the point of being
unacceptable, council will have to take stronger measures. These actions may include, invoking an
incapacity clause against the employee which could result in the employee being relieved of some duties or
in the total termination of contract.
7.5 Performance Audit
After completing the performance measurements (both institutional and individual), the results should be
audited. IYLM will do an internal audit of the results and also avail the results to the Auditor-General to
review on an annual basis as this is in keeping with the Municipal Systems Act which states the following
in section 45:
“The results of performance measurements in must be audited-
(a) As part of the municipality’s internal auditing process: and
(b) Annually by the Auditor-General”

158

159
7.6 First Draft High Level Service Delivery Budget Implementation Plan (SDBIP)
The SDBIP is an important tool as IYLM moves from conceptualising the strategic delivery of services to the application of those ideas and intentions in the
tangible development of communities. In line with MFMA Circular 13, this first draft of the SDBIP takes a high level approach and includes only the first three
of five components of the SDBIP. These include: monthly projections of revenue to be collected from each source; monthly projections of expenditure for each
vote; and quarterly projections of service delivery targets and performance indicators for each vote.
This information is still in an early stage of development and therefore still lacks: the ward information for expenditure and service delivery; as well as a
detailed capital works plan broken down over three years. Furthermore, the performance information component only addresses quarterly projections for the
annual targets derived from the 5 Year Implementation Plan, and does not provide for allocations per vote yet.
Nevertheless, the SDBIP is a vital tool for IYLM in monitoring in year performance and reporting. Crucially, it represents a draft of the contract between the
Mayor, Councillors, IYLM administration, and the broader community that will be developed and finalised within a month of the approval of the budget. The
following is a credible first draft of the expected revenue, expenditure, and service delivery targets. This first draft will form the basis for further refinement and
development of the SDBIP 2012/2013.

160
Table 40: Monthly revenue projections by source 2012/2013
MONTHLY CASH FLOWS Budget Year 2012/13 Medium Term Revenue and Expenditure Framework
R thousand July August Sept. October November December January February March April May June Budget Year
2012/13
Budget Year +1 2013/14
Budget Year +2 2014/15
Cash Receipts By Source 1
Property rates 900
900
900
900
900
– 4,500
4,739
4,971
Property rates - penalties & collection charges
–
Service charges - electricity revenue
–
Service charges - water revenue
–
Service charges - sanitation revenue
–
Service charges - refuse revenue
9
9
9
9
9
9
9
9
9
9
9
100
105
110
Service charges - other 454
454
454
454
454
454
454
454
454
454
907
5,442
5,730
6,011
Rental of facilities and equipment
27
27
27
27
27
27
27
27
27
27
27
300
316
331
Interest earned - external investments
27
27
27
27
27
27
27
27
27
27
27
300
316
331
Interest earned - outstanding debtors
9
9
9
9
9
9
9
9
9
9
9
100
105
110
Dividends received –
Fines 55
55
55
55
55
55
55
55
55
55
55
600
632
663
Licences and permits –
Agency services 109
109
109
109
109
109
109
109
109
109
109
1,200
1,264
1,326
Transfer receipts - operational
40,191
37,892
37,892
35,050
151,026
94,601
99,331
Other revenue 796
796
796
796
796
796
796
796
796
796
796
8,761
9,225
9,677
Cash Receipts by Source – 41,678
2,386
2,386
40,279
2,386
2,386
1,486
39,379
1,486
1,486
36,989
172,329
117,033
122,862

161
Table 41: Monthly revenue projections by source 2012/2013 continued
MONTHLY CASH FLOWS Budget Year 2012/13 Medium Term Revenue and Expenditure Framework
R thousand July August Sept. October November December January February March April May June Budget Year
2012/13
Budget Year +1 2013/14
Budget Year +2 2014/15
Other Cash Flows by Source
Transfer receipts - capital 10,487
10,487
10,487
– 31,461
33,269
34,932
Contributions recognised - capital & Contributed assets
–
Proceeds on disposal of PPE
–
Short term loans –
Borrowing long term/refinancing
–
Increase (decrease) in consumer deposits
–
Decrease (Increase) in non-current debtors
–
Decrease (increase) other non-current receivables
–
Decrease (increase) in non-current investments
–
Total Cash Receipts by Source
– 52,165
2,386
2,386
40,279
12,873
2,386
1,486
39,379
11,973
1,486
36,989
203,790
150,302
157,794

162
Table 42: Monthly expenditure projections by type of payment 2012/2013
MONTHLY CASH FLOWS Budget Year 2012/13 Medium Term Revenue and Expenditure Framework
R thousand July August Sept. October November December January February March April May June Budget Year
2012/13
Budget Year +1 2013/14
Budget Year +2 2014/15
Cash Payments by Type
Employee related costs 3,166
4,963
4,963
4,963
4,963
4,963
4,963
4,963
4,963
4,963
4,963
6,760
59,555
62,711
65,784
Remuneration of councillors
1,051
984
984
984
984
984
984
984
984
984
984
917
11,807
12,433
13,042
Finance charges –
Bulk purchases - Electricity
–
Bulk purchases - Water & Sewer
–
Other materials –
Contracted services –
Transfers and grants - other municipalities
–
Transfers and grants - other
–
Other expenditure 2,510
4,480
4,480
4,480
4,480
4,480
4,480
4,480
4,480
4,480
4,480
12,471
59,785
62,953
66,038
Cash Payments by Type
6,727
10,427
10,427
10,427
10,427
10,427
10,427
10,427
10,427
10,427
10,427
20,147
131,147
138,097
144,864
Other Cash Flows/Payments by Type
Capital assets –
Repayment of borrowing
–
Other Cash Flows/Payments
–
Total Cash Payments by Type
6,727
10,427
10,427
10,427
10,427
10,427
10,427
10,427
10,427
10,427
10,427
20,147
131,147
138,097
144,864
NET INCREASE/(DECREASE) IN CASH HELD
(6,727)
41,737
(8,041)
(8,041)
29,851
2,446
(8,041)
(8,941)
28,951
1,546
(8,941)
16,842
72,643
12,204
12,930
Cash/cash equivalents at the month/year begin:
(6,727)
35,010
26,969
18,928
48,780
51,226
43,185
34,244
63,195
64,741
55,801
– 72,643
84,847

163
Cash/cash equivalents at the month/year end:
(6,727)
35,010
26,969
18,928
48,780
51,226
43,185
34,244
63,195
64,741
55,801
72,643
72,643
84,847
97,777

164
7.6.1 Quarterly service delivery targets of the SDBIP 2012/2013
7.6.1.1 KPA 1: Municipal Transformation and Organisational Development
Cluster: Finance, Governance and Administration
Goal- To provide effective and efficient human resource and administrative services within IYLM towards institutional development and good governance,
supported by enhanced information and communications technology.
Strategic Objective: To improve the skills sets of IYLM Council and staff in line with their Personal Development Plans (PDPs).
Quarterly Targets
Priority Issue Strategy Performance
Indicator Baseline
Quarter 1 (Jul-Sep)
Quarter 2 (Oct- Dec)
Quarter 3 (Jan-Mar)
Quarter 4 (Apr-Jun)
Annual Target
Staff Responsible
Skills limitations
Skills development
Number of staff completed a training programme or course as per their PDPs
50 staff trained within 2011/2012
16 staff trained
16 staff trained
17 staff trained
17 staff trained
65 staff trained
Dir. Corp. Services
Number of Councillors completed a training programme or course as per their PDPs
15 Councillors trained within 2011/2012
3 Councillors trained
4 Councillors trained
4 Councillors trained
4 Councillors trained
15 Councillors trained
Dir. Corp. Services
Percentage of municipality's budget spent on implementing workplace skills plan
0.44% (R450000 out of R102189738 in 2011/2012)
0.125% 0.125% 0.125% 0.125% 0.50% (R650000 of 2012/2013 budget)
Dir. Corp. Services

165
Strategic Objective: To improve the well-being of IYLM staff and Council for better service delivery.
Quarterly Targets
Priority Issue Strategy Performance
Indicator Baseline
Quarter 1 (Jul-Sep)
Quarter 2 (Oct- Dec)
Quarter 3 (Jan-Mar)
Quarter 4 (Apr-Jun)
Annual Target
Staff Responsible
Employee Assistance
Health and awareness sessions
Average utilisation rate of Sick Leave
New indicator 26 days or less
26 days or less
26 days or less
26 days or less
26 days or less
Dir. Corp. Services
Strategic Objective: To improve the institutional performance of IYLM through the cascading of the institutional performance management system.
Quarterly Targets
Priority Issue Strategy Performance
Indicator Baseline
Quarter 1 (Jul-Sep)
Quarter 2 (Oct- Dec)
Quarter 3 (Jan-Mar)
Quarter 4 (Apr-Jun)
Annual Target
Staff Responsible
Organisational performance
Reviewing and cascading the PMS
Level of staff to which the PMS system is cascaded
Section 57 Manager Level
N/A N/A N/A Assistant Managers
Assistant Managers
Dir. Corp. Services
Strategic Objective: To improve access to information for Council, staff, and citizens of IYLM.
Quarterly Targets
Priority Issue Strategy Performance
Indicator Baseline
Quarter 1 (Jul-Sep)
Quarter 2 (Oct- Dec)
Quarter 3 (Jan-Mar)
Quarter 4 (Apr-Jun)
Annual Target
Staff Responsible
Information and Knowledge Management
Utilising and upholding existing policies and procedures
Average turnaround time for resolving request to access information
Within 24 hours
Within 24 hours
Within 24 hours
Within 24 hours
Within 24 hours
Within 24 hours
Dir. Corp. Services

166
Strategic Objective: To enhance governance through application of standing rules and orders of IYLM.
Quarterly Targets
Priority Issue Strategy Performance
Indicator Baseline
Quarter 1 (Jul-Sep)
Quarter 2 (Oct- Dec)
Quarter 3 (Jan-Mar)
Quarter 4 (Apr-Jun)
Annual Target
Staff Responsible
Council and committees services
Monitoring and enforcement of standing rules and orders
Number of Councillors signed for receipt of all Council Agendas seven days in advance
42 Councillors signed for receipt of all Council Agendas seven days in advance
42 Councillors signed for receipt of all Council Agendas seven days in advance
42 Councillors signed for receipt of all Council Agendas seven days in advance
42 Councillors signed for receipt of all Council Agendas seven days in advance
42 Councillors signed for receipt of all Council Agendas seven days in advance
42 Councillors signed for receipt of all Council Agendas seven days in advance
Dir. Corp. Services
Strategic Objective: To increase the organisational capacity of IYLM in annual prioritised work areas.
Quarterly Targets
Priority Issue Strategy Performance
Indicator Baseline
Quarter 1 (Jul-Sep)
Quarter 2 (Oct- Dec)
Quarter 3 (Jan-Mar)
Quarter 4 (Apr-Jun)
Annual Target
Staff Responsible
Organisational capacity
Recruitment and retention as per IYLM Policies
Organisational vacancy rate
20% vacancy rate in 2011/2012
20% 19% 18% 17% 17% Dir. Corp. Services
Number of funded vacancies filled as per identification in annual prioritised work areas
15 prioritised posts filled in 2011/2012
0 prioritised posts filled
5 prioritised posts filled
5 prioritised posts filled
5 prioritised posts filled
15 prioritised posts filled
Dir. Corp. Services
167
Strategic Objective: To increase the satisfaction levels of citizens with regards to IYLM services.
Quarterly Targets
Priority Issue Strategy Performance
Indicator Baseline
Quarter 1 (Jul-Sep)
Quarter 2 (Oct- Dec)
Quarter 3 (Jan-Mar)
Quarter 4 (Apr-Jun)
Annual Target
Staff Responsible
Employee awareness
Organisational Culture Survey
Organisational Culture Assessment
80% satisfaction rating
N/A
N/A
N/A
84% satisfaction rating
84% satisfaction rating
Dir. Corp. Services
Strategic Objective: To achieve equitable representation of Municipal staff in line with organisation’s transformation agenda.
Quarterly Targets
Priority Issue Strategy Performance
Indicator Baseline
Quarter 1 (Jul-Sep)
Quarter 2 (Oct- Dec)
Quarter 3 (Jan-Mar)
Quarter 4 (Apr-Jun)
Annual Target
Staff Responsible
Employment equity
Affirmative Action as per IYLM's Recruitment Policy
Number of people from employment equity target groups employed in three highest levels of management in compliance with municipality's employment equity plan
20 people from employment equity target groups employed in three highest levels of management
20 people from employment equity target groups employed in three highest levels of management
20 people from employment equity target groups employed in three highest levels of management
20 people from employment equity target groups employed in three highest levels of management
20 people from employment equity target groups employed in three highest levels of management
20 people from employment equity target groups employed in three highest levels of management
Dir. Corp. Services

168
7.6.1.2 KPA 2: Basic Services and Infrastructure
Cluster: Technical Services Cluster
Goal- To provide sound municipal planning, maintenance, and infrastructure provision that delivers for the needs and aspirations of IYLM citizens.
Strategic Objective: To improve road infrastructure networks within IYLM for greater mobility of people, goods, and services.
Quarterly Targets
Priority Issue Strategy Performance
Indicator Baseline
Quarter 1 (Jul-Sep)
Quarter 2 (Oct- Dec)
Quarter 3 (Jan-Mar)
Quarter 4 (Apr-Jun)
Annual Target
Staff Responsible
Roads infrastructure (including Storm Water Drainage)
Accelerate infrastructure provision and utilise all available funding
Kms of road constructed
Backlog of 1195kms at the end of 2009/2010
10 kms 20 kms 20 kms 20 kms 70 kms Dir. Plan. & Infra.
Strategic Objective: To achieve integrated land-use for sustainable human settlements within IYLM.
Quarterly Targets
Priority Issue Strategy Performance
Indicator Baseline
Quarter 1 (Jul-Sep)
Quarter 2 (Oct- Dec)
Quarter 3 (Jan-Mar)
Quarter 4 (Apr-Jun)
Annual Target
Staff Responsible
Integrated human settlements
Strengthen coordination across spheres
Percentage annual housing needs met according to the Housing Sector Plan
New indicator Finalised Housing Sector Plan (0%)
30% 60% 90% 90% Dir. Plan. & Infra.
Infrastructure provision
Number of sports facilities upgraded
None N/A N/A N/A 1 sports facility (Cofimvaba)
1 sports facility (Cofimvaba)
Dir. Plan. & Infra.

169
Strategic Objective: To improve access to basic water & sanitation to citizens of IYLM.
Quarterly Targets
Priority Issue Strategy Performance
Indicator Baseline
Quarter 1 (Jul-Sep)
Quarter 2 (Oct- Dec)
Quarter 3 (Jan-Mar)
Quarter 4 (Apr-Jun)
Annual Target
Staff Responsible
Water New water connections from sustainable sources
Number of villages received reticulation extensions
13 villages (Drought relief fund)
2 villages 2 villages 2 villages 2 villages 8 villages Dir. Plan. & Infra.
Sanitation New sanitation connections
Number of locations connected to the waterborne sewerage systems
1 location connected (approx. 400 households)
N/A N/A N/A 1 location connected
1 location connected
Dir. Plan. & Infra.
Strategic Objective: To improve access to electricity to citizens of IYLM.
Quarterly Targets
Priority Issue Strategy Performance
Indicator Baseline
Quarter 1 (Jul-Sep)
Quarter 2 (Oct- Dec)
Quarter 3 (Jan-Mar)
Quarter 4 (Apr-Jun)
Annual Target
Staff Responsible
Electricity & Energy Access
New electrical connections
Number of extensions received street lighting
25 extensions (approximately)
25 extensions
25 extensions
25 extensions
25 extensions
100 extensions
Dir. Plan. & Infra.

170
Cluster: Social Needs Cluster (within the Basic Services & Infrastructure KPA)
Goal- To provide quality social services and social infrastructure for the communities of IYLM, while ensuring public safety, promoting improved public health,
and supporting sustainable environmental management.
Strategic Objective: To improve the well-being of vulnerable groups within IYLM.
Quarterly Targets
Priority Issue Strategy Performance
Indicator Baseline
Quarter 1 (Jul-Sep)
Quarter 2 (Oct- Dec)
Quarter 3 (Jan-Mar)
Quarter 4 (Apr-Jun)
Annual Target
Staff Responsible
Special Programmes (Vulnerable Groups)
Community capacity development
Number of designated vulnerable individuals participated in IYLM programmes
840 individuals approximately in 2011/2012
250 individuals
250 individuals
250 individuals
250 individuals
1000 individuals
SPU Head & Municipal Manager
Develop & capacitate vulnerable groups
Number of vulnerable groups capacitated
New indicator 1 group 2 groups 1 group 1 group 5 groups SPU Head & Municipal Manager
Special Programmes
Establish SPU-Strategy Plan, Structure, Programmes, Projects
SPU Strategic Plan adopted by the Council
New indicator N/A N/A N/A 1 Strategic Plan
1 Strategic Plan
SPU Head & Municipal Manager
Mainstreaming of Special programmes
Number of mainstreaming SPU programmes completed across departments
2 programmes 1 program-me
1 program-me
1 program-me
N/A 3 program-mes
SPU Head & Municipal Manager
Special Programmes (Youth)
Recreational Tournament
Mayor's Cup Tournament
1 tournament N/A Road shows for tournament registration
1 tournament
Presentation of the Mayor’s Cup
1 tournament
SPU Head & Municipal Manager

171
Special Programmes (Heritage)
Celebration of National Days
Number of special day celebrations
6 celebrations N/A 1 celebration
N/A N/A 1 celebration
SPU Head & Municipal Manager
Strategic Objective: To improve the well-being of vulnerable groups within IYLM.
Quarterly Targets
Priority Issue Strategy Performance
Indicator Baseline
Quarter 1 (Jul-Sep)
Quarter 2 (Oct- Dec)
Quarter 3 (Jan-Mar)
Quarter 4 (Apr-Jun)
Annual Target
Staff Responsible
Indigent households
Provide free basic services
Number of households earning less than R1100 per month receiving free services
500 households approximately
750 households
750 households
750 households
750 households
750 households
CFO; MM; and Dir. Com. Services
Strategic Objective: To reduce HIV/AIDS related mortalities within IYLM.
Quarterly Targets
Priority Issue Strategy Performance
Indicator Baseline
Quarter 1 (Jul-Sep)
Quarter 2 (Oct- Dec)
Quarter 3 (Jan-Mar)
Quarter 4 (Apr-Jun)
Annual Target
Staff Responsible
HIV/AIDS By providing education
Number of participants of IYLM coordinated HIV/AIDS forums and support groups
420 participants
460 participants
500 participants
500 participants
500 participants
500 participants
Dir. Com. Services
Strategic Objective: To reduce the incidence of road accidents within IYLM.
Quarterly Targets
Priority Issue Strategy Performance
Indicator Baseline
Quarter 1 (Jul-Sep)
Quarter 2 (Oct- Dec)
Quarter 3 (Jan-Mar)
Quarter 4 (Apr-Jun)
Annual Target
Staff Responsible

172
Traffic Safety Education & awareness training to upgrading of infrastructure relevant to traffic safety
Reported incidence of road accidents on municipal roads
265 accidents 45 accidents or less
70 accidents or less
65 accidents or less
50 accidents or less
230 accidents or less
Dir. Com. Services
Strategic Objective: To increase household access to refuse removal services within IYLM.
Quarterly Targets
Priority Issue Strategy Performance
Indicator Baseline
Quarter 1 (Jul-Sep)
Quarter 2 (Oct- Dec)
Quarter 3 (Jan-Mar)
Quarter 4 (Apr-Jun)
Annual Target
Staff Responsible
Waste Management
Refurbishment of disposal site; Strengthen waste management cooperation; Community education for cleaning campaigns
Number of households with access to refuse removal services
1396 households
1396 households
1456 households
1506 households
1626 households
1626 households
Dir. Com. Services
Strategic Objective: To limit the risk of fires and disasters to communities within IYLM.
Quarterly Targets
Priority Issue Strategy Performance
Indicator Baseline
Quarter 1 (Jul-Sep)
Quarter 2 (Oct- Dec)
Quarter 3 (Jan-Mar)
Quarter 4 (Apr-Jun)
Annual Target
Staff Responsible
Fire-fighting and disaster management
Fire prevention and mitigation as per CHDM Disaster Management Plan
Incidence of Fire 22 fires in first half of 2011/2012
10 fires or less
12 fires or less
8 fires or less
6 fires or less
36 fires or less
Dir. Com. Services

173

174
Strategic Objective: To improve the environmental sustainability of IYLM.
Quarterly Targets
Priority Issue Strategy Performance
Indicator Baseline
Quarter 1 (Jul-Sep)
Quarter 2 (Oct- Dec)
Quarter 3 (Jan-Mar)
Quarter 4 (Apr-Jun)
Annual Target
Staff Responsible
Environmental management
Enforcing and maintaining environmental standards
Number of Environmental Impact Assessments completed prior to Project initiation
2 EIAs 1 EIA 1 EIA 1 EIA 1 EIA 4 EIAs Dir. Com. Services
Strategic Objective: To improve the security and care of all animals within IYLM.
Quarterly Targets
Priority Issue Strategy Performance
Indicator Baseline
Quarter 1 (Jul-Sep)
Quarter 2 (Oct- Dec)
Quarter 3 (Jan-Mar)
Quarter 4 (Apr-Jun)
Annual Target
Staff Responsible
Livestock and animal care
By complying with set standards of National animal care
Number of all animals impounded
240 animals 70 animals 90 animals 80 animals 60 animals 300 animals
Dir. Com. Services
Strategic Objective: To reduce the incidence of crime within IYLM.
Quarterly Targets
Priority Issue Strategy Performance
Indicator Baseline
Quarter 1 (Jul-Sep)
Quarter 2 (Oct- Dec)
Quarter 3 (Jan-Mar)
Quarter 4 (Apr-Jun)
Annual Target
Staff Responsible
Public safety To have functionality of police forum Municipal enforcement
Number of Community Policing Forums (CPFs) attended by at least one Councillor or Sect. 57 Manager
12 CPFs 3 CPFs 3 CPFs 3 CPFs 3 CPFs 12 CPFs Dir. Com. Services

175
Strategic Objective: To improve access to public amenities and recreational facilities for people within IYLM.
Quarterly Targets
Priority Issue Strategy Performance
Indicator Baseline
Quarter 1 (Jul-Sep)
Quarter 2 (Oct- Dec)
Quarter 3 (Jan-Mar)
Quarter 4 (Apr-Jun)
Annual Target
Staff Responsible
Community facilities
Upgrade existing and establish new facilities
Number of new community facilities opened
Backlog of 44 community facilities at the end of 2009/2010
1 community facility
1 community facility
1 community facility
1 community facility
4 community facility
Dir. Com. Services

176
7.6.1.3 KPA 3: Local Economic Development
Cluster: Economic Development and Planning
Goal- To support enterprise formations, retention and expansion of businesses and initiatives that provides job opportunities and income to the people of
IYLM.
Strategic Objective: To improve the agricultural sector contribution to the local economy of IYLM
Quarterly Targets
Priority Issue Strategy Performance
Indicator Baseline
Quarter 1 (Jul-Sep)
Quarter 2 (Oct- Dec)
Quarter 3 (Jan-Mar)
Quarter 4 (Apr-Jun)
Annual Target
Staff Responsible
Agriculture Targeted support and market access for all IYLM farmers
Number of IYLM farmers that receive financial support, training, and market access support
100 farmers 80 farmers 60 farmers 40 farmers 20 farmers 200 farmers
Dir: LED
Strategic Objective: To improve the forestry sub-sector’s contribution to the local economy of IYLM.
Quarterly Targets
Priority Issue Strategy Performance
Indicator Baseline
Quarter 1 (Jul-Sep)
Quarter 2 (Oct- Dec)
Quarter 3 (Jan-Mar)
Quarter 4 (Apr-Jun)
Annual Target
Staff Responsible
Forestry Facilitate funding and partnerships for forestry development
Number of communities supported before entering agreements with Private Investors
New indicator N/A N/A N/A 1 community
1 community
Dir: LED
Development of Forestry Value Adding activities
Number of furniture incubators (Cumulative over the term)
New indicator N/A N/A N/A 1 furniture incubator
1 furniture incubator
Dir: LED

177
Strategic Objective: To enhance tourism sector’s contribution to the local economy of IYLM.
Quarterly Targets
Priority Issue Strategy Performance
Indicator Baseline
Quarter 1 (Jul-Sep)
Quarter 2 (Oct- Dec)
Quarter 3 (Jan-Mar)
Quarter 4 (Apr-Jun)
Annual Target
Staff Responsible
Tourism Promote IYLM as a Heritage, Sports and Recreation destination
Number of visitors to Local tourism sites in IYLM
New indicator Establish baseline
Establish baseline
Establish baseline
Establish baseline
Establish baseline
Dir: LED
Strategic Objective: To grow enterprises involved in beneficiation and value-addition within IYLM.
Quarterly Targets
Priority Issue Strategy Performance
Indicator Baseline
Quarter 1 (Jul-Sep)
Quarter 2 (Oct- Dec)
Quarter 3 (Jan-Mar)
Quarter 4 (Apr-Jun)
Annual Target
Staff Responsible
SMMEs Greater retention and circulation of local currency support of Local SMMEs
Number of SMMEs registered within IYLM
204 SMMEs 204 SMMEs
206 SMMEs
210 SMMEs
214 SMMEs 214 SMMEs Dir: LED
Strategic Objective: To increase employment opportunities (temporal and permanent) within IY Municipal area.
Quarterly Targets
Priority Issue Strategy Performance
Indicator Baseline
Quarter 1 (Jul-Sep)
Quarter 2 (Oct- Dec)
Quarter 3 (Jan-Mar)
Quarter 4 (Apr-Jun)
Annual Target
Staff Responsible
Job creation Maximise expanded public works and LED employment opportunities
Number of jobs created through municipal LED initiatives (including capital projects)
662 jobs created
802 jobs created
922 jobs created
1265 jobs created
1362 jobs created
1362 jobs created
Dir: LED

178
Strategic Objective: To contribute to the environmental sustainability of Instika Yethu through prevention of soil erosion and removal of alien species.
Quarterly Targets
Priority Issue Strategy Performance Indicator Baseline Quarter 1 (Jul-Sep)
Quarter 2 (Oct- Dec)
Quarter 3 (Jan-Mar)
Quarter 4 (Apr-Jun)
Annual Target
Staff
Responsible
Conservation of
natural resources
Arrest land
degradation
Number of wards in
which land is
rehabilitated against
soil erosion
4 wards 1 wards 3 wards 3 wards 2 wards 9 wards Dir: LED
Clear alien
species
Number of hectares of
land cleared of alien
species of plant and
tree
1200 hectares 300 hectares 600 hectares 500 hectares 400 hectares 1800 hectares Dir: LED

179
7.6.1.4 KPA 4: Financial Management and Viability
Cluster: Finance, Governance, and Administration
Goal- To build the financial viability of IYLM through integrated planning, management, and good governance for a clean administration.
Strategic Objective: To improve the accuracy of the IYLM’s financial planning and reporting.
Annual Targets
Priority Issue Strategy Performance
Indicator Baseline
Quarter 1 (Jul-Sep)
Quarter 2 (Oct- Dec)
Quarter 3 (Jan-Mar)
Quarter 4 (Apr-Jun)
Annual Target
Staff Responsible
Inter-departmental integration and communication
Build internal capacity
% spending variance between approved budget and actual expenditure
10% 1% 2% 3% 5% 5% CFO
% of IYLM Capital expenditure on projects identified for the financial year within the IDP
New indicator (prescribed as schedule to the MSA)
25% 55% 85% 100% 100% CFO
Strategic Objective: To achieve best value for money through effective supply chain management within IYLM.
Quarterly Targets
Priority Issue Strategy Performance
Indicator Baseline
Quarter 1 (Jul-Sep)
Quarter 2 (Oct- Dec)
Quarter 3 (Jan-Mar)
Quarter 4 (Apr-Jun)
Annual Target
Staff Responsible
Value for money
Vetting of all suppliers
Percentage of all suppliers vetted
New indicator N/A N/A N/A 100% (1 annual data cleansing)
100% CFO

180
Training of all suppliers
Number of local suppliers workshopped on procurement procedures
50 service providers
100 service providers
N/A N/A N/A 100 service providers
CFO

181
Strategic Objective: To improve financial management capacity within IYLM.
Quarterly Targets
Priority Issue Strategy Performance
Indicator Baseline
Quarter 1 (Jul-Sep)
Quarter 2 (Oct- Dec)
Quarter 3 (Jan-Mar)
Quarter 4 (Apr-Jun)
Annual Target
Staff Responsible
Capacity limitations
Build internal capacity
Number of interns completed annual internship with Finance Dept.
5 for 2011/2012
N/A 5 interns completed internship
5 interns begin internship (0 interns completed internship)
N/A 5 interns completed internship
CFO
Strategic Objective: To strengthen the governance and control environment over all financial matters within IYLM.
Quarterly Targets
Priority Issue Strategy Performance
Indicator Baseline
Quarter 1 (Jul-Sep)
Quarter 2 (Oct- Dec)
Quarter 3 (Jan-Mar)
Quarter 4 (Apr-Jun)
Annual Target
Staff Responsible
Legislative compliance
Build SCM credibility
R-value of all fruitless, wasteful, unauthorised, and irregular expenditure
R2 million R 0 R 0 R 0 R 0 R 0 CFO
Strategic Objective: To achieve an unqualified audit opinion in the Municipality by 2014 and beyond.
Quarterly Targets
Priority Issue Strategy Performance
Indicator Baseline
Quarter 1 (Jul-Sep)
Quarter 2 (Oct- Dec)
Quarter 3 (Jan-Mar)
Quarter 4 (Apr-Jun)
Annual Target
Staff Responsible
Clean audit challenges (GRAP-17 standards)
Build internal controls
Auditor General Audit Opinion
Disclaimer N/A N/A N/A Unqualified Unqualified CFO & Municipal Manager

182
Strategic Objective: To increase revenue generation within the Intsika Yethu Municipal area.
Quarterly Targets
Priority Issue Strategy Performance
Indicator Baseline
Quarter 1 (Jul-Sep)
Quarter 2 (Oct- Dec)
Quarter 3 (Jan-Mar)
Quarter 4 (Apr-Jun)
Annual Target
Staff Responsible
Low revenue base
Implementation of MPRA; Review of existing leases; VAT Reviewal
R-value of all revenue generated within IYLM (excluding grants)
R10 million (approximately)
R15 million R 18 million
R21 million R 24 million
R 27 million
CFO

183
7.6.1.5 KPA 5: Good Governance and Public Participation
Cluster: Finance, Governance, and Administration
Goal- To ensure good governance and oversight within IYLM.
Strategic Objective: To strengthen the functionality of Ward Committees within IYLM.
Quarterly Targets
Priority Issue Strategy Performance
Indicator Baseline
Quarter 1 (Jul-Sep)
Quarter 2 (Oct- Dec)
Quarter 3 (Jan-Mar)
Quarter 4 (Apr-Jun)
Annual Target
Staff Responsible
Ward Committees & Community Participation
Capacitation of Ward and community members
Number of Ward Committee Clusters trained
1 training completed
2 Clusters trained
1 Cluster trained
2 Clusters trained
1 Cluster trained
6 Clusters trained
Municipal Manager
Strategic Objective: To improve communication within the IYLM.
Quarterly Targets
Priority Issue Strategy Performance
Indicator Baseline
Quarter 1 (Jul-Sep)
Quarter 2 (Oct- Dec)
Quarter 3 (Jan-Mar)
Quarter 4 (Apr-Jun)
Annual Target
Staff Responsible
Local Government Communication
Conduct survey for citizen feedback
Customer care survey rating
55% approval rating
N/A N/A N/A 60% 60% Municipal Manager
Strategic Objective: To improve Council Oversight and support to the political leadership within IYLM.
Quarterly Targets
Priority Issue Strategy Performance
Indicator Baseline
Quarter 1 (Jul-Sep)
Quarter 2 (Oct- Dec)
Quarter 3 (Jan-Mar)
Quarter 4 (Apr-Jun)
Annual Target
Staff Responsible
Council Support and Oversight
Regular reporting to all Section 79 Committees
Number of reports tabled to MPAC
2 reports for 2011/2012
1 report 1 report 1 report 1 report 4 reports Municipal Manager

184
Strategic Objective: To ensure codification, implementation of the by-laws, powers and functions.
Quarterly Targets
Priority Issue Strategy Performance
Indicator Baseline
Quarter 1 (Jul-Sep)
Quarter 2 (Oct- Dec)
Quarter 3 (Jan-Mar)
Quarter 4 (Apr-Jun)
Annual Target
Staff Responsible
Effective Legislation, By-laws, Powers and functions
Tracking of resolutions and by-laws
Number of new by-laws adopted by Council
3 by-laws in 2011/2012
Preparation (No by-laws yet adopted)
Public consultations (No by-laws yet adopted)
Public consultations (No by-laws yet adopted)
3 by-laws adopted
3 by-laws Municipal Manager
Compliance with statutory planning and reporting
Annual Report 1 Annual Report
N/A N/A First draft Annual Report presented to Council
1 Annual Report adopted by Council
1 Annual Report adopted by Council
Municipal Manager
Strategic Objective: To ensure effective Integrated Development Planning within the Municipality.
Quarterly Targets
Priority Issue Strategy Performance
Indicator Baseline
Quarter 1 (Jul-Sep)
Quarter 2 (Oct- Dec)
Quarter 3 (Jan-Mar)
Quarter 4 (Apr-Jun)
Annual Target
Staff Responsible
Integrated Development Planning
Compliance with statutory planning and reporting
Rating of the MEC’s IDP Assessment
High N/A N/A N/A High High Municipal Manager & LED
Strategic Objective: To ensure the participation of traditional leaders in service delivery.
Quarterly Targets
Priority Issue Strategy Performance
Indicator Baseline
Quarter 1 (Jul-Sep)
Quarter 2 (Oct- Dec)
Quarter 3 (Jan-Mar)
Quarter 4 (Apr-Jun)
Annual Target
Staff Responsible
Participation and Cooperation with Traditional Leadership
Formalise involvement of Traditional Leaders
Attendance rate of traditional leaders at meetings of Council
8 leaders in attendance per quarter
5 leaders in attendance
5 leaders in attendance
5 leaders in attendance
5 leaders in attendance
5 leaders in attendance on average annually
Municipal Manager

185

186
Chapter 5: Financial Plan and Budget
8. Financial Viability In accordance with the outcomes of the latest assessment conducted on the financial position, the IYLM
remains financially sustainable and is able to meet its financial commitments.
Significant reforms within the adoption of new accounting standards, being Generally recognised
Accounting Practice (GRAP), coupled with significant reforms within Municipal Budgeting and Reporting
Regulations has significantly enhanced the credibility, sustainability, transparency, accuracy and
reliability of financial planning, management and reporting within the IYLM
In meeting the demands associated with modernised practices towards sustaining and enhancing financial
viability; and addressing the specific needs of Intsika Yethu LM within the context of limited resources
and mounting service delivery expectations, has necessitated that a comprehensive integrated approach
towards financial sustainability be developed.
In terms of the approach adopted, the report will clearly define financial risks which have been identified
as being a financial threat to the long termed sustainability of the organisation, linked to key challenges,
with a detailed focus on effective strategies employed to mitigate against financial threats and weaknesses,
concluded by a detailed analysis of the service delivery package and associated financial implications on
the operations, statement of financial position and cashflows for the MTREF 2012/2013- 2014/2015
which collectively aim to position Intsika Yethu LM on a sustainable approach to service delivery.
8.1 Financial risks
In order to maintain and improve on the financial efficiencies and position of Intsika Yethu LM, certain
risks need to be managed, while financial management practices need to be continuously improved.
The key financial risks confronting the Municipality can be summarised as follows:
Limitation on Revenue Raising Capacity due to high poverty indices;
Growth within Debt Composition associated with Low level Service Offerings;
Financial Distress- ratio analysis- specific on Working capital elements;
Containment of personnel costs within set benchmarks as established within the budget process;
Governance and Administration costs as a percentage of own revenue;
Increases associated with deferred maintenance and backlog eradication.
8.2 Key Challenges
Achieving an unqualified audit report;
Affordability of a desired Organisational Structure;
The need to improve customer care;
The need to ensure legal compliance through all procedures and programmes.

187
8.3 Financial Strategies
The Financial Strategy has been formulated to ensure that the IYLM maximises all available opportunities
that would enhance Councils financial strength especially considering the cost‐shift environment that has
been created with the implementation of assigned powers and functions.
Council’s overall Financial Strategy is structured into the following core components to allow for a clearer
understanding of the overall task:
Revenue enhancement and maximisation Strategies;
Asset Management strategies;
Financial Management Strategies;
Capital Financing Strategies;
Operational Financing Strategies;
Strategies to Enhance Cost‐ effectiveness; and
Free Basic Services and indigent Support.
These segments are intended to provide operational guidance to staff to assist them in achieving identified
objectives and goals.
Importantly the Strategies formulated are deemed to be primary mitigating tool against the financial risks
identified, and giving effect to the objectives of the Integrated Development Plan, through ensuring that
the performance targets as per the Budget underlying the IDP are achieved.
The strategies are premised on ensuring compliance with adopted financial policies, modelled on
modernised reform practices applicable to Local Government.
8.3.1 Revenue Enhancement and Maximisation Strategy
The purpose of this strategy is to ensure that all possible avenues are explored to maximise the receipt of
any monies available to Council by way of intergovernmental transfers and Grants or Donations, including
expanding the billing database and maximising income opportunities on every registered serviced site
within the LM’s jurisdiction.
The second component of this strategy focuses on strengthening and building capacity within credit
control and debt management practices and processes of Council, ensuring the attainment and exceeding
of collection rates in line with key budgetary requirements.
The third component of the strategy focuses on maximising the registration of households eligible for
participation within the Free Basic Services (FBS) programme of Council, this component is aimed at
arresting spiralling debts associated with this user group, and limiting consumption of services in line with
the FBS allocation threshold.
In line with the strategy employed, Council has formalised the appointment of a debt collection agency on
a contingency arrangement over the next three years to undertake revenue enhancement and debt
reduction, with a special focus on skills transfer to a dedicated internal unit.
8.3.2 Subsidies and Grants
In order for Intsika Yethu LM to obtain maximum benefit from external monies available, a policy laying
out the relevant procedures has been put in place within the Institution to ensure that all grants,

188
donations and subsidies are investigated, applied for and received at the appropriate times. The policy will
ensure that Council receives maximum benefit from external funding available.
8.3.3 Credit Control and Debt Collection Policy
The Policy sets out to control and manage the recovery of outstanding debt due to Council. This policy is in
place and is subject to regular updates. The policy lays down the basis for distribution of accounts,
collection procedures, interest and penalties to be charged in the event of non‐payment, with strong focus
on management reporting requirements pursuant of key legislative requirements and performance
management.
Giving effect to the administration of this policy, Council through the appointment of a revenue
accountant has invested in a Revenue Management and Debt collection System fully compliant with
Municipal Bylaws and objects of the policy framework, the system effects have result in macro approach to
debt management and collection being effected, in an effective and efficient manner, maximise the return
on investment and per household.
8.3.4 Tariff Policy
This policy sets key guidelines on what should be considered when pricing services and guiding principles
for the compilation of water, sanitation, solid waste and other services. This policy is subject to constant
review, given significant reforms within the water sectors, which impact on the price cost of services
rendered, and ultimately on the sustainability of trading services.
8.4 Asset Management
8.4.1 Asset Management Strategies
The purpose of the strategy is to optimise the use of all assets under the control of IYLM, given the
financial exposure and the revenue streams earned by the Municipality in the rendering of services to the
community.
8.4.2 Asset Management Policy
This policy is deemed necessary in order to facilitate the effective management, control and maintenance
of the assets. The policy is in place and is subject to regular review. The prime objectives of the policy are
to ensure that the assets of Intsika Yethu are properly managed and accounted for by:
Ensuring the accurate recording of asset information;
The accurate recording of asset movements;
Exercising strict control over all assets;
Providing correct and meaningful management information;
Compliance with Council’s Insurance Policy and Payment Procedure;
Effecting adequate insurance of all assets; and
Maintenance of Council’s Assets.
The implication of this policy on the administration and planning of assets has been profound, in that the
organisation has a comprehensive understanding of all assets under the Management Control of the
Municipality, has an acute understanding of the conditions and remaining lifespan etc of the asset base, all

189
of which are aimed at ensuring that sound financial planning occurs, especially around investment
choices and reserve creation to safe guard against ageing infrastructure; the Funding and Reserves policy
is directly influenced through the outcomes of the annualised conditional assessment on all infrastructural
assets.
It is envisaged that strict adherence to policy framework will continue to be applied in order to protect the
resource of the community, and ensure the continued viability of the Municipality.
8.4.3 Asset Movement System
At the time of commissioning a GRAP compliant Asset Register, an asset tracking system using bar‐coded
discs and scanners was put in place. With the completion of the Asset Register, the asset tracking system is
now fully operational.
The system allow for regular audits of all assets to be completed in a shorter time frame and therefore
allowing for more regular updates of the register.
8.5 Financial Management Strategies
The purpose of this strategy is to ensure that the Financial Systems in place at IYLM are of such quality to
allow for the generation of accurate and timely reporting at all times.
The Strategy has culminated in the institution being able to effectively make informed decisions around
service delivery, identify financial risks and impeding financial problems, through having an acute
understanding of the financial affairs of the Municipality, through a simplified qualitative analysis being
provided based on the in year reports focusing on budgeted performance( revenue, expenditure, capital);
impact of the trading activity on the financial position and cashflows within the Organisation, this is in
compliance with international standards on in year reporting.
8.5.1 Budget and Finance Reform
A considerable amount of time and effort has been expended on ensuring that IYLM has the capacity to
deliver on the finance and budget reporting requirements as prescribed by National Treasury. The
institution has reaffirmed its commitment to the development of capacity to service local government
interest within financial management and administration and as such has invested huge amount towards
this program over the 2012/2013- 2014/2015 MTREF.
The process is being overseen by a Finance Standing committee and significant progress has been made in
some areas. Specific tasks being performed are:
Employment of interns and short term contract workers;
Reconciliation of assets;
Training;
Supply Chain Management;
Liability Management;
Revenue Management; and
Financial Systems Reporting.

190
8.5.2 Operational Financing Strategies
The purpose of this strategy is to assess the viability (IA) of any association or alliance or partnership that
may arise from time to time. IYLM has been assigned various functions and authorities by the MEC for
Local Government, Housing and Traditional Affairs or Structures Act. .
8.5.3 Strategies to Enhance Cost Effectiveness
The purpose of this strategy is to ensure that IYLM employs the most cost effective operating practices.
Importantly, this strategy is driven on the principles enshrined within the Costing policy, which amongst
other things advocates that the sustainability of IYLM is not primarily driven on resource generation
capacity, rather a combination of effective resource utilisation, premised on cost conscious decision
making practices and processes.
8.5.4 Benchmarking and Performance Indicators
A set of performance indicators will be developed and implemented to test the effectiveness and efficiency
of the Municipality. Benchmarking these against similar organisations will allow for regular internal
assessment and upgrading.
These bench mark indicators will supplement the battery of indicators that have been developed as part of
the new budget reporting formats and regulations, aimed at gauging the efficacy of financial performance
and management.
8.5.6 Training and Development of Staff
Training sessions and courses are continually being planned to ensure that all financial as well as non-
financial, senior staff and councillors will be in a better position to evaluate the financial position of the
Municipality. The Council also has an approved skills development plan, which is being implemented and
is used to guide training of both Councillors and Officials.
8.5.7 Cost Effectiveness
All departments of the IYLM are challenged continually with identifying the most cost effective means of
operating by employing the methods commonly associated with BOP (Best Operating Practices).
8.6 Free Basic Services
8.6.1 The indigent support policy
The basic principles of this policy are captured by indicating that the policy is to ensure that poor
households are not denied their constitutional right of access to services, the Intsika Yethu LM is required
to implement an indigent support policy that makes adequate financial provision to ensure the provision
of efficient and sustainable services to all residents within the area of jurisdiction.
The indigent support policy is an integral part of the Intsika Yethu’s tariff policy that is developed and
implemented in a transparent manner to ensure the sustainability of local public services to all of its
citizens at an affordable cost.
The indigent policy is intended to provide poor households ongoing access to a specified level of service.
The subsidies contained in the policy should not compromise the quality or efficiency of service delivery.

191
Critically as part of Intsika Yethu LM commitment to improve continued access to service and provide a
basket of free services as part of the poverty alleviation programme.
8.7 Actual expenditure and revenue for 2010/2011
The following tables provide an overview of IYLM’s actual expenditure and revenue over the last financial
year audited, 2010/2011. From the tables provided it is clear that IYLM’s challenges remain with the cost
of employing staff. Unlike in previous years, the municipality has been particularly effective in utilizing the
grants allocated to it for infrastructure development. Furthermore, it has also managed to collect more
revenue than was originally planned.
Table 43: IYLM budgeted expenditure versus actual expenditure 2010/2011
Budget 2010/11 Actual 2010/2011 Variance
PERSONNEL COSTS
Employee costs-Salaries 33,757,486 42,290,417 125.28%
Executive Committee and Council costs- Salaries
11,467,812 10,877,367 94.85%
SUB-TOTAL 45,225,298 53,167,784
GENERAL EXPENDITURE 35,873,279 40,599,473 113.17%
Repairs and maintenance of infrastructure
3,415,000 8,422,481 246.63%
SUB-TOTAL 39,288,279 41,385,038
CAPITAL PROJECTS 29,863,850 34,358,293 115.05%
TOTAL EXPENDITURE 114,377,427 128,911,115 112.71%
An area of concern lies with the municipality over-spending of its budget by more than 12%, whereas
revenue only increase by less than 2%. In the future the municipality will need to ensure there are stricter
controls in place to avoid over-spending on employee costs.
Table 44: IYLM budgeted revenue versus actual revenue 2010/2011
REVENUE BUDGET Budget 2010/11 Actual 2010/2011 Variance
EQUITABLE SHARE 66,271,000 66,271,000 100.00%
MIG 21,564,000 21,564,000 100.00%
FMG 1,250,000 1,250,000 100.00%
MSIG 750,000 750,000 100.00%
OTHER INCOME 24,542,427 26,368,872 107.44%
TOTAL REVENUE 114,377,427 116,203,872 101.60%
8.9 Financial Plan and Budget Statement
This plan is prepared in terms of Section 26 (h) of the Local Government: Municipal Systems Act, as
amended, which stipulates that a financial plan must be prepared as part of the Integrated Development
Plan.

192
The three year financial plan includes an Operating Budget and Capital Budget informed by the IDP
priorities. It takes into account the key performance areas of the IDP. All programmes contained in the
budget are reflected in the IDP. The review of the Municipality’s IDP has a ripple effect on the budget.
In addition to being informed by the IDP, the municipal fiscal environment is influenced by a variety of
macro-economic control measures. National Treasury determines the ceiling of year-on-year increases in
the total Operating Budget. Various government departments also affect municipal service delivery
through the level of grants and subsidies.
Table 45: Indicative 3 Year MTEF Budget for IYLM
PERSONNEL/PROJECT/
PROGRAMME BUDGET 2012/13 BUDGET 2013/14 BUDGET 2014/15
Basic Salary Councillors 8,386,200 8,855,827 9,334,042
Travelling allowance Councillors 2,794,998 2,951,518 3,110,900
Cellphone Allowance Councillors 625,970 661,025 696,720
Total Package - Senior Managers 5,737,893 6,059,215 6,386,412
Basic Salary Employees 33,007,708 34,856,140 36,738,371
Medical Aid Employees 2,062,982 2,178,509 2,296,148
Vehicle allowance 1,750,932 1,848,984 1,948,829
Cellphone Allowance employees 270,000 285,120 300,516
Pension Fund employees 5,899,556 6,229,931 6,566,347
Housing Subsidy 340,200 359,251 378,651
Skills Development Levies(UIF/SDL) 660,154 697,123 734,767
Bargaining Council Levies 293,843 310,298 327,054
Relief Personnel 0 0 0
Long Service Bonus 2,099 2,216 2,336
Basic Salary-CSP,s 4,800,000 5,068,800 5,342,515
Bonus CSP,s 600,000 633,600 667,814
Casual Workers 600,000 633,600 667,814
Relief Personnel 110,000 116,160 122,433
Annual Bonus 2,750,642 2,904,678 3,061,531
SALGA Levies 0 0 0
Shift Allowance 151,111 159,574 168,191
Allowances S& T 60,000 63,360 66,781
Overtime 347,746 367,219 387,049
Night Shift Allowance 110,368 116,549 122,842
TOTAL 71,362,401 75,358,695 79,428,065
GENERAL EXPENSES
Accomodation & Meals 1,660,500 1,753,488 1,848,176
Advertising Fees 250,000 264,000 278,256
Annual Report 100,000 105,600 111,302
Annual Audit Committee fee 70,000 73,920 77,912
Audit Fees 2,000,000 2,112,000 2,226,048

193
PERSONNEL/PROJECT/
PROGRAMME BUDGET 2012/13 BUDGET 2013/14 BUDGET 2014/15
Bank Charges 102,000 107,712 113,528
Books & Publication 65,000 68,640 72,347
Catering 650,000 686,400 723,466
Chemicals 500,000 528,000 556,512
Cleaning Material 180,000 190,080 200,344
Conference Fees(Strat Plan) 290,000 306,240 322,777
Consulting Fees & Prof Fees 2,150,000 2,270,400 2,393,002
Conveyance expenses 20,000 21,120 22,260
Electricity 560,000 591,360 623,293
FMG
Financial Statements 550,000 580,800 612,163
Intergrated IT System (eVenus) 650,000 686,400 723,466
CPMD Programme 1,050,000 1,108,800 1,168,675
Interns (Training & Salaries ) 1,140,000 1,203,840 1,268,847
MSIG
Asset Register (Revaluation of assets
& asset register) 1,200,000 1,267,200 1,335,629
Valuation Roll 1,200,000 1,267,200 1,335,629
Public Participation (IDP & BUDGET) 0 0 0
Training of Ward
Committes(Support) 0 0 0
Fuel & Oil(Motor Vehicles) 1,220,000 1,288,320 1,357,889
Fuel & Oil(Plant & Mach) 2,500,000 2,640,000 2,782,560
Hire of Equipment & Vehicles 670,000 707,520 745,726
ICT Networks 1,598,000 1,687,488 1,778,612
Insurance 800,000 844,800 890,419
Kitchen Utensils & Engraving 45,000 47,520 50,086
Legal Fees 1,200,000 1,267,200 1,335,629
Licence & Registration 350,000 369,600 389,558
Loan Repayment to Development
Bank of Southern Africa (DBSA) 950,000 1,003,200 1,057,373
Material & Stores 1,980,000 2,090,880 2,203,788
Membership Fees (Membership Fees) 42,000 44,352 46,747
Office Equipment Rental (Leased
equipment) 600,000 633,600 667,814
Office Equipment Repairs 100,000 105,600 111,302
Office furniture & equipment 310,000 327,360 345,037
Camping equipment and
accomodation 10,000 10,560 11,130
Postage 17,000 17,952 18,921
Pound Costs 60,000 63,360 66,781
Printing & Stationery 280,000 295,680 311,647
Protective Clothing 1,365,000 1,441,440 1,519,278

194
PERSONNEL/PROJECT/
PROGRAMME BUDGET 2012/13 BUDGET 2013/14 BUDGET 2014/15
Provision for Depreciation of Assets 200,000 211,200 222,605
Provision for Bad Debts 600,000 633,600 667,814
Repairs & Mantainance Buildings 2,150,000 2,270,400 2,393,002
Repairs and Maintanance 7,270,000 7,677,120 8,091,684
Community Lighting maintanance 600,000 633,600 667,814
Security Services/System 150,000 158,400 166,954
Social needs 160,000 168,960 178,084
Software Licence & Registration 0 0 0
Subsistance & Travelling 500,000 528,000 556,512
Telephone 1,100,000 1,161,600 1,224,326
Transport cost 120,000 126,720 133,563
Training Expense 2,010,000 2,122,560 2,237,178
Uniform 60,000 63,360 66,781
Vehicle Repairs & Mantainance 2,600,000 2,745,600 2,893,862
Corporate Branding 30,000 31,680 33,391
Traffic Equipment 0 0 0
OHS & EAP 200,000 211,200 222,605
Disaster 250,000 264,000 278,256
Perfomance Man.System 400,000 422,400 445,210
HIV/AIDS 250,000 264,000 278,256
Human Resources Systems 300,000 316,800 333,907
Clocking System 0 0 0
Wellness 200,000 211,200 222,605
Secretaries Day 0 0 0
Perfomance Awards 0 0 0
TOTAL 47,634,500 50,302,032 53,018,342
FREE BASIC SERVICES
Free basic services-electricity 2,000,000 2,112,000 2,226,048
Free basic services-alternative energy 4,000,000 4,224,000 4,452,096
MAYORAL POLITICAL FUND 0 0
Vehicles 0 0 0
Entertainment 500,000 528,000 556,512
Imbizo 200,000 211,200 222,605
Mayor's Cup 350,000 369,600 389,558
National day Celebration 100,000 105,600 111,302
EWP 1,000,000 1,056,000 1,113,024
Offical Activities 500,000 528,000 556,512
Pauper Burial 30,000 31,680 33,391
SPU 250,000 264,000 278,256
Twinning Arrangments 50,000 52,800 55,651
TOTAL 8,980,000 9,482,880 9,994,956

195
PERSONNEL/PROJECT/
PROGRAMME BUDGET 2012/13 BUDGET 2013/14 BUDGET 2014/15
SPEAKER'S POLITICAL FUND
Advance Councillor Training 200,000 211,200 222,605
Capacity Building 100,000 105,600 111,302
Ward Committees 2,520,000 2,661,120 2,804,820
Corporate Identity 50,000 52,800 55,651
Public Participation 200,000 211,200 222,605
Moral regenaration 100,000 105,600 111,302
TOTAL
3,170,000
3,347,520
3,528,286
TOTAL GENERAL EXPENSES 59,784,500 63,132,432 66,541,583
TOTAL OPERATING
EXPENDITURE
131,146,901
138,491,127
145,969,648
CAPITAL EXPENDITURE
MIG Committed Projects
MIG Access Roads(In house plant) 21,000,000
Cofimvaba Storm water 6,000,000
Cofimvaba Stadium 4,461,000 33,269,000 33,269,000
Waste Equipment 150,000 158,400 166,954
Land fill and Transfer(maintenance &
operation) 2,045,711 2,160,271 2,276,925
Road block trailer 120,000 126,720 133,563
DEA Project 0 0 0
Street Sweeper 0 0 0
Construction of Dipping Tanks 0 0 0
Business & Co-operation Forum 100,000 105,600 111,302
Goat Improvement Project 0 0 0
Wool Improvement Project 650,000 686,400 723,466
Dryland crop production project 2,000,000 2,112,000 2,226,048
Hawkers Stalls 100,000 105,600 111,302
Intsika Yethu Egg Producers 300,000 316,800 333,907
Farmer's Day 0 0 0
Information Day 40,000 42,240 44,521
Income Genetating Progamme 100,000 105,600 111,302
LTO 120,000 126,720 133,563
Lubisi Dam Development Project 400,000 422,400 445,210
Tree Nursery Project 100,000 105,600 111,302
Tourism SMME Support 100,000 105,600 111,302
Tourism development & Marketing 200,000 211,200 222,605
IDP 200,000 211,200 222,605
Feasibility study for Heritage Route 100,000 105,600 111,302
Feasibility study for wool
Improvement 100,000 105,600 111,302

196
PERSONNEL/PROJECT/
PROGRAMME BUDGET 2012/13 BUDGET 2013/14 BUDGET 2014/15
Intgrated Energy Centre (IeC) 300,000 316,800 333,907
Rehabilitation of Storm water
structures 2,000,000 2,112,000 2,226,048
Refuse Compactor 0 0 0
Padfoot roller x 2 0 0 0
1 Tonne Bakkie's x 2 300,000 316,800 333,907
Tipping and Processing-20km 1,000,000 1,056,000 1,113,024
Inter modal facilities 1,000,000 1,056,000 1,113,024
Street scapping and furniture 1,000,000 1,056,000 1,113,024
Blading(Wet/Dry)-50km 0 0 0
Dezzi Water Tank(Trailer) 450,000 475,200 500,861
Tsomo Offices 2,000,000 2,112,000 2,226,048
Conversion of truck to flatbed 350,000 369,600 389,558
Trailer for tractor 0 0 0
Tsomo and Cofimvaba Roads and
Stormwater 2,000,000 2,112,000 2,226,048
Town Planning and Land Use 600,000 633,600 667,814
WATER SERVICES PROJECTS
Umzomhle (water and sewer line
desing ) 13,000,000 13,728,000 14,469,312
Melika (water and sewer line desing ) 9,000,000 9,504,000 10,017,216
Parckage of plant 2,000,000 2,112,000 2,226,048
Upgrading of Tsojona Plant
(Generator) 800,000 844,800 890,419
Installation and convection 500,000 528,000 556,512
Upgrading of Tsomo WTW(Sump) 500,000 528,000 556,512
Access road to pump station 4,000,000 4,224,000 4,452,096
Uprading of Tsomo Plant
pumps(sewer) 500,000 528,000 556,512
Tsakana( water and sewer line design) 2,500,000 2,640,000 2,782,560
WATER QUALITY
MANAGEMENT
Health Safety 50,000 52,800 55,651
Water Purification 150,000 158,400 166,954
Water Sampling,Testing and
Treatment 750,000 792,000 834,768
CUSTOMER CARE
MANAGEMENT
Establishment of call center 800,000 844,800 890,419
Water campaigns and awareness
(water week) 250,000 264,000 278,256
Water demand management 700,000 739,200 779,117
REFURBISHMENT OF WATER
SCHEMES

197
PERSONNEL/PROJECT/
PROGRAMME BUDGET 2012/13 BUDGET 2013/14 BUDGET 2014/15
Drilling and Testing 6,800,000 7,180,800 7,568,563
CHDM ASSETS
Building and Containers 300,000 316,800 333,907
Office Furniture and Equipment 200,000 211,200 222,605
Vehicle Plant And Machinery 300,000 316,800 333,907
Mayoral Car 0 0 0
TOTAL CAPITAL
EXPENDITURE 92,486,711 97,712,151 101,192,081
TOTAL EXPENDITURE 223,633,612 236,203,278 247,161,729
REVENUE
Business Licence 80,000 84,480 88,704
Cemetry 10,000 10,560 11,088
Equitable Share/Fund 88,676,000 92,256,000 96,868,800
FMG 1,500,000 1,500,000 1,575,000
Interest on Rates 100,000 105,600 110,880
Interest Received 300,000 316,800 332,640
Savings - Internal Sources 4,000,000 4,224,000 4,435,200
MIG 31,461,000 33,269,000 34,932,450
MSIG 800,000 844,800 887,040
Plan Approval Fees 20,000 21,120 22,176
Pound Fees 150,000 158,400 166,320
Pound Auction Charges 100,000 105,600 110,880
Rates Receipt 4,500,000 4,752,000 4,989,600
Rental 300,000 316,800 332,640
Receipt of Licences & Reg (Agency
Fees) 1,200,000 1,267,200 1,330,560
Refuse Receipt 100,000 105,600 110,880
SARS 8,760,511 9,251,100 9,713,655
Sports field 7,000 7,392 7,762
Town Hall Hire Receipt 50,000 52,800 55,440
Traffic Fines 600,000 633,600 665,280
CHDM Subsidies /Grant 79,894,101 84,368,170 88,586,579
Connection fees Water and Sanitation 0 0 0
Septic Tank & Blokages 0 0 0
Sundry Income 1,000,000 1,056,000 1,108,800
VAT REFUND - SARS 0 0 0
Vending & Hawkers 25,000 26,400 27,720
Other Income 0 0 0
TOTAL 223,633,612 234,733,422 246,470,093
NET PROFIT(DEFICIT) 0 -1,469,856 -691,636

198
8.10 Financial Policies
8.10.1 Amendments to Budget Related Policies
The MFMA and the Budget and Reporting Regulations require budget related policies to be reviewed, and
where applicable, be updated on an annual basis.
A review of the existing budget related policies indicated that significant changes are required at this stage.
The following amended budget related policies are submitted herewith for final adoption:
Rates Policy
Supply Chain Management Policy
Cash and Investment Policy
Fleet Management Policy
8.10.2 New Policies proposed
Borrowing Policy
Funding and Reserves Policy
Policy related to long term financial plan
Policy relating to infrastructural investment and capital projects
Budget Implementation Plan
Policies related to Management of losses
Policy on Pauper Burials
Policy on Lease of Property
Policy on Unauthorized/irregular and wasteful expenditure
Policy on Contingent Liabilities
Policy on Related Party Disclosures
Policy on VAT
Policy on GRAP Disclosures
Policy on Journal Entries
Policy on Capital Commitments
8.11 History of Audit Reports
Qualification 2008/2009

199
Disclaimer 2009/2010
Disclaimer 2010/2011
IYLM has developed an action plan to address all the audit queries and has strengthened the internal audit
unit for the better monitoring of the implementation of this plan.

200
Chapter 6: Approval
The Draft IDP 2012-2017 was tabled to Council for adoption on 29 March 2012 and thereafter, comments
were invited from affected and interested parties via an advert in local papers.
Following receipt of comments from various interests groups and local communities via ward consultative
engagements and Mayoral Imbizos, inputs were considered and drafted into the final document.
A separate sector departmental engagement was organised during this comments period in order to invite
and discuss their comments on the draft in terms of their planned 2012/13 commitments in IYLM.
Thereafter, the drafting team produced this, the Final IDP 2012-2017 document which will be tabled to
Council together with the Budget for adoption and implementation with effect from July 2012.
The final document will be reproduced and marketed to all relevant audiences to ensure continuous buy-
in and support for the IDP 2012-2017 implementation.
Copies will also be forwarded to relevant authorities such as the MEC for Local Government and
Traditional Affairs in the province, the District Municipality and other development agencies that will be
lobbied to contribute to the development agenda of municipality.
DECLARATION OF ADOPTION
The final IDP document was adopted by the council on:
....................................
SIGNATURES
............................................. ...................................
Z. Shasha DATE
MUNICIPAL MANAGER
.............................................. ...................................
K. Vimbayo DATE
MAYOR
201
Annexure A: Strategy and Sector Plan Overview
The following provides an overview of plans and strategies currently in existence with IYLM and indicates
the year in which they were adopted. Where plans and strategies are in existence, they were considered
and informed the compilation of the IDP 2012-2017.
Table 1: Existing Strategies and Plans
Existing Strategies and Plans
Title Financial Year Adopted
Human Resource Strategy 2009/2010
Fire Response Plan 2008/2009
Fraud and Prevention Plan 2009/2010
HIV/AIDS Strategy 2009/2010
Tourism Strategy 2008/2009
LED Strategy 2007/2008
Small Towns Development Plan 2010/2011
Spatial Development Framework 2008/2009
Workplace Skills Plan 2008/2009
Employment Equity Plan 2008/2009
Audit Turnaround Plan 2011/2012 (March)
Waste Management Plan 2011/2012
Ward AIDS Council Plan 2011/2012
The table below gives an overview of those plans or strategies currently under development within IYLM
or currently in existence with the District Municipality. Where a document is in progress, it could not be
said to have an influence on the content of the document, whereas plans that were with CHDM were
implicitly considered in the compilation of the IDP.

202
Table 2: Current Plans with CHDM or Reviews in Progress
The table below provides an overview of all the potential strategies and plans currently under
consideration by IYLM for the new term of Council. Of priority in this regard are the Comprehensive
Infrastructure Plan and the Road Master Plan as these are crucial to effective and efficient service delivery
within the municipal area. Review and consideration of the implications of plans and strategies on these
issues is a useful point of departure for the municipality going forward.
Table 3: Additional Strategies and Plans for consideration in 2012-2017
Additional Strategies and Plans for consideration in 2012-2017
Title
Stakeholder Mobilisation Strategy
Community Participation Strategy
Complaints Management System
Traditional Leadership Strategy
Community Safety Plan
Air Quality Management Plan
Trade Effluent Policy
Leachate Management Plan
Current Plans with CHDM or Reviews in Progress
Title Status
Housing Sector Plan In progress
SDF Review In progress
Waste Water Treatment Plan CHDM
Sanitation Implementation Plan CHDM
Water Services Development Plan CHDM
Storm Water Management Plan In progress
Environmental Management Plan In Progress
Fire and Disaster Management Framework CHDM

203
Additional Strategies and Plans for consideration in 2012-2017
Title
Integrated Transport Plan
Roads Master Plan
Migration Plan
Land Degradation and Revitalisation Plan
Land Asset Register
Comprehensive Infrastructure Plan