sol plaatje local municipality integrated development plan 2022
168
SOL PLAATJE LOCAL MUNICIPALITY INTEGRATED DEVELOPMENT PLAN 2022 - 2027 1 SOL PLAATJE LOCAL MUNICIPALITY INTEGRATED DEVELOPMENT PLAN 2022 – 2027 DRAFT V1
-
Upload
khangminh22 -
Category
Documents
-
view
0 -
download
0
Transcript of sol plaatje local municipality integrated development plan 2022

SOL PLAATJE LOCAL MUNICIPALITY INTEGRATED DEVELOPMENT PLAN 2022 - 2027
1
SOL PLAATJE LOCAL MUNICIPALITY INTEGRATED DEVELOPMENT
PLAN 2022 – 2027
DRAFT V1

SOL PLAATJE LOCAL MUNICIPALITY INTEGRATED DEVELOPMENT PLAN 2022 - 2027
i
DOCUMENT INFORMATION
Document title: SOL PLAATJE LOCAL MUNICIPALITY INTEGRATED DEVELOPMENT PLAN
2022 – 2027
Draft Report Version 2
Prepared by: MOLIMI DEVELOPMENT PROJECTS (PTY) LTD
Contact details: 8 Jameson Avenue
Rhodesdene
Kimberley
8301
Tel: 072 375 4778
e-mail: [email protected]
Contact Person(s): Mr Wynand Myburgh
Prepared for: SOL PLAATJE LOCAL MUNICIPALITY
Contact details: Abattoir Road
Ashburnham
Kimberley
8301
Tel: 053 830 6675
email: [email protected]
Contact Person(s): Mr Danisile Seeco
SOL PLAATJE LOCAL MUNICIPALITY INTEGRATED DEVELOPMENT PLAN 2022 - 2027
ii
CONTENTS
Foreword by the Executive Mayor ....................................................................................... xi
Municipal Manager REMARKS ........................................................................................... xii
1. INTRODUCTION ............................................................................................................. 1
1.1. IDP PLANNING PHASE ........................................................................................................ 2
1.1.1. IDP PLANNING PROCESS FLOW ................................................................................................ 2
1.1.2. IDP ANNUAL PLANNING & DRAFTING PROCESS ........................................................................ 5
1.1.3. IDP AND BUDGET STEERING COMMITTEE ................................................................................ 6
1.1.4. TERMS OF REFERENCE FOR THE IDP AND BUDGET STEERING COMMITTEE ............................... 6
1.1.7. IDP REPRESENTATIVE FORUM ......................................................................................................... 7
1.1.7.1. COMPOSITION OF IDP REPRESENTATIVE FORUM ..................................................................... 7
1.1.7.2. WARD COMMITTEES ............................................................................................................... 7
1.1.7.3. INTERNAL AND EXTERNAL STAKEHOLDERS ............................................................................... 8
1.1.8. CONTEXT OF PUBLIC PARTICIPATION ..................................................................................... 11
1.1.9. MECHANISMS FOR PARTICIPATION ........................................................................................ 11
1.1.9.1. MEDIA............................................................................................................................... 11
1.1.9.2. PUBLIC ENGAGEMENTS ..................................................................................................... 11
1.1.9.3. MAYORAL IMBIZOS ........................................................................................................... 11
1.2. LEGISLATIVE ALIGNMENT ................................................................................................ 12
1.3. GLOBAL POLICY DIRECTIVES ............................................................................................ 22
1.3.1. SUSTAINABLE DEVELOPMENT GOAL ...................................................................................... 22
Implication/s for the IDP: ................................................................................................................... 22
1.3.2. THE NEW URBAN AGENDA .................................................................................................... 22
Implication/s for the IDP .................................................................................................................... 23
1.3.3. AFRICAN UNION AGENDA 2063 ............................................................................................. 23
Implication/s for the IDP: ................................................................................................................... 23
1.4. NATIONAL POLICY FRAMEWORK THE SOUTH AFRICAN CONTEXT ................................... 24
1.4.1. THE CONSTITUTION OF THE REPUBLIC OF SOUTH AFRICA (108) OF 1996 ................................ 24
Implication/s for the IDP: ................................................................................................................... 24
1.4.2. MUNICIPAL SYSTEMS ACT, NO 32 OF 2000 ............................................................................. 24
Implication/s for the IDP .................................................................................................................... 25
1.4.3. MUNICIPAL STRUCTURES ACT, 117 OF 1998........................................................................... 25
Implication/s for the IDP .................................................................................................................... 25

SOL PLAATJE LOCAL MUNICIPALITY INTEGRATED DEVELOPMENT PLAN 2022 - 2027
iii
1.4.4. MUNICIPAL FINANCE MANAGEMENT ACT, NO 56 OF 2003 .................................................... 26
Implication/s for the IDP .................................................................................................................... 26
1.4.5. THE WHITE PAPER ON LOCAL GOVERNMENT ......................................................................... 26
Implication/s for the IDP: ................................................................................................................... 26
1.4.6. THE INTERGOVERNMENTAL RELATIONS FRAMEWORK ACT, ACT 13 OF 2005 .......................... 27
Implication/s for the IDP .................................................................................................................... 27
1.4.7. MUNICIPAL DEMARCATION ACT 27 OF 1998 .......................................................................... 27
Implication/s for the IDP .................................................................................................................... 27
1.4.8. THE NDP 2030 ....................................................................................................................... 27
Implication/s for the IDP .................................................................................................................... 28
1.4.9. NATIONAL SPATIAL DEVELOPMENT PERSPECTIVE (NSDP), 2006 ............................................. 28
Implication/s for the IDP .................................................................................................................... 28
1.4.10. LOCAL GOVERNMENT TURNAROUND STRATEGY (LGTAS) ....................................................... 29
Implication/s for the IDP .................................................................................................................... 29
1.4.11. THE INTEGRATED URBAN DEVELOPMENT FRAMEWORK ........................................................ 29
Implication/s for the IDP .................................................................................................................... 29
1.4.12. THE MEDIUM-TERM STRATEGIC FRAMEWORK ....................................................................... 29
Implication/s for the IDP .................................................................................................................... 30
1.4.13. THE OUTCOMES APPROACH (12 OUTCOMES) ........................................................................ 30
Implication/s for the IDP .................................................................................................................... 30
1.4.14. STRATEGIC INFRASTRUCTURE PROJECTS ................................................................................ 31
Implication/s for the IDP .................................................................................................................... 31
1.4.15. BACK TO BASICS .................................................................................................................... 31
Implication/s for the IDP .................................................................................................................... 32
1.4.16. MFMA CIRCULAR NO. 88 ....................................................................................................... 32
Implication/s for the IDP .................................................................................................................... 32
1.4.17. STATE OF THE NATION ADDRESS 2022 ................................................................................... 33
Implication/s for the IDP .................................................................................................................... 33
1.4.18. THE DISTRICT DEVELOPMENT MODEL .................................................................................... 33
Implication/s for the IDP .................................................................................................................... 34
1.4.19. SPLUMA PRINCIPLES .............................................................................................................. 34
Implication/s for the IDP .................................................................................................................... 34
1.5. PROVINCIAL POLICIES ...................................................................................................... 35
1.5.1. NORTHERN CAPE PROVINCIAL GROWTH AND DEVELOPMENT PLAN (2018) ............................ 35

SOL PLAATJE LOCAL MUNICIPALITY INTEGRATED DEVELOPMENT PLAN 2022 - 2027
iv
Implication/s for the IDP .................................................................................................................... 35
1.5.2. NORTHERN CAPE PROVINCIAL SPATIAL DEVELOPMENT STRATEGY,2018 ................................ 35
Implication/s for the IDP .................................................................................................................... 35
1.5.3. STATE OF THE PROVINCE ADDRESS ........................................................................................ 36
Implication/s for the IDP .................................................................................................................... 36
1.6. DISTRICT POLICIES ........................................................................................................... 37
1.6.1. INTEGRATED DEVELOPMENT PLAN (FRANCES BAARD MUNICIPALITY) .................................... 37
Implication/s for the IDP .................................................................................................................... 37
1.6.2. FRANCES BAARD GROWTH AND DEVELOPMENT STRATEGY ................................................... 37
Implication/s for the IDP .................................................................................................................... 37
1.6.3. FRANCES BAARD SPATIAL DEVELOPMENT FRAMEWORK ........................................................ 38
Implication/s for the IDP .................................................................................................................... 38
1.6.4. FRANCES BAARD DISTRICT MUNICIPALITY TOURISM STRATEGY ............................................. 38
Implication/s for the IDP .................................................................................................................... 38
1.7. THE MUNICIPAL VISION AND SERVICE DELIVERY IMPERATIVES ...................................... 39
1.7.1. THE VISION & MISSION .......................................................................................................... 39
1.7.2. IDP COHERENCE .................................................................................................................... 39
2. MUNICIPAL PROFILE .................................................................................................... 41
2.1. SOCIO-ECONOMIC OVERVIEW ......................................................................................... 41
2.1.1. POPULATION BY GENDER, AGE AND POPULATION GROUP ..................................................... 42
2.1.2. GROWTH POPULATION TRENDS ............................................................................................ 43
2.1.3. HEALTH, SAFETY AND SECURITY ............................................................................................. 44
2.1.4. EDUCATION ........................................................................................................................... 46
2.1.5. ACCESS TO SERVICES AND HOUSING ...................................................................................... 47
2.2. ECONOMIC OVERVIEW .................................................................................................... 48
2.2.1. ECONOMIC PROFILE .............................................................................................................. 48
2.2.2. KEY ECONOMIC CONTRIBUTOR BY SECTOR ............................................................................ 49
2.2.3. EMPLOYMENT STATUS .......................................................................................................... 50
2.2.4. HOUSEHOLD INCOME ............................................................................................................ 51
2.2.5. YOUTH AND SOCIAL DEVELOPMENT ...................................................................................... 52
2.3. KEY FINDINGS & IMPLICATIONS ...................................................................................... 53
2.3.1. POPULATION & hOUSEHOLDS................................................................................................ 53
2.3.2. ECONOMIC PROFILE .............................................................................................................. 54
2.3.3. EMPLOYMENT & HOUSEHOLD INCOME ................................................................................. 54

SOL PLAATJE LOCAL MUNICIPALITY INTEGRATED DEVELOPMENT PLAN 2022 - 2027
v
2.3.4. EDUCATION ........................................................................................................................... 55
2.3.5. SOCIAL LIVING CONDITIONS .................................................................................................. 56
3. SPATIAL DEVELOPMENT CONTEXT .............................................................................. 58
3.1. GEOGRAPHIC OVERVIEW OF SPM ................................................................................... 58
3.1.1. SPLM LOCALITY ..................................................................................................................... 58
3.1.2. BIOPHYSICAL CONTEXT .......................................................................................................... 59
3.1.3. SPATIAL ECONOMIC DEVELOPMENT FRAMEWORK (SDF) ....................................................... 59
3.2. STATUS QUO.................................................................................................................... 60
3.2.1. ROADS AND STORMWATER ................................................................................................... 60
3.2.1.1. Transportation Plan and Pavement Management System: ................................................. 60
3.2.1.2. Roads Infrastructure:......................................................................................................... 60
3.2.1.3. Road Maintenance: ........................................................................................................... 61
3.2.1.4. Projects for Extension and Maintenance of Roads Infrastructure: ...................................... 61
3.2.1.5. Storm Water Management Plan: ....................................................................................... 61
3.2.1.6. Storm Water Infrastructure: .............................................................................................. 61
3.2.1.7. Storm Water Maintenance: ............................................................................................... 62
3.2.2. WATER .................................................................................................................................. 62
3.2.2.1. Water Services Development Plan (WSDP): ....................................................................... 62
3.2.2.2. National Targets for the Millennium Development Goals (MDG): ....................................... 62
3.2.2.3. Service Provision: .............................................................................................................. 62
3.2.2.4. Water Demand:................................................................................................................. 63
3.2.2.5. Water Infrastructure: ........................................................................................................ 64
3.2.2.5.1. Raw Water Source: ...................................................................................................... 64
3.2.2.5.2. Abstraction Infrastructure: .......................................................................................... 64
3.2.2.6. Water Treatment Works (WTW): ....................................................................................... 65
3.2.2.7. Trunk Mains ...................................................................................................................... 66
3.2.2.8. Bulk Pump Stations: .......................................................................................................... 68
3.2.2.9. Water Storage Infrastructure:............................................................................................ 69
3.2.2.10. Water Distribution and Reticulation Network: ............................................................... 70
3.2.2.11. Water Quality: .............................................................................................................. 70
3.2.2.12. Extension of Water Services: ......................................................................................... 71
3.2.3. SANITATION .......................................................................................................................... 71
3.2.3.1. Sanitation Development Plan (SDP): .................................................................................. 71
3.2.3.2. National Targets for the Millennium Development Goals (MDG): ....................................... 71

SOL PLAATJE LOCAL MUNICIPALITY INTEGRATED DEVELOPMENT PLAN 2022 - 2027
vi
3.2.3.3. Service Provision: .............................................................................................................. 71
3.2.3.4. Effluent Generation: .......................................................................................................... 72
3.2.3.5. Sanitation Infrastructure ................................................................................................... 72
3.2.3.5.1. Gravitational Network: ................................................................................................ 72
3.2.3.5.2. Bulk Outfall Pipelines: ................................................................................................. 72
3.2.3.5.3. Pump Stations: ............................................................................................................ 73
3.2.3.5.4. Rising Mains: ............................................................................................................... 74
3.2.3.5.5. Wastewater Treatment Works (WWTW): .................................................................... 74
3.2.3.6. Effluent Quality: ................................................................................................................ 75
3.2.4. ELECTRICAL ........................................................................................................................... 76
3.2.4.1. Electrical Master Plan: ....................................................................................................... 76
3.2.4.2. Service Provision: .............................................................................................................. 76
3.2.4.3. Infrastructure Maintenance:.............................................................................................. 77
3.2.4.4. Electrical Demand: ............................................................................................................ 77
3.2.4.5. Infrastructure: ................................................................................................................... 79
3.2.4.5.1. Municipal Intake: ........................................................................................................ 79
3.2.4.5.2. High Voltage Network (66kV): ..................................................................................... 79
3.2.4.5.3. Medium Voltage Network (11kV): ............................................................................... 80
3.2.4.5.4. Low Voltage Network (400V/230V):............................................................................. 80
3.2.4.5.5. Scheduled Summary of HV, MV and LV Condition: ....................................................... 80
3.2.4.5.6. Street lighting and Community Area Lighting: .............................................................. 80
3.2.4.6. Quality of Supply: .............................................................................................................. 81
3.2.4.7. Network Strengthening & Maintenance Projects: .............................................................. 81
3.2.4.7.1. Very Short Term (<1 Year): .......................................................................................... 81
3.2.4.7.2. Short Term (1-3 Years) ................................................................................................ 81
3.2.4.7.3. Medium Term (3-10 Years) .......................................................................................... 82
3.2.4.7.4. Long Term (>10 Years) ................................................................................................. 82
3.2.5. SOLID WASTE MANAGEMENT ................................................................................................ 83
3.2.5.1. Integrated Waste Management Plan (IWMP):.................................................................... 83
3.2.5.2. Solid Waste Disposal Site (SWDS): ..................................................................................... 83
3.2.5.3. Refuse Removal: ............................................................................................................... 83
3.2.5.4. Waste Management Equipment and Vehicles: ................................................................... 83
3.2.5.5. Key Issues: ........................................................................................................................ 84
3.2.6. HUMAN SETTLEMENTS .......................................................................................................... 84

SOL PLAATJE LOCAL MUNICIPALITY INTEGRATED DEVELOPMENT PLAN 2022 - 2027
vii
3.2.6.1. OVERVIEW ........................................................................................................................ 84
3.2.6.2. KEY ISSUES AFFECTING SUSTAINABLE HUMAN SETTLEMENTS ............................................ 86
3.3. SPATIAL DEVELOPMENT AND ECONOMIC DEVELOPMENT SYNERGIES ............................ 88
3.3.1. STRATEGIC SPATIAL DIRECTION ............................................................................................. 88
3.3.2. LOCAL ECONOMIC DEVELOPMENT......................................................................................... 89
3.3.3. IMPACT OF COVID ON THE ECONOMY ................................................................................... 90
3.3.4. CHALLENGES FACED .............................................................................................................. 91
3.3.5. PRECINCT DEVELOPMENT FRAMEWORK (PDF) ....................................................................... 91
3.3.5.1. CATERS GLEN PRECINCT .................................................................................................... 92
3.3.5.2. BIG HOLE & ADVENTURE TOURISM PRECINCTS .................................................................. 92
3.3.5.3. RIVERTON LEISURE AND CONFERENCING PRECINCT........................................................... 94
3.3.5.4. HERITAGE PRECINCT .......................................................................................................... 95
3.3.5.5. KAMFERSDAM ECO-FRIENDLY PRECINCT ........................................................................... 95
4. GOVERNANCE & COMMUNITY NEEDS ......................................................................... 98
4.1. SPLM GOVERNANCE ........................................................................................................ 98
4.1.1. STRUCTURE OF COUNCIL ....................................................................................................... 98
4.1.2. COMMITTEES ........................................................................................................................ 98
4.1.3. MUNICIPAL ORGANISATION & OPERATIONS .......................................................................... 99
4.2. WARDS POLITICAL STRUCTURE...................................................................................... 100
4.3. SPLM WARDS LOCATIONAL PROFILE ............................................................................. 103
4.4. WARD PRIORITIES SUMMARY & INPUTS ....................................................................... 104
4.4.1. WARD MEETING SCHEDULES ............................................................................................... 104
4.4.2. COMMUNITY REPRESENTATION .......................................................................................... 105
4.4.3. COMMUNITY INPUTS........................................................................................................... 107
4.5. IDP PROJECT STEERING COMMITTEE & FORUM INPUTS ................................................ 110
5. STRATEGIC DIRECTION............................................................................................... 112
5.1. STRATEGIC FRAMEWORK .............................................................................................. 112
5.1.1. THE VISION & MISSION .................................................................................................. 112
5.1.2. STRATEGIC OBJECTIVES & KPA’s........................................................................................... 112
5.1.2.1. SPATIAL TRANSFORMATION ............................................................................................ 113
5.1.2.2. INCLUSIVE GROWTH........................................................................................................ 113
5.1.2.3. SERVICE PROVISION ........................................................................................................ 113
5.1.2.4. GOVERNANCE ................................................................................................................. 114
5.1.2.5. KPA 1: LOCAL ECONOMIC DEVELOPMENT........................................................................ 114

SOL PLAATJE LOCAL MUNICIPALITY INTEGRATED DEVELOPMENT PLAN 2022 - 2027
viii
5.1.2.6. KPA 2: ACCESS TO BASIC SERVICES AND INFRASTRUCTURE DEVELOPMENT ...................... 115
5.1.2.7. KPA 3: SOUND FINANCIAL MANAGEMENT ....................................................................... 115
5.1.2.8. KPA 4: INSTITUTIONAL DEVELOPMENT AND CAPACITY BUILDING .................................... 116
5.1.2.9. KPA 5: GOOD GOVERNANCE AND PUBLIC PARTICIPATION ............................................... 116
5.2. MUNICIPAL INSTITUTIONAL DEVELOPMENT AND TRANSFORMATION .......................... 117
5.2.1. GOOD GOVERNANCE ........................................................................................................... 117
5.2.2. MUNICIPAL FINANCIAL VIABILITY AND MANAGEMENT ........................................................ 118
5.2.3. HUMAN RESOURCES............................................................................................................ 120
5.2.4. MUNICIPAL ICT .................................................................................................................... 120
5.2.5. SERVICE DELIVERY CHALLENGES .......................................................................................... 121
6. IDP IMPLEMENTATION .............................................................................................. 125
6.1. IDP PROJECTS ................................................................................................................ 125
6.2. PROJECTS PRIORITIES & WARD SPECIFIC ISSUES ADDRESSED ........................................ 135
6.3. IDP PROJECTS STRATEGIC ALIGNMENT .......................................................................... 136
6.4. IDP PROJECTS FUNDING STRUCTURE ............................................................................. 137
ANNEXURE A: ABBREVIATIONS ........................................................................................ 140
ANNEXURE B: SPATIAL DEVELOPMENT FRAMEWORK ...................................................... 142
ANNEXURE C: DETAILED IDP PREPARATION SCHEDULE, 2021/2022 & 2022/2023 MTREF
BUDGET ............................................................................................................................ 148
SOL PLAATJE LOCAL MUNICIPALITY INTEGRATED DEVELOPMENT PLAN 2022 - 2027
ix
List of Tables
Table 1: IDP Planning Phase - Key Activities Process Plan ................................................................... 5
Table 2: Internal Stakeholders ........................................................................................................... 8
Table 3: External Stakeholders ......................................................................................................... 10
Table 4: Legislation Principles & Alignment Summary ...................................................................... 13
Table 5: Proposed LED Projects per IDP 2017 -2022 ......................................................................... 90
Table 6: SPLM Political Party Representation ................................................................................. 100
Table 7: SPLM Ward Councillors .................................................................................................... 101
Table 8: SPLM Ward Community IDP Meeting Schedule ................................................................ 104
Table 9: IDP Strategic Objectives & KPA's ....................................................................................... 112
Table 10: SPLM Anticipated Tariffs increases, 2022 - 2025 ............................................................. 118
Table 11: Summary of spending p/funding source, 30 Apr '22 ........................................................ 120
Table 12: SPLM IDP Complete Project List ...................................................................................... 125
Table 13: IDP Projects Priority & Ward Priorities Addressed........................................................... 135
Table 14: IDP Projects Strategic Alignment .................................................................................... 136
Table 15: IDP Budget Implementation Framework ......................................................................... 137
Table 16: Preliminary IDP Projects Funding per KPA, 2022 - 2025................................................... 138
Table 17: List of Abbreviations ....................................................................................................... 140
Table 18: Detailed IDP Preparation Schedule ................................................................................. 148
LIST OF MAPS
Map 1: SPLM Provincial Locality ...................................................................................................... 58
Map 2: Frances Baard District Local Municipalities Boundaries ........................................................ 58
Map 3: Carters Glen Precinct Plan ................................................................................................... 92
Map 4: Big Hole & Adventure Tourism Precincts .............................................................................. 93
Map 5: Riverton Leisure and Conferencing Precinct ......................................................................... 94
Map 6: Platfontein Heritage Precinct ............................................................................................... 95
Map 7: Kamfersdam Eco-Friendly Precinct Plan ............................................................................... 96
Map 8: SPLM Wards Plan ............................................................................................................... 103

SOL PLAATJE LOCAL MUNICIPALITY INTEGRATED DEVELOPMENT PLAN 2022 - 2027
x
List of Figures
Figure 2: SPLM Human Settlement Patterns .................................................................................... 85
Figure 3: SPLM Township Establishments ........................................................................................ 85
Figure 4: Structure of Council .......................................................................................................... 98
Figure 5: Municipal Organisational Structure ................................................................................... 99
Figure 6: SPLM Political Party Representation (%) .......................................................................... 100
Figure 7: SPLM Councillors Gender Representation ....................................................................... 100
Figure 8: Community Representation of Wards at IDP Meeting ..................................................... 105
Figure 9: Community Participation at IDP Meetings (% of All) ........................................................ 106
Figure 10: IDP Respondent Inputs: Major Categories (% of all inputs) ............................................ 107
Figure 11: All Wards Summarised Inputs ........................................................................................ 107
Figure 12: Ward Specific Priorities per Category, number of responses, Wards 1 -17 ..................... 108
Figure 13: Ward Specific Priorities per Category, number of responses, Wards 17 - 33 .................. 109
Figure 14: Operational revenue: Budget Year 2022/23 .................................................................. 118
Figure 15: Expenditure by type: Budget Year 2022/23 ................................................................... 119
Figure 16: Capex Funding sources: 2022/23 ................................................................................... 119

SOL PLAATJE LOCAL MUNICIPALITY INTEGRATED DEVELOPMENT PLAN 2022 - 2027
xi
FOREWORD BY THE EXECUTIVE MAYOR
South Africa as a nation, held a successful and peaceful local government elections on 01 November
2021 for the fifth administration of local government, post-apartheid.
These local elections were certified to have been free and fair to a larger extent. This is a clear
demonstration of the growth of our young democracy and strengthening of our democratic dividend.
In accordance with the provisions of the laws that govern the affairs of the municipality we have
embarked upon a process of consultation with the local community with a view to present the IDP
and Budget for the 2022/2023 Financial year. Chapter 4 of the Municipal Systems Act 32 of 2000 makes
community participation in the affairs, programmes and activities of the municipality a legal
obligation.
This IDP is therefore a culmination of a lengthy process of consultation with the local community.
Accordingly, this IDP carries the aspirations of the masses of our community which the 2022/2023
Budget must seek to finance. Therefore, this IDP must be seen as a beacon of hope that will continue
to guide us over the next financial year in our collective endeavours of building a better life for all our
communities.
Our 2022/2027 Integrated Development Plan ( IDP) and Budget may not, and dare not, be the same
as the preceding ones as it must reflect the action prescribed by the President, and the inherent reality
that it is the last IDP, before the Local Government Elections, that determines our mandate as a
Municipality.
It is for this reason that this current IDP and Budget must and will be externally focused, driven by
community needs and geared towards meeting community aspirations gleaned from stakeholder
consultations and engagements throughout the past years.
Our IDP therefore, must first and foremost reflect our commitment to goals in our quest to meet the
2021 Local Government Elections Manifesto of the ruling party, which was subsequently adopted as
our guiding light for the Municipality for the five years including the period under review in this IDP,
where we have committed ourselves to delivering the following key deliverables for the next five
years:
We will continue to build an opportunity city that creates an enabling environment for economic
growth and job creation, and to provide assistance to those who need it most.
We will also continue to provide quality services to all residents and serve the residents of Sol Plaatje
in a well-run, corruption-free administration.
Through the IDP, for the next five years, we commit to:
• Contribute actively to the development of our environment, and human and social capital;
• Offer high-quality services to our people and provide support to businesses in our city; and •
Continue to be a leader in local government.
I have no doubt that we will be guided towards greater service delivery excellence during this term of
office, and that we will be making even more progress possible, together.
Best Wishes
Alderman Kagisho Sonyoni
Executive Mayor Sol Plaatje Municipality

SOL PLAATJE LOCAL MUNICIPALITY INTEGRATED DEVELOPMENT PLAN 2022 - 2027
xii
MUNICIPAL MANAGER REMARKS
In the history of the Municipality the 5th Generation Integrated Development Plan (IDP) cycle 2022-
2027 has to be the most challenging and yet the most exciting to draft, and this is due to two reasons.
Firstly, the novel Covid_19 virus has desolated livelihoods of communities, secondly it forced
governments to find innovative was to approach economic recovery and service delivery of which Sol
Plaatje Municipality was no exception to these new-found realities.
This IDP afforded management to pause and reorient the Municipality’s development trajectory in
response to myriad of challenges which bedevils the Municipal. The new vision of the 5th Generation
IDP “TOWARDS A CLEANER GROWING CITY’’ encapsulates these challenges but also offers hope of
total overhaul by embarking on an accelerated provision of economic infrastructure to leverage
private sector investment.
The provision of sustainable uninterrupted service to our communities remains apex priority
throughout by striking a balancing act between social and economic budgetary interface to cushion
the indigent households. Financial viability and sustainability through long term financial planning and
prudent financial management cannot be overemphasised.
A Turnaround Strategy in addressing electrical and water losses have been developed which in turn
will respond to fiscal leakages. The Municipality has introduced Revenue enhancing instruments with
anticipation that they will bolster the collection rate from 72% to 95% by 2027, we just need to build
public trust and confidence.
Corporative Governance we addressing the 5th Generation IDP, it becomes prudent that the
Municipality strategically implements tools for its delivery, inclusive of qualified and skilled human
resource, with targeted skills development for the entire workforce. Monitoring and evaluation of
municipal programmes becomes imperative for realization of this IDP, with annual SDBIPs at the
centre of this. Consequence management underpins success of this IDP.
Mrs. Nomonde Kesiamang
Acting Municipal Manager Sol Plaatje Municipality

SOL PLAATJE LOCAL MUNICIPALITY INTEGRATED DEVELOPMENT PLAN 2022 - 2027
13
CHAPTER 1
INTRODUCTION

SOL PLAATJE LOCAL MUNICIPALITY INTEGRATED DEVELOPMENT PLAN 2022 - 2027
1
1. INTRODUCTION
The Integrated Development Plan (IDP) is the principal strategic instrument of a municipality to give
effect to its developmental role as enshrined by the Constitution of the Republic of South Africa. The
external focus of an IDP is to identify and prioritize the critical developmental challenges of the
community whilst organizing internal governance and institutional structures in order to give effect to
those challenges.
The IDP is a five-year plan which clearly stipulates the vision, mission and strategic objectives of
Council and is reviewed annually to keep track of the ever-changing socio-economic, infrastructural
and environmental dynamics and needs of the communities under the jurisdiction of the municipality.
The IDP guides and informs all planning and development initiatives and forms the basis of Medium-
Term Revenue & Expenditure Framework (MTREF) of Sol Plaatje Municipality. One of key objectives
of Integrated Development Planning is to co-ordinate planning and execution of programmes/projects
across sectors and spheres of government in order to maximize the impact thereof on the livelihoods
of the community.
The IDP process plan seeks to ensure that co-ordination of activities is done within the timeframes as
prescribed in the Municipal Finance Management Act as well as Municipal Systems Act. It aims at
coordinating, integrate and align the strategic processes of the municipality which include the review
of sector plans, review of policies, the IDP, Budget Spatial Development Framework (SDF) and the
Performance Management System (PMS). The process plan incorporates all municipal planning,
budgeting, performance management, public engagement processes and also include the following:
• Programme specifying the time frames for the different planning activities
• Appropriate mechanisms, processes and procedures for consultation and
participation local communities, organs of state, and any other stakeholder’s in the IDP
process
• An indication of the organizational arrangements for the IDP process
• Policy and legislative requirements in respect of Integrated Development Planning
• Mechanisms and procedures for vertical and horizontal alignment
Integrated Development Planning is an elaborate and dynamic process which produces a strategic
plan to guide the municipality to eradicate service delivery backlogs, encourage socio-economic
development, preserve the natural environment as well as address the spatial disparities of
development.
The end result of the process should not only be the drafting of an IDP document but rather the
implementation of programmes & projects in an integrated sustainable manner which will ultimately
create a conducive environment which enhances the socio-economic prosperity for all people in the
Sol Plaatje Municipal Area.
SOL PLAATJE LOCAL MUNICIPALITY INTEGRATED DEVELOPMENT PLAN 2022 - 2027
2
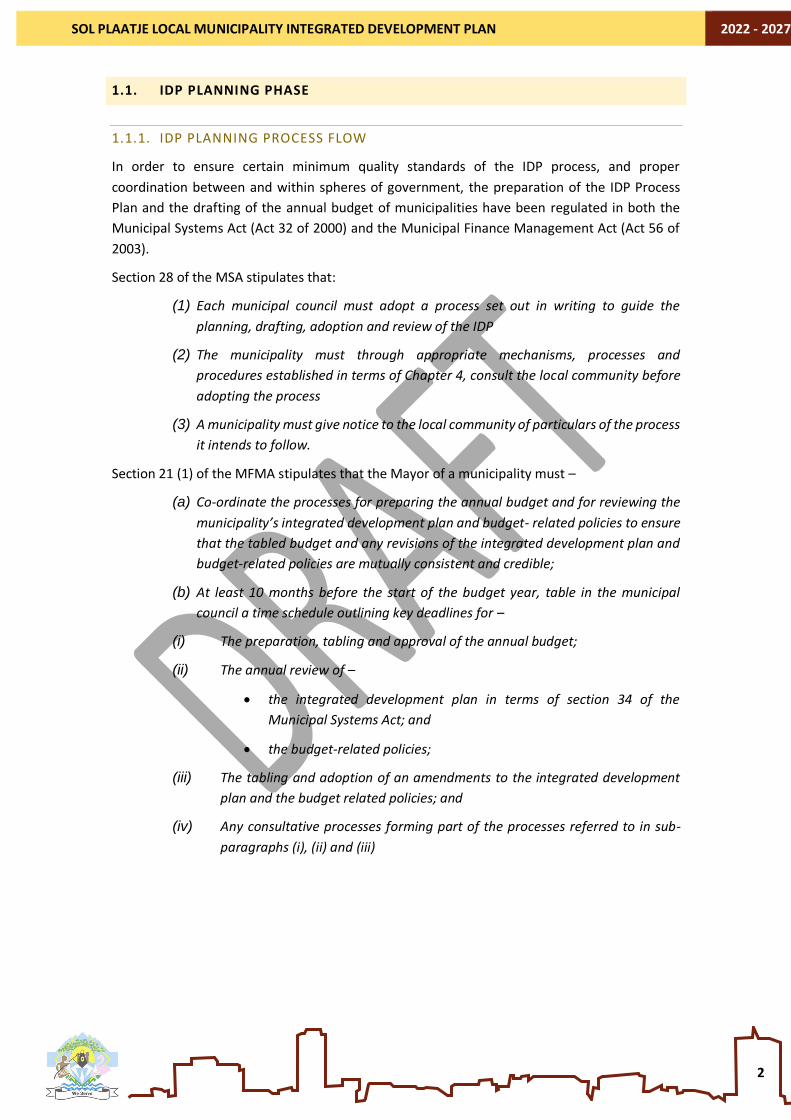
1.1. IDP PLANNING PHASE
1.1.1. IDP PLANNING PROCESS FLOW
In order to ensure certain minimum quality standards of the IDP process, and proper
coordination between and within spheres of government, the preparation of the IDP Process
Plan and the drafting of the annual budget of municipalities have been regulated in both the
Municipal Systems Act (Act 32 of 2000) and the Municipal Finance Management Act (Act 56 of
2003).
Section 28 of the MSA stipulates that:
(1) Each municipal council must adopt a process set out in writing to guide the
planning, drafting, adoption and review of the IDP
(2) The municipality must through appropriate mechanisms, processes and
procedures established in terms of Chapter 4, consult the local community before
adopting the process
(3) A municipality must give notice to the local community of particulars of the process
it intends to follow.
Section 21 (1) of the MFMA stipulates that the Mayor of a municipality must –
(a) Co-ordinate the processes for preparing the annual budget and for reviewing the
municipality’s integrated development plan and budget- related policies to ensure
that the tabled budget and any revisions of the integrated development plan and
budget-related policies are mutually consistent and credible;
(b) At least 10 months before the start of the budget year, table in the municipal
council a time schedule outlining key deadlines for –
(i) The preparation, tabling and approval of the annual budget;
(ii) The annual review of –
• the integrated development plan in terms of section 34 of the
Municipal Systems Act; and
• the budget-related policies;
(iii) The tabling and adoption of an amendments to the integrated development
plan and the budget related policies; and
(iv) Any consultative processes forming part of the processes referred to in sub-
paragraphs (i), (ii) and (iii)

SOL PLAATJE LOCAL MUNICIPALITY INTEGRATED DEVELOPMENT PLAN 2022 - 2027
3
The IDP process consists of 5 phases. Each phase can be broken down into the various steps shown below.
Illustration of different steps or events that need to be followed in the IDP process.
Phase 1: Analysis phase
Need & Demand
Phase 2: Strategy Phase
Bridging the Gap
Given the development priorities identified in the previous phase, the strategies
phase ensured ample opportunity for public debate on the appropriate ways and
means of solving problems. The aim of this phase was to define what benefits the
Municipality need to deliver, as well as what choices and solutions need to be made
to achieve the benefits.
Now that a vision and objective have been set, there is a need to think about how
to reach the objectives. A bridge must therefore be built between the present
situation (issues) and the future (objectives). This is known as strategies.
After building the bridge between the present situation and the future in the
municipality (strategies), there is a need to implement or start to use this bridge.
This is done by identifying appropriate projects and to design these projects. This
phase is also known as the “nuts and bolts” phase.
The analysis phase of the IDP is regarded as the platform of existing trends and
current realities within the municipal area where communities and stakeholders
were given the opportunity to analyze their problems and determine their
priorities. The main purpose of this phase was to form an understanding of the
dynamics influencing development within the framework of people’s priority
needs and knowledge in respect of available resources.
During this phase, several planning steps were followed to analyse developmental
problems/issues, major trends and causing factors as well as the availability and
capacity of resources. To achieve the desired outputs, this phase comprised both a
community analysis as well as a municipal analysis.
Prior to any community involvement, a current reality scan was done which
included the compilation and documentation of all available quantitative (socio-
economic indicators) and qualitative (previous visions, goals, and strategies)
information. This information assisted the community analysis process regarding
the identification of community needs and issues, existing structures, resources
and capacities that would guide the identification of community priorities.

SOL PLAATJE LOCAL MUNICIPALITY INTEGRATED DEVELOPMENT PLAN 2022 - 2027
4
Derived from the strategies and identified projects it was necessary to take the
process yet another step forward by ensuring the detailed design of concrete
and sufficiently specified project proposals. The purpose of this phase was to
create a smooth and effective planning – implementation link by identifying
structures and appropriate roles for implementation as well as designing
mechanisms for financing, implementing, and monitoring of projects within
available resources.
More specifically, the following aspects were considered during the detailed
project design:
Project objectives and performance indicators (quantities and qualities);
• Project outputs, targets, and locations.
• Major activities, responsibilities, and timing.
• Internal and external budget estimates and sources of finance.
The detailed design of the projects was done by special Task Teams related to
the organisational structure of the municipality and included heads of
departments, knowledgeable officials, councillors, professionals, and other
technical and financial experts. It is intended that these Project Task Teams
continue to exist to oversee the implementation and monitoring of projects as
well as to adjust project designs if necessary.
This is the phase where the public is invited to comment on the final IDP. This is
an opportunity for a municipality to go out and again brief communities on the
IDP results, receive comments and amend the document accordingly. A similar
process should be done for sector plans. After this, council can consider the plan
for approval.
Phase 4: Integration
Phase
Sector Plans/
Programmes
During Phase 4 of the IDP, the Municipality had to ensure that the project
proposals from the previous phases were in line with the agreed vision,
objectives and strategies, the resource frames as well as with legal requirements
and government strategies. To arrive at a truly integrated plan for development,
the purpose of this phase was to harmonise the contents of the former phases
into consolidated and integrated programmes for the different departments of
the Municipality as well as for the different sector agencies and/or service
providers.
The integration phase can be seen as a comprehensive operational strategy for
Phase 3: Project Phase
Project Plans
Phase 5: Approval Phase
Final IDP

SOL PLAATJE LOCAL MUNICIPALITY INTEGRATED DEVELOPMENT PLAN 2022 - 2027
5
1.1.2. IDP ANNUAL PLANNING & DRAFTING PROCESS
The table below summarizes the important activities and deliverables to be considered during the different phases of the IDP process, the detailed schedule
is attached as Annexure C:
Table 1: IDP Planning Phase - Key Activities Process Plan
PHASE ACTIVITIES DATES DIRECTORATE/STRUCTURE
Preparation • Establishment of Ward Committees ’14 March – 1April Council
• Amendment of Process Plan 23 March 2022 Office of the Municipal Manager
Analysis
• Conduct a community needs analysis through a comprehensive process of public participation.
• Conduct a socio-economic analysis • Develop ward-based development plans • Conduct an organizational SWOT analysis
29 March – 08 April 2022
Executive Mayor
Mayoral Committee
IDP Manager
All Directorates IDP Unit
Municipal Manager
Strategy
• Develop strategic objectives through a strategic planning session of Council
• Set specific service delivery and development targets • Review all sector plans
09- 15 April 2022
Council
Council
All Directorates
Projects/ Integration
• Develop business plans to effect to the strategic objectives of Council
• Horizontal & vertical alignment of Council strategic objectives with other spheres of government
• Actively participate in relevant inter- governmental engagements
11- 15 April 2022
All Directorates
Municipal Manager
Council All Directorates
Approval • First Draft presented for adoption at council
• Publish for comments on the draft IDP
25 May 2022
27 May 2022
• Executive Mayor • Council

SOL PLAATJE LOCAL MUNICIPALITY INTEGRATED DEVELOPMENT PLAN 2022 - 2027
6
1.1.3. IDP AND BUDGET STEERING COMMITTEE
As part of the IDP and Budget preparation process the Executive Mayor must establish an IDP and
Budget Steering Committee which is constituted as per Section 4 of the Local Government: Budget
and Reporting Regulations as follows:
IDP and Budget steering committee
4. (1) The mayor of a municipality must establish a budget steering committee to
provide technical assistance to the mayor in discharging the responsibilities set
out in section 53 of the Act.
The committee will act as an advisory and support structure to the Executive Mayor in providing a
platform for him to provide political guidance and to monitor any progress made in the IDP and
budget process. The Budget Steering Committee will comprise of the following Councillors and
officials as prescribed in section 4 (2) of the Budget and Reporting Regulations:
1. Executive Mayor;
2. Chairperson of the Finance Portfolio Committee
3. Chairperson of the IDP, Budget and Performance Management Committee
4. Municipal Manager;
5. Chief Financial Officer;
6. Executive Director Infrastructure and Service
7. Executive Director Strategy, Economic Development and Planning
8. Executive Director: Community Services and Social Development
9. Project Management Unit Manager
10. BTO Manager
11. Manager: IDP
1.1.4. TERMS OF REFERENCE FOR THE IDP AND BUDGET STEERING COMMITTEE
The terms of reference or the IDP and Budget Steering Committee are as follows:
• Provides terms of reference for various planning activities
• Commission benchmark / feasibility studies
• Process, summarize and document outputs
• Makes content recommendations
• Prepare, facilitate and document meetings.

SOL PLAATJE LOCAL MUNICIPALITY INTEGRATED DEVELOPMENT PLAN 2022 - 2027
7
1.1.7. IDP REPRESENTATIVE FORUM
1.1.7.1. COMPOSITION OF IDP REPRESENTATIVE FORUM
The IDP Representative Forum is constituted as part of the preparation phase of the IDP and
will continue its functions throughout the IDP Review process. The composition of the IDP
Representative Forum is as follows:
1. Executive Mayor
2. MAYCO members
3. Councillors
4. Ward Committees
5. Community Development Workers (CDW’s)
6. Municipal Manager and Directors
7. Stakeholder representatives of organized sector groups
8. NGO’s
9. Parastatal Organizations
10. Sector specialists
1.1.7.2. WARD COMMITTEES
Ward Committees will be established in each ward as per the prescribed legislation and guidelines
from Department of Local Government. The ward committees will serve as the official advisory and
consultation platform with the community of Sol Plaatje throughout the IDP and Budget process.
The role of the ward committees in respect of the IDP and Budget will be to:
1. Assist the ward councillor to identify service delivery needs and development challenges
2. Prioritize the service needs and development challenges in the w ard
3. Provide a mechanism for discussion and consultation between the stakeholders in the
ward
4. Encourage active participation amongst all the stakeholders in the IDP and Budget
processes
5. Ensure co-operation and constructive interaction between the municipality and the
community
6. Provide m e a n i n g f u l feedback to the community on issues pertaining the ward
7. Assist with the drafting of ward development plans which are incorporated in the IDP
8. Monitor the implementation of projects and programmes in the ward

SOL PLAATJE LOCAL MUNICIPALITY INTEGRATED DEVELOPMENT PLAN 2022 - 2027
8
1.1.7.3. INTERNAL AND EXTERNAL STAKEHOLDERS
There are several stakeholders which need to contribute towards the success of the IDP and
budget processes which can be categorized as follow:
Table 2: Internal Stakeholders
STAKEHOLDERS ROLES AND RESPONSIBILITIES
Council
• Approves and adopt the IDP process plan and budget
timetable
• Approves the IDP and MTREF
• Monitors the implementation of the IDP and budget and
consider any amendments of the plan when necessary
• Allocation and alignment of human resources (organizational
structure) and financial (budget resources for the
implementation of IDP).
Executive Mayor and Mayoral Committee
• Consider the IDP process plan and budget timetable and submit
it to council for approval
• Overall management co-ordination and monitoring of the IDP
and budget process
• Assign and delegate responsibilities to the municipal manager,
CFO, and other relevant senior managers for the implementation
• Submit the draft and final IDP and budget to council for approval
• Provide political guidance in respect of the IDP and budget
process
Speaker • Overall monitoring of the public participation process
• Establishment and oversight of the ward committee system
Ward Councillors
• Liaison between the public and the municipality
• Assist to facilitate meaningful participation by the public and
relevant stakeholders in the IDP and budget process
• Oversee the public meetings and other engagements in their
respective wards
• Monitor the implementation of the programmes/projects
culminating from the IDP and budget in the respective wards
Municipal Manager
• Fulfil the duties and responsibilities of the accounting officer
as per the MFMA
• Managing and coordinating the entire IDP and budget process
as assigned by the executive mayor
• Chairperson of the IDP and budget steering committee
• Establish task teams for the alignment and implementation of
programmes/projects identified in IDP
Chief Financial Officer
• The CFO performs all the budgeting duties as delegated by the
accounting officer in terms of section 81 of the MFMA
• Managing and co-ordinates the entire budgeting process
• Ensures proper alignment between the IDP and budget processes

SOL PLAATJE LOCAL MUNICIPALITY INTEGRATED DEVELOPMENT PLAN 2022 - 2027
9
IDP Manager
• Prepare the IDP process plan and co-ordinate the
implementation thereof
• Manage and co-ordinate the day-to-day activities of the
entire IDP process
• Facilitate effective engagements for public and
stakeholder participation in all wards
• Represent the municipality at inter-governmental
engagements with other spheres of government
• Drafting of all IDP documentation
• Submit the draft IDP to the MEC for comment
• Publish the draft IDP for comment to the public
• Incorporate all comments on the draft IDP for submission to the
municipal manager
• Facilitate alignment between the IDP and budget
• Ensure alignment of the municipal IDP with the IDP framework
of the district municipality;
Senior Managers
• Provide technical and financial information in respect
of analysing the priority issues of communities
• Provide technical and budgetary input in respect of the
development and operational strategies of the
municipality
• Preparation of project proposals and business plans for priority
projects
• Ensure integration all projects and programmes
culminating from the IDP process
• Submit project proposals and business plans to the relevant
authorities for funding and or technical support
• Facilitate the incorporation and updating of all relevant
sector plans into the IDP and the budget
Budget and IDP Steering Committee
• Quality control oversight over the IDP and budget to
ensure proper legislative compliance
• Ensure that the IDP maintains its strategic focus but at the same
time be implementation orientated
• Ensure the active and timeous involvement of all
internal stakeholders in the IDP and budget process
• Provide technical advice and support to the executive
mayor to perform her duties in terms of section 53 of
the MFMA

SOL PLAATJE LOCAL MUNICIPALITY INTEGRATED DEVELOPMENT PLAN 2022 - 2027
10
Table 3: External Stakeholders
STAKEHOLDERS ROLES AND RESPONSIBILITIES
National Government
• National Treasury issues guidelines on the way municipal
councils should prepare and process their annual budgets
• Assist with funding and technical support in respect of projects
and programmes emanating from the IDP process
Provincial Government
• Ensure alignment of the municipal IDP with all the relevant
provincial sector departments
• Facilitate structured inter-governmental engagements
between the municipality and provincial government
• Participate in the IDP processes through local offices
• Assessment and commenting on draft IDP’s to strengthen the
credibility thereof
• Assessment of the MTREF to improve the responsiveness of
the budget to the priority needs of communities
• Provincial Treasury provide guidelines for the preparation and
processing of the municipal budget
• Assist with funding and technical support in respect of projects
and programmes emanating from the IDP process
Frances Baard District
Municipality
• Ensure alignment of the municipal IDP with the district as well
as neighbouring municipalities
• Facilitate district wide IDP engagements to foster cross-border
planning between municipalities in the District
• Facilitate joint planning initiatives between municipalities in
the district with national and provincial spheres of government
Ward Committees
• Serve as an advisory body to the ward Councillor in respect of
the IDP and budget
• Encourage active participation from all stakeholders in their
respective wards
• Identify the critical development needs of the community and
prioritize such needs in their respective wards
• Provide input in the draft IDP and budget
• Monitor the implementation of the programmes/projects
culminating from the IDP and budget in the respective wards
IDP Representative Forum
• Encourage active participation from all stakeholders in their
respective wards
• Serve as an advisory body to the IDP and Budget Steering
Committee
• Facilitate participation of sector representatives and specialists
in the IDP process
• Prioritization municipal-wide community needs and
developmental challenges
General public • Participate meaningfully in the IDP and budget processes of
the municipality

SOL PLAATJE LOCAL MUNICIPALITY INTEGRATED DEVELOPMENT PLAN 2022 - 2027
11
1.1.8. CONTEXT OF PUBLIC PARTICIPATION
The Sol Plaatje Local Municipality has always regarded Integrated Development Planning as a people-driven
process and will again place a high premium on inclusivity and active participation of all relevant
stakeholders in the processing of its IDP and Budget Processes. The public participation process will be
structured in such a way that facilitates community-based planning in order to achieve the following
objectives:
• Identification of the real needs of all communities
• Prioritization of such needs and development challenges
• Collective development of appropriate solutions to address such needs
• Empowerment of the local communities to the ownership for their own development
1.1.9. MECHANISMS FOR PARTICIPATION
1.1.9.1. MEDIA
A vigorous communication and coordination of information sharing or dissemination campaign aimed at
reaching out to all the communities will be undertaken in terms of the annual IDP and Budget process.
The following means of communication will be utilized:
• Municipal Website and intranet;
• Notices at all Municipal offices,
• Municipal newsletters and notices;
• Loud hailing prior to the public meetings
• Adverts in local newspapers
• Radio announcements
• E-mails and bulk SMS’s to all on consolidated municipal database
• Social media platforms (Facebook, Twitter, etc.)
1.1.9.2. PUBLIC ENGAGEMENTS
All venues for public meetings will be selected in a manner that enables easy access for all community
members to attend. The meetings will be ward based but in instances where wards comprise distinctly
geographical and socio-economic different communities, more than one meeting will be held in such
wards in order to maximize participation.
Time chosen for the meetings will also ensure maximum attendance of all the citizens and the meetings
will be conducted in the preferable language in a specific area with interpretation services available. Details
of the meetings will be communicated to stakeholders timeously to maximize participation at meetings. It
is the responsibility of stakeholders to notify the relevant officials at the municipality of any changes
in their contact details or who will represent them at meetings.
1.1.9.3. MAYORAL IMBIZOS
The Executive Mayor will from time to time interact with all communities in the different wards to keep
track of the issues they face as well as give feedback regarding various municipal matters

SOL PLAATJE LOCAL MUNICIPALITY INTEGRATED DEVELOPMENT PLAN 2022 - 2027
12
1.2. LEGISLATIVE ALIGNMENT
The new local government dispensation that emerged in 2000 has seen the emergence of key legislative and
other governance imperatives which by design are aimed at improving the state of local government and as
such service delivery at a local level. Part of these imperatives include the development of Integrated
Development Plans (IDPs). Integrated development planning is a co–ordinating synergistic legal instrument
for municipal planning in South Africa which extends to the national and provincial spheres of government.
The introduction of these imperatives and measures sought to promote the wall-to-wall development of
communities and at the same time ensuring that there is alignment of the community needs to the ever-
decreasing resources in an effort to pursue developmental local government.
The abovementioned reality makes it incumbent upon, the local government sector, that in order for the
attainment of the objectives of the IDP, municipalities would need to consider all the necessary pieces of
legislation and key government processes in an effort to align all resources and interventions into the IDP.
This section of the document explores the various pieces of legislation and appreciates that IDPs are informed
and are done within certain parameters of national, provincial and local government policies, programmes
and initiatives. In this section an analysis on the broad legislative framework within the local government
sphere is conducted and the alignment implications flagged in order for all stakeholders to appreciate the
legislative drive on matters related to the realisation of the objectives of the IDP.
The policies and programmes discussed are by no means the only legislative frameworks to be considered
but gives a general indication of legislation that is linked to matters of developmental local government,
service delivery, employment creation, poverty eradication and economic growth. Taking these frameworks
into consideration when formulating and implementing IDP initiatives will ensure wider government support
and easier access to support instrument from government and donor organisations.

SOL PLAATJE LOCAL MUNICIPALITY INTEGRATED DEVELOPMENT PLAN 2022 - 2027
13
Table 4: Legislation Principles & Alignment Summary
Legislation Key Principles Issues for alignment
Sustainable Development Goals
The Sustainable Development Goals (SDGs) or Global Goals are a collection of 17 interlinked global goals
• GOAL 1: No Poverty
• GOAL 2: Zero Hunger
• GOAL 3: Good Health and Well-being
• GOAL 4: Quality Education
• GOAL 5: Gender Equality
• GOAL 6: Clean Water and Sanitation
• GOAL 7: Affordable and Clean Energy
• GOAL 8: Decent Work and Economic Growth
• GOAL 9: Industry, Innovation and Infrastructure
• GOAL 10: Reduced Inequality
• GOAL 11: Sustainable Cities and Communities
• GOAL 12: Responsible Consumption and Production
• GOAL 13: Climate Action
• GOAL 14: Life Below Water
• GOAL 15: Life on Land
• GOAL 16: Peace and Justice Strong Institutions
• GOAL 17: Partnerships to achieve the Goal
Agenda 2063 AGENDA 2063 is Africa’s blueprint and master plan for transforming Africa into the global powerhouse of the future
• Conducting development and business in the African context
• Exploring the creation of value for African assets and commodities.
Constitution of RSA
Bill of rights
Local Government Sphere
a. Status of Municipalities
b. Objects of local government
c. Development duties
d. Municipalities in Co-operative Government.
• Sol Plaatje Municipality to ensure that the municipal
residents enjoy all rights as enshrined in the bill of
rights.
• Sol Plaatje Municipality to ensure that it complies with
the objects of local government.

SOL PLAATJE LOCAL MUNICIPALITY INTEGRATED DEVELOPMENT PLAN 2022 - 2027
14
The White Paper on Local
Government
The cornerstone of the current local government system.
Foundation for developmental local government
• It is important that Sol Plaatje Municipality provides the
local communities with the required support structures
to local communities in order to obtain job
opportunities through the implementation of
sustainable development programmes.
• Sol Plaatje Municipality must intensify the need for co-
operative government in order to promote socio-
economic development across communities.
Municipal Structures Act
Defines the following:
a. Types and categories of municipalities,
b. division of functions and powers within
municipalities, and
c. the regulation of internal systems
• Sol Plaatje Municipality was therefore established in
terms of Section 12 of this Act.
• This Act fortifies the fact that the Sol Plaatje
Municipality is responsible for the delivery of municipal
services to communities and
• It the duty of Sol Plaatje Municipality to ensure the
delivery of the services according to the powers and
functions for municipalities within its capacity.
Municipal Systems Act
The Municipal Systems Act is part of a series of legislation
which aims to empower local government to fulfil its
Constitutional objects.
The Municipal Systems Act (Act 32 of 2000) lists the duties
of a municipal council, integrated development planning and
performance management systems
In its normal functioning, the Sol Plaatje Municipality must
at all times ensure that it complies with the legislation and
related guidelines on the matters of the various chapters of
this Act
The Municipal Finance
Management Act
The MFMA aims to:
Modernise budget and financial Management practices in
municipalities
• It is important that the Sol Plaatje Municipality adheres
to financial procedures presented in the MFMA when
engaging in financial matters relevant to any
development within the municipality.

SOL PLAATJE LOCAL MUNICIPALITY INTEGRATED DEVELOPMENT PLAN 2022 - 2027
15
It also aims to put in place a sound financial governance
framework, by clarifying and separating the roles and
responsibilities of the mayor or committee, councillors and
officials.
• The MFMA also provides a framework upon which the
resource requirements for this new generation IDP
projects will be undertaken.
• It later takes centre stage during IDP implementation,
where the accounting for the finances and including the
process of the procurement of the projects as reflected
in the IDP and it is expected that the Sol Plaatje
Municipality complies with each prescript and related
circular.
Municipal Demarcation Act
a. The need for integration of areas that belong
together.
b. The need to ensure that all municipalities are
financially viable and have administrative capacity.
c. The need to ensure effective local democracy and
governance, including alignment of government
administrative boundaries.
The boundaries of the municipality and the powers and
functions of the municipality are determined in line with
this piece of legislation and as such periodically, the Sol
Plaatje Municipality will engage in a process of the
assessment of the powers and functions and the
delineation of boundaries.
National Development Plan
a. Providing overarching goals for what we want to
achieve by 2030.
b. Building consensus on the key obstacles to us
achieving these goals and what needs to be done to
overcome those obstacles.
c. Providing a shared long-term strategic framework
within which more detailed planning can take place to
advance the long-term goals set out in the NDP.
d. Creating a basis for making choices about how best to
use limited resources.
In the process of the finalisation of the new generation Sol
Plaatje IDP, due consideration needs to be taken to ensure
that the targets as set out in the NDP are included in this
IDP.

SOL PLAATJE LOCAL MUNICIPALITY INTEGRATED DEVELOPMENT PLAN 2022 - 2027
16
National Spatial Development
Perspective
The NSDP provides a framework within which to discuss the
future development of the National space economy by
reflecting on the localities:
a. of severe deprivation and need,
b. of resource potential,
c. of infrastructure endowment and
d. of current and potential economic activity
The Sol Plaatje Municipality should use NSDP principles
when it needs to make key service delivery and
development related decisions.
Local Government
Turnaround Strategy (LGTAS)
Aim to renew the vision of developmental local government.
The LGTAS seeks to improve the organizational and political
performance of municipalities and in turn the improved
delivery of services.
The goal is to improve the lives of citizens, and progressively
meet their social, economic and material needs, thereby
restoring community confidence and trust in government.
The Sol Plaatje Municipality needs to have a differentiated
intervention system through distinct institutional measures
aimed to facilitate improved delivery of infrastructure and
services and structural, policy, legislative and capacity
building measures over the longer-term.
Northern Cape Provincial
Growth and Development
Plan (2018)
The PGDP offers strategic planning that intends to provide a
strategic framework, sectoral strategies and programmes
aimed at a rapid improvement in the quality of life for the
poorest people of the province. The plan will set out a vision
with quantified and sequenced targets in the areas of
economic growth, employment creation, poverty
eradication and income redistribution until 2040.
Sol Plaatje Municipality needs to ensure vertical alignment
of the key drivers and goals of the PGDP.
Outcome based approach:
Outcomes 8 and 9
Outcome 8
Output 1: Upgrading 400 000 units of accommodation
within informal settlements
Sol Plaatje Municipality needs to provide accommodation
and the provision of serviced sites and as such improve
basic service delivery.

SOL PLAATJE LOCAL MUNICIPALITY INTEGRATED DEVELOPMENT PLAN 2022 - 2027
17
Output 2: Improving access to basic services
Output 3: Facilitate the provision of 600 000
accommodation units within the gap market for people
earning between R3 500 and R12 800
Output 4: Mobilisation of well-located public land for low
income and affordable housing with increased densities on
this land and in general
Outcome 9
Output 1: Implement a differentiated approach to
municipal financing, planning and support
Output 2: Improving access to basic services.
Output 3: Implementation of the Community Work
Programme
Output 4: Actions supportive of the human settlement
outcome.
Output 5: Deepen democracy through a refined Ward
Committee model
Output 6: Administrative and financial capability
Output 7: Single window of coordination
Sol Plaatje Municipality needs to provide for gap market
housing.
Sol Plaatje Municipality needs to develop a Local
Government Turnaround Strategy, develop programmes
for the Community Works Programme.
The Municipality needs to deepen democracy through
Ward Committee Model and the development and
improvement of Administrative and Finance Systems within
the Municipality.
The Integrated Urban
Development Framework
To foster a shared understanding across government and
society about how best to manage urbanisation and achieve
the goals of economic development, job creation and
improved living conditions for our people.
Sol Plaatje Municipality needs to ensure a focus on long
term planning

SOL PLAATJE LOCAL MUNICIPALITY INTEGRATED DEVELOPMENT PLAN 2022 - 2027
18
Northern Cape Provincial
Spatial Development Strategy
The Northern Cape Provincial Spatial Development Strategy
not only gives effect to national spatial development
perspectives, but also makes provision for provincial, district
and local development priorities for the space economy in
the Northern Cape. This provides a means to guide strategic
decisions regarding the location and distribution of
resources in time and geographic space.
Sol Plaatje Municipality should be aware of nodes and/or
corridors to be developed within the municipal area in
order to align the IDP initiatives with these nodes and/or
corridors
Medium Terms Strategic
Framework
a. Strong and inclusive economy,
b. Capable South Africans and
c. Capable developmental state.
• Signing Performance Agreements with Members of the
Mayoral Committees (MMCs)
• Engages through the IDP and other intergovernmental
relations structures with other Sector Departments
Strategic Infrastructure
Projects
The SIPs comprise:
i. Five geographically focused SIPs ii. Three energy SIPs iii. Three spatial SIPs iv. Three social infrastructure SIPs v. Two knowledge SIPs
vi. One regional integration SIP vii. One water and sanitation SIP
Participating in the following SIPs:
• SIP 3: South-Eastern node & corridor development
• SIP 6: Integrated municipal infrastructure project
• SIP 7: Integrated urban space and public transport programme
• SIP 8: Green energy in support of the South African economy
• SIP 9: Electricity generation to support socio-economic development
• SIP 10: Electricity transmission and distribution for all
• SIP 12: Revitalisation of public hospitals and other health facilities
• SIP 13: National school build programme
• SIP 14: Higher education infrastructure
• SIP 15: Expanding access to communication technology
• SIP 18: Water and sanitation infrastructure
Back to Basics Government needs to do things differently if government wants different solutions.
a. Putting people first
b. Delivering basic services
c. Good governance

SOL PLAATJE LOCAL MUNICIPALITY INTEGRATED DEVELOPMENT PLAN 2022 - 2027
19
Government acknowledged that the situation needs a change of paradigm that focuses on serving the people and not political elites and organizations
d. Sound financial management
e. Building capacity
The New Urban Agenda
Linkages between sustainable urbanization and job
creation, livelihood opportunities and improved quality of
life, and it insists on incorporation of all these sectors in
every urban development or renewal policy and strategy
1. Provide basic services for all citizens
2. Ensure that all citizens have access to equal
opportunities and face no discrimination
3. Promote measures that support cleaner cities
4. Strengthen resilience in cities to reduce the risk
and the impact of disasters
5. Take action to address climate change by reducing
their greenhouse gas emissions
6. Fully respect the rights of refugees, migrants and
internally displaced persons regardless of their
migration status
7. Improve connectivity and support innovative and
green initiatives
8. Promote safe, accessible and green public spaces
District Development Model
A new integrated district-based approach to addressing our
service delivery challenges [and] localise[d] procurement
and job creation, that promotes and supports local
businesses, and that involves communities
Have a list of interventions and projects to be
implemented by all Sector Departments and Development
Partners in the Sol Plaatje Municipality
SPLUMA Principles • Spatial Justice
• Spatial Sustainability
• Efficiency
• Spatial Resilience
• Good Administration
• Final land use management scheme and
• The requisite institutional mechanisms and processes
to the realisation of the SPLUMA Principles

SOL PLAATJE LOCAL MUNICIPALITY INTEGRATED DEVELOPMENT PLAN 2022 - 2027
20
State of the Nation Address
2022
Reflects on the progress made in the implementation of the
plans made for the previous year and outline, the
government programme of action for the year ahead
1. Comprehensive Social Compact- Economic
Reconstruction and Recovery Plan (ERRP)
2. Strengthening The Health System
3. Economic Growth and Jobs
4. Electricity- Local Creation of Electricity
5. Digital Migration
6. Small Business Development
7. Water
8. Infrastructure Development
9. Manufacturing Base
10. School Education Infrastructure
11. Climate Change
12. Support To Small-Scale Farmers
13. Fight Against Corruption
14. Safety And Security
15. Fight Against GBVF
State of the Province Address
2022
The Premier held this Address under the theme 'The
People's SOPA"
• Alignment of all plans arising from the State of the
Province address.
• Integrate it into all their plans and this needs to thus
become part of the indicators that the municipality will
be focused on
The Frances Baard IDP
The district Integrated Development Plan mainly focuses on
the following aspects:
• Socio-economic development – especially economic growth, job creation, and poverty eradication, broad based black economic empowerment and environmental development.
Sol Plaatje Municipality needs to ensure alignment of the
key drivers and goals of the District IDP in its new
generation IDP.

SOL PLAATJE LOCAL MUNICIPALITY INTEGRATED DEVELOPMENT PLAN 2022 - 2027
21
• Service delivery, with emphasis on the provision of basic services.
• Governance, specifically as it relates to deepening democracy, thus through the ward committees system, capacity building, etc.
The District Growth and
Development Strategy
The FBDM DGDS is envisaged as a process of collective
planning to improve alignment between spheres of
government and other social partners to impact on poverty
and accelerated shared growth. The FBDM DGDS provides
an action plan to meet the development needs of the
communities within the District.
Sol Plaatje Municipality needs to ensure alignment of the
key focus sectors of the District IDP in its new generation
IDP.
Frances Baard Spatial
Development Framework
The Spatial Development Framework (SDF) of the FBDM
provides the District with development directives regarding
Economic Development Nodes and Economic Growth
Potential of Towns. The SDF makes provision for agro-
processing, mining beneficiation, tourism and tertiary
education nodes within the FBDM spatial perspective.
The Sol Plaatje Municipality needs to align the development
initiatives to these already identified nodes.
Frances Baard Tourism
Strategy
Tourism Strategy is both strategic and tactical response to
challenges faced by the District. Statement of intent and
direction is drawn from the mandate vested in the Northern
Cape’s Tourism Master Plan.
The Sol Plaatje Municipality needs to ensure that the
District Tourism Strategy is used as a cohesive planning
framework for the optimum co-ordination, management
and development of a vibrant tourism sector

SOL PLAATJE LOCAL MUNICIPALITY INTEGRATED DEVELOPMENT PLAN 2022 - 2027
22
1.3. GLOBAL POLICY DIRECTIVES
1.3.1. SUSTAINABLE DEVELOPMENT GOAL
The Sustainable Development Goals (SDGs) or Global Goals are a collection of 17 interlinked global goals. The
SDGs emerged after there was a level of misalignment with the approaches to sustainable development
globally and at the insistence of the then Secretary General of the UN, Kofi Anan, the SDGs were
conceptualized. The SDGs were set up in 2015 by the United Nations General Assembly (UN-GA) and are
intended to be achieved by 2030.
These are included in an UN-GA Resolution called the 2030 Agenda or what is colloquially known as Agenda
2030. The SDGs were developed in the Post-2015 Development Agenda as the future global development
framework to succeed the Millennium Development Goals which were ended in 2015. The 17 SDGs are:
➢ GOAL 1: No Poverty
➢ GOAL 2: Zero Hunger
➢ GOAL 3: Good Health and Well-being
➢ GOAL 4: Quality Education
➢ GOAL 5: Gender Equality
➢ GOAL 6: Clean Water and Sanitation
➢ GOAL 7: Affordable and Clean Energy
➢ GOAL 8: Decent Work and Economic Growth
➢ GOAL 9: Industry, Innovation and Infrastructure
➢ GOAL 10: Reduced Inequality
➢ GOAL 11: Sustainable Cities and Communities
➢ GOAL 12: Responsible Consumption and Production
➢ GOAL 13: Climate Action
➢ GOAL 14: Life Below Water
➢ GOAL 15: Life on Land
➢ GOAL 16: Peace and Justice Strong Institutions
➢ GOAL 17: Partnerships to achieve the Goal
IMPLICATION/S FOR THE IDP:
The Sol Plaatje Municipality as a development institution is central in ensuring that it pursues the SDGs in an
effort to ensure that humanity is developed in a manner that helps realize the principles of Agenda 2030. It
is of particular importance for the municipality to ensure that the approach to development integrates the
17 goals.
1.3.2. THE NEW URBAN AGENDA
The New Urban Agenda is a paradigm shift based on the science of cities and lays out standards and principles
for the planning, construction, development, management and improvement of urban areas. The New Urban
Agenda is intended as a resource for different actors in multiple levels of government and for civil society
organisations, the private sector and all who reside in urban spaces of the world.
The New Urban Agenda highlights linkages between sustainable urbanization and job creation, livelihood
opportunities and improved quality of life, and it insists on incorporation of all these sectors in every urban

SOL PLAATJE LOCAL MUNICIPALITY INTEGRATED DEVELOPMENT PLAN 2022 - 2027
23
development or renewal policy and strategy. The New Urban Agenda works as an accelerator of the
Sustainable Development Goals (SDGs), particularly SDG 11– Make cities and human settlements inclusive,
safe, resilient and sustainable
IMPLICATION/S FOR THE IDP
The Sol Plaatje Municipality should ensure that in service delivery planning, it strives at all costs to:
1) Provide basic services for all citizens
2) Ensure that all citizens have access to equal opportunities and face no discrimination
3) Promote measures that support cleaner cities
4) Strengthen resilience in cities to reduce the risk and the impact of disasters
5) Take action to address climate change by reducing their greenhouse gas emissions
6) Fully respect the rights of refugees, migrants and internally displaced persons regardless of
their migration status
7) Improve connectivity and support innovative and green initiatives
8) Promote safe, accessible and green public spaces
1.3.3. AFRICAN UNION AGENDA 2063
AGENDA 2063 is Africa’s blueprint and master plan for transforming Africa into the global powerhouse of the
future. It is the continent’s strategic framework that aims to deliver on its goal for inclusive and sustainable
development and is a concrete manifestation of the pan-African drive for unity, self-determination, freedom,
progress and collective prosperity pursued under Pan-Africanism and African Renaissance.
Agenda 2063 is important as Africa needs to revise and adapt its development agenda due to ongoing
structural transformations; increased peace and reduction in the number of conflicts; renewed economic
growth and social progress; the need for people centred development, gender equality and youth
empowerment; changing global contexts such as increased globalization and the ICT revolution; the
increased unity of Africa which makes it a global power to be reckoned with and capable of rallying support
around its own common agenda; and emerging development and investment opportunities in areas such as
agri-business, infrastructure development, health and education as well as the value addition in African
commodities.
IMPLICATION/S FOR THE IDP:
The Sol Plaatje Municipality needs to be cognisant of the ideals of Agenda 2063 and such needs to explore
efforts that are aimed at achieving the key outputs of Agenda 63. The Sol Plaatje Municipality is specifically
called to explore the issues of conducting development and business in the African context and exploring the
creation of value for African assets and commodities.

SOL PLAATJE LOCAL MUNICIPALITY INTEGRATED DEVELOPMENT PLAN 2022 - 2027
24
1.4. NATIONAL POLICY FRAMEWORK THE SOUTH AFRICAN CONTEXT
1.4.1. THE CONSTITUTION OF THE REPUBLIC OF SOUTH AFRICA (108) OF 1996
The Constitution (Act 108 of 1996) is the cornerstone for all legislation and policymaking in South Africa.
Chapter 2 of the Constitution focuses on the Bill of Rights and guarantees all South Africans specific rights.
The rights as enshrined in Chapter 2 are linked to the various spheres of government and makes the same
clarion call on local government to be particularly mindful of these rights and at all times ensure the
realization and protection of these rights. Chapter 7 furthermore, defines the role of local government and
details the objectives and duties it must fulfil.
IMPLICATION/S FOR THE IDP:
In terms of Chapter 2, municipalities are supposed to be cognisant of the fact that local government as a
sphere is supposed to make sure that in the process of the development of communities and in delivering
services to communities, they do so affirm the democratic values of human dignity, equality and freedom.
This implies that there is a need to provide quality and reliable services to communities and equally across
municipalities.
Municipalities are legally bound to promote social and economic development within its community. This
implies that public development and investment should largely focus on developing the municipal area in
terms of local economic development and providing for the basic needs of the community. Thus, it is
important that the municipalities provide services, infrastructure, community services, educational
components and business support to area that lack these services or in area where improvements of these
services are required. Very specifically, Chapter 7 is the “bible” for local government because it details, the
following:
a. Status of Municipalities
b. Objects of local government
c. Development duties
d. Municipalities in Co-operative Government.
1.4.2. MUNICIPAL SYSTEMS ACT, NO 32 OF 2000
The Municipal Systems Act is part of a series of legislation which aims to empower local government to fulfil
its Constitutional objects. The Municipal Systems Act (Act 32 of 2000) lists the duties of a municipal council,
within its financial and administrative capacity, as follows in Section 4(2):
• Exercise the municipality’s executive and legislative authority and use the resources of the
municipality in the best interest of the local community.
• Provide, without favour or prejudice, democratic and accountable government.
• Encourage the involvement of the local community
• Strive to ensure that municipal services are provided to the local community in a financially and
environmentally sustainable manner.
• Consult the local community about
o The level, quality, range and impact of municipal services provided by the municipality, either
directly or through another service provider; and
o The available options for service delivery.

SOL PLAATJE LOCAL MUNICIPALITY INTEGRATED DEVELOPMENT PLAN 2022 - 2027
25
• Give member of the local community equitable access to the municipal services to which they
are entitled.
• Promote and undertake development in the municipality.
• Promote gender equity in the exercise of the municipality’s executive and legislative authority.
• Promote a safe and healthy environment in the municipality.
• Contribute, together with other organs of state, to the progressive realisation of the fundamental
rights contained in sections 24, 25, 26, 27 and 29 of the Constitution.
Chapter 5 of the Municipal Systems Act exclusively addresses the matter of integrated development
planning. Chapter 5 states that:
Each municipal council must, within a prescribed period after the start of its elected term, adopt a single,
inclusive, and strategic plan for the development of the municipality which –
1. Links, integrates and coordinates plans, and takes into account proposals for the development
of the municipality;
2. Aligns the resources and capacity of the municipality with the implementation of the plan;
3. Forms the policy framework and general basis on which annual budgets are based;
4. Complies with the provisions of this Chapter; and
5. Is compatible with the national and provincial development plans and planning
requirements binding on the municipality in terms of legislation
Chapter 6 of the Municipal Systems Act seeks to ensure accountability on the IDP, by detailing performance
management systems for municipalities. This Chapter is very important as it is at the centre of ensuring that
local government actually works, and the promises made during the IDP process are kept and accounted for.
IMPLICATION/S FOR THE IDP
The Municipal Systems Act legally binds the municipalities to fulfil its duties and produce an IDP that will
actively drive the socio-economic development of communities within the municipalities.
1.4.3. MUNICIPAL STRUCTURES ACT, 117 OF 1998
The Municipal Structures Act of 1998 defines types and categories of municipalities, division of functions and
powers within municipalities, and the regulation of internal systems. Alternatively, the Municipal Systems
Act of 2000 provides municipalities with guidelines which ‘enable municipalities to move progressively
towards the social and economic upliftment of local communities’ so that basic services may be met.
IMPLICATION/S FOR THE IDP
Section 12 of the Municipal Structures Act seeks to detail the process for the establishment of municipalities.
Sol Plaatje Municipality was therefore established in terms of this process. According to the Municipal
Structures Act, local municipalities are responsible for the delivery of municipal services. It the duty of local
municipalities to ensure the services according to the powers and functions of each municipality are
delivered and reliably.

SOL PLAATJE LOCAL MUNICIPALITY INTEGRATED DEVELOPMENT PLAN 2022 - 2027
26
1.4.4. MUNICIPAL FINANCE MANAGEMENT ACT, NO 56 OF 2 003
The Municipal Finance Management Act (MFMA) aims to modernise budget and financial Management
practices in municipalities in order to maximise the capacity of municipalities to deliver services to all their
residents, customers and users. It also aims to put in place a sound financial governance framework, by
clarifying and separating the roles and responsibilities of the mayor or committee, councillors and officials.
The MFMA empowers the mayor (or executive committee) to provide political leadership by taking
responsibility for policy and outcomes and holds the municipal manager and other Senior managers
responsible for implementation and outputs. Councillors are empowered to play a key policy approval and
monitoring role through the municipal council. The MFMA also aims to enable managers to manage, but to
make them more accountable.
All these various roles are possible because of the stringent reporting requirements of the MFMA. The
challenge facing all stakeholders is their capacity to use the management information produced in terms of
the MFMA to improve the efficiency and effectiveness of the municipality.
The MFMA is required by the Constitution, which obligates all three spheres of government to be transparent
about their budgets and financial affairs. It also forms an integral part of the broader reform package for local
government outlined in the White Paper on Local Government in 1998. The MFMA must be read together
with other local government legislation, particularly the Municipal Systems Act, to ensure alignment of IDPs,
budgets, performance systems and governance across municipal entities.
IMPLICATION/S FOR THE IDP
It is important that the municipalities adhere to financial procedures presented in the MFMA when engaging
in financial matters relevant to any development within the municipality. The MFMA also provides a
framework upon which the resource requirements for the IDP projects will be undertaken. It later takes
centre stage during IDP implementation, where the accounting for the finances and including the process of
the procurement of the projects as reflected in the IDP.
1.4.5. THE WHITE PAPER ON LOCAL GOVERNMENT
This policy is the cornerstone of the current local government milieu. It places upon local government the
imperative to be developmental in outlook, structure and function. It identifies local government’s
responsibilities with regard to growth and development. This in many respects sets the tone for the way in
which all stakeholders involved in local government must act and interact with the sphere in general.
IMPLICATION/S FOR THE IDP:
The White Paper has a direct impact on the development, policy formulation and human resource
development projects of the local municipality. It emphasises the need for and importance of local municipal
support to communities through training and development and other support systems.
It is important that the municipalities provide the local communities with the required support structures
but also providing the local communities with the required skills in order to obtain job opportunities through
the implementation of sustainable development programmes and/or promoting possible empowerment
programmes to the local communities. It entrenches the concept of developmental local government and
further intensifies the need for co-operative government in to promote socio-economic development across
communities.

SOL PLAATJE LOCAL MUNICIPALITY INTEGRATED DEVELOPMENT PLAN 2022 - 2027
27
1.4.6. THE INTERGOVERNMENTAL RELATIONS FRAMEWORK ACT, ACT 13 OF 2005
The purpose of this Act is to establish a framework for the national government, provincial governments and
local governments to promote and facilitate intergovernmental relations. It further seeks to provide for
mechanisms and procedures to facilitate the settlement of intergovernmental disputes and to provide for
matters connected therewith. In the case for the IDP, it seeks to ensure that there is intergovernmental
cooperation in the planning, implementation and even monitoring of the efforts around the IDPs of
municipalities.
IMPLICATION/S FOR THE IDP
The municipalities need to appreciate the existence of the structures and fora, established under the auspices
of this piece of legislation. In this regard, particular cognisance needs to be discharged to maximisation of
the effect of IDP through, the Premier's Intergovernmental Forum, the Provincial and District IDP Fora,
District IGR Fora and all committees and subcommittees consequent thereto. Particular care needs to be
exercised towards intra and inter sphere relations when implementing the IDP in order to ensure that there
is developmental harmony.
1.4.7. MUNICIPAL DEMARCATION ACT 27 OF 1998
The objectives listed of this Act can be summed up into three broad principles:
a. The need for integration of areas that belong together.
b. The need to ensure that all municipalities are financially viable and have administrative capacity.
c. The need to ensure effective local democracy and governance, including alignment of
government administrative boundaries.
IMPLICATION/S FOR THE IDP
This piece of legislation is critical as it seeks to determine for the processes of planning and even the
implementation of services, the extent to which a municipality needs to spatially lay out the municipal
boundaries. It further is important as it determines the various boundaries of the wards, for purposes of
ward-based planning and even reporting.
1.4.8. THE NDP 2030
The National Development Plan (NDP) offers a long-term perspective. It defines a desired destination and
identifies the role different sectors of society need to play in reaching that goal. The NDP aims to eliminate
poverty and reduce inequality by 2030. According to the plan, South Africa can realise these goals by drawing
on the energies of its people, growing an inclusive economy, building capabilities, enhancing the capacity of
the state, and promoting leadership and partnerships throughout society.
It is a long-term strategic plan, that serves four broad objectives:
a. Providing overarching goals for what we want to achieve by 2030.
b. Building consensus on the key obstacles to us achieving these goals and what needs to be done to
overcome those obstacles.
c. Providing a shared long-term strategic framework within which more detailed planning can take
place to advance the long-term goals set out in the NDP.
d. Creating a basis for making choices about how best to use limited resources.

SOL PLAATJE LOCAL MUNICIPALITY INTEGRATED DEVELOPMENT PLAN 2022 - 2027
28
The NDP identified a failure to implement policies and an absence of broad partnerships as the main reasons
for slow progress, and set out nine primary challenges:
a. Too few people work
b. The quality of school education for black people is poor
c. Infrastructure is poorly located, inadequate and under-maintained
d. Spatial divides hobble inclusive development
e. The economy is unsustainably resource intensive
f. The public health system cannot meet demand or sustain quality
g. Public services are uneven and often of poor quality
h. Corruption levels are high
i. South Africa remains a divided society.
The NDP identified set the following vision for 2030:
1. Eliminate income poverty – Reduce the proportion of households with a monthly income below
R419 per person (in 2009 prices) from 39 percent to zero.
2. Reduce inequality – The Gini coefficient should fall from 0.69 to 0.6.
3. Produce sufficient energy to support industry at competitive prices, ensuring access for poor
households, while reducing carbon emissions per unit of power by about one-third.
4. Ensure that all South Africans have access to clean running water in their homes.
5. Make high-speed broadband internet universally available at competitive prices.
6. Realise a food trade surplus, with one-third produced by small-scale farmers or households.
7. Ensure household food and nutrition security.
8. Entrench a social security system covering all working people, with social protection for the poor
and other groups in need, such as children and people with disabilities.
9. Realise a developmental, capable and ethical state that treats citizens with dignity.
10. Ensure that all people live safely, with an independent and fair criminal justice system.
11. Broaden social cohesion and unity while redressing the inequities of the past.
12. Play a leading role in continental development, economic integration and human rights.
IMPLICATION/S FOR THE IDP
The implications of the NDP for the process are that the municipalities must take these various and respective
targets of the NDP into cognisance to ensure that the development of the local municipalities achieves the
vision of the NDP.
1.4.9. NATIONAL SPATIAL DEVELOPMENT PERSPECTIVE (NSDP), 2006
The NSDP provides a framework within which to discuss the future development of the National space
economy by reflecting the localities of severe deprivation and need, of resource potential, of infrastructure
endowment and of current and potential economic activity by describing the key social, economic and
natural resource trends and issues shaping the National geography.
IMPLICATION/S FOR THE IDP
The NSDP principles, state that economic growth should be a pre-requisite for the achievement of other
policy objectives, key among which would be poverty alleviation. It further states that efforts to address past
and current social inequalities should focus on people not places.

SOL PLAATJE LOCAL MUNICIPALITY INTEGRATED DEVELOPMENT PLAN 2022 - 2027
29
1.4.10. LOCAL GOVERNMENT TURNAROUND STRATEGY ( LGTAS)
One of the main aims of the Turnaround Strategy is to renew the vision of developmental local government.
To do this the LGTAS seeks to improve the organizational and political performance of municipalities and in
turn the improved delivery of services. The goal is to improve the lives of citizens, and progressively meet
their social, economic and material needs, thereby restoring community confidence and trust in government.
IMPLICATION/S FOR THE IDP
The LGTAS thus impresses upon municipalities, the need for them to have a differentiated intervention
system through distinct institutional measures aimed to facilitate improved delivery of infrastructure and
services and structural, policy, legislative and capacity building measures over the longer-term.
1.4.11.THE INTEGRATED URBAN DEVELOPMENT FRAMEWORK
The Integrated Urban Development Framework (IUDF) seeks to foster a shared understanding across
government and society about how best to manage urbanisation and achieve the goals of economic
development, job creation and improved living conditions for our people.
Dubbed “the new deal for cities”, and grounded in the economic history of humanity, urbanisation has always
been an accelerator of growth and development, bringing about enormous changes in the spatial distribution
of people and resources, and in the use and consumption of land. The key outcome of the IUDF is spatial
transformation. The identified policy levers and priorities are crucial for maximising the potential of urban
areas, by integrating and aligning investments in a way that improves the urban form.
IMPLICATION/S FOR THE IDP
The Sol Plaatje Municipality needs to recognise and accept that there a number of people already living in
urban areas and the statistics would rise to 71% by 2030. By 2050, eight in 10 people would be living in urban
areas and this would increase demand on basic infrastructure requirements. This detail calls on the Sol Plaatje
Municipality to focus on long term planning which will ensure that the Municipality is responsive to the
demands of an increasing population both in terms of space and development.
1.4.12.THE MEDIUM-TERM STRATEGIC FRAMEWORK
This Medium Term Strategic Framework (MTSF) is Government's strategic plan for the 2019-2024 electoral
term. It reflects the commitments made in the election manifesto of the governing party, including the
commitment to implement the NDP. The MTSF 2019-2024 is built on three foundational pillars:
a. a strong and inclusive economy,
b. capable South Africans and
c. a capable developmental state.
The 6th administration adopted these key pillars out of the recognition and realisation that the end of the
National Development Plan is within 8 years (in 2022) and there is a need for government to accelerate the
delivery of Vision 2030. To this effect, the emphasis is to improve the capacity of both the state and society
at large in order to get all hands on deck. The MTSF creates for the development of Performance Agreements
(PAs) which will enable the President to hold his Cabinet accountable for the implementation of the MTSF
2019 - 2024 and PAs will be derived from seven key priority areas that will guide government work for the
year.

SOL PLAATJE LOCAL MUNICIPALITY INTEGRATED DEVELOPMENT PLAN 2022 - 2027
30
IMPLICATION/S FOR THE IDP
The Sol Plaatje Municipality needs to adopt some of the planning principles of the Medium Terms Strategic
Framework. There may be value in the Executive Mayor, signing Performance Agreements with Members of
the Mayoral Committees (MMCs) in order for the MMCs to improve their oversight responsibilities, and of
course this notwithstanding the ordinary Performance Management System that are currently in place.
The Sol Plaatje Municipality needs to also ensure that it engages through the IDP and other
intergovernmental relations structures with other Sector Departments on how they are planning to
accelerate the 3 pillars of the MTSF and in the process, the SPM needs to work tirelessly towards the
realisation of the 3 pillars within the Municipality.
1.4.13.THE OUTCOMES APPROACH (12 OUTCOMES)
The Outcomes based approach to development in the country was developed when the President of the
country signed performance agreements with all Cabinet Ministers. In these performance agreements,
Ministers are required to establish an Implementation Forum for each of the outcomes. In each
implementation forum Ministers and all other parties responsible for delivering on an outcome, are required
to develop a delivery agreement. All departments, agencies and spheres of government involved in the direct
delivery process required to achieve the outputs. In this regard, and very specifically, Outcomes 8 and 9
require that:
OUTCOME 8: SUSTAINABLE HUMAN SETTLEMENTS AND AN IMPROVED QUALITY OF HOUSEHOLD
LIFE
o Output 1: Upgrading 400 000 units of accommodation within informal settlements
o Output 2: Improving access to basic services
o Output 3: Facilitate the provision of 600 000 accommodation units within the gap market for
people earning between R3 500 and R12 800
o Output 4: Mobilisation of well-located public land for low income and affordable housing with
increased densities on this land and in general
OUTCOME 9: RESPONSIVE, ACCOUNTABLE, EFFECTIVE AND EFFICIENT LOCAL GOVERNMENT
SYSTEM
o Output 1: Implement a differentiated approach to municipal financing, planning and support
o Output 2: Improving access to basic services.
o Output 3: Implementation of the Community Work Programme
o Output 4: Actions supportive of the human settlement outcome.
o Output 5: Deepen democracy through a refined Ward Committee model
o Output 6: Administrative and financial capability
o Output 7: Single window of coordination
IMPLICATION/S FOR THE IDP
This IDP would need to be cognisant of the need for the need for the Sol Plaatje Municipality to provide
accommodation and the provision of serviced sites and as such improve basic service delivery. Outcome 8
takes into specific account the need for municipalities to provide for gap market housing. Outcome 9 further
gives emphasis to programmes such as the Local Government Turnaround Strategy, the Community Works
Programme, Human Settlements Outcome and Deepening democracy through Ward Committee Model and
the development and improvement of Administrative and Finance Systems at local government.

SOL PLAATJE LOCAL MUNICIPALITY INTEGRATED DEVELOPMENT PLAN 2022 - 2027
31
1.4.14.STRATEGIC INFRASTRUCTURE PROJECTS
The SIPs cover social and economic infrastructure across all nine provinces (with an emphasis on lagging
regions). The SIPs include catalytic projects that can fast-track development and growth. Work is being
aligned with key cross-cutting areas, namely human settlement planning and skills development. The SIPs
comprise:
i. Five geographically focused SIPs
ii. Three energy SIPs
iii. Three spatial SIPs
iv. Three social infrastructure SIPs
v. Two knowledge SIPs
vi. One regional integration SIP
vii. One water and sanitation SIP
IMPLICATION/S FOR THE IDP
The Sol Plaatje Municipality needs to align its plans and actively activate processes aimed at participating in
the following SIPs:
➢ SIP 3: South-Eastern node & corridor development
➢ SIP 6: Integrated municipal infrastructure project
➢ SIP 7: Integrated urban space and public transport programme
➢ SIP 8: Green energy in support of the South African economy
➢ SIP 9: Electricity generation to support socio-economic development
➢ SIP 10: Electricity transmission and distribution for all
➢ SIP 12: Revitalisation of public hospitals and other health facilities
➢ SIP 13: National school build programme
➢ SIP 14: Higher education infrastructure
➢ SIP 15: Expanding access to communication technology
➢ SIP 18: Water and sanitation infrastructure
1.4.15.BACK TO BASICS
The back-to-basics programme was initiated after the realisation that government needs to do things
differently if government wants different solutions. Government acknowledged that the situation needs a
change of paradigm that focuses on serving the people and not political elites and organizations. This is the
essence of our ‘back to basics’ approach. The back-to-basics programme expects municipalities to:
• Put people and their concerns first and ensure constant contact with communities through effective
public participation platforms.
• Create conditions for decent living by consistently delivering municipal services to the right quality
and standard. This includes planning for and delivery of infrastructure and amenities, maintenance
and upkeep, including the budgeting to do this.
• Ensure no failures in services and where there are, restore with urgency.
• Be well governed and demonstrate good governance and administration - cut wastage, spend public
funds prudently, hire competent staff, ensure transparency and accountability.

SOL PLAATJE LOCAL MUNICIPALITY INTEGRATED DEVELOPMENT PLAN 2022 - 2027
32
• Ensure sound financial management and accounting, and prudently manage resources so as to
sustainably deliver services and bring development to communities.
• Build and maintain sound institutional and administrative capabilities administered and managed by
dedicated and skilled personnel at all levels.
IMPLICATION/S FOR THE IDP
The Sol Plaatje Municipality needs to ensure that the Municipality institutionalises their performance
management system to effect the changes that are require in the system. The Sol Plaatje Municipality will
need to develop and finalize a set of indicators as per the pillars of the Back-to Basics approach. These
indicators will measure whether municipalities are performing in terms of the ‘basics’, namely:
a. Putting people first
b. Delivering basic services
c. Good governance
d. Sound financial management
e. Building capacity
1.4.16.MFMA CIRCULAR NO. 88
The circular aims to support the alignment of planning and reporting instruments for a prescribed set of
municipal performance indicators. The Municipal Systems Act (MSA) and the MFMA require alignment
between planning and reporting instruments such as the Integrated Development Plan (IDP), the Service
Delivery and Budget Implementation Plan (SDBIP) and the Annual Report.
This circular aim prescribes municipal performance indicators for municipalities. In providing guidance and
conceptual clarity and alignment between the IDP, SDBIP and the performance part of the Annual Report,
this MFMA Circular lays out the conceptual benefit for all municipalities. The content of this circular has been
informed by a performance reporting reform initiative undertaken by National Treasury, in collaboration with
the Department of Cooperative Governance, the Department of Planning, Monitoring and Evaluation,
Statistics South Africa and in consultation with the Auditor-General of South Africa, amongst others.
The intention of this reform is to rationalise the reporting requirements of municipalities. It was identified
early on in this reform initiative that rationalising the reporting requirements of municipalities necessitates
clarification and resolution of inconsistencies in the statutory requirements of the IDP, SDBIP and the
performance part of the Annual Report.
IMPLICATION/S FOR THE IDP
The Sol Plaatje Municipality would need to understand that total set of indicators and align the indicators in
order to relevance to the Municipality and capacity of the Municipality. This process forces the Municipality
to align these indicators with the IDP and the Service Delivery and Budget Implementation Plan (SDBIP).

SOL PLAATJE LOCAL MUNICIPALITY INTEGRATED DEVELOPMENT PLAN 2022 - 2027
33
1.4.17.STATE OF THE NATION ADDRESS 2022
The President of the Republic of South Africa is in law not a Member of Parliament and the State of the Nation
Address is one mechanism of accountability to Parliament and by implication the country at large. Annually,
the President causes for the Speaker of Parliament to call for a joint sitting of both Houses of Parliament in
order to appraise them Parliament on the State of the Nation. In the State of the Nation Address, the
President reflects on the progress made in the implementation of the plans made for the previous year and
outline, the government programme of action for the year ahead. These plans, then get translated into plans
across all 3 spheres of government.
IMPLICATION/S FOR THE IDP
The Sol Plaatje needs to partner with provincial and national governments in the following programmes:
a. Comprehensive Social Compact- Economic Reconstruction and Recovery Plan (ERRP)
b. Strengthening The Health System
c. Economic Growth and Jobs
d. Electricity- Local Creation of Electricity
e. Digital Migration
f. Small Business Development
g. Water
h. Infrastructure Development
i. Manufacturing Base
j. School Education Infrastructure
k. Climate Change
l. Support To Small-Scale Farmers
m. Fight Against Corruption
n. Safety And Security
o. Fight Against GBVF
1.4.18.THE DISTRICT DEVELOPMENT MODEL
The District Development Model (DDM) was initiated by President Cyril Ramaphosa in his State of the Nation
Address in 2019. Subsequently, the District Development Model was adopted by Cabinet, the 2019
Presidential Coordinating Council (PCC), the March 2020 extended PCC and various MINMECs. The District
Development Model and approach was identified out of the “pattern of operating in silos” which leads to
lack of coherence in planning and implementation and has made monitoring and oversight of government’s
programme difficult. The consequence of the incoherence has been non-optimal delivery of services and
diminished impact on the triple challenges of poverty, inequality and employment.
The District Development Model calls for the rolling out of a new integrated district-based approach to
addressing our service delivery challenges and localised procurement and job creation, that promotes and
supports local businesses, and that involves communities. To this extent, Cabinet appointed District
Champions for all 52 Districts across the country and to this extent they have set up technical and political
structures to oversee the coordination of the approach across the country.

SOL PLAATJE LOCAL MUNICIPALITY INTEGRATED DEVELOPMENT PLAN 2022 - 2027
34
IMPLICATION/S FOR THE IDP
The Sol Plaatje Municipality should in this regard, have due consideration for processes related to the DDM
and in this regard, this IDP should have a list of interventions and projects to be implemented by all Sector
Departments and Development Partners in the Sol Plaatje Municipal space.
1.4.19.SPLUMA PRINCIPLES
Historically each province had its own set of Acts governing land use within its boundaries. SPLUMA unifies
all the provinces under one national legislation. SPLUMA replaced a number of Acts such as Removal of
Restrictions Act 84 of 1967, Physical Planning act 88 of 1967, Less Formal Township Establishment Act 113 of
1991, The Physical Planning Act 125 of 1991 and the Development Facilitations Act 67 of 1995.
Each Municipality must approve and adopt a single land use management scheme for its entire area within
5 years from the commencement date of SPLUMA. The commencement date was 1 July 2015 and as such
each Municipality was required to adopt its land use management scheme by 1 July 2020. The purposes of a
land use scheme are to promote economic growth, social inclusion, efficient land development and a minimal
impact on public health, the environment and natural recourses. SPLUMA has the following principles:
• Spatial Justice
• Spatial Sustainability
• Efficiency
• Spatial Resilience
• Good Administration
IMPLICATION/S FOR THE IDP
The Sol Plaatje Municipality should have adopted a final land use management scheme and have the requisite
institutional mechanisms and processes to the realisation of the SPLUMA Principles. Further to this, the Sol
Plaatje Municipality needs to municipalities to enact spatial planning and land use management by-laws

SOL PLAATJE LOCAL MUNICIPALITY INTEGRATED DEVELOPMENT PLAN 2022 - 2027
35
1.5. PROVINCIAL POLICIES
1.5.1. NORTHERN CAPE PROVINCIAL GROWTH AND DEVELOPMENT PLAN (2018)
The PGDP offers strategic planning that intends to provide a strategic framework, sectoral strategies and
programmes aimed at a rapid improvement in the quality of life for the poorest people of the province. The
plan will set out a vision with quantified and sequenced targets in the areas of economic growth, employment
creation, poverty eradication and income redistribution until 2040. This document is a strategic management
tool, not just for government, but especially for the Northern Cape people. It is envisioned that the PGDP will
lead to a concerted effort in achieving Vision 2040.
The PGDP Conceptual Framework consists of drivers of change, with delivery envisaged as being staggered
across the short, medium and long term. These drivers are intricately interrelated, with causality viewed as
complex and situation-specific, rather than being linear in nature. The drivers of change represent the focal
point of the Framework. The drivers of change spurred a diagnostic analysis, which shed light on the spatial
realities and development issues facing the province.
Based on the outcomes of the diagnostic analysis, paths to prosperity were identified and it is expected that
these will be the drivers that will place the Northern Cape Province on a new sustainable development
trajectory towards the 14 National Development Outcomes envisaged by government.
IMPLICATION/S FOR THE IDP
It is necessary for the municipalities to work in conjunction with the Northern Cape Provincial government
to vertically align the drivers and goals to those of local municipal IDPs.
1.5.2. NORTHERN CAPE PROVINCIAL SPATIAL DEVELOPMENT STRATEGY ,2018
The Northern Cape Provincial Spatial Development Strategy not only gives effect to national spatial
development perspectives, but also makes provision for provincial, district and local development priorities
for the space economy in the Northern Cape. This provides a means to guide strategic decisions regarding
the location and distribution of resources in time and geographic space.
IMPLICATION/S FOR THE IDP
Key issues that are addressed by the Spatial Development Strategy are:
• Established growth centres,
• Emerging growth centres,
• Stagnating small towns,
• Land Reform areas,
• Development corridors and Special resource areas.
It would be important for the municipality to be aware of nodes and/or corridors to be developed within the
municipal area in order to align the LED initiatives with these nodes and/or corridors.

SOL PLAATJE LOCAL MUNICIPALITY INTEGRATED DEVELOPMENT PLAN 2022 - 2027
36
1.5.3. STATE OF THE PROVINCE ADDRESS
The State of the Province Address (SOPA) happens annually in a similar fashion to the State of the Nation
Address, with the only difference being that the process takes a provincial perspective. In this regard, the
Premier of the Northern Cape, Dr. Zamani Saul delivered his third the State of the Province Address (SOPA)
under the theme 'The People's SOPA" on the 24th of February 2022 in Upington.
The highlights of the SOPA are:
a) When the sixth administration started in 2019 the GDP of the province was R 96 billion and now it
stands at R 107 billion,
b) The economy grew under the COVID-19 environment and thereby created job opportunities; hence
the Northern Cape has the lowest official unemployment rate in the country according to StatsSA
Quarterly Labour Force Survey for the 3rd quarter of 2021,
c) After four years the province managed to close the 2021/2022 Financial Year on a positive bank
balance of more than R300 million,
d) There is an improvement in the Grade 12 results, and this is a tangible indicator of the general
improvements in public education,
e) The Government created collaborative efforts with law enforcement agents which led to the
establishment of the SIU Offices in the province and this is accompanied by an increase in the number
of corruption cases which are being investigated and the number of arrests,
f) All the state driven work and training opportunities for young people in the province amounts to ±
26 000 job opportunities,
g) The Province has the lowest COVID-19 deaths per 100 000 people, which is an indicator of the general
improvement of the capacity of our public health system,
h) There is an increased number of people in the province that now have access to third and fourth
generation of wireless mobile telecommunications technology and this is due to the more than half
a billion rand investment in the province by MTN and Vodacom,
i) Government procurement to local enterprises increased from 34% in 2019 and it is standing at 47%
now; translated in rand and cents, it is more than R1.2 billion,
j) Through collaborative efforts with communities there is significant decreases in GBVF cases in the
province, and
k) Increased spending on social infrastructure, with more rural roads upgraded.
IMPLICATION/S FOR THE IDP
The Sol Plaatje Municipality needs to take into account all plans arising from the State of the Province address
and integrate it into all their plans and this needs to thus become part of the indicators that the municipality
will be focused on. The DDM Technical Committee will also align these commitments to the plans of the
various local authorities.
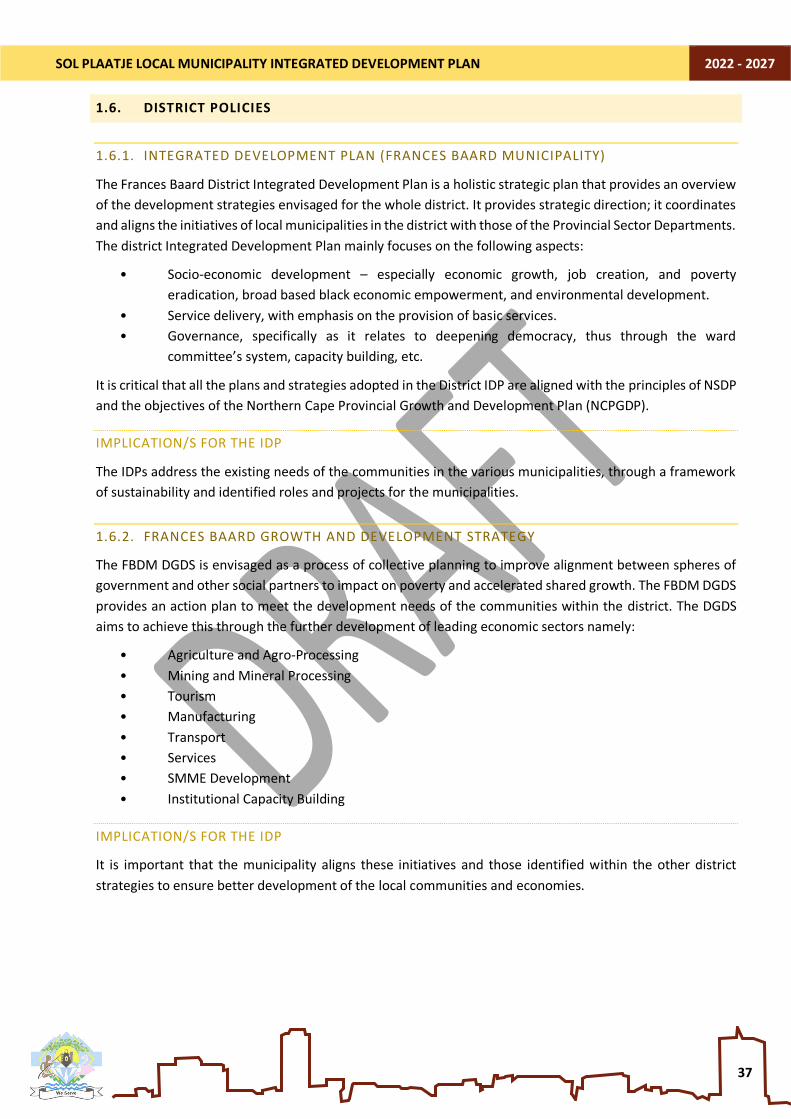
SOL PLAATJE LOCAL MUNICIPALITY INTEGRATED DEVELOPMENT PLAN 2022 - 2027
37
1.6. DISTRICT POLICIES
1.6.1. INTEGRATED DEVELOPMENT PLAN (FRANCES BAARD MUNICIPALITY)
The Frances Baard District Integrated Development Plan is a holistic strategic plan that provides an overview
of the development strategies envisaged for the whole district. It provides strategic direction; it coordinates
and aligns the initiatives of local municipalities in the district with those of the Provincial Sector Departments.
The district Integrated Development Plan mainly focuses on the following aspects:
• Socio-economic development – especially economic growth, job creation, and poverty
eradication, broad based black economic empowerment, and environmental development.
• Service delivery, with emphasis on the provision of basic services.
• Governance, specifically as it relates to deepening democracy, thus through the ward
committee’s system, capacity building, etc.
It is critical that all the plans and strategies adopted in the District IDP are aligned with the principles of NSDP
and the objectives of the Northern Cape Provincial Growth and Development Plan (NCPGDP).
IMPLICATION/S FOR THE IDP
The IDPs address the existing needs of the communities in the various municipalities, through a framework
of sustainability and identified roles and projects for the municipalities.
1.6.2. FRANCES BAARD GROWTH AND DEVELOPMENT STRATEGY
The FBDM DGDS is envisaged as a process of collective planning to improve alignment between spheres of
government and other social partners to impact on poverty and accelerated shared growth. The FBDM DGDS
provides an action plan to meet the development needs of the communities within the district. The DGDS
aims to achieve this through the further development of leading economic sectors namely:
• Agriculture and Agro-Processing
• Mining and Mineral Processing
• Tourism
• Manufacturing
• Transport
• Services
• SMME Development
• Institutional Capacity Building
IMPLICATION/S FOR THE IDP
It is important that the municipality aligns these initiatives and those identified within the other district
strategies to ensure better development of the local communities and economies.

SOL PLAATJE LOCAL MUNICIPALITY INTEGRATED DEVELOPMENT PLAN 2022 - 2027
38
1.6.3. FRANCES BAARD SPATIAL DEVELOPMENT FRAMEWORK
The Spatial Development Framework (SDF) of the FBDM provides the district with development directives
regarding Economic Development Nodes and Economic Growth Potential of Towns. The SDF makes provision
for agro-processing, mining beneficiation, tourism, and tertiary education nodes within the FBDM spatial
perspective.
IMPLICATION/S FOR THE IDP
The SDF identifies nodes for specific development activities, and it would therefore be the responsibility of
the municipalities to align the development initiatives to these already identified nodes.
1.6.4. FRANCES BAARD DISTRICT MUNICIPALITY TOURISM STRATEGY
Tourism Strategy is both strategic and tactical response to challenges faced by the district. Statement of
intent and direction is drawn from the mandate vested in the Northern Cape’s Tourism Master Plan. The
strategy is also informed and shaped by the Provincial Growth and Development Plan (PGDP), the National
Tourism Growth Strategy, as well as the strategic direction set by the FBDM. In this Strategy, FBDM has made
choices that are intended to realise its mandate.
IMPLICATION/S FOR THE IDP
The Tourism Strategy for the FBDM must be used as a cohesive planning framework for the optimum co-
ordination, management and development of a vibrant tourism sector that facilitates sustainable economic,
environmental, and social benefits for the people of the various municipalities.

SOL PLAATJE LOCAL MUNICIPALITY INTEGRATED DEVELOPMENT PLAN 2022 - 2027
39
1.7. THE MUNICIPAL VISION AND SERVICE DELIVERY IMPERATIVES
1.7.1. THE VISION & MISSION
“Towards a Cleaner Growing City “
The mission of the Sol Plaatje Local Municipality embodies the outcomes required to fulfill the vision with
the following:
• To reclaim the status of the city that sparkles back
• Building public confidence and trust
• Provision of economic infrastructure to accelerate private investment
• To deliver sustainable uninterrupted services to all residents within the jurisdiction.
1.7.2. IDP COHERENCE
The IDP is a legislative requirement, with a legal status and it supersedes all other plans that guide
development at local government level. The National Sphere of government provided five (5) Key
Performance Areas (KPAs) that local government must adhere to, to implement the National vision. These
KPAs are:
1. Basic Service Delivery and Infrastructure Development;
2. Local Economic Development;
3. Municipal Transformation and Institutional Development;
4. Good Governance and Public Participation; and
5. Financial Viability and Development.
In line with these KPA’s the SPLM developed KPA’s that closely link with the National Vision:
1. Local Economic Development
2. Access to Basi Services and Infrastructure Development
3. Sound Financial Management
4. Institutional Development and Capacity Building
5. Good Governance and Public Participation

SOL PLAATJE LOCAL MUNICIPALITY INTEGRATED DEVELOPMENT PLAN 2022 - 2027
40
CHAPTER 2
MUNICIPAL PROFILE

SOL PLAATJE LOCAL MUNICIPALITY INTEGRATED DEVELOPMENT PLAN 2022 - 2027
41
2. MUNICIPAL PROFILE
This chapter will focus on the local context of the Sol Plaatje Local Municipality with regards to the socio-
economic and economic profile. The chapter is divided into three sections focusing on an overview of both
these areas as well as a key findings section.
2.1. SOCIO-ECONOMIC OVERVIEW
The Sol Plaatje Local Municipality is named after Solomon Tshekisho Plaatje who was a South African intellectual, journalist, linguist, politician, translator, and writer. Solomon Plaatje was born just outside
Boshof, in the former Orange Free State (now Free State province, South Africa).
The Sol Plaatje Local Municipality is the second largest local municipality in the district with an area covering 3 145 km² and comprising a large urban node in the form of Kimberley, as well as villages and farms. Kimberley is the administrative centre of the municipality. Sol Plaatje Local Municipality is the
largest local municipality in the Frances Baard District Municipality in terms of population size.
Sol Plaatje’s economy was built on the foundation of a thriving diamond industry dating back to the days of Cecil John Rhodes. Sol Plaatje is the seat of the Northern Cape Provincial Administration and the seat for the offices of the Frances Baard District Municipality. The N12 highway, which connects
Gauteng to the Western Cape Province, runs through the City of Kimberley which is located in Sol Plaatje Local Municipality.
Source: https://www.statssa.gov.za/?page_id=993&id=sol-plaatjie-municipality &https://francesbaard.gov.za/our-regions/

SOL PLAATJE LOCAL MUNICIPALITY INTEGRATED DEVELOPMENT PLAN 2022 - 2027
42
28%
65%
7%
Demographics per Age Group - SPLM
0-14 15-65 65+48
48.5
49
49.5
50
50.5
51
51.5
MEN WOMAN
2.1.1. POPULATION BY GENDER, AGE AND POPULATION GROUP
269,160 - SPLM POPULATION
According to the Department of Statistics SA, Gauteng still comprises the largest share of the South African population, with approximately 15,81 million people (26.3%) living in this province. KwaZulu-
Natal is the province with the second largest population, with an estimated 11.5 million people (19,1%) living in this province. With a population of approximately 1,30 million people (2,2%), Northern Cape
remains the province with the smallest share of the South African population.
-12% -9% -6% -3% 0% 3% 6% 9% 12%
00-04
05-09
10-14
15-19
20-24
25-29
30-34
35-39
40-44
45-49
50-54
55-59
60-64
65-69
70-74
75-79
80+
Female Male

SOL PLAATJE LOCAL MUNICIPALITY INTEGRATED DEVELOPMENT PLAN 2022 - 2027
43
2.1.2. GROWTH POPULATION TRENDS
30 000
40 000
50 000
60 000
70 000
80 000
90 000
100 000
-
50 000
100 000
150 000
200 000
250 000
300 000
350 000
400 000
2011 2017 2022 2027 2030 2050
Populations Total Households Total
2011: 59 246 2027: 68 049
2017: 62 602 2030: 69 830
2022: 65 181 2050: 82 953
2011: 242 214 2027: 282 983
2017: 257 142 2030: 291 615
2022: 269 160 2050: 356 294
POPULATION TOTAL: SPLM HOUSEHOLD TOTAL: SPLM
The Sol Plaatje Local Municipality experienced the highest population growth of 2.56% between 2009 and 2019. Sol Plaatje is the most populated municipality in the district and the Northern Cape
Province.

SOL PLAATJE LOCAL MUNICIPALITY INTEGRATED DEVELOPMENT PLAN 2022 - 2027
44
2.1.3. HEALTH, SAFETY AND SECURITY
59.1 YEARS - LIFE EXPECTANCY
57 - HEALTH CARE
FACILITIES
204.7 / 100 000 -
MATERNAL MORALITY
21.2% - UNSAFE
45.5% - SAFE
SAFETY PERCEPTION PERCENTAGES - SLMP
55 / 100 000 - MURDER
192 / 100 000 - DRIVING
UNDER THE INFLUENCE
376 / 100 000 - DRUG
RELATED CRIMES
3,671 / 100 000 -
RESIDENTIAL BURGLARY
HEALTH STATISTICS - SPLM
Driving under the influence can result in a fine of up to R2000 or a two-year prison sentence, or both, depending on: Any previous
convictions and/or any extenuating circumstances surrounding your arrest.
According to the Governance, Public Safety and Justice Survey (GPSJS) 2019/20 housebreaking or burglary has increased from 2.1 million in
2015/16 to 2,3 million in 2019/20. This has consistently been the most common crime experienced by households in South Africa.
The 2nd half of 2020 (i.e. 2020b) saw a significant increase in the number of persons admitted for AOD treatment from 6 317 in 2019 to 9 394 in
2020 across 82 treatment centres/programmes. During this period, Covid-19 restrictions were eased and treatment centres could accommodate
more patients.
The number of households that experienced murder rose from 12 000 in 2018/19 to 15 000 in 2019/20. Data shows stability in the
number of murders between 2018/19 and 2019/20.
Healthcare in South Africa is administrated by the Department of Health. Around 80% of the population uses public healthcare, with the wealthiest 20% opting for private healthcare. Traditional medicine still plays a large part in South African healthcare. In fact, around 80% of the local population report using a
traditional healer for some form of health issues; usage rates are even higher in rural areas. Alternatively, you can also find various different forms of alternative medicine in South Africa including: Homeopathy;
Osteopathy; Chiropractic and Naturopathy.
Emergency Services in South Africa: 10111 - Nationwide Emergency Response 10177 - Ambulance Response - 112- Emergency Response in South Africa
45.5% of Residents in the Sol Plaatje Municipality area say they feel safe during daytime, while only 21.2% of residents feel safe during nighttime. Crime in this region can possibly have an influence in
these percentages.
PER 100 (15-64) -
DEPENDANCY RATIO
(2016)

SOL PLAATJE LOCAL MUNICIPALITY INTEGRATED DEVELOPMENT PLAN 2022 - 2027
45
• NORTHERN CAPE Confirmed Cases: 110,137 Deaths: 3,222 Recoveries: 105,671 Active Cases: 1,244
• WESTERN CAPE Confirmed Cases: 666,802 Deaths: 21,967 Recoveries: 6319,196 Active Cases: 5,639
• EASTERN CAPE Confirmed Cases: 350,406 Deaths: 16,641 Recoveries: 331,039 Active Cases: 2,726
• KWAZULU-NATAL Confirmed Cases: 686,471 Deaths: 16,093 Recoveries: 649,596 Active Cases: 20,782
• FREE STATE Confirmed Cases: 206,311 Deaths: 7,689 Recoveries: 195,107 Active Cases: 3,515
• NORTH WEST Confirmed Cases: 195,335 Deaths: 4,811 Recoveries: 188,827 Active Cases: 1,697
• LIMPOPO Confirmed Cases: 156,954 Deaths: 4,663 Recoveries: 151,991 Active Cases: 300
• MPUMALANGA Confirmed Cases: 195,837 Deaths: 4,705 Recoveries: 189,851 Active Cases: 1,281
• GAUTENG Confirmed Cases: 1,259,125 Deaths: 20,714 Recoveries: 1,221,992 Active Cases: 16,419
100, 505 DEATHS
3,827,378 POSITVE CASES
3,673,270 RECOVERIES
24,626,847 TESTS
CONDUCTED
9,253 NEW CASES
DAILY DEATHS
34
RECOVERY RATE
96%
ACTIVE CASES
53,603
VACCINES ADMINISTERED
35,112,052
COVID-19 STATISTICS IN SOUTH AFRICA, TUESDAY, 06 MAY 2022
COVID-19 Public Hotline: 0800 029 999
WhatsApp Support Line: 0600-123456
COVID-19 Symptoms - Cough - Body Ache or - Sneezing Headache - Runny Nose - Nasal Congestion - Sore Throat - Fever - Loss of Tase or Smell
Severe COVID-19 Symptoms - Trouble Breathing (Shortness of Breath, or difficulty breathing) - Ongoing chest pain or tightness of chest - Severe headache for a few days - Feeling confused or inability to stay awake or up - Pale, grey or blue colored skin, lips or fingernails - Progressively feeling weak
Severe COVID-19 is a medical emergency. If suspected, visit your nearest health facility or
call 158.

SOL PLAATJE LOCAL MUNICIPALITY INTEGRATED DEVELOPMENT PLAN 2022 - 2027
46
1395
5
2907
0
1503
1
L O W -S K I L L E D
S E M I -S K I L L E D
S K I L L E D
SKILL LEVELS
2.1.4. EDUCATION
5.4%
21.1%
4.8%
30.6%
19.4%
6.8%
11.9%
No Schooling
Some Primary
Completed Primary
Some Secondary
Grade 12/Std 10
Higher
Not Applicable
ADULT LITERACY RATE
THE STATE OF LITERACY IN SPLM
Skill Levels within the Sol Plaatje Municipal
Area - Number of workers by
Skill reflected.
Skill Levels: Level of
Education within an area or region.
Mean Years of Schooling
within the Sol Plaatje
Municipal Area. The average number of completed
years of education of a
population. 8.87 years
Expected Years of Schooling
within the Sol Plaatje
Municipal Area. Based on the duration of schooling at each level of education.
12.96 years
78.79%
Adult Literacy Rate of the
population is the
percentage of persons older than 20 with the highest
level of education,
being Grade 7 and higher. (Less than Grade 7 is
classified as illiterate.)

SOL PLAATJE LOCAL MUNICIPALITY INTEGRATED DEVELOPMENT PLAN 2022 - 2027
47
The concept was defined by two programmes: the Blue Drop Certification Programme for Drinking Water Quality
Management Regulation; and the Green Drop Certification Programme for Wastewater Quality Management
Regulation. 58.8% - MUNICIPAL BDRR SCORE
12500
13000
13500
14000
14500
15000
2016 2017 2018 2019
Indigent Households
20
21
22
23
24
2016 2017 2018 2019
Percentage of Total Households
2.1.5. ACCESS TO SERVICES AND HOUSING
ELECTRICITY
SANITATION
WASTE
REMOVAL
HOUSEHOLDS WITH
ACCESS TO WATER
ACCESS TO WATER
IN THEIR YARDS
82% - FORMAL DWELLINGS
18% - INFORMAL DWELLINGS
0% - TRADITIONAL DWELLINGS
2016: 13,873
2017: 13,425
2018: 13,784
2019: 14,647
2016: 22.5%
2017: 21.5%
2018: 21.9%
2019: 23.0%
GHS data show that households’ access to drinking water (89,0%) was most common in 2018, followed by access to mains electricity
(84,7%), and improved sanitation (83,0%). Access to refuse removal services at home
lagged behind at 66,4%. Although access to all four services increased between 2002 and
2018, improvements varied. Access to improved sanitation (flush toilets or pit toilets
with ventilation pipes) increased by 21,3 percentage points over the 17-year period, followed by access to mains electricity (8
percentage points) and refuse removal (7,9 percentage points). This may be attributed to
the fact that a larger percentage of households had access to drinking water (piped or tap
water in the dwellings, off-site or on-site) than any of the other basic services. Access to drinking water was also the service that
recorded the lowest growth over the period, at 4,6 percentage points.
Slightly more than eight-tenths (81,9%) of South African households
lived in formal dwellings in 2019, followed by 12,7% in informal
dwellings, and 5,1% in traditional dwellings. Households that that lived
in formal dwellings were most common in Limpopo (95,2%)
and Mpumalanga (89,6%).
SPLM DWELLINGS
LOW MEDIUM HIGH CRITICAL
<50% 50%-<70% 70%-<90% 90%-<100%

SOL PLAATJE LOCAL MUNICIPALITY INTEGRATED DEVELOPMENT PLAN 2022 - 2027
48
2.2. ECONOMIC OVERVIEW
2.2.1. ECONOMIC PROFILE
-2%
0%
2%
4%
6%
8%
10%
2016 2017 2018 2019 2020
RSA NC FBDM SPLM
14.3% According to Lora Jones, Daniele Palumbo & David Brown from BBC News on 24 January 2021, The FTSE dropped 14.3% in 2020, its worst performance since 2008. This is due to the impact of the coronavirus on stock markets
since the start of the outbreak.
In 2019, the financial industry contributed US$41.4 billion to South Africa's GDP. In 2021, South Africa-based financial institutions managed more than
US$1.41 trillion in assets. The total market capitalization of the Johannesburg Stock Exchange is US$1.28 trillion as of October 2021.
A few Reasons to invest in Kimberley:
• Economic Hub of the Northern Cape: Approximately ten other surrounding towns in the region are being served by the area, which is well known as the center for services such as: Education, Medical, Retail, Business and Financial Services. State of the art facilities are also found in this area.
• Linkages to Global Technological Development & Tourism: The SALT telescope and the radio-wave telescope (the SKA) at Carnarvon, to be the largest in the world. This opens doors for tourism and educational purposes in the area.
• Sol Plaatje University (SPU): The Sol Plaatje University is the 1st and only University in Africa which offers a Bachelor's Degree in Data Sciences.
• And so much more!

SOL PLAATJE LOCAL MUNICIPALITY INTEGRATED DEVELOPMENT PLAN 2022 - 2027
49
0 2000 4000 6000 8000 10000 12000 14000
Agriculture
Mining
Manufacturing
Electricity & Water
Construction
Wholesale & Trade
Transport
Finance & Business Services
Government
Community & Personal Services
2020 2019
2.2.2. KEY ECONOMIC CONTRIBUTOR BY SECTOR
In 2020, agriculture had contributed around 2.53
percent to the GDP of South Africa, whereas industry and services
had contributed 23.42 and 64.57 percent of the
total value added, respectively
2019: 787
2020: 1,003
2.0%
2019: 3,240
2020: 3,715
7.4%
2019: 3,811
2020: 3,585
7.1%
2019: 2,596
2020: 2,897
5.8%
2019: 1,519
2020: 1,333
2.6%
2019: 5,694
2020: 5,396
10.7%
2019: 7,628
2020: 7,168
14.2%
2019: 12,729
2020: 13,025
25.9%
2019: 4,127
2020: 4,256
8.5%
2019: 7,939
2020: 7,939
15.8%
2 7.4%
7.1%
5.8%
2.6%
10.7%
14.2%
25.9%
8.5%
15.8%
CONTRIBUTORS BY SECTOR -SPLM
In 2019, South Africa was the world's largest producer
of platinum, the world's largest producer of
chromium, the world's largest producer of
manganese, the 2nd largest world producer f titanium,
the world's 11th largest producer of phosphate. It
was the world's 12th largest producer of uranium in
2018.

SOL PLAATJE LOCAL MUNICIPALITY INTEGRATED DEVELOPMENT PLAN 2022 - 2027
50
South Africa's unemployment rate hit a new record high of 34.4% inn the second quarter of 2021 from 32.6% in the first quarter, the statistics agency said. Statistics South Africa said the number of unemployed totaled
7.826 million people in the three months to the end of June, compared with 7.242 million people in the previous three months.
0 5 10 15 20 25 30 35
2016
2017
2018
2019
2020
2021
SLMP - EMPLOYMENT PERCENTAGES PER MUNICIPAL AREA
Sol Plaatje LM Frances Baard DM Northern Cape
2.2.3. EMPLOYMENT STATUS
57,792 - SPLM POVERTY HEADCOUNT UNDER POVERTY LINE (NUMBER OF PERSONS)
2016: 24.3% 2019: 26.7% 2017: 25.4% 2020: 26.7% 2018: 25.3% 2021: 25.0%
2016: 27.1% 2019: 29.0% 2017: 27.9% 2020: 29.1% 2018: 27.5%
2016: 27.1% 2019: 26.7% 2017: 27.9% 2020: 26.7% 2018: 29.0%
Compared to Q1: 2020, the largest decreases in employment were recorded in Gauteng (down by 508 000), KwaZulu-Natal (down by 243 000), Western Cape (down by 192 000), Limpopo (down by 139 000) and
Mpumalanga (down by 113 000). Northern Cape recorded the least decrease in the number of employed persons at 22 000. Limpopo had the biggest change in employment with a decline of 10,0%, followed by
Gauteng with a decline of 9,9%.
Four out of eight industries in the formal sector employment recorded employment gains. An increase of 79 000 in employment was mainly driven by the Finance (179 000), Utilities (16 000), Mining (11 000) and
Manufacturing (6 000) industries. The biggest losses were recorded in the Construction (58 000) industry, followed by Transport (39 000), Community and social services (25 000), and Trade (15 000).

SOL PLAATJE LOCAL MUNICIPALITY INTEGRATED DEVELOPMENT PLAN 2022 - 2027
51
0% 500000% 1000000% 1500000% 2000000% 2500000% 3000000%
Below 39,536
39,536 to 71,333
71,334 to 130,781
130,782 to 299,495
299,496 and above
0
20
40
60
80
100
120
140
Salaries Grants Remittances Income frombusiness
Pensions
SOURCE OF HOUSEHOLD INCOME - 2019
South Africa Northen Cape
2.2.4. HOUSEHOLD INCOME
R299,496 AND ABOVE: 21.9% R39,536 TO R71,333: R18.9% R130,782 TO R299,495: 20.5% BELOW R39,536: 15.6% R71,334 TO 130,781: 23.0%
HOUSEHOLD INCOME PER YEAR - SPLM
17,5% OF PEOPLE IN THE NORTHERN CAPE PROVINCE EARN BETWEEN R20K - R40K - ABOUT 90 PERCENT OF THE RATE IN SOUTH AFRICA: 18,74%. (COMMUNITY SURVEY 2016)
THE INCOME REFLECTED ARE CALCULATED PER ANNUM.
A LARGE NUMBER OF HOUSEHOLDS OBTAINED THEIR
INCOME BY RECEIVING SALARIES, THEREAFTER BY RECEIVING GRANTS. GRANTS IN THE NORTHERN CAPE, WITH A
PERCENTAGE OF 57.0%, ARE MORE TO THE PERCENTAGE OF
46.2% FOR SOUTH AFRICA.

SOL PLAATJE LOCAL MUNICIPALITY INTEGRATED DEVELOPMENT PLAN 2022 - 2027
52
2.2.5. YOUTH AND SOCIAL DEVELOPMENT
0 5 10 15 20 25 30 35 40 45
2016
2017
2018
2019
2020
2016 2017 2018 2019 2020
SPLM 36.2 37.1 36.7 38.4 38.5
FBDM 37.1 38.2 37.9 39.7 39.7
NC 31 32.2 32.1 33.8 33.7
RSA 34.9 35.9 35.6 37.4 37.8
The Kimberley municipality is called the Sol Plaatje Municipality. It’s named after a founding member of the South African National Congress (which later became the African National Congress, the current ruling party in South Africa) which had spent considerable time in Kimberley. A statue of Sol Plaatje was unveiled early in
2010 in Kimberley by current South African president Jacob Zuma.
The Department of Social Development (DSD) provides social protection services and leads government’s efforts to forge partnerships through which vulnerable individuals, groups and communities become capable
and active participants in the development of themselves and society.
The NYP (National Youth Policy) 2020-2030, also referred to as the NYP 2030, is a cross-sectoral policy aimed at affecting positive youth development outcomes for young people at local, provincial, and national levels in South Africa. Developed by the Department of Woman, Youth and Persons with Disabilities, in collaboration with multiple stakeholders and young people, the policy was developed to redress the wrongs and injustices of the past and to deal decisively with the persistent as well as new and emerging challenges they are facing.
The NYP 2030 defines young people as those aged between 14 and 35.

SOL PLAATJE LOCAL MUNICIPALITY INTEGRATED DEVELOPMENT PLAN 2022 - 2027
53
2.3. KEY FINDINGS & IMPLICATIONS
The following are the key findings from the local context that needs to be taken into consideration for their
implications on the Sol Plaatje Local Municipality:
2.3.1. POPULATION & HOUSEHOLDS
The Sol Plaatje Local Municipality has a population of 269,160 that is projected to grow by an additional
13,823 by 2027, that is the equivalent of adding another Ritchie to the municipality. Urbanisation is a well-
known phenomenon worldwide with the UN estimating that approximately 55% of people live in urban areas
and this is expected to increase to 68% by 2050.
Population growth has slowed over the last 5 years, it is however important to take into consideration that
as unemployment rises in rural areas, more people will migrate to the larger urban centers. It is expected
that most of the population growth will occur in Kimberley as it will potentially provide better opportunities
and access to amenities.
The age profile indicates that 65% (169,901) of the population falls within the labor force, with 28% (75,576)
younger than 14 and 7% (18,345) older than 65. The 21,472 people between the ages of 15 – 19 will also add
to the labor force within the lifespan of this IDP, with only 8,709 people between the ages of 60 – 65 that will
presumably retire.
Implications for SPLM:
• The rise in population will place immense pressure on mostly Kimberley to provide the additional
necessary amenities and basic services to cater to the added residents. Currently there is not
adequate infrastructure and amenities for residents, and this will only be amplified with the addition
of more people.
• Urban sprawl will also take place as more people settle on the outskirts of town due to a lack of
housing opportunities closer to job opportunities. This will add to the costs that will need to be
incurred for the provision of infrastructure and services as little densification will take place.
• Rise in population with the lack of employment opportunities will result in higher social problems
such as unrest & crime.
• The increase in households will see demand for housing increase and will add to the current backlog
of housing that will need to be added to the local area. This will see more informal dwellings added
to local areas and by either providing additional formal housing or just the expansion of informal
dwellings will have urban sprawl as a result.
• During the next few years, the number of people entering the employment market (between the
ages of 15 – 19) will be more than double the anticipated retirement age, which will have an increase
in the youth employment rate.

SOL PLAATJE LOCAL MUNICIPALITY INTEGRATED DEVELOPMENT PLAN 2022 - 2027
54
2.3.2. ECONOMIC PROFILE
The importance of SPLM with regards to the composition of the economy is evident in that 75% of output is
concentrated within the tertiary sector, with 16% in the secondary and 9% in the primary sector. The
importance of Kimberley as gateway to the Northern Cape and as financial hub is clear, however the
economic growth rate has been in decline even before COVID19 hit.
Implications for SPLM:
• COVID19 has shaken the world economy with global decline in economic output, employment and
investment outlooks. Local solutions are required to react to a global issue and here it is important
for the SPLM to ensure economic responses are not done in isolation. SPLM should pursue active
cooperation across government departments and institutions to help minimise disjointed responses
and competition for resources.
• Businesses drive economic growth and employment, however if the business environment is not
favorable, these businesses will seek other locations where they can be profitable. The importance
of supporting existing businesses by providing quality and efficient infrastructure and basic services
should be a priority for the local municipality, in order to create as stable base for the economy to
grow from.
• Focus on providing investment incentives to attract investors is important but will only come to
fruition if quality infrastructure and services can be guaranteed.
• Providing readily available land for development through good planning practice and expedient
application processing will play a key role in attracting and fast-tracking development.
2.3.3. EMPLOYMENT & HOUSEHOLD INCOME
Unemployment has been on the rise even before the pandemic and will only be exasperated by the
challenges imposed by the pandemic on local businesses. With an unemployment rate of 29.1% Sol Plaatje
Local Municipality has approximately 28,000 people that are not employed within the confines of the local
municipal borders.
Most employment are within the Community, social and personal services sector with 27% (18,343) of the
total workforce, the other two sectors that contribute significantly to employment are that of Wholesale and
retail trade, catering and accommodation with 23% (15,882) and Finance, insurance, real estate and business
services with 18% (11,968).
The biggest job losses were experienced within the trade sector with 1,310 jobs lost between 2019 and 2020,
with the tourism industry hit extremely hard by COVID19. The largest percentage drop in employment
however is that of construction with 17.26%. All sectors were hit hard by COVID19 with all sectors losing
workers and the total job losses for the municipality between 2019 and 2020 at 4,501 or a 6.64% decline.
According to a 2020 report from the International Labor Organization, a specialized agency of the United
Nations, the global youth unemployment rate stands at 13.6%. The contributing factors to this high rate of
global youth unemployment are largely due to the lack of job opportunities but also include barriers to
entering the labor market, like limited work experience and the increasing size of the population itself –
worldwide, there are approximately 1.3 billion young people between the ages of 15 and 24.
The youth unemployment rate is 38.5% and paints a grim picture, with more young people that will enter
the employment market over the lifespan of this IDP. Automation within businesses has been a means by
SOL PLAATJE LOCAL MUNICIPALITY INTEGRATED DEVELOPMENT PLAN 2022 - 2027
55
which businesses increase productivity and limit expenses, this has seen a rise during the pandemic and will
ultimately result in more job losses.
Implications for SPLM:
• Unemployment adversely affects the disposable income of families, increase social unrest, added
crime, dependency on government grants, erodes purchasing power, diminishes employee morale,
and reduces an economy's output. The higher the unemployment the more prominent these
implications are to a local economy and will be seen more severely due to the high youth
unemployment.
• Loss of jobs within the municipality is high not only due to COVID, as before the pandemic there were
either small gains in certain sectors or significant losses in all economic sectors. The pandemic has
however exasperated the situation and initiatives to assist with economic development is critical to
reduce reliance on government to provide for citizens.
• There remains a large proportion of people within the municipality that don’t have any other sources
of income and live off social grants, which places a greater burden on the municipality at large.
• The percentage of people living under the poverty line in SPLM has remained constant since 2011 at
nearly 22%, if it is expected that this will continue, especially with the impact of COVID19, the number
of people living under the poverty line will be 62,256 by 2027. This will place more pressure to
provide for the additional 3,041 people that will be dependent on government assistance.
2.3.4. EDUCATION
Education is important for any economic development, especially when activities within the secondary and
tertiary sectors are considered. Sol Plaatje has 26.2% of the population that has either matric or a higher
education with 5.4% with no schooling and 56.4% of the population with some schooling.
Matric pass rate for the Northern Cape has declined from 78.7% in 2016 to 66% in 2020, undoubtably the
impact of the pandemic played a role. The Sol Plaatje matric passing rate was 91,12% for 2020, significantly
higher than the rest of the province due to the conglomeration of quality schools and teachers in the capital.
Implications for SPLM:
• Higher education is important for the advancement and specialization of an economy, the education
levels within Sol Plaatje needs to improve drastically to stimulate the secondary and tertiary sectors
of the economy.
• The Sol Plaatje University is a step in the right direction and courses that focus on research and
development such as those focused on supporting the SKA is a step in the right direction.
• However, skills drainage should also be of concern as higher skilled labour will automatically be
attracted to larger economic nodes where more and higher paying opportunities are easier to find
for higher educated and skilled laborers.
• Less people who complete matric and importantly finish with acceptable grades to qualify for higher
education is also a serious consideration, this is amplified even more when the focus on science and
mathematical subjects are taken into account. Education needs to be addressed from the earliest
grades and focus on rare skills and subjects should be emphasized from a young age to ensure that
more matriculants have the opportunity to study at higher education institutions.

SOL PLAATJE LOCAL MUNICIPALITY INTEGRATED DEVELOPMENT PLAN 2022 - 2027
56
2.3.5. SOCIAL LIVING CONDITIONS
Sol Plaatje has 57 health facilities, however there is only 1 Tertiary Hospital, with 2 other hospitals and 2
more specialized hospitals. There is also only 13 clinics within the SPLM. Life expectancy has increased over
the last 5 years to around 58%, however infant mortality has been on the rise for the same period to an
alarming 14.2%.
When crime is considered, Kimberley is generally seen as a safer city than most other cities in similar size.
The rate of crime in Kimberley is 73.49 per 1,000 residents during 2021, which equates to having a 1 in 14
chance of becoming a victim of crime. The number of contact crimes in Kimberley has decreased by 41%,
while the property crime rate in Kimberley has decreased by 65% year over year. The number of total crimes
in Kimberley has decreased by 48% year over year.
Most people within the Sol Plaatje municipal area have more than 85% access to basic services, this correlates
with the number of people that live within formal dwellings of around 82%, with the rest of the housing
informal.
Implications for SPLM:
• Although the access to basic services has overall improved since the 2011 Census, the increase in
population will ultimately require that more infrastructure and services are provided increasing both
capital expenditure required, higher operational cost and larger capacity facilities such as sewerage
works and purification plants.
• Approximately 18 % of the households live in informal settlements which places pressure on the
municipality to provide housing. Not only do they need access to basic services, but in large they face
various basic amenity challenges, which affect their ability to improve their economic position in
society.
• The number of people that will be added to the local municipal space will also form part of the long-
term issue of RDP housing and finding adequate land to develop housing on.
• Another critical issue within informal settlements relates to risk of fire and flooding; the higher the
density of the settlements and poorer the quality of building materials the greater the risk.
• COVID19 has shown the necessity for adequate health facilities within communities and the
importance of front-line medical workers. It is thus important for SPLM to ensure that there is
enough facilities for local communities, but also as it is the capital of the Northern Cape that
adequate medical facilities is available to the rest of the province.
SOL PLAATJE LOCAL MUNICIPALITY INTEGRATED DEVELOPMENT PLAN 2022 - 2027
57
CHAPTER 3
SPATIAL DEVELOPMENT CONTEXT

SOL PLAATJE LOCAL MUNICIPALITY INTEGRATED DEVELOPMENT PLAN 2022 - 2027
58
3. SPATIAL DEVELOPMENT CONTEXT
3.1. GEOGRAPHIC OVERVIEW OF SPM
3.1.1. SPLM LOCALITY
Sol Plaatje Local Municipality has a geographical area of 1877.1km² and comprises of the urban areas of
Kimberley, Ritchie and surrounding villages and farms. Kimberley is the administrative centre of the FBDM
and the seat of the Northern Cape Provincial Administration. The main economic activities consist of retailers,
industries as well as mining and farming.
Map 2: Frances Baard District Local Municipalities Boundaries
Map 1: SPLM Provincial Locality

SOL PLAATJE LOCAL MUNICIPALITY INTEGRATED DEVELOPMENT PLAN 2022 - 2027
59
3.1.2. BIOPHYSICAL CONTEXT
The SDF maps providing the environmental overview has been included as Annexure B and includes the
following:
➢ Biodiversity Plan
➢ Development Pressures Plan
➢ Land Cover Plan
➢ Geology Map
➢ Water Access
➢ Agriculture Potential
3.1.3. SPATIAL ECONOMIC DEVELOPMENT FRAMEWORK (SDF)
The SDF has the following key elements focusing on:
1) Category 1- Foster a unique sense of place within the Sol Plaatje Municipality-
o Central Area Revitalisation
▪ Strengthening Sol Plaatje’s Technological Network within the CBD particularly the
Knowledge economy’
2) Category 2: Desire to transform the exclusive spatial fabric- Spatial Transformation Zones
3) Category 3: Functional Areas- Anchor sustainable livelihoods development on economic growth;
4) Category 4: Revitalisation of Industrial Zones- Capitalise on the comparative and competitive
advantages of the city as expressed in planning frameworks of provincial and national spheres of
government;
5) Category 5: Sustainable Human Settlements -Need to promote social and economic
development in previously disadvantaged areas (PDAs) into (model) neighbourhoods;
6) Category 6: Promotion of Renewable Energy- Promotion of low carbon footprint and greenery;
7) Category 7: Compact City -The desire to dismantle apartheid spatial planning by linking the
disadvantaged areas with the CBD and activity corridors through Restructuring Zones;
8) Category 8: Areas of densification.
9) Category 9: Kimberley Airport – The desire is to plan vibrant and sustainable ancillary uses to
compliment the airport and provide employment opportunities to the surrounding communities.
10) Category 10: Desire to transform spatial fabric- Future precinct and areas of densification
11) Category 11: Transitional Zones- Reverting mine dumps to alternative uses such as Agri*energy
etc.
In accordance with the SPLM SDF these are given effect to the development rationale promoting sustainable
development within a defined functional area supported by a hierarchy of activity nodes connected by well-
defined arterials and collector roads.
It is important that the IDP Projects identified are linked to the spatial areas earmarked for development in
order to reinforce the spatial development rationale for the municipality. The projects will strategically be
linked and aligned to the SDF’s development framework. The balance between addressing community needs
and supporting economic development will also need to be considered for the final IDP in order to ensure
the spatial directives of the SDF are addressed.

SOL PLAATJE LOCAL MUNICIPALITY INTEGRATED DEVELOPMENT PLAN 2022 - 2027
60
3.2. STATUS QUO
3.2.1. ROADS AND STORMWATER
3.2.1.1. TRANSPORTATION PLAN AND PAVEMENT MANAGEMENT SYSTEM:
Sol Plaatje local Municipality has a comprehensive Transportation Plan in place.
Coupled with the above is a Pavement Management System for the management and development of road
pavement conditions. Sol Plaatje Local Municipality has not had such a system in place for the past 14 years
but has been identified as a crucial planning and management instrument to be instituted.
Lack of Funding has been identified as the key hurdle in the compilation and implementation of an adequate
Pavement Management System.
3.2.1.2. ROADS INFRASTRUCTURE:
Sol Plaatje Local Municipality at present contains approximately 1170km of roads infrastructure, consisting
of:
• • Bituminous Surfaced Roads: 398km
• • Block Paved Roads: 132km
• • Gravel Roads: 640km
The roads are classified as urban roads and the following may be regarded as the classification breakdown
of the existing roads infrastructure:
Road
Number
Road Class Age Condition
1
2
3
4 A & B
5 A & B
Aged
New
Good
Fair
Poor
N12
Len
gth
(km
)
10.00 X X
N8 10.00 X X
MR00900 1.25 X X
MR00807 2.46 X X
MR00904 7.66 X X
MR00905 4.92 X X
MR00909 0.86 X X
TR00801 4.21 X X
Varies 39.12 X X
Varies 1018.88 X X
The infrastructure is deemed to be aged and in poor condition, with most of the road infrastructure in varying
degrees of destress ranging from minor to major. The forms of destress experience throughout the road
network may be defined as but not limited to:
• Alligator cracking or Map cracking (Fatigue)
• Consolidation of pavement layers (Rutting)
• Shear failure cracking
• Longitudinal cracking
• Frost heaving

SOL PLAATJE LOCAL MUNICIPALITY INTEGRATED DEVELOPMENT PLAN 2022 - 2027
61
• Lack of binding to the lower course (potholes and slippage)
• Reflection cracking
• Formation of waves and corrugation
• Bleeding
• Pumping
The main cause for the state of destress of the road infrastructure in Sol Plaatje Local Municipality has been
identified as the inadequate or lack of planned maintenance for an extended period, primarily due to limited
funding allocated to such activities.
3.2.1.3. ROAD MAINTENANCE:
Sol Plaatje Local Municipality does not have a Road Maintenance Plan in place at the present moment,
making long-term planning and execution of maintenance projects difficult. Such a maintenance plan would
refer to the pavement management system as described in 2.1.1 for guidance, thus stressing the importance
of such a system and its implementation.
Road maintenance is primarily addressed on an ad-hoc basis, with maintenance and reparation to the road
infrastructure conducted as and when required.
3.2.1.4. PROJECTS FOR EXTENSION AND MAINTENANCE OF ROADS INFRASTRUCTURE:
At present Sol Plaatje has several projects aimed at the extension and maintenance of the road infrastructure,
namely:
• Upgrading of gravel roads for the 2021/2022 fiscal year.
• Upgrading of gravel roads for the 2022/2023 fiscal year.
• Resurfacing of roads for the 2021/2022 fiscal year.
• Resurfacing of roads for the 2022/2023 fiscal year.
3.2.1.5. STORM WATER MANAGEMENT PLAN:
Sol Plaatje Local Municipality does not currently have a Storm Water Management Plan in place.
3.2.1.6. STORM WATER INFRASTRUCTURE:
Sol Plaatje Local Municipality at present contains approximately 1310km of storm water infrastructure,
consisting of:
• • Pipes: 340km
• • Culverts: 80km
• • Channels: 890km
The infrastructure is deemed to be aged but in fair working order, however the infrastructure does
experience deficiencies in adequate capacity to drain storm water effectively and in a timely manner,
particularly during periods of high rainfall.
The chief reasons for the deficiencies in the capacity of the storm water infrastructure may be defined as
follows:
• Infrastructure Age:

SOL PLAATJE LOCAL MUNICIPALITY INTEGRATED DEVELOPMENT PLAN 2022 - 2027
62
The Sol Plaatje Municipal storm water infrastructure, though functional, is aged. Considering the relative
increased development experienced throughout the Sol Plaatje Municipality in the last few decades,
densification of the urban environment has occurred.
This has resulted in the increase of the urban surface area generating runoff during rainfall, and a greater
runoff coefficient than initially anticipated at the time the storm water infrastructure was instituted.
The storm water infrastructure is thus required to accommodate volumes greater than the initial design
volumes anticipated.
• Lack of Regular Maintenance is discussed next.
3.2.1.7. STORM WATER MAINTENANCE:
Sol Plaatje Local Municipality does not have a Storm Water Maintenance Plan in place at the present
moment, making long-term planning and execution of maintenance projects difficult.
Storm water maintenance is primarily addressed on an ad-hoc basis, with maintenance and reparation to the
storm water infrastructure conducted as and when required.
Of the primary concerns with regards to the adequate maintenance of the storm water infrastructure are the
following:
• High rates of refuse and other foreign matter deposited into the storm water infrastructure,
either through direct deposition or trough washing in of litter during rainfall.
• Damage to inlet structures either through vandalism or road traffic activity (reckless driving).
• The above will result in the further reduction of the capacity of the already pressured
infrastructure through:
• the artificial decrease in the available capacity of conduits (pipes, culverts, and channels).
• Obstruction of ingress of storm water to the infrastructure through inlets.
• Elevated levels of bypass at such inlets
• The undue aggregation of run-off at low lying areas.
3.2.2. WATER
3.2.2.1. WATER SERVICES DEVELOPMENT PLAN (WSDP):
At present Sol Plaatje Local Municipality does not have a valid WSDP in place, with the existing WSDP having
a validity period of 5 years from 2015 to 2020.
The process of updating the WSDP is underway and will be reviewed, approved, and adopted within the 2022
fiscal year, encompassing a five-year period from 2022 to 2027.
As indicated previously there is a Water Master Plan (WMP) developed by GLS Consulting, dated 2018.
3.2.2.2. NATIONAL TARGETS FOR THE MILLENNIUM DEVELOPMENT GOALS (MDG):
Sol Plaatje Local Municipality currently adhere to the national targets for the MDG for the provision of
potable water to at least half of the population within their jurisdiction.
3.2.2.3. SERVICE PROVISION:

SOL PLAATJE LOCAL MUNICIPALITY INTEGRATED DEVELOPMENT PLAN 2022 - 2027
63
The approved minimum level of service provision (RDP level of service) for potable water for Sol Plaatje Local
Municipality is as follows:
• • Formal Settlements: 1 communal standpipe per 200m radius at 25l/capita/day
• Informal Settlements: 2 communal standpipes per 200m radius at 25l/capita/day
At the date of the writing of this report no data was available for the breakdown of service provision for the
different wards within the municipal jurisdiction, and no clear figures for the provision of services above, at,
or below the stated minimum level of service could be provided.
However, it is stated that an approximate backlog in service delivery to approximately 7,334 households
(29,336 people) exist. This backlog represents an estimated 11% of the anticipated population figure of
273,778 people for the year 2022, as put forward in the Municipal Socio-Economic Profile for Sol Plaatje Local
Municipality dated 2021.
The main reasons for the backlog have been identified by Sol Plaatje Local Municipality as the following:
• “Mushrooming” of informal settlements – The sudden and unsanctioned settlement of vacant
land within the municipal borders, overnight, with little concern for the greater developmental
framework or township development.
• Unexpected population growth.
• Influx of persons from rural and smaller urban centres for several reasons, job seeking being one
of the major factors. A large catalyst of this population influx has been identified as the Sol Plaatje
Metropolitan University, attracting youth to the municipality in search of higher education
opportunities.
3.2.2.4. WATER DEMAND:
Soll Plaatje Local Municipality consists of two Demand Zones, namely Kimberley and Ritchie.
From the Sol Plaatje Local Municipality Water Master Plan, the estimated Annual Average Daily Demand
(AADD) for these two zones may defined as follows:
Demand
Zone
Growth/Annum
%
Annual Average Daily Demand (m3/day)
Estimated as per WMP Actual Current
5-year Forecast
20-year Forecast 2018 2022 2038
Kimberley 2.2 73,850 83,339 115,000 90,000 100,345 139,080
Ritchie 4.5 2,150 2,680 5,160 6,000 7,477 14,470
Total 76,000 86,019 120,160 96,000 114,815 145,080
From the above it can be seen that in the case of the Kimberley demand zone there exists a negligible
difference between the actual demand experienced for the year 2022 of 90,000m3/day and the estimated
(less than 10%). However, in the case of the Ritchie demand zone, a large deficit exists between the actual
demand of 6,000m3/day experienced and the estimated figures.
In the light of the above, for this report, it will be assumed that the AADD figures as obtained from Sol Plaatje
Local Municipality are accurate and correct. Furthermore, it will be assumed that average growth of water
consumption will be maintained at the rates per annum as proposed for the Water Master Plan and reflected
above.
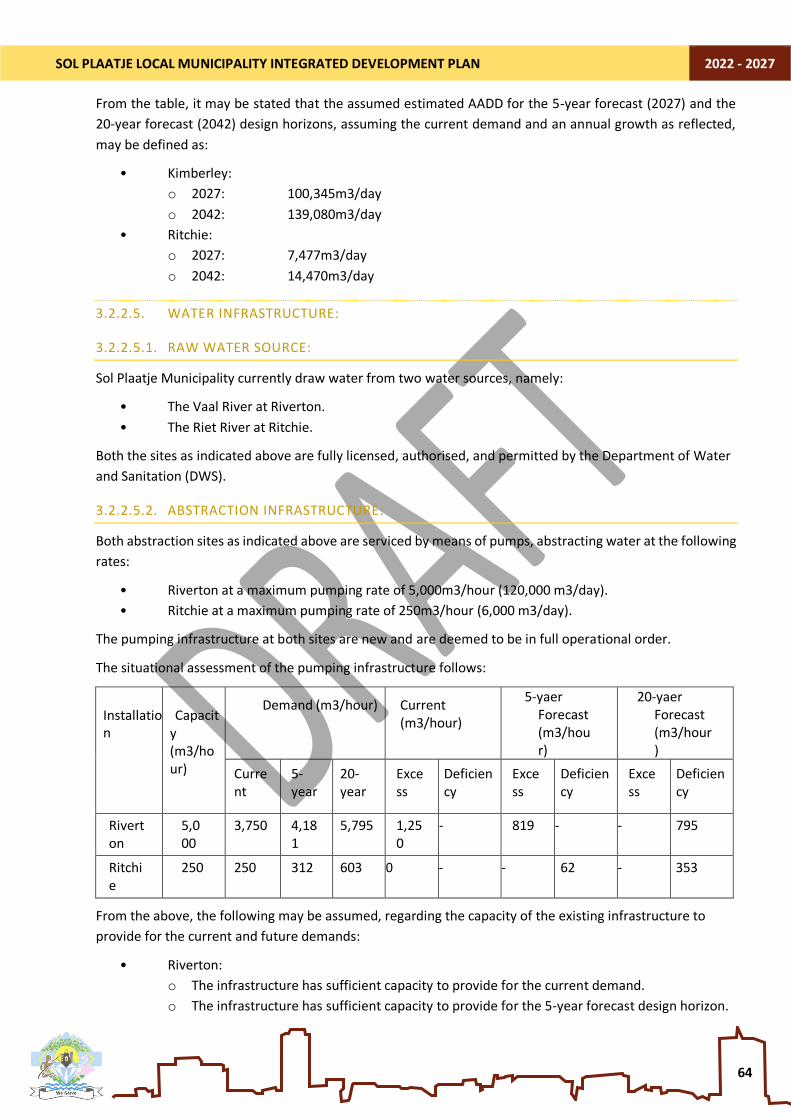
SOL PLAATJE LOCAL MUNICIPALITY INTEGRATED DEVELOPMENT PLAN 2022 - 2027
64
From the table, it may be stated that the assumed estimated AADD for the 5-year forecast (2027) and the
20-year forecast (2042) design horizons, assuming the current demand and an annual growth as reflected,
may be defined as:
• Kimberley:
o 2027: 100,345m3/day
o 2042: 139,080m3/day
• Ritchie:
o 2027: 7,477m3/day
o 2042: 14,470m3/day
3.2.2.5. WATER INFRASTRUCTURE:
3.2.2.5.1. RAW WATER SOURCE:
Sol Plaatje Municipality currently draw water from two water sources, namely:
• The Vaal River at Riverton.
• The Riet River at Ritchie.
Both the sites as indicated above are fully licensed, authorised, and permitted by the Department of Water
and Sanitation (DWS).
3.2.2.5.2. ABSTRACTION INFRASTRUCTURE:
Both abstraction sites as indicated above are serviced by means of pumps, abstracting water at the following
rates:
• Riverton at a maximum pumping rate of 5,000m3/hour (120,000 m3/day).
• Ritchie at a maximum pumping rate of 250m3/hour (6,000 m3/day).
The pumping infrastructure at both sites are new and are deemed to be in full operational order.
The situational assessment of the pumping infrastructure follows:
Installation
Capacit
y (m3/hour)
Demand (m3/hour) Current (m3/hour)
5-yaer Forecast (m3/hour)
20-yaer Forecast (m3/hour)
Current
5-year
20-year
Excess
Deficiency
Excess
Deficiency
Excess
Deficiency
Riverton
5,000
3,750 4,181
5,795 1,250
- 819 - - 795
Ritchie
250 250 312 603 0 - - 62 - 353
From the above, the following may be assumed, regarding the capacity of the existing infrastructure to
provide for the current and future demands:
• Riverton:
o The infrastructure has sufficient capacity to provide for the current demand.
o The infrastructure has sufficient capacity to provide for the 5-year forecast design horizon.

SOL PLAATJE LOCAL MUNICIPALITY INTEGRATED DEVELOPMENT PLAN 2022 - 2027
65
o The infrastructure does not have sufficient capacity to provide for the 20-year forecast
design horizon.
• Ritchie:
o The infrastructure has sufficient capacity to provide for the current demand but is found to
be at maximum capacity, with no available spare capacity.
o The infrastructure does not have sufficient capacity to provide for the 5-year forecast design
horizon.
o The infrastructure does not have sufficient capacity to provide for the 20-year forecast
design horizon.
The following key issues have been identified with regards to the operation of the pumping infrastructure as
indicated above:
• Riverton:
o Abstraction pumping infrastructure consists of 4 pumps that must operate at full capacity
(all 4 pumps in operation) to meet required demand, with no standby pumps for duty cycling
in the event of pump failure.
• Ritchie:
o Abstraction pumping infrastructure experiences recurrent flooding during the rainy season
and periods of abnormal and high rainfall. This situation resalts in disruptions to pump
operation and supply to Ritchie water treatment works.
o Abstraction infrastructure must be upgraded to provide for future demand.
3.2.2.6. WATER TREATMENT WORKS (WTW):
Sol Plaatje Local Municipality is currently served by two Water Treatment Works, namely:
• Riverton: Conventional WTW with a maximum daily capacity of 162.0Ml/day (162,000 m3/day)
• Ritchie: Conventional WTW with a maximum daily capacity of 6.0Ml/day (6,000 m3/day)
Riverton Water Treatment Works consists of two modules, one aged and one new, with individual daily
capacities of 54,000 m3/day and 108,000m3/day, respectively. The aged module is currently in a state of
decreased operation due to need for repair on damaged components, severely affecting available
operational capacity to the order of approximately 50% (27,000 m3/day). The new module is deemed to be
100% operational, however some maintenance is required.
Ritchie Water Treatment Works consist of an aged installation. The installation is operational; however, it is
deemed to be over capacity, and needs refurbishment and upgrading to restore full functionality to meet
both current and future demands.
The situational assessment of the WTW infrastructure follows:
Installation
Capacity (Ml/day)
Demand (Ml/day) Current (Ml/day) 5-yaer
Forecast (Ml/day)
20-yaer Forecast (Ml/day)
Current
5-year 20-year Excess
Deficiency
Excess
Deficiency
Excess
Deficiency
Riverton
162.0
90.0 100.3 139.1 72.0 - 61.7 - 22.9 -
Ritchie 6.0 6.0 7.5 14.5 0.0 - - 1.5 - 8.5

SOL PLAATJE LOCAL MUNICIPALITY INTEGRATED DEVELOPMENT PLAN 2022 - 2027
66
From the above, the following may be assumed, regarding the capacity of the existing infrastructure to
provide for the current and future demand:
• Riverton:
o Current available operational capacity is 135,000m3/day.
o The infrastructure has sufficient capacity to provide for the current demand.
o The infrastructure has sufficient capacity to provide for the 5-year forecast design horizon.
o The infrastructure has sufficient capacity to provide for the 20-year forecast design
horizon.
• Ritchie:
o The infrastructure has sufficient capacity to provide for the current demand but is found to
be at maximum capacity, with no available spare capacity.
o The infrastructure does not have sufficient capacity to provide for the 5-year forecast
design horizon.
o The infrastructure does not have sufficient capacity to provide for the 20-year forecast
design horizon.
The following key issues have been identified by Sol Plaatje Local Municipality with regards to the
operation of the pumping infrastructure as indicated above:
• Riverton Water Treatment Works:
o Aged module to be refurbished and repaired to restore functionality, and full operational
capacity to Riverton WTW. Scope of repairs include but may not be limited to the filtration,
valves, and electrical installations.
o New module to be maintained and refurbished to ensure full operational capacity is
maintained.
• Ritchie Water Treatment Works:
o Infrastructure must be upgraded to provide for future demand.
3.2.2.7. TRUNK MAINS
Sol Plaatje Local Municipality has several trunk mains for the conveyance of water.
The trunk mains may be divided into two systems, namely that serving Kimberley and Ritchie respectively,
and may be defined as follows:
• Kimberley System:
o Main 1 - 450mm Ø ND steel main from Riverton abstraction pumps to Riverton WTW,
approximate length 0.6km.
o Main 2 - 750mm Ø ND steel main from Riverton abstraction pumps to Riverton WTW,
approximate length 0.6km.
o Mian 3 - 600mm Ø ND steel main (alongside 900mm Ø ND main as below) from Riverton
WTW pump station to “Midstation”, approximate length 20km.
o Mian 4 - 900mm Ø ND steel main (alongside 600mm Ø ND main as above) from Riverton
WTW pump station to “Midstation”, approximate length 2.0km.
o Main 5 - 600mm Ø ND steel main from “Midstation” to rear of Seochoaring Street Shoprite
Centre approximate length 5.3km.
o Main 6 - 2 x 600mm Ø ND steel mains From rear of Seochoaring Street Shoprite Centre to
Newton Reservoir, approximate length 4.5km.

SOL PLAATJE LOCAL MUNICIPALITY INTEGRATED DEVELOPMENT PLAN 2022 - 2027
67
o Main 7 - 900mm Ø ND steel main from “Midstation” to Carters Ridge, approximate length
9.8km.
o Main 8 - 600mm Ø ND steel main (alongside 700mm Ø ND main as below) from Carters Ridge
to Newton Reservoir, approximate length 3.8km.
o Main 9 - 700mm Ø ND steel main (alongside 600mm Ø ND main as above) from Carters Ridge
to Newton Reservoir, approximate length 3.8km.
• Ritchie System:
o Main 10 - 300mm Ø ND uPVC main from abstraction pumps to Ritchie WTW.
The trunk mains from the Riverton extraction infrastructure to the Riverton WTW (mains 1 and 2), are aged
but in operational condition, with a combined total maximum flow rate of 1.4m3/s. The trunk from Riverton
WTW to Newton Reservoir (mains 3 to 9) are aged yet still functional, however minor to major leaks are
experienced along the length of these mains, leading to intermittent emergency maintenance and disruption
of supply to Newton reservoir. Furthermore, a portion of the 900mm Ø ND trunk main from “Midstation” to
Carters Ridge (main 9) is in a severe state of destress and needs urgent replacement. The combined total
maximum flow rate of these mains is 1.2m3/s.
The 300mm Ø trunk main from the Ritchie abstraction pumps to the WTW (main 10) is new and good working
order, with a total maximum flow rate of 0.12m3/s
The situational assessment of the trunk main infrastructure follows:
System
Area of Supply
Total Max Capacity (m3/s)
Demand (m3/s)
Situational Assessment
Current (m3/s)
5-yaer Forecast (m3/s)
20-yaer Forecast (m3/s)
From To Current
5- year
20- year
Excess
Deficiency
Excess
Deficiency
Excess
Deficiency
Kimberley
Abstraction
WTW 1.40 1.04 1.16
1.61
0.36 - 0.24 - - 0.21
WTW Reservoir
1.20 1.04 1.16
1.61
0.16 - 0.04 - - 0.41
Ritchie Abstraction
WTW 0.12 0.07 0.09
0.17
0.05 - 0.03 - - 0.05
From the above, the following may be assumed, regarding the capacity of the existing infrastructure to
provide for the current and future demand:
• Kimberley System:
o Mains 1 and 2 have sufficient combined capacity to serve both the current and 5-year
forecasted demands but lack capacity to supply the 20-year forecast.
o Mains 3 to 9 have sufficient combined capacity to serve both the current and 5-year
forecasted demands but lack capacity to supply the 20-year forecast.
• Ritchie System:
o Main 10 has sufficient capacity to serve both the current and 5-year forecasted demands but
lack capacity to supply the 20-year forecast.

SOL PLAATJE LOCAL MUNICIPALITY INTEGRATED DEVELOPMENT PLAN 2022 - 2027
68
The following key issues have been identified by Sol Plaatje Local Municipality with regards to the operation
of the trunk mains as described above:
• Kimberley system trunk mains experience leaks throughout and need
maintenance and repair.
• 900mm Ø ND steel trunk main from “Midstation” to Carters Ridge (main 9) in severe state of
destress and needs urgent replacement.
• Valves on trunk mains from :Midstation” require replacement.
3.2.2.8. BULK PUMP STATIONS:
There are several bulk water pump stations in Sol Plaatje Municipality. The pump stations may be divided
into two systems, namely that serving Kimberley and Ritchie respectively, and may be defined as follows:
• Kimberley System:
o Old Riverton pump station to Newton reservoir equipped with 2 duty pumps and no standby
pump.
o New Riverton pump station to Newton reservoir equipped with 4 duty pumps, with
allotment for additional 2 pumps. No standby pump is provided.
o Newton distribution pumps station to the distribution network equipped with 3 duty pumps
and no standby pump.
o Newton inline booster pumps to Newton distribution pumps equipped with 2 duty pumps
• Ritchie:
o Raw water dam pumps to WTW equipped with 1 duty pump and 1 standby pump.
o Potable distribution pumps to distribution network equipped with 3 duty pumps, 1 standby
pump.
The old Riverton pump station is equipped with 2 pumps in operable order; however, this pump station is
not used as the new pump station was constructed to replace it functionally. Furthermore, this pump station
does not deliver to the entire Kimberley trunk main system as described in 2.2.5.4, but services only the
600mm Ø ND trunk mains (mains 3,5, and 6). Considering the aforementioned, this pump station is
considered to lack sufficient capacity to serve the current and future AADD and is relegated to emergency
use in the event of complete failure of the new Riverton pump station.
The new Riverton pump station contains sufficient capacity to meet the existing peak demand under full
operational capacity as well as the 5-year forecast; however, lacks capacity to provide for the 20-year
forecast. It must be noted that full operational capacity is achieved with all four duty pumps operating in
parallel. This situation does not permit for a standby pump and duty cycling. In the event of pump failure
occurring a sharp decline of the total capacity that may be delivered will occur. It should be noted that
provision was made in this pump station for the installation of an additional 2 pumps to expand the pump
station operation as and when required. Assuming the addition of identical pumps, the pump station boasts
the potential maximum total delivery of approximately 1.8m3/s if all 6 pumps are to operate in parallel, as
well as the potential for the institution of a duty cycle and standby system in the event of unexpected pump
failure.
The Newton distribution pumps contain sufficient capacity to meet the existing peak demand of high laying
areas and ensure adequate pressure to such areas under full operational capacity. i.e., All 3 pumps operating
in parallel. However, it must be noted that during low water level operation of the Newton reservoirs these
pumps do not experience sufficient net positive suction head to operate at full capacity, requiring the

SOL PLAATJE LOCAL MUNICIPALITY INTEGRATED DEVELOPMENT PLAN 2022 - 2027
69
utilisation of on-site booster pumps to supply water to the distribution pumps. This results in the limiting of
available reservoir capacity that may be utilized. Furthermore, the need for full operational capacity to
provide for the demand does not permit for a standby and duty cycling in the event of pump failure occurring,
thus resulting in the sharp decline of the total capacity that may be delivered.
All pumping infrastructure in Ritchie contains sufficient capacity to meet the existing peak demands, while
maintaining one pump on standby; however, the infrastructure does not contain sufficient capacity to supply
the AADD for the 5- and 20-year forecast.
The following key issues have been identified by Sol Plaatje Local Municipality with regards to the operation
of the bulk pump stations as described above:
• New Riverton pump station to be fitted with one additional pump to provide for duty cycling and
standby operation.
• Distribution pump system at Newton reservoir requires revision and upgrading to ensure full
operation capacity and reservoir capacity utilization, as well as inclusion of additional pump to
provide for duty cycling and standby operation.
• Ritchie pumping infrastructure to be upgraded to provide for future demand.
3.2.2.9. WATER STORAGE INFRASTRUCTURE:
Sol Plaatje Local Municipality has two reservoir sites, namely:
• Newton Reservoir Complex serving Kimberley comprising of 4 ground level reservoirs with a
total maximum capacity of 261.5Ml.
• Ritchie Reservoir Complex serving Ritchie and Moderrivier comprising of 4 ground level
reservoirs with a total maximum capacity of 5.7Ml.
• Furthermore, Sol Plaatje Local Municipality also have five elevated storage towers, namely:
• Newton Tower with a capacity of 0.375 Ml.
• Roodepan Tower with a capacity of 0.75Ml (4 hours of AADD for the Roodepan suburb).
• Ritchie Tower.
• Ritchie WTW Tower.
• Moderrivier Tower.
Of the five elevated towers, only Roodepan tower serves a storage function, while the remainder are either
defunct or serve as balancing tanks within the water network.
The situational assessment of the reservoir infrastructure follows:
Reservoir
Name
Storage Capacity (Ml)
Demand (Ml/day)
Situational Assessment
Hours of AADD
Current 5-year 20-year Current 5-year 20-year
Newton 261.5 90.0 100.3 139.1 69.7 62.6 45.1
Ritchie 5.7 6.0 7.5 14.5 22.8 18.2 9.5
From the above, the following may be assumed, regarding the capacity of the existing infrastructure to
provide for the current and future demand:

SOL PLAATJE LOCAL MUNICIPALITY INTEGRATED DEVELOPMENT PLAN 2022 - 2027
70
• Newton Reservoir Complex contains sufficient capacity to provide for both the current and 5-
year forecasted demand; however, falls short on the required 48hour of AADD minim storage
requirements for the 20-year forecast.
• Ritchie Reservoir Complex is at present over capacity and does not contain sufficient capacity for
the current demand, with a shortfall in storage time of approximately 25.2hours.
The following key issues have been identified by Sol Plaatje Local Municipality with regards to the operation
of the water storage infrastructure as described above:
• Ritchie reservoir to be upgraded and refurbished to provide for the current and future demand.
3.2.2.10. WATER DISTRIBUTION AND RETICULATION NETWORK:
Sol Plaatje Local Municipality has at present a distribution and reticulation network consisting of
approximately 800km of pipes of varying pipe materials and diameters. This network is aged and a poor state
of repair with varying degrees of destress experienced throughout.
The total measured consumption within the reticulation network is recorded as approximately 45,000
m3/day, 50.0% of the total AADD for 2022 as indicated 1.2.3 (90,000 m3/day). A disparity between metered
consumption and actual treated demand is expected as a matter of course, due to the occurrence of losses
and unaccounted for water consumption, with normal design assumption being in the order of 10 to 15% of
the AADD. However, such a large disparity is indicative of heavy destresses with in a water distribution
network, leading to copious quantities of water losses, and/or the occurrence elevated levels of non-metered
consumptions.
The following key issues have been identified by Sol Plaatje Local Municipality with regards to the operation
of the distribution and reticulation networks as described above:
• Distribution and reticulation network experience elevated levels of destress throughout the
system, leading to intermittent- to regular emergency maintenance and disruption of supply to
the consumers.
• Elevated levels of losses due to leaks in destressed distribution and reticulation infrastructure.
• Elevated levels of non-metering of consumption leading to non-revenue water consumption.
3.2.2.11. WATER QUALITY:
Water quality monitoring in the Sol Plaatje Local Municipality is done daily from source to consumer, with an
average compliance of 98%. Operational, compliance, and point of use monitoring, and a full SANS analysis
is completed yearly
The average Blue-drop score achieved for the latest available assessment years is 79.26%. these assessment
years and scores achieved may be defined as.
• 2014 – 81.46%
• 2012 – 72.10%
• 2011 – 84.23%
The following key issues have been identified by Sol Plaatje Local Municipality with regards to the water
quality and monitoring as described above
• Maintenance, planning, and status compromises the achieved Blue-Drop scores.
• Technical operational capacity is inadequate, thus affecting performance.
SOL PLAATJE LOCAL MUNICIPALITY INTEGRATED DEVELOPMENT PLAN 2022 - 2027
71
• Risk-based resource allocation is not applied.
3.2.2.12. EXTENSION OF WATER SERVICES:
The following projects are planned to facilitate the extension of the existing water services.
• Upgrading and refurbishment of the existing bulk water supply infrastructure.
3.2.3. SANITATION
3.2.3.1. SANITATION DEVELOPMENT PLAN (SDP):
At present Sol Plaatje Local Municipality does not have a valid SDP in place as it forms part of the WSDP as
described 2.2.1, with the existing WSDP having a validity period of 5 years from 2015 to 2020.
The process of updating the WSDP is underway and will be reviewed, approved, and adopted within the 2022
fiscal year, encompassing a five-year period from 2022 to 2027.
As indicated in 1.3 there is a Sewer Master Plan (SMP) developed by GLS Consulting, dated 2018.
3.2.3.2. NATIONAL TARGETS FOR THE MILLENNIUM DEVELOPMENT GOALS (MDG):
Sol Plaatje Local Municipality currently adhere to the national targets for the MDG for the provision of
sanitation to at least half of the population within their jurisdiction.
3.2.3.3. SERVICE PROVISION:
The approved minimum level of service provision (RDP level of service) for sanitation for Sol Plaatje Local
Municipality is as follows:
• • Formal Settlements: 1 house connection per stand
• • Informal Settlements: 5 households per chemical toilet unit
The level of service delivered in the Sol Plaatje Local Municipality may defined as follows:
• • Households provided with free basic service: 3,979
• • Households provided with higher level service: 64,466
At the date of the writing of this report no data was available for the breakdown of service provision for the
different wards within the municipal jurisdiction.
However, an approximate backlog (less than minimum RDP level) in service delivery to 7,334 households
(29,336 people) exist. This backlog represents an estimated 11% of the anticipated population figure of
273,778 people for the year 2022, as put forward in the Municipal Socio-Economic Profile for Sol Plaatje Local
Municipality dated 2021.
The main reasons for the backlog have been identified by Sol Plaatje Local Municipality as the following:
• “Mushrooming” of informal settlements – The sudden and unsanctioned settlement of vacant
land within the municipal borders, overnight, with little concern for the greater developmental
framework or township development.
• Unexpected population growth.
• Influx of persons from rural and smaller urban centres for several reasons, job seeking being one
of the major factors. A large catalyst of this population influx has been identified as the Sol Plaatje

SOL PLAATJE LOCAL MUNICIPALITY INTEGRATED DEVELOPMENT PLAN 2022 - 2027
72
Metropolitan University, attracting youth to the municipality in search of higher education
opportunities.
3.2.3.4. EFFLUENT GENERATION:
Sol Plaatje Local Municipality consists of three sewer effluent drainage zones, namely Kimberley, Ritchie, and
Riverton. While Riverton and Ritchie drainage zones are served by singular wastewater treatment works
(WWTW), Kimberley consists of two sub-drainage zone served by two WWTW.
• Homevale sub-drainage zone.
• Beaconsfield sub-drainage zone.
From the Sol Plaatje Local Municipality Sewer Master Plan compiled by GLS Consulting dated 2018, the
Estimated Peak Daily Dry Weather Flow (PDDWF) for these four zones may defined as follows:
Drainage Zone
Sub-Zone
Growth/Annum
%
Annual Average Daily Demand (m3/day)
Estimated as per SMP
Actual Current Ass. 2022
5-year
Forecast
20-year Forecast
2018 2022 2038
Kimberley Homevale 3.1 33,300 38,792 61,000 38,792 45,189 83,216
Beaconsfield 4.7 9,200 11,575 23,100 11,575 14,563 36,491
Ritchie - 3.5 1,700 2,020 3,400 2,020 2,399 4,774
Riverton - 3.4 133 157 261 157 186 362
Total 44,333 52,544 87,761 52,544 62,337 124,843
Due to lack of accurate actual flow volumes available from Sol Plaatje Local Municipality, the estimated flow
for the year 2022 will be assumed to be accurate and correct for the remainder of this report.
3.2.3.5. SANITATION INFRASTRUCTURE
3.2.3.5.1. GRAVITATIONAL NETWORK:
The gravitational sewer network of Sol Plaatje Local Municipality is aged but still in working order, and
consists of approximately 560km of pipes of varying pipe material and diameters ranging from 100mm Ø to
650mm Ø.
The following key issues have been identified by Sol Plaatje Local Municipality with regards to the operation
of the gravitational networks as described above:
• Of the gravitational pipe network, approximately 20km may be near or at maximum operational
capacity with less than 30% spare flow capacity available, resulting in higher occurrences of
overflow particularly in “township” areas.
3.2.3.5.2. BULK OUTFALL PIPELINES:
At present Sol Plaatje Local Municipal have 5 bulk outfall pipelines within the Kimberley drainage zone,
draining to the two respective WWTW.
• Homevale Sub-drainage Zone:

SOL PLAATJE LOCAL MUNICIPALITY INTEGRATED DEVELOPMENT PLAN 2022 - 2027
73
o o Roodepan Outfall: 450mm Ø
o o Goga Outfall: 500mm Ø to 900mm Ø
o o Galeshewe Outfall: 450mm Ø to 1050mm Ø
o o Phaka Mabija (Transvaal) Outfall: 600mm Ø to 1050mm Ø
• Beaconsfield Sub-drainage Zone:
o o Grandon/ Cape Street Outfall: 225mm Ø to 565mm Ø
The above bulk outfall pipelines are all of varying age and condition, however all are considered to be in fair
operational condition.
The following key issues have been identified by Sol Plaatje Local Municipality with regards to the operation
of the bulk outfall pipelines as described above:
• Elevated levels of foreign material and debris experienced in outfall pipelines due to cumulative
ingress from upstream gravitational network and direct deposition by community, resulting in
obstruction of flow and intermittent to regular overflow of infrastructure.
3.2.3.5.3. PUMP STATIONS:
Sol Plaatje Local Municipality is served by 36 sewer pump stations throughout the three drainage zones.
• Kimberley Drainage Zone:
o Homevale Sub-drainage zone: 18 pump stations
o Beaconsfield Sub-drainage zone: 13 pump stations
• • Ritchie Drainage Zone: 4 pump stations
• • Riverton Drainage Zone: 3 pump stations
The above pump stations are all of varying age, condition, and state of repair, and as of the date of this report
no detailed list of defects is available for the individual pump stations.
It must be noted that a comprehensive study must be undertaken to identify and catalogue the state of all
sewer pump stations with the Sol Plaatje municipal jurisdiction.
The following pump stations are deemed, by vertu of the Sol Plaatje Sewer Master Plan dated 2018, not to
contain sufficient capacity to serve the current demand:
• Homevale Sub-drainage Zone:
o Eagle Street pump station
o Hilcrest pump station
o Club 2000 pump station
• Beaconsfield Sub-drainage Zone:
o Southridge pump station
o Kimberley Airport pump station
The following key issues have been identified by Sol Plaatje Local Municipality with regards to the operation
of the sewer pump stations as described above
• Insufficient capacity of pump stations results in intermittent overflow of sewer effluent during
periods of high flow volumes.
• Moderate to elevated levels of vandalism experienced at pump stations due to lack of adequate
security and deterrent measures, resulting in recurrent loss of operation as well as abnormal rate
of maintenance and repair.

SOL PLAATJE LOCAL MUNICIPALITY INTEGRATED DEVELOPMENT PLAN 2022 - 2027
74
• Lack of adequate and regular maintenance, resulting in loss of operational capacity.
• Lack of current and detailed condition surveys of pump station infrastructure.
3.2.3.5.4. RISING MAINS:
Sol Plaatje Local Municipality is served by 36 rising mains consists of varying pipe material and diameters
ranging from 100mm Ø ND to 500mm Ø ND.
The rising mains are all of varying age but are deemed to be fair operational order; however, as per the Sewer
Master Plan dated 2018, some rising mains do experience high rates of flow during pumping operation.
The rising mains experiencing high flow rates are as follows:
• Homevale Sub-drainage Zone:
o Legaeng pump station rising main.
o Club 2000 pump station rising main.
• Beaconsfield Sub-drainage Zone:
o Kimberley Airport pump station rising main.
• Ritchie Drainage Zone:
o Motswedi Moosa pump station rising main.
3.2.3.5.5. WASTEWATER TREATMENT WORKS (WWTW):
As stated in 2.3.4 Sol Plaatje Local Municipality consist of three drainage zones, with Ritchie and Riverton
each served by a single WWTW, and Kimberley served by tow WWTW for each of the Homevale- and
Beaconsfield sub-drainage zones, respectively.
These respective WWTW, and the maximum capacities, may be defined as follows:
• Homevale WWTW: Activated Sludge Process, Capacity 48,000m3/day
• Beaconsfield WWTW: Biological Filter process, Capacity 12,000m3/day
• Ritchie WWTW: Activated Sludge Process, Capacity 2,000m3/day
• Riverton WWTW: Anaerobic/ Aerobic Pond Process, capacity 500m3/day The total current
inflow to the above WWTW may be defined as follows:
• Homevale WWTW: 25,000m3/day.
• Beaconsfield WWTW: 6,000m3/day.
• Ritchie WWTW: 1,100m3/day.
• Riverton WWTW: 157 m3/day.
The situational assessment of the WWTW infrastructure follows:
It may be noted that a large discrepancy exists between the anticipate effluent generation figures as
determined in 2.3.4 and the actual figures reflected above.
While a discrepancy between anticipated and actual figures may be expected, such large deficiencies may be
symptomatic of loss of flow throughout the upstream infrastructure of sanitation network.

SOL PLAATJE LOCAL MUNICIPALITY INTEGRATED DEVELOPMENT PLAN 2022 - 2027
75
Drainage Zone
Sub-Zone
Capacity (m3/day)
Effluent Volume (m3/day)
Situational Assessment
Current
5-year Forecast
20-year Forecast
Current (m3/day)
5-yaer Forecast (m3/day)
20-yaer Forecast (m3/day)
Excess
Deficiency
Excess
Deficiency
Excess
Deficiency
Kimberley
Homevale
48,000
38,792
45,189
83,216
9,208
- 2,811
- - 35,216
Beaconsfield
12,000
11,575
14,563
36,491
425 - - 2,563 - 24,491
Ritchie - 2,000 2,020 2,399
4,774
- 20 - 399 - 2,774
Riverton
- 500
157 186 362 343 - 314 - 138
Assuming the estimated PDDF for 2022 are true and correct, then from table 8 above the existing WWTW
are theoretically nearing their operational maximum capacity, except in the case of the Riverton WWTW that
operates well below the maximum capacity available.
The total estimated available spare capacities may be defined as follows:
• Homevale WWTW: 9,208m3/day, approximately 7 years (from 2022) of growth at 3.1%/annum.
• Beaconsfield WWTW: 425m3/day, approximately 1 year (from 2022) of growth at 4.7%/annum.
• Ritchie WWTW: 20m3/day, over capacity; no spare capacity for growth available.
3.2.3.6. EFFLUENT QUALITY:
Effluent quality monitoring in the Sol Plaatje Local Municipality is done weekly by means of internal
laboratory services and resalts submitted through IRIS. Sludge analysis and classification is completed yearly
by independent laboratory services.
The average Blue-drop score achieved for the latest available assessment years is 79.26%. these assessment
years and scores achieved may be defined as.
• 2022 – 36.0%
• 2013 – 56.0%
• 2011 – 76.2%
2.3.7 Extension of Sanitation Services:
The following projects are planned to facilitate the extension of the existing sanitation services.
• Construction of New Carters Ridge Bulk Sewer Gravity Mains.
• Construction of New Carters Ridge Bulk Sewer Pump Station.

SOL PLAATJE LOCAL MUNICIPALITY INTEGRATED DEVELOPMENT PLAN 2022 - 2027
76
3.2.4. ELECTRICAL
3.2.4.1. ELECTRICAL MASTER PLAN:
The Sol Plaatje Local Municipality has a Master Plan pertaining to their electricity network which was
prepared in December 2018. The majority of the information contained in this section was extracted and
quoted from the said Master Plan.
The electrical Master Plan addresses the following:
• Planned future developments and projects in Kimberley and Galeshewe based on input from the
town planning department.
• • Identify problems within the existing infrastructure with reference to safety and
maintenance issues based on random visual site inspections and high- level network
information obtained from the Sol Plaatje Local Municipality.
• Propose and investigate projects to address the needs for both developmental and maintenance
requirements.
3.2.4.2. SERVICE PROVISION:
The approved minimum level of service provision (RDP level of service) for electricity for Sol Plaatje Local
Municipality is as follows:
• Formal Settlements: 60A SP level of service connection, with 20A SP as minimum standard.
• Informal Settlements: 40A SP level of service connection, with 20A SP as minimum standard.
The Cost of Supply and Tariff Study Report – 2021/2022 as received from the SPLM indicates the following
quantity and relevant connection category of existing customers:
• • 1 PH kWh pre-paid: 4,651
• • 3 PH kWh pre-paid: 965
• • 1 PH kWh: 4,370
• • 3 PH kWh: 2,373
• • 3 PH MD & CT’s: 0
• • 3 PH TOU & CT’s: 98
• • TOU RMU & CT/VT’s: 35
• • TOU at HV sub with CB: 1
The number of stands serviced are summarised as follows:
• • Domestic Connections Pre-paid: 54666 households (144GWhr consumption)
• • Domestic Connections Metered: 6418 households (25GWhr consumption)
• • Free basic service: 11980 households (6 GWhr consumption)
The number of associated services such as large single users, institutional etc. (e.g., non-household users)
are summarised as follows:
• Type of User: 248 (147 GWhr consumption)
• Small Power Users (conventional): 270 (16 GWhr consumption)
• Small Power Users (pre-paid): 1288 (4 GWhr consumption)
However, it is stated that an approximate backlog in informal settlements as summarised below exist:

SOL PLAATJE LOCAL MUNICIPALITY INTEGRATED DEVELOPMENT PLAN 2022 - 2027
77
• Lethabo Park – Approximately 1800 Households in total – Currently electrifying only 1166
households.
• Lerato Park – Approximately 2000 Households in total - Electrifying 1500 households in the
next FY 22/23.
The main reasons for the backlog have been identified by Sol Plaatje Local Municipality as the following:
• “Mushrooming” of informal settlements – The sudden and unsanctioned settlement of vacant
land within the municipal borders, overnight, with little concern for the greater developmental
framework or township development.
• Unexpected population growth.
• Influx of persons from rural and smaller urban centres for several reasons, job seeking being one
of the major factors. A large catalyst of this population influx has been identified as the Sol Plaatje
Metropolitan University, attracting youth to the municipality in search of higher education
opportunities.
3.2.4.3. INFRASTRUCTURE MAINTENANCE:
The NDP, based on the current Master Plan, is updated and is valid from 2018 to 2023. However, the electrical
maintenance plan does not exist.
Maintenance is not properly conducted and not scheduled accordingly. An asset care program is currently in
progress which is facilitated by Zutari. Shortage of staff is a critical factor and part of the strategy going
forward is to outsource.
The current and planned maintenance projects for Electrical infrastructure is listed below:
• Final commissioning of 20MVA transformer at Carters Glen Substation.
• Upgrade of MV switchgear at Herlear substation.
• Installation of 2X30MVA transformers at Hadison Park and Galeshewe Substations.
Key issues for maintenance are:
• The Governance of projects
• Budget planning and control thereof
3.2.4.4. ELECTRICAL DEMAND:
Sol Plaatje Local Municipality consists of two Demand Zones, namely Kimberley and Galeshewe.
The Notified Maximum Demand (NMD) from Eskom for the city is 111 MVA and the highest current peak
demand is 105MVA. The municipality has the facility to increase to a maximum demand of 140MVA, but
currently do not require that much; to increase to 120MVA might be a safer option.
The maximum demand and usage from the two intake points (Riverton excluded) are depicted below:
MONTH
2015 2016 2017 2018
Jan 84 591.00 87 254.00 84 507.00 88 578.00
Feb 88 455.00 86 967.00 84 062.00 86 546.00
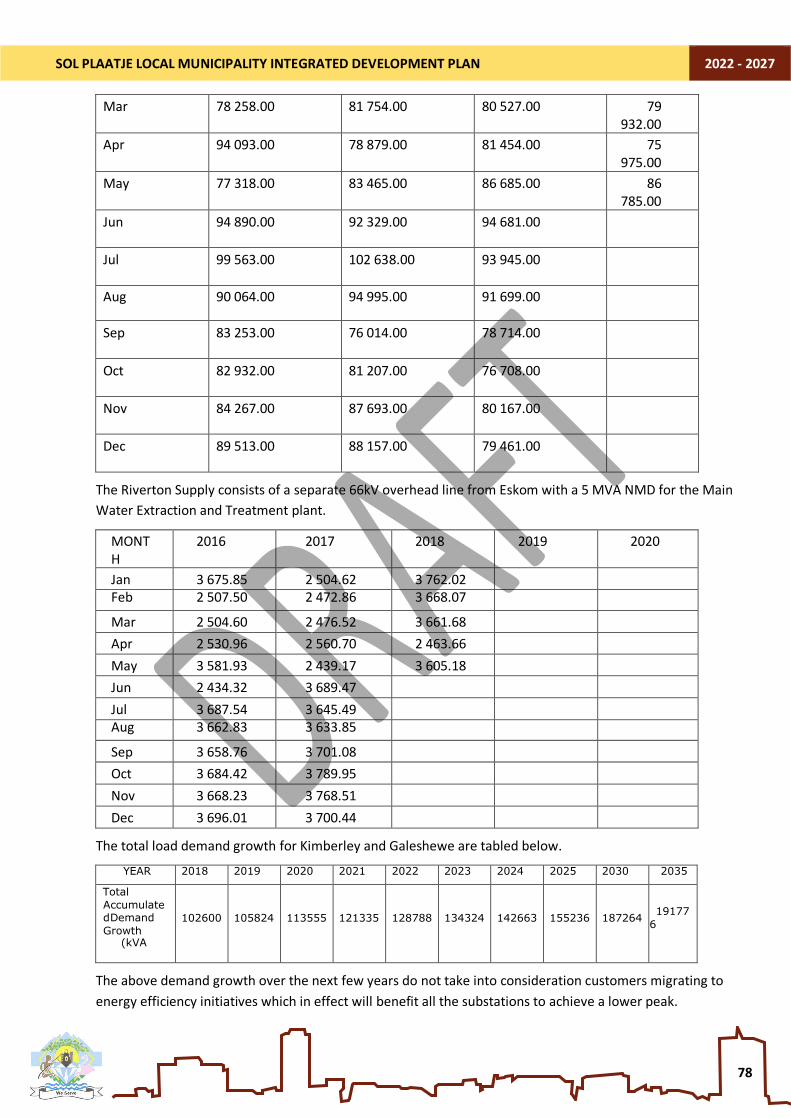
SOL PLAATJE LOCAL MUNICIPALITY INTEGRATED DEVELOPMENT PLAN 2022 - 2027
78
Mar 78 258.00 81 754.00 80 527.00 79 932.00
Apr 94 093.00 78 879.00 81 454.00 75 975.00
May 77 318.00 83 465.00 86 685.00 86 785.00
Jun 94 890.00 92 329.00 94 681.00
Jul 99 563.00 102 638.00 93 945.00
Aug 90 064.00 94 995.00 91 699.00
Sep 83 253.00 76 014.00 78 714.00
Oct 82 932.00 81 207.00 76 708.00
Nov 84 267.00 87 693.00 80 167.00
Dec 89 513.00 88 157.00 79 461.00
The Riverton Supply consists of a separate 66kV overhead line from Eskom with a 5 MVA NMD for the Main
Water Extraction and Treatment plant.
MONTH
2016 2017 2018 2019 2020
Jan 3 675.85 2 504.62 3 762.02
Feb 2 507.50 2 472.86 3 668.07
Mar 2 504.60 2 476.52 3 661.68
Apr 2 530.96 2 560.70 2 463.66
May 3 581.93 2 439.17 3 605.18
Jun 2 434.32 3 689.47
Jul 3 687.54 3 645.49
Aug 3 662.83 3 633.85
Sep 3 658.76 3 701.08
Oct 3 684.42 3 789.95
Nov 3 668.23 3 768.51
Dec 3 696.01 3 700.44
The total load demand growth for Kimberley and Galeshewe are tabled below.
YEAR 2018 2019 2020 2021 2022 2023 2024 2025 2030 2035
Total
Accumulated Demand
Growth (kVA
102600
105824
113555
121335
128788
134324
142663
155236
187264
19177
6
The above demand growth over the next few years do not take into consideration customers migrating to
energy efficiency initiatives which in effect will benefit all the substations to achieve a lower peak.

SOL PLAATJE LOCAL MUNICIPALITY INTEGRATED DEVELOPMENT PLAN 2022 - 2027
79
The following areas on the peripheral of- and outside of Kimberley are supplied by Eskom:
• Camelot
• Magersfontein & Memorial Golf Estate
• Moderrivier
3.2.4.5. INFRASTRUCTURE:
3.2.4.5.1. MUNICIPAL INTAKE:
The city of Kimberley (including Galeshewe) is currently supplied by Eskom at two Distribution Centres
(Homestead and Herlear) at 66 kV. At Homestead, 2 x 80 MVA 132/66 kV transformers are present providing
a firm 80 MVA supply to the city. Herlear also has 2 x 80 MVA 132/66 kV transformers providing another firm
80 MVA supply. With Herlear and Homestead combined, a firm 220 MVA supply exists onto the 66 kV
network (taking into consideration the 20 MVA load supplied from Kimberley Distribution Station that falls
outside the municipality’s supply area).
132/66 kV Substation ESKOM
Transformer Capacity
No of TRFs Installed Capacity
Firm Supply
Homestead 80 MVA 2 160 MVA 80 MVA
Kimberley Distribution Station (KDS)
80 MVA 2 160 MVA 60 MVA*
Kimberley + Galeshewe Total 220 MVA*
3.2.4.5.2. HIGH VOLTAGE NETWORK (66KV):
A 66 kV ring network exists around Kimberley and Galeshewe supplying 10 x 66/11 kV substations (that
include Herlear and HA Morris). The 66 kV network consists of a double circuit of single Wolf conductor each.
Wolf conductor has a current carrying capacity of 470 A and at 66 kV this equates to a full capacity load of
53.7 MVA per conductor. A derating of 80% is applied which would provide a capacity of 43 MVA.
66/11 kV Substation
Transformer Capacity
No of TRFs
Installed Capacity
Firm Supply Capacity
Registered Maximum Demand
HA Morris 20 MVA 2 40 MVA 20 MVA 9,4 MVA
Galeshewe 20 MVA 2 40 MVA 20 MVA 20,6 MVA
Carters Glen 14 MVA 1 14 MVA - 5 MVA
Ashburnham 30 MVA 2 60 MVA 30 MVA 20,3 MVA
Hadison Park 20 MVA 2 40 MVA 20 MVA 18,5 MVA
Hall Street 30 MVA 2 60 MVA 30 MVA 18,3 MVA
Herlear 30 MVA 2 60 MVA 30 MVA 20,6 MVA
South Ridge 30 MVA
14 MVA
1 1 44 MVA 14 MVA 10,4 MVA
MacDougal 20 MVA 1 20 MVA - 1,7 MVA
Midlands 20 MVA 2 40 MVA 20 MVA 5 MVA

SOL PLAATJE LOCAL MUNICIPALITY INTEGRATED DEVELOPMENT PLAN 2022 - 2027
80
3.2.4.5.3. MEDIUM VOLTAGE NETWORK (11KV):
The existing 11kV Network consists of a mixture of overhead- and underground networks constituting the
following:
• Majority of overhead pole mounted network within Galeshewe and older outskirts of Kimberley
being regarded as rural/agricultural zoning in the past such as Landbou Road.
• Majority of underground cable network in Kimberley.
• 11kV/400V Miniature substations, Substations buildings (transformer room/11kV switchgear
room/LV fuse room), and pole mounted transformers.
3.2.4.5.4. LOW VOLTAGE NETWORK (400V/230V):
The existing Low Voltage Network consists of a mixture of overhead- and underground networks constituting
the following:
• Majority of overhead pole mounted network (Bare Aluminium and Aerial Bundle Conductor)
within Galeshewe.
• Majority of underground cable network in Kimberley.
• Overhead (Airdac)-and underground services connections in Galeshewe and Kimberley
respectively supplied from pole mounted distribution boxes and distribution/metering kiosks.
3.2.4.5.5. SCHEDULED SUMMARY OF HV, MV AND LV CONDITION:
3.2.4.5.6. STREET LIGHTING AND COMMUNITY AREA LIGHTING:
The existing area/street lighting consists of the following:
High Voltage Cable Network:
kV Overhead/ Underground
Length Age Functional Destressed
Old New Yes No Yes No
66 Overhead 74 km x x x
11 Overhead 166 km x x x
11 Underground 277 km x x x
Low Voltage Cable Network:
kV Overhead/ Underground
Length Age Functional Destressed
Old New Yes No Yes No
0,4 Overhead 240 km x x x
0,4 Underground 16214 x x x
Mini Sub-Stations:
kVA No of Age Functional Destressed
Old New Yes No Yes No
111940 711 x x x
Sub-Stations:
kVA Name/ ID No Age Functional Destressed
Old New Yes No Yes No
398000 x x x

SOL PLAATJE LOCAL MUNICIPALITY INTEGRATED DEVELOPMENT PLAN 2022 - 2027
81
• Kimberley Street Lighting: main Urban, Residential, Provincial and National Roads consists of
8m MH galvanised street light poles with a combination of high- pressure lamps or LED Lamps.
• Kimberley Street Lighting: secondary Residential and Urban Roads consists of 6m MH
galvanised street light poles and a combination of with high-pressure lamps or LED Lamps.
• Galeshewe Community Area Lighting consists of 30m/40m MH ring-mounted high masts and
25m Mid-hinge high masts with high-pressure or LED Lamps.
• Certain roads of Galeshewe are also equipped with main- and secondary road street lighting as
in Kimberley.
3.2.4.6. QUALITY OF SUPPLY:
Local Supply Authorities are being pressurised by NERSA to measure the quality of supply they provide to
their customers in accordance with “NRS 048-2:2003, ELECTRICITY SUPPLY — QUALITY OF SUPPLY, Part 2:
Voltage characteristics, compatibility levels, limits, and assessment methods”. Hence it is proposed that
quality of supply recorders be strategically positioned at the following network levels:
• Main Intake substations
• 66kV substations
• 11 kV sub- and switching stations and customers
• At 230 V and 400V customers
These recorders can also be used in identifying problem areas and investigating consumer complaints.
3.2.4.7. NETWORK STRENGTHENING & MAINTENANCE PROJECTS:
The following projects as listed in the current Master Plan are planned to facilitate the network strengthening
and maintenance of the existing electricity network.
3.2.4.7.1. VERY SHORT TERM (<1 YEAR):
• Implement drawing office in planning department.
• Implement centralized simulation models to be used.
• Create and approve electrical standards to be used by contractors and own department.
• Implement stringent as-built control on internal and external work done on electrical network.
• • Implement regular meetings between the electrical
department’s various divisions.
• Create and implement Bulk Services Contribution Policy.
• Create and implement Clawback Policy.
• Investigate and cost fire detection, suppression, and intruder alarm options.
• Ensure all 66/11 kV substation have working bulk metering.
3.2.4.7.2. SHORT TERM (1-3 YEARS)
• Complete Automatic Meter Reading Programme on large customers.
• Complete conversion of all hard copy drawings into electronic master drawings of city.
• Complete SCADA installation and migration to Herlear of main controller.
• Audit on MV installations and update to information on assets.
• Meter and ripple control audit (with replacement, installation, and penalties).
• Continue replacement of 66 kV breakers with SF6 breakers.

SOL PLAATJE LOCAL MUNICIPALITY INTEGRATED DEVELOPMENT PLAN 2022 - 2027
82
• Replace Herlear 11 kV breakers.
• Upgrade Hadison Park 2 x 20 MVA transformers with 3 x 30 MVA transformers (and subsequent
replacement of old 11 kV switchgear if funding is available).
• Upgrade Carters Glen Substation to 2 x 20 MVA transformers to facilitate deloading of
Galeshewe.
• Deload Galeshewe to Carters Glen.
• Install firewalls between transformers where needed.
• Install fire detection, suppression, and intruder alarm systems.
• Total review of relay protection systems and grading (Year 1)
• Replacement and upgrades of relay protection systems (Year 2-3)
• Landbouweg Switching Station
• Study Street Switching Station & Cable Work around Fabricia.
• Newton Reservoir 185mm² Supply
• Complete total planning, design, and documentation for Galeshewe Looping system.
• Kimdustria Bulk Supply (depending on urgency and private funding).
• Commence SSEG compliance audit.
• Installation of new “Quality of Supply” system.
3.2.4.7.3. MEDIUM TERM (3-10 YEARS)
• Replace Southridge 14 MVA with a 30 MVA transformer for a firm 30 MVA supply.
• Replace Hadison Park 11 kV breakers (if not done when transformers were upgraded).
• Finish replacement of 66 kV breakers with SF6 breakers.
• Built Central Switching Station with associated cable work.
• Install second 20 MVA transformer at MacDougal Substation.
• Install and commission MacDougal Injection set on both busbars.
• Control Room with mimic panel and SCADA.
• Complete Cassandra 185mm² cable ring back to Herlear.K0588 Sol Plaatje Electrical Masterplan
Rev 0 20181213 2 Page 104 of 111 Rev 0
• Belgravia SS Bulk Supply.
• Kimdustria Bulk Supply
• Diamond Field Admin Board SS Bulk Supply
• KEW Bulk Supply
• Carters Road Breakpoint at Swanssway.
• Replace Galeshewe looping system
• 11 kV switching station for Ronaldsvlei and Alexanderfontein 123 development (time
dependant on private/governmental funding).
3.2.4.7.4. LONG TERM (>10 YEARS)
• New Kimdustria 66 / 11 kV Substation
• New Southern 66 /11 kV Substation
• New Central 66 /11 kV Substation.

SOL PLAATJE LOCAL MUNICIPALITY INTEGRATED DEVELOPMENT PLAN 2022 - 2027
83
3.2.5. SOLID WASTE MANAGEMENT
3.2.5.1. INTEGRATED WASTE MANAGEMENT PLAN (IWMP):
Sol Plaatje Municipality has an Integrated Waste Management Plan in place and is valid for the period 2018
to 2023.
3.2.5.2. SOLID WASTE DISPOSAL SITE (SWDS):
Sol Plaatje Municipality has jurisdiction of one landfill site, namely Kimberley Waste Disposal Site.
Kimberley Waste Disposal Site is licensed for the period 2016 to 2026 and is reviewed every 5 years.
Kimberley Waste Disposal Site caries a classification of Class G and may be used for the disposal of general
household waste.
At present Kimberley Waste Disposal Site experience a rate of waste deposition of approximately
100tons/day, with a total permissible rate of 106tons/day.
From the IWMP, the total cumulative volume of waste to be deposited by end of 2022 of is estimated to be
461,195 tons, and by the end of 2027 is 663,857 tons of waste. It is anticipated that Sol Plaatje Local
Municipality will have to make provision for additional landfill airspace to accommodate the 2027 volume of
waste.
3.2.5.3. REFUSE REMOVAL:
Refuse removal takes place throughout the Sol Plaatje Local Municipality as listed below:
• Kimberley – Daily Removal, with individual suburbs scheduled for servicing on different days of
the week. No refuse removal is undertaken on weekends.
• Galeshewe – Twice per week.
• Ritchie – Twice per week.
• Riverton – Once per week.
• Motswedimosa – Twice per week.
• Roodepan – Twice per week.
Approximately 82.7% of household are serviced, with remote location and poor infrastructure preventing
service delivery being the main cause for the backlog.
Street cleansing operations, namely street sweeping and litter picking, are executed weekly according to an
organised schedule.
3.2.5.4. WASTE MANAGEMENT EQUIPMENT AND VEHICLES:
Sol Plaatje Local Municipality own a fleet of 34 vehicles for the collection and management of waste. Of the
34 vehicles, 12 are non-operational due to mechanical failure.
Equipment Total Operational Non-
Operational
Refuse Compactors 14 11 3
Load Luggers 8 3 5
Tipper Truck 6 1 4

SOL PLAATJE LOCAL MUNICIPALITY INTEGRATED DEVELOPMENT PLAN 2022 - 2027
84
Tractors 4 2 2
Landfill Compactors 2 1 1
3.2.5.5. KEY ISSUES:
The following key issues are experienced with regards to Solid Waste Management:
• Informal communities not serviced by refuse and other waste removal services.
• Illegal dumping on public open space and communal land.
• Lack of municipal driven recycling initiatives, as well as support for community and privet
initiatives.
• Lack of adequate and competent security and access control at Kimberley Waste Disposal Site.
• Lack of maintenance of waste management equipment and vehicles.
• Remote location of household and poor infrastructure prevent access for refuse removal in some
areas.
3.2.6. HUMAN SETTLEMENTS
3.2.6.1. OVERVIEW
It should be emphasised that the provision of housing is not the responsibility of the Local Municipality, but
rather the Department of Cooperative Governance and Human Settlements (COGSTHA). The municipality
had in the past acted as an implementing agent for the department, through appointing and monitoring of
construction contractors. The function was, however taken back by the department in its entirety. The
municipality is responsible for the identification, planning and surveying of land suitable for human
settlement.
Housing remains a major challenge in Sol Plaatje municipality, with backlogs as per the housing applications
currently at approximately 12 000 applications. This is evident by the number of illegal and informal
settlements that have mushroomed over the past decade, sitting currently at 21 informal settlements. Nine
of the 21 informal settlements have however been formally registered and declared as townships, although
infrastructure provision remains a challenge.
It is important that a progressive working agreement between the municipality and COGSTHA is maintained
in order to deal with this issue in an effective manner.
The municipality is transferring title deeds to lawful owners, especially the pre- 1994 stock. This in in line
with the budget speech from the National Minister of Human Settlement. The Minister emphasized how
without the rightful owners, government is unable to revitalise old townships, which are in most cases in a
state of decay. The municipality is looking at collaborating with department of Land Reform and the office of
the Land Commission to create a dedicated unit to deal with fast tracking the issuing of these Title Deeds.

SOL PLAATJE LOCAL MUNICIPALITY INTEGRATED DEVELOPMENT PLAN 2022 - 2027
85
Figure 1: SPLM Human Settlement Patterns
Figure 2: SPLM Township Establishments

SOL PLAATJE LOCAL MUNICIPALITY INTEGRATED DEVELOPMENT PLAN 2022 - 2027
86
3.2.6.2. KEY ISSUES AFFECTING SUSTAINABLE HUMAN SETTLEMENTS
The apartheid legacy of spatially and economically marginalising the poor has meant that people live far from
job opportunities and major services, typically in “dormitory” type residential areas. Many of our people
continue to survive without basic services in the many informal settlements. Even those of our people who
have jobs and a consistent salary find it difficult to sustain a decent quality of life, as they fall outside of the
subsidy bracket but at the same time are unable to afford and access the mortgage products available from
commercial banks.
The current housing development approach with a focus on the provision of state subsidised houses will not
be able to meet the current and future backlog and there are questions related to its financial sustainability.
We need to diversify our approach to include alternative development and delivery strategies,
methodologies and products including upgrading of informal settlements, increasing rental stock, and
promoting and improving access to housing opportunities in the gap market. The core subsidised housing
product must be but one of many approaches.
While new household formation continues to grow at approximately 3% p.a., large numbers of households
continue to have no access to inadequate shelter.
The key challenges include:
• Demand is greater than supply. At current rates of delivery – combined with household growth
fuelled in large part by in-migration from other provinces and urbanisation – the number of
households with inadequate shelter is likely to nearly double
• Well-located land is in short supply, and new housing developments are often located close to the
urban edge, far away from economic opportunities and social amenities, with inadequate integration
into towns and cities. This results in urban sprawl and fuels social problems associated with skewed
apartheid spatial planning. Once land is secured, the statutory requirements to gain planning
approval to develop human settlements on that land are long and complex.
• Accelerating the provision of basic services puts added pressure on municipal bulk infrastructure.
• There is currently a gap in the property market, with numerous families whose household income
exceeds the upper limit for subsidised housing but is not high enough to access mortgage finance
from the private sector (R3500–R9000).
• Several beneficiaries rent out or even sell their state-funded houses, generally informally and at a
fraction of the value of the asset and move back into shacks in informal settlements. This situation is
further complicated by the backlog in transferring title deeds to beneficiaries. Collection rates of
rentals from tenants in state subsidised rental units are low. There is also a lack of commitment
among many homeowners and tenants to maintain their homes.
• The greatest source of dissatisfaction with government’s delivery of housing opportunities is the
perception of being left behind – that some people are benefiting at the expense of others. The
perception is reinforced by a beneficiary selection process that is sometimes inconsistent and
difficult to understand, and which varies from municipality to municipality, as do the quality, integrity
and accuracy of the housing demand data.
• The development of integrated human settlements is currently hampered by inadequate
coordination between the different spheres of government and among provincial government
departments, especially when it comes to aligning bulk infrastructure spending and plans for the
provision of amenities such as schools, clinics, libraries and other community facilities.

SOL PLAATJE LOCAL MUNICIPALITY INTEGRATED DEVELOPMENT PLAN 2022 - 2027
87
• According to Tissington and Dugard (2013), post- 1994 housing delivery still locates the bulk of low-
income housing on the periphery, often far away from socio-economic opportunities.
• As a consequence of rapid urbanisation, new household formation and past racially based planning,
South Africa faces a significant challenge in providing affordable, suitable accommodation to poor
households;
• In addition to living in poor accommodation, many households still do not have access to basic
services in respect of water, sanitation, refuse removal and electricity;
• Poor planning has resulted in a proliferation of marginalised and disconnected settlements;
• Many informal settlements, by way of contrast, are well located with respect to social amenities and
economic opportunities, but lack security of tenure and/or access to adequate basic and social
services; and
• Urban sprawl and low densities contribute to unproductive and inefficient cities as poor households
continue to be marginalised by distance and transportation costs and the lack of agglomeration in
many urban centres undermines economic development and efficiency.

SOL PLAATJE LOCAL MUNICIPALITY INTEGRATED DEVELOPMENT PLAN 2022 - 2027
88
3.3. SPATIAL DEVELOPMENT AND ECONOMIC DEVELOPMENT SYNERGIES
3.3.1. STRATEGIC SPATIAL DIRECTION
The focus is on developing thriving township economies and integrating the various organic urban nodes and
economic corridors to make the appropriate linkages between urban and rural settlements. Once this
strategic spatial vision is realised, implementation will follow through the development of urban
management mechanisms and precinct developments.
At present land locked spaces and sprawling informal settlements dominate the spatial landscape. The land
use patterns within the urban centers are not conducive to investment and robustness. This situation has led
to crime, grime and dilapidation. This IDP places a higher value and importance on spatial governance and
local economic development programs playing a bigger role in transforming the spatial landscape and
resultant consequences.
The strong elements of inequality in the form of racial or class exclusion in the spatial form will be attended
to through programs of public participation and intergovernmental relations. Community involvement will
include participation in developing pride of place and in incoming generating projects. The areas of highest
population densities in locations furthest away from economic opportunities with the least access to basic
services will be targeted for inclusion. In achieving inclusion, subsidized housing and provision thereof will
be located close to the urban core. This will require robust intergovernmental relations as the government
housing developments provide platforms for people to develop and exit the trap of inter-generational
poverty.
Low density areas enjoy the privilege of owning large tracts of land that are located in very close proximity
to economic opportunities. The divide between high- and low-density areas will be linked through a
coordinated effort of spatial planning, local economic development and access to services.
The program to eradicate the housing backlogs will be undertaken in a manner that creates integrated human
settlements. In this respect a partnership with the province and national department of Human Settlements
will be the main focus of intergovernmental relations. 30% of the Northern Cape housing backlog exists in
Sol Plaatje, thus the focus would be to ramp up the planning and delivery of houses, with clear economic
spin offs to boost the local economy.
Housing developments that will build the future should take pride in creating spaces for recreation, sports,
and community gathering. These developments should encompass elements that combat crime, promote
social cohesion and improve the quality of life for the poor. The stubborn problem of the inability to reach
universal coverage on basic services to all will be tackled with integrated infrastructure plans that link to
spatial planning and local economic development potentials.
A special attempt will be made to attract investment to grow the economy over time with the tourism being
developed as the anchor. At the same time, the informal sector and small and micro enterprises will be
supported to participate in the industrial value chain. A substantial number of households are dependent on
social grants. These households will be targeted to be involved in a range of income generating activities to
enable community development, social upliftment and personal growth. These efforts will begin to
fundamentally address the challenges of poverty, vulnerability, inequality and social exclusion.
The biggest challenge confronting many municipalities in South Africa including the Sol Plaatje Municipality
is on addressing service delivery backlogs whilst at the same time meeting the demands arising from

SOL PLAATJE LOCAL MUNICIPALITY INTEGRATED DEVELOPMENT PLAN 2022 - 2027
89
continuous local population growth (combination of natural growth and in- migration) with the concomitant
growth in the number of households.
The problem of cable theft, vandalism of properties and land grab are also huge challenges that Sol Plaatje
Municipality must dealt with for which there are no easy and quick solutions.
The historical backlog together with the resultant demand from growth for new infrastructure, services and
housing surpasses the fiscal capacity of many municipalities. The equitable share and conditional financial
grants as well as own revenue generation are insufficient to meet infrastructure investment requirements.
Own revenue generation by municipalities is constrained by weak local fiscal bases due to low economic
growth and very low employment and household income levels.
As the local state is a developmental state, a special focus on the involvement of all stakeholders will be
developed. All communities will be involved in working to make Sol Plaatje a clean, livable and vibrant city.
The future focus is about leaving a legacy for the next generation, the building blocks of skills, leveraging local
resources and maintaining active engagements with all citizens will modernize the city and provide the
necessary platform for Sol Plaatje leaders to lead the “new deal” for all citizens.
3.3.2. LOCAL ECONOMIC DEVELOPMENT
The LED report highlights low output growth in Frances Baard District as whole including Sol Plaatje
Municipality as a major concern. The traditional mainstay sectors of District economy (mining and
agriculture) show low to negative growth for the past decade while the mining era of the District is slowly
coming to an end. The economy largely missed the opportunity to develop a broad manufacturing base base
on its mineral resources. The public sector has replaced mining as major sector in the area but is marked by
overstaffed administrations in all municipalities.
Apart from low public investment and deteriorating physical infrastructure (due to lack of funds and high
municipal vacancy rates in technical skills, the economy faces challenges in terms of a serious lack of skills, in
turn the main reason behind economic inequalities in the area. Other challenges include political in-fighting,
crime and the general lack of soft infrastructure. In addition, there has been a decline in regional and
international exports from the area with local household expenditure becoming the main demand driver.
There is also evidence of social investors withdrawing support because of the complexities in dealing directly
with communities.
On a positive note, the economy did experience labour intensive growth the past decade. Agriculture is still
a strong sector in the area with some primary processing and export activities growing in products such as
beef and cotton. There is much scope to improve the support for the informal and small business
communities in the area to build the resilience of the local economy – currently a strong focus in economic
development. There are furthermore many examples of new technologies and products that combine both
high tech and low skills that would be appropriate as support strategy for skills development geared for the
demands of the Fourth Industrial revolution. The newly established university of Sol Plaatje is a positive step
not only for skills development but also for social capital building in the District.

SOL PLAATJE LOCAL MUNICIPALITY INTEGRATED DEVELOPMENT PLAN 2022 - 2027
90
The following projects for LED were identified within the previous IDP to be implemented:
Table 5: Proposed LED Projects per IDP 2017 -2022
LED Project Year Amount (R
millions)
NC mLab at Galeshewe SMMeVillage 2018/19 to 2020/21 11.8
Review of the LED Strategy 2020 1
Business expansion Attraction & Retention (BEAR) 2020/21 to 2022/23 45
Northern Cape Innovation Forum N/A 1
Partnership with Genk Municipality in Netherlands 2020 50
Integrated Township Economic Development Programme N/A
Mayibuye Uprising Monument-Kimberley – Frances Baard District 55
Enterprise and Supplier Development: Procurement Opportunities 2020 N/A
Multi-Skills Acquisition and Job Employment Project 2021 N/A
3.3.3. IMPACT OF COVID ON THE ECONOMY
When South Africa entered national lockdown on the 27th of March 2020, the country was already in a
recession and faced severe economic disruptions resulting from structural economic weaknesses, most
notable in energy supply, and significant policy uncertainties. The extraordinary economic challenges and
socio-economic implications of COVID-19 demands/require the focus to be on determining the appropriate
approach to economic recovery and growth.
Countries around the world are not only battling the health threat posed by the COVID-19 pandemic, but
also face an economic crisis as the result of the measures aimed at containing the spread of the coronavirus.
The COVID-19 pandemic is inflicting high and rising human costs worldwide. Nations across the world
implemented isolation measures, lockdowns, and widespread closures to slow the spread of the coronavirus,
protect lives and allow health care systems to manage the influx of people infected by the COVID-19
pandemic. The COVID-19 pandemic is unlike any other, the world has seen in terms of distribution and depth
and has severely impacted economic activity. The global synchronised downturn is expected to dwarf the
losses that triggered the global financial crisis.
South Africa and the Northern Cape are not exempt from the economic shock brought on by the pandemic.
Economic resilience will be key as the world navigates unprecedented circumstances and rebuilds economies
in a post-COVID-19 pandemic future.
The consequences of the COVID-19 pandemic had a profound effect on the global, national and provincial
economy. The pandemic resulted in an unprecedented societal and economic disruption with broad and
deep socio-economic consequences. The pandemic resulted in several problems, including a demand-side
crisis, an economy-wide firm-level liquidity crisis (and resulting solvency crisis), a decline in productivity and
a disruption in global supply chains (Northern Cape Department of Economic Development and Tourism,
2020). Travel bans and the prohibition on the distribution and sale of alcohol between 27 March and 17
SOL PLAATJE LOCAL MUNICIPALITY INTEGRATED DEVELOPMENT PLAN 2022 - 2027
91
August 2020 had a significant impact on the Northern Cape tourism and various industries in the wholesale
and trade sector.
The economic outlook for the Province remains uncertain. In addition to the fallout from the COVID-19
pandemic, the province also faces several pre-existing factors that adversely impact on economic growth,
such as unreliable power supply by Eskom, depressed national economic growth, rising unemployment and
the added pressure of a rapidly increasing population.
3.3.4. CHALLENGES FACED
The slower economic growth is due to various realities facing intermediate city, including SPM reliance on a
single sector (especially mining). This makes SPM vulnerable to changes in mining and international markets,
and to decisions and policies made at national level; for example, the imposition or relaxation of import
tariffs. Compounding this reality is the disappointing state of economic planning at local government level,
or local economic development (LED). The following key challenges are faced by the SPLM with regard to
Local Economic Development and social advancement:
• Declining economic growth since 2011
• Reliance on primary economic resources
• Lack of innovation and manufacturing
• Low skilled labour force
• High unemployment rate
• High Youth unemployment rate
• Low levels of capital spending to support infrastructure maintenance & development
• Increased migration and population growth due to potential for better opportunities
• Illegal mining activities
• Low educational literacy
• Environmental Degradation
• Disinvestment In the Kimberley CBD
• Ageing Infrastructure (Sewer Spillage, Potholes, Stormwater Drainage)
• Crime Levels (Particularly in The CBD Causes Disinvestment)
• Low Revenue Collection Rate
• Land Invasions
3.3.5. PRECINCT DEVELOPMENT FRAMEWORK (PDF)
The following are the Precinct Development Framework that focusses on the catalytic projects for the
advancement of development within the SPLM. The following Precincts were identified for development as
catalytic projects for the municipality:
1) Caters Glen Precinct
2) The Big Hole Tourism Precinct
3) Adventure Precinct
4) Riverton Leisure and Conferencing Precinct
5) Heritage Precinct
6) Kamfersdam Precinct.

SOL PLAATJE LOCAL MUNICIPALITY INTEGRATED DEVELOPMENT PLAN 2022 - 2027
92
3.3.5.1. CATERS GLEN PRECINCT
The Carter’s Glen Large-Scale Mixed-Use Precinct (future precinct) offers opportunities for integrated and
coordinated mixed use developments that include activities such as institutional, offices, commercial and
residential land uses.
The Precinct includes the existing Medi-Clinic Private Healthcare facility and the Public Mental Healthcare
Facility. This precinct will be one the areas that will accommodate large scale urban expansion projects given
the amount of land available and its proximity to existing services.
Map 3: Carters Glen Precinct Plan
3.3.5.2. BIG HOLE & ADVENTURE TOURISM PRECINCTS
Objective:
To contribute to the supply of tourism and recreational facilities.
Strategy:
To promote the establishment of tourism facilities by,
• Protecting the value of the rivers as fulfilling an amenity role
• Creating an enabling environment.

SOL PLAATJE LOCAL MUNICIPALITY INTEGRATED DEVELOPMENT PLAN 2022 - 2027
93
Guidelines:
Support and promote the establishment of low impact recreational and tourism facilities (excluding Golf
Estates).
Interventions;
1. Development to be above the 1:50 year flood line unless an acceptable flood management report
submitted by a professional engineer is approved by the municipality.
2. Environmental (Ecological and Archaeological) and heritage impact assessments are required for new
developments.
3. Agricultural land must not be lost.
4. The agricultural viability of the land may not be negatively impacted.
5. The water quality may not be negatively affected.
6. Upgrade and provide infrastructure to accommodate tourism enterprises in accordance with an
infrastructure master plan.
7. Apply:
a. Economic policy;
b. Land Use Policy;
c. Municipal Incentive Scheme for Tourism Development (when available).
Below depict the boundaries of the Big Hole Tourism Precinct which boasts 62.85ha and the adjoining
Adventure Park Precinct which boasts some 26.75ha.
Map 4: Big Hole & Adventure Tourism Precincts

SOL PLAATJE LOCAL MUNICIPALITY INTEGRATED DEVELOPMENT PLAN 2022 - 2027
94
3.3.5.3. RIVERTON LEISURE AND CONFERENCING PRECINCT
Objective:
To enable the establishment of a Leisure and Conferencing facility outside Kimberly Town.
Guidelines:
• Support and facilitate the establishment of a conferencing venue in conjunction with the
development of a leisure area outside Kimberly Town south of the Riverton area.
Map 5: Riverton Leisure and Conferencing Precinct

SOL PLAATJE LOCAL MUNICIPALITY INTEGRATED DEVELOPMENT PLAN 2022 - 2027
95
3.3.5.4. HERITAGE PRECINCT
Objective:
To enable the protection of areas of heritage significance.
Guidelines:
• Promote and facilitate the protection of the Platfontein Heritage Precinct and its Rock Art.
• Support and promote tourism and hospitality activities in support of the heritage area.
Map 6: Platfontein Heritage Precinct
3.3.5.5. KAMFERSDAM ECO-FRIENDLY PRECINCT
Role and Function:
To be national heritage and conservancy site supported by tertiary educational activities.
Objective 1:
To protect and enhance the Flamingo Conservancy
Guidelines
• Support and facilitate a world-renowned conservation area for flamingos, Northern Cape Fauna
and Flora.
• Support and promote tourism and hospitality activities in support of the conservation area.

SOL PLAATJE LOCAL MUNICIPALITY INTEGRATED DEVELOPMENT PLAN 2022 - 2027
96
Interventions:
• Prepare a precinct and conservancy plan clearly outlining the environmental factors to be in
place to enable a sustainable flamingo conservancy taking consideration of a tertiary institution
on the southern border of the subarea.
• Implement as an interim mechanism the water level management proposals to ensure that the
dam levels remain constant.
• Develop maintain and operate the water care works in such a manner that it contributes to the
aims of maintaining a world flamingo conservancy.
• No permanent residential settlement on the Golf Course.
Objective 2:
To enable the establishment of a tertiary educational facility
Guidelines:
• Support and facilitate the establishment of a tertiary institution in conjunction with the
development of world-renowned conservation area for flamingos, Northern Cape Fauna and
Flora.
Interventions:
• Investigate and determine the viability and execution of establishing a tertiary institution
opposite Colville south of the railway line.
Map 7: Kamfersdam Eco-Friendly Precinct Plan

SOL PLAATJE LOCAL MUNICIPALITY INTEGRATED DEVELOPMENT PLAN 2022 - 2027
97
CHAPTER 4
GOVERNANCE & COMMUNITY NEEDS

SOL PLAATJE LOCAL MUNICIPALITY INTEGRATED DEVELOPMENT PLAN 2022 - 2027
98
4. GOVERNANCE & COMMUNITY NEEDS
This section focusses on the governance structure of the municipality and representation of the community
needs it serves. The community inputs as per the IDP meetings for each of the Wards are presented with all
original documentation attached as annexures.
4.1. SPLM GOVERNANCE
The current structures under which the IDP process and implementation must take place are set out in this
section.
4.1.1. STRUCTURE OF COUNCIL
Figure 3: Structure of Council
4.1.2. COMMITTEES
Based on Section 53 of the Municipal Systems Act 32 of 2000 and the Municipal Structures Act 117 of 1998
Council business have been delegated standing committees noted below:
In terms of section 59 of the Municipal Systems Act, Council delegates the following powers, functions and
duties to the Rules Committee, including the power to sub-delegate:
a) Rules of Order: To develop Rules of Order and amendments thereto, and recommend the same
to Council, in relation to the functioning of committees and Council.
b) Attendance at Meetings: To require any councillor (s) and/or official(s) to appear before the
committee to assist the committee in the performance of its functions.
c) Delegations Register: To develop, review and amend the Delegations Register for
recommendation to Council for approval.
Council (64 Councillors)
Executive Mayor
Mayoral Committee
Portfolio Committee
Municipal Manager
Administration

SOL PLAATJE LOCAL MUNICIPALITY INTEGRATED DEVELOPMENT PLAN 2022 - 2027
99
In terms of Section 59 of the Systems Act, Council hereby delegates the following powers, functions and
duties to the Section 80 Committees including the power to sub-delegate:
• To develop policy and recommend same to the Executive Mayor who in turn tables this to Council
for approval.
• To develop draft bylaws and recommend same to the Executive Mayor who in turn tables this to
Council for approval.
• To develop draft business plans and recommend to the Executive Mayor.
• To comment and make recommendations to the Executive Mayor in regard to the draft IDP and
budget, who in turn tables this to Council for approval.
• To make recommendations in regard to the setting or revision of tariffs, levies, taxes and duties
to the Executive Mayor who in turn tables this to Council for approval.
• To ensure public participation in the development of policy, legislation, IDP’s and budget.
• To monitor the implementation of Council’s IDP, budget, business plans, strategic objectives,
policies and programmes and report herein to the Executive Mayor.
• To assess the performance of service delivery generally within the functional area of the
respective committee (outcomes monitoring) and report to the Executive Mayor.
• To determine the best way, including partnerships and other approaches, to deliver on Council’s
strategies, programmes and services to the maximum benefit of the city and to recommend the
same to the Executive Mayor.
• To identify the needs of the municipality as far as it relates to the functional area of the
committee and to recommend the same to the Executive Mayor.
• To review and evaluate those needs referred to above in order of priority and recommend the
same to the Executive Mayor.
• To ensure that regard is given to stakeholder views and report on the input/outcome of
stakeholder consultation/participation processes to the Executive Mayor.
• To recommend appropriate comments on National and Provincial draft legislation, regulations,
policy frameworks, etc that affects the committee and to submit such recommendation to the
Executive Mayor and Legal Advisor.
• To require councillor(s) and/or official(s) to appear before the committee to assist the committee
in the performance of its functions.
4.1.3. MUNICIPAL ORGANISATION & OPERATIONS
Figure 4: Municipal Organisational Structure
Municipal Manager
Executive Director:
Infrastructure & Services
Executive Director
Finance
Executive Director
Community & Social Services
Executive Director
Corporate Services
Executive Director
Strategy, Economic Development &
Planning Services

SOL PLAATJE LOCAL MUNICIPALITY INTEGRATED DEVELOPMENT PLAN 2022 - 2027
100
4.2. WARDS POLITICAL STRUCTURE
This section indicates the political structure of the ward councillors by political party, gender and ward
councillors per each ward.
Table 6: SPLM Political Party Representation
PARTY MEMBERS WARDS PROPORTIONAL
ANC 32 30 2
DA 14 7 7
EFF 6 6 0
VF+ 3 0 3
GOOD 2 2 0
PA 3 3 0
ACDP 1 0 1
SPSDF 3 0 3
Figure 5: SPLM Political Party Representation (%)
Figure 6: SPLM Councillors Gender Representation
50.0%
21.9%
9.4%
4.7%
3.1%
4.7%1.6%4.7%
ANC DA
EFF VF+
GOOD PA
ACDP SPSDF
61%
39%
Male
Female

SOL PLAATJE LOCAL MUNICIPALITY INTEGRATED DEVELOPMENT PLAN 2022 - 2027
101
Table 7: SPLM Ward Councillors
Ward # Surname Name Political Affiliation PR/Ward
1 Gallant (Ms) Annie ANC Ward 1
2 Brown (Mr) Johannes Emanuel ANC Ward 2
Johnson (Ms) Elizabeth GOOD Ward 2
3 Korkie (Mr) Derick Donivan ANC Ward 3
4 Bopape (Mr) Tebogo Hendry ANC Ward 4
5 Nolitye (Mr) Mncedisi Raphael ANC Ward 5
Mesha (Mr) Prince EFF Ward 5
6 Riet (Ms) Nomganza Rosemary ANC Ward 6
7 Koos (Ms) Lucia Jane EFF Ward 7
Diphahe (Mr.) John Gaolatlhwe ANC Ward 7
8 Sonyoni (Mr) Kagisho John Brendon ANC Ward 8
9 Dioka (Mr) Diteko Isaac ANC Ward 9
10 Landella Simphiwe Thandeka EFF Ward 10
Moses (Ms) Belinda Beryl ANC Ward 10
Molale (Ms) Keitumetse Mary ANC Ward 10
11 Bosman (Ms) Marope Sonja ANC Ward 11
Kgadiete (Mr) Kgotso Vincent ANC Ward 11
12 Mocwana (Mr) Pontsho Moses EFF Ward 12
Ruiter (Mr) Isaac ANC Ward 12
13 Molatudi (Mrs) Margaret Kereditse ANC Ward 13
Wapad (Ms) Rachel GOOD Ward 13
14 Adams (Mr) Emile PA Ward 14
Joseph (Mr) George Harold DA Ward 14
15 Nkukane (Mr) Thapelo Edward ANC Ward 15
16 Kock (Mr) Kenneth Corneels EFF Ward 16
Rammutle (Mr) Casper Bongani ANC Ward 16
17 Maputle Nomazizi Nokhanyo ANC Ward 17
Mouers (Ms) Pearl Mosetsanagape ANC Ward 17
Nathane (Ms) Poelo Elizabeth EFF Ward 17
18 Mofokeng (Mr) Gabriel Potlako ANC Ward 18
19 Lekoma (Mr) Itumeleng Abednego ANC Ward 19
20 Pearce (Ms.) Carol-Ann DA Ward 20
21 Mc Dillon Morne Dylan DA Ward 21
Philander (Ms) Monique PA Ward 21

SOL PLAATJE LOCAL MUNICIPALITY INTEGRATED DEVELOPMENT PLAN 2022 - 2027
102
Ward # Surname Name Political Affiliation PR/Ward
22 Pietersen (Mr) Jahn ANC Ward 22
23 Louw Petrus Johannes Francois DA Ward 23
24 Whittaker Christopher Paul DA Ward 24
25 Fourie (Mr) Ockert Cornelius DA Ward 25
26 Mokwang (Mr) Clifford ANC Ward 26
27 Wagter (Mr) Isak Bear ANC Ward 27
28 Engelbrecht (Ms) Sabrina Tempest ANC Ward 28
White (Mr) Martin Frank ANC Ward 28
Ferris (Ms) Sharifa Banu PA Ward 28
29 Aaron Malebo Constance ANC Ward 29
30 Kok (Mr) Robert ANC Ward 30
31 Lephoi (Mr) Christopher ANC Ward 31
32 Banda (Mr) Frikkie ANC Ward 32
33 Tau Yvonne Kelekegile ANC Ward 33
PR Badenhorst (Ms.) Eleanor Linzi DA PR
PR Esau (Ms) Adriana Justine SPSDF PR2
PR Louw (Mrs) Mariam DA PR
PR Matika (Ms) Eucia Thobeka ANC PR
PR Loff (Mr) Roddy Robert ACDP PR 7
PR Metsimetsi Baby Shadric SPSDF PR 26
PR Niemann (Ms.) Elizabeth DA PR
PR Phiri (Mr) Kamogelo Christopher DA PR
PR Pienaar (Mr) Dennis SPSDF PR
PR Pieterse (Mr) Leopold Heinrich Sarel DA PR
PR Reichert (Mr) Francois VF+ PR 23
PR Smit Johan VF+ PR
PR Van den Berg Hendrik Jakobus VF+ PR
PR Van Rooyen (Mr) Wesley Allistor DA PR
PR Beylefeld (Ms.) Maria Johanna DA PR
PR Boqo (Ms.) Anna Nomvula ANC PR

SOL PLAATJE LOCAL MUNICIPALITY INTEGRATED DEVELOPMENT PLAN 2022 - 2027
103
4.3. SPLM WARDS LOCATIONAL PROFILE
Map 8: SPLM Wards Plan

SOL PLAATJE LOCAL MUNICIPALITY INTEGRATED DEVELOPMENT PLAN 2022 - 2027
104
4.4. WARD PRIORITIES SUMMARY & INPUTS
4.4.1. WARD MEETING SCHEDULES
The inputs from the communities within each of the wards were obtained during the following meeting
schedule (the original copies have been attached as Annexure E).
Table 8: SPLM Ward Community IDP Meeting Schedule
WARD DATE VENUE TIME
1 12-Apr-22 SWEDISH HALL 17:00- 20:00
2 29-Mar-22 ROODEPAN PRIMARY SCHOOL 17:00- 20:00
3 29-Mar-22 HOMELITE SWEDISH HALL 17:00- 20:00
4 29-Mar-22 OLD AGE HOME 17:00- 20:00
5 29-Mar-22 OLD AGE HOME 17:00- 20:00
6 29-Mar-22 THEBEYA KGOMOTSO THUTLO STREET 17:00- 20:00
7 30-Mar-22 OLD ST PAULS 17:00- 20:00
8 30-Mar-22 Housing Support Centre 17:00- 20:00
9 30-Mar-22 EP LEKHELA 17:00- 20:00
10 30-Mar-22 MOLEHABANGWE SCHOOL 17:00- 20:00
11 30-Mar-22 ISAGO PRIMARY SCHOOL 17:00- 20:00
12 30-Mar-22 RECREATION HALL 17:00- 20:00
13 6-Apr-22 RECREATION HALL 17:00- 20:00
14 7-Apr-22 FLOORS HIGH SCHOOL 17:00- 20:00
15 31-Mar-22 VUYELETHU HIGH SCHOOL 17:00- 20:00
16 12-Apr-22 VICTORIA CELEBRATION 17:00- 20:00
17 31-Mar-22 N/A 17:00- 20:00
18 31-Mar-22 HOUSING SUPPORT CENTRE 17:00- 20:00
19 5-Apr-22 HOUSING SUPPORT CENTRE 17:00- 20:00
20 29-Mar-22 N/A 17:00- 20:00
21 N/A N/A 17:00- 20:00
22 5-Apr-22 GREENPOINT HIGH SCHOOL 17:00- 20:00
23 N/A N/A 17:00- 20:00
24 7-Apr-22 N/A 17:00- 20:00
25 6-Apr-22 DUTOITSPAN SKOOL 17:00- 20:00
26 6-Apr-22 N/A 17:00- 20:00
27 6-Apr-22 RIETVALE COMMUNITY HALL 17:00- 20:00

SOL PLAATJE LOCAL MUNICIPALITY INTEGRATED DEVELOPMENT PLAN 2022 - 2027
105
28 11-Apr-22 COLVILLE SWEDISH HALL 17:00- 20:00
29 N/A N/A 17:00- 20:00
30 N/A N/A 17:00- 20:00
31 N/A N/A 17:00- 20:00
32 7-Apr-22 LESEDI DAY CARE CENTREROODEPAN PRIMARY SCHOOL 17:00- 20:00
33 7-Apr-22 BANTU HALL 17:00- 20:00
4.4.2. COMMUNITY REPRESENTATION
The following graphs indicates the number of attendees per each ward (the full attendance registers are
attached as Annexure E)
Figure 7: Community Representation of Wards at IDP Meeting
0 25 50 75 100 125 150 175 200 225
1
2
3
4
5
6
7
8
9
10
11
12
13
14
15
16
17
18
19
20
22
24
25
26
27
28
32
33
Number of Community present at IDP Meeting
War
d N
um
ber

SOL PLAATJE LOCAL MUNICIPALITY INTEGRATED DEVELOPMENT PLAN 2022 - 2027
106
Figure 8: Community Participation at IDP Meetings (% of All)
7.25%
12.10%
9.43%
2.40%
1.91%
2.02%
1.91%
0.98%
1.14%
1.80%
2.40%
1.14%
3.27%
2.40%
5.83%
6.59%
2.45%
6.70%
0.27%
1.04%
5.01%
0.65%
0.65%
1.53%
4.74%
3.54%
5.34%
5.34%
0.11%
0.05%
0% 2% 4% 6% 8% 10% 12% 14%
1
2
3
4
5
6
7
8
9
10
11
12
13
14
15
16
17
18
19
20
22
24
25
26
27
28
32
33
39
53
Percentage of Community Representatives of total IDP Meetings Participation
War
d N
um
ber

SOL PLAATJE LOCAL MUNICIPALITY INTEGRATED DEVELOPMENT PLAN 2022 - 2027
107
4.4.3. COMMUNITY INPUTS
The following section indicates the inputs of communities by providing a summary of the key areas where
the IDP projects should be focused on, the detailed inputs are attached as Annexure F showing the captured
data and Annexure G indicating the original inputs per each ward.
Figure 9: IDP Respondent Inputs: Major Categories (% of all inputs)
Figure 10: All Wards Summarised Inputs
3.72
%
10.33%
54.13%
4.13%
27.69%
Economic Development
Housing
Infrastructure
Service Delivery
Social Development
3.35%
3.77%
4.60%
5.44%
3.77%
12.55%
6.28%
8.37%
20.08%
2.51%
7.95%
7.11%
4.60%
2.51%
7.11%
0% 4% 8% 12% 16% 20% 24%
Cleaning
Economic Development
Education
Electricity
Health
Housing
Lighting
Recreation
Roads
Safety
Sanitation
Service Delivery
Social Facilities
Storm Water
Water

SOL PLAATJE LOCAL MUNICIPALITY INTEGRATED DEVELOPMENT PLAN 2022 - 2027
108
Figure 11: Ward Specific Priorities per Category, number of responses, Wards 1 -17
0 1 2 3 4 5 6 7 8
Infrastructure
Housing
Infrastructure
Infrastructure
Social Development
Infrastructure
Social Development
Infrastructure
Social Development
Economic Development
Infrastructure
Social Development
Housing
Infrastructure
Social Development
Infrastructure
Social Development
Housing
Infrastructure
Infrastructure
Social Development
Housing
Infrastructure
Social Development
Infrastructure
Social Development
Housing
Infrastructure
Social Development
Housing
Infrastructure
Social Development
17
161
51
413
12
11
10
65
43
21
Number of Repondents
War
d N
um
be
r &
Pri
ori
ty C
ate
gory

SOL PLAATJE LOCAL MUNICIPALITY INTEGRATED DEVELOPMENT PLAN 2022 - 2027
109
Figure 12: Ward Specific Priorities per Category, number of responses, Wards 17 - 33
0 2 4 6 8 10 12 14 16
Housing
Infrastructure
Service Delivery
Social Development
Infrastructure
Social Development
Economic Development
Housing
Infrastructure
Service Delivery
Social Development
Infrastructure
Housing
Infrastructure
Service Delivery
Social Development
Infrastructure
Economic Development
Housing
Infrastructure
Social Development
Housing
Infrastructure
Social Development
Infrastructure
Service Delivery
Social Development
Infrastructure
Social Development
Economic Development
Infrastructure
Social Development
Housing
Infrastructure
Social Development
Economic Development
Infrastructure
Service Delivery
Social Development
32
31
30
29
28
27
26
25
24
23
22
21
20
Number of Repondents
War
d N
um
ber
& P
rio
rity
Cat
ego
ry

SOL PLAATJE LOCAL MUNICIPALITY INTEGRATED DEVELOPMENT PLAN 2022 - 2027
110
4.5. IDP PROJECT STEERING COMMITTEE & FORUM INPUTS
TO BE DEVELOPED FOR FINAL IDP

SOL PLAATJE LOCAL MUNICIPALITY INTEGRATED DEVELOPMENT PLAN 2022 - 2027
111
CHAPTER 5
STRATEGIC DIRECTION

SOL PLAATJE LOCAL MUNICIPALITY INTEGRATED DEVELOPMENT PLAN 2022 - 2027
112
5. STRATEGIC DIRECTION
5.1. STRATEGIC FRAMEWORK
5.1.1. THE VISION & MISSION
“Towards a Cleaner Growing City “
The mission of the Sol Plaatje Local Municipality embodies the outcomes required to fulfill the vision with
the following:
• To reclaim the status of the city that once sparkled back,
• To work towards;
✓ Clean audit and a corruption free administration
✓ Clean Infrastructure (roads, electricity, water, sanitation, pothole free)
✓ Clean Revenue and collection rate
✓ Clean pollution free environment and city spaces
• To boast the overall moral of all staff members
• Working towards building public confidence and trust
• To deliver sustainable uninterrupted services to all residents within the jurisdiction
5.1.2. STRATEGIC OBJECTIVES & KPA’S
The following structure are provided for the strategic objectives and KPA’s for guiding the implementation
of the IDP:
Table 9: IDP Strategic Objectives & KPA's
Strategic Objectives KPA’s
1) Spatial Transformation 1. Local Economic Development
2) Inclusive Growth 2. Access to Basic Services & Infrastructure
3) Service Provision 3. Sound Financial Management
4) Governance 4. Institutional Development & Capacity Building
5. Good Governance & Public Participation
SOL PLAATJE LOCAL MUNICIPALITY INTEGRATED DEVELOPMENT PLAN 2022 - 2027
113
5.1.2.1. SPATIAL TRANSFORMATION
To transform the spatial structure of the city towards an equitable, inclusive, efficient and compact form
consisting of a series of integrated and well-connected economic corridors, nodes and attractive mixed-
use/mixed-income sustainable human settlements of varying densities. The overarching strategy for the
development of the Sol Plaatje Municipality proposes looking at the IDP through the lens of geographical
“space-economy”.
The “space-economy” means the geographic distribution of settlements (large and small), the activities
within them (residential, commercial, institutional, recreational, etc.) and the relationship of these
settlements and activities to the infrastructure that connects and supports them and links in turn to
surrounding agriculture and nature areas.
People live their lives in geographic space; how activities and infrastructure are organized in space,
fundamentally impacts on people’s access to economic and social opportunities. For example, locating
housing for the poor far away from work opportunities, impacts on disposable income, work productivity
and transport infrastructure provision. People have to pay a disproportionately high percentage of their
incomes to move to and from work, journeys take a long time, and infrastructure and vehicles have to be
provided and maintained to transport them. Also, locating business opportunities far from infrastructure
increases the cost of products and diminishes the chances of success for large and small businesses. An
informal trader or small café owner cannot hope to succeed without necessities such as water or a
reasonable flow of passers- by.
The apartheid spatial legacy is the foundation for much of the inequity in society. A primary strategy of
Apartheid was to manipulate the space-economy of towns, to provide good opportunities for whites and the
rich and to deny opportunities for blacks and the poor. The best land and most viable locations, the best
infrastructure and networks, have traditionally been offered to the minority of citizens. Only through
restructuring the space-economy of our settlements can we hope to overcome our divided legacy.
Secondly, municipal strategy has over the last decade taken a strong “sectoral” approach. The approach looks
at development in sectors such as Local Economic Development Plans, plans for ‘creative industries’, small
enterprises, tourism, and so on. Unfortunately, much of this work is silent on the impact of space on specific
sectors and has assisted to hide spatial inequity in our settlements. For example, very few, if any, Local
Economic Development Plans will look at the relationship between transport infrastructure, economic
opportunity and job creation.
Thirdly, municipal government has considerable influence over the space economy of settlements. By virtue
of its mandate, local government can determine the nature and location of key infrastructure and where
settlement is to occur and were not. Local government cannot grow the economy, but it impacts on economic
success through the provision and maintenance of infrastructure and how activities are organized in space
5.1.2.2. INCLUSIVE GROWTH
To establish a competitive economic position that attracts diverse investments, increases economic growth
and creates targeted number of jobs.
5.1.2.3. SERVICE PROVISION
To plan for, install, maintain and operate infrastructure, and provide services more efficiently and on a
sustainable basis that adequately supports:

SOL PLAATJE LOCAL MUNICIPALITY INTEGRATED DEVELOPMENT PLAN 2022 - 2027
114
• transformed spatial structure
• economic growth objectives
• universal access to basic services,
• differentiated service requirements of households and human settlements and economic activity
5.1.2.4. GOVERNANCE
• To enhance the capacity of the state and its citizens to work together to achieve spatial and
social integration.
• To lead, direct and manage spatial growth of the city robustly, enhance revenue generation
and improve operational efficiency.
Sol Plaatje Municipality is committed to:
• Reverse inefficient land use patterns
• Tackle the aging infrastructure of the city
• Deal with the results of the relatively stagnant economic landscape in a systematic way
• Increase debt collection
• Critical service delivery
5.1.2.5. KPA 1: LOCAL ECONOMIC DEVELOPMENT
The availability of raw materials, skills, access to transport networks for distribution need to be detailed
alongside the natural resource base to provide an overview of what exists and what potentials can be
developed. The skills capacity in local areas and the informal economic activities can also be considered. This
helps to scope out the existing resources and advantages as well as potential economic opportunities
realistically. Currently, most of this work is carried out in the Spatial Development Framework, which sets
out the broad land use management potential. Work on developing sectors of the economy must follow this
activity. Nodes, corridors, points of growth and development, urban renewal projects and regeneration
programmes are some of the aspects that have made a presence. Integration with plans for the local
economy, on job creation, skills development, bringing an end to poverty and to sustainable economic
growth is still to be forged at the local level.
To fulfil the role of promoting economic development and in particular to position a municipality as an
attractive location for investment, municipalities must be financially and institutionally viable, and must
leverage available economic opportunities. The financial strength of municipalities is determined largely on
the size of the commercial economic base. Businesses and residents provide the rates base required to
support the social and physical infrastructure necessary to support a thriving community. Private sector
investment is critical to the local tax base. Public Sector investment helps to kick start this investment. Closely
related to this is the self-evident need to build managerial, project management and administrative
capacities. This involves addressing issues such as skills, management and administrative systems and
processes.
Another set of instruments available to the municipalities particularly for infrastructure development are the
various conditional grants from the national treasury. These grants differ from the equitable share of revenue
to municipalities in the division of revenue, as there are strong controls on the delivery of infrastructure
development projects. Unspent funds are monitored and cannot be used for other projects and expenditure.
These conditional grants have been leveraged to upgrade townships and informal settlements. In addition to
grants from the state coffers local government can negotiate bulk services contributions linked to private

SOL PLAATJE LOCAL MUNICIPALITY INTEGRATED DEVELOPMENT PLAN 2022 - 2027
115
developments to ensure private funding of bulk service connections for water, sewer, electricity and access
roads for developments in housing, retail malls and factories.
For municipal regulations to be economic-friendly it is necessary for councillors to engage with various
sectors of the economy that have a presence in a municipal area. Red tape and bureaucratic delays linked to
permissions affect the costs of doing business. It is only through an engagement with key stakeholders that
the local economy will begin to generate employment multiplier effects, increase productive investment,
contribute to broad-based black economic empowerment, encourage integration of value matrices, enhance
competitiveness of local production and improve the effectiveness of public sector spend.
Councillors are champions of developing the local economy. Economic growth must occur in a manner that
supports the rights of workers and protects the environment. To include the poor a focus on household
incomes and the affordability of tariffs is important. A key policy at municipal level at the disposal of
councillors to assist low-income households in townships and informal settlements to be included and
supported is the Indigent Policy. This policy allows for special tariffs for free basic services thereby including
the poor to access services and to be assisted out of the credit control net. The Councillors’ role at local level
is limited to policy making and public engagements. Councillors are prohibited from being involved in
procurement and tenders3. The bid specification development, evaluation and decision making are technical
processes as defined in the Municipal Finance Management Act 56 (2003).
5.1.2.6. KPA 2: ACCESS TO BASIC SERVICES AND INFRASTRUCTURE DEVELOPMENT
The IDP attempts to ascertain the economic benefit of all activity conducted by the municipality. This is
especially important with the public works programme, infrastructure programmes and integrated human
settlement programme, which links to the KPA on “Access to Basic Services and Infrastructure Development”.
The range of activities carried out in a municipality has broad economic implications. Activities includes the
building of infrastructure by way of housing, facilities and roads, the sale and provision of services such as
water, electricity and refuse removal, property management in the leasing of land and buildings, the
provision of services on land use management the zoning and rezoning of land, which determines how best
space can be utilised and provision of social services such as facilities for libraries, sports and recreation, arts
and culture, clinics which are concurrent functions with provincial government.
Technical assessments that inform the IDP are linked to spatial planning, land uses, environmental
sensitivities, electricity and water distribution, capacity of landfill sites, capacity of cemeteries and integrated
transport systems. These assessments are guided by national regulations and policies.
5.1.2.7. KPA 3: SOUND FINANCIAL MANAGEMENT
Sound financial management means management of financial resources in a manner that supports service
delivery, good governance and institutional transformation, whilst at the same time ensuring compliance
with the local government legislative framework and its supporting regulations and circulars. Sustainability
ensures business continuity and ability to improve what has been achieved for times in the future. The Key
Performance Indicators as per the SDBIP are mainly based on liquidity, sustainability and management ratios
as per National Treasury’s MFMA Circular 72.
The Financial Services Directorate indicators are highly sensitive to factors outside control of those expected
to achieve. The collection rate below the targeted average is a cause for concern, as it has ripple effect in
almost every aspect that measures management performance, liquidity and sustainability of the
organisation. This matter has been raised sharply with the Executive Mayor, and it is hoped that the strategy

SOL PLAATJE LOCAL MUNICIPALITY INTEGRATED DEVELOPMENT PLAN 2022 - 2027
116
proposed in March 2015, will be highly considered seeing that we had reached all-time low, since 2011 in
terms of cost coverage. Prevention is better that dealing with consequences of financial distress. The
municipality had adopted a two-approach to indigent verification process, and this has yielded favourable
results whereby a total of more than 13 800 indigent had been identified and are benefitting from Free Basic
Services.
5.1.2.8. KPA 4: INSTITUTIONAL DEVELOPMENT AND CAPACITY BUILDING
The IDP provides a local perspective of the national picture. This involves an unpacking of the local economy
and details of how it links to the New Growth Path, Industrial Action Plan, the National Development Plan,
the Integrated Urban Development Framework as well as the Provincial social and economic strategies. In
addition to a formal overview of the economy and society, the departmental technical plans are simplified
to be accessible to people for their inputs and understanding. This is to enable all members of the public to
be fully consulted about the five-year local plans. In this respect, public inputs to the IDP and policy processes
are a legislative imperative. It is also the underlying basis of the KPA linked to “Good Governance and Public
Participation. The IDP has a portion that looks at the workplace skills and equity plans. This aspect links to
the core KPA of “Institutional Development and Capacity Building” to tease out what skills are required within
the municipality to support delivery across all departments.
5.1.2.9. KPA 5: GOOD GOVERNANCE AND PUBLIC PARTICIPATION
Good governance is about the processes for making and implementing decisions, it is not about making
correct decisions, the best possible process for making decisions. Good governance has positive effects such
as public participation policies and practices, meeting procedures, service quality protocols, councillor and
municipal officials conduct, role clarification and good working relationships.
Accountability is a fundamental requirement of good governance, Municipalities have an obligation to
report, explain and be answerable for the consequences of decisions it has made on behalf of the community
it represents. Good governance is also transparent, as it must enable people to follow and understand the
decision-making process, the information utilised to arrive at the decision, the advice received and
consideration of the legal framework. Good governance is also responsive, and this is in line with the motto
of the municipality of “We Serve”.
The municipality operates with the Executive Mayor system and a Mayoral Committee, and Section 80
Committees adopted in 2011, after the elections. This system has proven to be successful, as the municipality
has achieved timely and qualitative reporting accolades and won various awards in the past. The Executive
Management team meets fortnightingly, for all schedules meetings, and other EMT meetings are schedules
as the need arises, especially during the IDP Review and Budget Process period.
Effective implementation of municipal administrative policies is critical for good governance, especially in the
areas of Human Resources, Labour Relations, Councillor Support, ICT and smooth functioning of the Office
of the Executive Mayor and that of the Honourable Speaker. Continuous feedback to the community is as
important, and hence the publishing of monthly newsletter for public consumption is very important.
Negative publicity remains a concern in this regard. Municipality must establish an institutional
communication framework that will place the organisation in the lead in terms of communicating
performance, information for public consumption, project progress reports, and get into the habit of
publishing news articles on specific matters that will take away the power from the media of reporting what
sells the papers.

SOL PLAATJE LOCAL MUNICIPALITY INTEGRATED DEVELOPMENT PLAN 2022 - 2027
117
5.2. MUNICIPAL INSTITUTIONAL DEVELOPMENT AND TRANSFORMATION
5.2.1. GOOD GOVERNANCE
Accountability is a fundamental requirement of good governance, Municipalities have an obligation to
report, explain and be answerable for the consequences of decisions it has made on behalf of the community
it represents.
Good governance is also transparent, as it must enable people to follow and understand the decision-making
process, the information utilised to arrive at the decision, the advice received and consideration of the legal
framework. Good governance is also responsive, and this is in line with the motto of the municipality of “We
Serve”. According to the Back-to-Basics Programme good governance is at the heart of the effective
functioning of municipalities.
SPLM must therefore ensure that good governance is prioritised. This lies within the responsibility sphere of
the political component of the Municipality, which will be constantly monitored and evaluated on its ability
to carry out the following basics:
• The holding of Council meetings as legislated.
• The functionality of oversight structures, S79 committees, audit committees and District IGR
Forums.
• The existence and efficiency of anti-corruption measures.
• The extent to which there is compliance with legislation and the enforcement of by-laws.
• The rate of service delivery protests and approaches to address them.
Public participation is another essential component of good governance namely, putting people first.
Measures need to be taken to ensure that the Municipality engages with communities.
According to literature on identification of the developmental state, there are few challenges that every
society, especially the developing economies, are faced with in accomplishment of good governance: they
are weak institutions, lack of participation and democratization, lack of social etc. In the developing countries,
institutions concerning fined property rights, formal contacts and guarantees and enforcement rules are
weak— either too weak or too predatory in their demands. This being so, to achieve good governance
becomes difficult. Attributes of goods and services have to be clearly measured for proper exchange to take
place and property rights enforced. All these activities have costs, which can be reduced only when these
institutions are effective.
In fact, good governance is significantly related to issues of participation and democratization. For the people
dependent on local resources, democracy means participation in managing them.
But in the face of the emergence of worldwide markets, the efficacy of local community tends to be
destroyed and they seem to be powerless in facing new challenges. These local communities need to be
strengthened to at least manage local resources and local affairs.
Other than weak institutions and absence of participation and democratization, lack of social capital poses a
major challenge to approaching good governance. Social capital is viewed as emerging from the collection of
norms, belief, attitudes and practices that govern relationship between individuals and groups in a society.

SOL PLAATJE LOCAL MUNICIPALITY INTEGRATED DEVELOPMENT PLAN 2022 - 2027
118
5.2.2. MUNICIPAL FINANCIAL VIABILITY AND MANAGEMENT
Sound financial management deals with the management of financial resources in a manner that supports
service delivery, good governance and institutional transformation, whilst at the same time ensuring
compliance with the local government legislative framework and its supporting regulations and circulars.
Figure 13: Operational revenue: Budget Year 2022/23
As per the graph the operational revenue breakdown for the budget year 2022/23 illustrates that most of
the SPLM revenue consists of Service charges with electricity the main service charge comprising of 67% of
all service charges. The revenue is expected to have grown by a 4.6% margin from the previous financial year.
The increase in service charges is indicated below with the average tariff increase indicated for the next 3
years. Electricity will see the highest increase for this period as municipalities adjust due to the national
electricity crisis.
Table 10: SPLM Anticipated Tariffs increases, 2022 - 2025
Revenue category 2022/23 2023/24 2024/25
Tariffs increases
Property Rates 4.00% 4.88% 4.63%
Electricity 6.82% 10.54% 9.04%
Water 5.68% 8.61% 5.08%
Wastewater (Sanitation) 4.00% 5.51% 5.75%
Waste management (Refuse removal) 4.00% 8.04% 7.29%
Average tariff increases/Municipal CPI 5.54% 8.24% 6.93%
Property rates25.2%
Service charges55.2%
Investment revenue0.2%
Transfers recognised -operational
10.4%
Other own revenue8.9%

SOL PLAATJE LOCAL MUNICIPALITY INTEGRATED DEVELOPMENT PLAN 2022 - 2027
119
Figure 14: Expenditure by type: Budget Year 2022/23
The expenditure profile of SPLM illustrates the expected budgetary spending as informed by the 2021/22
expenditure profile. Most of the expenditure are that of employee related costs and bulk purchases for
electricity comprising 62% of total expenditures. Electricity as bulk purchases contribution is expected to
increase over the next 3 years compared to the other expenses.
Figure 15: Capex Funding sources: 2022/23
When the capital funding sources are considered, most of the funding are derived from capital transfers. In
line with this the summary of spending per funding source are provided in the table below.
Employee related costs34%
Remuneration of councillors
1%
Debt impairment12%
Depreciation & asset impairment
3%
Finance charges2%
Bulk purchases -electricity
28%
Inventory consumed10%
Contracted services2%
Transfers and subsidies
0%
Other expenditure6%
Losses2%
Capital transfers71%
Borrowing0%
Internally generated funds29%
Capital transfers Borrowing Internally generated funds

SOL PLAATJE LOCAL MUNICIPALITY INTEGRATED DEVELOPMENT PLAN 2022 - 2027
120
Table 11: Summary of spending p/funding source, 30 Apr '22
5.2.3. HUMAN RESOURCES
The current human resource profile for SPLM are as follows:
• Staff compliment per the approved organogram: 2701
• Permanent Staff as of October 2021: 1 334
• Contract Staff as of October 2021: 400
• Vacancies: 967
• Vacant and Funded Positions: 203 (36%)
5.2.4. MUNICIPAL ICT
The SPLM is currently in the process of the Business Expansion Attraction & Retention (BEAR) Project in
collaboration with National Treasury and service provider that focusses on Enhancing Sol Plaatje Local
Municipality’s Economic Governance & Infrastructure. The project aims to enhance Sol Plaatje Local
Municipality’s economic governance and infrastructure through innovative business efficiencies and reform
for overall sustainable and inclusive local economic development. The expected outcoms of the project is to:
• A resourced municipality with skilled LED officials that drive innovation-led sustainable economic
planning and development.
• A harmonised and conducive regulatory environment that promotes BEAR.
• Improved business efficiencies and reduction of red tape for BEAR.
The estimated results/outcomes will be:
➢ Trained LED officials.
➢ Institutional learning exchange & benchmarking.
➢ SLM Ease of Doing Business Index.
➢ e-Repository on economic governance and infrastructure.
➢ Tested & Piloted SLM digital Business Application (& Facilitation) e-One-Stop Shop for BEAR.
The project will run for the 2020 – 2022 period and it is expected that the project will increase the ICT
capability of the municipality.
Row LabelsSum of
Budget
Sum of
Adjusted
Budget
Sum of
Previous
Month Exp
Sum of
Current
Month
Expenditure
Sum of Year
to Date
Expenses
Sum of
Balance
CRR 11,500,000 25,000,000 - - 4,312,804 20,687,196
EURO - 14,400,000 - 612,227 6,559,511 7,840,489
FBDM - 3,500,000 3,592,713 35,837 3,628,550 (128,550)
INEP 66,500,000 36,500,000 7,760 66,213 140,522 36,359,478
IUDG 66,266,000 66,266,000 968,172 5,809,311 24,373,750 41,892,250
NDPG 10,000,000 - - - - -
WSIG 25,000,000 21,000,000 1,254,798 - 12,811,243 8,188,757
Grand Total 179,266,000 166,666,000 5,823,443 6,523,588 51,826,381 114,839,619

SOL PLAATJE LOCAL MUNICIPALITY INTEGRATED DEVELOPMENT PLAN 2022 - 2027
121
5.2.5. SERVICE DELIVERY CHALLENGES
The following are the challenges that influences both financial and service delivery in SPLM as identified by
the municipality:
➢ Poor performance of municipal officials, exacerbated by a lack of discipline
➢ Apathetic attitude of employees and key personnel
➢ Lack of accountability and consequence management
➢ Funds not being spent cost-effectively
➢ Unnecessary wastage of time, labour and materials
➢ High-level of crisis management
➢ Downward adjustment of CRR funded projects
➢ Financial constraints in contributing internally generated funds towards capital projects
➢ Strike action from employees and pressure from unions to resolve internal matters
➢ Planning overall and prioritisation of needs
➢ Illegal dumping by the community and businesses
➢ Cleanliness of the city and suburbs
➢ Refuse collection which is hampered by old refuse compactors which are costly to replace
➢ Excessive costs on Repairs & Maintenance (R&M) of old refuse compactors and old infrastructure
➢ Inadequate housing and the allocation process
➢ State of municipal flats
➢ Proper contracts management of appointed contractors and consultants
➢ Improve on Project management
➢ Earlier planning of capital projects. Ensure tendering processes are started in April, for
implementation in Jul/Aug
➢ The response time on calls logged by the community and businesses which negatively impacts on
customer satisfaction
➢ The lower collection rate and escalation in outstanding debtors, especially debt over 90 days
➢ Non-payment of outstanding debt, emphasis on Organs of State
➢ Decline in investments and cash & cash equivalents, resulting in 7 day Cost coverage (norm is 3
months Cost coverage)
➢ Affordability of services, specifically tariff increases and ensuring that tariffs are cost-reflective
➢ Addressing inefficiencies, to prevent the community bearing the brunt in respect of tariffs being
increased beyond affordable levels
➢ The non-implementation of the basic charge for 2018/19 financial year that had a negative impact
on the budget and cash flow
➢ Escalation in debt owed to ESKOM and Waterboard, with a resultant increase in Interest on
overdue accounts, which exacerbates Fruitless and Wasteful expenditure
➢ Filling of critical vacancies like IDP Manager’s position
➢ Water and electricity losses that remain unacceptably high
➢ Inactive prepaid meters
➢ The public’s negative perception of the municipality in respect of overall management and lack of
service delivery, which negatively influences the community’s willingness to pay
➢ High-level of unemployment
➢ Stimulation of the local economy
➢ Current economic climate, inflation and increased cost of living

SOL PLAATJE LOCAL MUNICIPALITY INTEGRATED DEVELOPMENT PLAN 2022 - 2027
122
➢ Under-funded (Health and Resorts) and unfunded mandates (Libraries and Environmental Health)
➢ Excessive Expenditure on EPWP and the funding of the programme
➢ Excessive and uncontrollable Overtime expenditure, especially in prior years
➢ Reducing Employee related costs to at least 32% of Operational Expenditure
➢ Unauthorised, Irregular and Fruitless and Wasteful Expenditure
➢ Monthly billing of services, including interim billings and billing errors on accounts
➢ Late delivery of municipal accounts, however this is beyond the municipality’s control due to the
challenges at the Post Office
➢ Electronic mailing and sms services for municipal bills hampered, due to incomplete updated
contact information for all clients
➢ Budgetary and cash flow constraints which will complicate the compilation and funding of the
2021/22 Adjustment budget and the budget for the 2022/23 MTREF
➢ The implementation of water pre-payment meters for indigents and non-payers
➢ The municipality is not in any position to secure any long-term borrowing
➢ Recommendations from the Auditor General, Internal Audit and Audit Action Plan not being
adequately adhered to
➢ The turnaround time for the approval of building plans. This has improved compared to prior years
➢ The turnaround time for the approval of prospective investors
➢ Industrial sector – limited growth, no new developments, no incentives provided for new
developers, very high property expenses. High cost and limited availability of services.
➢ Lack of maintenance plans and routine, planned maintenance of assets with an emphasis on
revenue generating assets
➢ Capital grant dependency & conditional grant spending
➢ Capital expenditure overall
➢ Decline of Rollover requests which have a negative impact on service delivery and finances
➢ The availability of funds for servicing of sites and ervens for development
➢ Provision of security services
➢ Theft and vandalism of municipal assets
➢ The late explanation (NT) in terms of S32 of the SCM regulation resulting in increased Irregular
expenditure. It is recommended that the municipality refrain from SCM Regulation S32
appointments
➢ Turnaround time for the final awarding of tenders, this also negatively influences the municipality’s
ability to spend on conditional grants
➢ Negative impact of Covid-19 pandemic
➢ The South African economic outlook remains highly uncertain and the economic effects of COVID-
19 pandemic are far-reaching.
➢ Although a recovery in the economical sector can be noted it is very slow and unpredictable. SPM
already have a strained cash flow; COVID-19 have aggravated the current circumstance and have a
significant negative impact on SPM revenue. Consumers across sectors are currently showing strain
in their ability to pay municipal accounts
➢ Property rates and services revenue collection is highly vulnerable to defaulting by households as a
result of income losses. Additionally the effect of COVID-19 may have a wide-ranging impact on the
property market itself, which in turn will impact on Property rates.

SOL PLAATJE LOCAL MUNICIPALITY INTEGRATED DEVELOPMENT PLAN 2022 - 2027
123
➢ The real estate industry is already heavily affected which may translate into depressed property
prices and lower valuations during our next general valuation roll planned for implementation in
2023.
➢ Poor performance of municipal officials, exacerbated by a lack of discipline
➢ Apathetic attitude of employees and key personnel
➢ Lack of accountability and consequence management
➢ Funds not being spent cost-effectively
➢ Unnecessary wastage of time, labour and materials
➢ High-level of crisis management
➢ Downward adjustment of CRR funded projects
➢ Financial constraints in contributing internally generated funds towards capital projects
➢ Strike action from employees and pressure from unions to resolve internal matters
➢ Planning overall and prioritisation of needs

SOL PLAATJE LOCAL MUNICIPALITY INTEGRATED DEVELOPMENT PLAN 2022 - 2027
124
CHAPTER 6
IDP IMPLEMENTATION

SOL PLAATJE LOCAL MUNICIPALITY INTEGRATED DEVELOPMENT PLAN 2022 - 2027
125
6. IDP IMPLEMENTATION
This section focuses on the projects for the next IDP cycle with capital budgets and alignment to the KPA’s included:
6.1. IDP PROJECTS
Table 12: SPLM IDP Complete Project List
IDP Ref # Project
Included in CEF
Project Description Timeframe Project Category Project Budget
(Estimated Costing) (R)
Directorate
SPM01 Yes Construction of Riverton Reclamation Dam Short Water 10,000,000 Infrastructure & Services
SPM02 No Completion of New HLP (electrical works) Short Water 11,000,000 Infrastructure & Services
SPM03 Yes Filter Media replacement, Riverton: Short Water 7,000,000 Infrastructure & Services
SPM04 No Water meter replacement:(ongoing) Short Water 2,000,000 Infrastructure & Services
SPM05 Yes Upgrading of the existing Newton Reservoir Pump Station
Short Water 20,000,000 Infrastructure & Services
SPM06 Yes Water pipe replacement ( Dalham, Carrington, Broadway, Installation of pressure valves)
Short Water 20,000,000 Infrastructure & Services
SPM07 Yes Refurbishment and Upgrading of Riverton and Ritchie water purification works
Medium Water 160,000,000 Infrastructure & Services
SPM08 Yes Laying of additional rising main for 31km of 1200mm diameter from Riverton to Kimberley
Medium Water 450,000,000 Infrastructure & Services
SPM09 Yes Building of 3 new bulk storage reservoirs additional capacity of 100ML
Medium Water 120,000,000 Infrastructure & Services

SOL PLAATJE LOCAL MUNICIPALITY INTEGRATED DEVELOPMENT PLAN 2022 - 2027
126
SPM10 Yes Reticulation and Meter replacement (350km of reticulation). Beyond 5 years
Medium Water 650,000,000 Infrastructure & Services
SPM11 No Repairs at Homevale WWTW (Vandalism) Short Sanitation 14,000,000 Infrastructure & Services
SPM12 Yes Gogga P/Station Screw Pumps Refurbishment Short Sanitation 3,000,000 Infrastructure & Services
SPM13 Yes Upgrading and securing of sewer pump stations Short Sanitation 60,000,000 Infrastructure & Services
SPM14 No New Northern WWTW (30ML) to relieve Roodepan and Gogga pump stations (When spare capacity is low at Homevale)
Medium Sanitation 160,000,000 Infrastructure & Services
SPM15 No Reticulation pipe replacement (Replace old asbestos pipes and remove mid block sewers: 200km)
Medium Sanitation 300,000,000 Infrastructure & Services
SPM16 Yes Roads maintenance program (Patching and resealing)
Short Roads &
Stormwater 100,000,000
Infrastructure & Services
SPM17 Yes Upgrading of Gravel roads (Paving) Short Roads &
Stormwater 110,000,000
Infrastructure & Services
SPM18 Yes Upgrading of Storm water systems Short Roads &
Stormwater 200,000,000
Infrastructure & Services
SPM19 Yes Development of master plan Short Roads &
Stormwater 3,000,000
Infrastructure & Services
SPM20 Yes Implementation of N12 By pass road Long Roads &
Stormwater 750,000,000
Infrastructure & Services
SPM21 Yes Stormwater Systems and Access Roads for New Developments
Long Roads &
Stormwater 200,000,000
Infrastructure & Services
SPM22 Yes Electrical protection and SCADA upgrade Short Roads &
Stormwater 50,000,000
Infrastructure & Services
SPM23 Yes Meter replacement Short Roads &
Stormwater 20,000,000
Infrastructure & Services

SOL PLAATJE LOCAL MUNICIPALITY INTEGRATED DEVELOPMENT PLAN 2022 - 2027
127
SPM24 Yes Complete upgrading of Riverton Electrical installations project
Short Roads &
Stormwater 11,000,000
Infrastructure & Services
SPM25 Yes Riverton WPP: Installation of new cables to commission the two 10MVA transformers
Short Roads &
Stormwater 10,000,000
Infrastructure & Services
SPM26 Yes Upgrade of High Voltage Sub station in Hadison park
Medium Electricity 50,000,000 Infrastructure & Services
SPM27 Yes Replacement of switch gear at Herlear Sub station Medium Electricity 40,000,000 Infrastructure & Services
SPM28 Yes UPGRADE OF HADISON PARK SUBSTATION 2x 30 MVA TRANSFORMERS
Medium Electricity 15,000,000 Infrastructure & Services
SPM29 No Construction of New sub-station in Landbou weg Long Electricity 70,000,000 Infrastructure & Services
SPM30 No Construction of New sub station in Kimdustria Long Electricity 70,000,000 Infrastructure & Services
SPM31 Yes Mechanical Workshop (Fleet) Short Electricity 97,975,000 Infrastructure & Services
SPM32 Yes Rehabilitation of RC Elliot and Social Centre Medium Community
Services 13,000,000
Community Services
SPM33 No Establishment of Private Public Partnership for pleasure resorts
Medium Community
Services 15,000,000
Community Services
SPM34 No Development & implementation of AIS monitoring, control and eradication plan
Medium Community
Services 7,000,000
Community Services
SPM35 No Replacement of the A1 book scanner at the Africana library
Medium Community
Services 2,000,000
Community Services
SPM36 No Procure A3/A4 scanner Medium Community
Services 200,000
Community Services
SPM37 Yes Review the Intergrated Solid Wste Management Plan
Short Community
Services 500,000
Community Services

SOL PLAATJE LOCAL MUNICIPALITY INTEGRATED DEVELOPMENT PLAN 2022 - 2027
128
SPM38 Yes Refurbish the fences of cemeteries Short Community
Services 12,000,000
Community Services
SPM39 No Procure road marking paint machine Medium Community
Services 500,000
Community Services
SPM40 No Build administration block at the Landfill site Medium Community
Services 40,000,000
Community Services
SPM41 Yes Refurbish and rehabilitate pleasure resorts Short Community
Services 20,000,000
Community Services
SPM42 Yes Rehabilitate and maintain community parks Short Community
Services 10,000,000
Community Services
SPM43 No Review refuse collection route Medium Community
Services 6,000,000
Community Services
SPM44 No Expand the collection of refuse removal to unservice areas
Medium Community
Services 10,000,000
Community Services
SPM45 Yes Identification and development of new cemetery at Ritchie
Short Community
Services 20,000,000
Community Services
SPM46 No Procure law enforcement equipment Medium Community
Services 5,000,000
Community Services
SPM47 Yes Safeguarding of community & social assets Short Community
Services 20,000,000
Community Services
SPM48 No Education and training Medium Community
Services 500,000
Community Services
SPM49 No Poverty alleviation Medium Community
Services 5,000,000
Community Services
SPM50 No Establishment and impound facility Medium Community
Services 4,000,000
Community Services
SPM51 Yes Procurement of fleet and equipment Short Community
Services 20,000,000
Community Services

SOL PLAATJE LOCAL MUNICIPALITY INTEGRATED DEVELOPMENT PLAN 2022 - 2027
129
SPM52 No Awareness and promotion Medium Community
Services 500,000
Community Services
SPM53 No Procure digital data reporting system Medium Community
Services 500,000
Community Services
SPM54 No Expanded Public Works programme Medium Community
Services 20,000,000
Community Services
SPM55 No Procurement & hiring of fleet and equipment Medium Community
Services 12,000,000
Community Services
SPM56 No Growth Development Strategy N/A Economic
Development
Economic Development & Planning
SPM57 Yes Township Revitalisation N/A Economic
Development
Economic Development & Planning
SPM58 No Industrial Revitalization Strategy N/A Economic
Development
Economic Development & Planning
SPM59 No Incentives Strategy Finalization and implementation
N/A Economic
Development
Economic Development & Planning
SPM60 No Smart parking metering N/A Economic
Development
Economic Development & Planning
SPM61 No Township establishment(Informal settlement and middle income)
N/A Economic
Development
Economic Development & Planning
SPM62 Yes CBD redevelopment through Urban Networks Strategy
N/A Economic
Development
Economic Development & Planning
SPM63 No Mixed-use McDougal Precinct incl. studies e.g. EIA, Market analysis, Geotech, etc.
N/A Economic
Development
Economic Development & Planning

SOL PLAATJE LOCAL MUNICIPALITY INTEGRATED DEVELOPMENT PLAN 2022 - 2027
130
SPM64 No Industrial Node devt – Kimdustria and GLIP (Galeshewe Light Industrial Park)
N/A Economic
Development
Economic Development & Planning
SPM65 No Serviced sites N/A Economic
Development
Economic Development & Planning
SPM66 No GDS N/A Economic
Development
Economic Development & Planning
SPM67 No Upgrade Market infrastructure – Cold and Ripening rooms
N/A Economic
Development
Economic Development & Planning
SPM68 No Implement BEAR – ease of doing business N/A Economic
Development
Economic Development & Planning
SPM69 No Professionals’ upswing N/A Economic
Development
Economic Development & Planning
SPM70 No Budgeting – ED’s ‘project’ allocation be re-instated N/A Economic
Development
Economic Development & Planning
SPM71 No Implement CEF incl. of funding models. NB to prioritise Assets Management Plan to give impetus to Incentives as part of IUDG.
N/A Economic
Development
Economic Development & Planning
SPM72 No Automation of systems N/A Economic
Development
Economic Development & Planning
SPM73 No Built Environment Unit – team for developments N/A Economic
Development
Economic Development & Planning
SPM74 No Offer incentives N/A Economic
Development
Economic Development & Planning

SOL PLAATJE LOCAL MUNICIPALITY INTEGRATED DEVELOPMENT PLAN 2022 - 2027
131
SPM75 No Explore alternative income streams e.g. partnerships with Donors, Renewable energy, climate change in general
N/A Economic
Development
Economic Development & Planning
SPM76 No Monitoring and Evaluation Unit / IDP Mngmt Unit Beefed up
N/A Economic
Development
Economic Development & Planning
SPM77 No Review CEF N/A Economic
Development
Economic Development & Planning
SPM78 No Spatial targeting N/A Economic
Development
Economic Development & Planning
SPM79 No Integrated infrastructure Development needs N/A Economic
Development
Economic Development & Planning
SPM80 No Project Planning N/A Economic
Development
Economic Development & Planning
SPM81 No Monitoring and reporting N/A Economic
Development
Economic Development & Planning
SPM82 No Financial and strategic vision N/A Economic
Development
Economic Development & Planning
SPM83 No Priority development area N/A Economic
Development
Economic Development & Planning
SPM84 Yes Maintaining the inner city N/A Economic
Development
Economic Development & Planning
SPM85 No Expansion of residential zones N/A Economic
Development
Economic Development & Planning

SOL PLAATJE LOCAL MUNICIPALITY INTEGRATED DEVELOPMENT PLAN 2022 - 2027
132
SPM86 No Enhancement of tourism N/A Economic
Development
Economic Development & Planning
SPM87 No Population growth focus N/A Economic
Development
Economic Development & Planning
SPM88 No Capital Expenditure Framework Short Economic
Development 1,200,000
Economic Development & Planning
SPM89 No Review SDF N/A Economic
Development 1,400,000
Economic Development & Planning
SPM90 Yes Planning & Surveying Various wards N/A Economic
Development 15,000,000
Economic Development & Planning
SPM91 Yes Precinct Plans N/A Economic
Development 1,500,000
Economic Development & Planning
SPM92 No Structural Integrity Assessment various Municipal owned Buildings
Short Economic
Development 400,000
Economic Development & Planning
SPM93 Yes Motshwedimosa, City Hall, Gardner William Hall, Greenpoint Community Hall, RC Elliot, 2 Ricthie Halls, Social Centre
N/A Economic
Development 6,000,000
Economic Development & Planning
SPM94 No Growth Development Strategy N/A Economic
Development
Economic Development & Planning
SPM95 No Industrial Revitalization Strategy N/A Economic
Development
Economic Development & Planning
SPM96 No TPBAMS & BPAMS AFLA ESRI N/A Economic
Development 1,200,000
Economic Development & Planning

SOL PLAATJE LOCAL MUNICIPALITY INTEGRATED DEVELOPMENT PLAN 2022 - 2027
133
SPM97 No Name changes on approved general plans (Office of the Chief Surveyor General)
N/A N/A 100,000 N/A
SPM98 Yes Mounting of street names’ signage (22 areas in SPM)
Short N/A 400,000 N/A
SPM99 No URP Stormwater Upgrade N/A N/A N/A
SPM100 Yes Craven Taxi Rank Redevelopment N/A N/A N/A
SPM101 No CDB Road Reconstruction N/A N/A N/A
SPM102 No CBD Bulk Infrastructure Master Plan N/A N/A N/A
SPM103 No City Hall Precinct N/A N/A N/A
SPM104 Yes Heritage Footnote N/A N/A N/A
SPM105 No UNS Implementation N/A N/A N/A
SPM106 No No active legal contestation on arrear debt and listing of defaulters to credit Bureau or other means.
Medium Finance 30,000,000 CFO
SPM107 No
The Project estimate to resolve 12 000 verifications and new applications. Initially entered into in July 2021 and expected to end 30 June 2022, however only to kick start around February 2022
Medium Finance 3,000,000 CFO
SPM108 No revise the 2018 CoS Study, and assist the NERSA Tariff Application for 2022/2023
Short Finance 700,000 CFO
SPM109 No SPM to look at other municipalities and perform tariff comparison as a benchmarking exercise
Medium Finance 4,000,000 CFO

SOL PLAATJE LOCAL MUNICIPALITY INTEGRATED DEVELOPMENT PLAN 2022 - 2027
134
SPM110 No With the frequency of break-ins/ buglarly incidents at Matlalo Offices, which pose risk of files been stolen or losed due to risk of fire
Medium Finance 3,000,000 CFO
SPM111 No with the challenges of manually set up option to only run 14 days notice SMS on SOLAR with no other option to sent SMS per other credit control
Medium Finance 3,000,000 CFO
SPM112 No
with the challenges of manually set up call centre where Agents use SOLAR and manually search for information and keep no records calls or update responses from debtors
Medium Finance CFO
SPM113 No with the challenges of vandalism of outside points during public protests, it is motivated that mobile solution is explored
Medium Finance CFO
SPM114 No with the challenges of vandalism of outside points during public protests, Greenpoint has no service point
Medium Finance CFO

SOL PLAATJE LOCAL MUNICIPALITY INTEGRATED DEVELOPMENT PLAN 2022 - 2027
135
6.2. PROJECTS PRIORITIES & WARD SPECIFIC ISSUES ADDRESSED
TO BE DEVELOPED IN COLLABORATION WITH WARD COUNCILLORS FOR FINAL IDP
Table 13: IDP Projects Priority & Ward Priorities Addressed
IDP Ref #
Project Description Timeframe Priority Project
Category Directorate Wards #
Ward Priority Addressed
SPM01 Construction of Riverton Reclamation Dam
Short Water Infrastructure & Services
SPM02 Completion of New HLP (electrical works)
Short Water Infrastructure & Services

SOL PLAATJE LOCAL MUNICIPALITY INTEGRATED DEVELOPMENT PLAN 2022 - 2027
136
6.3. IDP PROJECTS STRATEGIC ALIGNMENT
TO BE DEVELOPED FOR FINAL IDP ONCE PROJECTS ARE APPROVED
Table 14: IDP Projects Strategic Alignment
IDP Ref #
Project Description
KP
A A
lign
me
nt
Nat
ion
al S
trat
egi
c
Ou
tco
me
s
Sust
ain
able
De
velo
pm
en
t G
oal
Nat
ion
al P
lan
nin
g C
om
mis
sio
n
NC
PG
DP
FBD
M S
trat
egi
c O
bje
ctiv
es
SPLM
SD
F
SPM01 Construction of Riverton Reclamation Dam
SPM02 Completion of New HLP (electrical works)

SOL PLAATJE LOCAL MUNICIPALITY INTEGRATED DEVELOPMENT PLAN 2022 - 2027
137
6.4. IDP PROJECTS FUNDING STRUCTURE
TO BE FINALISED IN COLLABORATION WITH WARD COUNCILLORS FOR FINAL IDP
Table 15: IDP Budget Implementation Framework
IDP Ref #
Project Description
Project Budget
(Estimated Costing)
Funded & in
Capital Budget
Funding Source
Directorate 2022/ 2023
2023/ 2024
2024/ 2025
2025/ 2026
2026/ 2027
SPM01
Construction of Riverton Reclamation Dam
10,000,000 Yes Infrastructure & Services
SPM02
Completion of New HLP (electrical works)
11,000,000 No Infrastructure & Services

SOL PLAATJE LOCAL MUNICIPALITY INTEGRATED DEVELOPMENT PLAN 2022 - 2027
138
Table 16: Preliminary IDP Projects Funding per KPA, 2022 - 2025
Strategic Objective/KPA’s Revenue Expenditure Capital Expenditure
R thousand Budget Year 2022/23
Budget Year +1 2023/24
Budget Year +2 2024/25
Budget Year 2022/23
Budget Year +1 2023/24
Budget Year +2 2024/25
Budget Year 2022/23
Budget Year +1 2023/24
Budget Year +2 2024/25
GOOD GOVERNANCE AND PUBLIC PARTICIPATION
335,918 350,834 367,103 416,801 432,338 458,699 53,705 52,382 58,096
MUNICIPAL FINANCIAL VIABILITY AND MANAGEMENT
648,238 679,804 711,345 157,404 165,377 174,379
MUNICIPAL INSTITUTIONAL DEVELOPMENT AND TRANSFORMATION
6,873 6,942 7,019 97,947 102,553 107,837 128,038 101,786 105,973
BASIC SERVICE DELIVERY AND INFRASTRUCTURE DEVELOPMENT
1,488,235 1,627,347 1,752,778 1,731,509 1,875,876 2,014,935
LOCAL ECONOMIC DEVELOPMENT 7,945 8,350 8,810 61,468 64,785 68,422 8,300
Total 2,487,209 2,673,277 2,847,055 2,465,128 2,640,928 2,824,271 190,043 154,168 164,069

SOL PLAATJE LOCAL MUNICIPALITY INTEGRATED DEVELOPMENT PLAN 2022 - 2027
139
ANNEXURES

SOL PLAATJE LOCAL MUNICIPALITY INTEGRATED DEVELOPMENT PLAN 2022 - 2027
140
ANNEXURE A: ABBREVIATIONS
Table 17: List of Abbreviations
ABBREVIATION DESCRIPTION
B2B Back To Basics
BBBEE Broad-Based Black Economic Empowerment
BNG Breaking New Ground
CBD Central Business District
CLCB Centre for Local Capacity Building
COGHSTA Department of Co-operative Governance, Human Settlement and Traditional
Affairs
DMS Disaster Management Framework
DTI Department of Trade and Industry
DOE Department of Energy
DWA Department of Water Affairs
EAP Employee Assistance Programme
EEDSM Energy Efficiency and Demand Side Management
EPWP Expanded Public Works Programme
EU European Union
FBDM Frances Baard District Municipality
FY Financial Year
GDP Gross Domestic Product
GDS Growth and Development Strategy
GV General Valuation
GVA Gross Value Added
HRM Human Resource Management
IDP Integrated development Plan
IGR Inter-Governmental Relations
INEP Integrated National Electrification Programme
IPP Independent Power Producer
ISDG Infrastructure Skills Development Grant
IT Information Technology
IUDF Integrated Urban Development Framework
KPA Key Performance Area
LA Local Administration
LED Local Economic Development
LGMIM Local Government Management Improvement Model
LUMS Land Use Management Scheme
MAYCO Mayoral Committee
MIIF Municipal Infrastructure Investment Framework

SOL PLAATJE LOCAL MUNICIPALITY INTEGRATED DEVELOPMENT PLAN 2022 - 2027
141
MPC Monetary Policy Committee
MSA Municipal Structures Act
MTREF Medium Term Revenue Expenditure Framework
NDP National Development Plan
NDPG Neighbourhood Development Partnership Grant
NERSA National Energy Regulator of South Africa
OPCAR Operational Clean Audit Report
PMS Performance Management System
RDP Reconstruction and Development Programme
RBIG Regional Bulk Infrastructure Grant
SARB South African Reserve Bank
SCM Supply Chain Management
SDBIP Service Delivery Budget Implementation Plan
SDF Spatial Development Framework
SDG Sustainable Development Goals
SECCU Sustainable Energy and Climate Change Unit
SLP Social Labour Plans
SMME Small, Medium and Micro-Sized Enterprise
SPLM Sol Plaatje Local Municipality
SPLUMA Spatial Planning and Land Use Management Act
SSEG Small Scale Embedded Generators
TOD Transit Orientated Development
UDS Urban Network Strategy
UDZ Urban Development Zone
WAS Water Service Authority
WWTW Waste Water Treatment Works

SOL PLAATJE LOCAL MUNICIPALITY INTEGRATED DEVELOPMENT PLAN 2022 - 2027
142
ANNEXURE B: SPATIAL DEVELOPMENT FRAMEWORK

SOL PLAATJE LOCAL MUNICIPALITY INTEGRATED DEVELOPMENT PLAN 2022 - 2027
143

SOL PLAATJE LOCAL MUNICIPALITY INTEGRATED DEVELOPMENT PLAN 2022 - 2027
144

SOL PLAATJE LOCAL MUNICIPALITY INTEGRATED DEVELOPMENT PLAN 2022 - 2027
145

SOL PLAATJE LOCAL MUNICIPALITY INTEGRATED DEVELOPMENT PLAN 2022 - 2027
146

SOL PLAATJE LOCAL MUNICIPALITY INTEGRATED DEVELOPMENT PLAN 2022 - 2027
147

SOL PLAATJE LOCAL MUNICIPALITY INTEGRATED DEVELOPMENT PLAN 2022 - 2027
148
ANNEXURE C: DETAILED IDP PREPARATION SCHEDULE, 2021/2022 & 2022/2023 MTREF BUDGET
Table 18: Detailed IDP Preparation Schedule
IDP AND BUDGET TIME-SCHEDULE FOR PREPARING THE IDP REVIEW 2021/22 AND BUDGET FOR 2022/23 MTREF
NO ACTIVITY DESCRIPTION ORGANISATIONAL
RESPONSIBILITY OUTPUT
LEGISLATIVE REQUIREMENT AND
INFORMATION TIME FRAME
JULY 2021
1 Briefing sessions with EMT to initiate the Annual Report and Annual Audit processes
MM/CFO Process Plan to complete the Annual Report and Annual Audit (Audit File process)
Internal process End July/ 6 Aug 2021
2 Constituting the IDP/Budget Steering Committee
MM/CFO Legally constituted IDP/Budget Steering Committee MFMA s53(1) End July/ 6 Aug 2021
3 Consideration of the IDP and Budget Process Plan 2022/23 MTREF
MM/CFO/EMT Process Plan for the 2021/22 IDP Review and Budget for 2022/23 MTREF
MSA 32 of 2000 & MFMA No. 56 of 2003
End July/ 6 Aug 2021
4 Approval of the IDP and Budget Process Plan
Executive Mayor Approval of the IDP and Budget Process Plan for 2022/23 MTREF
MSA 32 of 2000 & MFMA No. 56 of 2003
End July/ 6 Aug 2021
5 Conclude MM and s57 Managers Performance Agreements and Plans
MM/Mayco/Corporate Services ED
Signed Performance Agreements and Plans for MM and s 57 Managers
MSA and Reg 805 30 July 2021
6
Submit 4th Quarter SDBIP 2020/21 Performance Report: 1. EMT 2. EM and BSC 3. IA & PAC, IDP Budget Com 4. Submission of Section 52 (d) Report
to Council 5. NT/PT
All 4th Quarter SDBIP 2020/21 Performance Report MFMA S52(d)
1. 16 Jul 2021 (EMT) 2. 19 Jul 2021 (EM & BSC) 3. 20 Jul 2021 IA & PAC, &
IDP, Budget and PM Com)
4. Spec Council 28 Jul 2021 5. NT/PT 30 Jul 2021
AUGUST 2021
7 Tabling of the approved (by the Budget Steering Committee) IDP and Budget Process Plan
IDP, Budget and PM Committee (Sec 80 Committee)
Recommend the approval of the IDP and Budget Process Plan to Council
Terms of Reference of the Committee (Oversight Committee on IDP, Budget and Performance Management and Reporting)
10 Aug 2021
8 Publish MM and 57 Managers Performance Agreements and Plans on Web and submit to CoGHSTA, NT and PT
Corporate Services Published and submitted performance agreements and plans
MSA and Reg 805 6 August 2021

SOL PLAATJE LOCAL MUNICIPALITY INTEGRATED DEVELOPMENT PLAN 2022 - 2027
149
IDP AND BUDGET TIME-SCHEDULE FOR PREPARING THE IDP REVIEW 2021/22 AND BUDGET FOR 2022/23 MTREF
NO ACTIVITY DESCRIPTION ORGANISATIONAL
RESPONSIBILITY OUTPUT
LEGISLATIVE REQUIREMENT AND
INFORMATION TIME FRAME
9
Presentation of Final draft AFS EMT Audit Committee AGSA
MM/CFO
Submission of annual financial statements as per section 126(1) of the MFMA. Draft Annual Performance Report 2020/21 as per section 46 of the MSA.
s126(1) of the MFMA s46 of the MSA.
20 Aug 2021 31 Aug 2021 31 Aug 2021
10
Submit Annual Report including Annual Financial Statements and Annual Performance Report to the Audit Committee
MM/CFO
Submission of annual financial statements as per section 126(1) of the MFMA. Draft Annual Performance Report 2020/21 as per section 46 of the MSA.
MFMA Circular 63, Sep 12
31 Aug 2021
11 Approval of the IDP and Budget Process Plan
Executive Mayor Council approves the IDP and Budget Process Plan 2022/23 MTREF
MSA 32 of 2000 & MFMA No. 56 of 2003
31 Aug 2021
12 Submission of the Financial Statements, Annual Report and Annual Performance Report to the AGSA
MM/CFO Submission of signed AFS, Draft Annual Report and Final Annual Performance Report to AGSA
31 Aug 2021
13 Advertisement of time-schedule on website, local newspapers and notice boards
IDP/BTO Notification to public on how and when the IDP and Budget preparation process 2022/23 will happen
MSA and MFMA 31 Aug 2021
SEPTEMBER 2021
14 Issue of Budget guidelines (operational budget)
CFO
Issue Circular on operational budget guidelines: - Confirm approved organogram - Vacant and funded positions - Maintenance Plans - Review of Long Term Borrowing Contracts
and commitments of the next MTREF - Demand for services analysis - Review of Electricity Tariff Structure
Budget Policy 17 Sept 2021
15 Commencement of IDP analysis of institutional, services and infrastructure provision, backlogs and priorities.
IDP/BTO
Assessment Report: An assessment of existing Priority Issues, present Gaps in the IDP as well as issues identified in various government policy documents, engagements with political structures, provincial CoGHSTA, NT and other stakeholders. Unaudited Annual Report 2020/21 as submitted to Auditor-General to be used as input into the IDP strategic phase process and community verification & input by MPAC on reported performance.
MSA Circular 63, Sep 2012 MSA Ch5 s 26 and IDP Guides
19 March 2022
16 Finalise Assessment Report IDP/BTO Discuss and agree on Assessment Report to inform planning and budget for the 2022/23 MTREF. 1. EMT
MFMA/Budget Regulations and Internal process
20 Sep 2021 28 Sep 2021

SOL PLAATJE LOCAL MUNICIPALITY INTEGRATED DEVELOPMENT PLAN 2022 - 2027
150
IDP AND BUDGET TIME-SCHEDULE FOR PREPARING THE IDP REVIEW 2021/22 AND BUDGET FOR 2022/23 MTREF
NO ACTIVITY DESCRIPTION ORGANISATIONAL
RESPONSIBILITY OUTPUT
LEGISLATIVE REQUIREMENT AND
INFORMATION TIME FRAME
2. BSC
17 Councillor Induction: IDP Review Process MM/Executive Mayor
Review terms of reference of IDP Rep Forum Understanding the development agenda of the municipality Presentation of the status quo report 2021/2022 Performance Analysis and future projections
MSA and MFMA 24 March 2022
OCTOBER 2021
18 Finalise Annual Report EMT The Annual Report submitted complies with the
requirements of Section 121(3) (a-k). Information on pre-determined objectives to be included Note: that it is unaudited and will not include any of the Auditor-General’s reports as the auditing thereof will still be in progress
MSA Circular 63, Sep 2012
29 April 2022
19
Municipality submits Annual Report including final annual financial statements and annual performance report to Auditor-General for auditing councils’
CFO/IDP 31 May 2022
20 Liaise with National and Provincial Sector Departments re alignment of Strategic Priorities and Budgets
IDP Task Teams Liaise with sector departments to ensure that SPM priorities form part of their strategic plans and budgets
MSA 28 March to 8 April 2022
21
Prepare and submit 1st Quarter SDBIP 2021/22 Performance Report to: 1. EMT 2. (IDP, Budget Com & IA & PAC 3, Executive Mayor 4. Special Council 5. NT & PT
EMT, IDP, Budget & PMS Com and IA & PAC Com Mayco Councillors
1st Quarter SDBIP 2021/22 Performance Report submitted
MFMA and MFMA Cir 15
1. 15 Oct 2021 2 20 Oct 2021 3. 22 Oct 2021 3. 4 Nov 2021 4. 4 Nov 2021 5. 5 Nov 2021
22
1st Strategic Planning sessions with: 1. EMT 2. IDP/Budget/PMS Committee 3. Mayco 4. Informal Council meeting
EMT, IDP, Budget & PMS Com Mayco Councillors
Finalising Key Priority Issues related to Assessment Report. Review Strategic Objectives for service delivery and development including backlogs aligned to district, provincial and national strategic plans and policies. Review financial and non-financial performance, analyse gaps between planned and actual performance. Determine financial position and assess financial/human resource capacity against possible future strategies.
Internal Process
1. 1 Oct 2021 2. 5 Oct 2021 3. 20 Oct 2021 4. 26 Oct 2021
NOVEMBER 2021
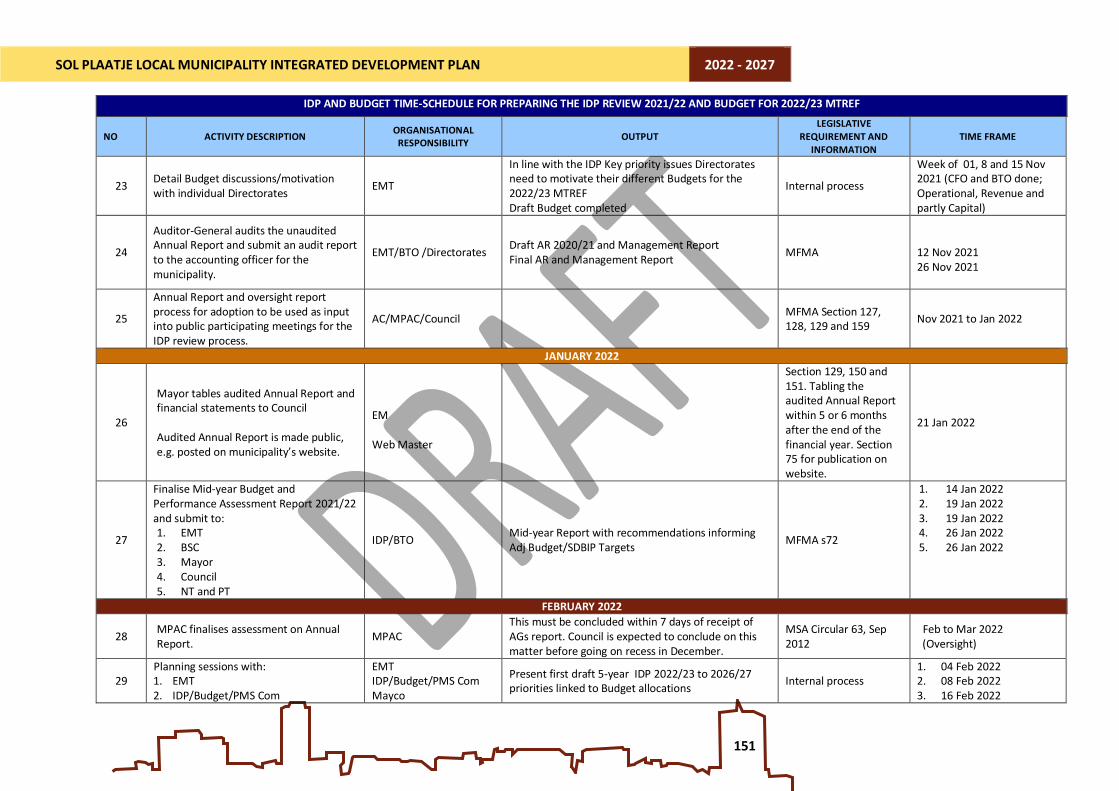
SOL PLAATJE LOCAL MUNICIPALITY INTEGRATED DEVELOPMENT PLAN 2022 - 2027
151
IDP AND BUDGET TIME-SCHEDULE FOR PREPARING THE IDP REVIEW 2021/22 AND BUDGET FOR 2022/23 MTREF
NO ACTIVITY DESCRIPTION ORGANISATIONAL
RESPONSIBILITY OUTPUT
LEGISLATIVE REQUIREMENT AND
INFORMATION TIME FRAME
23 Detail Budget discussions/motivation with individual Directorates
EMT
In line with the IDP Key priority issues Directorates need to motivate their different Budgets for the 2022/23 MTREF Draft Budget completed
Internal process
Week of 01, 8 and 15 Nov 2021 (CFO and BTO done; Operational, Revenue and partly Capital)
24
Auditor-General audits the unaudited Annual Report and submit an audit report to the accounting officer for the municipality.
EMT/BTO /Directorates Draft AR 2020/21 and Management Report Final AR and Management Report
MFMA
12 Nov 2021 26 Nov 2021
25
Annual Report and oversight report process for adoption to be used as input into public participating meetings for the IDP review process.
AC/MPAC/Council MFMA Section 127, 128, 129 and 159
Nov 2021 to Jan 2022
JANUARY 2022
26
Mayor tables audited Annual Report and financial statements to Council Audited Annual Report is made public, e.g. posted on municipality’s website.
EM Web Master
Section 129, 150 and 151. Tabling the audited Annual Report within 5 or 6 months after the end of the financial year. Section 75 for publication on website.
21 Jan 2022
27
Finalise Mid-year Budget and Performance Assessment Report 2021/22 and submit to: 1. EMT 2. BSC 3. Mayor 4. Council 5. NT and PT
IDP/BTO Mid-year Report with recommendations informing Adj Budget/SDBIP Targets
MFMA s72
1. 14 Jan 2022 2. 19 Jan 2022 3. 19 Jan 2022 4. 26 Jan 2022 5. 26 Jan 2022
FEBRUARY 2022
28 MPAC finalises assessment on Annual Report.
MPAC This must be concluded within 7 days of receipt of AGs report. Council is expected to conclude on this matter before going on recess in December.
MSA Circular 63, Sep 2012
Feb to Mar 2022 (Oversight)
29 Planning sessions with: 1. EMT 2. IDP/Budget/PMS Com
EMT IDP/Budget/PMS Com Mayco
Present first draft 5-year IDP 2022/23 to 2026/27 priorities linked to Budget allocations
Internal process 1. 04 Feb 2022 2. 08 Feb 2022 3. 16 Feb 2022

SOL PLAATJE LOCAL MUNICIPALITY INTEGRATED DEVELOPMENT PLAN 2022 - 2027
152
IDP AND BUDGET TIME-SCHEDULE FOR PREPARING THE IDP REVIEW 2021/22 AND BUDGET FOR 2022/23 MTREF
NO ACTIVITY DESCRIPTION ORGANISATIONAL
RESPONSIBILITY OUTPUT
LEGISLATIVE REQUIREMENT AND
INFORMATION TIME FRAME
3. Mayco 4. Informal Council meeting
Councillors 4. 22 Feb 2022
30 NT Mid-term visit EMT
Sec 71 and 72 Reports Qtr. 2 Performance Report 2021/22 Audited AFS 2020/21 Audit Report MFMA Sec 32 Report Risk Management Issues
NT Prescribed Between 11-18 Feb 2022
31
Adjustment Budget 1. EMT 2. BSC 3. Council
MM/CFO Tabling of Adjustment Budget 2021/22 MTREF MFMA Sec 28 1. 18 Feb 2022 2. 22 Feb 2022 3. 25 Feb 2022
32
Conduct 2020/21 annual performance assessments for MM and Managers reporting directly to MM as well as lower level managers up to job level 6
EM/MM/IDP/Human Resources
Performance Assessment Reports for MM, senior and other managers
MSA and Regulations Feb 2022
33 Note National/Provincial Government Budget for incorporation
IDP/BTO Ensure what is contained in National and provincial Budgets for incorporation in local budget
MFMA 25 Feb – 18 Mar 2022
34
Draft reviewed 5-year Capital Project Schedule aligned with IDP Strategic Objectives and KPA’s for prioritisation purposes – including Ward allocations submitted to EMT
IDP/Budget Office Draft 5-year Capital Programme 2022/23 to 2026/27 aligned to IDP Key Priority Issues including Ward priorities
Internal Process 22 April 2022
MARCH 2022
35 Draft Operating Budget submitted to EMT Directorates/BTO/ IDP Draft 3-year Operational Budget aligned to IDP Key Priority Issues
Internal Process 04 Mar 2022
36
Conduct Mid-year 2021/22 performance assessments for MM and Managers reporting directly to MM as well as lower level managers up to job level 6
EM/MM/IDP/Human Resources
Performance Assessment Reports for MM, senior and other managers
MSA and Reg 805 Mar 2022
37
1. Council adopts Oversight report. 2. Oversight report is made public. 3. Oversight report is submitted to
Legislators, Treasuries and CoGHSTA
Council CFO
The entire process, including oversight reporting and submission to provincial legislators is completed in December and not in March the following year.
MSA Circular 63, Sep 2012
Aug 2022

SOL PLAATJE LOCAL MUNICIPALITY INTEGRATED DEVELOPMENT PLAN 2022 - 2027
153
IDP AND BUDGET TIME-SCHEDULE FOR PREPARING THE IDP REVIEW 2021/22 AND BUDGET FOR 2022/23 MTREF
NO ACTIVITY DESCRIPTION ORGANISATIONAL
RESPONSIBILITY OUTPUT
LEGISLATIVE REQUIREMENT AND
INFORMATION TIME FRAME
38
Present and discuss draft 5-year IDP 2022/23 to 2026/27 and Budget 20222/23 with: 1. EMT 2. BSC 3. Mayco & relevant committees 4. Informal Council 5. Special Council
EMT/Mayco/Budget Steering Committee
Present, discuss and receive input from the different structures
Internal process
1. 10 June 2022 2. 13 June 2022 3. 15 June 2022 4. 29 June 2022
39 Table draft 5-year IDP 2022-2026/27 and Budget 2022/23 to Council for public consultation
IDP/BTO/Council Council to approve 5-Year IDP 2022/23 to 2026/27 and Budget 2022/23 for public consultation purposes
MSA and MFMA 29 June 2022(Tabling)
40 Make public the draft IDP and Budget and submit (including draft SDBIP) to NT, PT and NC CoGHSTA
IDP/BTO/Council IDP and Budget made public and submitted to relevant stakeholders for consultation purposes
MFMA 30 June 2022
APRIL 2022
41 Conduct public hearings Budget 2022/23 MTREFwith constituted public participation structures
IDP/BTO/Speaker’s Office/Service Providers
Consult and receive input from community and stakeholder groupings with regard to Budget 2022/23 MTREF
MSA and MFMA April 2022 (Public Participation)
42 Confirm National and Provincial DoRA allocations and adjust draft budget
BTO Ensure that DoRA allocations are included in the Budget
MFMA/DoRA April 2022
43
Prepare and submit 3rd Quarter SDBIP 2021/22 Performance Report to: 1. EMT 2. (IDP, Budget Com & IA & PAC 3, Executive Mayor 4. Special Council 5. NT & PT
IDP/BTO/Mayco/ Council 3rd Quarter SDBIP 2021/22 Performance report submitted
1. 14 Apr 2022 2 19 Apr 2022 3. 20 Apr 2022 4. 26 Apr 2022 5. 26 Apr 2022
44 Conclude public hearings Budget taking cognisance of input received
IDP/BTO Include input received from public consultation in Budget 2022/23
MSA and MFMA April / May 2022
45 Discuss adjusted for 2022/23 IDP/BTO Inform Mayco of input received from public consultation in IDP/Budget/SDBIP
Internal process April / May 2022
46 National Treasury benchmarking Exercise EMT/NT NT’s analysis of SPLM’s IDP and Budget 2022/23 benchmarked against 21 secondary cities to improve IDP and Budget processes and products
MFMA April/ May 2022
MAY 2022

SOL PLAATJE LOCAL MUNICIPALITY INTEGRATED DEVELOPMENT PLAN 2022 - 2027
154
IDP AND BUDGET TIME-SCHEDULE FOR PREPARING THE IDP REVIEW 2021/22 AND BUDGET FOR 2022/23 MTREF
NO ACTIVITY DESCRIPTION ORGANISATIONAL
RESPONSIBILITY OUTPUT
LEGISLATIVE REQUIREMENT AND
INFORMATION TIME FRAME
47 Finalise, Budget documentation for final submission to Council
EMT Finalise Budget documentation for final submission to Council
MSA and MFMA 06 May 2022
48
Present Budget 2022/23 to: 1. Budget Steering Com 2. IDP/Budget/PMS Com 3. Mayco 4. Informal Council
EM/MM/CFO Present final Budget and to Mayco, IDP/Budget/PMS and informal Council before submission to Council for adoption
Internal process
1. 10 May 2022 2. 12 May 2022 3. 18 May 2022 4. 25 May 2022
49
Council adopt IDP, Budget and “Top Layer” SDBIP by resolution, setting taxes and tariffs, approving changes to the IDP and budget related policies, approve measurable performance objectives for revenue by source and expenditure by vote before the start of the financial year
EM/MM/CFO Council adopted 2022/23 to 2026/27, Budget and SDBIP 2022/23
MFMA 26 May 2022
JUNE 2022
50 Notification of approved 5-year IDP 2022/23 to 2026/27 and Budget 2022/23 MTREF to public
BTO/IDP Notify public of adopted budget MFMA June 2022
51
Submit final 2022/23 SDBIP to Executive Mayor for approval, submit to Council for Notification and Make public 1. Executive Mayor 2. Council 3. NT & PT 4. Make public approved SDBIP
2022/23
IDP Executive Mayor approved SDBIP 2022/23 and published SDBIP
MFMA
1. 8 Jun 2022 2. 22 Jun 2022 3. 23 June 2022 4. 24 June 2022
52 Final Preparations for the implementation of mSCOA Version 6.6 (locked NT version)
BTO mSCOA compliance mSCOA Regulations 24 June 2022