Government Gazette Staatskoerant - National Treasury
192
N.B. The Government Printing Works will not be held responsible for the quality of “Hard Copies” or “Electronic Files” submitted for publication purposes AIDS HELPLINE: 0800-0123-22 Prevention is the cure Government Gazette Staatskoerant REPUBLIC OF SOUTH AFRICA REPUBLIEK VAN SUID AFRIKA Vol. 624 12 June Junie 2017 No. 40913 9 771682 584003 ISSN 1682-5843 40913 PART 1 OF 2
-
Upload
khangminh22 -
Category
Documents
-
view
1 -
download
0
Transcript of Government Gazette Staatskoerant - National Treasury

No. 10177Regulation Gazette Regulasiekoerant
N.B. The Government Printing Works willnot be held responsible for the quality of
“Hard Copies” or “Electronic Files”submitted for publication purposes
AIDS HELPLINE: 0800-0123-22 Prevention is the cure
Government GazetteStaatskoerant
R E P U B L I C O F S O U T H A F R I CAR E P U B L I E K VA N S U I D A F R I K A
Vol. 624 12June Junie 2017 No. 40913
9 7 7 1 6 8 2 5 8 4 0 0 3
ISSN 1682-584340913
PART 1 OF 2

This gazette is also available free online at www.gpwonline.co.za
2 No. 40913 GOVERNMENT GAZETTE, 12 JUNE 2017

This gazette is also available free online at www.gpwonline.co.za
STAATSKOERANT, 12 JUNIE 2017 No. 40913 3
General notices • alGemene KennisGewinGs
National Treasury/ Nasionale Tesourie459 Division of Revenue Act (3/2017): Publication of Section 16 (1) of the Act ............................................................... 40913 4
PageNo.
GazetteNo.No.
Contents
IMPORTANT NOTICE:The GovernmenT PrinTinG Works Will noT be held resPonsible for any errors ThaT miGhT occur due To The submission of incomPleTe / incorrecT / illeGible coPy.
no fuTure queries Will be handled in connecTion WiTh The above.

This gazette is also available free online at www.gpwonline.co.za
4 No. 40913 GOVERNMENT GAZETTE, 12 JUNE 2017
General notices • alGemene KennisGewinGs
National Treasury/ Nasionale Tesourie
NATIONAL TREASURY
NOTICE 459 OF 2017 459 Division of Revenue Act (3/2017): Publication of Section 16 (1) of the Act 40913
I, Malusi Gigaba, in my capacity as the Minister of Finance, hereby publish, in accordance with section 16(1) of the Division of Revenue Act, 2017 (Act No. 03 of 2017), the allocations per municipality for each Schedule 3; 4, Part B; 5, Part B; 6, Part B; and 7, Part B grant to local government and Schedule 6, Part A grants to provinces, and the provincial and local government frameworks for each Schedule 4, 5, 6, and 7 grant.
Part 1: Local government conditional grant allocations and appendix to Schedule 5, Part A; and Schedule 6, Part A, for provinces
Part 2: Frameworks for conditional grants to provinces Part 3: Frameworks for conditional grants to municipalities
Mr. MKN GIGABA MINISTER OF FINANCE
PUBLICATION OF GOVERNMENT GAZETTE REQUIRED IN TERMS OF SECTION 16 (1) OF THE DIVISION OF REVENUE
ACT, 2017 (ACT NO. 03 OF 2017)

This gazette is also available free online at www.gpwonline.co.za
STAATSKOERANT, 12 JUNIE 2017 No. 40913 5
PAR
T 1
LO
CA
L G
OV
ER
NM
EN
T C
ON
DIT
ION
AL
GR
AN
T A
LL
OC
ATI
ON
S Sc
hedu
les 3
, 4B,
5B
, 6B
, 7B
(Nat
iona
l and
Mun
icip
al F
inan
cial
Yea
rs)
PRO
VIN
CIA
L G
OV
ER
NM
EN
T C
ON
DIT
ION
AL
GR
AN
T A
LL
OC
ATI
ON
SA
ppen
dix
to S
ched
ules
5A
and
6A
(Nat
iona
l and
Mun
icip
al F
inan
cial
Yea
rs)

This gazette is also available free online at www.gpwonline.co.za
6 No. 40913 GOVERNMENT GAZETTE, 12 JUNE 2017
AN
NE
XU
RE
W4
SPEC
IFIC
PU
RPO
SE A
LLO
CA
TIO
NS
TO
MU
NIC
IPA
LIT
IES
(SC
HED
ULE
5, P
AR
T B
AN
D S
CH
ED
UL
E 7
, PA
RT
B):
CU
RR
EN
T G
RA
NT
S
(Nat
iona
l and
Mun
icip
al F
inan
cial
Yea
rs)

This gazette is also available free online at www.gpwonline.co.za
STAATSKOERANT, 12 JUNIE 2017 No. 40913 7A
NN
EXU
RE
W4
SPEC
IFIC
PU
RPO
SE A
LLO
CA
TIO
NS
TO M
UN
ICIP
ALI
TIES
(SC
HED
ULE
5, P
AR
T B
AN
D S
CH
EDU
LE 7
, PA
RT
B): C
UR
REN
T G
RA
NTS
Nat
iona
l and
Mun
icip
al F
inan
cial
Yea
rN
atio
nal a
nd M
unic
ipal
Fin
anci
al Y
ear
Nat
iona
l and
Mun
icip
al F
inan
cial
Yea
rN
atio
nal a
nd M
unic
ipal
Fin
anci
al Y
ear
Nat
iona
l and
Mun
icip
al F
inan
cial
Yea
rN
atio
nal a
nd M
unic
ipal
Fin
anci
al Y
ear
EA
STER
N C
APE
ABU
F B
uffa
lo C
ity10
560
11 8
0013
517
1 30
01
000
1 00
04
952
16 8
1212
800
14 5
17A
NM
A N
elso
n M
ande
la B
ay15
394
16 3
3417
229
1 05
01
000
1 00
04
807
21 2
5117
334
18 2
29
BEC
101
Dr B
eyer
s Nau
de6
847
5 94
56
455
6 71
51
383
14 1
756
455
6 71
5B
EC10
2 B
lue C
rane
Rou
te1
700
1 95
52
215
1 00
02
700
1 95
52
215
BEC
104
Mak
ana
2 14
52
400
2 66
01
000
3 14
52
400
2 66
0B
EC10
5 N
dlam
be1
900
2 15
52
415
1 00
02
900
2 15
52
415
BEC
106
Sun
days
Riv
er V
alle
y2
345
2 60
02
860
1 00
03
345
2 60
02
860
BEC
108
Kou
ga1
700
1 95
51
955
1 00
02
700
1 95
51
955
BEC
109
Kou
-Kam
ma
1 90
02
155
2 41
51
000
2 90
02
155
2 41
5C
DC1
0Sa
rah
Baar
tman
Dist
rict M
unic
ipal
ity1
250
1 00
01
000
1 00
02
250
1 00
01
000
Tota
l: Sa
rah
Baar
tman
Mun
icip
aliti
es6
847
18 8
8520
675
22 2
358
383
34 1
1520
675
22 2
35
BEC
121
Mbh
ashe
1 70
01
955
2 21
54
236
5 93
61
955
2 21
5B
EC12
2 M
nqum
a1
700
1 70
01
700
2 31
64
016
1 70
01
700
BEC
123
Gre
at K
ei2
345
2 60
02
600
1 26
33
608
2 60
02
600
BEC
124
Am
ahla
thi
1 70
01
955
2 21
51
389
3 08
91
955
2 21
5B
EC12
6 N
gqus
hwa
2 34
52
600
2 86
01
531
3 87
62
600
2 86
0B
EC12
9 R
aym
ond
Mhl
aba
4 56
63
800
4 05
64
316
1 66
210
028
4 05
64
316
CD
C12
Am
atho
le D
istric
t Mun
icip
ality
1 25
01
000
1 00
01
527
2 77
71
000
1 00
0To
tal:
Am
atho
le M
unic
ipal
ities
4 56
614
840
15 8
6616
906
13 9
2433
330
15 8
6616
906
B
EC13
1 In
xuba
Yet
hem
ba2
145
2 40
02
660
1 07
93
224
2 40
02
660
BEC
135
Intsi
ka Y
ethu
2 14
52
400
2 40
02
520
4 66
52
400
2 40
0B
EC13
6 E
mal
ahle
ni2
345
2 60
02
860
1 30
83
653
2 60
02
860
BEC
137
Eng
cobo
1 70
01
700
1 70
01
391
3 09
11
700
1 70
0B
EC13
8 S
akhi
sizw
e1
700
1 70
01
700
1 10
82
808
1 70
01
700
BEC
139
Eno
ch M
gijim
a6
847
1 80
01
900
2 00
05
945
6 20
06
460
4 88
919
481
8 10
08
460
CD
C13
Chr
is H
ani D
istric
t Mun
icip
ality
1 50
01
250
1 25
010
037
11 5
371
250
1 25
0To
tal:
Chr
is H
ani M
unic
ipal
ities
6 84
71
800
1 90
02
000
17 4
8018
250
19 0
3022
332
48 4
5920
150
21 0
30
BEC
141
Elu
ndin
i1
700
1 70
01
700
2 64
94
349
1 70
01
700
BEC
142
Sen
qu1
700
1 70
01
700
1 53
63
236
1 70
01
700
BEC
145
Wal
ter S
isulu
4 56
64
245
4 50
14
501
1 61
910
430
4 50
14
501
CD
C14
Joe G
qabi
Dist
rict M
unic
ipal
ity1
250
1 50
51
765
2 22
73
477
1 50
51
765
Tota
l: Jo
e Gqa
bi M
unic
ipal
ities
4 56
68
895
9 40
69
666
8 03
121
492
9 40
69
666
B
EC15
3 N
gquz
a Hill
1 70
01
700
1 70
01
880
3 58
01
700
1 70
0B
EC15
4 P
ort S
t Joh
ns1
900
2 15
52
415
1 50
13
401
2 15
52
415
BEC
155
Nya
nden
i1
700
1 70
01
700
1 29
12
991
1 70
01
700
BEC
156
Mhl
ontlo
2 34
52
600
2 60
01
417
3 76
22
600
2 60
0B
EC15
7 K
ing
Saba
ta D
alin
dyeb
o8
000
6 00
06
000
5 33
45
400
5 59
92
145
2 40
02
660
3 58
419
063
13 8
0014
259
CD
C15
O.R
. Tam
bo D
istric
t Mun
icip
ality
2 04
52
300
2 30
04
811
6 85
62
300
2 30
0To
tal:
O.R
.Tam
bo M
unic
ipal
ities
8 00
06
000
6 00
05
334
5 40
05
599
11 8
3512
855
13 3
7514
484
39 6
5324
255
24 9
74
BEC
441
Mat
atie
le1
700
1 70
01
700
2 78
04
480
1 70
01
700
BEC
442
Um
zim
vubu
1 70
01
955
1 95
52
537
4 23
71
955
1 95
5B
EC44
3 M
biza
na2
145
2 40
02
400
1 70
43
849
2 40
02
400
BEC
444
Nta
bank
ulu
1 90
02
155
2 41
52
311
4 21
12
155
2 41
5C
DC4
4 A
lfred
Nzo
Dist
rict M
unic
ipal
ity5
000
6 00
05
000
5 39
45
400
5 59
91
795
2 05
02
050
10 2
8022
469
13 4
5012
649
Tota
l: A
lfred
Nzo
Mun
icip
aliti
es5
000
6 00
05
000
5 39
45
400
5 59
99
240
10 2
6010
520
19 6
1239
246
21 6
6021
119
Tota
l: Ea
ster
n C
ape M
unic
ipal
ities
22 8
2613
000
12 0
0011
000
38 4
8240
834
43 9
4483
525
89 3
1293
732
96 5
2525
4 35
814
2 14
614
8 67
6
201
9/20
(R'0
00)
201
7/18
(R'0
00)
201
8/19
(R'0
00)
201
7/18
(R'0
00)
201
8/19
(R'0
00)
201
7/18
(R'0
00)
201
8/19
(R'0
00)
201
9/20
(R'0
00)
201
7/18
(R'0
00)
201
8/19
(R'0
00)
201
9/20
(R'0
00)
201
7/18
(R'0
00)
201
8/19
(R'0
00)
201
9/20
(R'0
00)
SUB-
TOTA
L: C
UR
REN
T1
Cat
egor
yM
unic
ipal
ity 2
017/
18(R
'000
) 2
018/
19(R
'000
) 2
019/
20(R
'000
)
Mun
icip
al D
emar
catio
n Tr
ansit
ion
Gra
ntEn
ergy
Eff
icie
ncy
and
Dem
and
Side
Man
agem
ent
Gra
nt
Infr
astr
uctu
re S
kills
Dev
elop
men
t Gra
ntLo
cal G
over
nmen
t Fin
anci
al M
anag
emen
t Gra
ntEx
pand
ed P
ublic
Wor
ks P
rogr
amm
e Int
egra
ted
Gra
nt fo
r Mun
icip
aliti
es
201
9/20
(R'0
00)

This gazette is also available free online at www.gpwonline.co.za
8 No. 40913 GOVERNMENT GAZETTE, 12 JUNE 2017A
NN
EXU
RE
W4
SPEC
IFIC
PU
RPO
SE A
LLO
CA
TIO
NS
TO M
UN
ICIP
ALI
TIES
(SC
HED
ULE
5, P
AR
T B
AN
D S
CH
EDU
LE 7
, PA
RT
B): C
UR
REN
T G
RA
NTS
Nat
iona
l and
Mun
icip
al F
inan
cial
Yea
rN
atio
nal a
nd M
unic
ipal
Fin
anci
al Y
ear
Nat
iona
l and
Mun
icip
al F
inan
cial
Yea
rN
atio
nal a
nd M
unic
ipal
Fin
anci
al Y
ear
Nat
iona
l and
Mun
icip
al F
inan
cial
Yea
rN
atio
nal a
nd M
unic
ipal
Fin
anci
al Y
ear
201
9/20
(R'0
00)
201
7/18
(R'0
00)
201
8/19
(R'0
00)
201
7/18
(R'0
00)
201
8/19
(R'0
00)
201
7/18
(R'0
00)
201
8/19
(R'0
00)
201
9/20
(R'0
00)
201
7/18
(R'0
00)
201
8/19
(R'0
00)
201
9/20
(R'0
00)
201
7/18
(R'0
00)
201
8/19
(R'0
00)
201
9/20
(R'0
00)
SUB-
TOTA
L: C
UR
REN
T1
Cat
egor
yM
unic
ipal
ity 2
017/
18(R
'000
) 2
018/
19(R
'000
) 2
019/
20(R
'000
)
Mun
icip
al D
emar
catio
n Tr
ansit
ion
Gra
ntEn
ergy
Eff
icie
ncy
and
Dem
and
Side
Man
agem
ent
Gra
nt
Infr
astr
uctu
re S
kills
Dev
elop
men
t Gra
ntLo
cal G
over
nmen
t Fin
anci
al M
anag
emen
t Gra
ntEx
pand
ed P
ublic
Wor
ks P
rogr
amm
e Int
egra
ted
Gra
nt fo
r Mun
icip
aliti
es
201
9/20
(R'0
00)
FR
EE S
TATE
AM
ANM
anga
ung
4 56
63
645
3 34
53
345
7 62
915
840
3 34
53
345
B
FS16
1 L
etse
men
g1
900
2 15
52
415
1 00
02
900
2 15
52
415
BFS
162
Kop
anon
g1
700
1 70
01
700
1 00
02
700
1 70
01
700
BFS
163
Moh
okar
e1
900
2 15
52
415
1 00
02
900
2 15
52
415
CD
C16
Xha
riep
Dist
rict M
unic
ipal
ity1
250
1 50
51
765
1 00
02
250
1 50
51
765
Tota
l: X
hari
ep M
unic
ipal
ities
6 75
07
515
8 29
54
000
10 7
507
515
8 29
5
BFS
181
Mas
ilony
ana
5 00
05
000
5 00
01
900
2 15
52
155
1 00
07
900
7 15
57
155
BFS
182
Tok
olog
o1
900
2 15
52
415
1 00
02
900
2 15
52
415
BFS
183
Tsw
elop
ele
1 90
02
155
2 15
51
000
2 90
02
155
2 15
5B
FS18
4 M
atjh
aben
g2
145
2 40
02
660
1 00
03
145
2 40
02
660
BFS
185
Nal
a2
345
2 60
02
860
1 00
03
345
2 60
02
860
CD
C18
Lej
wel
eput
swa D
istric
t Mun
icip
ality
1 25
01
000
1 00
01
000
2 25
01
000
1 00
0To
tal:
Lejw
elep
utsw
a M
unic
ipal
ities
5 00
05
000
5 00
011
440
12 4
6513
245
6 00
022
440
17 4
6518
245
B
FS19
1 S
etso
to1
700
1 70
01
960
1 88
93
589
1 70
01
960
BFS
192
Dih
labe
ng1
700
1 95
52
215
1 00
02
700
1 95
52
215
BFS
193
Nke
toan
a1
700
1 95
52
215
1 00
02
700
1 95
52
215
BFS
194
Mal
uti-a
-Pho
fung
2 14
52
400
2 66
05
219
7 36
42
400
2 66
0B
FS19
5 P
hum
elel
a2
345
2 60
02
860
1 00
03
345
2 60
02
860
BFS
196
Man
tsopa
2 14
52
400
2 66
01
000
3 14
52
400
2 66
0C
DC1
9 T
habo
Mof
utsa
nyan
a Dist
rict M
unic
ipal
ity6
000
6 00
06
000
1 25
01
505
1 76
52
142
9 39
27
505
7 76
5To
tal:
Thab
o M
ofut
sany
ana
Mun
icip
aliti
es6
000
6 00
06
000
12 9
8514
515
16 3
3513
250
32 2
3520
515
22 3
35
BFS
201
Moq
haka
2 14
52
400
2 40
01
000
3 14
52
400
2 40
0B
FS20
3 N
gwat
he6
000
6 00
06
000
2 14
52
400
2 66
01
000
9 14
58
400
8 66
0B
FS20
4 M
etsim
ahol
o1
700
1 95
52
215
1 00
02
700
1 95
52
215
BFS
205
Maf
ube
2 34
52
600
2 86
01
000
3 34
52
600
2 86
0C
DC2
0 F
ezile
Dab
i Dist
rict M
unic
ipal
ity1
250
1 00
01
000
1 25
01
000
1 00
0To
tal:
Fezil
e Dab
i Mun
icip
aliti
es6
000
6 00
06
000
9 58
510
355
11 1
354
000
19 5
8516
355
17 1
35
To
tal:
Free
Sta
te M
unic
ipal
ities
4 56
617
000
17 0
0017
000
44 4
0548
195
52 3
5534
879
100
850
65 1
9569
355
G
AU
TEN
G
A
EKU
Ekur
hule
ni12
000
16 0
0020
000
1 05
01
000
1 00
044
718
57 7
6817
000
21 0
00A
JHB
City
of J
ohan
nesb
urg
15 0
0016
000
20 0
008
760
9 30
09
820
1 05
01
000
1 00
017
421
42 2
3126
300
30 8
20A
TSH
City
of T
shw
ane
2 65
02
400
2 20
020
451
23 1
012
400
2 20
0
BG
T421
Em
fule
ni1
550
1 55
01
810
2 84
74
397
1 55
01
810
BG
T422
Mid
vaal
1 55
01
550
1 55
01
119
2 66
91
550
1 55
0B
GT4
23 L
esed
i6
000
6 00
05
000
1 55
01
550
1 55
01
324
8 87
47
550
6 55
0C
DC4
2 S
edib
eng
Dist
rict M
unic
ipal
ity1
250
1 25
01
250
2 49
03
740
1 25
01
250
Tota
l: Se
dibe
ng M
unic
ipal
ities
6 00
06
000
5 00
05
900
5 90
06
160
7 78
019
680
11 9
0011
160
B
GT4
81 M
ogal
e City
6 00
05
000
6 00
01
550
1 55
01
550
4 91
712
467
6 55
07
550
BG
T484
Mer
afon
g Ci
ty1
700
1 70
01
960
1 47
03
170
1 70
01
960
BG
T485
Ran
d W
est C
ity4
566
2 10
02
200
2 37
93
100
3 35
63
616
2 67
312
439
5 55
65
995
CD
C48
Wes
t Ran
d D
istric
t Mun
icip
ality
1 25
01
000
1 00
01
000
2 25
01
000
1 00
0To
tal:
Wes
t Ran
d M
unic
ipal
ities
4 56
66
000
5 00
06
000
2 10
02
200
2 37
97
600
7 60
68
126
10 0
6030
326
14 8
0616
505
Tota
l: G
aute
ng M
unic
ipal
ities
4 56
639
000
43 0
0051
000
10 8
6011
500
12 1
9918
250
17 9
0618
486
100
430
173
106
72 4
0681
685

This gazette is also available free online at www.gpwonline.co.za
STAATSKOERANT, 12 JUNIE 2017 No. 40913 9A
NN
EX
UR
E W
4SP
EC
IFIC
PU
RPO
SE A
LL
OC
AT
ION
S T
O M
UN
ICIP
AL
ITIE
S(S
CH
ED
UL
E 5
, PA
RT
B A
ND
SC
HE
DU
LE
7, P
AR
T B
): C
UR
RE
NT
GR
AN
TS
Nat
iona
l and
Mun
icip
al F
inan
cial
Yea
rN
atio
nal a
nd M
unic
ipal
Fin
anci
al Y
ear
Nat
iona
l and
Mun
icip
al F
inan
cial
Yea
rN
atio
nal a
nd M
unic
ipal
Fin
anci
al Y
ear
Nat
iona
l and
Mun
icip
al F
inan
cial
Yea
rN
atio
nal a
nd M
unic
ipal
Fin
anci
al Y
ear
201
9/20
(R'0
00)
201
7/18
(R'0
00)
201
8/19
(R'0
00)
201
7/18
(R'0
00)
201
8/19
(R'0
00)
201
7/18
(R'0
00)
201
8/19
(R'0
00)
201
9/20
(R'0
00)
201
7/18
(R'0
00)
201
8/19
(R'0
00)
201
9/20
(R'0
00)
201
7/18
(R'0
00)
201
8/19
(R'0
00)
201
9/20
(R'0
00)
SUB
-TO
TA
L: C
UR
RE
NT
1
Cat
egor
yM
unic
ipal
ity 2
017/
18(R
'000
) 2
018/
19(R
'000
) 2
019/
20(R
'000
)
Mun
icip
al D
emar
catio
n T
rans
ition
Gra
ntE
nerg
y E
ffic
ienc
y an
d D
eman
d Si
de M
anag
emen
t G
rant
In
fras
truc
ture
Ski
lls D
evel
opm
ent G
rant
Loc
al G
over
nmen
t Fin
anci
al M
anag
emen
t Gra
ntE
xpan
ded
Publ
ic W
orks
Pro
gram
me
Inte
grat
ed
Gra
nt fo
r M
unic
ipal
ities
201
9/20
(R'0
00)
K
WA
ZU
LU
-NA
TA
L
A
ETH
eThe
kwin
i15
000
10 0
0015
000
27 8
9328
433
29 3
721
050
1 00
01
000
66 7
9211
0 73
539
433
45 3
72
BK
ZN21
2uM
doni
4 56
64
245
4 50
14
501
1 00
09
811
4 50
14
501
BK
ZN21
3uM
zum
be1
900
1 90
01
900
1 29
13
191
1 90
01
900
BK
ZN21
4uM
uziw
aban
tu1
900
1 90
01
900
1 00
62
906
1 90
01
900
BK
ZN21
6R
ay N
kony
eni
4 56
63
600
3 60
03
600
3 30
611
472
3 60
03
600
CD
C21
Ugu
Dist
rict M
unic
ipal
ity1
795
2 05
02
050
1 95
63
751
2 05
02
050
Tot
al: U
gu M
unic
ipal
ities
9 13
213
440
13 9
5113
951
8 55
931
131
13 9
5113
951
B
KZN
221
uM
shw
athi
1 90
02
155
2 15
52
065
3 96
52
155
2 15
5B
KZN
222
uM
ngen
i1
700
1 95
51
955
1 00
02
700
1 95
51
955
BK
ZN22
3 M
pofa
na6
000
6 00
05
000
1 90
02
155
2 41
51
000
8 90
08
155
7 41
5B
KZN
224
iMpe
ndle
1 90
01
900
2 16
01
460
3 36
01
900
2 16
0B
KZN
225
Msu
nduz
i1
700
1 70
01
700
8 02
29
722
1 70
01
700
BK
ZN22
6 M
kham
bath
ini
1 90
02
155
2 41
51
089
2 98
92
155
2 41
5B
KZN
227
Ric
hmon
d1
900
1 90
01
900
1 44
33
343
1 90
01
900
CD
C22
uM
gung
undl
ovu
Dist
rict M
unic
ipal
ity1
250
1 00
01
000
1 42
82
678
1 00
01
000
Tot
al: u
Mgu
ngun
dlov
u M
unic
ipal
ities
6 00
06
000
5 00
014
150
14 9
2015
700
17 5
0737
657
20 9
2020
700
B
KZN
235
Okh
ahla
mba
1 90
01
900
1 90
03
911
5 81
11
900
1 90
0B
KZN
237
iNko
si La
ngal
ibal
ele
4 56
63
600
3 85
63
856
5 13
313
299
3 85
63
856
BK
ZN23
8 A
lfred
Dum
a4
566
3 60
03
600
3 60
03
347
11 5
133
600
3 60
0C
DC
23 u
Thuk
ela
Dist
rict M
unic
ipal
ity1
795
1 54
51
805
3 72
45
519
1 54
51
805
Tot
al: u
Thu
kela
Mun
icip
aliti
es9
132
10 8
9510
901
11 1
6116
115
36 1
4210
901
11 1
61
BK
ZN24
1 e
Ndu
men
i1
700
1 95
52
215
1 21
82
918
1 95
52
215
BK
ZN24
2 N
quth
u1
900
1 90
01
900
1 00
32
903
1 90
01
900
BK
ZN24
4 u
Msin
ga1
900
1 90
01
900
4 77
56
675
1 90
01
900
BK
ZN24
5 u
Mvo
ti1
800
2 05
52
315
1 00
72
807
2 05
52
315
CD
C24
uM
ziny
athi
Dist
rict M
unic
ipal
ity1
250
1 50
51
765
2 44
43
694
1 50
51
765
Tot
al: u
Mzi
nyat
hi M
unic
ipal
ities
8 55
09
315
10 0
9510
447
18 9
979
315
10 0
95
BK
ZN25
2 N
ewca
stle
1 70
01
700
1 70
04
166
5 86
61
700
1 70
0B
KZN
253
eM
adla
ngen
i1
900
2 15
52
415
1 00
02
900
2 15
52
415
BK
ZN25
4 D
annh
ause
r1
900
1 90
01
900
1 00
02
900
1 90
01
900
CD
C25
Am
ajub
a D
istric
t Mun
icip
ality
6 00
05
000
5 00
01
500
1 75
52
015
1 78
99
289
6 75
57
015
Tot
al: A
maj
uba
Mun
icip
aliti
es6
000
5 00
05
000
7 00
07
510
8 03
07
955
20 9
5512
510
13 0
30
BK
ZN26
1 e
Dum
be1
900
2 15
52
415
1 38
93
289
2 15
52
415
BK
ZN26
2 u
Phon
golo
1 90
02
155
2 41
54
678
6 57
82
155
2 41
5B
KZN
263
Aba
Qul
usi
1 70
01
955
2 21
51
505
3 20
51
955
2 21
5B
KZN
265
Non
gom
a1
900
2 15
52
155
1 03
92
939
2 15
52
155
BK
ZN26
6 U
lund
i1
800
2 05
52
055
2 99
54
795
2 05
52
055
CD
C26
Zul
ulan
d D
istric
t Mun
icip
ality
1 25
01
000
1 26
05
760
7 01
01
000
1 26
0T
otal
: Zul
ulan
d M
unic
ipal
ities
10 4
5011
475
12 5
1517
366
27 8
1611
475
12 5
15
BK
ZN27
1 u
Mhl
abuy
alin
gana
1 90
01
900
1 90
04
165
6 06
51
900
1 90
0B
KZN
272
Joz
ini
1 90
02
155
2 41
53
156
5 05
62
155
2 41
5B
KZN
275
Mtu
batu
ba1
900
2 15
52
155
1 55
83
458
2 15
52
155
BK
ZN27
6 B
ig F
ive
Hla
bisa
4 56
63
800
4 05
64
316
2 05
110
417
4 05
64
316
CD
C27
uM
khan
yaku
de D
istric
t Mun
icip
ality
1 25
01
000
1 26
01
008
2 25
81
000
1 26
0T
otal
: uM
khan
yaku
de M
unic
ipal
ities
4 56
610
750
11 2
6612
046
11 9
3827
254
11 2
6612
046
BK
ZN28
1 u
Mfo
lozi
1 90
01
900
1 90
01
418
3 31
81
900
1 90
0B
KZN
282
uM
hlat
huze
3 42
46
500
6 60
06
864
2 65
02
650
2 65
04
143
16 7
179
250
9 51
4B
KZN
284
uM
lala
zi1
700
1 95
51
955
2 98
54
685
1 95
51
955
BK
ZN28
5 M
thon
jane
ni3
424
2 85
02
850
2 85
02
222
8 49
62
850
2 85
0B
KZN
286
Nka
ndla
1 90
02
155
2 41
53
210
5 11
02
155
2 41
5C
DC
28 K
ing
Cet
shw
ayo
Dist
rict M
unic
ipal
ity1
250
1 00
01
260
5 03
26
282
1 00
01
260
Tot
al: K
ing
Cet
shw
ayo
Mun
icip
aliti
es6
848
6 50
06
600
6 86
412
250
12 5
1013
030
19 0
1044
608
19 1
1019
894
BK
ZN29
1 M
ande
ni1
900
1 90
01
900
2 28
54
185
1 90
01
900
BK
ZN29
2 K
waD
ukuz
a1
800
1 80
01
800
1 56
53
365
1 80
01
800
BK
ZN29
3 N
dwed
we
1 90
02
155
2 41
51
768
3 66
82
155
2 41
5B
KZN
294
Map
hum
ulo
1 90
01
900
1 90
01
529
3 42
91
900
1 90
0C
DC
29 iL
embe
Dist
rict M
unic
ipal
ity6
000
5 00
06
000
1 25
01
000
1 00
01
000
8 25
06
000
7 00
0T
otal
: iL
embe
Mun
icip
aliti
es6
000
5 00
06
000
8 75
08
755
9 01
58
147
22 8
9713
755
15 0
15
BK
ZN43
3 G
reat
er K
oksta
d1
800
1 80
01
800
1 00
02
800
1 80
01
800
BK
ZN43
4 u
Buh
lebe
zwe
1 90
02
155
2 15
51
000
2 90
02
155
2 15
5B
KZN
435
uM
zim
khul
u1
900
1 90
01
900
1 92
33
823
1 90
01
900
BK
ZN43
6 D
r Nko
saza
na D
lam
ini Z
uma
4 56
63
800
4 05
64
056
1 87
710
243
4 05
64
056
CD
C43
Har
ry G
wal
a D
istric
t Mun
icip
ality
8 00
08
000
6 00
01
250
1 00
01
000
1 71
810
968
9 00
07
000
Tot
al: H
arry
Gw
ala
Mun
icip
aliti
es4
566
8 00
08
000
6 00
010
650
10 9
1110
911
7 51
830
734
18 9
1116
911
Tot
al: K
waZ
ulu-
Nat
al M
unic
ipal
ities
34 2
4441
000
34 0
0037
000
34 3
9335
033
36 2
3610
7 93
511
2 51
411
7 45
419
1 35
440
8 92
618
1 54
719
0 69
0

This gazette is also available free online at www.gpwonline.co.za
10 No. 40913 GOVERNMENT GAZETTE, 12 JUNE 2017A
NN
EXU
RE
W4
SPEC
IFIC
PU
RPO
SE A
LLO
CA
TIO
NS
TO M
UN
ICIP
ALI
TIES
(SC
HED
ULE
5, P
AR
T B
AN
D S
CH
EDU
LE 7
, PA
RT
B):
CU
RR
ENT
GR
AN
TS
Nat
iona
l and
Mun
icip
al F
inan
cial
Yea
rN
atio
nal a
nd M
unic
ipal
Fin
anci
al Y
ear
Nat
iona
l and
Mun
icip
al F
inan
cial
Yea
rN
atio
nal a
nd M
unic
ipal
Fin
anci
al Y
ear
Nat
iona
l and
Mun
icip
al F
inan
cial
Yea
rN
atio
nal a
nd M
unic
ipal
Fin
anci
al Y
ear
201
9/20
(R'0
00)
201
7/18
(R'0
00)
201
8/19
(R'0
00)
201
7/18
(R'0
00)
201
8/19
(R'0
00)
201
7/18
(R'0
00)
201
8/19
(R'0
00)
201
9/20
(R'0
00)
201
7/18
(R'0
00)
201
8/19
(R'0
00)
201
9/20
(R'0
00)
201
7/18
(R'0
00)
201
8/19
(R'0
00)
201
9/20
(R'0
00)
SUB
-TO
TAL:
CU
RR
ENT1
Cat
egor
yM
unic
ipal
ity 2
017/
18(R
'000
) 2
018/
19(R
'000
) 2
019/
20(R
'000
)
Mun
icip
al D
emar
catio
n Tr
ansit
ion
Gra
ntEn
ergy
Eff
icie
ncy
and
Dem
and
Side
Man
agem
ent
Gra
nt
Infr
astr
uctu
re S
kills
Dev
elop
men
t Gra
ntLo
cal G
over
nmen
t Fin
anci
al M
anag
emen
t Gra
ntEx
pand
ed P
ublic
Wor
ks P
rogr
amm
e In
tegr
ated
G
rant
for
Mun
icip
aliti
es
201
9/20
(R'0
00)
LIM
POPO
BLI
M33
1 G
reat
er G
iyan
i2
145
2 14
52
145
4 36
46
509
2 14
52
145
BLI
M33
2 G
reat
er L
etab
a2
145
2 14
52
145
2 38
44
529
2 14
52
145
BLI
M33
3 G
reat
er T
zane
en2
145
2 14
52
145
4 91
87
063
2 14
52
145
BLI
M33
4 B
a-Ph
alab
orw
a5
000
5 00
05
000
2 14
52
400
2 66
01
000
8 14
57
400
7 66
0B
LIM
335
Mar
ulen
g1
900
1 90
01
900
1 12
43
024
1 90
01
900
CD
C33
Mop
ani D
istric
t Mun
icip
ality
1 79
52
050
2 31
01
725
3 52
02
050
2 31
0To
tal:
Mop
ani M
unic
ipal
ities
5 00
05
000
5 00
012
275
12 7
8513
305
15 5
1532
790
17 7
8518
305
BLI
M34
1LI
M34
12
282
5 00
05
000
5 00
01
900
1 90
02
160
1 01
310
195
6 90
07
160
BLI
M34
3LI
M34
32
282
1 70
01
700
1 70
02
543
6 52
51
700
1 70
0B
LIM
344
Mak
hado
2 28
21
700
1 70
01
700
2 04
86
030
1 70
01
700
BLI
M34
5LI
M 3
456
847
2 34
52
345
2 34
51
000
10 1
922
345
2 34
5C
DC3
4V
hem
be D
istric
t Mun
icip
ality
1 79
52
050
2 31
01
316
3 11
12
050
2 31
0To
tal:
Vhe
mbe
Mun
icip
aliti
es13
693
5 00
05
000
5 00
09
440
9 69
510
215
7 92
036
053
14 6
9515
215
BLI
M35
1Bl
oube
rg
3 04
42
533
2 53
32
533
1 56
27
139
2 53
32
533
BLI
M35
3M
olem
ole
3 04
42
333
2 58
82
588
1 00
06
377
2 58
82
588
BLI
M35
4Po
lokw
ane
3 04
46
000
5 00
05
000
6 21
36
500
6 86
42
979
3 23
43
234
4 97
823
214
14 7
3415
098
BLI
M35
5Le
pele
-Nku
mpi
2 14
52
145
2 14
51
160
3 30
52
145
2 14
5C
DC3
5Ca
pric
orn
Dist
rict M
unic
ipal
ity1
250
1 00
01
000
5 08
06
330
1 00
01
000
Tota
l: C
apri
corn
Mun
icip
aliti
es9
132
6 00
05
000
5 00
06
213
6 50
06
864
11 2
4011
500
11 5
0013
780
46 3
6523
000
23 3
64
BLI
M36
1 T
haba
zim
bi2
145
2 40
02
660
1 00
83
153
2 40
02
660
BLI
M36
2 L
epha
lale
1 70
01
700
1 70
01
215
2 91
51
700
1 70
0B
LIM
366
Bel
a-Be
la1
700
1 70
01
700
1 00
02
700
1 70
01
700
BLI
M36
7 M
ogal
akw
ena
1 70
01
955
1 95
51
093
2 79
31
955
1 95
5B
LIM
368
LIM
368
4 56
64
045
4 30
14
561
1 16
09
771
4 30
14
561
CD
C36
Wat
erbe
rg D
istric
t Mun
icip
ality
1 25
01
000
1 00
01
000
2 25
01
000
1 00
0To
tal:
Wat
erbe
rg M
unic
ipal
ities
4 56
612
540
13 0
5613
576
6 47
623
582
13 0
5613
576
BLI
M47
1 E
phra
im M
ogal
e2
145
2 40
02
660
1 44
73
592
2 40
02
660
BLI
M47
2 E
lias M
otso
aled
i1
700
1 95
52
215
1 44
43
144
1 95
52
215
BLI
M47
3 M
akhu
duth
amag
a1
700
1 95
51
955
1 15
82
858
1 95
51
955
BLI
M47
6 L
IM 4
764
566
4 04
54
301
4 56
11
279
9 89
04
301
4 56
1C
DC4
7 S
ekhu
khun
e D
istric
t Mun
icip
ality
1 25
01
505
1 76
51
085
2 33
51
505
1 76
5To
tal:
Sekh
ukhu
ne M
unic
ipal
ities
4 56
610
840
12 1
1613
156
6 41
321
819
12 1
1613
156
Tota
l: Li
mpo
po M
unic
ipal
ities
31 9
5716
000
15 0
0015
000
6 21
36
500
6 86
456
335
59 1
5261
752
50 1
0416
0 60
980
652
83 6
16
MPU
MA
LAN
GA
BM
P301
Chie
f Alb
ert L
uthu
li1
700
1 70
01
700
1 47
73
177
1 70
01
700
BM
P302
Msu
kalig
wa
2 14
52
400
2 66
01
458
3 60
32
400
2 66
0B
MP3
03M
khon
do2
145
2 40
02
660
3 35
05
495
2 40
02
660
BM
P304
Dr P
ixle
y ka
Isak
a Se
me
1 70
01
955
2 21
51
759
3 45
91
955
2 21
5B
MP3
05Le
kwa
1 70
01
955
2 21
51
013
2 71
31
955
2 21
5B
MP3
06D
ipal
esen
g5
000
5 00
05
000
1 90
02
155
2 41
51
706
8 60
67
155
7 41
5B
MP3
07G
ovan
Mbe
ki23
000
25 0
3926
441
1 70
01
955
1 95
54
244
28 9
4426
994
28 3
96C
DC3
0G
ert S
iban
de D
istric
t Mun
icip
ality
5 50
05
600
5 80
81
250
1 00
01
000
4 45
911
209
6 60
06
808
Tota
l: G
ert S
iban
de M
unic
ipal
ities
5 00
05
000
5 00
028
500
30 6
3932
249
14 2
4015
520
16 8
2019
466
67 2
0651
159
54 0
69
BM
P311
Vic
tor K
hany
e5
000
5 00
05
000
1 70
01
955
1 95
52
275
8 97
56
955
6 95
5B
MP3
12Em
alah
leni
2 14
52
400
2 66
01
717
3 86
22
400
2 66
0B
MP3
13St
eve
Tshw
ete
1 70
01
700
1 70
05
270
6 97
01
700
1 70
0B
MP3
14Em
akha
zeni
1 90
02
155
2 41
51
290
3 19
02
155
2 41
5B
MP3
15Th
embi
sile
Han
i1
700
1 95
51
955
2 56
04
260
1 95
51
955
BM
P316
Dr J
S M
orok
a1
700
1 95
52
215
3 24
64
946
1 95
52
215
CD
C31
Nka
ngal
a D
istric
t Mun
icip
ality
1 25
01
000
1 00
04
182
5 43
21
000
1 00
0To
tal:
Nka
ngal
a M
unic
ipal
ities
5 00
05
000
5 00
012
095
13 1
2013
900
20 5
4037
635
18 1
2018
900
BM
P321
Thab
a Ch
weu
6 00
06
000
6 00
02
145
2 40
02
660
1 90
910
054
8 40
08
660
BM
P324
Nko
maz
i1
700
1 95
51
955
7 17
48
874
1 95
51
955
BM
P325
Bush
buck
ridge
2 14
52
400
2 40
09
355
11 5
002
400
2 40
0B
MP3
26Ci
ty o
f Mbo
mbe
la4
566
7 00
08
000
10 0
003
400
3 65
63
916
6 71
421
680
11 6
5613
916
CD
C32
Ehla
nzen
i Dist
rict M
unic
ipal
ity1
500
1 25
01
250
4 35
55
855
1 25
01
250
Tota
l: Eh
lanz
eni M
unic
ipal
ities
4 56
613
000
14 0
0016
000
10 8
9011
661
12 1
8129
507
57 9
6325
661
28 1
81
Tota
l: M
pum
alan
ga M
unic
ipal
ities
4 56
623
000
24 0
0026
000
28 5
0030
639
32 2
4937
225
40 3
0142
901
69 5
1316
2 80
494
940
101
150

This gazette is also available free online at www.gpwonline.co.za
STAATSKOERANT, 12 JUNIE 2017 No. 40913 11A
NN
EXU
RE
W4
SPEC
IFIC
PU
RPO
SE A
LLO
CA
TIO
NS
TO M
UN
ICIP
ALI
TIES
(SC
HED
ULE
5, P
AR
T B
AN
D S
CH
EDU
LE 7
, PA
RT
B): C
UR
REN
T G
RA
NTS
Nat
iona
l and
Mun
icip
al F
inan
cial
Yea
rN
atio
nal a
nd M
unic
ipal
Fin
anci
al Y
ear
Nat
iona
l and
Mun
icip
al F
inan
cial
Yea
rN
atio
nal a
nd M
unic
ipal
Fin
anci
al Y
ear
Nat
iona
l and
Mun
icip
al F
inan
cial
Yea
rN
atio
nal a
nd M
unic
ipal
Fin
anci
al Y
ear
201
9/20
(R'0
00)
201
7/18
(R'0
00)
201
8/19
(R'0
00)
201
7/18
(R'0
00)
201
8/19
(R'0
00)
201
7/18
(R'0
00)
201
8/19
(R'0
00)
201
9/20
(R'0
00)
201
7/18
(R'0
00)
201
8/19
(R'0
00)
201
9/20
(R'0
00)
201
7/18
(R'0
00)
201
8/19
(R'0
00)
201
9/20
(R'0
00)
SUB
-TO
TAL:
CU
RR
ENT1
Cat
egor
yM
unic
ipal
ity 2
017/
18(R
'000
) 2
018/
19(R
'000
) 2
019/
20(R
'000
)
Mun
icip
al D
emar
catio
n Tr
ansit
ion
Gra
ntEn
ergy
Eff
icie
ncy
and
Dem
and
Side
Man
agem
ent
Gra
nt
Infr
astr
uctu
re S
kills
Dev
elop
men
t Gra
ntLo
cal G
over
nmen
t Fin
anci
al M
anag
emen
t Gra
ntEx
pand
ed P
ublic
Wor
ks P
rogr
amm
e In
tegr
ated
G
rant
for
Mun
icip
aliti
es
201
9/20
(R'0
00)
NO
RTH
ERN
CA
PE
BN
C061
Ric
hter
svel
d1
900
2 15
52
415
1 00
02
900
2 15
52
415
BN
C062
Nam
a K
hoi
2 14
52
400
2 66
01
000
3 14
52
400
2 66
0B
NC0
64 K
amie
sber
g2
345
2 60
02
860
1 00
03
345
2 60
02
860
BN
C065
Han
tam
1 90
02
155
2 15
51
000
2 90
02
155
2 15
5B
NC0
66 K
aroo
Hoo
glan
d2
000
5 00
05
000
1 90
02
155
2 41
51
000
4 90
07
155
7 41
5B
NC0
67 K
hâi-M
a1
900
2 15
52
415
1 00
02
900
2 15
52
415
CD
C6 N
amak
wa
Dist
rict M
unic
ipal
ity1
250
1 50
51
765
1 00
02
250
1 50
51
765
Tota
l: N
amak
wa
Mun
icip
aliti
es2
000
5 00
05
000
13 3
4015
125
16 6
857
000
22 3
4020
125
21 6
85
BN
C071
Ubu
ntu
1 90
02
155
2 41
51
000
2 90
02
155
2 41
5B
NC0
72 U
mso
bom
vu1
900
2 15
52
155
1 00
02
900
2 15
52
155
BN
C073
Em
than
jeni
1 70
01
700
1 70
01
086
2 78
61
700
1 70
0B
NC0
74 K
aree
berg
1 90
02
155
2 41
51
000
2 90
02
155
2 41
5B
NC0
75 R
enos
terb
erg
2 34
52
600
2 86
01
000
3 34
52
600
2 86
0B
NC0
76 T
hem
belih
le2
345
2 60
02
860
1 00
03
345
2 60
02
860
BN
C077
Siy
athe
mba
2 34
52
600
2 86
01
000
3 34
52
600
2 86
0B
NC0
78 S
iyan
cum
a2
345
2 60
02
860
1 00
03
345
2 60
02
860
CD
C7 P
ixle
y K
a Se
me
Dist
rict M
unic
ipal
ity1
250
1 50
51
765
1 00
02
250
1 50
51
765
Tota
l: Pi
xley
Ka
Sem
e M
unic
ipal
ities
18 0
3020
070
21 8
909
086
27 1
1620
070
21 8
90
BN
C082
!Kai
!Gar
ib2
345
2 60
02
860
1 00
03
345
2 60
02
860
BN
C084
!Khe
is2
345
2 60
02
860
1 00
03
345
2 60
02
860
BN
C085
Tsa
ntsa
bane
2 34
52
600
2 86
01
000
3 34
52
600
2 86
0B
NC0
86 K
gate
lope
le2
345
2 60
02
600
1 00
03
345
2 60
02
600
BN
C087
Daw
id K
ruip
er4
565
5 00
05
000
9 00
04
045
4 30
14
561
1 16
114
771
9 30
113
561
CD
C8Z.
F. M
gcaw
u D
istric
t Mun
icip
ality
1 25
01
000
1 00
01
000
2 25
01
000
1 00
0To
tal:
Z.F.
Mgc
awu
Mun
icip
aliti
es4
565
5 00
05
000
9 00
014
675
15 7
0116
741
6 16
130
401
20 7
0125
741
BN
C091
Sol
Pla
atjie
4 63
34
800
5 07
51
700
1 70
01
700
4 76
211
095
6 50
06
775
BN
C092
Dik
gatlo
ng2
345
2 60
02
860
1 00
03
345
2 60
02
860
BN
C093
Mag
aren
g1
900
2 15
52
415
1 00
02
900
2 15
52
415
BN
C094
Pho
kwan
e2
145
2 40
02
660
1 00
03
145
2 40
02
660
CD
C9 F
ranc
es B
aard
Dist
rict M
unic
ipal
ity1
250
1 00
01
000
1 16
82
418
1 00
01
000
Tota
l: Fr
ance
s Baa
rd M
unic
ipal
ities
4 63
34
800
5 07
59
340
9 85
510
635
8 93
022
903
14 6
5515
710
BN
C451
Joe
Mor
olon
g2
145
2 40
02
660
1 00
03
145
2 40
02
660
BN
C452
Ga-
Sego
nyan
a2
145
2 40
02
660
1 00
03
145
2 40
02
660
BN
C453
Gam
agar
a1
700
1 95
51
955
1 15
82
858
1 95
51
955
CD
C45
John
Tao
lo G
aetse
we
Dist
rict M
unic
ipal
ity3
200
3 50
03
696
1 25
01
000
1 26
01
000
5 45
04
500
4 95
6To
tal:
John
Tao
lo G
aets
ewe
Mun
icip
aliti
es3
200
3 50
03
696
7 24
07
755
8 53
54
158
14 5
9811
255
12 2
31
Tota
l: N
orth
ern
Cap
e M
unic
ipal
ities
4 56
57
000
10 0
0014
000
7 83
38
300
8 77
162
625
68 5
0674
486
35 3
3511
7 35
886
806
97 2
57
NO
RTH
WES
T
BN
W37
1 M
oret
ele
2 14
52
400
2 66
01
544
3 68
92
400
2 66
0B
NW
372
Mad
iben
g1
700
1 95
52
215
2 59
14
291
1 95
52
215
BN
W37
3 R
uste
nbur
g1
700
1 70
01
700
4 24
95
949
1 70
01
700
BN
W37
4 K
getle
ngriv
ier
2 34
52
600
2 86
01
362
3 70
72
600
2 86
0B
NW
375
Mos
es K
otan
e1
700
1 70
01
700
1 00
02
700
1 70
01
700
CD
C37
Boj
anal
a Pl
atin
um D
istric
t Mun
icip
ality
1 25
01
000
1 00
01
747
2 99
71
000
1 00
0To
tal:
Boj
anal
a Pl
atin
um M
unic
ipal
ities
10 8
4011
355
12 1
3512
493
23 3
3311
355
12 1
35
BN
W38
1 R
atlo
u1
900
1 90
01
900
1 99
73
897
1 90
01
900
BN
W38
2 T
swai
ng2
345
2 60
02
860
1 18
23
527
2 60
02
860
BN
W38
3 M
afik
eng
6 00
05
000
9 00
02
145
2 40
02
660
6 44
414
589
7 40
011
660
BN
W38
4 D
itsob
otla
2 14
52
400
2 66
01
208
3 35
32
400
2 66
0B
NW
385
Ram
otsh
ere
Moi
loa
2 14
52
400
2 40
01
091
3 23
62
400
2 40
0C
DC3
8 N
gaka
Mod
iri M
olem
a D
istric
t Mun
icip
ality
1 79
52
050
2 31
01
299
3 09
42
050
2 31
0To
tal:
Nga
ka M
odir
i Mol
ema
Mun
icip
aliti
es6
000
5 00
09
000
12 4
7513
750
14 7
9013
221
31 6
9618
750
23 7
90
BN
W39
2 N
aled
i3
000
5 00
05
000
1 70
01
955
2 21
52
224
6 92
46
955
7 21
5B
NW
393
Mam
usa
2 34
52
600
2 86
01
245
3 59
02
600
2 86
0B
NW
394
Gre
ater
Tau
ng2
345
2 60
02
860
1 30
93
654
2 60
02
860
BN
W39
6 L
ekw
a-Te
eman
e2
145
2 40
02
660
1 18
83
333
2 40
02
660
BN
W39
7K
agisa
no-M
olop
o3
076
3 30
53
348
3 22
56
301
3 30
53
348
CD
C39
Dr R
uth
Sego
mot
si M
ompa
ti D
istric
t Mun
icip
ality
1 25
01
505
1 76
54
842
6 09
21
505
1 76
5To
tal:
Dr
Rut
h Se
gom
otsi
Mom
pati
Mun
icip
aliti
es3
000
5 00
05
000
12 8
6114
365
15 7
0814
033
29 8
9419
365
20 7
08
BN
W40
3 C
ity o
f Mat
losa
na2
145
2 40
02
660
2 24
64
391
2 40
02
660
BN
W40
4 M
aqua
ssi H
ills
2 14
52
400
2 66
01
000
3 14
52
400
2 66
0b
NW
405
Ven
ters
dorp
/Tlo
kwe
4 56
68
000
5 00
05
000
4 04
54
301
4 56
13
868
20 4
799
301
9 56
1C
DC4
0 D
r Ken
neth
Kau
nda
Dist
rict M
unic
ipal
ity1
250
1 00
01
000
1 29
22
542
1 00
01
000
Tota
l: D
r K
enne
th K
aund
a M
unic
ipal
ities
4 56
68
000
5 00
05
000
9 58
510
101
10 8
818
406
30 5
5715
101
15 8
81
Tota
l: N
orth
Wes
t Mun
icip
aliti
es4
566
17 0
0015
000
19 0
0045
761
49 5
7153
514
48 1
5311
5 48
064
571
72 5
14

This gazette is also available free online at www.gpwonline.co.za
12 No. 40913 GOVERNMENT GAZETTE, 12 JUNE 2017
AN
NEX
UR
E W
4SP
ECIF
IC P
UR
POSE
ALL
OC
ATI
ON
S TO
MU
NIC
IPA
LITI
ES(S
CH
EDU
LE 5
, PA
RT
B A
ND
SC
HED
ULE
7, P
AR
T B
): C
UR
REN
T G
RA
NTS
Nat
iona
l and
Mun
icip
al F
inan
cial
Yea
rN
atio
nal a
nd M
unic
ipal
Fin
anci
al Y
ear
Nat
iona
l and
Mun
icip
al F
inan
cial
Yea
rN
atio
nal a
nd M
unic
ipal
Fin
anci
al Y
ear
Nat
iona
l and
Mun
icip
al F
inan
cial
Yea
rN
atio
nal a
nd M
unic
ipal
Fin
anci
al Y
ear
201
9/20
(R'0
00)
201
7/18
(R'0
00)
201
8/19
(R'0
00)
201
7/18
(R'0
00)
201
8/19
(R'0
00)
201
7/18
(R'0
00)
201
8/19
(R'0
00)
201
9/20
(R'0
00)
201
7/18
(R'0
00)
201
8/19
(R'0
00)
201
9/20
(R'0
00)
201
7/18
(R'0
00)
201
8/19
(R'0
00)
201
9/20
(R'0
00)
SUB
-TO
TAL:
CU
RR
ENT1
Cat
egor
yM
unic
ipal
ity 2
017/
18(R
'000
) 2
018/
19(R
'000
) 2
019/
20(R
'000
)
Mun
icip
al D
emar
catio
n Tr
ansit
ion
Gra
ntEn
ergy
Eff
icie
ncy
and
Dem
and
Side
Man
agem
ent
Gra
nt
Infr
astr
uctu
re S
kills
Dev
elop
men
t Gra
ntLo
cal G
over
nmen
t Fin
anci
al M
anag
emen
t Gra
ntEx
pand
ed P
ublic
Wor
ks P
rogr
amm
e In
tegr
ated
G
rant
for
Mun
icip
aliti
es
201
9/20
(R'0
00)
WES
TER
N C
APE
ACP
TCi
ty o
f Cap
e To
wn
10 0
0020
000
10 0
0010
393
11 6
3312
265
1 05
01
000
1 00
014
183
35 6
2632
633
23 2
65
BW
C011
Mat
zika
ma
1 55
01
550
1 55
01
406
2 95
61
550
1 55
0B
WC0
12 C
eder
berg
1 55
01
805
2 06
51
807
3 35
71
805
2 06
5B
WC0
13 B
ergr
ivie
r1
550
1 55
01
550
1 60
13
151
1 55
01
550
BW
C014
Sal
danh
a Ba
y1
550
1 55
01
550
1 50
03
050
1 55
01
550
BW
C015
Sw
artla
nd1
550
1 55
01
550
1 40
42
954
1 55
01
550
CD
C1 W
est C
oast
Dist
rict M
unic
ipal
ity1
250
1 00
01
000
1 10
02
350
1 00
01
000
Tota
l: W
est C
oast
Mun
icip
aliti
es9
000
9 00
59
265
8 81
817
818
9 00
59
265
BW
C022
Witz
enbe
rg1
550
1 55
01
550
1 48
53
035
1 55
01
550
BW
C023
Dra
kens
tein
1 55
01
550
1 55
02
456
4 00
61
550
1 55
0B
WC0
24 S
telle
nbos
ch7
236
10 0
0012
000
1 55
01
550
1 55
04
820
13 6
0611
550
13 5
50B
WC0
25 B
reed
e V
alle
y1
550
1 55
01
550
2 09
33
643
1 55
01
550
BW
C026
Lan
gebe
rg1
550
1 55
01
550
1 86
63
416
1 55
01
550
CD
C2 C
ape
Win
elan
ds D
istric
t Mun
icip
ality
1 25
01
000
1 00
01
000
2 25
01
000
1 00
0To
tal:
Cap
e W
inel
ands
Mun
icip
aliti
es7
236
10 0
0012
000
9 00
08
750
8 75
013
720
29 9
5618
750
20 7
50
BW
C031
The
ewat
ersk
loof
1 70
01
700
1 70
01
621
3 32
11
700
1 70
0B
WC0
32 O
vers
trand
1 55
01
550
1 55
02
300
3 85
01
550
1 55
0B
WC0
33 C
ape
Agu
lhas
1 55
01
550
1 55
01
131
2 68
11
550
1 55
0B
WC0
34 S
wel
lend
am1
700
1 95
51
955
1 29
12
991
1 95
51
955
CD
C3 O
verb
erg
Dist
rict M
unic
ipal
ity1
250
1 00
01
000
1 14
22
392
1 00
01
000
Tota
l: O
verb
erg
Mun
icip
aliti
es7
750
7 75
57
755
7 48
515
235
7 75
57
755
BW
C041
Kan
nala
nd2
145
2 40
02
400
1 00
03
145
2 40
02
400
BW
C042
Hes
sequ
a1
550
1 55
01
550
1 03
32
583
1 55
01
550
BW
C043
Mos
sel B
ay1
550
1 55
01
550
2 29
13
841
1 55
01
550
BW
C044
Geo
rge
7 00
010
000
10 0
004
100
4 50
04
752
1 55
01
550
1 55
04
001
16 6
5116
050
16 3
02B
WC0
45 O
udtsh
oorn
1 55
01
805
2 06
52
911
4 46
11
805
2 06
5B
WC0
47 B
itou
1 55
01
550
1 55
02
232
3 78
21
550
1 55
0B
WC0
48 K
nysn
a1
550
1 55
01
550
1 41
52
965
1 55
01
550
CD
C4 E
den
Dist
rict M
unic
ipal
ity1
250
1 00
01
000
1 28
02
530
1 00
01
000
Tota
l: Ed
en M
unic
ipal
ities
7 00
010
000
10 0
004
100
4 50
04
752
12 6
9512
955
13 2
1516
163
39 9
5827
455
27 9
67
BW
C051
Lai
ngsb
urg
1 80
01
800
1 80
01
031
2 83
11
800
1 80
0B
WC0
52 P
rince
Alb
ert
1 70
01
700
1 70
01
000
2 70
01
700
1 70
0B
WC0
53 B
eauf
ort W
est
6 00
05
024
5 06
51
700
1 70
01
700
1 65
99
359
6 72
46
765
CD
C5 C
entra
l Kar
oo D
istric
t Mun
icip
ality
1 25
01
000
1 00
01
095
2 34
51
000
1 00
0To
tal:
Cen
tral
Kar
oo M
unic
ipal
ities
6 00
05
024
5 06
56
450
6 20
06
200
4 78
517
235
11 2
2411
265
Tota
l: W
este
rn C
ape
Mun
icip
aliti
es30
236
45 0
2437
065
14 4
9316
133
17 0
1745
945
45 6
6546
185
65 1
5415
5 82
810
6 82
210
0 26
7
Una
lloca
ted
729
345
780
965
300
281
1 09
9 94
21
116
453
Nat
iona
l Tot
al11
1 85
620
3 23
621
5 02
422
7 06
514
0 77
414
8 93
915
7 28
050
2 00
653
1 12
256
0 86
569
1 44
772
9 34
578
0 96
51
949
600
1 99
5 02
72
061
663
1. I
nclu
des u
nallo
cate
d am
ount
s for
the
Mun
icip
al D
isaste
r Gra
nt. T
he sc
hedu
le 7
gra
nt is
allo
cate
d R3
00.3
mill
ion
in 2
017/
18, R
370.
6 m
illio
n in
201
8/19
and
R33
5.5
mill
ion
in 2
019/
20.

This gazette is also available free online at www.gpwonline.co.za
STAATSKOERANT, 12 JUNIE 2017 No. 40913 13
AN
NE
XU
RE
W5
INFR
AST
RU
CT
UR
E G
RA
NT
AL
LO
CA
TIO
NS
TO
MU
NIC
IPA
LIT
IES
(SC
HED
UL
E 4
, PA
RT
B A
ND
SC
HE
DU
LE
5, P
AR
T B
)
(Nat
iona
l and
Mun
icip
al F
inan
cial
Yea
rs)

This gazette is also available free online at www.gpwonline.co.za
14 No. 40913 GOVERNMENT GAZETTE, 12 JUNE 2017
AN
NEX
UR
E W
5IN
FRA
STR
UC
TUR
E G
RA
NT
ALL
OC
ATI
ON
S TO
MU
NIC
IPA
LITI
ES(S
CH
EDU
LE 4
, PA
RT
B A
ND
SC
HED
ULE
5, P
AR
T B
)
Nat
iona
l and
Mun
icip
al F
inan
cial
Yea
rN
atio
nal a
nd M
unic
ipal
Fin
anci
al Y
ear
Nat
iona
l and
Mun
icip
al F
inan
cial
Yea
rN
atio
nal a
nd M
unic
ipal
Fin
anci
al Y
ear
Nat
iona
l and
Mun
icip
al F
inan
cial
Yea
r
EAST
ERN
CA
PE
ABU
F B
uffa
lo C
ity25
000
30 0
0030
000
AN
MA
Nel
son
Man
dela
Bay
30 0
0045
000
45 0
00
BEC
101
Dr B
eyer
s Nau
de20
902
21 8
8722
928
7 00
07
000
10 0
00B
EC10
2 B
lue
Cran
e Ro
ute
14 4
9615
084
15 7
0517
000
8 00
08
000
BEC
104
Mak
ana
24 7
6425
990
27 2
835
000
10 0
00B
EC10
5 N
dlam
be27
715
29 1
2330
609
8 00
09
000
10 0
00B
EC10
6 S
unda
ys R
iver
Val
ley
26 0
0027
302
28 6
7613
000
13 0
0013
000
BEC
108
Kou
ga32
274
33 9
6535
749
4 00
05
000
10 0
00B
EC10
9 K
ou-K
amm
a15
592
16 2
4916
942
3 00
04
000
10 0
00C
DC1
0Sa
rah
Baar
tman
Dist
rict M
unic
ipal
ity2
235
2 34
92
485
Tota
l: Sa
rah
Baa
rtm
an M
unic
ipal
ities
161
743
169
600
177
892
17 0
0035
000
51 0
0071
000
2 23
52
349
2 48
5
BEC
121
Mbh
ashe
61 0
2764
500
68 1
6514
000
23 0
0025
000
BEC
122
Mnq
uma
63 6
9367
331
71 1
715
000
10 8
7010
000
BEC
123
Gre
at K
ei11
371
11 7
6512
182
4 00
05
000
10 0
00B
EC12
4 A
mah
lath
i28
574
30 0
3631
578
5 00
03
000
10 0
00B
EC12
6 N
gqus
hwa
22 8
3323
939
25 1
053
000
BEC
129
Ray
mon
d M
hlab
a44
877
42 0
3944
321
5 00
05
000
10 0
00C
DC1
2 A
mat
hole
Dist
rict M
unic
ipal
ity43
6 43
946
3 18
349
1 40
890
000
95 0
0010
2 00
02
933
3 16
33
344
Tota
l: A
mat
hole
Mun
icip
aliti
es66
8 81
470
2 79
374
3 93
090
000
95 0
0010
2 00
036
000
46 8
7065
000
2 93
33
163
3 34
4
BEC
131
Inxu
ba Y
ethe
mba
16 3
1317
014
17 7
549
000
12 0
0022
400
BEC
135
Intsi
ka Y
ethu
43 7
3546
137
48 6
714
500
5 00
07
000
BEC
136
Em
alah
leni
34 0
6135
862
37 7
645
000
7 00
0B
EC13
7 E
ngco
bo39
156
41 2
7343
508
13 0
0020
000
20 0
00B
EC13
8 S
akhi
sizw
e30
948
19 2
8220
161
2 00
05
000
BEC
139
Eno
ch M
gijim
a55
036
58 1
3861
411
10 0
0021
000
12 0
00C
DC1
3 C
hris
Han
i Dist
rict M
unic
ipal
ity29
2 34
031
0 15
232
8 95
020
8 50
013
2 00
025
000
80 0
0010
7 26
410
8 00
03
222
3 38
53
578
Tota
l: C
hris
Han
i Mun
icip
aliti
es51
1 58
952
7 85
855
8 21
920
8 50
013
2 00
025
000
80 0
0010
7 26
410
8 00
038
500
63 0
0073
400
3 22
23
385
3 57
8
BEC
141
Elu
ndin
i39
587
41 7
3143
993
30 0
0035
000
27 1
56B
EC14
2 S
enqu
39 1
1541
230
43 4
625
000
5 00
0B
EC14
5 W
alte
r Sisu
lu29
954
20 0
0920
934
9 00
08
000
CD
C14
Joe
Gqa
bi D
istric
t Mun
icip
ality
159
725
169
316
179
438
6 00
023
000
40 0
0064
500
87 3
1084
000
2 18
02
204
2 32
9To
tal:
Joe
Gqa
bi M
unic
ipal
ities
268
381
272
286
287
827
6 00
023
000
40 0
0064
500
87 3
1084
000
44 0
0035
000
40 1
562
180
2 20
42
329
BEC
153
Ngq
uza
Hill
55 4
3758
564
61 8
6314
500
13 0
0013
000
BEC
154
Por
t St J
ohns
34 8
9736
751
38 7
0718
000
20 0
0020
000
BEC
155
Nya
nden
i61
894
65 4
2169
143
15 0
0020
000
25 0
00B
EC15
6 M
hlon
tlo44
989
47 4
6850
084
14 0
0015
000
20 0
00B
EC15
7 K
ing
Saba
ta D
alin
dyeb
o87
808
92 9
4198
359
15 0
0015
000
35 0
00C
DC1
5 O
.R. T
ambo
Dist
rict M
unic
ipal
ity64
5 21
868
4 90
472
6 78
732
7 50
034
1 53
331
3 00
012
4 00
010
0 00
010
0 00
02
931
3 08
53
258
Tota
l: O
.R.T
ambo
Mun
icip
aliti
es93
0 24
398
6 04
91
044
943
327
500
341
533
313
000
124
000
100
000
100
000
76 5
0083
000
113
000
2 93
13
085
3 25
8
BEC
441
Mat
atie
le50
088
52 8
8355
832
80 0
0090
000
90 0
00B
EC44
2 U
mzi
mvu
bu47
190
49 8
0552
565
33 0
0036
000
40 0
00B
EC44
3 M
biza
na61
178
51 9
1654
806
34 0
0025
000
34 0
00B
EC44
4 N
taba
nkul
u27
581
28 9
8130
458
40 0
0050
000
50 0
00C
DC4
4 A
lfred
Nzo
Dist
rict M
unic
ipal
ity38
2 98
940
6 42
043
1 14
811
0 00
010
5 00
090
000
2 28
52
455
2 59
2To
tal:
Alfr
ed N
zo M
unic
ipal
ities
569
026
590
005
624
809
110
000
105
000
90 0
0018
7 00
020
1 00
021
4 00
02
285
2 45
52
592
Tota
l: Ea
ster
n C
ape
Mun
icip
aliti
es3
109
796
3 24
8 59
13
437
620
542
000
496
533
378
000
485
500
494
574
484
000
472
000
554
870
651
556
15 7
8616
641
17 5
86
201
8/19
(R'0
00)
201
9/20
(R'0
00)
201
7/18
(R'0
00)
201
8/19
(R'0
00)
201
9/20
(R'0
00)
Rur
al R
oads
Ass
et M
anag
emen
t Sys
tem
s Gra
nt
Cat
egor
yM
unic
ipal
ity 2
017/
18(R
'000
) 2
018/
19(R
'000
) 2
019/
20(R
'000
) 2
017/
18(R
'000
)
Mun
icip
al In
fras
truc
ture
Gra
ntR
egio
nal B
ulk
Infr
astr
uctu
re G
rant
Wat
er S
ervi
ces I
nfra
stru
ctur
e G
rant
Inte
grat
ed N
atio
nal E
lect
rific
atio
n Pr
ogra
mm
e (M
unic
ipal
) Gra
nt
201
7/18
(R'0
00)
201
8/19
(R'0
00)
201
9/20
(R'0
00)
201
7/18
(R'0
00)
201
8/19
(R'0
00)
201
9/20
(R'0
00)

This gazette is also available free online at www.gpwonline.co.za
STAATSKOERANT, 12 JUNIE 2017 No. 40913 15
AN
NEX
UR
E W
5IN
FRA
STR
UC
TUR
E G
RA
NT
ALL
OC
ATI
ON
S TO
MU
NIC
IPA
LITI
ES(S
CH
EDU
LE 4
, PA
RT
B A
ND
SC
HED
ULE
5, P
AR
T B
)
Nat
iona
l and
Mun
icip
al F
inan
cial
Yea
rN
atio
nal a
nd M
unic
ipal
Fin
anci
al Y
ear
Nat
iona
l and
Mun
icip
al F
inan
cial
Yea
rN
atio
nal a
nd M
unic
ipal
Fin
anci
al Y
ear
Nat
iona
l and
Mun
icip
al F
inan
cial
Yea
r 2
018/
19(R
'000
) 2
019/
20(R
'000
) 2
017/
18(R
'000
) 2
018/
19(R
'000
) 2
019/
20(R
'000
)
Rur
al R
oads
Ass
et M
anag
emen
t Sys
tem
s Gra
nt
Cat
egor
yM
unic
ipal
ity 2
017/
18(R
'000
) 2
018/
19(R
'000
) 2
019/
20(R
'000
) 2
017/
18(R
'000
)
Mun
icip
al In
fras
truc
ture
Gra
ntR
egio
nal B
ulk
Infr
astr
uctu
re G
rant
Wat
er S
ervi
ces I
nfra
stru
ctur
e G
rant
Inte
grat
ed N
atio
nal E
lect
rific
atio
n Pr
ogra
mm
e (M
unic
ipal
) Gra
nt
201
7/18
(R'0
00)
201
8/19
(R'0
00)
201
9/20
(R'0
00)
201
7/18
(R'0
00)
201
8/19
(R'0
00)
201
9/20
(R'0
00)
FREE
STA
TE
AM
AN
Man
gaun
g 20
000
12 0
0020
000
BFS
161
Let
sem
eng
17 3
7718
145
18 9
5425
000
70 0
0040
000
4 50
04
000
5 00
0B
FS16
2 K
opan
ong
30 0
3321
814
22 8
5020
000
65 0
0060
000
4 50
02
000
5 00
0B
FS16
3 M
ohok
are
18 2
3619
056
19 9
2220
000
30 0
0020
000
30 0
0048
500
55 0
002
000
5 00
0C
DC1
6 X
harie
p D
istric
t Mun
icip
ality
2 14
52
267
2 39
8To
tal:
Xha
riep
Mun
icip
aliti
es65
646
59 0
1561
726
20 0
0030
000
20 0
0075
000
183
500
155
000
9 00
08
000
15 0
002
145
2 26
72
398
BFS
181
Mas
ilony
ana
23 7
6824
931
26 1
5915
000
30 0
0050
000
5 00
0B
FS18
2 T
okol
ogo
16 7
7117
501
18 2
7111
000
4 00
09
000
BFS
183
Tsw
elop
ele
16 7
0417
430
18 1
9510
000
BFS
184
Mat
jhab
eng
121
216
128
420
136
023
30 0
0026
825
5 00
08
000
8 00
0B
FS18
5 N
ala
34 4
8231
665
33 3
085
000
8 00
08
000
CD
C18
Lej
wel
eput
swa
Dist
rict M
unic
ipal
ity2
276
2 40
02
538
Tota
l: Le
jwel
eput
swa
Mun
icip
aliti
es21
2 94
121
9 94
723
1 95
615
000
30 0
0050
000
30 0
0026
825
36 0
0020
000
25 0
002
276
2 40
02
538
BFS
191
Set
soto
47 9
9750
662
53 4
7520
000
20 0
0010
000
15 0
0020
000
25 0
006
000
5 00
05
951
BFS
192
Dih
labe
ng39
281
41 4
0643
649
15 0
0020
000
14 3
235
000
7 00
0B
FS19
3 N
keto
ana
25 7
5527
042
28 4
005
000
5 00
05
000
BFS
194
Mal
uti-a
-Pho
fung
165
732
175
695
186
210
50 0
0065
000
50 0
005
000
10 0
00B
FS19
5 P
hum
elel
a30
954
22 3
6423
434
10 0
0015
000
20 0
005
000
8 00
0B
FS19
6 M
antso
pa20
252
21 1
9822
196
15 0
0020
000
30 0
004
200
5 00
0C
DC1
9 T
habo
Mof
utsa
nyan
a D
istric
t Mun
icip
ality
2 40
02
530
2 67
2To
tal:
Thab
o M
ofut
sany
ana
Mun
icip
aliti
es32
9 97
133
8 36
735
7 36
435
000
40 0
0040
000
90 0
0012
0 00
010
9 32
311
000
29 2
0040
951
2 40
02
530
2 67
2
BFS
201
Moq
haka
40 8
4043
061
45 4
0620
000
10 0
0015
000
5 00
05
000
9 00
0B
FS20
3 N
gwat
he50
078
45 0
0147
465
15 0
0030
000
40 0
0020
000
5 00
010
000
14 0
00B
FS20
4 M
etsim
ahol
o45
398
47 9
0250
545
15 0
0010
000
10 0
0013
000
BFS
205
Maf
ube
27 0
8023
874
25 0
375
000
7 00
012
000
CD
C20
Fez
ile D
abi D
istric
t Mun
icip
ality
2 18
32
308
2 43
7To
tal:
Fezi
le D
abi M
unic
ipal
ities
163
396
159
838
168
453
15 0
0030
000
40 0
0055
000
10 0
0015
000
25 0
0032
000
48 0
002
183
2 30
82
437
Tota
l: Fr
ee S
tate
Mun
icip
aliti
es77
1 95
477
7 16
781
9 49
985
000
130
000
150
000
250
000
340
325
279
323
101
000
101
200
148
951
9 00
49
505
10 0
45
GA
UTE
NG
AEK
UEk
urhu
leni
40 0
0045
000
45 4
51A
JHB
City
of J
ohan
nesb
urg
40 0
0045
000
45 0
00A
TSH
City
of T
shw
ane
30 0
0040
000
40 0
00
BG
T421
Em
fule
ni18
1 64
518
2 40
719
3 33
630
000
20 0
0015
000
8 00
08
000
25 0
00B
GT4
22 M
idva
al32
289
33 9
8135
766
15 0
0015
000
15 0
008
000
9 00
037
000
BG
T423
Les
edi
41 9
1528
158
29 5
8520
000
15 0
0015
000
5 00
010
000
30 0
00C
DC4
2 S
edib
eng
Dist
rict M
unic
ipal
ity2
431
2 56
02
703
Tota
l: Se
dibe
ng M
unic
ipal
ities
255
849
244
546
258
687
65 0
0050
000
45 0
0021
000
27 0
0092
000
2 43
12
560
2 70
3
BG
T481
Mog
ale
City
119
195
126
274
133
745
30 0
0030
000
40 0
0010
000
BG
T484
Mer
afon
g Ci
ty67
428
71 2
9875
382
20 0
0030
000
35 0
0010
000
16 0
0030
000
BG
T485
Ran
d W
est C
ity10
0 94
898
217
103
959
35 0
0065
000
64 8
919
000
7 00
040
000
CD
C48
Wes
t Ran
d D
istric
t Mun
icip
ality
2 58
92
645
2 79
3To
tal:
Wes
t Ran
d M
unic
ipal
ities
287
571
295
789
313
086
85 0
0012
5 00
013
9 89
119
000
23 0
0080
000
2 58
92
645
2 79
3
Tota
l: G
aute
ng M
unic
ipal
ities
543
420
540
335
571
773
150
000
175
000
184
891
150
000
180
000
302
451
5 02
05
205
5 49
6

This gazette is also available free online at www.gpwonline.co.za
16 No. 40913 GOVERNMENT GAZETTE, 12 JUNE 2017A
NN
EXU
RE
W5
INFR
AST
RU
CTU
RE
GR
AN
T A
LLO
CA
TIO
NS
TO M
UN
ICIP
ALI
TIES
(SC
HED
ULE
4, P
AR
T B
AN
D S
CH
EDU
LE 5
, PA
RT
B)
Nat
iona
l and
Mun
icip
al F
inan
cial
Yea
rN
atio
nal a
nd M
unic
ipal
Fin
anci
al Y
ear
Nat
iona
l and
Mun
icip
al F
inan
cial
Yea
rN
atio
nal a
nd M
unic
ipal
Fin
anci
al Y
ear
Nat
iona
l and
Mun
icip
al F
inan
cial
Yea
r 2
018/
19(R
'000
) 2
019/
20(R
'000
) 2
017/
18(R
'000
) 2
018/
19(R
'000
) 2
019/
20(R
'000
)
Rur
al R
oads
Ass
et M
anag
emen
t Sys
tem
s Gra
nt
Cat
egor
yM
unic
ipal
ity 2
017/
18(R
'000
) 2
018/
19(R
'000
) 2
019/
20(R
'000
) 2
017/
18(R
'000
)
Mun
icip
al In
fras
truc
ture
Gra
ntR
egio
nal B
ulk
Infr
astr
uctu
re G
rant
Wat
er S
ervi
ces I
nfra
stru
ctur
e Gra
ntIn
tegr
ated
Nat
iona
l Ele
ctri
ficat
ion
Prog
ram
me
(Mun
icip
al) G
rant
201
7/18
(R'0
00)
201
8/19
(R'0
00)
201
9/20
(R'0
00)
201
7/18
(R'0
00)
201
8/19
(R'0
00)
201
9/20
(R'0
00)
KW
AZU
LU-N
ATA
L
AET
HeT
hekw
ini
35 0
0036
500
55 0
00
BK
ZN21
2uM
doni
31 1
6132
783
34 4
948
000
8 00
011
000
BK
ZN21
3uM
zum
be34
624
36 4
6038
398
10 0
0010
000
10 0
00B
KZN
214
uMuz
iwab
antu
23 6
8524
843
26 0
654
000
5 00
0B
KZN
216
Ray
Nko
nyen
i62
615
66 1
8769
956
14 0
0014
429
10 0
00C
DC2
1U
gu D
istric
t Mun
icip
ality
245
479
260
386
276
118
50 3
7275
000
95 0
002
658
2 79
72
956
Tota
l: U
gu M
unic
ipal
ities
397
564
420
659
445
031
50 3
7275
000
95 0
0036
000
37 4
2931
000
2 65
82
797
2 95
6
BK
ZN22
1 u
Msh
wat
hi39
016
29 4
4330
949
3 00
03
000
5 00
0B
KZN
222
uM
ngen
i23
379
24 5
1825
720
5 00
05
000
BK
ZN22
3 M
pofa
na12
164
12 6
0813
076
5 00
03
000
8 00
0B
KZN
224
iMpe
ndle
11 8
4512
269
12 7
175
000
5 00
0B
KZN
225
Msu
nduz
i20
1 13
921
3 29
722
6 12
838
191
65 0
0041
000
7 00
010
000
BK
ZN22
6 M
kham
bath
ini
16 2
8516
984
17 7
228
000
8 00
08
000
BK
ZN22
7 R
ichm
ond
18 6
9519
544
20 4
408
000
5 00
08
000
CD
C22
uM
gung
undl
ovu
Dist
rict M
unic
ipal
ity10
3 76
810
9 89
011
6 35
162
998
102
700
110
000
2 52
62
745
2 89
9To
tal:
uMgu
ngun
dlov
u M
unic
ipal
ities
426
291
438
553
463
103
101
189
167
700
151
000
29 0
0036
000
44 0
002
526
2 74
52
899
BK
ZN23
5 O
khah
lam
ba28
742
30 2
1431
767
13 0
00B
KZN
237
iNko
si La
ngal
ibal
ele
38 2
7640
338
42 5
1515
000
9 00
07
000
BK
ZN23
8 A
lfred
Dum
a62
749
66 3
2970
107
15 0
008
000
7 00
0C
DC2
3 u
Thuk
ela
Dist
rict M
unic
ipal
ity18
7 30
419
8 60
521
0 53
195
052
100
000
50 0
0082
500
93 0
0010
8 00
02
483
2 65
62
809
Tota
l: uT
huke
la M
unic
ipal
ities
317
071
335
486
354
920
95 0
5210
0 00
050
000
82 5
0093
000
108
000
43 0
0017
000
14 0
002
483
2 65
62
809
BK
ZN24
1 e
Ndu
men
i15
402
16 0
4716
728
9 00
010
000
10 0
00B
KZN
242
Nqu
thu
42 6
9133
346
35 0
9224
000
20 0
0020
000
BK
ZN24
4 u
Msin
ga38
032
40 0
8042
241
24 0
0020
000
20 0
00B
KZN
245
uM
voti
30 2
6931
835
33 4
8815
000
15 0
0015
000
CD
C24
uM
ziny
athi
Dist
rict M
unic
ipal
ity19
1 94
120
3 52
921
5 75
898
933
60 0
0040
000
78 6
9389
000
105
000
2 27
52
414
2 54
9To
tal:
uMzin
yath
i Mun
icip
aliti
es31
8 33
532
4 83
734
3 30
798
933
60 0
0040
000
78 6
9389
000
105
000
72 0
0065
000
65 0
002
275
2 41
42
549
BK
ZN25
2 N
ewca
stle
114
604
121
398
128
568
45 0
0055
000
60 0
009
000
20 0
0020
000
BK
ZN25
3 e
Mad
lang
eni
9 42
39
697
9 98
712
000
10 0
0015
000
BK
ZN25
4 D
annh
ause
r22
081
23 1
4024
258
CD
C25
Am
ajub
a D
istric
t Mun
icip
ality
41 7
1743
993
46 3
9570
000
78 0
0088
000
2 20
02
316
2 44
8To
tal:
Am
ajub
a M
unic
ipal
ities
187
825
198
228
209
208
115
000
133
000
148
000
21 0
0030
000
35 0
002
200
2 31
62
448
BK
ZN26
1 e
Dum
be18
292
19 1
1619
986
24 0
0025
000
25 0
00B
KZN
262
uPh
ongo
lo28
741
30 2
1231
765
9 00
011
000
15 0
00B
KZN
263
Aba
Qul
usi
37 7
4039
769
41 9
1115
000
15 0
0015
000
BK
ZN26
5 N
ongo
ma
43 3
7834
075
35 8
6615
000
10 0
0010
000
BK
ZN26
6 U
lund
i31
388
33 0
2334
750
26 0
0020
000
15 0
00C
DC2
6 Z
ulul
and
Dist
rict M
unic
ipal
ity22
9 72
524
3 65
525
8 35
611
0 00
015
4 88
350
000
107
746
115
000
100
000
2 35
92
511
2 65
6To
tal:
Zulu
land
Mun
icip
aliti
es38
9 26
439
9 85
042
2 63
411
0 00
015
4 88
350
000
107
746
115
000
100
000
89 0
0081
000
80 0
002
359
2 51
12
656
BK
ZN27
1 u
Mhl
abuy
alin
gana
35 4
8137
370
39 3
6425
000
20 0
0020
000
BK
ZN27
2 Jo
zini
38 0
0340
049
42 2
0815
000
20 0
0020
000
BK
ZN27
5 M
tuba
tuba
32 2
5333
943
35 7
2514
000
13 0
0010
000
BK
ZN27
6 B
ig F
ive
Hla
bisa
21 6
6422
697
23 7
8814
000
14 0
0018
000
CD
C27
uM
khan
yaku
de D
istric
t Mun
icip
ality
218
910
232
169
246
163
50 0
0065
000
80 0
002
619
2 71
32
867
Tota
l: uM
khan
yaku
de M
unic
ipal
ities
346
311
366
228
387
248
50 0
0065
000
80 0
0068
000
67 0
0068
000
2 61
92
713
2 86
7
BK
ZN28
1 u
Mfo
lozi
26 6
2327
964
29 3
7813
000
10 0
0016
000
BK
ZN28
2 u
Mhl
athu
ze10
8 74
211
5 17
312
1 96
034
000
46 0
0040
000
10 0
0010
000
40 0
00B
KZN
284
uM
lala
zi41
045
43 2
8045
638
8 00
08
000
15 0
00B
KZN
285
Mth
onja
neni
18 2
7819
102
19 9
708
000
8 00
015
000
BK
ZN28
6 N
kand
la23
170
24 2
9625
485
15 0
0015
000
CD
C28
Kin
g Ce
tshw
ayo
Dist
rict M
unic
ipal
ity17
3 93
818
4 41
019
5 46
266
410
104
830
90 0
0011
0 00
073
000
93 0
002
523
2 61
62
766
Tota
l: K
ing
Cet
shw
ayo
Mun
icip
aliti
es39
1 79
641
4 22
543
7 89
366
410
104
830
90 0
0014
4 00
011
9 00
013
3 00
039
000
51 0
0010
1 00
02
523
2 61
62
766
BK
ZN29
1 M
ande
ni35
940
37 8
5839
882
10 0
0015
000
18 0
00B
KZN
292
Kw
aDuk
uza
52 5
6255
510
58 6
2210
000
18 0
0030
000
BK
ZN29
3 N
dwed
we
41 2
7531
842
33 4
9614
000
9 00
010
176
BK
ZN29
4 M
aphu
mul
o22
646
23 7
4024
894
15 0
0010
000
10 0
00C
DC2
9 iL
embe
Dist
rict M
unic
ipal
ity19
6 12
620
7 97
322
0 47
714
5 00
090
000
65 0
0062
500
99 5
0010
7 10
52
266
2 73
92
894
Tota
l: iL
embe
Mun
icip
aliti
es34
8 54
935
6 92
337
7 37
114
5 00
090
000
65 0
0062
500
99 5
0010
7 10
549
000
52 0
0068
176
2 26
62
739
2 89
4
BK
ZN43
3 G
reat
er K
oksta
d17
550
18 3
2819
149
10 0
0030
000
45 0
00B
KZN
434
uBu
hleb
ezw
e27
330
28 7
1430
175
20 0
0020
000
25 0
00B
KZN
435
uM
zim
khul
u44
095
46 5
1949
076
15 0
0022
000
25 0
00B
KZN
436
Dr N
kosa
zana
Dla
min
i Zum
a27
566
28 9
6530
441
14 0
0010
000
20 0
00C
DC4
3 H
arry
Gw
ala
Dist
rict M
unic
ipal
ity20
4 54
521
6 91
522
9 96
990
000
100
000
97 9
2398
000
108
400
98 0
002
221
2 31
02
439
Tota
l: H
arry
Gw
ala
Mun
icip
aliti
es32
1 08
633
9 44
135
8 81
090
000
100
000
97 9
2398
000
108
400
98 0
0059
000
82 0
0011
5 00
02
221
2 31
02
439
Tota
l: K
waZ
ulu-
Nat
al M
unic
ipal
ities
3 44
4 09
23
594
430
3 79
9 52
560
5 39
560
9 71
339
2 92
389
0 00
01
064
600
1 12
5 10
554
0 00
055
4 92
967
6 17
624
130
25 8
1727
283

This gazette is also available free online at www.gpwonline.co.za
STAATSKOERANT, 12 JUNIE 2017 No. 40913 17A
NN
EXU
RE
W5
INFR
AST
RU
CTU
RE
GR
AN
T A
LLO
CA
TIO
NS
TO M
UN
ICIP
ALI
TIES
(SC
HED
ULE
4, P
AR
T B
AN
D S
CH
EDU
LE 5
, PA
RT
B)
Nat
iona
l and
Mun
icip
al F
inan
cial
Yea
rN
atio
nal a
nd M
unic
ipal
Fin
anci
al Y
ear
Nat
iona
l and
Mun
icip
al F
inan
cial
Yea
rN
atio
nal a
nd M
unic
ipal
Fin
anci
al Y
ear
Nat
iona
l and
Mun
icip
al F
inan
cial
Yea
r 2
018/
19(R
'000
) 2
019/
20(R
'000
) 2
017/
18(R
'000
) 2
018/
19(R
'000
) 2
019/
20(R
'000
)
Rur
al R
oads
Ass
et M
anag
emen
t Sys
tem
s Gra
nt
Cat
egor
yM
unic
ipal
ity 2
017/
18(R
'000
) 2
018/
19(R
'000
) 2
019/
20(R
'000
) 2
017/
18(R
'000
)
Mun
icip
al In
fras
truc
ture
Gra
ntR
egio
nal B
ulk
Infr
astr
uctu
re G
rant
Wat
er S
ervi
ces I
nfra
stru
ctur
e G
rant
Inte
grat
ed N
atio
nal E
lect
rific
atio
n Pr
ogra
mm
e (M
unic
ipal
) Gra
nt
201
7/18
(R'0
00)
201
8/19
(R'0
00)
201
9/20
(R'0
00)
201
7/18
(R'0
00)
201
8/19
(R'0
00)
201
9/20
(R'0
00)
LIM
POPO
BLI
M33
1 G
reat
er G
iyan
i61
736
65 2
5368
964
20 0
0010
000
10 0
00B
LIM
332
Gre
ater
Let
aba
61 1
6261
920
65 4
27B
LIM
333
Gre
ater
Tza
neen
95 9
4210
1 58
010
7 52
925
000
15 0
0020
000
BLI
M33
4 B
a-Ph
alab
orw
a39
619
34 2
4236
043
9 00
03
000
19 0
00B
LIM
335
Mar
ulen
g27
223
28 6
0030
054
CD
C33
Mop
ani D
istric
t Mun
icip
ality
462
748
491
124
521
069
95 0
0010
7 00
011
0 00
02
202
2 33
02
464
Tota
l: M
opan
i Mun
icip
aliti
es74
8 43
078
2 71
982
9 08
695
000
107
000
110
000
54 0
0028
000
49 0
002
202
2 33
02
464
BLI
M34
1LI
M34
129
468
30 9
8432
585
18 0
0010
000
20 0
00B
LIM
343
LIM
343
101
159
107
119
113
410
40 0
0035
000
40 0
00B
LIM
344
Mak
hado
91 1
6996
510
102
147
25 0
0025
000
45 0
00B
LIM
345
LIM
345
83 4
8088
345
93 4
7918
000
7 00
013
000
CD
C34
Vhe
mbe
Dist
rict M
unic
ipal
ity52
4 36
055
6 55
459
0 53
032
478
45 0
0050
000
2 24
42
336
2 46
9To
tal:
Vhe
mbe
Mun
icip
aliti
es82
9 63
687
9 51
293
2 15
132
478
45 0
0050
000
101
000
77 0
0011
8 00
02
244
2 33
62
469
BLI
M35
1Bl
oube
rg
45 0
9047
575
50 1
987
000
7 00
07
000
BLI
M35
3M
olem
ole
35 7
1837
622
39 6
324
000
3 00
0B
LIM
354
Polo
kwan
e 35
2 17
836
5 45
438
7 65
820
9 67
628
6 92
464
6 18
095
000
110
000
40 0
0040
000
40 0
00B
LIM
355
Lepe
le-N
kum
pi60
134
58 0
9661
367
CD
C35
Capr
icor
n D
istric
t Mun
icip
ality
235
037
249
296
264
345
90 0
0078
000
105
000
2 41
72
512
2 65
9To
tal:
Cap
rico
rn M
unic
ipal
ities
728
157
758
043
803
200
209
676
286
924
646
180
90 0
0017
3 00
021
5 00
047
000
51 0
0050
000
2 41
72
512
2 65
9
BLI
M36
1 T
haba
zim
bi33
759
35 5
4237
423
BLI
M36
2 L
epha
lale
44 3
7046
810
49 3
8650
000
35 0
0040
000
12 0
005
000
35 0
00B
LIM
366
Bel
a-Be
la26
304
27 6
2529
019
35 0
0040
000
45 0
0025
000
20 0
0035
000
BLI
M36
7 M
ogal
akw
ena
159
266
168
829
178
921
50 0
0060
000
70 0
0013
000
15 0
0015
000
BLI
M36
8 L
IM 3
6839
190
41 3
0943
546
80 0
0080
000
90 0
008
000
5 00
010
000
CD
C36
Wat
erbe
rg D
istric
t Mun
icip
ality
2 12
92
231
2 35
8To
tal:
Wat
erbe
rg M
unic
ipal
ities
302
889
320
115
338
295
215
000
215
000
245
000
58 0
0045
000
95 0
002
129
2 23
12
358
BLI
M47
1 E
phra
im M
ogal
e44
810
35 7
7537
670
BLI
M47
2 E
lias M
otso
aled
i55
860
59 0
1362
340
15 0
0010
000
24 0
00B
LIM
473
Mak
hudu
tham
aga
63 1
9666
804
70 6
1113
000
BLI
M47
6 L
IM 4
7685
863
90 8
7596
165
10 0
0050
000
40 0
00C
DC4
7 S
ekhu
khun
e D
istric
t Mun
icip
ality
484
042
513
737
545
076
95 0
0065
000
70 0
002
286
2 40
92
556
Tota
l: Se
khuk
hune
Mun
icip
aliti
es73
3 77
176
6 20
481
1 86
295
000
65 0
0070
000
38 0
0060
000
64 0
002
286
2 40
92
556
Tota
l: Li
mpo
po M
unic
ipal
ities
3 34
2 88
33
506
593
3 71
4 59
420
9 67
628
6 92
464
6 18
052
7 47
860
5 00
069
0 00
029
8 00
026
1 00
037
6 00
011
278
11 8
1812
506
MPU
MA
LAN
GA
BM
P301
Chie
f Alb
ert L
uthu
li88
616
93 7
9999
269
35 0
0020
000
25 0
007
000
10 0
0020
000
BM
P302
Msu
kalig
wa
53 6
0856
621
59 8
0121
000
17 0
0030
000
BM
P303
Mkh
ondo
82 2
1584
347
89 2
3535
000
15 0
0025
000
10 0
0011
000
15 0
00B
MP3
04 D
r Pix
ley
ka Is
aka
Sem
e29
327
28 1
8029
608
17 0
0010
000
8 00
0B
MP3
05Le
kwa
29 2
9330
799
32 3
8830
000
20 0
0030
000
8 00
010
000
8 00
0B
MP3
06D
ipal
esen
g19
076
19 9
4920
870
17 0
0015
000
12 0
00B
MP3
07G
ovan
Mbe
ki58
796
62 1
3165
650
14 0
0012
000
25 0
00C
DC3
0G
ert S
iban
de D
istric
t Mun
icip
ality
119
518
183
621
359
347
2 30
92
413
2 54
8To
tal:
Ger
t Sib
ande
Mun
icip
aliti
es36
0 93
137
5 82
639
6 82
111
9 51
818
3 62
135
9 34
710
0 00
055
000
80 0
0094
000
85 0
0011
8 00
02
309
2 41
32
548
BM
P311
Vic
tor K
hany
e25
286
26 5
4427
871
5 00
013
000
BM
P312
Emal
ahle
ni12
2 13
912
9 40
013
7 06
345
000
40 0
0030
780
BM
P313
Stev
e Ts
hwet
e50
557
53 3
8156
362
8 00
023
000
BM
P314
Emak
haze
ni18
484
19 3
2020
202
30 0
0015
000
20 0
007
000
6 98
98
000
BM
P315
Them
bisil
e H
ani
131
562
133
137
141
030
45 0
0045
000
50 0
002
000
2 00
0B
MP3
16D
r JS
Mor
oka
127
371
134
957
142
962
5 00
010
000
10 0
003
000
3 00
0C
DC3
1N
kang
ala
Dist
rict M
unic
ipal
ity2
175
2 28
02
408
Tota
l: N
kang
ala
Mun
icip
aliti
es47
5 39
949
6 73
952
5 49
080
000
70 0
0080
000
52 0
0064
989
79 7
802
175
2 28
02
408
BM
P321
Thab
a Ch
weu
48 1
7950
856
53 6
8145
000
40 0
0045
000
13 0
005
000
20 0
00B
MP3
24N
kom
azi
233
857
243
101
257
768
40 0
0040
000
45 0
005
000
5 00
020
000
BM
P325
Bush
buck
ridge
394
080
404
290
428
887
3 00
011
0 00
055
000
64 0
005
000
6 00
016
000
BM
P326
City
of M
bom
bela
339
939
360
701
382
612
40 0
0040
000
45 0
0031
000
30 0
0050
000
CD
C32
Ehla
nzen
i Dist
rict M
unic
ipal
ity2
347
2 47
52
614
Tota
l: Eh
lanz
eni M
unic
ipal
ities
1 01
6 05
51
058
948
1 12
2 94
83
000
235
000
175
000
199
000
54 0
0046
000
106
000
2 34
72
475
2 61
4
Tota
l: M
pum
alan
ga M
unic
ipal
ities
1 85
2 38
51
931
513
2 04
5 25
912
2 51
818
3 62
135
9 34
741
5 00
030
0 00
035
9 00
020
0 00
019
5 98
930
3 78
06
831
7 16
87
570

This gazette is also available free online at www.gpwonline.co.za
18 No. 40913 GOVERNMENT GAZETTE, 12 JUNE 2017A
NN
EXU
RE
W5
INFR
AST
RU
CTU
RE
GR
AN
T A
LLO
CA
TIO
NS
TO M
UN
ICIP
ALI
TIES
(SC
HED
ULE
4, P
AR
T B
AN
D S
CH
EDU
LE 5
, PA
RT
B)
Nat
iona
l and
Mun
icip
al F
inan
cial
Yea
rN
atio
nal a
nd M
unic
ipal
Fin
anci
al Y
ear
Nat
iona
l and
Mun
icip
al F
inan
cial
Yea
rN
atio
nal a
nd M
unic
ipal
Fin
anci
al Y
ear
Nat
iona
l and
Mun
icip
al F
inan
cial
Yea
r 2
018/
19(R
'000
) 2
019/
20(R
'000
) 2
017/
18(R
'000
) 2
018/
19(R
'000
) 2
019/
20(R
'000
)
Rur
al R
oads
Ass
et M
anag
emen
t Sys
tem
s Gra
nt
Cat
egor
yM
unic
ipal
ity 2
017/
18(R
'000
) 2
018/
19(R
'000
) 2
019/
20(R
'000
) 2
017/
18(R
'000
)
Mun
icip
al In
fras
truc
ture
Gra
ntR
egio
nal B
ulk
Infr
astr
uctu
re G
rant
Wat
er S
ervi
ces I
nfra
stru
ctur
e G
rant
Inte
grat
ed N
atio
nal E
lect
rific
atio
n Pr
ogra
mm
e (M
unic
ipal
) Gra
nt
201
7/18
(R'0
00)
201
8/19
(R'0
00)
201
9/20
(R'0
00)
201
7/18
(R'0
00)
201
8/19
(R'0
00)
201
9/20
(R'0
00)
NO
RTH
ERN
CA
PE
BN
C061
Ric
hter
svel
d7
382
7 52
97
685
6 00
07
000
18 0
0023
844
BN
C062
Nam
a K
hoi
14 7
7415
380
16 0
195
000
5 00
03
000
35 9
26B
NC0
64 K
amie
sber
g7
601
7 76
27
932
4 00
01
000
BN
C065
Han
tam
16 7
1610
150
10 4
6750
426
47 2
479
509
4 00
01
000
2 00
01
000
BN
C066
Kar
oo H
oogl
and
8 14
58
340
8 54
630
000
27 0
004
000
1 00
0B
NC0
67 K
hâi-M
a7
825
8 00
08
185
5 00
01
000
2 00
01
000
CD
C6 N
amak
wa
Dist
rict M
unic
ipal
ity2
898
3 01
83
187
Tota
l: N
amak
wa
Mun
icip
aliti
es62
443
57 1
6158
834
50 4
2677
247
36 5
0928
000
15 0
0025
000
62 7
702
898
3 01
83
187
BN
C071
Ubu
ntu
10 0
6310
377
10 7
094
000
1 00
03
000
1 50
0B
NC0
72 U
mso
bom
vu11
612
12 0
2112
454
4 00
02
000
5 00
01
500
BN
C073
Em
than
jeni
12 2
9212
744
13 2
2130
000
4 75
714
000
6 00
02
000
1 00
0B
NC0
74 K
aree
berg
8 09
58
287
8 49
030
000
46 8
244
000
1 00
0B
NC0
75 R
enos
terb
erg
7 52
77
683
7 84
910
000
3 00
021
000
23 0
00B
NC0
76 T
hem
belih
le9
533
9 81
410
110
4 00
01
000
BN
C077
Siy
athe
mba
9 92
010
225
10 5
4750
0B
NC0
78 S
iyan
cum
a23
693
17 5
5918
333
10 0
003
000
2 00
01
000
CD
C7 P
ixle
y K
a Se
me
Dist
rict M
unic
ipal
ity3
003
3 17
33
356
Tota
l: Pi
xley
Ka
Sem
e M
unic
ipal
ities
92 7
3588
710
91 7
1330
000
76 8
244
757
50 0
0017
000
33 0
0028
500
3 00
33
173
3 35
6
BN
C082
!Kai
!Gar
ib22
744
23 8
4425
004
10 0
003
000
2 00
030
000
BN
C084
!Khe
is10
798
11 1
5811
537
7 50
08
000
BN
C085
Tsa
ntsa
bane
15 7
4016
406
17 1
094
000
5 00
010
000
BN
C086
Kga
telo
pele
8 09
98
291
8 49
412
644
4 00
02
000
2 50
0B
NC0
87 D
awid
Kru
iper
25 4
6826
737
28 0
767
000
17 0
001
000
52 0
00C
DC8
Z.F.
Mgc
awu
Dist
rict M
unic
ipal
ity2
860
3 00
13
169
Tota
l: Z.
F. M
gcaw
u M
unic
ipal
ities
82 8
4986
436
90 2
2012
644
32 5
0020
000
10 0
0010
2 50
02
860
3 00
13
169
BN
C091
Sol
Pla
atjie
57 5
0353
465
56 4
5120
000
10 5
5125
000
31 0
007
989
50 3
54B
NC0
92 D
ikga
tlong
19 8
0020
718
21 6
863
000
2 00
01
600
BN
C093
Mag
aren
g11
279
11 6
6912
079
15 0
0025
000
50 0
00B
NC0
94 P
hokw
ane
26 6
6528
008
29 4
2525
000
30 0
0035
000
3 00
01
000
6 00
0C
DC9
Fra
nces
Baa
rd D
istric
t Mun
icip
ality
2 51
62
635
2 78
5To
tal:
Fran
ces B
aard
Mun
icip
aliti
es11
5 24
711
3 86
011
9 64
120
000
10 5
5150
000
30 0
0035
000
52 0
0035
989
107
954
2 51
62
635
2 78
5
BN
C451
Joe
Mor
olon
g61
060
64 5
3568
203
45 0
0095
000
100
000
2 00
036
000
BN
C452
Ga-
Sego
nyan
a54
211
57 2
6260
481
35 0
0080
000
95 0
005
000
40 0
00B
NC4
53 G
amag
ara
11 9
8212
415
12 8
7121
587
45 0
0020
000
20 0
0025
000
15 0
0025
000
65 0
00C
DC4
5 Jo
hn T
aolo
Gae
tsew
e D
istric
t Mun
icip
ality
1 97
92
072
2 19
8To
tal:
John
Tao
lo G
aets
ewe
Mun
icip
aliti
es12
7 25
313
4 21
214
1 55
521
587
45 0
0010
0 00
019
5 00
022
0 00
020
000
27 0
0014
1 00
01
979
2 07
22
198
Tota
l: N
orth
ern
Cap
e M
unic
ipal
ities
480
527
480
379
501
963
100
426
186
209
98 9
1026
0 50
022
5 00
025
5 00
012
4 00
013
0 98
944
2 72
413
256
13 8
9914
695
NO
RTH
WES
T
BN
W37
1 M
oret
ele
131
845
123
778
131
095
62 0
0074
000
80 0
006
451
BN
W37
2 M
adib
eng
287
005
304
486
322
935
14 0
0022
000
35 0
00B
NW
373
Rus
tenb
urg
239
436
253
969
269
306
65 0
0074
000
88 0
0030
000
BN
W37
4 K
getle
ngriv
ier
26 2
3927
556
28 9
4620
000
25 0
0030
000
10 0
00B
NW
375
Mos
es K
otan
e15
2 41
516
1 55
317
1 19
755
000
50 0
0055
000
5 00
0C
DC3
7 B
ojan
ala
Plat
inum
Dist
rict M
unic
ipal
ity2
359
2 45
92
599
Tota
l: B
ojan
ala
Plat
inum
Mun
icip
aliti
es83
6 94
087
1 34
292
3 47
920
2 00
022
3 00
025
3 00
014
000
22 0
0086
451
2 35
92
459
2 59
9
BN
W38
1 R
atlo
u29
859
31 4
0033
026
BN
W38
2 T
swai
ng29
730
31 2
6332
881
3 00
03
000
BN
W38
3 M
afik
eng
62 2
8865
840
69 5
875
000
10 0
00B
NW
384
Dits
obot
la37
133
39 1
2541
227
18 0
007
000
3 00
0B
NW
385
Ram
otsh
ere
Moi
loa
45 0
3339
790
41 9
3315
000
5 00
02
000
CD
C38
Nga
ka M
odiri
Mol
ema
Dist
rict M
unic
ipal
ity30
5 04
032
3 63
934
3 26
82
535
2 65
82
809
Tota
l: N
gaka
Mod
iri M
olem
a M
unic
ipal
ities
509
083
531
057
561
922
33 0
0020
000
18 0
002
535
2 65
82
809
BN
W39
2 N
aled
i17
205
17 9
6118
760
18 0
0010
000
13 1
96B
NW
393
Mam
usa
15 8
9716
572
17 2
85B
NW
394
Gre
ater
Tau
ng63
406
51 0
9653
936
8 00
025
000
BN
W39
6 L
ekw
a-Te
eman
e14
977
15 5
9516
248
9 00
08
000
12 0
00B
NW
397
Kag
isano
-Mol
opo
30 5
3932
122
33 7
936
000
12 0
00C
DC3
9D
r Rut
h Se
gom
otsi
Mom
pati
Dist
rict M
unic
ipal
ity14
0 90
314
9 32
715
8 21
818
2 00
015
7 00
013
0 00
077
986
111
557
105
000
2 43
92
568
2 71
4To
tal:
Dr
Rut
h Se
gom
otsi
Mom
pati
Mun
icip
aliti
es28
2 92
728
2 67
329
8 24
018
2 00
015
7 00
013
0 00
077
986
111
557
105
000
27 0
0032
000
62 1
962
439
2 56
82
714
BN
W40
3 C
ity o
f Mat
losa
na89
041
94 2
5199
749
14 0
0010
000
10 0
00B
NW
404
Maq
uass
i Hill
s28
646
30 1
1231
659
14 0
005
000
5 90
0b
NW
405
Ven
ters
dorp
/Tlo
kwe
67 8
5071
746
75 8
5827
000
10 0
0010
000
10 0
00C
DC4
0 D
r Ken
neth
Kau
nda
Dist
rict M
unic
ipal
ity2
455
2 65
32
708
Tota
l: D
r K
enne
th K
aund
a M
unic
ipal
ities
185
537
196
109
207
266
41 0
0029
000
20 0
0025
900
2 45
52
653
2 70
8
Tota
l: N
orth
Wes
t Mun
icip
aliti
es1
814
487
1 88
1 18
11
990
907
182
000
157
000
130
000
320
986
334
557
358
000
103
000
94 0
0019
2 54
79
788
10 3
3810
830

This gazette is also available free online at www.gpwonline.co.za
STAATSKOERANT, 12 JUNIE 2017 No. 40913 19
AN
NEX
UR
E W
5IN
FRA
STR
UC
TUR
E G
RA
NT
ALL
OC
ATI
ON
S TO
MU
NIC
IPA
LITI
ES(S
CH
EDU
LE 4
, PA
RT
B A
ND
SC
HED
ULE
5, P
AR
T B)
Nat
iona
l and
Mun
icip
al F
inan
cial
Yea
rN
atio
nal a
nd M
unic
ipal
Fin
anci
al Y
ear
Nat
iona
l and
Mun
icip
al F
inan
cial
Yea
rN
atio
nal a
nd M
unic
ipal
Fin
anci
al Y
ear
Nat
iona
l and
Mun
icip
al F
inan
cial
Yea
r 2
018/
19(R
'000
) 2
019/
20(R
'000
) 2
017/
18(R
'000
) 2
018/
19(R
'000
) 2
019/
20(R
'000
)
Rur
al R
oads
Ass
et M
anag
emen
t Sys
tem
s Gra
nt
Cat
egor
yM
unic
ipal
ity 2
017/
18(R
'000
) 2
018/
19(R
'000
) 2
019/
20(R
'000
) 2
017/
18(R
'000
)
Mun
icip
al In
fras
truc
ture
Gra
ntR
egio
nal B
ulk
Infr
astr
uctu
re G
rant
Wat
er S
ervi
ces I
nfra
stru
ctur
e G
rant
Inte
grat
ed N
atio
nal E
lect
rific
atio
n Pr
ogra
mm
e (M
unic
ipal
) Gra
nt
201
7/18
(R'0
00)
201
8/19
(R'0
00)
201
9/20
(R'0
00)
201
7/18
(R'0
00)
201
8/19
(R'0
00)
201
9/20
(R'0
00)
WES
TER
N C
APE
ACP
TCi
ty o
f Cap
e To
wn
5 00
05
000
19 0
00
BW
C011
Mat
zika
ma
21 6
1422
644
23 7
3110
000
10 0
0010
000
3 00
02
500
8 00
0B
WC0
12 C
eder
berg
15 8
6716
541
17 2
524
613
10 0
0010
000
12 0
004
000
3 00
08
000
BW
C013
Ber
griv
ier
14 7
2715
330
15 9
673
000
5 00
0B
WC0
14 S
alda
nha
Bay
19 6
8720
597
21 5
583
000
3 00
05
000
BW
C015
Sw
artla
nd21
608
22 6
3723
724
3 00
0C
DC1
Wes
t Coa
st D
istric
t Mun
icip
ality
2 55
32
715
2 86
9To
tal:
Wes
t Coa
st M
unic
ipal
ities
93 5
0397
749
102
232
4 61
320
000
20 0
0022
000
13 0
0011
500
26 0
002
553
2 71
52
869
BW
C022
Witz
enbe
rg22
739
23 8
3824
999
13 3
7210
000
20 0
006
000
7 00
0B
WC0
23 D
rake
nste
in35
709
37 6
1239
621
4 00
04
000
4 00
0B
WC0
24 S
telle
nbos
ch36
358
38 3
0240
353
4 00
04
000
7 00
0B
WC0
25 B
reed
e V
alle
y35
007
36 8
6738
830
8 00
02
000
3 00
0B
WC0
26 L
ange
berg
37 3
0223
375
24 5
071
000
1 00
0C
DC2
Cap
e W
inel
ands
Dist
rict M
unic
ipal
ity2
683
2 93
13
097
Tota
l: C
ape
Win
elan
ds M
unic
ipal
ities
167
115
159
994
168
310
13 3
7210
000
20 0
0017
000
17 0
0021
000
2 68
32
931
3 09
7
BW
C031
The
ewat
ersk
loof
26 8
3328
186
29 6
153
000
7 00
011
000
BW
C032
Ove
rstra
nd22
330
23 4
0424
538
4 00
04
000
11 0
00B
WC0
33 C
ape
Agu
lhas
11 1
1811
497
11 8
971
000
2 00
07
000
BW
C034
Sw
elle
ndam
12 0
6712
506
12 9
682
000
2 00
07
000
CD
C3 O
verb
erg
Dist
rict M
unic
ipal
ity2
643
2 71
62
868
Tota
l: O
verb
erg
Mun
icip
aliti
es72
348
75 5
9379
018
10 0
0015
000
36 0
002
643
2 71
62
868
BW
C041
Kan
nala
nd10
370
10 7
0311
055
8 00
013
000
18 7
96B
WC0
42 H
esse
qua
13 8
1314
360
14 9
361
000
2 00
03
000
BW
C043
Mos
sel B
ay24
464
25 6
7126
944
8 00
07
000
23 9
47B
WC0
44 G
eorg
e40
764
42 9
8145
321
18 0
4832
000
15 0
00B
WC0
45 O
udtsh
oorn
22 0
6223
120
24 2
3610
000
3 00
09
000
13 0
00B
WC0
47 B
itou
33 4
5821
417
22 4
2810
000
8 00
015
000
BW
C048
Kny
sna
25 4
0826
673
28 0
083
000
4 00
013
000
CD
C4 E
den
Dist
rict M
unic
ipal
ity2
420
2 66
32
814
Tota
l: Ed
en M
unic
ipal
ities
170
339
164
925
172
928
10 0
0051
048
75 0
0010
1 74
32
420
2 66
32
814
BW
C051
Lai
ngsb
urg
6 65
46
757
6 85
62
000
4 00
07
000
BW
C052
Prin
ce A
lber
t7
609
7 77
17
942
1 00
04
000
8 00
0B
WC0
53 B
eauf
ort W
est
14 1
4014
707
15 3
0515
000
CD
C5 C
entra
l Kar
oo D
istric
t Mun
icip
ality
1 91
72
117
2 23
2To
tal:
Cen
tral
Kar
oo M
unic
ipal
ities
28 4
0329
235
30 1
033
000
8 00
030
000
1 91
72
117
2 23
2
Tota
l: W
este
rn C
ape
Mun
icip
aliti
es53
1 70
852
7 49
655
2 59
117
985
10 0
0020
000
30 0
0020
000
22 0
0099
048
131
500
233
743
12 2
1613
142
13 8
80
Una
lloca
ted
300
000
300
000
Nat
iona
l Tot
al15
891
252
16 7
87 6
8517
733
731
1 86
5 00
02
060
000
2 17
5 36
03
329
464
3 55
9 05
63
757
319
2 08
7 04
82
204
477
3 32
7 92
810
7 30
911
3 53
311
9 89
1

This gazette is also available free online at www.gpwonline.co.za
20 No. 40913 GOVERNMENT GAZETTE, 12 JUNE 2017
AN
NEX
UR
E W
5IN
FRA
STR
UC
TUR
E G
RA
NT
ALL
OC
ATI
ON
S TO
MU
NIC
IPA
LITI
ES(S
CH
EDU
LE 4
, PA
RT
B A
ND
SC
HED
ULE
5, P
AR
T B)
Nat
iona
l and
Mun
icip
al F
inan
cial
Yea
rN
atio
nal a
nd M
unic
ipal
Fin
anci
al Y
ear
Nat
iona
l and
Mun
icip
al F
inan
cial
Yea
rN
atio
nal a
nd M
unic
ipal
Fin
anci
al Y
ear
Nat
iona
l and
Mun
icip
al F
inan
cial
Yea
r
EA
STER
N C
APE
ABU
F B
uffa
lo C
ity76
8 12
880
6 85
785
2 38
555
869
161
233
170
530
10 0
0020
000
25 0
006
956
11 4
5712
099
865
953
1 02
9 54
71
090
014
AN
MA
Nel
son
Man
dela
Bay
911
761
957
731
1 01
1 77
327
3 29
723
4 36
024
7 87
415
000
20 0
0020
000
7 30
817
478
18 4
581
237
366
1 27
4 56
91
343
105
BEC
101
Dr B
eyer
s Nau
de27
902
28 8
8732
928
BEC
102
Blu
e Cra
ne R
oute
31 4
9623
084
23 7
05B
EC10
4 M
akan
a24
764
30 9
9037
283
BEC
105
Ndl
ambe
35 7
1538
123
40 6
09B
EC10
6 S
unda
ys R
iver
Val
ley
39 0
0040
302
41 6
76B
EC10
8 K
ouga
36 2
7438
965
45 7
49B
EC10
9 K
ou-K
amm
a18
592
20 2
4926
942
CD
C10
Sara
h Ba
artm
an D
istric
t Mun
icip
ality
2 23
52
349
2 48
5To
tal:
Sara
h Ba
artm
an M
unic
ipal
ities
215
978
222
949
251
377
B
EC12
1 M
bhas
he75
027
87 5
0093
165
BEC
122
Mnq
uma
68 6
9378
201
81 1
71B
EC12
3 G
reat
Kei
15 3
7116
765
22 1
82B
EC12
4 A
mah
lath
i33
574
33 0
3641
578
BEC
126
Ngq
ushw
a25
833
23 9
3925
105
BEC
129
Ray
mon
d M
hlab
a49
877
47 0
3954
321
CD
C12
Am
atho
le D
istric
t Mun
icip
ality
15 0
8054
4 45
256
1 34
659
6 75
2To
tal:
Am
atho
le M
unic
ipal
ities
15 0
8081
2 82
784
7 82
691
4 27
4
BEC
131
Inxu
ba Y
ethe
mba
25 3
1329
014
40 1
54B
EC13
5 In
tsika
Yet
hu48
235
51 1
3755
671
BEC
136
Em
alah
leni
34 0
6140
862
44 7
64B
EC13
7 E
ngco
bo52
156
61 2
7363
508
BEC
138
Sak
hisiz
we
32 9
4819
282
25 1
61B
EC13
9 E
noch
Mgi
jima
65 0
3679
138
73 4
11C
DC1
3 C
hris
Han
i Dist
rict M
unic
ipal
ity58
4 06
255
2 80
146
5 52
8To
tal:
Chr
is H
ani M
unic
ipal
ities
841
811
833
507
768
197
B
EC14
1 E
lund
ini
69 5
8776
731
71 1
49B
EC14
2 S
enqu
44 1
1541
230
48 4
62B
EC14
5 W
alte
r Sisu
lu38
954
20 0
0928
934
CD
C14
Joe G
qabi
Dist
rict M
unic
ipal
ity23
2 40
528
1 83
030
5 76
7To
tal:
Joe G
qabi
Mun
icip
aliti
es38
5 06
141
9 80
045
4 31
2
BEC
153
Ngq
uza H
ill69
937
71 5
6474
863
BEC
154
Por
t St J
ohns
52 8
9756
751
58 7
07B
EC15
5 N
yand
eni
76 8
9485
421
94 1
43B
EC15
6 M
hlon
tlo58
989
62 4
6870
084
BEC
157
Kin
g Sa
bata
Dal
indy
ebo
102
808
107
941
133
359
CD
C15
O.R
. Tam
bo D
istric
t Mun
icip
ality
1 09
9 64
91
129
522
1 14
3 04
5To
tal:
O.R
.Tam
bo M
unic
ipal
ities
1 46
1 17
41
513
667
1 57
4 20
1
BEC
441
Mat
atie
le13
0 08
814
2 88
314
5 83
2B
EC44
2 U
mzi
mvu
bu80
190
85 8
0592
565
BEC
443
Mbi
zana
95 1
7876
916
88 8
06B
EC44
4 N
taba
nkul
u67
581
78 9
8180
458
CD
C44
Alfr
ed N
zo D
istric
t Mun
icip
ality
495
274
513
875
523
740
Tota
l: A
lfred
Nzo
Mun
icip
aliti
es86
8 31
189
8 46
093
1 40
1
To
tal:
East
ern
Cap
e Mun
icip
aliti
es1
679
889
1 76
4 58
81
864
158
329
166
395
593
418
404
40 0
8040
000
45 0
0014
264
28 9
3530
557
6 68
8 48
17
040
325
7 32
6 88
1
201
7/18
(R'0
00)
201
8/19
(R'0
00)
201
9/20
(R'0
00)
201
7/18
(R'0
00)
201
8/19
(R'0
00)
201
9/20
(R'0
00)
201
7/18
(R'0
00)
201
8/19
(R'0
00)
201
9/20
(R'0
00)
201
7/18
(R'0
00)
201
8/19
(R'0
00)
201
9/20
(R'0
00)
201
7/18
(R'0
00)
201
8/19
(R'0
00)
201
9/20
(R'0
00)
SUB-
TOTA
L: IN
FRA
STR
UC
TUR
E
Cat
egor
yM
unic
ipal
ity
Urb
an S
ettle
men
ts D
evel
opm
ent G
rant
Publ
ic T
rans
port
Net
wor
k G
rant
Nei
ghbo
urho
od D
evel
opm
ent P
artn
ersh
ip (C
apita
l) G
rant
Inte
grat
ed C
ity D
evel
opm
ent G
rant

This gazette is also available free online at www.gpwonline.co.za
STAATSKOERANT, 12 JUNIE 2017 No. 40913 21
AN
NEX
UR
E W
5IN
FRA
STR
UC
TUR
E G
RA
NT
ALL
OC
ATI
ON
S TO
MU
NIC
IPA
LITI
ES(S
CH
EDU
LE 4
, PA
RT
B A
ND
SC
HED
ULE
5, P
AR
T B)
Nat
iona
l and
Mun
icip
al F
inan
cial
Yea
rN
atio
nal a
nd M
unic
ipal
Fin
anci
al Y
ear
Nat
iona
l and
Mun
icip
al F
inan
cial
Yea
rN
atio
nal a
nd M
unic
ipal
Fin
anci
al Y
ear
Nat
iona
l and
Mun
icip
al F
inan
cial
Yea
r 2
017/
18(R
'000
) 2
018/
19(R
'000
) 2
019/
20(R
'000
) 2
017/
18(R
'000
) 2
018/
19(R
'000
) 2
019/
20(R
'000
) 2
017/
18(R
'000
) 2
018/
19(R
'000
) 2
019/
20(R
'000
) 2
017/
18(R
'000
) 2
018/
19(R
'000
) 2
019/
20(R
'000
) 2
017/
18(R
'000
) 2
018/
19(R
'000
) 2
019/
20(R
'000
)
SUB-
TOTA
L: IN
FRA
STR
UC
TUR
E
Cat
egor
yM
unic
ipal
ity
Urb
an S
ettle
men
ts D
evel
opm
ent G
rant
Publ
ic T
rans
port
Net
wor
k G
rant
Nei
ghbo
urho
od D
evel
opm
ent P
artn
ersh
ip (C
apita
l) G
rant
Inte
grat
ed C
ity D
evel
opm
ent G
rant
FR
EE S
TATE
AM
ANM
anga
ung
761
307
799
692
844
816
231
637
155
641
164
616
15 0
0070
000
67 0
008
224
11 3
3911
974
1 03
6 16
81
048
672
1 10
8 40
6
BFS
161
Let
sem
eng
46 8
7792
145
63 9
54B
FS16
2 K
opan
ong
54 5
3388
814
87 8
50B
FS16
3 M
ohok
are
68 2
3699
556
99 9
22C
DC1
6 X
harie
p D
istric
t Mun
icip
ality
2 14
52
267
2 39
8To
tal:
Xha
riep
Mun
icip
aliti
es17
1 79
128
2 78
225
4 12
4
BFS
181
Mas
ilony
ana
43 7
6854
931
76 1
59B
FS18
2 T
okol
ogo
27 7
7121
501
27 2
71B
FS18
3 T
swel
opel
e26
704
17 4
3018
195
BFS
184
Mat
jhab
eng
156
216
163
245
144
023
BFS
185
Nal
a39
482
39 6
6541
308
CD
C18
Lej
wel
eput
swa D
istric
t Mun
icip
ality
2 27
62
400
2 53
8To
tal:
Lejw
elep
utsw
a M
unic
ipal
ities
296
217
299
172
309
494
B
FS19
1 S
etso
to88
997
95 6
6294
426
BFS
192
Dih
labe
ng54
281
66 4
0664
972
BFS
193
Nke
toan
a30
755
32 0
4233
400
BFS
194
Mal
uti-a
-Pho
fung
215
732
245
695
246
210
BFS
195
Phu
mel
ela
40 9
5442
364
51 4
34B
FS19
6 M
antso
pa35
252
45 3
9857
196
CD
C19
Tha
bo M
ofut
sany
ana D
istric
t Mun
icip
ality
2 40
02
530
2 67
2To
tal:
Thab
o M
ofut
sany
ana
Mun
icip
aliti
es46
8 37
153
0 09
755
0 31
0
BFS
201
Moq
haka
65 8
4058
061
69 4
06B
FS20
3 N
gwat
he90
078
85 0
0110
1 46
5B
FS20
4 M
etsim
ahol
o70
398
57 9
0263
545
BFS
205
Maf
ube
32 0
8030
874
37 0
37C
DC2
0 F
ezile
Dab
i Dist
rict M
unic
ipal
ity2
183
2 30
82
437
Tota
l: Fe
zile D
abi M
unic
ipal
ities
260
579
234
146
273
890
Tota
l: Fr
ee S
tate
Mun
icip
aliti
es76
1 30
779
9 69
284
4 81
623
1 63
715
5 64
116
4 61
615
000
70 0
0067
000
8 22
411
339
11 9
742
233
126
2 39
4 86
92
496
224
G
AU
TEN
G
A
EKU
Ekur
hule
ni1
985
010
2 08
5 09
42
202
750
700
718
671
906
710
650
82 0
0055
000
55 0
0048
646
48 2
2150
921
2 85
6 37
42
905
221
3 06
4 77
2A
JHB
City
of J
ohan
nesb
urg
1 86
4 73
11
958
751
2 06
9 27
791
8 18
71
141
563
1 20
7 38
979
523
46 8
6746
867
82 1
8267
281
71 0
482
984
623
3 25
9 46
23
439
581
ATS
HCi
ty o
f Tsh
wan
e1
616
415
1 69
7 91
41
793
723
900
239
732
309
774
536
20 0
0030
000
45 0
0038
429
44 3
2246
804
2 60
5 08
32
544
545
2 70
0 06
3
BG
T421
Em
fule
ni30
000
50 0
0050
000
249
645
260
407
283
336
BG
T422
Mid
vaal
55 2
8957
981
87 7
66B
GT4
23 L
esed
i66
915
53 1
5874
585
CD
C42
Sed
iben
g D
istric
t Mun
icip
ality
2 43
12
560
2 70
3To
tal:
Sedi
beng
Mun
icip
aliti
es30
000
50 0
0050
000
374
280
374
106
448
390
B
GT4
81 M
ogal
e City
20 0
0040
000
40 0
0016
9 19
519
6 27
422
3 74
5B
GT4
84 M
eraf
ong
City
97 4
2811
7 29
814
0 38
2B
GT4
85 R
and
Wes
t City
144
948
170
217
208
850
CD
C48
Wes
t Ran
d D
istric
t Mun
icip
ality
10 0
0010
000
12 5
8912
645
2 79
3To
tal:
Wes
t Ran
d M
unic
ipal
ities
30 0
0050
000
40 0
0042
4 16
049
6 43
457
5 77
0
To
tal:
Gau
teng
Mun
icip
aliti
es5
466
156
5 74
1 75
96
065
750
2 51
9 14
42
545
778
2 69
2 57
624
1 52
323
1 86
723
6 86
716
9 25
715
9 82
416
8 77
39
244
520
9 57
9 76
810
228
577

This gazette is also available free online at www.gpwonline.co.za
22 No. 40913 GOVERNMENT GAZETTE, 12 JUNE 2017A
NN
EX
UR
E W
5IN
FRA
STR
UC
TU
RE
GR
AN
T A
LL
OC
AT
ION
S T
O M
UN
ICIP
AL
ITIE
S(S
CH
ED
UL
E 4
, PA
RT
B A
ND
SC
HE
DU
LE
5, P
AR
T B
)
Nat
iona
l and
Mun
icip
al F
inan
cial
Yea
rN
atio
nal a
nd M
unic
ipal
Fin
anci
al Y
ear
Nat
iona
l and
Mun
icip
al F
inan
cial
Yea
rN
atio
nal a
nd M
unic
ipal
Fin
anci
al Y
ear
Nat
iona
l and
Mun
icip
al F
inan
cial
Yea
r 2
017/
18(R
'000
) 2
018/
19(R
'000
) 2
019/
20(R
'000
) 2
017/
18(R
'000
) 2
018/
19(R
'000
) 2
019/
20(R
'000
) 2
017/
18(R
'000
) 2
018/
19(R
'000
) 2
019/
20(R
'000
) 2
017/
18(R
'000
) 2
018/
19(R
'000
) 2
019/
20(R
'000
) 2
017/
18(R
'000
) 2
018/
19(R
'000
) 2
019/
20(R
'000
)
SUB
-TO
TA
L: I
NFR
AST
RU
CT
UR
E
Cat
egor
yM
unic
ipal
ity
Urb
an S
ettle
men
ts D
evel
opm
ent G
rant
Publ
ic T
rans
port
Net
wor
k G
rant
Nei
ghbo
urho
od D
evel
opm
ent P
artn
ersh
ip (C
apita
l) G
rant
Inte
grat
ed C
ity D
evel
opm
ent G
rant
K
WA
ZU
LU
-NA
TA
L
A
ETH
eThe
kwin
i1
980
109
2 07
9 94
62
197
311
917
150
857
251
906
683
50 0
0065
000
65 0
0039
111
52 2
2455
148
3 02
1 37
03
090
921
3 27
9 14
2
BK
ZN21
2uM
doni
39 1
6140
783
45 4
94B
KZN
213
uMzu
mbe
44 6
2446
460
48 3
98B
KZN
214
uMuz
iwab
antu
27 6
8529
843
26 0
65B
KZN
216
Ray
Nko
nyen
i76
615
80 6
1679
956
CD
C21
Ugu
Dist
rict M
unic
ipal
ity29
8 50
933
8 18
337
4 07
4T
otal
: Ugu
Mun
icip
aliti
es48
6 59
453
5 88
557
3 98
7
BK
ZN22
1 u
Msh
wat
hi42
016
32 4
4335
949
BK
ZN22
2 u
Mng
eni
28 3
7929
518
25 7
20B
KZN
223
Mpo
fana
17 1
6415
608
21 0
76B
KZN
224
iMpe
ndle
11 8
4517
269
17 7
17B
KZN
225
Msu
nduz
i21
0 01
411
5 52
712
2 18
940
000
30 0
0030
000
489
344
430
824
429
317
BK
ZN22
6 M
kham
bath
ini
24 2
8524
984
25 7
22B
KZN
227
Ric
hmon
d26
695
24 5
4428
440
CD
C22
uM
gung
undl
ovu
Dist
rict M
unic
ipal
ity16
9 29
221
5 33
522
9 25
0T
otal
: uM
gung
undl
ovu
Mun
icip
aliti
es21
0 01
411
5 52
712
2 18
940
000
30 0
0030
000
809
020
790
525
813
191
B
KZN
235
Okh
ahla
mba
41 7
4230
214
31 7
67B
KZN
237
iNko
si La
ngal
ibal
ele
53 2
7649
338
49 5
15B
KZN
238
Alfr
ed D
uma
77 7
4974
329
77 1
07C
DC
23 u
Thuk
ela
Dist
rict M
unic
ipal
ity36
7 33
939
4 26
137
1 34
0T
otal
: uT
huke
la M
unic
ipal
ities
540
106
548
142
529
729
B
KZN
241
eN
dum
eni
24 4
0226
047
26 7
28B
KZN
242
Nqu
thu
66 6
9153
346
55 0
92B
KZN
244
uM
singa
62 0
3260
080
62 2
41B
KZN
245
uM
voti
45 2
6946
835
48 4
88C
DC
24 u
Mzi
nyat
hi D
istric
t Mun
icip
ality
371
842
354
943
363
307
Tot
al: u
Mzi
nyat
hi M
unic
ipal
ities
570
236
541
251
555
856
B
KZN
252
New
castl
e50
000
25 0
0025
000
218
604
221
398
233
568
BK
ZN25
3 e
Mad
lang
eni
21 4
2319
697
24 9
87B
KZN
254
Dan
nhau
ser
22 0
8123
140
24 2
58C
DC
25 A
maj
uba
Dist
rict M
unic
ipal
ity11
3 91
712
4 30
913
6 84
3T
otal
: Am
ajub
a M
unic
ipal
ities
50 0
0025
000
25 0
0037
6 02
538
8 54
441
9 65
6
BK
ZN26
1 e
Dum
be42
292
44 1
1644
986
BK
ZN26
2 u
Phon
golo
37 7
4141
212
46 7
65B
KZN
263
Aba
Qul
usi
52 7
4054
769
56 9
11B
KZN
265
Non
gom
a58
378
44 0
7545
866
BK
ZN26
6 U
lund
i57
388
53 0
2349
750
CD
C26
Zul
ulan
d D
istric
t Mun
icip
ality
449
830
516
049
411
012
Tot
al: Z
ulul
and
Mun
icip
aliti
es69
8 36
975
3 24
465
5 29
0
BK
ZN27
1 u
Mhl
abuy
alin
gana
60 4
8157
370
59 3
64B
KZN
272
Joz
ini
53 0
0360
049
62 2
08B
KZN
275
Mtu
batu
ba46
253
46 9
4345
725
BK
ZN27
6 B
ig F
ive
Hla
bisa
35 6
6436
697
41 7
88C
DC
27 u
Mkh
anya
kude
Dist
rict M
unic
ipal
ity27
1 52
929
9 88
232
9 03
0T
otal
: uM
khan
yaku
de M
unic
ipal
ities
466
930
500
941
538
115
BK
ZN28
1 u
Mfo
lozi
39 6
2337
964
45 3
78B
KZN
282
uM
hlat
huze
152
742
171
173
201
960
BK
ZN28
4 u
Mla
lazi
49 0
4551
280
60 6
38B
KZN
285
Mth
onja
neni
26 2
7827
102
34 9
70B
KZN
286
Nka
ndla
23 1
7039
296
40 4
85C
DC
28 K
ing
Cet
shw
ayo
Dist
rict M
unic
ipal
ity35
2 87
136
4 85
638
1 22
8T
otal
: Kin
g C
etsh
way
o M
unic
ipal
ities
643
729
691
671
764
659
BK
ZN29
1 M
ande
ni11
178
57 1
1852
858
57 8
82B
KZN
292
Kw
aDuk
uza
62 5
6273
510
88 6
22B
KZN
293
Ndw
edw
e55
275
40 8
4243
672
BK
ZN29
4 M
aphu
mul
o37
646
33 7
4034
894
CD
C29
iLem
be D
istric
t Mun
icip
ality
405
892
400
212
395
476
Tot
al: i
Lem
be M
unic
ipal
ities
11 1
7861
8 49
360
1 16
262
0 54
6
BK
ZN43
3 G
reat
er K
oksta
d27
550
48 3
2864
149
BK
ZN43
4 u
Buh
lebe
zwe
47 3
3048
714
55 1
75B
KZN
435
uM
zim
khul
u59
095
68 5
1974
076
BK
ZN43
6 D
r Nko
saza
na D
lam
ini Z
uma
41 5
6638
965
50 4
41C
DC
43 H
arry
Gw
ala
Dist
rict M
unic
ipal
ity39
4 76
642
7 62
542
8 33
1T
otal
: Har
ry G
wal
a M
unic
ipal
ities
570
307
632
151
672
172
Tot
al: K
waZ
ulu-
Nat
al M
unic
ipal
ities
1 98
0 10
92
079
946
2 19
7 31
11
127
164
972
778
1 02
8 87
215
1 17
812
0 00
012
0 00
039
111
52 2
2455
148
8 80
1 17
99
074
437
9 42
2 34
3

This gazette is also available free online at www.gpwonline.co.za
STAATSKOERANT, 12 JUNIE 2017 No. 40913 23A
NN
EXU
RE
W5
INFR
AST
RU
CTU
RE
GR
AN
T A
LLO
CA
TIO
NS
TO M
UN
ICIP
ALI
TIES
(SC
HED
ULE
4, P
AR
T B
AN
D S
CH
EDU
LE 5
, PA
RT
B)
Nat
iona
l and
Mun
icip
al F
inan
cial
Yea
rN
atio
nal a
nd M
unic
ipal
Fin
anci
al Y
ear
Nat
iona
l and
Mun
icip
al F
inan
cial
Yea
rN
atio
nal a
nd M
unic
ipal
Fin
anci
al Y
ear
Nat
iona
l and
Mun
icip
al F
inan
cial
Yea
r 2
017/
18(R
'000
) 2
018/
19(R
'000
) 2
019/
20(R
'000
) 2
017/
18(R
'000
) 2
018/
19(R
'000
) 2
019/
20(R
'000
) 2
017/
18(R
'000
) 2
018/
19(R
'000
) 2
019/
20(R
'000
) 2
017/
18(R
'000
) 2
018/
19(R
'000
) 2
019/
20(R
'000
) 2
017/
18(R
'000
) 2
018/
19(R
'000
) 2
019/
20(R
'000
)
SUB-
TOTA
L: IN
FRA
STR
UC
TUR
E
Cat
egor
yM
unic
ipal
ity
Urb
an S
ettle
men
ts D
evel
opm
ent G
rant
Publ
ic T
rans
port
Net
wor
k G
rant
Nei
ghbo
urho
od D
evel
opm
ent P
artn
ersh
ip (C
apita
l) G
rant
Inte
grat
ed C
ity D
evel
opm
ent G
rant
LIM
POPO
BLI
M33
1 G
reat
er G
iyan
i81
736
75 2
5378
964
BLI
M33
2 G
reat
er L
etab
a61
162
61 9
2065
427
BLI
M33
3 G
reat
er T
zane
en12
0 94
211
6 58
012
7 52
9B
LIM
334
Ba-
Phal
abor
wa
48 6
1937
242
55 0
43B
LIM
335
Mar
ulen
g27
223
28 6
0030
054
CD
C33
Mop
ani D
istric
t Mun
icip
ality
559
950
600
454
633
533
Tota
l: M
opan
i Mun
icip
aliti
es89
9 63
292
0 04
999
0 55
0
BLI
M34
1LI
M34
147
468
40 9
8452
585
BLI
M34
3LI
M34
314
1 15
914
2 11
915
3 41
0B
LIM
344
Mak
hado
116
169
121
510
147
147
BLI
M34
5LI
M 3
4510
1 48
095
345
106
479
CD
C34
Vhe
mbe
Dist
rict M
unic
ipal
ity55
9 08
260
3 89
064
2 99
9To
tal:
Vhe
mbe
Mun
icip
aliti
es96
5 35
81
003
848
1 10
2 62
0
BLI
M35
1Bl
oube
rg
52 0
9054
575
57 1
98B
LIM
353
Mol
emol
e35
718
41 6
2242
632
BLI
M35
4Po
lokw
ane
216
734
98 0
3510
3 68
826
000
35 0
0039
212
844
588
920
413
1 32
6 73
8B
LIM
355
Lepe
le-N
kum
pi60
134
58 0
9661
367
CD
C35
Capr
icor
n D
istric
t Mun
icip
ality
327
454
329
808
372
004
Tota
l: C
apri
corn
Mun
icip
aliti
es21
6 73
498
035
103
688
26 0
0035
000
39 2
121
319
984
1 40
4 51
41
859
939
BLI
M36
1 T
haba
zim
bi33
759
35 5
4237
423
BLI
M36
2 L
epha
lale
106
370
86 8
1012
4 38
6B
LIM
366
Bel
a-Be
la86
304
87 6
2510
9 01
9B
LIM
367
Mog
alak
wen
a22
2 26
624
3 82
926
3 92
1B
LIM
368
LIM
368
127
190
126
309
143
546
CD
C36
Wat
erbe
rg D
istric
t Mun
icip
ality
2 12
92
231
2 35
8To
tal:
Wat
erbe
rg M
unic
ipal
ities
578
018
582
346
680
653
BLI
M47
1 E
phra
im M
ogal
e44
810
35 7
7537
670
BLI
M47
2 E
lias M
otso
aled
i70
860
69 0
1386
340
BLI
M47
3 M
akhu
duth
amag
a76
196
66 8
0470
611
BLI
M47
6 L
IM 4
7695
863
140
875
136
165
CD
C47
Sek
hukh
une
Dist
rict M
unic
ipal
ity58
1 32
858
1 14
661
7 63
2To
tal:
Sekh
ukhu
ne M
unic
ipal
ities
869
057
893
613
948
418
Tota
l: Li
mpo
po M
unic
ipal
ities
216
734
98 0
3510
3 68
826
000
35 0
0039
212
4 63
2 04
94
804
370
5 58
2 18
0
MPU
MA
LAN
GA
BM
P301
Chie
f Alb
ert L
uthu
li13
0 61
612
3 79
914
4 26
9B
MP3
02M
suka
ligw
a74
608
73 6
2189
801
BM
P303
Mkh
ondo
127
215
110
347
129
235
BM
P304
Dr P
ixle
y ka
Isak
a Se
me
46 3
2738
180
37 6
08B
MP3
05Le
kwa
67 2
9360
799
70 3
88B
MP3
06D
ipal
esen
g36
076
34 9
4932
870
BM
P307
Gov
an M
beki
72 7
9674
131
90 6
50C
DC3
0G
ert S
iban
de D
istric
t Mun
icip
ality
121
827
186
034
361
895
Tota
l: G
ert S
iban
de M
unic
ipal
ities
676
758
701
860
956
716
BM
P311
Vic
tor K
hany
e25
286
31 5
4440
871
BM
P312
Emal
ahle
ni25
000
35 0
0035
000
192
139
204
400
202
843
BM
P313
Stev
e Ts
hwet
e50
557
61 3
8179
362
BM
P314
Emak
haze
ni55
484
41 3
0948
202
BM
P315
Them
bisil
e H
ani
176
562
180
137
193
030
BM
P316
Dr J
S M
orok
a13
2 37
114
7 95
715
5 96
2C
DC3
1N
kang
ala
Dist
rict M
unic
ipal
ity2
175
2 28
02
408
Tota
l: N
kang
ala
Mun
icip
aliti
es25
000
35 0
0035
000
634
574
669
008
722
678
BM
P321
Thab
a Ch
weu
106
179
95 8
5611
8 68
1B
MP3
24N
kom
azi
278
857
288
101
322
768
BM
P325
Bush
buck
ridge
512
080
465
290
508
887
BM
P326
City
of M
bom
bela
211
673
120
412
127
356
40 0
0060
000
60 0
0066
2 61
261
1 11
366
4 96
8C
DC3
2Eh
lanz
eni D
istric
t Mun
icip
ality
2 34
72
475
2 61
4To
tal:
Ehla
nzen
i Mun
icip
aliti
es21
1 67
312
0 41
212
7 35
640
000
60 0
0060
000
1 56
2 07
51
462
835
1 61
7 91
8
Tota
l: M
pum
alan
ga M
unic
ipal
ities
211
673
120
412
127
356
65 0
0095
000
95 0
002
873
407
2 83
3 70
33
297
312

This gazette is also available free online at www.gpwonline.co.za
24 No. 40913 GOVERNMENT GAZETTE, 12 JUNE 2017A
NN
EXU
RE
W5
INFR
AST
RU
CTU
RE
GR
AN
T A
LLO
CA
TIO
NS
TO M
UN
ICIP
ALI
TIES
(SC
HED
ULE
4, P
AR
T B
AN
D S
CH
EDU
LE 5
, PA
RT
B)
Nat
iona
l and
Mun
icip
al F
inan
cial
Yea
rN
atio
nal a
nd M
unic
ipal
Fin
anci
al Y
ear
Nat
iona
l and
Mun
icip
al F
inan
cial
Yea
rN
atio
nal a
nd M
unic
ipal
Fin
anci
al Y
ear
Nat
iona
l and
Mun
icip
al F
inan
cial
Yea
r 2
017/
18(R
'000
) 2
018/
19(R
'000
) 2
019/
20(R
'000
) 2
017/
18(R
'000
) 2
018/
19(R
'000
) 2
019/
20(R
'000
) 2
017/
18(R
'000
) 2
018/
19(R
'000
) 2
019/
20(R
'000
) 2
017/
18(R
'000
) 2
018/
19(R
'000
) 2
019/
20(R
'000
) 2
017/
18(R
'000
) 2
018/
19(R
'000
) 2
019/
20(R
'000
)
SUB
-TO
TAL:
INFR
AST
RU
CTU
RE
Cat
egor
yM
unic
ipal
ity
Urb
an S
ettle
men
ts D
evel
opm
ent G
rant
Publ
ic T
rans
port
Net
wor
k G
rant
Nei
ghbo
urho
od D
evel
opm
ent P
artn
ersh
ip (C
apita
l) G
rant
Inte
grat
ed C
ity D
evel
opm
ent G
rant
NO
RTH
ERN
CA
PE
BN
C061
Ric
hter
svel
d20
382
25 5
2931
529
BN
C062
Nam
a K
hoi
24 7
7418
380
51 9
45B
NC0
64 K
amie
sber
g11
601
7 76
28
932
BN
C065
Han
tam
72 1
4259
397
20 9
76B
NC0
66 K
aroo
Hoo
glan
d13
145
38 3
4035
546
BN
C067
Khâ
i-Ma
13 8
2510
000
9 18
5C
DC6
Nam
akw
a D
istric
t Mun
icip
ality
2 89
83
018
3 18
7To
tal:
Nam
akw
a M
unic
ipal
ities
158
767
162
426
161
300
BN
C071
Ubu
ntu
15 0
6313
377
12 2
09B
NC0
72 U
mso
bom
vu17
612
17 0
2113
954
BN
C073
Em
than
jeni
32 2
9244
744
18 9
78B
NC0
74 K
aree
berg
43 0
9555
111
8 49
0B
NC0
75 R
enos
terb
erg
20 5
2728
683
30 8
49B
NC0
76 T
hem
belih
le14
533
9 81
410
110
BN
C077
Siy
athe
mba
9 92
010
225
11 0
47B
NC0
78 S
iyan
cum
a36
693
19 5
5919
333
CD
C7 P
ixle
y K
a Se
me
Dist
rict M
unic
ipal
ity3
003
3 17
33
356
Tota
l: Pi
xley
Ka
Sem
e M
unic
ipal
ities
192
738
201
707
128
326
BN
C082
!Kai
!Gar
ib35
744
25 8
4455
004
BN
C084
!Khe
is18
298
11 1
5819
537
BN
C085
Tsa
ntsa
bane
19 7
4021
406
27 1
09B
NC0
86 K
gate
lope
le12
099
10 2
9123
638
BN
C087
Daw
id K
ruip
er49
468
27 7
3780
076
CD
C8Z.
F. M
gcaw
u D
istric
t Mun
icip
ality
2 86
03
001
3 16
9To
tal:
Z.F.
Mgc
awu
Mun
icip
aliti
es13
8 20
999
437
208
533
BN
C091
Sol
Pla
atjie
27 5
0020
000
20 0
0016
1 00
392
005
126
805
BN
C092
Dik
gatlo
ng22
800
22 7
1823
286
BN
C093
Mag
aren
g26
279
36 6
6962
079
BN
C094
Pho
kwan
e54
665
59 0
0870
425
CD
C9 F
ranc
es B
aard
Dist
rict M
unic
ipal
ity2
516
2 63
52
785
Tota
l: Fr
ance
s Baa
rd M
unic
ipal
ities
27 5
0020
000
20 0
0026
7 26
321
3 03
528
5 38
0
BN
C451
Joe
Mor
olon
g10
6 06
016
1 53
520
4 20
3B
NC4
52 G
a-Se
gony
ana
94 2
1113
7 26
219
5 48
1B
NC4
53 G
amag
ara
46 9
8279
002
147
871
CD
C45
John
Tao
lo G
aetse
we
Dist
rict M
unic
ipal
ity1
979
2 07
22
198
Tota
l: Jo
hn T
aolo
Gae
tsew
e M
unic
ipal
ities
249
232
379
871
549
753
Tota
l: N
orth
ern
Cap
e M
unic
ipal
ities
27 5
0020
000
20 0
001
006
209
1 05
6 47
61
333
292
NO
RTH
WES
T
BN
W37
1 M
oret
ele
193
845
197
778
217
546
BN
W37
2 M
adib
eng
301
005
326
486
357
935
BN
W37
3 R
uste
nbur
g31
4 15
614
3 37
115
1 63
910
000
15 0
0025
000
628
592
486
340
563
945
BN
W37
4 K
getle
ngriv
ier
46 2
3952
556
68 9
46B
NW
375
Mos
es K
otan
e20
7 41
521
1 55
323
1 19
7C
DC3
7 B
ojan
ala
Plat
inum
Dist
rict M
unic
ipal
ity2
359
2 45
92
599
Tota
l: B
ojan
ala
Plat
inum
Mun
icip
aliti
es31
4 15
614
3 37
115
1 63
910
000
15 0
0025
000
1 37
9 45
51
277
172
1 44
2 16
8
BN
W38
1 R
atlo
u29
859
31 4
0033
026
BN
W38
2 T
swai
ng29
730
34 2
6335
881
BN
W38
3 M
afik
eng
62 2
8870
840
79 5
87B
NW
384
Dits
obot
la55
133
46 1
2544
227
BN
W38
5 R
amot
sher
e M
oilo
a60
033
44 7
9043
933
CD
C38
Nga
ka M
odiri
Mol
ema
Dist
rict M
unic
ipal
ity30
7 57
532
6 29
734
6 07
7To
tal:
Nga
ka M
odir
i Mol
ema
Mun
icip
aliti
es54
4 61
855
3 71
558
2 73
1
BN
W39
2 N
aled
i35
205
27 9
6131
956
BN
W39
3 M
amus
a15
897
16 5
7217
285
BN
W39
4 G
reat
er T
aung
63 4
0659
096
78 9
36B
NW
396
Lek
wa-
Teem
ane
23 9
7723
595
28 2
48B
NW
397
Kag
isano
-Mol
opo
30 5
3938
122
45 7
93C
DC3
9D
r Rut
h Se
gom
otsi
Mom
pati
Dist
rict M
unic
ipal
ity40
3 32
842
0 45
239
5 93
2To
tal:
Dr
Rut
h Se
gom
otsi
Mom
pati
Mun
icip
aliti
es57
2 35
258
5 79
859
8 15
0
BN
W40
3 C
ity o
f Mat
losa
na75
000
35 0
0035
000
178
041
139
251
144
749
BN
W40
4 M
aqua
ssi H
ills
47 6
4630
112
37 5
59b
NW
405
Ven
ters
dorp
/Tlo
kwe
104
850
81 7
4685
858
CD
C40
Dr K
enne
th K
aund
a D
istric
t Mun
icip
ality
2 45
52
653
2 70
8To
tal:
Dr
Ken
neth
Kau
nda
Mun
icip
aliti
es75
000
35 0
0035
000
332
992
253
762
270
874
Tota
l: N
orth
Wes
t Mun
icip
aliti
es31
4 15
614
3 37
115
1 63
985
000
50 0
0060
000
2 82
9 41
72
670
447
2 89
3 92
3

This gazette is also available free online at www.gpwonline.co.za
STAATSKOERANT, 12 JUNIE 2017 No. 40913 25
ANNE
XURE
W5
INFR
ASTR
UCTU
RE G
RANT
ALL
OCA
TIO
NS T
O M
UNIC
IPAL
ITIE
S(S
CHED
ULE
4, P
ART
B AN
D SC
HED
ULE
5, P
ART
B)
Natio
nal a
nd M
unici
pal F
inan
cial Y
ear
Natio
nal a
nd M
unici
pal F
inan
cial Y
ear
Natio
nal a
nd M
unici
pal F
inan
cial Y
ear
Natio
nal a
nd M
unici
pal F
inan
cial Y
ear
Natio
nal a
nd M
unici
pal F
inan
cial Y
ear
2017
/18
(R'00
0)
2018
/19
(R'00
0)
2019
/20
(R'00
0)
2017
/18
(R'00
0)
2018
/19
(R'00
0)
2019
/20
(R'00
0)
2017
/18
(R'00
0)
2018
/19
(R'00
0)
2019
/20
(R'00
0)
2017
/18
(R'00
0)
2018
/19
(R'00
0)
2019
/20
(R'00
0)
2017
/18
(R'00
0)
2018
/19
(R'00
0)
2019
/20
(R'00
0)
SUB-
TOTA
L: IN
FRAS
TRUC
TURE
Cate
gory
Mun
icipa
lity
Urba
n Se
ttlem
ents
Deve
lopm
ent G
rant
Publ
ic Tr
ansp
ort N
etwo
rk G
rant
Neig
hbou
rhoo
d De
velo
pmen
t Par
tner
ship
(Cap
ital)
Gran
tIn
tegr
ated
City
Dev
elopm
ent G
rant
WES
TERN
CAP
E
ACP
TCi
ty of
Cap
e Tow
n1 4
94 78
61 5
70 15
21 6
58 75
199
9 524
807 4
2285
3 981
2 109
30 00
058
093
61 26
356
740
59 91
72 5
62 68
22 4
69 31
42 6
49 74
2
BW
C011
Matz
ikam
a34
614
35 14
441
731
BW
C012
Ced
erbe
rg34
480
29 54
137
252
BW
C013
Ber
grivi
er14
727
18 33
020
967
BW
C014
Sald
anha
Bay
22 68
723
597
26 55
8B
WC0
15 S
wartl
and
24 60
822
637
23 72
4C
DC1
Wes
t Coa
st Di
strict
Mun
icipa
lity
2 553
2 715
2 869
Tota
l: W
est C
oast
Mun
icipa
lities
133 6
6913
1 964
153 1
01
BW
C022
Witz
enbe
rg36
111
39 83
851
999
BW
C023
Dra
kens
tein
39 70
941
612
43 62
1B
WC0
24 S
tellen
bosc
h40
358
42 30
247
353
BW
C025
Bre
ede V
alley
43 00
738
867
41 83
0B
WC0
26 L
ange
berg
38 30
224
375
24 50
7C
DC2
Cap
e Wine
lands
Dist
rict M
unici
palit
y2 6
832 9
313 0
97To
tal:
Cape
Win
eland
s Mun
icipa
lities
200 1
7018
9 925
212 4
07
BW
C031
The
ewate
rsklo
of29
833
35 18
640
615
BW
C032
Ove
rstra
nd26
330
27 40
435
538
BW
C033
Cap
e Agu
lhas
12 11
813
497
18 89
7B
WC0
34 S
welle
ndam
14 06
714
506
19 96
8C
DC3
Ove
rber
g Dist
rict M
unici
palit
y2 6
432 7
162 8
68To
tal:
Ove
rber
g Mun
icipa
lities
84 99
193
309
117 8
86
BW
C041
Kan
nalan
d18
370
23 70
329
851
BW
C042
Hes
sequ
a14
813
16 36
017
936
BW
C043
Mos
sel B
ay32
464
32 67
150
891
BW
C044
Geo
rge
210 3
6227
104
28 66
726
9 174
102 0
8588
988
BW
C045
Oud
tshoo
rn35
062
32 12
037
236
BW
C047
Bito
u43
458
29 41
737
428
BW
C048
Kny
sna
10 00
010
000
38 40
840
673
41 00
8C
DC4
Ede
n Dist
rict M
unici
palit
y2 4
202 6
632 8
14To
tal:
Eden
Mun
icipa
lities
210 3
6227
104
28 66
710
000
10 00
045
4 169
279 6
9230
6 152
BW
C051
Lain
gsbu
rg8 6
5410
757
13 85
6B
WC0
52 P
rince
Alb
ert
8 609
11 77
115
942
BW
C053
Bea
ufor
t Wes
t14
140
14 70
730
305
CDC
5 C
entra
l Kar
oo D
istric
t Mun
icipa
lity
1 917
2 117
2 232
Tota
l: Ce
ntra
l Kar
oo M
unici
palit
ies33
320
39 35
262
335
Tota
l: W
este
rn C
ape M
unici
palit
ies1 4
94 78
61 5
70 15
21 6
58 75
11 2
09 88
683
4 526
882 6
4812
109
40 00
058
093
61 26
356
740
59 91
73 4
69 00
13 2
03 55
63 5
01 62
3
Unal
loca
ted
1 316
534
1 392
450
1 616
534
1 692
450
Natio
nal T
otal
11 38
2 247
11 95
6 137
12 63
0 786
6 159
559
6 582
669
6 962
248
663 3
9070
1 867
741 1
7229
2 119
309 0
6232
6 369
41 77
7 388
44 27
4 486
47 77
4 804

This gazette is also available free online at www.gpwonline.co.za
26 No. 40913 GOVERNMENT GAZETTE, 12 JUNE 2017
AN
NE
XU
RE
W6
AL
LOC
ATI
ON
S-IN
-KIN
D T
O M
UN
ICIP
AL
ITIE
S(S
CH
ED
UL
E 6
, PA
RT
B)
(Nat
iona
l and
Mun
icip
al F
inan
cial
Yea
rs)

This gazette is also available free online at www.gpwonline.co.za
STAATSKOERANT, 12 JUNIE 2017 No. 40913 27
AN
NEX
UR
E W
6
ALL
OC
ATIO
NS-
IN-K
IND
TO
MU
NIC
IPA
LITI
ES (SC
HED
ULE
6, P
AR
T B
)
Nat
iona
l and
Mun
icip
al F
inan
cial
Yea
rN
atio
nal a
nd M
unic
ipal
Fin
anci
al Y
ear
Nat
iona
l and
Mun
icip
al F
inan
cial
Yea
rN
atio
nal a
nd M
unic
ipal
Fin
anci
al Y
ear
Nat
iona
l and
Mun
icip
al F
inan
cial
Yea
rN
atio
nal a
nd M
unic
ipal
Fin
anci
al Y
ear
EA
STER
N C
APE
ABU
F B
uffa
lo C
ity21
546
21 5
4622
818
1 20
01
200
1 20
022
746
22 7
4624
018
AN
MA
Nel
son
Man
dela
Bay
1 35
41
200
1 20
092
005
160
000
185
000
93 3
5916
1 20
018
6 20
0
B
EC10
1 D
r Bey
ers N
aude
2 33
92
339
2 47
532
000
27 0
005
500
34 3
3929
339
7 97
5B
EC10
2 B
lue
Cran
e Ro
ute
BEC
104
Mak
ana
4 11
04
110
4 34
860
010
000
51 0
0051
000
38 0
0076
165
710
55 8
7142
348
BEC
105
Ndl
ambe
522
522
553
25 0
0025
522
522
553
BEC
106
Sun
days
Riv
er V
alle
y8
526
8 52
69
020
6 00
011
000
2 00
078
82
000
15 3
1419
526
13 0
20B
EC10
8 K
ouga
1 52
11
521
1 58
81
521
1 52
11
588
BEC
109
Kou
-Kam
ma
1 92
21
922
2 03
35
000
4 00
01
000
6 92
25
922
3 03
3C
DC1
0Sa
rah
Baar
tman
Dist
rict M
unic
ipal
ity3
123
3 12
3To
tal:
Sara
h B
aart
man
Mun
icip
aliti
es18
940
18 9
4020
017
600
10 0
0011
9 00
093
000
46 5
0078
83
884
2 00
014
9 32
811
5 82
468
517
BEC
121
Mbh
ashe
49 1
5349
153
52 0
0549
153
49 1
5352
005
BEC
122
Mnq
uma
70 8
1370
813
74 9
2070
813
70 8
1374
920
BEC
123
Gre
at K
eiB
EC12
4 A
mah
lath
i10
818
10 8
1811
445
1 00
010
818
10 8
1812
445
BEC
126
Ngq
ushw
a7
379
7 37
97
806
7 37
97
379
7 80
6B
EC12
9 R
aym
ond
Mhl
aba
18 6
4518
645
19 7
2676
118
645
19 4
0619
726
CD
C12
Am
atho
le D
istric
t Mun
icip
ality
62 3
6351
000
38 1
933
001
1 43
465
364
52 4
3438
193
Tota
l: A
mat
hole
Mun
icip
aliti
es15
6 80
815
6 80
816
5 90
262
363
51 0
0038
193
3 00
12
195
1 00
022
2 17
221
0 00
320
5 09
5
B
EC13
1 In
xuba
Yet
hem
ba78
81
000
788
1 00
0B
EC13
5 In
tsika
Yet
hu41
905
41 9
0534
336
41 9
0541
905
34 3
36B
EC13
6 E
mal
ahle
ni16
398
16 3
9817
349
16 3
9816
398
17 3
49B
EC13
7 E
ngco
bo21
816
21 8
1623
081
21 8
1621
816
23 0
81B
EC13
8 S
akhi
sizw
e14
045
14 0
4514
869
14 0
4514
045
14 8
69B
EC13
9 E
noch
Mgi
jima
8 76
58
765
9 27
578
89
553
8 76
59
275
CD
C13
Chr
is H
ani D
istric
t Mun
icip
ality
1 63
61
636
Tota
l: C
hris
Han
i Mun
icip
aliti
es10
2 92
910
2 92
998
910
3 21
21
000
106
141
102
929
99 9
10
B
EC14
1 E
lund
ini
67 0
5567
055
55 1
7867
055
67 0
5555
178
BEC
142
Sen
qu26
956
26 9
5628
519
1 00
026
956
26 9
5629
519
BEC
145
Wal
ter S
isulu
761
761
CD
C14
Joe
Gqa
bi D
istric
t Mun
icip
ality
1 63
71
637
Tota
l: Jo
e G
qabi
Mun
icip
aliti
es94
011
94 0
1183
697
1 63
776
11
000
95 6
4894
772
84 6
97
B
EC15
3 N
gquz
a H
ill77
143
77 1
4387
487
1 00
077
143
77 1
4388
487
BEC
154
Por
t St J
ohns
33 9
0933
909
35 8
7678
834
697
33 9
0935
876
BEC
155
Nya
nden
i28
548
28 5
4830
204
1 00
028
548
28 5
4831
204
BEC
156
Mhl
ontlo
7 31
17
311
7 73
51
000
7 31
17
311
8 73
5B
EC15
7 K
ing
Saba
ta D
alin
dyeb
o43
949
43 9
4946
498
1 36
51
434
45 3
1445
383
46 4
98C
DC1
5 O
.R. T
ambo
Dist
rict M
unic
ipal
ity3
001
1 43
43
001
1 43
4To
tal:
O.R
.Tam
bo M
unic
ipal
ities
190
860
190
860
207
800
5 15
42
868
3 00
019
6 01
419
3 72
821
0 80
0
B
EC44
1 M
atat
iele
56 9
2356
923
60 2
2456
923
56 9
2360
224
BEC
442
Um
zim
vubu
87 2
1187
211
87 3
4287
211
87 2
1187
342
BEC
443
Mbi
zana
45 2
6145
261
47 8
8676
145
261
46 0
2247
886
BEC
444
Nta
bank
ulu
121
098
121
098
129
281
121
098
121
098
129
281
CD
C44
Alfr
ed N
zo D
istric
t Mun
icip
ality
40 0
0083
441
68 0
002
425
42 4
2583
441
68 0
00To
tal:
Alfr
ed N
zo M
unic
ipal
ities
310
493
310
493
324
733
40 0
0083
441
68 0
002
425
761
352
918
394
695
392
733
Tota
l: Ea
ster
n C
ape
Mun
icip
aliti
es89
5 58
789
5 58
792
3 87
73
154
2 40
02
400
10 0
0031
3 36
838
7 44
133
7 69
316
217
10 4
698
000
1 23
8 32
61
295
897
1 27
1 97
0
201
9/20
(R'0
00)
201
7/18
(R'0
00)
201
8/19
(R'0
00)
201
7/18
(R'0
00)
201
8/19
(R'0
00)
201
9/20
(R'0
00)
201
7/18
(R'0
00)
201
8/19
(R'0
00)
201
7/18
(R'0
00)
201
8/19
(R'0
00)
201
9/20
(R'0
00)
201
7/18
(R'0
00)
201
8/19
(R'0
00)
201
9/20
(R'0
00)
SUB
-TO
TAL:
IND
IREC
T
Cat
egor
yM
unic
ipal
ity 2
017/
18(R
'000
) 2
018/
19(R
'000
) 2
019/
20(R
'000
)
Inte
grat
ed N
atio
nal E
lect
rific
atio
n Pr
ogra
mm
e (E
skom
) Gra
ntN
eigh
bour
hood
Dev
elop
men
t Par
tner
ship
Gra
nt
(Tec
hnic
al A
ssist
ance
)W
ater
Ser
vice
s Inf
rast
ruct
ure
Gra
nt
Reg
iona
l Bul
k In
fras
truc
ture
Gra
ntM
unic
ipal
Sys
tem
s Im
prov
emen
t Gra
nt
201
9/20
(R'0
00)

This gazette is also available free online at www.gpwonline.co.za
28 No. 40913 GOVERNMENT GAZETTE, 12 JUNE 2017
ANNE
XURE
W6
ALLO
CATI
ONS
-IN-K
IND
TO M
UNIC
IPAL
ITIE
S (SCH
EDUL
E 6,
PAR
T B)
Natio
nal a
nd M
unici
pal F
inan
cial Y
ear
Natio
nal a
nd M
unici
pal F
inan
cial Y
ear
Natio
nal a
nd M
unici
pal F
inan
cial Y
ear
Natio
nal a
nd M
unici
pal F
inan
cial Y
ear
Natio
nal a
nd M
unici
pal F
inan
cial Y
ear
Natio
nal a
nd M
unici
pal F
inan
cial Y
ear
2019
/20
(R'00
0)
2017
/18
(R'00
0)
2018
/19
(R'00
0)
2017
/18
(R'00
0)
2018
/19
(R'00
0)
2019
/20
(R'00
0)
2017
/18
(R'00
0)
2018
/19
(R'00
0)
2017
/18
(R'00
0)
2018
/19
(R'00
0)
2019
/20
(R'00
0)
2017
/18
(R'00
0)
2018
/19
(R'00
0)
2019
/20
(R'00
0)
SUB-
TOTA
L: IN
DIRE
CT
Cate
gory
Mun
icipa
lity
2017
/18
(R'00
0)
2018
/19
(R'00
0)
2019
/20
(R'00
0)
Inte
grat
ed N
atio
nal E
lectr
ifica
tion
Prog
ram
me
(Esk
om) G
rant
Neig
hbou
rhoo
d De
velo
pmen
t Par
tner
ship
Gra
nt
(Tec
hnica
l Assi
stanc
e)W
ater
Ser
vice
s Inf
rastr
uctu
re G
rant
Re
gion
al B
ulk
Infr
astr
uctu
re G
rant
Mun
icipa
l Sys
tem
s Im
prov
emen
t Gra
nt
2019
/20
(R'00
0)
FREE
STA
TE
A
MAN
Man
gaun
g 48
869
974
042
01 2
001 2
0093
141
109 0
0027
4 832
94 04
911
0 899
276 7
72
B
FS16
1 L
etsem
eng
6973
1 000
691 0
73B
FS16
2 K
opan
ong
3335
3 000
1 000
3 000
331 0
35B
FS16
3 M
ohok
are
3610
210
81 6
851 0
001 7
2110
21 1
08C
DC16
Xha
riep D
istric
t Mun
icipa
lity
1 636
1 636
Tota
l: Xh
ariep
Mun
icipa
lities
3620
421
64 6
851 6
363 0
006 3
5720
43 2
16
B
FS18
1 M
asilo
nyan
a96
8893
1 500
13 49
320
000
1 365
1 434
2 961
15 01
520
093
BFS
182
Tok
olog
o96
8792
13 50
055
240
43 50
750
000
1 000
68 83
643
594
51 09
2B
FS18
3 T
swelo
pele
3450
5325
000
20 00
01 0
0025
034
20 05
01 0
53B
FS18
4 M
atjha
beng
29 68
04 9
085 1
933 0
005 1
3850
000
788
33 46
810
046
55 19
3B
FS18
5 N
ala24
826
21 0
001 3
651 4
342 3
651 6
8226
2C
DC18
Lejw
elepu
tswa D
istric
t Mun
icipa
lity
3 123
3 123
Tota
l: Le
jwele
putsw
a Mun
icipa
lities
29 90
65 3
815 6
9313
500
85 74
082
138
120 0
003 5
185 9
912 0
0013
2 664
93 51
012
7 693
BFS
191
Sets
oto
169
4 055
4 290
31 00
016
7 299
25 00
019
8 468
29 05
54 2
90B
FS19
2 D
ihlab
eng
2 454
2 597
15 00
010
000
20 00
01 3
651 4
3416
365
13 88
822
597
BFS
193
Nke
toan
a11
416
756
17 72
720
000
68 00
665
000
40 00
01 3
651 4
3389
485
83 18
957
727
BFS
194
Malu
ti-a-P
hofu
ng18
5 211
5 512
30 00
040
000
40 00
02 1
531 4
3432
171
46 64
545
512
BFS
195
Phu
melel
a23
84 9
495 2
3643
500
23 00
01 3
651 4
3345
103
29 38
25 2
36B
FS19
6 M
antso
pa9 8
2564
681 0
0020
000
1 000
1 000
10 82
520
064
2 068
CDC
19 T
habo
Mof
utsan
yana
Dist
rict M
unici
palit
y3 1
233 1
23To
tal:
Thab
o Mof
utsa
nyan
a Mun
icipa
lities
10 36
433
489
35 43
051
000
324 8
0518
3 000
101 0
006 2
488 8
571 0
0039
2 417
225 3
4613
7 430
BFS
201
Moq
haka
8 265
3 429
3 606
20 00
028
265
3 429
3 606
BFS
203
Ngw
athe
2628
19 93
825
000
25 00
01 3
651 4
3421
303
26 46
025
028
BFS
204
Mets
imah
olo
1314
35 00
03 0
001 0
0035
000
3 013
1 014
BFS
205
Mafu
be13
1435
069
30 00
020
000
1 365
1 433
36 43
431
446
20 01
4C
DC20
Fez
ile D
abi D
istric
t Mun
icipa
lity
3 123
3 123
Tota
l: Fe
zile D
abi M
unici
palit
ies8 2
653 4
813 6
6211
0 007
58 00
045
000
2 730
5 990
1 000
121 0
0267
471
49 66
2
To
tal:
Free
Sta
te M
unici
palit
ies49
059
43 25
445
741
420
1 200
1 200
64 50
061
8 378
432 1
3854
0 832
14 13
220
838
7 000
746 4
8949
7 430
594 7
73
GA
UTEN
G
A
EKU
Ekur
hulen
i2 0
953 6
233 8
324 4
105 5
047 2
006 5
059 1
2711
032
AJH
BCi
ty of
Joha
nnes
burg
35 06
813
362
14 13
71 0
001 2
001 2
0036
068
14 56
215
337
ATS
HCi
ty of
Tsh
wane
15 91
211
386
12 04
62 4
102 5
492 4
0018
322
13 93
514
446
BGT
421
Emf
uleni
4 131
17 16
718
162
1 771
1 200
2 021
168 0
3327
8 358
288 6
5176
117
3 935
297 4
8630
8 834
BGT
422
Mid
vaal
73 00
065
000
7 000
1 000
73 00
065
000
8 000
BGT
423
Les
edi
1 365
1 433
1 365
1 433
CDC
42 S
edib
eng D
istric
t Mun
icipa
lity
3 123
3 123
Tota
l: Se
dibe
ng M
unici
palit
ies4 1
3117
167
18 16
21 7
711 2
002 0
2124
1 033
343 3
5829
5 651
1 365
5 317
1 000
248 3
0036
7 042
316 8
34
B
GT48
1 M
ogale
City
10 11
889
394
51 6
061 2
501 2
001 0
0011
724
2 143
3 145
BGT
484
Mer
afong
City
893
945
1 365
1 433
1 365
2 326
945
BGT
485
Ran
d Wes
t City
59 01
112
4 200
338 4
001 0
0059
011
124 2
0033
9 400
CDC
48 W
est R
and D
istric
t Mun
icipa
lity
200
1 636
1 636
200
Tota
l: W
est R
and
Mun
icipa
lities
10 11
81 7
861 8
901 6
061 4
501 2
0059
011
124 2
0033
8 400
3 001
1 433
2 000
73 73
612
8 869
343 4
90
To
tal:
Gaut
eng M
unici
palit
ies67
324
47 32
450
067
11 19
711
903
14 02
130
0 044
467 5
5863
4 051
4 366
6 750
3 000
382 9
3153
3 535
701 1
39

This gazette is also available free online at www.gpwonline.co.za
STAATSKOERANT, 12 JUNIE 2017 No. 40913 29A
NN
EXU
RE
W6
ALL
OC
ATIO
NS-
IN-K
IND
TO
MU
NIC
IPA
LITI
ES (SC
HED
ULE
6, P
ART
B)
Nat
iona
l and
Mun
icip
al F
inan
cial
Yea
rN
atio
nal a
nd M
unic
ipal
Fin
anci
al Y
ear
Nat
iona
l and
Mun
icip
al F
inan
cial
Yea
rN
atio
nal a
nd M
unic
ipal
Fin
anci
al Y
ear
Nat
iona
l and
Mun
icip
al F
inan
cial
Yea
rN
atio
nal a
nd M
unic
ipal
Fin
anci
al Y
ear
201
9/20
(R'0
00)
201
7/18
(R'0
00)
201
8/19
(R'0
00)
201
7/18
(R'0
00)
201
8/19
(R'0
00)
201
9/20
(R'0
00)
201
7/18
(R'0
00)
201
8/19
(R'0
00)
201
7/18
(R'0
00)
201
8/19
(R'0
00)
201
9/20
(R'0
00)
201
7/18
(R'0
00)
201
8/19
(R'0
00)
201
9/20
(R'0
00)
SUB-
TOTA
L: IN
DIR
ECT
Cat
egor
yM
unic
ipal
ity 2
017/
18(R
'000
) 2
018/
19(R
'000
) 2
019/
20(R
'000
)
Inte
grat
ed N
atio
nal E
lect
rific
atio
n Pr
ogra
mm
e (E
skom
) Gra
ntN
eigh
bour
hood
Dev
elop
men
t Par
tner
ship
Gra
nt
(Tec
hnic
al A
ssist
ance
)W
ater
Ser
vice
s Inf
rast
ruct
ure G
rant
R
egio
nal B
ulk
Infr
astr
uctu
re G
rant
Mun
icip
al S
yste
ms I
mpr
ovem
ent G
rant
201
9/20
(R'0
00)
KW
AZU
LU-N
ATA
L
A
ETH
eThe
kwin
i4
102
29 6
5631
376
2 92
02
400
2 40
07
022
32 0
5633
776
BKZ
N21
2uM
doni
30 8
9032
681
30 8
9032
681
BKZ
N21
3uM
zum
be79
987
69 8
3773
888
79 9
8769
837
73 8
88B
KZN
214
uMuz
iwab
antu
BKZ
N21
6Ra
y N
kony
eni
6 22
328
799
30 4
706
223
28 7
9930
470
CD
C21
Ugu
Dist
rict M
unic
ipal
ity1
636
1 63
6To
tal:
Ugu
Mun
icip
aliti
es86
210
129
526
137
039
1 63
687
846
129
526
137
039
BKZ
N22
1 u
Msh
wat
hi24
169
1 20
11
270
24 1
691
201
1 27
0B
KZN
222
uM
ngen
iB
KZN
223
Mpo
fana
11 1
4211
789
11 1
4211
789
BKZ
N22
4 iM
pend
leB
KZN
225
Msu
nduz
i49
486
43 1
2835
630
1 89
91
200
1 20
01
000
51 3
8544
328
37 8
30B
KZN
226
Mkh
amba
thin
i1
585
1 58
5B
KZN
227
Ric
hmon
dC
DC2
2 u
Mgu
ngun
dlov
u D
istric
t Mun
icip
ality
1 63
71
000
1 63
71
000
Tota
l: uM
gung
undl
ovu
Mun
icip
aliti
es75
240
55 4
7148
689
1 89
91
200
1 20
01
637
2 00
078
776
56 6
7151
889
BKZ
N23
5 O
khah
lam
ba1
556
1 64
61
000
1 55
62
646
BKZ
N23
7 iN
kosi
Lang
alib
alel
e 3
397
11 4
9912
166
3 39
711
499
12 1
66B
KZN
238
Alfr
ed D
uma
51 0
9952
668
46 3
0351
099
52 6
6846
303
CD
C23
uTh
ukel
a Dist
rict M
unic
ipal
ity3
001
1 43
33
001
1 43
3To
tal:
uThu
kela
Mun
icip
aliti
es54
496
65 7
2360
115
3 00
11
433
1 00
057
497
67 1
5661
115
BKZ
N24
1 eN
dum
eni
BKZ
N24
2 N
quth
u18
701
42 7
8953
171
1 00
018
701
42 7
8954
171
BKZ
N24
4 u
Msin
ga51
133
3 08
63
265
761
51 1
333
847
3 26
5B
KZN
245
uM
voti
15 0
2011
272
1 34
615
020
11 2
721
346
CD
C24
uM
ziny
athi
Dist
rict M
unic
ipal
ity1
637
1 63
7To
tal:
uMzin
yath
i Mun
icip
aliti
es84
854
57 1
4757
782
1 63
776
11
000
86 4
9157
908
58 7
82
B
KZN
252
New
castl
e48
642
38 4
1040
638
200
1 20
01
200
48 8
4239
610
41 8
38B
KZN
253
eMad
lang
eni
761
761
BKZ
N25
4 D
annh
ause
r1
720
3 50
13
704
1 72
03
501
3 70
4C
DC2
5 A
maj
uba D
istric
t Mun
icip
ality
1 63
61
636
Tota
l: A
maj
uba
Mun
icip
aliti
es50
362
41 9
1144
342
200
1 20
01
200
1 63
676
152
198
43 8
7245
542
B
KZN
261
eDum
be10
198
7 29
47
717
10 1
987
294
7 71
7B
KZN
262
uPh
ongo
loB
KZN
263
Aba
Qul
usi
28 5
3420
643
21 8
5228
534
20 6
4321
852
BKZ
N26
5 N
ongo
ma
44 1
6346
725
44 1
6346
725
BKZ
N26
6 U
lund
i2
178
11 2
6111
914
1 36
51
433
3 54
312
694
11 9
14C
DC2
6 Z
ulul
and
Dist
rict M
unic
ipal
ity18
5 00
01
637
1 00
018
6 63
71
000
Tota
l: Zu
lula
nd M
unic
ipal
ities
40 9
1083
361
88 2
0818
5 00
03
002
1 43
31
000
228
912
84 7
9489
208
B
KZN
271
uM
hlab
uyal
inga
na81
639
149
934
126
530
761
1 00
081
639
150
695
127
530
BKZ
N27
2 Jo
zini
210
396
108
525
94 8
1921
0 39
610
8 52
594
819
BKZ
N27
5 M
tuba
tuba
30 8
8126
543
28 0
8230
881
26 5
4328
082
BKZ
N27
6 B
ig F
ive H
labi
sa10
355
20 1
8721
357
10 3
5520
187
21 3
57C
DC2
7 u
Mkh
anya
kude
Dist
rict M
unic
ipal
ity12
0 00
01
637
121
637
Tota
l: uM
khan
yaku
de M
unic
ipal
ities
333
271
305
189
270
788
120
000
1 63
776
11
000
454
908
305
950
271
788
B
KZN
281
uM
folo
zi2
744
2 74
4B
KZN
282
uM
hlat
huze
57 4
7313
502
14 2
8557
473
13 5
0214
285
BKZ
N28
4 u
Mla
lazi
25 8
4446
095
48 7
681
000
25 8
4446
095
49 7
68B
KZN
285
Mth
onja
neni
600
635
600
635
BKZ
N28
6 N
kand
la22
411
18 7
4519
832
22 4
1118
745
19 8
32C
DC2
8 K
ing
Cetsh
way
o D
istric
t Mun
icip
ality
1 63
71
000
1 63
71
000
Tota
l: K
ing
Cet
shw
ayo
Mun
icip
aliti
es10
8 47
278
942
83 5
201
637
2 00
011
0 10
978
942
85 5
20
BKZ
N29
1 M
ande
ni46
200
52 6
3777
588
200
761
46 2
0053
598
77 5
88B
KZN
292
Kw
aDuk
uza
3 61
53
825
200
3 81
53
825
BKZ
N29
3 N
dwed
we
47 4
1571
364
79 6
131
000
47 4
1571
364
80 6
13B
KZN
294
Map
hum
ulo
73 0
8779
938
84 5
7573
087
79 9
3884
575
CD
C29
iLem
be D
istric
t Mun
icip
ality
1 63
61
636
Tota
l: iL
embe
Mun
icip
aliti
es16
6 70
220
7 55
424
5 60
140
01
636
761
1 00
016
8 33
820
8 71
524
6 60
1
BKZ
N43
3 G
reat
er K
oksta
d10
260
10 2
60B
KZN
434
uBu
hleb
ezw
e22
062
3 32
63
519
22 0
623
326
3 51
9B
KZN
435
uM
zim
khul
u58
964
19 1
1120
219
1 00
058
964
19 1
1121
219
BKZ
N43
6 D
r Nko
saza
na D
lam
ini Z
uma
15 7
9916
716
15 7
9916
716
CD
C43
Har
ry G
wal
a Dist
rict M
unic
ipal
ity1
637
1 63
7To
tal:
Har
ry G
wal
a M
unic
ipal
ities
91 2
8638
236
40 4
541
637
1 00
092
923
38 2
3641
454
Tota
l: K
waZ
ulu-
Nat
al M
unic
ipal
ities
1 09
5 90
51
092
716
1 10
7 91
45
019
5 20
04
800
185
000
120
000
19 0
965
910
10 0
001
425
020
1 10
3 82
61
122
714

This gazette is also available free online at www.gpwonline.co.za
30 No. 40913 GOVERNMENT GAZETTE, 12 JUNE 2017A
NN
EXU
RE
W6
ALL
OC
ATIO
NS-
IN-K
IND
TO
MU
NIC
IPA
LITI
ES (SC
HED
ULE
6, P
AR
T B
)
Nat
iona
l and
Mun
icip
al F
inan
cial
Yea
rN
atio
nal a
nd M
unic
ipal
Fin
anci
al Y
ear
Nat
iona
l and
Mun
icip
al F
inan
cial
Yea
rN
atio
nal a
nd M
unic
ipal
Fin
anci
al Y
ear
Nat
iona
l and
Mun
icip
al F
inan
cial
Yea
rN
atio
nal a
nd M
unic
ipal
Fin
anci
al Y
ear
201
9/20
(R'0
00)
201
7/18
(R'0
00)
201
8/19
(R'0
00)
201
7/18
(R'0
00)
201
8/19
(R'0
00)
201
9/20
(R'0
00)
201
7/18
(R'0
00)
201
8/19
(R'0
00)
201
7/18
(R'0
00)
201
8/19
(R'0
00)
201
9/20
(R'0
00)
201
7/18
(R'0
00)
201
8/19
(R'0
00)
201
9/20
(R'0
00)
SUB
-TO
TAL:
IND
IREC
T
Cat
egor
yM
unic
ipal
ity 2
017/
18(R
'000
) 2
018/
19(R
'000
) 2
019/
20(R
'000
)
Inte
grat
ed N
atio
nal E
lect
rific
atio
n Pr
ogra
mm
e (E
skom
) Gra
ntN
eigh
bour
hood
Dev
elop
men
t Par
tner
ship
Gra
nt
(Tec
hnic
al A
ssist
ance
)W
ater
Ser
vice
s Inf
rast
ruct
ure
Gra
nt
Reg
iona
l Bul
k In
fras
truc
ture
Gra
ntM
unic
ipal
Sys
tem
s Im
prov
emen
t Gra
nt
201
9/20
(R'0
00)
LI
MPO
PO
B
LIM
331
Gre
ater
Giy
ani
51 1
6593
586
79 0
1476
151
165
94 3
4779
014
BLI
M33
2 G
reat
er L
etab
a35
634
24 3
5025
762
35 6
3424
350
25 7
62B
LIM
333
Gre
ater
Tza
neen
21 1
0253
020
56 0
9521
102
53 0
2056
095
BLI
M33
4 B
a-Ph
alab
orw
a10
804
17 2
6718
269
1 36
51
433
12 1
6918
700
18 2
69B
LIM
335
Mar
ulen
g20
430
20 3
2121
499
20 4
3020
321
21 4
99C
DC3
3 M
opan
i Dist
rict M
unic
ipal
ity10
000
440
318
296
200
70 0
003
001
1 43
345
3 31
929
7 63
370
000
Tota
l: M
opan
i Mun
icip
aliti
es13
9 13
520
8 54
420
0 63
910
000
440
318
296
200
70 0
004
366
3 62
759
3 81
950
8 37
127
0 63
9
BLI
M34
1LI
M34
17
073
31 2
6733
080
7 07
331
267
33 0
80B
LIM
343
LIM
343
73 6
6927
050
28 6
1973
669
27 0
5028
619
BLI
M34
4M
akha
do22
120
37 8
8440
081
761
22 1
2038
645
40 0
81B
LIM
345
LIM
345
53 1
1653
116
CD
C34
Vhe
mbe
Dist
rict M
unic
ipal
ity10
000
67 6
8211
3 74
860
000
2 42
580
107
113
748
60 0
00To
tal:
Vhe
mbe
Mun
icip
aliti
es15
5 97
896
201
101
780
10 0
0067
682
113
748
60 0
002
425
761
236
085
210
710
161
780
B
LIM
351
Blou
berg
40
503
31 9
3833
790
40 5
0331
938
33 7
90B
LIM
353
Mol
emol
e15
264
24 6
7726
109
15 2
6424
677
26 1
09B
LIM
354
Polo
kwan
e 10
5 74
897
464
83 1
1723
01
200
1 37
640
000
205
000
152
000
145
978
303
664
236
493
BLI
M35
5Le
pele
-Nku
mpi
24 9
0220
332
21 5
1124
902
20 3
3221
511
CD
C35
Capr
icor
n D
istric
t Mun
icip
ality
23 0
0059
919
70 0
001
636
24 6
3659
919
70 0
00To
tal:
Cap
rico
rn M
unic
ipal
ities
186
417
174
411
164
527
230
1 20
01
376
40 0
0020
5 00
015
2 00
023
000
59 9
1970
000
1 63
625
1 28
344
0 53
038
7 90
3
BLI
M36
1 T
haba
zim
bi85
54
074
4 31
027
122
68 0
0090
000
1 36
51
433
29 3
4273
507
94 3
10B
LIM
362
Lep
hala
le61
605
89 2
2283
817
1 00
010
000
39 0
2862
605
99 2
2212
2 84
5B
LIM
366
Bel
a-Be
la4
899
1 84
51
952
761
4 89
92
606
1 95
2B
LIM
367
Mog
alak
wen
a42
972
120
814
121
772
150
000
160
000
183
558
788
193
760
280
814
305
330
BLI
M36
8 L
IM 3
683
645
3 85
71
000
15 0
0040
000
1 36
51
433
2 36
520
078
43 8
57C
DC3
6 W
ater
berg
Dist
rict M
unic
ipal
ity1
636
1 00
01
636
1 00
0To
tal:
Wat
erbe
rg M
unic
ipal
ities
110
331
219
600
215
708
27 1
2268
000
90 0
0015
2 00
018
5 00
026
2 58
65
154
3 62
71
000
294
607
476
227
569
294
B
LIM
471
Eph
raim
Mog
ale
16 0
788
812
9 32
378
816
866
8 81
29
323
BLI
M47
2 E
lias M
otso
aled
i25
303
9 29
39
832
761
25 3
0310
054
9 83
2B
LIM
473
Mak
hudu
tham
aga
93 2
0967
917
71 8
5693
209
67 9
1771
856
BLI
M47
6 L
IM 4
7673
748
39 4
1841
704
788
74 5
3639
418
41 7
04C
DC4
7 S
ekhu
khun
e D
istric
t Mun
icip
ality
10 0
0022
6 00
019
0 00
031
0 00
01
637
237
637
190
000
310
000
Tota
l: Se
khuk
hune
Mun
icip
aliti
es20
8 33
812
5 44
013
2 71
510
000
226
000
190
000
310
000
3 21
376
144
7 55
131
6 20
144
2 71
5
Tota
l: Li
mpo
po M
unic
ipal
ities
800
199
824
196
815
369
230
1 20
01
376
97 1
2227
3 00
024
2 00
090
9 00
084
4 86
777
2 58
616
794
8 77
61
000
1 82
3 34
51
952
039
1 83
2 33
1
MPU
MA
LAN
GA
BM
P301
Chie
f Alb
ert L
uthu
li11
800
18 6
7519
758
1 36
51
433
13 1
6520
108
19 7
58B
MP3
02M
suka
ligw
a20
758
8 02
68
491
1 36
51
433
22 1
239
459
8 49
1B
MP3
03M
khon
do44
769
42 0
3344
471
44 7
6942
033
44 4
71B
MP3
04 D
r Pix
ley
ka Is
aka
Sem
e10
535
3 38
53
581
10 5
353
385
3 58
1B
MP3
05Le
kwa
683
328
25 3
471
365
1 43
32
048
1 76
125
347
BM
P306
Dip
ales
eng
615
4 98
155
270
1 36
51
433
1 98
06
414
55 2
70B
MP3
07G
ovan
Mbe
ki2
340
5 52
325
843
2 34
05
523
25 8
43C
DC3
0G
ert S
iban
de D
istric
t Mun
icip
ality
3 12
33
123
Tota
l: G
ert S
iban
de M
unic
ipal
ities
91 5
0082
951
182
761
5 46
08
855
96 9
6091
806
182
761
B
MP3
11V
icto
r Kha
nye
375
4 53
24
795
30 2
6528
758
3 00
01
365
1 43
332
005
34 7
237
795
BM
P312
Emal
ahle
ni3
250
1 20
01
200
10 2
3820
000
15 0
0078
714
275
21 2
0016
200
BM
P313
Stev
e Ts
hwet
e3
464
3 57
13
778
3 46
43
571
3 77
8B
MP3
14Em
akha
zeni
2 70
01
310
1 38
678
73
487
1 31
01
386
BM
P315
Them
bisil
e H
ani
109
220
40 3
8553
307
33 0
2588
355
125
669
761
142
245
129
501
178
976
BM
P316
Dr J
S M
orok
a20
414
22 2
2023
509
20 4
1422
220
23 5
09C
DC3
1N
kang
ala
Dist
rict M
unic
ipal
ity3
123
3 12
3To
tal:
Nka
ngal
a M
unic
ipal
ities
136
173
72 0
1886
775
3 25
01
200
1 20
073
528
137
113
143
669
2 93
95
317
215
890
215
648
231
644
B
MP3
21Th
aba
Chw
eu1
605
10 2
6610
861
1 36
51
433
2 97
011
699
10 8
61B
MP3
24N
kom
azi
12 3
4726
020
27 5
2924
022
88 0
4098
798
1 00
036
369
114
060
127
327
BM
P325
Bush
buck
ridge
101
611
182
998
183
032
200
41 6
414
400
761
143
252
188
359
183
032
BM
P326
City
of M
bom
bela
57 1
5455
136
58 3
341
890
1 25
01
200
40 2
5424
042
39 3
9699
298
80 4
2898
930
CD
C32
Ehla
nzen
i Dist
rict M
unic
ipal
ity1
637
1 63
7To
tal:
Ehla
nzen
i Mun
icip
aliti
es17
2 71
727
4 42
027
9 75
61
890
1 45
01
200
105
917
116
482
138
194
3 00
22
194
1 00
028
3 52
639
4 54
642
0 15
0
Tota
l: M
pum
alan
ga M
unic
ipal
ities
400
390
429
389
549
292
5 14
02
650
2 40
017
9 44
525
3 59
528
1 86
311
401
16 3
661
000
596
376
702
000
834
555

This gazette is also available free online at www.gpwonline.co.za
STAATSKOERANT, 12 JUNIE 2017 No. 40913 31A
NN
EX
UR
E W
6
AL
LO
CA
TIO
NS-
IN-K
IND
TO
MU
NIC
IPA
LIT
IES (S
CH
ED
UL
E 6
, PA
RT
B)
Nat
iona
l and
Mun
icip
al F
inan
cial
Yea
rN
atio
nal a
nd M
unic
ipal
Fin
anci
al Y
ear
Nat
iona
l and
Mun
icip
al F
inan
cial
Yea
rN
atio
nal a
nd M
unic
ipal
Fin
anci
al Y
ear
Nat
iona
l and
Mun
icip
al F
inan
cial
Yea
rN
atio
nal a
nd M
unic
ipal
Fin
anci
al Y
ear
201
9/20
(R'0
00)
201
7/18
(R'0
00)
201
8/19
(R'0
00)
201
7/18
(R'0
00)
201
8/19
(R'0
00)
201
9/20
(R'0
00)
201
7/18
(R'0
00)
201
8/19
(R'0
00)
201
7/18
(R'0
00)
201
8/19
(R'0
00)
201
9/20
(R'0
00)
201
7/18
(R'0
00)
201
8/19
(R'0
00)
201
9/20
(R'0
00)
SUB
-TO
TA
L: I
ND
IRE
CT
Cat
egor
yM
unic
ipal
ity
201
7/18
(R'0
00)
201
8/19
(R'0
00)
201
9/20
(R'0
00)
Inte
grat
ed N
atio
nal E
lect
rifi
cati
on P
rogr
amm
e (E
skom
) Gra
ntN
eigh
bour
hood
Dev
elop
men
t Par
tner
ship
Gra
nt
(Tec
hnic
al A
ssis
tanc
e)W
ater
Ser
vice
s In
fras
truc
ture
Gra
nt
Reg
iona
l Bul
k In
fras
truc
ture
Gra
ntM
unic
ipal
Sys
tem
s Im
prov
emen
t Gra
nt
201
9/20
(R'0
00)
N
OR
TH
ER
N C
AP
E
B
NC
061
Ric
hter
svel
d15
000
21 7
8276
115
761
21 7
82B
NC
062
Nam
a K
hoi
3 70
01
000
3 70
01
000
BN
C06
4 K
amie
sber
gB
NC
065
Han
tam
762
637
2 79
076
2 63
72
790
BN
C06
6 K
aroo
Hoo
glan
d76
176
1B
NC
067
Khâ
i-Ma
1 00
01
000
CD
C6
Nam
akw
a D
istr
ict M
unic
ipal
ity3
123
3 12
3T
otal
: Nam
akw
a M
unic
ipal
itie
s76
2 63
72
790
3 70
015
000
21 7
824
645
2 00
03
776
22 2
8226
572
B
NC
071
Ubu
ntu
2 00
02
000
BN
C07
2 U
mso
bom
vu44
449
475
4444
947
5B
NC
073
Em
than
jeni
2 00
020
000
6 79
61
000
2 00
020
000
7 79
6B
NC
074
Kar
eebe
rgB
NC
075
Ren
oste
rber
g3
000
3 00
0B
NC
076
The
mbe
lihle
247
247
BN
C07
7 S
iyat
hem
ba76
2 00
07
621
787
10 4
84B
NC
078
Siy
ancu
ma
114
1 47
31
559
28 0
005
150
21 2
3715
000
33 2
6422
710
16 5
59C
DC
7 P
ixle
y K
a Se
me
Dis
tric
t Mun
icip
ality
3 12
43
124
Tot
al: P
ixle
y K
a Se
me
Mun
icip
alit
ies
481
1 92
22
034
37 0
0012
771
41 2
3721
796
787
3 12
41
000
51 0
3946
283
24 8
30
BN
C08
2 !K
ai !G
arib
9 85
869
473
080
010
000
1 00
010
658
694
11 7
30B
NC
084
!Khe
is1
000
1 00
0B
NC
085
Tsa
ntsa
bane
389
832
10 4
024
800
787
5 62
59
832
10 4
02B
NC
086
Kga
telo
pele
787
787
BN
C08
7 D
awid
Kru
iper
1 16
319
220
325
000
34 1
0030
000
21 4
221
000
60 2
6330
192
22 6
25C
DC
8Z.
F. M
gcaw
u D
istr
ict M
unic
ipal
ity3
124
3 12
4T
otal
: Z.F
. Mgc
awu
Mun
icip
alit
ies
11 0
5910
718
11 3
3529
800
34 9
0030
000
31 4
221
574
3 12
43
000
77 3
3343
842
45 7
57
BN
C09
1 S
ol P
laat
jie20
000
800
1 20
01
200
1 36
51
433
2 16
52
633
21 2
00B
NC
092
Dik
gatlo
ng7
765
8 93
29
459
14 7
071
000
22 4
728
932
10 4
59B
NC
093
Mag
aren
g25
000
9 75
878
710
545
25 0
00B
NC
094
Pho
kwan
e1
131
787
1 91
8C
DC
9 F
ranc
es B
aard
Dis
tric
t Mun
icip
ality
3 12
43
124
Tot
al: F
ranc
es B
aard
Mun
icip
alit
ies
8 89
68
932
54 4
5980
01
200
1 20
024
465
2 93
94
557
1 00
037
100
14 6
8956
659
B
NC
451
Joe
Mor
olon
g9
693
12 8
8013
628
9 69
312
880
13 6
28B
NC
452
Ga-
Sego
nyan
a98
362
74 4
0871
723
787
99 1
4974
408
71 7
23B
NC
453
Gam
agar
a9
930
118
468
123
722
1 00
09
930
118
468
124
722
CD
C45
Joh
n Ta
olo
Gae
tsew
e D
istr
ict M
unic
ipal
ity1
637
1 63
7T
otal
: Joh
n T
aolo
Gae
tsew
e M
unic
ipal
itie
s11
7 98
520
5 75
620
9 07
32
424
1 00
012
0 40
920
5 75
621
0 07
3
Tot
al: N
orth
ern
Cap
e M
unic
ipal
itie
s13
8 49
722
9 96
527
9 69
180
01
200
1 20
070
500
72 1
3686
237
75 0
007
724
15 4
508
000
289
657
332
852
363
891
N
OR
TH
WE
ST
B
NW
371
Mor
etel
e14
457
18 3
3119
182
38 9
1970
500
83 2
7053
376
88 8
3110
2 45
2B
NW
372
Mad
iben
g86
729
59 2
7170
000
60 0
0012
5 17
515
5 00
050
000
60 0
0060
000
761
196
729
245
207
285
000
BN
W37
3 R
uste
nbur
g20
229
80 1
8180
833
800
1 20
01
200
1 00
021
029
81 3
8183
033
BN
W37
4 K
getle
ngri
vier
247
143
151
40 0
0030
000
1 00
040
247
30 1
431
151
BN
W37
5 M
oses
Kot
ane
37 2
4114
237
15 0
631
365
1 43
338
606
15 6
7015
063
CD
C37
Boj
anal
a Pl
atin
um D
istr
ict M
unic
ipal
ity1
637
1 63
7T
otal
: Boj
anal
a P
lati
num
Mun
icip
alit
ies
158
903
172
163
185
229
800
1 20
01
200
60 0
0012
5 17
515
5 00
012
8 91
916
0 50
014
3 27
03
002
2 19
42
000
351
624
461
232
486
699
B
NW
381
Rat
lou
11 5
8014
645
15 4
9411
580
14 6
4515
494
BN
W38
2 T
swai
ng8
857
5 82
56
163
787
9 64
45
825
6 16
3B
NW
383
Maf
iken
g29
811
15 6
8316
593
787
30 5
9815
683
16 5
93B
NW
384
Dits
obot
la4
598
7 04
67
454
1 36
51
433
5 96
38
479
7 45
4B
NW
385
Ram
otsh
ere
Moi
loa
15 1
688
513
9 00
71
000
15 1
688
513
10 0
07C
DC
38 N
gaka
Mod
iri M
olem
a D
istr
ict M
unic
ipal
ity10
0 00
021
0 00
024
5 23
388
000
114
586
95 0
001
637
189
637
324
586
340
233
Tot
al: N
gaka
Mod
iri M
olem
a M
unic
ipal
itie
s70
014
51 7
1254
711
100
000
210
000
245
233
88 0
0011
4 58
695
000
4 57
61
433
1 00
026
2 59
037
7 73
139
5 94
4
BN
W39
2 N
aled
i4
490
2 40
62
545
1 36
51
433
5 85
53
839
2 54
5B
NW
393
Mam
usa
25 8
5523
213
24 5
5978
726
642
23 2
1324
559
BN
W39
4 G
reat
er T
aung
14 4
5815
347
16 6
611
000
14 4
5815
347
17 6
61B
NW
396
Lek
wa-
Teem
ane
147
107
113
1 00
014
710
71
113
BN
W39
7K
agis
ano-
Mol
opo
28 9
9532
879
34 5
7476
028
995
33 6
3934
574
CD
C39
Dr R
uth
Sego
mot
si M
ompa
ti D
istr
ict M
unic
ipal
ity1
637
1 63
7T
otal
: Dr
Rut
h Se
gom
otsi
Mom
pati
Mun
icip
alit
ies
73 9
4573
952
78 4
523
789
2 19
32
000
77 7
3476
145
80 4
52
BN
W40
3 C
ity o
f Mat
losa
na73
93
287
3 47
842
01
200
1 20
01
000
1 15
94
487
5 67
8B
NW
404
Maq
uass
i Hill
s53
03
270
3 45
925
000
1 00
025
530
3 27
04
459
bN
W40
5 V
ente
rsdo
rp/T
lokw
e56
431
032
86
300
40 0
0078
77
651
40 3
1032
8C
DC
40 D
r Ken
neth
Kau
nda
Dis
tric
t Mun
icip
ality
3 12
43
124
Tot
al: D
r K
enne
th K
aund
a M
unic
ipal
itie
s1
833
6 86
77
265
420
1 20
01
200
31 3
0040
000
787
3 12
42
000
34 3
4051
191
10 4
65
Tot
al: N
orth
Wes
t Mun
icip
alit
ies
304
695
304
694
325
657
1 22
02
400
2 40
016
0 00
033
5 17
540
0 23
324
8 21
931
5 08
623
8 27
012
154
8 94
47
000
726
288
966
299
973
560

This gazette is also available free online at www.gpwonline.co.za
32 No. 40913 GOVERNMENT GAZETTE, 12 JUNE 2017
AN
NEX
UR
E W
6
ALL
OC
ATIO
NS-
IN-K
IND
TO
MU
NIC
IPA
LITI
ES (SC
HED
ULE
6, P
AR
T B
)
Nat
iona
l and
Mun
icip
al F
inan
cial
Yea
rN
atio
nal a
nd M
unic
ipal
Fin
anci
al Y
ear
Nat
iona
l and
Mun
icip
al F
inan
cial
Yea
rN
atio
nal a
nd M
unic
ipal
Fin
anci
al Y
ear
Nat
iona
l and
Mun
icip
al F
inan
cial
Yea
rN
atio
nal a
nd M
unic
ipal
Fin
anci
al Y
ear
201
9/20
(R'0
00)
201
7/18
(R'0
00)
201
8/19
(R'0
00)
201
7/18
(R'0
00)
201
8/19
(R'0
00)
201
9/20
(R'0
00)
201
7/18
(R'0
00)
201
8/19
(R'0
00)
201
7/18
(R'0
00)
201
8/19
(R'0
00)
201
9/20
(R'0
00)
201
7/18
(R'0
00)
201
8/19
(R'0
00)
201
9/20
(R'0
00)
SUB
-TO
TAL:
IND
IREC
T
Cat
egor
yM
unic
ipal
ity 2
017/
18(R
'000
) 2
018/
19(R
'000
) 2
019/
20(R
'000
)
Inte
grat
ed N
atio
nal E
lect
rific
atio
n Pr
ogra
mm
e (E
skom
) Gra
ntN
eigh
bour
hood
Dev
elop
men
t Par
tner
ship
Gra
nt
(Tec
hnic
al A
ssist
ance
)W
ater
Ser
vice
s Inf
rast
ruct
ure
Gra
nt
Reg
iona
l Bul
k In
fras
truc
ture
Gra
ntM
unic
ipal
Sys
tem
s Im
prov
emen
t Gra
nt
201
9/20
(R'0
00)
W
ESTE
RN
CA
PE
A
CPT
City
of C
ape
Tow
n59
747
37 6
4644
698
564
1 20
01
200
60 3
1138
846
45 8
98
BW
C011
Mat
zika
ma
6669
9 00
020
000
9 06
620
069
BW
C012
Ced
erbe
rg10
695
25 8
8817
389
1 00
010
695
25 8
8818
389
BW
C013
Ber
griv
ier
9196
760
851
96B
WC0
14 S
alda
nha
Bay
4 69
166
691
000
4 69
166
1 06
9B
WC0
15 S
war
tland
1 11
681
085
71
116
810
857
CD
C1 W
est C
oast
Dist
rict M
unic
ipal
ity5
000
3 12
43
124
5 00
0To
tal:
Wes
t Coa
st M
unic
ipal
ities
16 5
0226
921
18 4
809
000
25 0
003
884
2 00
016
502
39 8
0545
480
B
WC0
22 W
itzen
berg
123
130
123
130
BW
C023
Dra
kens
tein
1 36
51
433
1 36
51
433
BW
C024
Ste
llenb
osch
1 00
01
000
BW
C025
Bre
ede
Val
ley
12 6
6322
371
13 6
6976
012
663
23 1
3113
669
BW
C026
Lan
gebe
rg25
261
000
251
026
CD
C2 C
ape
Win
elan
ds D
istric
t Mun
icip
ality
3 12
43
124
Tota
l: C
ape
Win
elan
ds M
unic
ipal
ities
12 6
6322
519
13 8
251
365
5 31
72
000
14 0
2827
836
15 8
25
BW
C031
The
ewat
ersk
loof
2 92
64
905
5 19
11
000
2 92
64
905
6 19
1B
WC0
32 O
vers
trand
BW
C033
Cap
e A
gulh
as28
51
000
285
1 00
0B
WC0
34 S
wel
lend
am25
2776
078
527
CD
C3 O
verb
erg
Dist
rict M
unic
ipal
ity3
124
3 12
4To
tal:
Ove
rber
g M
unic
ipal
ities
2 92
65
215
5 21
83
884
2 00
02
926
9 09
97
218
B
WC0
41 K
anna
land
12 9
4960
000
77 0
0012
949
60 0
0077
000
BW
C042
Hes
sequ
a12
313
012
313
0B
WC0
43 M
osse
l Bay
1 58
51
677
1 58
51
677
BW
C044
Geo
rge
2 62
298
104
1 00
02
622
981
104
BW
C045
Oud
tshoo
rn32
334
220
000
40 0
0076
021
083
40 3
42B
WC0
47 B
itou
124
124
BW
C048
Kny
sna
1 00
01
000
CD
C4 E
den
Dist
rict M
unic
ipal
ity3
124
3 12
4To
tal:
Eden
Mun
icip
aliti
es2
622
2 25
32
253
12 9
4980
000
117
000
3 88
42
000
15 5
7186
137
121
253
B
WC0
51 L
aing
sbur
g38
2525
760
3878
525
BW
C052
Prin
ce A
lber
t25
261
000
251
026
BW
C053
Bea
ufor
t Wes
t30
232
05
000
15 0
0076
06
062
15 3
20C
DC5
Cen
tral K
aroo
Dist
rict M
unic
ipal
ity3
124
3 12
4To
tal:
Cen
tral
Kar
oo M
unic
ipal
ities
3835
237
15
000
15 0
004
644
1 00
038
9 99
616
371
Tota
l: W
este
rn C
ape
Mun
icip
aliti
es94
498
94 9
0684
845
564
1 20
01
200
12 9
4994
000
157
000
1 36
521
613
9 00
010
9 37
621
1 71
925
2 04
5
Una
lloca
ted
67 5
6267
562
N
atio
nal T
otal
3 84
6 15
43
962
031
4 18
2 45
327
744
29 3
5330
997
587
122
608
175
642
233
2 77
3 53
92
880
922
3 03
7 29
510
3 24
911
5 11
612
1 56
27
337
808
7 59
5 59
78
014
540

This gazette is also available free online at www.gpwonline.co.za
STAATSKOERANT, 12 JUNIE 2017 No. 40913 33
AN
NE
XU
RE
W7
EQU
ITA
BLE
SH
AR
E A
ND
TO
TA
L A
LL
OC
AT
ION
S T
O M
UN
ICPA
LIT
IES
(Nat
iona
l and
Mun
icip
al F
inan
cial
Yea
rs)

This gazette is also available free online at www.gpwonline.co.za
34 No. 40913 GOVERNMENT GAZETTE, 12 JUNE 2017
ANNEXURE W7
EQUITABLE SHARE AND TOTAL ALLOCATIONS TO MUNICPALITIES
National and Municipal Financial Year National and Municipal Financial Year
EASTERN CAPE
A BUF Buffalo City 705 277 779 473 841 980 1 610 788 1 844 566 1 970 529A NMA Nelson Mandela Bay 844 287 942 772 1 028 922 2 196 263 2 395 875 2 576 456
B EC101 Dr Beyers Naude 77 494 83 203 88 039 153 910 147 884 135 657B EC102 Blue Crane Route 45 700 48 917 51 426 79 896 73 956 77 346B EC104 Makana 79 569 85 530 90 751 173 188 174 791 173 042B EC105 Ndlambe 82 084 88 192 93 638 146 221 128 992 137 215B EC106 Sundays River Valley 65 367 71 933 77 618 123 026 134 361 135 174B EC108 Kouga 102 637 113 277 123 252 143 132 155 718 172 544B EC109 Kou-Kamma 42 375 45 402 48 090 70 789 73 728 80 480C DC10 Sarah Baartman District Municipality 84 825 88 177 91 012 89 310 94 649 94 497Total: Sarah Baartman Municipalities 580 051 624 631 663 826 979 472 984 079 1 005 955
B EC121 Mbhashe 218 025 224 474 227 832 348 141 363 082 375 217B EC122 Mnquma 227 129 233 395 236 441 370 651 384 109 394 232B EC123 Great Kei 34 997 37 805 39 333 53 976 57 170 64 115B EC124 Amahlathi 95 446 96 836 96 852 142 927 142 645 153 090B EC126 Ngqushwa 73 615 75 217 75 760 110 703 109 135 111 531B EC129 Raymond Mhlaba 149 375 155 353 158 899 227 925 225 854 237 262C DC12 Amathole District Municipality 757 132 787 007 839 363 1 369 725 1 401 787 1 475 308Total: Amathole Municipalities 1 555 719 1 610 087 1 674 480 2 624 048 2 683 782 2 810 755
B EC131 Inxuba Yethemba 37 704 39 437 40 691 67 029 70 851 84 505B EC135 Intsika Yethu 147 333 147 638 145 371 242 138 243 080 237 778B EC136 Emalahleni 115 992 115 768 113 113 170 104 175 628 178 086B EC137 Engcobo 134 108 135 843 135 622 211 171 220 632 223 911B EC138 Sakhisizwe 59 593 61 476 62 498 109 394 96 503 104 228B EC139 Enoch Mgijima 160 117 164 355 166 282 254 187 260 358 257 428C DC13 Chris Hani District Municipality 507 459 525 397 543 249 1 104 694 1 079 448 1 010 027Total: Chris Hani Municipalities 1 162 306 1 189 914 1 206 826 2 158 717 2 146 500 2 095 963
B EC141 Elundini 134 116 137 949 139 913 275 107 283 435 267 940B EC142 Senqu 132 828 136 038 137 402 207 135 205 924 217 083B EC145 Walter Sisulu 49 030 52 514 55 125 98 414 77 785 88 560C DC14 Joe Gqabi District Municipality 239 160 258 757 273 460 476 679 542 092 580 992Total: Joe Gqabi Municipalities 555 134 585 258 605 900 1 057 335 1 109 236 1 154 575
B EC153 Ngquza Hill 210 127 225 694 235 124 360 787 376 101 400 174B EC154 Port St Johns 125 772 134 678 140 105 216 767 227 493 237 103B EC155 Nyandeni 223 248 233 307 239 669 331 681 348 976 366 716B EC156 Mhlontlo 159 379 165 019 168 081 229 441 237 398 249 500B EC157 King Sabata Dalindyebo 267 710 290 205 304 787 434 895 457 329 498 903C DC15 O.R. Tambo District Municipality 728 270 793 525 857 040 1 837 776 1 926 781 2 002 385Total: O.R.Tambo Municipalities 1 714 506 1 842 428 1 944 806 3 411 347 3 574 078 3 754 781
B EC441 Matatiele 185 808 205 402 215 237 377 299 406 908 422 993B EC442 Umzimvubu 175 236 191 102 199 217 346 874 366 073 381 079B EC443 Mbizana 197 681 227 226 238 082 341 969 352 564 377 174B EC444 Ntabankulu 99 613 107 864 112 067 292 503 310 098 324 221C DC44 Alfred Nzo District Municipality 437 586 511 925 557 420 997 754 1 122 691 1 161 809Total: Alfred Nzo Municipalities 1 095 924 1 243 519 1 322 023 2 356 399 2 558 334 2 667 276
Total: Eastern Cape Municipalities 8 213 204 8 818 082 9 288 763 16 394 369 17 296 450 18 036 290
2017/18(R'000)
2018/19(R'000)
2019/20(R'000)
2017/18(R'000)
2018/19(R'000)
2019/20(R'000)
TOTAL ALLOCATIONS TO MUNICIPALITIES
Category Municipality
EQUITABLE SHARE1

This gazette is also available free online at www.gpwonline.co.za
STAATSKOERANT, 12 JUNIE 2017 No. 40913 35
ANNEXURE W7
EQUITABLE SHARE AND TOTAL ALLOCATIONS TO MUNICPALITIES
National and Municipal Financial Year National and Municipal Financial Year 2017/18(R'000)
2018/19(R'000)
2019/20(R'000)
2017/18(R'000)
2018/19(R'000)
2019/20(R'000)
TOTAL ALLOCATIONS TO MUNICIPALITIES
Category Municipality
EQUITABLE SHARE1
FREE STATE
A MAN Mangaung 630 908 685 968 741 097 1 776 965 1 848 884 2 129 620
B FS161 Letsemeng 49 189 57 899 61 783 98 966 152 268 129 225B FS162 Kopanong 67 330 77 579 82 637 127 563 168 126 173 222B FS163 Mohokare 56 055 61 606 66 009 128 912 163 419 169 454C DC16 Xhariep District Municipality 33 307 40 418 41 856 39 338 44 190 46 019Total: Xhariep Municipalities 205 881 237 502 252 285 394 779 528 003 517 920
B FS181 Masilonyana 89 814 106 815 113 792 144 443 183 916 217 199B FS182 Tokologo 44 274 49 254 52 554 143 781 116 504 133 332B FS183 Tswelopele 59 702 66 780 71 163 114 340 106 415 92 566B FS184 Matjhabeng 393 631 459 418 498 537 586 460 635 109 700 413B FS185 Nala 100 124 110 692 117 408 145 316 154 639 161 838C DC18 Lejweleputswa District Municipality 115 472 120 945 125 096 119 998 127 468 128 634Total: Lejweleputswa Municipalities 803 017 913 904 978 550 1 254 338 1 324 051 1 433 982
B FS191 Setsoto 157 656 173 593 185 530 448 710 300 010 286 206B FS192 Dihlabeng 129 764 147 888 161 256 203 110 230 137 251 040B FS193 Nketoana 79 880 87 430 93 708 202 820 204 616 187 050B FS194 Maluti-a-Phofung 493 768 537 563 573 326 749 035 832 303 867 708B FS195 Phumelela 61 603 67 933 72 638 151 005 142 279 132 168B FS196 Mantsopa 68 314 74 700 79 840 117 536 142 562 141 764C DC19 Thabo Mofutsanyana District Municipality 101 909 106 990 110 846 113 701 120 148 121 283Total: Thabo Mofutsanyana Municipalities 1 092 894 1 196 097 1 277 144 1 985 917 1 972 055 1 987 219
B FS201 Moqhaka 164 092 185 011 200 251 261 342 248 901 275 663B FS203 Ngwathe 160 606 174 200 186 068 281 132 294 061 321 221B FS204 Metsimaholo 142 709 163 582 181 267 250 807 226 452 248 041B FS205 Mafube 78 462 86 124 92 261 150 321 151 044 152 172C DC20 Fezile Dabi District Municipality 144 321 149 130 153 678 147 754 155 561 157 115Total: Fezile Dabi Municipalities 690 190 758 047 813 525 1 091 356 1 076 019 1 154 212
Total: Free State Municipalities 3 422 890 3 791 518 4 062 601 6 503 355 6 749 012 7 222 953
GAUTENG
A EKU Ekurhuleni 2 719 861 3 154 062 3 503 013 5 640 508 6 085 410 6 599 817A JHB City of Johannesburg 3 666 637 4 241 872 4 722 485 6 729 559 7 542 196 8 208 223A TSH City of Tshwane 2 132 788 2 404 666 2 661 272 4 779 294 4 965 546 5 377 981
B GT421 Emfuleni 633 240 709 076 772 614 1 061 217 1 268 519 1 366 594B GT422 Midvaal 86 316 97 438 107 839 217 274 221 969 205 155B GT423 Lesedi 104 923 119 389 132 215 182 077 181 530 213 350C DC42 Sedibeng District Municipality 254 779 258 764 266 791 260 950 265 697 270 744Total: Sedibeng Municipalities 1 079 258 1 184 667 1 279 459 1 721 518 1 937 715 2 055 843
B GT481 Mogale City 323 938 370 843 410 961 517 324 575 810 645 401B GT484 Merafong City 163 084 186 186 203 851 265 047 307 510 347 138B GT485 Rand West City 239 112 275 335 303 044 455 510 575 308 857 289C DC48 West Rand District Municipality 193 187 197 803 204 516 209 662 211 648 208 309Total: West Rand Municipalities 919 321 1 030 167 1 122 372 1 447 543 1 670 276 2 058 137
Total: Gauteng Municipalities 10 517 865 12 015 434 13 288 601 20 318 422 22 201 143 24 300 002

This gazette is also available free online at www.gpwonline.co.za
36 No. 40913 GOVERNMENT GAZETTE, 12 JUNE 2017
ANNEXURE W7
EQUITABLE SHARE AND TOTAL ALLOCATIONS TO MUNICPALITIES
National and Municipal Financial Year National and Municipal Financial Year 2017/18(R'000)
2018/19(R'000)
2019/20(R'000)
2017/18(R'000)
2018/19(R'000)
2019/20(R'000)
TOTAL ALLOCATIONS TO MUNICIPALITIES
Category Municipality
EQUITABLE SHARE1
KWAZULU-NATAL
A ETH eThekwini 2 582 776 2 902 498 3 183 088 5 721 903 6 064 908 6 541 378
B KZN212 uMdoni 113 579 118 193 121 233 162 551 194 367 203 909B KZN213 uMzumbe 119 070 120 221 119 566 246 872 238 418 243 752B KZN214 uMuziwabantu 79 670 82 268 83 753 110 261 114 011 111 718B KZN216 Ray Nkonyeni 175 566 184 983 191 993 269 876 297 998 306 019C DC21 Ugu District Municipality 411 676 436 655 463 376 715 572 776 888 839 500Total: Ugu Municipalities 899 561 942 320 979 921 1 505 132 1 621 682 1 704 898
B KZN221 uMshwathi 87 377 91 504 94 392 157 527 127 303 133 766B KZN222 uMngeni 54 448 60 089 64 801 85 527 91 562 92 476B KZN223 Mpofana 29 225 31 803 33 407 55 289 66 708 73 687B KZN224 iMpendle 31 475 32 554 33 192 46 680 51 723 53 069B KZN225 Msunduzi 468 430 507 022 544 706 1 018 881 983 874 1 013 553B KZN226 Mkhambathini 51 173 55 191 57 951 80 032 82 330 86 088B KZN227 Richmond 59 253 62 275 64 446 89 291 88 719 94 786C DC22 uMgungundlovu District Municipality 457 680 484 563 526 441 631 287 700 898 757 691Total: uMgungundlovu Municipalities 1 239 061 1 325 001 1 419 336 2 164 514 2 193 117 2 305 116
B KZN235 Okhahlamba 102 863 110 010 114 395 150 416 143 680 150 708B KZN237 iNkosi Langalibalele 143 450 154 726 162 118 213 422 219 419 227 655B KZN238 Alfred Duma 190 231 205 367 215 338 330 592 335 964 342 348C DC23 uThukela District Municipality 361 568 398 405 433 175 737 427 795 644 806 320Total: uThukela Municipalities 798 112 868 508 925 026 1 431 857 1 494 707 1 527 031
B KZN241 eNdumeni 37 228 41 425 44 516 64 548 69 427 73 459B KZN242 Nquthu 115 616 121 634 125 529 203 911 219 669 236 692B KZN244 uMsinga 136 937 144 789 150 233 256 777 210 616 217 639B KZN245 uMvoti 104 498 112 328 118 226 167 594 172 490 170 375C DC24 uMzinyathi District Municipality 291 519 325 764 353 929 668 692 682 212 719 001Total: uMzinyathi Municipalities 685 798 745 940 792 433 1 361 522 1 354 414 1 417 166
B KZN252 Newcastle 318 176 341 372 362 646 591 488 604 080 639 752B KZN253 eMadlangeni 25 391 27 122 28 210 49 714 49 735 55 612B KZN254 Dannhauser 78 831 81 935 83 825 105 532 110 476 113 687C DC25 Amajuba District Municipality 137 965 148 751 159 832 262 807 279 815 303 690Total: Amajuba Municipalities 560 363 599 180 634 513 1 009 541 1 044 106 1 112 741
B KZN261 eDumbe 61 570 65 830 68 538 117 349 119 395 123 656B KZN262 uPhongolo 107 146 118 558 125 240 151 465 161 925 174 420B KZN263 AbaQulusi 117 393 129 314 137 095 201 872 206 681 218 073B KZN265 Nongoma 128 137 135 743 140 597 189 454 226 136 235 343B KZN266 Ulundi 132 566 142 381 148 121 198 292 210 153 211 840C DC26 Zululand District Municipality 382 571 425 804 465 143 1 026 048 942 853 878 415Total: Zululand Municipalities 929 383 1 017 630 1 084 734 1 884 480 1 867 143 1 841 747
B KZN271 uMhlabuyalingana 133 848 144 660 152 220 282 033 354 625 341 014B KZN272 Jozini 146 284 158 617 166 461 414 739 329 346 325 903B KZN275 Mtubatuba 132 131 142 546 150 138 212 723 218 187 226 100B KZN276 Big Five Hlabisa 84 732 93 374 98 617 141 168 154 314 166 078C DC27 uMkhanyakude District Municipality 330 020 375 654 412 729 725 444 676 536 743 019Total: uMkhanyakude Municipalities 827 015 914 851 980 165 1 776 107 1 733 008 1 802 114
B KZN281 uMfolozi 107 114 114 299 119 356 152 799 154 163 166 634B KZN282 uMhlathuze 292 009 326 318 355 898 518 941 520 243 581 657B KZN284 uMlalazi 156 999 164 545 169 641 236 573 263 875 282 002B KZN285 Mthonjaneni 67 317 70 509 72 424 102 091 101 061 110 879B KZN286 Nkandla 82 435 86 214 88 386 133 126 146 410 151 118C DC28 King Cetshwayo District Municipality 453 730 477 540 516 964 814 520 843 396 900 452Total: King Cetshwayo Municipalities 1 159 604 1 239 425 1 322 669 1 958 050 2 029 148 2 192 742
B KZN291 Mandeni 134 192 145 837 154 162 241 695 254 193 291 532B KZN292 KwaDukuza 131 541 147 634 160 991 197 468 226 759 255 238B KZN293 Ndwedwe 118 243 128 677 135 070 224 601 243 038 261 770B KZN294 Maphumulo 75 284 80 395 83 175 189 446 195 973 204 544C DC29 iLembe District Municipality 419 734 469 828 518 484 835 512 876 040 920 960Total: iLembe Municipalities 878 994 972 371 1 051 882 1 688 722 1 796 003 1 934 044
B KZN433 Greater Kokstad 47 250 55 133 58 136 87 860 105 261 124 085B KZN434 uBuhlebezwe 95 443 98 915 101 013 167 735 153 110 161 862B KZN435 uMzimkhulu 160 817 168 285 173 323 282 699 257 815 270 518B KZN436 Dr Nkosazana Dlamini Zuma 101 241 110 135 115 314 153 050 168 955 186 527C DC43 Harry Gwala District Municipality 285 028 318 779 345 521 692 399 755 404 780 852Total: Harry Gwala Municipalities 689 779 751 247 793 307 1 383 743 1 440 545 1 523 844
Total: KwaZulu-Natal Municipalities 11 250 446 12 278 971 13 167 074 21 885 571 22 638 781 23 902 821

This gazette is also available free online at www.gpwonline.co.za
STAATSKOERANT, 12 JUNIE 2017 No. 40913 37
ANNEXURE W7
EQUITABLE SHARE AND TOTAL ALLOCATIONS TO MUNICPALITIES
National and Municipal Financial Year National and Municipal Financial Year 2017/18(R'000)
2018/19(R'000)
2019/20(R'000)
2017/18(R'000)
2018/19(R'000)
2019/20(R'000)
TOTAL ALLOCATIONS TO MUNICIPALITIES
Category Municipality
EQUITABLE SHARE1
LIMPOPO
B LIM331 Greater Giyani 234 578 251 584 262 868 373 988 423 329 422 991B LIM332 Greater Letaba 222 508 242 595 254 930 323 833 331 010 348 264B LIM333 Greater Tzaneen 311 977 336 443 353 706 461 084 508 188 539 475B LIM334 Ba-Phalaborwa 120 392 131 531 139 114 189 325 194 873 220 086B LIM335 Maruleng 99 298 108 493 114 231 149 975 159 314 167 684C DC33 Mopani District Municipality 759 547 843 149 923 013 1 776 336 1 743 286 1 628 856Total: Mopani Municipalities 1 748 300 1 913 795 2 047 862 3 274 541 3 360 000 3 327 356
B LIM341 LIM341 104 327 122 782 133 307 169 063 201 933 226 132B LIM343 LIM343 361 798 388 695 407 408 583 151 559 564 591 137B LIM344 Makhado 294 079 314 649 329 245 438 398 476 504 518 173B LIM345 LIM 345 304 695 325 128 339 170 469 483 422 818 447 994C DC34 Vhembe District Municipality 824 760 913 077 999 217 1 467 060 1 632 765 1 704 526Total: Vhembe Municipalities 1 889 659 2 064 331 2 208 347 3 127 155 3 293 584 3 487 962
B LIM351 Blouberg 161 111 167 031 170 559 260 843 256 077 264 080B LIM353 Molemole 122 614 127 590 130 623 179 973 196 477 201 952B LIM354 Polokwane 752 064 831 889 903 461 1 765 844 2 070 700 2 481 790B LIM355 Lepele-Nkumpi 212 142 221 852 228 112 300 483 302 425 313 135C DC35 Capricorn District Municipality 522 352 548 624 588 367 880 772 939 351 1 031 371Total: Capricorn Municipalities 1 770 283 1 896 986 2 021 122 3 387 915 3 765 030 4 292 328
B LIM361 Thabazimbi 68 976 86 282 93 908 135 230 197 731 228 301B LIM362 Lephalale 109 248 130 420 144 652 281 138 318 152 393 583B LIM366 Bela-Bela 74 939 81 992 88 513 168 842 173 923 201 184B LIM367 Mogalakwena 369 653 394 585 415 836 788 472 921 183 987 042B LIM368 LIM 368 93 384 100 825 107 303 232 710 251 513 299 267C DC36 Waterberg District Municipality 117 373 122 646 127 038 123 388 125 877 131 396Total: Waterberg Municipalities 833 573 916 750 977 250 1 729 780 1 988 379 2 240 773
B LIM471 Ephraim Mogale 123 766 129 255 132 946 189 034 176 242 182 599B LIM472 Elias Motsoaledi 223 019 236 259 245 626 322 326 317 281 344 013B LIM473 Makhuduthamaga 233 368 240 823 244 910 405 631 377 499 389 332B LIM476 LIM 476 333 002 359 356 378 699 513 291 543 950 561 129C DC47 Sekhukhune District Municipality 658 580 713 194 771 374 1 479 880 1 485 845 1 700 771Total: Sekhukhune Municipalities 1 571 735 1 678 887 1 773 555 2 910 162 2 900 817 3 177 844
Total: Limpopo Municipalities 7 813 550 8 470 749 9 028 136 14 429 553 15 307 810 16 526 263
MPUMALANGA
B MP301 Chief Albert Luthuli 254 241 277 989 296 235 401 199 423 596 461 962B MP302 Msukaligwa 134 855 154 428 169 675 235 189 239 908 270 627B MP303 Mkhondo 186 451 209 114 226 372 363 930 363 894 402 738B MP304 Dr Pixley ka Isaka Seme 96 312 107 189 114 486 156 633 150 709 157 890B MP305 Lekwa 93 948 107 311 117 044 166 002 171 826 214 994B MP306 Dipaleseng 58 388 64 426 69 280 105 050 112 944 164 835B MP307 Govan Mbeki 218 181 258 160 286 526 322 261 364 808 431 415C DC30 Gert Sibande District Municipality 278 576 282 338 290 911 411 612 478 095 659 614Total: Gert Sibande Municipalities 1 320 952 1 460 955 1 570 529 2 161 876 2 305 780 2 764 075
B MP311 Victor Khanye 79 745 87 215 94 208 146 011 160 437 149 829B MP312 Emalahleni 288 802 326 821 362 607 499 078 554 821 584 310B MP313 Steve Tshwete 156 759 179 975 201 936 217 750 246 627 286 776B MP314 Emakhazeni 55 222 58 515 61 560 117 383 103 289 113 563B MP315 Thembisile Hani 338 477 363 538 385 423 661 544 675 131 759 384B MP316 Dr JS Moroka 328 528 344 913 358 572 486 259 517 045 540 258C DC31 Nkangala District Municipality 339 056 343 843 354 394 346 663 350 246 357 802Total: Nkangala Municipalities 1 586 589 1 704 820 1 818 700 2 474 688 2 607 596 2 791 922
B MP321 Thaba Chweu 124 393 132 815 140 835 243 596 248 770 279 037B MP324 Nkomazi 483 144 515 601 544 585 807 244 919 717 996 635B MP325 Bushbuckridge 683 632 719 537 750 699 1 350 464 1 375 586 1 445 018B MP326 City of Mbombela 608 678 662 052 712 545 1 392 268 1 365 249 1 490 359C DC32 Ehlanzeni District Municipality 229 690 238 711 246 531 239 529 242 436 250 395Total: Ehlanzeni Municipalities 2 129 537 2 268 716 2 395 195 4 033 101 4 151 758 4 461 444
Total: Mpumalanga Municipalities 5 037 078 5 434 491 5 784 424 8 669 665 9 065 134 10 017 441

This gazette is also available free online at www.gpwonline.co.za
38 No. 40913 GOVERNMENT GAZETTE, 12 JUNE 2017
ANNEXURE W7
EQUITABLE SHARE AND TOTAL ALLOCATIONS TO MUNICPALITIES
National and Municipal Financial Year National and Municipal Financial Year 2017/18(R'000)
2018/19(R'000)
2019/20(R'000)
2017/18(R'000)
2018/19(R'000)
2019/20(R'000)
TOTAL ALLOCATIONS TO MUNICIPALITIES
Category Municipality
EQUITABLE SHARE1
NORTHERN CAPE
B NC061 Richtersveld 14 115 15 455 16 574 37 397 58 900 72 300B NC062 Nama Khoi 40 403 43 940 47 044 72 022 64 720 102 649B NC064 Kamiesberg 19 362 20 714 21 763 34 308 31 076 33 555B NC065 Hantam 21 047 22 830 24 360 96 165 87 019 50 281B NC066 Karoo Hoogland 18 198 20 222 21 775 36 243 66 478 64 736B NC067 Khâi-Ma 16 391 17 411 18 334 33 116 29 566 30 934C DC6 Namakwa District Municipality 38 744 47 106 48 603 43 892 54 752 53 555Total: Namakwa Municipalities 168 260 187 678 198 453 353 143 392 511 408 010
B NC071 Ubuntu 28 192 31 083 33 249 48 155 46 615 47 873B NC072 Umsobomvu 39 760 44 147 47 543 60 316 63 772 64 127B NC073 Emthanjeni 37 094 40 758 43 710 74 172 107 202 72 184B NC074 Kareeberg 20 397 21 975 23 282 66 392 79 241 34 187B NC075 Renosterberg 20 182 22 162 23 589 47 054 53 445 57 298B NC076 Thembelihle 20 915 22 925 24 394 39 040 35 339 37 364B NC077 Siyathemba 27 526 29 807 31 754 51 275 42 632 45 661B NC078 Siyancuma 41 384 45 255 47 871 114 686 90 124 86 623C DC7 Pixley Ka Seme District Municipality 39 862 47 696 49 345 45 115 55 498 54 466Total: Pixley Ka Seme Municipalities 275 312 305 808 324 737 546 205 573 868 499 783
B NC082 !Kai !Garib 63 164 77 174 83 485 112 911 106 312 153 079B NC084 !Kheis 21 454 23 106 24 330 43 097 36 864 47 727B NC085 Tsantsabane 32 206 35 403 38 344 60 916 69 241 78 715B NC086 Kgatelopele 18 974 20 479 21 904 35 205 33 370 48 142B NC087 Dawid Kruiper 70 769 78 081 84 564 195 271 145 311 200 826C DC8 Z.F. Mgcawu District Municipality 55 770 65 988 68 213 60 880 73 113 72 382Total: Z.F. Mgcawu Municipalities 262 337 300 231 320 840 508 280 464 211 600 871
B NC091 Sol Plaatjie 150 982 172 904 189 209 325 245 274 042 343 989B NC092 Dikgatlong 66 982 75 726 81 312 115 599 109 976 117 917B NC093 Magareng 37 698 41 562 44 094 77 422 80 386 133 588B NC094 Phokwane 85 242 94 174 100 096 144 970 155 582 173 181C DC9 Frances Baard District Municipality 112 317 116 144 119 678 117 251 122 903 123 463Total: Frances Baard Municipalities 453 221 500 510 534 389 780 487 742 889 892 138
B NC451 Joe Morolong 121 603 128 209 133 609 240 501 305 024 354 100B NC452 Ga-Segonyana 129 580 141 621 152 362 326 085 355 691 422 226B NC453 Gamagara 28 558 33 116 37 442 88 328 232 541 311 990C DC45 John Taolo Gaetsewe District Municipality 71 799 85 203 88 273 80 865 91 775 95 427Total: John Taolo Gaetsewe Municipalities 351 540 388 149 411 686 735 779 985 031 1 183 743
Total: Northern Cape Municipalities 1 510 670 1 682 376 1 790 105 2 923 894 3 158 510 3 584 545
NORTH WEST
B NW371 Moretele 284 500 305 804 322 408 535 410 594 813 645 066B NW372 Madibeng 567 442 625 845 681 745 1 069 467 1 199 493 1 326 895B NW373 Rustenburg 526 072 607 549 680 253 1 181 642 1 176 970 1 328 931B NW374 Kgetlengrivier 70 879 81 401 88 722 161 072 166 700 161 679B NW375 Moses Kotane 357 438 385 729 408 142 606 159 614 652 656 102C DC37 Bojanala Platinum District Municipality 313 057 321 870 333 726 320 050 325 329 337 325Total: Bojanala Platinum Municipalities 2 119 388 2 328 198 2 514 996 3 873 800 4 077 957 4 455 998
B NW381 Ratlou 102 876 110 675 115 357 148 212 158 620 165 777B NW382 Tswaing 92 403 101 649 107 070 135 304 144 337 151 974B NW383 Mafikeng 198 796 224 700 238 967 306 271 318 623 346 807B NW384 Ditsobotla 98 339 111 601 118 756 162 788 168 605 173 097B NW385 Ramotshere Moiloa 137 639 151 772 159 888 216 076 207 475 216 228C DC38 Ngaka Modiri Molema District Municipality 616 267 698 707 766 482 1 116 573 1 351 640 1 455 102Total: Ngaka Modiri Molema Municipalities 1 246 320 1 399 104 1 506 520 2 085 224 2 349 300 2 508 985
B NW392 Naledi 43 507 47 075 49 602 91 491 85 830 91 318B NW393 Mamusa 47 502 50 036 51 877 93 631 92 421 96 581B NW394 Greater Taung 170 353 175 330 178 014 251 871 252 373 277 471B NW396 Lekwa-Teemane 41 695 44 556 46 677 69 152 70 658 78 698B NW397 Kagisano-Molopo 103 799 108 496 111 421 169 634 183 562 195 136C DC39 Dr Ruth Segomotsi Mompati District Municipality 308 448 338 013 361 371 719 505 759 970 759 068Total: Dr Ruth Segomotsi Mompati Municipalities 715 304 763 506 798 962 1 395 284 1 444 814 1 498 272
B NW403 City of Matlosana 354 377 393 806 427 110 537 968 539 944 580 197B NW404 Maquassi Hills 102 111 115 250 123 571 178 432 151 032 168 249b NW405 Ventersdorp/Tlokwe 209 740 234 327 257 001 342 720 365 684 352 748C DC40 Dr Kenneth Kaunda District Municipality 173 676 179 905 185 575 178 673 186 682 189 283Total: Dr Kenneth Kaunda Municipalities 839 904 923 288 993 257 1 237 793 1 243 342 1 290 477
Total: North West Municipalities 4 920 916 5 414 096 5 813 735 8 592 101 9 115 413 9 753 732

This gazette is also available free online at www.gpwonline.co.za
STAATSKOERANT, 12 JUNIE 2017 No. 40913 39
ANNEXURE W7
EQUITABLE SHARE AND TOTAL ALLOCATIONS TO MUNICPALITIES
National and Municipal Financial Year National and Municipal Financial Year 2017/18(R'000)
2018/19(R'000)
2019/20(R'000)
2017/18(R'000)
2018/19(R'000)
2019/20(R'000)
TOTAL ALLOCATIONS TO MUNICIPALITIES
Category Municipality
EQUITABLE SHARE1
WESTERN CAPE
A CPT City of Cape Town 2 292 908 2 582 306 2 835 569 4 951 527 5 123 099 5 554 474
B WC011 Matzikama 47 561 52 454 56 696 85 131 98 214 120 046B WC012 Cederberg 40 873 45 113 48 716 89 405 102 347 106 422B WC013 Bergrivier 37 144 41 503 45 359 55 022 62 234 67 972B WC014 Saldanha Bay 71 511 80 637 88 800 101 939 105 850 117 977B WC015 Swartland 70 560 82 301 92 184 99 238 107 298 118 315C DC1 West Coast District Municipality 84 972 88 303 91 217 89 875 95 142 100 086Total: West Coast Municipalities 352 621 390 311 422 972 520 610 571 085 630 818
B WC022 Witzenberg 70 412 84 872 93 510 109 558 126 383 147 189B WC023 Drakenstein 120 821 137 935 151 671 165 901 182 530 196 842B WC024 Stellenbosch 110 631 124 544 137 145 164 595 178 396 199 048B WC025 Breede Valley 98 097 109 299 118 836 157 410 172 847 175 885B WC026 Langeberg 65 384 73 248 79 403 107 102 99 198 106 486C DC2 Cape Winelands District Municipality 222 739 225 200 231 860 227 672 232 255 235 957Total: Cape Winelands Municipalities 688 084 755 098 812 425 932 238 991 609 1 061 407
B WC031 Theewaterskloof 77 911 87 508 95 078 113 991 129 299 143 584B WC032 Overstrand 84 223 96 165 105 986 114 403 125 119 143 074B WC033 Cape Agulhas 25 190 27 645 29 808 39 989 42 977 51 255B WC034 Swellendam 26 201 29 045 31 507 43 259 46 291 53 457C DC3 Overberg District Municipality 57 286 67 781 70 043 62 321 74 621 73 911Total: Overberg Municipalities 270 811 308 144 332 422 373 963 418 307 465 281
B WC041 Kannaland 24 023 25 909 27 321 58 487 112 012 136 572B WC042 Hessequa 37 497 40 959 44 087 54 893 58 992 63 703B WC043 Mossel Bay 78 472 85 985 92 943 114 777 121 791 147 061B WC044 George 122 613 137 809 151 044 411 060 256 042 257 438B WC045 Oudtshoorn 62 683 67 877 72 405 102 206 122 885 152 048B WC047 Bitou 74 039 82 976 91 226 121 279 114 067 130 204B WC048 Knysna 70 833 78 409 85 140 112 206 120 632 128 698C DC4 Eden District Municipality 146 055 151 130 155 816 151 005 157 917 159 630Total: Eden Municipalities 616 215 671 054 719 982 1 125 913 1 064 338 1 175 354
B WC051 Laingsburg 13 572 14 948 15 908 25 095 28 290 31 589B WC052 Prince Albert 17 652 19 274 20 588 28 961 32 770 39 256B WC053 Beaufort West 51 060 56 567 60 766 74 559 84 060 113 156C DC5 Central Karoo District Municipality 22 599 28 426 29 394 26 861 34 667 32 626Total: Central Karoo Municipalities 104 883 119 215 126 656 155 476 179 787 216 627
Total: Western Cape Municipalities 4 325 522 4 826 128 5 250 026 8 059 727 8 348 225 9 103 961
Unallocated 300 281 2 716 476 2 876 465
National Total 57 012 141 62 731 845 67 473 465 108 076 937 116 596 955 125 324 4721. Includes equitable share formula allocations, RSC levies replacement and special contribution towards councillor remuneration, but excludes the sharing of the general fuel levy with metropolitan municipalities. (See Appendix W1)

This gazette is also available free online at www.gpwonline.co.za
40 No. 40913 GOVERNMENT GAZETTE, 12 JUNE 2017
APP
EN
DIX
W1
APP
END
IX T
O S
CH
EDU
LE
3: E
QU
ITA
BLE
SH
AR
E A
LLO
CA
TIO
NS
TO M
UN
ICIP
AL
ITIE
S
(Nat
iona
l and
Mun
icip
al F
inan
cial
Yea
rs)
(EQ
UIT
AB
LE S
HA
RE
FO
RM
UL
A A
LLO
CA
TIO
NS
+ R
SC L
EVIE
S R
EPL
AC
EM
EN
T +
SPE
CIA
L SU
PPO
RT
FO
R C
OU
NC
ILLO
R
RE
MU
NER
ATI
ON
AN
D W
AR
D C
OM
MIT
TE
ES
+ B
RE
AK
DO
WN
OF
EQ
UIT
AB
LE S
HA
RE
AL
LOC
ATI
ON
S PE
R L
OC
AL
MU
NIC
PAL
ITY
PE
R S
ER
VIC
E F
OR
DIS
TR
ICT
MU
NIC
IPL
ITIE
S A
UT
HO
RIS
ED F
OR
SER
VIC
ES)

This gazette is also available free online at www.gpwonline.co.za
STAATSKOERANT, 12 JUNIE 2017 No. 40913 41A
PPEN
DIX
W1
APP
END
IX T
O S
CH
EDU
LE 3
: EQ
UIT
ABL
E SH
AR
E A
LLO
CA
TIO
NS
TO M
UN
ICIP
ALI
TIES
Nat
iona
l and
Mun
icip
al F
inan
cial
Yea
rN
atio
nal a
nd M
unic
ipal
Fin
anci
al Y
ear
Nat
iona
l and
Mun
icip
al F
inan
cial
Yea
rN
atio
nal a
nd M
unic
ipal
Fin
anci
al Y
ear
Nat
iona
l and
Mun
icip
al F
inan
cial
Yea
rN
atio
nal a
nd M
unic
ipal
Fin
anci
al Y
ear
Wat
er
San
itatio
n R
efus
e W
ater
S
anita
tion
Ref
use
Wat
er
San
itatio
n R
efus
e 2
017/
18(R
'000
) 2
018/
19 (R
'000
) 2
019/
20 (R
'000
)
EAST
ERN
CA
PE
A
BUF
Buf
falo
City
705
277
779
473
841
980
AN
MA
Nel
son
Man
dela
Bay
844
287
942
772
1 02
8 92
2
BEC
101
Dr B
eyer
s Nau
de72
163
77 6
0782
177
5 33
15
596
5 86
2B
EC10
2 B
lue C
rane
Rou
te43
382
46 4
8448
876
2 31
82
433
2 55
0B
EC10
4 M
akan
a74
238
79 9
3484
889
5 33
15
596
5 86
2B
EC10
5 N
dlam
be78
157
84 0
6989
318
3 92
74
123
4 32
0B
EC10
6 S
unda
ys R
iver
Val
ley
62 2
2668
635
74 1
623
141
3 29
83
456
BEC
108
Kou
ga96
913
107
269
116
958
5 72
46
008
6 29
4B
EC10
9 K
ou-K
amm
a40
057
42 9
6945
540
2 31
82
433
2 55
0C
DC1
0Sa
rah
Baar
tman
Dist
rict M
unic
ipal
ity22
641
24 0
9725
048
62 1
8464
080
65 9
64To
tal:
Sara
h Ba
artm
an M
unic
ipal
ities
489
777
531
064
566
968
62 1
8464
080
65 9
6428
090
29 4
8730
894
BEC
121
Mbh
ashe
205
626
211
457
214
193
12 3
9913
017
13 6
3971
024
55 0
5969
748
52 6
9276
297
56 1
11B
EC12
2 M
nqum
a21
4 95
622
0 61
422
3 04
812
173
12 7
8113
393
74 2
1557
533
72 9
8755
138
79 5
5658
507
BEC
123
Gre
at K
ei32
263
34 9
3536
325
2 73
42
870
3 00
88
104
6 28
29
572
7 23
110
403
7 65
0B
EC12
4 A
mah
lath
i89
556
90 6
5290
372
5 89
06
184
6 48
029
598
22 9
4527
494
20 7
7129
881
21 9
76B
EC12
6 N
gqus
hwa
69 0
6970
446
70 7
624
546
4 77
14
998
21 8
4016
931
20 7
3915
667
22 5
3916
576
BEC
129
Ray
mon
d M
hlab
a14
0 34
414
5 87
014
8 96
29
031
9 48
39
937
45 5
5035
311
46 3
0134
978
50 6
8737
276
CD
C12
Am
atho
le D
istric
t Mun
icip
ality
425
482
445
243
467
460
331
650
341
764
371
903
Tota
l: A
mat
hole
Mun
icip
aliti
es1
177
296
1 21
9 21
71
251
122
331
650
341
764
371
903
46 7
7349
106
51 4
5525
0 33
119
4 06
124
6 84
118
6 47
726
9 36
319
8 09
6
BEC
131
Inxu
ba Y
ethe
mba
34 1
7035
726
36 8
033
534
3 71
13
888
16 4
3812
743
16 5
1312
475
18 1
7713
368
BEC
135
Intsi
ka Y
ethu
139
087
138
980
136
298
8 24
68
658
9 07
349
088
38 0
5443
398
32 7
8547
166
34 6
87B
EC13
6 E
mal
ahle
ni10
9 31
710
8 75
910
5 76
96
675
7 00
97
344
37 8
8229
366
32 4
1624
489
35 3
1025
968
BEC
137
Eng
cobo
125
966
127
292
126
659
8 14
28
551
8 96
343
379
33 6
2839
931
30 1
6643
515
32 0
02B
EC13
8 S
akhi
sizw
e56
225
57 9
4158
796
3 36
83
535
3 70
217
059
13 2
2416
741
12 6
4718
268
13 4
35B
EC13
9 E
noch
Mgi
jima
160
117
164
355
166
282
69 6
6454
005
66 7
5050
426
73 4
0153
981
CD
C13
Chr
is H
ani D
istric
t Mun
icip
ality
435
093
446
411
457
297
72 3
6678
986
85 9
52To
tal:
Chr
is H
ani M
unic
ipal
ities
1 05
9 97
51
079
464
1 08
7 90
472
366
78 9
8685
952
29 9
6531
464
32 9
7023
3 51
018
1 02
021
5 74
916
2 98
823
5 83
717
3 44
1
BEC
141
Elu
ndin
i12
7 44
113
0 94
013
2 56
96
675
7 00
97
344
45 1
7935
023
43 8
5733
132
48 1
2835
394
BEC
142
Sen
qu12
6 15
312
9 02
913
0 05
86
675
7 00
97
344
44 1
6734
239
42 3
9432
027
46 4
0534
128
BEC
145
Wal
ter S
isulu
44 4
5447
707
50 0
864
576
4 80
75
039
20 9
8016
264
22 4
5416
963
24 9
7818
370
CD
C14
Joe G
qabi
Dist
rict M
unic
ipal
ity21
3 54
822
4 36
923
6 03
925
612
34 3
8837
421
Tota
l: Jo
e Gqa
bi M
unic
ipal
ities
511
596
532
045
548
752
25 6
1234
388
37 4
2117
926
18 8
2519
727
110
326
85 5
2610
8 70
582
122
119
511
87 8
92
BEC
153
Ngq
uza H
ill19
7 72
821
2 67
722
1 48
512
399
13 0
1713
639
64 4
6049
971
71 8
2554
261
79 3
8258
380
BEC
154
Por
t St J
ohns
118
085
126
608
131
651
7 68
78
070
8 45
437
964
29 4
3042
027
31 7
4946
357
34 0
92B
EC15
5 N
yand
eni
210
849
220
290
226
030
12 3
9913
017
13 6
3973
038
56 6
2174
883
56 5
7182
408
60 6
05B
EC15
6 M
hlon
tlo14
9 33
615
4 47
515
7 03
410
043
10 5
4411
047
48 9
1737
922
49 4
4037
350
53 7
3239
516
BEC
157
Kin
g Sa
bata
Dal
indy
ebo
267
710
290
205
304
787
110
515
85 6
7312
3 06
192
967
136
613
100
469
CD
C15
O.R
. Tam
bo D
istric
t Mun
icip
ality
646
328
704
086
759
714
81 9
4289
439
97 3
26To
tal:
O.R
.Tam
bo M
unic
ipal
ities
1 59
0 03
61
708
341
1 80
0 70
181
942
89 4
3997
326
42 5
2844
648
46 7
7933
4 89
425
9 61
736
1 23
627
2 89
839
8 49
229
3 06
2
BEC
441
Mat
atie
le17
5 76
519
4 85
820
4 19
010
043
10 5
4411
047
56 9
7144
165
68 5
9051
817
75 8
3455
771
BEC
442
Um
zim
vubu
164
800
180
146
187
738
10 4
3610
956
11 4
7951
978
40 2
9461
065
46 1
3267
087
49 3
37B
EC44
3 M
biza
na18
5 50
821
4 44
522
4 68
912
173
12 7
8113
393
55 1
6942
768
73 4
1755
463
81 6
8360
072
BEC
444
Nta
bank
ulu
92 5
4110
0 43
510
4 27
97
072
7 42
97
788
27 2
8521
152
31 8
8924
090
34 8
2625
612
CD
C44
Alfr
ed N
zo D
istric
t Mun
icip
ality
395
113
457
264
497
939
42 4
7354
661
59 4
81To
tal:
Alfr
ed N
zo M
unic
ipal
ities
1 01
3 72
71
147
148
1 21
8 83
542
473
54 6
6159
481
39 7
2441
710
43 7
0719
1 40
314
8 37
923
4 96
117
7 50
225
9 43
019
0 79
2
Tota
l: Ea
ster
n C
ape M
unic
ipal
ities
7 39
1 97
17
939
524
8 34
5 18
461
6 22
766
3 31
871
8 04
720
5 00
621
5 24
022
5 53
21
120
464
868
603
1 16
7 49
288
1 98
71
282
633
943
283
201
8/19
(R'0
00)
201
9/20
(R'0
00)
201
7/18
(R'0
00)
201
8/19
(R'0
00)
201
9/20
(R'0
00)
Cat
egor
yM
unic
ipal
ity
(EQ
UIT
ABL
E SH
AR
E FO
RM
ULA
ALL
OC
ATI
ON
S +
RSC
LEV
IES
REP
LAC
EMEN
T +
SPEC
IAL
SUPP
OR
T FO
R C
OU
NC
ILLO
R R
EMU
NER
ATI
ON
AN
D W
AR
D C
OM
MIT
TEES
+ B
REA
KD
OW
N O
F EQ
UIT
ABL
E SH
AR
E A
LLO
CA
TIO
NS
PER
LO
CA
L M
UN
ICPA
LITY
PER
SER
VIC
E FO
R D
ISTR
ICT
MU
NIC
IPLI
TIES
AU
THO
RIS
ED F
OR
SER
VIC
ES)
Equi
tabl
e Sha
re F
orm
ula
RSC
Lev
ies R
epla
cem
ent
Spec
ial S
uppo
rt fo
r Cou
ncill
or R
emun
erat
ion
and
War
d C
omm
ittee
sBR
EAK
DO
WN
OF
EQU
ITA
BLE
SHA
RE
FOR
DIS
TRIC
T M
UN
ICIP
ALI
TIES
AU
THO
RIS
ED F
OR
SER
VIC
ES
201
7/18
(R'0
00)
201
8/19
(R'0
00)
201
9/20
(R'0
00)
201
7/18
(R'0
00)

This gazette is also available free online at www.gpwonline.co.za
42 No. 40913 GOVERNMENT GAZETTE, 12 JUNE 2017AP
PEND
IX W
1
APPE
NDIX
TO
SCH
EDUL
E 3:
EQ
UITA
BLE
SHAR
E AL
LOCA
TIO
NS T
O M
UNIC
IPAL
ITIE
S
Natio
nal a
nd M
unici
pal F
inan
cial Y
ear
Natio
nal a
nd M
unici
pal F
inan
cial Y
ear
Natio
nal a
nd M
unici
pal F
inan
cial Y
ear
Natio
nal a
nd M
unici
pal F
inan
cial Y
ear
Natio
nal a
nd M
unici
pal F
inan
cial Y
ear
Natio
nal a
nd M
unici
pal F
inan
cial Y
ear
Wat
er
San
itatio
n R
efus
e W
ater
S
anita
tion
Ref
use
Wat
er
San
itatio
n R
efus
e 20
17/1
8(R'
000)
20
18/1
9 (R'
000)
20
19/2
0 (R'
000)
20
18/1
9(R
'000)
20
19/2
0(R
'000)
20
17/1
8(R
'000)
20
18/1
9(R
'000)
20
19/2
0(R
'000)
Ca
tego
ryM
unici
palit
y
(EQ
UITA
BLE
SHAR
E FO
RMUL
A AL
LOCA
TIO
NS +
RSC
LEV
IES
REPL
ACEM
ENT
+ SP
ECIA
L SU
PPO
RT F
OR
COUN
CILL
OR
REM
UNER
ATIO
N AN
D W
ARD
COM
MIT
TEES
+ B
REAK
DOW
N O
F EQ
UITA
BLE
SHAR
E AL
LOCA
TIO
NS P
ER L
OCA
L M
UNIC
PALI
TY P
ER S
ERVI
CE F
OR
DIST
RICT
M
UNIC
IPLI
TIES
AUT
HO
RISE
D FO
R SE
RVIC
ES)
Equi
tabl
e Sha
re F
orm
ula
RSC
Levi
es R
epla
cem
ent
Spec
ial S
uppo
rt fo
r Cou
ncill
or R
emun
erat
ion
and
War
d Co
mm
ittee
sBR
EAK
DOW
N O
F EQ
UITA
BLE
SHAR
E FO
R DI
STRI
CT M
UNIC
IPAL
ITIE
S AU
THO
RISE
D FO
R SE
RVIC
ES
2017
/18
(R'00
0)
2018
/19
(R'00
0)
2019
/20
(R'00
0)
2017
/18
(R'00
0)
FREE
STA
TE
AM
ANM
anga
ung
630 9
0868
5 968
741 0
97
BFS
161
Lets
emen
g46
871
55 46
659
233
2 318
2 433
2 550
BFS
162
Kop
anon
g64
180
74 27
279
171
3 150
3 307
3 466
BFS
163
Moh
okar
e53
737
59 17
363
459
2 318
2 433
2 550
CDC
16 X
harie
p Dist
rict M
unici
palit
y15
572
16 75
917
426
15 07
420
841
21 45
42 6
612 8
182 9
76To
tal:
Xhar
iep M
unici
palit
ies18
0 360
205 6
7021
9 289
15 07
420
841
21 45
410
447
10 99
111
542
BFS
181
Mas
ilony
ana
86 05
410
2 868
109 6
583 7
603 9
474 1
34B
FS18
2 T
okol
ogo
42 61
047
506
50 72
21 6
641 7
481 8
32B
FS18
3 T
swelo
pele
56 55
263
473
67 69
73 1
503 3
073 4
66B
FS18
4 M
atjha
beng
393 6
3145
9 418
498 5
37B
FS18
5 N
ala95
412
105 7
4411
2 224
4 712
4 948
5 184
CDC
18 L
ejwele
putsw
a Dist
rict M
unici
palit
y30
602
33 48
735
067
84 87
087
458
90 02
9To
tal:
Lejw
elepu
tswa M
unici
palit
ies70
4 861
812 4
9687
3 905
84 87
087
458
90 02
913
286
13 95
014
616
BFS
191
Sets
oto
151 1
4716
6 760
178 3
726 5
096 8
337 1
58B
FS19
2 D
ihlab
eng
129 7
6414
7 888
161 2
56B
FS19
3 N
keto
ana
76 34
683
719
89 82
03 5
343 7
113 8
88B
FS19
4 M
aluti-
a-Pho
fung
493 7
6853
7 563
573 3
26B
FS19
5 P
hume
lela
58 45
364
626
69 17
23 1
503 3
073 4
66B
FS19
6 M
antso
pa64
946
71 16
576
138
3 368
3 535
3 702
CDC
19 T
habo
Mof
utsan
yana
Dist
rict M
unici
palit
y44
989
48 33
550
466
56 92
058
655
60 38
0To
tal:
Thab
o Mof
utsa
nyan
a Mun
icipa
lities
1 019
413
1 120
056
1 198
550
56 92
058
655
60 38
016
561
17 38
618
214
BFS
201
Moq
haka
164 0
9218
5 011
200 2
51B
FS20
3 N
gwath
e16
0 606
174 2
0018
6 068
BFS
204
Mets
imah
olo
142 7
0916
3 582
181 2
67B
FS20
5 M
afube
75 09
482
589
88 55
93 3
683 5
353 7
02C
DC20
Fez
ile D
abi D
istric
t Mun
icipa
lity
8 409
9 073
9 504
135 9
1214
0 057
144 1
74To
tal:
Fezil
e Dab
i Mun
icipa
lities
550 9
1061
4 455
665 6
4913
5 912
140 0
5714
4 174
3 368
3 535
3 702
Tota
l: Fr
ee S
tate
Mun
icipa
lities
3 086
452
3 438
645
3 698
490
292 7
7630
7 011
316 0
3743
662
45 86
248
074
GAUT
ENG
AEK
UEk
urhu
leni
2 719
861
3 154
062
3 503
013
AJH
BCi
ty of
Joha
nnes
burg
3 666
637
4 241
872
4 722
485
ATS
HCi
ty of
Tsh
wane
2 132
788
2 404
666
2 661
272
B
GT42
1 E
mfule
ni63
3 240
709 0
7677
2 614
BGT
422
Mid
vaal
80 59
291
430
101 5
455 7
246 0
086 2
94B
GT42
3 L
esed
i99
818
114 0
2912
6 599
5 105
5 360
5 616
CDC
42 S
edib
eng D
istric
t Mun
icipa
lity
18 68
920
211
21 22
523
6 090
238 5
5324
5 566
Tota
l: Se
dibe
ng M
unici
palit
ies83
2 339
934 7
461 0
21 98
323
6 090
238 5
5324
5 566
10 82
911
368
11 91
0
BGT
481
Mog
ale C
ity32
3 938
370 8
4341
0 961
BGT
484
Mer
afong
City
163 0
8418
6 186
203 8
51B
GT48
5 R
and W
est C
ity23
9 112
275 3
3530
3 044
CDC
48 W
est R
and D
istric
t Mun
icipa
lity
31 60
834
538
36 45
216
1 579
163 2
6516
8 064
Tota
l: W
est R
and
Mun
icipa
lities
757 7
4286
6 902
954 3
0816
1 579
163 2
6516
8 064
Tota
l: Ga
uten
g Mun
icipa
lities
10 10
9 367
11 60
2 248
12 86
3 061
397 6
6940
1 818
413 6
3010
829
11 36
811
910

This gazette is also available free online at www.gpwonline.co.za
STAATSKOERANT, 12 JUNIE 2017 No. 40913 43A
PPEN
DIX
W1
APP
END
IX T
O S
CH
EDU
LE 3
: EQ
UIT
AB
LE S
HA
RE
ALL
OC
ATI
ON
S TO
MU
NIC
IPA
LITI
ES
Nat
iona
l and
Mun
icip
al F
inan
cial
Yea
rN
atio
nal a
nd M
unic
ipal
Fin
anci
al Y
ear
Nat
iona
l and
Mun
icip
al F
inan
cial
Yea
rN
atio
nal a
nd M
unic
ipal
Fin
anci
al Y
ear
Nat
iona
l and
Mun
icip
al F
inan
cial
Yea
rN
atio
nal a
nd M
unic
ipal
Fin
anci
al Y
ear
Wat
er
San
itatio
n R
efus
e W
ater
S
anita
tion
Ref
use
Wat
er
San
itatio
n R
efus
e 2
017/
18(R
'000
) 2
018/
19 (R
'000
) 2
019/
20 (R
'000
) 2
018/
19(R
'000
) 2
019/
20(R
'000
) 2
017/
18(R
'000
) 2
018/
19(R
'000
) 2
019/
20(R
'000
) C
ateg
ory
Mun
icip
ality
(EQ
UIT
AB
LE S
HA
RE
FOR
MU
LA A
LLO
CA
TIO
NS
+ R
SC L
EVIE
S R
EPLA
CEM
ENT
+ SP
ECIA
L SU
PPO
RT
FOR
CO
UN
CIL
LOR
REM
UN
ERA
TIO
N A
ND
WA
RD
CO
MM
ITTE
ES +
BR
EAK
DO
WN
OF
EQU
ITA
BLE
SH
AR
E A
LLO
CA
TIO
NS
PER
LO
CA
L M
UN
ICPA
LITY
PER
SER
VIC
E FO
R D
ISTR
ICT
MU
NIC
IPLI
TIES
AU
THO
RIS
ED F
OR
SER
VIC
ES)
Equi
tabl
e Sh
are
Form
ula
RSC
Lev
ies R
epla
cem
ent
Spec
ial S
uppo
rt fo
r C
ounc
illor
Rem
uner
atio
n an
d W
ard
Com
mitt
ees
BR
EAK
DO
WN
OF
EQU
ITA
BLE
SH
AR
E FO
R D
ISTR
ICT
MU
NIC
IPA
LITI
ES A
UTH
OR
ISED
FO
R S
ERV
ICES
201
7/18
(R'0
00)
201
8/19
(R'0
00)
201
9/20
(R'0
00)
201
7/18
(R'0
00)
KW
AZU
LU-N
ATA
L
AET
HeT
hekw
ini
2 58
2 77
62
902
498
3 18
3 08
8
B
KZN
212
uMdo
ni10
6 28
511
0 53
611
3 21
17
294
7 65
78
022
37 6
6429
198
36 9
7927
936
41 2
6330
346
BK
ZN21
3uM
zum
be11
0 92
811
1 67
011
0 60
38
142
8 55
18
963
35 9
9227
901
32 6
8724
694
35 5
2526
126
BK
ZN21
4uM
uziw
aban
tu75
743
78 1
4579
433
3 92
74
123
4 32
025
122
19 4
7524
431
18 4
5626
947
19 8
17B
KZN
216
Ray
Nko
nyen
i17
5 56
618
4 98
319
1 99
383
967
65 0
9284
112
63 5
4394
467
69 4
74C
DC2
1U
gu D
istric
t Mun
icip
ality
342
776
361
451
381
540
68 9
0075
204
81 8
36To
tal:
Ugu
Mun
icip
aliti
es81
1 29
884
6 78
587
6 78
068
900
75 2
0481
836
19 3
6320
331
21 3
0518
2 74
514
1 66
617
8 20
913
4 62
919
8 20
214
5 76
3
BK
ZN22
1 u
Msh
wat
hi82
046
85 9
0888
530
5 33
15
596
5 86
231
573
24 4
7631
879
24 0
8335
387
26 0
24B
KZN
222
uM
ngen
i49
902
55 3
1859
803
4 54
64
771
4 99
829
413
22 8
0232
476
24 5
3437
045
27 2
44B
KZN
223
Mpo
fana
27 3
2329
807
31 3
161
902
1 99
62
091
9 73
17
544
11 1
678
436
12 3
379
073
BK
ZN22
4 iM
pend
le29
876
30 8
7531
432
1 59
91
679
1 76
08
585
6 65
58
392
6 34
09
144
6 72
5B
KZN
225
Msu
nduz
i46
8 43
050
7 02
254
4 70
6B
KZN
226
Mkh
amba
thin
i48
424
52 3
0554
927
2 74
92
886
3 02
415
401
11 9
3917
015
12 8
5419
055
14 0
13B
KZN
227
Ric
hmon
d56
504
59 3
8961
422
2 74
92
886
3 02
419
473
15 0
9519
624
14 8
2521
985
16 1
68C
DC2
2 u
Mgu
ngun
dlov
u D
istric
t Mun
icip
ality
221
842
241
533
261
979
235
838
243
030
264
462
Tota
l: uM
gung
undl
ovu
Mun
icip
aliti
es98
4 34
71
062
157
1 13
4 11
523
5 83
824
3 03
026
4 46
218
876
19 8
1420
759
114
176
88 5
1112
0 55
391
072
134
953
99 2
47
BK
ZN23
5 O
khah
lam
ba97
139
104
002
108
101
5 72
46
008
6 29
430
491
23 6
3733
649
25 4
2037
100
27 2
84B
KZN
237
iNko
si La
ngal
ibal
ele
134
419
145
243
152
181
9 03
19
483
9 93
745
261
35 0
8750
397
38 0
7356
172
41 3
10B
KZN
238
Alfr
ed D
uma
190
231
205
367
215
338
79 2
6461
447
87 5
9766
176
97 0
6971
387
CD
C23
uTh
ukel
a D
istric
t Mun
icip
ality
304
535
336
327
365
805
51 7
1056
441
61 4
185
323
5 63
75
952
Tota
l: uT
huke
la M
unic
ipal
ities
726
324
790
939
841
425
51 7
1056
441
61 4
1820
078
21 1
2822
183
155
016
120
171
171
643
129
669
190
341
139
981
BK
ZN24
1 e
Ndu
men
i34
646
38 7
1541
678
2 58
22
710
2 83
816
390
12 7
0618
904
14 2
8121
471
15 7
91B
KZN
242
Nqu
thu
109
107
114
801
118
371
6 50
96
833
7 15
834
853
27 0
1936
426
27 5
1840
186
29 5
54B
KZN
244
uM
singa
129
449
136
923
141
987
7 48
87
866
8 24
644
345
34 3
7746
404
35 0
5651
631
37 9
71B
KZN
245
uM
voti
99 1
6710
6 73
211
2 36
45
331
5 59
65
862
36 9
3628
633
39 5
9429
912
44 7
3032
895
CD
C24
uM
ziny
athi
Dist
rict M
unic
ipal
ity25
7 69
428
1 50
230
5 76
333
825
44 2
6248
166
Tota
l: uM
ziny
athi
Mun
icip
aliti
es63
0 06
367
8 67
372
0 16
333
825
44 2
6248
166
21 9
1023
005
24 1
0413
2 52
410
2 73
514
1 32
810
6 76
715
8 01
811
6 21
1
BK
ZN25
2 N
ewca
stle
318
176
341
372
362
646
BK
ZN25
3 e
Mad
lang
eni
23 0
7324
689
25 6
602
318
2 43
32
550
5 72
24
436
6 34
24
791
6 98
15
134
BK
ZN25
4 D
annh
ause
r73
893
76 7
5178
395
4 93
85
184
5 43
022
174
17 1
9022
266
16 8
2124
453
17 9
83C
DC2
5 A
maj
uba
Dist
rict M
unic
ipal
ity66
837
71 1
1675
351
71 1
2877
635
84 4
81To
tal:
Am
ajub
a M
unic
ipal
ities
481
979
513
928
542
052
71 1
2877
635
84 4
817
256
7 61
77
980
27 8
9621
626
28 6
0821
612
31 4
3423
117
B
KZN
261
eD
umbe
58 4
2962
532
65 0
823
141
3 29
83
456
17 5
8713
634
19 2
9214
574
21 3
3415
689
BK
ZN26
2 u
Phon
golo
101
422
112
550
118
946
5 72
46
008
6 29
432
492
25 1
8838
647
29 1
9643
305
31 8
48B
KZN
263
Aba
Qul
usi
117
393
129
314
137
095
46 3
9835
969
53 3
1140
274
59 7
9743
976
BK
ZN26
5 N
ongo
ma
119
891
127
085
131
524
8 24
68
658
9 07
335
679
27 6
5938
179
28 8
4242
219
31 0
49B
KZN
266
Ulu
ndi
123
308
132
662
137
938
9 25
89
719
10 1
8334
303
26 5
9338
619
29 1
7542
669
31 3
80C
DC2
6 Z
ulul
and
Dist
rict M
unic
ipal
ity33
0 28
136
8 73
040
3 03
652
290
57 0
7462
107
Tota
l: Zu
lula
nd M
unic
ipal
ities
850
724
932
873
993
621
52 2
9057
074
62 1
0726
369
27 6
8329
006
166
459
129
043
188
048
142
061
209
324
153
942
BK
ZN27
1 u
Mhl
abuy
alin
gana
126
946
137
415
144
630
6 90
27
245
7 59
042
354
32 8
3446
748
35 3
1652
621
38 6
99B
KZN
272
Jozi
ni13
8 43
115
0 37
115
7 82
17
853
8 24
68
640
44 4
0134
420
50 1
7637
906
56 0
1041
191
BK
ZN27
5 M
tuba
tuba
124
278
134
300
141
498
7 85
38
246
8 64
039
653
30 7
4043
238
32 6
6449
036
36 0
62B
KZN
276
Big
Fiv
e H
labi
sa79
502
87 8
8292
861
5 23
05
492
5 75
623
007
17 8
3627
203
20 5
5130
617
22 5
17C
DC2
7 u
Mkh
anya
kude
Dist
rict M
unic
ipal
ity29
5 57
533
0 64
536
3 75
134
445
45 0
0948
978
Tota
l: uM
khan
yaku
de M
unic
ipal
ities
764
732
840
613
900
561
34 4
4545
009
48 9
7827
838
29 2
2930
626
149
415
115
830
167
365
126
437
188
284
138
469
B
KZN
281
uM
folo
zi10
0 22
010
7 05
911
1 76
76
894
7 24
07
589
30 3
2323
507
32 4
4224
509
36 4
4326
801
BK
ZN28
2 u
Mhl
athu
ze29
2 00
932
6 31
835
5 89
8B
KZN
284
uM
lala
zi14
6 39
715
3 41
315
7 97
610
602
11 1
3211
665
48 9
8837
977
49 9
9637
770
55 5
0040
816
BK
ZN28
5 M
thon
jane
ni62
087
65 0
1766
668
5 23
05
492
5 75
616
858
13 0
6817
562
13 2
6819
184
14 1
08B
KZN
286
Nka
ndla
77 1
0480
618
82 5
245
331
5 59
65
862
22 3
0817
293
23 3
2317
620
25 3
7218
659
CD
C28
Kin
g Ce
tshw
ayo
Dist
rict M
unic
ipal
ity21
1 98
722
8 42
524
5 88
124
1 74
324
9 11
527
1 08
3To
tal:
Kin
g C
etsh
way
o M
unic
ipal
ities
889
804
960
850
1 02
0 71
424
1 74
324
9 11
527
1 08
328
057
29 4
6030
872
118
477
91 8
4512
3 32
393
167
136
499
100
384
BK
ZN29
1 M
ande
ni12
7 29
013
8 59
214
6 57
26
902
7 24
57
590
45 0
3534
912
50 0
3537
799
56 5
3841
580
BK
ZN29
2 K
waD
ukuz
a13
1 54
114
7 63
416
0 99
177
766
60 2
8587
473
66 0
8210
0 58
173
970
BK
ZN29
3 N
dwed
we
110
517
120
563
126
565
7 72
68
114
8 50
533
539
26 0
0038
564
29 1
3343
034
31 6
48B
KZN
294
Map
hum
ulo
70 9
6575
860
78 4
234
319
4 53
54
752
21 3
1416
523
23 8
0217
981
25 9
4019
077
CD
C29
iLem
be D
istric
t Mun
icip
ality
341
227
384
139
425
238
78 5
0785
689
93 2
46To
tal:
iLem
be M
unic
ipal
ities
781
540
866
788
937
789
78 5
0785
689
93 2
4618
947
19 8
9420
847
177
654
137
720
199
874
150
995
226
093
166
275
BK
ZN43
3 G
reat
er K
oksta
d43
490
51 1
8654
002
3 76
03
947
4 13
417
310
13 4
1923
261
17 5
7225
852
19 0
12B
KZN
434
uBu
hleb
ezw
e90
112
93 3
1995
151
5 33
15
596
5 86
229
402
22 7
9329
121
22 0
0032
060
23 5
78B
KZN
435
uM
zim
khul
u15
2 34
515
9 39
116
4 00
48
472
8 89
49
319
52 9
5341
050
53 6
6340
540
59 5
9843
830
BK
ZN43
6 D
r Nko
saza
na D
lam
ini Z
uma
95 1
7910
3 76
910
8 64
16
062
6 36
66
673
29 2
7722
696
33 8
2825
555
37 4
9127
572
CD
C43
Har
ry G
wal
a D
istric
t Mun
icip
ality
254
200
278
120
301
276
30 8
2840
659
44 2
45To
tal:
Har
ry G
wal
a M
unic
ipal
ities
635
326
685
785
723
074
30 8
2840
659
44 2
4523
625
24 8
0325
988
128
942
99 9
5813
9 87
310
5 66
715
5 00
111
3 99
2
Tota
l: K
waZ
ulu-
Nat
al M
unic
ipal
ities
10 1
38 9
1311
081
889
11 8
73 3
8289
9 21
497
4 11
81
060
022
212
319
222
964
233
670
1 35
3 30
41
049
105
1 45
8 82
41
102
076
1 62
8 14
91
197
381

This gazette is also available free online at www.gpwonline.co.za
44 No. 40913 GOVERNMENT GAZETTE, 12 JUNE 2017A
PPEN
DIX
W1
APP
END
IX T
O S
CH
EDU
LE 3
: EQ
UIT
ABL
E SH
AR
E A
LLO
CA
TIO
NS
TO M
UN
ICIP
ALI
TIES
Nat
iona
l and
Mun
icip
al F
inan
cial
Yea
rN
atio
nal a
nd M
unic
ipal
Fin
anci
al Y
ear
Nat
iona
l and
Mun
icip
al F
inan
cial
Yea
rN
atio
nal a
nd M
unic
ipal
Fin
anci
al Y
ear
Nat
iona
l and
Mun
icip
al F
inan
cial
Yea
rN
atio
nal a
nd M
unic
ipal
Fin
anci
al Y
ear
Wat
er
San
itatio
n R
efus
e W
ater
S
anita
tion
Ref
use
Wat
er
San
itatio
n R
efus
e 2
017/
18(R
'000
) 2
018/
19 (R
'000
) 2
019/
20 (R
'000
) 2
018/
19(R
'000
) 2
019/
20(R
'000
) 2
017/
18(R
'000
) 2
018/
19(R
'000
) 2
019/
20(R
'000
) C
ateg
ory
Mun
icip
ality
(EQ
UIT
ABL
E SH
AR
E FO
RM
ULA
ALL
OC
ATI
ON
S +
RSC
LEV
IES
REP
LAC
EMEN
T +
SPEC
IAL
SUPP
OR
T FO
R C
OU
NC
ILLO
R R
EMU
NER
ATI
ON
AN
D W
AR
D C
OM
MIT
TEES
+ B
REA
KD
OW
N O
F EQ
UIT
ABL
E SH
AR
E A
LLO
CA
TIO
NS
PER
LO
CA
L M
UN
ICPA
LITY
PER
SER
VIC
E FO
R D
ISTR
ICT
MU
NIC
IPLI
TIES
AU
THO
RIS
ED F
OR
SER
VIC
ES)
Equi
tabl
e Sha
re F
orm
ula
RSC
Lev
ies R
epla
cem
ent
Spec
ial S
uppo
rt fo
r Cou
ncill
or R
emun
erat
ion
and
War
d C
omm
ittee
sBR
EAK
DO
WN
OF
EQU
ITA
BLE
SHA
RE
FOR
DIS
TRIC
T M
UN
ICIP
ALI
TIES
AU
THO
RIS
ED F
OR
SER
VIC
ES
201
7/18
(R'0
00)
201
8/19
(R'0
00)
201
9/20
(R'0
00)
201
7/18
(R'0
00)
LIM
POPO
BLI
M33
1 G
reat
er G
iyan
i22
2 40
523
8 80
324
9 47
512
173
12 7
8113
393
75 9
9358
911
83 0
5462
744
92 5
6168
072
BLI
M33
2 G
reat
er L
etab
a21
0 72
823
0 22
624
1 96
911
780
12 3
6912
961
71 1
5055
157
81 4
5661
537
90 8
6766
826
BLI
M33
3 G
reat
er T
zane
en31
1 97
733
6 44
335
3 70
612
5 21
897
071
136
104
102
821
152
468
112
129
BLI
M33
4 B
a-Ph
alab
orw
a11
3 09
812
3 87
413
1 09
27
294
7 65
78
022
40 1
3231
111
45 4
1334
308
51 1
9537
650
BLI
M33
5 M
arul
eng
93 9
6710
2 89
710
8 36
95
331
5 59
65
862
29 8
0923
109
34 3
0425
915
38 4
1628
252
CD
C33
Mop
ani D
istric
t Mun
icip
ality
656
310
730
467
800
394
103
237
112
682
122
619
Tota
l: M
opan
i Mun
icip
aliti
es1
608
485
1 76
2 71
01
885
005
103
237
112
682
122
619
36 5
7838
403
40 2
3834
2 30
226
5 35
938
0 33
128
7 32
542
5 50
731
2 92
9
BLI
M34
1LI
M34
199
615
117
834
128
123
4 71
24
948
5 18
438
464
29 8
1849
857
37 6
6457
760
42 4
78B
LIM
343
LIM
343
345
865
371
967
389
881
15 9
3316
728
17 5
2713
1 27
010
1 76
314
2 59
510
7 72
415
9 39
711
7 22
5B
LIM
344
Mak
hado
294
079
314
649
329
245
117
926
91 4
1812
5 90
295
113
140
757
103
516
BLI
M34
5LI
M 3
4529
0 72
531
0 46
232
3 80
313
970
14 6
6615
367
105
694
81 9
3611
3 35
285
632
126
351
92 9
22C
DC3
4V
hem
be D
istric
t Mun
icip
ality
757
674
839
853
919
536
67 0
8673
224
79 6
81To
tal:
Vhe
mbe
Mun
icip
aliti
es1
787
958
1 95
4 76
52
090
588
67 0
8673
224
79 6
8134
615
36 3
4238
078
393
354
304
935
431
706
326
133
484
265
356
141
BLI
M35
1Bl
oube
rg
152
472
157
961
161
054
8 63
99
070
9 50
552
842
40 9
6452
720
39 8
2857
947
42 6
16B
LIM
353
Mol
emol
e11
6 33
112
0 99
312
3 71
16
283
6 59
76
912
39 2
9530
462
39 8
0530
071
43 6
9432
133
BLI
M35
4Po
lokw
ane
752
064
831
889
903
461
BLI
M35
5Le
pele
-Nku
mpi
200
362
209
483
215
151
11 7
8012
369
12 9
6166
884
51 8
4968
263
51 5
7075
525
55 5
43C
DC3
5Ca
pric
orn
Dist
rict M
unic
ipal
ity31
6 59
633
6 59
335
7 63
820
5 75
621
2 03
123
0 72
9To
tal:
Cap
rico
rn M
unic
ipal
ities
1 53
7 82
51
656
919
1 76
1 01
520
5 75
621
2 03
123
0 72
926
702
28 0
3629
378
159
021
123
275
160
788
121
469
177
166
130
292
BLI
M36
1 T
haba
zim
bi64
430
81 5
1188
910
4 54
64
771
4 99
8B
LIM
362
Lep
hala
le10
9 24
813
0 42
014
4 65
2B
LIM
366
Bel
a-Be
la71
571
78 4
5784
811
3 36
83
535
3 70
2B
LIM
367
Mog
alak
wen
a36
9 65
339
4 58
541
5 83
6B
LIM
368
LIM
368
93 3
8410
0 82
510
7 30
3C
DC3
6 W
ater
berg
Dist
rict M
unic
ipal
ity30
156
32 6
0334
185
81 3
9583
878
86 3
435
822
6 16
56
510
Tota
l: W
ater
berg
Mun
icip
aliti
es73
8 44
281
8 40
187
5 69
781
395
83 8
7886
343
13 7
3614
471
15 2
10
BLI
M47
1 E
phra
im M
ogal
e11
7 48
312
2 65
812
6 03
46
283
6 59
76
912
40 6
4531
509
40 3
4930
482
45 1
2633
187
BLI
M47
2 E
lias M
otso
aled
i21
1 01
322
3 65
423
2 41
912
006
12 6
0513
207
71 0
0655
045
74 0
7455
960
83 0
6161
085
BLI
M47
3 M
akhu
duth
amag
a22
1 19
522
8 04
223
1 51
712
173
12 7
8113
393
78 2
7160
677
75 8
0257
265
84 0
0561
780
BLI
M47
6 L
IM 4
7633
3 00
235
9 35
637
8 69
911
7 42
591
030
126
606
95 6
4514
3 56
910
5 58
5C
DC4
7 S
ekhu
khun
e Dist
rict M
unic
ipal
ity57
8 12
062
5 37
367
5 80
880
460
87 8
2195
566
Tota
l: Se
khuk
hune
Mun
icip
aliti
es1
460
813
1 55
9 08
31
644
477
80 4
6087
821
95 5
6630
462
31 9
8333
512
307
347
238
261
316
831
239
352
355
761
261
637
Tota
l: Li
mpo
po M
unic
ipal
ities
7 13
3 52
37
751
878
8 25
6 78
253
7 93
456
9 63
661
4 93
814
2 09
314
9 23
515
6 41
61
202
024
931
830
1 28
9 65
697
4 27
91
442
699
1 06
0 99
9
MPU
MA
LAN
GA
BM
P301
Chie
f Alb
ert L
uthu
li24
4 59
126
7 85
828
5 62
09
650
10 1
3110
615
BM
P302
Msu
kalig
wa
134
855
154
428
169
675
BM
P303
Mkh
ondo
178
990
201
280
218
164
7 46
17
834
8 20
8B
MP3
04 D
r Pix
ley
ka Is
aka S
eme
92 1
5910
2 83
010
9 92
04
153
4 35
94
566
BM
P305
Lekw
a93
948
107
311
117
044
BM
P306
Dip
ales
eng
55 8
9261
804
66 5
312
496
2 62
22
749
BM
P307
Gov
an M
beki
218
181
258
160
286
526
CD
C30
Ger
t Sib
ande
Dist
rict M
unic
ipal
ity10
369
11 3
3211
939
268
207
271
006
278
972
Tota
l: G
ert S
iban
de M
unic
ipal
ities
1 02
8 98
51
165
003
1 26
5 41
926
8 20
727
1 00
627
8 97
223
760
24 9
4626
138
BM
P311
Vic
tor K
hany
e76
377
83 6
8090
506
3 36
83
535
3 70
2B
MP3
12Em
alah
leni
288
802
326
821
362
607
BM
P313
Stev
e Tsh
wet
e15
6 75
917
9 97
520
1 93
6B
MP3
14Em
akha
zeni
52 0
7255
208
58 0
943
150
3 30
73
466
BM
P315
Them
bisil
e Han
i33
8 47
736
3 53
838
5 42
3B
MP3
16D
r JS
Mor
oka
316
355
332
132
345
179
12 1
7312
781
13 3
93C
DC3
1N
kang
ala D
istric
t Mun
icip
ality
19 4
0220
854
21 9
1131
9 65
432
2 98
933
2 48
3To
tal:
Nka
ngal
a M
unic
ipal
ities
1 24
8 24
41
362
208
1 46
5 65
631
9 65
432
2 98
933
2 48
318
691
19 6
2320
561
B
MP3
21Th
aba C
hweu
119
062
127
219
134
973
5 33
15
596
5 86
2B
MP3
24N
kom
azi
483
144
515
601
544
585
BM
P325
Bush
buck
ridge
683
632
719
537
750
699
BM
P326
City
of M
bom
bela
608
678
662
052
712
545
CD
C32
Ehla
nzen
i Dist
rict M
unic
ipal
ity70
003
74 1
5477
137
159
687
164
557
169
394
Tota
l: Eh
lanz
eni M
unic
ipal
ities
1 96
4 51
92
098
563
2 21
9 93
915
9 68
716
4 55
716
9 39
45
331
5 59
65
862
Tota
l: M
pum
alan
ga M
unic
ipal
ities
4 24
1 74
84
625
774
4 95
1 01
474
7 54
875
8 55
278
0 84
947
782
50 1
6552
561

This gazette is also available free online at www.gpwonline.co.za
STAATSKOERANT, 12 JUNIE 2017 No. 40913 45A
PPEN
DIX
W1
APP
END
IX T
O S
CH
EDU
LE 3
: EQ
UIT
AB
LE S
HA
RE
ALL
OC
ATI
ON
S TO
MU
NIC
IPA
LITI
ES
Nat
iona
l and
Mun
icip
al F
inan
cial
Yea
rN
atio
nal a
nd M
unic
ipal
Fin
anci
al Y
ear
Nat
iona
l and
Mun
icip
al F
inan
cial
Yea
rN
atio
nal a
nd M
unic
ipal
Fin
anci
al Y
ear
Nat
iona
l and
Mun
icip
al F
inan
cial
Yea
rN
atio
nal a
nd M
unic
ipal
Fin
anci
al Y
ear
Wat
er
San
itatio
n R
efus
e W
ater
S
anita
tion
Ref
use
Wat
er
San
itatio
n R
efus
e 2
017/
18(R
'000
) 2
018/
19 (R
'000
) 2
019/
20 (R
'000
) 2
018/
19(R
'000
) 2
019/
20(R
'000
) 2
017/
18(R
'000
) 2
018/
19(R
'000
) 2
019/
20(R
'000
) C
ateg
ory
Mun
icip
ality
(EQ
UIT
AB
LE S
HA
RE
FOR
MU
LA A
LLO
CA
TIO
NS
+ R
SC L
EVIE
S R
EPLA
CEM
ENT
+ SP
ECIA
L SU
PPO
RT
FOR
CO
UN
CIL
LOR
REM
UN
ERA
TIO
N A
ND
WA
RD
CO
MM
ITTE
ES +
BR
EAK
DO
WN
OF
EQU
ITA
BLE
SH
AR
E A
LLO
CA
TIO
NS
PER
LO
CA
L M
UN
ICPA
LITY
PER
SER
VIC
E FO
R D
ISTR
ICT
MU
NIC
IPLI
TIES
AU
THO
RIS
ED F
OR
SER
VIC
ES)
Equi
tabl
e Sh
are
Form
ula
RSC
Lev
ies R
epla
cem
ent
Spec
ial S
uppo
rt fo
r C
ounc
illor
Rem
uner
atio
n an
d W
ard
Com
mitt
ees
BR
EAK
DO
WN
OF
EQU
ITA
BLE
SH
AR
E FO
R D
ISTR
ICT
MU
NIC
IPA
LITI
ES A
UTH
OR
ISED
FO
R S
ERV
ICES
201
7/18
(R'0
00)
201
8/19
(R'0
00)
201
9/20
(R'0
00)
201
7/18
(R'0
00)
NO
RTH
ERN
CA
PE
BN
C061
Ric
hter
svel
d12
629
13 8
9614
941
1 48
61
559
1 63
3B
NC0
62 N
ama
Kho
i36
837
40 1
9643
120
3 56
63
744
3 92
4B
NC0
64 K
amie
sber
g17
876
19 1
5520
130
1 48
61
559
1 63
3B
NC0
65 H
anta
m19
145
20 8
3422
269
1 90
21
996
2 09
1B
NC0
66 K
aroo
Hoo
glan
d16
599
18 5
4320
015
1 59
91
679
1 76
0B
NC0
67 K
hâi-M
a14
905
15 8
5216
701
1 48
61
559
1 63
3C
DC6
Nam
akw
a D
istric
t Mun
icip
ality
5 74
56
109
6 33
030
504
38 3
5539
483
2 49
52
642
2 79
0To
tal:
Nam
akw
a M
unic
ipal
ities
123
736
134
585
143
506
30 5
0438
355
39 4
8314
020
14 7
3815
464
BN
C071
Ubu
ntu
26 7
0629
524
31 6
161
486
1 55
91
633
BN
C072
Um
sobo
mvu
37 4
4241
714
44 9
932
318
2 43
32
550
BN
C073
Em
than
jeni
33 9
4437
451
40 2
443
150
3 30
73
466
BN
C074
Kar
eebe
rg18
911
20 4
1621
649
1 48
61
559
1 63
3B
NC0
75 R
enos
terb
erg
18 5
8320
483
21 8
291
599
1 67
91
760
BN
C076
The
mbe
lihle
19 3
1621
246
22 6
341
599
1 67
91
760
BN
C077
Siy
athe
mba
25 6
2427
811
29 6
631
902
1 99
62
091
BN
C078
Siy
ancu
ma
38 6
5042
385
44 8
632
734
2 87
03
008
CD
C7 P
ixle
y K
a Se
me
Dist
rict M
unic
ipal
ity15
659
16 7
3317
383
21 0
4327
616
28 4
283
160
3 34
73
534
Tota
l: Pi
xley
Ka
Sem
e M
unic
ipal
ities
234
835
257
763
274
874
21 0
4327
616
28 4
2819
434
20 4
2921
435
BN
C082
!Kai
!Gar
ib59
182
72 9
9379
103
3 98
24
181
4 38
2B
NC0
84 !K
heis
19 8
5521
427
22 5
701
599
1 67
91
760
BN
C085
Tsa
ntsa
bane
29 4
7232
533
35 3
362
734
2 87
03
008
BN
C086
Kga
telo
pele
17 4
8818
920
20 2
711
486
1 55
91
633
BN
C087
Daw
id K
ruip
er64
653
71 6
6077
838
6 11
66
421
6 72
6C
DC8
Z.F.
Mgc
awu
Dist
rict M
unic
ipal
ity13
076
14 0
6114
662
39 2
0148
228
49 6
453
493
3 69
93
906
Tota
l: Z.
F. M
gcaw
u M
unic
ipal
ities
203
726
231
594
249
780
39 2
0148
228
49 6
4519
410
20 4
0921
415
B
NC0
91 S
ol P
laat
jie15
0 98
217
2 90
418
9 20
9B
NC0
92 D
ikga
tlong
64 2
4872
856
78 3
042
734
2 87
03
008
BN
C093
Mag
aren
g35
796
39 5
6642
003
1 90
21
996
2 09
1B
NC0
94 P
hokw
ane
81 4
8290
227
95 9
623
760
3 94
74
134
CD
C9 F
ranc
es B
aard
Dist
rict M
unic
ipal
ity8
268
8 92
29
304
104
049
107
222
110
374
Tota
l: Fr
ance
s Baa
rd M
unic
ipal
ities
340
776
384
475
414
782
104
049
107
222
110
374
8 39
68
813
9 23
3
BN
C451
Joe
Mor
olon
g11
5 07
212
1 34
612
6 41
26
531
6 86
37
197
17 2
5317
495
18 6
40B
NC4
52 G
a-Se
gony
ana
124
249
136
025
146
500
5 33
15
596
5 86
2B
NC4
53 G
amag
ara
25 9
7630
406
34 6
042
582
2 71
02
838
CD
C45
John
Tao
lo G
aetse
we
Dist
rict M
unic
ipal
ity30
074
31 9
4333
349
38 2
3249
561
51 0
183
493
3 69
93
906
Tota
l: Jo
hn T
aolo
Gae
tsew
e M
unic
ipal
ities
295
371
319
720
340
865
38 2
3249
561
51 0
1817
937
18 8
6819
803
17 2
5317
495
18 6
40
Tota
l: N
orth
ern
Cap
e M
unic
ipal
ities
1 19
8 44
41
328
137
1 42
3 80
723
3 02
927
0 98
227
8 94
879
197
83 2
5787
350
17 2
5317
495
18 6
40
NO
RTH
WES
T
BN
W37
1 M
oret
ele
274
291
295
084
311
175
10 2
0910
720
11 2
33B
NW
372
Mad
iben
g56
7 44
262
5 84
568
1 74
5B
NW
373
Rus
tenb
urg
526
072
607
549
680
253
BN
W37
4 K
getle
ngriv
ier
67 9
0478
279
85 4
522
975
3 12
23
270
BN
W37
5 M
oses
Kot
ane
344
087
371
711
393
453
13 3
5114
018
14 6
89C
DC3
7 B
ojan
ala
Plat
inum
Dist
rict M
unic
ipal
ity65
495
71 1
5975
317
235
919
238
381
245
388
11 6
4312
330
13 0
21To
tal:
Boj
anal
a Pl
atin
um M
unic
ipal
ities
1 84
5 29
12
049
627
2 22
7 39
523
5 91
923
8 38
124
5 38
838
178
40 1
9042
213
BN
W38
1 R
atlo
u97
052
104
557
108
943
5 82
46
118
6 41
431
272
24 2
4335
274
26 6
4838
766
28 5
10B
NW
382
Tsw
aing
86 6
7995
641
100
776
5 72
46
008
6 29
432
172
24 9
4037
934
28 6
5741
985
30 8
77B
NW
383
Maf
iken
g19
8 79
622
4 70
023
8 96
781
263
62 9
9799
313
75 0
2711
0 87
381
539
BN
W38
4 D
itsob
otla
98 3
3911
1 60
111
8 75
643
339
33 5
9753
378
40 3
2559
404
43 6
87B
NW
385
Ram
otsh
ere
Moi
loa
130
178
143
938
151
680
7 46
17
834
8 20
843
402
33 6
4651
513
38 9
1657
268
42 1
17C
DC3
8 N
gaka
Mod
iri M
olem
a D
istric
t Mun
icip
ality
448
559
515
656
567
289
167
708
183
051
199
193
Tota
l: N
gaka
Mod
iri M
olem
a M
unic
ipal
ities
1 05
9 60
31
196
093
1 28
6 41
116
7 70
818
3 05
119
9 19
319
009
19 9
6020
916
231
448
179
423
277
412
209
573
308
296
226
730
BN
W39
2 N
aled
i39
580
42 9
5245
282
3 92
74
123
4 32
017
444
13 5
2319
447
14 6
9121
556
15 8
53B
NW
393
Mam
usa
43 9
6846
325
47 9
893
534
3 71
13
888
15 6
6412
143
16 1
1412
173
17 8
8613
154
BN
W39
4 G
reat
er T
aung
160
929
165
435
167
645
9 42
49
895
10 3
6955
007
42 6
4254
278
41 0
0459
155
43 5
04B
NW
396
Lek
wa-
Teem
ane
38 3
6741
060
43 0
123
328
3 49
63
665
14 9
0711
556
15 9
8212
074
17 7
9713
088
BN
W39
7K
agisa
no-M
olop
o98
075
102
488
105
127
5 72
46
008
6 29
431
934
24 7
5633
152
25 0
4536
184
26 6
11C
DC3
9D
r Rut
h Se
gom
otsi
Mom
pati
Dist
rict M
unic
ipal
ity26
1 69
327
8 96
829
7 30
141
432
53 4
0858
118
5 32
35
637
5 95
2To
tal:
Dr
Rut
h Se
gom
otsi
Mom
pati
Mun
icip
aliti
es64
2 61
267
7 22
870
6 35
641
432
53 4
0858
118
31 2
6032
870
34 4
8813
4 95
610
4 62
013
8 97
310
4 98
715
2 57
811
2 21
0
BN
W40
3 C
ity o
f Mat
losa
na35
4 37
739
3 80
642
7 11
0B
NW
404
Maq
uass
i Hill
s97
792
110
715
118
819
4 31
94
535
4 75
2b
NW
405
Ven
ters
dorp
/Tlo
kwe
209
740
234
327
257
001
CD
C40
Dr K
enne
th K
aund
a D
istric
t Mun
icip
ality
20 0
3921
582
22 5
9815
3 63
715
8 32
316
2 97
7To
tal:
Dr
Ken
neth
Kau
nda
Mun
icip
aliti
es68
1 94
876
0 43
082
5 52
815
3 63
715
8 32
316
2 97
74
319
4 53
54
752
Tota
l: N
orth
Wes
t Mun
icip
aliti
es4
229
454
4 68
3 37
85
045
690
598
696
633
163
665
676
92 7
6697
555
102
369
366
404
284
043
416
385
314
560
460
874
338
940

This gazette is also available free online at www.gpwonline.co.za
46 No. 40913 GOVERNMENT GAZETTE, 12 JUNE 2017
APP
END
IX W
1
APP
END
IX T
O S
CH
EDU
LE 3
: EQ
UIT
AB
LE S
HA
RE
ALL
OC
ATI
ON
S TO
MU
NIC
IPA
LITI
ES
Nat
iona
l and
Mun
icip
al F
inan
cial
Yea
rN
atio
nal a
nd M
unic
ipal
Fin
anci
al Y
ear
Nat
iona
l and
Mun
icip
al F
inan
cial
Yea
rN
atio
nal a
nd M
unic
ipal
Fin
anci
al Y
ear
Nat
iona
l and
Mun
icip
al F
inan
cial
Yea
rN
atio
nal a
nd M
unic
ipal
Fin
anci
al Y
ear
Wat
er
San
itatio
n R
efus
e W
ater
S
anita
tion
Ref
use
Wat
er
San
itatio
n R
efus
e 2
017/
18(R
'000
) 2
018/
19 (R
'000
) 2
019/
20 (R
'000
) 2
018/
19(R
'000
) 2
019/
20(R
'000
) 2
017/
18(R
'000
) 2
018/
19(R
'000
) 2
019/
20(R
'000
) C
ateg
ory
Mun
icip
ality
(EQ
UIT
AB
LE S
HA
RE
FOR
MU
LA A
LLO
CA
TIO
NS
+ R
SC L
EVIE
S R
EPLA
CEM
ENT
+ SP
ECIA
L SU
PPO
RT
FOR
CO
UN
CIL
LOR
REM
UN
ERA
TIO
N A
ND
WA
RD
CO
MM
ITTE
ES +
BR
EAK
DO
WN
OF
EQU
ITA
BLE
SH
AR
E A
LLO
CA
TIO
NS
PER
LO
CA
L M
UN
ICPA
LITY
PER
SER
VIC
E FO
R D
ISTR
ICT
MU
NIC
IPLI
TIES
AU
THO
RIS
ED F
OR
SER
VIC
ES)
Equi
tabl
e Sh
are
Form
ula
RSC
Lev
ies R
epla
cem
ent
Spec
ial S
uppo
rt fo
r C
ounc
illor
Rem
uner
atio
n an
d W
ard
Com
mitt
ees
BR
EAK
DO
WN
OF
EQU
ITA
BLE
SH
AR
E FO
R D
ISTR
ICT
MU
NIC
IPA
LITI
ES A
UTH
OR
ISED
FO
R S
ERV
ICES
201
7/18
(R'0
00)
201
8/19
(R'0
00)
201
9/20
(R'0
00)
201
7/18
(R'0
00)
WES
TER
N C
APE
ACP
TCi
ty o
f Cap
e To
wn
2 29
2 90
82
582
306
2 83
5 56
9
BW
C011
Mat
zika
ma
44 5
8649
332
53 4
262
975
3 12
23
270
BW
C012
Ced
erbe
rg38
555
42 6
8046
166
2 31
82
433
2 55
0B
WC0
13 B
ergr
ivie
r34
562
38 7
9342
521
2 58
22
710
2 83
8B
WC0
14 S
alda
nha
Bay
66 1
8075
041
82 9
385
331
5 59
65
862
BW
C015
Sw
artla
nd70
560
82 3
0192
184
CD
C1 W
est C
oast
Dist
rict M
unic
ipal
ity14
911
16 1
0616
897
70 0
6172
197
74 3
20To
tal:
Wes
t Coa
st M
unic
ipal
ities
269
354
304
253
334
132
70 0
6172
197
74 3
2013
206
13 8
6114
520
BW
C022
Witz
enbe
rg70
412
84 8
7293
510
BW
C023
Dra
kens
tein
120
821
137
935
151
671
BW
C024
Ste
llenb
osch
110
631
124
544
137
145
BW
C025
Bre
ede
Val
ley
98 0
9710
9 29
911
8 83
6B
WC0
26 L
ange
berg
60 8
3868
477
74 4
054
546
4 77
14
998
CD
C2 C
ape
Win
elan
ds D
istric
t Mun
icip
ality
1 88
62
043
2 14
322
0 85
322
3 15
722
9 71
7To
tal:
Cap
e W
inel
ands
Mun
icip
aliti
es46
2 68
552
7 17
057
7 71
022
0 85
322
3 15
722
9 71
74
546
4 77
14
998
BW
C031
The
ewat
ersk
loof
77 9
1187
508
95 0
78B
WC0
32 O
vers
trand
79 2
8590
981
100
556
4 93
85
184
5 43
0B
WC0
33 C
ape
Agu
lhas
22 8
7225
212
27 2
582
318
2 43
32
550
BW
C034
Sw
elle
ndam
23 8
8326
612
28 9
572
318
2 43
32
550
CD
C3 O
verb
erg
Dist
rict M
unic
ipal
ity16
543
17 8
0418
597
40 7
4349
977
51 4
46To
tal:
Ove
rber
g M
unic
ipal
ities
220
494
248
117
270
446
40 7
4349
977
51 4
469
574
10 0
5010
530
BW
C041
Kan
nala
nd22
537
24 3
5025
688
1 48
61
559
1 63
3B
WC0
42 H
esse
qua
33 9
3137
215
40 1
633
566
3 74
43
924
BW
C043
Mos
sel B
ay73
141
80 3
8987
081
5 33
15
596
5 86
2B
WC0
44 G
eorg
e12
2 61
313
7 80
915
1 04
4B
WC0
45 O
udtsh
oorn
57 7
4562
693
66 9
754
938
5 18
45
430
BW
C047
Bito
u71
457
80 2
6688
388
2 58
22
710
2 83
8B
WC0
48 K
nysn
a66
680
74 0
5080
574
4 15
34
359
4 56
6C
DC4
Ede
n D
istric
t Mun
icip
ality
14 8
0715
880
16 5
9013
1 24
813
5 25
013
9 22
6To
tal:
Eden
Mun
icip
aliti
es46
2 91
151
2 65
255
6 50
313
1 24
813
5 25
013
9 22
622
056
23 1
5224
253
BW
C051
Lai
ngsb
urg
12 0
8613
389
14 2
751
486
1 55
91
633
BW
C052
Prin
ce A
lber
t16
166
17 7
1518
955
1 48
61
559
1 63
3B
WC0
53 B
eauf
ort W
est
48 3
2653
697
57 7
582
734
2 87
03
008
CD
C5 C
entra
l Kar
oo D
istric
t Mun
icip
ality
11 5
9412
345
12 7
858
844
13 7
6814
176
2 16
12
313
2 43
3To
tal:
Cen
tral
Kar
oo M
unic
ipal
ities
88 1
7297
146
103
773
8 84
413
768
14 1
767
867
8 30
18
707
Tota
l: W
este
rn C
ape
Mun
icip
aliti
es3
796
524
4 27
1 64
44
678
133
471
749
494
349
508
885
57 2
4960
135
63 0
08
Una
lloca
ted
N
atio
nal T
otal
51 3
26 3
9656
723
117
61 1
35 5
434
794
842
5 07
2 94
75
357
032
890
903
935
781
980
890
4 04
2 19
63
133
581
17 2
534
332
357
3 27
2 90
217
495
4 81
4 35
53
540
603
18 6
40

This gazette is also available free online at www.gpwonline.co.za
STAATSKOERANT, 12 JUNIE 2017 No. 40913 47
APP
EN
DIX
W2
APP
END
IX T
O S
CH
EDU
LE
5, P
AR
T B
: MU
NIC
IPA
L IN
FRA
STR
UC
TU
RE
GR
AN
T (M
IG)
(Nat
iona
l and
Mun
icip
al F
inan
cial
Yea
rs)

This gazette is also available free online at www.gpwonline.co.za
48 No. 40913 GOVERNMENT GAZETTE, 12 JUNE 2017
APPENDIX W2
APPENDIX TO SCHEDULE 5, PART B: MUNICIPAL INFRASTRUCTURE GRANT (MIG)
EASTERN CAPE
B EC121 Mbhashe 161 101 171 087 181 627B EC122 Mnquma 149 755 159 039 168 835B EC123 Great Kei 9 104 9 669 10 264B EC124 Amahlathi 35 795 38 014 40 356B EC126 Ngqushwa 29 375 31 196 33 118B EC129 Raymond Mhlaba 46 308 49 179 52 208C DC12 Amathole District MunicipalityTotal: Amathole Municipalities 431 438 458 184 486 408
B EC131 Inxuba Yethemba 5 078 5 393 5 725B EC135 Intsika Yethu 90 606 96 222 102 150B EC136 Emalahleni 45 457 48 275 51 248B EC137 Engcobo 83 919 89 121 94 611B EC138 Sakhisizwe 20 179 21 430 22 751B EC139 Enoch Mgijima 42 101 44 711 47 465C DC13 Chris Hani District MunicipalityTotal: Chris Hani Municipalities 287 340 305 152 323 950
B EC141 Elundini 85 286 90 573 96 152B EC142 Senqu 58 552 62 182 66 013B EC145 Walter Sisulu 10 887 11 562 12 274C DC14 Joe Gqabi District MunicipalityTotal: Joe Gqabi Municipalities 154 725 164 317 174 439
B EC153 Ngquza Hill 144 881 153 862 163 340B EC154 Port St Johns 82 356 87 461 92 849B EC155 Nyandeni 148 243 157 432 167 130B EC156 Mhlontlo 93 013 98 778 104 863B EC157 King Sabata Dalindyebo 171 725 182 370 193 604C DC15 O.R. Tambo District MunicipalityTotal: O.R.Tambo Municipalities 640 218 679 903 721 786
B EC441 Matatiele 91 798 97 488 103 493B EC442 Umzimvubu 93 211 98 989 105 086B EC443 Mbizana 135 574 143 978 152 847B EC444 Ntabankulu 57 407 60 966 64 721C DC44 Alfred Nzo District MunicipalityTotal: Alfred Nzo Municipalities 377 990 401 421 426 147
Total: Eastern Cape Municipalities 1 891 711 2 008 977 2 132 730
KWAZULU-NATAL
B KZN212 uMdoni 43 928 46 651 49 524B KZN213 uMzumbe 78 251 83 101 88 220B KZN214 uMuziwabantu 35 028 37 199 39 490B KZN216 Ray Nkonyeni 83 273 88 435 93 883C DC21 Ugu District MunicipalityTotal: Ugu Municipalities 240 480 255 386 271 117
B KZN221 uMshwathi 27 635 29 348 31 156B KZN222 uMngeni 18 289 19 423 20 619B KZN223 Mpofana 7 280 7 731 8 207B KZN224 iMpendle 10 627 11 285 11 981B KZN225 MsunduziB KZN226 Mkhambathini 18 027 19 144 20 323B KZN227 Richmond 16 911 17 959 19 065C DC22 uMgungundlovu District MunicipalityTotal: uMgungundlovu Municipalities 98 769 104 890 111 351
National and Municipal Financial Year
Category Municipality 2017/18(R'000)
2018/19(R'000)
2019/20(R'000)
Schedule 5, Part BBreakdown of MIG allocations for district
municipalities authorised for services

This gazette is also available free online at www.gpwonline.co.za
STAATSKOERANT, 12 JUNIE 2017 No. 40913 49
APPENDIX W2
APPENDIX TO SCHEDULE 5, PART B: MUNICIPAL INFRASTRUCTURE GRANT (MIG)
National and Municipal Financial Year
Category Municipality 2017/18(R'000)
2018/19(R'000)
2019/20(R'000)
Schedule 5, Part BBreakdown of MIG allocations for district
municipalities authorised for services
B KZN235 Okhahlamba 44 005 46 733 49 611B KZN237 iNkosi Langalibalele 59 379 63 060 66 945B KZN238 Alfred Duma 78 920 83 812 88 975C DC23 uThukela District MunicipalityTotal: uThukela Municipalities 182 304 193 605 205 531
B KZN241 eNdumeni 9 039 9 599 10 191B KZN242 Nquthu 47 984 50 958 54 097B KZN244 uMsinga 79 377 84 297 89 490B KZN245 uMvoti 50 541 53 674 56 980C DC24 uMzinyathi District MunicipalityTotal: uMzinyathi Municipalities 186 941 198 528 210 758
B KZN252 NewcastleB KZN253 eMadlangeni 10 234 10 868 11 538B KZN254 Dannhauser 26 483 28 125 29 857C DC25 Amajuba District MunicipalityTotal: Amajuba Municipalities 36 717 38 993 41 395
B KZN261 eDumbe 15 617 16 585 17 606B KZN262 uPhongolo 44 640 47 407 50 327B KZN263 AbaQulusi 47 910 50 880 54 014B KZN265 Nongoma 70 088 74 433 79 018B KZN266 Ulundi 46 470 49 350 52 390C DC26 Zululand District MunicipalityTotal: Zululand Municipalities 224 725 238 655 253 355
B KZN271 uMhlabuyalingana 60 110 63 836 67 769B KZN272 Jozini 71 924 76 383 81 088B KZN275 Mtubatuba 53 998 57 345 60 878B KZN276 Big Five Hlabisa 27 877 29 605 31 429C DC27 uMkhanyakude District MunicipalityTotal: uMkhanyakude Municipalities 213 909 227 169 241 164
B KZN281 uMfolozi 32 281 34 282 36 394B KZN282 uMhlathuzeB KZN284 uMlalazi 73 535 78 093 82 904B KZN285 Mthonjaneni 28 204 29 952 31 797B KZN286 Nkandla 34 918 37 083 39 367C DC28 King Cetshwayo District MunicipalityTotal: King Cetshwayo Municipalities 168 938 179 410 190 462
B KZN291 Mandeni 41 707 44 292 47 021B KZN292 KwaDukuza 62 478 66 351 70 438B KZN293 Ndwedwe 43 691 46 400 49 258B KZN294 Maphumulo 43 249 45 930 48 760C DC29 iLembe District MunicipalityTotal: iLembe Municipalities 191 125 202 973 215 477
B KZN433 Greater Kokstad 10 333 10 974 11 650B KZN434 uBuhlebezwe 47 029 49 944 53 021B KZN435 uMzimkhulu 96 707 102 702 109 028B KZN436 Dr Nkosazana Dlamini Zuma 45 475 48 294 51 269C DC43 Harry Gwala District MunicipalityTotal: Harry Gwala Municipalities 199 544 211 914 224 968
Total: KwaZulu-Natal Municipalities 1 743 452 1 851 523 1 965 578

This gazette is also available free online at www.gpwonline.co.za
50 No. 40913 GOVERNMENT GAZETTE, 12 JUNE 2017
APPENDIX W2
APPENDIX TO SCHEDULE 5, PART B: MUNICIPAL INFRASTRUCTURE GRANT (MIG)
National and Municipal Financial Year
Category Municipality 2017/18(R'000)
2018/19(R'000)
2019/20(R'000)
Schedule 5, Part BBreakdown of MIG allocations for district
municipalities authorised for services
LIMPOPO
B LIM331 Greater Giyani 114 760 121 874 129 381B LIM332 Greater Letaba 90 845 96 476 102 420B LIM333 Greater Tzaneen 180 970 192 188 204 027B LIM334 Ba-Phalaborwa 32 244 34 243 36 352B LIM335 Maruleng 38 929 41 342 43 889C DC33 Mopani District MunicipalityTotal: Mopani Municipalities 457 748 486 123 516 069
B LIM341 LIM341 28 106 29 848 31 687B LIM343 LIM343 189 422 201 164 213 556B LIM344 Makhado 161 774 171 802 182 385B LIM345 LIM 345 140 058 148 740 157 902C DC34 Vhembe District MunicipalityTotal: Vhembe Municipalities 519 360 551 554 585 530
B LIM351 Blouberg 81 125 86 154 91 461B LIM353 Molemole 54 123 57 478 61 018B LIM354 Polokwane B LIM355 Lepele-Nkumpi 94 789 100 664 106 865C DC35 Capricorn District MunicipalityTotal: Capricorn Municipalities 230 037 244 296 259 344
B LIM471 Ephraim Mogale 47 552 50 500 53 611B LIM472 Elias Motsoaledi 114 817 121 934 129 445B LIM473 Makhuduthamaga 131 041 139 164 147 737B LIM476 LIM 476 185 632 197 139 209 283C DC47 Sekhukhune District MunicipalityTotal: Sekhukhune Municipalities 479 042 508 737 540 076
Total: Limpopo Municipalities 1 686 187 1 790 710 1 901 019
NORTH WEST
B NW381 Ratlou 49 287 52 342 55 566B NW382 Tswaing 38 085 40 446 42 937B NW383 Mafikeng 110 136 116 964 124 169B NW384 Ditsobotla 45 556 48 380 51 361B NW385 Ramotshere Moiloa 56 976 60 507 64 235C DC38 Ngaka Modiri Molema District MunicipalityTotal: Ngaka Modiri Molema Municipalities 300 040 318 639 338 268
B NW392 Naledi 11 716 12 443 13 209B NW393 Mamusa 9 999 10 619 11 273B NW394 Greater Taung 72 942 77 463 82 235B NW396 Lekwa-Teemane 4 045 4 296 4 560B NW397 Kagisano-Molopo 37 200 39 506 41 940C DC39 Dr Ruth Segomotsi Mompati District MunicipalityTotal: Dr Ruth Segomotsi Mompati Municipalities 135 902 144 327 153 217
Total: North West Municipalities 435 942 462 966 491 485
National Total 5 757 292 6 114 176 6 490 812
This gazette is also available free online at www.gpwonline.co.za
STAATSKOERANT, 12 JUNIE 2017 No. 40913 51
APP
EN
DIX
W3
APP
END
IX T
O S
CH
EDU
LE
5, P
AR
T B
: MU
NIC
IPA
L IN
FRA
STR
UC
TU
RE
GR
AN
T
(Nat
iona
l and
Mun
icip
al F
inan
cial
Yea
rs)
RIN
G-F
ENC
ED F
UN
DIN
G F
OR
SPO
RT
INFR
AST
RU
CT
UR
E -
BR
EA
KD
OW
N P
ER
MU
NIC
IPA
LIT
Y

This gazette is also available free online at www.gpwonline.co.za
52 No. 40913 GOVERNMENT GAZETTE, 12 JUNE 2017
APPENDIX W3
APPENDIX TO SCHEDULE 5, PART B: MUNICIPAL INFRASTRUCTURE GRANT
RING-FENCED FUNDING FOR SPORT INFRASTRUCTURE - BREAKDOWN PER MUNICIPALITY
EASTERN CAPE
B EC129 Raymond Mhlaba Upgrading of sports facilities and install irrigation system and security booth 5 000
Total: Amathole Municipalities 5 000
B EC138 Sakhisizwe Construction of sports facilities, multi-purpose sports courts, irrigation system and a pavilion
12 500
Total: Chris Hani Municipalities 12 500
B EC145 Walter Sisulu Construction of sports facilities, multi-purpose sports courts, irrigation system and installation of floodlights
10 821
Total: Joe Gqabi Municipalities 10 821
B EC443 Mbizana Construction of sports facilities, multi-purpose sports courts, multi-purpose hall and install irrigation system and security booth
12 000
Total: Alfred Nzo Municipalities 12 000
Total: Eastern Cape Municipalities 40 321
FREE STATE
B FS162 Kopanong Construction and rehabilitation of sports facilities and multi-purpose sports courts
9 200
Total: Xhariep Municipalities 9 200
B FS185 Nala Upgrading of sports facilities and sport parks 4 373
Total: Lejweleputswa Municipalities 4 373
B FS195 Phumelela Construction of sports facilities, a pavilion, caretaker house and change rooms 9 604
Total: Thabo Mofutsanyana Municipalities 9 604
B FS203 Ngwathe Construction of sports facilities and multi-purpose sports courts 7 412
B FS205 Mafube Upgrading of sports facilities 4 308
Total: Fezile Dabi Municipalities 11 720
Total: Free State Municipalities 34 897
GAUTENG
B GT421 Emfuleni Upgrading of sports facilities, pavilion, installation of underground water supply pipes and construction of the security booth
9 593
B GT423 Lesedi Construction of sports facilities, multi-purpose sports courts, community centre, irrigation system and installation of floodlights
15 108
Total: Sedibeng Municipalities 24 702
B GT485 Rand West City Construction of sports facilities, a multi-purpose sport and recreation community centre and security upgrades
8 172
Total: West Rand Municipalities 8 172
Total: Gauteng Municipalities 32 873
KWAZULU-NATAL
B KZN221 uMshwathi Construction of sports facilities, multi-purpose sports courts, community centre, irrigation system and installation of floodlights
11 000
Total: uMgungundlovu Municipalities 11 000
B KZN242 Nquthu Construction of sports facilities, multi-purpose sports courts, community centre, irrigation system, installation of floodlights and security booth
11 000
Total: uMzinyathi Municipalities 11 000
B KZN265 Nongoma Construction of sports facilities, multi-purpose sports courts, irrigation system and repairing floodlights
11 000
Total: Zululand Municipalities 11 000
B KZN293 Ndwedwe Upgrading of sports facilities, multi-purpose sports courts and children's play area
11 000
Total: iLembe Municipalities 11 000
Total: KwaZulu-Natal Municipalities 44 000
LIMPOPO
B LIM332 Greater Letaba Construction multi-purpose sports courts, guardhouse and connection to municipal services
2 564
B LIM334 Ba-Phalaborwa Construction and refurbishment of sports facilities and multi-purpose sports courts
7 084
Total: Mopani Municipalities 9 648
B LIM354 Polokwane Construction of artificial sports facilities, irrigation system and installation of floodlights
7 764
B LIM355 Lepele-Nkumpi Construction of sports and ablution facilities, irrigation system and installation of floodlights
5 137
Total: Capricorn Municipalities 12 901
B LIM471 Ephraim Mogale Construction of multi-purpose sports courts, parking area and refurbishment of sports facilities
10 832
Total: Sekhukhune Municipalities 10 832
Total: Limpopo Municipalities 33 381
Ring-fenced Municipal Infrastructure Grant allocations for sport infrastructure
National and Municipal Financial Year
Category Municipality Project 2017/18(R'000)
2018/19(R'000)
2019/20(R'000)

This gazette is also available free online at www.gpwonline.co.za
STAATSKOERANT, 12 JUNIE 2017 No. 40913 53
APPENDIX W3
APPENDIX TO SCHEDULE 5, PART B: MUNICIPAL INFRASTRUCTURE GRANT
RING-FENCED FUNDING FOR SPORT INFRASTRUCTURE - BREAKDOWN PER MUNICIPALITY
Ring-fenced Municipal Infrastructure Grant allocations for sport infrastructure
National and Municipal Financial Year
Category Municipality Project 2017/18(R'000)
2018/19(R'000)
2019/20(R'000)
MPUMALANGA
B MP303 Mkhondo Refurbishment of multi-purpose sports courts 2 500
B MP304 Dr Pixley ka Isaka Seme Construction of multi-purpose sports courts 2 500
Total: Gert Sibande Municipalities 5 000
B MP315 Thembisile Hani Construction of sports facilities, multi-purpose sports courts and community centre
5 904
Total: Nkangala Municipalities 5 904
B MP324 Nkomazi Construction of sports facilities and multi-purpose sports courts 4 654
B MP325 Bushbuckridge Construction and upgrading of sports facilities and multi-purpose sports courts 13 096
Total: Ehlanzeni Municipalities 17 750
Total: Mpumalanga Municipalities 28 654
NORTHERN CAPE
B NC065 Hantam Construction of sports facilities and multi-purpose sports courts 6 867
Total: Namakwa Municipalities 6 867
B NC078 Siyancuma Construction of sports facilities and multi-purpose sports courts 6 867
Total: Pixley Ka Seme Municipalities 6 867
B NC091 Sol Plaatjie Construction of sports facilities and multi-purpose sports courts 6 867
Total: Frances Baard Municipalities 6 867
Total: Northern Cape Municipalities 20 600
NORTH WEST
B NW371 Moretele Construction of sports facilities, multi-purpose sports courts and clubhouse 15 000
Total: Bojanala Platinum Municipalities 15 000
B NW385 Ramotshere Moiloa Upgrading of sports facilities 7 274
Total: Ngaka Modiri Molema Municipalities 7 274
B NW394 Greater Taung Construction of sports and ablution facilities, multi-purpose sports courts and clubhouse
15 000
Total: Dr Ruth Segomotsi Mompati Municipalities 15 000
Total: North West Municipalities 37 274
WESTERN CAPE
B WC026 Langeberg Upgrading of sports facilities and multi-purpose sports courts 15 000
Total: Cape Winelands Municipalities 15 000
B WC047 Bitou Construction of sports and ablution facilities, a pavilion and a clubhouse 13 000
Total: Eden Municipalities 13 000
Total: Western Cape Municipalities 28 000
Unallocated 300 000 300 000
National Total 300 000 300 000 300 000

This gazette is also available free online at www.gpwonline.co.za
54 No. 40913 GOVERNMENT GAZETTE, 12 JUNE 2017
APP
EN
DIX
W4
(Nat
iona
l and
Mun
icip
al F
inan
cial
Yea
rs)
APP
END
IX T
O S
CH
EDU
LE 5
, PA
RT
B: T
AR
GE
TS
FOR
EX
PAN
DE
D P
UB
LIC
WO
RK
S PR
OG
RA
MM
E IN
TEG
RA
TED
GR
AN
T
FOR
MU
NIC
IPA
LIT
IES

This gazette is also available free online at www.gpwonline.co.za
STAATSKOERANT, 12 JUNIE 2017 No. 40913 55
Expanded Public Works Programme Integrated Grant for Municipalities
EASTERN CAPE
A BUF Buffalo City 1 589 4 952A NMA Nelson Mandela Bay 1 879 4 807
B EC101 Dr Beyers Naude 51 1 383B EC102 Blue Crane Route 36 1 000B EC104 Makana 57 1 000B EC105 Ndlambe 63 1 000B EC106 Sundays River Valley 60 1 000B EC108 Kouga 72 1 000B EC109 Kou-Kamma 38 1 000C DC10 Sarah Baartman District Municipality 7 1 000Total: Sarah Baartman Municipalities 384 8 383
B EC121 Mbhashe 151 4 236B EC122 Mnquma 145 2 316B EC123 Great Kei 31 1 263B EC124 Amahlathi 67 1 389B EC126 Ngqushwa 56 1 531B EC129 Raymond Mhlaba 92 1 662C DC12 Amathole District Municipality 905 1 527Total: Amathole Municipalities 1 447 13 924
B EC131 Inxuba Yethemba 40 1 079B EC135 Intsika Yethu 105 2 520B EC136 Emalahleni 78 1 308B EC137 Engcobo 88 1 391B EC138 Sakhisizwe 44 1 108B EC139 Enoch Mgijima 144 4 889C DC13 Chris Hani District Municipality 670 10 037Total: Chris Hani Municipalities 1 169 22 332
B EC141 Elundini 98 2 649B EC142 Senqu 89 1 536B EC145 Walter Sisulu 50 1 619C DC14 Joe Gqabi District Municipality 343 2 227Total: Joe Gqabi Municipalities 580 8 031
B EC153 Ngquza Hill 125 1 880B EC154 Port St Johns 81 1 501B EC155 Nyandeni 134 1 291B EC156 Mhlontlo 100 1 417B EC157 King Sabata Dalindyebo 202 3 584C DC15 O.R. Tambo District Municipality 1 353 4 811Total: O.R.Tambo Municipalities 1 995 14 484
B EC441 Matatiele 120 2 780B EC442 Umzimvubu 112 2 537B EC443 Mbizana 110 1 704B EC444 Ntabankulu 71 2 311C DC44 Alfred Nzo District Municipality 853 10 280Total: Alfred Nzo Municipalities 1 266 19 612
Total: Eastern Cape Municipalities 10 309 96 525
APPENDIX W4
APPENDIX TO SCHEDULE 5, PART B: TARGETS FOR EXPANDED PUBLIC WORKS PROGRAMME INTEGRATED GRANT FOR MUNICIPALITIES
FTE Target for2017/18
National and Municipal Financial Year
Category Municipality 2017/18(R'000)
2018/19(R'000)
2019/20(R'000)

This gazette is also available free online at www.gpwonline.co.za
56 No. 40913 GOVERNMENT GAZETTE, 12 JUNE 2017
Expanded Public Works Programme Integrated Grant for Municipalities
APPENDIX W4
APPENDIX TO SCHEDULE 5, PART B: TARGETS FOR EXPANDED PUBLIC WORKS PROGRAMME INTEGRATED GRANT FOR MUNICIPALITIES
FTE Target for2017/18
National and Municipal Financial Year
Category Municipality 2017/18(R'000)
2018/19(R'000)
2019/20(R'000)
FREE STATE
A MAN Mangaung 1 593 7 629
B FS161 Letsemeng 43 1 000B FS162 Kopanong 50 1 000B FS163 Mohokare 44 1 000C DC16 Xhariep District Municipality 7 1 000Total: Xhariep Municipalities 144 4 000
B FS181 Masilonyana 55 1 000B FS182 Tokologo 41 1 000B FS183 Tswelopele 41 1 000B FS184 Matjhabeng 252 1 000B FS185 Nala 68 1 000C DC18 Lejweleputswa District Municipality 7 1 000Total: Lejweleputswa Municipalities 464 6 000
B FS191 Setsoto 110 1 889B FS192 Dihlabeng 86 1 000B FS193 Nketoana 59 1 000B FS194 Maluti-a-Phofung 370 5 219B FS195 Phumelela 50 1 000B FS196 Mantsopa 48 1 000C DC19 Thabo Mofutsanyana District Municipality 14 2 142Total: Thabo Mofutsanyana Municipalities 737 13 250
B FS201 Moqhaka 90 1 000B FS203 Ngwathe 93 1 000B FS204 Metsimaholo 99 1 000B FS205 Mafube 53 1 000C DC20 Fezile Dabi District Municipality Total: Fezile Dabi Municipalities 335 4 000
Total: Free State Municipalities 3 273 34 879
GAUTENG
A EKU Ekurhuleni 4 321 44 718A JHB City of Johannesburg 3 895 17 421A TSH City of Tshwane 3 412 20 451
B GT421 Emfuleni 367 2 847B GT422 Midvaal 72 1 119B GT423 Lesedi 63 1 324C DC42 Sedibeng District Municipality 17 2 490Total: Sedibeng Municipalities 519 7 780
B GT481 Mogale City 244 4 917B GT484 Merafong City 176 1 470B GT485 Rand West City 137 2 673C DC48 West Rand District Municipality 7 1 000Total: West Rand Municipalities 564 10 060
Total: Gauteng Municipalities 12 711 100 430

This gazette is also available free online at www.gpwonline.co.za
STAATSKOERANT, 12 JUNIE 2017 No. 40913 57
Expanded Public Works Programme Integrated Grant for Municipalities
APPENDIX W4
APPENDIX TO SCHEDULE 5, PART B: TARGETS FOR EXPANDED PUBLIC WORKS PROGRAMME INTEGRATED GRANT FOR MUNICIPALITIES
FTE Target for2017/18
National and Municipal Financial Year
Category Municipality 2017/18(R'000)
2018/19(R'000)
2019/20(R'000)
KWAZULU-NATAL
A ETH eThekwini 4 459 66 792
B KZN212 uMdoni 70 1 000B KZN213 uMzumbe 79 1 291B KZN214 uMuziwabantu 55 1 006B KZN216 Ray Nkonyeni 149 3 306C DC21 Ugu District Municipality 519 1 956Total: Ugu Municipalities 872 8 559
B KZN221 uMshwathi 71 2 065B KZN222 uMngeni 54 1 000B KZN223 Mpofana 32 1 000B KZN224 iMpendle 34 1 460B KZN225 Msunduzi 470 8 022B KZN226 Mkhambathini 40 1 089B KZN227 Richmond 48 1 443C DC22 uMgungundlovu District Municipality 225 1 428Total: uMgungundlovu Municipalities 974 17 507
B KZN235 Okhahlamba 84 3 911B KZN237 iNkosi Langalibalele 111 5 133B KZN238 Alfred Duma 149 3 347C DC23 uThukela District Municipality 412 3 724Total: uThukela Municipalities 756 16 115
B KZN241 eNdumeni 39 1 218B KZN242 Nquthu 71 1 003B KZN244 uMsinga 109 4 775B KZN245 uMvoti 68 1 007C DC24 uMzinyathi District Municipality 410 2 444Total: uMzinyathi Municipalities 697 10 447
B KZN252 Newcastle 264 4 166B KZN253 eMadlangeni 26 1 000B KZN254 Dannhauser 52 1 000C DC25 Amajuba District Municipality 98 1 789Total: Amajuba Municipalities 440 7 955
B KZN261 eDumbe 46 1 389B KZN262 uPhongolo 89 4 678B KZN263 AbaQulusi 86 1 505B KZN265 Nongoma 72 1 039B KZN266 Ulundi 83 2 995C DC26 Zululand District Municipality 512 5 760Total: Zululand Municipalities 888 17 366
B KZN271 uMhlabuyalingana 100 4 165B KZN272 Jozini 98 3 156B KZN275 Mtubatuba 75 1 558B KZN276 Big Five Hlabisa 58 2 051C DC27 uMkhanyakude District Municipality 457 1 008Total: uMkhanyakude Municipalities 788 11 938
B KZN281 uMfolozi 64 1 418B KZN282 uMhlathuze 253 4 143B KZN284 uMlalazi 103 2 985B KZN285 Mthonjaneni 52 2 222B KZN286 Nkandla 69 3 210C DC28 King Cetshwayo District Municipality 392 5 032Total: King Cetshwayo Municipalities 933 19 010
B KZN291 Mandeni 88 2 285B KZN292 KwaDukuza 116 1 565B KZN293 Ndwedwe 73 1 768B KZN294 Maphumulo 56 1 529C DC29 iLembe District Municipality 412 1 000Total: iLembe Municipalities 745 8 147
B KZN433 Greater Kokstad 42 1 000B KZN434 uBuhlebezwe 62 1 000B KZN435 uMzimkhulu 102 1 923B KZN436 Dr Nkosazana Dlamini Zuma 69 1 877C DC43 Harry Gwala District Municipality 432 1 718Total: Harry Gwala Municipalities 707 7 518
Total: KwaZulu-Natal Municipalities 12 259 191 354

This gazette is also available free online at www.gpwonline.co.za
58 No. 40913 GOVERNMENT GAZETTE, 12 JUNE 2017
Expanded Public Works Programme Integrated Grant for Municipalities
APPENDIX W4
APPENDIX TO SCHEDULE 5, PART B: TARGETS FOR EXPANDED PUBLIC WORKS PROGRAMME INTEGRATED GRANT FOR MUNICIPALITIES
FTE Target for2017/18
National and Municipal Financial Year
Category Municipality 2017/18(R'000)
2018/19(R'000)
2019/20(R'000)
LIMPOPO
B LIM331 Greater Giyani 154 4 364B LIM332 Greater Letaba 135 2 384B LIM333 Greater Tzaneen 227 4 918B LIM334 Ba-Phalaborwa 73 1 000B LIM335 Maruleng 63 1 124C DC33 Mopani District Municipality 964 1 725Total: Mopani Municipalities 1 616 15 515
B LIM341 LIM341 67 1 013B LIM343 LIM343 222 2 543B LIM344 Makhado 198 2 048B LIM345 LIM 345 176 1 000C DC34 Vhembe District Municipality 1 088 1 316Total: Vhembe Municipalities 1 751 7 920
B LIM351 Blouberg 101 1 562B LIM353 Molemole 79 1 000B LIM354 Polokwane 748 4 978B LIM355 Lepele-Nkumpi 119 1 160C DC35 Capricorn District Municipality 517 5 080Total: Capricorn Municipalities 1 564 13 780
B LIM361 Thabazimbi 69 1 008B LIM362 Lephalale 90 1 215B LIM366 Bela-Bela 56 1 000B LIM367 Mogalakwena 309 1 093B LIM368 LIM 368 80 1 160C DC36 Waterberg District Municipality 7 1 000Total: Waterberg Municipalities 611 6 476
B LIM471 Ephraim Mogale 79 1 447B LIM472 Elias Motsoaledi 123 1 444B LIM473 Makhuduthamaga 136 1 158B LIM476 LIM 476 183 1 279C DC47 Sekhukhune District Municipality 1 000 1 085Total: Sekhukhune Municipalities 1 521 6 413
Total: Limpopo Municipalities 7 063 50 104
MPUMALANGA
B MP301 Chief Albert Luthuli 189 1 477B MP302 Msukaligwa 118 1 458B MP303 Mkhondo 183 3 350B MP304 Dr Pixley ka Isaka Seme 66 1 759B MP305 Lekwa 66 1 013B MP306 Dipaleseng 50 1 706B MP307 Govan Mbeki 147 4 244C DC30 Gert Sibande District Municipality 30 4 459Total: Gert Sibande Municipalities 849 19 466
B MP311 Victor Khanye 66 2 275B MP312 Emalahleni 259 1 717B MP313 Steve Tshwete 137 5 270B MP314 Emakhazeni 46 1 290B MP315 Thembisile Hani 271 2 560B MP316 Dr JS Moroka 280 3 246C DC31 Nkangala District Municipality 28 4 182Total: Nkangala Municipalities 1 087 20 540
B MP321 Thaba Chweu 112 1 909B MP324 Nkomazi 517 7 174B MP325 Bushbuckridge 841 9 355B MP326 City of Mbombela 742 6 714C DC32 Ehlanzeni District Municipality 29 4 355Total: Ehlanzeni Municipalities 2 241 29 507
Total: Mpumalanga Municipalities 4 177 69 513

This gazette is also available free online at www.gpwonline.co.za
STAATSKOERANT, 12 JUNIE 2017 No. 40913 59
Expanded Public Works Programme Integrated Grant for Municipalities
APPENDIX W4
APPENDIX TO SCHEDULE 5, PART B: TARGETS FOR EXPANDED PUBLIC WORKS PROGRAMME INTEGRATED GRANT FOR MUNICIPALITIES
FTE Target for2017/18
National and Municipal Financial Year
Category Municipality 2017/18(R'000)
2018/19(R'000)
2019/20(R'000)
NORTHERN CAPE
B NC061 Richtersveld 22 1 000B NC062 Nama Khoi 37 1 000B NC064 Kamiesberg 22 1 000B NC065 Hantam 27 1 000B NC066 Karoo Hoogland 23 1 000B NC067 Khâi-Ma 23 1 000C DC6 Namakwa District Municipality 7 1 000Total: Namakwa Municipalities 161 7 000
B NC071 Ubuntu 27 1 000B NC072 Umsobomvu 30 1 000B NC073 Emthanjeni 32 1 086B NC074 Kareeberg 23 1 000B NC075 Renosterberg 22 1 000B NC076 Thembelihle 26 1 000B NC077 Siyathemba 27 1 000B NC078 Siyancuma 41 1 000C DC7 Pixley Ka Seme District Municipality 7 1 000Total: Pixley Ka Seme Municipalities 235 9 086
B NC082 !Kai !Garib 53 1 000B NC084 !Kheis 29 1 000B NC085 Tsantsabane 39 1 000B NC086 Kgatelopele 23 1 000B NC087 Dawid Kruiper 59 1 161C DC8 Z.F. Mgcawu District Municipality 7 1 000Total: Z.F. Mgcawu Municipalities 210 6 161
B NC091 Sol Plaatjie 134 4 762B NC092 Dikgatlong 47 1 000B NC093 Magareng 30 1 000B NC094 Phokwane 61 1 000C DC9 Frances Baard District Municipality 8 1 168Total: Frances Baard Municipalities 280 8 930
B NC451 Joe Morolong 132 1 000B NC452 Ga-Segonyana 118 1 000B NC453 Gamagara 33 1 158C DC45 John Taolo Gaetsewe District Municipality 7 1 000Total: John Taolo Gaetsewe Municipalities 290 4 158
Total: Northern Cape Municipalities 1 176 35 335
NORTH WEST
B NW371 Moretele 233 1 544B NW372 Madibeng 556 2 591B NW373 Rustenburg 461 4 249B NW374 Kgetlengrivier 58 1 362B NW375 Moses Kotane 296 1 000C DC37 Bojanala Platinum District Municipality 12 1 747Total: Bojanala Platinum Municipalities 1 616 12 493
B NW381 Ratlou 73 1 997B NW382 Tswaing 68 1 182B NW383 Mafikeng 169 6 444B NW384 Ditsobotla 83 1 208B NW385 Ramotshere Moiloa 83 1 091C DC38 Ngaka Modiri Molema District Municipality 638 1 299Total: Ngaka Modiri Molema Municipalities 1 114 13 221
B NW392 Naledi 50 2 224B NW393 Mamusa 40 1 245B NW394 Greater Taung 107 1 309B NW396 Lekwa-Teemane 38 1 188B NW397 Kagisano-Molopo 84 3 225C DC39 Dr Ruth Segomotsi Mompati District Municipality 324 4 842Total: Dr Ruth Segomotsi Mompati Municipalities 643 14 033
B NW403 City of Matlosana 195 2 246B NW404 Maquassi Hills 65 1 000b NW405 Ventersdorp/Tlokwe 163 3 868C DC40 Dr Kenneth Kaunda District Municipality 9 1 292Total: Dr Kenneth Kaunda Municipalities 432 8 406
Total: North West Municipalities 3 805 48 153

This gazette is also available free online at www.gpwonline.co.za
60 No. 40913 GOVERNMENT GAZETTE, 12 JUNE 2017
Expanded Public Works Programme Integrated Grant for Municipalities
APPENDIX W4
APPENDIX TO SCHEDULE 5, PART B: TARGETS FOR EXPANDED PUBLIC WORKS PROGRAMME INTEGRATED GRANT FOR MUNICIPALITIES
FTE Target for2017/18
National and Municipal Financial Year
Category Municipality 2017/18(R'000)
2018/19(R'000)
2019/20(R'000)
WESTERN CAPE
A CPT City of Cape Town 3 123 14 183
B WC011 Matzikama 53 1 406B WC012 Cederberg 44 1 807B WC013 Bergrivier 41 1 601B WC014 Saldanha Bay 50 1 500B WC015 Swartland 53 1 404C DC1 West Coast District Municipality 7 1 100Total: West Coast Municipalities 248 8 818
B WC022 Witzenberg 56 1 485B WC023 Drakenstein 88 2 456B WC024 Stellenbosch 106 4 820B WC025 Breede Valley 85 2 093B WC026 Langeberg 58 1 866C DC2 Cape Winelands District Municipality 7 1 000Total: Cape Winelands Municipalities 400 13 720
B WC031 Theewaterskloof 65 1 621B WC032 Overstrand 60 2 300B WC033 Cape Agulhas 30 1 131B WC034 Swellendam 33 1 291C DC3 Overberg District Municipality 8 1 142Total: Overberg Municipalities 196 7 485
B WC041 Kannaland 28 1 000B WC042 Hessequa 35 1 033B WC043 Mossel Bay 64 2 291B WC044 George 109 4 001B WC045 Oudtshoorn 65 2 911B WC047 Bitou 56 2 232B WC048 Knysna 60 1 415C DC4 Eden District Municipality 9 1 280Total: Eden Municipalities 426 16 163
B WC051 Laingsburg 20 1 031B WC052 Prince Albert 22 1 000B WC053 Beaufort West 40 1 659C DC5 Central Karoo District Municipality 7 1 095Total: Central Karoo Municipalities 89 4 785
Total: Western Cape Municipalities 4 482 65 154
Unallocated
National Total 59 255 691 447

This gazette is also available free online at www.gpwonline.co.za
STAATSKOERANT, 12 JUNIE 2017 No. 40913 61
APP
EN
DIX
W5
APP
END
IX T
O S
CH
ED
ULE
5, P
AR
T B
AN
D S
CH
ED
UL
E 6
, PA
RT
B: R
EG
ION
AL
BU
LK
INFR
AST
RU
CT
UR
E G
RA
NT
(Nat
iona
l and
Mun
icip
al F
inan
cial
Yea
rs)
BRE
AK
DO
WN
OF
RE
GIO
NA
L B
UL
K IN
FRA
STR
UC
TU
RE
GR
AN
T A
LL
OC
AT
ION
S PE
R L
OC
AL
MU
NIC
IPA
LIT
Y P
ER
PRO
JEC
T

This gazette is also available free online at www.gpwonline.co.za
62 No. 40913 GOVERNMENT GAZETTE, 12 JUNE 2017A
PPEN
DIX
W5
APP
END
IX T
O S
CH
EDU
LE 5
, PA
RT
B A
ND
SC
HED
ULE
6, P
AR
T B
: REG
ION
AL
BU
LK IN
FRA
STR
UC
TUR
E G
RA
NT
BR
EAK
DO
WN
OF
REG
ION
AL
BU
LK IN
FRA
STR
UC
TUR
E G
RA
NT
ALL
OC
ATI
ON
S PE
R L
OC
AL
MU
NIC
IPA
LITY
PER
PR
OJE
CT
EA
STE
RN
CA
PE
Noo
itged
agt B
ulk
Wat
er S
uppl
yA
NM
AN
elso
n M
ande
la B
ay M
etro
polit
an M
unic
ipal
ityN
elso
n M
ande
la B
ay M
etro
polit
an M
unic
ipal
ity 9
2 00
5 1
60 0
00 1
85 0
00
92
005
160
000
185
000
ECR0
42Ik
wez
i Bul
k W
ater
Sup
ply
BEC
101
Dr B
eyer
s Nau
de L
ocal
Mun
icip
ality
Dr B
eyer
s Nau
de L
ocal
Mun
icip
ality
5 0
00 1
7 00
0 2
000
ECR0
41M
isgu
nd B
ulk
Wat
er S
uppl
yB
EC10
9K
ou-k
amm
a L
ocal
Mun
icip
ality
Kou
kam
ma
Loc
al M
unic
ipal
ity 5
000
4 0
00 1
000
ECR0
47Ja
mes
Kle
ynha
ns B
ulk
Wat
er S
uppl
y (B
WS)
BEC
104
Mak
ana
Loca
l Mun
icip
ality
Mak
ana
Loca
l Mun
icip
ality
25
000
25
000
15
000
EC N
EW
Belm
ont W
aste
Wat
er T
reat
men
t Wor
ks (W
WTW
)B
EC10
4M
akan
a Lo
cal M
unic
ipal
ityM
akan
a Lo
cal M
unic
ipal
ity 9
000
6 0
00 1
5 00
0BE
PM
akan
a Bu
lk S
ewer
BEC
104
Mak
ana
Loca
l Mun
icip
ality
Mak
ana
Loca
l Mun
icip
ality
12
000
EC N
EW
May
field
Was
te W
ater
Tre
atm
ent W
orks
BEC
104
Mak
ana
Loca
l Mun
icip
ality
Mak
ana
Loca
l Mun
icip
ality
5 0
00 2
0 00
0 8
000
ECR0
38G
raaf
-Rei
net E
mer
genc
y W
ater
Sup
ply
Sche
me
(WSS
)B
EC10
1D
r Bey
ers N
aude
Loc
al M
unic
ipal
ityD
r Bey
ers N
aude
Loc
al M
unic
ipal
ity 2
5 00
0 1
0 00
0 3
500
ECR0
37N
dlam
be D
am/ A
lban
y C
oast
BW
S (G
raha
nsto
wn
&
Port
Alfr
ed A
ugm
enta
tion)
BEC
105
Ndl
ambe
Loc
al M
unic
ipal
ity
Ndl
ambe
Loc
al M
unic
ipal
ity
25
000
ECR0
24Su
nday
s Riv
er -
Pate
rson
Bul
k W
ater
Sup
ply
BEC
106
Sund
ays R
iver
Val
ley
Loca
l Mun
icip
ality
Sund
ays R
iver
Val
ley
Loca
l Mun
icip
ality
1 0
00EC
R043
Kirk
woo
d W
ater
Tre
atm
ent W
orks
BEC
106
Sund
ays R
iver
Val
ley
Loca
l Mun
icip
ality
Sund
ays R
iver
Val
ley
Loca
l Mun
icip
ality
5 0
00 1
1 00
0 2
000
ECR0
39St
eytle
rvill
e W
ater
Sup
ply
Sche
me
BEC
101
Dr B
eyer
s Nau
de L
ocal
Mun
icip
ality
Dr B
eyer
s Nau
de L
ocal
Mun
icip
ality
2 0
00
119
000
93
000
46
500
ECR0
15X
hora
Eas
t Wat
er S
uppl
yC
DC
12A
mat
hole
Dis
trict
Mun
icip
ality
Mbh
ashe
Loc
al M
unic
ipal
ity 5
3 36
3 2
6 00
0 3
193
Sund
wan
a W
ater
Sup
ply
CD
C12
Am
atho
le D
istri
ct M
unic
ipal
ityM
bhas
he L
ocal
Mun
icip
ality
5 0
00 2
0 00
0 1
5 00
0EC
R006
Ibik
a W
ater
Sup
ply
CD
C12
Am
atho
le D
istri
ct M
unic
ipal
ityM
nqum
a Lo
cal M
unic
ipal
ityN
gqam
akhw
e Bu
lk W
ater
Sup
ply
CD
C12
Am
atho
le D
istri
ct M
unic
ipal
ityM
nqum
a Lo
cal M
unic
ipal
ity 4
000
5 0
00 2
0 00
0
62
363
51
000
38
193
ECR0
33C
lust
er 4
CH
DM
Bul
k W
ater
Sup
ply
CD
C13
Chr
is H
ani D
istri
ct M
unic
ipal
ityEn
gcob
o Lo
cal M
unic
ipal
ity 4
5 00
0 4
0 00
0 8
000
ECR0
28C
lust
er 6
CH
DM
Bul
k W
ater
Sup
ply
CD
C13
Chr
is H
ani D
istri
ct M
unic
ipal
ityEn
gcob
o Lo
cal M
unic
ipal
ity 3
5 00
0 7
000
5 0
00EC
R029
Clu
ster
9 C
HD
M B
ulk
Wat
er S
uppl
yC
DC
13C
hris
Han
i Dis
trict
Mun
icip
ality
Ints
ika
Yet
hu L
ocal
Mun
icip
ality
95
000
75
000
7 0
00EC
R002
Xon
xa B
ulk
Wat
er S
uppl
yC
DC
13C
hris
Han
i Dis
trict
Mun
icip
ality
Engc
obo
Loca
l Mun
icip
ality
26
000
7 0
00 5
000
Mid
dleb
urg
Gro
und
Wat
er S
uppl
yC
DC
13C
hris
Han
i Dis
trict
Mun
icip
ality
Enoc
h M
gijim
a Lo
cal M
unic
ipal
ity 6
000
3 0
00EC
R005
Hof
mey
er G
roun
d W
ater
Sup
ply
CD
C13
Chr
is H
ani D
istri
ct M
unic
ipal
ityEn
och
Mgi
jima
Loca
l Mun
icip
ality
1 5
00 2
08 5
00 1
32 0
00 2
5 00
0
Lady
Gre
y Bu
lk W
ater
Sup
ply
CD
C14
Joe
Gqa
bi D
istri
ct M
unic
ipal
itySe
nqu
Loca
l Mun
icip
ality
3 0
00 1
0 00
0 2
0 00
0EC
R046
Ster
kspr
uit W
aste
Wat
er T
reat
men
t Wor
ks
CD
C14
Joe
Gqa
bi D
istri
ct M
unic
ipal
itySe
nqu
Loca
l Mun
icip
ality
3 0
00 1
3 00
0 2
0 00
0 6
000
23
000
40
000
ECR0
19O
.R. T
ambo
, Mth
atha
, Kin
g Sa
bato
Dal
inye
bo W
ater
Su
pply
CD
C15
O.R
. Tam
bo D
istri
ct M
unic
ipal
ityK
ing
Saba
ta D
alin
dyeb
o Lo
cal M
unic
ipal
ity 2
500
7 0
00 1
3 00
0
ECR0
45O
.R. T
ambo
, Mth
atha
, Kin
g Sa
bato
Dal
inye
bo
Sani
tatio
nC
DC
15O
.R. T
ambo
Dis
trict
Mun
icip
ality
Kin
g Sa
bata
Dal
indy
ebo
Loca
l Mun
icip
ality
325
000
334
533
300
000
327
500
341
533
313
000
ECR0
01M
atat
iele
Bul
k W
ater
Sup
ply
Sche
me
CD
C44
Alfr
ed N
zo D
istri
ct M
unic
ipal
ityM
atat
iele
Loc
al M
unic
ipal
ity 2
0 00
0 2
000
EC N
EWK
inira
Reg
iona
l BW
SSC
DC
44A
lfred
Nzo
Dis
trict
Mun
icip
ality
Mat
atie
le L
ocal
Mun
icip
ality
2 0
00 2
000
8 0
00EC
R 04
4N
taba
nkul
u Bu
lk W
ater
Sup
ply
CD
C44
Alfr
ed N
zo D
istri
ct M
unic
ipal
ityN
taba
nkul
u L
ocal
Mun
icip
ality
2 0
00 2
000
10
000
EC N
EWM
ount
Ayl
iff B
ulk
Peri
Urb
an W
ater
Sup
ply
CD
C44
Alfr
ed N
zo D
istri
ct M
unic
ipal
ityU
mzi
mvu
bu L
ocal
Mun
icip
ality
15
000
75
441
35
000
EC N
EWM
kem
ane
Regi
onal
Bul
k W
SSC
DC
44A
lfred
Nzo
Dis
trict
Mun
icip
ality
Um
zim
vubu
Loc
al M
unic
ipal
ity 1
000
2 0
00 1
5 00
0 4
0 00
0 8
3 44
1 6
8 00
0
542
000
496
533
378
000
313
368
387
441
337
693
Tot
al:
Nel
son
Man
dela
Bay
Met
ropo
litan
Mun
icip
ality
Tot
al: S
arah
Baa
rtm
an M
unic
ipal
ities
Tot
al: A
mat
ole
Mun
icip
aliti
es
Tot
al: C
hris
Han
i Mun
icip
aliti
es
Tot
al: J
oe G
qabi
Mun
icip
aliti
es
Tot
al: O
.R. T
ambo
Mun
icip
aliti
es
Tot
al: A
lfred
Nzo
Mun
icip
aliti
es
Tot
al: E
aste
rn C
ape
Mun
icip
aliti
es
Bre
akdo
wn
of r
egio
nal b
ulk
infr
astr
uctu
re g
rant
allo
catio
ns p
er lo
cal m
unic
ipal
ity p
er p
roje
ctSc
hedu
le 5
, Par
t BSc
hedu
le 6
, Par
t B
Nat
iona
l and
Mun
icip
al F
inan
cial
Yea
rPr
ojec
t C
ode
Proj
ect N
ame
Cat
egor
yW
ater
Ser
vice
Aut
hori
tyB
enef
iting
Mun
icip
ality
201
7/18
(R'0
00)
201
8/19
(R'0
00)
201
9/20
(R'0
00)
201
7/18
(R'0
00)
201
8/19
(R'0
00)
201
9/20
(R'0
00)

This gazette is also available free online at www.gpwonline.co.za
STAATSKOERANT, 12 JUNIE 2017 No. 40913 63A
PPEN
DIX
W5
APP
END
IX T
O S
CH
EDU
LE 5
, PA
RT
B A
ND
SC
HED
ULE
6, P
AR
T B
: REG
ION
AL
BU
LK IN
FRA
STR
UC
TUR
E G
RA
NT
BR
EAK
DO
WN
OF
REG
ION
AL
BU
LK IN
FRA
STR
UC
TUR
E G
RA
NT
ALL
OC
ATI
ON
S PE
R L
OC
AL
MU
NIC
IPA
LITY
PER
PR
OJE
CT
Bre
akdo
wn
of r
egio
nal b
ulk
infr
astr
uctu
re g
rant
allo
catio
ns p
er lo
cal m
unic
ipal
ity p
er p
roje
ctSc
hedu
le 5
, Par
t BSc
hedu
le 6
, Par
t B
Nat
iona
l and
Mun
icip
al F
inan
cial
Yea
rPr
ojec
t C
ode
Proj
ect N
ame
Cat
egor
yW
ater
Ser
vice
Aut
hori
tyB
enef
iting
Mun
icip
ality
201
7/18
(R'0
00)
201
8/19
(R'0
00)
201
9/20
(R'0
00)
201
7/18
(R'0
00)
201
8/19
(R'0
00)
201
9/20
(R'0
00)
FRE
E S
TA
TE
Wel
beda
cht P
ipel
ine
AM
AN
Man
gaun
g M
etro
polit
an M
unic
ipal
ityM
anga
ung
Met
ropo
litan
Mun
icip
ality
90
000
109
000
274
832
Dew
etsd
orp
Out
fall
Sew
er L
ine
AM
AN
Man
gaun
g M
etro
polit
an M
unic
ipal
ityM
anga
ung
Met
ropo
litan
Mun
icip
ality
3 1
41 9
3 14
1 1
09 0
00 2
74 8
32FS
R002
Jage
rsfo
ntei
n / F
aure
smith
Bul
k W
ater
Sup
ply
BFS
162
Kop
anon
g Lo
cal M
unic
ipal
ityK
opan
ong
Loca
l Mun
icip
ality
3 0
00FS
R005
Roux
ville
/ Sm
ithfie
ld /Z
astro
n Bu
lk W
ater
Sup
ply
BFS
163
Moh
okar
e Lo
cal M
unic
ipal
ity
Moh
okar
e Lo
cal M
unic
ipal
ity
20
000
30
000
20
000
Roux
ville
Out
fall
Sew
erB
FS16
3M
ohok
are
Loca
l Mun
icip
ality
M
ohok
are
Loca
l Mun
icip
ality
1
685
20
000
30
000
20
000
4 6
85
FSR0
11M
asilo
nyan
a B
ulk
Wat
er S
uppl
yB
FS18
1M
asilo
nyan
a Lo
cal M
unic
ipal
ity
Mas
ilony
ana
Loca
l Mun
icip
ality
1
5 00
0 3
0 00
0 5
0 00
0FS
040
Mas
ilony
ana
Bulk
Sew
er(B
rand
fort&
Win
burg
)B
FS18
1M
asilo
nyan
a Lo
cal M
unic
ipal
ity
Mas
ilony
ana
Loca
l Mun
icip
ality
1
500
13
493
20
000
FSR0
08To
kolo
go R
egio
nal W
ater
Sup
ply
2B
FS18
2To
kolo
go L
ocal
Mun
icip
ality
Toko
logo
Loc
al M
unic
ipal
ity 4
5 00
0 4
0 00
0 5
0 00
0BE
PD
eale
svill
e C
onst
ruct
ion
of a
sew
er M
ains
- 200
mm
BFS
182
Toko
logo
Loc
al M
unic
ipal
ityTo
kolo
go L
ocal
Mun
icip
ality
8 5
00BE
PH
ertz
ogvi
lle O
utfa
ll Se
wer
+ P
umps
tatio
nB
FS18
2To
kolo
go L
ocal
Mun
icip
ality
Toko
logo
Loc
al M
unic
ipal
ity 1
740
BEP
Bosh
off O
utfa
ll Se
wer
BFS
182
Toko
logo
Loc
al M
unic
ipal
ityTo
kolo
go L
ocal
Mun
icip
ality
225
BEP
Her
zogv
ille
Out
fall
Sew
erB
FS18
2To
kolo
go L
ocal
Mun
icip
ality
Toko
logo
Loc
al M
unic
ipal
ity 3
282
Tsw
elop
ele
Bulk
Wat
er S
uppl
yB
FS18
3Ts
wel
opel
e Lo
cal M
unic
ipal
ityTs
wel
opel
e Lo
cal M
unic
ipal
ity 2
5 00
0 2
0 00
0FS
038
Mat
hjab
eng
Bulk
Sew
er (W
elko
m)
BFS
184
Mat
jhab
eng
Loc
al M
unic
ipal
ityM
atjh
aben
g L
ocal
Mun
icip
ality
3 0
00 5
138
50
000
Nal
a Bu
lk S
ewer
BFS
185
Nal
a Lo
cal M
unic
ipal
ityN
ala
Loca
l Mun
icip
ality
1 0
00 1
5 00
0 3
0 00
0 5
0 00
0 8
5 74
0 8
2 13
8 1
20 0
00
FSR0
13Se
tsot
o Bu
lk W
ater
Sup
ply
BFS
191
Sets
oto
Loca
l Mun
icip
ality
Sets
oto
Loca
l Mun
icip
ality
20
000
20
000
10
000
BEP
Clo
cola
an C
onst
ruct
ion
of S
ewer
Mai
n ( 2
00m
m-
400m
m)
BFS
191
Sets
oto
Loca
l Mun
icip
ality
Sets
oto
Loca
l Mun
icip
ality
70
000
BEP
Sene
kal C
onst
ruct
ion
of a
Sew
er M
ains
( 20
0mm
-40
0mm
)B
FS19
1Se
tsot
o Lo
cal M
unic
ipal
itySe
tsot
o Lo
cal M
unic
ipal
ity 5
0 00
0
Sene
kal C
onst
ruct
ion
of a
Pum
psta
tion
BFS
191
Sets
oto
Loca
l Mun
icip
ality
Sets
oto
Loca
l Mun
icip
ality
25
000
BEP
Fisc
ksbu
rg O
utfa
ll Se
wer
and
Pum
psta
tion
BFS
191
Sets
oto
Loca
l Mun
icip
ality
Sets
oto
Loca
l Mun
icip
ality
47
299
FSR0
03D
ihla
beng
Bul
k W
ater
Sup
ply
B FS
192
Dih
labe
ng L
ocal
Mun
icip
ality
Dih
labe
ng L
ocal
Mun
icip
ality
15
000
10
000
20
000
FSR0
12N
keto
ana
Regi
onal
Wat
er S
uppl
y B
FS19
3N
keto
ana
Loca
l Mun
icip
ality
Nke
toan
a Lo
cal M
unic
ipal
ity 3
0 00
0 4
0 00
0 4
0 00
0FS
R031
Man
tsop
a Bu
lk S
ewer
(Lad
ybra
nd)
BFS
196
Man
tsop
a Lo
cal M
unic
ipal
ityM
ants
opa
Loca
l Mun
icip
ality
1 0
00 2
0 00
0 1
000
BEP
RS12
8-Re
itz a
nd L
indl
ey C
ons G
rey
PLB
FS19
3N
keto
ana
Loca
l Mun
icip
ality
Nke
toan
a Lo
cal M
unic
ipal
ity 5
000
BEP
Petru
s Ste
yn R
efur
bish
men
t of a
Pac
kage
Pla
ntB
FS19
3N
keto
ana
Loca
l Mun
icip
ality
Nke
toan
a Lo
cal M
unic
ipal
ity 5
947
BEP
Petru
s Ste
yn O
utfa
ll Se
wer
BFS
193
Nke
toan
a Lo
cal M
unic
ipal
ityN
keto
ana
Loca
l Mun
icip
ality
27
059
BEP
Arli
ngto
n G
rey
Wat
er P
acka
ge P
lant
BFS
193
Nke
toan
a Lo
cal M
unic
ipal
ityN
keto
ana
Loca
l Mun
icip
ality
25
000
FSR0
07M
alut
i-a-P
hofu
ng B
WS
Phas
e 2
BFS
194
Mal
uti-a
-Pho
fung
Loc
al M
unic
ipal
ityM
alut
i-a-P
hofu
ng L
ocal
Mun
icip
ality
30
000
40
000
40
000
FSR0
06Ph
umel
ela
Bulk
Wat
er S
uppl
yB
FS19
5Ph
umel
ela
Loca
l Mun
icip
ality
Ph
umel
ela
Loca
l Mun
icip
ality
4
0 00
0 2
3 00
0BE
PM
emel
Ref
urbi
shm
ent W
WTW
and
Sew
erB
FS19
5Ph
umel
ela
Loca
l Mun
icip
ality
Ph
umel
ela
Loca
l Mun
icip
ality
3
500
FSR0
15M
ants
opa-
Twee
spru
it, E
xcel
sior
, Hob
hous
e Bu
lk
Wat
er S
uppl
yB
FS19
6M
ants
opa
Loca
l Mun
icip
ality
Man
tsop
a Lo
cal M
unic
ipal
ity 1
5 00
0 2
0 00
0 3
0 00
0
35
000
40
000
40
000
324
805
183
000
101
000
FSR0
10M
oqha
ka B
ulk
Wat
er S
uppl
yB
FS20
1M
oqha
ka L
ocal
mun
icip
ality
Moq
haka
Loc
al m
unic
ipal
ity 2
0 00
0BE
PH
eilb
ron
Sew
er a
nd P
umps
tatio
nB
FS20
3N
gwat
he L
ocal
Mun
icip
ality
Ngw
athe
Loc
al M
unic
ipal
ity 9
938
FSR0
09N
gwat
he B
ulk
Wat
er S
uppl
y Ph
ase
1 (V
rede
fort)
BFS
203
Ngw
athe
Loc
al M
unic
ipal
ityN
gwat
he L
ocal
Mun
icip
ality
10
000
25
000
25
000
Ngw
athe
Bul
k W
ater
Sup
ply
Phas
e 2
BFS
203
Ngw
athe
Loc
al M
unic
ipal
ityN
gwat
he L
ocal
Mun
icip
ality
15
000
30
000
40
000
FSR0
39U
pgra
ding
of D
eney
svill
e W
WTW
BFS
204
Met
sim
ahol
o Lo
cal M
unic
ipal
ityM
etsi
mah
olo
Loca
l Mun
icip
ality
35
000
3 0
00FS
R021
Fran
kfor
t Bul
k Se
wer
BFS
205
Maf
ube
Loca
l Mun
icip
ality
Maf
ube
Loca
l Mun
icip
ality
20
000
30
000
20
000
BEP
Twee
ling
Sew
er P
umps
tatio
nB
FS20
5M
afub
e Lo
cal M
unic
ipal
ityM
afub
e Lo
cal M
unic
ipal
ity 7
459
BEP
Fran
kfor
t Ris
ing
Mai
nB
FS20
5M
afub
e Lo
cal M
unic
ipal
ityM
afub
e Lo
cal M
unic
ipal
ity 7
610
15
000
30
000
40
000
110
007
58
000
45
000
85
000
130
000
150
000
618
378
432
138
540
832
Tot
al: L
ejw
elep
utsw
a M
unic
ipal
ities
Tot
al: T
habo
Mof
utsa
nyan
a M
unic
ipal
ities
Tot
al: F
ezile
Dab
i Mun
icip
aliti
es
Tot
al: F
ree
Stat
e M
unic
ipal
ities
Tot
al: X
hari
ep M
unic
ipal
ities
Tot
al: M
anga
ung
Met
ro

This gazette is also available free online at www.gpwonline.co.za
64 No. 40913 GOVERNMENT GAZETTE, 12 JUNE 2017
APP
END
IX W
5
APP
END
IX T
O S
CH
EDU
LE 5
, PA
RT
B A
ND
SC
HED
ULE
6, P
AR
T B
: REG
ION
AL
BU
LK IN
FRA
STR
UC
TUR
E G
RA
NT
BR
EAK
DO
WN
OF
REG
ION
AL
BU
LK IN
FRA
STR
UC
TUR
E G
RA
NT
ALL
OC
ATI
ON
S PE
R L
OC
AL
MU
NIC
IPA
LITY
PER
PR
OJE
CT
Bre
akdo
wn
of r
egio
nal b
ulk
infr
astr
uctu
re g
rant
allo
catio
ns p
er lo
cal m
unic
ipal
ity p
er p
roje
ctSc
hedu
le 5
, Par
t BSc
hedu
le 6
, Par
t B
Nat
iona
l and
Mun
icip
al F
inan
cial
Yea
rPr
ojec
t C
ode
Proj
ect N
ame
Cat
egor
yW
ater
Ser
vice
Aut
hori
tyB
enef
iting
Mun
icip
ality
201
7/18
(R'0
00)
201
8/19
(R'0
00)
201
9/20
(R'0
00)
201
7/18
(R'0
00)
201
8/19
(R'0
00)
201
9/20
(R'0
00)
GA
UT
EN
G
GPR
001
Sedi
beng
Reg
iona
l Was
te W
ater
Tre
atm
ent W
orks
B
GT4
21Em
fule
ni L
ocal
Mun
icip
ality
Emfu
leni
, Mid
vaal
and
City
of J
ohan
nesb
erg
2 5
00 8
7 65
8 1
97 8
00G
PR00
5Se
boke
ng W
aste
Wat
er T
reat
men
t Wor
ksB
GT4
21Em
fule
ni L
ocal
Mun
icip
ality
Emfu
leni
Loc
al M
unic
ipal
ity 1
65 5
33 1
90 7
00 9
0 85
1G
PR00
8Ro
thde
ne p
ump
stat
ion
and
risin
g m
ain
BG
T422
Mid
vaal
Loc
al M
unic
ipal
ityM
idva
al L
ocal
Mun
icip
ality
18
000
19
500
GPR
006
Mey
erto
n W
aste
Wat
er T
reat
men
t Wor
ksB
GT4
22M
idva
al L
ocal
Mun
icip
ality
Mid
vaal
Loc
al M
unic
ipal
ity 5
5 00
0 4
5 50
0 7
000
241
033
343
358
295
651
GPR
002
Wes
tona
ria R
egio
nal B
ulk
Sani
tatio
n (Z
uurb
ekom
)B
GT4
85Ra
nd W
est C
ity L
ocal
Mun
icip
ality
Rand
Wes
t City
Loc
al M
unic
ipal
ity 5
5 25
1 8
0 50
0 1
90 9
00G
PR00
9M
ohla
keng
pum
p st
atio
n an
d se
wer
out
fall
BG
T485
Rand
Wes
t City
Loc
al M
unic
ipal
ityRa
nd W
est C
ity L
ocal
Mun
icip
ality
3 7
60 4
3 70
0 1
47 5
00 5
9 01
1 1
24 2
00 3
38 4
00
300
044
467
558
634
051
KW
AZ
UL
U-N
AT
AL
Spio
enko
p to
Lad
ysm
ith B
WS
CD
C23
uThu
kela
Dis
trict
Mun
icip
ality
Alfr
ed D
uma
Loca
l Mun
icip
ality
85
052
100
000
50
000
KN
R010
Drie
font
ein
Inda
ka B
ulk
Wat
er S
uppl
yC
DC
23uT
huke
la D
istri
ct M
unic
ipal
ityA
lfred
Dum
a Lo
cal M
unic
ipal
ity 1
0 00
0 9
5 05
2 1
00 0
00 5
0 00
0
KN
R008
Gre
ytow
n Re
gion
al B
ulk
Sche
me
CD
C24
uMzi
nyat
hi D
istri
ct M
unic
ipal
ityuM
voti
Loca
l Mun
icip
ality
98
933
60
000
40
000
98
933
60
000
40
000
KN
R001
Non
gom
a Bu
lk W
ater
Sch
eme
CD
C26
Zulu
land
Dis
trict
Mun
icip
ality
Non
gom
a Lo
cal M
unic
ipal
ity
70
000
65
170
KN
R002
Man
dlak
azi B
ulk
Wat
er S
uppl
yC
DC
26Zu
lula
nd D
istri
ct M
unic
ipal
ityuP
hong
olo
& N
ongo
ma
Loca
l Mun
icip
aliti
es 4
0 00
0 8
9 71
3 5
0 00
0 1
10 0
00 1
54 8
83 5
0 00
0
KN
R015
Pong
olap
oort
Bulk
Wat
er S
chem
eC
DC
27U
mkh
anya
kude
Dis
trict
Mun
icip
ality
Jozi
ni L
ocal
Mun
icip
ality
119
000
KN
R014
Duk
uduk
u Re
settl
emen
tC
DC
27U
mkh
anya
kude
Dis
trict
Mun
icip
ality
Mtu
batu
ba/B
ig F
ive
Hla
bisa
Loc
al M
unic
ipal
ities
1 0
00 1
20 0
00
KN
R005
Gre
ater
Mth
onja
neni
Bul
k W
ater
Sup
ply
CD
C28
Kin
g C
etsh
way
o D
istri
ct M
unic
ipal
ityM
thon
jane
ni/ N
kand
la L
ocal
Mun
icip
aliti
es 3
6 41
0 5
0 00
0 4
0 00
0K
NR0
16M
iddl
edrif
t (N
kand
la) R
egio
nal B
ulk
Wat
er S
uppl
yC
DC
28K
ing
Cet
shw
ayo
Dis
trict
Mun
icip
ality
Nka
ndla
Loc
al M
unic
ipal
ity 3
0 00
0 5
4 83
0 5
0 00
0 6
6 41
0 1
04 8
30 9
0 00
0
KN
R011
Ngc
ebo
Regi
onal
Wat
er B
ulk
(Low
er T
ugel
a)C
DC
29iL
embe
Dis
trict
Mun
icip
ality
Map
hum
ulo
Loca
l Mun
icip
ality
145
000
90
000
65
000
145
000
90
000
65
000
KN
R007
Gre
ater
Bul
wer
Don
nybr
ook
Wat
er S
chem
eC
DC
43H
arry
Gw
ala
Dis
trict
Mun
icip
ality
Dr N
kosa
zana
Dla
min
i Zum
a an
d uB
uhle
bezw
e Lo
cal M
unic
ipal
ities
90
000
100
000
97
923
90
000
100
000
97
923
605
395
609
713
392
923
120
000
Tot
al: u
Mkh
anya
kude
Mun
icip
aliti
es
Tot
al: K
ing
Cet
shw
ayo
Mun
icip
aliti
es
Tot
al: i
Lem
be M
unic
ipal
ities
Tot
al: S
ison
ke M
unic
ipal
ities
Tot
al: K
waZ
ulu-
Nat
al M
unic
ipal
ities
Tot
al: Z
ulul
and
Mun
icip
aliti
es
Tot
al: S
edib
eng
Mun
icip
aliti
es
Tot
al: W
est R
and
Mun
icip
aliti
es
Tot
al: G
aute
ng M
unic
ipal
ities
Tot
al:u
Thu
kela
Mun
icip
aliti
es
Tot
al: u
Mzi
nyat
hi M
unic
ipal
ities

This gazette is also available free online at www.gpwonline.co.za
STAATSKOERANT, 12 JUNIE 2017 No. 40913 65A
PPE
ND
IX W
5
APP
EN
DIX
TO
SC
HE
DU
LE
5, P
AR
T B
AN
D S
CH
ED
UL
E 6
, PA
RT
B: R
EG
ION
AL
BU
LK
INFR
AST
RU
CT
UR
E G
RA
NT
BR
EA
KD
OW
N O
F R
EG
ION
AL
BU
LK
INFR
AST
RU
CT
UR
E G
RA
NT
AL
LO
CA
TIO
NS
PER
LO
CA
L M
UN
ICIP
AL
ITY
PE
R P
RO
JEC
T
Bre
akdo
wn
of r
egio
nal b
ulk
infr
astr
uctu
re g
rant
allo
catio
ns p
er lo
cal m
unic
ipal
ity p
er p
roje
ctSc
hedu
le 5
, Par
t BSc
hedu
le 6
, Par
t B
Nat
iona
l and
Mun
icip
al F
inan
cial
Yea
rPr
ojec
t C
ode
Proj
ect N
ame
Cat
egor
yW
ater
Ser
vice
Aut
hori
tyB
enef
iting
Mun
icip
ality
201
7/18
(R'0
00)
201
8/19
(R'0
00)
201
9/20
(R'0
00)
201
7/18
(R'0
00)
201
8/19
(R'0
00)
201
9/20
(R'0
00)
LIM
POPO
LPR
018
Giy
ani B
ulk
Wat
er S
uppl
y D
roug
ht R
elie
f C
DC
33M
opan
i Dis
tric
t Mun
icip
ality
Gre
ater
Giy
ani L
ocal
Mun
icip
ality
200
000
256
200
LPR
027
Giy
ani W
ater
Ser
vice
sC
DC
33M
opan
i Dis
tric
t Mun
icip
ality
Gre
ater
Giy
ani L
ocal
Mun
icip
ality
200
318
Mam
etja
Sek
oror
o B
ulk
Wat
er S
uppl
yC
DC
33M
opan
i Dis
tric
t Mun
icip
ality
Mar
ulen
g Lo
cal M
unic
ipal
ity
40
000
40
000
70
000
440
318
296
200
70
000
LPR
020
Prov
inci
al H
igh
Cat
alyt
ic P
roje
cts
- Mut
ash
Hub
C
DC
34V
hem
be D
istr
ict M
unic
ipal
ityLI
M34
1 1
500
18
748
LPR
002
Nzh
elel
e V
alle
y B
ulk
Wat
er S
uppl
yC
DC
34V
hem
be D
istr
ict M
unic
ipal
ityM
akha
do L
ocal
Mun
icip
ality
1 5
00 2
0 00
0LP
R01
6Si
nthu
mul
e K
utam
a B
ulk
Wat
er S
uppl
yC
DC
34V
hem
be D
istr
ict M
unic
ipal
ityM
akha
do L
ocal
Mun
icip
ality
25
000
75
000
60
000
Luvu
vhu
GW
SC
DC
34V
hem
be D
istr
ict M
unic
ipal
ityM
akha
do L
ocal
Mun
icip
ality
39
682
Mpo
fana
(exc
ludi
ng C
adha
m v
otin
g di
stri
ct)
67
682
113
748
60
000
Polo
kwan
e W
aste
Wat
er T
reat
men
t Wor
ks
BLI
M35
4Po
lokw
ane
Loca
l Mun
icip
ality
Polo
kwan
e Lo
cal M
unic
ipal
ity 9
0 00
0 1
28 4
62 3
46 1
80Po
lokw
ane
Bul
k W
ater
Sup
ply
BLI
M35
4Po
lokw
ane
Loca
l Mun
icip
ality
Polo
kwan
e Lo
cal M
unic
ipal
ity 1
19 6
76 1
58 4
62 3
00 0
00LP
R00
1M
atok
s R
egio
nal W
ater
Sch
eme
BD
C35
Cap
rico
rn D
istr
ict M
unic
ipal
ityM
olem
ole
Loca
l Mun
icip
ality
1
500
19
919
LPR
022
Aga
nang
Bul
k W
ater
Sup
ply
BD
C35
Cap
rico
rn D
istr
ict M
unic
ipal
ityPo
lokw
ane
Loca
l Mun
icip
ality
20
000
25
000
70
000
LPR
008
Gle
n A
lphi
ne R
egio
nal W
ater
Sch
eme
BD
C35
Cap
rico
rn D
istr
ict M
unic
ipal
ityM
olem
ole
Loca
l Mun
icip
ality
1
500
15
000
209
676
286
924
646
180
23
000
59
919
70
000
LPR
003
Leph
alal
e - B
ulk
Wat
er A
ugm
enta
tion
BLI
M36
2Le
phal
ale
Loc
al M
unic
ipal
ityLe
phal
ale
Loc
al M
unic
ipal
ity 1
000
10
000
39
028
LPR
004
Mag
alie
s W
ater
to W
ater
berg
BLI
M36
8LI
M36
8LI
M36
8 1
000
15
000
40
000
LPR
015
Mog
alak
wen
a B
ulk
Wat
er S
uppl
yB
LIM
367
Mog
alak
wen
a L
ocal
Mun
icip
ality
Mog
alak
wen
a L
ocal
Mun
icip
ality
150
000
160
000
183
558
152
000
185
000
262
586
LPR
019
Mou
tse
Bul
k W
ater
Sup
ply
CD
C47
Sekh
ukhu
ne D
istr
ict M
unic
ipal
ityEp
hrai
m M
ogal
e/ E
lias
Mot
soal
edi L
Ms
60
000
40
000
50
000
LPR
011
Neb
o B
ulk
Wat
er S
uppl
yC
DC
47Se
khuk
hune
Dis
tric
t Mun
icip
ality
LIM
476/
Mak
hudu
tmah
aga
LMs
55
000
60
000
90
000
LPR
012
Moo
ihoe
k/Tu
bats
e B
ulk
Wat
er S
uppl
yC
DC
47Se
khuk
hune
Dis
tric
t Mun
icip
ality
LIM
476
105
000
Leba
lelo
Cen
tral
& N
orth
Reg
iona
l Wat
er S
chem
e C
DC
47Se
khuk
hune
Dis
tric
t Mun
icip
ality
LIM
476
1 0
00 4
0 00
0 8
0 00
0N
ebo
Bul
k W
ater
Sup
ply-
De
Hoo
p A
ugm
enta
tion
/Nor
th/ S
outh
/ Ste
elpo
ort
CD
C47
Sekh
ukhu
ne D
istr
ict M
unic
ipal
ityLI
M47
6 5
000
50
000
90
000
226
000
190
000
310
000
209
676
286
924
646
180
909
000
844
867
772
586
MPU
MA
LA
NG
A
Empu
l/Met
hu/A
mst
er B
ulk
Wat
er S
uppl
yC
DC
30 G
ert S
iban
de D
istr
ict M
unic
ipal
ityC
hief
Alb
ert L
uthu
li Lo
cal M
unic
ipal
ity 5
000
41
879
98
781
Lush
ushw
ane
Bul
k W
ater
Sch
eme
CD
C30
Ger
t Sib
ande
Dis
tric
t Mun
icip
ality
Chi
ef A
lber
t Lut
huli
Loca
l Mun
icip
ality
28
108
36
450
3 0
00Ee
rste
hoek
/Eku
linde
ni B
ulk
Wat
er S
uppl
yC
DC
30 G
ert S
iban
de D
istr
ict M
unic
ipal
ityC
hief
Alb
ert L
uthu
li Lo
cal M
unic
ipal
ity 3
000
25
621
34
842
Am
ster
dam
and
She
epm
ore
Bul
k W
ater
Sch
eme
CD
C30
Ger
t Sib
ande
Dis
tric
t Mun
icip
ality
Chi
ef A
lber
t Lut
huli
Loca
l Mun
icip
ality
5 0
00 2
3 00
0 5
000
Msu
kalin
gwa
regi
onal
wat
er s
uppl
y sc
hem
e (P
hase
1)C
DC
30 G
ert S
iban
de D
istr
ict M
unic
ipal
ityM
suka
ligw
a Lo
cal M
unic
ipal
ity 3
000
10
000
90
000
Bal
four
Was
te W
ater
Tre
atm
ent W
orks
CD
C30
Ger
t Sib
ande
Dis
tric
t Mun
icip
ality
Dip
ales
eng
Loca
l Mun
icip
ality
33
403
15
343
3 5
00B
alf/S
iyat
/Gre
yl/W
illem
/Nth
or B
ulk
Wat
er S
uppl
yC
DC
30 G
ert S
iban
de D
istr
ict M
unic
ipal
ityD
ipal
esen
g Lo
cal M
unic
ipal
ity
42
007
31
328
124
224
119
518
183
621
359
347
Upg
rade
of D
elm
as W
aste
Wat
er
BM
P311
Vic
tor K
hany
e Lo
cal M
unic
ipal
ity
Vic
tor K
hany
e Lo
cal M
unic
ipal
ity
29
765
28
758
3 0
00U
pgra
de o
f Bot
leng
Was
te W
ater
B
MP3
11V
icto
r Kha
nye
Loca
l Mun
icip
ality
V
icto
r Kha
nye
Loca
l Mun
icip
ality
5
00M
PR02
8Em
alah
leni
Bul
k W
ater
Sup
ply
upgr
ade
BM
P312
Emal
ahle
ni L
ocal
Mun
icip
ality
Em
alah
leni
Loc
al M
unic
ipal
ity
10
238
20
000
15
000
Them
bisi
le W
ater
Sch
eme
(Los
kop)
BM
P315
Them
bisi
le H
ani L
ocal
Mun
icip
ality
Th
embi
sile
Loc
al M
unic
ipal
ity
28
025
71
362
100
669
MPR
005
Wes
tern
Hig
hvel
d (R
ust d
e W
inte
r) B
ulk
Wat
er
Sche
me
BM
P316
Them
bisi
le H
ani L
ocal
Mun
icip
ality
Them
bisi
le H
ani a
nd D
r JS
Mor
oka
Loca
l Mun
icip
ality
5
000
16
993
25
000
73
528
137
113
143
669
MPR
NEW
Bus
hbuc
krid
ge W
ater
Ser
vice
sM
P325
Bus
hbuc
krid
ge L
ocal
Mun
icip
ality
Bus
hbuc
krid
ge L
ocal
Mun
icip
ality
3 0
00M
PRN
EWH
oxan
e B
ulk
Wat
er S
uppl
y (P
hase
3 E
xten
sion
)B
MP3
25B
ushb
uckr
idge
Loc
al M
unic
ipal
ityB
ushb
uckr
idge
Loc
al M
unic
ipal
ity 4
1 64
1 4
400
MPR
004
MP
Low
veld
feas
ibili
ty S
tudy
BM
P326
City
of M
bom
bela
City
of M
bom
bela
1 5
00 5
000
10
000
MPR
019
Nor
ther
n N
zika
zi B
ulk
Wat
er S
uppl
yB
MP3
26C
ity o
f Mbo
mbe
laC
ity o
f Mbo
mbe
la 3
8 75
4 1
9 04
2 2
9 39
6M
PR01
8D
riek
oppi
es U
pgra
ding
CM
P324
Nko
maz
i Loc
al M
unic
ipal
ityN
kom
azi L
ocal
Mun
icip
ality
13
522
42
528
65
398
MPR
020
Siba
nge
Bul
k W
ater
Sup
ply
CM
P324
Nko
maz
i Loc
al M
unic
ipal
ityN
kom
azi L
ocal
Mun
icip
ality
10
500
45
512
33
400
3 0
00
1
05 9
17 1
16 4
82 1
38 1
94
122
518
183
621
359
347
179
445
253
595
281
863
Tot
al: N
kang
ala
Mun
icip
aliti
es
Tot
al: E
hlan
zeni
Mun
icpa
litie
s
Tot
al: M
pum
alan
ga M
unic
ipal
ities
Tot
al: G
ert S
iban
de M
unic
ipal
ities
Tot
al: M
opan
i Mun
icip
aliti
es
Tot
al: V
hem
be M
unic
ipal
ities
Tot
al: C
apri
con
Mun
icip
aliti
es
Tot
al: W
ater
berg
Mun
icip
aliti
es
Tot
al: S
ekhu
khun
e M
unic
ipal
ities
Tot
al: L
impo
po M
unic
ipal
ities

This gazette is also available free online at www.gpwonline.co.za
66 No. 40913 GOVERNMENT GAZETTE, 12 JUNE 2017A
PPE
ND
IX W
5
APP
EN
DIX
TO
SC
HE
DU
LE
5, P
AR
T B
AN
D S
CH
ED
UL
E 6
, PA
RT
B: R
EG
ION
AL
BU
LK
INFR
AST
RU
CT
UR
E G
RA
NT
BR
EA
KD
OW
N O
F R
EG
ION
AL
BU
LK
INFR
AST
RU
CT
UR
E G
RA
NT
AL
LO
CA
TIO
NS
PER
LO
CA
L M
UN
ICIP
AL
ITY
PE
R P
RO
JEC
T
Bre
akdo
wn
of r
egio
nal b
ulk
infr
astr
uctu
re g
rant
allo
catio
ns p
er lo
cal m
unic
ipal
ity p
er p
roje
ctSc
hedu
le 5
, Par
t BSc
hedu
le 6
, Par
t B
Nat
iona
l and
Mun
icip
al F
inan
cial
Yea
rPr
ojec
t C
ode
Proj
ect N
ame
Cat
egor
yW
ater
Ser
vice
Aut
hori
tyB
enef
iting
Mun
icip
ality
201
7/18
(R'0
00)
201
8/19
(R'0
00)
201
9/20
(R'0
00)
201
7/18
(R'0
00)
201
8/19
(R'0
00)
201
9/20
(R'0
00)
NO
RT
HE
RN
CA
PE
NC
R017
Bulk
Wat
er S
uppl
y to
Por
th N
ollo
thB
NC
061
Rich
ters
veld
Loc
al M
unic
ipal
ity
Rich
ters
veld
Loc
al M
unic
ipal
ity
15
000
21
782
NC
R012
Loer
iesf
onte
in B
ulk
Wat
er S
uppl
yB
NC
065
Han
tam
Loc
al M
unic
ipal
ity
Han
tam
Loc
al M
unic
ipal
ity
50
426
17
247
Will
isto
n Bu
lk W
ater
Sup
ply
BN
C06
6K
aroo
Hoo
glan
d Lo
cal M
unic
ipal
ity
Kar
oo H
oogl
and
Loca
l Mun
icip
ality
3
0 00
0 2
7 00
0N
CR0
16Bu
lk W
ater
Sup
ply
to B
rand
vlei
(Han
tam
)B
NC
065
Han
tam
Loc
al M
unic
ipal
ity
Han
tam
Loc
al M
unic
ipal
ity
30
000
9 5
09 5
0 42
6 7
7 24
7 3
6 50
9
15
000
21
782
NC
R015
De
Aar
Bor
ehol
e D
evel
opm
ent
BN
C07
3Em
than
jeni
Loc
al M
unic
ipal
ityEm
than
jeni
Loc
al M
unic
ipal
ity 3
0 00
0 4
757
20
000
6 7
96N
CR0
24V
an W
yksv
lei B
ulk
Wat
er S
uppl
yB
NC
074
Kar
eebe
rg L
ocal
Mun
icip
ality
Kar
eebe
rg L
ocal
Mun
icip
ality
30
000
46
824
NC
R036
Mar
ydal
e Bu
lk W
ater
Sup
ply
BN
C07
7Si
yath
emba
Loc
al M
unic
ipal
itySi
yath
emba
Loc
al M
unic
ipal
ity 7
621
NC
R038
Dou
glas
WTW
Upg
radi
ngB
NC
078
Siya
ncum
a Lo
cal M
unic
ipal
itySi
yanc
uma
Loca
l Mun
icip
ality
750
21
237
15
000
BEP
Brei
paal
Pum
psat
ion
BN
C07
8Si
yanc
uma
Loca
l Mun
icip
ality
Siya
ncum
a Lo
cal M
unic
ipal
ity 4
400
30
000
76
824
4 7
57 1
2 77
1 4
1 23
7 2
1 79
6
NC
R028
Kal
ahar
i Eas
t to
Mie
r pip
elin
eB
NC
087
Daw
id K
ruip
er L
ocal
Mun
icip
allit
yD
awid
Kru
iper
Loc
al M
unic
ipal
lity
1 5
00N
CR0
29K
akam
a W
aste
wat
er w
orks
BN
C08
2 !K
ai !G
arib
Loc
al M
unic
ipal
ity!K
ai !G
arib
Loc
al M
unic
ipal
ity 8
00 1
0 00
0BE
PLo
iusv
ale
Pum
psta
tion
BN
C08
7D
awid
Kru
iper
Loc
al M
unic
ipal
lity
Daw
id K
ruip
er L
ocal
Mun
icip
allit
y 8
200
BEP
Loiu
sval
e Pu
mps
tatio
n (R
efur
bish
men
t) B
NC
087
Daw
id K
ruip
er L
ocal
Mun
icip
allit
yD
awid
Kru
iper
Loc
al M
unic
ipal
lity
4 4
00U
ping
ton
Was
terw
ater
trea
tmen
t wor
ksB
NC
087
Daw
id K
ruip
er L
ocal
Mun
icip
allit
yD
awid
Kru
iper
Loc
al M
unic
ipal
lity
20
000
30
000
21
422
Dan
iels
kuil
Was
tew
ater
Tre
atm
ent w
orks
BN
C08
6K
gate
lope
le L
ocal
Mun
icip
ality
Kga
telo
pele
Loc
al M
unic
ipal
ity 1
2 64
4
1
2 64
4 3
4 90
0 3
0 00
0 3
1 42
2
NC
R025
Hom
ewal
e W
aste
wat
er T
reat
men
t Wor
ksB
NC
091
Sol P
laat
jie L
ocal
Mun
icip
ality
Sol P
laat
jie L
ocal
Mun
icip
ality
Ritc
hie
Bulk
Wat
er S
chem
eB
NC
091
Sol P
laat
jie L
ocal
Mun
icip
ality
Sol P
laat
jie L
ocal
Mun
icip
ality
20
000
10
551
NC
R020
Win
dsor
ton
to H
olpa
n Bu
lk W
ater
Sup
ply
BN
C09
2D
ikga
tlong
Loc
al M
unic
ipal
ityD
ikga
tlong
Loc
al M
unic
ipal
ity 1
4 70
7N
CR0
30W
arre
nton
Wat
er T
reat
men
t Wor
ksB
NC
093
Mag
aren
g Lo
cal M
unic
ipal
ityM
agar
eng
Loca
l Mun
icip
ality
9 7
58 2
0 00
0 1
0 55
1
24
465
Kat
hu B
ulk
Wat
er S
uppl
yB
NC
453
Gam
agar
a Lo
cal M
unic
ipal
ityG
amag
ara
Loca
l Mun
icip
ality
21
587
45
000
NC
R018
Kur
uman
Bul
k W
ater
Sup
ply
BN
C45
2G
a-Se
gony
ana
Loca
l Mun
icip
ality
Ga-
Sego
nyan
a Lo
cal M
unic
ipal
ity
21
587
45
000
100
426
186
209
98
910
72
136
86
237
75
000
NO
RT
H W
EST
NW
R013
Mad
iben
g Bu
lk W
ater
Sup
ply
BN
W37
2M
adib
eng
Loca
l Mun
icip
ality
Mad
iben
g Lo
cal M
unic
ipal
ity 5
0 00
0 6
0 00
0 6
0 00
0N
WRN
EWM
oret
ele
Nor
th B
ulk
Wat
er S
uppl
yB
NW
371
Mor
etel
e Lo
cal M
unic
ipal
ityM
oret
ele
Loca
l Mun
icip
ality
3 9
19 2
500
70
000
Mor
etel
e So
uth
Bulk
Wat
er S
uppl
yB
NW
371
Mor
etel
e Lo
cal M
unic
ipal
ityM
oret
ele
Loca
l Mun
icip
ality
35
000
68
000
13
270
NW
RNEW
Kos
ter W
aste
Wat
er T
reat
men
t Wor
ks u
pgra
deB
NW
374
Kge
tleng
rivie
r Loc
al M
unic
ipal
ityK
getle
ngriv
ier L
ocal
Mun
icip
ality
40
000
30
000
128
919
160
500
143
270
NW
R002
Ratlo
u Bu
lk W
ater
Sup
ply
CD
C38
Nga
ka M
odiri
Mol
ema
Ratlo
u Lo
cal M
unic
ipal
ity
45
000
55
000
40
000
NW
R014
Maf
iken
g So
uth
Bulk
Wat
er S
uppl
yC
DC
38N
gaka
Mod
iri M
olem
aM
afik
eng
Loca
l Mun
icip
ality
4
3 00
0 5
9 58
6 5
5 00
0 8
8 00
0 1
14 5
86 9
5 00
0
Kag
isan
o-M
olop
o Bu
lk W
ater
Sup
ply
CD
C39
Dr R
uth
Sego
mot
si M
ompa
ti D
istri
ct M
unic
ipal
ityK
agis
ano-
Mol
opo
Loca
l Mun
icip
ality
26
000
37
000
40
000
NW
R009
Taun
g/ N
aled
i Bul
k W
ater
Sup
ply
CD
C39
Dr R
uth
Sego
mot
si M
ompa
ti D
istri
ct M
unic
ipal
ityG
reat
er T
aung
/ Nal
edi L
ocal
Mun
icip
aliti
es 5
5 00
0 3
0 00
0M
WR0
08G
reat
er M
amus
a Bu
lk W
ater
Sup
ply
CD
C39
Dr R
uth
Sego
mot
si M
ompa
ti D
istri
ct M
unic
ipal
ityM
amus
a Lo
cal M
unic
ipal
ity
101
000
90
000
90
000
182
000
157
000
130
000
NW
R016
Potc
hefs
troom
Was
te W
ater
Tre
atm
ent W
orks
up
grad
eB
NW
405
NW
405
NW
405
5 0
00 4
0 00
0
NW
R010
Ven
ters
dorp
Bul
k W
ater
Sup
ply
BN
W40
5N
W40
5N
W40
5 1
300
NW
R015
Wol
mar
anss
tad
Was
te W
ater
Tre
atm
ent W
orks
BN
W40
4M
aqua
ssi H
ills L
ocal
Mun
icip
ality
M
aqua
ssi H
ills L
ocal
Mun
icip
ality
2
5 00
0 3
1 30
0 4
0 00
0
182
000
157
000
130
000
248
219
315
086
238
270
Tot
al: D
r K
enne
th K
aund
a M
unic
ipal
ities
Tot
al: N
orth
Wes
t Mun
icip
aliti
es
Tot
al: D
r R
uth
Sego
mot
si M
ompa
ti M
unic
ipal
ities
Tot
al: N
amak
wa
Mun
icip
aliti
es
Tot
al: P
ixle
y ka
Sem
e M
unic
ipal
ities
Tot
al: Z
.F. M
gcaw
u M
unic
ipal
ities
Tot
al: F
ranc
es B
aard
Mun
icip
aliti
es
Tot
al: J
ohn
Tao
lo G
aets
ewe
Mun
icip
aliti
es
Tot
al: N
orth
ern
Cap
e M
unic
ipal
ities
Tot
al: B
ojan
ala
Plat
inum
Mun
icip
aliti
es
Tot
al: N
gaka
Mod
iri M
olem
a M
unic
ipal
ities

This gazette is also available free online at www.gpwonline.co.za
STAATSKOERANT, 12 JUNIE 2017 No. 40913 67
APP
END
IX W
5
APP
END
IX T
O S
CH
EDU
LE 5
, PA
RT
B A
ND
SC
HED
ULE
6, P
AR
T B
: REG
ION
AL
BU
LK IN
FRA
STR
UC
TUR
E G
RA
NT
BR
EAK
DO
WN
OF
REG
ION
AL
BU
LK IN
FRA
STR
UC
TUR
E G
RA
NT
ALL
OC
ATI
ON
S PE
R L
OC
AL
MU
NIC
IPA
LITY
PER
PR
OJE
CT
Bre
akdo
wn
of r
egio
nal b
ulk
infr
astr
uctu
re g
rant
allo
catio
ns p
er lo
cal m
unic
ipal
ity p
er p
roje
ctSc
hedu
le 5
, Par
t BSc
hedu
le 6
, Par
t B
Nat
iona
l and
Mun
icip
al F
inan
cial
Yea
rPr
ojec
t C
ode
Proj
ect N
ame
Cat
egor
yW
ater
Ser
vice
Aut
hori
tyB
enef
iting
Mun
icip
ality
201
7/18
(R'0
00)
201
8/19
(R'0
00)
201
9/20
(R'0
00)
201
7/18
(R'0
00)
201
8/19
(R'0
00)
201
9/20
(R'0
00)
WE
STE
RN
CA
PE
WC
R018
Van
rhyn
sdor
p Ra
w W
ater
B
WC
011
Mat
zika
ma
Loca
l Mun
icip
ality
M
atzi
kam
a Lo
cal M
unic
ipal
ity
5 0
00 1
0 00
0W
CR0
19K
law
er B
ulk
Wat
erB
WC
011
Mat
zika
ma
Loca
l Mun
icip
ality
M
atzi
kam
a Lo
cal M
unic
ipal
ity
4 0
00 1
0 00
0W
CR0
20C
itrus
dal W
aste
Wat
er T
reat
men
t Pla
ntB
WC
012
Ced
erbe
rg L
ocal
Mun
icip
ality
C
eder
berg
Loc
al M
unic
ipal
ity
Cla
nwill
iam
/ Lam
berts
baai
Reg
iona
l Wat
er S
uppl
y an
d D
esal
inat
ion
BW
C01
2C
eder
berg
Loc
al M
unic
ipal
ity
Ced
erbe
rg L
ocal
Mun
icip
ality
6
13
WC
R021
Cla
nwill
iam
Wat
er T
reat
men
t Wor
ksB
WC
012
Ced
erbe
rg L
ocal
Mun
icip
ality
C
eder
berg
Loc
al M
unic
ipal
ity
4 0
00W
est C
oast
Des
alin
atio
nB
WC
014
Sald
anha
Bay
Loc
al M
unic
ipal
ity
Sal
danh
a Ba
y Lo
cal M
unic
ipal
ity
5 0
00 4
613
9
000
25
000
Tulb
agh
Bulk
Wat
er S
uppl
yB
WC
022
Witz
enbe
rg L
ocal
Mun
icip
ality
Witz
enbe
rg L
ocal
Mun
icip
ality
13
372
10
000
20
000
WC
R022
Paar
l Bul
k Se
wer
BW
C02
3D
rake
nste
in L
ocal
Mun
icip
ality
Dra
kens
tein
Loc
al M
unic
ipal
ityW
CR0
23St
elle
nbos
ch W
aste
Wat
er T
reat
men
t Wor
ksB
WC
024
Stel
lenb
osch
Loc
al M
unic
ipal
itySt
elle
nbos
ch L
ocal
Mun
icip
ality
13
372
10
000
20
000
WC
R009
Gra
bouw
Was
te W
ater
Tre
atm
ent P
lant
BW
C03
1Th
eew
ater
sklo
of L
ocal
Mun
icip
ality
Thee
wat
ersk
loof
Loc
al M
unic
ipal
ity
WC
R015
Kan
nala
nd D
am R
eloc
atio
nB
WC
041
Kan
nala
nd L
ocal
Mun
icip
ality
Kan
nala
nd L
ocal
Mun
icip
ality
7 9
49 3
0 00
0 5
0 00
0W
CR0
14C
alitz
dorp
& L
adis
mith
Was
te W
ater
Tre
atm
ent W
orks
BW
C04
1K
anna
land
Loc
al M
unic
ipal
ityK
anna
land
Loc
al M
unic
ipal
ity 5
000
30
000
27
000
WC
R017
Out
dtsh
oorn
Gro
undw
ater
BW
C04
5O
utdt
shoo
rn L
ocal
Mun
icip
ality
Out
dtsh
oorn
Loc
al M
unic
ipal
ity 2
0 00
0 4
0 00
0
12
949
80
000
117
000
WC
R024
Beau
fort
Wes
t Bul
k W
ater
BW
C05
3Be
aufo
rt W
est L
ocal
Mun
icip
ality
Be
aufo
rt W
est L
ocal
Mun
icip
ality
5
000
15
000
5 0
00 1
5 00
0
17
985
10
000
20
000
12
949
94
000
157
000
1 86
5 00
02
060
000
2 17
5 36
02
773
539
2 88
0 92
23
037
295
Tot
al: C
entr
al K
aroo
Mun
icip
aliti
es
Tot
al: W
este
rn C
ape
Mun
icip
aliti
es
Nat
iona
l Tot
al
Tot
al: W
est C
oast
Mun
icip
aliti
es
Tot
al: C
ape
Win
elan
ds M
unic
ipal
ities
Tot
al: O
verb
erg
Mun
icip
aliti
es
Tot
al: E
den
Mun
icip
aliti
es

This gazette is also available free online at www.gpwonline.co.za
68 No. 40913 GOVERNMENT GAZETTE, 12 JUNE 2017
APP
EN
DIX
W6
(Nat
iona
l and
Mun
icip
al F
inan
cial
Yea
rs)
APP
END
IX T
O S
CH
EDU
LE
5, P
AR
T A
: BR
EA
KD
OW
N O
F E
PWP
INT
EG
RA
TE
D G
RA
NT
FO
R P
RO
VIN
CE
S:TA
RG
ETS
AN
D
AL
LOC
AT
ION
S PE
R P
RO
VIN
CIA
L D
EPA
RT
ME
NT
S

This gazette is also available free online at www.gpwonline.co.za
STAATSKOERANT, 12 JUNIE 2017 No. 40913 69
APPENDIX W6
Province/Provincial Department 2017/18(R'000)
2018/19(R'000)
2019/20(R'000)
EASTERN CAPECooperative Governance and Traditional Affairs 14 2 036 Economic Development, Environmental Affairs And Tourism 17 2 554 Education 16 2 411 Health 1 129 2 000 Human Settlement 18 2 639 Roads and Public Works 3 325 89 771 Rural Development and Agrarian Reform 36 2 000 Social Development 13 2 000 Sport, Recreation, Arts and Culture 13 2 000 Transport 33 4 924
Total: Eastern Cape 4 614 112 335 - - FREE STATE
Agriculture and Rural Development 25 2 000 Economic And Small Business Development, Tourism And Environmental Affairs 13 2 000 Education 13 2 000 Health 988 2 000 Human Settlement 13 2 000 Police, Roads and Transport 2 716 5 666 Public Works and Infrasturcture 73 10 900 Sport, Arts, Culture and Recreation 13 2 000
Total: Free State 3 854 28 566 - - GAUTENG
Agriculture and Rural Development 28 2 684 Cooperative Governance and Traditional Affairs 13 2 000 Education 17 2 537 Health 1 684 2 000 Human Settlement 94 14 055 Infrastructure Development 129 19 192 Roads and Transport 1 112 6 504 Social Development 13 2 000 Sport, Arts, Culture and Recreation 15 2 206
Total: Gauteng 3 105 53 178 - - KWAZULU-NATAL
Agriculture and Rural Development 80 8 466 Arts and Culture 13 2 000 Co-operative Governance And Traditional Affairs 22 3 338 Economic Development, Tourism and Environmental Affairs 41 6 149 Education 13 2 000 Health 2 259 8 400 Human Settlement 38 5 625 Public Works 44 6 588 Sport and Recreation 13 2 000 Transport 4 323 33 645
Total: KwaZulu-Natal 6 846 78 211 - - LIMPOPO
Agriculture and Rural Development 45 3 731 Cooperative Governance, Human Settlement and Traditional Affairs 13 2 000 Economic Development, Environment and Tourism 17 2 567 Education 13 2 000 Public Works, Roads and Infrastructure 2 158 5 897 Sports, Arts and Culture 13 2 000 Safety, Security and Liaison 13 2 000
Total: Limpopo 2 272 20 195 - - MPUMALANGA
Agriculture, Rural Development, Land and Environmental Affairs 37 3 605 Co-operative Governance and Traditional Affairs 13 2 000 Culture, Sport and Recreation 13 2 000 Economic Development and Tourism 23 3 505 Education 17 2 597 Health 682 2 000 Public Works, Roads & Transport 1 895 16 729 Social Development 13 2 000
Total: Mpumalanga 2 693 34 436 - -
APPENDIX TO SCHEDULE 5, PART A: BREAKDOWN OF EPWP INTEGRATED GRANT FOR PROVINCES:TARGETS AND ALLOCATIONS PER PROVINCIAL DEPARTMENTS
Expanded Public Works Programme Incentive Integrated Grant for Provinces
FTE Target for2017/18
Financial Year

This gazette is also available free online at www.gpwonline.co.za
70 No. 40913 GOVERNMENT GAZETTE, 12 JUNE 2017
Province/Provincial Department 2017/18(R'000)
2018/19(R'000)
2019/20(R'000)
Expanded Public Works Programme Incentive Integrated Grant for Provinces
FTE Target for2017/18
Financial Year
NORTHERN CAPEAgriculture, Land Reform and Rural Development 30 2 044 Cooperative Governance, Human Settlement and Traditional Affairs 13 2 000 Economic Development and Tourism 13 2 000 Education 14 2 083 Environment and Nature Conservation 15 2 182 Health 1 001 2 000 Roads and Public Works 1 873 3 834 Sport, Arts and Culture 13 2 000 Transport, Safety and Liaison 13 2 000
Total: Northern Cape 2 985 20 143 - - NORTH WEST
Education and Sports Development 13 2 000 Health 765 2 000 Local Government and Human Settlement 16 2 437 Public Works and Roads 1 948 3 186
Rural, Environment and Agricultural Development 38 2 760 Social Development 13 2 000
Total: North West 2 793 14 383 - - WESTERN CAPE
Education 14 2 149 Agriculture 23 2 062 Cultural Affairs and Sport 22 3 237 Environmental Affairs and Development Planning 29 4 385 Health 1 188 2 473 Human Settlements 23 3 374 Transport and Public Works 1 878 16 452
Total: Western Cape 3 177 34 132 - - Unallocated - - 416 036 451 505 Grand Total 32 339 395 579 416 036 451 505

This gazette is also available free online at www.gpwonline.co.za
STAATSKOERANT, 12 JUNIE 2017 No. 40913 71
APP
EN
DIX
W7
(Nat
iona
l and
Mun
icip
al F
inan
cial
Yea
rs)
APP
EN
DIX
TO
SC
HED
ULE
5, P
AR
T A
: BR
EA
KD
OW
N O
F SO
CIA
L S
EC
TO
R E
PWP
INC
EN
TIV
E G
RA
NT
FO
R P
RO
VIN
CE
S:
AL
LOC
AT
ION
S PE
R P
RO
VIN
CIA
L D
EPA
RT
ME
NT

This gazette is also available free online at www.gpwonline.co.za
72 No. 40913 GOVERNMENT GAZETTE, 12 JUNE 2017
Province/Provincial Department 2017/18(R'000)
2018/19(R'000)
2019/20('R000)
EASTERN CAPEEducation 206 5 022 Health 192 4 662 Safety and Liaison 76 1 856 Social Development 61 1 496 Sport, Recreation, Arts and Culture 60 1 467
Total: Eastern Cape 595 14 503 - - FREE STATE
Education 69 1 679 Health 183 4 453 Police, Roads and Transport 69 1 693 Social Development 569 13 823 Sport, Arts, Culture and Recreation 62 1 519
Total: Free State 952 23 167 - - GAUTENG
Community Safety 60 1 463 Education 403 9 791 Health 109 2 663 Social Development 386 9 384 Sport, Recreation, Arts and Culture 61 1 496
Total: Gauteng 1 019 24 797 - - KWAZULU-NATAL
Community Safety and Liason 61 1 487 Education 198 4 808 Health 1 938 47 058 Social Development 803 19 498 Sport and Recreation 501 12 165
Total: KwaZulu-Natal 3 501 85 016 - - LIMPOPO
Education 118 2 888 Health 1 240 30 113 Social Development 369 8 978
Total: Limpopo 1 727 41 979 - - MPUMALANGA
Community Safety, Security and Liason 61 1 482 Culture, Sport and Recreation 127 3 083 Education 123 3 008 Health 1 668 40 498 Social Development 1 116 27 109
Total: Mpumalanga 3 095 75 180 - - NORTHERN CAPE
Education 83 2 017 Health 1 245 30 229 Social Development 803 19 497 Sport, Arts and Culture 96 2 341 Transport, Safety and Liaison 103 2 510
Total: Northern Cape 2 330 56 594 - - NORTH WEST
Community Safety and Transport Management 76 1 854 Education and Sport Developmet 146 3 557 Health 901 21 882 Social Development 194 4 715
Total: North West 1 317 32 008 - - WESTERN CAPE
Community Safety 137 3 328 Cultural Affairs and Sport 61 1 496 Education 339 8 243 Health 137 3 334 Social Development 656 15 938
Total: Western Cape 1 330 32 339 - - Unallocated - - 407 948 430 793 Grand Total 15 866 385 583 407 948 430 793
APPENDIX W7
APPENDIX TO SCHEDULE 5, PART A: BREAKDOWN OF SOCIAL SECTOR EPWP INCENTIVE GRANT FOR PROVINCES: ALLOCATIONS PER PROVINCIAL DEPARTMENT
Social Sector Expanded Public Works Programme Incentive Grant for Provinces
FTE Target for2017/18
Financial Year

This gazette is also available free online at www.gpwonline.co.za
STAATSKOERANT, 12 JUNIE 2017 No. 40913 73
APP
EN
DIX
W8
(Nat
iona
l Fin
anci
al Y
ears
)
APP
END
IX T
O S
CH
EDU
LE
6, P
AR
T A
: BR
EA
KD
OW
N O
F N
AT
ION
AL
HE
AL
TH IN
SUR
AN
CE
IND
IRE
CT
GR
AN
T:
AL
LOC
AT
ION
S PE
R G
RA
NT
CO
MPO
NE
NT
PE
R P
RO
VIN
CE

This gazette is also available free online at www.gpwonline.co.za
74 No. 40913 GOVERNMENT GAZETTE, 12 JUNE 2017
APPENDIX W8
Health (Vote 16)
Province/Components 2017/18(R'000)
2018/19(R'000)
2019/20('R000)
Total Per Province Eastern Cape 434 534 153 753 413 677 Free State 181 903 128 884 167 474 Gauteng 130 818 137 776 144 565 KwaZulu-Natal 115 271 65 830 69 516 Limpopo 186 260 420 010 185 299 Mpumalanga 78 253 157 555 79 136 Northern Cape 13 539 13 619 28 616 North West 41 578 25 134 26 541 Western Cape 44 968 21 532 22 738 Unallocated 435 914 640 767 726 129
Total 1 663 037 1 764 859 1 863 691 of which:Health Facility Revitalisation Grant Component
Eastern Cape 346 187 98 188 355 000 Free State 132 699 93 397 130 000 Gauteng 33 157 51 215 53 157 KwaZulu-Natal - - - Limpopo 132 803 375 032 137 803 Mpumalanga 34 224 119 760 39 224 Northern Cape - - 14 234 North West - - - Western Cape - - - Unallocated 269 914 250 767 314 289
Total 948 984 988 359 1 043 707 Human Papillomavirus Vaccine Grant Component
Eastern Cape 39 120 - - Free State 17 320 - - Gauteng 17 481 - - KwaZulu-Natal 56 002 - - Limpopo 13 760 - - Mpumalanga 10 055 - - Northern Cape 1 484 - - North West 18 731 - - Western Cape 26 047 - - Unallocated - - -
Total 200 000 - - Health Professionals Contracting Component
Eastern Cape 43 503 46 026 48 604 Free State 29 002 30 684 32 402 Gauteng 77 338 81 824 86 406 KwaZulu-Natal 54 137 57 277 60 484 Limpopo 34 802 36 821 38 882 Mpumalanga 30 935 32 729 34 562 Northern Cape 10 634 11 251 11 881 North West 21 268 22 502 23 762 Western Cape 16 434 17 387 18 361 Unallocated - - -
Total 318 053 336 500 355 344 Information Systems Component
Eastern Cape - - - Free State - - - Gauteng - - - KwaZulu-Natal - - - Limpopo - - - Mpumalanga - - - Northern Cape - - - North West - - - Western Cape - - - Unallocated 166 000 390 000 411 840
Total 166 000 390 000 411 840 Ideal Clinics Component
Eastern Cape 5 724 9 539 10 073 Free State 2 882 4 803 5 072 Gauteng 2 842 4 737 5 002 KwaZulu-Natal 5 132 8 553 9 032 Limpopo 4 895 8 157 8 614 Mpumalanga 3 039 5 066 5 350 Northern Cape 1 421 2 368 2 501 North West 1 579 2 632 2 779 Western Cape 2 487 4 145 4 377 Unallocated - - -
Total 30 000 50 000 52 800
APPENDIX TO SCHEDULE 6, PART A: BREAKDOWN OF NATIONAL HEALTH INSURANCE INDIRECT GRANT: ALLOCATIONS PER GRANT COMPONENT PER PROVINCE
National Health Insurance Indirect GrantNational Financial Year

This gazette is also available free online at www.gpwonline.co.za
STAATSKOERANT, 12 JUNIE 2017 No. 40913 75
APP
EN
DIX
W9
(Nat
iona
l Fin
anci
al Y
ears
)
APP
EN
DIX
TO
SC
HED
ULE
6, P
AR
T A
: BR
EA
KD
OW
N O
F SC
HO
OL
INFR
AST
RU
CT
UR
E B
AC
KLO
GS
GR
AN
T: A
LLO
CA
TIO
NS
PER
PR
OV
INC
E

This gazette is also available free online at www.gpwonline.co.za
76 No. 40913 GOVERNMENT GAZETTE, 12 JUNE 2017
APPENDIX W9
Basic Education (Vote 14)
Province 2017/18(R'000)
2018/19(R'000)
2019/20('R000)
Eastern Cape 1 574 120 - - Free State 656 578 - - Gauteng - - - KwaZulu-Natal 15 000 - - Limpopo 317 000 - - Mpumalanga 15 000 - - Northern Cape - - - North West 17 000 - - Western Cape - - - Unallocated - - -
Total 2 594 698 - -
APPENDIX TO SCHEDULE 6, PART A: BREAKDOWN OF SCHOOL INFRASTRUCTURE BACKLOGS GRANT: ALLOCATIONS PER PROVINCE
Schools Infrastructure Backlogs GrantNational Financial Year

This gazette is also available free online at www.gpwonline.co.za
STAATSKOERANT, 12 JUNIE 2017 No. 40913 77
APP
EN
DIX
W10
(Nat
iona
l Fin
anci
al Y
ears
)
APP
END
IX T
O S
CH
ED
ULE
4, P
AR
T A
AN
D S
CH
ED
UL
E 5
, PA
RT
A: B
RE
AK
DO
WN
OF
RIN
G-F
EN
CED
DIS
AST
ER:
AL
LOC
AT
ION
S FO
R P
RO
VIN
CE
S PE
R G
RA
NT

This gazette is also available free online at www.gpwonline.co.za
78 No. 40913 GOVERNMENT GAZETTE, 12 JUNE 2017
APPENDIX W10
Province/Grant Name 2017/18(R'000)
2018/19(R'000)
2019/20('R000)
Comprehensive Agriculture Support Programme GrantEastern Cape - - - Free State - - - Gauteng - - - KwaZulu-Natal - - - Limpopo 5 000 - - Mpumalanga 5 326 - - Northern Cape 111 538 - - North West - - - Western Cape 17 207 - -
Total 139 071 - - Education Infrastructure Grant
Eastern Cape - - - Free State - - - Gauteng - - - KwaZulu-Natal - - - Limpopo - - - Mpumalanga - - - Northern Cape - - - North West - - - Western Cape - - -
Total - - - Health Facility Revitilisation Grant
Eastern Cape - - - Free State - - - Gauteng - - - KwaZulu-Natal - - - Limpopo - - - Mpumalanga - - - Northern Cape - - - North West - - - Western Cape - - -
Total - - - Human Settlements Development Grant
Eastern Cape 134 261 - - Free State - - - Gauteng - - - KwaZulu-Natal - - - Limpopo - - - Mpumalanga - - - Northern Cape - - - North West - - - Western Cape - - -
Total 134 261 - - Provincial Roads Maintenance Grant
Eastern Cape 90 000 80 000 66 188 Free State - - - Gauteng - - - KwaZulu-Natal - - - Limpopo 130 000 130 000 140 000 Mpumalanga 50 000 - - Northern Cape - - - North West - - - Western Cape - - -
Total 270 000 210 000 206 188 Grand Total 543 332 210 000 206 188
APPENDIX TO SCHEDULE 4, PART A AND SCHEDULE 5, PART A: BREAKDOWN OF RING-FENCED DISASTER: ALLOCATIONS FOR PROVINCES PER GRANT
Ring-fenced disaster allocation per provinceNational Financial Year

This gazette is also available free online at www.gpwonline.co.za
STAATSKOERANT, 12 JUNIE 2017 No. 40913 79
APP
EN
DIX
W11
(Nat
iona
l Fin
anci
al Y
ears
)
APP
END
IX T
O S
CH
EDU
LE 5
, PA
RT
A: B
RE
AK
DO
WN
OF
TH
E E
AR
LY
CH
ILD
HO
OD
DEV
ELO
PMEN
T G
RA
NT
: A
LLO
CA
TIO
NS
PER
GR
AN
T C
OM
PON
EN
T P
ER
PR
OV
INC
E

This gazette is also available free online at www.gpwonline.co.za
80 No. 40913 GOVERNMENT GAZETTE, 12 JUNE 2017
APPENDIX W11
Social Development (Vote 17)
Province/Components 2017/18(R'000)
2018/19(R'000)
2019/20('R000)
Total Per Province Eastern Cape 56 365 86 968 91 830 Free State 18 398 25 903 27 347 Gauteng 38 489 61 883 65 344 KwaZulu-Natal 71 879 112 347 118 629 Limpopo 41 085 62 414 65 901 Mpumalanga 25 799 39 989 42 223 Northern Cape 13 761 18 127 19 139 North West 32 686 51 692 54 582 Western Cape 19 150 31 477 33 235
Total 317 612 490 800 518 228 of which:Maintenance Component
Eastern Cape 12 364 14 167 14 956 Free State 9 039 10 358 10 934 Gauteng 3 567 4 088 4 315 KwaZulu-Natal 12 955 14 845 15 671 Limpopo 10 984 12 586 13 287 Mpumalanga 5 382 6 167 6 510 Northern Cape 9 106 10 435 11 015 North West 4 751 5 445 5 747 Western Cape 572 655 692
Total 68 720 78 746 83 127 Subsidy Component
Eastern Cape 44 001 72 801 76 874 Free State 9 359 15 545 16 413 Gauteng 34 922 57 795 61 028 KwaZulu-Natal 58 924 97 501 102 958 Limpopo 30 101 49 827 52 614 Mpumalanga 20 417 33 822 35 713 Northern Cape 4 654 7 693 8 123 North West 27 935 46 247 48 834 Western Cape 18 578 30 822 32 543
Total 248 892 412 054 435 101
APPENDIX TO SCHEDULE 5, PART A: BREAKDOWN OF THE EARLY CHILDHOOD DEVELOPMENT GRANT: ALLOCATIONS PER GRANT COMPONENT PER PROVINCE
Early Childhood Development GrantNational Financial Year

This gazette is also available free online at www.gpwonline.co.za
STAATSKOERANT, 12 JUNIE 2017 No. 40913 81
Part 2: Frameworks for Conditional Grants to Provinces
Detailed frameworks on Schedule 4, Part A; Schedule 5, Part A; Schedule 6, Part A; and Schedule 7, Part A grants to provinces Introduction This annexure provides a brief description of the framework for the grants set out in Schedule 4, Part A; Schedule 5, Part A; Schedule 6, Part A; and Schedule 7, Part A of the 2017 Division of Revenue Bill. The following are key areas considered for each grant:
Strategic goal and purpose of the grant Outcome statements and outputs of the grant Priority outcome(s) of government that the grant primarily contributes to Conditions of the grant (additional to what is required in the Bill) Criteria for allocation between provinces Rationale for funding through a conditional grant Past performance The projected life of the grant 2017 MTEF allocations The payment schedule Responsibilities of transferring national department and receiving provincial departments Process for approval of business plans for 2018/19 The attached frameworks are not part of the Division of Revenue Bill, but are published in order to provide more information on each grant to parliament, legislatures, municipal councils, officials in all three spheres of government and the public. Once the 2017 Division of Revenue Bill is enacted, these frameworks will be gazetted in terms of the Act.
The financial statements and annual reports for 2017/18 will report against the Division of Revenue Act, Division of Revenue Amendment Act and their schedules, and the grant frameworks as gazetted in terms of the Act. Such reports must cover both financial and non-financial performance, focusing on the outputs achieved.

This gazette is also available free online at www.gpwonline.co.za
82 No. 40913 GOVERNMENT GAZETTE, 12 JUNE 2017
AGRICULTURE, FORESTRY AND FISHERIES GRANTS
Comprehensive Agricultural Support Programme Grant Transferring department Agriculture, Forestry and Fisheries (Vote 24) Grant Schedule Schedule 5, Part A Strategic goal To create a favourable and supportive agricultural services environment for the farming community, in
particular subsistence, smallholder and black commercial farmers Grant purpose To provide effective agricultural support services, promote and facilitate agricultural development by
targeting beneficiaries of land reform, restitution and redistribution, and other black producers who have acquired land through private means and are engaged in value-adding enterprises domestically, or the export market
To address damages to infrastructure caused by floods Outcome statements Broadened access to agricultural support for subsistence, smallholder and black commercial farmers
Improved farming efficiency Increased wealth creation, and sustainable employment in rural areas Increased access to markets by beneficiaries of Comprehensive Agriculture Support Programme
(CASP) Improved household and national food security Reliable and accurate agricultural information available for management decision making
Outputs Farmer supported per category (subsistence, smallholder) 450 black commercial farmers supported Number of CASP beneficiaries that are South African Good Agricultural Practice Standard certified Jobs created Youth, women and farmers with disabilities supported through CASP On and off - farm infrastructure provided and repaired Land under agricultural production (crop and livestock) Yields per unit area Beneficiaries of CASP trained on farming methods or opportunities along the value chain Beneficiaries of CASP accessing markets Extension personnel recruited and maintained in the system Extension officers upgrading qualifications at various institutions Agriculture Information Management System (AIMS) implemented in all 9 provinces
Priority outcome(s) of government that this grant primarily contributes to
Outcome 4: Decent employment through inclusive economic growth Outcome 5: A skilled and capable work force to support an inclusive growth path Outcome 7: Comprehensive rural development and land reform
Details contained in the business plan
Outcome indicators Outputs indicators Inputs Key activities Monitoring framework Risks and mitigation strategies
Conditions The funding for this grant can be spent using the following prescription: o at most 20 per cent of project allocation to support Fetsa Tlala initiatives o at most 55 per cent of project allocation to support Agriculture Policy Action Plan (APAP)
- at least 20 per cent of which should be focused on black commercial farmers in partnership with the relevant commodity organisation
- at least 35 per cent of which should be focused on commercialisation of smallholder farmers in partnership with the relevant commodity organisations
o at most 5 per cent of project allocation on AIMS o at least 10 per cent of project allocation on market access and development o at most 10 per cent of project allocation on training and capacity building of farmers
Farmers supported must be linked to, but not limited to, black commodity organisations. The province should have formal partnership agreements with these commodity organisations in supporting farmers (joint support, joint funding and joint implementation as necessary)
The Department of Agriculture, Forestry and Fisheries (DAFF) will reprioritise the allocated funds on the following basis: o in the event of poor spending on the part of a province where the reason for poor spending is as a
result of poor planning or failure by service providers to meet their contractual obligation o in the event of a disaster that affects the implementation of approved plans
A central AIMS to be implemented by eight provinces (Western Cape Province is already implementing the system) to ensure a harmonised system that integrates and collates information to the national and provincial level (vice versa). Eastern Cape, Gauteng, Limpopo and North West, have each made their full contributions of R9 million towards the implementation of AIMS
The following contribution per province will be made to the National Agriculture Marketing Council (coordinating the development of the system) for the implementation of AIMS:

This gazette is also available free online at www.gpwonline.co.za
STAATSKOERANT, 12 JUNIE 2017 No. 40913 83
Comprehensive Agricultural Support Programme Grant o Free State: R3 million (R6 million contribution made) o KwaZulu-Natal: R9 million o Mpumalanga: R9 million o Northern Cape: R4.5 million (R4.5 million contribution already made)
Provinces must adhere to the CASP Standard Operating Procedure (SOP) framework when implementing projects
In cases where farmers requiring support are outside a commodity organisation agreement, their proposals must be approved by established committees and authorities
All assisted farmers should be listed in the provincial and national farm registers The provincial departments must confirm human resources capacity to implement CASP business plans
by 28 March 2017 All receiving departments must abide by the Public Finance Management Act (PFMA), Treasury
Regulations and the 2017 Division of Revenue Act (DoRA) when executing projects as well as for reporting purposes
Funds will be transferred as per the disbursement schedule approved by National Treasury Provinces to inform the transferring officer (TO) of any changes from plans and allocations approved
by the DAFF, within 7 days of such change, and such changes must be approved by the TO before they are implemented
Provincial business plans must be signed-off by the Heads of Department (HoD) of the provincial agriculture departments in collaboration with Chief Financial Officers (CFOs) or their representatives, and must be co-signed by the HoDs of provincial treasuries
Signed business plans for CASP must be submitted to the DAFF for approval Allocation for agricultural colleges must only be used to revitalise infrastructure and equipment at these
colleges as determined in the master plan Allocations for natural disasters must only be used for the repair of infrastructure damaged by natural
disasters declared in the Government Gazette and as assessed by the National Disaster Management Centre (NDMC). The allocations for 2017/18, for infrastructure damaged by floods are as follows: o Limpopo: R5.0 million o Mpumalanga: R5.3 million o Northern Cape R111.5 million o Western Cape: R17.2 million
Business plans for the allocated disaster funds must be in line with the post disaster verification assessment reports, and must be submitted to the NDMC and DAFF for approval
Quarterly performance reports on disaster allocations must be submitted to the NDMC and DAFF Allocation criteria The formula used to allocate funds is a weighted average of the following variables: agricultural land
area, households involved in agriculture (General Household Survey 2015 report), previous CASP performance and current benchmarks on production and national policy imperatives
The repairs to the 2010/11 flood damaged diversion walls along the Orange River in the Northern Cape are incomplete. The funds that were allocated to complete this activity will be recovered from provinces that received it after it was diverted to project support
Reasons not incorporated in equitable share
Agriculture is identified as a game changer and investment in agriculture must be guided under strict conditions to achieve the aspirations of the National Development Plan
The responsibility for the programme rests with DAFF while provincial departments of agriculture are implementing agents
Past performance 2015/16 audited financial outcomes Of R1.7 billion allocated to provinces, R1.6 billion (98.9 per cent) was transferred to provinces, of
which R1.6 billion (100.3 per cent) was spent by the end of the financial year 2015/16 service delivery performance
92 096 beneficiaries were supported from 543 implemented projects 9 363 jobs created 27 612 farmers trained in targeted training programmes A total of 153 extension officers were recruited nationally, and 816 maintained in the system A total of 234 extension officers registered for qualification upgrading Ongoing upgrading of infrastructure to 10 agricultural colleges 155 farmers benefited from repair of infrastructure damaged by flood disasters (114 agricultural
infrastructure, 6 soil rehabilitation and 35 production inputs) 211 jobs created through implementation of the flood disaster scheme
Projected life Grant continues until 2019/20, subject to review MTEF allocations 2017/18: R1.6 billion; 2018/19: R1.8 billion; and 2019/20: R1.9 billion Payment schedule Four instalments: 21 April 2017; 25 August 2017; 27 October 2017; and 26 January 2018 Responsibilities of the transferring officer and receiving officer
Responsibilities of the national department Agree on outputs and targets with provincial departments in line with grant objectives Provide guidelines and criteria for the development and approval of business plans

This gazette is also available free online at www.gpwonline.co.za
84 No. 40913 GOVERNMENT GAZETTE, 12 JUNE 2017
Comprehensive Agricultural Support Programme Grant Provide a template for project registration and reporting Monitor monthly financial expenditure by provinces and conduct sampled project site visits quarterly Submit monthly financial reports to National Treasury 20 days after the end of the month Submit quarterly performance reports to National Treasury within 45 days after the end of each quarter Submit annual evaluation of performance report to National Treasury within four months after the end
of the financial year Oversee and monitor implementation of the grant during Ministerial Technical Committee (MinTech)
on agriculture and quarterly review meetings Responsibilities of the provincial departments
Provinces to adhere to the conditions of this framework and DoRA Provinces to submit detailed project list as per the DAFF project list template Provinces to report monthly (financial) 15 days after the end of each month, and quarterly
(non-financial) 20 days after the end of each quarter, and annually two months after the end of the financial year on the progress and achievements of the programme
Provinces to implement the approved CASP business plans All receiving departments must abide by the PFMA, Treasury Regulations and the 2017 DoRA when
executing projects as well as for reporting purposes Provinces to inform the TO of any changes from plans and allocations approved by the TO for DAFF,
within 7 days of such a change, and such changes must be approved by the TO before they are implemented
Assign and delegate officials to manage and monitor the implementation of the programme before April 2017
Keep record of projects supported and farmer registers Monitor project implementation on quarterly basis and evaluate the impact of projects in achieving
CASP goals Submit quarterly performance reports on disaster allocations to the Provincial Disaster Management
Centres and DAFF, within 20 days after the end of each quarter Submit quarterly project performance reports to the DAFF Provinces to adhere to the approved CASP SOP framework
Process for approval of the 2018/19 business plans
Provide provincial departments with business plan format, guidelines, criteria and outputs as prescribed by National Treasury by 30 May 2017
Submission of provincial CASP business plans by provinces on 29 September 2017 Engagement with provinces, pre-national assessment panel (NAP) on submitted business plans during
October/November 2017 prior to the final NAP meeting Evaluation and recommendation of business plans by NAP between November 2017 and
February 2018 Send funding agreements to provinces by February/March 2018 to be signed by HoDs, CFOs, and
CASP coordinators Approval of business plans by the TO before 31 March 2018 Inform provinces of approval of the business plans in March or April 2018 Approval by the TO regarding 2018 business planning process compliance during April 2018, and send
to National Treasury by end April 2018

This gazette is also available free online at www.gpwonline.co.za
STAATSKOERANT, 12 JUNIE 2017 No. 40913 85
Ilima/Letsema Projects Grant Transferring department Agriculture, Forestry and Fisheries (Vote 24) Grant Schedule Schedule 5, Part A Strategic goal To reduce poverty through increased food production initiatives Grant purpose To assist vulnerable black South African farming communities to achieve an increase in agricultural
production and invest in infrastructure that unlocks agricultural production Outcome statements Increased agricultural production at both household and national level
Improved household and national food security Improved farm income Maximised job opportunities Reduced poverty Rehabilitated and expanded irrigation schemes
Outputs Land under agricultural production (crop and livestock) Yields per unit area Jobs created Beneficiaries/farmers supported by the grant per category Hectares of rehabilitated and expanded irrigation schemes
Priority outcome(s) of government that this grant primarily contributes to
Outcome 4: Decent employment through inclusive economic growth Outcome 7: Comprehensive rural development and land reform
Details contained in the business plan
Outcome indicators Outputs indicators Inputs Key activities Monitoring framework Risks and mitigation strategies
Conditions 100 per cent of Ilima/Letsema grant should be allocated to support food production (crop and livestock production) in support of the Fetsa Tlala initiative, this will also include infrastructure that unlocks production e.g. rehabilitation of irrigation schemes in Northern Cape, North West (Taung) and KwaZulu-Natal
Only vulnerable households, subsistence, smallholder and black commercial farmers not qualifying for a loan should be supported by this grant
Partnerships with black commodity organisations should be prioritised for joint support, joint funding and joint implementation
Provincial departments to confirm human resources capacity to implement Ilima/Letsema business plans on or before 28 March 2017
All receiving departments must abide by the Public Finance Management Act (PFMA), Treasury Regulations and the 2017 Division of Revenue Act (DoRA) when executing projects as well as for reporting purposes
All assisted farmers should be listed in the provincial and national farm registers Provinces to inform the transferring officer (TO) of any changes from plans and allocations approved
by the national Department of Agriculture, Forestry and Fisheries (DAFF), within 7 days of such change and such changes must be approved by the TO before they are implemented
The provincial business plans must be signed-off by the Head of Department (HoD) of the provincial agriculture department in collaboration with the Chief Financial Officer (CFO) or their representative, and co-signed by the heads of provincial treasuries
The signed business plans must be submitted to the DAFF Allocation criteria The formula used to allocate funds is a weighted average of the following variables: agricultural land
available, previous homeland areas, households involved in agriculture (General Household Survey 2015), food insecure areas and national priority areas targeted for increased food production
Reasons not incorporated in equitable share
The funding originated with the special poverty allocations made by national government for a specific purpose and requires tight conditionality to achieve the national goal
Agriculture is identified as a game changer and investment in agriculture must be guided under strict conditions to achieve the aspirations of the National Development Plan
The responsibility for the programme rests with the DAFF while provincial departments of agriculture are implementing agents
Past performance 2015/16 audited financial outcomes R467 million was allocated to provinces, R467 million (100 per cent) was transferred, of which
R465 million (99.7 per cent) was spent by the end of the financial year

This gazette is also available free online at www.gpwonline.co.za
86 No. 40913 GOVERNMENT GAZETTE, 12 JUNE 2017
Ilima/Letsema Projects Grant 2015/16 service delivery performance
25 349 jobs were created 150 363 beneficiaries were supported by the programme 62 273 households were supported with starter packs and production inputs 156 schools assisted with food gardens 419 community food gardens established 81 403 hectares of land planted Between 3-7 tons per hectare of maize produced
Projected life Grant continues until 2019/20, subject to review MTEF allocations 2017/18: R522 million; 2018/19: R552 million; and 2019/20: R583 million Payment schedule Four instalments: 21 April 2017; 25 August 2017; 27 October 2017; and 26 January 2018 Responsibilities of the transferring officer and receiving officer
Responsibilities of the national department Agree on outputs and targets with provincial departments in line with grant objectives for 2017/18 Oversee and monitor implementation of the grant during Ministerial Technical Committee on
Agriculture and quarterly review meetings Provide guidelines and criteria for the development and approval of business plans Monitor monthly financial expenditure by provinces and conduct sampled quarterly project site visits Submit monthly financial reports to National Treasury 20 days after the end of the month Submit quarterly performance reports to National Treasury within 45 days after the end of each quarter Submit annual performance reports to National Treasury within four months after the end of the
financial year Responsibilities of the provincial departments
Provinces to adhere to the conditions of this framework and 2017 DoRA Provinces to report monthly (financial) 15 days after the end of each month, and quarterly
(non-financial) 20 days after the end of each quarter, and annually two months after the end of the financial year on the progress and achievements of the programme
Provinces must draft and implement the Ilima/Letsema business plans as approved All receiving departments must abide by the PFMA, Treasury Regulations and the 2017 DoRA when
executing projects as well as for reporting purposes Provinces to inform the TO of any changes from plans and allocations approved by the TO, within
seven days of such a change, and such changes must be approved by the TO before they are implemented
Assign and delegate officials to manage and monitor the implementation of the programme Monitor project implementation on quarterly basis and evaluate the impact of projects in achieving
Ilima/Letsema goals Process for approval of the 2018/19 business plans
Provide provincial departments with business plan format, guidelines, criteria and outputs as prescribed by National Treasury by 30 May 2017
Submission of provincial Ilima/Letsema business plans by provinces on 29 September 2017 Engagement with provinces at the pre-national assessment panel (NAP) on submitted business plans
during October/November 2017 prior to final NAP meeting Evaluation and recommendation of business plans by NAP between November 2017 and
February 2018 Send funding agreements to provinces by February/March 2018 to be signed by HoDs, CFOs, and
Ilima/Letsema coordinators Approval of business plans by the TO before 30 March 2018 Inform provinces of approval of their business plans by March or April 2018 Approval by the TO regarding 2018 business planning process compliance during April 2018, and send
to National Treasury by end April 2018

This gazette is also available free online at www.gpwonline.co.za
STAATSKOERANT, 12 JUNIE 2017 No. 40913 87
Land Care Programme Grant: Poverty Relief and Infrastructure Development Transferring department Agriculture, Forestry and Fisheries (Vote 24) Grant schedule Schedule 5, Part A Strategic goal To optimise productivity and sustainability of natural resources leading to greater productivity, food
security, job creation and better quality of life for all Grant purpose To promote sustainable use and management of natural resources by engaging in community based
initiatives that support the pillars of sustainability (social, economic and environmental), leading to greater productivity, food security, job creation and better well-being for all
Outcome statements Improved veld carrying capacity and livestock productivity Improved production potential of arable land leading to increased yield Improved quantity and quality of South Africa’s water resources by mitigating disaster risks for the sector Improved youth participation in the agricultural sector and intergenerational transfer of skills Improved custodianship and stewardship of natural resources through community based ownership Improved livelihoods of rural communities within the ambit of the green economy Improved partnerships with private, public and community sectors that are responsible for natural
resources Improved knowledge and skills base in the sustainable use and management of natural resources Enhanced ecosystem services for current and future generations
Outputs Hectares of rangeland protected and rehabilitated Hectares of land protected and rehabilitated Number of Junior Care participants involved in the programme Number of hectares of land where water resources are protected and rehabilitated Number of capacity building initiatives conducted for Junior Care Number of capacity building initiatives conducted for Land Carers Number of awareness campaigns conducted and attended by Land Carers Hectares of land where weeds and invader plants are under control Number of kilometres of fence erected Number of green jobs created expressed as full time equivalents (FTEs) Number of Land Care committees established
Priority outcome(s) of government that this grant primarily contributes to
Outcome 4: Decent employment through inclusive economic growth Outcome 7: Comprehensive rural development and land reform Outcome 10: Protect and enhance our environmental assets and natural resources
Details contained in the business plan
Outcome indicators Outputs indicators Inputs Cash flow projections and statement of work Key activities/implementation plan Monitoring and evaluation Risk and mitigation Exit strategy
Conditions Provinces must confirm capacity to implement projects and operational funding before funds can be transferred
Provincial departments’ annual evaluations for 2017/18 must be submitted using an approved template that clearly indicates measurable objectives and performance targets as per the business plans approved by the Department of Agriculture, Forestry and Fisheries (DAFF)
The impact (before and after) of the Land Care programme should also be quantified during initiation, implementation and handing over phases of the projects
Provinces should report their financial performance per project on the 15th of every month in compliance with the 2017 Division of Revenue Act (DoRA)
Provinces should report on the number of jobs created 15 days after the end of each month. The report should, amongst other requirements, indicate for each participant their name, surname, identity number, gender, project name, wage and duration of employment. The number of jobs created should further be reported on the Expanded Public Works Programme (EPWP) reporting system
Projects should adhere to the reporting dates as stipulated in the 2017 DoRA, and furthermore adhere to the agreed dates as approved by the natural resource management working group (NRMWG)
Provinces should submit their portfolio of evidence (acknowledgement letters, project maps etc.) that is in line with their quarterly and monthly reports. The evidence should be submitted together with the quarterly report
Allocation criteria Allocations are based on an index comprising of nodes, land capability, poverty, degradation and land size derived from the following sources: o nodes of the most deprived wards in comprehensive rural development programme o land capability = total hectares class I, II and III (spatial analysis - land capability data) o size = hectares (new boundaries from the Municipal Demarcations Board) o poverty = poverty gap based on food poverty line (Statistics South Africa Living Conditions Survey
2011) o degradation = hectares (Land degradation report 2016) o policy imperatives and development for sustainable land management
Reasons not incorporated in equitable share
The funding originated with the special poverty allocations made by national government for a specific purpose

This gazette is also available free online at www.gpwonline.co.za
88 No. 40913 GOVERNMENT GAZETTE, 12 JUNE 2017
Land Care Programme Grant: Poverty Relief and Infrastructure Development Past performance 2015/16 audited financial outcomes
R65 million was allocated and transferred (100 per cent) to provinces, of which provinces spent R65.5 million (100.8 per cent) by the end of the financial year
2015/16 service delivery performance 7 991 hectares of rangeland protected and rehabilitated 23 992 hectares of land protected and rehabilitated 21 447 Junior Care participants involved in the programme 783 hectares of land where water resources are protected and rehabilitated 3 769 capacity building initiatives conducted for Junior Care 12 720 capacity building initiatives conducted for Land Carers 25 100 awareness campaigns conducted and attended by Land Carers 14 807 hectares of land where weeds and invader plants are under control 296 kilometres of fence erected 972 green jobs created expressed as Full Time Equivalents (FTEs) 95 LandCare committee established
Projected life This grant will be reviewed when and if the need arises to align it with changes in the EPWP, outcome approach, national planning report and any policy development within government
MTEF allocations 2017/18: R74 million; 2018/19: R78 million; and 2019/20: R82 million Payment schedule Allocation to provinces will be disbursed on a quarterly basis (25 April 2017; 22 August 2017;
24 October 2017; and 23 January 2018) Percentage allocation per province will depend on the approved provincial business plan budget
Responsibilities of the transferring and receiving officers
Responsibilities of the national department Agree on outputs and targets with provincial departments in line with grant objectives for 2017/18 Review norms and standards for the implementation of the grant during the NRMWG meeting held
quarterly Provide the guidelines and criteria for the development and approval of business plans Monitor implementation through project site visits and provide support to provinces Submit quarterly performance reports to the National Treasury within 45 days after the end of each
quarter Submit evaluation reports to the National Treasury within four months after the end of the financial year
Responsibilities of the provincial departments Provincial departments to report monthly (financial) and quarterly (non-financial) on the progress of the
projects as prescribed by 2017 DoRA. Provinces should further adhere to agreements approved by the NRMWG on performance reporting and any other matter related to natural resource management
Provincial departments to report monthly on jobs created as part of the EPWP. These reports should be submitted to the Department of Public Works using the approved reporting system
Provinces should further report jobs created to the DAFF using the prescribed Department of Public Works reporting template/format within 15 days after the end of each month
Provincial departments to implement the projects according to the approved business plans. Any deviation should first be communicated to DAFF in writing and approved by DAFF before implementation
Provinces must hold provincial assessment panels that are inclusive of relevant partners before submission of preliminary individual and provincial business plans to DAFF by 29 September 2017
Provincial departments should monitor project implementation and evaluate the impacts of projects in achieving Land Care goals
Provinces to submit evaluation reports to DAFF two months after the end of the financial year Process for approval of the 2018/19 business plans
DAFF must provide provincial departments with business plan formats, guidelines, criteria and outputs as prescribed by National Treasury and DAFF by June 2017
Submission of signed preliminary provincial and individual Land Care business plans by provinces on or before 29 September 2017
Engagement by DAFF with provinces on business plans submitted before provincial assessment panel and prior to the national assessment panel
Evaluation and recommendation of business plans by national assessment panel before the end of February 2018
Interactions with provinces on national assessment panel comments and final submission of signed individual and provincial business plans by the provinces prior to approval by the DAFF’s TO
Approval of business plans by the DAFF’s TO before the end of March 2018 Notify provinces of the approval of business plans before 30 March 2018 Send funding agreements to provinces by March 2017 to be signed by the heads of department

This gazette is also available free online at www.gpwonline.co.za
STAATSKOERANT, 12 JUNIE 2017 No. 40913 89
ARTS AND CULTURE GRANT
Community Library Services Grant Transferring department Arts and Culture (Vote 37) Grant schedule Schedule 5, Part A Strategic goal To enable the South African society to gain access to knowledge and information that will improve
their socio-economic status Grant purpose To transform urban and rural community library infrastructure, facilities and services (primarily targeting
previously disadvantaged communities) through a recapitalised programme at provincial level in support of local government and national initiatives
Outcome statements Improved coordination and collaboration between national, provincial and local government on library services
Equitable access to transformed library and information services delivered to all rural and urban communities
Improved library infrastructure and services that reflect the specific needs of the communities they serve Improved staff capacity at urban and rural libraries to respond appropriately to community knowledge and
information needs Improved culture of reading
Outputs 420 000 items of library materials (books, periodicals, toys etc.) purchased Library information and communication technology infrastructure and systems software in all provinces Library material and services for the visually impaired at identified community libraries in all provinces 26 new library structures completed 18 new library services established for dual-purpose libraries 40 upgraded and maintained library structures 1 665 existing contract library staff maintained in all provinces 45 new staff appointed for dual-purpose libraries 80 new staff appointed at public libraries to support the shifting of the function to provinces Capacity building programmes for public librarians
Priority outcome(s) of government that this grant primarily contributes to
Outcome 1: Quality basic education Outcome 14: Nation building and social cohesion
Details contained in the business plan
Outcome indicators Output indicators Inputs Key activities
Conditions The provincial business plans must be developed in accordance with identified priority areas To qualify for allocations from the grant in 2018/19 provinces must submit progress reports that detail a
phased approach towards the full funding of the function, either by assignment to municipalities, or preparation of provinces to take over the function, or a combination of both. This must be done by the end of the 2017 medium term expenditure framework (MTEF). Grant funding must not be used to replace funding for items that provinces have previously allocated to community libraries
Provinces may use a maximum of five per cent of the total amount allocated to them for capacity building and provincial management of the grant
The details of how these funds will be used must be included in the respective business plans Provinces will include in their business plans, the scope of work for maintenance and upgrades, including
the budget to be committed to the maintenance and upgrading of existing libraries Funds earmarked to support Schedule 5 function shift in category B municipalities and to establish dual
purpose service points may only be used for that purpose. Provinces may use up to 80 per cent of their earmarked allocations in 2017/18 financial year to address the Schedule 5 function shift imperative in category B municipalities. At least 20 per cent of the earmarked additional allocations must be used to establish dual purpose service points in collaboration with provincial departments of Education. The detail of how these funds will be used by provinces must be included in their respective business plans. The total earmarked allocations per province are as follows: o Eastern Cape: R63.1 million o Free State: R80.1 million o Gauteng: R86.4 million o KwaZulu-Natal: R77.3 million o Limpopo: R26.5 million o Mpumalanga: R60.5 million o Northern Cape: R60.6 million o North West: R53.7 million o Western Cape: R77.2 million
Service level agreements (SLAs) determining reporting protocols must be signed with receiving municipalities within two months after the 2017 Division of Revenue Act (DoRA) takes effect
The SLAs must include financial commitments over the MTEF in addition to the payment schedules to municipalities and reporting protocols which outline measurable performance targets for each municipality

This gazette is also available free online at www.gpwonline.co.za
90 No. 40913 GOVERNMENT GAZETTE, 12 JUNE 2017
Community Library Services Grant Allocation criteria The allocation criteria is based on an evaluation report for 2015/16 conducted by the national Department of
Arts and Culture (DAC) which identified community library needs and priorities Reasons not incorporated in equitable share
This funding is intended to address backlogs and disparities in the provision and maintenance of community library services across provinces, and enable the DAC to provide strategic guidance and alignment with national priorities
Past performance 2015/16 audited financial outcomes Allocated R1.4 billion, R1.3 billion (91.9 per cent) was transferred to provinces, of which R1.2 billion
(96.5 per cent) was spent by provinces by the end of the financial year 2015/16 service delivery performance
35 libraries upgraded 44 libraries built 59 new staff appointed 70 bursaries maintained
Projected life The projected life will be informed by evaluation reports and should become part of the provincial equitable share in 2019/20 if provinces have completed the function shift and completed a process that leads to the full funding of the service
MTEF allocations 2017/18: R1.4 billion; 2018/19: R1.5 billion; and 2019/20: R1.6 billion Payment schedule Four instalments: 21 April 2017; 14 July 2017; 13 October 2017; and 18 January 2018 Responsibilities of the transferring officer and receiving officer
Responsibilities of the national department Finalise a framework for planning the allocation of library funding at the provincial level by 9 February
2018 that must prescribe minimum norms and standards for the provision of public libraries Establish an intergovernmental forum with provinces that meets at least twice a year to discuss issues related
to the provision of community library services Participate in at least one intergovernmental forum meeting per province between provinces and
municipalities per year Identify challenges and risks and prepare mitigation strategies Monitor and evaluate implementation Evaluate annual performance of the grant for the previous financial year, for submission to National
Treasury within four months after the end of the financial year Submit monthly financial and quarterly performance reports to the National Treasury Determine outputs and targets for 2018/19 with provincial departments
Responsibilities of the provincial departments Provinces must establish intergovernmental forums with municipalities within their province that are funded
through this grant, that meet at least three times a year to discuss issues related to the provision of community library services
Provincial departments must establish capacity to monitor and evaluate SLAs with municipalities Provinces must maintain the number of staff appointed using this conditional grant Submit evaluation reports to the DAC within two months after the end of the financial year Submit signed monthly financial reports of provinces to DAC within 15 days after the end every month Submit quarterly performance reports to the DAC within 30 days after the end of the quarter
Process for approval of the 2018/19 business plans
Provinces must submit a draft progress report for comment to DAC by 4 August 2017. A final report must be submitted by 3 October 2017
Progress reports must detail at least the following: o criteria that will be used to evaluate the capacity of municipalities to administer the function on behalf
of the province o a policy framework for funding municipalities that administer the service o this framework must provide for funding the service over a three year time horizon
Provinces to submit draft business plans to DAC by 7 September 2017. Business plans must be aligned to their strategies for full funding of the function
DAC to evaluate provincial business plans and provide feedback to provinces by 27 October 2017 Provinces to submit final provincial business plans to DAC by 12 January 2018 DAC approves business plans and submits them to National Treasury by 31 January 2018

This gazette is also available free online at www.gpwonline.co.za
STAATSKOERANT, 12 JUNIE 2017 No. 40913 91
BASIC EDUCATION GRANTS
Education Infrastructure Grant Transferring department Basic Education (Vote 14) Grant schedule Schedule 4, Part A Strategic goal To supplement provinces to fund the provision of education infrastructure in line with the regulations
relating to minimum uniform norms and standards for public school infrastructure Grant purpose To help accelerate construction, maintenance, upgrading and rehabilitation of new and existing
infrastructure in education including district and circuit accommodation To enhance capacity to deliver infrastructure in education To address damage to infrastructure To address achievement of the targets set out in the minimum norms and standards for school
infrastructure Outcome statements Improved quality of education service delivery by provincial departments as a result of an improved
and increased stock of schools infrastructure Aligned and coordinated approach to infrastructure development at the provincial sphere Improved education infrastructure expenditure patterns Improved response to the rehabilitation of school infrastructure Improved rates of employment and skills development in the delivery of infrastructure
Outputs Number of new schools, additional education spaces, education support spaces and administration facilities constructed as well as equipment and furniture provided
Number of existing schools’ infrastructure upgraded and rehabilitated Number of new and existing schools maintained Number of work opportunities created Number of new special schools provided and existing special and full service schools upgraded and
maintained Priority outcome(s) of government that this grant primarily contributes to
Outcome 1: Quality basic education
Documents to be assessed as per the Performance Based Approach System guidelines
This grant uses an infrastructure plan that includes: o the infrastructure programme management plan (IPMP) o the procurement strategy o the capacitation strategy o the infrastructure reporting model (IRM) o the year-end evaluation report
Conditions Provinces may use a maximum of R42.2 million of this grant in 2017/18 for the appointment of public servants to their infrastructure units in line with the human resource capacitation circular published by National Treasury
The flow of the first instalment of the grant depends upon receipt by the national Department of Basic Education (DBE) and provincial treasuries of: o approved and signed-off infrastructure plan with prioritised project lists for the 2017 medium
term expenditure framework (MTEF) by no later than 31 March 2017. The infrastructure plan must also include the implementation plans for schools affected by natural disasters
o preventative and corrective maintenance plan for all maintenance programmes over the MTEF period accompanied by a project list no later than 31 March 2017
The flow of the second instalment depends upon receipt by DBE and provincial treasuries of the approved and signed-off: o monthly infrastructure reports in a format determined by the National Treasury and DBE o national education infrastructure management system (NEIMS) assessment forms for the fourth
quarter of the 2016/17 financial year no later than 28 April 2017 o a report on the filling of posts on the approved establishment for the infrastructure unit in the
format approved by National Treasury for the fourth quarter of the 2016/17 financial year within 22 days after the end of the fourth quarter
o quarterly performance reports on disaster allocations for the fourth quarter of 2016/17 to the Provincial Disaster Management Centre (PDMC) and DBE
The flow of the third instalment is dependent upon receipt by DBE, the relevant provincial treasuries and the National Treasury, on a date and in a format determined by National Treasury, of the approved and signed-off: o infrastructure plan for all infrastructure programmes for a period of 10 years (including the initial
list of prioritised projects). The 2017/18 project list must be drawn from the prioritised project list for the MTEF tabled in 2016/17 on a date specified in the Performance Based Approach guidelines
o preventative and corrective maintenance plans for all maintenance programmes over the MTEF period accompanied by a project list on a date specified in the Performance Based Approach guidelines

This gazette is also available free online at www.gpwonline.co.za
92 No. 40913 GOVERNMENT GAZETTE, 12 JUNE 2017
Education Infrastructure Grant o monthly infrastructure reports in the format determined by National Treasury and the DBE
o NEIMS assessment forms for the first quarter of 2017/18 by 28 July 2017 o a report on the filling of posts on the approved establishment for the infrastructure unit in the
format approved by National Treasury for the first quarter of the 2017/18 financial year within 22 days after the end of the first quarter
o the conditional grant year-end evaluation report on financial and non-financial performance no later than 31 May 2017
The flow of the fourth instalment is conditional upon receipt by the DBE and relevant provincial treasuries of the approved and signed off: o monthly infrastructure reports in the format determined by National Treasury and the DBE o NEIMS assessment forms for the second quarter of 2017/18 by 27 October 2017 o IPMP for infrastructure programmes envisaged to commence within the period for the medium
term expenditure framework on a date specified in the performance based approach guidelines o procurement strategy for infrastructure programmes envisaged to commence within the period of
the medium term expenditure framework on a date specified in the performance based approach guidelines
o a report on the filling of posts on the approved establishment for the infrastructure unit in the format approved by National Treasury for the second quarter of the 2017/18 financial year within 22 days after the end of the second quarter
The flow of the fifth instalment is conditional upon receipt by the DBE and the relevant provincial treasuries, on a date determined by National Treasury, of the approved and signed-off: o monthly infrastructure reports in the format determined by National Treasury and the DBE o NEIMS assessment forms for the third quarter of 2017/18 to DBE not later than 23 January 2018 o a report on the filling of posts on the approved establishment for the infrastructure unit in the
format approved by National Treasury for the third quarter of the 2017/18 financial year within 22 days after the end of the third quarter
Provincial education departments (PEDs) must provide school governing bodies with maintenance guidelines to conduct minor maintenance. This should be in accordance with the sector maintenance strategy
PEDs should allocate no less than 20 per cent of the EIG allocation to address preventative and corrective maintenance at schools
In schools without section 21 responsibilities, PEDs should put in place the necessary measures to ensure that planned maintenance at these schools occurs as per the scheduled maintenance plan for such schools
PEDs must provide all the necessary equipment and furniture in the spaces provided when constructing new projects
PEDs to submit their plans for the procurement of mobile classrooms to the DBE and that any deviation from these plans should be approved in writing by DBE and National Treasury
PEDs must adhere to the prescripts of the National Treasury instruction number 2 of 2015/16 on the implementation of the school cost norms
Compliance with the conditions of this grant framework and the relevant clauses within the stipulated timeframes of the 2017 Division of Revenue Act (DoRA)
Non-compliance with any of the above conditions may result in the withholding and subsequent stopping of transfers
Allocation criteria Allocations for 2017/18 are based on historical allocations for this grant Allocations also include incentive based allocations as described in Annexure W1 for the 2017 DoRA
Reason not incorporated in equitable share
Funding infrastructure through a conditional grant enables the national department to ensure the delivery and maintenance of education infrastructure in a coordinated and efficient manner, and consistent with national norms and standards for school buildings
Past performance 2015/16 audited financial outcomes R9.7 billion was allocated to provinces, R9.4 billion (96.9 per cent) transferred, of which
R9.5 billion (101.5 per cent) was spent by the end of the national financial year 2015/16 service delivery performance
5 941 teaching spaces, 2 254 administrative spaces, 597 maintenance or upgrading projects 622 water, 1 610 sanitation, 138 electricity and 379 fencing infrastructure projects 80 sports facilities were provided The sector has provided a total of 100 new and replacement schools in respective provinces
Projected life Grant continues until 2019/20, subject to review MTEF allocations 2017/18: R10 billion; 2018/19: R13.4 billion; and 2019/20 R14.1 billion Payment schedule Transfers are made in accordance with a payment schedule approved by National Treasury

This gazette is also available free online at www.gpwonline.co.za
STAATSKOERANT, 12 JUNIE 2017 No. 40913 93
Education Infrastructure Grant Responsibilities of the transferring officer and receiving officer
Responsibilities of the national department Visit selected infrastructure sites in provinces DBE and National Treasury to support provinces to improve infrastructure delivery capacity and
systems Provide guidance to provinces in planning and prioritisation Issue guidelines on the capacitation process of infrastructure units as well as the conditions attached
to the utilisation of the funding DBE and National Treasury to jointly evaluate progress with the capacitation of provincial
infrastructure units and provide feedback to all provinces in terms of the guidelines DBE and National Treasury must jointly evaluate and provide feedback to all provinces on the
assessment of all documents as outlined on the performance based approach system guidelines Submit quarterly performance reports on disaster allocations to the National Disaster Management
Centre and National Treasury within 45 days after the end of each quarter Assess the reports submitted by PEDs and provide feedback before transferring the instalment Submit reports to the National Treasury in terms of quarterly achievements by PEDs Comply with the conditions of this grant framework and the relevant clauses within the stipulated
timeframes of the 2017 DoRA Responsibilities of the provincial departments
Approve monthly provincial infrastructure reports on infrastructure programmes within 15 days after the end of each month to the relevant provincial treasury and DBE
Submit a signed-off monthly provincial infrastructure report on infrastructure programmes within 22 days after the end of each month to the relevant provincial treasury and DBE
Submit quarterly performance reports on disaster allocations, to the PDMC and DBE Comply with the conditions of this grant framework and the relevant clauses within the stipulated
timeframes in 2017 DoRA Submit quarterly capacitation reports within 45 days after the end of each quarter Ensure that Section 42 transfers as per the PFMA are effected
Process for approval of 2018/19 business plans
The process for approval for the 2018 MTEF allocation will be in line with the performance based incentive approach guidelines published by National Treasury

This gazette is also available free online at www.gpwonline.co.za
94 No. 40913 GOVERNMENT GAZETTE, 12 JUNE 2017
HIV and AIDS (Life Skills Education) Grant Transferring department Basic Education (Vote 14) Grant schedule Schedule 5, Part A Strategic goal Addressing social and structural drivers on Human Immunodeficiency Virus (HIV), sexually transmitted
infections (STIs) and Tuberculosis (TB) prevention, care and impact Preventing new HIV, STIs and TB infections To increase access to sexual and reproductive health services including HIV as well as TB services for
learners and educators, with a specific focus on schools that are located in high priority areas Grant purpose To support South Africa’s HIV prevention strategy by providing comprehensive sexuality education and
access to sexual and reproductive health services to learners and educators To mitigate the impact of HIV and TB by providing a caring, supportive and enabling environment for
learners and educators To reduce the vulnerability of children to HIV, TB and STIs, with a particular focus on orphaned
children and girls Outcome statements Increased HIV, STIs and TB knowledge and skills amongst learners, educators and officials
Decrease in risky sexual behaviour among learners, educators and officials Decreased barriers to retention in schools, in particular for vulnerable learners and girls
Outputs 19 750 educators trained to implement comprehensive sexuality education (CSE) and TB prevention programmes for learners to be able to protect themselves from HIV and TB, and their associated key drivers including alcohol and drug use, leading to unsafe sex, learner pregnancy and HIV infection, prioritising schools located in areas with a high burden of HIV and TB infections
7 500 school management teams and governing bodies trained to develop policy implementation plans focusing on keeping mainly young girls in school, ensuring that CSE and TB education is implemented for all learners in schools, access to sexual and reproductive health (SRH) and TB services. A component of training will also address multiple sexual partners among boys
Co-curricular activities on provision of CSE, access to SRH and TB services implemented in schools including a focus on prevention of alcohol and drug use and learner pregnancy, targeting 212 500 learners. Priority will be in the eight education collaboration framework districts as well as schools located in high burden areas
Care and support programmes implemented to reach 190 000 learners and 19 750 educators. Expand the appointment of learner support agents to support vulnerable learners, with a specific focus on keeping girls in school, using the care and support for teaching and learning framework
400 000 copies of curriculum and assessment policy statement compliant material, including material for learners with barriers to learning, printed and distributed to schools. Printing of the school policy pack will be prioritised over learner teacher support material (LTSM) to ensure that all schools have a copy of the Department of Basic Education’s (DBE) national policy on HIV, STIs and TB
Advocacy and social mobilisation events hosted with 500 500 learners, educators and school community members on the new DBE national policy on HIV, STIs and TB to review and change societal norms and values on the provision of CSE and access to SRH and TB services, including a focus on key risk behaviours such as alcohol and drug use, learner pregnancy, inter-generational and transactional sex amongst girls and to advocate for the integrated school health programmes including SRH services such as contraception, HIV testing, condom distribution and information on voluntary male circumcision in secondary schools
Priority outcome(s) of government that this grant primarily contributes to
Outcome 1: Quality basic education Outcome 2: A long and healthy life for all South Africans
Details contained in the business plan
Outcome indicators Output indicators Inputs Key activities
Conditions
Provincial education departments (PEDs) must distribute the grant allocation in accordance with the following weights for the key performance areas: o training and development (10 per cent) o co-curricular activities (20 per cent) o care and support (25 per cent) o learning and teaching support material (10 per cent) o advocacy and social mobilisation (20 per cent) o monitoring and support (8 per cent) o management and administration (7 per cent)
PEDs must report on expenditure according to the above seven key performance areas per quarter Instalments are dependent on the DBE receiving these reports, adherence to approved business plans and
attendance at the biannual inter-provincial meetings The above percentages are guidelines and may be deviated from in accordance with provincial needs
with the approval of the national transferring officer. However, provinces must prioritise areas with high rates of HIV, TB, and learner pregnancy
These deviations should be informed and motivated by achievements and/or critical challenges relating to the trends in the epidemic as relevant to respective provinces and PEDs
PEDs must ensure that they have the necessary capacity and skills to manage the implementation of the grant

This gazette is also available free online at www.gpwonline.co.za
STAATSKOERANT, 12 JUNIE 2017 No. 40913 95
HIV and AIDS (Life Skills Education) Grant Allocation criteria The education component of the provincial equitable share formula, as explained in Annexure W1 of the
2017 Division of Revenue Act, is used to allocate the grant amongst provinces Reason not incorporated in equitable share
To enable the DBE to provide overall guidance, to ensure congruency, coherence and alignment with: o national strategic plan for HIV, STIs and TB (2017–2022) o DBE’s integrated strategy on HIV, STIs and TB (2012–2016) o DBE national policy on HIV, STIs and TB
This enables DBE to exercise an oversight role in the implementation of the HIV and AIDS Life Skills Education programme in schools
Past performance 2015/16 audited financial outcomes R215 million was allocated to provinces, R209 million (97.2 per cent) was transferred to provinces, of
which R215 million (103.2 per cent) was spent by the end of the financial year 2015/16 service delivery performance
1 146 master trainers, 1 9237 life orientation educators and 9 025 educators were trained in the integration of life skills in the curriculum
87 416 functional peer education programmes were undertaken, 84 332 learners trained on the learner retention and learner pregnancy programme, 76 997 learners trained in the substance use programme and 7 950 educators trained to mentor peer education in primary schools
15 469 school based support teams established, 6 571 school management teams trained to develop policy implementation plans, and 172 714 vulnerable learners identified and referred for services
554 950 sets of learning and teaching support material delivered to 19 700 schools and 17 500 first aid kits distributed to 12 250 schools
Advocacy reached 248 063 learners and educators as well as 227 315 members of the school communities and reaching 71 979 learners through advocacy activities focusing on the prevention of TB
13 857 schools reached through monitoring and support visits and 748 meetings held Projected life The grant will be reviewed on an ongoing basis to respond to the nature and trends in the HIV and TB
epidemics MTEF allocations 2017/18: R245 million; 2018/19: R260 million; and 2019/20: R274 million Payment schedule Four instalments: 13 April 2017; 28 July 2017; 27 October 2017; and 26 January 2018 Responsibilities of the transferring officer and receiving officer
Responsibilities of the national department Identify risks and challenges impacting on provincial implementation Develop risk management strategies to address these risks Ensure synergy with national strategies and processes aimed at reducing HIV and the related chronic
illnesses such as TB infection in the country together with their risk factors such as alcohol and drug use Agree on outputs and targets with PEDs in line with grant objectives and national imperatives for
2018/19 by 29 September 2017 Provide evidence-based guidance for the development of business plans based on monitoring and
findings from international and national research Monitor implementation of the programme and provide support to provinces Develop partnerships with key stakeholders Submit quarterly performance reports to National Treasury within 45 days after the end of each quarter
Responsibilities of the provincial departments Ensure synergy with national strategies and processes aimed at reducing HIV and TB infections and all
other related issues including their risk factors such as alcohol and drug use Identify risks and challenges impacting on implementation Develop risk management strategies and implementation plans to address these risks Submit monthly expenditure reports, quarterly and annual performance reports to the DBE in line with
the 2017 Division of Revenue Act and Public Finance Management Act Agree with the DBE on outputs and targets to ensure effective implementation of the programme Monitor implementation of the programme and provide support to districts and schools PEDs to implement the projects according to the approved business plans Any deviation should first be communicated to and approved by the DBE before implementation Evaluate and submit a provincial evaluation report on the performance of the conditional grant to the
DBE by 31 May 2017 Process for approval of 2018/19 business plans
Communication and meeting with provinces to inform targets for the next financial year by 31 October 2017
PEDs submit draft business plans to DBE for evaluation by 30 November 2017 DBE evaluates provincial business plans from 8 December 2017 Comments sent to PEDs to amend the plans by 8 January 2018 PEDs submit amended and signed plans to DBE by 28 February 2018 DBE approves provincial business plans by 30 March 2018

This gazette is also available free online at www.gpwonline.co.za
96 No. 40913 GOVERNMENT GAZETTE, 12 JUNE 2017
Learners with Profound Intellectual Disabilities Grant Transferring department Basic Education (Vote 14) Grant schedule Schedule 5, Part A Strategic goal To ensure that learners with severe to profound intellectual disabilities access quality publicly funded
education and support Grant purpose To provide the necessary support, resources and equipment to identified care centres and schools for the
provision of education to children with severe to profound intellectual disabilities (SPID) Outcome statements Improved access to quality basic education for children with severe to profound intellectual disabilities in
conditions that ensure dignity, promote self-reliance and facilitate active participation in the community Outputs Training of teachers and officials (capacity building)
o provision of an accredited training programme for identified teachers and caregivers of children with SPID
o training of 155 outreach officials to provide outreach services as part of the district-based support (DBS) teams to care centres as well as to ordinary, full-service and special schools
o training of teachers from 31 special/full-service schools to support the special care centres and implement the learning programme
o training of teachers at 155 identified schools to support children with SPID enrolled at these schools by delivering the learning programmes
o capacity building of caregivers at 280 centres contributing towards their professionalisation Outreach services provided o assessment of children with severe to profound intellectual disabilities in schools and centres by
outreach officials o children with profound intellectual disabilities at 280 centres and 31 designated schools introduced to
the learning programme o therapeutic services provided to learners at 280 centres and 31 schools o psycho-social support services provided to learners at 280 centres and 31 schools
Database of selected schools and care centres (national and provincial responsibilities) o baseline information available of 280 care centres, 31 selected special/full-service schools and 155
other schools that provide support and services to children with SPID Human resources specific to inclusive education through the o provision of key additional staff on 3 year contracts, such as: o 9 deputy chief education specialists as provincial project managers o 155 Transversal itinerant team members to deliver education support programmes to special care
centres consisting of a total of 31 psychosocial service providers, 31 special needs teachers at post level 2 (PL2), 31 chief education therapists (speech), 31 chief education therapists (occupational), 31 chief education therapists (physio)
Priority outcome(s) of government that this grant primarily contributes to
Outcome 1: Quality basic education
Details contained in the business plan
Outcome indicators Output indicators Inputs Key activities Annual budget and resource allocation schedules Monitoring and reporting Risk management plan Cash flow projections Participating centres and schools list (separate annexure)
Conditions
Grant structure and allocation The grant is utilised on an interventional basis and is not a general roll-out for all schools and centres Schools’ and centres’ needs and allocation of funds shall be identified through criteria indicated in the
framework in partnership with provinces and the Departments of Health (DoH), Social Development (DSD) and other relevant departments
The grant will support a total of 280 centres and 155 schools across all provinces The provincial funds allocation should be divided in accordance with the following guideline: o 13 per cent for training of teachers and outreach teams o 11 per cent for learning and teaching support materials (LTSM), toolkits and equipment for centres and
designated schools o 56 per cent for compensation of itinerant teams and provincial co-ordinators o 21 per cent for administration including travel, vehicles, accommodation and subsistence o provinces may deviate from the prescribed guidelines provided the transferring officer approves such
deviations The outreach teams must consist of one special needs teacher (PL2), one chief education therapist
(occupational), one chief education therapist (speech), one chief education therapist (physiotherapy) and one psycho-social support specialist
The learning programme that must be offered at centres and schools must be the nationally approved programme

This gazette is also available free online at www.gpwonline.co.za
STAATSKOERANT, 12 JUNIE 2017 No. 40913 97
Learners with Profound Intellectual Disabilities Grant The transferring and receiving departments must appoint or identify a qualified and experienced person/s to
administer, manage and co-ordinate the activities of the grant in accordance with the provisions of the framework and business plan
Business planning process: Priorities
All the grant outputs are prioritised in accordance with the allocation percentages unless the province has requested a deviation
Outputs Training of teachers and outreach teams will be conducted through nationally developed training manuals
and at times as agreed upon with the DBE and will be monitored by national and provincial project co-ordinators. Provinces may contract specialist training providers to offer training
LTSM, equipment and toolkits: these items should be procured as per the minimum specifications as defined by the national Department of Basic Education (DBE) and in line with the learning programme. The grant also supports the training of all end-users in the utilisation of all resources provided to a school
Outreach teams will be appointed and compensated in accordance with post levels as agreed upon with DBE. They will be appointed at district level as members of the district-based support team (DBST) and could be based at district, circuit or school level from where they will be responsible for providing educational support to designated schools and care centres on an itinerant basis. The support provided by the itinerant teams will consist of assessment of learners, provision of therapeutic programmes, training and mentoring of caregivers and teachers and monitoring the implementation of the learning programme, as well as providing psycho-social support to learners and to families. They may also provide support to other children in the community as and when needed
Administrative support will include purchasing of appropriate vehicles, provision of tools of trade, travel, subsistence and accommodation costs when visiting distantly located care centres
Procurement matters Transversal tenders will be developed with the advice of DoH as well as DSD and entered into with
multiple suppliers and provinces will be invited to participate in such procurement contracts. In the absence of a DBE transversal tender, provinces must continue to procure on their own
The grant funds and implementation (procurement, delivery and payment) are to be managed at provincial level
Before equipment and LTSM can be transferred to schools/centres, there should be assurance that systems, controls and capacity is available to manage and maintain these items
Allocation criteria The allocation of the grant will be in accordance with the number of schools and centres that will be participating in the programme
Reason not incorporated in equitable share
In order to address the needs of this seriously marginalised population of children with disabilities of whom the majority are not in school and not accessing educational subsidies through the educational norms applied at schools, the funding has to be ring-fenced in the form of a conditional grant. This will enable the DBE to provide overall guidance, to ensure congruency, coherence and alignment with the policy on the provision of quality education and support for children with severe to profound intellectual disabilities which will be promulgated in the course of 2017
Past performance 2015/16 financial audited outcomes New grant
2015/16 service delivery performance New grant
Projected life The grant will be reviewed on an ongoing basis to respond to the nature and trends in the education of learners with severe to profound intellectual disabilities
MTEF allocations 2017/18: R72 million; 2018/19: R185 million; and 2019/20: R221 million Payment schedule Payments will be made on a quarterly basis on 3 April 2017; 3 July 2017; 2 October 2017; and
2 January 2018 Responsibilities of national transferring officer and receiving officer
Responsibilities of the national department Finalise policy and learning programme for children with SPID Develop training materials, guidelines and advocacy materials Coordinate training of officials on inclusive education Evaluate, approve and submit provincial business plans to National Treasury Provide the administrative services for the grant (manage, coordinate, monitor and support programme
implementation at all levels) Develop and provide capacity building programmes for provincial implementation teams to assist them in
implementing the grant Develop and distribute planning, implementation, monitoring and evaluation guidelines and/or templates
including minimum specifications for school/centre resources Ensure compliance with reporting requirements in line with the provisions of the 2017 Division of Revenue
Act (DoRA) Monitor implementation at provincial, district and school/centre level on a monthly and quarterly basis or as
and when required in line with the grant framework Evaluate the performance of the conditional grant and submit an evaluation report to National Treasury as
per the requirements of the 2017 DoRA

This gazette is also available free online at www.gpwonline.co.za
98 No. 40913 GOVERNMENT GAZETTE, 12 JUNE 2017
Learners with Profound Intellectual Disabilities Grant Establish and strengthen partnerships with relevant stakeholders and government departments Ensure that care centres and schools are improved in terms of provision of education learning programmes
for learners with SPID and that learners are incrementally enrolled at schools on an annual basis Responsibilities of provincial departments
Establishment of provincial task teams with representatives from the department of Health, Basic Education, Social Development, Public Works and Transport and other key stakeholders
The provincial grant managers shall conduct monitoring at all levels on a monthly and quarterly basis or as and when required
Provinces to submit targeted schools and centres lists and their needs to DBE Develop and submit approved business plans to DBE Ensure compliance with reporting requirements by providing consolidated quarterly reports 30 days after
the end of the quarter including other monitoring or diagnostic reports and reviews as required from time to time
Manage and implement the programme in line with the 2017 DoRA and the Public Finance Management Act
Where applicable, participate in transversal tenders issued by the DBE or other provinces in order to procure goods and services related to the outputs of the grant
Monitor and provide support to districts/regions, circuits and schools on a monthly basis or as and when required
Provide human resource capacity at all relevant levels including the appointment or identification of a qualified and experienced person/s to administer, manage and co-ordinate the activities of the grant in accordance with the provisions of the framework and compliance certificates
Appoint outreach teams and provide office facilities and furniture for them, as well as procure tools of trade Evaluate the performance of the grant and submit evaluation reports to DBE within two months after the
end of the financial year Conduct advocacy and awareness raising programmes on the right to education and support of children with
profound intellectual disabilities with relevant stakeholders such as community representatives, parents and non-governmental organisations
Ensure that children with severe to profound intellectual disabilities are assessed and have individual support plans and have access to education programmes which must be incrementally made available at schools
Provincial departments to implement the projects according to the approved business plans. Any deviation should first be communicated to the DBE in writing and approved by the transferring officer before implementation
Process for approval of 2018/19 business plans
Communication and meeting with provinces to inform targets for the next financial year by 30 August 2017 PEDs submit draft business plans to DBE for evaluation by 31 October 2017 DBE evaluates provincial business plans by 16 November 2017 Comments sent to PEDs to amend the plans by 14 December 2017 PEDs submit amended and signed-off plans to DBE by 2 February 2018 DBE approves provincial business plans by 20 March 2018

This gazette is also available free online at www.gpwonline.co.za
STAATSKOERANT, 12 JUNIE 2017 No. 40913 99
Maths, Science and Technology Grant Transferring Department Basic Education (Vote 14) Grant schedule Schedule 5, Part A Strategic goal To strengthen the implementation of the National Development Plan and Action Plan 2019 by
increasing the number of learners taking Maths, Science and Technology (MST) subjects, improving the success rates in the subjects and improving teachers’ capabilities
Grant purpose To provide support and resources to schools, teachers and learners in line with the Curriculum Assessment Policy Statements (CAPS) for the improvement of MST teaching and learning at selected public schools
Outcome statements Improved learner participation and success in MST subjects in the country Outputs School Support
Information, communication and technology (ICT) subject specific resources: o 300 schools supplied with subject specific computer hardware in accordance with the
minimum specifications prescribed by CAPS o 300 schools supplied with subject related software in accordance with the minimum
specifications Workshop equipment and machinery o 200 technical schools’ workshop equipment for technology subjects repaired, maintained
and/or replaced in accordance with the minimum specifications o 200 technical schools’ workshop machinery for technology subjects repaired, maintained and
replaced in accordance with the minimum specifications Laboratories and workshop equipment, apparatus and consumables o 1 000 schools supplied with Mathematics and Science kits o 1 000 laboratories supplied with apparatus for Mathematics and Science subjects in
accordance with the minimum specifications o 500 laboratories and workshops supplied with consumables for Mathematics, Science and
Technology subjects in accordance with the minimum specifications Learner Support o 50 000 learners registered for participation in Mathematics, Science and Technology
Olympiads/Fairs/Expos and other events based on a structured annual calendar including support through learner camps and additional learning, teaching and support material such as study guides
Teacher Support o 1 500 participants attending specific structured training and orientation for teachers and
subject advisors in subject content and teaching methodologies on CAPS for Electrical, Civil and Mechanical Technology, Technical Mathematics, and Technical Sciences
o 1 000 teachers and subject advisors attending targeted and structured training in teaching methodologies and subject content either for Mathematics, Physical, Life, Natural and Agricultural Sciences, Technology, Computer Applications Technology, Information Technology, Agricultural Management and Technology subjects
Priority outcome(s) of government that this grant primarily contributes to
Outcome 1: Quality basic education
Details contained in the Business Plan
Outcome indicators Output indicators Inputs Key activities Annual budget and resource allocation schedules Monitoring and reporting Risk management plan Cash flow projections Participating schools list (separate annexure)
Conditions Grant structure and allocation The grant is utilised on an interventional basis and is not a general roll-out for all schools Schools’ needs and allocation of funds shall be identified through a criteria indicated in the
framework in partnership with Provinces and Districts in the preceding financial period The grant will support a total of 1 000 schools across all provinces covering all MST subjects from
grades R-12 The provincial funds allocation should be divided in accordance with the following guideline: o 10 per cent for ICT resources including training of ICT integration for educators o 20 per cent for repair/replacement and maintenance of workshop equipment and machinery o 40 per cent for laboratories and workshop apparatus and consumables o 15 per cent for learner support o 15 per cent for Technical schools CAPS teachers and subject advisors training and orientation
Provinces may deviate from the prescribed guidelines provided the transferring officer approves all deviations
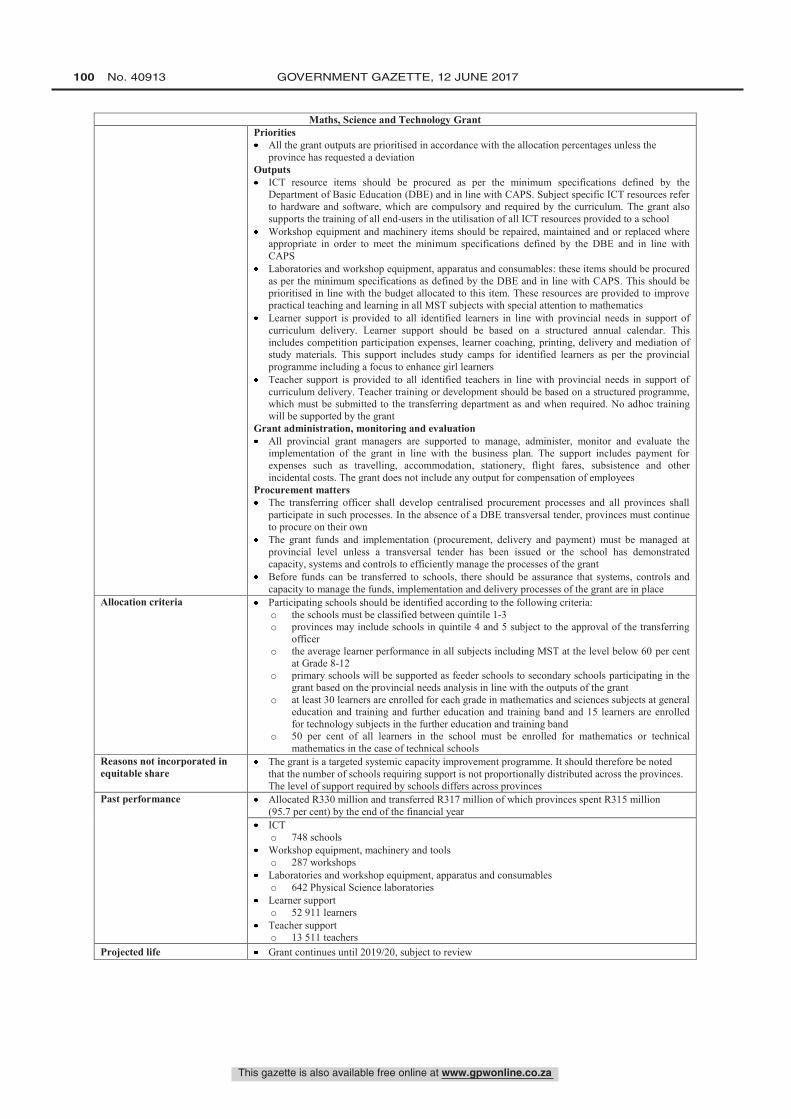
This gazette is also available free online at www.gpwonline.co.za
100 No. 40913 GOVERNMENT GAZETTE, 12 JUNE 2017
Maths, Science and Technology Grant Priorities All the grant outputs are prioritised in accordance with the allocation percentages unless the
province has requested a deviation Outputs ICT resource items should be procured as per the minimum specifications defined by the
Department of Basic Education (DBE) and in line with CAPS. Subject specific ICT resources refer to hardware and software, which are compulsory and required by the curriculum. The grant also supports the training of all end-users in the utilisation of all ICT resources provided to a school
Workshop equipment and machinery items should be repaired, maintained and or replaced where appropriate in order to meet the minimum specifications defined by the DBE and in line with CAPS
Laboratories and workshop equipment, apparatus and consumables: these items should be procured as per the minimum specifications as defined by the DBE and in line with CAPS. This should be prioritised in line with the budget allocated to this item. These resources are provided to improve practical teaching and learning in all MST subjects with special attention to mathematics
Learner support is provided to all identified learners in line with provincial needs in support of curriculum delivery. Learner support should be based on a structured annual calendar. This includes competition participation expenses, learner coaching, printing, delivery and mediation of study materials. This support includes study camps for identified learners as per the provincial programme including a focus to enhance girl learners
Teacher support is provided to all identified teachers in line with provincial needs in support of curriculum delivery. Teacher training or development should be based on a structured programme, which must be submitted to the transferring department as and when required. No adhoc training will be supported by the grant
Grant administration, monitoring and evaluation All provincial grant managers are supported to manage, administer, monitor and evaluate the
implementation of the grant in line with the business plan. The support includes payment for expenses such as travelling, accommodation, stationery, flight fares, subsistence and other incidental costs. The grant does not include any output for compensation of employees
Procurement matters The transferring officer shall develop centralised procurement processes and all provinces shall
participate in such processes. In the absence of a DBE transversal tender, provinces must continue to procure on their own
The grant funds and implementation (procurement, delivery and payment) must be managed at provincial level unless a transversal tender has been issued or the school has demonstrated capacity, systems and controls to efficiently manage the processes of the grant
Before funds can be transferred to schools, there should be assurance that systems, controls and capacity to manage the funds, implementation and delivery processes of the grant are in place
Allocation criteria Participating schools should be identified according to the following criteria: o the schools must be classified between quintile 1-3 o provinces may include schools in quintile 4 and 5 subject to the approval of the transferring
officer o the average learner performance in all subjects including MST at the level below 60 per cent
at Grade 8-12 o primary schools will be supported as feeder schools to secondary schools participating in the
grant based on the provincial needs analysis in line with the outputs of the grant o at least 30 learners are enrolled for each grade in mathematics and sciences subjects at general
education and training and further education and training band and 15 learners are enrolled for technology subjects in the further education and training band
o 50 per cent of all learners in the school must be enrolled for mathematics or technical mathematics in the case of technical schools
Reasons not incorporated in equitable share
The grant is a targeted systemic capacity improvement programme. It should therefore be noted that the number of schools requiring support is not proportionally distributed across the provinces. The level of support required by schools differs across provinces
Past performance Allocated R330 million and transferred R317 million of which provinces spent R315 million (95.7 per cent) by the end of the financial year
ICT o 748 schools
Workshop equipment, machinery and tools o 287 workshops
Laboratories and workshop equipment, apparatus and consumables o 642 Physical Science laboratories
Learner support o 52 911 learners
Teacher support o 13 511 teachers
Projected life Grant continues until 2019/20, subject to review

This gazette is also available free online at www.gpwonline.co.za
STAATSKOERANT, 12 JUNIE 2017 No. 40913 101
Maths, Science and Technology Grant MTEF allocations 2017/18: R365 million; 2018/19: R386 million; and 2019/20: R408 million Payment schedule Four tranches:12 May 2017; 18 August 2017; 17 November 2017; and 9 February 2018 Responsibilities of the transferring national officer and receiving officer
Responsibilities of the national department Identify and analyse areas requiring support in MST Evaluate, approve and submit provincial business plans to National Treasury Provide the administrative services for the grant (manage, coordinate, monitor and support
programme implementation at all levels) Develop and distribute planning, implementation, monitoring and evaluation guidelines and/or
templates including minimum specifications for school resources Ensure compliance with reporting requirements in line with the provisions of the 2017 Division of
Revenue Act (DoRA) Monitor implementation at provincial, district and school level on a quarterly basis or as and when
required in line with the grant framework Evaluate the performance of the conditional grant and submit an evaluation report to National
Treasury as per the requirements of the 2017 DoRA Responsibilities of the provincial departments Identify and analyse areas requiring support in MST Develop and submit approved business plans to DBE Provinces shall submit lists of schools to DBE as per the timeframes set by the grant framework Develop and submit an approved procurement plan in line with the business plan targets by the end
of the financial year Ensure compliance with reporting requirements by providing consolidated monthly expenditure
reports, 15 days after the end of the month, and quarterly reports 30 days after the end of the quarter including other monitoring or diagnostic reports and reviews as required from time to time
Using a portion of the grant funding, manage and implement the programme in line with the 2017 DoRA and the Public Finance Management Act
Where applicable, participate in transversal tenders issued by the DBE or other provinces in order to procure goods and services related to the outputs of the grant
Monitor and provide support to districts/regions, circuits and schools on a monthly and quarterly basis or as and when required
Provide human resource capacity at all relevant levels including the appointment or identification of a qualified and experienced person/s to administer, manage and co-ordinate the activities of the grant in accordance with the provisions of the framework and compliance certificates
Evaluate the performance of the grant and submit evaluation reports to DBE within two months after the end of the financial year
Provincial departments to implement the projects according to the approved business plans. Any deviation should first be communicated, in writing, and approved by the transferring officer before implementation
Responsibilities of the schools Submit schools’ needs on Maths, Science and Technology to the districts as required by the
province Submit quarterly MST activity reports on equipment, machinery, consumables, maintenance,
LTSM and training support Submit learner performance data for all grades in MST subjects to the district and grant manager Ensure that capacity, systems and controls are in place to implement the grant, to receive funds
where a transfer to a school has been agreed upon Receive funds from provincial departments of education and manage the procurement, delivery
and payment processes where necessary Participate in relevant structures that have been put in place to support implementation of the grant
such as annual principal’s meetings Monitor and ensure quality of work of the service providers and sign-off on the completeness of
the service delivery processes Process for approval of the 2018/19 business plans
The first draft of the consolidated provincial business plans and revised school lists to be submitted to DBE for appraisal by 31 October 2017
The DBE team will meet to evaluate the consolidated business plans by 16 November 2017 The comments on the business plans will be sent to provinces for amendments by
14 December 2017 Provinces will be required to submit the provincially approved amended business plans to DBE by
2 February 2018 DBE will approve the final business plans by 9 March 2018 DBE’s transferring officer approves business plans to be submitted to the National Treasury by
20 March 2018

This gazette is also available free online at www.gpwonline.co.za
102 No. 40913 GOVERNMENT GAZETTE, 12 JUNE 2017
National School Nutrition Programme Grant Transferring department Basic Education (Vote 14) Grant schedule Schedule 5, Part A Strategic goal To enhance learning capacity and improve access to education Grant purpose To provide nutritious meals to targeted schools Outcome statements Enhanced learning capacity and improved access to education Outputs 20 084 schools that prepare nutritious meals for learners Priority outcome(s) of government that this grant primarily contributes to
Outcome 1: Quality basic education
Details contained in the business plan
Outcome indicators Output indicators Inputs Key activities Risk management plan
Conditions Spending must be in line with national and provincial business plans The budget allocation must be distributed in terms of the following weightings for both
secondary and primary schools: o school feeding (inclusive of cooking facilities, equipment and utensils): minimum of
96 per cent o administration maximum of 3.5 per cent o de-worming and hygiene practices minimum of 0.5 per cent
Minimum feeding requirements: o provide nutritious meals to all learners in quintile 1 - 3 primary and secondary schools, as
well as identified special schools on all school days o annual meal costs per learner will increase at a minimum of 4 per cent in all benefiting
primary schools and 2 per cent for all secondary schools. Far-flung farm and rural schools that are receiving funds directly should be allocated a higher meal cost to cover higher transport costs
o pay honorarium of a minimum of R1 089 per person for 12 months, plus R11 to the Unemployment Insurance Fund in line with a food handler to learner ratio of 1:200. Food handlers must be allocated in line with approved sliding scales submitted with provincial business plans
o comply with approved food specifications and menu specifications consisting of meals containing starch, protein and fresh vegetable/fruit
o fresh vegetables/fruits must be served daily and vary between green and yellow/red o a variety of protein-rich foods must be served in line with approved menu options. Raw
sugar beans must be packed separately from samp, not mixed in one packet o soya mince must not be served more than twice a week and must meet approved
specifications o pilchards mackerel must be served at least once a week. High quality protein products can
replace pilchards in areas where these are not socially acceptable o Ultra-high temperature (UHT) full cream milk or pasteurised maas must be served once a
week. Milk must be approved in line with dairy standards set by Milk South Africa o provinces must promote sustainable food production and nutrition education
Provinces must promote local economic empowerment, including procurement of fresh produce from smallholder farmers. The farmers should be registered with the Department of Agriculture, Forestry and Fisheries and adhere to good agricultural practices
Provinces that are transferring funds for meals to schools (Eastern Cape, Free State, Limpopo, Northern Cape and North West) are required to reconcile expenditure by schools against budget transfers on a quarterly basis
Provincial business plans will be approved in line with the above minimum requirements and available resources. The following variations may be approved by the transferring officer based on achievements and/or critical challenges in each province: o feeding days reduced to a minimum of 187 days o feeding cost below the minimum requirements, provided the quality of meals is not
compromised o number of learners that exceed the gazetted quintiles o serving of processed vegetables or fruit in remote areas o targeting of learners in quintile 4 and quintile 5 schools o quintile 1-3 schools that do not feed all learners (Gauteng and Western Cape). Approved
letters from schools requesting a deviation from whole school feeding must be provided to the provincial office and kept on record
Provinces must complete a needs assessment audit of cooking facilities, equipment and utensils audit for a needs assessment
Allocation criteria The distribution formula is poverty-based in accordance with the poverty distribution table used in the national norms and standards for school funding as gazetted by the Minister of Basic Education on 17 October 2008
Reasons not incorporated in equitable share
The National School Nutrion Programme (NSNP) is a government programme for poverty alleviation, specifically initiated to uphold the rights of children to basic food and education
The conditional grant framework enables the Department of Basic Education (DBE) to play an oversight role in the implementation of all NSNP activities in schools

This gazette is also available free online at www.gpwonline.co.za
STAATSKOERANT, 12 JUNIE 2017 No. 40913 103
National School Nutrition Programme Grant Past performance
2015/16 audited financial outcomes R5.7 billion was allocated to provinces, R5.7 billion (99.7 per cent) was transfereed, of which
provinces spent R5.7 billion (99.6 per cent) by the end of the financial year 2015/16 service delivery performance
The programme reached 21 177 schools and provided meals to 9.6 million learners nationwide Projected life It is envisaged that, given the levels of poverty in the country and the impact of various health
conditions such as HIV and Aids, diabetes and debilitating chronic conditions, the need for such a grant will persist for at least another 10 years. The programme ensures learners from the poorest communities have decent opportunities to learn
MTEF allocations 2017/18: R6.4 billion; 2018/19: R6.8 billion; and 2019/20: R7.2 billion Payment schedule The payment schedule will be in line with respective provincial procurement models as follows:
o provinces that transfer funds directly to all schools (Eastern Cape, Free State, North West and Northern Cape) receive five instalments as follows: 6 April 2017; 14 June 2017; 7 September 2017; 27 September 2017; and 7 December 2017
o provinces that procure from service providers on behalf of schools receive five instalments as follows: 6 April 2017; 3 August 2017; 27 September 2017; 19 October 2017; and 25 January 2018
o The 27 September 2017 budget transfer is for cooking facilities, equipment and utensils as per equipment specifications provided by the DBE
Responsibilities of the transferring officer and receiving officer
Responsibilities of the national department Develop and submit approved national business plans to the National Treasury Evaluate, approve and submit provincial business plans to the National Treasury Manage, monitor and support programme implementation in provinces Ensure compliance with reporting requirements and NSNP guidelines Consolidate and submit quarterly performance reports to the National Treasury within 45 days
after the end of each quarter Evaluate performance of the conditional grant and submit an evaluation report to the National
Treasury four months after the end of the financial year Responsibilities of the provincial departments
Develop and submit approved business plans to DBE. The business plans should include databases reflecting distribution of volunteer food handlers and cooking fuel per school
Monitor and provide support to districts/regions/area project officers and schools Manage and implement the programme in line with the Division of Revenue Act and the Public
Finance Management Act Implement monitoring and evaluation plans Provide human resource capacity at all relevant levels Evaluate the performance of the conditional grant annually and submit evaluation reports to the
DBE two months after the end of the financial year Submit quarterly financial and performance reports including consolidated monitoring, reporting
and response system (MRR) reports, where applicable to DBE after the end of each quarter Provinces that are transferring funds to schools are required to: o develop and submit transfer schedules reflecting actual dates on which funds will be
transferred to schools o reconcile expenditure by schools against budget transfers on a quarterly basis. Reports on
actual expenditure should be submitted six weeks after the quarter being reported upon Responsibilities of districts
Monitor and support schools Submit monthly and quarterly reports (narrative and expenditure reports to the provincial
department, as well as reports on expenditure by schools, where applicable). This should include consolidated MRR reports, where applicable
Coordinate all NSNP activities in the district Responsibilites of schools Implement the programme in line with the conditions of the NSNP Framework Submit reports to districts as per the provincial reporting requirements (i.e. narrative and
expenditure reports) Safeguarding of programme resources (i.e. cooking facilities, equipment and utensils)
Process for approval of the 2018/19 business plans
Planning meeting by 14 July 2017 Consultation with district officials, provincial treasuries, provincial finance sections and the
National Treasury Inter-provincial meeting held in September 2017 to consult provinces on the 2018/19 conditional
grant framework Provinces submit first draft business plans to DBE by 31 October 2017 DBE to evaluate first draft business plans and send comments to provinces by 24 November
2017 Provinces submit final business plans to DBE by 26 January 2018 The transferring officer to approve national and provincial business plans by 30 March 2018

This gazette is also available free online at www.gpwonline.co.za
104 No. 40913 GOVERNMENT GAZETTE, 12 JUNE 2017
School Infrastructure Backlogs Grant Transferring department Basic Education (Vote 14) Grant schedule Schedule 6, Part A Strategic goal The eradication of inappropriate education structures and backlogs in basic services Grant purpose Eradication of all inappropriate school infrastructure
Provision of water, sanitation and electricity to schools Outcome statements Improved access to enabling learning and teaching environments
Build the capacity of provinces benefiting from an indirect grant (Schedule 6, Part A) allocation to carry out this function themselves in future
Outputs Sub-programme 1: eradication and replacement of 115 inappropriate schools and provision of related school furniture
Sub-programme 2: 344 schools provided with water Sub-programme 3: 257 schools provided with sanitation Sub-programme 4: 134 schools provided with electricity
Priority outcome(s) of government that this grant primarily contributes to
Outcome 1: Quality basic education
Details contained in the infrastructure programme management plan
This grant uses an infrastructure programme management plan (IPMP) that includes the following: o institutional framework o procurement and contract management plan o scope management o time management plan o cost management plan o risk management plan o quality management plan o monitoring and reporting details o budgeting and programme accounting details o performance management plan o communication management plan
Conditions This is an in-kind grant administered by the national Department of Basic Education (DBE) that may be transferred to a province through the Education Infrastructure Grant (EIG) if the province is able to demonstrate, through a proven track record, that it has the capacity to implement the projects
DBE must submit an IPMP Programme governance will be conducted by the following committees established to ensure that various
processes are initiated within the programme: o national steering committee o technical committee o project steering committee o infrastructure bid specification and evaluation committee o infrastructure bid adjudication committee
The provincial planning and monitoring teams (PPMTs) or equivalent in each province should meet monthly to: ensure information flows between the stakeholders; unblock processes; monitor progress; and enhance cooperation
DBE must submit monthly project reports with cash flow to National Treasury 15 days after the end of each month, that show how actual payments and cash flow reconcile with the projected cash flow schedule and explain any deviations from the original projected cash flow
Assets will be transferred to custodians in the respective provinces at final completion. Provincial education departments (PEDs) must report in their annual report, describe how the schools have been considered in their future maintenance plans
The DBE must agree in writing with the provinces on projects that the DBE will administer on behalf of each province
The department and/or implementing agents must ensure skills transfer takes place as part of the implementation of projects
Allocation criteria The grant allocation is based on the distribution of inappropriate structures and schools without access to water, sanitation and electricity across provinces
Final allocations will be based on the finalised IPMP of the DBE as approved by the transferring officer Reasons not incorporated in equitable share
This is a specific purpose grant to eradicate the basic safety norms backlogs in schools without water, sanitation and electricity, and to replace those schools constructed from inappropriate material including mud schools to contribute towards improved learning and teaching. The grant will be administered by the DBE to achieve maximum impact in the shortest time possible
Past performance 2015/16 audited financial outcomes Allocated R2 billion of which R1.6 billion (79.3 per cent) was spent by the end of the national financial
year 2015/16 service delivery performance
163 new schools built, 605 schools provided with water, 412 schools provided with sanitation, and 294 schools provided with electricity

This gazette is also available free online at www.gpwonline.co.za
STAATSKOERANT, 12 JUNIE 2017 No. 40913 105
School Infrastructure Backlogs Grant Projected life Grant will merge with the EIG in 2018/19. In order for the transition to take place, the following
documents are needed: o submission to National Treasury by DBE of the IPMP o the skills transfer and capacity building plans must be submitted to National Treasury before the start
of the financial year MTEF allocations 2017/18: R2.6 billion Payment schedule Payments will be made according to professional service provider’s verified invoices or advance
payments in line with approved memoranda of agreements, implementation plans and reviewed monthly cash flow projections from implementing agents
Responsibilities of the transferring officer and receiving officer
Responsibilities of the national department Undertake planning of the processes, activities, and Accelerated School Infrastructure Delivery Initiative
(ASIDI) programme policies required to realise the outputs and identify required resources Undertake the necessary procurement to secure the services of implementing agents, professional service
providers, contractors and secondary procurement objectives to respond to the scope of work identified in the IPMP
Monitor and evaluate performance of the programme support unit, implementing agents, conduct project site inspections at selected sites to verify progress and quality of the works to secure programme outputs and deliverables
Harness the opportunities offered through the programme to contribute towards skills development The DBE must submit a draft skills transfer and capacity building plan for Schedule 6A allocations to
National Treasury by 30 June 2017; a final plan must be submitted to National Treasury by 1 September 2017. The skills transfer and capacity building plan must set out how the capacity of benefiting provinces will be developed so that they can continue to perform the function after the schedule 6A funded project ends. The plan must set measurable targets that will be achieved over the 2017 medium term expenditure framework. The plan must set out how existing and new capacity building initiatives will be used to achieve these targets
The DBE must submit an annual assessment of progress against its skills transfer and capacity building plan to National Treasury two months after the end of the national financial year
DBE will convene and chair meetings of the national steering committee which will: o provide strategic direction to the ASIDI programme o provide general oversight on the programme o ensure that the management of the programme brings together those players responsible for different
elements of project success and ensure a holistic approach in support of the programme o ensure that standards are in line with different prescripts e.g. norms and standards for school
infrastructure are adhered to o facilitate the establishment of sub-programme management, their membership, reporting modalities
and their interaction with the steering committee o establish the modalities linking the targeted PEDs with DBE o supervise the programme and ensure appropriate coordination and cooperation between different
agencies and departments involved o facilitate the linkages between national stakeholders such as the National Treasury (infrastructure
delivery improvement plan), Construction Industry Development Board, and the national Department of Human Settlements, Water and Sanitation, Energy, and Public Works
o ensure ASIDI strategies and targets are in line with national goals and targets o monitor progress in terms of national goals and targets o assist the management of the programme in solving particular issues that may arise and that may
require the intervention of the committee o report to the Minister of Basic Education, the Council for Education Ministers, the Heads of
education departments Committee, and senior management Develop a sector procurement strategy and procurement strategy for this grant in terms of the practice
guide prescribed by the infrastructure delivery management toolkit The DBE will develop a procurement strategy for this grant that will lead to the quickest possible
achievement of the grant objectives which may require the clustering of projects across provincial boundaries
Submit an approved IPMP including projects list to the National Treasury Ensure compliance with reporting requirements and adherence to projected cash flow schedules Consolidate and submit quarterly reports to National Treasury and National Council of Provinces within
45 days after the end of each quarter Conduct site visits to selected projects to assess performance Create the necessary organisational structures and build capacity within the department to oversee and
monitor the implementation of the grant The DBE must ensure that the heads of education departments committee meets at least once a month
and is provided with sufficiently detailed reports to assess project implementation and projected cash flow schedules reconciled at the end of the month preceding the monthly meetings
Provide an operations and maintenance manual to the PEDs

This gazette is also available free online at www.gpwonline.co.za
106 No. 40913 GOVERNMENT GAZETTE, 12 JUNE 2017
School Infrastructure Backlogs Grant Responsibilities of the provincial departments
Provide the list of schools to be included in the ASIDI programme Ensure that the list of schools identified includes all the schools in their entirety that were not constructed
of appropriate materials in their entirety Ensure that the list of schools identified includes all the schools that never had basic sanitation, water and
electricity Ensure that, where schools are identified for rationalisation and mergers, DBE is made aware on time, in
writing, and that all necessary supporting documents are provided Establish PPMTs that will provide support to the DBE when implementing projects funded by this grant Convene the PPMTs and report to the national steering committee Generate a maintenance plan from the operations and maintenance manual provided
Process for approval of the 2018/19 infrastructure programme management plan
Not applicable

This gazette is also available free online at www.gpwonline.co.za
STAATSKOERANT, 12 JUNIE 2017 No. 40913 107
COOPERATIVE GOVERNANCE AND TRADITIONAL AFFAIRS GRANT
Provincial Disaster Grant Transferring department Cooperative Governance and Traditional Affairs (Vote 4) Grant schedule Schedule 7, Part A Strategic goal To enable a timely response to immediate needs after a disaster has occurred Grant purpose To provide for the immediate release of funds for disaster response Outcome statements Immediate consequences of disasters are mitigated Outputs Emergency repair of critical infrastructure
Emergency provision of goods and services Priority outcome(s) of government that this grant primarily contributes to
Outcome 12: An efficient, effective and development-oriented public service
Details contained in the business plan
Applications for funding from this grant use the National Disaster Management Centre (NDMC) disaster grant guideline which includes the following: o copy of the classification letter in terms of the Disaster Management Act o copy of declaration of disaster in terms of the Disaster Management Act o number of people affected and the extent of damages and losses sectors affected o total funds required for disaster response o resources (both financial and in-kind) allocated by the province to respond and mitigate the effects of
the disaster o resources (both financial and in-kind) committed by other role players, including municipalities,
national departments and non-government organisations o implementation plan with the following: details of the projects to be repaired including geo position
services (GPS) coordinates, costs for the repair of project, consolidated projects cash flow over a three months’ period as an annexure to the implementation plan
An initial funding application from the Provincial Disaster Grant may be based on the initial disaster assessment and verification (draft versions of the supporting documentation required above may be accepted for the initial application)
Conditions A copy of the classification letter and declaration of disaster in terms of the Disaster Management Act must be submitted to the NDMC
This grant may only be used to fund the expenditure in the event that the responsible sphere of government is unable to deal with the effects of the disaster utilising own legislation, guidelines and resources examples of expenditure that may be funded from the grant are as follows: o provide immediate temporary structures and/or shelters in the event that Department of Human
Settlements is unable to provide from own resources o mobile classrooms or temporary structures in the event that the national and provincial departments of
Basic Education are unable to provide from own resources o large scale humanitarian and other relief required that the provincial and national sector departments are
not responsible for or are unable to provide o provision of temporary access roads and bridges in the event the relevant sector is unable to provide the
services. Proof must be presented by the relevant sector o provide assistance to the agricultural sector such as livestock feed and livestock water in the event that
national and provincial sectors are unable to provide from own resources Funds from this grant must be utilised within three calendar months following the date of the transfer of the
funds to the province Emergency procurement system as guided by PFMA should be invoked to ensure immediate assistance to
the affected communities Allocation criteria The grant is allocated according to declared disasters and reports from assessments conducted by NDMC,
Provincial Disaster Management Centres (PDMCs) and affected sectors for immediate disaster relief needs Funding may however be released in tranches, with the first tranche based on an initial assessment, verification of the immediate disaster relief needs and the submitted cash flow projection
Reasons not incorporated in equitable share
This grant caters for response and relief from unforeseen and unavoidable disasters
Past performance 2015/16 audited financial outcome Of R111 million allocated, there were no transfers
2015/2016 service delivery performance There were no transfers
Projected life This grant is expected to continue over the 2017 medium term, but will be subject to review MTEF allocations 2017/18: R123 million; 2018/19: R131 million; and 2019/20: R138 million Payment schedule Transfers are made subject to approval by National Treasury

This gazette is also available free online at www.gpwonline.co.za
108 No. 40913 GOVERNMENT GAZETTE, 12 JUNE 2017
Provincial Disaster Grant Responsibilities of the transferring officer and receiving officer
Responsibilities of the National Disaster Management Centre: Conduct a preliminary cost verification and submit an initial request to the National Treasury within
14 days of receiving a written funding request or a submission from the PDMC Confirm support to be provided by relevant national sector departments to prevent duplication resources Seek approval from National Treasury for the disbursement of funds to provincial sector departments
within 35 days of receipt of the written funding request and submission of the preliminary report from the PDMC
Notify the relevant PDMC and provincial treasury of a transfer at least two days before transfer. Funds must be transferred no later than five days after notification
Provide National Treasury with written notification of the transfer within 14 days of a transfer of the grant Submit financial and non-financial reports to National Treasury within 20 days of the end of each month Provide a performance report, within 45 days of the end of the quarter in which the funds were spent, to
National Treasury using the disaster allocation monitoring template agreed to with the National Treasury Responsibilities of Provincial Disaster Management Centres: Together with the affected provincial departments, may conduct initial assessments of disaster impacts to
verify the applications for initial funding within 14 days following the occurrence of a reported incident that meets the conditions
Conduct assessments of disaster impacts together with NDMC and the affected provincial departments, to verify applications for funding, within 35 days of the incident while adhering to the requirements of the Disaster Management Act
Submit requests for disaster funding, monitor projects, and provide reports to the NDMC and provincial treasuries
Provide financial reports to NDMC within 15 days of the end of each month Provide a performance report which includes evidence on progress implementation of the projects to the
NDMC within 35 days of the end of the quarter in which funds are spent Provide a performance report, within 30 days of the end of the quarter in which the funds were spent, to
NDMC using the relevant disaster allocation monitoring template Responsibilities of the provincial departments
Cooperate with the NDMC, PDMC and sector departments to conduct damage assessment and cost verification
Submit initial request for funding to the PDMC within 14 days following the declaration of a disaster Consult with the relevant national sector departments and provincial treasury for support on existing
resources to address the disasters Consult with relevant national sector department on funding request before submission to the PDMC Notify provincial treasury of all submitted requests for funding Ensure sector invoke emergency procurement processes to implement the immediate disaster projects Report and monitor implementation of projects Provide a financial and non-financial report to the PDMC and relevant national sector within 10 days of
the end of each month. Include evidence in the form of invoices and pictures of the projects as Annexures Provide a performance report which includes evidence, and progress on implementation of the projects, to
the PDMC and relevant National Sector within 20 days of the end of the quarter in which funds are spent Responsibilities of the National Departments
Provide support and guidance to provincial sector departments and NDMC regarding line function related matters on assessments and costing verifications
Provide support and guidance to provincial sector departments and NDMC in the preparation of funding requests
Provide support and guidance to provincial sector departments in the preparation of reports and ensure compliance to the guidelines
Monitor and evaluate implementation of projects by provincial sectors Process for approval of 2018/19 business plans
Not applicable

This gazette is also available free online at www.gpwonline.co.za
STAATSKOERANT, 12 JUNIE 2017 No. 40913 109
HEALTH GRANTS
Comprehensive HIV, AIDS and TB Grant Transferring department Health (Vote 16) Grant schedule Schedule 5, Part A Strategic goal The implementation of the National Strategic Plan on HIV, Sexually Transmitted Infections and
Tuberculosis (TB) 2017 – 2022 Grant purpose To enable the health sector to develop and implement an effective response to HIV and AIDS
and TB Outcome statements Improved coordination and collaboration in the implementation of comprehensive HIV, AIDS
and TB grant between national and provincial government Improved quality of HIV and AIDS and TB services including access to: o HIV Counseling and Testing (HCT) o TB case finding, screening and diagnosis o Antiretroviral Treatment (ART) o treatment for TB, including drug-resistant TB o adherence monitoring and support o prevention of TB o prevention of mother-to-child-transmission (PMTCT) o medical male circumcision (MMC)
Improved health workers capacity at provincial and district facilities Strengthened health system
Outputs Number of new patients started on ART Total number of patients on ART remaining in care Number of male condoms distributed Number of female condoms distributed Number of exposed infants HIV positive at 10 weeks Polymerase Chain Reaction (PCR) test Number of clients tested for HIV (including antenatal) Number of MMC performed Number of patients on ART initiated on Isoniazid Preventative Therapy (IPT) Number of clients newly initiated on Bedaquiline Number of adherence clubs TB new smear positive client success rate
Priority outcome(s) of government that this grant primarily contributes to
Outcome 2: A long and healthy life for all South Africans
Details contained in the business plan
Outcome indicators Output indicators Inputs Key activities
Conditions The following priority areas must be supported through the grant: o ART related interventions o care and support (C&S) o condom distribution and high transmission area (HTA) interventions o post exposure prophylaxis (PEP) o prevention of mother to child transmission (PMTCT) o programme management strengthening (PMS) o regional training centres (RTC) o HIV counselling and testing (HCT) o medical male circumcision (MMC) o TB screening, prevention, treatment
Allocation criteria Allocations are based on antenatal HIV prevalence, estimated share of AIDS cases, populations post-demarcation
Reasons not incorporated in equitable share
HIV, AIDS and TB are key national priorities and require a coordinated responses for the country as a whole and this effectively achieved through a conditional grant
Past performance 2015/16 audited financial performance R13.7 billion was allocated, R13.7 billion (99.7 per cent) was transferred to provinces of which
R13.7 billion (100.2 per cent) was spent by provinces 2015/16 service delivery performance
9 936 lay counsellors providing services at service points 11.9 million HIV test were conducted, (including antenatal) 7.5 million beneficiaries had access to HCBC services 3 805 health facilities offered ART services 3.4 million patients were on ART 1 614 high transmission intervention sites were in operation

This gazette is also available free online at www.gpwonline.co.za
110 No. 40913 GOVERNMENT GAZETTE, 12 JUNE 2017
Comprehensive HIV, AIDS and TB Grant 100 per cent of primary health care (PHC) facilities offered PMTCT services 464 731 MMCs were performed 839.9 million male condoms were distributed 27 million female condoms were distributed
Projected life Ongoing in-line with National Strategic Plan on HIV and AIDS MTEF allocations 2017/18: R17.6 billion; 2018/19: R19.9 billion; and 2019/20: R22 billion Payment schedule Monthly instalments based on the approved payment schedule Responsibilities of the transferring national officer and receiving officer
Responsibilities of the National Department Visit provinces twice a year to monitor implementation and provide support Report to the National Treasury on an additional set of indicators agreed upon between the two
departments Meet with National Treasury to review grant performance on a quarterly basis
Responsibilities of the Provincial Departments Quarterly performance output reports to be submitted within 30 days following the reporting
period using standard formats as determined by the national department. Submit an electronic version to be followed by a hard copy signed by the provincial grant receiving manager
Clearly indicate measurable objectives and performance targets as agreed with the national department in provincial departmental business plans for 2016/17 and over the MTEF
Process for approval of the 2018/19 business plans
Submission of draft business plans by 31 October 2017 Submission of final business plans to national Department of Health by 28 February 2018 Submission of final business plans to National Treasury by 30 March 2018

This gazette is also available free online at www.gpwonline.co.za
STAATSKOERANT, 12 JUNIE 2017 No. 40913 111
Health Facility Revitalisation Grant Transferring department Health (Vote 16) Grant schedule Schedule 5, Part A Strategic goal To enable provinces to plan, manage, and transform health infrastructure in line with national and
provincial policy objectives Grant purpose To help accelerate construction, maintenance, upgrading and rehabilitation of new and existing
infrastructure in health including, health technology, organisational development systems and quality assurance
To enhance capacity to deliver health infrastructure Outcome statements Improved service delivery by provincial departments as a result of an enhanced and better quality of health
services Improved quality and quantity of well-maintained health infrastructure (backlog and preventative
maintenance) Improved rates of employment and skills development in the delivery of infrastructure Value for money and cost effective design of facilities in line with the standard for infrastructure
procurement and delivery management (SIPDM) Outputs Number of new facilities completed
Number of facilities maintained Number of facilities upgraded, and renovated Number of facilities commissioned
Priority outcome(s) of government that this grant primarily contributes to
Outcome 2: A long and healthy life for all South Africans
Details contained in the business plan
The business plan for this grant consists of the following: User-asset management plan (U-AMP) infrastructure programme management plan (IPMP) over the 2017 MTEF including a list of projects annual implementation plan (AIP)
Conditions Projects should be initiated in terms of the control framework of the SIPDM stage 0 which requires an initiation report, prefeasibility and feasibility reports are required for all projects
With the exception of funding for costs incurred on stages 0, 1 and 2 of SIPDM projects must be approved by the transferring officer before funds can be released for such projects
The management and procurement of all projects funded through this grant must follow the prescripts of the infrastructure delivery management system (IDMS) and SIPDM
Annual implementation plans signed-off by the heads of department to the national Department of Health (DoH) for approval by 6 March 2017
The 2017 MTEF project list as captured in the AIP for both current and capital budgets should cover: o maintenance of infrastructure o renovations, upgrading and additions of infrastructure o new and replacement of infrastructure
Provinces may utilise a portion of grant funding for the appointment of public servants on permanent basis to their infrastructure units in line with human resource capacitation circular published by National Treasury
In instances where the capacity of the provincial public works department is deemed insufficient, the provincial department of health (PDoH) will be entitled to engage alternative implementing agents (IAs), provided that supply chain management processes as prescribed in the Treasury Regulations for appointment of service providers are followed
PDoHs must enter into service delivery agreements with their IAs Appropriately qualified built environment representatives from the provincial departments’ infrastructure
units must assist in the procurement of professional service providers and contractors by its IA, through representation as a member on the specification and evaluation committees of the IA
Allocation criteria Allocations for 2017/18 are project and performance based Reasons not incorporated in equitable share
Funding infrastructure through a conditional grant enables the national department to ensure the delivery, rehabilitation, maintenance and upgrading of health infrastructure in a coordinated and efficient manner and ensure consistency with national norms, standards and guidelines for health facilities
Past performance 2015/16 audited financial outcomes R 5.7 billion was allocated to provinces, R5.4 billion (95 per cent) was transferred, of which of provinces
spent R5.5 billion (101.4 per cent) by the end of the financial year 2015/16 Performance Number of Projects:
7 planned 6 designed 17 constructed, equipped and operationalised this includes 15 clinics and community health centres as well
as 2 hospitals o the three outputs combined are based on the project package that includes equipment and facilities
which are operationalised from the practical/retention stage 74 rehabilitated

This gazette is also available free online at www.gpwonline.co.za
112 No. 40913 GOVERNMENT GAZETTE, 12 JUNE 2017
Health Facility Revitalisation Grant Projected life Health is a key government priority and given the need to continually maintain health infrastructure to
ensure that norms and standards are maintained, the grant will remain in place until at least the end of the 2017 MTEF
MTEF allocations 2017/18: R5.7 billion; 2018/19: R5.9 billion; and 2019/20: R6.2 billion Payment schedule Transfers are made on quarterly basis in accordance with a payment schedule approved by National
Treasury Responsibilities of the transferring officer and receiving officer
Responsibilities of the national department Coordinate and facilitate site visits Attend quarterly provincial infrastructure progress review meetings with National Treasury Provide guidance to provinces on planning, prioritisation and evaluating of U-AMP, IPMP, AIP, project
proposals and concept reports that provinces develop and submit Review if provinces comply with the SIPDM issued guidelines on the capacitation process of infrastructure
units, as well as the conditions attached to the utilisation of funds DoH and National Treasury must jointly evaluate progress with the 2017 DoRA capacitation of provincial
infrastructure units and provide feedback to all provinces Submit consolidated quarterly report including the value, expenditure and physical progress by project
Responsibilities of the provincial departments Provincial departments must hold progress review meetings with the relevant IAs Provinces must submit to DoH quarterly reports for all projects funded in the 2017/18 financial year in this
grant through the project management information system and infrastructure reporting model PDoHs must align infrastructure plans (U-AMP and IPMP) with their respective strategic plans and annual
performance plans Provinces will include completed projects in their asset register Provinces should undertake life cycle maintenance as well as the full operation, staffing and management
of the projects in facilities completed under this grant Process for approval of the 2018/19 Implementation Plans
The process for approval for the 2018 MTEF will be in line with the performance based incentive approach guidelines published by National Treasury and DoH
PDoH must submit 2018/19 AIP signed-off by the Head of Department to the DoH by 6 March 2018 Submission of draft IPMPs for 2018/19 by DoH to National Treasury by 11 August 2017 Submission of final IPMPs for 2018/19 by DoH to National Treasury by 6 March 2018

This gazette is also available free online at www.gpwonline.co.za
STAATSKOERANT, 12 JUNIE 2017 No. 40913 113
Health Professions Training and Development Grant Transferring department Health (Vote 16) Strategic goal To contribute to the implementation of the national human resource plan for health through the clinical
training and supervision of health science trainees in designated public health facilities in South Africa Grant purpose Support provinces to fund service costs associated with clinical training and supervision of health
science trainees on the public service platform Outcome statements Progressive realisation of the national human resource plan for health
Clinical training and supervision capacity established in designated developmental provinces (Northern Cape, North West, Limpopo, Mpumalanga and Eastern Cape)
Outputs The following categories of health professionals, associated with clinical training and supervision, are funded on the public health service delivery platform:
o Number of specialists o Number of registrars o Number of medical officers o Number of clinical supervisors/trainers per category in nursing, EMS and allied health and pharmacy o Number of grant administration staff
Priority outcome(s) of government that this grant primarily contributes to
Outcome 2: A long and healthy life for all South Africans
Details contained in the business plan
Non-financial business plan – number of specialists, registrars, medical officers, clinical supervisors/tutors per category in nursing, EMS, allied health, pharmacy and grant administration staff funded from the grant
Financial business plan – allocation by economic classification to each category of clinical trainer/supervisor
Conditions Submission of an approved business plan 2017/18 in the prescribed format signed by the provincial Head of Department or receiving officer by 28 February 2017, and the National Department of Health transferring officer by 31 March 2017
Cost of personnel for the administration of grant must not exceed 1 per cent of the total grant allocation National Treasury and NDOH to negotiate funding in 2017/18 for a review of the HPTDG in 2018/19 on
the categories and numbers of students trained under grant and development of the unit costs. On an annual basis, each province must discuss the nature of the clinical training platform with the
relevant higher education institutions in the province National Treasury and NDOH to negotiate funding in 2017/18 for a review commission a review of the
HPTDG in 2018/19 on the categories and numbers of students trained under grant and development of the unit costs
NDOH to work with Department of Higher Education and Training to ensure a national, coordinated process for the planning and funding of health sciences education
Allocation criteria Based on historical allocations and spending patterns Reasons not incorporated in equitable share
Provinces give effect to the national human resource strategy by the clinical training and supervision of health science trainees on the public health service platform
National coordination needed for health science training Past performance 2015/16 audited financial outcomes
Allocated and transferred R2.4 billion to provinces of which R2.4 billion (100 per cent) was spent by the end of the financial year
2015/16 service delivery performance Provincial achievements in training and development by discipline:
o 1 473 registrars o 287 specialists o 294 undergraduates o 14 grant administration staff o 587 postgraduates (nurses and allied health)
Projected life The grant will remain as long as health science trainees are trained and supervised on the public health service platform
MTEF allocations 2017/18: R2.6 billion, 2018/19: R2.8 billion, 2019/20: R2.9 billion Payment schedule Monthly instalments as per approved payment schedule Responsibilities of the transferring officer and receiving officer
Responsibilities of the national department Convene at least one annual meeting of national, provincial and facility programme managers Monitor the number of health science trainers/clinical supervisors that are responsible for health science
training on the public health service delivery platform Conduct a minimum of two site visits to provinces and site visits to selected facilities on a rotational
basis. Provincial visits to include facilities Report on a quarterly basis to the National Treasury on an additional set of indicators agreed upon
between the two departments

This gazette is also available free online at www.gpwonline.co.za
114 No. 40913 GOVERNMENT GAZETTE, 12 JUNE 2017
Health Professions Training and Development Grant Responsibilities of the provincial departments Provinces must provide the allocated amounts for individual facilities to Provincial Treasury for
gazetting as per the number of agreed upon business plans per province and be facility/cluster specific, by 29 April 2017
Provinces must maintain a separate budget for each benefiting facility/cluster Each benefiting facility/cluster budget letter must be supplied by the receiving officer to the facility head
by 29 April 2017 Provinces to monitor the following categories of health science trainers/ clinical supervisors on the
public health service delivery platform by category: o specialists o registrars o medical officers o clinical supervisors/trainers o grant management (admin staff)
Submission of updated specialist details funded by the grant at facility level by 31 March 2017 Submission of updated specialists details funded on the equitable share by 28 February 2017
o Report quarterly (by economic classification) on financial and non-financial performance in the approved expenditure areas
Conduct a minimum of two sites visit to each budgeted facility/complex per annum and submit reports of these site visits to national Department of Health
Process for approval of the 2018/19 business plans
Draft business plans for 2018/19 must be submitted in the approved format by 31 October 2017 Completion of an approved business plans, in the prescribed format, signed by each receiving officer by
28 February 2018, and the transferring officer by 25 March 2018

This gazette is also available free online at www.gpwonline.co.za
STAATSKOERANT, 12 JUNIE 2017 No. 40913 115
National Health Insurance Indirect Grant Transferring department Health (Vote 16) Grant schedule Schedule 6, Part A Strategic goal This grant has five components which are specific to their respective strategic goals:
o Human Papillomavirus Vaccine (HPV) o Health Information Systems o Health Facility Revitalisation o Health Professionals Contracting o Ideal Clinic
To accelerate health sector improvement by strengthening the role of the national Department of Health (DoH) in accelerating delivery of infrastructure particularly in order to assist provinces with weaker capacity and performance in the preparatory phase of National Health Insurance
To reduce the incidence of cancer of the cervix through the introduction of the HPV vaccination to grade 4 school girls
As specified further in the five component frameworks Grant purpose To address capacity constraints in the provinces and to create an alternate track to speed up
infrastructure delivery To improve spending, performance, monitoring and evaluation on NHI pilots and infrastructure
projects To fund the introduction of the HPV vaccination programme in schools
Outcome statements As specified in the five component frameworks Outputs As specified in the five component frameworks Priority outcome(s) of government that this grant primarily contributes to
Outcome 2: A long and healthy life for all South Africans
Details contained in the business plan
As specified in the five component frameworks
Conditions As specified in the five component frameworks Allocation criteria As specified in the five component frameworks Reason not incorporated in equitable share
As specified in the five component frameworks
Past performance 2015/16 audited financial outcome As specified in the five component frameworks
2015/16 service delivery performance As specified in the five component frameworks
Projected life It is likely this will be a temporary grant, with the following five components: o Human Papillomavirus Vaccine: Funding for this programme will be earmarked as a direct
conditional grant in 2018/19 o Health Information Systems: Subject to policy development that will be finalised as part of the
implementation of NHI o Health Facility Revitalisation: the grant will continue over the 2017 medium term expenditure
framework, subject to a review o Health Professionals Contracting: subject to policy developments that will be finalised as part of
the implementation of NHI o Ideal Clinic: The grant is projected to end in 2020/21
MTEF allocations 2017/18: R 1.7 billion; 2018/19: R 1.8 billion; and 2019/20: R 1.9 billion of which the five components are: o Human Papillomavirus Vaccine: 2017/18: R200 million o Health Information Systems: 2017/18: R166 million; 2018/19: R390 million; and
2019/20: R412 million o Health Facility Revitalisation: 2017/18: R949 million; 2018/19: R988 million; and
2019/20: R1 billion o Health Professionals Contracting: 2017/18: R318 million; 2018/19: R337 million; and
2019/20: R355 million o Ideal Clinic: 2017/18: R30 million; 2018/19: R50 million and 2019/20: R53 million
Payment schedule As specified in the five component frameworks Responsibilities of the transferring national officer and receiving officer
Responsibilities of the national department As specified in the five component frameworks
Responsibilities of the provincial department As specified in the five component frameworks
Process for approval of 2018/19 business plans
As specified in the five component frameworks

This gazette is also available free online at www.gpwonline.co.za
116 No. 40913 GOVERNMENT GAZETTE, 12 JUNE 2017
National Health insurance Indirect Grant: Health Facility Revitalisation Component Transferring department Health (Vote 16) Grant schedule Schedule 6, Part A Strategic goal To ensure appropriate health infrastructure that is in line with national and provincial policy objectives Grant purpose To create an alternative track to improve spending, performance as well as monitoring and evaluation on
infrastructure in preparation for National Health Insurance (NHI) To enhance capacity and capability to deliver infrastructure for NHI
Outcome statements Appropriate procurement of service providers for infrastructure delivery for NHI Improved spending, performance, monitoring and evaluation of infrastructure projects for NHI Improved employment and skills development in the delivery of infrastructure for NHI Value for money and cost effectively designed facilities in line with the standard for infrastructure
procurement and delivery management (SIPDM) Outputs Number, value, expenditure and physical progress of health infrastructure projects, initiated, planned,
implemented and closed-out Priority outcome(s) of government that this grant primarily contributes to
Outcome 2: A long and healthy life for all South Africans
Details contained in the business plan
The infrastructure programme management plan (IPMP) for 2017 MTEF aligned to the infrastructure delivery management system and SIPDM will be submitted on 26 May 2017 and will include the following: o costed project lists with annual cash flow projections per project for the full duration of the projects on
the programme o projected milestones per project for SIPDM control framework stages indicating current stage of the
project Conditions:
The national Department of Health (DoH) must, in consultation with the provinces, develop and submit to the National Treasury by 30 June 2017, an intergovernmental protocol framework agreement covering the duration of the grant component and outlining how the grant will operate as well as the responsibility and functions of each sphere. Project sheets will form part of the agreement
Prior to submitting the IPMP, each provincial department must have signed-off a project sheet for all projects funded from the grant which list scope of work, current stage and anticipated target dates for achieving stages of control framework, operational budgets (i.e. personnel, equipment, etc.) and maintenance budgets
With the exception of funding for costs incurred on stages 0, 1 and 2 (project initiation in line with SIPDM and National Treasury capital planning guidelines) approvals for the project by the National Treasury are required before funds can be spent
The grant component must only be spent on projects included in the business plan and project lists signed by provinces. Projects can only be added to the business plan as part of the adjustment budget process, subject to National Treasury approval
In instances where the capacity of the DoH and the provincial department is deemed insufficient, they are entitled to engage alternative implementing agents, provided that supply chain management processes as prescribed in the Treasury Regulations for appointment of service providers are followed. In those cases service level agreements between DoH and the implementing agent must be in place
Appropriately qualified built environment representatives from the national department must assist in the procurement of professional service providers and contractors by its implementing agent
DoH may utilise a portion of grant funding for the appointment of public servants on no more than 36 months contracts to their infrastructure units. The amount that can be used for this is determined in terms of the conditions by the 2017 Appropriation Act
DoH must maintain an up-to-date database (project management information system), infrastructure reporting model (IRM) with all contracts that are fully or partially funded by this grant and provide the IRM report and THS report data on a monthly basis
DoH must convene quarterly progress review committee meetings with all project managers, implementing agents and National Treasury for monitoring and oversight of the performance of all funded projects
All completed projects must have a close-out report with a documented maintenance plan National Treasury may request copies of any documentation and may withhold grant funding if there is
non-compliance with any of the conditions above Allocation criteria Allocations for 2017/18 are project and performance based Reasons not incorporated in equitable share
Funding infrastructure through an indirect conditional grant enables the national department to ensure the delivery and maintenance of health infrastructure in a coordinated and efficient manner that is consistent with national norms, standards and guidelines for health facilities
Past performance 2015/16 audited financial outcomes R913 million was allocated to the grant, which was adjusted to R613 million. Of the adjusted allocation,
R613 million (100 per cent) was spent by the end of the national financial year 2015/16 service delivery performance
By March 2016 there were 220 reported projects funded from the National Health Grant across the country for the 2015/16 financial year; 7 were in initial phase, 14 in planning phase, 81 were in construction phase and, 118 reached practical and work completion (closed out)

This gazette is also available free online at www.gpwonline.co.za
STAATSKOERANT, 12 JUNIE 2017 No. 40913 117
National Health insurance Indirect Grant: Health Facility Revitalisation Component Projected life Health is a key government priority and given the need to continually maintain health infrastructure and
ensure that norms and standards are maintained, the grant will continue over the 2017 MTEF, subject to a review
MTEF allocations 2017/18: R949 million; 2018/19: R988 million; and 2019/20: R1 billion Payment schedule Monthly payments made according to verified and approved invoices from the services providers Responsibilities of the transferring officer and receiving officer
Responsibilities of the national department Build and demonstrate the capacity necessary to manage this grant Ensure alignment between the IPMP and the annual performance plan Undertake the infrastructure development cycle to the extent agreed with the provinces in the
implementation protocol agreements Convene progress review committees with appropriate reporting and invite National Treasury Meet with National Treasury to review grant performance on a quarterly basis Collaboration and coordination with provincial departments for the full development cycle of infrastructure
development in respect of projects funded by this grant Provide provincial departments with progress of the projects under this grant for inclusion in provincial
annual reports. DoH must submit quarterly infrastructure reports to National Treasury within 45 days after the end of each
quarter. These reports must contain: o expenditure per project against the cash flow projections provided in the business plan o explanation of major deviations from the cash flow projections o physical progress per project against the milestones projected in the business plan o explanation of major deviations from the projected milestones o any other challenges experienced and interventions to address these challenges o status report on the capacity of the DoH infrastructure unit to manage the grant component
Responsibilities of the provincial departments Provinces will include completed projects in their asset register Provinces should undertake life cycle maintenance as well as the full operation, staffing and management
of the projects in facilities completed under this grant by the DoH All immovable asset management and maintenance responsibilities of the completed projects under this
grant as prescribed by the Government Immovable Asset Management Act of 2007 rests with the provinces Provinces should report on progress of the projects under this grant in their annual reports and describe
how these facilities have been considered in their future planning and budgeting. The projects must be included in the provincial user-asset management plans (U-AMPS)
Process for approval of the 2018/19 annual implementation plans
Submission of IPMP to National Treasury by 31 May 2018 Submission of signed implementation protocol by 29 June 2018

This gazette is also available free online at www.gpwonline.co.za
118 No. 40913 GOVERNMENT GAZETTE, 12 JUNE 2017
National Health Insurance Indirect Grant: Health Professionals Contracting Component Transferring department Health (Vote 16) Grant schedule Schedule 6, Part A Strategic goal To strengthen the public healthcare systems
To assess the service delivery implications
Grant purpose To develop and implement innovative models for purchasing services from health practitioners in the 10 National Health Insurance (NHI) pilot sites
To develop and implement innovative models for the dispensing and distribution of chronic medication A risk-based capitation model for the reimbursement of primary health care (PHC) facilities developed
Outcome statements Appropriate and innovative models for purchasing services from health practitioners identified and tested Implement an alternative dispensing and distribution model for chronic medication Develop a risk-adjusted capitation model for the reimbursement of primary health care (PHC) facilities
Outputs Innovative models for the purchasing of health care services, including: o number of health practitioners contracted per subcategory o number of pharmacy assistants contracted o number of patient visits attended to by the contracted health practitioners and services provided o number of hours worked by health practitioners
An alternative chronic medicines dispensing and distribution model implemented Number of new and number of total patients registered in the programme, broken down by the following: o Antiretroviral (ARV) Treatment o ARV with co-morbidities o non-communicable diseases (NCDs) o number of pickup points (PuPs) state and non-state
A base capitation model for the reimbursement of PHC facilities developed Priority outcome(s) of government that this grant primarily contributes to
Outcome 2: A long and healthy life for all South Africans
Details contained in the business plan
Business plan for contracting health practitioners should contain roles and responsibilities of national and provincial departments
Targets, cash flow projections as well as monitoring and evaluation plans for the following programmes: o mental health specialist teams o chronic medicines dispensing and distribution model o developing a risk-adjusted capitation model
Service level agreements (SLAs) will include information on the following: o outcome indicators o output indicators o key activities and resource schedule o monitoring and evaluation plan o cash flow requirements for 2017/18
Conditions Project level administrative expenditure may not exceed three per cent of the total grant funding. No activity that is linked to the responsibility of Department of Health (DoH) but falls outside this scope may be funded through this grant
The grant must be used to achieve the objectives of the following areas: o development and testing of innovative models for purchasing health care services from
health practitioners o an alternative chronic care medication dispensing and distribution model o development of a risk-adjusted capitation model for reimbursement of PHC facilities
The DoH must put in place an evaluation strategy using independent external experts to evaluate the interventions funded through this grant. An evaluation report on lessons learnt from contracting health practitioners and their implications for NHI policy development and implementation must be produced and submitted to National Treasury
Allocation criteria Health facilities with the greatest need for health practitioners and where health practitioners are willing to work in the facility will be prioritised
The alternative chronic care medication dispensing and distribution model will be implemented across the country in the ten NHI pilot districts, with priority given to previously disadvantaged areas
Reason not incorporated in equitable share
The importance of central coordination in development of models and the establishment of NHI to inform ongoing NHI designs
Past performance 2015/16 audited financial outcomes R290 million was allocated of which R280 million (96 per cent) was spent by the end of the financial year

This gazette is also available free online at www.gpwonline.co.za
STAATSKOERANT, 12 JUNIE 2017 No. 40913 119
National Health Insurance Indirect Grant: Health Professionals Contracting Component 2015/16 service delivery performance
The data extraction from clinical files within the central hospitals has been undertaken at eight out of 10 central hospitals
The initial financial and clinical analysis has been undertaken and the draft case mix analysis report prepared
Phase two of the programme will continue to develop the base diagnosis related grouper has been started Other data sources from private partners are being sourced for the purpose of triangulation and data
validation With regards to health practitioner contracting, 256 doctors were placed at various clinics in the NHI pilot
districts Projected life Subject to policy developments that will be finalised as part of the implementation of NHI MTEF allocations 2017/18: R318 million; 2018/19: R337 million; and 2019/20: R355 million Payment schedule Payments will be made according to verified invoices or advance payments in line with approved
programme implementation plans from the service providers Monthly instalments which may be altered at the discretion of the National Treasury based on invoices
paid Responsibilities of the transferring officer and receiving officer
Responsibilities of the national department Convene and chair all meetings of the national district health services (NDHS) committee on contracting
of health practitioners and related matters through implementing innovative models for the purchasing of health care services
Establish the necessary organizational structures and build capacity within the DoH to implement, oversee and monitor the execution of all approved projects using the three per cent administrative costs provision
Provide the guidance and support for innovative arrangements of engaging public and private sector providers, including methods of contracting (types of contracts and payment mechanisms)
Undertake an independent evaluation of the interventions funded through this grant using external experts Manage, monitor and support programme implementation Prepare and submit a quarterly performance report to the National Treasury. The reports must include: o expenditure per project against the cash flow projections provided in the business plans o explanation of major deviations from the cash flow projections o physical progress per project against the milestones and targets projected in the business plan o explanation of major deviations from the projected milestones and targets o any other challenges experienced and interventions to address these challenges
Meet with the National Treasury to review grant performance on a quarterly basis Responsibilities of the provincial departments
Facilitate the achievement of grant outputs Ensure compliance with all reporting requirements and adherence to the provisions of SLAs
Process for approval of 2018/19 business plans
DoH must submit final business plans to National Treasury by 30 March 2018

This gazette is also available free online at www.gpwonline.co.za
120 No. 40913 GOVERNMENT GAZETTE, 12 JUNE 2017
National Health Insurance Indirect Grant: Human Papillomavirus Vaccine Component Transferring department Health (Vote 16) Grant schedule Schedule 6, Part A Strategic goal To reduce the incidence of cancer of the cervix through the introduction of the Human Papillomavirus (HPV)
vaccination to grade four school girls Grant purpose To enable the health sector to prevent cervical cancer by making available HPV vaccination for grade four school
girls in all public and special schools Outcome statements Increased access to HPV vaccines by grade four school girls in all public and special schools Outputs 80 per cent of grade four school girls aged 9 and above in vaccinated for HPV
100 per cent of schools with grade four girls reached by the HPV vaccination team Priority outcome(s) of government that this grant primarily contributes to
Outcome 2: A long and healthy life for all South Africans
Details contained in the business plan
The grant uses a service level agreement (SLA) and should contain the following: o agreed upon services o output indicators o inputs o key activities and allocation o risk management plans
Conditions Completion of a SLA in the format determined by the national Department of Health (DoH) between each provincial department and DoH, signed by each receiving officer and transferring officer by 31 March 2017 and submitted to National Treasury by 31 March 2017
Ensure provinces include HPV vaccination indicators in provincial annual performance plans Grant funding must also be used to strengthen capacity in provinces to manage the programme Social mobilisation of community on benefits of HPV for prevention of cervical cancer should be done as part of
this programme Allocation criteria Allocations based on the number of grade four girls and schools with grade four from the education management
information system in each province Reason not incorporated in equitable share
Cervical cancer is a high national priority and requires uniform implementation in order to achieve the minimum coverage of 80 per cent and have the desired impact of significantly reducing incidences of cervical cancer
To develop provincial capacity in order for provinces to assume responsibility of the programme from 2018/19 Past performance 2015/16 audited financial outcome
R200 million was allocated to DoH, of which R158 million (79 per cent) was spent by the end of the financial year 2015/16 service delivery performance
85 per cent of grade four school girls received the HPV vaccination 90 per cent of schools with grade four girls were reached by the HPV vaccination team
Projected life The indirect grant is projected to end in 2017/18 Funding for this programme will be earmarked as a direct conditional grant in 2018/19
MTEF allocations 2017/18: R200 million Payment schedule Payment will be made according to verified invoices or advance payments in line with approved HPV programme
implementation plans Responsibilities of the transferring officer and receiving officer
Responsibilities of the national department Procure and distribute vaccines and other resources as per the provincial HPV vaccination programme Monitor and support provincial planning and implementation Meet with National Treasury to review performance of the grant on a quarterly basis Strengthen the existing capacity in the child, youth and school health cluster for HPV vaccination coordination
within the department Strengthen the capacity of provinces to deliver the HPV vaccination programme Initiate a draft transition plan for hand-over to provinces
Responsibilities of the provincial department Provincial health departments must provide DoH with full and unrestricted access to all records and data related to
the programme Provinces must submit a HPV vaccination implementation plan and micro plan for each district using standard
formats as determined by the DoH Delegate the responsibility of managing the HPV vaccination programme Utilise existing human resource and transport capacity at all relevant levels Provinces must develop draft implementation plans for taking over this function in 2018/19 Submission of business plans in the prescribed format on or before 31 May 2017
Process for completion of 2018/19 service level agreement
Draft business plans for 2018/19 must be submitted in an approved format by 31 October 2017 Final business plans signed by receiving officer must be submitted by 28 February 2018 and to National Treasury
by 31 March 2018

This gazette is also available free online at www.gpwonline.co.za
STAATSKOERANT, 12 JUNIE 2017 No. 40913 121
National Health Insurance Indirect Grant: Ideal Clinics Component Transferring department Health (Vote 16) Grant schedule Schedule 6, Part A Strategic goal To improve quality of services at primary health care facilities Grant purpose To enable the health sector to address the deficiencies in the primary health care facilities systematically to
yield fast results Outcome statements Improved quality health services in all primary health care facilities Outputs 1 700 primary health care facilities peer reviewed
Achieve a cumulative target of 1000 primary health care facilities obtaining an overall compliance score of 70 per cent or above
Branding guidelines completed 5 per cent of clinics in NHI pilot districts branded Sustainability training to clinic managers of 30 per cent of clinics in NHI pilot districts
Priority outcome(s) of government that this grant primarily contributes to
Outcome 2: A long and healthy life for all South Africans
Details contained in the business plan
Input Output indicators Outcome indicators Key activities Risk management plans
Conditions Completion of a business plan by the national Department of Health (DoH) signed by the transferring officer by 24 March 2017 and submitted to the National Treasury by 31 March 2017
Allocation criteria Allocations are based on the number of identified facilities and their needs in each province Reason not incorporated in equitable share
Ideal clinic is a key national priority and requires systematic implementation in order to achieve 740 ideal clinics and have the desired impact of improving quality health care services
Past performance 2015/16 audited financial outcome New grant
2015/16 service delivery performance New grant
Projected life The grant is projected to end in 2020/21 MTEF allocations 2017/18: R30 million; 2018/19: R50 million; and 2019/20: R53 million Payment schedule Procurement will be done centrally by DoH based on the approved procurement plan Responsibilities of the transferring officer and receiving officer
Responsibilities of the national department Improve patients’ experience of care by improving quality in primary health care facilities Monitor and support provincial planning and implementation Submit a quarterly performance report to the National Treasury in terms of the 2017 Division of Revenue
Act Meet with the National Treasury to review performance of the grant on a quarterly basis Strengthen the capacity of provinces to realise and maintain ideal clinic status Maintain the ideal clinic software
Responsibilities of the provincial department Provincial health departments must provide DoH with full and unrestricted access to all records and data
related to the programme Provinces must submit provincial needs as per prescribed format by DoH Include the ideal clinic indicators in the provincial annual performance plans Delegate a person responsible for managing the Ideal clinic programme Provinces must develop draft implementation plans for taking over this function in 2020/21 Submit quarterly performance reports to DoH
Process for completion of 2018/19 business plan
Submission of business plan signed by the transferring officer by 30 March 2018 to National Treasury

This gazette is also available free online at www.gpwonline.co.za
122 No. 40913 GOVERNMENT GAZETTE, 12 JUNE 2017
National Health Insurance Indirect Grant: Health Information Systems Component Transferring department Health (Vote 16) Grant schedule Schedule 6, Part A Strategic goal To strengthen health systems in preparation for the introduction of National Health Insurance (NHI) by
creating systems that improve business efficiencies Grant purpose To fund the development of and roll-out of new health information systems in preparation of NHI Outcome statements Build the enterprise architecture design for patient information systems, procurement and management
of health commodities Outputs Number and percentage of facilities implementing the Health Patient Registration Systems and
processes Number of patients registered on health patient registration systems and processes Number and percentage of primary health care facilities implementing an electronic stock replenishment
system Number and percentage of hospitals implementing an electronic stock replenishment system Visual analytics network established in support of Surveillance of Medicine Availability
Priority outcome(s) of government that this grant primarily contributes to
Outcome 2: A long and healthy life for all South Africans
Details contained in the business plan
The programme governance and management Objectives, indicators and targets Activity plan Monitoring and evaluation plan Cash flow projections
Conditions Completion of a business plan by National Department of Health (DoH) signed by the receiving officer by 24 March 2017 and submitted to National Treasury on 31 March 2017
All information systems developed and implemented under this grant component must comply with the interoperability norms and standards as approved by the National Health Council
Allocation criteria Grant is not allocated per province and will be utilised towards: o the development and making sure that implementation is standardised across provinces, districts
and public health facilities o the establishment of a unified health information and management of health commodities systems
for the country Reasons not incorporated in equitable share
The programme supports health systems reform work within the NHI space and will evolve over time. In line with the National Health Act sections 74.1 and 74.2, DoH has to develop and coordinate all health information systems in the country. This is a complex programme with many facets that requires an iterative process of testing and implementation in a phased manner. This situation calls for dedicated funding which will allow for institutionalisation over time
Past performance 2015/16 audited financial outcomes New grant
2015/16 service delivery performance New grant
Projected life Subject to policy development that will be finalised as part of the implementation of NHI MTEF allocations 2017/18: R166 million; 2018/19: R390 million; and 2019/20: R412 million Payment schedule Procurement will be done centrally at DoH
Responsibilities of the transferring officer
Adhere to all procurement processes Submit a quarterly performance report to the National Treasury in terms of the 2017 Division of
Revenue Act Meet with National Treasury to review performance of the grant on a quarterly basis
Responsibilities of the receiving officer
To provide all the necessary information needed by the DoH Provide access to facilities to implement systems Appoint one or more provincial liaisons/contact persons for both systems
Process for approval of the 2018/19 business plans
Submission of the business plan to National Treasury signed by the transferring officer by 31 March 2018

This gazette is also available free online at www.gpwonline.co.za
STAATSKOERANT, 12 JUNIE 2017 No. 40913 123
National Tertiary Services Grant Transferring department Health (Vote 16) Strategic goal To enable provinces to plan, modernise, rationalise and transform the tertiary hospital service delivery
platform Grant purpose Ensure provision of tertiary health services for all South African citizens (including documented foreign
nationals) To compensate tertiary facilities for the additional costs associated with provision of these services
Outcome statements Modernised and transformed tertiary services that allows for improved access and equity to address the burden of disease
Outputs Number of inpatient separations Number of day patient separations Number of outpatients first attendances Number of outpatients follow-up attendances Number of inpatient days
Priority outcome(s) of government that this grant primarily contributes to
Outcome 2: A long and healthy life for all South Africans
Details contained in the service level agreement
This grant uses national service level agreements (SLAs) which are signed between NDOH and each province and contains the following: o provincial and institutional allocations o tertiary services specifications (approved YES list) funded by the grant, by facility by province o annual targets for inpatient separations, inpatient days, day patient separations, outpatient first visits,
outpatient follow up visits per facility per province per year o monitoring and reporting responsibilities o validation and revision of data o deviations or changes to tertiary services o referral responsibilities o approved business plan o approved specialists funded from the grant (approved specialist detail list) o national guidelines on definitions of tertiary services that may be funded by the grant
Conditions Completion of a national SLA in the prescribed format, signed by the provincial Head of Department or receiving officer by 28 February 2017, and the transferring officer by 31 March 2017
The grant allocation to each central/provincial tertiary facility must not exceed a maximum of 65 per cent of the total facility budget
The following amounts in the allocation to Gauteng are earmarked to fund the operations of the Nelson Mandela Children’s Hospital (NMCH): o R150 million in 2017/18 o R200 million in 2018/19 o R300 million in 2019/20 o All staff for this hospital must be procured at rates no higher than Department of Public Service and
Administration approved remuneration rates o The services offered by Nelson Mandela Children’s hospital should be integrated into the service
delivery platform in collaboration with relevant provinces, particularly Gauteng Allocation criteria Based on historical allocations and spending patterns Reason not incorporated in equitable share
There are significant cross boundary flows associated with tertiary services that are not affected by provincial boundaries due to their specialised nature
Past performance 2015/16 audited financial outcomes Allocated and transferred R10.4 billion to provinces, of which R10.4 billion (100 per cent) was spent by
the end of the national financial year 2015/16 service delivery performance Provincial tertiary services performance was measured against the SLAs and the total patient activity
rendered is as follows: o Inpatient separations 670 415 o Inpatient days 3 932 950 o Day patient separation 298 855 o Outpatient first visits 1 117 783 o Outpatient follow up visits 2 666 335
Projected life Support for tertiary services will continue because of the need to sustain and modernise tertiary services MTEF allocations 2017/18: R11.6 billion; 2018/19: R12.4 billion; 2019/20: R13.2 billion Payment schedule Monthly instalments as per payment schedule approved by National Treasury with the exception of
Nelson Mandela Children’s Hospital where the first payment of R100 million will be made in April 2017. Payments of R25 million each will be made in July and October 2017 based on satisfactory performance

This gazette is also available free online at www.gpwonline.co.za
124 No. 40913 GOVERNMENT GAZETTE, 12 JUNE 2017
Responsibilities of the transferring officer and receiving officer
Responsibilities of the national department Convene at least one annual meeting of national, provincial and facility programme managers Monitor expenditure by economic classification, and patient activity and provide on-site support to
facilities/complexes and provinces Conduct a minimum of two site visits to provinces and a minimum of one site visit to facilities/complexes.
Provincial visits to include facilities Report on a quarterly basis to the National Treasury on an additional set of indicators agreed upon
between the NDoH and National Treasury Responsibilities of the provincial departments Completion of a provincial SLA/memorandum of understanding signed by the receiving officer and the
benefitting institution by 31 March 2017, and submission to NDoH by 28 April 2017(due date for NMCH is 31 March 2017)
Provinces must provide the allocated amounts for individual funded facilities/clusters to Provincial Treasury for gazetting as per the number of agreed upon business plans per province and be facility/cluster specific, by 28 April 2017
Provinces must maintain a separate budget for each benefiting facilities The receiving officer must supply the head of each benefiting facility/complex with a budget letter which
includes the equitable share allocation by 29 April 2017 Conduct a minimum of two sites visit to each budgeted facility/complex per annum and submit reports of
these site visits to NDoH Submission of updated specialists details funded by the equitable share by 28 February 2017 Submission of updated specialist details funded by the grant at facility level by 31 March 2017 Submission of service specifications funded at each facility by 30 November 2017 Submission of quarterly reports in the approved expenditure areas in the prescribed format Provide patient utilisation data (inpatient separations, inpatient days, day case separations, outpatient first
visits, outpatient follow up visits and patient-day equivalents) as per the prescribed format Provide the number of inpatient separations for intensive care units (ICU) and neonatal ICU (NICU)
quarterly Provide the number of inpatient days for ICU and NICU quarterly Provide the average length of stay at facility level quarterly
Process for approval of 2018/19 service level agreements
Submission of draft business plans (provincial and facility) by 31 October 2017. Completion of SLA, in the prescribed format, signed by each receiving officer by 28 February 2018 and
the transferring officer by 25 March2018

This gazette is also available free online at www.gpwonline.co.za
STAATSKOERANT, 12 JUNIE 2017 No. 40913 125
HUMAN SETTLEMENTS GRANT
Human Settlements Development Grant Transferring department Human Settlements (Vote 38) Grant schedule Schedule 5, Part A Strategic goal The creation of sustainable and integrated human settlements that enable improved quality of household
life and access to basic services Grant purpose To provide funding for the creation of sustainable and integrated human settlements Outcome statements The facilitation and provision of adequate housing opportunities and improved quality living environments
A functionally equitable and integrated residential property market Enhanced institutional capabilities for effective coordination of spatial investment decisions
Outputs Number of housing opportunities created may include the following: o number of residential units delivered in all housing programmes o number of serviced sites delivered in all housing programmes
Number of households in informal settlements provided with access to basic services – at upgrading of informal settlements programme level 2 standard
Number of households in backyards provided with access to services/upgraded services Number of title deeds issued (pre 1994, post 1994 and post 2014) Hectares of well-located land acquired and zoned to create housing opportunities Number of work opportunities created through related programmes Number of informal settlements upgraded on site and/or relocated Percentage of project value procured from women and youth service providers Number of socio-economic amenities delivered in human settlements Number of catalytic projects planned, approved and implemented for integrated human settlements
developments Priority outcome(s) of government that this grant primarily contributes to
Outcome 8: Sustainable human settlements and improved quality of household life
Details contained in the business plan
Medium term strategic framework targets, outputs and outcomes Project planning and facilitation Outputs and targets Cash flow projections (payment schedule) Quarterly reporting Project information Project readiness matrix Title deeds project pipeline matrix Infrastructure reporting model
Conditions Funds for this grant should be utilised for the priorities as set out in the 2014-19 Medium Term Strategic Framework for human settlements
The transfer of the first tranche of funds is conditional on approval by the national Department of Human Settlements (DHS) of provincial business plans consistent with the provisions of the Housing Act, 2017 Division of Revenue Act (DoRA) and in compliance with the National Housing Code
The transfer of subsequent tranches is conditional on provinces capturing the targets and budget and capturing delivery statistics and expenditure monthly on the housing subsidy system (HSS) and the basic accounting system (BAS), at sub-sub-programme level, and submiting monthly reconciliations within the required time frames
The provinces must ensure reconciliation and alignment of financial and non-financial outputs between the HSS and BAS on a monthly basis
All projects in the approved business plan must be aligned with the integrated development plan (IDP) and the spatial development framework of municipalities as well as the built environment performance plan (BEPP) for metropolitan municipalities
Draft and final business plans must be aligned to provincial annual performance plans Provincial Heads of Departments (HoDs) must sign-off and confirm that projects captured in business
plans are assessed and approved for implementation in the 2017/18 financial year Provinces may utilise up to a maximum of five per cent of the provincial allocation for the operational
capital budget programme to support the implementation of the projects contained in the business plan Provinces must indicate budget allocations consistent with provincial and related municipal backlogs for
adequate housing Provinces must gazette allocations for respective accredited municipalities in terms of the DoRA by no
later than 31 May 2017 Where municipalities have been accredited for the housing function, the provincial business plans must
reflect relevant allocations, targets and outputs as agreed and approved with the respective municipalities Provinces may utilise a maximum of two per cent of the human settlements development grant (HSDG) for
the provision bulk infrastructure projects for basic services in non-metropolitan municipalities to unlock Human Settlement projects on condition that the funding is complementary with commitments by

This gazette is also available free online at www.gpwonline.co.za
126 No. 40913 GOVERNMENT GAZETTE, 12 JUNE 2017
Human Settlements Development Grant municipalities in their Integrated Development Plan and municipal budget for provision of such bulk and infrastructure with Municipal Infrastructure Grant funding. The prior approval of the transferring officer is required
Provinces may request in writing to the transferring officer approval to amend their approved business plan by the end of September 2017
The payment schedules should be derived from the cash flows contained in the approved business plans Funds have been included in this grant for the repair of infrastructure for damage incurred in natural
disasters as declared in terms of the Disaster Management Act. Should the cost of repairing the affected infrastructure exceed the amounts earmarked below, provinces may not fund any such shortfalls out of this conditional grant. The following amounts per province must be used for the repair of infrastructure damaged by natural disasters declared in the government gazette and as assessed by the National Disaster Management Centre (NDMC): o Eastern Cape: R134.3 million
Business plans for the allocated disaster funds must be in line with the post disaster verification assessment reports and must be submitted to the NDMC and the national department
Disaster reconstruction and rehabilitation funds may only be utilised for approved projects as listed in the post disaster verification assessment reports and approved business plans
Monthly and quarterly performance reports on disaster allocations must be submitted to the NDMC and national department
A total of R507 million is ring-fenced for the Finance Linked Individual Subsidy Programme (FLISP). The following ring-fenced funds may only be used for planned FLISP spending as contained in the approved business plans of each province: o Eastern Cape: R20 million o Free State: R6 million o Gauteng: R239 million o KwaZulu-Natal: R110 million o Limpopo: R25 million o Mpumalanga: R7 million o Northern Cape: R2 million o North West: R8 million o Western Cape: R90 million
A minimum of 30 per cent of the total must be allocated for the upgrading of informal settlements programme with targets segregated per province in the delivery agreement
In addition, the following funds must be earmarked to support the upgrading of informal settlement in the area of each respective mining town. These are additional funds and may not be used to replace existing baseline funds allocated to projects in these areas. The following funds may only be utilised to funds projects and related infrastructure (including bulk) for housing and human settlements developments in the following prioritised mining towns: o Free State:
Matjhabeng: R83.1 million o Gauteng:
Merafong City: R48.5 million Rand West City: R60.1 million Mogale City R20.0 million
o Limpopo: Thabazimbi: R22.2 million Elias Motsoaledi: R10.1 million Lephalale: R14.6 million LIM 476: R34.4 million
o Mpumalanga: Emalahleni: R79.2 million Steve Tshwete: R31.4 million Thaba Chweu: R23.2 million
o Northern Cape: Tsantsabane: R8.7 million Ga-Segonyana: R10.3 million Gamagara: R8.5 million Kgatelopele: R1.7 million
o North West: Kgetlengriver: R26.4 million Madibeng: R107.1 million Moses Kotane: R93.3 million Rustenburg: R83.4 million City of Matlosana: R133.6 million

This gazette is also available free online at www.gpwonline.co.za
STAATSKOERANT, 12 JUNIE 2017 No. 40913 127
Human Settlements Development Grant The following funds are ring-fenced for utilisation in the eradication of the title deed registration backlog
linked to provincial title deed registration implementation plans which must be included in the project readiness matrix and business plan. Funds may only be spent in terms of the approved business plan
These funds cannot be used for current and new projects: o Eastern Cape: R62 million o Free State: R47 million o Gauteng: R99 million o KwaZulu-Natal: R95 million o Limpopo: R21 million o Mpumalanga: R49 million o Northern Cape: R19 million o North West: R48 million o Western Cape: R47 million
Provinces must include the nationally approved human settlements catalytic projects in their business plans as per the catalytic programme requirements. In addition provinces must allocate a reasonable percentage of their grant allocation to the approved national priority catalytic projects in line with their projects readiness status
A minimum of 30 per cent of HSDG allocations should be allocated to contracts awarded to women and youth service providers
At least two per cent of the HSDG grant should be allocated to programmes and projects for the implementation of innovative building technologies in the human settlements implementation delivery chain
Provinces should ensure that the allocation for land acquisition and related purposes is included in the business plans
Provinces must agree with municipalities a plan for the provision of basic services to all households served in new housing developments
Allocation criteria The grant is allocated through the HSDG allocation formula approved by the Human Settlements MINMEC and National Treasury. The formula is based primarily on the share of inadequate housing in each province but also accounts for population size and extent of poverty in each province
Funds for informal settlement upgrading in mining towns are allocated based on project plans as agreed with provinces and municipalities in terms of the Presidential Mining Towns Intervention
Reasons not incorporated in equitable share
A conditional grant enables the national department to provide effective oversight and ensure compliance with the National Housing Code
Past performance 2015/16 audited financial outcome Allocated and transferred R18.7 billion of which R18.2 billion (97.3 per cent) was spent by the end of the
financial year 2015/16 service delivery performance
100 339 housing units completed 52 411 serviced sites completed
Projected life This is a long term grant as government has an obligation to assist the poor with the provision of human settlements in terms of the Constitution
MTEF allocations 2017/18: R19.7 billion; 2018/19: R21.1 billion; and 2019/20: R22.3 billion Payment schedule Monthly instalments as per the payment schedule approved by National Treasury Responsibilities of the transferring officer and receiving officer
Responsibilities of the national department Finalise and ensure the approval of the applicable subsidy quantums per programme and the allocation
formula for the delivery of sustainable and integrated human settlements Approve the final national and provincial business plans and issue national compliance certificates Assess and make recommendations on the credibility of provincial business plans and the readiness of
projects captured therein Ensure that provinces align financial and non-financial information in terms of reporting in BAS, HSS,
provincial business plans and provincial quarterly reports Monitor provincial, financial and non-financial grant performance and control systems related to the
HSDG Ensure provinces comply with the reporting requirements for the HSS in terms of frequency and quality of
the input Provide support to provinces and accredited municipalities with regards to human settlements delivery as
may be required Undertake structured and other visits to provinces and metropolitan municipalities as is necessary Facilitate regular interaction between DHS and provincial departments of human settlements and
accredited municipalities Submit an annual evaluation report for 2016/17 on the financial and non-financial performance of the grant
to National Treasury by 28 July 2017 Evaluate the audited provincial annual reports for submission to National Treasury by 15 December 2017 Submit quarterly performance reports to National Treasury within 45 days after the end of each quarter

This gazette is also available free online at www.gpwonline.co.za
128 No. 40913 GOVERNMENT GAZETTE, 12 JUNE 2017
CONTINUES ON PAGE 130 - PART 2

No. 10177Regulation Gazette Regulasiekoerant
N.B. The Government Printing Works willnot be held responsible for the quality of
“Hard Copies” or “Electronic Files”submitted for publication purposes
AIDS HELPLINE: 0800-0123-22 Prevention is the cure
Government GazetteStaatskoerant
R E P U B L I C O F S O U T H A F R I C AR E P U B L I E K V A N S U I D A F R I K A
Vol. 624 12June Junie 2017 No. 40913
9 7 7 1 6 8 2 5 8 4 0 0 3
ISSN 1682-584340913
PART 2 OF 2

This gazette is also available free online at www.gpwonline.co.za
130 No. 40913 GOVERNMENT GAZETTE, 12 JUNE 2017
Human Settlements Development Grant Provide systems including HSS, that support the administration of the human settlements delivery process Comply with the responsibilities of the transferring officer outlined in the 2017 DoRA Publish approved business plans Provinces should ensure that they implement the programmes only in the approved business plans
Responsibilities of the provincial departments Provinces must conclude implementation protocols with the Housing Development Agency (HDA)
for the preparation and programme management of catalytic projects Submit 2016/17 annual evaluation reports to DHS by 30 May 2017 Submit 2016/17 audited annual reports to the DHS by 29 September 2017 Prioritise funds in order to build houses to meet the quota set for the military veterans Support accredited municipalities in carrying out delegated functions as per the accreditation framework Provinces must utilise the HSS for the administration and related performance reporting of all the human
settlement delivery programmes and processes Any malicious use or non-compliance to the HSS will result in funds being withheld or stopped in terms of
DoRA Provinces must ensure alignment of financial and non-financial reporting in terms of reporting in BAS,
HSS, approved provincial business plans, and provincial quarterly reports Ensure effective and efficient utilisation of and access to the HSS by municipalities Comply with the Housing Act, 2017 DoRA, Housing Code and the national delivery agreements that have
been concluded The monthly expenditure report, as contemplated in section 12(3) of the 2017 DoRA and section 40(4)(c)
of the Public Finance Management Act (PFMA), must be submitted by the 15th of every month for the preceding month with work in progress inclusive of expenditure and monthly BAS and HSS reconciliation as stipulated on the Practice Note dated 24 April 2015
The monthly DoRA expenditure and quarterly reports must be signed by both the HoD and the relevant provincial treasury HoD
Submit the reports on the outputs as mentioned on this framework above by the 15th of every month for the preceding month
Provinces should ensure that they only implement the programmes in the approved business plans Consult with municipalities on the programme and projects submitted for approval in terms of the HSDG
business plan Ensure all projects to be implemented are contained in the municipal IDP and Spatial development
frameworks of municipalities Ensure that the relevant amounts to be applied and transferred to municipalities are gazetted by no later
than 31 May 2017 Process for approval of the 2018/19 business plans
Draft provincial business plans for 2018/19 financial year and project readiness matrix to be submitted to the national department by 31 August 2017
The second draft business plans to be submitted by 13 October 2017 Submit final provincial business plans, project readiness matrix, including cash flow projections and
compliance certificates for 2018/19 financial year to the DHS by 09 February 2018 Specific approval from Transferring Officer should be sought, for rectification (pre and post 1994), IDP
chapters, blocked projects, CRU (upgraded), project linked, consolidation subsidies (blocked projects) and the allocation must appear in the draft and final business plans

This gazette is also available free online at www.gpwonline.co.za
STAATSKOERANT, 12 JUNIE 2017 No. 40913 131
PUBLIC WORKS GRANTS
Expanded Public Works Programme Integrated Grant for Provinces Transferring department Public Works (Vote 11) Grant schedule Schedule 5, Part A Strategic goal To provide funding for job creation efforts in specific focus areas, where labour intensive delivery
methods can be maximised Grant purpose To incentivise provincial departments to expand work creation efforts through the use of labour
intensive delivery methods in the following identified focus areas, in compliance with the Expanded Public Works Programme (EPWP) guidelines: o road maintenance and the maintenance of buildings o low traffic volume roads and rural roads o other economic and social infrastructure o tourism and cultural industries o sustainable land based livelihoods o waste management
Outcome statements Improved quality of life of poor people and increased social stability through engaging the previously unemployed in paid and productive activities
Reduced level of poverty Contribute towards increased levels of employment Improved opportunities for sustainable work through experience and learning gained
Outputs Number of people employed and receiving income through the EPWP Increased average duration of the work opportunities created
Priority outcome(s) of government that this grant primarily contributes to
Outcome 4: Decent employment through inclusive economic growth
Details contained in the business plan
The programme is implemented through provinces using incentive agreements that contain project lists and targets for the creation of full time equivalents (FTEs) and work opportunities
Conditions EPWP projects must comply with the project selection criteria determined in the EPWP grant manual, the EPWP guidelines set by Department of Public Works (DPW) and the ministerial determination
Eligible provincial departments must sign a funding agreement with their final EPWP project list attached, before the first planned disbursement of the grant
Provincial departments must report quarterly on all projects via DPW’s EPWP reporting system Reports must be loaded on the EPWP reporting system within 30 days after the end of every quarter in
order for progress to be assessed The grant cannot be used for departmental personnel costs, however a maximum of five per cent of the
grant can be used to fund contract based capacity required to manage data capturing and on-site management costs related to the use of labour intensive methods
The grant can only be utilised for EPWP purposes and for the projects approved in the EPWP Integrated Agreement signed by each eligible provincial department
To receive the first planned grant disbursement, eligible provincial departments must: o submit a final EPWP project list by 28 April 2017 o sign a grant agreement with DPW
Subsequent grant disbursements are conditional upon eligible provincial departments: o reporting on EPWP performance quarterly within the required time frames o implementing their approved EPWP project list as planned towards the agreed job creation targets
EPWP branding must be incorporated in any existing signage as per corporate identity manual Provincial departments must maintain beneficiary and or payroll records as specified in the audit
requirements in the EPWP grant manual, and make these available to DPW for data quality assessment tests
Allocation criteria To be eligible for a EPWP grant allocation in 2017/18, a provincial department must have reported EPWP performance (in either the infrastructure or environment and culture sector) by 30 October 2016
The EPWP grant allocations are based on EPWP performance in the past 18 months, number of FTEs created per million rand, and the duration of the work opportunities created
Reasons not incorporated in equitable share
This grant is intended to fund expansion in specific focus areas as well as incentivise increased EPWP performance
The grant is based on performance, the potential to expand and the need for EPWP work in key geographic regions
Past performance 2015/16 audited financial outcomes Out of the R332.8 million allocated amount, R325.6 million was transferred (97.8 per cent) of which
R326.2 million (100 per cent) was spent by the end of the national financial year 2015/16 service delivery performance
140 139 work opportunities reported and 65 863 FTEs created Projected life Grant continues until the end of 2019/20 financial year, subject to review

This gazette is also available free online at www.gpwonline.co.za
132 No. 40913 GOVERNMENT GAZETTE, 12 JUNE 2017
Expanded Public Works Programme Integrated Grant for Provinces MTEF allocations 2017/18: R396 million; 2018/19: R416 million; and 2019/20: R452 million Payment schedule Three instalments per annum: 25 per cent, 12 May 2017; 45 per cent, 15 August 2017; and 30 per cent,
15 November 2017 Responsibilities of the transferring officer and receiving officer
Responsibilities of the national department Determine eligibility and set grant allocations and FTE targets for eligible provincial departments Publish on the EPWP website all documents relevant for provincial departments to understand and
implement the grant, including a grant manual, the relevant EPWP guidelines and the ministerial determination
Support provincial departments, in the manner agreed to in the funding agreement, to identify suitable EPWP projects, develop EPWP project lists in accordance with the EPWP project selection criteria, apply the EPWP project selection criteria and EPWP guidelines to project design, report using the EPWP reporting system
Monitor the performance and spending of provincial departments and assess progress towards their implementation of EPWP project lists
Disburse the grant to eligible provinces Report to National Treasury progress against FTE targets and spending against the grant allocation on a
quarterly basis Conduct data quality assessments on a continuous basis to support good governance and identify areas
for administrative improvement Manage the EPWP coordinating structures in collaboration with provincial coordinating departments to
support implementation, identify blockages and facilitate innovative solutions Support the sector to collect the required data, align monitoring and reporting frameworks and to report
on key outputs on the EPWP web-based system Responsibilities of the provincial departments
Develop and submit an EPWP project list to DPW by 28 April 2017 Sign the standard funding agreement with DPW agreeing to comply with the conditions of the grant
before receiving any grant disbursement by 28 April 2017 Agree on the areas requiring technical support from DPW upon signing the grant agreement Report on all EPWP projects into the EPWP reporting system and update progress quarterly in
accordance with the reporting requirements and timelines stipulated in the grant agreement Process for approval of the 2018/19 business plans
Provincial departments must report on performance of EPWP projects for the 2016/17 financial year by 28 April 2017 or report on 2017/18 performance by 30 October 2017 to be eligible for a grant allocation
Provincial departments must submit draft 2018/19 EPWP project lists to DPW by 26 April 2018 Eligible provincial departments must sign the standard funding agreement with an approved
2018/19 EPWP project list by 26 April 2018

This gazette is also available free online at www.gpwonline.co.za
STAATSKOERANT, 12 JUNIE 2017 No. 40913 133
Social Sector Expanded Public Works Programme Incentive Grant for Provinces Transferring department Public Works (Vote 11) Grant schedule Schedule 5, Part A Strategic goal To increase job creation through the expansion of the social sector Expanded Public Works Programme
(EPWP) Grant purpose To incentivise provincial social sector departments, identified in the 2016 social sector EPWP log-frame
to increase job creation by focusing on the strengthening and expansion of social sector programmes that have employment potential
Outcome statements Improved service delivery to communities by expanding the reach and quality of social services Contribute towards increased levels of employment Improved opportunities for sustainable work through experience and learning gained Strengthened capacity of non-government delivery partners through increased access to funds for
training, wages and administration Outputs 15 866 full time equivalents (FTEs) funded through this grant
A minimum 15 205 people employed and receiving income through the EPWP A minimum average duration of 200 person days for work opportunities created A minimum of 70 000 households to which services are provided A minimum of 140 000 beneficiaries to whom services are provided A minimum of 1 000 beneficiaries who received training
Priority outcome(s) of government that this grant primarily contributes to
Outcome 4: Decent employment through inclusive economic growth Outcome 5: A skilled and capable workforce to support an inclusive growth path
Details contained in the business plan
Outcome indicators Output indicators Inputs Key activities
Conditions Provincial departments must report EPWP expenditure on the monthly In-Year Monitoring (IYM) tool in accordance with section 32 of the Public Finance Management Act
Reports on financial and non-financial performance must be loaded on the EPWP reporting system within 30 days after the end of each quarter
Provincial departments must adhere to the audit requirements stipulated in the social sector EPWP incentive grant manual
The incentive grant allocation must be used to expand job creation programmes in the social sector The incentive grant allocation must be used to fund the following priority areas: o to provide stipends to unpaid volunteers at a minimum R83.59 per day and further adjustments as
per the Ministerial Determination for EPWP Workers and the prescripts of the Department of Labour o to provide additional allocations for prioritising existing programmes that contribute to achieving
EPWP targets o to expand social sector EPWP programmes as identified in the EPWP social sector log-frame for
creation of additional work opportunities A minimum of 80 per cent of the total incentive allocation must be used to pay stipends or wages Of this 80 per cent, at least 25 per cent must be used for the creation of work opportunities for persons
not previously employed in the relevant programme EPWP branding must be incorporated in any existing signage as per corporate identity manual The balance of the overall incentive allocation must be used for capacity-building at the implementation
level or the standardisation of wages Maintain beneficiary and payroll records as specified in the audit requirements of the EPWP grant
manual Allocation criteria To be eligible for an incentive allocation in 2017/18, a provincial department must have reported
2015/16 and first quarter 2016/17 EPWP performance by 13 October 2016 Departments receive a participation allocation which depends on the number of FTEs contributed in the
preceding 18 months leading up to 30 September 2016 For departments that reported in 2015/16, the department’s performance is assessed against a set of
social sector EPWP standards to determine the size of an additional allocation, these are: o number of FTEs per million rand per departmental programme as compared to the median value for
similar programmes (cost-effectiveness) o beneficiary profile consisting of 2 per cent persons with disabilities o beneficiary profile consisting of 55 per cent youth o beneficiary profile consisting of 55 per cent female beneficiaries o 10 per cent of days worked spent in training o average duration of work opportunities o average minimum daily wage of R75.10 from April to October 2015 and R78.86 from
November 2015 to March 2016 (per person day of work) The additional allocation for each eligible provincial department is based on its proportion of the total
allocation, which is derived by multiplying a composite score against the above standards with the number of FTEs created in the 18 month period prior

This gazette is also available free online at www.gpwonline.co.za
134 No. 40913 GOVERNMENT GAZETTE, 12 JUNE 2017
Social Sector Expanded Public Works Programme Incentive Grant for Provinces Past compliance will affect future allocations. The following penalties are applied where there is non-
compliance to conditions of the grant o 0.6 per cent for non-compliance in submission of planning documents o 2.4 per cent for non-compliance in implementation stage o 0.3 per cent for late submission of each quarterly non-financial report o 0.3 per cent for each tranche withheld o 0.3 per cent for less than 100 per cent expenditure reported in the assessment period o 1 per cent for non-achievement of FTE target given in the assessment period
Reasons not incorporated in equitable share
The incentive allocation is based on the performance of programmes in a prior financial year and use of the allocation is specifically earmarked for EPWP programme expansion
Past performance 2015/16 audited financial outcomes Of the total R226 million allocated, R226 million (99.9 per cent) was transferred, of which R227 million
(100.2 per cent) was spent by the end of the national financial year 2015/16 service delivery performance
11 138 FTEs were created 95 961 households serviced 1 522 non-profit organisations administratively supported
Projected life Grant continues until the end of 2019/20 financial year, subject to review MTEF allocations 2017/18: R386 million; 2018/19: R408 million; and 2019/12: R431 million Payment schedule Three instalments per annum: 25 per cent, 5 May 2017; 45 per cent, 28 July 2017; and 30 per cent,
31 October 2017 Responsibilities of the transferring officer and receiving officer
Responsibilities of the national department Determine the eligibility of provincial departments, set job creation targets and performance measures
and calculate incentive allocations Revise an incentive manual that will provide provincial departments with standard information on the
rules of the incentive programme, its application, monitoring and evaluation information and audit regulations
Develop an incentive agreement outlining the requirements of the incentive grant and ensure that each provincial department signs the agreement by 31 March 2017
Reach agreements with national sector departments on their roles in ensuring effective implementation of the incentive grant by 31 March 2017
Support provincial departments to develop plans to meet job creation targets Support the sector to collect the required data, align monitoring and reporting frameworks and to report
on key outputs on the EPWP reporting system Monitor the performance of provincial departments and the use of the incentive grant against the
conditions in the framework and report to National Treasury on monthly and quarterly progress Audit the final performance of provincial departments after the end of the financial year Report quarterly to provincial departments on projected eligibility for the incentive grant in the following
year Issue guidelines to provincial departments on how to report expenditure by 31 March 2017 Identify anomalies in the reported data
Responsibilities of the provincial department Compile and sign business plans and project lists on how to achieve the incentive grant targets by
31 March 2017 By 31 March 2017, sign the standard incentive agreement with national Department of Public Works
(DPW) agreeing to comply with the conditions and obligations of the grant before receiving any incentive payment
Report EPWP performance onto the EPWP reporting system and update progress monthly and quarterly in accordance with the reporting requirements in the incentive agreement
Provide financial and non-financial data on the use of the incentive grant on a monthly and quarterly basis in the format and manner prescribed by National Treasury and DPW
Process for approval of the 2018/19 business plans
Provincial departments must have reported EPWP performance by 13 October 2017 to be eligible for an allocation
Provincial departments participate in the planning exercise from December to January each year and submit their business plans, project lists and targets to DPW during this process in the format prescribed
DPW to distribute the incentive agreements for provincial Head of Department endorsement by end of March every year
Provincial departments sign the incentive agreement with DPW by 30 March 2018 and agree to comply with the conditions and obligations of the incentive grant

This gazette is also available free online at www.gpwonline.co.za
STAATSKOERANT, 12 JUNIE 2017 No. 40913 135
SOCIAL DEVELOPMENT GRANTS
Early Childhood Development Grant Transferring department Social Development (Vote 17) Grant schedule Schedule 5, Part A Strategic goal To increase the provision of early childhood development (ECD) services through partial care facilities to
poor children Grant purpose To increase the number of poor children accessing subsidised ECD services through partial care facilities
To assist existing conditionally registered partial care facilities providing an ECD programme to meet basic requirements in order to attain full registration
Outcome statements The provision of ECD services to poor children Improving the physical health and safety conditions in which early learning takes place
Outputs Subsidy component Number of poor children that benefit from ECD services that are subsidised Number of days subsidised Number of children attending ECD services in registered centres
Maintenance component Number of ECD centres conditionally registered as per registration framework Number of ECD centres assessed for the maintenance component Number of ECD centres upgraded from the maintenance component Number of ECD centres that moved from conditional registration to full registration as a result of the
maintenance component Number of children that ECD centres are registered to accommodate (capacity)
Priority outcome(s) of government that this grant primarily contributes to
Outcome 1: Quality basic education Outcome 13: An inclusive and responsive social protection system
Details contained in the business plan
The provincial departments will use a business plan issued by the national Department of Social Development (DSD) which contains the following:
o project background o project objectives o scope of the work o deliverables and outputs to be achieved o risk assessment with mitigation plan
Conditions Conditional grant funding cannot be used to replace funding that provinces have previously allocated for ECD subsidies
Business plans must be signed off by the Head of Department (HoD) of the provincial department of Social Development and submitted to the DSD by 01 March 2017 in the format set by DSD
Subsidy component Fully registered or conditionally registered partial care facilities offering ECD programmes will be
eligible for the subsidy Partial care facilities (ECD centres) that are registered conditionally will be eligible for the maintenance
component Each province may use a maximum of R2.1 million of their conditional grant allocation for administrative
management of the grant which includes capacity to manage the grant and funding for maintenance assessments of ECDs
The subsidy is targeted for children from zero to five years old or until they enter Grade R The provincial DSD and the ECD centre will enter into a service level agreement (SLA) which stipulates
the purpose of the subsidy, the amount of the subsidy, conditions of the subsidy and obligations of both provincial DSD and the ECD centre with regard to the payment of the subsidy and the reporting requirements
The value of the subsidy paid to each ECD centre will be calculated as follows: R15 multiplied by the annual number days the ECD centre will operate as agreed to in the SLA, multiplied by number of children attending the ECD centre as agreed to in the SLA
The full value of the subsidy will be paid in equal parts in line with the SLA and any changes to the payment schedule must be aligned to a determination of non-compliance as defined in the SLA
Once funds are transferred to ECD centres, the department may not pre-approve how the funds are to be utilised
All allocations must be aligned to the number of children as per the SLA and can only be reduced as per the process outlined in the SLA. Allocations must not be changed in-year based on how many children attend
The subsidy must target ECD centres or qualifying children in line with the process set out below Children that are already receiving social grants will be eligible to be subsidised and will not be subject to
an individual means test whilst children who do not receive grants will be subjected to the means test when calculating the subsidy allocation for ECD Centres
A child is eligible to be subsidised if her/his parents’ income falls below the following prescribed test Income-based means test:

This gazette is also available free online at www.gpwonline.co.za
136 No. 40913 GOVERNMENT GAZETTE, 12 JUNE 2017
Early Childhood Development Grant o income of parents or caregivers may not exceed R45 600 per annum if single and R91 200 per annum
if married as aligned to the means test applied for the receipt of the Child Support Grant. This is updated each year with an increase in the grant value
o the following documents must be submitted by an ECD Centre, in the case of children receiving a child related social assistance grant:
o original, reprinted or certified copies of proof of receipt of the child related grant (Child Support Grant or the Foster Care Grant) as issued by South African Social Security Agency
In the case of children who are not beneficiaries of a child related grant: o proof of income of parents (or caregivers); o three months bank statement of parents or guardians; or o affidavit declaring status of income
If the child is attending an ECD centre falling outside of those municipal wards that have been identified for universal targeting of the subsidy, the subsidy will be targeted to the individual child
Maintenance component ECD centres must be conditionally registered only minor building and maintenance improvements are aimed at ensuring ECD centres comply with the
health and safety norms and standards, as identified by the national Department of Social Development will be funded from this grant
the maximum value to be spent per ECD centre for maintenance improvements is R100 000 prior approval for any amount exceeding the R100 000 should be obtained from the HOD and CFO the exceeding amount should not be more than 30 per cent of the R100 000 provinces must conduct assessments of conditionally registered centres and cost them in order to qualify
for maintenance grant funding in 2018/19 all maintenance projects must be recorded on the National Treasury is infrastructure reporting model
Allocation criteria The overall provincial allocations are determined based on: o the number of poor children in the provinces o the number of poor children currently accessing the ECD subsidy o the value of the ECD subsidy and the number of days children should be subsidised
Number of conditionally registered ECD centres Reasons not incorporated in equitable share
To allow DSD to better ring-fence expansion of ECD in the country and to facilitate compliance to the National Integrated ECD Policy approved by Cabinet on 9 December 2015
Past performance 2015/16 audited financial outcomes New grant
2015/16 service delivery performance New grant
Projected life Given the nature of the programme and the drive to expand provision of ECD services, the need for the grant will be needed for at least another 10 years
MTEF allocations 2017/18: R318 million; 2018/19: R491 million; and 2019/20: R518 million allocated as follows: o ECD subsidies: 2017/18: R249 million; 2018/19: R412 million; and 2019/20: R435 million o ECD maintenance improvements: 2017/18: R69 million; 2018/19: R79 million; and
2019/20: R83 million Payment schedule Quarterly instalments on 13 April 2017; 18 July 2017; 13 October 2017; and 15 January 2018 Responsibilities of the transferring officer and receiving officer
Responsibilities of the national department Develop a standardised reporting framework and monitoring tool Develop a standardised format for the business plan Assist the provincial Departments of Social Development with their planning To assess and approve the business plans submitted by provinces Develop standardised SLAs to be entered into between provincial DSDs and ECD service providers Develop an ECD conditional registration framework that clearly outlines the criteria for conditional
registration Develop guidelines on the implementation of the ECD centre maintenance component Monitoring of project progress and compliance to conditional grant framework Provide continuous monitoring and support to provinces on a monthly and quarterly basis Submit a monthly financial report to National Treasury 20 days after the end of the reporting month Consolidate and submit quarterly performance reports to National Treasury within 45 days after the end of
each quarter To monitor the utilisation of the grant against the set outcomes and to take appropriate action in cases of
non-compliance with the framework Submit an annual evaluation report four months after the end of the 2017/18 financial year Facilitate approval of the payment schedule and approval of in-year adjustments to the payment schedule Develop a proposal on a short to long term management information system for ECD

This gazette is also available free online at www.gpwonline.co.za
STAATSKOERANT, 12 JUNIE 2017 No. 40913 137
Early Childhood Development Grant Responsibilities of the provincial departments Develop and submit approved business plans signed off by the HoD to the DSD by 1 March 2017 Provinces to implement the business plan as approved by the DSD (national must approve any deviation
in writing) Conclude SLAs with ECD centres in a format prescribed by the DSD Ensure that payments are made in line with the payment schedule as per the SLAs with ECD centres Provinces must provide a plan to the DSD on how they will proceed with the assessment of conditionally
registered centres Provinces must provide a plan on how they will proceed with the actual maintenance upgrade of the
conditionally registered ECD centres The reasons for conditional registration must be attached to the ECD registration certificate and kept on
file Provinces must submit a list of all conditionally registered centres that require maintenance upgrades
citing both the type of upgrade required and costs to DSD by the 1 March 2017 Ensure that claims are submitted to DSD to allow for transfer of funds by DSD in line with the payment
schedule approved by the National Treasury Subsidies must be made into the ECD centres designated bank accounts, which must be with a registered
deposit taking institution in the Republic of South Africa Subsidies may only be reduced in cases of non-compliance as outlined in the prescribed SLA Use the information reported in the quarterly reports from ECD centres to develop and maintain a master
list of all children benefitting from the ECD subsidy Maintain a database on the status of registration of all ECD centres in the province that is inclusive of the
following basic information: o registration status o capacity of the centre o number of children in attendance o number of children subsidised
Maintain a database of all ECD centres that have been assisted through the maintenance grant Maintain a database of all ECD centres that moved from conditional to full registration Submit monthly financial reports to DSD 15 days after the end of the reporting month Provinces must upload all ECD maintenance projects on the Infrastructure Reporting Model and update it
monthly Submit quarterly performance reports to national department within 30 days after the end of each quarter Submit an evaluation report two months after the end of the 2017/18 financial year
Process for approval of the 2018/19 business plans
Engagement with provincial departments on submission of business plans between September 2017 and February 2018
Provinces must submit a list of all conditionally registered centres that have been assessed and that require maintenance upgrades citing both the type of upgrade required and costs to DSD by the 29 September 2017
Provinces to submit revised business plans and assessment of business plans to the DSD by 14 November 2017
Submit final provincial business plan, including cash flow projections and compliance certificates signed-off by HoD’s for 2015/16 financial year to the DSD by 16 February 2018
The transferring officer must approve provincial business plans by 26 March 2018

This gazette is also available free online at www.gpwonline.co.za
138 No. 40913 GOVERNMENT GAZETTE, 12 JUNE 2017
Social Worker Employment Grant Transferring department Social Development (Vote 17) Grant Schedule Schedule 4, Part A Strategic goal Strengthening high priority social welfare service delivery through employment of social workers that
benefitted from the Department of Social Development’s (DSD) social work scholarship (hereafter referred to as social work graduates)
Grant purpose To reduce the backlog in the number of social work graduates that remain unemployed Outcome statements Employ social work graduates to reduce unemployed social work graduates by 27 per cent by the end
of March 2018 Outputs Increase in the employment of social workers who benefitted from the social work scholarship
Reduction in the backlog of unemployed social work graduates during the 2017/18 financial year The total number of social work graduates employed through the provincial social development sector The number of social work graduates not yet employed at the end of the reporting period
Priority outcome(s) of government that this grant primarily contributes to
Outcome 13: An inclusive and responsive social protection system
Details contained in the business plan
Provincial departments will use a business plan as issued by the DSD which contains the following: o Project background o Project objectives o Scope of the work o Deliverables and outputs to be achieved o Quarterly reporting requirements o Risk assessment with mitigation plan o Provincial specific needs analysis
Conditions The conditional grant is to be used solely for employment of social work graduates The social workers should be appointed by the provincial Departments of Social Development and
allocated to high priority areas as identified in the provincial specific needs analysis Provinces should report to DSD on a quarterly basis on the number of social work graduates that have
been employed through the grant, the number of social work graduates employed through the provincial equitable share and the number of social work graduates not yet employed at the end of the reporting period
Provinces to submit to DSD a list of all unemployed graduates to indicate how large the back the backlog is from 2013 – 2016, with identification details by the end of January 2017 to DSD
Allocation criteria The overall provincial allocations were determined based on the proportion of unemployed social work graduates per province
Reasons not incorporated in equitable share
To accelerate the absorption of social workers into sector in a targeted manner that matches need across the country, and address the backlog in employment of social work graduates, this grant is created to be allocated outside the general criteria used for the equitable share
Past performance 2015/16 audited financial outcomes New grant
2015/16 service delivery performance New grant
Projected life The grant continues until 2019/20 financial year; subject to review MTEF allocations 2017/18: R182 million; 2018/19: R197 million; and 2019/20: R213 million Payment schedule Quarterly instalments on 11 April 2017; 03 July 2017; 02 October 2017; and 17 January 2018 Responsibilities of the transferring national officer and receiving officer
Responsibilities of the national department Develop a standardised reporting framework Develop a standardised format for the business plan Assist the provincial DSDs with their planning To assess and approve the business plans submitted by provinces Monitoring of project progress and compliance to the conditional grant framework Monitor implementation and provide support on a monthly and quarterly basis Submit monthly financial reports to National Treasury 20 days after the end of the month Consolidate and submit quarterly performance reports to National Treasury within 45 days after the
end of each quarter To monitor the utilisation of the grant against the set outcomes and to take appropriate action in cases
of non-compliance with the framework Submit an annual evaluation report 4 months after the end of the 2017/18 financial year Facilitate approval of the payment schedule and in-year adjustments to the payment schedule

This gazette is also available free online at www.gpwonline.co.za
STAATSKOERANT, 12 JUNIE 2017 No. 40913 139
Social Worker Employment Grant Responsibilities of the provincial departments
Submit a business plan to DSD in the template provided Provinces to implement the business plan as approved by DSD Submit signed off monthly financial reports to DSD 15 days after the end of the month Submit quarterly performance reports to DSD within 30 days after the end of each quarter Provinces to submit evaluation reports to DSD two months after the end of the financial year Provinces to report on expenditure against spending plans on a monthly basis Ensure that claims are submitted to DSD to allow for transfer of funds by DSD in line with the
payment schedule approved by the National Treasury Ensure sufficient supervision capacity for newly employed social work graduates
Process for approval of the 2018/19 business plans
Engagement with provincial departments on submission of business plans between September 2017 and February 2018
Provinces submit revised business plans to the DSD by 14 November 2017 Submit final provincial business plan, including cash flow projections and compliance certificates
signed off by HoDs for 2018/19 financial year, to the DSD by 16 February 2018 The transferring officer approves provincial business plans by 25 March 2018

This gazette is also available free online at www.gpwonline.co.za
140 No. 40913 GOVERNMENT GAZETTE, 12 JUNE 2017
Substance Abuse Treatment Grant Transferring department Social Development (Vote 17) Grant schedule Schedule 5, Part A Strategic goal To strengthen the harm reduction programme by providing treatment for substance abuse
To improve access to public substance dependency treatment facilities Grant purpose To provide funding for the operationalization (including the purchasing of equipment) of substance
dependency treatment facilities in the provinces of Eastern Cape, Free State, Northern Cape and North West Outcome statements Reduction in recurrence of substance abuse
Affordable public treatment programmes Outputs Four operational substance dependency treatment facilities Priority outcome(s) of government that this grant primarily contributes to
Outcome 2: A long and healthy life for all South Africans
Details contained in the business plan
The business plan will include the following: o project background o project objectives o scope of the work o deliverables and outputs to be achieved o quarterly reporting requirements o risk assessment with mitigation plan
Conditions The substance dependency treatment facilities are to be operationalised in compliance with the Prevention of and Treatment for Substance Abuse Act, 2008 (Act No. 70 of 2008), its regulations and norms and standards
All centres to be registered as a treatment centre before operationalisation Centres must comply with occupational health and safety standards All the facilities should adhere to the National Health Act (Act No. 61 of 2003) All required reports must be signed-off by the relevant delegated official within the provincial department business plans must be signed off by the Head of Department (HoD) of the provincial Department of Social
Development and submitted to the national Department of Social Development (DSD) by 1 February 2017 The flow of the first instalment of the grant depends upon receipt by DSD of: o monthly progress reports via the infrastructure reporting model (IRM) including a narrative progress
report on projects o status report on the provinces readiness to commence with operationalisation of the facility o business plan signed by the HoD of the provincial DSD o spending plan for operationalisation expenditure for the 2017/18 financial year
The flows of the subsequent tranches are dependent upon DSD and National Treasury receiving: o monthly financial reports o monthly IRM reports o quarterly statistics measuring the intake profile of service users and staff from facilities that are
operational Provincial DSDs to provide sustainability plans to DSD by 31 August 2017
Allocation criteria Provinces were allocated funds according to the cost calculations for a standard design guideline of a substance dependency treatment facility
Reasons not incorporated in equitable share
This grant enables the DSD to ensure the delivery of substance abuse treatment facilities in the four provinces that do not have these public facilities
Past performance 2015/16 audited financial outcome R51 million was allocated to provinces, R48 million (94 per cent) was transferred to provinces, of which
R23 million (46.3 per cent) was spent by the end of the financial year 2015/16 service delivery performance
Eastern Cape: The building was completed and certificate of completion handed to DSD on 17 September 2015. The registration of the treatment facility in terms of the Prevention of and Treatment for Substance Abuse Act was finalised in January 2016. A 12 month conditional registration status was approved
Free State: A site for the construction of the building was previously identified and the design of the facility was finalised. The contractor was appointed in February 2016
Northern Cape: Groundwork was completed by the end of the financial year. The contractor appointed for top structure started with foundation. The Process for procurement of external fence has commenced
North West: The site was handed over on 23 January 2015. Project progress is currently at a 96 per cent completion
Projected life The allocation for temporary operationalisation of the centres will commence in 2017/18 until 2019/20 and will be subject to review thereafter
MTEF allocations 2017/18: R57 million; 2018/19: R71 million; and 2019/20: R75 million Payment schedule Quarterly instalments on 25 April 2017; 28 July 2017; 23 October 2017; and 26 January 2018

This gazette is also available free online at www.gpwonline.co.za
STAATSKOERANT, 12 JUNIE 2017 No. 40913 141
Substance Abuse Treatment Grant Responsibilities of the transferring officer and receiving officer
Responsibilities of the national department Monitoring compliance to conditional grant framework Monitor implementation through project site visits and provide appropriate support Provide the guidelines and criteria for the development and approval of the business plan Submit an annual evaluation report after the end of the 2016/17 financial year, four months after the financial
year end Provide National Treasury with a quarterly report against the project plan 45 days after the end of each
quarter Initiate a process to guide the allocation criteria of funds for operation budgets starting 2017/18 Submit monthly financial reports to National Treasury 20 days after the end of the month Facilitate approval of the payment schedule and approval of in-year adjustments to the payment schedule To monitor the utilisation of the grant against the set outcomes and to take appropriate action in cases of non-
compliance with the framework Responsibilities of the provincial department
Submit a business plan to national DSD in the template provided. Provinces to implement the business plan as approved by DSD Submit monthly financial reports to DSD 15 days after the end of the month Approve monthly IRM reports within 15 days after the end of the reporting month Submit signed copies of approved IRM reports within 22 days after the end of each month Submit quarterly performance reports to DSD within 20 days after the end of each quarter Provinces to submit evaluation reports to DSD two months after the end of the financial year Ensure that claims are submitted to national DSD to allow for transfer of funds by national DSD in line with
the payment schedule approved by the NT Provinces must provide a sustainability plan on the continued operation of the centres subsequent to the
conditional grant period Process for approval of the 2018/19 business plans
Engagement with provincial departments on submission of business plan from August 2017 to January 2018 Provinces submit revised business plan to the national DSD by 14 November 2017 Submit final provincial business plan, including cash flow projections and compliance certificates signed off
by HoD’s for 2018/19 financial year to the national DSD by 1 February 2018 The transferring officer approves provincial business plans by 15 February 2018

This gazette is also available free online at www.gpwonline.co.za
142 No. 40913 GOVERNMENT GAZETTE, 12 JUNE 2017
SPORT AND RECREATION SOUTH AFRICA GRANT
Mass Participation and Sport Development Grant
Transferring department Sport and Recreation South Africa (Vote 40) Grant schedule Schedule 5, Part A Strategic goal Increasing citizens’ access to sport and recreation activities Grant purpose To facilitate sport and active recreation participation and empowerment in partnership with relevant
stakeholders Outcome statements Increased and sustained participation in sport and active recreation
Improved sector capacity to deliver sport and active recreation Outputs School sport
o learners supported to participate in the National School Sport Championship o learners participating in school sport tournaments at a provincial level o learners participating in school sport tournaments at a district level o people trained to deliver school sport o schools provided with equipment and/ or attire o school sport coordinators remunerated o school sport structures supported
Siyadlala: Community sport and active recreation o youth participating at the National Youth Camp o active recreation events organised and implemented o people actively participating in organised sport and active recreation events o people in the hubs trained to deliver Siyadlala in the Mass Participation Programme o indigenous games clubs participating in Indigenous Games Tournaments o hubs provided with equipment and or attire
Club development o local leagues supported o people trained to deliver the club development programme o clubs participating in the Rural Sport Development Programme o clubs provided with equipment and or attire
Club pilot in Limpopo and KwaZulu-Natal o clubs audited in the club development pilot project o clubs trained using the tool kit o clubs in the pilot project supported as per the service level agreement (SLA)
Sport academies o athletes supported by the sport academies o sport academies supported o people trained to deliver the sport academy programme o sport focus schools supported
National training centre in Free State o construction of the national training centre
Transversal matters o sport and active recreation projects implemented by the provincial sports confederation o provincial programmes implemented o branding material procured as per specifications
Management o staff appointed on a long term contract o administration standards met
Priority outcome(s) of government that this grant primarily contributes to
Outcome 14: Nation building and social cohesion
Details contained in the business plan
Grant purpose Outcome indicators Grant outputs Output indicators Key activities
Conditions Provincial compliance Provinces must ensure that: o all structures at all levels are aligned to the 16 SRSA priority codes to contribute to seamless
service delivery o 50 per cent of hubs and clubs supported must be from the rural and farm areas o performance evidence is timeously submitted irrespective of the status of the project as per the
technical indicator descriptors o funds from this grant are not used on projects falling outside the scope of the grant unless
following a written request, approval to such effect is granted by the SRSA Accounting Officer

This gazette is also available free online at www.gpwonline.co.za
STAATSKOERANT, 12 JUNIE 2017 No. 40913 143
Mass Participation and Sport Development Grant The provincial allocation is rationalised after the deduction of 10 per cent for the national training
Centre and three per cent for the Club Development Pilot Project from the national grant allocation. The provincial allocation is then balanced out to 100 per cent in order for the respective provinces funding to be aligned and allocated consistently
The provincial allocation must be utilised as follows: o school sport 38 per cent o community sport and active recreation 35 per cent o sport academies 11 per cent o transversal matters 7 per cent o management 9 per cent o provinces based on their provincial dynamics may apply to the Accounting Officer to change the
above sub-allocations School sport: 38 per cent
Provinces must ring-fence R10 million to provide transport, attire and delivery of provincial teams to the national school sport championships. Provincial allocation to provinces will consider funds necessary for hosting national championship games and will include accommodation, breakfast and dinner for the provinces that will be hosting the three national championship games this year, (2017 Autumn). Provincial allocations will already reflect the deduction of the amount for accommodation
The remaining school sport allocation must be allocated as follows: o 10 per cent for training of people to deliver school sport o 20 per cent to purchase equipment and or attire for schools below quintal 3 identified through
participation in leagues o 40 per cent to deliver district and provincial competitions o 15 per cent to remunerate coordinators who coordinate, support, monitor and evaluate school sport
at district and local level o 15 per cent to support school sport structures
Community sport and active recreation: 35 per cent Siyadlala: 17 per cent Youth Camps: o provinces must ring-fence R3 million for the National Youth Camp to provide transport,
accommodation, meals, attire, security, public liability, medical support, stationery, and the costs associated with plenary meetings
The remaining Siyadlala allocation must be allocated as follows: o 30 per cent for organising and implementing events o 20 per cent or Indigenous Games tournament support, such as transport and catering o 15 per cent to purchase equipment o 10 per cent to purchase attire o 5 per cent for ministerial outreach programmes o 20 per cent for training
Club development: 18 per cent The portion of the grant ring fenced for club development must be used as follows: o 20 per cent to support the clubs that are participating in the Rural Sport Development Programme o 20 per cent for training in sport administration; team management; coaching or technical
officiating o 35 per cent for leagues o 25 per cent to purchase sport equipment and attire
Sport academies: 11 per cent The allocation must be used for the establishment and development of district and provincial
academies in line with sport academies framework and guidelines of SRSA: o 10 per cent for training in the following: talent identification and scouting, coaching, medical and
scientific, life skills, counselling o 40 per cent for resourcing of district and provincial academies o 35 per cent for athlete support as documented in the academy framework o 10 per cent for remuneration for services rendered by specialist personnel (sport scientists,
psychologists, biokineticist, physiotherapists, nutritionists, etc.) These should be contracted to provide the services as and when the need arises
o 5 per cent for Sport Focus Schools Transversal matters: 7 per cent
Provincial Sport Confederation 3 per cent Provinces may transfer funds to the provincial sport confederation provided: o a transfer plan has been developed and submitted together with a signed business plan approved
by SRSA o a SLA has been entered into between the provincial department and the provincial sport
confederation stating clearly what is expected of the provincial sport confederation o a monitoring mechanism is in place to monitor expenditure and performance by the sport
confederation as per the SLA Provincial Programmes: 3 per cent o These are specific provincial programmes that contribute to the main purpose of the grant

This gazette is also available free online at www.gpwonline.co.za
144 No. 40913 GOVERNMENT GAZETTE, 12 JUNE 2017
Mass Participation and Sport Development Grant Branding: 1 per cent o The allocation must be used to provide branding for all programmes that are funded through the
Conditional Grant. Annually there will be dedicated allocation to specified branding material o In 2017/18 the focus will be on the Rural Sport Development Programme
Management: 9 per cent Appointing staff: 6 per cent o the portion of the grant ring-fenced for the appointment of staff must be used to appoint staff on a
three year contract. The appointed staff must implement conditional grant programmes. The allocation is not for support staff in programmes such as finance, planning, monitoring and evaluation or research
Administration: 3 per cent provinces are expected to use this portion of allocation to ensure that all their submissions are
packaged properly (These will vary from business plans, Projects Implementation Agreement, reports (monthly, quarterly, and annual)
Allocation Criteria Each province is allocated a baseline of R20 million, whereafter the equitable share formula is applied to the remaining amount
The Northern Cape allocation is increased due to a need to increase participation in the rural areas, R2 million and R3 million is deducted from Gauteng and KwaZulu-Natal to fund this. 3 per cent per provinces is reallocated equally to Limpopo and KwaZulu-Natal for the club development pilot
10 per cent per province is reallocated to the Free State for the national training centre Reason not incorporated in equitable share
The conditional grant is assisting the sport sector in implementing the National Sport and Recreation Plan and National Development Plan objectives
Past performance 2015/16 audited financial outcomes R542 million was allocated to provinces, R533 million (98.4 per cent) was transferred to provinces of
which R537 million (100.8 per cent) was spent by the end of the financial year 2015/16 service delivery performance
135 950 People actively participating in organised sport and active recreation events 37 673 Learners participating in school sport tournaments at a district level 3 938 Schools, hubs and clubs provided with equipment and/or attire 6 089 Athletes supported by the sport academies 35 Sport academies supported
Projected life Grant continues until 2019/20, thereafter subject to review MTEF allocations 2017/18: R585 million; 2018/19: R618 million; and 2019/20: R653 million Payment schedule Four instalments: 31 May 2017; 31 August 2017; 30 November 2017; and 26 January 2018 Responsibilities of national transferring officer and receiving officer
Responsibilities of the national department Evaluate Annual Reports for the 2016/17 grants for submission to the National Treasury by
28 July 2017 Agree on outputs and targets with provincial departments in line with grant objective for 2018/19 by
25 August 2017 Provide the guidelines and criteria for the development and approval of business plans Monitor implementation and provide support Submit approved business plan for 2017/18 to the National Treasury (NT) on 28 April 2017 Submit quarterly performance reports to NT 45 days after the end of each quarter Ensure that all the conditional grant practice notes issued by NT are adhered to Desktop monitoring: monthly and quarterly reports analysis received by provinces Physical verification visits to the provinces to verify what has been reported in the monthly and
quarterly reports Quarterly review sessions with all role players of the conditional grant from the provinces
Responsibilities of provincial departments Submit the 2016/17 Annual Evaluation report to SRSA by 31 May 2017 Submit monthly reports as per the requirements contained in the 2017 Division of Revenue Act
(DoRA) Monitor progress of programmes delivered through the conditional grant Ensure that conditional grant managers attend all national conditional grant meetings Ensure that capacity exists to manage the grant and that there is a grant manager responsible for the
grant framework, planning, implementation and reporting Ensure organisational capacity to deliver on the programmes that are implemented through the grant
Process for approval of 2018/19 business plans
Provinces provide draft business plan to SRSA by 16 October 2017 SRSA evaluates draft business plans by 24 November 2017 Comments sent to provinces by 1 December 2017 Provinces submit revised business plans to SRSA by 31 January 2018 Head of Department approves business plan by 15 February 2018 SRSA submits business plans to NT by 30 March 2018

This gazette is also available free online at www.gpwonline.co.za
STAATSKOERANT, 12 JUNIE 2017 No. 40913 145
TRANSPORT GRANTS
Provincial Roads Maintenance Grant Transferring department Transport (Vote 35) Grant schedule Schedule 4A Strategic goal To ensure efficient and effective investment in provincial roads to implement the Road Infrastructure
Strategic Framework For South Africa (RISFSA) in line with the S’hamba Sonke road programme and other related road infrastructure asset management programmes
Grant purpose To supplement provincial investments for routine, periodic and special maintenance To ensure all roads are classified as per RISFSA and the technical recommendation for highways
(TRH) 26, and road classification and access management (RCAM) guidelines To implement and maintain road asset management systems (RAMS) as per technical methods for
highways (TMH) 22 To supplement provincial projects for the repair of roads and bridges damaged by declared natural
disasters To improve the state of the road network serving electricity generation infrastructure To improve road safety with a special focus on pedestrian safety in rural areas
Outcome statements Improve the condition and lifespan of the assets (provincial roads), thereby improving the level of service
Improved rates of employment, community participation and skills development through the delivery of roads infrastructure projects (expanded public works programme objective)
Create work opportunities for unemployed people through labour-intensive construction methodologies for the delivery of road infrastructure projects
Outputs Road classification processes are 100 per cent complete and continuously maintained, including all newly proclaimed constructed and upgraded roads
Fully functional RAMS in line with minimum TMH 22 requirements for a provincial road authority Network condition assessment and determination of project priority list from the RAMS The following actual delivery related measures against 2017/18 targets defined in the final road asset
management plan (RAMP) for each province: o number of m² of surfaced roads rehabilitated o number of m² of surfaced roads resurfaced (overlay or reseal) o number of m² of blacktop patching (including pothole repairs) o number of kilometres of gravel roads re-gravelled o number of kilometres of gravel roads bladed
The following performance based on national job creation indicators o number of jobs created o number of full time equivalents (FTEs) created o number of youths employed (18 – 35) o number of women employed o number of people living with disabilities
Submission of updated road condition data (paved and unpaved), traffic data, and bridge condition report by 31August 2017
Reporting on the provinces contractor development programme (CDP) o number of SMME’s
Priority outcome(s) of government that this grant primarily contributes to
Outcome 6: An efficient, competitive and responsive economic infrastructure network
Details contained in the business plan
This grant uses a RAMP, which contains the following details: o targets set for levels of service for 2017/18 to 2019/20 with regards to the key performance
indicator components identified which will include road condition, safety, traffic and vehicle operating cost
o financial summary o organisational and support plan o job creation estimates o emerging contractor opportunities o linkages to socio-economic activities and opportunities
Conditions A maximum of R10 million may be used to build road asset management capacity . This funding is allocated as capacity support and is extended until the 2018/19 financial year
For RISFSA Class R1, R2 and R3 data collection requirements are: visual condition data according to TMH 9 for pavements no older than 2 years, and TMH 19 for
bridges no older than 5 years instrumental pavement data for roughness, rut depth and macro texture according to TMH 13 no
older than 2 years instrumental pavement data for deflections according to TMH 13 no older than 5 years

This gazette is also available free online at www.gpwonline.co.za
146 No. 40913 GOVERNMENT GAZETTE, 12 JUNE 2017
Provincial Roads Maintenance Grant Traffic data according to TMH 3, TMH 8 and TMH 14 no older than 3 years For RISFSA Class R4 and R5 data requirements are: o visual condition data according to TMH 9 for pavements no older than 3 years and TMH 19 for
bridges no older than 5 years o instrumental pavement data for roughness, rut depth and macro texture according to TMH 13 no
older than 4 years on paved roads only o traffic data according to TMH 3, TMH 8 and TMH 14 no older than 5 years
All provinces will be expected to collect and provide information on the following: o road safety assessments, appraisals and improvements (Opex) o a representative sample of all roads to be assessed which is about 10 per cent of Provincial Road
Network for field checking by an independent assessor as agreed by the Department of Transport (DoT) utilising the agreed rates to confirm the correctness of the assessment made.
o Provinces will be required to submit above data to the national data repository as per the format described in TMH18
Up to a maximum of R1000 per km per year for paved roads and R500 per km per year for gravel roads of the grant may be allocated towards the road classification and collection of data required by this grant
A detailed draft RAMP for 2018/19 that is compliant with the requirements of the Government Immovable Assets Management Act (2007) and based on the ommittee of transport officials road asset management guidelines must be submitted by 31 August 2017 to DoT, relevant provincial treasury and National Treasury
The payment of the first instalment is dependent upon submission to DoT and the relevant provincial treasury of the following:
final RAMP and tabled project list for the 2017 MTEF in a Table B5 format by 30 March 2017 submission of monthly infrastructure reporting model (IRM) reports, 15 days after the end of the
month; and approval of the reports 22 days after the end of the month planning IRM for 2017 financial year at a date determined by NT The payment of the second instalment is dependent on submission of monthly IRM reports, 15 days
after the end of the month; and approval of the reports 22 days after the end of the month The third instalment is dependent on the submission of monthly IRM reports, 15 days after the end of
the month; and approval of the reports 22 days after the end of the month The fourth instalment is dependent on the submission of monthly IRM reports, 15 days after the end
of the month; and approval of the reports 22 days after the end of the month The PRMG allocation can be allocated to following projects as identified and prioritised through the
provincial RAMS: o routine maintenance (Opex): Include day to day routine activities such as cleaning drains and
culverts, vegetation control, line marking, guard rail repair, road sign repair, crack sealing, patching, edge repair, spot regravel, blading
o periodic maintenance (Opex): Include periodically scheduled activities such as fog sprays/diluted emulsions/rejuvenators, surface seals and functional asphalt overlays < 50 mm in thickness. For gravel roads it includes re-gravelling up to 100 mm thick
o special maintenance (Opex): Includes the repair of selected pavement areas up to maximum of 25 per cent of project length followed by application of surface seal or functional asphalt overlay < 50mm. Also includes reinstatement of slope stability, repairs to existing structures and the repair of damage caused by floods or accidents
o rehabilitation (Capex): Includes increasing the structural capacity of an existing pavement through the recycling of existing layers and/or addition of new granular layers or structural asphalt overlays >80mm thick. For gravel roads it is gravel layer > 100 mm thick. These rehabilitation activities are however limited to maximum of 25 per cent of the PRMG allocation
The PRMG allocation cannot be allocated to following projects: o improvements (Capex): This comprises works that aim to improve the quality of service on roads
with an unacceptable quality of service. These include measures of improving quality of service on existing roads such as increases the width in selected areas (i.e. addition of climbing/passing lanes), increases in the width over the total length of the project i.e. addition of paved shoulder and localised geometric and intersection improvements. These activities could in some instances include complete rehabilitation of the existing pavement structure
o The upgrading of gravel roads to surface roads, the construction of new roads and new interchanges do not qualify for funding under this grant
o New Facilities (Capex): This comprises works that aim to improve network capacity and includes the upgrading of earth (dirt) road to an engineered gravel road, the upgrading of a gravel road to a surfaced road and upgrading of single carriageway road to 4-lane or dual carriageway road. The construction of new gravel or surfaced road where previously no road existed (brown/green fields construction). The construction of new bridge to replace existing bridge or new interchange to replace intersection
Deviations from this must be by application to the national DoT, and motivated through a RAMS.

This gazette is also available free online at www.gpwonline.co.za
STAATSKOERANT, 12 JUNIE 2017 No. 40913 147
Provincial Roads Maintenance Grant These projects include multi-year projects that are continuing since inception of the grant
The following amounts per province must be used in 2017/18 for the repair of infrastructure damaged by the natural disaster during 2013/14 and 2014/15 and declared in respective provincial gazettes, and as verified by the National Disaster Management Centre (NDMC): o Eastern Cape: R90 million o Limpopo: R130 million o Mpumalanga: R50 million
Should the cost of repairing the disaster affected infrastructure exceed the amounts earmarked above provinces must fund that shortfall from their provincial equitable share
Business plans for the allocated disaster funds must be in line with the post disaster verification assessment reports and must be submitted to the NDMC and DoT prior to the transfer of the allocation
Disaster reconstruction and rehabilitation funds may only be utilised for approved projects as listed in the post disaster verification assessment reports and approved business plans
Quarterly performance reports on disaster allocations must be submitted to the NDMC and DoT R1billion will be redistributed to provinces complying to the efficiency in investment on roads
project which was undertaken in the 2016/17 financial year as a performance incentive All new provincial roads infrastructure projects funded through the grant must be branded on the
contract sign boards with the S’hamba Sonke logo Provinces may participate in the S’hamba Sonke Programme Technical Support Services of the DoT
through PFMA and Treasury Regulations Allocation criteria Allocations are based on the PRMG formula, which takes into account the extent of the provincial
road network (gravel/paved), the traffic volumes, the visual condition indices on the network and geo-climatic and topographic factors
R1 billion top-up will be redistributed to provinces as an incentive per level of service which efficiency achieved in road project investments, undertaken in the 2016/17 financial year as a performance indicator
The funding for road networks supporting electricity generation infrastructure are subject to separate allocation criteria based on the programme schedule: o Mpumalanga must allocate R482 million in 2017/18 to coal haulage road projects
The funding for rehabilitation and repair of roads and bridges that were assessed by the NDMC is subject to separate allocation criteria
Allocation criteria from 2017/18 onwards shall consider compliance by provinces in submitting recently updated road condition data/reports
Reasons not incorporated in equitable share
This grant is intended to ensure that provinces give priority to road infrastructure maintenance and promote efficiency in road investment
Past performance 2015/16 audited financial outcomes Of the total R9.5 billion allocated and transferred to provinces, R9.9 billion (103.8 per cent) was
spent by the end of the national financial year, 2015/16 service delivery performance
2 438 m² of roads re-sealed. 4 560 km of roads re-gravelled 1 497 281 m² of roads patched 381 867 km bladed 1 911 km rehabilitated
Projected life The grant is ongoing, but will be subject to periodic review MTEF allocations 2017/18: R10.8 billion; 2018/19: R11.5 billion; and 2019/20: R12.3 billion Payment schedule Payment will be made in accordance with a payment schedule agreed to with provinces and approved
by National Treasury Responsibilities of the transferring officer and receiving officer
Responsibilities of the national department DoT in partnership with the national Department of Public Works (DPW) will assess business plans
to ensure compliance to S’hamba Sonke and Expanded Public Works Programme (EPWP) guidelines. In addition, the two departments will monitor and assess the performance on the S’hamba Sonke and EPWP by provincial departments
Submit quarterly performance reports to National Treasury within 45 days after the end of each quarter
Submit a grant evaluation report to National Treasury 120 days after the end of the financial year Review performance based allocation mechanism for use in determining future allocations Confirm the correctness of submitted data by provinces by assessing a representative sample

This gazette is also available free online at www.gpwonline.co.za
148 No. 40913 GOVERNMENT GAZETTE, 12 JUNE 2017
Provincial Roads Maintenance Grant
Responsibilities of the provincial departments Provincial departments must submit monthly infrastructure reports that comply with the IRM to DoT
and the relevant provincial treasury Completed Quarterly Performance Report templates 30 days after the end of each quarter Provincial departments must implement their projects in line with the S’hamba Sonke and EPWP
guidelines Provincial departments should report on the EPWP job creation data to DoT and DPW on the EPWP
reporting system Provinces must report all infrastructure expenditure partially or fully funded by this grant on the IRM
provided by National Treasury Ensure projects are selected using RAMS as the primary source of information Ensure ongoing stakeholder communication and engagement, regarding planning and implementation
of road projects Ensure that approved PRMG funded projects are published as part of the Estimates of Provincial
Revenue Expenditure through the provincial legislative system and processes. Design and implement projects in compliance with the S’hamba Sonke and EPWP guidelines
Process for approval of the 2018/19 business plans
Provinces submit a draft 2018/19 RAMP with a 10 year planned projects selected using RAMS as the primary source, by 31 August 2017
RAMPs, including 2018 MTEF prioritised project lists must be reviwed by DoT and feedback provided by 30 January 2018
Provinces to submit final 2018/19 RAMP to DoT, relevant provincial treasury and National Treasury by 30 March 2018
A updated road network study, for appropriate classification and management of roads by the relevant spheres of government and government entities, is necessary for an informed understanding of how roads are used nationally, and subqeuntly how they should be financed

This gazette is also available free online at www.gpwonline.co.za
STAATSKOERANT, 12 JUNIE 2017 No. 40913 149
Public Transport Operations Grant Transferring department Transport (Vote 35) Grant schedule Schedule 4, Part A Strategic goal Subsidised road based public transport services Grant purpose To provide supplementary funding towards public transport services provided by provincial departments of
transport Outcome statements The provision of public transport services in terms of contracts which are kilometre based and affordable to
the users of the services Improve efficiencies in public transport spending
Outputs Number of vehicles subsidised Number of cumulative annual vehicles subsidised Number of scheduled trips Number of trips operated Number of passengers Number of kilometres Number of employees
Priority outcome(s) of government that this grant primarily contributes to
Outcome 6: An efficient, competitive and responsive economic infrastructure network
Details contained in the business plan
Not applicable
Conditions This conditional grant, which is supplementary, is a national contribution to subsidised service contracts entered into by the provincial departments of transport and public transport operators for the provision of affordable subsidised transport services
The contracting authority must supervise, monitor and verify the correctness of the operators’ claim in terms of the kilometres of service provided and provide a monthly summary report to the transferring officer
If the contracting function is devolved to any municipality before the 2017/18 adjustment budget, the appropriate portion of the grant will also be devolved to the municipality
The implementation of the devolution should be in terms of section 17(5) of the 2017 Division of Revenue Act (DoRA)
The municipality and province will have to make transitional arrangements to ensure payments to operators meet contractual commitments. Should contracts be devolved during 2017/18, a service level agreement between the province and the municipality must be signed and funds must flow in line with 2017 DoRA requirements. Provinces must take all reasonable measures to assist the transition within a framework to be prescribed by the national Department of Transport (DoT) and National Treasury
In cases where contracts are transferred as part of the integrated public transport network (IPTN) of the municipality, the funds allocated to such contracts must be ring-fenced and transferred to the municipalities taking over the contracts from provinces
For the purpose of planning, provinces must share relevant information with municipalities, where services link to integrated public transport networks
All new contracts, including designs and operators’ business plans detailing subsidised services, must be approved by the Public Transport Integration Committee (PTIC), and be in line with relevant legislation and in compliance with the public transport strategy. Where an Intermodal Planning Committee is established at municipal level, in terms of the National Land Transport Act (NLTA), the functions of the two committees must be consolidated to ensure integration of planning, services and modes
Provinces must ensure that PTIC are functional and no new contracts should be paid from the grant if not approved by the PTIC
Allocation criteria The allocations are based on 2009 DoRA allocation baseline, weighted for the average shares of historical contributions that supplement the grant. Provinces/contracting authorities should determine individual operator’s budgets and ensure that the operation stays within the allocation or provide supplementary funds from the provincial budget
Reasons not incorporated in equitable share
Subsidies are earmarked for the provision of public transport services
Past performance 2015/16 audited financial outcome R4.96 billion was allocated to provinces, R4.9 billion (99.5 per cent) was transferred, of which R4.9 billion
(99.7 per cent), was spent by the end of the financial year 2015/16 service delivery performance
Number of cumulative annual vehicles subsidised: 78 228 Number of vehicles subsidised: 6 519 Number of kilometres subsidised: 240 948 029 Subsidy per passenger: R15.19 Subsidy per kilometre operated: R20.02 Kilometres operated per vehicle: 3 080.1 Passengers per vehicle: 4 061 Passengers per trip operated: 51.8 Employees per vehicle: 2.0
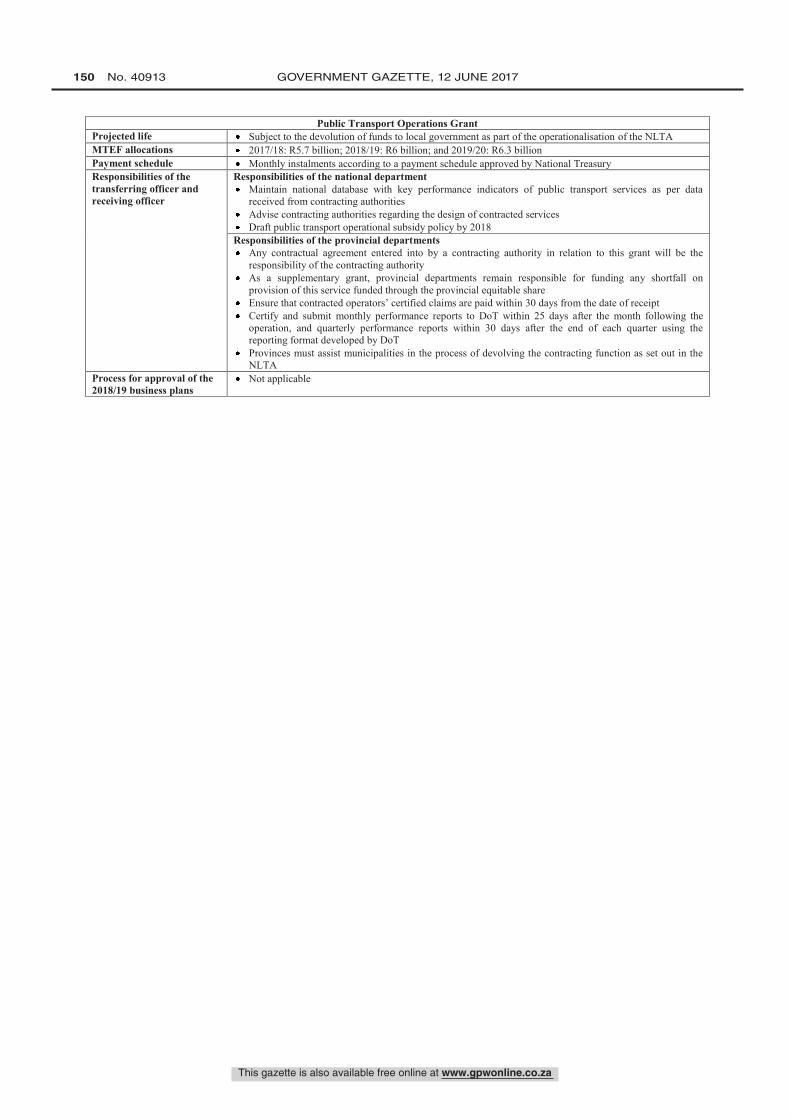
This gazette is also available free online at www.gpwonline.co.za
150 No. 40913 GOVERNMENT GAZETTE, 12 JUNE 2017
Public Transport Operations Grant Projected life Subject to the devolution of funds to local government as part of the operationalisation of the NLTA MTEF allocations 2017/18: R5.7 billion; 2018/19: R6 billion; and 2019/20: R6.3 billion Payment schedule Monthly instalments according to a payment schedule approved by National Treasury Responsibilities of the transferring officer and receiving officer
Responsibilities of the national department Maintain national database with key performance indicators of public transport services as per data
received from contracting authorities Advise contracting authorities regarding the design of contracted services Draft public transport operational subsidy policy by 2018
Responsibilities of the provincial departments Any contractual agreement entered into by a contracting authority in relation to this grant will be the
responsibility of the contracting authority As a supplementary grant, provincial departments remain responsible for funding any shortfall on
provision of this service funded through the provincial equitable share Ensure that contracted operators’ certified claims are paid within 30 days from the date of receipt Certify and submit monthly performance reports to DoT within 25 days after the month following the
operation, and quarterly performance reports within 30 days after the end of each quarter using the reporting format developed by DoT
Provinces must assist municipalities in the process of devolving the contracting function as set out in the NLTA
Process for approval of the 2018/19 business plans
Not applicable

This gazette is also available free online at www.gpwonline.co.za
STAATSKOERANT, 12 JUNIE 2017 No. 40913 151
Part 3: Frameworks for Conditional Grants to Municipalities
Detailed frameworks on Schedule 4, Part B; Schedule 5, Part B; Schedule 6, Part B; and Schedule 7, Part B grants to municipalities Introduction This annexure provides a brief description for each grant in Schedule 4, Part B; Schedule 5, Part B; Schedule 6, Part B; and Schedule 7, Part B of the 2017 Division of Revenue Bill. The following are key areas considered for each grant:
Strategic goal and purpose of the grant Outcome statements and outputs of the grant Priority outcome(s) of government that the grant primarily contributes to Conditions of the grant (additional to what is required in the Bill) Criteria for allocation between municipalities Rationale for funding through a conditional grant Past performance The projected life of the grant 2017 MTEF allocations The payment schedule Responsibilities of transferring national department and receiving municipalities Process for approval of business plans for 2018/19 The attached frameworks are not part of the Division of Revenue Bill, but are published in order to provide more information on each grant to parliament, legislatures, municipal councils, officials in all three spheres of government and the public. Once the 2017 Division of Revenue Bill is enacted, these frameworks will be gazetted in terms of the Act.
The financial statements and annual reports for 2017/18 will report against the Division of Revenue Act, Division of Revenue Amendment Act and their schedules, and the grant frameworks as gazetted in terms of the Act. Such reports must cover both financial and non-financial performance, focusing on the outputs achieved.

This gazette is also available free online at www.gpwonline.co.za
152 No. 40913 GOVERNMENT GAZETTE, 12 JUNE 2017
COOPERATIVE GOVERNANCE AND TRADITIONAL AFFAIRS GRANTS
Municipal Disaster Grant Transferring department Cooperative Governance and Traditional Affairs (Vote 4) Grant schedule Schedule 7, Part B Strategic goal To enable a timely response to immediate needs after a disaster has occurred Grant purpose To provide for the immediate release of funds for disaster response Outcome statements Immediate consequences of disasters are mitigated Outputs Emergency repair of critical infrastructure
Emergency provision of goods and services Priority outcome(s) of government that this grant primarily contributes to
Outcome 9: Responsive, accountable, effective and efficient developmental local government system
Details contained in the business plan
Applications for funding from this grant use the National Disaster Management Centre (NDMC) Disaster Grant Guideline which includes the following: o copy of the classification letter in terms of the Disaster Management Act o copy of a declaration of disaster in terms of the Disaster Management Act o number of people affected and the extent of damages and losses o sectors affected o total funds required for disaster response o resources (both financial and in-kind) allocated by the municipality to respond and mitigate the
effects of the disaster o resources (both financial and in-kind) committed by other role players, including provinces, the
private sector, national departments and non-government organisations o consolidated projects cash flow as an annexure
An implementation plan with the following: o details of the projects to be repaired including GPS coordinates o costs for the project o consolidated project cash flows over a three month period as an annexure to the implementation
plan An initial funding application may be based on the rapid disaster assessments and verification (draft
versions of the supporting documentation required above may be accepted for the initial application) Conditions Copies of the declaration and classification documents must be signed-off by the relevant authorities in
terms of the Disaster Management Act and must be submitted to the NDMC Funds from this grant may only be used to fund expenditure in the event that the municipality
responsible for the provision of the affected basic service is unable to deal with the effects of the disaster utilising their own resources. The examples of expenditure that may be funded from the grant are as follows: o provision of temporary shelter in the event that the municipalities and the Department of Human
Settlements are unable to make provision for immediate housing, with evidence that they are unable to make such provisions
o provide humanitarian relief, in the event that the Department of Social Development is unable to make provision, with evidence that they are unable to make such provisions
Municipalities must fund a portion of the costs of the disaster response and recovery from their own budget or prove that they are unable to do so
Funds from this grant may be utilised to reimburse municipalities for expenditure incurred which could not be accommodated within the municipality’s own budget. Reimbursement is conditional on: o municipalities consulting the NDMC through the Provincial Disaster Management Centres
(PDMCs) for approval prior to spending the funds o providing proof of expenditure in the form of invoices to the relevant PDMC and NDMC
Items purchased must fall within the competency of the municipality Funds from this grant must be utilised within three calendar months following the date of the transfer of
the funds to the municipality The emergency procurement system provided for in the Treasury Regulations should be invoked to
ensure immediate assistance by the affected municipalities Allocation criteria The grant is allocated based on declared municipal disasters and reports of immediate disaster relief
needs. Funding may, however, be released in tranches, with the first tranche being based on an initial assessment and verification of the immediate disaster relief needs
Reason not incorporated in equitable share
This is a conditional grant with a specific purpose to provide for response and relief for unforeseeable and unavoidable disasters
Past performance 2015/16 audited financial outcomes R261 million was allocated and there were no transfers to municipalities
2015/16 service delivery performance There were no transfers to municipalities
Projected life This grant is expected to continue over the medium term and will be subject to review MTEF allocations 2017/18: R300 million; 2018/19: R371 million; and 2019/20: R335 million Payment schedule Transfers are made in accordance with a payment schedule approved by National Treasury

This gazette is also available free online at www.gpwonline.co.za
STAATSKOERANT, 12 JUNIE 2017 No. 40913 153
Municipal Disaster Grant Responsibilities of the transferring officer and receiving officer
Responsibilities of National Disaster Management Centre Advise municipalities and PDMCs about the existence of the grant and how grant funding can be
applied for Conduct a preliminary cost verification and submit an initial request to the National Treasury within 14
days following the receipt of the written initial funding request and submission from the affected PDMCs and municipalities
Together with the affected municipalities and provinces, conduct assessments of disaster impacts to verify the final applications for funding within 35 days following the receipt of written funding requests and as per the requirements of the Disaster Management Act
Submit funding requests to National Treasury for consideration within 35 days following the receipt of the written funding request from the municipalities through the PDMCs
Confirm what support national sector departments are providing and ensure there is no duplication of support
Provide written advice on the timing of disbursements to municipalities and transfer these funds to municipalities within five days of drawing the funds from the National Revenue Fund
Notify the relevant municipality of a transfer at least one day before transfer and transfer the funds no later than five days after notification
Notify the relevant PDMC, together with the relevant sector departments and the provincial treasury, of a transfer and reason for transfer within five days of the transfer of funds to municipalities
Build relationships and establish the necessary communication channels with relevant national and provincial departments to ensure the country has a coordinated approach to disaster response
Provide National Treasury and the relevant provincial treasury with written notification of the transfer within 14 days of a transfer of this grant
Provide expenditure reports to National Treasury in line with the 2017 Division of Revenue Act and the Public Finance Management Act within 20 days after the end of each month
Provide a performance report to National Treasury in the disaster allocation monitoring template agreed to with the National Treasury within 45 days of the end of the quarter in which funds are spent, with invoices as annexures to the report
Responsibilities of Provincial Disaster Management Centres Together with the affected municipalities, conduct initial assessments to verify the impact of the disaster
for application for initial funding, within 14 days following the occurrence of the incident Together with the NDMC and the affected municipalities, conduct assessments of disaster impacts to
verify the final applications for funding within 35 days following the occurrence of the incident, and as per the requirements of the Disaster Management Act
Assist municipalities with requests for disaster funding, and monitor projects to ensure that the funds are used for intended purposes and provide reports to the NDMC and relevant provincial treasury
Coordinate, analyse and submit expenditure reports on progress regarding the implementation of the projects to NDMC within 15 days after the end of each month in which funds are spent, with invoices as annexures to the reports
Coordinate, analyse and submit a performance report, which includes evidence, on progress with implementation of the projects to the NDMC within 35 days after the end of the quarter in which funds are spent
All reports must be signed off by the head of the PDMC Responsibilities of municipalities
Cooperate with the NDMC, PDMC, provincial and national sector departments to conduct damage assessment and cost verification
Submit funding requests to the PDMC within 14 days following the declaration of a disaster Municipalities must invoke emergency procurement processes provided for within the Treasury
Regulations when spending the funds allocated, to ensure immediate assistance to the affected municipalities
Municipalities must monitor all projects and ensure that the funds allocated are spent for their intended purposes
Submit expenditure reports, including evidence of expenditure in the form of invoices, on the progress with implementation of projects to the relevant PDMC within 10 days of the end of each month in which funds are spent
Submit a performance report, including evidence, on the progress with implementation of projects to the PDMC within 30 days of the end of the quarter in which funds are spent
All reports must be signed off by the accounting officer Process for approval of 2018/19 MTEF allocations
Not applicable

This gazette is also available free online at www.gpwonline.co.za
154 No. 40913 GOVERNMENT GAZETTE, 12 JUNE 2017
Municipal Demarcation Transition Grant Transferring department Cooperative Governance and Traditional Affairs (Vote 4) Grant schedule Schedule 5, Part B Strategic goal Facilitate the successful implementation of major boundary changes that took effect at the time of the 2016
local government elections Grant purpose To subsidise the additional institutional and administrative costs arising from major boundary changes that
took effect at the time of the 2016 local government elections Outcome statements Municipalities affected by major boundary changes have administrations that are responsive, accountable,
effective, efficient and developmental Outputs Number of policies, systems, procedures and plans prepared and implemented to facilitate the smooth
transition to new municipalities Priority outcome(s) of government that this grant primarily contributes to
Outcome 9: Responsive, accountable, effective and efficient developmental local government system
Details contained in the business plan
Outcome indicators Output indicators Inputs Key activities Financial implications
Conditions To receive transfers from this grant, municipalities must collaborate with the provincial departments responsible for local government
Funds may only be used in terms of a business plan approved by the national Department of Cooperative Governance (DCoG)
The grant may only be used to fund the following administrative costs to the extent that additional costs arise as a result of the impact of major boundary changes: o consolidation of records management for affected municipalities o development of new organograms (including of work study, job evaluation, job description) o enactment of a new set of by-laws o communication and public participation directly related to the mergers o rationalisation and alignment of municipal policies o alignment of geographic information system data o alignment of valuation rolls o tariff restructuring o debt reconciliation o information technology system amalgamation (infrastructure and systems) o merging asset registers o financial management systems o transitional costs relating to existing staff/personnel, limited to retrenchment packages, relocation costs
and salary equalisation, only after an organogram has been finalised and all posts evaluated The new municipality established in Limpopo (LIM345) may also spend grant funds to recruit new staff and
construct, refurbish or upgrade municipal offices and administrative infrastructure Municipalities may not use grant funds to appoint additional staff Before procuring any professional services or new or upgraded systems, the terms of reference must be
reviewed and approved by the provincial department responsible for local government Any systems purchased or upgraded with funding from this grant must comply with the relevant requirements
set by national government, including being compatible with the municipal standard chart of accounts Allocation criteria Funds are only allocated to municipalities affected by major boundary changes
The amount allocated to each new municipality is based on the number of previously existing municipalities that were merged or split to create the new municipality
Reason not incorporated in equitable share
The grant funds the costs associated with major boundary changes that came into effect at the time of the 2016 local government elections
Past performance 2015/16 audited financial performance Of an allocation of R39 million, R3.7 million was transferred to municipalities
2015/16 service delivery performance Westonaria and Randfontein local municipalities were supported to prepare for their merger
Projected life This is a three year grant to assist municipalities with the 2016 major boundary changes. It came into effect in 2015/16 and will be terminated in 2017/18
MTEF allocations 2017/18: R112 million Payment schedule Transfers are made in accordance with a payment schedule approved by National Treasury

This gazette is also available free online at www.gpwonline.co.za
STAATSKOERANT, 12 JUNIE 2017 No. 40913 155
Municipal Demarcation Transition Grant Responsibilities of the national transferring officer and receiving officer
Responsibilities of national department Assess business plans in collaboration with provincial departments responsible for local government Approve business plans by 31 May 2017 Submit quarterly progress reports to the National Treasury Prescribe a template for business plans Only transfer funds after consulting with the provincial department responsible for local government Complete a phase-out report on the performance of the grant and submit it to Parliament
Responsibilities of provincial departments responsible for local government Monitor and coordinate the resources allocated to assisting re-demarcated municipalities by municipalities,
provinces and national government to ensure there are no duplications and that the grant is only used for additional costs resulting from boundary changes
Assist DCoG to assess municipal business plans Assist DCoG to coordinate reporting from municipalities
Responsibilities of municipalities Municipalities must submit final business plans by 28 April 2017 in the format and template prescribed by
DCoG Report to the national and relevant provincial department on a monthly basis on financial performance and on
a quarterly basis against the performance targets set out in the business plan

This gazette is also available free online at www.gpwonline.co.za
156 No. 40913 GOVERNMENT GAZETTE, 12 JUNE 2017
Municipal Infrastructure Grant Transferring department Cooperative Governance and Traditional Affairs (Vote 4) Grant schedule Schedule 5, Part B Strategic goal Subsidise the capital costs of providing basic services to poor households Grant purpose To provide specific capital finance for eradicating basic municipal infrastructure backlogs for poor
households, microenterprises and social institutions servicing poor communities Outcome statements Improved access to basic services infrastructure for poor communities Outputs Number of poor households impacted through the construction of new infrastructure and upgrading and
renewal of existing infrastructure for: o basic water and sanitation services o central collection points for refuse, transfer stations, recycling facilities and solid waste disposal sites o sport and recreation facilities o street and community lighting o public facilities
Number of kilometres of municipal roads developed and maintained Number of work opportunities and Full-Time Equivalents (FTEs) created using the Expanded Public
Works Programme (EPWP) guidelines for the above outputs Priority outcome(s) of government that this grant primarily contributes to
Outcome 9: Responsive, accountable, effective and efficient developmental local government system
Details contained in the business plan
This grant uses the Municipal Infrastructure Grant (MIG) registration form as agreed with sector departments, which includes: o project title o sector o timeframes for implementation o cost of the project
Conditions
To receive the first tranche, municipalities must have followed the process for approval of 2017/18 projects and have confirmed by 2 June 2017 with the Department of Cooperative Governance (DCoG) their programme, project planning and implementation readiness in the form of an implementation plan that includes a cash flow projection. This should be done prior to the year of implementation and be informed by their Integrated Development Plan (IDP) and three-year capital plans
MIG priorities set by municipalities (as stated in their three-year capital plan) can only be changed with municipal council approval, the concurrence of the sector departments and the approval of DCoG
MIG must be allocated and transferred directly to a category B or C municipality that has the powers and functions for basic services referred to in section 84 of the Municipal Structures Act, to enable the municipality to provide basic municipal infrastructure to the poor, in line with their functions
Municipalities must prioritise MIG for eligible beneficiaries and infrastructure that includes: o basic residential infrastructure for the poor for water, sanitation, roads, waste management, street
lighting, community facilities as well as associated municipal bulk and connector infrastructure o new or upgrading of municipal bulk, connector and reticulation infrastructure to support existing
areas and the formalisation of settlements o renewal of eligible infrastructure servicing the poor subject to the confirmation by the relevant sector
department of the state of infrastructure and a commitment from the municipality of how on-going operations and maintenance of the renewed infrastructure will be funded and performed
o maintenance of roads infrastructure mainly servicing the poor Municipalities must spend at least 60 per cent of their first transfer and comply with reporting provisions
before the second and subsequent transfers are made Municipalities must spend 40 per cent of their total MIG allocation by December 2017 Municipalities must comply with sector norms, standards and legislation as confirmed by sectors during
the MIG project registration processes Local municipalities investing in roads infrastructure must utilise data from the Rural Road Asset
Management System (RRAMS), where available, to identify and prioritise their investment on roads projects; including maintenance
Municipalities with bucket sanitation backlogs in formal areas must prioritise the eradication of these backlogs. Bucket eradication projects in formal areas must be planned in conjunction with provinces and national government to ensure alignment of projects implemented by each sphere. Transfers may be withheld or stopped if a municipality with substantial bucket sanitation backlogs does not comply with this condition
Ring-fenced sport infrastructure allocation: o municipalities that have allocations gazetted as part of the ring-fenced allocation for specific sport
infrastructure projects may only spend these allocations on the projects identified by Sport and Recreation South Africa (SRSA)
o municipalities must make use of transversal contracts approved by SRSA when implementing projects funded from this allocation unless an exemption from this requirement is approved by SRSA
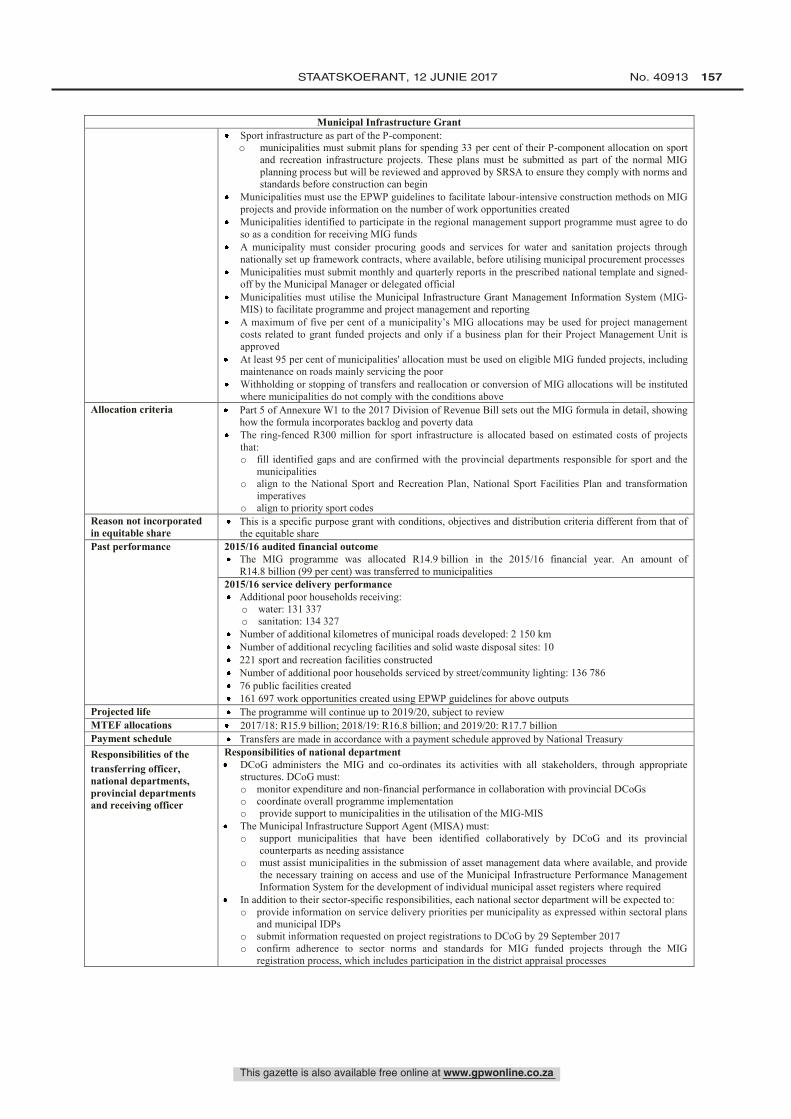
This gazette is also available free online at www.gpwonline.co.za
STAATSKOERANT, 12 JUNIE 2017 No. 40913 157
Municipal Infrastructure Grant Sport infrastructure as part of the P-component: o municipalities must submit plans for spending 33 per cent of their P-component allocation on sport
and recreation infrastructure projects. These plans must be submitted as part of the normal MIG planning process but will be reviewed and approved by SRSA to ensure they comply with norms and standards before construction can begin
Municipalities must use the EPWP guidelines to facilitate labour-intensive construction methods on MIG projects and provide information on the number of work opportunities created
Municipalities identified to participate in the regional management support programme must agree to do so as a condition for receiving MIG funds
A municipality must consider procuring goods and services for water and sanitation projects through nationally set up framework contracts, where available, before utilising municipal procurement processes
Municipalities must submit monthly and quarterly reports in the prescribed national template and signed-off by the Municipal Manager or delegated official
Municipalities must utilise the Municipal Infrastructure Grant Management Information System (MIG-MIS) to facilitate programme and project management and reporting
A maximum of five per cent of a municipality’s MIG allocations may be used for project management costs related to grant funded projects and only if a business plan for their Project Management Unit is approved
At least 95 per cent of municipalities' allocation must be used on eligible MIG funded projects, including maintenance on roads mainly servicing the poor
Withholding or stopping of transfers and reallocation or conversion of MIG allocations will be instituted where municipalities do not comply with the conditions above
Allocation criteria Part 5 of Annexure W1 to the 2017 Division of Revenue Bill sets out the MIG formula in detail, showing how the formula incorporates backlog and poverty data
The ring-fenced R300 million for sport infrastructure is allocated based on estimated costs of projects that: o fill identified gaps and are confirmed with the provincial departments responsible for sport and the
municipalities o align to the National Sport and Recreation Plan, National Sport Facilities Plan and transformation
imperatives o align to priority sport codes
Reason not incorporated in equitable share
This is a specific purpose grant with conditions, objectives and distribution criteria different from that of the equitable share
Past performance 2015/16 audited financial outcome The MIG programme was allocated R14.9 billion in the 2015/16 financial year. An amount of
R14.8 billion (99 per cent) was transferred to municipalities 2015/16 service delivery performance
Additional poor households receiving: o water: 131 337 o sanitation: 134 327
Number of additional kilometres of municipal roads developed: 2 150 km Number of additional recycling facilities and solid waste disposal sites: 10 221 sport and recreation facilities constructed Number of additional poor households serviced by street/community lighting: 136 786 76 public facilities created 161 697 work opportunities created using EPWP guidelines for above outputs
Projected life The programme will continue up to 2019/20, subject to review MTEF allocations 2017/18: R15.9 billion; 2018/19: R16.8 billion; and 2019/20: R17.7 billion Payment schedule Transfers are made in accordance with a payment schedule approved by National Treasury Responsibilities of the transferring officer, national departments, provincial departments and receiving officer
Responsibilities of national department DCoG administers the MIG and co-ordinates its activities with all stakeholders, through appropriate
structures. DCoG must: o monitor expenditure and non-financial performance in collaboration with provincial DCoGs o coordinate overall programme implementation o provide support to municipalities in the utilisation of the MIG-MIS
The Municipal Infrastructure Support Agent (MISA) must: o support municipalities that have been identified collaboratively by DCoG and its provincial
counterparts as needing assistance o must assist municipalities in the submission of asset management data where available, and provide
the necessary training on access and use of the Municipal Infrastructure Performance Management Information System for the development of individual municipal asset registers where required
In addition to their sector-specific responsibilities, each national sector department will be expected to: o provide information on service delivery priorities per municipality as expressed within sectoral plans
and municipal IDPs o submit information requested on project registrations to DCoG by 29 September 2017 o confirm adherence to sector norms and standards for MIG funded projects through the MIG
registration process, which includes participation in the district appraisal processes

This gazette is also available free online at www.gpwonline.co.za
158 No. 40913 GOVERNMENT GAZETTE, 12 JUNE 2017
Municipal Infrastructure Grant o confirm the current state of maintenance where municipalities have applied for funding of renewal
projects o fulfil a sectoral monitoring and guidance role on relevant sectoral outputs o advise which sphere (provincial or national – even if different across provinces) should sign-off MIG
projects o sign-off on project close out reports, thereby acknowledging the projects have been completed as
intended Department of Water and Sanitation: o support and monitor municipalities to prepare and implement water services development plans o monitor and oversee progress on water and sanitation projects implemented through the MIG o ensure alignment between the MIG programme, Regional Bulk Infrastructure Grant and the Water
Services Infrastructure Grant Department of Environmental Affairs: support municipalities with planning and implementation of solid
waste management projects and monitor their performance and compliance with conditions applicable to this sector
Department of Energy: support municipalities with planning and implementation of public lighting and monitor municipalities’ performance and compliance with conditions applicable to this sector
Department of Transport: support municipalities with planning and implementation of municipal roads projects in terms of the RRAMS data and monitor municipalities’ performance and compliance with conditions applicable to this sector
Sport and Recreation South Africa: o identify projects with targeted municipalities to be allocated funds outside of the MIG formula o award transversal tenders for the procurement of services relating to sport infrastructure o support municipalities with planning and implementation of municipal sport and recreation facilities
and monitor municipalities’ performance and compliance with conditions applicable to this sector Department of Public Works: o monitor compliance with the EPWP guidelines and advise municipalities on the use of labour
intensive processes, systems, techniques and approaches o monitor the number of work opportunities and FTEs created on MIG funded projects that contribute
towards EPWP o ensure that municipalities register their EPWP projects on the EPWP reporting system and monitor
compliance with norms and standards applicable to this sector Responsibilities of provincial departments responsible for local government Monitor and reconcile reported expenditure with proof of payment signed-off by the municipality Monitor the accuracy of project registration forms and coordinate monthly, quarterly and annual reports
from municipalities and forward them to DCoG Coordinate district appraisal and progress committee meetings ensuring that DCoG and relevant sector
departments are invited Issue registration letters for projects approved by the district appraisal committees to municipalities,
copying DCoG Coordinate technical support to municipalities Monitor project implementation in collaboration with sectors and submit site visit reports to DCoG Monitor compliance with provincial legislation and alignment to provincial growth and development
strategies through project registration Monitor performance of municipal Project Management Units and recommend relevant sanctions for
under-performance to DCoG Provide assistance to municipalities in managing municipal infrastructure projects Provide support to municipalities in the utilisation of the MIG-MIS
Responsibilities of provincial sector departments Participate in district appraisal and progress committee meetings Evaluate and provide recommendations on sector technical reports before projects are appraised Each provincial sector department must fulfil a sectoral monitoring and guidance role on relevant sectoral
outputs Provide technical advice as required by a municipality through the feasibility, planning, design, tender
and construction phases of a MIG project Responsibilities of municipalities
Municipalities must ensure appropriate programme and project planning and implementation readiness prior to the year of implementation and this must be informed by the IDP and three-year capital plan
Municipalities must monitor each project and ensure that MIG funds are spent for the intended purpose as registered under the MIG-MIS
The municipality must report monthly, quarterly and annually in the prescribed formats and timelines, reports must be signed-off by the Municipal Manager or the delegated official and submitted to national government via the provincial department responsible for local government
Utilise the MIG-MIS to inform the content of the reports mentioned above

This gazette is also available free online at www.gpwonline.co.za
STAATSKOERANT, 12 JUNIE 2017 No. 40913 159
Municipal Infrastructure Grant Process for approval of 2018/19 business plans
Over time, secondary cities should be treated in the same way as metros by the grant system as they also face challenges related to developing integrated and dynamic urban economies. In the short-term, however, the capacity of secondary cities and the scale of urban challenges facing them is sufficiently different to metros and thus cannot be immediately included in the same grant as metros. Special rules and processes for secondary cities will, however, be included in a separate framework from 2018/19 through a “MIG-2” funding stream
Under the MIG-1 funding stream Municipalities must submit all technical reports to the sector departments responsible for water,
sanitation, solid waste, sport and recreation, roads and transport by 28 July 2017, for all projects to be implemented in 2018/19
The responsible sector department must evaluate reports and provide final recommendations to the municipality by 29 September 2017
The municipality must submit all project registration forms by 3 October 2017, for the projects to be implemented in 2018/19, to the provincial department responsible for local government
The provincial departments must provide final recommendations to municipalities by 30 November 2017 Projects not implemented within three-years of approval by the relevant appraisal committee will be
deregistered Municipalities must submit to DCOG by 31 January 2018, detailed project implementation plans for all
the projects to be implemented in the 2018/19 and 2019/20 financial years Such plans should include timelines regarding project designs, initiation of procurement, and
environmental impact assessment (EIA) and/or relevant permit/license approvals in the prescribed format Municipalities must submit updated implementation plans as mentioned above by 11 June 2018,
justifying any changes from the 31 January 2018 detailed plan Under the MIG-2 funding stream (for secondary cities) DCoG to inform municipalities of the eligibility criteria and process to be undertaken in the preparation
to the roll-out of the MIG-2 funding stream

This gazette is also available free online at www.gpwonline.co.za
160 No. 40913 GOVERNMENT GAZETTE, 12 JUNE 2017
Municipal Systems Improvement Grant Transferring department Cooperative Governance and Traditional Affairs (Vote 4) Grant schedule Schedule 6, Part B Strategic goal An efficient and developmental sphere of government capable of delivering services to local communities Grant purpose To assist municipalities to perform their functions and stabilise institutional and governance systems as
required in the Municipal Systems Act and related local government legislation Outcome statements A responsive, accountable, effective and efficient local government system Outputs Number of municipalities supported with the harmonising of their monitoring and evaluation systems
Number of municipalities benefitting from the rollout and implementation of simplified revenue plans Number of municipalities supported to develop organograms for their structures Number of municipalities supported through the development of a consumer database
Priority outcome(s) of government that this grant primarily contributes to
Outcome 9: Responsive, accountable, effective and efficient developmental local government system
Details contained in the business plan
This grant uses a memorandum of understanding that includes: o outcome indicators o output indicators o key activities o inputs o details of how the systems and practices developed will be sustained over the long-term
Conditions The Department of Cooperative Governance and the benefitting municipality must sign a memorandum of understanding (MoU) that includes details of the activities and deliverables being funded, responsibilities of each stakeholder, protocols for engagements and feedback, budget for each activity, and timeframes for implementation
Municipalities must pass a council resolution in support of the technical assistance being provided Grant funds may be spent on building the capacity of municipalities with respect to the purpose and
outputs listed for this grant Technical support to municipalities must include transfer of skills to municipal officials
Allocation criteria In 2017/18 allocations are targeted to municipalities with a history of poor audit outcomes, municipalities in the 27 priority district municipalities, and non-metropolitan municipalities with large outstanding debts owed to creditors
Over the MTEF funds will be allocated to some municipalities not reached in 2017/18 Funds may be reallocated if an MoU is not signed
Reasons not incorporated in equitable share
The grant is aimed at building the capacity of targeted municipalities to implement sound institutional and governance systems required in terms of the Municipal Systems Act and related local government legislation
Past performance 2015/16 audited financial outcomes The direct grant had an allocation of R251 million and the total amount (100 per cent) was transferred to
270 municipalities 2015/16 service delivery performance 188 municipalities supported to improve systems that support service delivery 175 municipalities supported to improve their audit outcomes 191 municipalities supported with systems that improve effective ward participation
Projected life The grant continues until 2019/20, subject to review MTEF allocations 2017/18: R103 million; 2018/19: R115 million; and 2019/20: R122 million Payment schedule Transfers are made in accordance with a payment schedule approved by National Treasury Responsibilities of the transferring national officer and receiving officer
Responsibilities of national department Management, monitoring and reporting of the programme Agree on MoUs with participating municipalities Coordinate with the National Treasury to ensure that the capacity building activities of the two
departments are complimentary Submit reports which are consistent with the reporting requirements in the 2017 Division of Revenue Act

This gazette is also available free online at www.gpwonline.co.za
STAATSKOERANT, 12 JUNIE 2017 No. 40913 161
Responsibilities of municipalities Identify municipal officials that will be recipients of skills transfer Ensure that municipal officials participate actively in all activities funded through this grant Ensure systems and practices developed through this grant are sustained as part of the operations of the
municipality Submit reports consistent with the reporting requirements in the 2017 Division of Revenue Act
Process for approval of 2018/19 MTEF allocations
Targeted municipalities must sign an MoU and pass a council resolution in support of this programme

This gazette is also available free online at www.gpwonline.co.za
162 No. 40913 GOVERNMENT GAZETTE, 12 JUNE 2017
ENERGY GRANTS
Energy Efficiency and Demand Side Management Grant Transferring department Energy (Vote 26) Grant schedule Schedule 5, Part B Strategic goal To reduce electricity consumption by promoting energy efficient practices Grant purpose To provide subsidies to municipalities to implement energy efficiency and demand side management
(EEDSM) initiatives within municipal infrastructure in order to reduce electricity consumption and improve energy efficiency
Outcomes statements Reduced demand for electricity Increased awareness of energy saving Skills development in energy efficiency Energy management capability enhanced
Outputs Amount of electricity saved in Kilowatt hours (KWh) Number of energy efficient street lights installed Number of energy efficient traffic lights installed Number of buildings retrofitted Number of units of water services infrastructure retrofitted Realised energy savings (in KWh)
Details contained in the business plans
Outcome indicators Output indicators Projected energy savings Key activities Inputs
Priority outcome(s) of government that this grant primarily contributes to
Outcome 9: Responsive, accountable, effective and efficient developmental local government system Outcome 10: Protect and enhance our environmental assets and natural resources
Conditions Funds can only be used to implement electricity saving projects in municipal infrastructure The focus for implementation of energy efficiency interventions shall be limited to municipal
buildings, streetlights, traffic lights, waste water treatment works and pump stations Municipalities shall determine a detailed and extended electricity consumption baseline in line with
standards set by the South African Bureau of Standards (SABS) Municipalities must respond to the request for proposals issued by the Department of Energy (DoE) in
the format provided Municipalities must commit to energy savings (in KWh) to be achieved through the retrofits to the
DoE A performance agreement with specific conditions shall be entered into between the municipality and
the DoE The municipality shall prepare a project work plan and business plan in the templates provided by the
DoE Allocation criteria The following criteria are used for selecting municipalities to receive allocations from the grant:
o municipalities that have responded to the request for proposals as issued by the DoE o municipalities with higher electricity consumption and higher electricity saving potential o municipalities with clearly defined objectives on energy efficiency improvements o proposals that use proven energy efficient technologies with low pay-back periods o municipalities that show readiness and capacity to implement the EEDSM projects o good past performance if a municipality has previously participated in the programme o quality, viability and financial feasibility of proposed projects
Reason not incorporated in equitable share
This is a specific conditional transfer in support of the EEDSM programme
Past performance 2015/16 audited financial outcomes The total grant allocation of R178 million was transferred to all participating municipalities
2015/16 service delivery performance An unverified total electricity saving of 18.45 GWh was reported by municipalities against the total
projected savings of 23.57 GWh. The process of verifying the savings is underway and will be concluded in March 2017
Projected life The grant will continue until 2019/20, subject to review MTEF allocations 2017/18: R203 million; 2018/19: R215 million; and 2019/20: R227 million Payment schedule Transfers are made in accordance with a payment schedule approved by National Treasury Responsibilities of the transferring national officer and receiving officer
Responsibilities of the national department Monitoring and evaluation of the EEDSM programme including measurement and verification of
energy savings Provide municipalities with guidance and support through capacity building workshops on best
practices and pricing for EEDSM projects Communicate to municipalities the process and requirements for obtaining EEDSM grant funds in
2018/19 Develop a fair and open process to accredit and establish a panel of competent service providers with
technical expertise to support municipalities during the implementation of EEDSM projects

This gazette is also available free online at www.gpwonline.co.za
STAATSKOERANT, 12 JUNIE 2017 No. 40913 163
Energy Efficiency and Demand Side Management Grant Responsibilities of municipalities Submit proposals as per the request for proposals issued by DoE Ensure that proposals are in the format and template provided by DoE Implement the EEDSM programme as per the framework and contractual agreement In the implementation of EEDSM projects, use service providers accredited by DoE Submit to the DoE the monthly and quarterly reports approved by the municipal manager
Process for approval of 2018/19 business plans
Allocations for 2018/19 will be based on the proposals submitted in line with the request for proposal issued by the DoE
Proposals must be submitted by 29 September 2017 and shall be evaluated against the criteria set out in this framework and the request for proposals issued by DoE

This gazette is also available free online at www.gpwonline.co.za
164 No. 40913 GOVERNMENT GAZETTE, 12 JUNE 2017
Integrated National Electrification Programme (Municipal) Grant Transferring department Energy (Vote 26) Grant schedule Schedule 5, Part B Strategic goal To reduce electrification backlog through funding of bulk infrastructure (substations and
lines) to ensure constant supply of electricity Grant purpose To implement the Integrated National Electrification Programme (INEP) by providing capital
subsidies to municipalities to address the electrification backlog of all existing and planned residential dwellings (including upgrade of informal settlements, new, and normalisation), and the installation of relevant bulk infrastructure
Outcome statements A reduction in household electrification backlogs Universal access to electricity and improvement in distribution infrastructure reliability
Outputs The number of connections to households per annum The number of bulk infrastructure installations Implementation of labour intensive methods on electrification projects and the number of
jobs created Priority outcome(s) of government that this grant primarily contributes to
Outcome 6: An efficient, competitive and responsive economic infrastructure network Outcome 9: Responsive, accountable, effective and efficient developmental local government
system
Details contained in the business plan
Outcome indicators Output indicators Key activities Inputs
Conditions
Adhere to labour-intensive construction methods in terms of the Expanded Public Works Programme (EPWP) guidelines for activities such as trenching, planting of poles, etc.
Register electrification master plans for bulk infrastructure with INEP and abide by the advice or guidance of the Department of Energy (DoE) regarding the central planning and co-ordination for such bulk infrastructure
Bulk infrastructure can only be funded for infrastructure serving poor households (where infrastructure serves tariff-funded areas and poor households costs should be shared)
Use INEP funds for the refurbishment of critical infrastructure, only upon submission of a project plan which must be approved by the DoE
Utilise own funding if the subsidy is insufficient (top–up funding must be available) Minimum size of supply of 1.2 kVA After Diversity Maximum Demand, standard installation
of 20 Amp per household connection, in line with the Suite of Supply Policy Municipalities may utilise up to R1.5 million of the total allocation for service fees (pre-
engineering and Eskom connection fee) if approved by the DoE in their business plans Allocation criteria Allocations are based on an assessment of applications from municipalities based on:
o high backlogs o rural bias o number of planned households for connection projects o past performance o integration with other programmes such as 27 priority district municipalities, the
National Development Plan, catalytic projects, and mining towns o the financial, technical and staff capabilities to distribute electricity and expand and
maintain networks o unlicensed municipalities must appoint service providers with the required knowledge
and expertise for implementation o consultation with communities in terms of the Integrated Development Plan process o ensuring that universal access objectives are fast tracked o infrastructure which is in a state of disrepair, unsafe and which prohibits further
connections o informal settlements where service delivery has been prioritised o new and upgrading of bulk infrastructure projects that support future electrification
needs, and, where distribution network reliability (refurbishment) adversely impacts economic activity and cannot sustain current electrification
Reason not incorporated in equitable share
This is a specific conditional capital transfer for electrification of households
Past performance 2015/16 audited financial outcome R2 billion was allocated and transferred to municipalities
2015/16 service delivery performance 72 399 households were connected including connections funded from roll-overs
Projected life Grant continues until 2019/20, subject to review MTEF allocations 2017/18: R2.1 billion; 2018/19: R2.2 billion; and 2019/20: R3.3 billion Payment schedule Transfers are made in accordance with a payment schedule approved by National Treasury
Responsibilities of the transferring officer and receiving officer
Responsibilities of national department Agree with municipalities on outputs and targets Continuously monitor implementation and provide support to municipalities Verify reports from municipalities

This gazette is also available free online at www.gpwonline.co.za
STAATSKOERANT, 12 JUNIE 2017 No. 40913 165
Integrated National Electrification Programme (Municipal) Grant
Responsibilities of municipalities Ensure that projects are implemented in line with what is reflected in the Integrated
Development Plan of the municipality Report accurately and timeously on the management of this grant and include invoices on
their monthly reports, when reporting to the DoE Municipalities need to appoint service providers to implement their projects by the end of
April 2017 Process for approval of 2018/19 business plans
Application forms are sent to municipalities and the evaluation of all applications and business plan proposals received from municipalities is completed by 14 August 2017

This gazette is also available free online at www.gpwonline.co.za
166 No. 40913 GOVERNMENT GAZETTE, 12 JUNE 2017
Integrated National Electrification Programme (Eskom) Grant Transferring department Energy (Vote 26) Grant schedule Schedule 6, Part B Strategic goal To reduce the backlogs of un-electrified households and fund bulk infrastructure to ensure constant
supply of electricity Grant purpose To implement the Integrated National Electrification Programme by providing capital subsidies to Eskom
to address the electrification backlog of occupied residential dwellings, the installation of bulk infrastructure and rehabilitation and refurbishment of electricity infrastructure in order to improve quality of supply in Eskom licenced areas
Outcome statements A reduction in household electrification backlogs Universal access to electricity and improvement in distribution infrastructure reliability
Outputs The number of household connections per annum The number of bulk infrastructure installations Implementation of labour intensive methods on electrification projects and the number of jobs created
Priority outcome(s) of government that this grant primarily contributes to
Outcome 6: An efficient, competitive and responsive economic infrastructure network Outcome 9: Responsive, accountable, effective and efficient developmental local government system
Details contained in business plan
Outcome indicators Output indicators Inputs Key activities
Conditions Plans need to have undergone pre-engineering and project feasibility approval Projects must be prioritised by municipalities in their Integrated Development Plans (IDPs) and
supporting letters must be provided to demonstrate that municipalities are in agreement with projects to be undertaken
Eskom to comply with requirements to provide approved bulk projects in their business plans Allocation criteria Allocations to Eskom are made on behalf of municipalities based on applications from Eskom for non-
licensed municipalities according to the following criteria: o high backlogs o rural bias o integration with other programmes such as 27 priority district municipalities, the National
Development Plan and other infrastructure programmes like catalytic projects and mining towns o the cost of a project is within benchmarked norms o the project is aligned with the IDP for a particular municipality
Reason not incorporated in equitable share
This is a specific conditional capital transfer for electrification of households and bulk infrastructure
Past performance 2015/16 audited financial outcomes The grant was allocated R3.6 billion and the entire amount was transferred to Eskom, of which
R1.8 billion (64 per cent) was spent by the end of the financial year 2015/16 service delivery performance
150 674 connections were completed at the end of the financial year (includes connections funded from roll-overs)
Projected life The grant will continue until 2019/20, subject to review MTEF allocations 2017/18: R3.8 billion; 2018/19: R4 billion; and 2019/20: R4.2 billion Payment schedule Transfers are made in accordance with a payment schedule approved by National Treasury Responsibilities of the transferring officer and receiving officer
Responsibilities of the national department Agree with Eskom on outputs and targets Continuously monitor implementation Provide central coordination for bulk infrastructure Approve submissions for refurbishment of critical infrastructure
Responsibilities of Eskom Minimum size of supply of 1.2 KVA, After Diversity Maximum Demand, 20 Amp per household
connection and applicable supply for clinic connections, in line with the Suite of Supply Policy Report to the Department of Energy and the National Treasury on monthly and quarterly expenditure for
the grant Process for approval of 2018/19 business plans
Eskom and the Department of Energy must ensure that all planned projects are in line with municipal IDPs and priority lists
Eskom and the Department of Energy must ensure that planned projects are feasible and have gone through the pre-engineering process

This gazette is also available free online at www.gpwonline.co.za
STAATSKOERANT, 12 JUNIE 2017 No. 40913 167
HUMAN SETTLEMENTS GRANT
Urban Settlements Development Grant Transferring department Human Settlements (Vote 38) Grant schedule Schedule 4, Part B Strategic goal To assist metropolitan municipalities to improve household access to basic services through the provision
of bulk, link and internal reticulation infrastructure, with a focus on the poor; and urban land production to support broader urban development, spatial integration and inclusion by supplementing the capital budgets of metropolitan municipalities
Grant purpose Supplements the capital revenues of metropolitan municipalities in order to support the national human settlements development programme, focusing on poor households
Outcome statements
The outcomes to be realised in order to promote integrated sustainable human settlements and improved quality of household life are: o increased individual household access to basic services and related infrastructure o increased acquisition and availability of well-located land for human settlements development o increased access of poor households to public and socio-economic amenities o supporting densification and transit-oriented development projects connecting existing and new
housing developments o ensure the provision of infrastructure for mixed income and mixed use developments to support the
leveraging of private and non-state sector grants and funding in support of approved human settlements catalytic projects
o improving the sustainability of the livelihoods of poor households within each municipality’s area of jurisdiction
Outputs
The following outputs should be funded by the grant to support the improvement of the overall built environment: o increase in bulk infrastructure capacity o increase in the provision of basic services to individual poor households, specifically in informal
settlements and back yards, including water, sanitation, solid waste, electricity, refuse removal, roads and access to transport
o increase in land provision for informal settlement upgrading, subsidy housing, or mixed use developments in support of approved human settlements catalytic projects
o increase in access to public and socio-economic amenities o improved dwelling unit densities within an improved human settlements spatial integration framework o increase in the number of serviced sites in informal settlements upgrading and/or in-situ projects and
green-fields and/or infill developments Priority outcome(s) of government that this grant primarily contributes to
Outcome 8: Sustainable human settlements and improved quality of household life Outcome 9: Responsive, accountable, effective and efficient developmental local government system
Details contained in business plan
This grant uses the Urban Settlements Development Grant (USDG) performance matrix and Built Environment Performance Plans (BEPP) that are consistent with the Integrated Development Plan (IDP), including the human settlements chapter of the IDP, and the Service Delivery and Budget Implementation Plans (SDBIPs) of the receiving municipalities
Conditions A minimum of 50 per cent of the USDG allocation must be spent on the provision of individual basic services to households living in informal settlements either through in-situ upgrades, relocation or integrated development projects
Metros must submit an annual BEPP, USDG performance matrix and SDBIP aligned to the IDP, to the national Department of Human Settlements and National Treasury
The flow of the first instalment is subject to: o submission of the 2016/17 third quarter report, signed-off by the municipal accounting officer
including the performance matrix with non-financial information o submission of the annual BEPP and USDG performance matrix for 2017/18 that is aligned to the
municipal IDP, SDBIP and national priorities by 31 May 2017 The flow of the second instalment will be conditional upon the: o submission of the 2016/17 fourth quarter report signed-off by the accounting officer of the
municipality including the performance matrix with non-financial information o submission of the 2017/18 first quarter report signed-off by the accounting officer of the municipality
to the transferring officer and the National Treasury The flow of the third instalment will be conditional upon submission and approval of the signed-off second
quarter report by the accounting officer to the transferring officer and the National Treasury including the performance matrix with non-financial information
Metros which do not spend 60 per cent of their transferred funds by the end of second quarter, may have subsequent transfers stopped and reallocated

This gazette is also available free online at www.gpwonline.co.za
168 No. 40913 GOVERNMENT GAZETTE, 12 JUNE 2017
Urban Settlements Development Grant The metros must submit an annual USDG performance matrix containing a project list with project
names, project descriptions, classification of infrastructure, Geographic Information System (GIS) coordinates and wards in which projects are being developed. The submission should include motivations of how the projects will benefit poor households and information on spatial targeting, co-funding and other associated investments
A maximum of three per cent of the USDG may be used to procure capacity to support the implementation of USDG human settlements programme outputs as contained in the Medium Term Strategic Framework (MTSF) and in line with the capacity building guideline published by the Department of Human Settlements
Municipalities must indicate the amounts of their annual allocations for spending on the identified catalytic projects in their BEPPs as approved by municipal council
Allocation criteria The grant is allocated to all metropolitan municipalities The base allocation is derived from the Municipal Infrastructure Grant formula explained in part 5 of
annexure W1 of the 2017 Division of Revenue Bill The formula incorporates household backlogs in basic services and access to socio-economic services and
poverty-weighted data Reason not incorporated in equitable share
This is a supplementary capital infrastructure grant with conditions, objectives and distribution criteria (including infrastructure backlogs) aimed at improving outcomes of the application of the equitable share
Past performance 2015/16 audited financial outcomes The grant was allocated R10.6 billion, and R10.6 billion (100 per cent) was transferred to municipalities
2015/16 service delivery performance Delivery performance is indicated in the performance evaluation reports for 2015/16
Projected life The programme will continue until 2019/20, subject to review MTEF allocations 2017/18: R11.4 billion; 2018/19: R12 billion; and 2019/20: R12.6 billion Payment schedule Transfers will be made in accordance with a payment schedule approved by National Treasury Responsibilities of transferring officer and receiving officer
Responsibilities of the national department Develop indicators for the outcomes and outputs Convene a structured forum to meet with municipalities on a quarterly basis Monitor and evaluate the municipal financial and non-financial performance of the grant, including
quarterly summary reports on performance across municipalities Provide support to municipalities with regards to human settlement programmes Publish a guideline by 30 May 2017 on how capacity funds from this grant should be used by cities Ensure collaboration between provinces and municipalities to promote area-based planning, budgeting and
funding alignment as well as implementation support, where applicable Undertake oversight visits to municipalities as may be necessary Facilitate strategic and spatial planning support related to human settlements development Submit an evaluation report on the 2016/17 municipal grant to National Treasury by 27 October 2017 Provide systems, including the Housing Subsidy System that support the administration of the human
settlements delivery process Coordinate and facilitate interaction between national departments, state-owned enterprises, other relevant
entities of the state, provincial departments of human settlements and participating municipalities When under expenditure and under performance is identified, the department may shift funds between
municipalities in line with the 2017 Division of Revenue Act (DoRA) processes and requirements and with the concurrence of donor and receiving municipalities
Participate in the municipal budget benchmarking process as and when indicated by National Treasury Review and approve the USDG performance matrix Review BEPP guidelines
Responsibilities of municipalities Submit 2016/17 evaluation reports in terms of the USDG performance matrix, as contained in the SDBIP,
to the transferring officer on or before 25 August 2017 Metropolitan municipalities may replace non-performing projects with performing projects providing a
similar infrastructure that fulfils the same policy objectives. This replacement should not jeopardise the achievement of the overall MTSF targets committed to by the municipality
Changes to the approved project list may only be made once a quarter and the metro must notify the national Department of Human Settlement in writing and provide all the relevant details of the new project within 30 days after the end of the quarter
Submit monthly financial reports, as contemplated in section 71(5) of the Municipal Finance Management Act (MFMA), within 10 working days after the end of each month indicating reasons for deviations and remedial actions. Such reports must be submitted to the national department, provincial departments and National Treasury

This gazette is also available free online at www.gpwonline.co.za
STAATSKOERANT, 12 JUNIE 2017 No. 40913 169
Urban Settlements Development Grant Ensure that the USDG performance matrix is consistent and aligned with national priorities and provincial
human settlements plans Comply with the terms and conditions of the receiving officer outlined in the DoRA Municipalities should request the roll-over of unspent funds through National Treasury and inform the
transferring officer of all processes regarding the request Ensure effective and efficient utilisation of the grant and alignment to the purpose and outputs of the grant Ensure compliance with required intergovernmental forums, reporting, and accountability frameworks for
human settlements Ensure that the USDG is used to meet municipality MTSF targets as contained in Outcome 8
Process for approval of 2018/19 business plans
Municipalities must submit a comprehensive USDG performance matrix as included in the BEPP which shall include indicators and targets aligned to the MTSF, IDP and SDBIP and a draft and/or approved municipal budget
Municipalities must submit their first draft of the USDG performance matrix to the transferring officer by 30 March 2018 and the final USDG performance matrix should be submitted by 31 May 2018
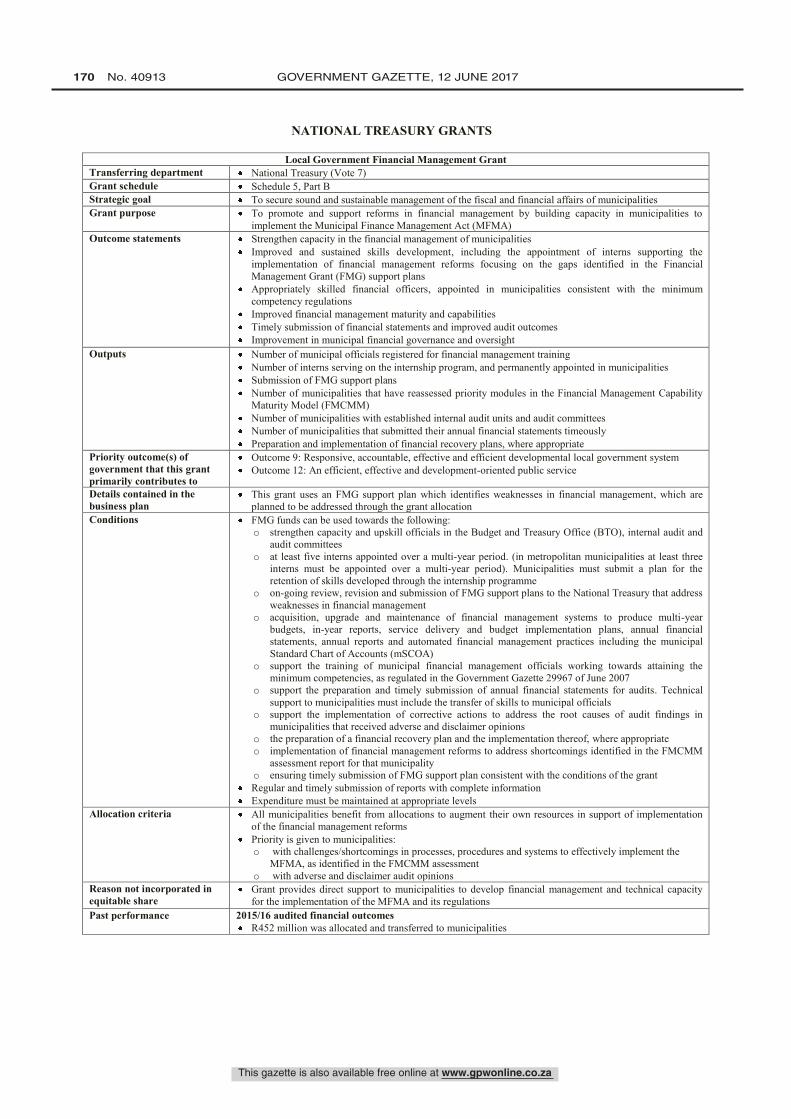
This gazette is also available free online at www.gpwonline.co.za
170 No. 40913 GOVERNMENT GAZETTE, 12 JUNE 2017
NATIONAL TREASURY GRANTS
Local Government Financial Management Grant Transferring department National Treasury (Vote 7) Grant schedule Schedule 5, Part B Strategic goal To secure sound and sustainable management of the fiscal and financial affairs of municipalities Grant purpose To promote and support reforms in financial management by building capacity in municipalities to
implement the Municipal Finance Management Act (MFMA) Outcome statements Strengthen capacity in the financial management of municipalities
Improved and sustained skills development, including the appointment of interns supporting the implementation of financial management reforms focusing on the gaps identified in the Financial Management Grant (FMG) support plans
Appropriately skilled financial officers, appointed in municipalities consistent with the minimum competency regulations
Improved financial management maturity and capabilities Timely submission of financial statements and improved audit outcomes Improvement in municipal financial governance and oversight
Outputs Number of municipal officials registered for financial management training Number of interns serving on the internship program, and permanently appointed in municipalities Submission of FMG support plans Number of municipalities that have reassessed priority modules in the Financial Management Capability
Maturity Model (FMCMM) Number of municipalities with established internal audit units and audit committees Number of municipalities that submitted their annual financial statements timeously Preparation and implementation of financial recovery plans, where appropriate
Priority outcome(s) of government that this grant primarily contributes to
Outcome 9: Responsive, accountable, effective and efficient developmental local government system Outcome 12: An efficient, effective and development-oriented public service
Details contained in the business plan
This grant uses an FMG support plan which identifies weaknesses in financial management, which are planned to be addressed through the grant allocation
Conditions FMG funds can be used towards the following: o strengthen capacity and upskill officials in the Budget and Treasury Office (BTO), internal audit and
audit committees o at least five interns appointed over a multi-year period. (in metropolitan municipalities at least three
interns must be appointed over a multi-year period). Municipalities must submit a plan for the retention of skills developed through the internship programme
o on-going review, revision and submission of FMG support plans to the National Treasury that address weaknesses in financial management
o acquisition, upgrade and maintenance of financial management systems to produce multi-year budgets, in-year reports, service delivery and budget implementation plans, annual financial statements, annual reports and automated financial management practices including the municipal Standard Chart of Accounts (mSCOA)
o support the training of municipal financial management officials working towards attaining the minimum competencies, as regulated in the Government Gazette 29967 of June 2007
o support the preparation and timely submission of annual financial statements for audits. Technical support to municipalities must include the transfer of skills to municipal officials
o support the implementation of corrective actions to address the root causes of audit findings in municipalities that received adverse and disclaimer opinions
o the preparation of a financial recovery plan and the implementation thereof, where appropriate o implementation of financial management reforms to address shortcomings identified in the FMCMM
assessment report for that municipality o ensuring timely submission of FMG support plan consistent with the conditions of the grant
Regular and timely submission of reports with complete information Expenditure must be maintained at appropriate levels
Allocation criteria All municipalities benefit from allocations to augment their own resources in support of implementation of the financial management reforms
Priority is given to municipalities: o with challenges/shortcomings in processes, procedures and systems to effectively implement the
MFMA, as identified in the FMCMM assessment o with adverse and disclaimer audit opinions
Reason not incorporated in equitable share
Grant provides direct support to municipalities to develop financial management and technical capacity for the implementation of the MFMA and its regulations
Past performance 2015/16 audited financial outcomes R452 million was allocated and transferred to municipalities
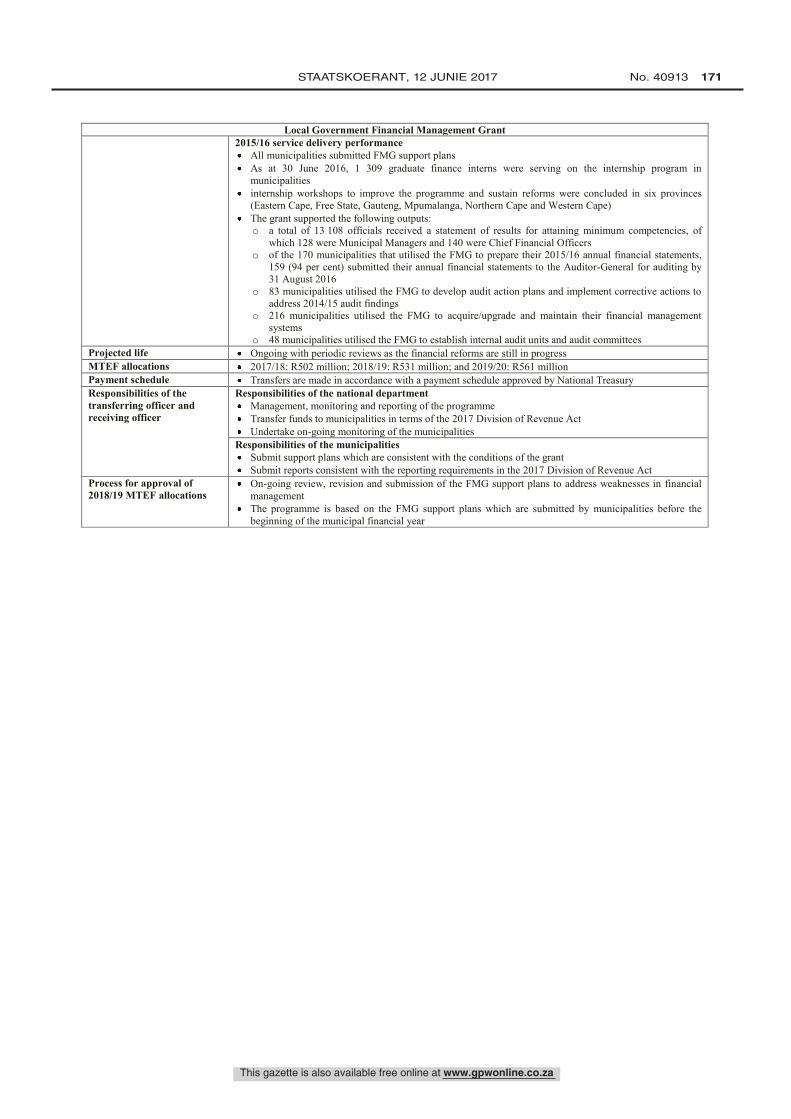
This gazette is also available free online at www.gpwonline.co.za
STAATSKOERANT, 12 JUNIE 2017 No. 40913 171
Local Government Financial Management Grant 2015/16 service delivery performance
All municipalities submitted FMG support plans As at 30 June 2016, 1 309 graduate finance interns were serving on the internship program in
municipalities internship workshops to improve the programme and sustain reforms were concluded in six provinces
(Eastern Cape, Free State, Gauteng, Mpumalanga, Northern Cape and Western Cape) The grant supported the following outputs: o a total of 13 108 officials received a statement of results for attaining minimum competencies, of
which 128 were Municipal Managers and 140 were Chief Financial Officers o of the 170 municipalities that utilised the FMG to prepare their 2015/16 annual financial statements,
159 (94 per cent) submitted their annual financial statements to the Auditor-General for auditing by 31 August 2016
o 83 municipalities utilised the FMG to develop audit action plans and implement corrective actions to address 2014/15 audit findings
o 216 municipalities utilised the FMG to acquire/upgrade and maintain their financial management systems
o 48 municipalities utilised the FMG to establish internal audit units and audit committees Projected life Ongoing with periodic reviews as the financial reforms are still in progress MTEF allocations 2017/18: R502 million; 2018/19: R531 million; and 2019/20: R561 million Payment schedule Transfers are made in accordance with a payment schedule approved by National Treasury Responsibilities of the transferring officer and receiving officer
Responsibilities of the national department Management, monitoring and reporting of the programme Transfer funds to municipalities in terms of the 2017 Division of Revenue Act Undertake on-going monitoring of the municipalities
Responsibilities of the municipalities Submit support plans which are consistent with the conditions of the grant Submit reports consistent with the reporting requirements in the 2017 Division of Revenue Act
Process for approval of 2018/19 MTEF allocations
On-going review, revision and submission of the FMG support plans to address weaknesses in financial management
The programme is based on the FMG support plans which are submitted by municipalities before the beginning of the municipal financial year

This gazette is also available free online at www.gpwonline.co.za
172 No. 40913 GOVERNMENT GAZETTE, 12 JUNE 2017
Integrated City Development Grant Transferring Department National Treasury (Vote 7) Grant schedule Schedule 4, Part B Strategic goal The development of more inclusive, liveable, productive and sustainable urban built environments in
metropolitan municipalities Grant purpose To provide a financial incentive for metropolitan municipalities to achieve a more compact urban spatial
form through integrating and focussing their use of available infrastructure investment and regulatory instruments
Outcome statements Improved spatial targeting and sequencing of public investments in the urban built environment to achieve a more compact, inclusive, productive and sustainable urban spatial form
Outputs Number of infrastructure projects including public transport, roads, water, energy, housing, land acquisition and development in implementation within identified integration zones
Number of integrated strategic/catalytic projects planned within identified integration zones Number of authorised studies/strategies completed
Priority outcome(s) of government that this grant primarily contributes to
Outcome 6: An efficient, competitive and responsive economic infrastructure network Outcome 8: Sustainable human settlements and improved quality of household life Outcome 9: Responsive, accountable, effective and efficient developmental local government system
Details contained in the business plan
Outcome indicators Output indicators Inputs Key activities
Conditions
Eligibility is restricted to metropolitan municipalities which must have: o obtained a financially unqualified audit opinion from the Auditor-General (AG) for the 2015/16
financial year, or finalised an audit action plan by 24 February 2017 o achieved acceptable levels of capital expenditure performance (reported a variance between adjusted
budgeted and actual expenditures of 35 per cent or lower to the National Treasury for the 2015/16 financial year)
Municipalities have the authority to select preferred investments within their functional mandates and within identified integration zones. Eligible expenditures include: o any capital expenditure within the functional mandate of the municipality within identified integration
zones o authorised direct operating expenditure to produce analytical or diagnostic studies, strategy
development or transaction advisory assistance related to the development or implementation of strategies for identified integration zones
A municipality may apply to the transferring officer, by no later than 31 August 2017, to utilise a maximum of 15 per cent of the total annual allocation to undertake specified planning activities within integration zones, provided that these conform to the list of eligible activities identified by the transferring officer, including: o property market empirical and diagnostic studies o integrated infrastructure and spatial planning for identified integration zones o investment pipeline development (excluding direct project preparation) o development of infrastructure financing strategies and instruments o development of policies, bylaws and systems for the administration of development charges o enhanced policies and procedures for environmental and social management in infrastructure delivery o the municipality can demonstrate the ability to implement these activities within the financial year
The first transfer of the grant will only be released to a municipality that has submitted a council approved Built Environment Performance Plan (BEPP) in the prescribed format by 31 May 2017 that includes: o a pipeline of catalytic projects that has been compiled according to a prescribed format o built environment outcome indicators and targets for 2017/18 that have been compiled according to a
prescribed format The second transfer will only be released to a municipality that has submitted detailed information on the
catalytic projects that are in the pipeline in accordance with the standard format provided Allocation criteria Allocations will be made to eligible metropolitan municipalities on a population-weighted basis in order to
account for the relatively greater planning complexity and investment needs in larger metropolitan municipalities. Final allocations are adjusted by performance against the following weighted indicators: o BEPP evaluation score for 2016/17 (30 per cent) o no decrease in total debt to revenue ratio in 2015/16 (15 per cent) o no Section 57 vacancies for longer than six months in 2016 (10 per cent) o unqualified audit opinion by AG (with or without findings) for the last financial year (25 per cent) o decrease in total value of irregular, fruitless and wasteful expenditure identified by AG (20 per cent)

This gazette is also available free online at www.gpwonline.co.za
STAATSKOERANT, 12 JUNIE 2017 No. 40913 173
Integrated City Development Grant For the outer years of the MTEF, allocations per metropolitan municipality have been provided without
taking into account any performance adjustments. The allocation figures for the 2018 MTEF will be adjusted based on actual performance against the weighted indicators listed above as well as any new built environment indicators agreed with the metros
Reason not incorporated in equitable share
The grant provides a specific financial incentive for metropolitan municipalities to enhance the performance of their urban built environment programmes. It reflects commitments contained in the National Development Plan to streamline funding for urban public investments to support the restructuring of the urban built environment
Past performance 2015/16 audited financial outcomes R255 million was allocated and transferred to municipalities
2015/16 service delivery performance All eight metropolitan municipalities submitted BEPPs timeously and identified 14 integration zones Municipalities also indicated 12 catalytic projects being planned and three projects under implementation
in these integration zones Projected life The grant will continue over the 2017 MTEF, subject to review MTEF allocations 2017/18: R292 million; 2018/19: R309 million; and 2019/20: R326 million Payment schedule Transfers are made in accordance with a payment schedule approved by National Treasury Responsibilities of transferring officer and receiving officer
Responsibilities of the national department National Treasury will review eligibility criteria and assess compliance with grant conditions prior to the
transfer of each grant instalment National Treasury in consultation with the Department of Cooperative Governance and the Department of
Rural Development and Land Reform will facilitate engagements on the BEPPs with metropolitan municipalities and other sector departments
National Treasury will provide operational guidelines, facilitate peer learning and provide capacity support through the Cities Support Programme
National Treasury will authorise applications for the utilisation of grant funds for specified operating purposes
National Treasury will review the credibility and measurability of audit plans Responsibilities of municipalities
Submit BEPPs and in-year reports Ensure consistent planning in integration zones, including alignment of integrated development plans,
social housing restructuring zones, priority housing development areas and urban development zones Strengthen and align their own capacity to support BEPP implementation
Process for approval of 2018/19 business plans
Eligible municipalities must submit their draft BEPP by 31 March 2018 in accordance with requirements outlined in the BEPP guidelines

This gazette is also available free online at www.gpwonline.co.za
174 No. 40913 GOVERNMENT GAZETTE, 12 JUNE 2017
Infrastructure Skills Development Grant Transferring department National Treasury (Vote 7) Grant schedule Schedule 5, Part B Strategic goal To improve infrastructure delivery management capacity within municipalities by developing a long-term
and sustainable pool of registered professionals with built environment and related technical skills in engineering, town planning, architecture, quantity surveying, geographic information system and project management
Grant purpose To recruit unemployed graduates into municipalities to be trained and professionally developed, as per the requirements of the relevant statutory councils within the built environment
Outcome statements Developed technical capacity within local government to enhance infrastructure provision, and service delivery, through improved infrastructure planning, implementation, operations and maintenance
Registered professionals with built environment qualifications (national diplomas and degrees) as per the statutory councils’ requirements
Increased number of qualified and registered professionals employed within local government Outputs Number of built environment graduates registered as candidates for training and professional development
as per requirements of the relevant statutory councils Number of graduates recognised as registered professionals by the relevant statutory councils Number of graduates employed as registered professionals within the built environment in local
government Priority outcome(s) of government that this grant primarily contributes to
Outcome 5: A skilled and capable workforce to support an inclusive growth path Outcome 9: Responsive, accountable, effective and efficient developmental local government system
Details contained in the business plan
Outcome indicators Output indicators Inputs Key activities
Conditions The business plan must demonstrate that the municipality has projects in which the graduates can be trained, and provide the relevant complexity of work and responsibility that can support graduates to meet the registration requirements of the relevant statutory councils
Graduates must be seconded to an entity (public or private) if no relevant training is available to develop the necessary competence of the graduates
Where graduates are placed in another entity (public or private) a Memorandum of Agreement (MoA) must be developed and signed between the municipality and the entity, according to Infrastructure Skills Development Grant (ISDG) guidelines. The MoA must clearly demonstrate the supervision requirements and the roles and responsibilities of all parties associated with the training of graduates
Graduates must have a national diploma or degree in the built environment from higher education institutions i.e. Universities or Universities of Technology recognised by the statutory council
Municipalities must provide training as per the road-to-registration requirements of the relevant statutory council
Mentoring must be provided by registered professionals in the same field, and registration category, as the graduates in training. The full names and proof of registration of the mentor must be submitted to the National Treasury, and a contract must be entered into with each mentor, according to ISDG guidelines
The ISDG funding is to be utilised exclusively for costs associated with the training and professional development process of graduates (refer to ISDG Guidelines)
The business plan of a municipality must include an absorption strategy for the graduates within the municipality or any other municipality
A Project Administrator may be appointed per municipality for the purpose of the ISDG administration if approved by National Treasury (refer to ISDG Guidelines)
Graduates are to be placed in units to support the management, maintenance and/or implementation of infrastructure, infrastructure related projects and accelerated service/infrastructure delivery
Graduates must be assigned to a supervisor with experience in the same field as the graduates-in-training Graduates’ training progress is to be evaluated by professionally registered mentors on a quarterly basis
and development of the required competencies of graduates is to be evaluated bi-annually Municipalities must submit monthly and quarterly reports timeously Graduate reports and/or log books must be completed in the format of the statutory council and must be
signed by the registered mentor/supervisor as required by statutory councils Municipalities must sign a Service Level Agreement (SLA) with the National Treasury and such an
agreement must be adhered to Non-compliance with the above conditions can result in the funds being withheld, stopped or re-allocated

This gazette is also available free online at www.gpwonline.co.za
STAATSKOERANT, 12 JUNIE 2017 No. 40913 175
Infrastructure Skills Development Grant Allocation criteria Allocations are based on business plans submitted and ability of municipalities to provide training and
professional development of graduates for the duration of the candidate phase as stipulated by statutory councils
Reason not incorporated in equitable share
This conditional grant is meant to develop technical skills within identified municipalities
Past performance 2015/16 audited financial outcomes R124 million was allocated and transferred to 16 municipalities
2015/16 service delivery performance The grant has created employment and training opportunities for 495 graduates The following municipalities received the grant:
o Buffalo City (30 graduates) o Nelson Mandela Bay (45 graduates) o eThekwini (87 graduates) o City of Johannesburg (4 graduates) o Westonaria (13 graduates) o Polokwane (28 graduates) o Govan Mbeki (120 graduates) o Gert Sibande (13 graduates) o Lukhanji (8 graduates) o Alfred Nzo (20 graduates) o Umhlathuze (19 graduates) o Sol Plaatjie (19 graduates) o John Taolo Gaetsewe (8 graduates) o King Sabata Dalindyebo (20 graduates) o City of Cape Town (23 graduates) o George (15 graduates) o Ditsobotla (23 graduates)
Projected life The grant is expected to continue over the 2017 Medium Term Expenditure Framework (MTEF), subject to review
MTEF allocations 2017/18: R141 million, 2018/19: R149 million and 2019/20: R157 million Payment schedule Transfers are made in accordance with a payment schedule approved by National Treasury Responsibilities of the transferring officer and receiving officer
Responsibilities of National Treasury Issue guidelines and supporting documentation for the implementation of the ISDG Rollout the ISDG in municipalities in compliance with the ISDG framework, guidelines and relevant
prescripts Manage, monitor and report on the programme Ensure professional development is aligned to statutory council requirements Monitor the registration progress of graduates with the relevant statutory councils by municipalities Monitor financial and non-financial performance of the ISDG Maintain graduates database for the ISDG Work with the Municipal Infrastructure Support Agent (MISA), and other stakeholders, on policies,
strategies and guidelines to recruit graduates into permanent positions in local government after they have registered as professionals
Responsibilities of municipalities Comply with the requirements of the Division of Revenue Act, ISDG guidelines, the SLA and the
requirements of the relevant statutory councils Municipalities must prepare a structured training plan, indicating how graduates will be exposed to
suitable projects, to ensure that graduates achieve competencies in relevant activities and are developed professionally to meet the outcome(s) requirements for professional registration
Seek and provide secondment opportunities/agreements with professional service providers, appointed by the municipality, when there is no more relevant work and adequate responsibility for the candidate to progress

This gazette is also available free online at www.gpwonline.co.za
176 No. 40913 GOVERNMENT GAZETTE, 12 JUNE 2017
Infrastructure Skills Development Grant Provide the candidate with the requisite workspace, supervisor, tools of profession/trade, and logistics to
perform the recommended activities within their training plans Continuously review, and assess, the candidates’ work and progress on the road-to-registration and make
recommendations for corrective action Ensure that candidates attend professional development activities in accordance with their training plans,
progress and the requirements of their respective statutory councils Attend all meetings and workshops convened by the National Treasury relating to this grant Support and supervise graduates on the road-to-registration training Recruit professionally registered mentors who are in line with the skills training required and ensure that
they are adequately orientated on the registration process and its requirements Manage the programme and provide progress reports on a monthly and quarterly basis in the standard
reporting templates provided by the National Treasury Manage the utilisation of ISDG funds and report to the National Treasury The municipality must provide, and update, the list of business tools procured with the ISDG funds. The
business tools must be procured in accordance with ISDG guidelines Municipalities must submit applications for graduates to register as candidates with the relevant statutory
councils within six months, and where not initially eligible, must complete the additional requirements for acceptance as a candidate within 12 months of intake
Municipalities must submit evidence of the graduates’ registration to National Treasury when graduates have qualified as registered professionals
Process for approval of 2018/19 business plans
Interested municipalities must submit a three-year business plan by 31 August 2017 for assessment by the National Treasury
Participating municipalities to submit revised business plans to the National Treasury by 31 August 2017

This gazette is also available free online at www.gpwonline.co.za
STAATSKOERANT, 12 JUNIE 2017 No. 40913 177
Neighbourhood Development Partnership Grant Transferring department National Treasury (Vote 7) Grant schedule Schedule 5, Part B and Schedule 6, Part B Strategic goal Eradicating spatial inequality towards the creation of liveable, sustainable, resilient, efficient, and
integrated towns and cities Grant purpose To plan, catalyse, and invest in targeted locations in order to attract and sustain third party capital
investments aimed at spatial transformation, that will improve the quality of life, and access to opportunities for residents in South Africa’s under-served neighbourhoods, generally townships
Outcome statements Spatially integrated cities and towns Diversity of public and private capital investments leveraged into targeted locations Improved ratio of Neighbourhood Development Partnership Grant (NDPG) to third-party capital
investment into strategic locations Improved municipal capacity to support infrastructure investment planning, prioritisation, and ability to
drive long-term spatial transformation Outputs Targeted locations with catalytic projects, defined as either:
o urban hub precincts with secondary linkages; or o built environment upgrade projects in urban and rural townships
Leveraged third-party capital investment into targeted locations The production and dissemination of toolkits, guidance and/or good practice notes and supporting
knowledge sharing events Enhanced municipal strategic competencies in investment targeting, implementation, and urban
management Priority outcome(s) of government that this grant primarily contributes to
Outcome 4: Decent employment through inclusive economic growth Outcome 8: Sustainable human settlements and improved quality of household life Outcome 9: Responsive, accountable, effective and efficient developmental local government system
Details contained in the business plan
Outcome indicators Output indicators Inputs Key activities
Conditions Compliance with the aims and objectives outlined in a signed memorandum of agreement or funding agreement between the municipality and the transferring officer
Submit cash flow schedules with budgets and timeframes for technical assistance and capital grant (project) implementation as requested by the transferring officer
Programme execution is dependent on a sequential and formal acceptance/approval by the transferring officer of NDPG-related municipal plans or deliverables
Municipalities must commit to forging partnerships with businesses, investors, communities, national and provincial government and state-owned entities in order to leverage the third-party capital investment required to ensure long-term and sustainable outcomes for each precinct
Allocation criteria The grant funds the following activities in targeted locations that are defined as urban hubs: planning, the development of catalytic projects and management activities as well as the development of built environment upgrade projects in rural townships
Schedule 6B: Technical assistance allocations support planning, professional programme management costs as well as management activities for projects in targeted locations in order to attract and sustain third party capital investments based on the NDPG’s allocation criteria
Schedule 5B: Capital grant allocations are determined via a pipeline of prioritised projects that have been identified through the planning process of targeted locations
Allocations are focused on municipalities whose circumstances align with the NDPG’s criteria, these include: higher population densities, diverse nature of economic activity, concentrations of poverty, inefficient spatial-historical development, improved connectivity and mobility (in particular through improved public transport networks)
Reason not incorporated in equitable share
This grant has a strong focus on catalytic nodal and linkage investment in targeted township locations that is not the focus of the equitable share
Past performance 2015/16 audited financial outcomes R607 million allocated, and R584 million transferred in Schedule 5, Part B direct transfers to
municipalities R26 million allocated in Schedule 6, Part B indirect transfers to municipalities and R18 million of the
allocation was spent by the end of the national financial year 2015/16 service delivery performance
61 NDPG projects under construction in 2015/16 R4.1 billion in estimated third party investment leveraged (cumulative since 2007/08) 357 catalytic projects approved (cumulative since 2007/08) 18 long-term urban regeneration programmes registered (cumulative since 2013/14)
Projected life This grant is expected to continue over the medium term, subject to review

This gazette is also available free online at www.gpwonline.co.za
178 No. 40913 GOVERNMENT GAZETTE, 12 JUNE 2017
Neighbourhood Development Partnership Grant MTEF allocations Direct transfers (Schedule 5, Part B)
2017/18: R663 million; 2018/19: R702 million; and 2019/20: R741 million Allocation-in-kind (Schedule 6, Part B)
2017/18: R28 million; 2018/19: R29 million; and 2019/20: R31 million Payment schedule Transfers are made in accordance with a payment schedule approved by National Treasury Responsibilities of the transferring officer and receiving officer
Responsibilities of the national department The National Treasury funds plans and catalytic projects in targeted locations that are defined either as
urban hubs or as built environment upgrade projects in urban and rural townships, including: o notifying all municipalities of their allocation status, both directly and via the Neighbourhood
Development Partnerships (NDP) page on the National Treasury website o reporting in terms of the 2017 Division of Revenue Act (DoRA) o determining grant allocations for the Medium Term Expenditure Framework (MTEF) period o performing the obligations as set out in the Memorandum of Agreement/Funding Agreements signed
between the municipality and the national department o governing the acceptance or approval milestones of NDPG-related municipal plans or deliverables o monitoring, managing and evaluating financial and non-financial performance o overseeing and enforcing the conditions of this grant o producing and disseminating toolkits, guidance and good practice notes that strengthen competencies
in investment targeting, implementation and urban management The Department of Rural Development and Land Reform is to drive rural development by supporting the
planning and infrastructure delivery of identified and agreed NDPG projects, including: o acting as the agent of the National Treasury on identified and agreed NDPG projects o appointing a dedicated project manager to ensure the continuity of NDPG activities o reporting monthly to the National Treasury on the progress of NDPG projects o providing programme and project management support to municipalities until the NDPG projects are
completed and closed o motivating to the National Treasury for the reallocation of funding for specific municipal projects o integrating existing project and information systems to ensure efficient and effective management of
existing NDP projects o participating in a joint advisory committee with National Treasury to govern the direction and
coordination of the agency function o exploring the feasibility of developing grant management capacity
Responsibilities of municipalities Compile and submit monthly and quarterly expenditure and progress reports in line with NDPG
requirements and as stipulated in the DoRA Submit a cash flow schedule with budgets and timeframes for technical assistance and/or capital grant
implementation as requested by the transferring officer Provide adequate human resources capacity for the successful coordination and implementation of NDPG
projects Coordinate the development of NDPG related municipal plans or deliverables and ensure that they are
aligned with the grant objectives against which performance will be assessed Manage and monitor technical assistance and/or capital grant implementation ensuring sound financial
management and value for money Maintain accurate and current grant and performance information as specified in NDPG management
information formats and systems Engage stakeholders so as to develop partnerships that leverage funding into the targeted locations Collect and provide evidence of funding leveraged into each precinct Mainstream and reflect the NDPG development strategies and plans across the municipality, i.e. through
the municipal: o Spatial Development Frameworks (SDFs) and Capital Investment frameworks (as a chapter in the
municipal SDF) o Integrated Development Plans (IDPs) o Built Environment Performance Plans (BEPPs) - only applicable to metropolitan municipalities
Process for approval of 2018/19 municipal NDPG plans
Submission of NDPG related municipal plans and/or deliverables within the timeframes defined in each municipality’s own work plans
Plans and/or deliverables must include an indication of: o the ability to attract and report on third-party funding leveraged o the quality of performance and progress reporting o the level of NDPG alignment across all municipal development strategies and plans including
coordination, targeting, and prioritisation with other related capital projects as reflected through municipal SDFs and capital investment frameworks

This gazette is also available free online at www.gpwonline.co.za
STAATSKOERANT, 12 JUNIE 2017 No. 40913 179
PUBLIC WORKS GRANT
Expanded Public Works Programme Integrated Grant for Municipalities Transferring department Public Works (Vote 11) Grant schedule Schedule 5, Part B Strategic goal To provide Expanded Public Works Programme (EPWP) incentive funding to expand job creation
efforts in specific focus areas, where labour intensive delivery methods can be maximised Grant purpose To incentivise municipalities to expand work creation efforts through the use of labour intensive
delivery methods in the following identified focus areas, in compliance with the EPWP guidelines: o road maintenance and the maintenance of buildings o low traffic volume roads and rural roads o basic services infrastructure, including water and sanitation reticulation (excluding bulk
infrastructure) o other economic and social infrastructure o tourism and cultural industries o waste management o parks and beautification o sustainable land-based livelihoods o social services programmes o community safety programmes
Outcome statements Contribute towards increased levels of employment Improved opportunities for sustainable work through experience and learning gained
Outputs 59 255 Full-Time Equivalents (FTEs) to be created through the grant Number of people employed and receiving income through the EPWP Increased average duration of the work opportunities created
Priority outcome(s) of government that this grant primarily contributes to
Outcome 4: Decent employment through inclusive economic growth Outcome 9: Responsive, accountable, effective and efficient developmental local government system
Details contained in the business plans
The programme is implemented through municipalities using EPWP integrated agreements and project lists that specify the number of FTEs and work opportunities to be created
Conditions
EPWP projects must comply with the project selection criteria determined in the EPWP grant manual, the EPWP guidelines set by the Department of Public Works (DPW) and the Ministerial Determination updated annually on 1 November each year
Eligible municipalities must sign a funding agreement with the DPW before the first grant disbursement, with their final EPWP project list attached
Municipalities must report quarterly on all EPWP projects via DPW’s EPWP reporting system Reports must be loaded on the EPWP reporting system within 15 days after the end of every quarter in
order for progress to be assessed Municipalities must maintain beneficiary and payroll records as specified in the audit requirements in
the EPWP grant manual The EPWP grant cannot be used to fund the costs of permanent municipal personnel; however, a
maximum of five per cent of the grant can be used to fund contract based capacity required to manage data capturing and on-site management costs related to the use of labour intensive methods
The EPWP grant can only be utilised for EPWP purposes, for the projects approved in each municipality's EPWP project list
To receive the first planned grant disbursement, eligible municipalities must submit a signed integrated agreement with a project list by 9 June 2017
Subsequent grant disbursements are conditional upon eligible municipalities reporting quarterly on EPWP performance within the required timeframes
Municipalities must implement their approved EPWP project list and meet agreed job creation targets EPWP branding must be incorporated on any existing signage as per corporate identity manual
Allocation criteria To be eligible for an EPWP grant allocation in the 2017/18 financial year, a municipality must have reported EPWP performance by 30 October 2016. The EPWP grant allocations are based on: o past EPWP performance o the number of FTE jobs created in the prior 18 months o past performance with regard to labour intensity in the creation of EPWP work opportunities o the need for EPWP work creation in a municipal area, indicated by levels of unemployment,
poverty and service backlogs Allocation criteria include a rural bias. Rural municipalities will also be prioritised in terms of
technical support for implementation provided by DPW Reason not incorporated in equitable share
This grant is intended to fund the expansion of labour intensity in specific focus areas as well as incentivise increased EPWP performance. The grant is based on performance, the potential to expand and the need for EPWP work in key geographic regions
Past performance
2015/16 audited financial outcomes The grant had an allocation of R588 million. 276 municipalities were eligible for the grant and the total
allocated amount of R588 million (100 per cent) was transferred to these municipalities

This gazette is also available free online at www.gpwonline.co.za
180 No. 40913 GOVERNMENT GAZETTE, 12 JUNE 2017
Expanded Public Works Programme Integrated Grant for Municipalities
2015/16 service delivery performance 124 410 work opportunities were reported by 247 municipalities and validated on the EPWP system 41 063 FTE jobs were reported by 247 municipalities and validated on the EPWP system
Projected life Grant continues until 2019/20, subject to review MTEF allocations 2017/18: R691 million; 2018/19: R729 million; and 2019/20: R781 million Payment schedule Transfers are made in accordance with a payment schedule approved by National Treasury Responsibilities of the transferring officer and receiving officer
Responsibilities of the national department Determine eligibility and set grant allocations and FTE targets for eligible municipalities Publish on the EPWP website all documents relevant for municipalities to understand and implement
the grant, including a grant manual, the relevant EPWP guidelines and the Ministerial Determination Support municipalities in the manner agreed to in the grant agreement, to: o identify suitable EPWP projects and develop EPWP project lists in accordance with the EPWP
project selection criteria o apply the EPWP project selection criteria and EPWP guidelines to project design o report using the EPWP reporting system
Monitor the performance and spending of municipalities according to the signed incentive agreement Disburse the grant to eligible municipalities Conduct data quality assessments on a continuous basis, to support good governance and identify areas
for administrative improvement Manage the EPWP coordinating structures in collaboration with provincial coordinating departments
to support implementation, identify blockages and facilitate innovative solutions Conduct site visits to identify where support is needed
Responsibilities of the eligible municipalities Develop and submit an EPWP project list to DPW by 9 June 2017 Sign the standard funding agreement with DPW agreeing to comply with the conditions of the grant
before receiving any grant disbursement Agree on the areas requiring technical support from DPW upon signing the grant agreement Ensure that reporting is done within the timelines stipulated in the grant agreement and that
information is captured in the EPWP reporting system Municipalities must maintain beneficiary and payroll records as specified in the audit requirements in
the EPWP grant manual, and make these available to DPW for data quality assessment tests Reports must be loaded within 15 days after the end of every quarter in order for progress to be
assessed Process for approval of 2018/19 business plans
Municipalities must report performance on EPWP projects for the 2017/18 financial year by 30 October 2017 to be eligible for a grant allocation
Municipalities must submit a signed EPWP integrated agreement and project list by 8 June 2018

This gazette is also available free online at www.gpwonline.co.za
STAATSKOERANT, 12 JUNIE 2017 No. 40913 181
TRANSPORT GRANTS
Public Transport Network Grant Transferring department Transport (Vote 35) Grant schedule Schedule 5, Part B Strategic goal To support the National Land Transport Act (Act No. 5 of 2009) and Public Transport Strategy (PTS) and
Action Plan in promoting the provision of accessible, reliable and affordable integrated municipal public transport network services
Grant purpose To provide funding for accelerated construction and improvement of public and non-motorised transport infrastructure that form part of a municipal integrated public transport network and to support the planning, regulation, control, management and operations of fiscally and financially sustainable municipal public transport network services
Outcome statements Improved public transport network infrastructure and services that function optimally and are safe, convenient, affordable, well managed and maintained
Public transport systems that are accessible to an increasing percentage of the population of urban municipalities and contribute to more spatially efficient urban areas
Outputs Network Operations Component Number of average weekday passenger trips carried on Public Transport Network Grant (PTNG) funded
networks Number and percentage of municipal households within a 500m walk to an Integrated Public Transport
Network (IPTN) station or stop that has a minimum peak period frequency of 15 minutes or better Percentage uptime for network operating systems as a proportion of the network’s public operating hours Passengers per network vehicle per average weekday
Network Infrastructure Component Public transport network infrastructure including dedicated lanes, routes and stops/shelters, stations,
depots, signage and information displays, control centres and related information technology, fare systems and vehicles (if the Department of Transport (DoT) approves use of grant funds to purchase vehicles), non-motorised transport (NMT) infrastructure that supports network integration (e.g. sidewalks, cycleways, cycle storage at stations, etc.)
Plans and detailed design related to IPTN infrastructure and operations Priority outcome(s) of government this grant primarily contributes to
Outcome 6: An efficient, competitive and responsive economic infrastructure network Outcome 9: Responsive, accountable, effective and efficient developmental local government system
Details contained in the business plan
This grant uses IPTN operational and related plans that include financial modelling
Conditions
Projects must be based on and form part of a strategic, municipal wide, long-term IPTN plan and strategy approved by the municipal council
Projects funded by this grant must be based on an Operational and Business Plan, which must include a multi-year financial operational plan approved by the municipal council. This multi-year financial operational plan must cover the full duration of any contracts for each phase funded by the PTNG and include operating and maintenance costs and universal design access plans
Projects must support an integrated multi-modal network approach as defined in the National Land Transport Act (NLTA) and the Public Transport Strategy and municipalities must manage operations to progressively achieve the standard of service defined in the Public Transport Strategy within available resources
Projects in metropolitan municipalities must demonstrate alignment to Built Environment Performance Plans
Payments will be conditional on the attainment of milestones specified in the grant allocation letter to each municipality from the DoT. Milestones are based on the approved IPTN operational plans of cities and are defined after consultation with municipalities
All public transport infrastructure and services funded through this grant must ensure that there is provision for the needs of special categories of passengers (including disabled, elderly and pregnant passengers) in line with the requirements of section 11(c)(xiv) of the NLTA
Allocations for this grant are made through two components, with separate conditions applicable to each component as set out in the allocations criteria section below. Allocations for the Network Operations Component will be determined by DoT and National Treasury once municipalities submit an annual operations plan including financial forecasts for 2017/18 by 3 April 2017. Funds for one component can be shifted to the other if approved by National Treasury and DoT
The first tranche is subject to cities submitting, by 15 June 2017, a multi-year financial operational plan (approved by the municipal council) for the duration of the vehicle operating contract/s pertaining to any phase on which 2017/18 grant funds will be spent
The second tranche is subject to this financial operational plan being submitted to DoT and accepted jointly by National Treasury and the DoT as a basis for future grant payments
All new Intelligent Transport Solutions (ITS) related contracts that will incur grant expenditure must be jointly approved by DoT and National Treasury before grant funds may be spent on them

This gazette is also available free online at www.gpwonline.co.za
182 No. 40913 GOVERNMENT GAZETTE, 12 JUNE 2017
Public Transport Network Grant Network Operations Component
Operating subsidies from this component can fund security, station management, fare collection services, control centre operations, information and marketing, network management, insurance, compensation for the economic rights of existing operators and maintenance of infrastructure and systems
From the start of operations, IPTN systems must recover all the direct operating costs of contracted vehicle operators from fare revenue, other local funding sources and, if applicable, from any Public Transport Operations Grant contributions. These direct operating costs consist of fuel, labour, operator administration and vehicle maintenance
From the start of operations on a route, the grant can fund a portion of the per kilometre rate to subsidise up to 100 per cent of the capital cost (including interest and related fees) of vehicles purchased by the vehicle operating company
IPTN operational plans and on-going operations management must target improved farebox cost coverage, through minimising costs and maximising fare revenues. Municipalities operating network services are required to supply detailed operating performance and operating cost and revenue reports quarterly in the formats prescribed by the DoT
Operating subsidies for any new or existing service, line, route or phase, will only be transferred after a municipality meets the requirements of DoT’s Operational Readiness Framework
Municipalities must enforce rules and by-laws regarding usage of dedicated lanes, fare payment, and operator/supplier compliance with contractual provisions
Municipalities are required to establish specialist capacity to manage and monitor public transport system contracts and operations
Verified data on operator revenue and profitability and draft agreements for the compensation of existing economic rights of affected operators must be provided to DoT prior to concluding agreements on compensation for economic rights
Municipalities must enforce agreements that only legal operators operate on routes subject to compensation agreements
Network Infrastructure Component The grant can fund all IPTN-related infrastructure, including for non-motorised transport, upgrades of
existing public transport infrastructure and for new infrastructure Municipalities must demonstrate in their IPTN operational plans that they have attempted to give
maximum priority to public and non-motorised transport while minimising costs through using existing infrastructure, road space and public land
For each phase, final network routing, service design and related financial modelling must be submitted to DoT for review and approval before municipalities proceed with detailed infrastructure design
IPTN projects must meet the minimum requirements of the South African Bureau of Standards (including Part S of the Building Regulations)
Contracted operators should finance and own vehicles unless a case for the exceptional use of limited infrastructure funding for vehicle procurement is approved by DoT, in consultation with National Treasury. If approval is granted, any vehicles purchased with grant funds must remain the property of the municipality
Allocation criteria Allocations are only made to municipalities that submit business plans in line with the above conditions, that demonstrate sufficient capacity to implement and operate any proposed projects, and credibly demonstrate the long-term fiscal and financial sustainability of the proposed projects
80 per cent of available funds are allocated according to a formula. The formula has three equally weighted indicators: o size of population o size of economy o number of public transport users
20 per cent of available funds are allocated through a non-formula component. The allocation of this non-formula component is led by DoT in consultation with National Treasury and agreed upon by a joint committee
Allocations for the Network Operations Component are based on cities’ Annual Operations Plans (to be submitted to DoT by 3 April 2017) which indicate the amount of the 2017/18 total allocation to be used within the rules of this component. Approval of these allocations is specified in the DoT allocation letter to municipalities and is based on the following rules: o DoT approval of the annual operations plan o the network operations component can be used in each phase and sub-phase of the introduction of
services to fund up to 70 per cent of indirect operating costs for two years after the municipal financial year in which operations start. Thereafter the grant can fund up to 50 per cent. Non-PTNG sources must cover the remaining costs
o compensation for the economic rights of existing operators can be funded up to 100 per cent in each phase
Reasons not incorporated in equitable share
Infrastructure and operational costs associated with the implementation of the PTS and NLTA were not included in municipal budgets prior to the introduction of IPTN services

This gazette is also available free online at www.gpwonline.co.za
STAATSKOERANT, 12 JUNIE 2017 No. 40913 183
Public Transport Network Grant Past performance 2015/16 audited financial outcomes:
Public Transport Network Grant: R6 billion was allocated and R6 billion (100 per cent) was transferred to municipalities.
2015/16 service delivery performance: eThekwini:
5.4 km of bus rapid transit lanes completed along Route C3 Preliminary design on C1B completed Construction on corridor C9 commenced and detailed design for corridor C1A was completed
George: 3 phases are operational Cost recovery ratio of over 50 per cent, a system coverage ratio of over 80 per cent and at an average of
between 25 000 and 30 000 passenger trips per day Cape Town:
Average of 62 183 passenger journeys per weekday Construction completed incudes: 0.6 kilometers of dedicated trunk busway, 18 kilometetrs of trunk busway
in mixed traffic lanes, 44 of feeder routes, 50 shelters and 11 other stops 80 contracted operators were paid compensation and 63 affected vehicles were taken out of service Annual fare revenue amounted to R190 million
Ekurhuleni: Trunk route construction complete up to R25 interchange, including areas 2A, 2B, 3A, 3B, 4A and 4B Complementary Roads to Isando and Vosloorus complete, including areas 1A, 1B and Isando Road Six stations complete The construction of Transport Management Centre (TMC), including the installation of the video wall was
completed Johannesburg
The full Phase 1A and 1B systems are operational and include: o 82 articulated buses and 195 standard buses in operation o 43.5 km of dedicated routes o 153.9 km of feeders and complementary routes o 130 bus stops and feeder routes and 99 bus stops on complimentary routes o 48 stations in operation o Average of 48 271 passenger journeys per weekday
Mangaung The focus was on the development and the gathering of the public transport data required for the design
and operational plans for the IPTN Mbombela
Construction underway Msunduzi
Progress on all construction is 20 per cent Marketing and ITS strategies approved and detailed financial model completed Signing of the Memorandum of Agreement with the taxi operators
Nelson Mandela Bay Roadworks for Cleary Park contract area completed A Public Transport Operations Verification Survey on reduced starter service routes was 80 per cent
completed Polokwane
Construction and rehabilitation of Moletji trunk extensions, Seshego trunk extensions, city centre trunk feeders, Nelson Mandela trunk
Rustenburg 5.3 km of bi-directional dedicated bus rapid transit busways, non-motorised transport and 5 stations sub-
structures completed for Phase 1A 8.5 km of bi-directional dedicated bus rapid transit busways, non-motorised transport and 5 stations sub-
structures completed for Phase 1B, including an interchange and 3 bridges Tshwane
Average of 4 634 passenger journeys per weekday on line 1A The construction of line 1A reached 85 per cent completion on Pretorius to Nana Sita section and 5 per
cent completion on city centre to Rainbow Junction section Construction of Belle Ombre Compressed Natural Gas (CNG) Bus Depot: civil works 80 per cent complete
and building works 10 per cent of complete Projected life The grant is expected to continue until 2019/20, subject to review MTEF allocations 2017/18: R6.2 billion; 2018/19: R6.6 billion; and 2019/20: R7 billion Payment schedule Transfers are made in accordance with an agreed payment schedule approved by National Treasury

This gazette is also available free online at www.gpwonline.co.za
184 No. 40913 GOVERNMENT GAZETTE, 12 JUNE 2017
Public Transport Network Grant Responsibilities of the transferring officer and receiving officer
Responsibilities of the national department Disburse PTNG funds and monitor PTNG expenditure Monitor IPTN implementation progress and operating performance in line with the NLTA and the public
transport strategy Verify reports from municipalities by conducting at least one site visit per annum Allocate the funds based on stated priorities through an allocation mechanism agreed to by the DoT and
National Treasury Review and comment on draft compensation agreements for economic rights Review and comment on the network model submitted by each city Evaluate the performance of the grant annually Maintain the database of operational performance based on the indicators and continue to track, report
and evaluate the performance of the grant based on these measures Finalise the public transport subsidy policy for South Africa Develop cost norms for ITS and include these in the annual PTNG guidelines and requirements circulated
to cities by DoT Submit copies of allocation letters and milestones to National Treasury Review the Public Transport Strategy to ensure its requirements enable cities to develop fiscally
sustainable IPTN systems Responsibilities of municipalities
Ensure that projects are implemented in line with approved business plans and are also reflected in the integrated development plan of the municipality. Additional plans that cities will need to complete include: o network operational plans, including universal design access plans o business and financial plans (including financial modelling, economic evaluation, and operator
transition plans) o institutional network management plans o engineering and architectural preliminary and detailed designs o public transport vehicle and technology plans o marketing and communication plans
Projects funded by this grant must promote the integration of the public transport networks in a city, through: o physical integration between different services within a single network o fare integration between different services o marketing integration with unified branding o institutional integration between the services o spatial integration, in conjunction with other grants directed at the built environment
Provide budget proposals for the PTNG funding that: o are based on sound operational and financial plans that cover direct vehicle company operating costs
from local sources at a minimum o indicate the intended allocations between the network operations component and network
infrastructure component Establish a dedicated project team to plan, manage and monitor infrastructure development and
maintenance, as well as operations with an emphasis on optimising vehicle kilometres through full use of procured Intelligent Transport System tools
Compile and submit data that indicates the efficiency and effectiveness of operational services in the formats and using the indicators defined by the DoT
Process for approval of 2018/19 MTEF allocations
Municipalities must submit business plans based on a fiscally and financially sustainable IPTN (or an agreed plan to compile this), supported by credible multi-year financial operational plans by 31 July 2017
DoT and National Treasury will jointly evaluate these plans – based on pre-determined criteria regarding financial and fiscal sustainability and sufficient capacity – for the city’s eligibility for an allocation in the 2018/19 financial year
Municipalities that fail to pass the eligibility criteria will be informed by 21 August 2017 and may be asked to resubmit plans

This gazette is also available free online at www.gpwonline.co.za
STAATSKOERANT, 12 JUNIE 2017 No. 40913 185
Rural Roads Asset Management Systems Grant Transferring department Transport (Vote 35) Grant Schedule Schedule 5, Part B Strategic goal Ensure efficient and effective investment in rural municipal roads through development of Road Asset
Management Systems (RAMS) and collection of data Grant purpose To assist rural district municipalities to set up rural RAMS, and collect road, bridges and traffic data on
municipal road networks in line with the Road Infrastructure Strategic Framework for South Africa (RISFSA)
Outcome statements Improved data on municipal rural roads to guide infrastructure maintenance and investments Reduced vehicle operating costs
Outputs
Road condition data (paved and unpaved) Traffic data Data on condition of structures as per Technical Methods for Highways (TMH) 19 (including bridges and
culverts) Extent of unproclaimed roads Prioritised project list for roads to inform Municipal Infrastructure Grant project selection
Priority outcome(s) of government that this grant primarily contributes to
Outcome 6: An efficient, competitive and responsive economic infrastructure network Outcome 7: Comprehensive rural development and land reform Outcome 9: Responsive, accountable, effective and efficient local government
Details contained in the business plan
This grant uses Road Asset Management Business Plans which contain the following details: o network condition, structures and traffic volumes data collection plan o organisational and support plan o financial summary o details of planned engagements and sharing of data with local municipalities
Conditions Transfer of the first tranche is conditional on submission of an approved business plan by 28 April 2017 Transfer of the second tranche is conditional on submission of evidence of engagements and sharing of data
with local municipalities Road authorities must conduct regular condition assessments for paved and unpaved roads and bridges and
collect traffic data in accordance with TMH9, TMH19 and TMH22 District municipalities must provide local municipalities with validated information from the condition data
collected to enable municipalities to identify and prioritise road maintenance requirements within their own budgets, to improve the condition and extend the lifespan of road infrastructure
District municipalities must submit the above data to the national repository as per the format described in TMH18
For RISFSA Class R1, R2 and R3 roads, data collection requirements are: o visual condition data not older than two years for pavements and five years for bridges o instrumental pavement data for roughness, rut depth and macro texture not older than two years o instrumental pavement data for structural strength not older than five years o traffic data not older than three years
For RISFSA Class R4 and R5 roads, data requirements are: o visual condition data not older than three years for pavements and five years for bridges o traffic data not older than five years
All road condition reports and data collected must be submitted to the National Department of Transport (DoT), and the relevant Provincial Roads Authorities
Systems developed to record data must be compatible with DoT specifications (TMH26 and TMH22) for uniformity
Up to a maximum of R1000 per km per year for paved roads and R500 per km per year for gravel roads of the grant may be allocated towards road classification and collection of data required by this grant
District municipalities must participate in grant management structures, including attending quarterly RRAMS meetings
A maximum of five per cent may be used for municipal costs incurred as part of coordination, project management and reporting by the district municipality. Municipalities must not use this grant to appoint staff
District municipalities must appoint an independent assessor to assess a representative sample of all roads assessed (which is about 10 per cent of their assessed network) to confirm the correctness of the assessment made by the municipality
Allocation criteria Allocations are based on the extent of the road network and number of local municipalities within each district municipality
All 44 district municipalities will benefit from this grant in the 2017 MTEF Reason not incorporated in equitable share
This is a specific purpose grant mainly for the provision of systems to collect data on traffic, and the condition of rural roads and access bridges

This gazette is also available free online at www.gpwonline.co.za
186 No. 40913 GOVERNMENT GAZETTE, 12 JUNE 2017
Rural Roads Asset Management Systems Grant Past performance 2015/16 audited financial outcomes
R97 million was allocated, and R97 million (100 per cent of the allocation) was transferred to municipalities
2015/16 service delivery performance Approximately 21 440 kilometres of paved road network and 190 402 kilometres of unpaved road network
had been assessed by the programme in the 44 district municipalities receiving allocations Approximately 3 269 structures were identified and 1 793 structures were assessed which represent 55 per
cent of the total number of structures Submission of RAMS data in TMH18 format has been a challenge with some district municipalities but
workshops were held to assist them with the new data exchange format 163 graduates were recruited into the programme
Projected life The grant will continue until 2019/20, subject to review MTEF allocations 2017/18: R107 million; 2018/19: R114 million; and 2019/20: R120 million Payment schedule Transfers are made in two tranches in accordance with a payment schedule approved by National Treasury Responsibilities of the transferring officer and receiving officer
Responsibilities of national department Monitoring implementation of RAMS together with provincial road authorities Provide guidance on sustainable RAMS operations and standards Facilitate interaction between local municipalities and district municipalities in using RAMS outputs as
guidance in municipal road infrastructure management Check the quality and integrity of data captured on municipalities’ RAMS in collaboration with provincial
road authorities Responsibilities of municipalities
Municipalities must make provision to maintain RAMS after the lifespan of the grant Data for all rural roads to be updated within two years Recruit unemployed youth, S3 experiential training students and young graduates Ensure human capacity at municipalities for the operation of RAMS is built Road quality data on RAMS must be used for planning Municipal Infrastructure Grant roads investments as
well as roads maintenance funded from other sources Submission of updated RAMS data in TMH18 format by 30 August 2017
Process for approval of 2018/19 business plans
District municipalities must submit a Road Asset Management Plan (RAMP) / business plan annually to DoT by the end of April
RAMP must contain the following: o the extent of the road network in the municipality o the proportion of municipal roads with updated data captured on its RAMS o the condition of the network in the municipality o the maintenance and rehabilitation need of the municipal road network o the status of the municipality’s RAMS o status of institutionalisation of RAMS in the district municipality o TMH 22 RAMP guideline can be used as template
DoT together with Provincial Roads Authorities will evaluate the business plans and progress reports by the end of May

This gazette is also available free online at www.gpwonline.co.za
STAATSKOERANT, 12 JUNIE 2017 No. 40913 187
WATER AND SANITATION GRANTS
Regional Bulk Infrastructure Grant Transferring department Water and Sanitation (Vote 36) Grant schedule Schedule 5, Part B and Schedule 6, Part B Strategic goal Facilitate achievement of targets for access to bulk water and sanitation through successful execution and
implementation of bulk projects of regional significance Grant purpose To develop new, refurbish, upgrade and replace ageing water and wastewater infrastructure of regional
significance that connects water resources to infrastructure serving extensive areas across municipal boundaries or large regional bulk infrastructure serving numerous communities over a large area within a municipality
To pilot regional Water Conservation and Water Demand Management (WC/WDM) projects or facilitate and contribute to the implementation of local WC/WDM projects that will directly impact on bulk infrastructure requirements
Outcome statements Access to water supply enabled through regional bulk infrastructure Proper wastewater management and disposal enabled through regional wastewater infrastructure
Outputs Number of regional bulk water and sanitation projects under construction and WC/WDM projects initiated
Number of projects/project phases completed Number of households targeted to benefit from bulk supply Number of households benefitting from projects completed Number of municipalities benefitting Number of job opportunities created
Priority outcome(s) of government that this grant primarily contributes to
Outcome 6: An efficient, competitive and responsive economic infrastructure network Outcome 7: Comprehensive rural development and land reform Outcome 9: A responsive, accountable, effective and efficient developmental local government system
Details contained in the business plan
This grant uses approved Implementation Readiness Studies (IRS) and funding agreements which contain the following: o cash flow and implementation milestones o details of key stakeholders and main contractors o specific funding conditions related to the project o outline of the roles and responsibilities of the respective parties
Conditions The Regional Bulk Infrastructure Grant (RBIG) is intended to fund the social component of regional bulk water and wastewater projects approved by the Department of Water and Sanitation (DWS), unless arguments for exemption based on affordability are recommended by DWS and approved by National Treasury
All identified projects must be referenced to and included in the municipal Integrated Development Plan (IDP) and Water Services Development Plans (WSDP) and show linkages to projects under the Municipal Infrastructure Grant (MIG) and/or the Water Services Infrastructure Grant (WSIG)
Funds may only be used for drought relief interventions based on a business plan approved by DWS Schedule 5, Part B allocations
The municipality must spend grant funds in line with the approved IRS The municipality must submit monthly financial and quarterly non-financial reports to DWS on stipulated
dates Grant funds must be reflected in the capital budget of the municipality All source of funding for the cost of the project must be clearly outlined in the approved IRS The financing plan with associated co-funding agreements must be in place prior to implementation of
the project unless exemption to co-funding requirements has been approved by National Treasury Schedule 6, Part B allocations This grant can be used to build enabling infrastructure required to connect or protect water resources over
significant distances with bulk and reticulation systems A financing plan with associated co-funding agreements must be in place prior to implementation of
RBIG funded projects All sources of funding for the full cost of the project must be outlined in the IRS and the funding
agreement, which must be signed by DWS and the benefiting municipality RBIG payments for Schedule 6, Part B allocations will be made to DWS’s contracted implementing
agent based on invoices for work done All projects must be implemented and transferred in line with the approved IRS If required, a transfer plan must be developed and agreed to prior to the commencement of any new
projects or the handover of projects already under construction. A maximum of 3 per cent of the cost of a project can be spent on developing and implementing the transfer plan
Allocation criteria Projects are assessed individually, and allocations are made by DWS on a project basis, taking into account the following factors: o demand and availability of water o the overall infrastructure needs o the strategic nature of the project o socio-economic importance of an area o urgency and impact of the intervention
Reason not incorporated in equitable share
Regional bulk projects are closely linked to water resource planning and development, which is a DWS competency
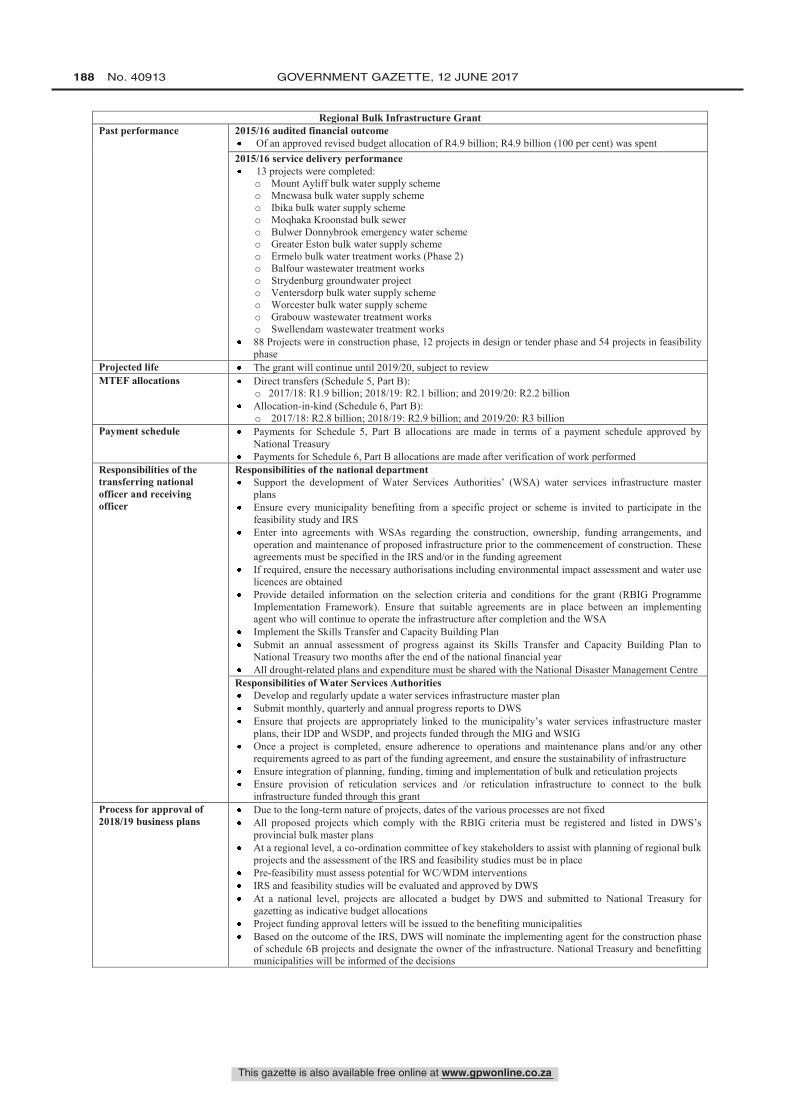
This gazette is also available free online at www.gpwonline.co.za
188 No. 40913 GOVERNMENT GAZETTE, 12 JUNE 2017
Regional Bulk Infrastructure Grant Past performance 2015/16 audited financial outcome
Of an approved revised budget allocation of R4.9 billion; R4.9 billion (100 per cent) was spent 2015/16 service delivery performance
13 projects were completed: o Mount Ayliff bulk water supply scheme o Mncwasa bulk water supply scheme o Ibika bulk water supply scheme o Moqhaka Kroonstad bulk sewer o Bulwer Donnybrook emergency water scheme o Greater Eston bulk water supply scheme o Ermelo bulk water treatment works (Phase 2) o Balfour wastewater treatment works o Strydenburg groundwater project o Ventersdorp bulk water supply scheme o Worcester bulk water supply scheme o Grabouw wastewater treatment works o Swellendam wastewater treatment works
88 Projects were in construction phase, 12 projects in design or tender phase and 54 projects in feasibility phase
Projected life The grant will continue until 2019/20, subject to review MTEF allocations Direct transfers (Schedule 5, Part B):
o 2017/18: R1.9 billion; 2018/19: R2.1 billion; and 2019/20: R2.2 billion Allocation-in-kind (Schedule 6, Part B):
o 2017/18: R2.8 billion; 2018/19: R2.9 billion; and 2019/20: R3 billion Payment schedule Payments for Schedule 5, Part B allocations are made in terms of a payment schedule approved by
National Treasury Payments for Schedule 6, Part B allocations are made after verification of work performed
Responsibilities of the transferring national officer and receiving officer
Responsibilities of the national department Support the development of Water Services Authorities’ (WSA) water services infrastructure master
plans Ensure every municipality benefiting from a specific project or scheme is invited to participate in the
feasibility study and IRS Enter into agreements with WSAs regarding the construction, ownership, funding arrangements, and
operation and maintenance of proposed infrastructure prior to the commencement of construction. These agreements must be specified in the IRS and/or in the funding agreement
If required, ensure the necessary authorisations including environmental impact assessment and water use licences are obtained
Provide detailed information on the selection criteria and conditions for the grant (RBIG Programme Implementation Framework). Ensure that suitable agreements are in place between an implementing agent who will continue to operate the infrastructure after completion and the WSA
Implement the Skills Transfer and Capacity Building Plan Submit an annual assessment of progress against its Skills Transfer and Capacity Building Plan to
National Treasury two months after the end of the national financial year All drought-related plans and expenditure must be shared with the National Disaster Management Centre
Responsibilities of Water Services Authorities Develop and regularly update a water services infrastructure master plan Submit monthly, quarterly and annual progress reports to DWS Ensure that projects are appropriately linked to the municipality’s water services infrastructure master
plans, their IDP and WSDP, and projects funded through the MIG and WSIG Once a project is completed, ensure adherence to operations and maintenance plans and/or any other
requirements agreed to as part of the funding agreement, and ensure the sustainability of infrastructure Ensure integration of planning, funding, timing and implementation of bulk and reticulation projects Ensure provision of reticulation services and /or reticulation infrastructure to connect to the bulk
infrastructure funded through this grant Process for approval of 2018/19 business plans
Due to the long-term nature of projects, dates of the various processes are not fixed All proposed projects which comply with the RBIG criteria must be registered and listed in DWS’s
provincial bulk master plans At a regional level, a co-ordination committee of key stakeholders to assist with planning of regional bulk
projects and the assessment of the IRS and feasibility studies must be in place Pre-feasibility must assess potential for WC/WDM interventions IRS and feasibility studies will be evaluated and approved by DWS At a national level, projects are allocated a budget by DWS and submitted to National Treasury for
gazetting as indicative budget allocations Project funding approval letters will be issued to the benefiting municipalities Based on the outcome of the IRS, DWS will nominate the implementing agent for the construction phase
of schedule 6B projects and designate the owner of the infrastructure. National Treasury and benefitting municipalities will be informed of the decisions

This gazette is also available free online at www.gpwonline.co.za
STAATSKOERANT, 12 JUNIE 2017 No. 40913 189
Water Services Infrastructure Grant Transferring department Water and Sanitation (Vote 36) Grant schedule Schedule 5, Part B and Schedule 6, Part B Strategic goal To assist Water Services Authorities (WSAs) to reduce water and sanitation backlogs and sustain water
and sanitation infrastructure Grant purpose Facilitate the planning and implementation of various water and sanitation projects to accelerate backlog
reduction and improve the sustainability of services in prioritised district municipalities, especially in rural municipalities
Provide interim, intermediate water and sanitation supply that ensures provision of services to identified and prioritised communities, including through spring protection, drilling, testing and equipping of boreholes
Provide on-site sanitation solutions Support the existing bucket eradication programme intervention in formal residential areas Support drought relief projects in affected municipalities
Outcome statements An increased number of households with access to reliable, safe drinking water and sanitation services Outputs Number of households provided with water and sanitation through:
o reticulated water supply o on-site sanitation o bucket systems replaced with appropriate sanitation facilities o on-site water o source identification o water conservation/water demand management provision
Number of households reached by health and hygiene awareness and end-user education Number of job opportunities created
Priority outcome(s) of government that this grant primarily contributes to
Outcome 7: Comprehensive rural development and land reform Outcome 8: Sustainable human settlements and improved quality of household life Outcome 9: Responsive, accountable, effective and efficient developmental local government system
Details contained in the business plan
Outcome indicators Output indicators Inputs Key activities Roles and responsibilities
Conditions
All projects funded must be aligned to, and not duplicate, any existing or planned projects funded by other conditional grants or municipalities’ own funds
Municipalities must demonstrate in their business plans how they plan to fund and manage the infrastructure over the long term
Schedule 5, Part B allocations Municipalities must submit business plans signed off by their accounting officer in line with their Water
Services Development Plans (WSDPs) The Department of Water and Sanitation (DWS) must approve the business plans before projects can be
implemented WSAs may only spend funds in line with approved business plans WSAs must submit monthly financial and quarterly non-financial reports to DWS All projects funded must be aligned to, and not duplicate, any existing or planned projects funded by other
conditional grants or municipal own funds Funds must be reflected in the capital budget of the municipality Grant funds may not be spent on operations and routine maintenance The Project Management Unit funded through the Municipal Infrastructure Grant should be utilised to
manage the implementation of projects funded through this grant Funds may only be used for drought relief interventions based on a plan approved by DWS
Schedule 6, Part B allocations Municipalities must submit business plans signed-off by their accounting officer in line with their WSDP.
In the case of Bucket Eradication Programme projects, a Service Level Agreement (SLA) will guide implementation
DWS must approve the business plans before projects can be implemented DWS must enter into a SLA with the relevant municipality before any project is implemented SLAs between DWS and the WSA must specify: o the location of the project and communities impacted o the consultation process that was undertaken with affected communities
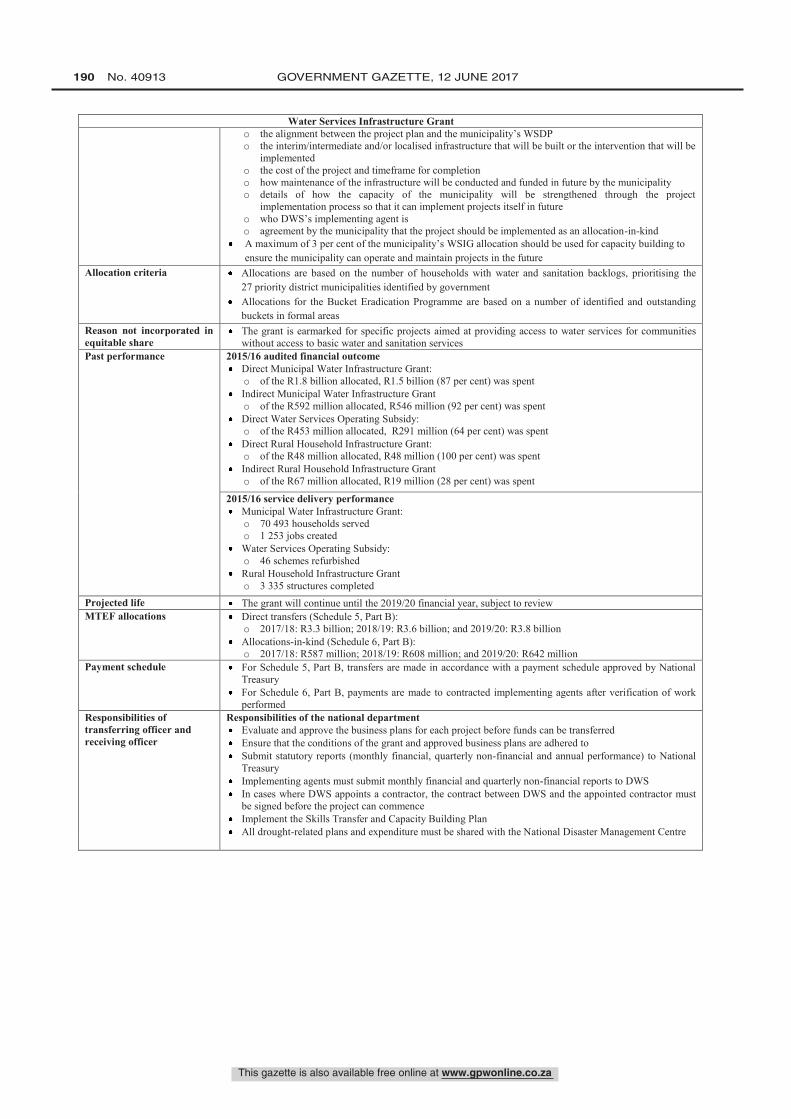
This gazette is also available free online at www.gpwonline.co.za
190 No. 40913 GOVERNMENT GAZETTE, 12 JUNE 2017
Water Services Infrastructure Grant o the alignment between the project plan and the municipality’s WSDP o the interim/intermediate and/or localised infrastructure that will be built or the intervention that will be
implemented o the cost of the project and timeframe for completion o how maintenance of the infrastructure will be conducted and funded in future by the municipality o details of how the capacity of the municipality will be strengthened through the project
implementation process so that it can implement projects itself in future o who DWS’s implementing agent is o agreement by the municipality that the project should be implemented as an allocation-in-kind
A maximum of 3 per cent of the municipality’s WSIG allocation should be used for capacity building to ensure the municipality can operate and maintain projects in the future
Allocation criteria Allocations are based on the number of households with water and sanitation backlogs, prioritising the 27 priority district municipalities identified by government
Allocations for the Bucket Eradication Programme are based on a number of identified and outstanding buckets in formal areas
Reason not incorporated in equitable share
The grant is earmarked for specific projects aimed at providing access to water services for communities without access to basic water and sanitation services
Past performance 2015/16 audited financial outcome Direct Municipal Water Infrastructure Grant: o of the R1.8 billion allocated, R1.5 billion (87 per cent) was spent
Indirect Municipal Water Infrastructure Grant o of the R592 million allocated, R546 million (92 per cent) was spent
Direct Water Services Operating Subsidy: o of the R453 million allocated, R291 million (64 per cent) was spent
Direct Rural Household Infrastructure Grant: o of the R48 million allocated, R48 million (100 per cent) was spent
Indirect Rural Household Infrastructure Grant o of the R67 million allocated, R19 million (28 per cent) was spent
2015/16 service delivery performance Municipal Water Infrastructure Grant: o 70 493 households served o 1 253 jobs created
Water Services Operating Subsidy: o 46 schemes refurbished
Rural Household Infrastructure Grant o 3 335 structures completed
Projected life The grant will continue until the 2019/20 financial year, subject to review MTEF allocations Direct transfers (Schedule 5, Part B):
o 2017/18: R3.3 billion; 2018/19: R3.6 billion; and 2019/20: R3.8 billion Allocations-in-kind (Schedule 6, Part B): o 2017/18: R587 million; 2018/19: R608 million; and 2019/20: R642 million
Payment schedule For Schedule 5, Part B, transfers are made in accordance with a payment schedule approved by National Treasury
For Schedule 6, Part B, payments are made to contracted implementing agents after verification of work performed
Responsibilities of transferring officer and receiving officer
Responsibilities of the national department Evaluate and approve the business plans for each project before funds can be transferred Ensure that the conditions of the grant and approved business plans are adhered to Submit statutory reports (monthly financial, quarterly non-financial and annual performance) to National
Treasury Implementing agents must submit monthly financial and quarterly non-financial reports to DWS In cases where DWS appoints a contractor, the contract between DWS and the appointed contractor must
be signed before the project can commence Implement the Skills Transfer and Capacity Building Plan All drought-related plans and expenditure must be shared with the National Disaster Management Centre

This gazette is also available free online at www.gpwonline.co.za
STAATSKOERANT, 12 JUNIE 2017 No. 40913 191
Water Services Infrastructure Grant Responsibilities of water services authorities
Compile and submit signed-off business plans for each project (for the relevant financial year) Sustainably operate and maintain funded water and sanitation projects over their lifetime Ensure integrated planning for all projects funded through the different grants and programmes Review and sign-off on the technical report for each project Ensure adequate participation and involvement of the public in each project, particularly in rural areas Manage project implementation in line with the business plan Submit monthly, quarterly and annual progress reports in the format prescribed by DWS Comply with all the funding conditions agreed to in the business plan
Process for approval of 2018/19 business plans
Business plans must be submitted to DWS by 15 November 2017 Business plans must be approved by DWS by 28 February 2018

This gazette is also available free online at www.gpwonline.co.za
Printed by and obtainable from the Government Printer, Bosman Street, Private Bag X85, Pretoria, 0001Contact Centre Tel: 012-748 6200. eMail: [email protected]
Publications: Tel: (012) 748 6053, 748 6061, 748 6065
192 No. 40913 GOVERNMENT GAZETTE, 12 JUNE 2017