A multi-disciplinary perspective on the built environment ...
Upload
khangminh22Category
view
5download
0
70
1. Introduction Mosque is an important religious structure that symbolizes the Islamic faith as well as to serve the multi needs of Islamic community. In relation to this mosque built form involving its design morphology including its articulation of form and style had undergone many phases of changes since the emergence of Islam in Malaysia till present (Abd. Halim N 2004; Ken Yeang 1992; David M. 1998; Abd Ghafar 1999; Tajuddin 2007; Ismail, A.S., 2008 ; Megat et.al., 2014). Since mosque is utilized for multi- purpose function like as the center of Muslim community, a place for prayer, meditation, religious instruction, political discussion, places of learning, teaching as well as for conducting da’wah, it is widely constructed throughout the country. Nevertheless, according to many scholars mosque in Malaysia namely function as center of da’wah to actively encourage fellow Muslims in the pursuance of learning and practice Islam in mosque. To understand why and how mosque is utilized as center for da’wah in Malaysia, it is beneficial to firstly understand the meaning and importance of da’wah in Islam in the next section.
1.1 The importance of da’wah in Islam The term da’wah in Islam derives from the Arabic word da’a, yad’u, da’watun, da’wan dan du’aan meaning to invite and to propagate (Shaharuddin, 2006). Al-Quran however define the purpose of da’wah in Islam are for two reasons which are the worship of Allah S.W.T and an invitation towards Islam (Racius, 2009). Since the term da’wah had often been mentioned 211 times in Al-Quran it clearly indicates the important role of da’wah for every Muslim to practice in achieving the right path in life (Nurhidayat, 2012). In this sense, da’wah is an important act as part of worshipping Allah S.W.T as well as to directly invite or to show the good behavior and character of Islam as had been outline in Quran and Sunnah (Abdurrahman, 2010; Said, 2012). In other words, da’wah is an important form of communication tool to convey message of Islam to society. According to scholar, da’wah can be conducted using informal or formal kind of approach through various medium such as ritual, event, displays and artistic representation like architectural built form (Ismail, 2008). Hence for the benefit of this study, the focus of da’wah is through mosque architectural form as a medium to convey the message of Islam to the
INTERNATIONAL JOURNAL OF BUILT ENVIRONMENT AND SUSTAINABILITY Published by Faculty of Built Environment, Universiti Teknologi Malaysia
Website: http://www.ijbes.utm.my
IJBES 3(2)/2016, 70-78
Architectural Style of Da’wah Mosque in Malaysia: from Vernacular to Modern Structures Nurul ‘Athiqah Binti Baharudin Faculty of Built Environment, Universiti Teknologi Malaysia, Skudai 81310, Johor Bahru Email: [email protected] Alice Sabrina Ismail Department of Architecture, Faculty of Built Environment, Universiti Teknologi Malaysia, Skudai, 81310, Johor Bahru Email: [email protected]
ABSTRACT The main purpose of this paper is to document the development phases of da’wah mosque architectural style in Malaysia from pre to post-independence era. Throughout Islamic history in many Muslim and non-Muslim countries, mosque not only function as a place to perform prayers but also serves as multifunctional space to conduct various activities involving individual and communal needs like da’wah. Similar scenario also occurs in the context of Malaysia’s mosque development in which the mosque act as a sign to convey message of Islam and as symbol of da’wah. These da’wah mosque architectural style however undergo various changes due to many influencing factors like the role of mosque patron, continuous transformation of designer tastes as well as social, economic and political influence. Nonetheless, the most empowering influence is from the role of patron or client whom has the major tendency to shape the da’wah mosque based on their individual ideology that they hold onto. To analyze the mosque design and its evolution in Malaysia, interpretivism as research paradigm will be adopted. This is vital to establish set of practices in order to sort out the role and function of da’wah mosque throughout the Malaysian history. Hermeneutic on the other hand will be used as methodological approach to extract the meaning of the da’wah mosque as a ‘sign’ as well as to understand the documentation relating to the da’wah mosque as subject of research. The findings then will be analyzed using coding method. This paper, therefore, offers clear knowledge on the da’wah mosque study by widening and strengthening the understanding of Islamic architecture in Malaysia.
History:
Received: 20 December 2015 Accepted: 19 February 2016 Available Online: 30 May 2016 Keywords:
Mosque, da’wah, style, influence Corresponding Author Contact: +60137972196 DOI:
10.11113/ijbes.v3.n2.122

71
masses. This is because, architecture is a kind of social product or ‘sign’ which is well known by many scholars as a medium of communication that able to convey messages involving the social, political and cultural ideology, as well as one’s religious belief through the design elements of built form and space (Moustafa, 1988; Gottdiener, 2003; Gawlikowska , 2013). Since this paper focuses on mosque as a place for da’wah next section will elucidate this matter in depth followed by the historical documentation on mosque development as da’wah center in Malaysia during pre and post-independence era including factors of design influence as well as the representation of architectural style and design form. 1.2 The role and function of mosque as a ‘sign’ and place for
da’wah Mosque as architectural built form potentially acts as a symbol which can communicates with its surroundings and users. Study on mosque as form of ‘sign’ to symbolize Islamic faith and as message of da’wah had been widely conducted by many past scholars (Ardalan, 1980; Joseph, 1981; Grabar, 1983; Cook, 1985; Moustafa, 1988; Koehler, 2002; Goodarzi , 2014; Ismail, 2008; Creswell, 1960; Burckhardt, 1976; Holod & Khan, 1997; Abdul Halim, 2004). According to these scholars, each element of the mosque like the minarets, dome, minbar (the direction of Mecca), mihrab, Sahn, Sakka, the wudu', and the use of geometric elements can act as a code when translated and provide message of Islam to society in various ways. This is because mosque provides specific dual message for the benefit of society (Moustafa, 1988). Firstly, it may portray current values and identity of Islam and Muslims status in society. Secondly, may become a symbol of Islamic faith and religion. In other words, mosque may become a sign of Islamic iconography and theology (Cook, 1985; Tajuddin, 2008; Longhurst, 2012; Murray, 2014). In this regard, mosque is commonly utilized as a place or center for da’wah and this prevails since the days of the prophet Muhamad till present context. The concept of da’wah was firstly introduce by the prophet Muhamad whom spread the message of Islam in his house which later becomes a mosque or known as the prophet mosque to conduct the da’wah activity. The functional existence of this prophet mosque then becomes a model to all mosque throughout the centuries till the present context to apply the same concept (Longhurst, 2012). In relation to this, the element of mosque are designed in various style and form of representation to symbolically convey the message of Islam and as landmark to its follower (Ismail, A.S., 2010). Such example, is seen from the placement of the qiblat wall which symbolizes the concept of tawhid or means to make or to conceive as or hold to be one towards Allah. Hence, it is an obligatory for all mosque design to be located facing to the Qaabah in Mecca. By performing prayer to the only one direction it promotes the feel of brotherhood among all Muslims. As supported by Spahic (2012) ‘Islam with its unique ‘tawhidic’ (the unity of God) worldview champions - that Muslims are brothers to each other and their similitude is like a wall whose bricks enforce and rely on each other. They are like a solid cemented structure held together in unity and strength, each part contributing strength in its own way, and the whole held together not like a mass, but like a living organism.’ Similar situation also occurs in the Malaysian context in which the values of da’wah are embedded in mosque design to symbolically teach Muslims on the importance of Islamic religion. To understand this matter, the next section will explain the methodology used to analyze the da’wah mosque as case study followed by the discussion on the findings. The findings will describe in depth the evolution of mosque in Malaysia as
symbol of da’wah in which the mosque design built form convey the message of Islamic faith to the locals from past till present context.
2. Methodology
In conducting this study, interpretivism as research paradigm is adopted since this study requires hermeneutic method to analyze the architecture of da’wah mosque to reveal the possible factors that influence its design form and space. Hermeneutic is chosen because it holds beliefs that view of reality can account for all the phenomena of life. This approach is vital as it will provide a deeper understanding of the study. Hermeneutic is the theory of text interpretation that includes written, verbal, and nonverbal communication. The meaning of text in this context refers to material built form. To analyze the factors that influence the design of material built form, hermeneutics is used to reveal the meaning embedded in the mosque built form in Malaysia as well as written documentation like historical and archival text that relates to the mosque background. Nonetheless, for this study, philosophical hermeneutics phenomenology which refers primarily to the theory of knowledge initiated by Heidegger is adapted (Sebastian & Cecez, 2010). This is because Heidegger Hermeneutic circle theory proposed that to understand the meaning of the text in depth the researcher must involve and see for oneself to reveal the hidden meaning in detail. In this sense, interpretation of knowledge from written text is conducted in a cyclic manner which involves a series of phases (McAuley, 2006). Firstly, from basic naïve understanding on the subject matter from textual reading is done. Then move on to the second phase of understanding which is coding the process and finally subdivide the subject matter into themes also sub-themes before re-summarizing it in a holistic manner. This theory is beneficial for this study because it will help the researcher to understand the ideology and the intention of the patron and contextual factors like social and political culture during the design process of the mosque as documented in design reports as well as reveal the final design of the mosque (Ismail, 2008). Findings from this textual documentation will reveal the hidden reason behind the mosque design in portraying the message of Islam through the principles of da’wah. To achieve this, the paper utilized multiple case study as research strategy to gain information for the study (Yin, 2003). The multiple mosques as case studies were chosen based on prominent eras as segregated by changing regimes and political climate in Malaysia dating back from the 15th century till present era. In order to find out the influence of da’wah movement and the design of mosque in Malaysia, the mosque development will be divided into era before independence and after independence. These case studies are analyzed based on the indicators that could determine the architectural style and its influence. To conduct the data collection method, direct observation and documentation referencing will be adopted. To analyze the gathered information, the data will be analyzed using the open coding technique which involves the open reading of the documents. This is important to understand and identify the general ideas, thoughts and meanings contained within the documents.The second step involves the axial coding process, where detailed line-by-line analysis for each paragraph of the document is conducted. Through this process, questions are asked about the phenomena as reflected in the data. This process is vital because it will help to generate a variety of concepts and sub-concepts in terms of their properties (characteristics or attributes of a concept) and dimensions (location of a property along a continuum or range). This process is

72
done by breaking down the data into separate parts, examining and comparing for similarities and differences and the findings then are gathered according to the different eras of development. Using the above methods, the finding of the mosque as centre of da’wah in Malaysia will be discussed in the following section according to different phases of evolution.
3. Results and Discussion The emergence of Islam in Malaysia begins as early as in the 12th century introduced by traders arriving from Arabia, China and India (Van Luer, 1955; Fatimi, 1983). The religion was then adopted peacefully by the coastal trading ports people of Malaysia, absorbing rather than conquering existing beliefs. By the 15th and 16th centuries Islam becomes the majority faith of the Malay people. The Islamic faith was then later uphold in the Malaysian constitution in which it becomes the "religion of the Federation" to symbolize its importance to Malaysian society during the post-independence period. The Islamic religion hence becomes well ingrained in the Malay life and that Islamic rituals are also practiced as Malay culture. Muslim and Malays are also interchangeable in many daily contexts. In conjunction with the spread of Islamic belief in the country, mosques were also constructed as a place for prayer, meditation, religious instruction, political discussion, and a school. And anywhere Islam took hold in the country, mosques were established, and basic religious and educational instruction began. Once established, mosques in Malaysia were developed into well-known places of learning, teaching and for conducting da’wah. 3.1 Mosque development during the pre and post-independence
era as symbol and center for da’wah Mosque development in Malaysia during the pre-independence era can be divided into two main phases which are during the Malacca Sultanate era, followed by the period of colonialization involving the Portuguese, the Dutch and the British. The development of da’wah mosque then evolve further during the post-independence era. Holistically all of these eras showcases the evolution of the mosque as da’wah and religious learning center serving the needs of the local community. 3.2 Era of the Malay sultanate, Portuguese and Dutch
subjugation (12th to 17th century) According to scholars, the wide spread of Islamic faith in the Malay Peninsula occurred due to the role of the Malay aristocrats whom converted to Islam and then promote the Islamic religion to the masses. It was well accepted by many historian that Sultan Mudzafar Shah I (12th century) of Kedah (Hindu name Phra Ong Mahawangsa), was the first ruler to be known to convert to Islam after being introduced to it by Indian traders who themselves were recent converts. Nevertheless, many historians agreed that Islam became widespread in the region due to the conversion of Parameswara to Islamic faith after marrying a princess from Pasai, of present-day Indonesia (Abd Aziz, 2007). This Hindu prince whom is the first Sultan of Melaka had established the Sultanate of Melaka in the 15th century CE. During its heyday in the 15th century CE, Melaka became a renowned hub of Islamic studies. Islam continued to flourish in the peninsula during the 15th and the 16th century CE, which greatly influenced the Malay lifestyle and culture as can be seen until today. Nevertheless, the earliest evidence of the arrival of Islam in Malaysia was discovered in Terengganu, in the form of an ancient inscribed stone locally referred to as ‘Batu Bersurat’. Dated 1303 CE, the stone tablet with Jawi (Romanised Arabic) script on it stands as proof that Islam had arrived in the east coast region of the
peninsula long before Parameswara embraced Islam (Abd Halim, 2004). During the reign of Malay sultanates, mosques were built mainly in the vicinity of the palaces to teach Islam to the populace and at times too, the sultanate palaces become center of Islamic teaching and learning (Taib & A. Aziz , 2000; Syaimak et al., 2014). Apart from this, there are also mosques built within the communal settings. Mosques built in the early days were modest in scale without dominant aesthetic character (Surat et. al., 2011; Shukri et. al., 2014). During the early arrival of Islam in Malaysia, the mosque architecture within the community context are simple, does not have a clear features as what can be seen in the mosques of Middle Eastern. Many mosques of the traditional architectural style were built to hold prayers and other activities associated with the teachings and dissemination of Islam. This include conducting da’wah activities to preach Islam to the populace. The architectural style and building materials of the mosques built during the 12th to 17th centuries were similar to that of the traditional Malay houses. According to Ahmad (1999), there are two types of architectural styles under the vernacular mosques category, namely the traditional and regional influences, differentiate by the design of the roof. The traditional mosques usually reflect the strong influences of the Malay houses, way of life and environment. The roof generally a long shape gable roof. Conversely seen in vernacular mosques with regional influence which can be distinguished by their two or three-tiered roofs with decorative roof ridges and clay tiles. The regional influence mosques in Malaysia are similar with the old mosques built in many parts of Indonesia. The architectural style of traditional mosque reflects most to the environment which can be seen through the building construction (Ahmad, 1999). Some of building features which were built in response to the warm and humid climatic conditions are pitched roofs to enable rain water to run off quickly and many openings including louvered windows, fanlights and carving panels to allow natural cross ventilation of air. Another design features is built on stilts to raise the mosques above ground level to avoid floods and consequently a purpose for ventilation comfort and safety precaution are in response to the environment (Nasir and Tea, 1997; Rasdi, 2004). Although there are many mosques built during the 12th to 17th century, nevertheless there is little prominent mosque structures standing due to natural dilapidation as well as torn down during the Portuguese and Dutch occupation to be replaced by stone walled church and fortresses. This is because the basic politics brought by the Portuguese and Dutch restrict other religions except Christian to be
Figure 1: Kampung Laut Mosque (Source: Nakula, 1985)

73
openly professed (Pintado, 1976). Thus, there is no evidence of additional mosques being built during the Portuguese and Dutch occupation, as they seemed to be hostile towards the Muslims and Malay inhabitants. However, the arrival of the migration of foreign traders and merchants to Malacca under the Dutch rule also changed the local architectural scene in the Peninsula during this period. The Dutch also imported vast numbers of Chinese workers to Malacca from Batavia (now known as Jakarta) through the Dutch East India Company in Indonesia (Hoyt, 1996). The conversion of these rich merchants and immigrant workers to Islam sponsored the building of mosques located in rural Muslim communities. The Chinese and Indian Muslims patron introduced their native crafts skills to the dominant architectural features of the mosques (Kohl, 1984). However, many historians agreed that the most prominent mosque that can be associated as the famous center of Islamic teaching and proselytization or da’wah in the Malay Archipelago is the Kampung Laut mosque built in the 16th century (Figure 1). According to Tajuddin (1999), there are three theories relating to the origin and function of this mosque. The first theory associated to Raja Iman whose intention was to build a mosque in form of ‘wakaf’ as a center to teach locals about Islam. The second theory however was owed to the Islamic missionaries from Champa whom intended to establish a renowned Muslim center within the Malay Archipelago. The third theory related to the contribution of the two Wali Songo whom is Sunang Bonang and Sunan Giri whom build the mosque under the instruction of Sheikh Mohamad Saman to have a center for Islamic teaching focusing under the subject of Sufism. In brief, it is understood that, Kampung Laut mosque can be claimed as a center of learning and teaching Islam as well as a place for conducting da’wah. The masjid Kampung Laut also may know as a sign to convey message of Islam to user through its design elements or in other words act as form of da’wah. For instance, the built form of masjid Kampung Laut is distinguished by several layers of pyramidal arrangement for its roof design, and it is understood that in some areas in Indonesia called the roof design as ‘joglo roof” as reflects to its original roof design from traditional Javanese house (Nasir, 1995; Budi, 2004). The roof arranged by stacking one above the other and an ornamental features are installed on top of it, which called ‘mahkota atap’ (Nasir, 1995). According to scholars such design of tiered roof form in different levels are not constructed arbitrarily, but have the philosophy of science and spirituality of Islam in itself. The first roof level is denoted by the first law of worship known as ‘syariat’ which symbolizes the need of performing prayer whilst the second, third and fourth level of worship known as the ‘hakikat’, ‘tarikat’ and ‘marifat’ is distinguished by the upper tiered roof as a sign of one’s level of worship in achieving divinity (Nakula, 1985). In brief, mosque in the early days functioned and portrayed the values of da’wah in which it is well embedded in mosque design to symbolically teach Muslims on the importance of Islamic religion. 3.3 Era of the British Colonialization (18th to 19th century) The first British colony was established in the Malay Peninsula after the lease of Penang Island by the Sultan of Kedah to the British East India Company in 1786. Following the Anglo-Dutch Treaty in 1824, the British not only took control of Malacca but also helped to divide the Malay Archipelago between the British and the Dutch. Malaya, however, was designated as colonial territory (Ismail, A.S., 2008; 2010). In 1826, the British formally established the crown colony of the Straits Settlements which were comprised of Penang Island, Malacca
and Singapore (Andaya, 2001). The Straits Settlements were placed under the control of the East India Company in Calcutta, however, by 1867, the seat of administration transferred to the Colonial Office in London. The British influence and intervention over the Malay states began to accelerate further after the signing of Pangkor Treaty in 1874. By the turn of the 20th century, the colonial administrative apparatus was quickly established in the states of Pahang, Selangor, Perak, and Negeri Sembilan, to form a Federated Malay state. British residents were appointed to advise the Malay rulers in these states. For the unfederated states like Johore, Kedah, Perlis, Kelantan and Terengganu the acceptance of British advisors came at a much later period. Even though the colonials showed different period of influence in various Malay states, in the long run the outcomes of their administration were much similar and consistent (Andaya, 2001). The colonial phase presented a gradual transformation in the local scene and traditional Malay society from the aspect of social culture, politics and religious institutions (Parkinson, 1960). These significant changes were brought upon by an increased contact with foreign cultures made possible by Muslims from other lands like the Middle East and India, and due to the intensive indoctrination of colonial ideology and administrative policy (Yegar, 1979).
Figure 2: Sultan Abu Bakar mosque (Source: Ismail, 2008)
Figure 3: Jamek Muar Mosque (Source: Ismail, 2008)

74
On this account, mosques were widely constructed throughout the country not only by the colonials but also by influential individuals in society and private da’wah groups (Ahmad 1999; Nasir, 1984). The British at first took little interest in the affairs of the Malay states and no development or construction of buildings took place. However, towards the close of the 20th century when tin mining and rubber became the main exports of the country they began to show their commitments and characterized their authority and power by constructing infrastructures and buildings. With increasing wealth at hand, the British were able to get rid of the timber buildings, as replacements, materials such as bricks, stone, cast iron and steel became the common choice in design and construction techniques (Raalah 2002; Ismail, 2010), see for examples Figures 2 and 3. Thus, the royal mosque built by the colonials portrayed a new architectural vocabulary and distinctive aesthetics. It is architecturally different from the traditional mosques in terms of scale and proportion, form, features and building materials. According to Omer (2000:197), “the British for geo-political reasons helped building mosques that looked monumental and more like palaces than places of worship, to keep up with their reputation as colonial masters but also for the satisfaction of a local sultan”. As a result, it makes the role of the mosque as an object to portray Islam as a symbol which separated from the true Islamic way of life (M. Tajuddin R., 2005). The primary architectural features of these mosques are focused on the external façade in which many mosque built by the British using imported architecture style like the mainly reflects the Western design assimilated with regional taste designed by the British architects and engineers who were mostly transferred from outside to Malaya Public Works Department (Ismail, 2010). Such example are North Indian, European classical and European art deco architecture style. The British introduced many new building materials and technology usage like bricks, iron and cast iron (Raalah, 2002). The architecture showed the use of many decorative features, poles 'capital', 'key arches' and 'pediment' (Black Mizan & Talib Maher 2005). The plan of the mosque is also symmetrical in rectangular or square shape (Black Mizan & Talib Maher 2005). During this era function of mosque as place for da’wah or preaching and disseminating the Islamic knowledge lessened as many royal mosque were constructed in strategic, central locations within the proximity of royal palaces and even named after the respective sultans by the colonials (Ahmad, 1999).
On this account, mosques were widely constructed throughout the country not only by the colonials but also by influential individuals in society and private da’wah groups using available capacity (Ahmad 1999; Nasir 1984). Nevertheless, the individual funded mosques are very basic in shape using wood and concrete (Ismail, A.S., 2008). These type of mosque are located in rural areas to cater for locals and villagers. The type of mosque they produced typically portrayed the traditional typology outlook and is smaller in scale compared to the royal mosque (Rahman, 1998). It is vernacular in design using natural existing material. The planning of mosque is functional which emphasis on maximizing the praying area with separate wudhu’ for hygiene purposes. The mosque also has large verandah area surrounding the main prayer hall to hold any extended activities. An example is the Paloh Mosque in Ipoh (Figure 4) which was patronized by ‘orang besar Perak‘ – Datuk Seri Adika, Muhammad bin Mohd Taib and Tuan Haji Kasim Banjar in 1912 (Rahman 1998; Ismail, A.S., 2010). The surge of wealthy Indian and Chinese Muslim traders along with the mass migration of laborers and coolies from China and southern India brought in by the British also introduced their architectural and cultural identity into the local scene. Hence, in order to exhibit their position and to gain recognition among the local inhabitants these Chinese and Indian–Muslims also constructed mosques during this period (Ismail, 2010). For instance, the Indian Muslims constructed a mosque in Muslim settlements made of brick resembling the Northern Indian design style (Figure 5). Therefore, this kind of mosque design was widespread throughout the country in major cities like Penang, Taiping and Kuala Lumpur. An example is the Indian Mosque located in Kuala Lumpur (Yeang 1992; Ismail, 2010). The mosque built by influential locals and migrated patrons however differ from the royal mosque in which most of the mosques actively become center of Islamic teaching and learning as well as a place for the propagation of Islamic faith or da’wah due to its strategic location and placement within the proximity of the local communal residential areas (Ismail, 2010). 3.4 Era of post-independence period (1957-till present) After achieving independence from the British on the 31st of August 1957, the new government under Tunku Abdul Rahman wasted no time in planning to develop and promote Malaysia as a newly independent country. To achieve this, local architects were asked to design public Figure 4: Paloh Mosque (Source: Abdul Halim Nasir, 2004)
Figure 5: India Mosque, Kuala Lumpur. (Source: Rahman, 1998)
75
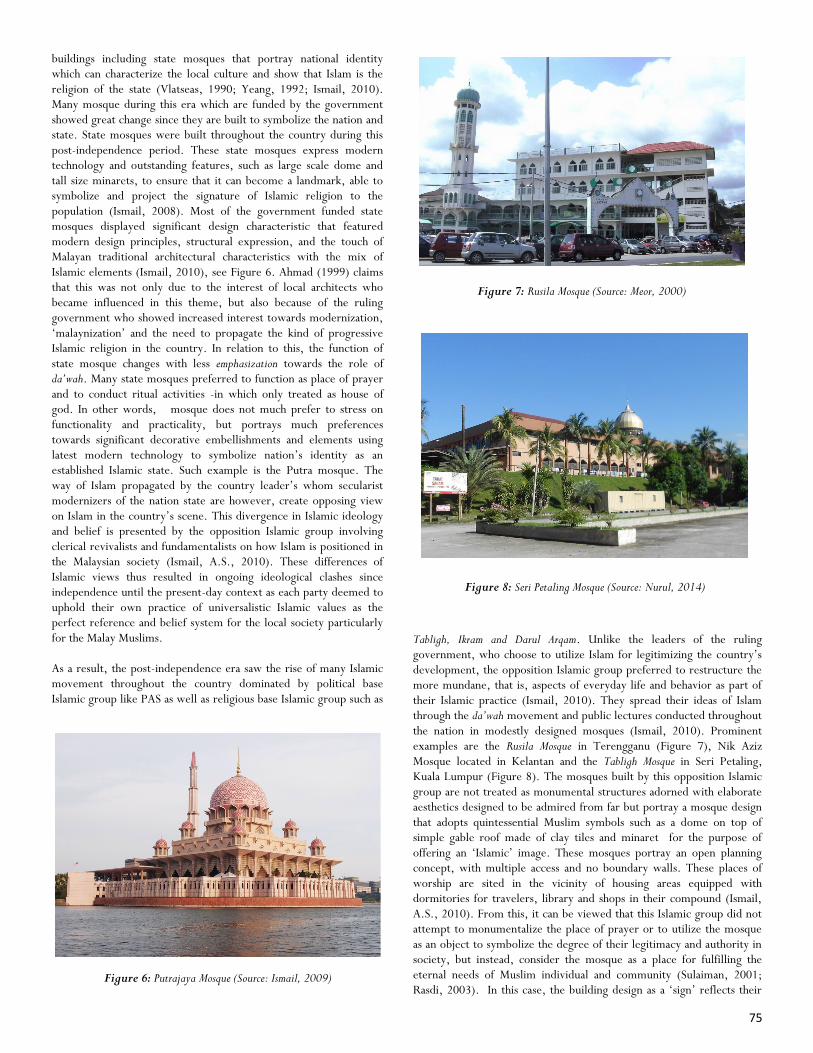
buildings including state mosques that portray national identity which can characterize the local culture and show that Islam is the religion of the state (Vlatseas, 1990; Yeang, 1992; Ismail, 2010). Many mosque during this era which are funded by the government showed great change since they are built to symbolize the nation and state. State mosques were built throughout the country during this post-independence period. These state mosques express modern technology and outstanding features, such as large scale dome and tall size minarets, to ensure that it can become a landmark, able to symbolize and project the signature of Islamic religion to the population (Ismail, 2008). Most of the government funded state mosques displayed significant design characteristic that featured modern design principles, structural expression, and the touch of Malayan traditional architectural characteristics with the mix of Islamic elements (Ismail, 2010), see Figure 6. Ahmad (1999) claims that this was not only due to the interest of local architects who became influenced in this theme, but also because of the ruling government who showed increased interest towards modernization, ‘malaynization’ and the need to propagate the kind of progressive Islamic religion in the country. In relation to this, the function of state mosque changes with less emphasization towards the role of da’wah. Many state mosques preferred to function as place of prayer and to conduct ritual activities -in which only treated as house of god. In other words, mosque does not much prefer to stress on functionality and practicality, but portrays much preferences towards significant decorative embellishments and elements using latest modern technology to symbolize nation’s identity as an established Islamic state. Such example is the Putra mosque. The way of Islam propagated by the country leader’s whom secularist modernizers of the nation state are however, create opposing view on Islam in the country’s scene. This divergence in Islamic ideology and belief is presented by the opposition Islamic group involving clerical revivalists and fundamentalists on how Islam is positioned in the Malaysian society (Ismail, A.S., 2010). These differences of Islamic views thus resulted in ongoing ideological clashes since independence until the present-day context as each party deemed to uphold their own practice of universalistic Islamic values as the perfect reference and belief system for the local society particularly for the Malay Muslims. As a result, the post-independence era saw the rise of many Islamic movement throughout the country dominated by political base Islamic group like PAS as well as religious base Islamic group such as
Tabligh, Ikram and Darul Arqam. Unlike the leaders of the ruling government, who choose to utilize Islam for legitimizing the country’s development, the opposition Islamic group preferred to restructure the more mundane, that is, aspects of everyday life and behavior as part of their Islamic practice (Ismail, 2010). They spread their ideas of Islam through the da’wah movement and public lectures conducted throughout the nation in modestly designed mosques (Ismail, 2010). Prominent examples are the Rusila Mosque in Terengganu (Figure 7), Nik Aziz Mosque located in Kelantan and the Tabligh Mosque in Seri Petaling, Kuala Lumpur (Figure 8). The mosques built by this opposition Islamic group are not treated as monumental structures adorned with elaborate aesthetics designed to be admired from far but portray a mosque design that adopts quintessential Muslim symbols such as a dome on top of simple gable roof made of clay tiles and minaret for the purpose of offering an ‘Islamic’ image. These mosques portray an open planning concept, with multiple access and no boundary walls. These places of worship are sited in the vicinity of housing areas equipped with dormitories for travelers, library and shops in their compound (Ismail, A.S., 2010). From this, it can be viewed that this Islamic group did not attempt to monumentalize the place of prayer or to utilize the mosque as an object to symbolize the degree of their legitimacy and authority in society, but instead, consider the mosque as a place for fulfilling the eternal needs of Muslim individual and community (Sulaiman, 2001; Rasdi, 2003). In this case, the building design as a ‘sign’ reflects their
Figure 6: Putrajaya Mosque (Source: Ismail, 2009)
Figure 7: Rusila Mosque (Source: Meor, 2000)
Figure 8: Seri Petaling Mosque (Source: Nurul, 2014)

76
Islamic philosophy that emphasis on mundane devotional experience that emphasis on the concept of da’wah rather than material development (Ismail, A.S., 2010).
In addition to that there are also mosque built by individual and influential patron in society like the Chinese Muslim converts known as MACMA (Malaysian Chinese Muslim association).Their mosque also has specific purpose as a place to teach and learn the Islamic religion as well as da’wah center to attract non-Muslim to profess the Islamic religion. The mosque is also design with elements to convey the message of Islam to user namely the Chinese race. For instance, the mosque portray mixture of middle eastern style with taste of Chinese architectural elements like the usage of pagoda roof tipped with geometrical Chinese decoration and bright Coors as symbol of prosperity (Figures 9 and 10). It aims to bring together the Malaysian Chinese people to profess Islam since there is always misconception that Islam was only for Arabs and Malays in the local context (Tee, 2013). The period of post-independence Malaysia hence portray that the role of da’wah is prominently practiced in many of the local mosque. All in all the post-independence era showcases various approach of mosque design as a ‘sign’ influenced by social and political atmosphere that reflects each individual group Islamic philosophy which showed emphasis and non emphasization on mundane devotional experience involving the accentuation on the concept of da’wah rather than material development or the reversionary (Ismail, 2010), Diagram 1.
4. Conclusion The findings above demonstrate that the evolution of da’wah mosque in Malaysia have been utilized by its patron as an ideological space for the propagation of Islamist belief to convey the message of Islam to society. Although the construction of the da’wah mosque may be seen as an extension of the patron’s manipulation in which the mosque’s physical attributes (scale, setting, access, spatial organization, façade treatment and structural arrangement) provide a way of viewing the representation of the patron Islamic belief and ideologies, nonetheless many of the da’wah mosque are designed based on the concept of community in which these mosques are situated in high density areas and integrated into the communities they were intended to serve. They are also portrayed in moderate scale with unlavish treatment of built form, both in the exterior and interior. Both of these mosques also present unrestricted flow of movement within its spatial organization due to the existence of multiple entry points, nodes and connections of space segments which allows high social interaction to occur within its spatial
Figure 9: Chinese Mosque, Ipoh, Perak (Source: Tee, 2014)
Figure 10: Chinese Mosque, Melaka: (Source: masjid.melaka.gov.my/)
Diagram 1: Evolution of main function of mosque from pre-independence up to post-modern.

77
layout. As a result, these da’wah mosques form a part of community center which caters for most of the social and Muslim family needs – as a place of worship, space for religious education, as well as a venue for other Muslim activities in the Malaysian context. Therefore it can be concluded, mosques after independence chipped by category and ownership of the mosque. It is registered under the state government to control the activities of the mosque to be fixed on the basis of religion and avoid the heretical beliefs and distortions. The result of a significant change for the sake of change, especially after the occupation of the functions and role of the mosque narrowed. As stated by Ozaloglu & Gurel (2011) changes in space and architecture of the mosque due to changes in the social and political atmosphere. Because of the major mosques obtain special funds of the government, the effect of making it a model of the mosque as the identity of Malaysia as an Islamic state looks significantly as a study conducted by Ismail (2008). However, there are still a small number of mosques built mainly by a missionary organization that seeks to enliven the role of the mosque as the mosque at the time of the prophet. Model of the mosque that the emergence of the missionary organization as a precursor to the emergence of a new model of the mosque. It was designated as a mosque da’wah center. Da’wah mosque serves as a mosque which is used not only for prayers but encompasses any missionary activity and its construction as a missionary movement. Mosques that is built for general purposes and has a specific purpose and fulfilled religious and management activities at the mosque itself shows the successful inauguration in boosting their activity. The function and use of this mosque is seen in line with the demands of the use of the mosque as in the days of the Prophet Muhammad and the Caliph Al-Rasyidin. It is not concerned with the architecture but the architecture style established itself by developing its space. Finally, the da’wah mosque came under growing due to social factors in society that looked like to propagate Islam. They want to make the mosque as a center for the dissemination and Islamic Studies and that’s is why the mosque also became a symbol of the ideology of Islam to educate people about Islam Reference Ahmad, A.Ghafar (1999). The architectural Styles of Mosque in Malaysia: from vernacular to modern structures. Proceedings of the Symposium on Mosque Architecture: The Historic and Urban Developments of Mosque Architecture. 31 Jan -3 Feb. King Saud University, Riyadh, Saudi Arabia. Vol. 2, 1999, ms. 147-163 Aizan A.M.Z, Tarek L, Faisal, Nurulwahidah F dan Fadila G. (2013). At-Attas’s Works and Contribution to the Islamic Architecture in Malaysia. Middle-East Journal of Scientific Research. 14(12). 1685-1690. Alrouf, A.A. (2011). Mosquephobia: the dilemma of architecture, multiculturalism and Islam. Lonaard. 3(1), May 2011, 1-13 Andaya, Leonard Y. (2001). A history of Malaysia. Hampshire: Palgrave. Ardalan, Nadir (1980). On mosque architecture. Architecture and community.55-56. Azhar M, M. Ismail M & Bushrah B. (2011). Menjana pengurusan masjid inovatif: satu keperluan di era globalisasi. Prosiding seminar pengurusan masjid inovatif peringkat antarabangsa, berinovasi dalam pengurusan
masjid.iain ar-raniry, banda Acheh. 23-24 April 2011.Pusat Islam Universiti Teknologi Malaysia.1-13. Bruce A. (1996). Notes on Early Mosque of the Malaysian Peninsula .69 (2-271).71- 81.Malaysian Branch of the Royal Asiatic Society. Creswell K.A.C. (1989). A short account of early Muslim architecture, Cairo: The American University in Cairo Press. Fatimi, S.Q. (1963). Islam Comes To Malaysia. Singapore: Malaysian Sociological Research Institute. Fernandis, Gerard (2003). The Portuguese community at the periphery: A minority report on the Portuguese quest for bumiputera status. Kajian Malaysia, XXI (1&2). Gawlikowska A.P. (2013). Communication and buildings. Space as mass-media. Budownictwo I architektura. 12(4).7-20. Goodarzi (2014). The influence of Sufism on the development of Persian mosque architecture. Ijazah Sarjana. Universiti Malaya. Grabar, O. (1980). Symbols and sign in Islamic architecture. Architecture and community. 25-32. Haider, G. (1996). Faith is the architect reflection on the mosque. Arch & comport. Architecture and behaviour. 11(3-4). 243-248. Holod, Renata dan Khan, Hassan-Udin (1997). The mosque and the modern world: architects Patrons and Designs Since the 1950's. London: Thames and Hudson Ltd. Hoyt S.H. (1996). Old Malacca. Kuala Lumpur. Oxford University Press.Andaya, Barbara Watson and Khan (1990). The architecture of the mosque and overview and design directions. Expression of Islam in buildings. Ismail, Alice Sabrina (2008). The influence of Islamic political ideas on the design of state mosque in peninsular west Malaysia, PhD Dissertation.University of Queensland Town. Ismail, Alice Sabrina (2010) Mosque architecture and political agenda in twentieth-century Malaysia Journal of Architecture. 15, 2, p. 137-152 16 p. Ismail, Syaimak; Yusof, Abdullah & Hamid, Faisal@Ahmad Faisal Abdul (2014). Motif Dan Hiasan Cina Dalam Dekorasi Dalaman Masjid: Kajian Terhadap Masjid Tua Di Melaka Pada Awal Abad Ke 18. Jurnal Al-Muqadimah, 2 (1). pp. 1-13. Joseph R (1981). The semiotic of the Islamic mosque. Arab studies quarterly. 3(3). 285-295. Katu, Samiang (2011). Taktik dan strategi gerakan dakwah jamaah tabligh di Makassar. Al-Fikr. 15(2).156-173. Kohl, David G (1984). Chinese architecture in the Straits Settlement and western Malaya, Kuala Lumpur: Heinemann Asia.
Longhurst C.E. (2012). Theology of Mosque: the sacred inspiring form, function and design in Islamic Architecture. Leonard, art and architecture magazine. Architectural Critical Review. 2(8), 3-13. Surat M, Rasdi, A.R. Musa, Utaberta U. &Tahir M (2011a). Salah tanggapan terhadap kubah pada senibina masjid: pengaruh pengisian sejarah dalam hasrat rekabentuk masjid. Jurnal design + built (edisi masjid). McAuley, J. (2006) ‘Hermeneutic Understanding in Cassell, C. and Symon, G. Essential Guide to Qualitative Methods in Organizational Research. London: Sage, pp. 192-202

78
Megat A.S., Ezrin A & Nila I. (2014). Transformation of mosque in Malaysia. : critical analysis of architectural history approach. Proceeding of the International Conference on Arabic Studies and Islamic Civilization iCasic 2014 (e-ISBN 978-967-11768-4-9). 4-5 March 2014, Kuala Lumpur, MALAYSIA Mizan H dan Anuar T. (2005). The Malaysian Mosque: Evolution, element and meaning. Journal of Built Environment, UiTM 2 (1), 1-10. M.Adil Khan Afridi (2011). Contributions of mosque towards building society: A case study on Masjid Wilayah Persekutuan, Kuala Lumpur. International conference on Islamic civilization and Malay identity (ICICMI) M.Said N. (2012). Dakwah dalam perspektif Al-Quran dan Hadis. Al-Fikr. 16(1).96-108. M.Tajuddin R. (2010). Rethinking Islamic Architecture. Startegic Information and Research Development Centre, Petaling Jaya. M. Tajuddin R. (2000). The Mosque as a Community Development Center: Reformation and Revolution, Intellectual Forum and Seminar on ‘The Mosque’, International Islamic University, 28th October 2000 Architectural Heritage: Contributions for Tourism. M.Tajuddin R.(2004). Hadith and Mosque: hadith as a guide in designing mosques. Utusan publications & distributions Sdn.Bhd. M.Tajuddin R. (2005). Malaysian architecture: crisis within. Utusan publications. M.Tajuddin R.(2007). Mosque architecture in Malaysia:Classification of styles and possible influence. Journal Alam Bina X(XX). Mohd Nasir, Badlihisham (2003). Da’wah and the Malaysian Islamic Movement. Synergymate Sdn. Bhd. Mohd Taib O. & A.Aziz Deraman (2000) Tamadun Islam di Malaysia.Percetakan Dewan Bahasa dan Pustaka. Moustafa A.A. (1988). Architectural representation and Meaning: towards a theory of interpretation. Master of Science in architecture studies. The Massachusetts Institute of technology. Nasir, Abd Halim (1984). Masjid-masjid di Semenanjung Malaysia. Berita publishing. Nasir, Abd Halim (1995). Masjid-masjid di Semenanjung Malaysia. Berita Publishing; Set 1 edition Nasir, Abd Halim (2004). Mosque architecture in the Malay World. Universiti Kebangsaan Malaysia, Bangi. Nakula (1982). Senibina Islam: aplikasi di Malaysia.kertas kerja international conference on Islam and technology.UTM. Nangkula Utaberta & M.Tajuddin R. (2010b). Deskripsi tipologi, klasifikasi dan analisis perancangan masjid di Malaysia. El-Harakah.12 (3), 179-193. Nurhidayat M. S. (2012). Dakwah dalam perspektif Al-Quran dan Hadis. Al-Fikr. 16(1). 96-108. Parkinson (1960), British Intervention in Malaya 1867-1877. Singapore: University Malaya press. Pintado, Fr. M.J. 1976. “The Portuguese Community in Malacca (1511-1973).” In Illustrated Historical Guide To Malacca. Malacca: The Rotary Club of Malacca.
Raalah Mohamad (2002). The documentation on the architectural features of five oldest mosque in Melaka built in 18th century. Unpublished Master thesis UK: University of Sheffield. Racius, Egdunas (2004). The multiple nature of the Islamic da’wa. Dissertation. The University of Helsinki. Rahman, Nash (1998). Masjid: sejarah, ciri-ciri pembentukan dan pembinaan masjid-masjid Dunia, Malaysia dan Kuala Lumpur, Kuala Lumpur: Puncak Awal and majlis Agama Islam Wilayah Persekutuan. Rapoport A. (1980). Cross cultural aspects of environmental design. Altman Rapoport and Wohwill.7-46. Sebastian K.B & Cecez-kecmanovic D (2010). Literature reviews and the hermeneutic circle. Australian Academic & Research Libraries. 41(2). 129-144. Shaharuddin Syarul Azman (2006). Keberkesanan Metod Dakwah Jemaah Tabligh Masjid Jamek Bandar Baru Seri Petaling, Kuala Lumpur. Doktor Falsafah, Jabatan Dakwah dan Pembangunan Insan Akademi Pengajian Islam Universiti Malaya, Kuala Lumpur Shukri A et.al (2014). Penghayatan solat dan pengimarahan masjid: kajian dalam kalangan pelajar universiti utara Malaysia. Proceeding of the Social Sciences Research ICSSR 2014 .9-10 Jun 2014, Kota Kinabalu, Sabah, MALAYSIA. 786-797. Spahic, Mohammed Musa (2000). The design and relationship of the first built mosque within a non-muslim urban environment” proceedings of the symposium on mosque architecture: the historic and urban development of mosque architecture (2B); 191-2-6. Spahic O (2012). The concepts of god, man and the built environment in Islam: implications for Islamic architecture. Journal of Islamic Architecture. 2(1). 1-12. Spahic, O. (2002). Studies in the Islamic built environment. Research centre. International Islamic university Malaysia. Syed Abdulrahman (2010). Kepentingan Dakwah Terhadap Ummat al-Ijabah dan Ummat al-Dakwah. Monograf asasi pengajian Islam. Jawatankuasa Penyelidikan dan Penerbitan Akademi Pengajian Islam Universiti Malaya, Nilam Puri Tee, Ridhuan (2013). Masjid Cina milik semua orang Islam. Ed. Zuarida Mohyin. Utusan Online. Whyte, William (2006). How do Buildings mean? Some issues on the interpretation In the History of Architecture.: History and Theory Journal. 45: 153-177 Yeang, K. (1992). Architecture of Malaysia. Kuala Lumpur: The Pepin Press. Yegar (1979). Islam and Islamic institution in British Malaya 1874-1941: policies and implementation. Jerusalem: magnes Press. Yin, Robert, K (2003a). Case Study Research, design and methods, 3rd edition, London: Sage.

79
1. Introduction
Planning is the process of analysing information, making decisions and formulating plans of action for future (Glasson, 1982).Development plan will provide the spatial framework for promoting and regulating the physical development of lands and buildings in each of the urban area to ensure the sustainable urbanization (Bruton and Nicholson, 1985).The implementation of development plans and the evaluation of objectives of plans have been ignored for decades in the field of planning (Houghton,1997).Since the mid-1990s planning scholars have given considerable attention to define the characteristics of plan quality (Erickson et al,2004,Laurian,2010).In the late 1990’s it was considered evaluating the outcomes of planning activities, rather than focusing on planning processes (Houghton ,1997,Carmona and Sieh,2008).Achievement of objectives of development plan can also contribute to the accountability and trust in, public managers and institutions, and should guide improvements in plans and practices (Kaiser et al, 1995). Laurian et al. (2004) introduces conformance-based evaluation which assume observable causal linkages between planning goals, activities and outcomes and require clearly defined goals and objectives which can be measurable with measurable indicators and logically derived planning strategies. But in practice, these evaluations are complicated because plan objectives are not always clear and measurable and multiple strategies are used to advance objectives (Seasons,2003,Snyderand Coglianese,2005).Since there is no proper method to evaluate the achievement of objectives, planners cannot know whether plans achieve their objectives, or learn from the results of past interventions to improve planning practice(Baehler,2003,Seasons,2003).Therefore this study is supposed to evaluate the achievement of objectives of development plan as the main
objective of the study. The other objectives supposed to be fulfilled while carrying out this study are identifying the importance and progress of planning evaluation, application of AHP to evaluate the human judgments in different conditions.
2. Literature Review 2.1. Levels of Planning and Planning Evaluation Planning can be undertaken by government in many sectors with appropriate strategies and action projects to achieve goals and objectives involved (Glasson, 1982). Planning can include preparing and formulating plans in different levels as National plans, Regional plans, Local plans, and urban development plan to promote and regulate the development.(Bruton and Nicholson,1985).Impacts of action projects are the outcomes of development plans, which are to be contributed to the development impact of the planning region (Bagwat and Sharma,2007).They are accountable for achieving objectives of development plan and contributing to the development impact (Morrison and Pearce,2000). Patton(1989) and Michael (2002) states that planning evaluation is the systematic assessment of plans, planning processes, objectives and outcomes compared with explicit standards or indicators and it is important since it ensures accountability, improvement and knowledge of the development plan. Berke (2006) states three types of planning evaluations as process, impact and outcome evaluations. Planning evaluation can be conducted for different purposes as a priori or ex ante evaluation (Alexander, 2006), on-going monitoring or formative evaluation (Scriven, 1967) and ex post facto or retrospective evaluation
INTERNATIONAL JOURNAL OF BUILT ENVIRONMENT AND SUSTAINABILITY Published by Faculty of Built Environment, Universiti Teknologi Malaysia
Website: http://www.ijbes.utm.my
IJBES 3(2)/2016, 79-85
Application of Analytic Hierarchy Process (AHP) in Evaluating the Achievement Level of Objectives of Urban Development Plan Gayani Ranasinghe Department of Town & Country Planning, University of Moratuwa, Sri Lanka Email: [email protected] Lalith De Silva Department of Building Economics, University of Moratuwa, Sri Lanka Email: [email protected]
ABSTRACT Planning evaluation can be a systematic assessment of plans, planning processes, objectives and outcomes compared with explicit standards or indicators. Evaluating the achievement level of objectives of development plan has been ignored in the field of planning due to lack of proper method. But in practice, these evaluations are complicated because objectives are not always clear and measurable. Therefore this study is supposed to evaluate the level of achievement of objectives of the development plan by applying Analytic Hierarchy Process (AHP) when objectives are not measurable. Public perception on achievement of objectives criteria of related action projects considering overall benefits of each project were judged as ex post facto evaluation. Field surveys and questionnaire surveys were carried out to identify different views of different stakeholders. This application can be used as an objective evaluation tool for planners and policy makers to improve planning practices and provide necessary knowledge for revising plans.
History:
Received: 21 January 2016 Accepted: 30 March 2016 Available Online: 30 May 2016 Keywords:
Objectives, criteria, public perception DOI:
10.11113/ijbes.v3.n2.123

80
(Baum, 2001, Snyder and Coglianese,2005).This study focus on impact evaluation in terms of achievement of objectives related to each action projects of Moratuwa development plan as an ex post facto or retrospective evaluation. Most ex post studies evaluate planning objectives considering policies, programs, action projects and regulations rather than outcomes (Baum, 2001). Yet, the literature on the ex post facto evaluation of planning outcomes is underdeveloped and actual outcome evaluations by practitioners are rare (Carmona, 2007; Carmona and Sieh, 2008). This study also evaluates planning objectives considering overall benefits of action projects based on public perception.
2.2. Barriers for Evaluating Plan The rational perspective assumes that plan goals and objectives translate into policies and methods, which are implemented to address specific problems and yield expected outcomes. This is how legislation and planning mandates tend to be designed and how planners usually conceptualize their practice. (Berke et al, 2006, Laurian et al, 2004). But in practice objectives of plan are rarely evaluated by planning agencies (Carmona and Sieh, 2008, Seasons, 2003).This gap can be explained by several factors. First, evaluation requires selecting indicators of success and obtaining relevant data and information (Baum, 2001; Snyder and Coglianese, 2005). Incompatible objectives need to be reinterpreted by evaluators to select evaluation criteria and indicators (Seasons, 2003). Monitoring and evaluation also require appropriate and reliable data to identify trends and changes of the plan implementation (Baehler, 2003; Seasons, 2003).Yet, very few plans are provided for monitoring processes to evaluate the effects of land-use decisions, or identify discriminating indicators suitable for linking plan objectives to measurable outcomes, especially in the area of spatial planning (Snyder and Coglianese,2005).Thus, evaluators often rely on proxy variables, which are often too removed from planning decisions to talk much about their outcomes (Baum, 2001). Secondly, evaluation also assumes that weaknesses should be identified to promote change, but more organizations and administrators reluctantly can resist evaluations they perceive as threatening (Baehler,2003).Even if committed, many planning agencies, and especially local authorities, often lack of resources in time, staff, or expertise to support plan monitoring or evaluation (Baehler, 2003; Seasons, 2003).Third, evaluating plan outcomes is methodologically difficult. Existing evaluation methods are generally not designed to address the physical, environmental, and spatial components of planning. The main difficulty faced by evaluators is the lack of a generally accepted ex post facto method for evaluating objectives of plan (Baehler, 2003; Talen, 1997). The most problematic methodological question is the attribution, or causality, question. It is difficult to distinguish the objectives of planning activities from other factors (Carmona and Sieh, 2008).Finally identifying a cause relationship between planning decisions and objectives is difficult (Baum, 2001, Seasons, 2003).
2.3. Different Planning Evaluation Methods and their
Limitation Laurian et al. (2004) and Laurian et al. (2010) introduced the Conformance-based evaluation method that assume observable causal linkages between planning objectives, activities, and outcomes, and require clearly defined goals and objectives and logically derived (and properly implemented) planning strategies. It does not assess the impacts of strategic plans overall, but rather the specific outcomes of discrete plan elements with specific goals and objectives. It seeks to
answer these questions: Are plan objectives achieved? Why or why not? Are observed outcomes attributable to the plan?. First, it develops and builds on a conceptual model of plan logic and implementation and investigates associations between plan goals and outcomes. This step relies on `plan logic mapping' to determine whether the plan is logically capable of achieving its objectives. Evaluating the associations between objectives and action projects is essential because planners, legislators, and taxpayers are primarily interested in achieving stated goals or objectives. Finally it uses structured expert assessments to identify causal relationships between plan provisions and outcomes. Laurian et al. (2004) support a conformance-based approach on where a plan is considered implemented if development patterns adhere to its policies and meet its objectives. While this approach sounds reasonable, challenges arise when it is used as a framework for evaluating whether or not a plan has been implemented. A major criticism is that strictly adhering to the conformance approach may be too rigid or narrow in practice. For example, Laurian et al. (2004) evaluated plans by systematically comparing issued permits to plans to see whether the plans were followed. While this process would indicate whether the permitting process was done in accordance to the plan, it would hardly tell you that the plan had been implemented. What about the social and political objectives of a plan? How those are assessed using a conformance-based approach? What about the actions of other actors outside of the planning department? The difficulty in answering these questions may be explained by the postmodernists. Performance-based evaluation is well suited to evaluate comprehensive and strategic plans, seen as broad efforts to identify, formulate, and promote main visions and goals and objectives (Mastop and Faludi, 1997).It focuses on process and not the plan itself. If we assume that the plan's major purpose is to serve as a guide for implementation, then the plan (and subsequent implementation) cannot be evaluated solely as a process tool. An additional problem plaguing both the conformance and the performance approaches is that, they have not agreed upon what is a `good' plan, let alone what constitutes the successful implementation of a plan. An inquiry into the reasons for planning success seems an unbelievable task because (1) there is no existent definition of what success is (2) there is no empirical knowledge of when or what circumstances of planning has in fact succeeded and (3) there is no method for measuring planning success (Talen, 1997).
2.4. Proposals to Overcome above Limitation First, identifying relationship between objectives and action projects is required since action projects are the results that link to the immediate objectives as described in the development plan (Bagwat and Sharma,2007). Second, Berke (2006) shows that stakeholders should be get involved in the process of evaluating the objectives of plan. Third, reviewing public perception is a good technique to study the present situation and evaluate the overall impacts of action projects of plan(Marqueset al, 2010; Baum,2001; Seasons, 2003). Fourth, Planners must be aware of the factors that affect stakeholder participation (Burby, 2003) because planners’ failure to recognize the differences in evaluation between experts and public may lead to figurative protests (Norton, 2008).According to the Section 8D of UDA Act of No: 4 of 1982, public are being consulted only during post preparation of development plan and that should be done for plan evaluation. Local authorities’ responsibility is to get involve people in both planning, implementing activities (Circular No 01 under reference 08/01/38 dated on 20/03/1985) and suggested to be involved in evaluating activities as well.

81
3. Methodology Reviewing public perception is one of the techniques which can be applied to study the present situation and overall benefits of each action projects and to evaluate objectives, since it has being benefited greatly throughout the past practices (Berke, 2006; Seasons, 2003; Marques et al., 2010). Objective achievement matrix is another advance planning technique which has been applied to identify the relationship between objectives, proposed strategies and action projects(Lichfield,1996, Sager,2003). Field surveys and questionnaire surveys were selected as the data collection technique, since they will be supported for reviewing public perception on achievement of objectives criteria of related action projects considering overall benefits of each action project of Moratuwa development plan. Accordingly 100 people who live in Moratuwa MC Area, 20 project officers who have been involved in each project and 05 planning officers of Moratuwa MC were selected randomly, for a125 sample size. In this study, the researcher cannot control the independent variables (Kraemer,2002) that are occurred as outcomes of the development plan itself. Therefore, experiment is not applicable for this study. That is why field surveys and questionnaire surveys were carried out as suitable techniques to investigate the achievement of objectives of all action projects of Moratuwa Development Plan. 3.1. Analytic Hierarchy Process (AHP) Today decision makers are benefited using AHP as a technique which can be applied to quantify relative priorities for identified elements, human values and judgments of problems in order to make reasonable decision. AHP has recognized as which has theoretical sound which was invented by Saaty in early 1970’s. Further in 1994 he introduced the AHP as a tool to make decisions and stated that the AHP is about breaking a problem down and then aggregating the solutions of all the sub problems into a conclusion. It is also a reliable tool to facilitate systematic & logical decision making processes & determining the significance of set of criteria & sub criteria. Liang (2003) described AHP as a multi attribute decision tool that allows financial and non-financial quantitative and qualitative measures to be considered and trade-offs among them to be addressed. Islam & Rasad (2005) used AHP to evaluate employees performances based upon the criteria such as quantity and quality of the work, planning organization, initiative commitment, team work, communication and obtained overall ranking of the employees. And also Cheng & Li (2001) has provided convenient and effective method based on AHP to evaluate human resources. Braglia et al. (2006) provided a structure methodology to permit an optimal selection of the best suited computer managed maintenance system software within process industries. Wu et al. (2007) applied the AHP is to determine the priority of accessibility criteria. Chan et al (2004) used AHP method to assess safety management in construction industry. Cheng, & Heng (2001) introduced use of AHP to select the right candidate for a posted position based on a set of weighted selection criteria. Furthermore Barclay & Osei (2010) emphasized the use of AHP in selection best supplier to perform construction activities of a project. In this background AHP was used as the main technique to evaluate the achievement level of objectives of each action projects. It builds on perception of local community, project managers and planners to identify the impacts of action projects, the influence of non-plan factors and the unintended consequences of planning activities considering as overall benefits of each projects. Criteria of objectives related to each action projects were compared with each other under pair wise comparison. Intensity of contribution of each action project towards the achievement of each objective criteria
was measured using Likert scale indicating in Table 1 considering given scale values through structured questionnaire surveys for each project separately. All these values were applied to Analytical Hierarchical Process and AHP derived the final priority vector [(Pj) =eign(A)] (normalized principal eigenvector ) as percentage value. These values indicate the achievement of criteria of objectives as an overall assessment of the intensity of contribution of each action project and planning intervention. 4. Analysis: Evaluate the objectives of Moratuwa
Development Plan
4.1. Step one - Identify the Coherence of Plan Elements and association between Objectives and Action projects
Urban Development Plan for the Urban Area of Moratuwa, constituted by the Municipal Council Area of Moratuwa, has been considered the recommendations made by the Board of Management of the UDA on 04th August, 2004 under Section 8F of the Urban Development Authority (Amendment) Act No.4 of 1982. This Development plan provides the legal basis for the physical development of Moratuwa town through a vision that is ‘Moratuwa town has the potential to be developed as a model town embodying a regional service center, through industry and educational services, while maintaining its environmental equilibrium’. Identified objectives, strategies and action projects of the Moratuwa development plan can be illustrated with the application of objective achievement matrix in Table 2. This matrix was developed considering contribution of the proposed development to achieve stated specific objectives and their relationship. The progress of the development plan reveals that only three action projects have been implemented successfully. They are Lunawa lagoon development project, development of Lunawa hospital land for a low income housing development and parks development project which consisted with redevelopment of Puranappu open air theatre and beach park development in Koralawella. Under this study, when evaluate the objectives of Moratuwa development plan related to each action project, it was considered the overall benefits of above implemented three projects and the overall benefits which are currently achieved pertaining to partly implemented action projects. After identified the objectives which are to be achieved through specific action project, it was further examined to extract the main criteria of them as shown in Table 3. 4.2. Step Two–Evaluate the Objectives of Each Action Project
Using AHP Above identified criteria of objectives regarding to each action project were included as a matrix to the structured questionnaire for the pair wise comparison. Intensity of contribution of each project towards the achievement of each objective criteria is evaluated using Likert scale values of 1(equally achieved), 3(slightly achieved one element over
Intensity of contri-
bution
Definition
1 Two elements were achieved equally by the project 3 Contribution slightly achieved one element over another 5 Contribution strongly achieved one element over another
Table 1: Likert Scale

82
another) and 5 (strongly achieved one element over another) considering the given values by all respondents. When there is equal contribution level (achievement level), scale is given as 1 and it is three times as higher for moderate level (3) and five times as higher for high level (5). When responding to a Likert scale, participants specify their level of agreement to statements with typically five or seven ordered response levels (Joost and Dodou, 2010).Several studies show that people are not able to place their point of view on a scale greater than seven since more than seven points scale are too much. Seven or less is preferred. Studies are not conclusive on what is the perfect number, most commonly mentioned are five, four or three point scales (Intelligent measurement, 2007). They showed that numbered scales are difficult for people. For example, scales that are marked “1 to 5, with 5 being the highest” result in less accurate results than scales with labels such as “low” or “high”. If numbered scales are used, signposts are recommended (e.g. put “low” as 1, “moderate” as 3 and “high” as 5). In this background the above 1, 3, 5 Likert scales has been selected to measure the intensity of contribution of each project towards the achievement of each objective criteria. Since this study based on public perception survey and to have a clear variance among the achievement level, 1, 3, 5 scales were taken rather than considering 1, 2, and 3.
Finally responded values were applied to AHP calc version 22.5 software program developed by Geopel, K.(2012) to run the process of application of AHP. It was calculated priority vector (Pj) for each project which indicates the achievement of criteria of relevant objectives. The software facilitated to calculate lambda max, consistency index (CI) and consistency ratio (CR) for each action project. Table 04 illustrates the achievement level of objective criteria of Lunawa Lagoon development project.
5. Conclusions The Conformance-based evaluation method introduced by Laurian et al. (2004) can be applied to evaluate the objectives when there is a observable causal linkages between planning goals, activities and outcomes and it is required to have clearly defined goals and objectives which can be measurable with measurable indicators and logically derived planning strategies. But in practice, these evaluations are complicated because plan objectives are not always clear and measurable and multiple strategies are used to advance the objectives. Since there is no proper method to evaluate the achievement of objectives when objectives are not always clear and measurable,
Action Projects Objectives Strategies Proposed Development Progress up to year 2014
Town Center Devel-opment Project
Development as a water-
front city
Improve the infrastructure
facilities
Zone for mixed residential and
commercial activities
Planning the town Centre to suit the
future requirements by implement-
ing planning regulations.
Development of Post Office Premises
Partly Implemented
Katubedda Sub-Town Development project
Improve the infrastructure
facilities
Provision of facilities to
improve the industries in the
town
Improvement of the fishing
industry
Maintenance of existing common
amenities and regularization of
physical development of the town by
implementing planning and building
regulations.
Establishment of a sewerage system
Implement Zoning regulations,
housing & common amenities.
Proposed Katubedda Super Market Commercial Activities at Katubadda junction
Not Implemented
Partly Implemented
Lunawa Lagoon Development Project
To protect natural re-
sources, and maintain the
development of the town
and its environmental equi-
librium
Zone for various land uses
Implement planning regulations
Extend the existing infrastructure
facilities
Develop the of coastal strip and the
reservations of watercourses
Landscaping and Improvement Plan for the Lakesides
Implemented
Housing development Project
Improve the standards of
living by providing housing
and infrastructure facilities
for low income settlements
in the town
Implement Zoning regulations.
Special planning standards
Commercial Houses, Low Income Houses. Around Lunawa Hospital Premises (2 Acers)
Implemented
Coastal Road Devel-opment Project
Establishment of an efficient
transport system
Maintenance of reservations
of public roads and water-
ways
Maintenance of adequate road reser-
vations and improvement of the
relevant facilities
Enforce the reservations of roads and
waterways
Coastal line Road Extension Development of Coastal Park Entertainment Park
Partly Implemented
Parks Development Project
Establishment of adequate
number of parks, play-
grounds and open spaces
Enforce Zoning Regulations of
recreational open spaces and play-
grounds.
Redevelopment of PuranAppu Open Air Theatre Beach Park development
Implemented
Table 2: Objective Achievement Matrix

83
planners cannot know whether the development plans achieve their objectives, or learn from the results of past interventions to improve planning practice. In this background this study attempted to evaluate the achievement level of objectives of Moratuwa urban development plan applying AHP as a technique that can be used to overcome such an issue. The AHP application shows that all six action projects have been contributed to achieve relevant criteria of objectives in different levels (Table 5). Addition of percentage values of achievement level of objective criteria under each project is 100% and the percentage value relevant to each criteria indicate achievement level as a ratio of comparison with other. In a situation action projects are partly implemented, these values do not indicate the significance difference. Therefore the study revealed that this application is totally suitable for evaluating objectives relevant to
implemented action projects only. It was suggested that this application should be updated according to the dynamic nature of the planning industry. 5.1. Limitations Objectives of Moratuwa urban development plan were evaluated towards the achievement of objective criteria considering the overall benefits of all identified action projects only. This case study reflects the stakeholders' satisfaction on the overall benefits of action projects but has not done a study about the planning process and theories which were applied to identify strategic action projects of selected urban development plan. The level of achievement of objective criteria under each action project was evaluated considering perception of planning
Action Projects Objectives Related Criteria of the objectives
Town Center Devel-opment Project
1. Development as a waterfront city
C1-City development
C2-water front city
2.Improve the infrastructure facilities C3-Improve infrastructure facilities
KatubeddaSub-Town Development project
2. Improve the infrastructure facilities C1-Improve infrastructure facilities
3.Provision of facilities to improve the industries in
the town
C2-Provide facilities to improve industries
4. Improvement of the fishing industry C3-Improve fishing industry
Lunawa Lagoon De-velopment Project
5. To protect natural resources, and maintain the
development of the town and its environmental
C1-to Protect natural resource
C2-to maintain City development
Housing development project
6. Improve the standards of living by providing hous-
ing and infrastructure facilities for low income
settlements in the town
C1-to Improve standard of living
C2-to provide better quality houses
C3-Provide infrastructure facilities
Coastal Road Devel-opment Project
7. Establishment of an efficient transport system C1-to establish efficient transport system
8. Maintenance of reservations of public roads and
waterways
C2-to maintain reservation of public roads
C3-to maintain reservation of water ways
Parks Development Project
9. Establishment of adequate number of parks, play-
grounds and open spaces
C1-Provision urban recreational facilities
C2-Optimum utilization of Urban land
C3-Provide open space
Table 3: Criteria of objectives relevant to each action project
Lunawa Lagoon Development Project To Protect natu-ral resource C1
To maintain City develop-ment C2
For Ecologi-cal Balance C3
Sum Priority vector
To Protect natural resource C1 0.425 0.486 0.406 1.317 43.91% To maintain City development C2 0.125 0.143 0.166 0.434 14.46% For Ecological Balance C3 0.450 0.371 0.429 1.249 41.63% Sum 1.000 1.000 1.000 3.000 100.0% Lambda max 3.014 Consistency Index (CI) 0.69% n = 3 Consistency Ratio (CR) 1.20% The value of consistency ratio (CR) is 1.20%. Since it is smaller than 10% judgment matrix is consistent and reliable.
Table 4: Achievement level of Objective Criteria for Lunawa Lagoon Development Project

84
officers, project officers and community as only 30 respondents for each project. The achievement level of each criteria of objectives were evaluated as low, moderate and high by giving likert scale values of 1, 3 and 5 consequently. Since criteria of objectives are ambiguous, it was needed to explain them to participants. This method should avoid selecting only stakeholders who will positively evaluate the plan's objectives. There can be long time lags between plan adoption, implementation, project outcomes and development impacts. 5.2. Contribution to Industry This method will be a useful tool to planners, project managers and academics seeking to assess the objectives of development plans in local level. Because Objective Criteria Achievement level indicate the intensity of contribution of the action project to achieve related criteria of its relevant objectives considering overall benefits of each action project. These evaluations facilitate to learn and improve planning practice, while providing the necessary knowledge to revise plans, improve performance of action projects, and increase the transparency and accountability of planning practice. This method involves all relevant stakeholders to evaluate the objectives of plan. Therefore community will identify how the plans have shaped up their communities and they will help the planners, project managers and the politicians to achieve the expected objectives. The effectiveness of this method in Sri Lankan planning industry should be tested with a few more implemented development plans.
References Alexander,E.R.(2006) Evaluation in Planning: Evolution and Prospects. Ashgate, Aldershot, Hants. Baehler,K.(2003) Evaluation and the policy cycle.In Lunt,N,Davidson,C&Kegg (Eds), Evaluating Policy and Practice. Section 1.4,A New Zealand Reader, Pearson Prentice Hall, Auckland. Bagwat,R.,& Sharma,M.K.(2007) Performance measurement of supply chain management a balanced scorecard approach. Computers and industrial Engineering (pp43-62) Barclay,C.,&Osei,K.M.(2010) Project performance development framework an approach for developing performance criteria & measures for information system project. International Journal of Production Economics, 124,(pp272-292). Baum,H.(2001) How should we evaluate community initiatives. Journal of the American Planning Association, 67, 147 -158 Berke,P.(2006) What makes plan implementation successful? An evaluation of local plans and implementation practices in New Zealand. Environment and Planning B: Planning and Design, 33, 581 -600 Braglia,M., Carmignani, G., Frosolini, M. and Grasi, A.(2006) AHP- based evaluation of CMMS software. Journal of Manufacturing Technology Management, 17(5), pp.585-602 Brown,J.D. (2011) Likert items and scales of measurement. JALT Testing & Evaluation SIG Newsletter.15, 1.
Action Pro-jects
Objectives
Related Criteria of the objectives
Objective Criteria Achieve-ment Level
Town Center Development Project
1. Development as a waterfront city
C1-City development C2-water front city
61.51% 13.78%
2.Improve the infrastructure facilities C3-Improve infrastructure facilities 24.71%
Katubedda Sub-Town Develop-ment project
2. Improve the infrastructure facilities C1-Improve infrastructure facilities 60.80%
3.Provision of facilities to improve the industries in the town
C2-Provide facilities to improve industries 26.27%
4. Improvement of the fishing industry C3-Improve fishing industry 12.92% Lunawa Lagoon Development Project
5. To protect natural resources, and maintain the development of the town and its environmental equilibrium
C1-to Protect natural resource C2-to maintain City development C3-for Ecological Balance
43.91% 14.46% 41.63%
Lunawa Housing development project
6. Improve the standards of living by providing housing and infrastructure facilities for low income settlements in the town
C1-to Improve standard of living C2-to provide better quality houses C3-Provide infrastructure facilities
36.38% 47.16% 16.46%
Coastal Road Development Project
7. Establishment of an efficient transport system
C1-to establish efficient transport system 18.46%
8. Maintenance of reservations of public roads and waterways
C2-to maintain reservation of public roads C3-to maintain reservation of water ways
36.99% 44.55%
Parks Develop-ment Project
9. Establishment of adequate number of parks, playgrounds and open spaces
C1-Provision urban recreational facilities C2-Optimum utilization of Urban land C3-Provide open space
12.06% 35.24% 52.70%
Table 5: Achievement level of objective criteria of other all six action projects of Moratuwa Development Plan

85
Bruton,M.,& Nicholson.(1987) Local Planning in Practice. London, University of whales, Institute of Science and technology in Cardiff. Burby,R.J.(2003) Making better plans that matter: citizen involvement and government action. Journal of the American Planning Association, 69, 33 – 44. Carmona, M.(2007) Monitoring outcome quality in planning: challenges and possibilities. Town and Country Planning Tomorrow , 8 Carmona,M.,& Sieh,L.(2008) Performance measurement in planning towards a holistic view. Environment and Planning C: Government and Policy, 26 ,428 – 454. Carol,H.W.(1998) Evaluation: methods for studying programs and policies. Prentice Hall,Upper Saddle River. Chan, A.H.S. Kwok, W.Y. and Duffy, V.G. (2004) Using AHP for determining priority in safety management system. Industrial Management & Data Systems, 104(5), pp. 430-445 Cheng, E.W.L.,& Li,H.(2001) Information priority setting for better resource allocation using analytic hierarchy process (AHP).Information Management & Computer Security, 9(2),pp.61-70 Davidson,J.E.(2000) Ascertaining causality in theory-based evaluation. In P. J. Rogers (Eds) Program Theory Evaluation: Challenges and Opportunities New Directions in Evaluation series. Ericksen,N.,Berke,P.,Crawford,J.,& Dixon,J.(2004) Plan-making for Sustainability: The New Zealand Experience. Ashgate: Aldershot Hants. Geopel, K.(2012) AHP Analytic Hierarchy Process (Multiple inputs). Retrieved from http//:bpmsg.com Glasson.J.(1982) Regional Planning. England. Government of Sri Lanka.(1982) Urban Development Authority Law No 4(Amendment). Colombo, Parliament of Socialist republic of Sri Lanka Hoch,C.J.(2002) Evaluating plans pragmatically. Planning Theory, 1, 53 -75. Houghton, M.(1997) Performance indicators in town planning: much ado about nothing?. Local Government Studies, 23(2) ,1 – 13. Intelligent measurement.(2007) Likert Scale and Best Practices. Retrieved from http ://www.intelligentmesurement.wordpress.com Islam,R and Rasad,S.B.M.(2005) .Employee performance evaluation by AHP: a case study, international symposium on the analytic Hierarchy process. 8-10 July 2005. Hawaii: University of Hawaii, USA Joost,C.F.D.,& Dodo,D.(2010) Five-Point Likert Items: t test versus Mann-Whitney-Wilcoxon. Practical Assessment Research and Evaluation,15,11. Kaiser,E.J.,Godschalk,D.R.,&Chapin,F.S.(1995) Urban Land Use Planning 4th edition. University of Illinois Press, Urbana, IL. Kraemer,L.K.(2002) Survey research methodology in management information systems: an assessment. Working paper on graduation of management of school, University of California, California. Laurian.L.(2004) What makes plan implementation successful? An evaluation of local plans and implementation practices in New Zealand. University of Auckland, Newzealand Laurian,L.,Crawford,J.,Day,M.,Kouwenhoven,P.,Mason,G.,Ericksen,N.,&Beattie,L.,(2010) Evaluating the outcomes of plans: theory, practice, and
methodology. Environment and Planning B: Planning and Design, volume 37, 740 -757. Liang,W.Y.(2003) The analytic hierarchy process in project evaluation an R& D case study in Taiwan, Benchmarking. An international Journal,10(5),pp.445-456 Lichfield,N.(1996) Community Impact Evaluation. UCL Press, London Marques,G.,Gourc,D.,&Lauras,M.(2010) Multi-criteria performance analysis for decision making in project management. Department of Industrial Organization, Logistics and Technology: Boulevard Las crosses, France. Mastop,H.,&Faludi,A.(1997)Evaluation of strategic plans: the performance principle. Environment and Planning B: Planning and Design, 24, 815-832 Mayne,J.(2001) Addressing attribution through contribution analysis: using performance measures sensibly. Canadian Journal of Program Evaluation, 16, 1 -24 Michael,Q.P.(2002) Qualitative research and evaluation methods. SAGE, Thousand Oaks. Morrison,N.,& Pearce,B.(2000) Developing indicators for evaluating the effectiveness of the UK land use planning system. Town Planning Review, 71, 191- 211. Norton,R.K.(2008) Using content analysis to evaluate local master plans and zoning codes. Land Use Policy, 25, 432 -435. Patton, M.Q.(1989) A context and boundaries for a theory-driven approach to validity. Evaluation and Program Planning, 12, 375 -377 Preston,C.C., & Colman,A.M.(2000) Optimal number of response categories in rating scales: Reliability, validity, discriminating power, and respondent preferences. Acta Psychological, 104, 1–15. Rhoda,I.(1982) Urban & regional Analysis for Development planning. Colorade, Western press, Boulder. Sager,T.(2003) Rationality Types in Evaluation Techniques -The Planning Balance Sheet and the Goals Achievement Matrix. European Journal of Spatial Development. Retrieved fromhttp://www.nordregio.se Saaty,T.L.(1994) How to make a decision: the analytic hierarchy process. Interfaces, 24(6), pp. 19-43 Scriven, M.(1996) Types of evaluation and types of evaluator. American Journal of Evaluation ,17, 151-161. Seasons, M.(2003) Monitoring and evaluation in municipal planning. Journal of the American Planning Association, 69, 431-440 Snyder,B.L.,& Coglianese,C.(2005) Measuring progress: program evaluation of environmental policies. Environment, 47(2), 22-39 Talen,E.(1997) Success, failure, and conformance: an alternative approach to planning evaluation. Environment and Planning B: Planning and Design, 24, 573- 587. Vedung,E.(1997) Public Policy and Program Evaluation.Transaction Publishers: New Brunswick,NJ. Weiss,C.(1997) How can theory-based evaluation make greater headway?. Evaluation Review ,21, 501- 524. Wu.S.,Lee,A.,Tah,J.H.M.,&Aouad,G.(2007) The use of multi attribute tool for evaluating accessibility in buildings: The AHP approach. Facilities, 25(9), pp.375-389

86
1. Introduction
The concept of sprawl has different meaning in different literature. Their review of the literature found that sprawl can alternatively or simultaneously refer to: (1) certain patterns of land-use, (2) processes of land development, (3) causes of particular land-use behaviors, and (4) consequences of land-use behaviors. They have reviewed many definitions of sprawl from different perspectives. It seems that sprawl is used both as a noun (condition) and verb (process); and suffers from a lack of clarity even though many would claim to ‘know it when they see it’ (Galster et al 2001). Urban sprawl is defined as “The extension of the area of cities beyond the walkable range and the emergence of endless’ cities”, by (Angel, Parent, & Civco, 2007). Geographical Information system and Remote Sensing is a vital technology in any evolving urban growth study. Therefore, it’s a collection, interpretation, analysis, managing, storing and distribution of Geospatial data which is very much important for urban sprawl detection and planning activities for managing the unplanned growth of a city. Remote Sensing can give detailed information about spatial and temporal information of urban morphology, infrastructure, land cover / land use patterns (Bhatta, 2010). Remote sensing data are capable of detecting and measuring a verity of elements relating to the morphology of cities , such as the amount, shape, density, textural form , and spread of built up areas (Webster, 1995). Four dimensions of any remote
sensing image which has to be considered are spatial, spectral, radiometric and temporal. To identify the quantification, characterization and dimension of sprawl using index defined by George Galster in his paper ‘Wrestling Sprawl to the Ground: Defining and measuring an elusive Concept’. The main objective of this paper is to calculate and analysis the results of this index. 1.1 Study Area and Data Used Rajkot is one of the fastest developing cities located on the western part of India (Figure 1). It was founded by the ruler of Sardhar 1608 A. D. on the west bank of the river Aji as a small fortified town .which has now grown into a one of the major cities of Gujarat. City of Rajkot has Madhapar and Manharpur out growth in the north-west of Rajkot city. There is outgrowth of Bedi in north east direction of the city. More growth is observed in western region which has Munjka and Mota Mava outgrowth. And in the south we can see Vavdi and Kotharia outgrowth (Gazetteer, Rajkot, GOI). The study has been conducted using LISS IV data acquired from RESOURCESAT- 2 satellite image of Rajkot city. Image for November 2011 of the 150 Path and 44 Row has been downloaded for this study. Thematic Maps of Ward boundary was collected from Rajkot Municipal Corporation in shape file format. City Development
INTERNATIONAL JOURNAL OF BUILT ENVIRONMENT AND SUSTAINABILITY Published by Faculty of Built Environment, Universiti Teknologi Malaysia
Website: http://www.ijbes.utm.my
IJBES 3(2)/2016, 86-92
Quantifying Urban Sprawl for Rajkot City using Geospatial Technology
Shaily Raju Gandhi1*, Shashikant A. Sharma2 and Anjana Vyas1 1Faculty of Technology, CEPT University, Ahmedabad, India. 2Space Applications Centre, ISRO, Ahmedabad, India.
*Email: [email protected]
ABSTRACT Urban sprawl is one of the avidly urban issues today. “Sprawling” means the spreading of urban area towards rural area surrounding it. There are different social and economic factors which led to urban sprawl. The study of urban sprawl in this paper attempts to measure the sprawl of urban areas into rural areas and the type of sprawl and the pre-dominant causes responsible for sprawl. It first reviews and analyses past research on the definitions of urban form, compactness and sprawl, and corresponding quantitative variables. Measures of urban sprawl will be identified and procedures will be developed to compute these indicators in GIS environment. The indicators of sprawl defined by (Galster et al, 2001) are considered as major characteristics of sprawl which have been adopted in this paper to develop a set of variables for quantification, characterization and dimension of sprawl.The study has been done on grid level (Grid Size = 500m x 500 m). The density index shows that in 2001 Rajkot had 9292 persons per grid of 500 meters x 500 meters which has decreased to 7394 persons per grid which shows that the population is moving from center to outer fringes. The value of concentration index has decreased from 0.56 in 2001 to 0.23 in 2011 which shows the sprawl development pattern. Centrality has been one of the major indicators of urban sprawl the value of centrality has been observed as 3.7 in 2001 and it has increased to 7.6 in 2011 which indicates sprawl.
History:
Received: 22 January 2016 Accepted: 30 March 2016 Available Online: 30 May 2016 Keywords:
Urban Sprawl, Satellite Imagery, GIS, Urban Index DOI:
10.11113/ijbes.v3.n2.124

87
Plan with land used details was obtained from Rajkot Urban Development Authority Web site in PDF format. Population data at ward level was taken from Census of India 2001 (Figure 2) and 2011 (Figure 3).
2. Methodology The methodology consists of several steps: data collection from multiple sources, data processing such as image fusion and digitizing, temporal mapping, evaluation based on spatial indicators and comparisons. The main quantitative analysis includes morphology analysis and spatial pattern analysis. For this study multi date satellite data have been collected and georeferenced. Visual image interpretation has been performed on this remote sensing data to obtain the urban area from the satellite image. Ward boundaries were superimposed on the urban layer. Land use layer was created from the PDF first step was to convert the PDF into image. Then this image was georeferenced with the satellite data and the Land use layer was digitized from this image. This layer gives information about the land use according to the government rules. Population data from Census of India was integrated with the ward boundaries. Grid of different size were created using fishnet tool. Population data was then integrated with grids and a micro level analysis is done for different indices are calculated for the understanding the characterization and dimension of urban sprawl namely density, continuity, concentration, clustering, centrality, mixed use. These indexes have been modified according to the demographic data. The study area is divided into square grids of 500m×500m. On these grids all the urban sprawling index are calculated using field calculator. 2.1 Indices Calculation Urban sprawl quantification is done using the indices. These indices can be used to understand the characteristics of urban sprawl. The methodology used to measures urban sprawl will be identified and procedures will be developed to compute these indicators in GIS
environment. The following Table 1 shows the indicators of sprawl defined by (Galster et al ,2001). In this paper the study area is divided into small grids of 500m×500m and bigger grids are of 1000m×1000m. The above mentioned measures are calculated grids level.
3. Results and Discussions 3.1 Density Density is calculated to show the population in a particular area. In this paper micro level analysis is done for each index which gives a better result. Density is calculated using the following formula.
Gross Density = (Total population Grid/ Built up Area of Grid) Where Grid Size = 500×500 meters, and 1 dot = 1,000 person It is observed from Figure 2 and Figure 3 Population has decreased from 9292 persons per grid in 2001 to 7394 persons per grid in 2011. People have moved out in the new developed areas in all directions from the center. Wards in the central Rajkot are densely populated in 2001 where as the density has reduced over a period of time and has spread in the new built up areas. New development in Ward 1, 2, 3, 5, 6, 17, 21, 12, 11, 13, 12 have changed the population density of the central wards, people have migrated to outer areas where new housing
Figure 1: Rajkot City
Dimension Indicators
Density Development density: Residential units and
Continuity Developed area divided by total metropoli-
Concentration Percentage of very high density grids among
Coefficient of variation in the density of
Delta Index
Clustering Calculating density of each one square mile block of the grid and of each of the 1/4th square mile blocks within it. The standard deviation of each 1/4th mile square block from their associated one square mile block density are then averaged and standardized using the average density of all one square
Centrality Average distance of housing units or em-
Mixed Use Average density of one land use in the area of a separate land use
Table 1: Measures of Sprawl

88
development is taking place and land price is lower compared to central zone more over new industrial development is also attracting people to move away from CBD. 3.2 Continuity Continuity is the degree to which developable land has been built upon at urban density in an unbroken manner (Ewing, 1997; Harvey & William, 1965). Following formula is used to calculate continuity:
Continuity = Developed area /total metropolitan area According to Figure 4 and Figure 5 given above continuity for 2001 is 0.34 and for 2011 is 0.66. Hence, it is observed that continuous development has taken place over a period of time. A ribbon development pattern has been observed in North West direction and in the south direction. There is a smooth and continuous development which indicates extent of scattered development. Most of the growth has happened along the fringes of urban area. Water bodies, protected wetlands, forest, parks, other public reservation are not considered as interruptions of continuous development pattern. 3.3 Concentration Concentration is the degree to which development is located disproportionately in relative to 500m x 500m of the total urban area rather than spreading evenly throughout. Following formula is used to calculate concentration as proposed by Galster et al. (2001), where: D(i)u = Density of land use over the developable land area in urban area
D(i)m = Density of land use over the developable land area in 500m×500m grid As observed from figures 6 and figures 7 urban areas here are continuously growing but all urban areas are not evenly developed. Here in 2001 concentration is 0.56 and in 2011 concentration is 0.23. Due to high concentration in 2001, the development is evenly distributed. Whereas in 2011 there is high concentration in the central wards and a few other areas high concentration are observed in the North West direction. Low concentration is observed in the outgrowth of ward 1, 2, 5, 12 and 13; hence development pattern is sprawl like in the wards mentioned here. 3.4 Clustering Clustering is the degree to which development has been tightly bunched to minimize the amount of land in each 1000m x 1000m grid of developable land occupied by residential or non-residential uses. Following formula is used for calculating the clustering (Galster, 2001). D(i)s = Density of landuse over the developable land area in 500m× 500m grid D(i)m = Density of landuse over the developable land area in 1000m×1000m grid
Figure 2: Rajkot Population Density 2001 Figure 3: Rajkot Population Density 2011
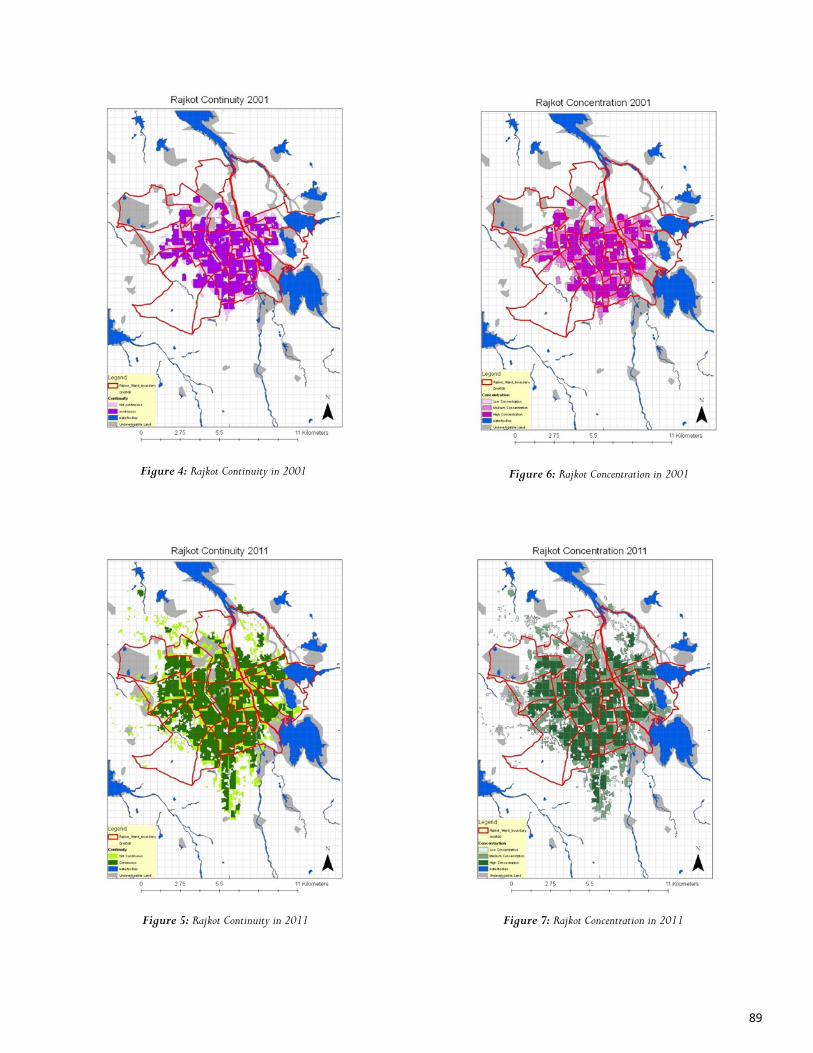
89
Figure 4: Rajkot Continuity in 2001
Figure 5: Rajkot Continuity in 2011
Figure 6: Rajkot Concentration in 2001
Figure 7: Rajkot Concentration in 2011

90
As observed from Figure 8 and Figure 9 Clustering value for 2001 is 0.58 and for 2011 it is 0.52. The change observed in very insignificant. Clustering is concerned with the development pattern within the grids. In some grids development is dense and concentrated but not very clustered. The central ward represents high clustering during observation periods.
Figure 8: Rajkot Clustering in 2001
Figure 9: Rajkot Clustering in 2011
Figure 10: Rajkot Centrality in 2001
Figure 11: Rajkot Centrality in 2011

91
3.5 Centrality Centrality is the degree to which residential or non-residential development is located close to the central business district (CBD) of urban area has been studied. The following equation is used to calculate centrality (Galster et al., 2001): T(i)u = total number of observations of land use in Urban Area A = Total Area F(k,m) = distance from CBD T(i)m = total number of observations of land use in 500×500 grid As observed from figures 10 and figures 11 Centrality for 2001 is 3.7 where as it has become higher for 2011 to 7.6. Increase in centrality, is one of the most common elements of sprawl. Highly decentralized area as residential and non-residential are spread over a lager region. Decentralization of Sprawl in urban area is often cited as a cause for longer travel distances and consumption of more time reflects inefficiencies in land use. The result reveals the pattern is poly nuclear, represents more than one commercial and industrial area. Hence it results in shortening employee’s journey to work. Employees are distributed all over the urban region. 3.6 Mixed Use Mixed land use is the degree to which substantial number of two different land uses exits within the same grid. Following equation is used for calculating the mixed use: Three types of land use are considered: Residential, Commercial and Industrial. Grids which have more than one land use type in them are considered as mixed use. As observed from figures 12 and figures 13 the value of mixed use is 0.21 for 2001 and 0.24 for 2011 which shows very marginal change in a decade. Mixed landuse remained as a part of the urban settlement, with the increase of the sprawl of the area of mixed land use increases. 4.0 Conclusion All the index derived are being placed together. Density index shows that there is decrease in density representing population are getting scattered. There is a smooth and continuous development. Continuity has increased over a period of time. In 2001 it is observed that there is high concentration throughout hence the development is more evenly distributed. Whereas in 2011 the concentration has been reduced to half the value. Clustering is having similar pattern in both the years. In 2001 it is seen that it is
more centralized as we move towards 2011 centrality is lost and many new poly nuclear pattern of development is seen. Value of mixed use suggest that ratio of mixed use on single land use is showing similar value.
Figure 12: Rajkot Mixed Use in 2001
Figure 13: Rajkot Mixed Use in 2011

92
These results can be of great use for developing the city plan. According to these results Rajkot Municipal Corporation can take up the issues in each ward and work on the development of the city ward by ward. Each Index has been calculated for a 500 m x 500 m grid which leads to better understanding of the areas which require more attention and areas which are open for new development. Acknowledgments The authors are thankful to ISRO for providing the satellite data used in this study. The authors are also thankful to Rajkot Municipal Corporation for their cooperation and support for this study. The authors are highly thankful to CEPT University for providing the computing facilities. This paper is a part of Minor study for PhD degree carried out by Shaily Gandhi, CEPT University. References Abed, J., & Kaysi, I. A. (2003). Identifying urban boundaries: application of remote sensing and geographic information system technologies. Canadian Journal of Civil Engineering , Vol. 30, No. 6 : 992–999. Alexander, C. (1965). A city is not a tree. Architectural Forum ,Vol. 122, No. 1: 58–62. Angel, S., Parent, J., & Civco, D. (2007). Urban Sprawl Metrics:An Analsys Of Global Urban Expansion Using GIS. Proceedings of ASPRS 2007 Annual Conference (pp. 1-12). Tampa, Florida: URL: http://clear.uconn.edu/publications/research/tech_papers/Angel_et_al_ASPRS2007.pdf. Bhatta, B. (2010). Analysis of Urban Growth and Sprawl from Remote Sensing Data. Kolkata: Springer. Census of india 2001. New Delhi: Government of India. Census of india 2011. New Delhi: Government of India. Eryilmaz, S. S., Cengiz, H., & Eryilmaz, Y. (2008). The Urban Sprawl Model for an Affected Metropolis:. 44th ISoCaRP Congress 2008, (p. 12). China. Esnard, A. M., & Yang, Y. (2002). Descriptive and comparative studies of 1990 urban extent data for the New York Metropolitan Region. URISA Journal ,Vol. 14, No. 1 : 57-62. Ewing, R. (1997). Is Los Angeles - Style Sprawl Desirable? Jouranal of the American Plannig Association , Vol. 63, No. 1 : 107-126.
Fulton, W., Pendall, R., Nguyen, M., & Harrison, A. (2001). Who Sprawls the Most? How Growth Patterns Differ Across the US. Washington, DC: The Brookings Institution center on Urban and Metropolitan Policy. Galster, G. (1991). Black suburbanization: has it changed the relative location of the races? Urban Affairs Quarterly , Vol. 26, No. 4 : 621–628. Galster, G., Hanson, R., Wolman, H., & et al. (2000). Wrestling Sprawl to the Ground: Defining and Measuring an Elusive Concept. Working Paper of Fannie Mae , 1–38. Galster, G., Hanson, R., Wolman, H., Coleman, S., & Freihage, J. (2001). Wrestling sprawl to the ground: defining and measuring an elusive concept. Housing Policy Debate ,Vol. 12 , No. 4 : 681–717. Goodchild, M. F. (2000). Spatial analysis: methods and problems in land use management. (M. J. Hill, & R. J. Aspinall, Eds.) Singapore: Gordon and Breach Science Publishers. Gujarat Town Planning and Urban Development. (1976). General Development Control Regulations. Rajkot: Rajkot Urban Development Authority. Harvey, R. O., & William, C. A. (1965). The Natural and Economics of Sprawl . Land Economics , 1-9. Lata, M. K., Dr. Prasad, K. V., Dr. Badarinath, K. V., & Dr. Raghavaswamy , V. (2001). Measuring Urban sprawl' A case study of Hyderabad'. GIS development , 26-29. Paddision, R. (2001). Handbook of Urban Studies Paddison. London: SAGE Publication. Patel, S., & Deb, K. (2006 ). Urban Studies. New Delhi: Oxford University Press. Pathan, S. K., Shukla, V. K., Patel, R. G., & Mehta, K. S. (1991). Urban land use mapping - A case study of Ahmedabad city and its environs. Journal Indian Socity of Remote Sensing , Vol. 19, No. 2 : 95- 112. Rajkot Mulcipal Corporation. (2005). Rajkot City Development Plan. Rajkot: Rajkot Urban Development Authority . Rajkot Municipal Corporation. (2012). Preparation of Second Generation City Development Plan for RMC as well as RUDA. Rajkot: CRISIL Risk and Infrastructure Solutions Limited. Webster, C. J. (1995). Urban morphological fingerprints. Environment and Planning B ,Vol. 23, No. 3 : 279–297.
Index 2001 2011 Change
Net Density 9292 7394 -
Continuity 0.34 0.66 +
Concentration 0.56 0.23 -
Clustering 0.58 0.52 -
Centrality 3.7 7.6 +
Mixed Use 0.21 0.24 +
Table 2: Urban Index
93
1. Introduction
Throughout the various stages of architectural history, the richness of architectural design values has contributed to the independent concepts for the formation of novel ideas. The injection of traditional design values has generated significant impacts on the overall quality of the built environment. Implementation of traditional design values in contemporary architecture acts as a manifestation between past, present and future (Rapoport, 1969). Design values of the Malay traditional houses have recognized as one of the rational architectural movements in the context of time. Additionally, design values have been adopted based on pure ideology and belief as a notable architectural style that can be highly accretive to the contemporary Malay house design (Ismail & Sani, 2002).
Despite the richness of architectural design values in the Malay traditional house, inattentiveness to the values of traditional design in contemporary Malay house architecture has become a controversial subject among scholars and practitioners (Heynen, 2005). Currently, the manifestation of design values in contemporary Malay house architecture is the core of discussion on the problematic issues in architectural design. The contemporary Malay House architecture is an outcome of this inattentiveness. It loses its originality and becomes a hybrid global architecture with existential conflicts between its origins and new architecture (Gurupiah, 2008).
Numerous efforts have been attempted by scholars and practitioners to address the relevant issues. For instance, Pallasmaa (2007, p. 134)
asserted that the spirit of time and place through an unorthodox juxtaposition of modernist vocabulary and traditional design has been rooted in the viewpoint of the architectural practice. This perspective was adopted as a creative approach without borrowing any possible origins from elsewhere, to achieve modern approval and a modest atmosphere in the design of buildings. According to Allsopp (1977, p. 13) traditional architecture embodies the experiences of ancient designers that are highly significant to contemporary architecture. The consistency of the design in contemporary architecture produces a positive sense of the visual aspect, experiencing physical and spatial features as an honest approach to the form, materials, organization of spaces and cultural symbolism (Saleh, 1998, pp. 571-589). Although, scholars agree to have demonstrated various models, ideas and design approaches to the issues, inattentiveness to the design values and concepts of traditional Malay houses as an interactional bridge between past and present is perceivable and occurs across the country. The traditional architecture is now being modified by unfettered ideas and bad imitations. Traditional Malay houses have a positive impact on inspiration of meaning of tradition design concepts and values in contemporary Malay house.
It is becoming a crucial subject to utilize the idea of traditional design values in contemporary architecture, particularly based on theoretical approaches such as critical regionalism, vernacularism, and modern regionalism (Gurupiah, 2008). Modification and adaptation of contemporary architectural design by means of traditional design experiences are vital to the development of new trends in the design processes of contemporary Malay houses.
INTERNATIONAL JOURNAL OF BUILT ENVIRONMENT AND SUSTAINABILITY Published by Faculty of Built Environment, Universiti Teknologi Malaysia
Website: http://www.ijbes.utm.my
IJBES 3(2)/2016, 93-101
Implementation of Traditional Malay Design Values in Contemporary Malay Houses Elham Hosseini1*, Gurupiah Mursib1, Raja Nafida bt Raja Shahminan2 1Department of Architecture, Faculty of Built Environment, Universiti Teknologi Malaysia, Johor Bahru 2KALAM, Department of Architecture, Faculty of Built Environment, Universiti Teknologi Malaysia, Johor Bahru
*Email: [email protected]
ABSTRACT Traditional houses are the most essential architectural experience that is in harmony with the people's culture, beliefs, environment and lifestyles. The development of design values in contemporary architecture by tracking traditional design values in architecture paves the way for arguments concerning the implementation of authentic Malay traditional house design values in contemporary Malay houses. In addition, it is hypothesized that the Malay traditional houses theoretically provide a constructive innovative framework for the design performance of the contemporary Malay house. In this research, data was compiled through field observation and documentary review. The evidence revealed that Malay traditional houses convey a concrete message of richness encompassing architectural design values and theoretical propositions. The credibility of the results was improved and confirmed by a confluence of evidence via a confirmation process. The findings suggested that there is a rich source of subjective support, lending proof to the premise of the research investigation. The research has highlighted the significance of traditional architectural design values towards innovative design in the architecture of contemporary Malay houses as a workable pattern for use in the design of contemporary architecture.
History:
Received: 05 January 2016 Accepted: 10 April 2016 Available Online: 30 May 2016 Keywords:
Traditional Architecture, Malay Traditional House Architecture, Design Values, Contemporary Malay House Architecture. DOI:
10.11113/ijbes.v3.n2.125

94
Given the general significance of traditional architecture, this paper argues that the design values of traditional architectural of Malay houses should be incorporated into the implementation of contemporary Malay architectural houses designs. The relevance and benefits of this implementation are demonstrated by Shahedi (2004), who attempted to utilize the most fundamental principle of historical precedents that significantly develop values, meaning and order in contemporary architecture.
The assessment of arguments has been achieved through cross examine the evidence, providing a series of facts which connect in a logical theoretical foundation and followed by a confirmative process, discussion and justification of the outcome.
2. Overview of Architectural Design Values
The term “architectural design value” in this research is used in the context of traditional architectural design which has a considerable significance to the design of the traditional Malay house and consequently to contemporary Malay houses. Design values have always been important throughout history of architectural practice. Architectural design values represent the excellence of total design quality. Such qualities include but not limited to goodness, wholeness, art, craftsmanship, integration, user quality and so on. The concept of design value in architecture cannot be isolated from history, tradition and theory as a historical momentum to clarify design values in a specific context. A comprehensive design value speaks not only to the individual, but to the society's cultural context. In the composition of traditional Malay house compounds in rural Melaka the significance of historical momentum was brought up as a series of predetermined explorative concept (Ani, Mohamed, & Rahman, 2012) such as minimalism, spirit of place, etc.
Similarly, the significance of architectural design values was brought up in relation to historical and traditional background, particularly the design value of structural honesty which has been specified not only as "considerable historical and traditional roots but as an architectural design value which is commonly found within many design movements and among many individual architects” (Holm, 2006). Although some technical aspect of architecture can be measured quantitatively in unproblematic ways, such as cost, energy performance and overall ecological performance, the value of design is not measurable because it is not a quantifiable quality of architectural design. Additionally, design values are the rational inquiry vs. the intuitive. Architecture was an expressible societal functional system that can be made according to a rational inquiry (Schumacher, 2011). Successful architectural design values must be the same as the final products of a total design process. In the process of designing, the ultimate outcome of design is a product and not framing the issues of concept and design principles (Prins, 2009). Architectural design values begin with a concept and ordering principle. The ordering principle applied as part of the architectural design principle. The establishment of design values in architecture creates a unique expertise or core of proficiency in legible organization of the built environment in relation to the community, the framing, the structuring and priming of social communicative interactions. Additionally, stabilize the patterns of communication to be supported by means of spatial framing.
3. Bridging Tradition and Contemporary
The contribution of the architectural design values of precedent traditional architecture and its role in contemporary architecture generally understood as a treasure-store of design values and attributes (Shahedi, Keumala, & Yaacob, 2013). Contemporary architecture
demands a deep understanding of societies' background and awareness of traditional architecture. Bird (2008) concluded, "The iconographies of indigenous culture and local geological conditions have been very productive players in the making of contemporary architecture in building and urban development scale.” The implementation of indigenous materials it’s a harmonious process in the nature of the contemporary house setting. This includes effective ventilation, protection from direct sunlight thus regulating the indoor temperature, maintaining and utilizing the various indigenous building materials while preserving the authenticity of the design values of the Malay traditional houses.
Traditional architecture is a mixture of tangible elements that perceived through the eyes and are discernible through the overall visual character; and intangible elements which are perceived through the senses. However, both are laid in the physical and spatial characteristics of Malay traditional architecture, creating a valuable combination of the values of architectural design of the house. The characteristics of traditional architecture with respect to its context are a result of dwellers' perception and experience of the built environment. The notions of traditional architecture have always demonstrated the quality of its design values through an understanding of visual shape, form, materials, trim, opening, projection, exposed structure and setting in relation to the environmental context. In addition, conceptual elements of design also contribute to the individual space, related space, sequential space and adjacent (Figure 1). These elements of design values depict in the form of humanistic architecture of the local people who are ethically tied up in their traditional houses.
Figure 1: Conceptual elements of design contribute to the individual space, related spaces, sequential spaces and adjacent spaces.
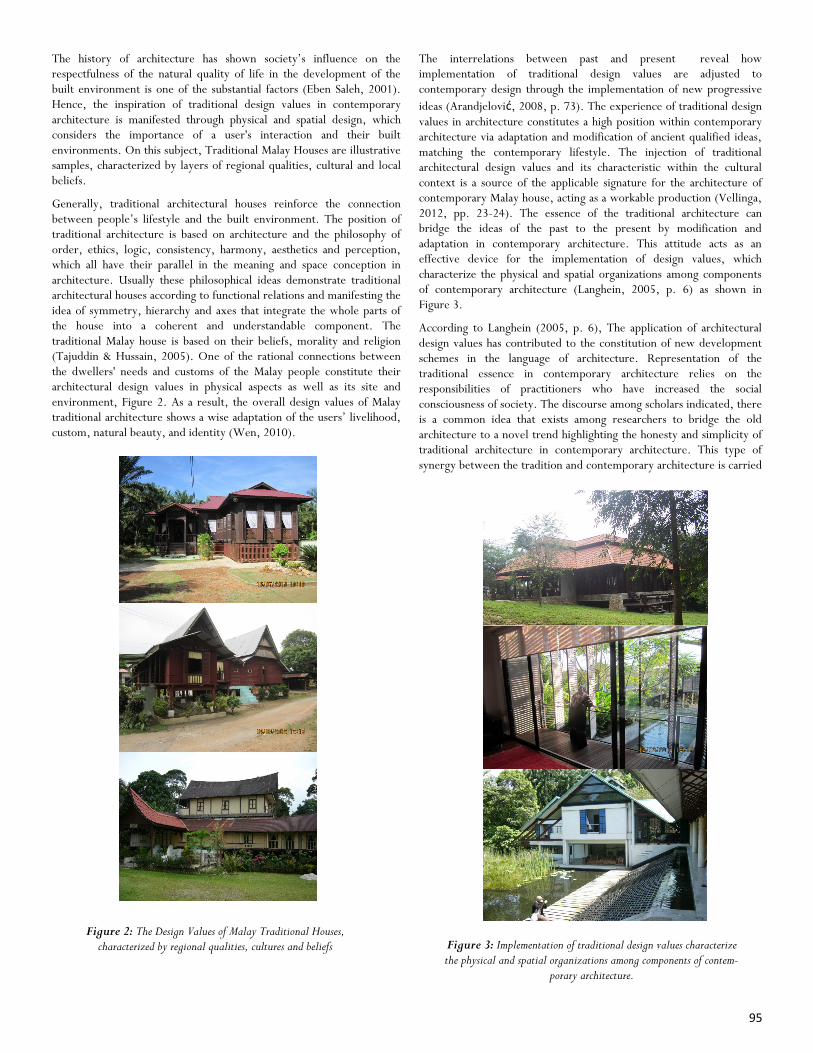
95
The history of architecture has shown society’s influence on the respectfulness of the natural quality of life in the development of the built environment is one of the substantial factors (Eben Saleh, 2001). Hence, the inspiration of traditional design values in contemporary architecture is manifested through physical and spatial design, which considers the importance of a user's interaction and their built environments. On this subject, Traditional Malay Houses are illustrative samples, characterized by layers of regional qualities, cultural and local beliefs.
Generally, traditional architectural houses reinforce the connection between people’s lifestyle and the built environment. The position of traditional architecture is based on architecture and the philosophy of order, ethics, logic, consistency, harmony, aesthetics and perception, which all have their parallel in the meaning and space conception in architecture. Usually these philosophical ideas demonstrate traditional architectural houses according to functional relations and manifesting the idea of symmetry, hierarchy and axes that integrate the whole parts of the house into a coherent and understandable component. The traditional Malay house is based on their beliefs, morality and religion (Tajuddin & Hussain, 2005). One of the rational connections between the dwellers' needs and customs of the Malay people constitute their architectural design values in physical aspects as well as its site and environment, Figure 2. As a result, the overall design values of Malay traditional architecture shows a wise adaptation of the users’ livelihood, custom, natural beauty, and identity (Wen, 2010).
The interrelations between past and present reveal how implementation of traditional design values are adjusted to contemporary design through the implementation of new progressive
ideas (Arandjelović, 2008, p. 73). The experience of traditional design
values in architecture constitutes a high position within contemporary architecture via adaptation and modification of ancient qualified ideas, matching the contemporary lifestyle. The injection of traditional architectural design values and its characteristic within the cultural context is a source of the applicable signature for the architecture of contemporary Malay house, acting as a workable production (Vellinga, 2012, pp. 23-24). The essence of the traditional architecture can bridge the ideas of the past to the present by modification and adaptation in contemporary architecture. This attitude acts as an effective device for the implementation of design values, which characterize the physical and spatial organizations among components of contemporary architecture (Langhein, 2005, p. 6) as shown in Figure 3.
According to Langhein (2005, p. 6), The application of architectural design values has contributed to the constitution of new development schemes in the language of architecture. Representation of the traditional essence in contemporary architecture relies on the responsibilities of practitioners who have increased the social consciousness of society. The discourse among scholars indicated, there is a common idea that exists among researchers to bridge the old architecture to a novel trend highlighting the honesty and simplicity of traditional architecture in contemporary architecture. This type of synergy between the tradition and contemporary architecture is carried
Figure 2: The Design Values of Malay Traditional Houses, characterized by regional qualities, cultures and beliefs Figure 3: Implementation of traditional design values characterize
the physical and spatial organizations among components of contem-porary architecture.

96
out through the adaptability and mobility of traditional design values in creative architectural designs. The house are characterized by their deep overhang that provide shade and cut out low angle tropical sun, verandas space that act as a transitional, semi public zones; specification of local materials indigenous to the region to support the local economy and minimize the negative environmental effects of transportation, and the sensitivity to both local culture and topography as shown in Figure 4.
A reflection of architectural precedents reveals the various principles and values that are linked to what is known and understood as a system of thought. The sense of traditional Malay house architecture is accentuated on the use of order, scale, proportion, space, colour and natural light. Elements of structure, functions, and materials have considerable traditional values in the architecture of ancient times. The integration of traditional design values with contemporary design is confined to the particular situation of projects, contextual gesture and environmental demands (Holm, 2006, p. 257). Traditional design values are a cultural injection that improves contemporary architecture and reveals how design structuralism has characterized its values through traditional evidence. It is evident that the key factors to be sought in the traditional design values could be observed in its original
essence. In this respect, utilization of various aspects of traditional Malay design values have been intertwined with its ideology, and philosophy of simplicity and purity, which found as a humanistic form of architecture suitable for human society. The architecture of the past to the present produces such humanistic design values, which are accomplished by perceiving and understanding the essence of traditional architectural characteristics. The values of design in today’s architecture demonstrate the rationality of a design’s success, which uncovers new elements and criteria from tradition. The implementation of these design values provides a balance between traditional and contemporary architecture. Integration of past into present is a key to the new way of life, by continuity of the modern movement based on traditional ideology (Fister, 2001). This interplay between cultural context and traditional architecture is a unique intellectual development procedure in contemporary lifestyles. As such, Shahedi and his co-authors (2012) hypothesized based on relevant studies that users’ perception of traditional historical buildings could result in a more satisfying architecture than those recent ones without any meaningful background.
4. Theoretical Approaches: Traditional Design Values in Relation to Contemporary Design
The incorporative of traditional design values in contemporary architectural design expresses different components of the built-form in the language of architecture. The level of combination between the Past and present, theoretically, makes the circumstances possible to match contemporary architecture with the state of the environment and present contemporary architecture in a sensible manner. Different theoretical viewpoints have been posed by scholars to implement several approachable solutions by utilization of traditional architecture as a social instrument to provide solutions to the issues of contemporary architecture.
Rasmussen’s (1964) asserted, Diversity of architectural design values has been found throughout history in great buildings from ancient to modern times. This diversity is an important part of a logical relationship that interplays within the context of traditional and contemporary design values. Hence, design values independently cannot be treated as an element by itself, unless we relate it to several qualities of design about expression, originality of honest materials and form. The significance of architectural history indicates a special relationship of wholeness to create a pattern in which users manipulate to take charge of their own environment (Alexander, 1987). This process is embedded in the sequence of time through “theoretical and practical innovation. ”Contemporary architecture, through the principals of design relating to the expression of traditional Malay design values, gives rise to the sense of spatial and physical quality of the overall visual and conceptual aspect. It depicts the wholeness of the spirit of the time and the contextual interaction to the built environment Values. Theoretical perspectives including regionalism and vernacular as defined by scholars are embedded in the key elements of traditional architecture. The term “Vernacular’ architecture” is a development of folk architecture that raised the spiritual aspect of architecture as a significant and symbolic means for man in relation to “nature, awareness, ideas, concept or philosophical idea” (Allsopp, 1977).
Vernacular architecture holds a central position in traditional design values that relied on the purification of its function. This can be used to uncover the factual meaning of contemporary architecture in a
Figure 4: Adaptability and mobility of traditional design values in creative architectural design. Source: Idea House (Pomeroy, 2011)

97
disciplinary theoretical manner of simplicity of order and style. A number of points of view exist, based on the theory of vernacularism, involving with the local needs and society’s demands in contemporary lifestyles. As a result, a varying scale of traditional design values have influenced contemporary architecture (Gurupiah, 2008, pp. 103-334). By using a combination of the new techniques in construction and materials, a translation and interpretation of traditional outcomes is achieved through the foundation of vernacularism approaches (Gurupiah, 2008, p. 105). Culture and identity are two modifiable issues that reflect the current condition of a region (Eggener, 2002). From the regionalism point of view, seeking an acceptable universal architecture that follows the original expression of traditional design values may translate the customs, user needs and built environment (Lefaivre & Tzonis, 2003). For example regionalism has always emphasized the interaction between architecture and users based on and cultural and environmental contexts (Brown, 2009). Development of visual harmony among building components is chief among the accomplishment of purposive relations between the overall architectural design values and environmental characteristics. The design values of regionalism architecture are the most substantial issues in identifying folklore architecture (Lefaivre & Tzonis, 2003). According to Brown(2009) "traditional architecture can take a moral or ideological position where it demands that architecture expresses the shape or form of a better society”. The contribution of traditional architecture to the issues of contemporary architecture is a theoretically approach, characterizing the values of contemporary architectural design, which rely on the cultural background of nations and environmental requirement of users (Mumford, 1941, p. 30). Architecture and tradition look at the uses of traditional design values in the pursuit of quality, character, style, place, language and sense of order, to the contemporary architectural design (Uysal, 2004).
Malay contemporary houses can have creative designs that bridge the past and the present. Thus, in these cases, the values of design and its attributes of traditional architecture are revealed through the tangible and intangible character of forms and spaces in contemporary architectural phenomenon. The values of design are notably recognized as being derived from the simplicity and minimal traditional design concepts bounded by the perception of ontology, diversity, spontaneous harmony, analogy and correlative mode of thinking. Recreation toward the traditional design values in contemporary design is an acceptable and appreciated style, preserving the balance between past and present as one of the crucial discussions among scholars and practitioners. Literal replication of traditional design values in architecture contributes to a creation of innovative design for contemporary architecture. The new form of built environment involves a new perception shaped by values of traditional design through theories as a complementary frame of reference in architectural practice (Brown, 2009).
Contemporary architecture is manifested through the identification of a particular environment and harmonization of buildings within the environmental conditions of a settlement (Gelernter & Dubrucq, 2005). The expression of contemporary architecture by implementation of traditional design values establishes a rational link between culture, architecture and its built environment. Critical regionalism is the key theme that synthesizes the local cultural meanings, which make the architectonic feature apart from any cultural prejudice (Canizaro, 2007, p. 374). Additionally,
regionalism presented an alternative approach to the development of contemporary architecture excluded from any dehumanizing aspects of forms (Ingersoll, 2007, p. 387). The modern regionalism performance is a compatible transformation of traditional design values into contemporary architecture that characterizes the quality of the current built environment. Traditional transformation reinterprets the values of design to the new trend in principles of design concerning culture, technology and climate, etc. (Gurupiah, 2008, pp. 103-107). Utilization of traditional design values has indicated the sustainability of architectural design in the discourse of modern regionalism, which generate innovative ideas toward the improvement of contemporary architecture (Moore, 2005, p. 433). To prevent the contemporary Malay house design from losing their regional character, design values and architectural language, different theoretical approaches can resolve the issues in contemporary Malay house design.
The influence of culture and geography as the factual phenomena in the determination of architectural design values are characterized without any constraints on material and construction of the overall design as a minimal with the actual condition of life and built environment. Hence, simplicity of design, material honesty, and interaction with the context of design are key values in contemporary architecture that symbolize the overall traditional architectural design, identifying the effective factors in the creation of contemporary architecture (Frampton, 1983). The
Figure 5: Design Values of the Malay traditional houses are linked to the habitants’ spiritual, ethical, social interaction and ideology.

98
indication of theoretical position is related to the spirit of time for which the architecture is made. The values of traditional design forming a new type of architectural concepts with a high level of originality that belongs to the people, expressing the communal feeling.
5 Observational Evidence
The observation sessions during the research sought to provide a complementary support to achieve the objective. The course of observation was augmented through interactional process with dwellers over the months. The overall organizational process of Malay traditional houses was connecting to the local culture, lifestyle, and conditions of the built environment. It was also observed to be linked to the habitant’s spirituality, ethics, social interaction and ideology (Figure 5). The Malay traditional houses were woven to characteristics of the built environment with symbolic meanings as a complement to the components of Malay traditional houses. Without doubt, as one approaches the houses and moves through the different segments, he/she would discover that the design values of the houses express a reflection of originality, simplicity, honesty, minimalist character and sense of order that is built upon a firm structural stilted platform.
The spirit of traditional houses is manifested through a simple physical and spatial organization of form and space. For instance, the geometry of the high-pitched roof and its related design element are observed to be important to the Malay traditional houses' overall design values. The qualities of materials, surface and craftsmanship are observed to be important up-close qualities that contribute to the high level of values in the originality of design. During the observation session, the “Selang” is observed as a well defined joint, articulating the segments of the frontal and posterior zones of Malay traditional houses (Figure 6).
The spatial hierarchy of Malay traditional houses reflects the interrelationship of functional requirements and spatial elements, which are closely tied to the spatial quality of the aesthetic design value of Malay traditional houses. The houses are constructed with simple geometry, plans and elements. The use of uncomplicated geometry indicated the architectonic typological design values of the overall layout of the house. Additionally, this clarifies the applicability of the simple geometric plan, relationships and logical organization of form, shape and spaces for the design of contemporary Malay houses that is enhanced by the intellectual and emotional perception of the systematic method of the Malay traditional house structure. A strong sense of geometric representation is also perceived through the building components, which not only functionally relate activities to other activities, but geometrically as well. The use of simple treatments in the organization of form and space in relation to the systematic process of the linear structural system is perceived as tangible in the overall spatial relationship. The plan and its circulation movement within the functional space were identified as simple adjacent spaces in relation to the circulation path of the house (Figure 7).
From the plans, it is easy to find a visual spatial connection in a sequential manner from the exterior stairs to the “Anjung”, to the “Serambi Gantung”, to the “Rumah Ibu”, to the “Selang”, to the “Rumah Tengah” and on to the “Dapur”. The visual qualities of the spaces are related directly to the plan of the houses. Thus the shape of the space revealed an essential sequential design values as a part of the Malay traditional houses. In addition, the core of the observation revealed the use of natural materials, such as, timber and other tropical supplies. This express the meaning of honest structure that contributes to the values of true and authentic qualities of house materials and architectural significance that convey a sense of time and place associated with the dwellers. An indication of such originality is seen in the timber structural open system technique that is influenced by the local conditions. The traditional Malay houses are not only perceivable through their visual character design quality, but also through the tangible experience of touching real and natural materials and even through the musty smell of timber. The sense of belonging to the spaces is observed to be a reflection of the traditional cultural beliefs of the Malay residents. The observation specified that the hierarchical design values formed, through the segmentation of the spaces depict into two distinct parts, the frontal and posterior zone. This expresses the levels of privacy on the basis of function and religion beliefs. This clear indication was understandable in
Figure 6: The geometry of high pitched roof, on-stilts structure, quality of materials, surface, craftsmanship and spatial segmentation of frontal
and posterior zones contribute to the high level of values in the originality of Malay traditional house design.
Figure 7: simplicity of plan and circulation movement. Source: (Amad, Sujud, & Hasan, 2007)

99
the tradition of the folklore architecture, as a succession in expressing the identity of the Malay community. The integration process of spatial design as a cultural pattern reflect the hierarchal
relationship between Serambi1, Rumah Ibu2, and Dapur3 as a sense of
cultural aspiration and creativity between architectural procession and or a sequence of movement in time (Figure 8). The sense of order was observed through the architectural elements and modularity in relation to the human body.
The Malay traditional house is observed to be representative of design values, which not only respond to the available regional materials, but also to the regional style, rather than representing the design of its period. For example, the traditional houses of Kampung Baru in Kuala Lumpur and Negeri Sembilan demonstrate the most appropriate regional architectures, respecting the characteristic of regional architecture while allowing for change by an innovative approach in a new tradition. The values of design in the Malay traditional houses have been experienced through the sensory factors, by touching, smelling, seeing and even hearing. The physical components of these houses experienced in two ways. Firstly it is experienced structurally, which is important to the firmness of the house. Secondly, it is experienced spatially, where the different zones of spaces for different functional activities are defined. The treatment of openings on the different sides of the house allows penetration of natural light while giving a special quality to the spatial characteristics of the interior spaces in different parts of the house. The quality of ornamental elements is perceived as a dynamic symbolic gesture, which is devoted to different parts of the house. As a result, a house can be observed as a complete unit of artistic work that represents a number of design values (Figure 9). The dynamic gesture of design elements devoted to the quality of different parts of the house. For example, a semantic reflection of the wooden craft pattern depicts the idea that relates to sacred beliefs, exhibiting the local arts and craft, and demonstrating the approach of delight to local cultural beliefs of the Malaysian society.
6 Confirmations
Although evidence from the body of the papers' in topics 2, 3 and 4 are cross examine and corroborate as a process of validation, the conformity of the implementation design values were also corroborated in the contemporary Malay houses to confirm the consistency of the research outcomes. The confirmatory process was conducted in the area of three single regional domestic architectural buildings to established support for the thesis argument (Kimmelman, Mogil, & Dirnagl, 2014). The samples were selected deliberately as the author's intention was to achieve a balanced literal replication through direct observation, based on the criteria explained in the following paragraphs.
The basis for selecting these confirmatory samples are derived from contemporary phenomenon within real life in order to examine the validation and assessment process (Yin, 2003). Each confirmatory sample selected to be a unit of human activity embedded in real life
(Gillham, 2000). Having more than two confirmatory samples will produce an even stronger effect. In the face of these benefits, having at least two samples should be the goal. However, more than two make it
Seram
bi
Ru
mah
Ibu
Dap
ur
Selan
g
Figure 8: The Hierarchical relationship between Serambi, Rumah Ibu, and Dapur (Source: KALAM)
Figure 9: The quality of aesthetics perceived as a dynamic gesture of symbolic ornamental elements devoted to different parts of the house.
______________________________________
1A type of verandah, which used to receive guests. 2Core Main area of house, which referred to as the „mother house‟. 3The Kitchen.

100
more valid as there are more experiments in experimental investigation(Yin, 2003, p. 54). All the three samples were influenced by a spirit of tradition and embodied a set of design values of the Malay traditional house that were integrated with modern techniques of architectural design. This conformity procedure illustrates the performance of traditional design values and their potential to be incorporated into particular samples of contemporary houses for more adaptability to their real context. Although there are apparent dissimilarities among the selected houses, factual evidence demonstrated considerable literal replication concerning the impression of traditional house design values of the contemporary Malay house. This established the applicable implementation of the research outcomes satisfactorily in the contemporary Malay architectural design house (Table 1). The confirmation process was drawn from the conceptual replication design method provides precise information in the right circumstances, supporting the argument and hypothesis that the implementation of architectural design values of Malay traditional houses increases the novelty of contemporary architecture and identity. This helps to retain the users, visitors, and society’s interest.
7 Discussion & Conclusion
The design values of the Malay traditional house that takes place within this domain have revealed a diverse reality concerning the essence of traditional architectural design. One of the distinctive outcomes of this research had signified that fundamentally, architectural design values rely on the traditional beliefs and perception of society. Theoretical appropriate approach in harmony with the nature of Malay traditional house architecture is implemented through a constant relationship between the cultural background and theory of architecture. The Malay traditional house is significant in its sustainable use of traditional component that contributes to its architectural character. Additionally, it is based on the belief that Malay traditional house design values are in accordance with the particular characteristics related to the derivation of regional and national identity. Bridging traditional design values and contemporary architecture through the principles of design relates to the Malay traditional house design values. The traditional Malay house is imbued with a number of values that influences the development of the design reality, such as originality, simplicity, honesty, minimal, interaction, quality, character, style, sense of order and architectural language as well as several functional aspects and its site environment. These design values and their diverse expressions are, to some degree, a reflection of the development that has taken place in the contemporary
Selected Samples
Design Values
Sample No.1 Sample No.2 Sample No.3
The spirit of the time and Place Yes Yes Yes
The structural, functional and material honesty Yes Yes Yes
Simple forms, i.e. Aesthetics without consider-able ornaments, simple geometry, smooth sur-faces etc.
Yes Yes Yes
It strives to create a connection between past and present forms of building
No Yes Yes
The classic, traditional and vernacular design value
Yes No No
The regionalism design value Yes Yes Yes
Relies on a belief on traditional designs as a preferred typology and template
No No Yes
Environmental design values Yes Yes Yes
Natural lighting, ventilation, Yes Yes Yes
Harmonize with the surroundings Yes Yes Yes
Maximum opening Yes Yes Yes
Table 1: Conformity of Implementation of Traditional Design Values in Contemporary Malay Houses

101
phenomena. Theoretical approaches such as critical regionalism, vernacularism, and modern regionalism are linked as a guide to utilize the key items of Malay traditional design values towards innovative design in contemporary Malay house architecture.
It is concluded that there exists a robust relationship between architectural creativity and originality based on traditional design values in Malay architecture. These values in architectural design are a valuable asset for the improvement of contemporary Malay architectural character. Collectively, evidence encourages further investigation into Malay traditional design values in the process of implementation in contemporary Malay architecture. In addition, an exploration of the traditional architectural essence can be considered as another line of investigation in the regional cultural design. Hence, this research recommends the implementation of the architecture of Malay traditional house design values in contemporary Malay house architecture that is based on various creative, applicable design value concepts derived from traditional architectural character. The exploration of concepts has to be considered as vital criteria in contemporary Malay house architecture that is based on theoretical approaches. This is in order to maintain the originality of the architectural identity of the Malay society.
References
Alexander, C. (1987). A New Theory of Urban Design: Oxford University Press.
Allsopp, B. (1977). A Modern Theory of Architecture. London: Routledge & Kegan Paul.
Amad, A. M., Sujud, A. e., & Hasan, H. Z. (2007). Proxemics and its Relationship with Malay Architecture. Human Communication. A Publication of the Pacific and Asian Communication Association., Vol.10(3), 275-288.
Ani, A., Mohamed, N., & Rahman, N. A. (2012). Socio-Cultural Influences in the Composition of Traditional Malay House Compounds in Rural Melaka. Alam Cipta, University of Putra Malaysia Vol.5(1), PP.63-78.
Arandjelović , B. (2008). Historical Heritage and Contemporary Architecture Fusion at the Example of the City Center of Graz. Facta Universitatis: Architecture and Civil Engineering 6(1), 65-74.
Bird, C. (2008). Britomart Contemporary Public Transport Interchange Meets Traditional Maori Meeting House. In P. Herrle & E. Wegeerhoff (Eds.), Architecture and identity (Vol. 9, pp. 423-435). Berlin: Lit
Brown, A. (2009). A Theory of Theory of Architecture Retrieved from http://archinoid2.blogspot.com/2009/10/theory -of-theory-of-architecture.html
Canizaro, V. B. (2007). Architectural Regionalism: Collected writings on Place, Identity, Modernity, and Tradition. New york: Princeton Architectural Press.
Eben Saleh, M. A. (2001). The evolution of planning & urban theory from the perspective of vernacular design: MOMRA initiatives in improving Saudi Arabian neighbourhoods. Land Use Policy, 18(2), 179-190.
Eggener, K. L. (2002). Placing Resistance: A Critique of Critical Regionalism. Architectural Education, 55(4), 228-237.
Fister, P. (2001). Protection of Architectural Heritage, State of Art, New Aims and Possibilities in Urban Renewal: The case of Slovenia. Retrieved from www.arcchip.cz/w03/w03_fister
Frampton, K. (1983). Prospects for a Critical Regionalism. Perspecta, 20, pp. 147-162.
Gelernter, M., & Dubrucq, V. (2005). Historicism. In R. S. Sennott (Ed.), Encyclopedia of 20th-Century Architecture (Vol. 2, pp. 896). London: Taylor & Francis e-Library.
Gillham, B. (2000). Case Study Research Methods. Great Britain: TJ International Ltd., Padstow, Cornwall.
Gurupiah, M. (2008). Pemikiran Dan Sahutan Regionalisme Dalam Wacana Senibina Malaysia. University Technology Malaysia, Skudi johor.
Heynen, H. (2005). Postmodernism. In R. S. Sennott (Ed.), Encyclopedia of
20th-Century Architecture (Vol. 2, pp. 896). London: Taylor & Francis e-Library.
Holm, I. (2006). Ideas and Beliefs in Architecture and Industrial design. The Oslo School of Architecture and Design, Oslo.
Ingersoll, r. (2007). Critical Regionalism in Houston: A Case for the Menil Collection. In S. Amourgis (Ed.), Architectural Regionalism: Collected writings on Place, Identity, Modernity, and Tradition (pp. 387-392). New york: Princeton Architectural Press.
Ismail, Z., & Sani, A. (2002). Modularity Concept in Traditional Malay House (TMH) in Malaysia.
Kimmelman, J., Mogil, J. S., & Dirnagl, U. (2014). Distinguishing between Exploratory and Confirmatory Preclinical Research Will Improve Translation. PLOS Biology, Vol.12(No.5).
Langhein, J. (2005). Proportion and Traditional Architecture. International Network for Traditional Building, Architecture& Urbanism, I ( 10),
Lefaivre, L., & Tzonis, A. (2003). Critical Regionalism: Architecture and Identity in a Globalised World. Munich: Prestel.
Moore, S. A. (2005). Technology, Place, and Non - modern Regionalism.
Mumford, L. (1941). The South in Architecture - The Dancy Lectures, Alabama College 1942. New York: Harcourt, Brace And Company.
Pallasmaa, J. (2007). New Architectural Horizons. Architectural Design, Vol. 77(2), 16-23.
Pomeroy, J. (2011). Idea House, Future Tropical Living Today (ORO editions ed.).
Prins, M. (2009). Architectural Value. In S. Emmitt, M. Prins & A. d. Otter (Eds.), Architectural Management: International Research and Practice. UK: Wiley-Blackwell, Oxford.
Rapoport, A. (1969). House Form and Culture (Vol. 10). London: Prentice - Hall, INC., Englewood Cliffs, N.J.
Rasmussen, S. E. (1964). Experiencing architecture: MIT Press.
Saleh, M. A. E. (1998). The Integration of Tradition and Modernity: A Search for an Urban and Architectural Identity in Arriyadh, The Capital of Saudi Arabia. Habitat International, 22(4), 571-589.
Schumacher, P. (2011). The Value of Design is not measurable. London: Business Design Centre.
Shahedi, B. (2004). The prayer hall. Omran-e-Zayandeh Rood Village, Isfahan: D.O.S. Design Organization Service.
Shahedi, B., Daud, N. I. M. K. H., & Yaacob, N. M. (2012). Users’ Perceptions of Aesthetic Design Approach of Safavid Architecture, Iran. Journal of Design and Built Environment, University of Malaya(UM), 10.
Shahedi, B., keumala, n. i. m., & Yaacob, N. M. (2013). Role of Architectural Historical Precedent in Aesthetic Design of Contemporary Architecture. Built Environment Journal, University Technology MARA (UiTM), 10(2).
Tajuddin, M., & Hussain, N. H. (2005). National Identity and the Architecture of Malayan Architect Co-Partnership.
Uysal, Z. C. (2004). Architectural Interpretations of Modernity and Cultural Identity: A Comparative Study on Sedad Hakki Eldem And Bruno Taut In Early Republican Turkey. Natural and Applied Sciences of Middle East Technical University.
Vellinga, M. (2012). New Vernacular Architecture. Paper presented at the 6th International Seminar on Vernacular Settlements, Contemporary Vernaculars: Places, Processes and Manifestations, Estern Mediterranean University, Famagusta, North Cyprus.
Wen, R. (2010). Architecture and Tradition. Unitec Institute of Technology, Auckland, New Zealand.
Yin, R. K. (2003). Case Study research Design and Methods (Third ed. Vol. 5). California: Sage publications, Inc.

102
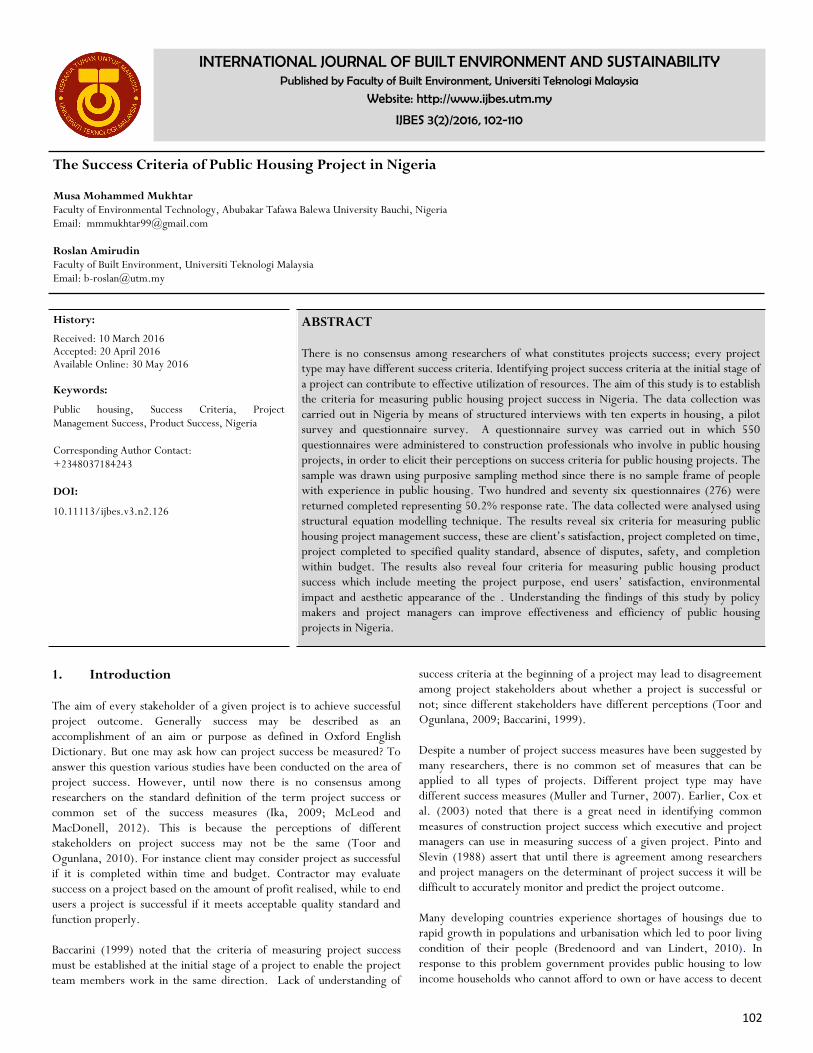
102
1. Introduction The aim of every stakeholder of a given project is to achieve successful project outcome. Generally success may be described as an accomplishment of an aim or purpose as defined in Oxford English Dictionary. But one may ask how can project success be measured? To answer this question various studies have been conducted on the area of project success. However, until now there is no consensus among researchers on the standard definition of the term project success or common set of the success measures (Ika, 2009; McLeod and MacDonell, 2012). This is because the perceptions of different stakeholders on project success may not be the same (Toor and Ogunlana, 2010). For instance client may consider project as successful if it is completed within time and budget. Contractor may evaluate success on a project based on the amount of profit realised, while to end users a project is successful if it meets acceptable quality standard and function properly. Baccarini (1999) noted that the criteria of measuring project success must be established at the initial stage of a project to enable the project team members work in the same direction. Lack of understanding of
success criteria at the beginning of a project may lead to disagreement among project stakeholders about whether a project is successful or not; since different stakeholders have different perceptions (Toor and Ogunlana, 2009; Baccarini, 1999). Despite a number of project success measures have been suggested by many researchers, there is no common set of measures that can be applied to all types of projects. Different project type may have different success measures (Muller and Turner, 2007). Earlier, Cox et al. (2003) noted that there is a great need in identifying common measures of construction project success which executive and project managers can use in measuring success of a given project. Pinto and Slevin (1988) assert that until there is agreement among researchers and project managers on the determinant of project success it will be difficult to accurately monitor and predict the project outcome. Many developing countries experience shortages of housings due to rapid growth in populations and urbanisation which led to poor living condition of their people (Bredenoord and van Lindert, 2010). In response to this problem government provides public housing to low income households who cannot afford to own or have access to decent
INTERNATIONAL JOURNAL OF BUILT ENVIRONMENT AND SUSTAINABILITY Published by Faculty of Built Environment, Universiti Teknologi Malaysia
Website: http://www.ijbes.utm.my
IJBES 3(2)/2016, 102-110
The Success Criteria of Public Housing Project in Nigeria Musa Mohammed Mukhtar
Faculty of Environmental Technology, Abubakar Tafawa Balewa University Bauchi, Nigeria Email: [email protected]
Roslan Amirudin
Faculty of Built Environment, Universiti Teknologi Malaysia Email: [email protected]
ABSTRACT There is no consensus among researchers of what constitutes projects success; every project type may have different success criteria. Identifying project success criteria at the initial stage of a project can contribute to effective utilization of resources. The aim of this study is to establish the criteria for measuring public housing project success in Nigeria. The data collection was carried out in Nigeria by means of structured interviews with ten experts in housing, a pilot survey and questionnaire survey. A questionnaire survey was carried out in which 550 questionnaires were administered to construction professionals who involve in public housing projects, in order to elicit their perceptions on success criteria for public housing projects. The sample was drawn using purposive sampling method since there is no sample frame of people with experience in public housing. Two hundred and seventy six questionnaires (276) were returned completed representing 50.2% response rate. The data collected were analysed using structural equation modelling technique. The results reveal six criteria for measuring public housing project management success, these are client’s satisfaction, project completed on time, project completed to specified quality standard, absence of disputes, safety, and completion within budget. The results also reveal four criteria for measuring public housing product success which include meeting the project purpose, end users’ satisfaction, environmental impact and aesthetic appearance of the . Understanding the findings of this study by policy makers and project managers can improve effectiveness and efficiency of public housing projects in Nigeria.
History:
Received: 10 March 2016 Accepted: 20 April 2016 Available Online: 30 May 2016 Keywords:
Public housing, Success Criteria, Project Management Success, Product Success, Nigeria Corresponding Author Contact: +2348037184243 DOI:
10.11113/ijbes.v3.n2.126
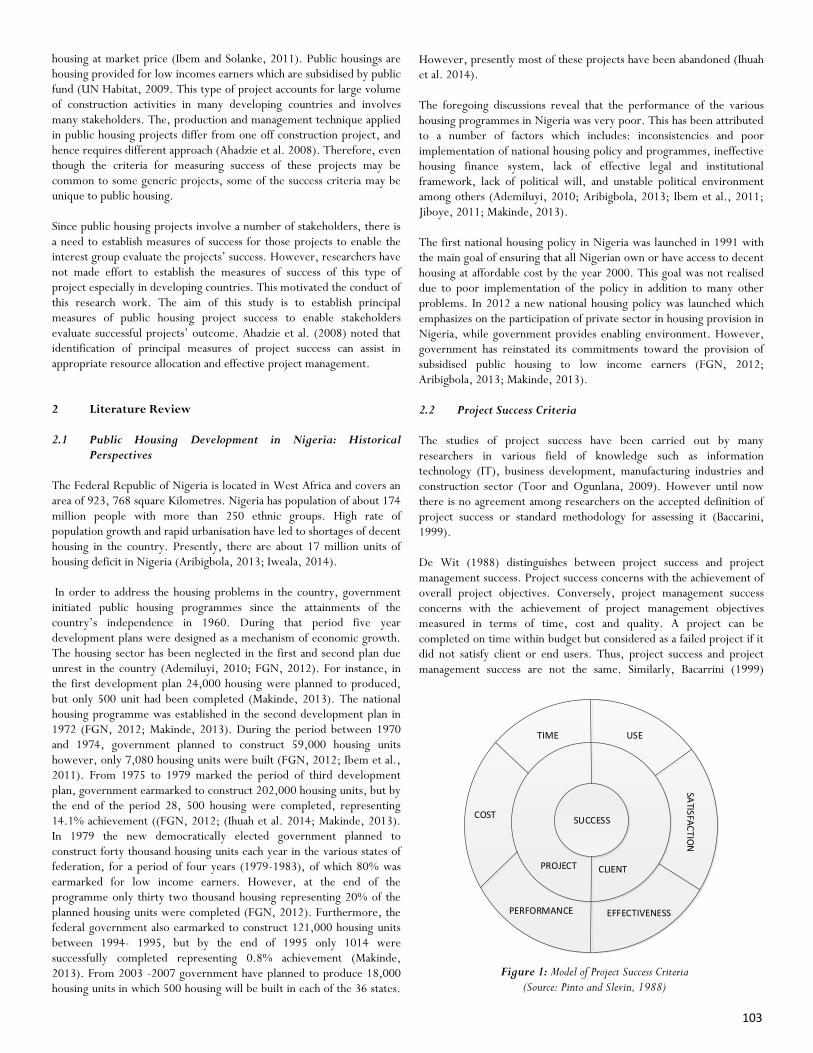
103
housing at market price (Ibem and Solanke, 2011). Public housings are housing provided for low incomes earners which are subsidised by public fund (UN Habitat, 2009. This type of project accounts for large volume of construction activities in many developing countries and involves many stakeholders. The, production and management technique applied in public housing projects differ from one off construction project, and hence requires different approach (Ahadzie et al. 2008). Therefore, even though the criteria for measuring success of these projects may be common to some generic projects, some of the success criteria may be unique to public housing. Since public housing projects involve a number of stakeholders, there is a need to establish measures of success for those projects to enable the interest group evaluate the projects’ success. However, researchers have not made effort to establish the measures of success of this type of project especially in developing countries. This motivated the conduct of this research work. The aim of this study is to establish principal measures of public housing project success to enable stakeholders evaluate successful projects’ outcome. Ahadzie et al. (2008) noted that identification of principal measures of project success can assist in appropriate resource allocation and effective project management. 2 Literature Review 2.1 Public Housing Development in Nigeria: Historical
Perspectives The Federal Republic of Nigeria is located in West Africa and covers an area of 923, 768 square Kilometres. Nigeria has population of about 174 million people with more than 250 ethnic groups. High rate of population growth and rapid urbanisation have led to shortages of decent housing in the country. Presently, there are about 17 million units of housing deficit in Nigeria (Aribigbola, 2013; Iweala, 2014). In order to address the housing problems in the country, government initiated public housing programmes since the attainments of the country’s independence in 1960. During that period five year development plans were designed as a mechanism of economic growth. The housing sector has been neglected in the first and second plan due unrest in the country (Ademiluyi, 2010; FGN, 2012). For instance, in the first development plan 24,000 housing were planned to produced, but only 500 unit had been completed (Makinde, 2013). The national housing programme was established in the second development plan in 1972 (FGN, 2012; Makinde, 2013). During the period between 1970 and 1974, government planned to construct 59,000 housing units however, only 7,080 housing units were built (FGN, 2012; Ibem et al., 2011). From 1975 to 1979 marked the period of third development plan, government earmarked to construct 202,000 housing units, but by the end of the period 28, 500 housing were completed, representing 14.1% achievement ((FGN, 2012; (Ihuah et al. 2014; Makinde, 2013). In 1979 the new democratically elected government planned to construct forty thousand housing units each year in the various states of federation, for a period of four years (1979-1983), of which 80% was earmarked for low income earners. However, at the end of the programme only thirty two thousand housing representing 20% of the planned housing units were completed (FGN, 2012). Furthermore, the federal government also earmarked to construct 121,000 housing units between 1994- 1995, but by the end of 1995 only 1014 were successfully completed representing 0.8% achievement (Makinde, 2013). From 2003 -2007 government have planned to produce 18,000 housing units in which 500 housing will be built in each of the 36 states.
However, presently most of these projects have been abandoned (Ihuah et al. 2014). The foregoing discussions reveal that the performance of the various housing programmes in Nigeria was very poor. This has been attributed to a number of factors which includes: inconsistencies and poor implementation of national housing policy and programmes, ineffective housing finance system, lack of effective legal and institutional framework, lack of political will, and unstable political environment among others (Ademiluyi, 2010; Aribigbola, 2013; Ibem et al., 2011; Jiboye, 2011; Makinde, 2013). The first national housing policy in Nigeria was launched in 1991 with the main goal of ensuring that all Nigerian own or have access to decent housing at affordable cost by the year 2000. This goal was not realised due to poor implementation of the policy in addition to many other problems. In 2012 a new national housing policy was launched which emphasizes on the participation of private sector in housing provision in Nigeria, while government provides enabling environment. However, government has reinstated its commitments toward the provision of subsidised public housing to low income earners (FGN, 2012; Aribigbola, 2013; Makinde, 2013). 2.2 Project Success Criteria The studies of project success have been carried out by many researchers in various field of knowledge such as information technology (IT), business development, manufacturing industries and construction sector (Toor and Ogunlana, 2009). However until now there is no agreement among researchers on the accepted definition of project success or standard methodology for assessing it (Baccarini, 1999). De Wit (1988) distinguishes between project success and project management success. Project success concerns with the achievement of overall project objectives. Conversely, project management success concerns with the achievement of project management objectives measured in terms of time, cost and quality. A project can be completed on time within budget but considered as a failed project if it did not satisfy client or end users. Thus, project success and project management success are not the same. Similarly, Bacarrini (1999)
PROJECTSUCCESS
PROJECT CLIENT
PERFORMANCE EFFECTIVENESS
COST
TIME USE
SATISFA
CTIO
N
Figure 1: Model of Project Success Criteria (Source: Pinto and Slevin, 1988)

104
divides project success into two major components, projects management success that concern with the achievement of project management objectives and product success that concern with the success of the final product. Thus, criteria for measuring project management success is different from those used to measure the final product success. Success criteria are defined as standard or measures by which project success or failure can be judged (Lim and Mohamed, 1999; Cookie-Davies, 2002). They are measures which can be used to evaluate project success or failure. Pinto and Slevin (1988) develop a model for assessing project success, which consists of two components ‘Project and Client’ as shown in Figure 1. The first component ‘Project’ comprises of three criteria, time, cost and performance. These assess whether the project performs as intended, in terms of schedule, budget and technical specification. The second component consists of three criteria ‘use, satisfaction and effectiveness’. These assess whether the project is being used by its intended users, whether the intended users satisfied with the project and whether the project directly benefits the end users respectively. Traditionally, construction project success is measured by three criteria, on time, within budget and to specified quality standard (Atkinson, 1999; Hughes et al., 2004). These criteria are referred to as iron triangle. However, it has been argued that the measures of success in construction projects are beyond the iron triangle (Low and Chuan, 2006; Toor and Ogunlana, 2010). Thus, new criteria have been suggested by various researchers in addition to the traditional measures of time, cost and quality. For instance client satisfaction (Rad, 2003; Jha and Iyer, 2007), end users satisfaction, (Toor and Ogunlana, 2010), project team members satisfaction (Jha and Iyer, 2007); contractor’s profit (Sanvido,et al. 1992; Atkinson, 1999), safety (Ahadzie et al., 2009; Toor and Ogunlana, 2010), environmental impact (Ahadzie et al., 2008), Marketability of the final product (Sanvido et al. 1992), meeting the project purpose (Baccarini, 1999; Turner, 2009), absence of dispute or legal claim (Jha and iyer, 2007; Toor and Ogunlan, 2010), and aesthetic appearance of the project (Sanvido et al. 1992; Pheng and Chuan, 2006). This study proposed 12 criteria for measuring public housing project success based on:
The model of project success criteria (Figure 1) developed by Pinto and Slevin (1988).
Literature review of project success criteria presented above.
The meaning and purpose of public housing project.
However, there is a need to identify which criteria can be used to measure project management success and which can measure product success. Baccarini (1999) simplify this by dividing project success into two distinct components. The project management success and product success as mentioned earlier. The projects management success criteria are completion on time, within cost and to specified quality, stakeholders’ satisfaction (client satisfaction, team members’ satisfaction). The product success criteria are customers’/ end users’ satisfaction and meeting the projects’ goals/ purpose. Thus, the two components must meet stakeholders’ satisfaction based on their interest in the respective components. Lim and Mohamed (1999) classified project success into two viewpoints, micro and macro viewpoints. The micro viewpoint concerns the achievement of project success at the completion of construction phase
of a project. The criteria for measuring project micro viewpoints of project success include completion on time, within budget, to specified quality, performance (efficiency) and safety. The macro view point of project success concerns with the achievement of original project concept/ goal which can only be known at the operational phase of a project. The criteria for measuring macro viewpoints project success are the end users satisfaction and meeting the project’s goal. Atkinson (1999) divides success criteria into two main categories, those measure project success at the delivery stage and those at post-delivery stage. Success criteria at delivery stage are time, cost and quality, they measure project management performance. Success criteria at post-delivery stage are benefit to organisation (improved efficiency and effectiveness, and increased profits etc) and stakeholders benefit which include end users’ satisfaction, environmental impact, contractors profit, professional learning etc. Toor and Ogunlana (2010) suggest that performance measures of construction project (project management success) include on time, within budget, to specify quality standard, safety, stakeholders’ satisfaction, and minimum dispute. Therefore the foregoing discussions suggest that, the proposed measures of public housing project success can be classified into two categories. The first category relates to success criteria that measure project management success or performance. These include completion on time, on cost, to the quality standard, safety, client satisfaction, project team members’ satisfaction, absence of dispute or legal claim as shown in Table 1. The second category relates to success criteria that measure the final product success. These include end users’ satisfaction, environmental impact of the project, aesthetic appearance, marketability of the product and meeting the project purposes as shown in Table 2.
3. Methodology This section explains the methodology adopted in conducting this study. It describes the entire research design which includes method of data collection, questionnaire development, sampling technique, and data analysis process. 3.1 Method of Data Collection This study conducted an intensive literature review in order to identify success criteria/measures for public housing project and to develop a survey questionnaire. Based on the literature review, twelve (12) success criteria were identified. Before developing the questionnaire, a
Items Descriptions
PMS1 Project completed on time
PMS2 Project completed within budget PMS3 Absence of disputes or any legal claims
PMS4 Client satisfaction with the project
PMS5 Project team members’ satisfaction with the project
PMS6 Project completed with a low accident rate
PMS7 Project completed to the specified quality standard.
Table 1: Measures for Public Housing Project Management Success

105
list of the identified success criteria was presented to ten experts who have at least 15 years’ experience involving in public housing projects. They include developers, consultants, contractors and those working in public housing agencies. The experts were asked to indicate their views on the relevance and adequacy of the success criteria with regards to developing countries using five point Likert Scale ranging from 1 to 5, with 1 representing least important criterion and 5 extremely important criterions. They were also asked to modify the wording and suggest additional success criteria were necessary. Analysis of the results indicates that all the experts agreed that 12 success criteria are comprehensive and important measures of public housing project in developing countries. Based on these results a preliminary questionnaire was developed. Tables 1 and 2 present the proposed measures of public housing projects success. In order to test the clarity and comprehensively of the questionnaire a pilot survey was conducted in Nigeria with 52 construction professionals including architect, quantity surveyors, engineers and builders who work as developers, consultant, contractors and public servants. After minor modifications the final survey questionnaire was developed. The questionnaire consists of three sections. The first section elicits information on the respondents’ background, the second section consists of questions related measures of project management success of public housing, while section three consist of questions related to public housing product success measures. The questionnaire survey was carried out in Nigeria in March 2014. Five hundred and fifty (550) questionnaires were administered to construction professionals including architects, quantity surveyors, engineers and builders who have experience in public housing projects.. The sample was drawn using purposive sampling technique. This is because it was not possible to use probability sampling methods since no sample frame exist of people with experience in public housing projects. The respondents were requested to indicate their views on the importance of each success criteria in measuring the success of public housing project management or product success as the case may be. They were asked to use five point Likert Scale ranging from 1 to 5
where 1 represent least important success criteria and 5 extremely important success criteria. A total of 276 usable questionnaires were returned completed representing 50.2% response rate. The response rate is high in comparison with “the norm of 20-30% with most questionnaire survey in the construction industry” (Akintoye, 2000). 3.2 Data Analysis and Results The data collected were analysed with the aid of Statistical Package for Social Sciences (SPSS) and Analysis of Moment Structures (AMOS) computer software. Before the analyses were carried out the data collected were screened to ensure important assumptions of multivariate techniques have been met. These include sample size, missing data and normality. The normality of the data was evaluated by observing skewness and kurtosis statistics. The values of both statistics were found to be within the range of ±1 indicating normality of the data as suggested by Xiong et al. (2015). Five cases were found with missing data. Analyses of the extent of missing values show that about 50% of the variables in each of the five cases have missing values. Therefore based on the recommendation of Hair et al. (2009), these cases were dropped for analysis. Descriptive statistics were used to analyse the respondents’ profiles using SPSS. Whereas confirmatory factor analysis (CFA) was performed based on the responses to test how well the success criteria (success measures) represent their constructs. The CFA enables a researcher to test how well measured variables represent a smaller number of constructs (Hair et al. 2009). These methods had been used by other similar studies (Chileshe and Haupt, 2005; Huang and Lai, 2012; Musa et al. 2015). Table 3 present the summary of the respondents’ profile. The results indicate that 30.4% of the respondents work in public housing agencies, 22.5% are developers, 22.8% are consultants while 24.3% are contractors. Their professional affiliations include architecture 28.6%, quantity surveying 30.8%, engineering 15.9%, building technology 22.5%, other professions account for 2.2%. The highest academic qualifications of the respondents range from Higher National Diploma (HND) to Doctor of Philosophy (PhD). About 50% have Bachelor of Science (BSC) and 26% possess Master of Science (MSC) as their highest academic qualifications. Majority of the respondents (64.1%) have more than 10 years’ experience involving in public housing projects. Therefore, based on their professional background, academic qualifications and experience, the respondents were capable of providing reliable information. 3.3 Confirmatory Factor Analysis Confirmatory Factor Analysis (CFA) model for project management success criteria with seven indicators (success measures) and product success criteria model with five indicators were specified and analysed
Items Descriptions
FPS1 End users satisfaction with the project
FPS2 Environmental impact of the housing project FPS3 Marketability of the completed housing unit
FPS4 Aesthetic appearance of the housing units
FPS5 Meeting the project’s purpose
Table 2: Measures for Public Housing Product Success
Profession % Qualifica-
tion %
Experience (years)
% Organisation %
Architecture 28.6 HND 19.2 1-5 5.1 Public Sector 30.4
Quantity Surveying 30.8 BSC 49.3 6-10 30.8 Developer 22.5
Engineering 15.9 MSC 26.1 11-15 36.6 Consultancy 22.8
Building Technology 22.5 PHD 1.8 16-20 18.8 Contracting 24.3 Others 2.2 Others 3.6 > 20 8.7
Table 3: Summary of Respondents' Profile

106
separately. The aim was to test how well the corresponding success measures represent the constructs. The indicators have been shown in Table 1 and 2 respectively. Evaluations of GOFs model indicate that there is need to re-specify the two models, because the sample data did not fit the hypothesised models well. The possible sources of misspecification can be identified by evaluation of standardised factor loading, standardised residual and modification indices as suggested by (Byrne, 2010; Hair et al. 2010; Kline, (2011). However, due to limitations of space the details of the modifications process have not been reported in this study. Precisely, for CFA model of project management success criteria, the modifications involve deletion of one measure variable (Project team members’ satisfaction with the project) from the model because it has high standardised residual value (larger than 2.58) as suggested by Kline (2011). Moreover, two error covariances related to PMS4 and PMS6 as well as PMS3 and PMS1 have modification index of 16.2 and 11.6 respectively which are considered large. Thus, these two parameters have been added to the measurement model (Byrne, 2010; Kline, 2011). The re-specified has shown in Figure 2. For CFA model of product success criteria, the modification also involve deletion of one measure variable (Marketability of the completed housing unit) from the model because it has high standardised residual value (larger than 2.58) as suggested by Kline (2011). No modification index has been found in this model; hence, no parameter was added. The re-specification of the model involves only the deletion of one measure variable as shown in Figure 3. 3.4 Assessing Validity of CFA measurement model Validity is defined as the extent to which research is accurate (Hair et al. 2009). Measurement model validity is evaluated based on establishing acceptable level of goodness of fit indices and finding specific evidence of construct validity (Hair et al. 2009). 3.4.1 Goodness of Fit Indices Goodness of fit (GOF) compares the theory and reality by assessing how well the specified model reproduces the observed covariance matrix among the indicators items (ie the similarity of the observed and estimated covariance matrices (Hair et al. 2009). The fundamental statistical measure of GOF in any CFA model that assesses the difference of the observed and estimated covariance matrices is Chi Square (X2). However, because assessment of GOF with chi square value alone is complicated by several factor, researchers have developed a number of alternative GOF measures. These are classified into three main groups: absolute fit indices, incremental fit indices and parsimony fit indices (Hair et al. 2009). Despite there are a number of GOF measures in each group, a researcher is not expected to report all the GOFs in the assessment of model fit. Hair et al. (2009) suggest that using three to four indices provide adequate evidence of model fit. This should include at least one incremental index and one absolute index in addition to chi square value and degree of freedom. Thus, they assert that reporting, Comparative Fit Index (CFI), Tucker Lewis Index (TLI) and Root Mean Square Error of Approximation (RMSEA), Chi Square (X2)
value and Degree of Freedom (df) are sufficient to provide information to evaluate model fit. Therefore, this study in addition to the recommended GOF measures also reports Goodness of Fit Index (GFI) and Adjusted Goodness of Fit Index (AGFI). The CFI assess model fit relative to independent/null model whose variables are completely uncorrelated. The CFI values > 0.90 are indicative of a good fitting model. The TLI is an incremental fit indices, it is a comparison of normed chi square of value of an independent/null model (one that assumes all observed variables are uncorrelated) and specified model which take account of model complexity. TLI values > 0.90 suggest a better fit. The RMSEA estimate the lack of fit in a model compared to a perfect model. Thus, it estimates how well a model fit a population. The RMSEA values < 0.08 indicate a good fit. The GFI calculate a weighted proportion of variance in the sample covariance accounted for by the estimated population covariance matrix, the GFI values > 0.90 were considered good. The AGFI is GFI index adjusted for number of parameters estimated in the model. The recommended values of AGFI for a good fit are > 0.90 (Hair et al. 2009; Tabachnick and Fidell, 2013). 3.4.2 Construct validity Construct validity is the extent to which a set of observed or measured variables truly represent theoretical latent construct which they are assigned to measure. Construct validity can be assessed by establishing convergent validity of the construct. This can be confirmed if the items that are the indicators of a specific construct converge or share high proportion of variance in common (Hair et al., 2009). Convergent validity can be estimated by examinations of size of factor loadings and assessment of reliability. High factor loadings indicate that the items converge at a common point, the latent construct (Hair et al., 2009). It has been recommended that the standardised factor loadings should be at least 0.5 and statistically significant. Standardised and unstandardized estimates are interpreted just as regression coefficient in multiple regressions (Hair, et al., 2009; Kline, 2011). Reliability which indicates internal consistency in the construct is also a measure of convergent validity. Coefficient of reliability can be estimated using Cronbach Alpha. Reliability coefficient should be at least 0.7 to suggest good reliability (Hair et al., 2009). 3.5 Validity of Measurement Model for Project Management
Success Criteria Figure 2 shows measurement model for project management success criteria, while Table 4 shows the model fit. Analysis of GOF indices as shown in the Table 4 reveals that, the X2= 17.928, df= 7, p = 0.012 (<0.05), CFI = 0.977, TLI = 0.950, RMSEA = 0.075, GFI = 0.980, AGFI = 0.940. All the GOF indices apart from chi square p value are within the recommended values of a good fit suggested by Hair et al. (2009). Convergent validity of the model was assessed through examinations of size of factor loadings and reliability. The results in Table 5 reveal that all the standardised factor loadings of the indicator items are greater than 0.5 and they are all significant that is their critical ratios (C.R) > 1.96. These are consistent with recommendations of Hair et al. (2009). The reliability coefficients shown in Table 6 indicate that the reliability of project management success criteria construct is 0.813 which is considered as good (Hair et al. 2009).

107
These results show that the convergent validity of the measurement model is confirmed. Thus, based on the assessment of the factor loadings and convergent validity, it can be concluded that the validity of measurement model for project management success criteria has been established.
3.6 Validity of Measurement Model for Product Success Criteria Figure 3 shows measurement model for product success criteria, whereas Table 7 indicates the model fit. Analysis of GOF indices as shown in the Table 7 reveals that, the X2= 5.262, df= 2, p = 0.072 (> 0.05), CFI = 0.988, TLI = 0.963, RMSEA = 0.077, GFI = 0.990, AGFI = 0.951. The model passed the chi square test, as the p value is > 0.05 which indicates that there is no significant difference between the observed and estimated covariance matrices (no significant difference between the specified model and reality). Moreover, all the other GOF indices are within the recommended values of a good fit suggested by Hair et al. (2009). As explained earlier convergent validity of a model is assessed through
Fit Indices Recommended Measurement Model
X2 - 17.928
Df - 7
P > 0.05 0.012
CFI > 0.90 0.977
TLI > 0.90 0.95 RMSEA < 0.08 0.075
GFI > 0.90 0.980
AGFI > 0.90 0.940
Table 4: Fit Indices for Measurement Model of Project Management Success Criteria
Relationship Stand-ardized
Un-standard
ized
C. R P
PMS1—Success 0.707 1.016 10.047 Sig.
PMS2— Success 0.577 0.837 8.532 Sig. PMS3—Success 0.638 0.919 9.157 Sig.
PMS4—Success 0.747 1.102 10.229 Sig.
PMS6—Success 0.632 0.923 8.798 Sig.
PMS7—Success 0.680 1.000 Sig.
Table 5: Parameter Estimates for Measurement Model of Project Manage-ment Success Criteria
Constructs Cronbach’s Alpha
Project Management Success Criteria 0.813 Product Success Criteria 0.766
Table 6: Reliability Estimates
Fit Indices Recommended Measurement Model
X2 - 5.262 Df - 2
P > 0.05 0.072
CFI > 0.90 0.988
TLI > 0.90 0.963
RMSEA < 0.08 0.077
GFI > 0.90 0.990 AGFI > 0.90 0.951
Table 7: Fit Indices for Measurement Model of Product Success
Criteria
Figure 2: Measurement Model for Project Management Success Criteria for Public Housing
Relationship Stand-ardized
Un-standard
ized
C. R P
FPS1—Success 0.666 0.944 8.800 Sig.
FPS2—Success 0.658 0.909 8.735 Sig.
FPS4—Success 0.625 0.854 8.421 Sig.
FPS5—Success 0.739 1.000 Sig.
Table 8: Parameter Estimates for Measurement Model of Product Success
Criteria

108
examinations of size of factor loadings and reliability. The results in Table 8 reveal that all the standardised factor loadings of the indicator items are greater than 0.5 and they are all significant that is their critical ratios (C.R) > 1.96. These are consistent with recommendations of Hair et al. (2009). The reliability coefficients shown in Table 6 indicate that the reliability of product success criteria construct is 0.766 which is considered as good (Hair et al. 2009). These results show that the convergent validity of the measurement model is confirmed. Thus, based on the assessment of the factor loadings and convergent validity, it can be concluded that the validity of measurement model for product success criteria has been established.
4. Conceptual Model for Public Housing Project Success Criteria
Figure 4 shows a conceptual model for public housing project success criteria. The model is divided into three phases. The first phase comprises public housing project success criteria; the second phase contains project management success and product success while the third phase represents the overall success of public housing project. It can be noted that the first phase of the model is made up of ten success criteria which have been divided into two parts. The first part has six success criteria which measure project management success and comprises of client satisfaction, project completed on time, to specified quality standard, absence of disputes/conflict, safety (project completed with low accident rate) and completion on cost (within budget). The second part has four success criteria that measure public housing product success, and comprise of meeting the project’s purpose, end users’ satisfaction, environmental impact and aesthetic appearance of the project. This model indicates that different set of success criteria measure public housing project management success and product success. However, despite the traditional measure of project management success of completion on time, on cost and to specified quality are still in use, other criteria also emerged. This model can assist project managers of public housing in effective utilisation of resources by focusing on the achievement of their projects’ objectives.
5 Discussions The results from this study indicate that six success criteria can be used to measure project management success of public housing project. These are client’s satisfaction; project completed on time, to specified quality standard, absence of disputes, safety, and
completion on cost (within budget). This is consistent with the previous studies (Ahadzie, 2008; Baccarini; 1999; Toor and Ogunlana, 2010). The standardised factor loading presented in Table 5 can be used to assess the importance of each success criteria in measuring the project management success. For instance, based on the results it can be noted that client satisfaction with the project (PMS4) has the highest value of standardised estimates (747), this indicates that it is the most important criteria for measuring project management success in public housing projects. Completion of the projects on time is the second most important project management success criteria with standardised estimates (0.707), followed by project completed to specified quality standard (0.680), absence of disputes/ conflicts (0.638), safety (0.632) and project completed on cost (0.577). Thus, on project management of public housing projects, the respondents are more conscious about clients’ satisfaction of the projects, completion on time and to specified quality standard. These criteria are important in preventing disputes. The absences of disputes are also very important issues suggested by this study. The present of dispute among project participants may lead to delay in completion and cause overrun and these may affect the efficiency of project management. Completion of project with low accident rate is also an important measure of project management success. It is hardly to achieve success of a project if there are no safe working conditions to the workers. This is in agreement with Toor and Ogunlana, (2010). Project completion within budget is very essential in measuring project management success as cost overrun may lead to delay in completion. This is consistent with Ahadzie (2008). The results from this study also reveal that, four success criteria can be used to measure public housing product success. These are meeting the project purpose, end users’ satisfaction, environmental impact and aesthetic appearance of the project. The results are consistent with the previous findings (Baccarini, 1999; Lim and Mohamed, 1999; Pheng and Chuan, 2006). Table 8 indicates that meeting the project purpose (FPS5) has the highest standardised estimates (0.739), meaning that it is the most important criteria for measuring public housing product success. End users’ satisfaction (FPS1) is the second most important factor having standardised estimates (0.666), followed by environmental impacts of housing projects (0.658) and then aesthetic appearance of the projects (0.625). The purpose of public housing projects is to assist low income earners who cannot compete on a marketplace to own or have access to decent housing. If the original purpose of the project is not achieved then the project may be regarded as unsuccessful. Thus, for public housing product to be successful, the housing must be affordable to low income
Figure 3: Measurement Model for Product Success Criteria for Public Housing Project
109
earners and allocated to people based on needs. The results also suggest that end users’ satisfactions are vital to the success of the final product. End users are the people who occupy the housing; hence, their satisfaction with the projects is vital. Therefore, the housing should be design and constructed in such a way that will give the end users maximum satisfactions. The respondents also considered environmental impact of the project as essential measure of public housing product success. The environmental quality and its sustainability to the needs of people of the area are very essential. It is therefore important that public housing construction should not lead to detrimental effect on the community or environment. All construction waste should be appropriately managed, and construction materials usage should be in accordance with the directives of relevant state protection agencies which are aimed at protecting the environment. This finding is consistent with that of Ahadzie (2008). The respondents also opined that, aesthetic appearance of the housing units is a principal measure of public housing product success. Generally, if public housings are designed to have appealing appearance it will preserve respect to the occupants and this will increase the acceptability of the projects by the end users. This is supported by previous studies (Sanvido et al., 1992).
6 Conclusions The study established ten criteria that can be used to measure the success of public housing projects in developing countries. These criteria have been classified into two groups. The first group measure project management success, and comprises of client’s satisfaction, project completed on time, to specified quality standard, absence of disputes/conflicts, safety (project completed with low accident rates) and project completed on cost (within
budget). The second group measure public housing product success and comprises of meeting the project purpose, end user’s satisfaction, environmental impact and aesthetic or appealing appearance of the housing units. The study reveals that client’s satisfaction, completing the projects on time and to the specified quality standard are three most important criteria for measuring project management success in public housing projects. On the other hand, meeting the project success and end users’ satisfaction are the two most important criteria in measuring public housing product success. All participants in public housing projects should understand these success criteria clearly at the initial stage, so that they can focus in the same direction to achieve overall success in their projects. This study can guide project managers and developers in effective and efficient utilisations of resources in public housing projects. The project managers are informed on the specific area that must be satisfied in order to achieve success in project management. For instance completion on time, within cost and to specified quality standard. The study can guide executives and senior managers in public of public housing projects to understand specific areas that must be satisfied in order to obtain overall success in public housing projects. Moreover, end users can also benefit from this study by having public housings that satisfy their need. The major limitation of this study is that the data collection was carried out in northern Nigerian. Thus, only views of construction professionals whose organisations were based in northern Nigeria are represented in this study. Since this study is meant for developing countries, the results should be interpreted with consideration of this limitation. Future studies are recommended to be carried out using the same methodology and collect more sample data to cover the whole Nigeria both northern and southern regions. Future studies should also be carried out in other developing countries using the same methodology, to find out whether the criteria for measuring public
ON TIME
TO SPECIFIED
QUALITY
SAFETY
MEETING THE
PROJECT PURPOSE
CLIENT S
SATTISFACTION
END USERS
SATISFACTION
AESTHETIC
APPEARANCE
PROJECT
MANAGEMENT
SUCCESS
PRODUCT SUCCESS
PUBLIC HOUSING
PROJECT SUCCESS
ABSENCE OF
DISPUTES
ON COST
ENVIRONMENTAL
IMPACT
Figure 4: Conceptual Model for Public Housing Project Success Criteria
110
housing projects are the same in the countries. References Ademiluyi, I. A. (2010). Public Housing Housing Delivery Strategies in Nigeria: A Historical Perspectives of Policies and Programmes. Journal of Sustainable Development in Africa, 12(6), 153-161.
Ahadzie, D. K., Proverbs, D. G., & Olomolaiye, P. O. (2008). Critical success criteria for mass house building projects in developing countries. International Journal of Project Management, 26, 675–687.
Akintoye, A. (2000). Analysis of Factors Influencing Project Cost Estimating Practice. Construction Management and Economics, 18, 77- 89.
Aribigbola, A. (2013). Causes and Consequences of Housing Policy Failure in Nigeria. British Journal of Social Sciences, 1(6), 18-31.
Atkinson, R. (1999). Project Management: Cost, Time and Quality, Two Best Guesses And a Phenomenon, Its Time to Accept Other Success Criteria. International Journal of Project Management, 17(6), 337-342.
Baccarini, D. (1999). The Logical Framework Method for Defining Project Success. Project Management Journal, 30(4), 25-32.
Bredenoord, P., & van Lindert , P. (2010). Pro-Poor Housing Policies: Retinking the Potential of Assisted Selp- Help Housing. Habitat International, 34, 278-287.
Byrne, B. M. (2010). Structural Equation Modeling with AMOS: Basic Concepts, Applications, and Programming, 2nd Edition . New York: Routledge.
Chileshe, N., & Haupt, T. C. (2005). Modelling critical success factors of construction project management. Journal of Engineering, Design and Technology,, 3 (2), 140-154.
Cooke-Davies, T. (2002). The ‘‘real’’ success factors on projects. International Journal of Project Management, 20, 185–190.
Cox, R. F., Issa, R. R., & Ahrens, D. (2003). Management’s Perception of Key Performance Indicators. Journal of Construction Engineering and Management, 129(2), 142-151.
De Wit, A. (1988). Measurement of Project Success. Project Management Journal, 3(6), 164-170.
Federal Government of Nigeria. (2012). National Housing Policy. Federal Ministry of Land, housing and Urban Development.
Hair, J. F., Black , W. C., Babin, B. J., & Anderson, R. E. (2009). Multivariate Data Analysis, 7th Edition. Upper Saddle River: Prentice Hall.
Huang , L., & Lai, G. (2012). An Investigation on Critical Success Factors for Knowledge Management Using Structural Equation Modeling. International Conference on Asia Pacific Business Innovation and Technology Management (pp. 24-30). Taiwan: Elsevier- Social and Behavioral Sciences.
Hughes, S. W., Tippett, D. D., & Thomas, W. K. (2004). Measuring Project Success in the Construction Industry. Engineering Management Journal, 16(3), 31-37.
Ibem, E. O., Anosike, M. N., & Azuh, D. E. (2011). Challenges in public housing provision in the post independence era in Nigeria. nternational Journal of Human Sciences, 8(2), 421-443.
Ibem, E. O., & Solanke, O. (2011). Assessing Organizational Capacity in Housing Provision: a Survey of Public Housing Agencies in Ogun State, Nigeria. Journal of Social and Development Sciences, 2(6), 275-285.
Ihuah, P. W., Kakulu, I. I., & Eaton, D. (2014). A review of Critical Project Management Success Factors (CPMSF) for sustainable social housing in Nigeria. Retrieved February 20, 2015, from International Journal of Sustainable Built Environment: http://
dx.doi.org/10.1016/j.ijsbe.2014.08.001
Ika, L. A. (2009). Project Success as a Topic in Project Management Journals. Project Management Journal, 40(4), 6-19.
Iweala, N. O. (2014). Unleashing the Housing Sector in Nigeria and in Africa. Paper Presented at the 6th Global Housing Finance Conference. Washington, DC, U.S.A.
Jha, K. N., & Iyer, K. C. (2007). Commitment, Coordination, Competence and the Iron Triangle. International Journal of Project Management, 25, 527–540.
Jiboye, A. D. (2011). Urbanization challenges and housing delivery in Nigeria: The need for an effective Policy framework for Sustainable Development. International Review of Social Sciences and Humanities, 2(1), 176-185. Kline, R. B. (2011). Principles and Practice of Structural Equation Modeling, 3rd Edition. New York: The Guilford Press. Lim, C. S., & Mohamed, M. Z. (1999). Criteria of Project Success: An Exploratory Re-Examination. International Journal of Project Management, 17(4), 243-248.
Makinde, O. O. (2013). Housing delivery system, need and demand. Retrieved February 2014, from Journal of Environment, Development and Sustainability: DOI 10.1007/s10668-013-9474-9
McLeod, L., Doolin, B., & MacDonell, S. G. (2012). A Perspective-Based Understanding of Project Success. Project Management Journal, 43(5), 68–86.
Muller, R., & Turner, R. (2007). The Influence of Project Managers on Project Success Criteria and Project Success by Type of Project. European Management Journal, 25(4), 298–309.
Musa, M. M., Amirudin, R. B., Sofield, T., & Musa, M. A. (2015). Influence of External Environmental Factors on the Success of Public Housing Projects in Developing Countries. Construction Economics and Building, 15(4), 30-44.
Pinto, J. K., & Slevin, D. P. (1988). Project Successs: Definitions and Measurement Techniques. Project Management Journal, xix(1), 67-71.
Pheng, L. S., & Chuan, Q. T. (2006). Environmental factors and work performance of project managers in the construction industry. International Journal of
Rad, P. F. (2003). Project Success Attributes. Journal of Cost Engineering, 45(4), 23-29.
Sanvido, V., Grobler, F., Parfitt, K., Guvenis, M., & Coyle, M. (1992). Critical Success Factors for Construction Projects. Journal of Construction Engineering and Management, 118(1), 94-111.
Tabachnick, B. G., & Fidell, L. S. (2013). Using Multivariate Statistics. Upper Saddle River: Pearson Education, Inc.
Toor, S. R., & Ogunlana, S. O. (2010). Beyond the 'Iron Triangle’: Stakeholder Perception of Key Performance Indicators (KPIs) for Large-Scale Public Sector Development Projects. International Journal of Project Management, 28, 228–236.
Turner, J. R. (2009). The Handbook of Project Based Management. New York: McGraw-Hill Education.
UN.Habitat. (2009). Financing Affordable Social Housing in Europe. Nairobi: United Nations Human Settlements Programme.
Xiong, B., Skitmore, M., & Xia, B. (2015). A Critical Review of Structural Equation Modeling Applications in Construction Research. Automation in Construction, 49, 59- 70.

111
1. Introduction Building envelope refers to an enclosure of a built environment, which comprises of walls, doors, windows, roof, skylights, and other openings for light and ventilation. Building envelope as the totality of (building) elements made up of components which separate the indoor environment of the building from the outdoor environment (Oral et al.,2004). The envelope protects the building’s interior and occupants from the weather conditions and other external elements. Design features of an envelope strongly affect the visual and thermal comfort of the occupants, as well as energy consumption in the buildings. Emergence of a building envelope design depends upon the ‘Skin’ (material used), built form, building pattern and building scale or its proportions. A building envelope is usually designed with respect to various determinants such as: environmental, technological, socio-cultural, functional and aesthetic. Building envelope components can be divided into opaque and transparent components. The opaque components include walls, roofs, slabs, basements walls and opaque doors. Transparent components (fenestration system) of a building envelope includes windows, skylights, ventilators, doors that are more than one half glazed, and glass block walls. Common measures of the effectiveness of a building
envelope components include physical protection from weather and climate (comfort), indoor air quality (hygiene and public health), durability and energy efficiency. It should also satisfy the user psychologically and environmentally. Psychologically, outside views are very important. (Thomas, 2002) Environmentally, the questions that need to be addressed are: how they respond to solar radiation (both from sun’s heat and light), how is ventilation made possible, how is heat loss minimized and how is noise controlled? Development of a building envelope or skin is likely to be rapid in the next decade or so. Technological innovation in glass will allow window systems to respond according to environmental conditions to achieve sustainability in built form.
2. Theoretical Background 2.1 Energy Efficiency and Sustainability Term energy efficiency means to reduce the amount of energy required to provide comfortable indoor spaces. If a building is consuming less energy from outside to sustain, it can be green or energy efficient according to the building energy certification, but not sustainable (Dempsey and Bramley, 2012). Sustainable buildings need to work efficiently for a long period keeping comfort, function, usability,
INTERNATIONAL JOURNAL OF BUILT ENVIRONMENT AND SUSTAINABILITY Published by Faculty of Built Environment, Universiti Teknologi Malaysia
Website: http://www.ijbes.utm.my
IJBES 3(2)/2016, 111-118
Design Determinants of Building Envelope for Sustainable Built Environment: A Review
Gireendra Kumar* and Gaurav Raheja
Department of Architecture & Planning, Indian Institute of Technology Roorkee, Uttrakhand, India *Email: [email protected]
ABSTRACT Building envelope separates indoor environment form outside environment as well as provides a comfortable indoor environment through an appropriate balance of passive and active technologies. Building envelopes and its components are designed with respect to environmental, technological, socio-cultural, functional and aesthetic determinants. In contemporary scenario a major concern is to get a comfortable indoor environment in respect of thermal, visual and psychological comfort. Further innovation in designing and construction of contemporary building envelope and its components is likely to be developed rapidly. Designing of buildings and its envelope have a major focus on making buildings sustainable by reducing energy consumption without compromising on user’s comfort. This creates a challenge to the designer and engineers to study and monitor the impact on performance of built form design determinants. This paper aims to describe and highlight the role of design determinants in building envelope and in its various components to achieve sustainable built environment. Study has described the difference in terms “energy efficiency and sustainability” in buildings and built spaces for users through the review of definitions and past researches. Further design concept and technology discussed through relevant examples of various typologies of building envelope system and described the parameters of building envelope’s transparent and opaque components for evaluation. This study is an attempt to describe the integration of design determinants like environmental, technological, socio- cultural, functional and aesthetic in building envelope and its components in making efficient and sustainable built form and space as per user comfort. The paper concludes with meaningful recommendations for sustainable development in designing future building envelopes
History:
Received: 30 January 2016 Accepted: 25 April 2016 Available Online: 30 May 2016 Keywords:
Building Envelope, Sustainability, Energy Efficiency,
Comfort, Users.
DOI:
10.11113/ijbes.v3.n2.127

112
durability of the space and material. Acceptance of users to live and work in that space is the most important criteria for sustainable buildings. Sustainability has to be considered as a dynamic concept, which will change over in a place with time and need of users. It is as an integrative and holistic process of maintaining a dynamic balance between the needs and demands of people for equity, prosperity and quality of life (Plesis, 2003). The task of a designer is to create a system which maintains physical conditions within a specified set point range, and occupants, company culture, location and other contextual factors have no role to play in achieving comfort and satisfaction (Healey and Mannisov, 2012). The Energy Conservation Building Code (ECBC) of India provides a mandatory provision for building envelope design and prescriptive criteria and trade off options for façade and fenestration design. To achieve those prescriptive requirements for energy efficient building envelope design depends on the designer’s creativity (USAID-ECO-III, 2009). This is required now to use and apply unconventional building envelope practices that are ecologically, socially and culturally sustainable at the same time. Energy efficiency and renewable energy are said to be the “twin pillars” of a sustainable energy policy (Brundtland Commission, 1987). Design strategies must be developed concurrently in order to stabilize design aspects in building envelope as well as reduce carbon dioxide emissions by using technology based on renewable energy.
The architecture history, often noted that is traceable through windows, whose size, shape and interface with the building envelope define architectural styles. In broadest sense, windows not only encompass the glazing proper, but also external or internal shading and light control elements – like overhang, louvers, shades and blinds, light shelves, or brise-soleil. Opaque building materials such as clay bricks, gypsum, stones, cement and RCC will be characterized for its thermal conductivity, thermal diffusivity, specific heat, density etc. Transparent – translucent materials such as glass, acrylics will be characterized for transmittance, absorptance and reflectance (Carmody, Selkowitz, Lee, Arasteh and Willmert, 2004). From the last century, the language of architecture has given more emphasis to lightness & transparency of building- which pushing towards fully glazed envelopes. They are habitable due to presence of heating and cooling systems; otherwise it is difficult to control climatic parameters in the space (Butera, 2005). Now that we are into the 21st century, people are slowly beginning to realize the necessity of energy efficiency of building and its sustainability. The biggest disadvantage to green buildings in our contemporary period is that the buildings are front loaded, i.e. initial start-up costs are often slightly higher than conventional buildings. Creative design solution & innovation can integrate solar technology into building envelope components to create self-sustainable building in terms of energy consumption and generation (Manríquez, 2006). Traditional design techniques and innovative use of materials in building envelope can play important role to make our built environment healthy and economical to the users. 2.2 Evolution of Building Envelope Components The Building Envelope design had constantly evolved from our ancestor to our contemporary period. People in traditional culture know how to make the buildings they need. Over years, through trial, error, reflection and new trials, building traditions have evolved that integrate materials, climate, other physical constraints, and cultural practice into architecture forms that meet the needs of individual or group. The building envelope design had developed with transfer of traditional
architectural knowledge from person to person or generation to generation. People in these cultures develop spoken and written means of codifying building traditions, also know how to transmit this knowledge from one generation to next. Thus, eventually the roof, wall and floor became distinct elements of the building envelope that have continued to this day with very little change in concept, use and even material. To take one element of the envelope, the wall, its basic performance requirements have remained the same from medieval times to this day: protection of the interior from the elements and security for its occupants. Traditional buildings (like designed by Hassan Fathy) are design according to the need of people at that time with consideration of local climate and easily available material (Crouch and Johnson, 2000; Koenigsberger, 2000). Over the period with new trials, errors and reflections, building traditions have evolved that integrate materials, climate, other physical constraints, and cultural practice into architecture forms that meet the needs of individual or group (Acar and Onder, 2006). Earlier timber or bamboo frames clad with leaves or woven textiles were used for making shelters. Also, heavier indigenous materials such as stone, rock and clay baked by the sun were used (Thomas, 2002; Koenigsberger, 2000). Traditional buildings accomplished many of the building envelope functions by default through use of thick, heavy masonry which is fireproof and good for insulation in both summer and winter. Technology development with time brings modification in the design of shelter with understanding of using building components to provide more comfortable and functional indoor spaces (Manríquez, 2006). The big change in the concept of the wall or building envelope occurred with the invention of steel, reinforced concrete, glass and curtain wall in the nineteenth century. The exterior wall could become a screen against the elements and no longer be needed to support the floors and roof (Crouch and Johnson, 2000; Acar and Onder, 2006). The modern architectural revolution beginning in the early 20th century changed this and by mid-century the steel or concrete framed office building with its lightweight metal and glass curtain wall had become the new world-wide vernacular for larger commercial and institutional buildings.
3. Methodology Building envelope design for different types of buildings have been studied, investigated and researched. This review began by searching databases using relevant search terms in the domain of energy efficient and sustainable buildings. This produced a number of articles, research papers, Indian standards and books, which were considered relevant for this study. Based on this study, major design determinants for building envelope design were identified and further sub factors and aspects were studied in assessment of their role and impact. As well as papers providing references back to earlier work, the citations of a number of notable articles were also traced forwards to more recent researches in this domain. Based on the findings from the literature review, the field of sustainable built environments draws on a number of disciplines and determinants of the buildings envelope and its components. That has been in relation to domain of purely functional, aesthetic, environmental, technological and social aspects for buildings envelope design. Energy saving and sustainable design opportunities in an unconditioned or conditioned buildings have been have been reviewed and identified. This has been discussed in results after reviewing and categorizing the parameters or determinants based on types of components of building envelope and façade typologies. This research

113
deals with a study of building envelope design and strategies affecting the indoor built spaces comfort level and technological integration methods and tools for building envelopes’ components.
4. Determinants Role in Building Envelope Building envelope’s component design must take the consideration of both the external and internal heat loads, as well as daylight benefits. Building envelope components are always design with an objective to achieve environmental, technological, socio cultural, functional and aesthetic design determinants to achieve its highest workability, efficiency and sustainability. These design determinants includes study of aspects like maximization of the daylight entrance, controlling the direct sunlight, minimizing the heat gain during overheated period, providing glare control and view to the outdoor environment. To design building envelope for a space, determination of component’s properties and parameters will help in understanding physical process of heat, air, moisture and light through the building envelope (Figure1). In the comfort domain, most important factor is thermal comfort and which is measured by variables like dry blub temperature (DBT), wet blub temperature (WBT), Relative Humidity (RH), globe temperature (GT), clo value, heat exchange, air velocity etc., on which various model & equations are already developed. Thermal comfort can be defined as the
conditioned of mind which expresses satisfaction with the thermal environment. This depends upon the environmental parameter such as physiology, psychology and behavioral factors. As such comfort is a complex relationship between parameters such as metabolic rates, the level of clothing being worn, air temperature, relative humidity, mean radiant temperature, local air velocity and radiant asymmetry. (Anderson, T, 2012). The use of daylight is more of an architectural than a building-systems challenge. Daylight helps in improving the functional determinant of built space and also helps in making social or user’s activities productive. Optimizing the distribution of daylight saves the energy and reduces the heats generated by artificial lighting. First and foremost, however, natural lighting is a key factor in architectural design of a space and promotes the visual comfort of the user. (Krishan, Baker et al, 1999) Many buildings with sufficient daylight in the interior are nevertheless plagued by problems arising by glare, usually in connection with computer related work. What is needed in these situations is dispersed light or deflection of incident sunlight, which can also improve the distribution of light in the interior. Daylight intensity diminishes rapidly as the distance from the window is increases. Given an average room height and fenestration, the maximum depth of natural light in a room is about 6m (Thomas, 2002). Light distribution system can improve the light distribution in the room without, however, greatly expanding the effectively lit room depth. There are some design strategies that make natural lighting in deep interiors possible, for example, sky lights, light domes, light wells and atria (like figure 2) (Krishan, Baker et al, 1999). Sun protection in summer (like shading devices, horizontal & vertical louvers, blinds and shade or wall projection) is vital in connection with these functional, environmental and aesthetic determinants. Environmental determinant plays a very important role and directly impacts the energy efficiency and sustainability of a built space. In domain of environmental determinants, solar radiation is the most important climate factor. As solar radiation is responsible for the heat gain in a built space or form and also make lighten up the space. Energy exchange between building and its environment is characterized by a continual crossing of thermal boundaries (building envelope components) between interior and exterior. This unique interior - exterior relationship occurs in various ways, most of which are barely noticeable. Energy exchanges are happened due to heat gain through solar radiation and convection process, which also affect people and building’s space environment. Externally, the building envelope is
Figure 1: Major Component of Envelope & Physical Process (Source: USAID-ECO-III, 2009)
Figure 2: Section of Facade (a) Sloped surfaces at opening to soften glare; (b) Deep wall section for self-shading (Source: Krishan, Baker et al., 1999)

114
subject to solar gain, radiation exchange with its surroundings and convective heat loss or gain owing to the winds that almost continuously flow past it. To control and maintain adequate environment in the built form, building envelope design takes the lead role. In the design of envelope includes shape of building (massing), fenestration (size, position and orientation), solar control by shading devices and surface finishes, building facade fabric or material (insulation and thermal storage) and opening size and shape for light and ventilation. In simple terms, this design process and concept is also known as “solar architecture”. In this the main principle is to understand the solar geometry, both in cold climates where its utilization can contribute greatly to heating, and in warm zones, where the focus is on avoiding solar incidence in summer. Dependent on cloud cover, global radiation is composed of a direct and a diffuse component. The diffused component of solar radiation is non-directional. Design measures for passive utilization of solar energy are chiefly based on direct solar radiation; which may be influenced by the orientation of facade (Krishan, Baker et al., 1999; Koenigsberger et al., 2000). Determination of the building envelope alternatives can be done for transparent and opaque elements with an objective to achieve environmental, technological, socio cultural, functional and aesthetic design determinant’s parameters. Parameters which are observed to study properties and behavior of components may be separated into two groups i.e. parameters related to an external environment and parameters related to the built environment. Parameters related to the external environment are outdoor air temperature, solar radiation, outdoor humidity, outdoor wind velocity, outdoor illumination level, and outdoor sound level (Oral et al, 2004). These values for the local environmental conditions can be obtained from geographic, meteorological and topographical data. A building’s location and surroundings also plays a key role in regulating its temperature and illumination through building envelope. For example, trees, landscaping, and hills can provide shade and block wind. In cold climate, designing of buildings with south-facing windows increases the amount of sun (ultimately heat energy) entering the building, minimizing energy use, by maximizing passive solar heating. Tight
building design, including energy-efficient windows, well-sealed doors, and additional thermal insulation of walls, basement slabs, and foundations can reduce heat loss by 25 to 50 percent (Thomas, 2002). Parameters related to the built environment can be obtained separately for opaque components and for transparent components of building envelope with an influence on the control of heat, light and sound, as well as energy conservation as shown in Table 1 (Oral et al., 2004). Alternate design of building envelope components is possible by making different fenestration assembly and wall layers combinations. These alternative designs construct different building envelope design types. Building envelope types defines the degree of compactness and identity that can be achieved in different kinds of buildings like office or commercial buildings, educational campuses, housing, school buildings etc. Building envelope different designs would depend on the wall design with opening(s) as well as on the number of layers in wall structure in regard to compactness, natural lighting and solar heat gain.
5. Typologies of Building Envelope To understand the behavior of building envelope components categorization of different types of building envelope needed to define suitable combinations for the site and climate. Normally building envelope is categorized into two parts:
Single skin façade building envelope
Double or multiple skin façade building envelope As this has been discussed a building element was evolved from past to current architecture style and now it is being used in multiple layer of material or skin in contemporary building façade, which termed as double skin façade. The benefits for using the concept of double skin building envelope in buildings to encourage for sustainable building design and save energy to make built thermally and visually comfortable. In contemporary period, designer and researchers from the building community have integrated sustainable design concepts that can improve the overall design determinants results through enhancing indoor air quality, thermal and visual comfort while
Opaque Components (Walls, roofs, slabs, basements walls and opaque doors)
Transparent Components (Fenestration system : windows, ventilators, doors, glass wall, glazing etc)
Orientation of building, its form and size of external obsta-cles
Orientation of fenestration components, and external obstacles
Position of building relative to other building. Dimensions of the transparent component. Soil cover and nature of ground Heat transmission coefficient of the glazing. Thickness, density, specific heat and conduction coefficients of materials.
Absorption, reflection and transmission coefficient of the glazing for solar radiation.
Light absorption and reflection coefficients of the surfaces Transmission coefficient of the glazing for diffuse sunlight. Porosity and roughness of the surface. Transmission coefficient of the glazing for direct sunlight. Sound transmission and absorption coefficient of the sur-face.
Transmission coefficient of the glazing for sound.
Depth of the cavity between the layers. Type of frame used for the transparent component. Thickness and sound absorption of the insulating material used inside the cavity.
Maintenance factor of the glazing.
Kind of connection between layers of different materials, and their number.
Thermal properties of spacer and cavity in glazing system.
Table 1: Parameters for Opaque and Transparent Components of Building Envelope (After Oral et al., 2004)
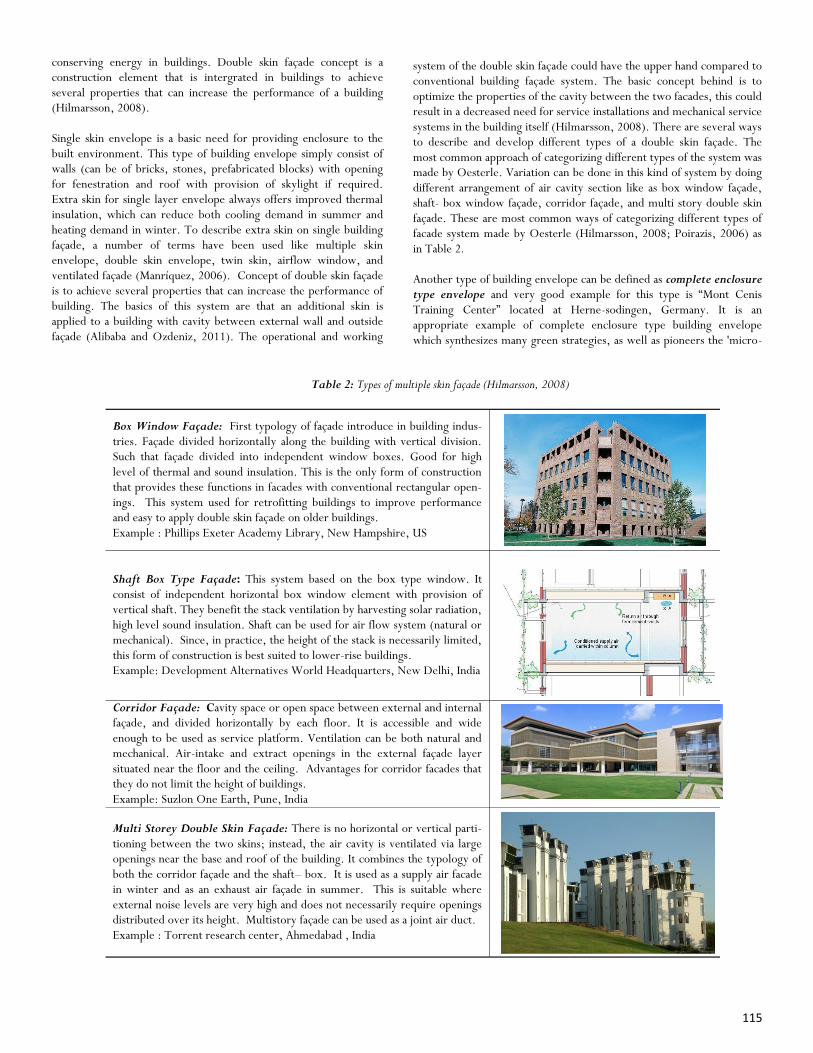
115
conserving energy in buildings. Double skin façade concept is a construction element that is intergrated in buildings to achieve several properties that can increase the performance of a building (Hilmarsson, 2008). Single skin envelope is a basic need for providing enclosure to the built environment. This type of building envelope simply consist of walls (can be of bricks, stones, prefabricated blocks) with opening for fenestration and roof with provision of skylight if required. Extra skin for single layer envelope always offers improved thermal insulation, which can reduce both cooling demand in summer and heating demand in winter. To describe extra skin on single building façade, a number of terms have been used like multiple skin envelope, double skin envelope, twin skin, airflow window, and ventilated façade (Manríquez, 2006). Concept of double skin façade is to achieve several properties that can increase the performance of building. The basics of this system are that an additional skin is applied to a building with cavity between external wall and outside façade (Alibaba and Ozdeniz, 2011). The operational and working
system of the double skin façade could have the upper hand compared to conventional building façade system. The basic concept behind is to optimize the properties of the cavity between the two facades, this could result in a decreased need for service installations and mechanical service systems in the building itself (Hilmarsson, 2008). There are several ways to describe and develop different types of a double skin façade. The most common approach of categorizing different types of the system was made by Oesterle. Variation can be done in this kind of system by doing different arrangement of air cavity section like as box window façade, shaft- box window façade, corridor façade, and multi story double skin façade. These are most common ways of categorizing different types of facade system made by Oesterle (Hilmarsson, 2008; Poirazis, 2006) as in Table 2. Another type of building envelope can be defined as complete enclosure type envelope and very good example for this type is “Mont Cenis Training Center” located at Herne-sodingen, Germany. It is an appropriate example of complete enclosure type building envelope which synthesizes many green strategies, as well as pioneers the 'micro-
Box Window Façade: First typology of façade introduce in building indus-tries. Façade divided horizontally along the building with vertical division. Such that façade divided into independent window boxes. Good for high level of thermal and sound insulation. This is the only form of construction that provides these functions in facades with conventional rectangular open-ings. This system used for retrofitting buildings to improve performance and easy to apply double skin façade on older buildings. Example : Phillips Exeter Academy Library, New Hampshire, US
Shaft Box Type Façade: This system based on the box type window. It consist of independent horizontal box window element with provision of vertical shaft. They benefit the stack ventilation by harvesting solar radiation, high level sound insulation. Shaft can be used for air flow system (natural or mechanical). Since, in practice, the height of the stack is necessarily limited, this form of construction is best suited to lower-rise buildings. Example: Development Alternatives World Headquarters, New Delhi, India
Corridor Façade: Cavity space or open space between external and internal façade, and divided horizontally by each floor. It is accessible and wide enough to be used as service platform. Ventilation can be both natural and mechanical. Air-intake and extract openings in the external façade layer situated near the floor and the ceiling. Advantages for corridor facades that they do not limit the height of buildings. Example: Suzlon One Earth, Pune, India
Multi Storey Double Skin Façade: There is no horizontal or vertical parti-tioning between the two skins; instead, the air cavity is ventilated via large openings near the base and roof of the building. It combines the typology of both the corridor façade and the shaft– box. It is used as a supply air facade in winter and as an exhaust air façade in summer. This is suitable where external noise levels are very high and does not necessarily require openings distributed over its height. Multistory façade can be used as a joint air duct. Example : Torrent research center, Ahmedabad , India
Table 2: Types of multiple skin façade (Hilmarsson, 2008)
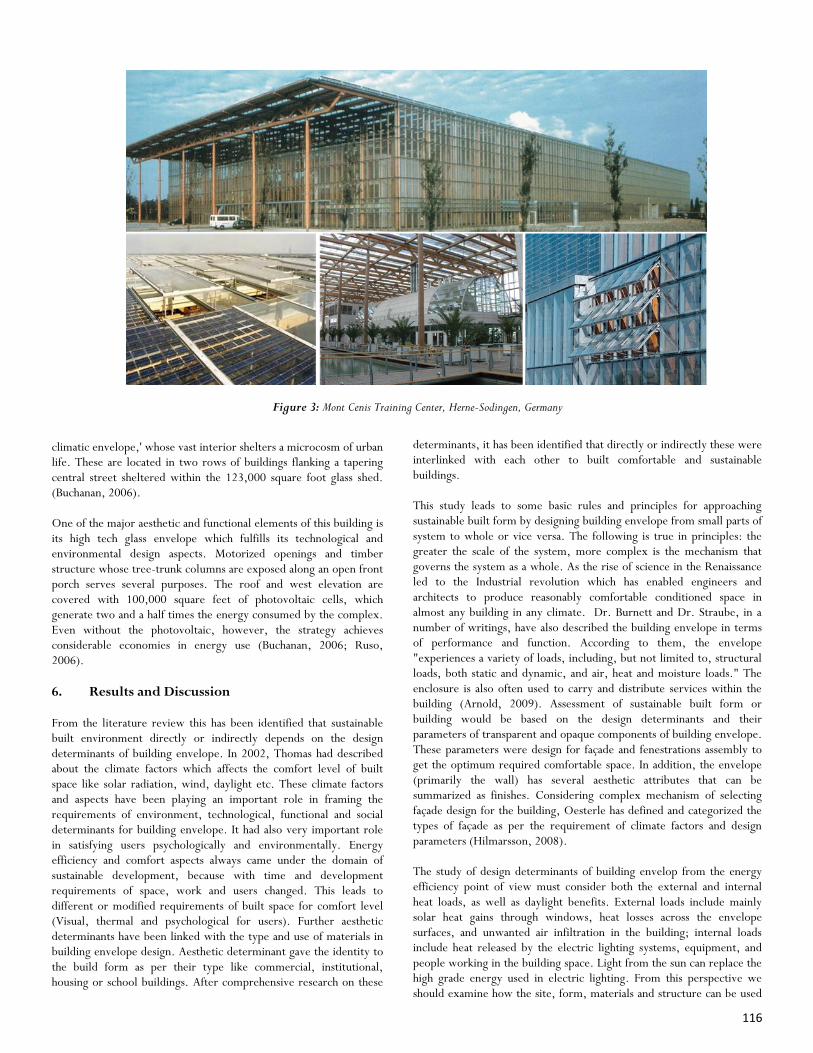
116
climatic envelope,' whose vast interior shelters a microcosm of urban life. These are located in two rows of buildings flanking a tapering central street sheltered within the 123,000 square foot glass shed. (Buchanan, 2006). One of the major aesthetic and functional elements of this building is its high tech glass envelope which fulfills its technological and environmental design aspects. Motorized openings and timber structure whose tree-trunk columns are exposed along an open front porch serves several purposes. The roof and west elevation are covered with 100,000 square feet of photovoltaic cells, which generate two and a half times the energy consumed by the complex. Even without the photovoltaic, however, the strategy achieves considerable economies in energy use (Buchanan, 2006; Ruso, 2006).
6. Results and Discussion From the literature review this has been identified that sustainable built environment directly or indirectly depends on the design determinants of building envelope. In 2002, Thomas had described about the climate factors which affects the comfort level of built space like solar radiation, wind, daylight etc. These climate factors and aspects have been playing an important role in framing the requirements of environment, technological, functional and social determinants for building envelope. It had also very important role in satisfying users psychologically and environmentally. Energy efficiency and comfort aspects always came under the domain of sustainable development, because with time and development requirements of space, work and users changed. This leads to different or modified requirements of built space for comfort level (Visual, thermal and psychological for users). Further aesthetic determinants have been linked with the type and use of materials in building envelope design. Aesthetic determinant gave the identity to the build form as per their type like commercial, institutional, housing or school buildings. After comprehensive research on these
determinants, it has been identified that directly or indirectly these were interlinked with each other to built comfortable and sustainable buildings. This study leads to some basic rules and principles for approaching sustainable built form by designing building envelope from small parts of system to whole or vice versa. The following is true in principles: the greater the scale of the system, more complex is the mechanism that governs the system as a whole. As the rise of science in the Renaissance led to the Industrial revolution which has enabled engineers and architects to produce reasonably comfortable conditioned space in almost any building in any climate. Dr. Burnett and Dr. Straube, in a number of writings, have also described the building envelope in terms of performance and function. According to them, the envelope "experiences a variety of loads, including, but not limited to, structural loads, both static and dynamic, and air, heat and moisture loads." The enclosure is also often used to carry and distribute services within the building (Arnold, 2009). Assessment of sustainable built form or building would be based on the design determinants and their parameters of transparent and opaque components of building envelope. These parameters were design for façade and fenestrations assembly to get the optimum required comfortable space. In addition, the envelope (primarily the wall) has several aesthetic attributes that can be summarized as finishes. Considering complex mechanism of selecting façade design for the building, Oesterle has defined and categorized the types of façade as per the requirement of climate factors and design parameters (Hilmarsson, 2008). The study of design determinants of building envelop from the energy efficiency point of view must consider both the external and internal heat loads, as well as daylight benefits. External loads include mainly solar heat gains through windows, heat losses across the envelope surfaces, and unwanted air infiltration in the building; internal loads include heat released by the electric lighting systems, equipment, and people working in the building space. Light from the sun can replace the high grade energy used in electric lighting. From this perspective we should examine how the site, form, materials and structure can be used
Figure 3: Mont Cenis Training Center, Herne-Sodingen, Germany

117
to reduce energy consumption but maintain comfort. Some basic general principles and strategies that would help us to manage the transition of space to make comfortable, healthy and energy efficient for achieving sustainable built form, like: a) Building Orientation and its form, b) Climate condition design, c) Energy flow in building, and d) Material and construction (Thomas, 2002; Koenigsberger, 2000). Building envelope components plays an important role in tackling all aspects to achieve the design determinants for building envelope design.
Building Orientation and its form: Designers and Architects always look for optimal building orientation but in all cases it is not possible to get, due to site constraints or neighborhood objects. Like in complex urban context consideration of land value, access to traffic volume, noise, urban integration, density, neighboring development, services etc. has become very important and it works as a constraint for designing.
Climate condition design: Building envelope design should consider the technical data or information of local region climate (location, topography, site orientation and vegetation) for the basic understanding to achieve design determinants and its analysis (for sun path, wind flow, rainfall etc.).
Energy flow in building: Understanding physics of heat, air, moisture and light gives the picture of exchange of energy between the interior of built environment with external. Relationship can be mapped out between various aspects or design determinants of building envelope. This can reduce the negative impact of energy exchange which affects people and building performance, as building envelope is subject to solar gains, radiation exchange, air flow and convective heat loss/gain.
Material and construction: Materials affect structure, form, aesthetics, cost, method of construction and internal & external environments. There are a number of ways in which to reduce the embodied energy and CO2 production of buildings. The first is to select lower energy materials. A second is to design for longevity includes high quality and durability of materials. Third aspect is economic use of materials and designing to reduce waste. Recycling of material is final and very important aspect of sustainability (Thomas, 2002).
The above aspects of design determinants in building envelope and in its components, plays an important role to achieve comfortable and sustainable built environment. 7. Conclusion and Recommendations In summary, this could be state that the building envelope and its components always play an important role in providing a comfortable enclosure for users. Designing building envelope with consideration of environmental, technological, socio-cultural, functional and aesthetic determinants helps in achieving energy efficient and sustainable built forms. Further study of building envelope and its components’ evolution from past technology to contemporary could make the environment of built space user friendly in reference of social culture determinants. Study and examine the properties of transparent and opaque parameters would guide in the selection of facades typology for understanding building envelope behavior as per site condition and requirements. One challenge for technological and socio-culture determinants in designing façade and selecting transparent components design is balancing design and human issues with numerous technical and functional criteria of built form and space. Design and selection of the building envelope typology and its fenestrations style for openings have been strongly based on the local area’s climate factors and orientation in order to fulfill the requirements of environmental determinant. This could help in to achieve the sustainable design for building façade components. Further dynamic building façade of typologies needs to incorporate more opacity, more solidity and insulation, with windows strategically located where natural light penetration is actually required. Innovation in the design of façade as per design determinant’s need with commitment to adopt energy conservation strategies would definitely help in reduction of the environmental load. It could be recommended to use an innovative combination of different façade types with application of basic design principle and strategies as well as using of renewable energy technology like integration of PV cell into façade components. This would increase overall energy efficiency and environmental quality or determinant of built space like in Mont Cenis Training Center. For moving towards advancement in technology, further research is needed to be done on different components of building envelope with integration of renewable energy considering
Figure 4: Design Determinants Role of Building Envelope
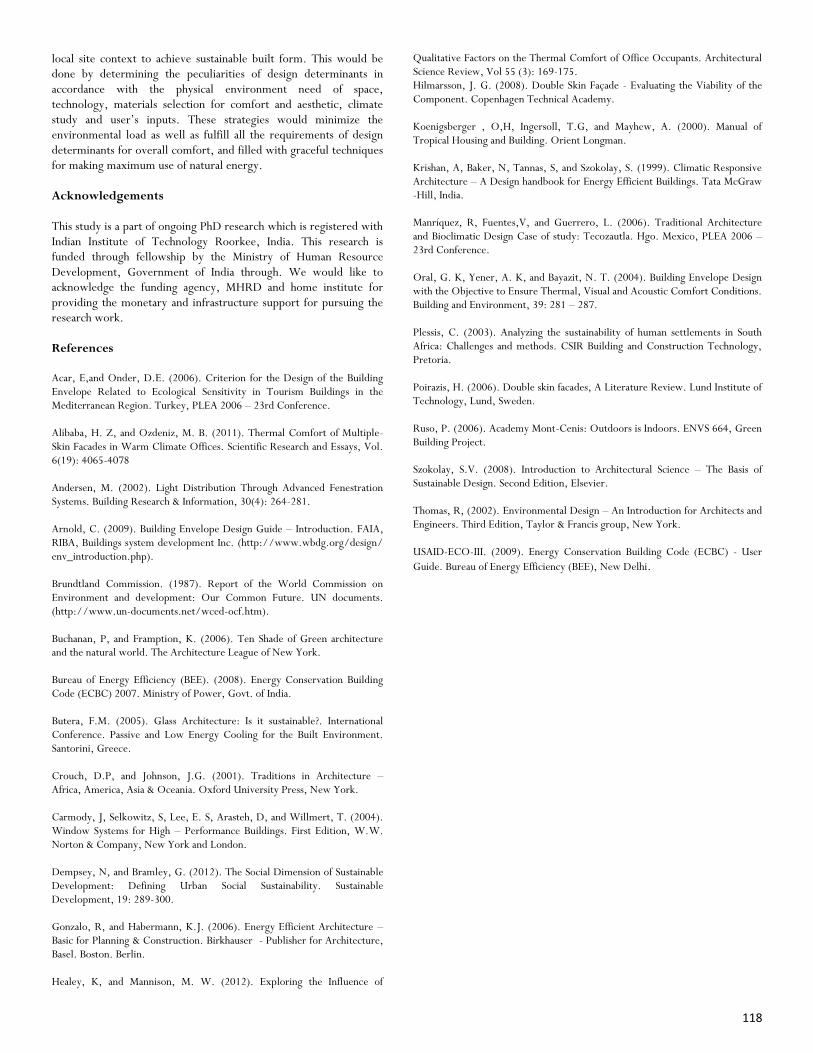
118
local site context to achieve sustainable built form. This would be done by determining the peculiarities of design determinants in accordance with the physical environment need of space, technology, materials selection for comfort and aesthetic, climate study and user’s inputs. These strategies would minimize the environmental load as well as fulfill all the requirements of design determinants for overall comfort, and filled with graceful techniques for making maximum use of natural energy. Acknowledgements This study is a part of ongoing PhD research which is registered with Indian Institute of Technology Roorkee, India. This research is funded through fellowship by the Ministry of Human Resource Development, Government of India through. We would like to acknowledge the funding agency, MHRD and home institute for providing the monetary and infrastructure support for pursuing the research work. References Acar, E,and Onder, D.E. (2006). Criterion for the Design of the Building Envelope Related to Ecological Sensitivity in Tourism Buildings in the Mediterranean Region. Turkey, PLEA 2006 – 23rd Conference. Alibaba, H. Z, and Ozdeniz, M. B. (2011). Thermal Comfort of Multiple-Skin Facades in Warm Climate Offices. Scientific Research and Essays, Vol. 6(19): 4065-4078 Andersen, M. (2002). Light Distribution Through Advanced Fenestration Systems. Building Research & Information, 30(4): 264-281. Arnold, C. (2009). Building Envelope Design Guide – Introduction. FAIA, RIBA, Buildings system development Inc. (http://www.wbdg.org/design/env_introduction.php). Brundtland Commission. (1987). Report of the World Commission on Environment and development: Our Common Future. UN documents. (http://www.un-documents.net/wced-ocf.htm). Buchanan, P, and Framption, K. (2006). Ten Shade of Green architecture and the natural world. The Architecture League of New York. Bureau of Energy Efficiency (BEE). (2008). Energy Conservation Building Code (ECBC) 2007. Ministry of Power, Govt. of India. Butera, F.M. (2005). Glass Architecture: Is it sustainable?. International Conference. Passive and Low Energy Cooling for the Built Environment. Santorini, Greece. Crouch, D.P, and Johnson, J.G. (2001). Traditions in Architecture – Africa, America, Asia & Oceania. Oxford University Press, New York. Carmody, J, Selkowitz, S, Lee, E. S, Arasteh, D, and Willmert, T. (2004). Window Systems for High – Performance Buildings. First Edition, W.W. Norton & Company, New York and London. Dempsey, N, and Bramley, G. (2012). The Social Dimension of Sustainable Development: Defining Urban Social Sustainability. Sustainable Development, 19: 289-300. Gonzalo, R, and Habermann, K.J. (2006). Energy Efficient Architecture – Basic for Planning & Construction. Birkhauser - Publisher for Architecture, Basel. Boston. Berlin. Healey, K, and Mannison, M. W. (2012). Exploring the Influence of
Qualitative Factors on the Thermal Comfort of Office Occupants. Architectural Science Review, Vol 55 (3): 169-175. Hilmarsson, J. G. (2008). Double Skin Façade - Evaluating the Viability of the Component. Copenhagen Technical Academy. Koenigsberger , O,H, Ingersoll, T.G, and Mayhew, A. (2000). Manual of Tropical Housing and Building. Orient Longman. Krishan, A, Baker, N, Tannas, S, and Szokolay, S. (1999). Climatic Responsive Architecture – A Design handbook for Energy Efficient Buildings. Tata McGraw-Hill, India. Manríquez, R, Fuentes,V, and Guerrero, L. (2006). Traditional Architecture and Bioclimatic Design Case of study: Tecozautla. Hgo. Mexico, PLEA 2006 – 23rd Conference. Oral, G. K, Yener, A. K, and Bayazit, N. T. (2004). Building Envelope Design with the Objective to Ensure Thermal, Visual and Acoustic Comfort Conditions. Building and Environment, 39: 281 – 287. Plessis, C. (2003). Analyzing the sustainability of human settlements in South Africa: Challenges and methods. CSIR Building and Construction Technology, Pretoria. Poirazis, H. (2006). Double skin facades, A Literature Review. Lund Institute of Technology, Lund, Sweden. Ruso, P. (2006). Academy Mont-Cenis: Outdoors is Indoors. ENVS 664, Green Building Project. Szokolay, S.V. (2008). Introduction to Architectural Science – The Basis of Sustainable Design. Second Edition, Elsevier. Thomas, R, (2002). Environmental Design – An Introduction for Architects and Engineers. Third Edition, Taylor & Francis group, New York. USAID-ECO-III. (2009). Energy Conservation Building Code (ECBC) - User
Guide. Bureau of Energy Efficiency (BEE), New Delhi.

119
1. Introduction Land regularization or title ratification can be defined as a legalization of interests on land which is acquired irregularly and thus lacking legal status. According to Section 26(2) of the Land Use Act of 1979 Law of Federal Republic of Nigeria, the legal title to a land within each state of the federation can be held by possessing Certificate of Occupancy (C of O) issued by state governors over land within their jurisdictions. Therefore, any interest in land contrary to possession of C of O is not recognized by law in Nigeria. Land title regularization is a mechanism that allows informal land to secure formal and legal recognition by the government. As a result of this, land title regularization policies are conceived and implemented to ensure that lands acquired irregularly are given legal recognition in order to promote security of land tenure and sustainable urban development. This has become an inevitable tool for solving future social and economic problems which can be associated with insecurity of land tenure (Besley and Burgess 1998). Growth of informal settlements is a product of irreconcilable relationship between urbanization and land market. Increase in urban population exerts pressure on the land market by increasing demand for urban land (UN-HABITAT, 2010). The increase in demand for urban land leads to competition which makes informal and squatter
settlements to flourish because the low income earners in the society who cannot access land through the formal or state recognized means resort to accessing land informally. Omirin (2002) asserted that land accessibility, affordability, availability and security of tenure are major components of sustainable urban land development. Deficit of any of these major components of sustainable urban land development, leads to growth in the informal land market. Land regularization is a deliberate action of the government in recognizing the land title of those that accessed land from the informal land market so as to make land accessible, available, affordable and secured for the citizens. Omirin (2002) asserted that growth of informal settlements in developing countries is an evidence of income disparity in such countries. This was corroborated by Homes (2007) who asserted that governments in the developing world have been pressured by the electoral process into showing greater tolerance to their landless poor, allowing tenure regularization through intermediate forms of title, such as temporary occupation licenses, permits to occupy or certificate of comfort in the Caribbean. This assertion revealed that informal lands are common among the urban poor. Rakodi and Leduka (2003) discovered that majority of urban residents,
INTERNATIONAL JOURNAL OF BUILT ENVIRONMENT AND SUSTAINABILITY Published by Faculty of Built Environment, Universiti Teknologi Malaysia
Website: http://www.ijbes.utm.my
IJBES 3(2)/2016, 119-125
Citizens’ Satisfaction on Land Titling Policy and Regularization in Ogun State, Nigeria Joseph Oyewale Oyedeji Department of Estate Management, Bells University of Technology, Ota, Ogun State, Nigeria Email: [email protected], Abiodun Kazeem Sodiya Department of Estate Management and Valuation, Moshood Abiola Polytechnic, Abeokuta, Ogun State, Nigeria Email: [email protected]
ABSTRACT Land title is the designation of an official certificate indicating the name of the individual in whom such ownership is vested. Thus any illegal acquisition of land lacks legal status, then land title regularization will be necessary. When designing and implementing land regularization, the citizen’s opinion is not usually taken into consideration. This study fills this gap by taking statistically representative samples of the opinion of home owners in Ogun State, Nigeria on their level of satisfaction with the latest land regularization policy of Ogun State government. We adopted a purposive sample technique, and we administered a Questionnaire survey to property owners in the study area. Data gathered were analyzed using descriptive method of statistics and the level of satisfaction of the respondents was evaluated based on relevant criteria adopting a 4 point Likert scale. We found that that none of the respondents acquired their through a formal source and none of the have the statutory certificate of occupancy for their land. We also measured the level of satisfaction of the respondents and we found that the property owners dissatisfied with the extent of high-handedness of the staff of the regularization agency and the level of transparency of the scheme. It was also found that home owners mostly dissatisfied with the amount paid for the application and the procedure for processing title documents. It is very important for the government to address dissatisfaction of the citizens with the scheme and to subsequently include sampling opinion of citizen’s level of satisfaction as an integral part of land regularization policies.
History:
Received: 20 March 2016 Accepted: 2 May 2016 Available Online: 30 May 2016 Keywords:
Building Envelope, Sustainability, Energy Efficiency,
Comfort, Users.
Corresponding Author’s Contact:
+2348138451880 and +2348132397861
DOI:
10.11113/ijbes.v3.n2.128

120
especially the poor access proprietary rights through the informal land market as a result of urban growth. Nigeria is not an exemption of this trend, as Vision 2020 (2010) stated that only 20% of the lands in Nigeria are duly registered. This percentage shows that the proportion of land duly registered by the government is low and this really depicts that the proportion of those accessing land through the informal land market is high. As a result of this, deliberate action of the government is needed to regularize the informal lands so as to foster rapid economic development as postulated by Valey (1998) who posited that economic development can be engineered by regularizing the informal land. Government of developing nations of the world had taken various steps to regularize lands in their respective countries. However, none of them considered it important to evaluate success of the land regularization schemes they implemented. It is necessary to evaluate the level of satisfaction of the citizens about the program designed to make them better off. Research has shown that evaluation of citizen’s level of satisfaction with land regularization is not considered as an integral part of conception, design and implementation of land regularization. This study aimed at filling this gap by evaluating the level of citizen’s satisfaction with land regularization of Ogun State government, Nigeria. This will be achieved by examining the source of land acquisition and citizen’s evidence of ownership before subscribing to the regularization scheme. Finally, by evaluating the level of citizen’s satisfaction based on relevant criteria to the scheme.
2. Land Regularization in Ogun State (Home-owners Charter Scheme, HOCS)
The HOCS was an adhoc policy program designed and introduced by Ogun State government, Nigeria in September, 2013 to allow those that hold land illegally within the State to regularize their title and obtain a Certificate of Occupancy (C of O) and other land related documents. The scheme acknowledged illegality of such lands but does not revoke “ownership” from the illegal settlers but focuses majorly on ratifying title to landed property. The implementation of the title ratification is being handled by Ogun State Bureau of Lands and Survey in partnership with Pishonland Services Limited. Part of the benefit of the scheme is reduced associated cost and timing for the processing of the title document compared to the existing land registration process. The concern of the state government was the rate at which informal settlements were flourishing in the state without appropriate title documentation. However, this program was only restricted to habitable residential properties. Properties close to gas pipe lines, petroleum pipe lines and high voltage power lines are not eligible for this program. The procedure involved in the title ratification scheme (Figure 1) starts with obtaining a N10,000 (USD64 as at September, 2014) application form, and a processing fee of N5,000 (USD32) (Central Bank of Nigeria, 2014). This figure is acclaimed to be just 25% of the amount that a property owner will normally pay to get all these documents under normal registration process. The filled application form will then be submitted with a copy of registered survey plan, building approval, land purchase receipt or other requirements if possessed to the nearest ad hoc HOCS office scattered across the state. The next stage of the process is the schedule of inspection and verification of the subject property by staff of Ogun State Bureau of Lands. The inspection will be conducted latest 4weeks from the date of submission of the application (according to the program time table). The staff will generate an assessment report of the property based on their observations during inspection. The assessment report will also indicate the amount payable by the property owner. This amount is determined by the nature of the
existing document (survey plan, architectural drawings, approved building plan etc.) the property owner possesses. However, it is only properties free of encumbrances that will be ratified. Encumbered properties according to the scheme are the properties in locations under government acquisition. The flat rate of obtaining all the necessary documents for un-encumbered property is N95,000 (USD513). After the prescribed amount has been paid, the applicant will be issued the Certificate of Occupancy and other documents.
3. Theoretical Background 3.1 Informal Settlements Urbanization has been attributed as the major cause of informal settlement growth (Midheme, 2007). UN-Habitat (2004) posited that 80% of world population growths between 1990 and 2000 are in the urban areas. Also, rural-urban migration attributed for high urbanization rate in the urban areas and this consequently increase poverty rate of the urban areas (UNDP, 2005). The body posited further that the urbanization process happen against a backdrop of dwindling resources on the part of the urban authorities to finance the requisite urban services and infrastructure to accompany the growth in urban population. A consequential effect of these trends has been the inability of the formal channels of land supply in cities to carter for land demand. Therefore, citizens result to the informal land market for land acquisition. In contrary, Fernandes (2006) posited that the process of informal access to urban land and housing results from a combination of still little understood reasons, and is itself one of the underlying bases for many other serious problems. The scholar posited further that the causes of informal access to urban land ranges from global, macroeconomic to local variables. He however emphasized that five of the causes deserve special attention. The five causes are: the lack of formal options resulting from the nature of land, urban, housing, and fiscal policies; the exclusionary dynamics of formal land markets that do not cater to the urban poor; the long-standing political manipulation of
Figure 1: flow chart of Ogun State Home Owner Charter Scheme

121
the people living in informal settlements through renewed practices; the elitist and technocratic planning systems put in place by local administrations, which fail to take into account both the socioeconomic realities determining the conditions of access to urban land and housing, and the capacity of local administrations to act to implement urban legislation; and lastly, the obsolete nature of the legal and judicial systems prevailing in many developing and transitional countries. The scholar summed it up that more should be done locally to reduce the effect of informal settlements. In another instance, Tsenkova et al (2009) described informal settlements as settlements often characterized as “illegal” residential formations lacking basic infrastructure, security of tenure and adequate housing. The study also identified growth of informal settlements as a feature of urbanization. This assertion was corroborated by Ali and Sulieman (2006) who posited that informal settlements are prevalent in developing nations due to limited capacity of government to address the negative impact of urbanization. Informal settlements are faced with the challenge of insecure tenure of housing. The study also discovered that informal settlements are faced with insufficient social and physical infrastructure and the lack of government involvement to improve the conditions in some informal housing settlements consequently contributes to extreme poverty, higher child mortality and deteriorating urban conditions. Informal settlements are known to be illegal settlements not recognized by the government. However, they can be classified based on their peculiar features. Tsenkova et al. (2009) classified informal settlements as follows: Squatter settlements on public or private land; Settlements for refugees and vulnerable people; Upgraded squatter settlements; illegal sub-urban land division on legally owned private with illegal changing of land-use regulations, often on the urban fringe; overcrowded, dilapidated housing without adequate facilities in city centers or densely populated urban areas. The classified informal settlements have a common feature despite their differences. The common feature is that they are not recognized as an ideal settlement for human living by the state. The peculiarity of these classified informal settlements has been the major consideration of different government in solving the problems that are associated with informal settlements in their respective countries. There are different measures that have been taken by government of different developing countries to solve the problems of informal settlements. However, the most important measure is the implementation of land regularization policy to regularize title documents of informal housing and lands. In some instances, urban renewal and land regularization were implemented together as a measure to resolve the problems of informal settlement. The essence of implementing urban renewal was to clear city slum and not to formalize title to land. Land regularization is the state mechanism for recognizing illegally occupied lands. 3.2 Land Regularization Land regularization refers to processes and procedures involving land use planning, cadastral surveying and land registration which include upgrading and land legalization processes of informal settlements (Amin, 1997) . Land regularization or title ratification is the deliberate action of the government to legalize or formalize informal settlements or land with the aim of ensuring sustainable development. Advocates of land regularization predicts that its benefits begin with registered title, which they believe will lead not only to improve tenure security, increased
incentives for land-attached investments, and access to formal credit but also to benefits society in the form of increased agricultural employment and demand for inputs (Deininger, 2003; Feder and Nishio, 1998). Despite the numerous benefits of land regularization, the policy is usually characterized with protests especially by the urban poor whenever they are not satisfied with the scheme. Mollet (2006, 2010) explored how Honduran rural women contested the acclaimed racialized and gendered influence that characterized land regularization in Honduras. The scholar discovered that the women were not pleased with the land regularization exercise in Honduras that was acclaimed to favor some tribes and the men. Also, Gould (2014) revealed that the peasants were not ready to participate in land titling exercise in Northern- Guatemala because the associated cost for ratifying title document was based on the market value of the land and most peasants could not afford it. The land titling exercise was argued to paved way for land grabbing from the peasant by the rich elite. It has been established, that most land regularization policies implemented in developing nations are characterized by revolt from the poor due to one reason or the other. It is difficult, to achieve optimum success in regularizing informal title if the citizens are not cooperative. This assertion was substantiated by Monkkonen (2008) who conducted an empirical test on the level of success of land titling in 140 regularly developed neighborhoods where regularization was implemented in Mexico. He discovered that the land regularization exercise failed because most citizens saw the policy as a form of exploitation by the government. The citizens believed that the government is more concern with the income to be realized from the regularization project rather than execution of the project. Sincerity of purpose of government on the regularization exercise was in doubt. As a result of the different criticism characterizing land regularization programs, integration of community participation was advocated by scholars. Armstrong (1987) and Majani (2000) advocated that local communities should be incorporated into land regularization projects in order to provide an alternative to the non-participatory land regularization which is more of a planning approach. The scholars buttressed that the non-participatory approach involve more of designing master plan for an informal settlement. The non-participatory approach was identified as the major cause of community’s condemnation of the land regularization project. Therefore, the need for carrying along communities in land regularization projects is imperative so as to have a sustainable land regularization exercise. This position was also corroborated by Kombe et al.,(1995) Alfonsin (1997) and De Soto (2000) who asserted that community involvement in land regularization has been perceived as a viable strategy to enhance security of land tenure in informal neighborhoods. Furthermore, lack of government will to implement land regularization policies have been identified as another cause of failure of land regularization projects. Mabogunje (1992) and UNDP (1998) established that the haphazard and disjointed effort of government in implementing land regularization policy, contributed to continued informal settling, fears of landholder’s eviction, inadequate manpower and finance mobilization and political interference in rapid urbanizing cities. Having established the importance of community participation in land regularization exercise and the importance of government will to implement land regularization policy, it become imperative to examine the level of satisfaction of the citizens with land regularization, designed and implemented for their community.

122
3.3 Land Regularization and Citizen’s Satisfaction Pressure for land title to be regularized, recognized and ratified is a common phenomenon in the developing nations of the world. However, evaluation or examination of the level of citizens‟ satisfaction with land regularization policy after its implementation is rare. In the executive summary of the experience gained in land regularization in the Brazilian municipals compiled by the Institute of Brazilian Municipal Administration IBAM (2002), it was stated that the state and municipal governments were motivated by the positive assessment of previous experiences in Teresina, Belo Horizonte, Recife and Victoria and the negative assessment in Belem lowlands. The body also stated that growth in urban violence as in Rio de Janeiro and social exclusion in Santo Andre motivated the government to embrace mass municipal land regularization. However, the IBAM failed to reveal details of the evaluation conducted on land regularization in municipals in Brazil. Valey (1998) designed a model on how to execute an efficient land regularization. The study defined land regularization as a process of social integration of urban poor into the life of the city and also a process of political integration of urban poor into government recognized system. The research evaluated the level of satisfaction with land regularization in Mexico by assessing the level of satisfaction with land regularization in terms of political popularity. The author reported that the ease of securing political votes by a government that implemented land regularization policy is the best means of accessing the level of satisfaction of citizens with a land regularization exercise. The author failed to consider the fact that there are numerous factors that can determine electoral victory apart from implementation of land regularization. Mertins et al. (1998) classified squatter settlements into informal and semi-formal land. The research classified semi-formal land as land purchased from a legal source but not duly registered. The author stated that eradication of conflicts that generates from land in accessibility as the best means of accessing citizen’s satisfaction with land regularization. The authors asserted that the level of citizens‟ satisfaction can best be measured when there is no more conflict in an area faced with conflict that arose from informal land. The study concludes that, peace in a community is the best means to measure citizen’s level of satisfaction with land regularization. However, like Valey (1998), the study did not take into cognizance that other factors can influence peace in an informal settlement where land regularization is implemented. In addition, authors evaluating citizen’s level of satisfaction on land regularization policies failed to breakdown criteria for evaluation. Evaluation were mainly done based on societal reaction without knowing the criteria appreciated most in the regularization scheme by the citizens. This was revealed in the work of Valey (1998) where evaluation of land title regularization in Mexico was based on electoral victory. The author failed to evaluate based on relevant factor to the title regularization. This gap will be filled by this study. The level of satisfaction of respondents will be evaluated based on factors that can influence decisions of the citizens on the land title regularization policy. Magigi and Majani (2006) emphasized the importance of feedback to the success of land regularization project. The scholars concluded that communities must be involved in the design and implementation of land regularization. Also, it was established that feedback mechanism on the level of success of land regularization exercise should be incorporated into land regularization projects. Furthermore, the study revealed that
the integration of community participation in land regularization can only be successful if community leaders are carried along. The aim of land regularization is to increase land accessibility in order to foster sustainable land development. However, in order to achieve land accessibility, different parameters had been suggested by different scholars. Omirin (2002) discussed the importance of reduced cost of land registration, tenure security, reduction in time of preparation, reduction in bureaucracy and citizen friendly process of preparation as necessary ingredients for an efficient land registration process. Also, Agunbiade, Rajabfard and Bennett (2011) emphasized the essence of transparency, staff capability, government sincerity, and anti-corruption measures in land administration. All these important factors will be adopted in the evaluation of the land title regularization scheme.
4. Methodology This study has adopted Ogun State, Nigeria as its case study. Ogun State is in the South-western part of Nigeria created in the year 1976 with a land size of 16,980 sq km. According to the 2006 National population census, the population of the state stood at 3,751,140 people and it was ranked 16th out of the 36 States in Nigeria in terms of population size (National Population Commission, 2006). It borders Lagos State in the South, Oyo and Osun States to the North, Ondo State to the east and Republic of Benin to the West. The study populations for this study are the property owners that subscribed to the HOCS occupying properties in four communities in Sango and Ota area of Ogun State. The choice of Sango and Ota communities is as a result of their proximity to Lagos state which is the commercial nerve center of Nigeria. Questionnaires were designed and systematically administered to the respondents. In addition to questionnaires administration, some of the respondents were interviewed on their level of satisfaction with the HOCS. The level of satisfaction of the citizens on the HOCS was measured by adopting ordinal scale (Likert type) to determine the importance of the factors. This was adopted because the tool provides means for measuring respondents‟ impression in an attitudinal study. This was used by Ogunba (2012) where he carried out a study on the factors responsible for the continuous use of rent areas assumptions in investment modeling. Also, Udoekanem (2012) measured opinion about study of plant and machinery valuation by undergraduate students. The data gathered was analyzed using the relative importance index (a form of weighted average ranking). Purposive method of sampling was employed due to the fact that not all the landed properties owners within the study area subscribed to the land title regularization scheme. Also, eligibility clause of the scheme that makes it exclusive for habitable landed property and exclusion of properties built on right of way yielded a sample size of 200. The data collected was analyzed using SPSS 17.0 software and descriptive methods of statistics were adopted to present the result.
5. Results and Discussions Out of the 200 questionnaires administered, 179 were returned but only170 questionnaires (representing 85%) were valid for analysis. This high retrieval rate can be attributed to respondents‟ zeal of giving feedbacks on the land regularization exercise. The result of the survey is presented in Table 1. Table 1 reveals the various sources by which the respondents acquired
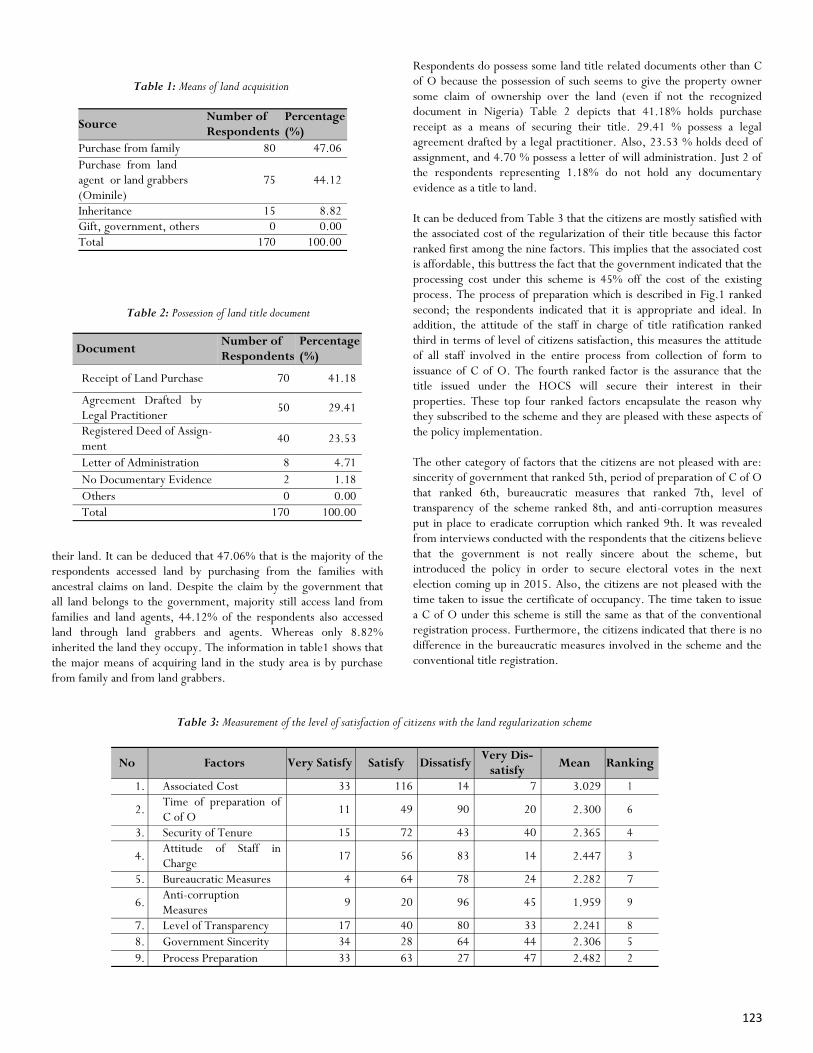
123
their land. It can be deduced that 47.06% that is the majority of the respondents accessed land by purchasing from the families with ancestral claims on land. Despite the claim by the government that all land belongs to the government, majority still access land from families and land agents, 44.12% of the respondents also accessed land through land grabbers and agents. Whereas only 8.82% inherited the land they occupy. The information in table1 shows that the major means of acquiring land in the study area is by purchase from family and from land grabbers.
Respondents do possess some land title related documents other than C of O because the possession of such seems to give the property owner some claim of ownership over the land (even if not the recognized document in Nigeria) Table 2 depicts that 41.18% holds purchase receipt as a means of securing their title. 29.41 % possess a legal agreement drafted by a legal practitioner. Also, 23.53 % holds deed of assignment, and 4.70 % possess a letter of will administration. Just 2 of the respondents representing 1.18% do not hold any documentary evidence as a title to land. It can be deduced from Table 3 that the citizens are mostly satisfied with the associated cost of the regularization of their title because this factor ranked first among the nine factors. This implies that the associated cost is affordable, this buttress the fact that the government indicated that the processing cost under this scheme is 45% off the cost of the existing process. The process of preparation which is described in Fig.1 ranked second; the respondents indicated that it is appropriate and ideal. In addition, the attitude of the staff in charge of title ratification ranked third in terms of level of citizens satisfaction, this measures the attitude of all staff involved in the entire process from collection of form to issuance of C of O. The fourth ranked factor is the assurance that the title issued under the HOCS will secure their interest in their properties. These top four ranked factors encapsulate the reason why they subscribed to the scheme and they are pleased with these aspects of the policy implementation. The other category of factors that the citizens are not pleased with are: sincerity of government that ranked 5th, period of preparation of C of O that ranked 6th, bureaucratic measures that ranked 7th, level of transparency of the scheme ranked 8th, and anti-corruption measures put in place to eradicate corruption which ranked 9th. It was revealed from interviews conducted with the respondents that the citizens believe that the government is not really sincere about the scheme, but introduced the policy in order to secure electoral votes in the next election coming up in 2015. Also, the citizens are not pleased with the time taken to issue the certificate of occupancy. The time taken to issue a C of O under this scheme is still the same as that of the conventional registration process. Furthermore, the citizens indicated that there is no difference in the bureaucratic measures involved in the scheme and the conventional title registration.
Source Number of Respondents
Purchase from family
Purchase from land agent or land grabbers (Ominile)
Inheritance Gift, government, others Total
Table 1: Means of land acquisition
Document Number of Respondents
Receipt of Land Purchase
Agreement Drafted by Legal Practitioner
Registered Deed of Assign-ment
Letter of Administration
No Documentary Evidence
Others Total
Table 2: Possession of land title document
No Factors Satisfy
Mean Ranking
1. Associated Cost 3.029
2. Time of preparation of C of O
2.300
3. Security of Tenure 2.365
4. Attitude of Staff in Charge
2.447
5. Bureaucratic Measures 2.282 7
6. Anti-corruption Measures
1.959
7. Level of Transparency 2.241
8. Government Sincerity 2.306
9. Process Preparation 2.482
Table 3: Measurement of the level of satisfaction of citizens with the land regularization scheme

124
All these prove that the citizens are not totally pleased with the land regularization exercise. However, the land regularization policy is a welcome development.
6. Recommendations and Conclusions This study has attempted to measure citizen’s level of satisfaction with the HOCS of the Ogun State government geared towards regularization of informal land title documents of properties within the states. The citizens indicated that the scheme is a welcome development because associated cost is affordable, the process is ideal, the attitude of the personnel involved in the process is tolerable and that the exercise will earn them security of tenure. However, the citizens are not pleased with the following factors: sincerity of government, period of preparation of C of O, bureaucratic measure, transparency of the scheme, and the anti-corruption measure put in place by the government. Therefore, the government needs to address the factors that the citizens are not satisfied with, because without a total acceptance of the scheme, successful land title regularization cannot be achieved. Optimum success of land regularization brings about unprecedented development and also wealth creation for both the government and the citizens. In order to achieve well acceptable land regularization policy, this study recommends that government should always include evaluation of citizen’s opinion as an integral part of land regularization policy. This will give the government opportunity to get feedback on the implementation of land policy. Government should set-up a task force that will monitor activities of the civil servant charged with the exercise. By doing this, the citizens will see government to be sincere about the scheme. This is important because perception about government sincerity ranked 5th. Also, it is necessary for the government to see to the time taken in processing a certificate of occupancy as obtainable in the developed country. Furthermore, the bureaucratic measures or process involved should be reduced. Some of the processes should be made automated by adopting the necessary technology. This will make the whole process quicken. This will be able to change perception about time of preparation of C of O and bureaucracy that ranked 6th and 7th respectively. In addition, Government should embrace the political will to prosecute any staff alleged collecting bribe or any form of inducement in order to serve as a deterrent to others. Land matters is always characterized with corruption due to its importance to the people, this is necessary because anti-corruption and level of transparency ranked 8th and 9threspectively in the study and if corruption and lack of transparency are not well addressed, it can render the whole program useless. Also, government should provide an avenue for citizens to give feedback on the running of land regularization process. This will give the government the privilege to address the areas where the scheme is not performing to expectation and to sustain areas where the scheme is performing well. In addition, there should be continuity in the program and indeed governance. Title ratification exercise should be a continuous program and should not be canceled by another regime. Also, other States governments within the Nation should also introduce this in their respective states, so that there will be an even national development in the country. Finally, governments of other developing nations of the world should ensure that evaluation of citizen’s satisfaction is an integral part land regularization schemes.
References Agunbiade M E, Rajabifard A and Bennett R (2011) Land Administration for Housing Production: Drivers, Concepts and Analytic Tools, TS05B- Developments in Land Administration FIG Working Week, Bridging the Gap between Cultures Marrakects, Morocco Ali M.H and Sulaiman M.S (2006) The Causes and Consequences of the Informal Settlements in Zanzibar. TS35-Informal Settlements: Policy, Land Use and Tenure, Shaping the change XX III FIG Congress Munich, Germany. Amin, Nurul (1997). Formal and informal sector paradigm. Urban Development Dialogue, 6. Armstrong, A. (1987). Master plans for Dar es Salaam, Tanzania. Habitat International, 11(2): 133–145. Besley T and Burgess R (1998) Land Reform, Poverty Reduction and Growth: Evidence from India. The Development Economics Discussion Paper Series, Suntory and Toyota International centers for Economic and Related disciplines, London School of Economic, London Central Bank of Nigeria (2014) Monthly average exchange rate of the Naira (Naira per unit of currency) - 2013. Retrieved from www.cenbank.org/rates/exrate.asp?year= 2013amonth=10 Deininger K.W (2003) Land Policies for Growth and Poverty Reduction: A World Bank Policy Research Report (World Bank, Washington) Feder G and Nishio A (1998) “ The benefits of land registration and titling: economic and social perspectives” Land Use Policy, 15(1):25-43. Fernades, E (2006) Urban Land Regularization Program In Global Poverty Gould K.A (2014) Everyday expertise: land regularization and the conditions for land grabs in Preten, Guatemala. Environment and Planning A, 46:2353-2368 Home R (2007) This land belongs to you and me: The global challenge of land management, inaugural lecture at Anglia Ruskin University IBAM Executive Summary (2002) Estudo de Aveliacao da Experiencia Brasileria sober Urban zacao de Farelas e Regularizacao Fundiaria prepared by Brasileiro De Administracao municipal- IBAM, subtitled in English Language Land Use Act of 1979, Law of Federal Republic of Nigeria Mabogunje, A. L. (1992). A new paradigm for urban development. Washington, DC: The World Bank. Magigi W and Majani B.B.K (2006) Community Involvement in Land Regularization for Informal Settlement in Tanzania: A strategy for enhancing security of tenure in residential neighborhoods, Habitat International 30: 1066 – 1088. Majani, B. B. (2000) Institutionalizing environmental planning and management. The Institutional Economics of Solid Waste Management in Tanzania. Ph.D. thesis, Spring research Series: Vol. 28, Dortmund. Mertins G, Popp J, Wehrmann B, Pander H (1998) Land Tenure and Land Regularization in Informal Urban Settlements in Developing Countries- Examples from Latin America and Africa. Division 4500 Rural Development. Sector Project: Importance of Land Policy and Land Tenure in Developing Countries Mollet S (2006) “Race and natural resource conflicts in Honduras: the Miskito and Garifauna struggle for Lasa Pulan” Latin American Research Review 4 pp. 76-101 Mollet S (2010) “ Esta lito (are you ready)? Gender, race and land registration in

125
the Rio Platano Biosphere Reserve” Gender, Place and Culture 17: 357 – 375 Monkkonen P (2008) Land Regularization in Tijuana, Mexico. Working Paper 2008-01 Institute of Urban and Regional Development. Midheme E.P.O (2007) State-Vs. Community-led Land Tenure Regularization in Tanzania, The Case of Dares Salam City. Unpublished M.Sc Thesis Submitted to the Department of Geo-Information Science and Earth Observation, University of Dares Salam, Tanzania. Nigeria National Population Commission Census Record (2006) Ogunba O. A (2012) the Error in Ordinary Annuity Assumptions in Nigeria Investment Valuation. Journal of the Nigerian Institution of Estate Surveyors and Valuers: 37(1): 23 - 34 Omirin, M (2002) Land accessibility withers Nigeria. A paper presented at workshop on land tax reform in University of Lagos, Lagos state, Nigeria Payne G and Durand-Larserve A. (2012) “Holding on: Security of Tenure – types, Policies, Practices and Challenges “This research paper was prepared for an expert group meeting on security of Tenure convened by the special rapporteur Rakodi and Leduka (2003) In UNHABITAT Handbook for Practitioners on Urban Land Market: Economic Concepts and Tools for Engaging in Africa Tsenkova S, Potsiou C and Badyina A (2009) Self-made Cities In Search of Sustainable Solutions for Informal Settlements in the United Nations Economic Commission for Europe Region. UNITED NATIONS PUBLICATIONS, Sales No. E.09.11.E.9, ISBN 978-92-1-117005-4 pg 28 – 32. Udoekanem N. B (2012) Education and Training of Plant and Machinery Valuers in Nigeria: Imperatives of Industry- Academia Collaboration. Journal of the Nigerian Institution of Estate Surveyors and Valuers: 37(1):82- 89. United Nations Development Programme (UNDP) (1998). Human development report. London: Oxford Press. United Nations Development Programme UNDP (2005) A home in the city: UN Millennium Project task force on improving the lives of slum dwellers. London: Earthscan. United Nations Habitat UN-HABITAT (2001) Declaration on Cities and Other Human Settlements in the New Millennium. United Nations Habitat UN-HABITAT (2003) Global Report on Human Settlements 2003. The Challenge of Slum, London. United Nations Habitat UN-HABITAT (2004) Global Campaign for secure tenure: A tool for advocating the provision of adequate shelter for urban poor. Nairobi:UN-Habitat. United Nations Habitat UN-HABITAT (2010) Urban Land Market: Economic concepts and tools for engaging in Africa, United Nations Human Settlement Programme, Nairobi, Kenya, www.unhabitat.org Valey (1998) new models of Urban Land Regularization In Mexico: Decentralization and Democracy Vs. Clientilism, Paper for delivery at the 1998 meeting of the Latin America Studies Association. Vision 2020 (2010) Nigeria vision.
126
1. Introduction India being the third largest economy of the world, more number of the population (more than two third of the total population) lives in villages, and started to consuming more quantity of energy in the recent years. The year 1999-2000, the domestic sector in India consumed 86.6 billion kWh of the total of 395 billion kWh, which is accounted for 22 per cent of the total electricity consumption (Kumar et al., 2003). Though the electricity consumption in the domestic sector has increased up to 22 per cent of the total electricity consumption, electricity consumption in villages is very less, since good number of villages in the rural system are not even electrified. In urban areas almost 90 per cent of the household use electricity for lighting and just 10 per cent use kerosene for the said purpose, whereas in the rural areas still more number of households use kerosene for lighting purposes. The per household energy consumption for lighting is 402 kWh in the urban system and it is 271 kWh in rural system (Stephane et al., 2009), whereas in kerosene consumption for lighting, it is 2151 MJ per households in the urban system and 1562 MJ per households in the rural system, which shows that the households in the urban system consume huge quantity of energy for lighting purposes compared to the households in the rural system (Stephane et al., 2009). Though the villages do not consume more quantity of electricity in the residential sector, India has the highest per capita residential energy consumption compared to China and the US. The residential energy consumption depending on various factors including location, building size, weather, architectural design, housing unit, application of home
appliances, people’s attitude and behaviors, type of constructions, energy use pattern, energy consuming devices installed in building, etc. The building sector in India consumed 33 per cent of the total electricity consumption, of which the residential sector is accounted for 25 per cent, and the rest is used for the commercial sector. Energy consumption for lighting in residential sector is one of the most important parameters, which needs more attention since most of the Indian households, normally, use incandescent bulbs because of their low initial fixing cost. In India the purchasing cost of CFL is almost 50 times more than that of incandescent bulb and twice than of fluorescent tube lights (Kaya D, 2003). This incandescent bulb is absolutely inefficient compared to CFL lights since CFL light consume 4 to 5 times less amount of energy for the same lumen output compared to incandescent bulb, and it has been observed that the duration (life period) of CFL lights is increased up to 13 times compared to the standard incandescent bulb (Kumar et al., 2003). Application of advance technology in appliances at the household’s level reduces energy consumption. It is observed in Brazil that application of advanced technology in appliance reduce 27.4 per cent of electricity consumption, replacement of incandescent bulb with compact fluorescent lamp (CFL) save 14.5 per cent of energy, solar water heater save 7.7 per cent of energy, and refrigerator save 6.1 per cent of energy (Bukarica et al., 2007; Garbacz C, 1983; Mahlia et al., 2005). Similar findings were also observed in Croatia (Bukarica et al., 2007; Mahlia et al., 2005). It is also interesting to note that few more studies in different parts of world observed that application of CFL at
INTERNATIONAL JOURNAL OF BUILT ENVIRONMENT AND SUSTAINABILITY Published by Faculty of Built Environment, Universiti Teknologi Malaysia
Website: http://www.ijbes.utm.my
IJBES 3(2)/2016, 126-133
A Household-based analysis of domestic energy consumption for lighting in Jaipur City
Nand Kumar1*, V. Devadas2 1Department of Architecture and Planning, Malviya National Institute of Technology, Jaipur 302017, India 2Department of Architecture and Planning, Indian Institute of Technology Roorkee 247667, India
*Email: [email protected]
ABSTRACT India being the third largest economy of the world, more than two third of the total population lives in villages and started to consuming more quantity of energy in the recent years. Though the electricity consumption in the domestic sector has increased up to 22 per cent of the total electricity consumption, electricity consumption in villages is very less, since good number of villages in the rural system are not even electrified. In urban areas almost 90 percent of the household use electricity for lighting and just 10 percent use kerosene for the said purpose, whereas in the rural areas still more number of households use kerosene for lighting purposes. In this paper an attempt is made to analyze the domestic energy consumption for lighting in Jaipur city. Good amount of literature collected pertaining to domestic energy consumption for lighting purposes across the globe, analyzed thoroughly and presented. Further, a household survey was conducted among 684 households in Jaipur city by employing pre-tested schedule. The schedule has few variables including identification particulars, economic conditions, demographic pattern, domestic lighting appliances at the household level; and the energy consumption pattern. Further the collected data are analyzed and a multiple regression model was developed by considering the total electricity consumption as dependent variable ‘Y’ and the electrical appliances for lighting purposes, such as the number of incandescent bulbs, tube lights, CFL, and LED are considered as ‘X’ variables; and this study conclude with plausible findings and recommendations.
History:
Received: 21 January 2016 Accepted: 5 May 2016 Available Online: 30 May 2016 Keywords:
Energy consumption, incandescent bulbs, tube lights,
CFLs, LED .
DOI:
10.11113/ijbes.v3.n2.129
127
household level reduce the energy requirement compared to the use of incandescent bulbs in lighting purposes (Anjali and Gadgil, 1996; Balachandra and Reddy, 2007; Balachandra and Shekar, 2001; Bukarica et al., 2007; Haas R, 1997; Johnson et al., 2012; Kaya D, 2003; Larsen and Nesbakken, 2004; Mahlia et al., 2005; Martinot and Borg, 1999). An integrated planning model was developed by having the objective function of maximizing the annual return by replacing the standard device with an efficient one and observed that modern device (CFL) and the light-emitting diode (LED) are the best option compared to the traditional one, since huge quantity is conserved compared to the traditional one, further Discounted Cash Flow (DCF) technique have been employed to quantify the cost of traditional lighting devices and the modern lighting devices and observed that the modern devices are very much cost effective in long run since it gives clean energy along with conserve more quantity of energy (Balachandra and Reddy, 2007). A study in Nigeria observed that application of CFL is the best option at household level for lighting purpose, since it saves huge amount of energy, and it is unfortunate to state that awareness of using CFL is not much observed, hence it is essential to create awareness among the masses to increase the use of CFL by imparting either demonstration methods or other plausible measures. Further, it is observed that CFL manufacturing companies are also not much available since application CFL is much lesser in this country. It is advocated to have accurate metering system, incentive to CFL manufacturing companies, setting up of a standard organization to certify the quality of the CFL and minimization of cost of CFL lamps, etc., in the system (Johnson et al., 2012). Similar observations were also observed in the study conducted in Bombay City in India (Anjali and Gadgil, 1996), and in Arizona City (Kaya D, 2003). In Northern Ireland of UK, domestic energy use and their behavior were studied. Survey research method was employed and observed that 35 per cent of the dwellings units could improve their energy efficiency by improved tank insulation. Further, the people are very much aware of energy efficient appliances at their household level for cooking, lighting and other uses. There were 70-80 per cent of the households undertook same kind of day to day energy efficient measures at their households. Fluorescent bulbs, halogen bulbs are much popular for lighting purpose in the studied areas, and also observed that 61 per cent of the households used energy saving lighting methods. Solid fuels were much used for space heating and were greatly reduced by oil fired central heating. Oil fired central heating along with the use of natural gas has become more popular method in `space heating. Water heating provision was also increasing besides space heating in the system (Garg and Bansal, 2000). The high dependency on traditional fuels (solid fuels) was observed is more in rural households as compared to the urban households (Reddy BS, 2004). In the rural households, on an average 21.44 kg of fuel-wood is consumed per capita per month, whereas it is 6.23 kg in the urban system; the per capita consumption of electricity 5.67 units per month in the rural system, and it is 19.96 units in the urban system, which reflects that there is a serious threat to energy security in the rural system (Jain G, 2010). Further, it has been observed that the household in the rural system shows upward movements on energy ladder starting from kerosene to electricity in lighting and solid fuel to liquid fuels for cooking purpose (Alam and Barnes, 1998; Brounen et al., 2012; Garbacz C, 1993; Gupta and Ravindranath, 1997; Heltberg R, 2003; Jain G, 2010; Link et al., 2012; Mu T et al., 2010; Rao and Reddy, 2007; Reddy et al., 2012; Reddy BS, 2004). Similar findings were also observed in Taiwan, and it is found that the residential electricity
consumption had increased from 257 GWh to 26144 GWh over the period of 40 years, i.e., from 1957 to 1995. It is interesting to note that the aggregate household income is also increased from 22438 to 5003970 New Taiwanese (NT) $ million, which is equal to ten folds increase. It is also interesting to note that there is a vast scale of urbanization took place during this period, i.e., from 1957 to 1995 (Holtedahl and Joutz, 2004). The present study analyzes the lighting energy consumption in the domestic sector of Jaipur City.
2. Study Area at a Glance Jaipur city has been chosen for conducting the present investigation. It lies at 26.92°N latitude & 75.82°E longitude and it is confined in an latitude of 431 meter (above MSL). This city is surrounded by Bharatpur and Dausa district in the East, Alwar district in the North and Sikar district in the North-West, and it has 1464 Sq. km. of geographical area under the Jaipur Development Authority region (Figure 1). As per the census 2011, it has a population of 3073350, and the Jaipur metropolitan area has a population of 3646590, which comprises of Hindu, Muslim, Jain, Christian and Sikh community representing to 77 percent, 17 percent, 4 percent, 0.5 percent and 0.5 percent respectively. It has the sex ratio of 898 female per thousand males and overall literacy rate of the district is 76.44 percent. It is the center of both traditional and modern industries, and it exports gold, diamond and stone jewelry; and is the only center for finishing blue diamond or tanzanite in the world. It is characterized by high temperature, low rain fall and mild winter, since it is located in the hot- dry region. It consumed 936 MW of electrical energy in the year 2011-12 and it’s projected to increase up to 7579 MW for the year 2029-30. Residential energy consumption in the Jaipur city has increased 14.29 per cent per annum between the year 2001-2002 and 2011-2012, i.e., in the year 2001-2002 it is was 1,296,389 MWh, and in the year 2011-2012, it was 3,149,336 MWh.
3. Methodology Survey research methodology has been employed to quantify the residential building energy consumption in the study area, Jaipur city. This city is divided into 76 wards for development administration, and of which 24 wards are selected randomly for conducting the present
Figure 1 Expansion of Jaipur City
(Source: Jaipur City Development Plan, 2005)

128
investigation. It has been observed that the households confined in all the selected wards are varying in number and some wards are having more numbers of households, whereas few are having very less number of households. There are 684 households chosen for conducting the present investigation by employing simple random sampling technique. Subsequently, the household survey was conducted among the chosen households with the help of pre-tested household survey schedule by the investigator himself, and there after tabulation and analysis were done.
4. Tabulation Analysis In tabulation analysis, the more important variables, which have direct association with residential lighting energy consumption are analyzed and presented in the sequel. 4.1 Income Wise Distribution of Households Income is the most important parameter, which decides the functions of the system. The higher income households consume good amount of energy, whereas the lower income households consume lesser amount of energy in their day to day activities. Further, income more or less decides the sources of energy consumption. The higher income households consume more quantity of clean fuels, such as electricity, liquefied petroleum gas (LPG), etc., at the household level, whereas the low income households consume more quantity of traditional sources of energy for their day to day activities. Further, the income increases the households to use more quantity of modern electrical appliances at the household level, which consume huge quantity of clean energy, whereas the lower income households do not use much electrical appliances at the household level, thereby consumption of clean energy is also lesser at the lower income household level. Having this knowledge in the mind, the investigator grouped the surveyed households into six different income groups, such as monthly income of Rs. < 30,000, Rs. 30,000-60,000, Rs. 60,000-90,000, Rs. 90,000-120,000, Rs. 120,000-150,000 and above Rs. 150,000 for analysis, and the results are presented in Table 1. The table illustrates that about two-fifth of the surveyed households confined in the monthly income group of Rs. < 30,000, and it is further observed that availability of households in different income group level is decreasing along with increase in monthly income. Further, it is observed that more than two-third (69.74 percent) of the surveyed households are confined within the monthly income groups of up to Rs. 60,000, which shows that majority of population live in the city are considered to be middle income group.
4.2 Population and Household Size Population is the one of the most important parameters, which decides the functions of the system. The considerable growth of the population in the city is more or less responsible for all kinds of socio-economic evils, which prevail in the cities including schisms, unemployment, underemployment, disguised unemployment, poverty, mall nutrition, increase in crime rate, scarcity of resources, scarcity of infrastructure services, congestion, and so on. Having this knowledge in mind, the population of the city at the household level has been considered as one of the parameters in the survey schedule, conducted the investigation among the chosen samples at the grassroots level, analyzed along with various income groups, and the results are presented in Table 2. This table reveals that more than two-fifth of the population is confined among the lowest income group of the classification, i.e. the monthly income group of Rs. < 30,000 of the total population, and the available number of population is decreasing along with increase in income groups, which is also evident from the Table 1, which states that more number of households confined among the lowest income strata. It is also observed that more than two-third (70.69 percent) of the total population of the surveyed households are confined within the monthly income range of up to Rs. 60,000, which is also almost tallying with the number of households confined in this group. Further, observe that the size of household (persons in household) is decreasing along with increase in monthly income group of up to Rs.1, 50,000, and then observe the reverse trend, which shows that the highest income category people produce more number of population compared to the rest of the income groups. The average population per household is working as 4.9, whereas the highest income category groups has the average household size of 5.8. The least income group of category, i.e., monthly income group of Rs. < 30,000 has 5.2 as average size of household, and the other monthly income groups categories have less than the average size of households, i.e., 4.9. 4.3 Domestic Lighting Appliances (Electrical) In general, the economically well of people (higher income group people) use to fix costly electrical appliances for lighting at their household level. In fact, fixing tube lights, CFL, LED are little costlier compared to fixing incandescent bulbs. The CFL and LED consume lesser amount of energy and produce more amount of lights, whereas the incandescent bulb consume more amount of energy and produce lesser amount of output. Having this knowledge in mind, the investigator considered using different kinds of electrical appliances for lighting, which include incandescent bulbs, tube lights, CFL and LED
No. Income Group
(Rs/Month)
Households
Nos. Percent
1 < 30,000 263 38.45
2 30,000 - 60,000 214 31.29
3 60,000 - 90,000 100 14.61
4 90,000 - 120,000 55 8.04
5 120,000 - 150,000 30 4.39
6 > 150,000 22 3.22
Total 684 100.00
NOTE: Indian Rupee 1000 (Rs) = US Dollar 15
Table 1 Household Income of the Respondents
No. Income Group
(Rs/Month)
Total Population Size of House-
hold Nos. Percent
1 < 30,000 1367 40.60 5.2
2 30,000 - 60,000 1013 30.09 4.7
3 60,000 - 90,000 470 13.96 4.7
4 90,000 - 120,000 260 7.72 4.7
5 120,000 - 150,000 130 3.86 4.3
6 > 150,000 127 3.77 5.8
Total 3367 100.00 4.9
Table 2 Household Income and Household Size
NOTE: Indian Rupee 1000 (Rs) = US Dollar 15
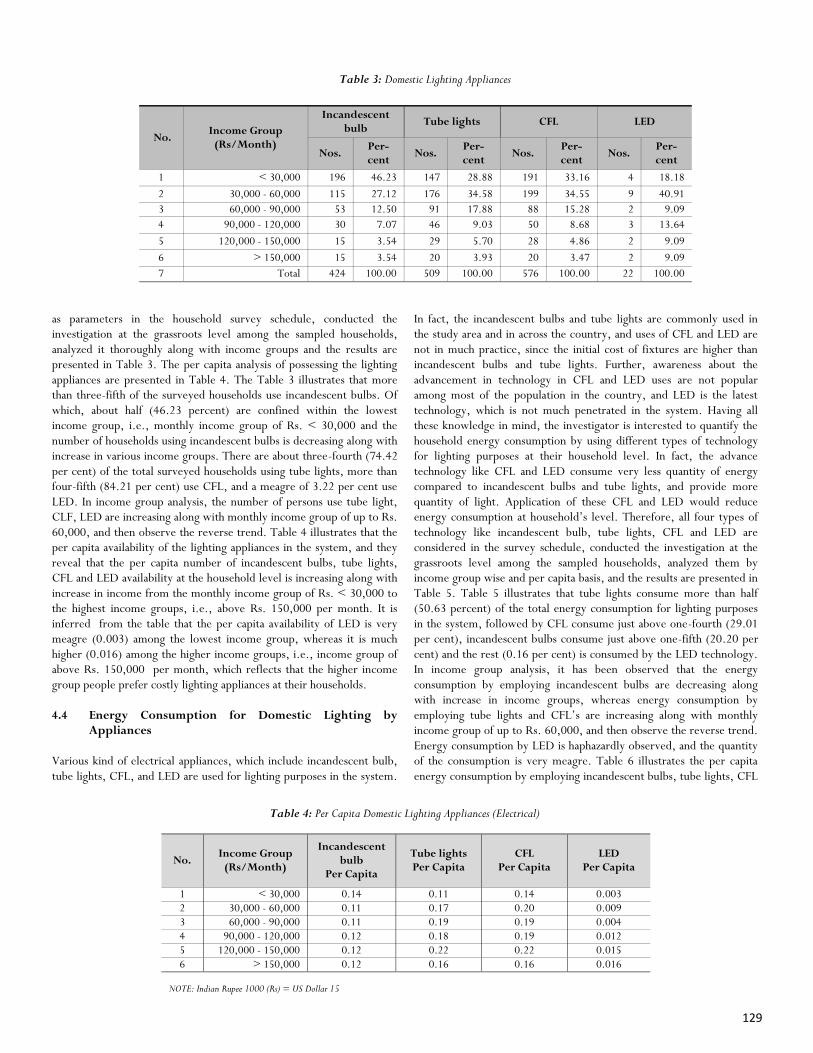
129
as parameters in the household survey schedule, conducted the investigation at the grassroots level among the sampled households, analyzed it thoroughly along with income groups and the results are presented in Table 3. The per capita analysis of possessing the lighting appliances are presented in Table 4. The Table 3 illustrates that more than three-fifth of the surveyed households use incandescent bulbs. Of which, about half (46.23 percent) are confined within the lowest income group, i.e., monthly income group of Rs. < 30,000 and the number of households using incandescent bulbs is decreasing along with increase in various income groups. There are about three-fourth (74.42 per cent) of the total surveyed households using tube lights, more than four-fifth (84.21 per cent) use CFL, and a meagre of 3.22 per cent use LED. In income group analysis, the number of persons use tube light, CLF, LED are increasing along with monthly income group of up to Rs. 60,000, and then observe the reverse trend. Table 4 illustrates that the per capita availability of the lighting appliances in the system, and they reveal that the per capita number of incandescent bulbs, tube lights, CFL and LED availability at the household level is increasing along with increase in income from the monthly income group of Rs. < 30,000 to the highest income groups, i.e., above Rs. 150,000 per month. It is inferred from the table that the per capita availability of LED is very meagre (0.003) among the lowest income group, whereas it is much higher (0.016) among the higher income groups, i.e., income group of above Rs. 150,000 per month, which reflects that the higher income group people prefer costly lighting appliances at their households. 4.4 Energy Consumption for Domestic Lighting by
Appliances Various kind of electrical appliances, which include incandescent bulb, tube lights, CFL, and LED are used for lighting purposes in the system.
In fact, the incandescent bulbs and tube lights are commonly used in the study area and in across the country, and uses of CFL and LED are not in much practice, since the initial cost of fixtures are higher than incandescent bulbs and tube lights. Further, awareness about the advancement in technology in CFL and LED uses are not popular among most of the population in the country, and LED is the latest technology, which is not much penetrated in the system. Having all these knowledge in mind, the investigator is interested to quantify the household energy consumption by using different types of technology for lighting purposes at their household level. In fact, the advance technology like CFL and LED consume very less quantity of energy compared to incandescent bulbs and tube lights, and provide more quantity of light. Application of these CFL and LED would reduce energy consumption at household’s level. Therefore, all four types of technology like incandescent bulb, tube lights, CFL and LED are considered in the survey schedule, conducted the investigation at the grassroots level among the sampled households, analyzed them by income group wise and per capita basis, and the results are presented in Table 5. Table 5 illustrates that tube lights consume more than half (50.63 percent) of the total energy consumption for lighting purposes in the system, followed by CFL consume just above one-fourth (29.01 per cent), incandescent bulbs consume just above one-fifth (20.20 per cent) and the rest (0.16 per cent) is consumed by the LED technology. In income group analysis, it has been observed that the energy consumption by employing incandescent bulbs are decreasing along with increase in income groups, whereas energy consumption by employing tube lights and CFL’s are increasing along with monthly income group of up to Rs. 60,000, and then observe the reverse trend. Energy consumption by LED is haphazardly observed, and the quantity of the consumption is very meagre. Table 6 illustrates the per capita energy consumption by employing incandescent bulbs, tube lights, CFL
No. Income Group
(Rs/Month)
Incandescent bulb
Tube lights CFL LED
Nos. Per-cent
Nos. Per-cent
Nos. Per-cent
Nos. Per-cent
1 < 30,000 196 46.23 147 28.88 191 33.16 4 18.18
2 30,000 - 60,000 115 27.12 176 34.58 199 34.55 9 40.91
3 60,000 - 90,000 53 12.50 91 17.88 88 15.28 2 9.09
4 90,000 - 120,000 30 7.07 46 9.03 50 8.68 3 13.64
5 120,000 - 150,000 15 3.54 29 5.70 28 4.86 2 9.09
6 > 150,000 15 3.54 20 3.93 20 3.47 2 9.09
7 Total 424 100.00 509 100.00 576 100.00 22 100.00
Table 3: Domestic Lighting Appliances
No. Income Group
(Rs/Month)
Incandescent bulb
Per Capita
Tube lights Per Capita
CFL Per Capita
LED Per Capita
1 < 30,000 0.14 0.11 0.14 0.003 2 30,000 - 60,000 0.11 0.17 0.20 0.009 3 60,000 - 90,000 0.11 0.19 0.19 0.004 4 90,000 - 120,000 0.12 0.18 0.19 0.012 5 120,000 - 150,000 0.12 0.22 0.22 0.015 6 > 150,000 0.12 0.16 0.16 0.016
Table 4: Per Capita Domestic Lighting Appliances (Electrical)
NOTE: Indian Rupee 1000 (Rs) = US Dollar 15

130
and LED by income group wise. The per capita energy consumption is just 48.90 kWh/month among the income group of Rs. < 30,000, whereas it is 167.59 kWh/month for the higher income group, i.e., the monthly income group of above 150,000, which shows the higher income group is consuming huge quantity of energy for lighting purpose. It has been observed from the Table 6 that the per capita energy consumption by employing all the aforesaid types of technology, which include incandescent bulb, tube lights, CFL and LED for lighting purpose is increasing along with the increase in income group from the lowest income group to the higher income group category. It is deduced from these tables and figures that the quantity of energy consumption for lighting purpose is quite high among the higher income group category compared to the lower income group category. 5. Multiple regression analysis A multiple regression model was developed for understanding the impact of total electricity consumption on lighting appliances in the system. In this model total electricity consumption (y) is considered as dependent variable, and the following independent variables, such as number of incandescent bulbs (x1), number of tube lights (x2), number of CFLs (x3) and number of LED (x4) are considered and are presented in equation (1) below
Y = f (x1 + x2 + x3 ...+ xn) (1) The model equation is presented in equation (2) by incorporating the values of independent variables in equation (1) and the results of the
model are presented in appendix A. Y= -89.357x1+837.662x2+364.059x3+390.619x4+1145.272 (2) The model results show that the adjusted R square value is 0.146, which shows that 14.6 per cent variations in household income are explained by these explanatory variables included in the model. It is observed from the ANOVA table, that the F (4,679) = 30.116 and the p value is less than 0.001, which shows that overall model is statistically significant at 1 per cent level. Further, the variables, such as number of tube light and number of CFLs are having the respective coefficients are positive and the p value was observed as p < 0.05, which denotes that these variables are statistically significant in the model, For example, if all the variables except number of tube lights are constant, then the total electricity consumption per household would increase by 837.662 kwh. With similar assumption, effects of all other variables are held constant, then the total electricity consumption per household would increase as 364.059 kWh per additional unit increase in number of CFLs category. Usages of incandescent bulbs and LED are insignificant because their use in the study area is negligible. The incandescent bulb appliances share is 61.99 percent at the household level, but energy consumption share is only 20.20 percent, and the people are not using much duration. Mainly incandescent bulbs are placed in toilets, staircase lobby, car porch, verandah etc., and therefore their use is much limited and it is negative. LED appliances share is just 3.22 per cent at the household level and its share in energy consumption is just 0.16 percent. Therefore, it is insignificant. 6. Results and Discussion The residential energy consumption depends on various factors including location, building size, weather, architectural design, housing unit, application of home appliances, peoples attitude and behaviors, type of construction, energy use pattern, energy consuming devices installed in building, etc. Application of advance technology in appliances at household level reduces energy consumption. The cost of the modern advanced technology for lighting system at the residential level, such as CFL and LED are most costly items for the less income households and it becomes a dream to apply in their households. In fact the modern devices are very much cost effective in long run since it gives clean energy along with conserve more quantity of energy. There are 684 households chosen for conducting the household surveys at the grassroots level to understand the lighting energy consumption in the study area. The surveyed households are decreasing along with increase in income, .i.e., of the total surveyed households about two-
No Income Group
(Rs/Month)
Consumption (kWh/Year)
Incandescent bulb Tube lights CFL LED Total Per Capita kWh kWh
Per-cent
kWh Per-cent
kWh Per-cent
kWh Per-cent
kWh Per-cent
1 < 30,000 21,433.05 34.53 26,466.48 17.01 18,815.40 21.10 136.80 27.46 6,6852 21.75 48.90 2 30,000 - 60,000 19,657.18 31.67 51,965.32 33.39 34,083.43 38.22 168.12 33.75 10,5874 34.44 104.52 3 60,000 - 90,000 8,494.79 13.68 35,888.69 23.06 14,413.27 16.16 21.74 4.36 5,8818 19.13 125.15 4 90,000 - 120,000 6,351.08 10.24 21,049.06 13.51 11,191.00 12.55 46.08 9.25 3,8637 12.57 148.60 5 120,000 - 150,000 1,970.57 3.17 13,642.56 8.77 6,129.90 6.87 43.20 8.67 2,1786 7.09 167.59 6 > 150,000 4,168.26 6.71 6,622.92 4.26 4,548.06 5.10 82.26 16.51 1,5422 5.02 121.43
Total 62,074.93 100.00 155,635.03 100.00 89,181.06 100.00 498.2 100.00 30,7389 100.00
Table 5 Energy Consumption for Domestic Lighting by Appliances
No Income Group (Rs/Month.)
Consumption (kWh/Person/Year)
Incan-descent
bulb
Tube lights
CFL LED
1 < 30,000 15.68 19.36 13.76 0.10
2 30,000 - 60,000 19.40 51.30 33.65 0.17
3 60,000 - 90,000 18.07 76.36 30.67 0.05
4 90,000 - 120,000 24.43 80.96 43.04 0.18
5 120,000 - 150,000 15.16 104.94 47.15 0.33
6 > 150,000 32.82 52.15 35.81 0.65
Table 6 Per Capita Energy Consumption for Domestic Lighting by Appliances

131
fifth (38.45 per cent) are confined in the lowest monthly income group of Rs. less than 30,000, whereas it is just 3.22 per cent of households confined among the highest income group of households having monthly income of Rs. more than 150,000. More than two-third (70.69 per cent) of the surveyed households are confined within the monthly income range of up to Rs. 60,000, and the average household size is more than 5 among the lowest and the highest income households, whereas it is less than 5 among the other category of income groups. Use of incandescent bulb are very much common in study area and more than three-fifth (61.99 per cent) of the surveyed households use incandescent bulb at their households, of which about half (46.26 per cent) are confined within the lowest income group. The number of available other fixtures, such as tube light, CFL and LED are also more upto the income group of Rs. 60,000 per month, since these two groups together account for more than two-third of households among the total surveyed households, and it is quite interesting to state that the per capita availability of incandescent bulb is decreasing along with increase in income groups, whereas other fixtures such tube lights, CFL and LED are increasing along with increase in income groups, i.e., from the lowest income groups to the highest income groups, which reflects that economically weaker section use more number of incandescent bulbs since it’s initially purchase cost is very less, and the higher income group use more number of energy efficient fixtures though initial fixing cost is much higher compared to the incandescent bulbs. In energy consumption for lighting, it is understood that the per capita energy consumption for lighting are increasing along with increase in income group, i.e., just 48.90 kWh for the lowest income groups, and it is increased to 167.59 kWh for the higher income group of Rs. 120,000-150,000, which shows that income decide the quantity of energy consumption at the household level. Income is the basic phenomenon which decides the functions of the system. The study area has more number of less income (Rs. < 30,000) households (30.60 per cent) and these less income households are more or less fixed incandescent bulb (46.23 per cent), and its cost is very less compared to the other lighting fixtures. The quantity of energy consumption for lighting incandescent bulb per hour is much higher compared to the higher cost lighting fixtures, such as tube light, CFL, LED. Even though quantity of energy consumption lighting the incandescent bulb per hour is much higher compared to other fixtures, the energy consumption made by the least income group is very less (21.75 per cent), which shows that this particular income group consume very less amount of energy compared to the higher income groups (78.25 per cent). It is evident from this study that the hypothesis can be evolved like increase in income of the households consume more quantity of energy in this particular urban system (study area). The results of the investigation proves that quantity of energy consumption is increasing (48.90 kWh to 167.59 kWh) along with increase in income (per capita basis), and thereby the hypothesis is proved. Further, it has been observed that the higher income households (per capita) fixed more number of tube light, CFL and LED lights compared to the less income households, which reflects that income decides the function of the system, i.e., increase in income leads to increase in standard of living. It is interesting to note that the regression analyzes reveal that tube light and CFL lights are
having more bearing in the system in terms of electrical energy consumption at the household level, which shows that people in the study area are having more awareness pertaining to energy conservation. In fact the available number of CFL and incandescent bulb fixtures are almost same among the households confined in the income group of Rs. < 30, 000 per month, which is also reflected in Table 3 of this paper, but the usages of incandescent bulbs are much minimal. It is interesting to note that the findings of this investigation, increase in household income reflected in increase in quantity of energy consumption, which is coinciding with the energy ladder concept referred in this investigation (Cross Reference Alam and Barnes, 1998; Brounen et al., 2012; Garbacz C, 1993; Gupta and Ravindranath, 1997; Heltberg R, 2003; Jain G, 2010; Link et al., 2012; Mu T et al., 2010; Rao and Reddy, 2007; Reddy et al., 2012; Reddy BS, 2004). However, the literature review reveals about the sources and type of energy consumption is altered by increase in income, whereas in this investigation electrical lighting fixtures are altered by income, i.e., lesser income households use more number of incandescent bulbs (0.14 per capita), whereas the higher income groups use more number of CFL and tube lights (0.22 per capita) at their households. 7. Conclusion In this study an attempt has been made to understand the domestic energy consumption for lighting purposes in Jaipur city. Survey research method was employed to collect the necessary amount of data at the grassroots level to understand the domestic energy consumption for lighting purposes in the study area. The data are analysed thoroughly and multiple regression model was developed and employed in this investigation to understand the functions among few variables, such as incandescent bulb, tube light, CFL and LED and the total electricity consumption for lighting purposes. It is observed that tube light (74.42 per cent) and CFL (84.21 per cent) getting more importance among the electrical lighting appliances used in the system, invariably among all income groups including the least income group, whose is monthly income is less than Rs. 30,000. The available number of incandescent bulb and CFL lights are almost same in this least income group and their representation is 46.23 per cent and 33.16 per cent respectively which shows that the available number of incandescent bulbs are very less among the higher income households. The following recommendations are made, (a) Government may bring policies to provide CFL and LED lights at cheaper rate or free of cost to the least income households, (b) Awareness programs may be organized among the population to employ advanced technology for appliances at the households level, which intern results into reduction in energy consumption, (c) Awareness programs may be organized among the population regarding attitude and behavior change for switching off the lights, while it is not required, (d) Government may promote energy efficient buildings by giving special benefits in FAR or subsidy in approval fee. This may enforced through building byelaws giving more emphasis to natural lighting, cooling etc., (e) Government may promote advanced lighting technology manufacturing fixtures industries to reduce the cost of lighting appliances by giving special incentives, (f) Government may start programs of energy management at residential level such as retrofitting of incandescent bulb with CFL and LED, (g) The purchasing power of households (income) may be considered while evolving policies pertaining to energy related action since more than four-fifth of the surveyed households (85.35 per cent) confined within the less than Rs. 100,000 per month income, therefore, plausible policies may be evolved pertaining to energy related activities since energy is the basic phenomenon for any development in the system.

132
References: Alam M, Barnes D. (1998). Urban household energy use in India: efficiency and policy implications. Energy Policy, 26(11): LBNL-43942. Anjali SM, Gadgil AJ. (1996) Bombay efficient lighting large-scale experiment (Belle): Blueprint for improving energy efficiency and reducing peak electric demand in a developing country. Atmospheric Environment, 30(5): 803–808. Balachandra P, Reddy BS. (2007) Technology portfolio analysis for residential lighting, Indira Gandhi Institute of Development Research, Mumbai May 2007, WP-2007-007. Balachandra P, Shekar GL. (2001). Energy technology portfolio analysis: an example of lighting for residential sector. Energy Conversion and Management, 42(7): 813–832. Brounen D, Kok N, Quigley JM. (2012). Residential energy use and conservation: Economics and demographics. European Economic Review, 56(5): 931–945. Bukarica V, Tomsic Z. (2007) Energy efficiency in Croatian residential and service sector-analysis of potentials, barriers and policy instruments. Wseas Transactions on Advances in Engineering Education, 12(4):259-264. Can Stephane de la Rue du , Letschert V, Mcneil M, Zhou Nan, Sathaye J.(2009). Residential and transport energy use in India: Past rend and future outlook. Ernest Orlando Lawrence Berkley National Laboratory, Jan 2009. Garbacz C. (1983). A model of residential demand for electricity using a national household sample. Energy Economics, 5(2): 124-128. Garg V, Bansal NK. (2000). Smart occupancy sensors to reduce energy consumption. Energy and Buildings, 32: 81-87. Gupta S, Ravindranath NH. (1997). Financial analysis of cooking energy options for India. Energy Conversion and Management ,38(18): 1869–1876. Haas R. (1997). Energy efficiency indicators in the residential sector. Energy Policy, 25(7-9):789–802. Heltberg R. (2003). Household fuel and energy - A Multicounty study. Oil and Gas Policy Division, The World Bank 2003;1–86. Holtedahl P, Joutz FL. (2004). Residential electricity demand in Taiwan. Energy Economics 2004; 26: 201–224. Jain G. (2010). Energy security issues at household level in India. Energy Policy, 38: 2835-2845. Johnson OO, Odekoya AJ, Umeh OL. (2012). Factors influencing the usage of compact fluorescent lamps in existing residential buildings in Lagos, Nigeria. International Journal of Energy Economics and Policy, 2(2): 63–70. Kaya D. (2003). Energy conservation opportunities in lighting systems, Energy Engineering, 100(4): 37–57. Kumar A, Jain SK, Bansal NK. (2003). Disseminating energy efficient technologies: a case of compact fluorescent lamps (CFLs) in India. Energy Policy, 31: 259-272 Larsen BM, Nesbakken R. (2004). Household electricity end-use consumption: results from econometric and engineering models. Energy Economics, 26(2): 179–200.
Link CF, Axinn WG, Ghimire DJ. (2012). Household energy consumption : Community context and the fuelwood transition. Social Science Research, 41: 598–611.
Mahlia TMI, Said MFM, Masjuki HH, Tamjis MR. (2005). Cost-benefit analysis and emission reduction of lighting retrofits in residential sector. Energy and Buildings, 37: 573–578. Martinot E, Borg N. (1999). Energy-efficient lighting programs Experience and lessons from eight countries. Energy Policy, 26(14): 1071–1081. Mu T, Xia Q, Kang C. (2010). Input-output table of electricity demand and its application. Energy, 35: 326–331.
Rao MN, Reddy BS. (2007). Variations in energy use by Indian households : An analysis of micro level data. Energy, 32: 143–153. Reddy BS, Salk H, Nathan K. Energy in the development strategy of Indian households – The missing half. Indira Gandhi Institute of Development Research, Mumbai January 2012, WP-2012-003. http://www.igidr.ac.in/pdf/publication/WP-2012-003.pdf Reddy BS. Economic and social dimensions of household energy use: a case study of India. Proceedings of IV Biennial International Workshop “Advances in Energy Studies”. Unicamp, Campinas, SP, Brazil June 16-19, 2004; 469–477.

133
Appendix A
Model R R Square Adjusted R Square
Std. Error of the Estimate
1 .388a .151 .146 993.99999
a. Predictors: (Constant), LED (Nos.), Incandescent bulb (Nos.), Tube lights
(Nos.), CFL (Nos.)
Model Sum of Squares df Mean Square
F Sig.
1
Regression 119021900.667 4 29755475.167 30.116 .000b
Residual 670876432.262 679 988035.983
Total 789898332.929 683
Total electricity consumption with lighting appliances model summary
ANOVA
a. Dependent Variable: Total Electricity consumption for Domestic Appliances (kWh/year b. Predictors: (Constant), LED (Nos.), Incandescent bulb (Nos.), Tube lights (Nos.), CFL (Nos.)
Model Unstandardized Coeffi-cients
Standardized Coefficients
t Sig.
B Std. Error Beta
(Constant) 1145.272 135.631 8.444 .000
Incandescent Bulb (Nos.)
-89.357 80.472 -.040 -1.110 .267
Tube lights (Nos.) 837.662 87.845 .340 9.536 .000
CFL (Nos.) 364.059 107.089 .124 3.400 .001
LED (Nos.) 390.619 216.881 .064 1.801 .072
Regression Coefficient
a. Dependent Variable: Total Electricity consumption for Domestic Appliances (kWh/year)
Copyright © 2022 FDOKUMEN