The Poverty of Conceptual Analysis (revised version of 'The Poverty of Analysis' 2009)
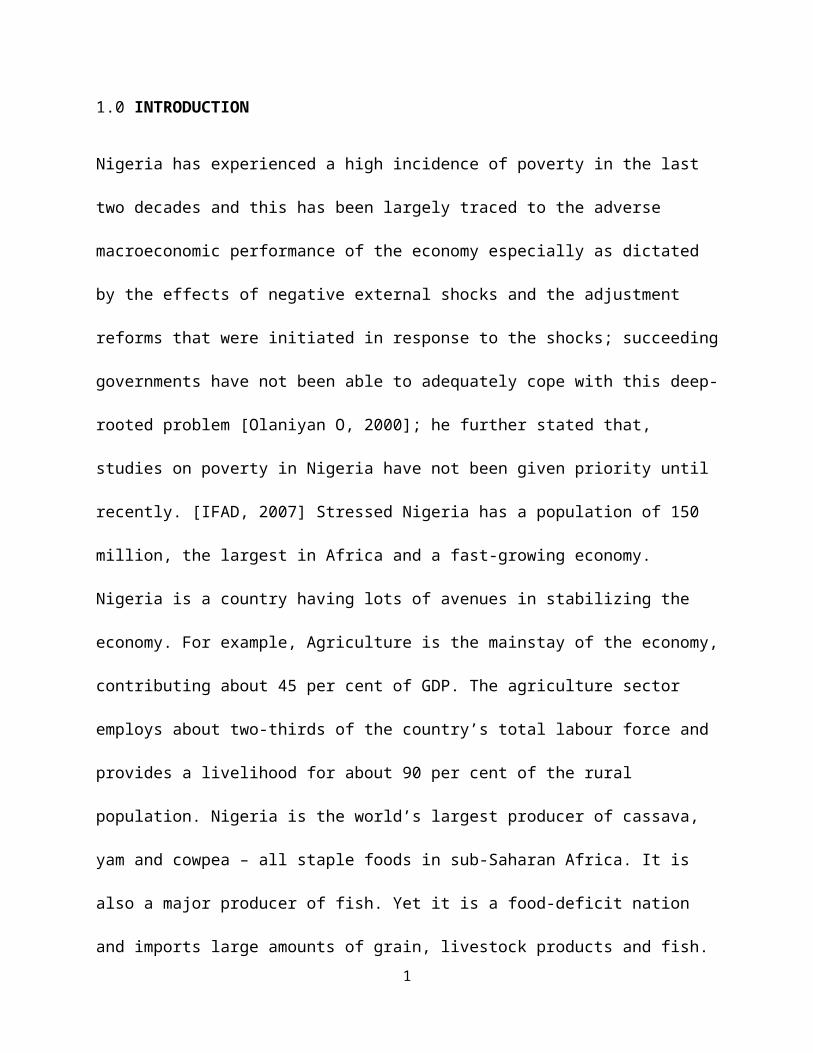
1.0 INTRODUCTION
Nigeria has experienced a high incidence of poverty in the last
two decades and this has been largely traced to the adverse
macroeconomic performance of the economy especially as dictated
by the effects of negative external shocks and the adjustment
reforms that were initiated in response to the shocks; succeeding
governments have not been able to adequately cope with this deep-
rooted problem [Olaniyan O, 2000]; he further stated that,
studies on poverty in Nigeria have not been given priority until
recently. [IFAD, 2007] Stressed Nigeria has a population of 150
million, the largest in Africa and a fast-growing economy.
Nigeria is a country having lots of avenues in stabilizing the
economy. For example, Agriculture is the mainstay of the economy,
contributing about 45 per cent of GDP. The agriculture sector
employs about two-thirds of the country’s total labour force and
provides a livelihood for about 90 per cent of the rural
population. Nigeria is the world’s largest producer of cassava,
yam and cowpea – all staple foods in sub-Saharan Africa. It is
also a major producer of fish. Yet it is a food-deficit nation
and imports large amounts of grain, livestock products and fish. 1
Nigeria’s huge agricultural resource base offers great potential
for growth. Recent government policies have started to show
results: between 2003 and 2007, the agricultural sector is
reported to have grown by 7 percent a year. The area of land
under cultivation could be increased by as much as 100 per cent.
And there is substantial scope for an increase in irrigation,
which now covers only 7 per cent of irrigable land. Irrigation
and other inputs would substantially increase average yields for
major staple crops, currently below those in other developing
countries. Despite Nigeria’s plentiful agricultural resources and
oil wealth, poverty is widespread in the country and has
increased since the late 1990s. Over 70 per cent of Nigerians are
now classified as poor, and 35 per cent of them live in absolute
poverty. Poverty is especially severe in rural areas, where up to
80 percent of the population lives below the poverty line and
social services and infrastructure are limited. The country’s
poor rural women and men depend on agriculture for food and
income. About 90 per cent of Nigeria’s food is produced by small-
scale farmers who cultivate small plots of land and depend on
rainfall rather than irrigation systems (IFAD, 2007). Katepa
2

kalala p. (2006) defined poverty as deprivation from resources
(physical, economic, social, etc.), which are needed to achieve a
sustainable livelihood. Poverty is recognized to be
multidimensional in its causes and manifestations; including lack
of income and productive resources sufficient to ensure a
sustainable livelihood; hunger and malnutrition; ill health;
limited or lack of access to education and other basic services,
increasing morbidity and mortality from illness, homelessness and
inadequate housing, unsafe environments; social discrimination
and exclusion; lack of participation in decision-making, social
and cultural life.
More importantly, many of the other aspects of poverty (e.g.,
health, education, environment, political empowerment) are
covered more fully in the assessments reports of the other
critical areas of concern. A commonly used measure of the
incidence of poverty is the head count ratio. This is defined as
the share of the population whose consumption falls below the
‘poverty line’. The poverty line is a specified threshold of
income or value of consumption for a given country, sub-region or
region, below which one is defined as poor. For developing
3

countries, poverty lines are usually calculated as the monetary
value of some minimum bundle of consumption goods and services
(food, shelter and health, etc.) required to satisfying basic
requirements within a particular social context. Poverty lines
may differ among countries/regions in a given space in time, and
may also vary over time, as socioeconomic conditions change.
Forty four per cent of the Africa's population lives below the
region-wide poverty line of $39 per capita per month. However,
the extent and severity of poverty varies among the sub-regions.
The least prevalent incidence of poverty is found in the North
African sub-region where 22 percent of the population lives below
the sub-regional poverty line of $54 per capita per month. In
Sub-Saharan Africa, 51 percent of the population lives below the
regional poverty line of $34 per capita per month. In Sub-Saharan
Africa, the incidence of poverty in rural areas tends to be
higher than that in urban areas. Its further stressed that, this
(the incidence of poverty in rural areas tends to be higher than
that in urban areas) was found to be the case on the basis of
comparisons of the head-count ratio, the mean expenditure,
poverty line and average expenditure for the urban and rural
4

areas. The extent of rural poverty varies among countries. Cote
d’Ivoire was found to have the lowest level of rural poverty,
while the Central African Republic had the highest proportion
(78%) of its rural population living in poverty.
The overall objective of this study is to assess the determinants
and level of poverty among dwellers in Adigbe community, Abeokuta
of Ogun State, Nigeria.
.
1.1 STATEMENT OF PROBLEM
5
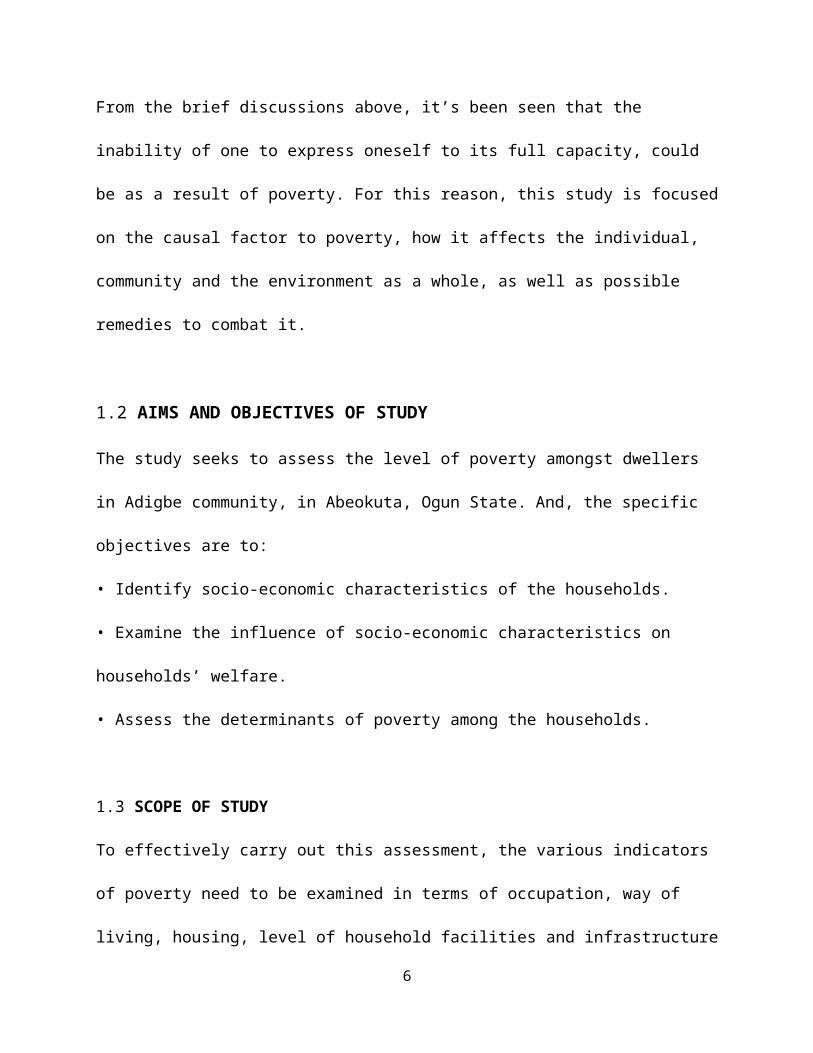
From the brief discussions above, it’s been seen that the
inability of one to express oneself to its full capacity, could
be as a result of poverty. For this reason, this study is focused
on the causal factor to poverty, how it affects the individual,
community and the environment as a whole, as well as possible
remedies to combat it.
1.2 AIMS AND OBJECTIVES OF STUDY
The study seeks to assess the level of poverty amongst dwellers
in Adigbe community, in Abeokuta, Ogun State. And, the specific
objectives are to:
• Identify socio-economic characteristics of the households.
• Examine the influence of socio-economic characteristics on
households’ welfare.
• Assess the determinants of poverty among the households.
1.3 SCOPE OF STUDY
To effectively carry out this assessment, the various indicators
of poverty need to be examined in terms of occupation, way of
living, housing, level of household facilities and infrastructure
6
available within the neighborhood. Also, the literacy level, and
income distribution pattern of respondents, the effects of slum
condition on the residents were equally investigated
1.4 THE STUDY AREA
Various expressions have described informal settlement areas
as congested district, characterized by deteriorating, unsanitary
housing environments and noticeably poverty area. Hence, the
areas chosen for this study include: Adigbe, oke-ijeun, oke-
ejigbo. But Adigbe was taken as case study for this research due
to some logistical changes.
7

Figure 1: Map showing Adigbe and its environ.
8

The area is located in the northeastern part of Abeokuta towards
the far end of Panseke area. It has an adjacent land mass to the
Navy Boys Secondary School, and lies between latitude 7.126 º N
and longitude 3.325 º E’.
1.5 RESEARCH METHODOLOGY
Multistage sampling technique was used to select the
representative sample. Some prominent area were selected from the
chosen area, this was done through random sampling technique to
arrive at a total of 50 respondents used for the study.
Analytical techniques used include descriptive statistics such as
frequency count, percentages, and mean values.
The data for this study was collected through primary sources.
Questionnaire administration constitutes the major instrument
used in information collection. Map upgrading, building and
facility surveys supplemented this. Meanwhile, only two
households were interviewed in each of the district visited. Each
questionnaire contains 44 variables, which were thoroughly
investigated to obtain information on sex, marital status and age
of respondents. Also, the residences’ socio-economic
9
characteristics, structural condition of buildings, the level of
infrastructure facilities as well as residents’ perception of the
government, education and their environment were investigated.
2.0 LITERATURE REVIEW
According to De-Janvry A, Sadoulet E (World Dev. 2001), the
failure of many poverty reduction interventions has been because
they ignored the great diversity and heterogeneity in assets
portfolios across rural households and the range of activities in
which they engage to generate income. But, now it has been
discovered that peasant households in developing countries
typically earn income from many different sources [Babatunde R.O,
2008]; literatures on income diversification across developing
countries have pointed to the increasing role of off-farm income
in poverty reduction [Babatunde R.O, 2008] and with increasingly
10

limited agricultural resources; many have proposed a poverty
reduction strategy, which would focus on the role of the off-farm
sector to eradicate poverty and ensure equitable rural
development. [Raju pl, 1995] opined that, the extent and depth of
poverty in the developing world is a disgrace; over 1.1 billion
people (30 percent of the population) live in absolute poverty
with only a dollar a day or less per person to meet food,
shelter, and other needs. Not surprisingly, hunger, malnutrition,
and associated diseases are widespread: more than 700 million
people do not have access to sufficient food to lead healthy,
productive lives; millions more live on the edge of hunger; and
more than 180 million pre-school children are significantly
underweight. Every second, person in South Asia and Sub-Saharan
Africa is absolutely poor; unless concerted action is taken now,
poverty is not expected to diminish much in the near future.
South Asia will continue to be home to half the developing
world's poor, and Sub-Saharan Africa, where the number of poor is
projected to increase 40 percent between 1990 and 2000, will
emerge as an increasingly important locus of poverty.
11
Poverty is a rural phenomenon in most of the developing world,
especially the low-income developing countries. The rural poor
make up more than 75 percent of the poor in many Sub-Saharan
African and Asian countries. Latin America's high urbanization
rates have led to a higher prevalence of urban poverty, but even
in that region the majority of the poor are rural. [katepa
kalala. P, 1999] observed that while commonly used indicators are
useful in providing an understanding of overall poverty
situation, yet they do not enable much insight into the gendered
nature of the underlying causes and incidence of poverty; they
tend to be based primarily on consumption and income data
collected at the household level. They are not however, broken
down by gender and therefore do not indicate the sex
disaggregation of those classified as poor.
These indicators are also unable to reflect gender-based
inequities within households. A key challenge for documenting and
monitoring the gendered nature of poverty is the development of
appropriate and reliable indicators. This would probably entail
the use of the common indicators of poverty, along with
information collected within households.
12
Meanwhile, there is still a paucity of generally accepted
indicators looking at the gender differentiation in the
incidence, severity and change in poverty; for instance, the
presence of female heads of households is sometimes considered a
generalized likely indicator of women's economic poverty
particularly in Africa. However, recent studies have shown that
the existence of female heads of households does not always
coincide with higher levels of poverty. It was also argued that,
in West Africa, polygamous male headed households as a group had
a larger incidence of poverty in the society. However, an
argument can be made that, in many cases, women are the de-facto
heads of households. As such, in some features, sub-units of
polygamous households could be considered as female-headed
households. Similar results were found for Kenya, Guinea-Bissau
and Cote d’Ivoire. On the other hand, in Southern Africa, it was
found that the incidence of poverty was actually higher among
female-headed households. Other indicators for women’s poverty
which have been considered include family size, women's control
over resources and women's levels of education. However, for the
most part, there is still a need to collect gender-disaggregated
13
data, develop indicators and use them for policy, research and
advocacy for the enhancement of gender equality in Africa.
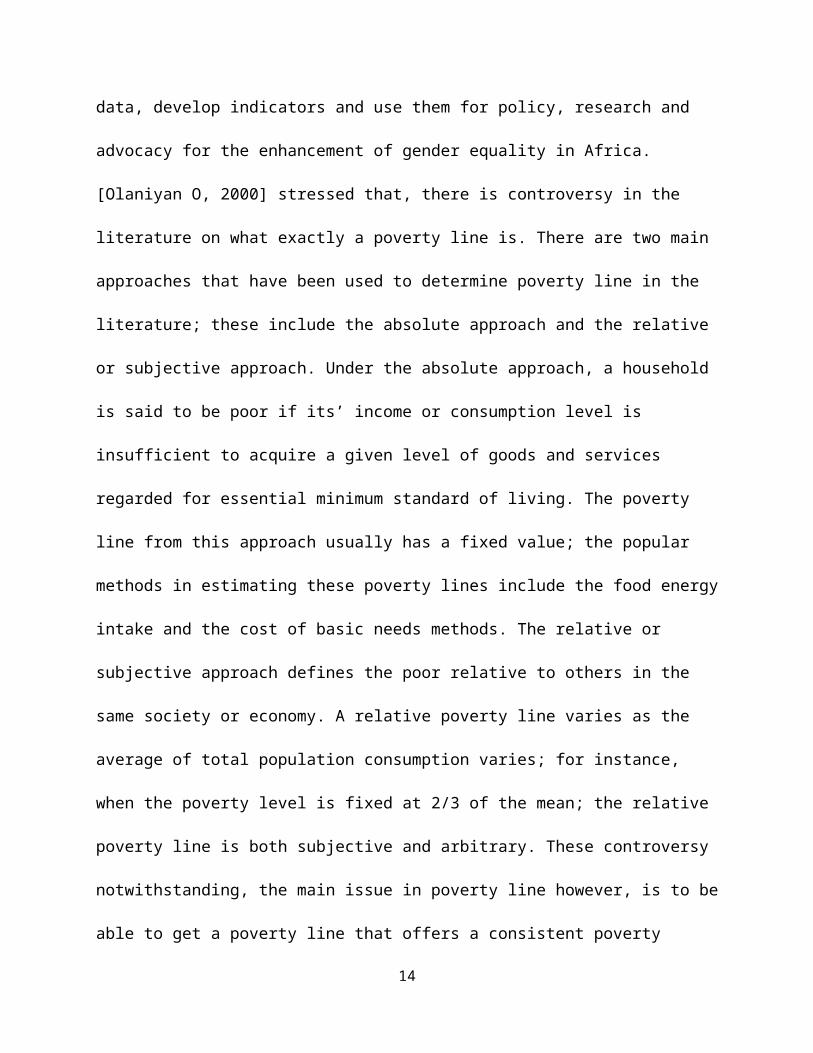
[Olaniyan O, 2000] stressed that, there is controversy in the
literature on what exactly a poverty line is. There are two main
approaches that have been used to determine poverty line in the
literature; these include the absolute approach and the relative
or subjective approach. Under the absolute approach, a household
is said to be poor if its’ income or consumption level is
insufficient to acquire a given level of goods and services
regarded for essential minimum standard of living. The poverty
line from this approach usually has a fixed value; the popular
methods in estimating these poverty lines include the food energy
intake and the cost of basic needs methods. The relative or
subjective approach defines the poor relative to others in the
same society or economy. A relative poverty line varies as the
average of total population consumption varies; for instance,
when the poverty level is fixed at 2/3 of the mean; the relative
poverty line is both subjective and arbitrary. These controversy
notwithstanding, the main issue in poverty line however, is to be
able to get a poverty line that offers a consistent poverty
14
profile so that we would be able to compare precisely poverty
among households. In the same vein, [Okumadewa FY, 1999] defined
poverty line as a predetermined or well-defined standard of
income or value of consumption, which is deemed to represent the
minimum required for a productive and active life or even
survival. The global concern about poverty is not by accident as
there is a general consensus that poverty has become a pervasive
and massive global outrage; this is because almost a billion
people in the world over live in absolute poverty and suffer from
chronic hunger [Akingbile LA, Ndaghu AAT. 2005].
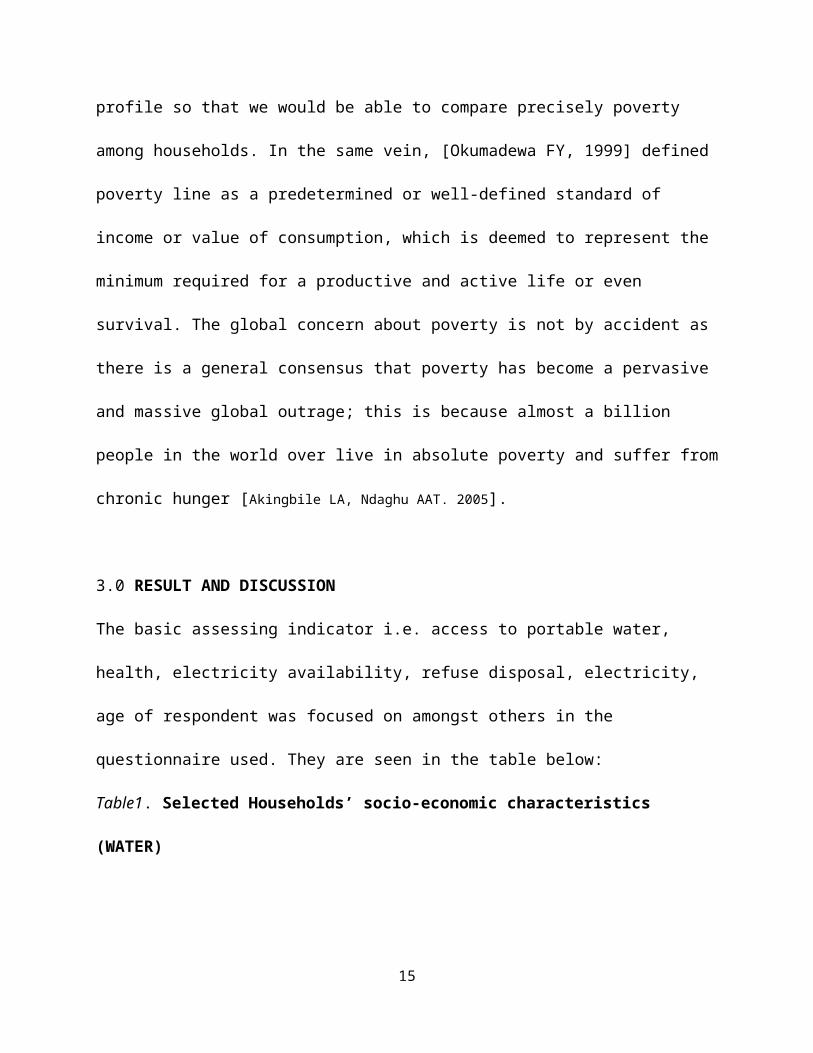
3.0 RESULT AND DISCUSSION
The basic assessing indicator i.e. access to portable water,
health, electricity availability, refuse disposal, electricity,
age of respondent was focused on amongst others in the
questionnaire used. They are seen in the table below:
Table1. Selected Households’ socio-economic characteristics
(WATER)
15

N Minimum Maximum MeanStd.
DeviationSource of water 50 2.00 3.00 2.1800 .38809Access to portable water
50 1.00 2.00 1.4600 .50346
Is the water portable
50 1.00 2.00 1.0800 .27405
distance coveredto fetch water
47 1.00 3.00 1.4681 .65445
volume of water used per day
50 1.00 3.00 2.3400 .62629
Valid N (list wise)
47
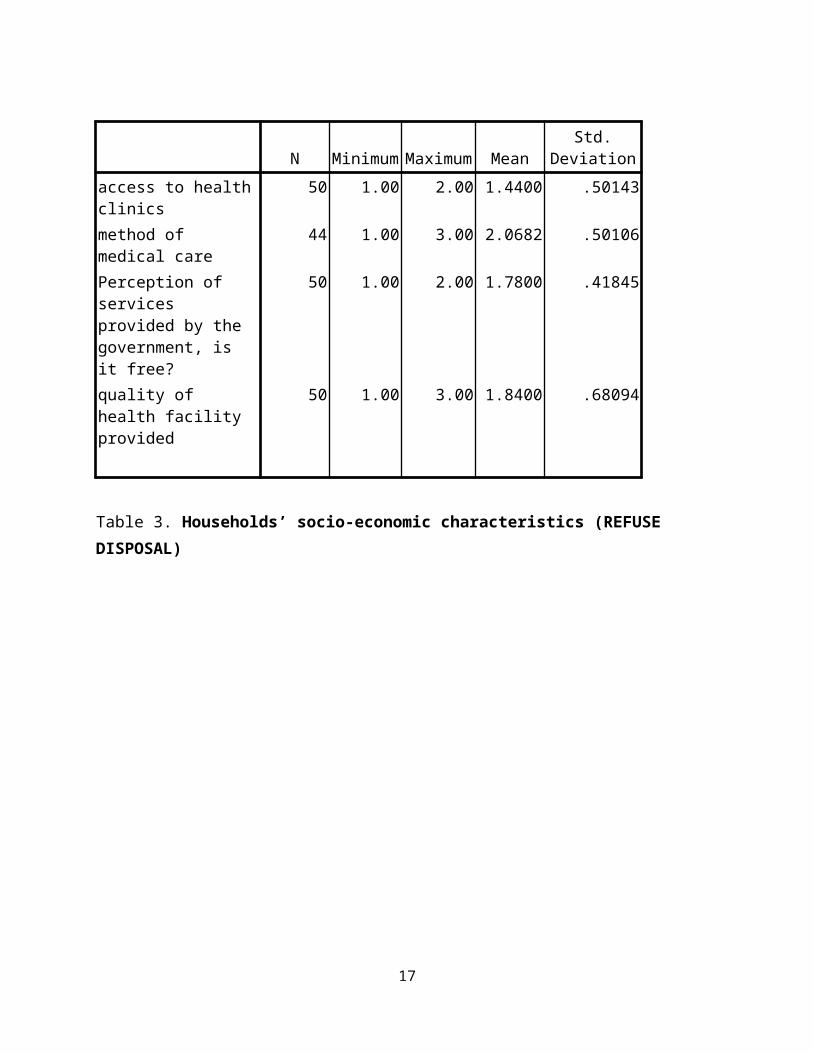
Table2. Households’ socio-economic characteristics (HEALTH)
N Minimum Maximum MeanStd.
Deviationaccess to healthclinics
50 1.00 2.00 1.4400 .50143
method of medical care
44 1.00 3.00 2.0682 .50106
Perception of services provided by the government, is it free?
50 1.00 2.00 1.7800 .41845
quality of health facility provided
50 1.00 3.00 1.8400 .68094
Valid N (list wise)
44
16
N Minimum Maximum MeanStd.
Deviationaccess to healthclinics
50 1.00 2.00 1.4400 .50143
method of medical care
44 1.00 3.00 2.0682 .50106
Perception of services provided by the government, is it free?
50 1.00 2.00 1.7800 .41845
quality of health facility provided
50 1.00 3.00 1.8400 .68094
Table 3. Households’ socio-economic characteristics (REFUSE DISPOSAL)
17

N Minimum Maximum MeanStd.
DeviationMethod of refusedisposal
50 1.00 3.00 2.0000 .67006
if approved refuse collector
18 1.00 9.00 2.5556 2.99455
Waste collectioneffectiveness
50 1.00 999.00 699.9200
461.49057
Method of refusestorage before disposal
50 1.00 999.00 61.3600 239.29716
Is there a dump site within the vicinity
50 1.00 2.00 1.1000 .30305
Valid N (list wise)
18
Table 4. Households’ socio-economic characteristics (ELECTRICITY)
N Minimum Maximum MeanStd.
DeviationDo you have constant access to power supply
50 1.00 2.00 1.9200 .27405
Valid N (list wise)
50
18
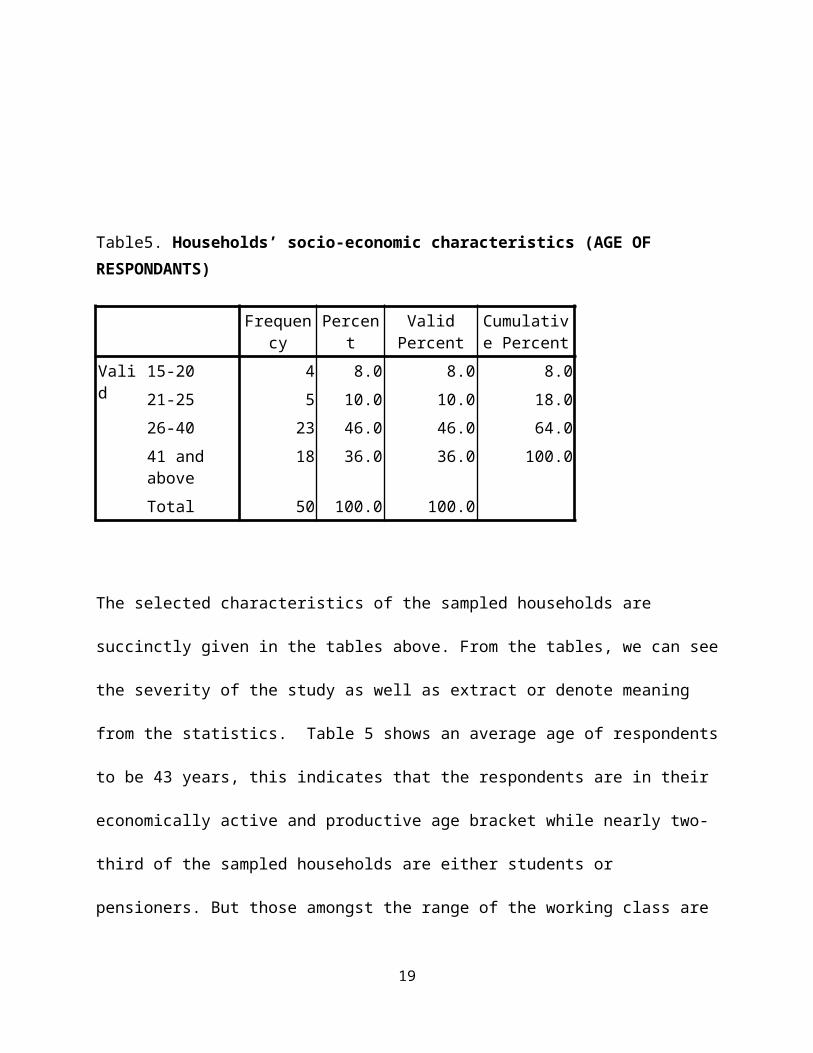
Table5. Households’ socio-economic characteristics (AGE OF RESPONDANTS)
Frequency
Percent
ValidPercent
Cumulative Percent
Valid
15-20 4 8.0 8.0 8.021-25 5 10.0 10.0 18.026-40 23 46.0 46.0 64.041 and above
18 36.0 36.0 100.0
Total 50 100.0 100.0
The selected characteristics of the sampled households are
succinctly given in the tables above. From the tables, we can see
the severity of the study as well as extract or denote meaning
from the statistics. Table 5 shows an average age of respondents
to be 43 years, this indicates that the respondents are in their
economically active and productive age bracket while nearly two-
third of the sampled households are either students or
pensioners. But those amongst the range of the working class are
19
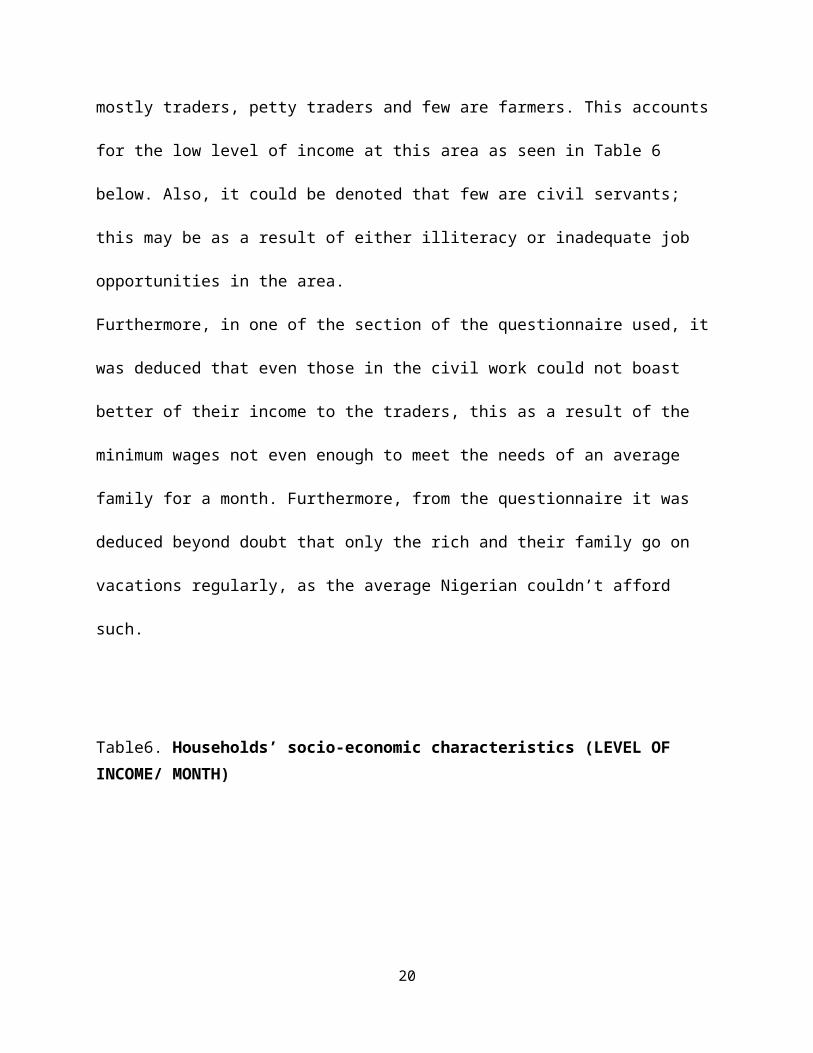
mostly traders, petty traders and few are farmers. This accounts
for the low level of income at this area as seen in Table 6
below. Also, it could be denoted that few are civil servants;
this may be as a result of either illiteracy or inadequate job
opportunities in the area.
Furthermore, in one of the section of the questionnaire used, it
was deduced that even those in the civil work could not boast
better of their income to the traders, this as a result of the
minimum wages not even enough to meet the needs of an average
family for a month. Furthermore, from the questionnaire it was
deduced beyond doubt that only the rich and their family go on
vacations regularly, as the average Nigerian couldn’t afford
such.
Table6. Households’ socio-economic characteristics (LEVEL OF INCOME/ MONTH)
20
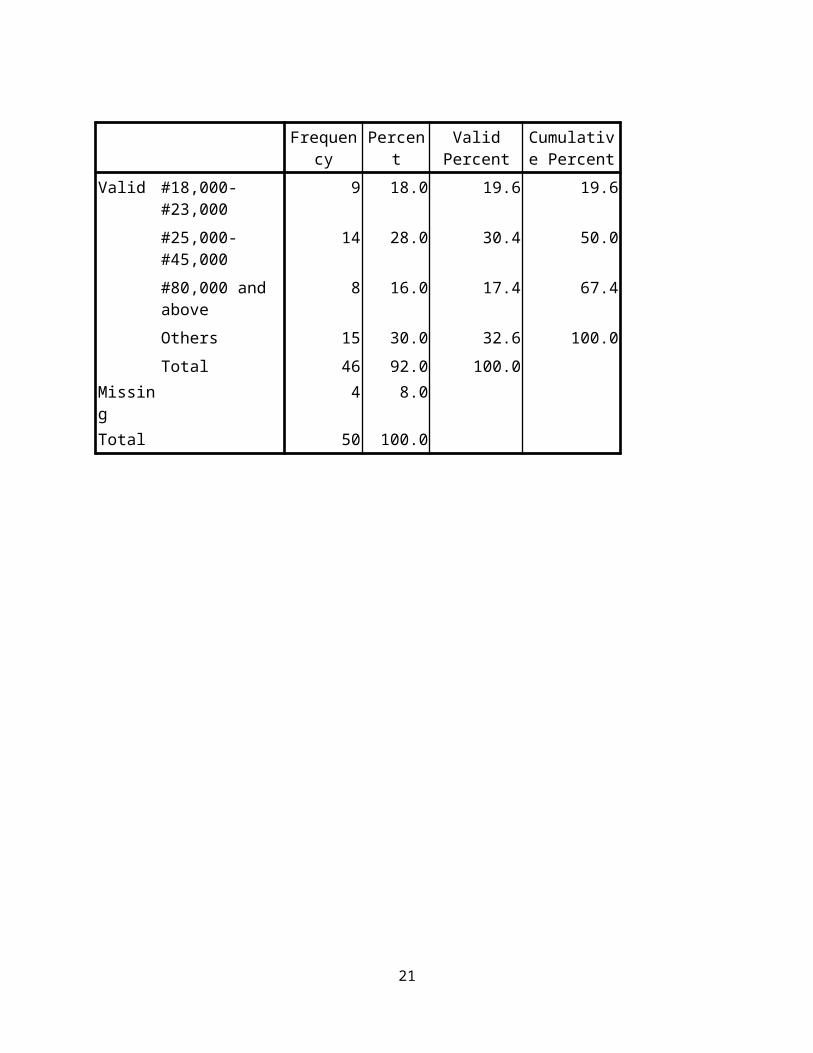
Frequency
Percent
ValidPercent
Cumulative Percent
Valid #18,000-#23,000
9 18.0 19.6 19.6
#25,000-#45,000
14 28.0 30.4 50.0
#80,000 and above
8 16.0 17.4 67.4
Others 15 30.0 32.6 100.0Total 46 92.0 100.0
Missing
4 8.0
Total 50 100.0
21
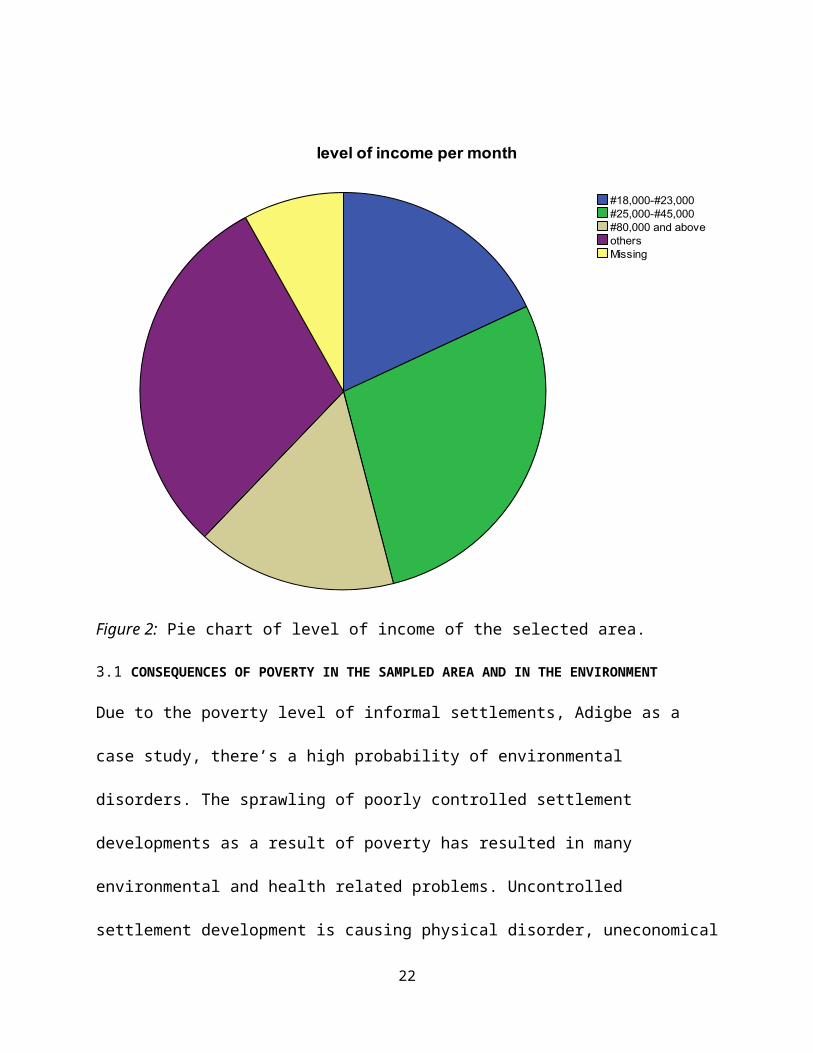
Figure 2: Pie chart of level of income of the selected area.
3.1 CONSEQUENCES OF POVERTY IN THE SAMPLED AREA AND IN THE ENVIRONMENT
Due to the poverty level of informal settlements, Adigbe as a
case study, there’s a high probability of environmental
disorders. The sprawling of poorly controlled settlement
developments as a result of poverty has resulted in many
environmental and health related problems. Uncontrolled
settlement development is causing physical disorder, uneconomical
22

land utilization, and excessive encroachment of settlements into
good agricultural land, environmental degradation and pollution
risks (COLE 1995). Also, as explained below, it has become very
difficult for the government to send social and economic
infrastructure/services to these areas due to the lack of space
and accessibility. The most common consequences of the expanding
informal settlements include the following:
3.1.2 Pollution from Solid and Liquid Wastes
One of the fundamental problems faced by the residents is the
lack of a proper system for waste management. Due to the lack of
established collection points, piles of garbage are scattered in
and around residential areas which leads to environmental and
health problems. Few residents opt to bury or burn their wastes
close to their residences.
As there is no centralized sewage system, liquid waste which
includes water from washing, laundry, kitchen, bath and other
domestic uses is haphazardly discharged onsite.
This disposal practice pollutes the groundwater and marine
environments and is a major cause of water born diseases.
23
3.1.3 Flooding
Haphazard construction of houses has blocked many natural water
ways and has led to frequent floods during the rainy seasons
particularly in the months of March, April and May of every year.
This is deduced from the layout of the houses during the survey
while sampling the respondent. Soil erosion and landslides are
strongly related to flooding which destroy houses as well as
footpaths and unpaved roads.
Houses and other properties are being washed away by floods
forcing the inhabitants to vacate the areas. A high housing
density, which most of the informal settlements are characterized
by, makes natural seepage of storm water more difficult due to a
high share of sealed land Flooding which results in the overflow
of pit latrines and septic tanks is also a major cause for
pollution of water sources and marine environments. Due to the
non-existence of drainage systems, storm water creates big
24

puddles that become breeding places for mosquitoes which is the
cause of malaria.
3.1.4 Accessibility
Lack of access is one of the most common problems caused by and
experienced by residents in the informal settlements. This was
clearly seen, as there is only one major road linking the area to
the outside environ via panseke route. Because there are neither
the layout plans nor the regulatory machinery, residents tend to
build to almost 100 per cent of their plot size. It has become
impossible to provide access roads to these areas as there is no
space for this.
Likewise, no area is left open for social services like schools,
hospitals, children’s play grounds, etc. Consequently, people and
service movement in these areas is very restricted and residents
have to walk long distance to obtain services like health,
education, transport and the likes.
4.0 CONCLUSION
From the study carried out in the study area, it’s clearly seen
that poverty is rampant within the settlement. It’s also seen
25
that poverty is associated with informal settlements as a result
of many factors of which have been mentioned earlier. As
discussed above, and to further back it up, as urban population
grows the social economic needs (housing needs, amongst others)
will continue to increase, forcing more agricultural land to be
converted into human settlements and the prolific growth of huge
Informal Settlement, and when it sets in, leads to poverty.
26
5.0 RECOMMENDATION
The critical issue that needs to be addressed is the extent to
which government can formulate development policies that can have
a definite impact on trends of urban growth. It is now clearly
evident that the pursuit of the urban biased policies inspired
structural adjustment programmes, have actually accelerated and
not reversed the rural – urban migration trend. Comprehensive
rural development policies backed up with a sound
decentralization programme (with a strong institutional up) offer
a glimmer of hope for the deceleration of rural-urban influx and
eventually the slow growth of the urban Informal Settlement.
Likewise the conventional spatial planning approaches have not
resulted in the desired or expected outcomes in terms of, among
other things, orderly growth of human settlements and pre-empt of
the Informal Settlement. The basic problems with these planning
approaches have been an inappropriate conception of space as
somehow separable from other dimensions of society, economy and
27
politics, together with the lack of political will to restructure
and distribute power (Simon 1990).
This state of affairs calls for a change on both approaches and
attitudes. The authorities necessarily need to appreciate and
offer support to the local people who are attempting to plan for
and by themselves. As Scholz et al (2005) argue, since there are
no alternatives, the ongoing informal or socially regulated
planning processes have to be integrated into the existing legal
system with shared responsibilities.
The above initiatives will necessarily need to go together with
the programme of upgrading and formalization of the informal
settlements in order to provide important services and security
of tenure to the poor majority.
Lastly, it has become evident that the bourgeoning of the
informal settlements is a physical manifestation of the
widespread urban poverty. Therefore, for a practical and workable
solution any policy or planning intervention will need to go hand
in hand with the poverty reduction strategies as outlined in the
Poverty Reduction Plan of 2003.
28

REFERENCES
Ameyibor et.al 2003
29
Huchzermeyer, M. (2003): A legacy of control; the capital subsidy
and informal settlement intervention in South Africa.
International Journal of Urban and Regional Research 27, 591–
612. Synergy, ISI
IFAD. Rural Poverty in Nigeria’. Agriculture in the Federal
Republic of Nigeria: Approaches, Policies and Programmes,
13th February; 2007.
Mohammed Haji Ali And Mohammed Sulaiman
NBS. National Bureau of Statistics, socio-economic survey on
Nigeria, Abuja; 2006.
Olaniyan O. The Role of Household Endowments in determining
Poverty in Nigeria. Department of Economics, University of
Ibadan, Nigeria; 2000.
Simon 1990
Scholz et.al, 2005.
30
APPENDIX
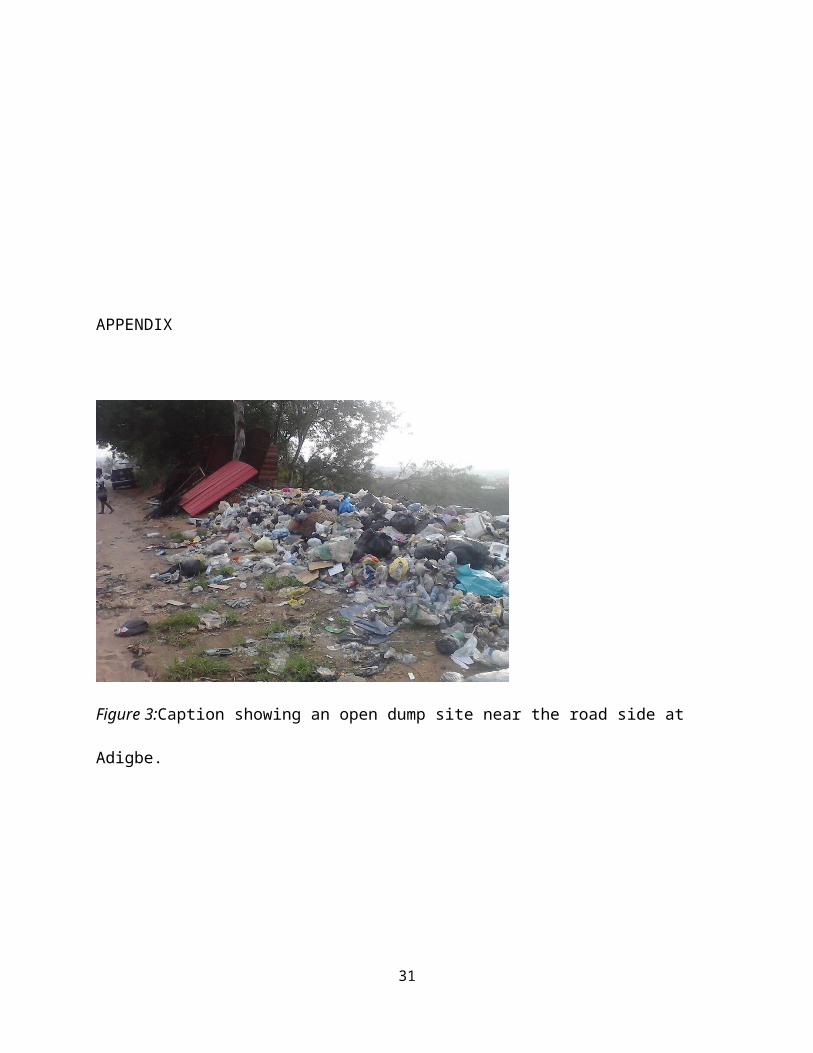
Figure 3:Caption showing an open dump site near the road side at
Adigbe.
31
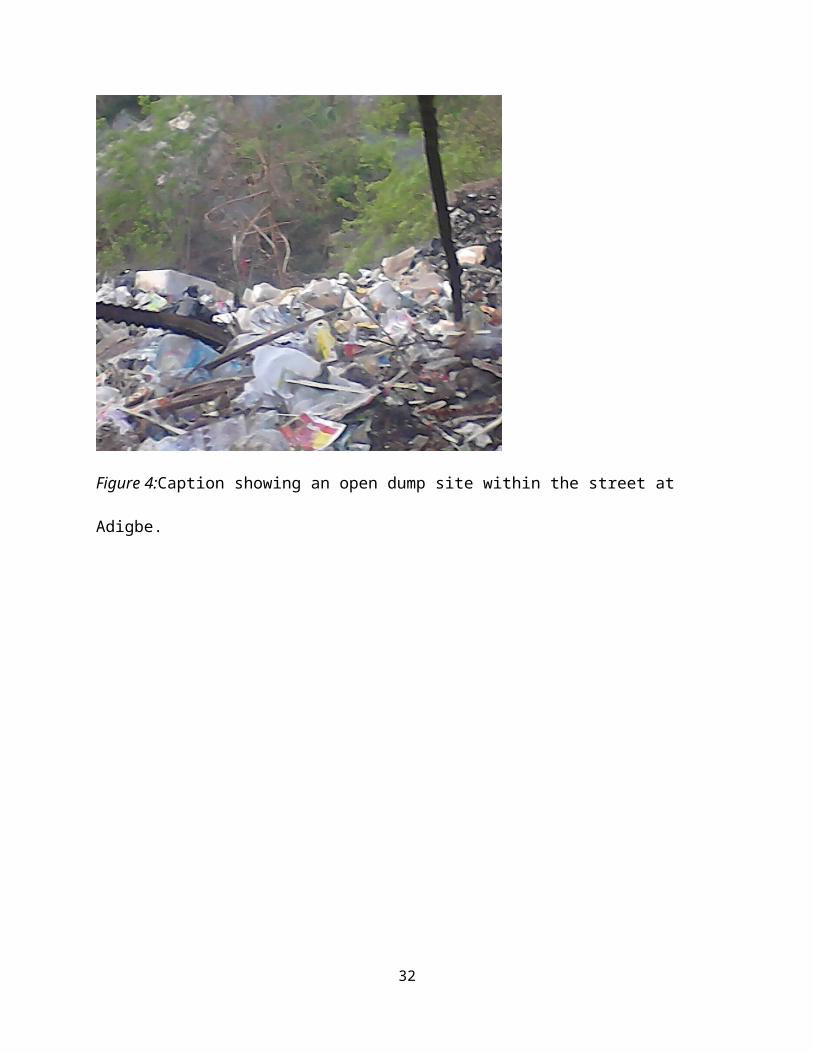
Figure 4:Caption showing an open dump site within the street at
Adigbe.
32
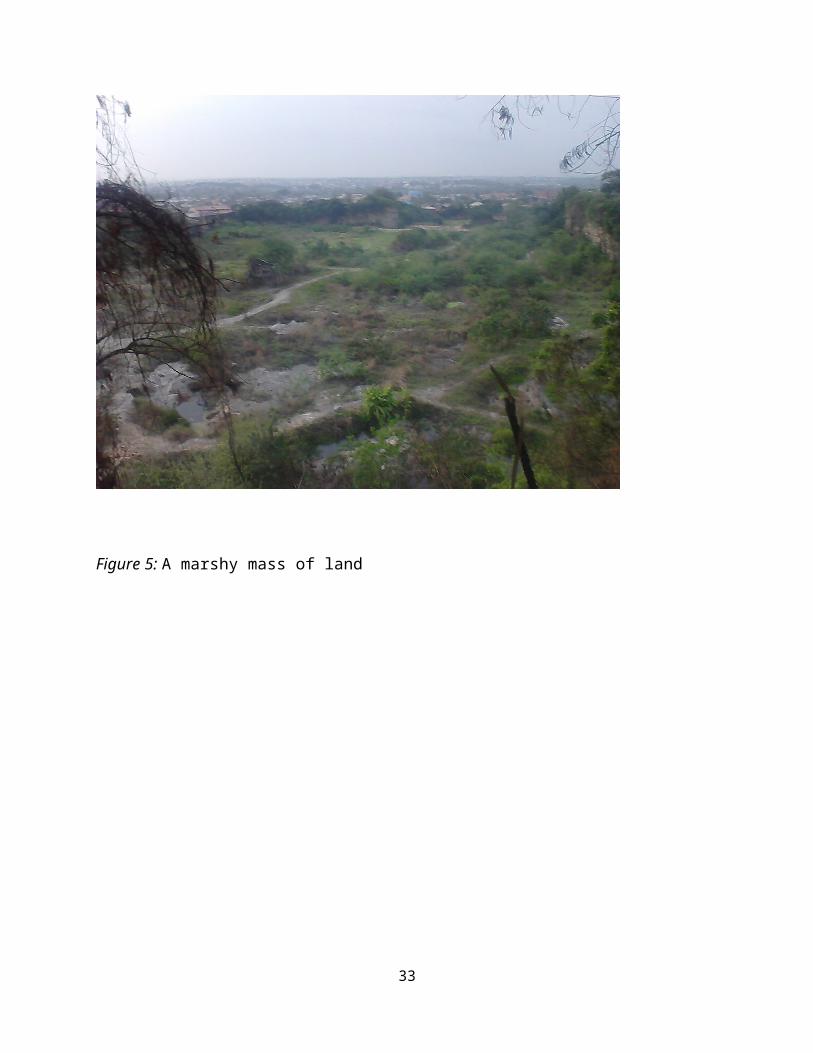
Figure 5: A marshy mass of land
33

Figure 6: caption showing a prison training institute.
34
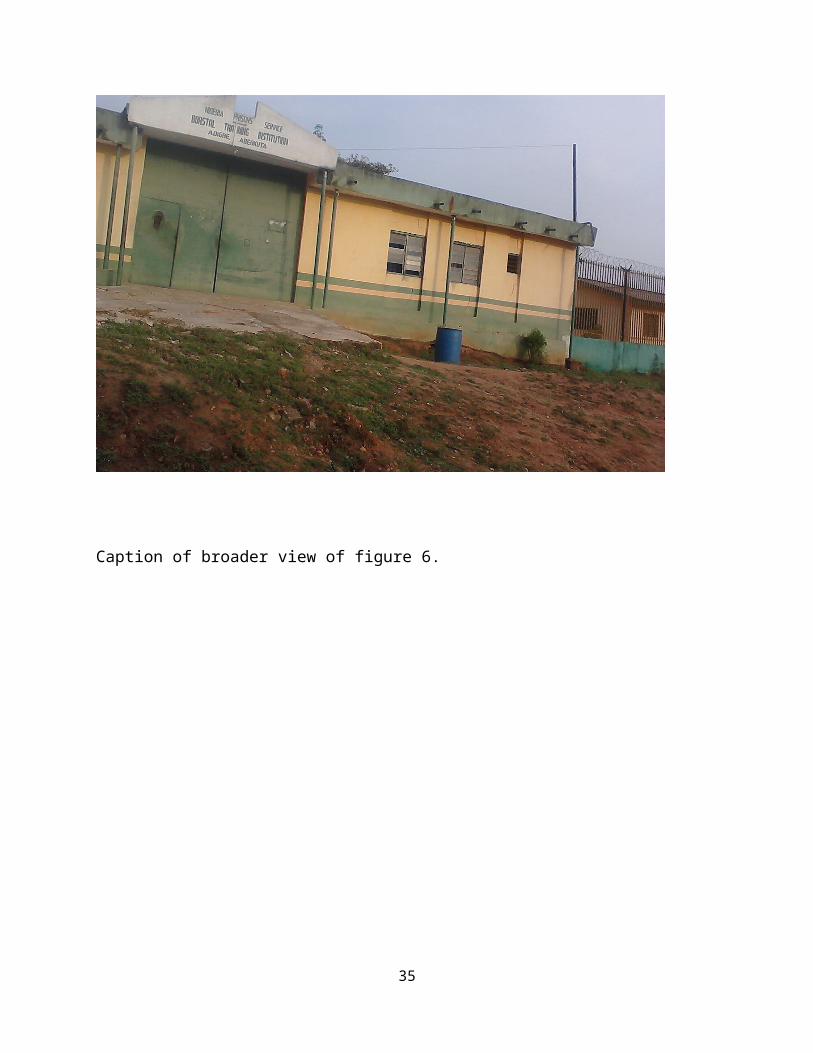
Caption of broader view of figure 6.
35
Copyright © 2022 FDOKUMEN