Low Innovation Intensity, High Growth and Specialized Trajectories: Norway
38
8. Low innovation intensity, high growth and specialized trajectories: Norway Terje Grønning, Svein Erik Moen and Dorothy Sutherland Olsen 1 INTRODUCTION The Norwegian economy is one of the major puzzles within studies of eco- nomic growth and welfare. The country ranks high on indicators for eco- nomic output and standard of living, but low on innovation output indicators. In this chapter, we explore the functioning of the Norwegian national system of innovation (NSI) with this main puzzle in mind. The account builds on official statistics, published survey results, secondary lit- erature, and, in connection with Section 4.4, interviews with two firms, three ministries and nine different support organizations for incubation, funding and policy. The chapter follows the same structure as other chapters in this volume: an examination of the main traits of the NSI and of the propensity to innovate, analyses of activities within the NSI, of the system’s degree of openness and of policy traits and concerns. In order to identify and describe the main traits of the economy, we include an explicit focus on technological trajectories (Pavitt, 1984; Archibugi, 2001). On the one hand, a large segment of the economy is related to extraction of natural resources and is populated mainly by the scale-intensive and supplier-based trajectories. On the other hand, a limited number of firms within the science-based trajectory constitute an alternative segment where one part is linked to extraction of natural resources through supplies and services, but where another part is relatively indepen- dent of those activities. As a third segment, there is an innovation-intensive trajectory of specialized suppliers with strong linkages to the scale-intensive and supplier-dominated trajectories in the form of supplies to these segments. The framework is further presented and discussed below in Sections 2 and 3. Our investigation into the relationship between Norway’s low innovation output and high economic output includes the more obvious factors, such 281
Transcript of Low Innovation Intensity, High Growth and Specialized Trajectories: Norway

8. Low innovation intensity, highgrowth and specialized trajectories:NorwayTerje Grønning, Svein Erik Moen andDorothy Sutherland Olsen
1 INTRODUCTION
The Norwegian economy is one of the major puzzles within studies of eco-nomic growth and welfare. The country ranks high on indicators for eco-nomic output and standard of living, but low on innovation outputindicators. In this chapter, we explore the functioning of the Norwegiannational system of innovation (NSI) with this main puzzle in mind. Theaccount builds on official statistics, published survey results, secondary lit-erature, and, in connection with Section 4.4, interviews with two firms,three ministries and nine different support organizations for incubation,funding and policy.
The chapter follows the same structure as other chapters in this volume: anexamination of the main traits of the NSI and of the propensity to innovate,analyses of activities within the NSI, of the system’s degree of openness andof policy traits and concerns. In order to identify and describe the main traitsof the economy, we include an explicit focus on technological trajectories(Pavitt, 1984; Archibugi, 2001). On the one hand, a large segment of theeconomy is related to extraction of natural resources and is populated mainlyby the scale-intensive and supplier-based trajectories. On the other hand, alimited number of firms within the science-based trajectory constitute analternative segment where one part is linked to extraction of natural resourcesthrough supplies and services, but where another part is relatively indepen-dent of those activities. As a third segment, there is an innovation-intensivetrajectory of specialized suppliers with strong linkages to the scale-intensiveand supplier-dominated trajectories in the form of supplies to these segments.The framework is further presented and discussed below in Sections 2 and 3.
Our investigation into the relationship between Norway’s low innovationoutput and high economic output includes the more obvious factors, such
281

as the influence of the oil and gas revenues, but also tries to take morespecific mechanisms into account. Affluence has come as a result ofincreasing specialization in low-tech resource extraction in combinationwith the existence of innovation-intensive technological trajectories withinsectors such as mechanical engineering, engineering consultancy and sup-pliers to the aquaculture sectors. This development has partly been due totechnology innovation policies, which have been generous in terms ofaffording infrastructure financing on a broad basis. The current and futurecompetitive global situation, together with reduction of access to naturalresources, may force Norwegian government and business alike into seriousprioritization. Future policies may be forced from their current broad andgeneral orientation into either a portfolio of instruments catering moreexplicitly to fostering diversity and multiple knowledge-intensive activities,or a more targeted and competitive policy with fewer focus areas.
2 MAIN HISTORICAL TRENDS
The geography of Norway facilitated an industrialization process thatrelied heavily on natural endowments. Thus it was timber, fisheries andshipping that became the first industrial basis of the economy in the latenineteenth century (Hodne and Grytten, 1992, pp. 30–45; Sejersted, 1993).In the period between 1905 and 1920, the wider foundations of the moderneconomy were laid in the form of private and government initiativesfor co-locating heavy industry and power plants at large waterfalls.Innovations developed by the first companies of this kind were highlyknowledge-intensive and considered as technological breakthroughs. Thisindustrial build-up was heavily supported by a large amount of foreigndirect investment (FDI) from Europe.
During its occupation of Norway in the Second World War, Germanystarted numerous projects related to railways, energy and heavy industry,and the Norwegian government completed many of these projects after thewar. The government furthermore planned an overall postwar moderniza-tion by way of rebuilding and improving infrastructure. Public programmesfor regional planning and industrial development in this era included thePlan for rebuilding Northern Norway (1951) and establishment of theRegional Development Fund (1961).
Employment in mining and manufacturing industries rose until 1974.From 1974 to 1992, employment levels in industries such as iron, steel, ferro-alloys and paper manufacturing suffered most among those that competedon the international market. Machine production, however, experiencedrising employment due to offshore industry supplies. The service sector, as in
282 Slow growth countries

most other industrialized countries, experienced considerable growth. Today,the most important sectors based on natural resources extraction are, inaddition to fisheries and aquaculture, the sectors centred on oil and gasextraction, which were developed from the early 1970s onwards (see Box 8.1).By the beginning of the 2000s, oil and gas extraction accounted for close toa quarter of gross domestic product (GDP) (Baygan, 2003), and in terms ofall export revenues it accounted for 42.5 per cent (Figure 8.1). Oil and gasextraction has become increasingly supported by adjoining sectors which arespecialized in high-technology supply ships, engineering, administration,
Norway 283
BOX 8.1 NORWEGIAN OIL AND GAS
In 1969 oil and gas potential was discovered below the North Sea.Much of the capital and technology had to be transferred fromabroad, but at the same time the Norwegian government wantedto establish and maintain indigenous oil extraction companies.Thegovernment went into alliances with foreign oil companies, givingconcessions for some of the oil drilling. In return, the oil companieshad to locate some of their R&D in Norway, something thatwas crucial in order to build up a domestic knowledge base.Norwegian solutions were provided by the Norwegian sourceswithin certain fields, such as H-3 platforms and the so-calledCondeep constructions. In addition, Norwegian ship-ownersstrategically ordered supply ships and drilling rigs at Norwegianshipping yards. One estimate is that Norwegian oil companies withoperations in the North Sea placed 46 per cent of all contracts withdomestic suppliers between 1979 and 1993. By the mid-1990sapproximately 11–12 per cent of the total employment in the oiland gas industry were within approximately 150 companies withinthe offshore engineering consulting industry. The oil extractionactivities thus created new opportunities for the supplier industryand the service sector. A central debate in recent years amongboth scholars and policy makers has been related to theNorwegian ‘oil dependency’. One view is that it is necessary toredirect development before the natural endowments areexhausted around 2050, since future wealth depends on whetheror not alternative and competitive sectors are developed.
Sources: Cumbers (2000); Howie and Lipka (1993, as cited in Cumbers, 2000,p. 245); Olsen and Sejersted (1997) and Skogli (1998).

284
Con
stru
ctio
n
Oth
er b
usin
ess
serv
ices
Soft
war
e, R
&D
and
engi
neer
ing
serv
ices
Scie
nce-
base
d &
spe
cial
ized
supp
liers
in m
anuf
actu
ring
Scal
e-in
tens
ive
& s
uppl
ier-
dom
inat
ed m
anuf
actu
ring
Oth
er r
esou
rce
extr
acti
onse
ctor
s
Ext
ract
ion
of o
il an
d na
tura
l gas
Yea
r
1975
1977
1979
1981
1983
1985
1987
1989
1991
1993
1995
1997
1999
2001
020406080100%
Not
e:B
ased
on
thre
e-ye
ar c
entr
ed a
vera
ges.
Oth
er r
esou
rce
extr
acti
ng s
ecto
rs in
clud
e el
ectr
icit
y,ga
s an
d w
ater
sup
ply;
min
ing
and
quar
ryin
g(e
xcep
t oi
l and
nat
ural
gas
) an
d fi
sher
ies/
aqua
cult
ure.
Sou
rce:
OE
CD
ST
AN
dat
abas
e.
Fig
ure
8.1
Val
ue-a
dded
in t
he N
orw
egia
n bu
sine
ss s
ecto
r,19
75–2
001

finance and information and communication technology (ICT) services.Regarding the last, the worldwide trend is that ICT services relevant to oilextraction have become increasingly important within both exploration andproduction (Pinder, 2001), and several specialized Norwegian ICT firms areat the international forefront (UFD, 2005a).
State ownership within business was as of the mid-1990s the third highestin Europe next to Finland and Italy (Bøhren and Ødegaard, 2003), and hashistorically been evident in the form of two distinct waves, where the firstcoincided with the postwar industrial build-up and consolidation in the1945–70s period. Strong state involvement was seen as necessary if Norwaywas to become a serious actor within selected heavy industries (Wicken,2000). In addition to direct ownership, the state also provided a very hands-on type of coordination by way of nurturing a large research institutesector servicing industry (Benner, 2003, p. 138), stimulating entrepreneur-ship, entering licensing agreements and ensuring privileged access to capitaland special considerations in incomes policy. An additional, althoughpassing, wave of increased state ownership later occurred and focusedmainly on banking and finances due to the 1990s crisis within this sector(Huber and Stephens, 1998, p. 368).
Large firms in the core sectors are important, but that is not to say thatsmall and medium-sized enterprises (SMEs) play a minor role. Referring tosheer numbers, there were as of 2006 merely 610 firms with more than 250employees, whereas there were 2076 with 100–249 employees and 81 313firms with 5–99 employees (Statistics Norway, 2007). Smaller proprietor-managed firms in agriculture, trade and manufacturing gave vital input tothe Norwegian political economy during the 1800s, and many later becamecentral within sectors such as furniture, engineering and machinery. TheSMEs were (and still are) often family-owned and dependent on localfinancing. Their business activities were then gradually supplemented, asreviewed above, with a few larger enterprises exploiting natural resources.Thus, similar to Finland and different from Sweden, big business did notgain overwhelming societal influence (Huber and Stephens, 1998, p. 368;Sejersted, 1993).
3 INNOVATION INTENSITY
According to the Community Innovation Survey (CIS) there was a slightnegative trend regarding innovation intensity in Norway during 1994–96and during 1997–2001 (see Appendix Table A4.1). This negative develop-ment can be seen in most other countries that participated in the CIS study.Still, the overall assessment is that Norwegian firms on average are not
Norway 285

286 Slow growth countries
particularly innovative. Only about 30 per cent of Norwegian firms can beclassified as innovative, and the share of innovating firms remained unal-tered in 1997–2001. Denmark and Sweden have a share of innovating firmsthat is considerably higher (approximately 40 per cent, which is in line withthe average score in the survey). It is also worth mentioning that the shareof Norwegian firms that have introduced products that are new to themarket is quite low, which indicates that many of the innovations arediffusion-based, i.e. adoptions of innovations made by others.
One feature of innovation intensity in Norway is the difference betweenSMEs and large firms, with the latter being considerably more innovative(see Appendix Table A4.2). There may be several reasons for this difference.Large enterprises (LEs) often have more financial and knowledgeresources, and also usually have a broader range of products and moreprocesses than smaller firms. However, while the share of innovatingNorwegian LEs is on the same level as in the other CIS countries, theNorwegian SMEs distinguish themselves from other European SMEs byhaving a low share of innovators.
Among the Norwegian SMEs, the average innovation expenditures were2.3 per cent of turnover in 1997 and 1.4 per cent in 2001. But the LEs alsospent less on innovation in 2001 as seen in relation to turnover. Looking atresearch and development (R&D) in isolation, R&D intensity declined from1.7 per cent of turnover in 1997 to 0.9 per cent in 2001 for large firms, andfrom 1.4 per cent to 0.9 per cent on average. This decline may be partlyexplained by the general state of the market around 2000–2001, and can beseen in most other European countries as well, with the exception of Sweden.Among Norwegian SMEs there was an increase from 1997 to 2001 of firmsthat had introduced products new to the market. The large firms’ share in thisrespect was more than twice that of the SMEs. Compared with Denmark,Ireland, the Netherlands and Sweden, both Norwegian SMEs and LEs havea lower share of innovating firms (see Appendix Tables A4.4 and A4.10).
Among the knowledge-intensive business services (KIBS) there was anincrease in R&D intensity, simultaneous with a slight decline in innovationintensity from an average of 5.9 per cent of turnover in 1997 to 5.4 per centin 2001. Innovation intensity among manufacturing firms declined from 2.7per cent in 1997 to 2.1 per cent in 2001. In the same period, innovationintensity also decreased among manufacturers of basic metals and fabri-cated metal products.
One cause for decline in innovation intensity during the time period inquestion may simply have been the ‘relationship between technologicalchange and the low oil-price regime which prevailed towards the end of the1990s’ (Pinder, 2001, p. 580). In other words, many oil companies restrainedtheir exploration and production activity due to overall low prices for oil

(ibid.). Another contributing cause may have been the general downturnwithin high-tech investments following the 2000 crisis within ICTs andbiotechnology (Grønning et al., 2006). More extensive explanations havealso been offered, such as the time-lag hypothesis suggesting that Norwayis an extreme case of high economic performance today being based on thehigh innovation input of yesterday (i.e. during the 1970s), the structuralweakness hypothesis stating the accumulated effects of erroneous choices,and the hypothesis stating that the innovation indicators presently in usemay actually be unable to capture the particularities of the Norwegianeconomy in an adequate way (Aanstad et al., 2005; Moen, 2005).1
Coupled to this last indicator (ir)relevancy hypothesis we may pursuestill another type of explanation in line with the main argument of thischapter, which is to show that there is considerable heterogeneity bothwithin the country and within sectors when it comes to innovation inten-sity. We are in this respect inspired by the technological trajectory perspec-tive pioneered by Pavitt (1984; see also Archibugi, 2001; Srholec andGrønning, 2006), and see the oil and gas extraction sector as part of a scale-intensive trajectory and fisheries/aquaculture as part of a supplier-basedtrajectory. The scale-intensive trajectory has been associated with learningby doing in connection with process technology, internal non-R&D inputs,and external technology sourcing from specialized suppliers, and thesupplier-based trajectory with dependence on external inputs when itcomes to technology sourcing (Pavitt, 1984). Whereas both of these trajec-tories in themselves score relatively modestly on the various indicators forinnovation and R&D intensity (see Tables 8.1 and 8.2), the neighbouringspecialized supplier trajectory is innovation- and R&D-intensive, and largeparts of the specialized supplier trajectory’s output consists of supplies tothe trajectories dominated by the primary sector. Indeed, even parts of thescience-based trajectory in Norway are tightly linked to the less innovation-intensive trajectories by way of R&D output to these trajectories, e.g. vac-cines and other equipment for aquaculture and high-tech equipment, aswell as R&D services for oil and gas exploration. As for value-added, whenextraction of oil and natural gas as well as fisheries and aquaculture areincluded in the analysis, the value-added proportion between different tra-jectories is as shown in Figure 8.1. There has been an abrupt increase of oiland gas extraction value-added up until 1984, and then again from 1987onwards. Fisheries and aquaculture have been of more limited importancewhen it comes to value-added (Figure 8.1), but have been extremely import-ant for employment (Table 8.1).
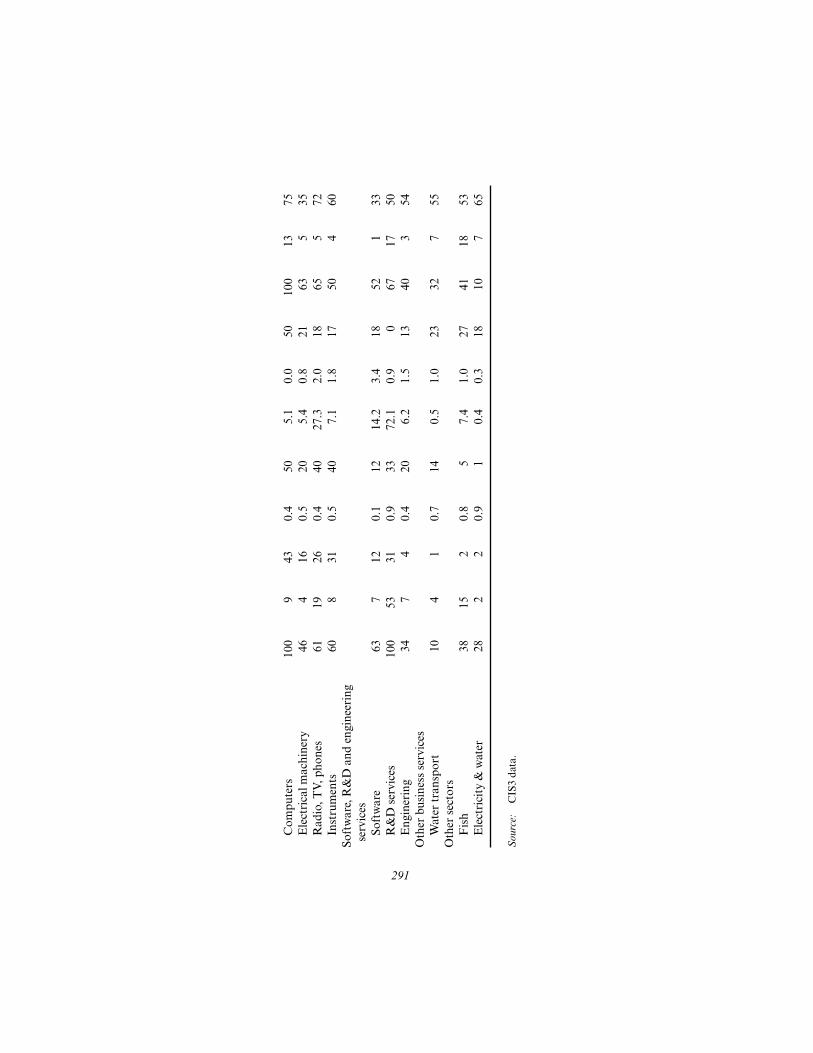
Table 8.2 shows the main findings for innovation and R&D intensity, aswell as the nature of innovativeness and interaction patterns. Of specialinterest are oil and gas extraction as seen in relation to other sectors. One
Norway 287

288
Tab
le 8
.1C
hara
cter
isti
cs o
fse
lect
ed s
ecto
rs in
Nor
way
,200
1
Shar
e in
the
bus
ines
s se
ctor
(%
)M
arke
t st
ruct
ure
Val
ue-
Em
ploy
men
tE
xpor
tIn
tern
al%
of
smal
lC
apit
alE
xpor
tad
ded
R&
D e
xpen
ditu
refi
rms
inte
nsit
yin
tens
ity
Ave
rage
n.a.
n.a.
n.a.
n.a.
401
949
18M
edia
nn.
a.n.
a.n.
a.n.
a.41
600
13E
xtra
ctio
n of
oil a
nd n
atur
al g
as35
.02.
545
.96.
03
20 1
7885
Scal
e-in
tens
ive
and
supp
lier-
dom
inat
ed
man
ufac
turi
ngF
ood
3.0
5.1
3.4
2.9
2881
916
Woo
d0.
71.
50.
30.
455
583
8P
aper
0.8
0.9
2.0
1.3
92
289
44B
asic
met
als
1.4
1.4
5.8
3.2
72
644
53F
abri
cate
d m
etal
1.0
1.8
0.5
1.1
6536
89
Fur
nitu
re0.
51.
20.
41.
051
391
11Sc
ienc
e-ba
sed
and
spec
ializ
ed s
uppl
iers
in
man
ufac
turi
ngC
hem
ical
s1.
51.
55.
68.
49
2 93
934
Mac
hine
ry,N
.e.c
.1.
42.
42.
17.
443
351
22C
ompu
ters
0.0
0.1
0.4
0.5
512
832
11E
lect
rica
l mac
hine
ry0.
50.
80.
63.
138
612
16R
adio
,TV
,pho
nes
0.4
0.7
0.9
13.8
2039
019
Inst
rum
ents
0.4
0.8
0.5
4.1
3018
816

289
Soft
war
e,R
&D
and
eng
inee
ring
se
rvic
esSo
ftw
are
2.3
3.7
0.8
14.9
5519
26
R&
D s
ervi
ces
0.5
1.1
0.2
0.9
2343
312
Eng
inee
ring
7.2
15.0
2.9
5.7
5312
012
Oth
er b
usin
ess
serv
ices
Wat
er t
rans
port
3.9
4.8
12.4
0.3
192
328
77O
ther
res
ourc
e ex
trac
ting
sect
ors
Fis
h1.
11.
51.
12.
293
1 51
530
Ele
ctri
city
& w
ater
3.5
1.6
1.3
0.7
3012
473
20
Not
es:
Exp
ort
inte
nsit
y in
clud
es b
oth
inte
rmed
iate
goo
ds a
s w
ell a
s ca
pita
l goo
ds.
Sou
rce:
OE
CD
ST
AN
dat
abas
e.

290
Tab
le 8
.2In
nova
tive
ness
and
nat
ure
ofin
nova
tion
pro
cess
in s
elec
ted
sect
ors
in N
orw
ay,2
001
Inno
vati
vene
ssN
atur
e of
inno
vati
on p
roce
ssIn
tera
ctio
n
Ave
rage
415
90.
623
5.4
1.6
2141
548
Med
ian
402
60.
520
1.6
0.9
2040
447
Ext
ract
ion
of43
13
0.4
731.
30.
023
3514
58oi
l and
nat
ural
gas
Scal
e-in
tens
ive
and
supp
lier-
dom
inat
ed m
anuf
actu
ring
Foo
d35
26
0.7
80.
60.
622
175
30W
ood
252
20.
718
0.9
1.0
2928
544
Pap
er31
111
0.7
181.
30.
338
560
69B
asic
met
als
481
111.
037
1.4
0.4
2140
1055
Fab
rica
ted
met
al29
16
0.5
242.
21.
020
394
40F
urni
ture
427
120.
538
2.4
1.0
2948
738
Scie
nce-
base
d an
d sp
ecia
lized
supp
liers
in m
anuf
actu
ring
Che
mic
als
652
80.
556
1.7
0.4
2346
668
Mac
hine
ry,N
.e.c
.45
819
0.5
464.
71.
24
463
46
Overall innovativeness
Product innovation
Process vs.productinnovation
Appropriability bypatents
Intensity on R&Dinputs
Interaction withcustomers
Interaction withscience
Cooperationagreements
Product imitation
Intensity on non-R&Dinputs
Interaction withsuppliers
291
Com
pute
rs10
09
430.
450
5.1
0.0
5010
013
75E
lect
rica
l mac
hine
ry46
416
0.5
205.
40.
821
635
35R
adio
,TV
,pho
nes
6119
260.
440
27.3
2.0
1865
572
Inst
rum
ents
608
310.
540
7.1
1.8
1750
460
Soft
war
e,R
&D
and
eng
inee
ring
serv
ices
Soft
war
e63
712
0.1
1214
.23.
418
521
33R
&D
ser
vice
s10
053
310.
933
72.1
0.9
067
1750
Eng
iner
ing
347
40.
420
6.2
1.5
1340
354
Oth
er b
usin
ess
serv
ices
Wat
er t
rans
port
104
10.
714
0.5
1.0
2332
755
Oth
er s
ecto
rsF
ish
3815
20.
85
7.4
1.0
2741
1853
Ele
ctri
city
& w
ater
282
20.
91
0.4
0.3
1810
765
Sou
rce:
CIS
3 da
ta.

could have expected machinery and instruments to rank even higher due totheir highly specialized nature as suppliers to natural resources and trans-portation sectors. However, the figures for machinery product imitation,as well as product imitation and innovation for instruments, stand out(Table 8.2, Innovativeness column).
4 ACTIVITIES THAT INFLUENCE INNOVATION
In the following we examine four groups of NSI activities: knowledgeinputs to innovation, demand-side factors, provision of constituents andsupport services for innovating firms. It would be an exaggeration to statethat all activities within the Norwegian system revolve around the resource-extracting sectors. Other sectors, including public sector services, occupy animportant place within the Norwegian economy. However, the sectionfocuses on the business sector with the aim of assessing the relative role ofresource-extracting scale-intensive and supplier-based trajectories versusother trajectories when it comes to the specific types of activities.
4.1 Knowledge Inputs to Innovation
4.1.1 R&D activitiesDuring 1991–2003 Norway had low R&D expenditure in relation to GDPcompared to the OECD average. The share was 1.75 per cent in 2003,while OECD average spending was 2.24 per cent (OECD, 2005).NOK29 517 billion was spent on R&D in Norway: the business sectorfinanced 49 per cent, the public sector financed 42 per cent, while the restwas financed by other domestic and foreign sources. Regarding expendi-tures, the business sector’s share of R&D expenditures in Norway was 57.5per cent in 2003, compared to the OECD average of 67.3 per cent. Thepublic sector and the higher education sector accounted for around 42.5 percent, which is higher than the OECD average (NFR, 2005; OECD, 2005).
When we separate the public sector (higher education and research insti-tutes) from the private sector (business), we find that R&D expenditures arerelatively different in character. The private sector spends more within ICT,offshore technology and materials technology. It also spends a largeamount within ‘other fields’ (medicine, social sciences, human sciences andnatural sciences). The public sector has by far the majority of its expenseswithin ‘other fields’, but also within ‘marine R&D’ (NFR, 2003, p. 35).
The research institute sector is large in Norway, and 23 per cent of allNorwegian R&D expenditures in Norway are spent there. There were, as of2005, 63 research institutes and approximately 50 more ‘other institutes
292 Slow growth countries

with R&D’. The former accounted for 85 per cent of R&D expenditures inthe institute sector and received some basic funding from the NorwegianResearch Council or from the ministries. The industrial research institutesaccounted for the largest group. The Foundation for Scientific andIndustrial Research at the Norwegian Institute of Technology was by farthe largest unit with approximately 1800 employees, and was heavilyinvolved within research areas such as petroleum, gas and marine research(NFR, 2005, pp. 34–5).
The relatively low Norwegian expenditure on R&D in relation to GDPis closely related to the structure of the Norwegian economy, in which thereis – as reviewed – a large proportion of SMEs without much tradition ofresearch activity. And most LEs have – also as reviewed above – their basisin the exploitation of natural endowments. These are as such low- andmedium–low-technology firms with relatively low levels of R&D expend-iture. Thus Norway looks weak in the OECD R&D comparisons (seeAppendix Table A2.1). Another important factor in considering the lowprovision of R&D is the large income from the oil and gas sector con-tributing to a high GDP, which in turn makes the Norwegian R&D effortlook very low (Nås and Hauknes, 2004). By accounting for R&D intensityin the business sector adjusted for variations in industry structure based onaverages from 1999 to 2002, Norway’s relative ranking moves up substan-tially in terms of business R&D intensity, while Korea and Finland drop toa lower level (OECD, 2006, pp. 57–9). Also, measuring the provision ofR&D in relation to population size from 1991 to 2003 shows that Norwayhas spent more than the OECD average (OECD, 2005).
Norway’s share of the world’s total output of scientific articles in theperiod 1998–2002 was nearly 0.6 per cent. Based on Appendix Figure A3.1,the average annual growth was 2.86 per cent, which is a relatively lowgrowth rate. Publications come from two major areas, with medical sciencesaccounting for the largest share (52 per cent) and natural sciences thesecond largest (24 per cent). As for the latter, the historical changes in pub-lication output from 1982 to 2001 show a remarkable growth within geo-sciences. This development is related to the oil exploration activities.Ecology and plant and animal sciences are also subjects of high specializa-tion, reflecting the activities taking place within fisheries and aquaculture.Subjects such as engineering, physics, chemistry and computer science havea relatively low specialization level.
Researchers in Norway increasingly collaborate with foreign researchers.Collaboration between Norwegian researchers on scientific publicationsincreased from 23 per cent in 1985 to 53 per cent in 2004. However, this ten-dency is apparent in all countries, reflecting the increasing international-ization of research in general (NFR, 2005, pp. 112–13).
Norway 293

Norway ranks low when it comes to patenting activities in internationaland comparative terms, with only a 0.2 per cent share of the total US Patentand Trademark Office grants (as compared to 0.3 for Denmark, 0.6 forFinland, 0.8 for the Netherlands and 0.9 for Sweden), and 67.54 EuropeanPatent Office patent applications per million inhabitants as compared to,for example, 160.63 for Denmark and 261.35 for Finland (see AppendixTable A3.1). These findings are consistent with other aspects of the low-tech nature of large parts of the Norwegian business sectors. TheNorwegian Patent Office registered 69 795 patent applications in the period1991–2002. Applications of foreign origin constituted around 80 per cent,highly represented by the USA, Germany and Sweden. There was adifference between patent applications of Norwegian and foreign originwith regard to technological fields. During 1995–2002, most of the foreignpatent applications were within chemicals and pharmaceuticals. Most ofthe Norwegian applications were related to shipbuilding, machine tools,pumps/turbines, oil rigs, drilling techniques and instruments within med-ical technology (NFR, 2003, pp. 181–6).
In sum, the importance of the oil and gas extraction sector as part of ascale-intensive trajectory and fisheries/aquaculture as part of a supplier-based trajectory is reflected in Norway’s revealed technological advantage(see Appendix Figure A3.2). Oil and gas have experienced a dramaticincrease during the whole period, while transportation services (basicallyshipping) have become more competitive since 1993 after experiencing adownturn during 1980–86. Medical electronics have also very recentlybecome more competitive. However, other sectors related to naturalresources such as metals, wood and paper have experienced a decrease interms of technological advantage since 1980.
4.1.2 Competence buildingAs of 2004, the share of 20–24-year-olds having enrolled in higher educa-tion was over 95 per cent, compared to the EU-15 average of 76 per cent.In 2004 there were 209 000 students in Norway within higher education. In2002, 31 per cent of the population between 25 and 64 years in Norway hadhigher education,2 which was nearly the same as in Sweden, Denmark andFinland, but much higher than the OECD average (23 per cent). Thesenumbers indicate that Norway has an advantage compared to the OECDaverage in terms of competence in the labour force. However, looking at thenumbers of 20–29-year-olds with science and technology education ingeneral, and also the number of people with PhDs within these fields,Norway ranks relatively low compared to the EU-15 average, as well as toSweden, Ireland and Denmark (NFR, 2005, pp. 230–31). The quality ofeducation within mathematics has also been questioned: Norway ranks
294 Slow growth countries
statistically below the OECD average when it comes to mathematics per-formance (OECD, 2004b). This has been taken seriously by the gov-ernment, which in 2005 started to consider measures for increasingrecruitment to science and mathematics studies (Aanstad et al., 2005).
The size, importance and the technical complexity of the Norwegian oiland gas system is reflected in the data on people with higher education. Asof 2003, the largest share of people with higher education in the labourforce was found within oil, gas and mining, where 16 per cent of all employ-ees had a higher education, as compared to less than 5 per cent in manu-facturing. It is also within oil, gas and mining that we find the highestshare of people educated within technology and natural sciences (NFR,2005, pp. 83–4).
4.2 Demand-side Factors
Three types of activities directly or indirectly aimed at increasing demandand creating new markets are of special interest. First, publicly ownedorganizations have used procurement to stimulate innovation. Second,businesses have been active as front-runners in the implementation of ICTsin the case of both banking and oil and gas. Third, Norwegian firms areglobally at the forefront when it comes to demand-related quality assuranceregarding shipbuilding and oil platforms, and energy production in general.
In 2003 public procurement accounted for 15 per cent of NorwegianGDP (OECD, 2004a). A procurement programme established in 1986aimed at stimulating the development of new products or processes forwhich a government department has a requirement. The aim was princi-pally to speed up the purchase and implementation of new products andservices in government ministries and give industry a ‘pilot’ customer andreference (Remøe et al., 2004). During the 1990s public procurement policyhad been directed towards achieving the greatest possible efficiency andlowest prices, unlike in Sweden, where public procurement had been usedmore actively to stimulate technology development. During the second halfof the 1990s there was an increasing awareness of public procurement as apotential means of increasing innovation, providing customer references,setting high requirements and generally professionalizing firms (NHD,1997). According to an evaluation report, the existing guidelines on pro-curement still concentrate on efficiency, whereas neither innovation norstimulation of markets is mentioned (NHD, 2004, p. 50).
Formerly state-owned organizations that have been privatized engageactively in procurement, which is stimulating innovation. Perhaps the best-known example is Statoil’s role in the development of the oil industry(Rothwell, 1994). Statoil deliberately created a local market for engineering
Norway 295

suppliers by engaging with them in innovative collaborations. The legacy ofthis policy, combined with the goodwill agreements with foreign firms, is arobust engineering sector with sufficient technological capabilities to winglobal contracts. On a similar theme, the DEMO 2000 programme wasstarted in order to remove market barriers and improve competition forsuppliers and services to oil producers. It has aimed at trying out new tech-nology in pilot projects involving producers, suppliers and research insti-tutes (Hansen et al., 2005). Also in 2001, the OG21 project was initiated bygovernment and business with the aim of improving research, demonstra-tion and commercialization of new technology for use in the oil-relatedbusinesses.
When it comes to other businesses, a group of competing banks, softwaresuppliers and the retail industry collaborated during the 1980s in anattempt to stimulate use of electronic payments systems. This initiative gaveNorway a standardized electronic platform on which to develop newpayment products and Internet banking, and in 2002 Norway had thehighest worldwide use of electronic debit cards for consumer purchases(Bank of Norway, 2003). In 2002 the e-Norway programme was initiatedby the Ministry of Trade and Industry with aims including ‘creating valuethrough enhanced innovation and competitiveness in Norwegian industry’(NHD, 2003a, p. 6). A programme entitled BIT has been aimed at improv-ing the profitability and competitive ability of firms by developing commonICT solutions adapted to specific sectors of industry, and has receivedfavourable evaluation results (Kallerud et al., 2006, p. 43).
As for quality assurance, the Norwegian organization Det NorskeVeritas is one of the main organizations setting quality standards for, forexample, oil-rig building and shipping industry worldwide.
4.3 Provision of Constituents
4.3.1 Provision of organizationsThis section deals with provision of organizations in two different senses.The first is the establishment of new business organizations and the secondthe provision of innovation policy organizations. Norway performsparticularly well when it comes to the creation of entirely new businessorganizations. Birth rates are, according to Eurostat (2007), higher than in,for example, Sweden, Finland, Denmark and the Netherlands. Norwayalso holds a strong potential in this area, since the country consistentlyranks very high on the ratio of the active population engaged in start-ups.In addition, Norway ranks well ahead of Sweden, Denmark and Finlandwhen it comes to start-ups representing something new in the domesticmarket (Kolvereid and Alsos, 2003, p. 13).
296 Slow growth countries

Sweden excels, however, when it comes to survival rate, at least duringthe 2000–2001 period. This phenomenon is obviously connected to thedifferences in death rates, where Sweden is clearly lower, with 5.55 percent-age points compared to 8.30 in Norway (Eurostat, 2007).
The figures above concern all kinds of firms. A survey by Matson (2005)gives an indication of Norway’s performance when it comes to the creationand bankruptcy rates of new technology-based firms (NTBFs) during1990–2001. Within his sample of 3055 firms, computer and R&D serviceshad 10.7 and 13.0 per cent bankruptcy rates respectively, compared tobetween circa 20 and 30 per cent for mining, manufacturing, constructionand transportation and 9.4 per cent for oil and gas exploitation (Matson,2005, p. 70). According to another study (Nås et al., 2003a; 2003b) only11.2 per cent of all spin-off firms in Norway were spin-offs from high-technology industries. This figure compares to 17.5 per cent for Sweden andDenmark, and 17.3 per cent for Finland. Not surprisingly, Norway holds(together with Denmark) a considerably lower share of spin-offs from high-technology manufacturing, mainly due to the overall higher presence ofsuch industry in Sweden and Finland.
Regarding agencies and organizations for innovation policy, the devel-opment has been towards consolidation in larger units. Until 1993, Norwayhad a funding system spread across several research councils according tobroad disciplinary bases. These research councils were then merged intoone, the Research Council of Norway, which was further reorganized in2004, based on the recommendations of a large-scale evaluation exercise(Kuhlman and Arnold, 2001). Simultaneously, the trend has been fromsmaller research programmes and funding of individual research projectsto formation of larger and more comprehensive research programmes. Inaddition, Norwegian business may participate in regional development orstart-up support programmes. In 2004 these programmes were merged intoInnovation Norway, together with the Trade Council of Norway and twoother support organizations.
4.3.2 Networking, interactive learning and knowledge integration Collaboration between firms is important for innovation in the NorwegianNSI. Forty-one per cent of all the surveyed firms collaborated actively withothers in the period 1999–2001 (cf. CIS3). Suppliers were the most frequentpartners (around 70 per cent of the surveyed firms). However, 39 per centof the firms reported that customers were the most important actors incollaboration, while competitors were the least important. Twenty-eightper cent of the firms reported that they collaborated with universities andstate/scientific colleges, and 33 per cent collaborated with public or privateresearch institutes. The level of innovation cooperation was thus very high
Norway 297

in Norway compared to the EU-15 average.3 Innovation cooperation withnational partners in Norway was considerably higher than the EU-15average. In Norway, suppliers, customers and consultants were the mostimportant partners. Thirty-three per cent of the firms were engaged ininnovation cooperation as compared to 23 per cent in the EU. Regardinginternational collaboration and the nationality of the collaborating partnerfirms, 29 and 34 per cent collaborated with firms within Scandinavia andwithin EU/EFTA respectively. Most of the Norwegian firms that collabo-rated with partners in the USA were large firms with activities related to oiland gas, shipping and production of chemicals. Smaller firms within othersectors such as aquaculture and furniture did not report any such collabo-ration (Statistics Norway, 2001). It should however be noted that collabo-ration between firms on the one hand, and universities, scientific collegesand research institutes on the other, had relatively low importance forinnovation processes. Correspondingly, interactions within the firm werethe most important source of information during innovation processes(ibid.).
When it comes to R&D collaboration between firms in Norway, approx-imately 50 per cent of all firms with R&D activities had a formal relationof R&D collaboration with another firm in 2003. This was especially appar-ent in aquaculture, extraction of oil and gas, metal products, communica-tion equipment and medical instruments (NFR, 2005, pp. 104–5).
Networking programmes set up by national or regional authorities haveincluded the BUNT (Business Development Using New Technology) pro-gramme in the early 1990s, targeting firms’ abilities to find and use newtechnology developed in other companies or research institutions, a follow-up FRAM programme (est. 1992) supporting basic learning in SMEs, anda programme for mobilization of R&D-related innovation in SMEs(Aslesen, 2004, p. 31). Looking at oil and gas in particular, the NorwegianOil and Gas Partners network was established jointly by the business com-munity and government in 1997, and had 160 partner companies as of 2004(INTSOK, 2005).
4.3.3 Provision of institutionsThis section contains a review of institutional arrangements related to theactivities reviewed elsewhere in this Section 4. The review contains only themost significant developments in recent years, but some issues will bepursued in further detail in Section 7 in connection with the overview ofinnovation policies.
In connection with knowledge inputs to innovation, such as provision ofR&D (see Section 4.1.1), the institutional framework has undergone aseries of changes. In 1993, the goodwill R&D agreements with foreign oil
298 Slow growth countries
companies were abolished, making it a necessity to sustain this kind ofresearch on a more competitive basis. In 2002, amendments to the Act onUniversities and Colleges (UFD, 2002) gave universities and collegesformal responsibility for assisting in the process of making research resultsavailable for society. In more concrete terms, the traditional ‘professorialexemption rule’ in the act was dissolved. Employees at higher educationorganizations traditionally had rights connected with the inventions anddiscoveries that were made, and the change in this respect was part of anintended shift towards higher participation by higher education organiza-tions in the commercialization process by way of being entitled to the intel-lectual property rights (Askevold et al., 2003, p. 13). The organizationshave in this respect also been faced with new tasks and responsibilities, andas a consequence several technology transfer units have been established.
The White Paper ‘Commitment to Research’ (UFD, 2005a) states thatNorway’s future goals include raising the number of researchers per 1000employees. In concrete terms the declining number of new recruits toscience and technology subjects is to be countered first and foremost byimproving the conditions for science teachers at secondary and tertiarylevels. Furthermore, recruitment to researcher posts is to be improved bygiving special premiums for science and technology doctoral candidates(UFD, 2005b, p. 30), and making the postgraduate researcher careeropportunities and working conditions in general more attractive throughimproved working conditions (UFD, 2005a, p. 7).
Furthermore, and also related to the institutional framework of compe-tence building (see Section 4.1.2), a new Act on Universities and Collegespassed in 2002 (UFD, 2002) included changes in the control and manage-ment structures of universities and colleges. In the ensuing debate manyhave seen this as a threat to academic freedom and internal democracy, andsubstantial freedom when it comes to deciding governance structures hasbeen reinstated (Aanstad et al., 2005).
Regarding demand-side factors (cf. Section 4.2), competition legislationand its agency were coordinated into a new competition authority in 1994in order to enforce both national and European competition law. Norwayis as of 2007 not an EU member, but adheres to EU directives throughsigning the Agreement on the European Economic Area. The OECD has,however, pointed to prevailing problems with the Norwegian market andrecommends that greater efforts should be made to improve competitioneven further (OECD, 2004a).
One of the main traits of the Norwegian economy is, apart from theNorwegian state having ownership interests in parts of industry, that theNorwegian firms are governed by institutionalized employee represent-ation on the board. There are no signs of deinstitutionalization on this
Norway 299

point. Regarding corporate governance, there have been changes in thewake of scandals such as Enron abroad as well as within Norway in theearly 2000s. Main actors in the financial market agreed on a code for cor-porate governance in 2005. In parallel, another institution of domesticorigin and based on long-standing egalitarian norms is the proposedminimum ratios of females on corporate boards. The demand for qualifiedfemales has incidentally led to the establishment of databases listingwomen eligible for board service.
One unresolved issue of perhaps even greater implications for organiza-tions and their innovativeness is the overall framework for corporate own-ership. As mentioned in Section 2, ownership patterns of Norwegiancorporations differ from those in the rest of Europe, starting with high stateownership, much as in Finland and Italy. Figures from a 1993–97 study oflisted companies show that the public owns 14 per cent as compared to8 per cent in the other European countries in the study. Overseas ownersconstitute 32 per cent as compared to 21 per cent, owners such as pensionfunds and so on constitute 21 per cent as compared to 25 per cent, indus-trial owners 25 per cent as compared to 18 per cent, and personal owner-ship is restricted to a mere 8 per cent as compared to 28 per cent (Bøhrenand Ødegaard, 2003). This low level of direct ownership is rather unusual,and has been explained by referring to more long-term and normativelybased institutions such as taxation aimed at equalization of income andassets. Gradual change in this respect started, however, at the end of the1990s with periodic tax alleviations for savings in bonds (ibid.). There havealso been examples in recent years of firms and business persons first suc-cessful in, for example, mechanical engineering, aquaculture and retailsales later investing in other sectors than their own.
Regarding institutions related to support services for innovating firms(Section 4.4), we find the most dramatic developments within financing.The surpluses from oil revenues have been first and foremost accumulatedin the form of the Petroleum Fund established in 1990 and starting opera-tions in 1996. The fund is an integral part of Norwegian fiscal policy andallows Norway to finance a budget deficit which should, over time, notsurpass the ‘real return’ on the Petroleum Fund, estimated at 4 per cent ofthe fund value. The objective is thus also to secure present oil and gas rev-enues for future generations (OECD, 2004a, pp. 11 and 21). Conditions areattached to this capital stipulating that it has to be invested abroad in orderto avoid artificial overstimulation of the domestic economy. This policy hasbeen adjusted in recent years with the establishment of a separate Fund forResearch and Innovation (FRI) in 1999 with a capital of NOK3 billion, aswell as funds for seed capital. The FRI capital base has been increased, withthe 2005 White Paper mentioned above (UFD, 2005a), to NOK50 billion
300 Slow growth countries

starting from 2006 (Aanstad et al., 2005). Needless to say, increasedfunding may in turn have implications for the scale of R&D provisionalready reviewed above. One may speculate that large-scale research pro-grammes catering mainly to the science-based trajectory by focusing onbiotechnology (2002–11) and nanotechnology (2002–8 with planned exten-sion through 2011) might not have been possible without these means.
Also related to financing, albeit on a more detailed level, is the institu-tionalization of R&D support in the form of tax deductions to privateenterprises with sales less than NOK80 million and fewer than 100 employ-ees. This was instituted in January 2002 and became a popular opportunityamong SMEs. The programme was based on predecessors in Austria andSpain, and nearly 60 per cent of the applicants in the 2004–6 period havebeen firms with fewer than ten employees (Kallerud et al., 2006, pp. 35–7).From 2007 onwards the criteria have become somewhat stricter, includinga maximum level of deductions when it comes to hourly expenses as wellas annual hours worked per person (Munch, 2007). Nevertheless the char-acter of the policy instrument as being reserved for rather small firms andas working more on an egalitarian rather than competitive basis remainsintact.
4.4 Support Services for Innovating Firms
4.4.1 Incubating activitiesIncubation activities are based on experiences gained in Europe and theUSA, although the recommended size of the average unit has beenmodified in order to fit with Norwegian conditions. The most importantpublic actor within incubation is the Industrial Development Corporationof Norway (SIVA) (est. 1968), which was, as of 2002, the joint owner of 10research parks, 15 knowledge parks, 34 business parks, 8 R&D companies,18 singular incubators and 12 seed capital/venture investment companies(SIVA, 2002). There are in addition 14 other science or research parks inNorway, a majority of which were established in the late 1990s and havemixed public and private ownership. These are in general located adjacentto one of the universities or colleges.
The creation and maintenance of incubators is relatively recent inNorway. Evaluations cite examples of successes, but point out that the busi-ness aims are vague and not directed towards any particular market (Havnes,2003), and that research output in the form of, for example, patenting so farhas been limited (Askevold et al., 2003). From initially being mainly prop-erty developers, the incubator hosts now see themselves more as providingvarious services for innovators. One aspect which may differ from othercountries is that the publicly funded incubators usually have a dual aim of
Norway 301

creating economic growth through innovation while at the same time pro-moting regional development (SIVA, 2004). Thus although research parkand incubation activities are in a sense by definition high-tech, and henceenhance a science-based trajectory, this dual function emphasizes the muchbroader aim of the initiative in Norway.
4.4.2 FinancingIn this section we briefly describe in sequence the provision of both ventureand seed capital, and the activities of private investors. Note that we focuson financing of innovation in start-up firms, and not on financing of innov-ation in larger, existing firms.
It has been pointed out that there is no real lack of capital in theNorwegian market (NHD, 2001; FD, 2004). But venture capital (VC)raised in 2001 was an amount equivalent to 0.152 per cent of GDP, whichis lower than in most other European countries (EVCA, 2002). The com-position of the investor population is mainly public funds and a few largeprivate investors, and in this respect it differs from European VC.Norwegian investors are investing well below the European average in theseed capital phase, and during 2000–2002 almost 60 per cent has beeninvested in the buyout stage (NVCA, 2001; EVCA, 2002). During the sameperiod less than 30 per cent of total VC investments were in seed and start-up firms and projects (Baygan, 2003, p. 8). An alliance of public and privatepartners was created in 1997 aimed at providing seed capital for new busi-nesses. However, in practice the capital raised was invested in later stagesthan is typical for seed capital (Sydnes and Halvorsen, 2003).
Innovation Norway is responsible for a system of grants and loans fordeveloping ideas, and for the creation and development of new firms.Innovation Norway and its predecessors had a fairly constant level ofresources available for new start-ups in the period from around 1980 andup until 1990. In the period 1994–2003 there was a general trend of reduc-tions in funding (from NOK4 billion to NOK2 billion). This reduction wasparticularly dramatic in urban areas, where funding fell by over 60 per cent(Innovation Norway, 2004). Reasons for the reductions aimed at entrepre-neurialism are not entirely clear, but may have been related to the generaldecentralization of regional funding to regional and municipal councils(KRD, 2003), to increases in R&D funding (Aanstad et al., 2005, p. 18), orto the lack of coherence in implementing innovation policies (Remøe et al.,2004, p. 92). This reduction may contribute to the funding problems experi-enced by entrepreneurs, particularly urban NTBFs.
According to CIS3 data, 15 per cent of innovative companies experienceproblems regarding financing of innovations, an increase from 12 per centin 1997. The only factor that more firms (17 per cent) rate as an obstacle to
302 Slow growth countries

innovation is cost. According to CIS data, under 1 per cent of the firms inthe 2001 survey used VC to finance innovation, and the vast majority ofinnovation was financed using internal resources. Borch et al. (2002)also show that over 60 per cent of the entrepreneurs involved in starting uptechnology-based companies saw obtaining finance as their greatest chal-lenge. It is, however, not clear if this problem is due to lack of finance or tolack of communication between investors and entrepreneurs.
4.4.3 Provision of consultancy servicesConsultancy and advisory services for innovating firms are available inNorway from both public and private organizations. In recent years therehas been an expansion in the number of KIBS, while the publicly fundedservices have increased their emphasis on the support of SMEs, particularlyin rural areas.
If we first look at the development of KIBS, we see a marked growth inboth number of firms and number of employees. Stambøl (2005) states thataround 6 per cent of the Norwegian workforce were employed in KIBS in1994.4 By 1999 this figure had risen to around 12 per cent. This is similarto the growth experienced in Sweden in the same period. As of the mid-1990s more than one-tenth of total employment related directly to oil andgas extraction worked in smaller firms providing knowledge-intensive con-sultancy services to the resource-extraction firms themselves (Skogli, 1998).
It is difficult to compare exactly with other countries, but in the periodbetween 1998 and 2001, Norway had a greater increase in the number offirms in the service sector overall than the other Scandinavian countries.During the 1990s there was an increase in the education levels of thoseemployed in KIBS, and they now have on average 1.5 more years of edu-cation than the average for the Norwegian workforce (Stambøl, 2005,p. 93). It should be mentioned that there has been an increase in the exter-nalization, or outsourcing, of certain large firm business functions such asICT services, and this may be partly responsible for the growth in KIBS.
CIS3 data indicate that the KIBS sector is the most innovative inNorway, since 48.9 per cent of the firms are innovating and 7.8 per cent ofturnover is from new-to-the-market products or services. KIBS are alsoactive in assimilating products developed by others, with 46.3 per centintroducing products new to the firm accounting for 23.2 per cent ofturnover.
The major public actors are Innovation Norway, providing local consul-tancy and advisory services aimed at SMEs especially in rural areas, SIVA,providing similar services for firms in their incubators, and business parksand the semi-public research institutes (see Sections 4.1.1 and 4.4.1 formore details). Additionally there are private foundations receiving public
Norway 303

support, but having more specific aims than public consultancy services.The Technological Institute offers technological expertise, advisory ser-vices, training, technology transfer programmes as well as laboratorytesting and certifying services to SMEs, and the advisory institute inNorthern Norway offers advice and contract research for that specificregion. The Public Advisory Service for Inventors is a public agencyoffering advice and scholarships for inventors. The office supports patentapplications and the building of prototypes (Aanstad et al., 2005).
Studies of knowledge-intensive services in the software and aquacultureindustries have shown that although innovative firms use KIBS actively, theinternal activities play a more important role in innovation (Broch andIsaksen, 2004; Aslesen, 2004). This finding matches CIS3 data on sourcesof innovation, where 46 per cent of innovative firms cite internal sources asthe most important for innovation.
4.5 Summary of the Main Activities Influencing Innovation
The provision of R&D is without doubt an important activity within theNorwegian system. SMEs are not particularly active in this regard, whichcomes as no surprise. A particular feature of R&D provision is the closerelationships between the large firms within resource extraction andmechanical engineering firms on the one hand and the semi-public researchinstitutes on the other hand. This particular type of relationship alsoexplains the relatively low participation of KIBS.
Regarding knowledge inputs to innovation, the importance of thenatural-resource-extraction-related trajectories is reflected in Norway’srevealed technological advantage. At the same time, there are more recentand increasingly significant features related to other ‘challenging’ traject-ories, such as the science-based trajectory. The latter is highly visible throughlarge sums of R&D expenditure, as well as high competence levels. Theleading firms still need science and technology graduates, as do the special-ized supplying research institutes and firms. Seen from the needs of the dom-inant trajectories, the low number of graduates is alarming. This stagnationin competence development may also pose a problem for the successfuldevelopment of alternative strongholds within the science-based trajectory.
The distribution of activities in the case of demand aspects has alwaysbeen heavily tilted towards the segment of the economy not directly relatedto natural resources extraction. This is most visible in the form of pro-grammes for ICT diffusion. However, when it comes to quality requirementorganizations, Norway has been and continues to be prominent by supply-ing some of the leading organizations for certification of equipment withinnatural-resources-related sectors.
304 Slow growth countries

The Norwegian system shows dynamism in terms of organizationturnover as well as support services. While organizational longevity couldideally be at least at the level of Sweden’s, the recruitment to entrepreneur-ial activities seems to be adequate. The level of support services in termsof incubators, financing and consulting seems to be high. On an institu-tional level the review shows adjustment to supranational trends (such as,e.g., the change of university-related legislation and implementation ofcorporate governance codes) blended with domestic initiatives (such ascontinued strong employee representation and gender-based corporateboard quotas).
5 CONSEQUENCES OF INNOVATION
The Norwegian NSI, as repeatedly stated, scores relatively low on innov-ation and R&D intensity in the CIS data (see Sections 3 and 4.1.1), whilerelative GDP and productivity growth are high. Economic growth inNorway during 1980–2003 has been higher than the average for the OECDcountries (see Appendix Table A2.3). In the 1992–2002 period, averageemployment growth was twice as high as within the EU, with a simultane-ous reduction in unemployment. Norway has had a steady, positive devel-opment in productivity during 1980–2001 (see Appendix Table A2.2 for the1995–2003 period). This positive development also goes for labour pro-ductivity/total employment, labour productivity/hours worked, and totalfactor productivity. Moreover, Norway ranks as number one on the HumanDevelopment Index (see Appendix Table A1.2) and relatively high on liter-acy indicators (see Appendix Table A1.3).
One explanation is that this prosperity is predominantly due to revenuesfrom the energy sector, in particular oil and gas, but also from hydroelec-tricity in earlier times. For example, looking at the structural non-oil budgetbalance during the 1980–2004 period, there are 20 years of negative figures.In 1992, the balance was down to nearly minus 10 per cent (OECD, 2004a,p. 27). It would thus be safe to conclude that the fluctuations of NorwegianGDP in recent decades are closely related to fluctuations in energy produc-tion. Benner (2003) claims that Norway’s lack of innovation intensity is dueto a lack of incentives for innovation. It is argued that the country ‘seemsstuck in its traditional growth paradigm, which at the moment is more thansufficient to support a full employment labour market and a universal socialpolicy regime’ (ibid., p. 140).
This can, however, only constitute part of the explanation, since com-pared to most other ‘oil-dependent’ economies the Norwegian economy isfar more heterogeneous, includes a large public sector and sustains a
Norway 305
significantly higher standard of living for the general population.Complementary (and also partial) explanations for the puzzle are thus,first, that while CIS takes into account many types of firms and sectors,the highly profitable oil and gas firms constitute only a small fraction ofthese firms. In addition, oil and gas drilling is not represented statisticallyas manufacturing, but rather as a primary industry together with fisheriesand aquaculture. Second, while Norwegian innovation output on averageis low due to, among other things, the low-tech character of manyNorwegian firms, there are indeed competitive and innovative niches suchas supply services to oil drilling, medical technology and environmentaltechnology.
With these reservations in mind, we sum up some overall observations.According to the Norwegian part of CIS3, the positive effects of thefirms’ innovative activities in Norway are related to improved productsand services. Sixteen per cent reported that they increased their marketshare due to innovations. Twenty-seven per cent of firms reported that inthe 1999–2001 period the most important effect of innovation was better-quality products. This was particularly common among producers of ICTequipment and other electronic goods. Twenty-three per cent of the firmsreported a broader range of goods and services as being the most import-ant effect, and this was particularly noticeable for those producing agri-cultural and forestry machinery. Sixteen per cent of the firms sawincreased market share as the most important consequence. Within aqua-culture, oil and gas extraction, and also within construction, the mostimportant innovation effects were improved flexibility in production,increased production capacity and reductions in labour costs. Processimprovements were the most important in the service sector as well. Thereare no noticeable differences between the effects on small or large firms,but a larger number of the small firms do stress the importance ofimproved production flexibility. However, this was the opposite in thecase of the service sector. Ørstavik (2000) followed up CIS2, and the rela-tive significance of successful innovations was related to increased com-petence and technology more than to increased turnover. This was inparticular a dominant trend within ICT. With regard to turnover, around50 per cent of the firms reported that innovations had a positive effect(ibid.).
As mentioned in Section 3, various hypotheses have been proposed toexplain the low innovation intensity of the Norwegian firms (Aanstadet al., 2005; Moen, 2005). One is that there is a long time lag between innov-ation indicators and economic performance. Strong macroeconomicperformance in the present could therefore partly be explained by choicesand activities of the 1970s and 1980s when Norway invested strongly in the
306 Slow growth countries

oil- and gas-related efforts as well as within the marine sciences (Aanstadet al., 2005, p. 20).
A second type of explanation is that the Norwegian economy suffersfrom structural weaknesses resulting from erroneous choices and strategieswithin both business and government. According to this view there is cur-rently an aversion to, or perhaps even inability to, foster high-tech innov-ation intensive sectors (Moen, 2005, p. 7). This practice differs significantlyfrom other countries such as Ireland, Finland and Singapore, and Norwayshould emulate these countries and channel more of its surplus resourcesinto high-tech efforts in order to become a fully fledged member of theknowledge economy (Moen, 2002).
The third type of explanation criticizes this ‘high-tech bias’ (Aanstadet al., 2005, p. 21) in modern policies consisting of ‘the mind-set seeinghigh-tech sectors as the future focus and loci of the economic activity in theadvanced economies’ (ibid.). This view is to a great extent supported by ourstudy. It questions the relevance of benchmarking the Norwegian experi-ence against such a biased perspective, and rather suggests that theinnovation indicators presently in use may be unable to capture the partic-ularities of the Norwegian economy. Norway is specialized in the low-techindustrial range, and has little activity in the high-tech sectors except for insome niches (see Appendix Table A2.1). There is, as reviewed above, a largenumber of small companies that invest little in R&D. Manufacturing con-centrates, also as reviewed above, much of its efforts on process innova-tions, but ‘process innovation may be equally or even more profitable in oiland gas, metals etc. compared to new to firm or new to market products’(Aanstad et al., 2005, p. 20). It could thus be argued that the indicators suchas those used within the European Innovation Scoreboard (EuropeanCommission, 2005) provide a misleading picture of actual innovation per-formance and dynamism.
6 GLOBALIZATION
Norway’s degree of openness in terms of import and export ratios has beensteadily declining since the 1980s. As for 2000, the country’s position isnumber 13 on the list, and this compares to Ireland as number 1, Swedenas number 6, Finland as number 7, and Denmark as number 8 (seeAppendix Table A2.6). As for share of high-technology products withinexports, Norway does not score particularly high either. The 1999 level of3.91 per cent is well below Finland, Sweden and Denmark (see AppendixTable A2.6). Again it could be noted that these figures are special inNorway’s case, since they refer to the average and not to particular niches
Norway 307

such as oil drilling equipment or aquaculture equipment, where we wouldexpect considerably higher figures.
There has been a gradual increase in the amount of FDI in theNorwegian stock market since the 1980s, and as of 2003 it accounts for over20 per cent. In comparative terms, however, this figure is far below Sweden(47.5 per cent), Denmark (36.1 per cent) and Finland (28.6 per cent). Itcould however be added that Norway ranked as number 2 on UNCTAD’sInward FDI Potential Index, 2000–2002 (p. 15) after the USA (number 1),but before, for example, Singapore (4), Ireland (7), Sweden (10), theNetherlands (11), Hong Kong (12), Finland (13), Korea (18), Denmark(19) and Taiwan (21) (UNCTAD, 2004, p. 15). Value-added to Norwegianmanufacturing industry by foreign interests increased from under 10 percent in 1991 to over 25 per cent in 2000. In 1999, the value-added by theseforeign affiliates was spread over several sectors, with the main ones beingpharmaceuticals (89 per cent), electrical machinery (47 per cent), chemicalproducts (38 per cent) and petroleum products (32 per cent).
As for outward FDI stocks as a percentage of GDP, the increase has beenconsiderably steeper, whereas the comparative situation is that Norway,with its 18.4 per cent as of 2003, is far behind Sweden (62.7 per cent),Finland (42.4 per cent) and Denmark (36.6 per cent) (see Appendix TableA2.6). Here one could add that the Petroleum Fund instituted in 1990 andstarting its overseas investment activities in 1996 (see Section 4.3.3) isbound to contribute to changes of these figures and rankings provided theinstitutional framework for the fund remain.
Regarding knowledge inputs to innovation, Norway ranks very high onoutward student mobility. In 2001, 6.9 per cent of the students studied atuniversities outside Norway. Foreign students studying in Norway haveincreased from around 3 per cent to over 4 per cent during the 1998–2001period. Present policies and immigration rules, however, are not designedto encourage these students to remain in Norway (KUF, 2000). Graversenet al. (2003) suggest that the main flow when it comes to migration amongthe Scandinavian countries is not knowledge workers, but rather tradespeople, and that most of the migration between the Scandinavian countriesis short-term.
Regarding support services for innovating firms, more specificallyfinancing, there has been an increase in the number of transnationalsyndicates in the private equity market, mostly resulting in Norwegiancapital being invested abroad. VC raised from foreign sources amountedto 4 per cent in 2001, 6 per cent in 2002 and 26 per cent in 2003 (EVCA,2003), whereas the comparable figure for most other European countrieswas approximately 50 per cent in the 1997–2001 period (Baygan, 2003,p. 11).
308 Slow growth countries

7 STRENGTHS AND WEAKNESSES OF THESYSTEM AND INNOVATION POLICIES
7.1 Strengths and Weaknesses
Norway’s high competence level and industrial specialization pattern arepredominantly related to resource extraction and to transportation-relatedservices (mainly shipping). It has recently been argued that the NSI heavilydepends on these trajectories, and is being ‘locked into’ their needs (Narula,2002). The trend within scientific specialization also reflects such a view.There is a correlation between specialization in some scientific fields and thecountry’s industrial strengths. Furthermore, most of Norwegian patentingis related to activities taking place in sectors such as shipbuilding, machinetools, pumps/turbines, oil rigs and drilling techniques. Norway also showsa competitive publication advantage in geosciences related to oil explo-ration. These are technologies applied in sectors characterized as low- andmedium–low-technology fields, which have been dominating the structureof the Norwegian manufacturing industry for a long period of time. Here,Norway seems to do very well.
Strengths are also found for example in relatively high numbers of start-up firms and entrepreneurship, high enrolment and graduation rates withinthe education system, a developed banking sector, as well as a regionalsystem of providing advice and grants to entrepreneurs. Both public andprivate actors contribute to seed capital funds, and there is a growingnumber of increasingly professional venture capitalists. Public and privateactors cooperate in providing incubator facilities with good regional linksand contact with most of the academic environments. Finally, the level ofinnovation collaboration is very high in Norway.5
As for weaknesses, we have found a slight negative trend in the propen-sity to innovate during 1994–97 as well as during 1998–2001. Norway alsoshows a relatively low innovation intensity and R&D intensity compared tothe other Nordic countries. However, we know that in relation to popula-tion size, Norway’s provision of R&D is close to the OECD average. Afurther reason for the low propensity to innovate is the existence of manySMEs without much tradition of R&D. In addition, some large firms arewithin low- and low–medium-tech industries.
Related to high-technology fields, we have seen that the country alreadyperforms low in physics and computer science publication output. In highereducation, a low performance in mathematics threatens the country’sability to educate sufficient numbers of scientists and engineers.
Other weaknesses include the investment climate and structural rigidity.Investments in innovation (both VC and seed funding) are concentrated
Norway 309

around the expansion phase of new firm developments, and there is limitedavailability of risk capital, particularly when it comes to larger projects inurban areas. This pattern of investment has contributed to a situationwhere there is only a small number of new high growth firms and fewNTBFs. The Norwegian incubators are very small by European standards,and many are only now moving their focus from property development toinnovation. At this stage, many of the incubators still have vague aimsand are not directed towards particular sectors. In comparison with othercountries, little has been done in the area of competitive incentives in orderto encourage investment or to facilitate the early-phase development ofnew firms.
The prominent position of the semi-public research institutes is of anambiguous nature. On the one hand they may serve pragmatic buffer andsystemic ‘lubrication’ functions (Nerdrum and Gulbrandsen, 2006) andconstitute a strength, while they may at the same time serve as a disincen-tive to firms developing competitive in-house or firm-to-firm collaborativeR&D activities.
7.2 Summary and Evaluation of the Innovation Policy Pursued
Wicken (2000) and Remøe et al. (2004, pp. 10–20) suggest that Norwegianinnovation policies have evolved from a ‘1st generation innovation policy’(Lengrand et al., 2002) during circa 1946 to the 1970s, where innovationwas conceived of as a linear progression from basic science to appliedtechnology, through two distinct stages of a ‘2nd generation policy’ duringthe 1980s and 1990s focused on the interactive aspects of the innovationprocess.
The first stage of the second-generation era (1978–92) had a strong tech-nology focus where new technology came to be recognized as the mostimportant factor in creating economic growth. Targeted areas were ICT,biotechnology, materials technology, aquaculture and offshore technology.The second stage of the second-generation era must be seen in relation tothe economic context of the very end of the 1980s and the beginning of the1990s, when Norway had problems with increasing unemployment, loweroil prices, stagnation within the farmed salmon market and problems withthe development of high-technology industries. Accordingly, priority wasno longer to be given to selected sectors. Although there were some mainareas of focus (marine research, ICT, medicine and health, and energy andenvironment), the new policy aimed at improving the general performancein all firms with innovation potential. The numerous R&D and innovationpromotion organizations were collected into two major organizations, atthe same time as more funds and grants for development of the industries
310 Slow growth countries

became available. In a White Paper on R&D policy (KUF, 1998), thecentral objective was to reach the average OECD level (3 per cent) of R&Dexpenditures in relation to GDP before 2005. This goal was to be reachedby means of a considerable escalation in public expenditure, partly throughthe establishment of a research and innovation fund. At the same time, theprivate sector was to be stimulated to invest in R&D.
During the early 2000s, there have been attempts at implementing abroader ‘3rd generation policy’ (Remøe et al., 2004) in the form of anoutline for a ‘holistic innovation policy’ (NHD, 2003b), followed up by anew R&D policy (UFD, 2005a) building directly on the initiative of severalyears before (KUF, 1998). The priority areas of the ‘holistic innovationpolicy’ are the development and maintenance of educational organizationsthat produce and disseminate relevant knowledge on a high internationallevel, better competence in natural sciences and mathematics, strengthen-ing of lifelong learning and the capacity of firms to apply knowledge inpractice, and increase of knowledge flows between industry and milieus ofknowledge and competence – regionally, nationally and internationally(Remøe et al., 2004, p. 68). Furthermore, ‘research, development, and com-mercialization’ included aims such as working to get Norway to the OECDgross expenditure on R&D average by 2005, improving quality and inter-nationalization in Norwegian research, stimulating increased research inthe private sector through a tax deduction scheme, encouraging commer-cialization of results of research and promoting better interaction betweenknowledge organizations and private industrial actors. In concrete andpost-White Paper terms, a programme for centres for research-based innov-ation started in 2006, supplementing the centres for excellence and centresof expertise programmes that had started in 2003. A programme for ‘indus-trial PhDs’ based on a Danish predecessor was also suggested and is as of2006 in the process of being implemented (Kallerud et al., 2006, p. 29).6
However, and as Remøe et al. (2004, p. 20) point out, it is questionablewhether the holistic policy constitutes a departure from previous policies. Itis a third-generation policy mainly in the sense that innovation concerns nowpermeate other policy areas, while the policy is very vague when it comes tomore concrete measures regarding any changes of framework conditions andinfrastructure. The relationship between the political system and demandaspects, which is another key point of a third-generation policy (Arnold,2004), are absent from the policy proposition.
The 2005 ‘Commitment to Research’ (UFD, 2005a) is in essence centredon the goal of achieving 3 per cent R&D expenditure as seen in relation toGDP, with the new target date set to 2010. Basic priorities include inter-nationalization, increased focus on natural sciences when it comes to basicresearch, and research-based innovation within both the public and the
Norway 311

private sectors. The four thematic areas continued more or less from the late1990s policy are energy and environment, health, marine activities andfood, and the three technological areas of nano-/materials technology,biotechnology and ICT are in addition specified as supporting the overalltargeted areas.
In this rather ambitious policy, the relationship between maintaining abroad orientation simultaneous with specialization is explained as a two-level relationship. The country must on one level be able to understand andmake use of a broad range of research results from other countries,although the prerequisites for it being in the lead within these fields are notpresent. In addition to this, Norway should exploit national advantagesand take responsibility within research areas where the country has suchprerequisites (UFD, 2005a, pp. 24 and 28–9). In these respects, the 2005‘Commitment to Research’ (UFD, 2005a) demonstrates a strong belief inresearch-driven innovation.7
7.3 Future Innovation Policy
The Norwegian government as well as business community is at a water-shed when it comes to the formulation and implementation of innovationpolicy for the coming years. The main issues of this watershed are twofold.First, there is the issue of deciding between a broad versus a more targetedapproach in a technical sense. In addition to general upgrading, the gov-ernment has proposed targeted areas for further development. In the caseof general upgrading as the main and underlying philosophy, there is a needto further formulate the conditions under which general upgrading is totake place. In other words, if the rationale is that heterogeneity leads toincreased output and that a subsequent core strategy is to foster hetero-geneity by way of having broad and multiple targets, this must be stated inan explicit way. In the case of targeted areas, one might want to ask whetherthey are too broad and ambitious for a small country such as Norway. Onealso might want to ask whether the technical focus areas are the right onesin the sense that they are only partly connected to past areas of strength,and instead mainly preoccupied with the fostering of new and hithertolargely unknown areas.
Second, there may also be an issue of prioritizing between innovationand growth issues in a narrow sense, and broader issues such as regional,environmental and welfare development. Of course, these two areas ofconcern need not constitute a contradiction in essence. It may perfectly wellbe possible to combine, for example, regional development with growth andinnovation. However, the supposed symbiosis between innovation on theone hand, and regional, environmental and welfare development on the
312 Slow growth countries
other hand, is, in our interpretation, more assumed than proven. In such asituation, there is a high risk that the development of a critical mass willsuffer, since there is a risk of compromises in the form of broad distribu-tion of funds rather than serious pursuit of actual and ‘deserved’ needs.
Indeed, one might be able to argue that the Norwegian economy canafford to maintain a broad approach in both of the senses referred to above,at least in the near to medium term. We are, however, convinced that it willbecome necessary to face some unpleasant prioritizing tasks. We sum upthe main alternative options as follows:
1. Increased attention to the possibilities of further and advancedexploitation of the existing trajectories, such as oil and gas extractionsector as part of a scale-intensive trajectory and fisheries/aquacultureas part of a supplier-based trajectory.
2. Examining the realism and need for specific percentage ‘push’ goalswhen it comes to R&D expenditure, and rather devising sectoral ‘pull’goals.
3. Abolition of the general and integrated approach consisting of includ-ing multiple aims within one and the same policy, and instead devisingcompetitive instruments where such symbiosis may (or may not) bepart of the end result.
First, current policy seems to be ‘high-tech biased’ (see Section 5) in thesense that it is overly concerned with the need to develop a set of so-callednew technologies as the basis for the knowledge society in Norway, andthereby trying to fill purported ‘gaps’ between the low-tech status of theNorwegian system and high-tech areas. This may distract attention frominnovation potential in the predominantly low-tech areas. Policy mightinstead have greater promise when focusing more on innovation in low-techsectors in line with the argument posed by von Tunzelmann and Acha(2004). In the case of Norway, the low-tech and the medium–low-techsectors are certainly such fields.
Second, current R&D and innovation policy is, as reviewed, mainlycentred on the specific numerical goal of reaching a certain level as com-pared to the OECD average. Apart from representing a partial reversion tothe linear way of perceiving the innovation process, such a strategy may beside-stepping the real problems addressed in our chapter. Indeed, financingis necessary and welcomed by the public and private sectors alike, but todesign the entire R&D policy around this goal reflects a push-type philos-ophy. Instead, differentiated intermediate goals should be set where eachtargeted area or sector may be envisioned as reaching certain levels ofexpenditure at certain dates, but where these goals may be adjusted or even
Norway 313

abandoned along the way according to performance criteria. Whether theend aggregate level is higher than, lower than, or exactly 3 per cent of GDPthus becomes less relevant than the content of the expenditure. Such analternative strategy may have an additional strength in the sense that it willbe forced to deal with the business financing part of the 3 per cent goal ina more direct as well as pragmatic way than as within current policy.Current policy expects business to partake in reaching the 3 per cent goalby being responsible for circa two-thirds of the expenditures, somethingthat must be confronted as a rather unrealistic goal in view of past historyand current structure of Norwegian business and its R&D expenditurepatterns.
Third and similarly, a general and integrated approach consisting inincluding multiple aims, such as innovation and growth concerns integratedwith regional development concerns, within one and the same policy maybe admirable in itself. It is not entirely clear, however, that integration ofaims is the most efficient means of achieving optimal results. Measuresdirected at enhancing innovation output should be designed and directedprimarily towards this objective on competitive terms in order to avoid thefinancing of ‘mediocre’ projects and firms. Such an alternative and com-petitive approach may indeed have one or several weaknesses, including theadministrative costs. We are, however, convinced that drastic measures areneeded within this realm if there is to be significant progress.
ACKNOWLEDGEMENTS
We would very much like to thank the interview respondents for their timeand help, Ingunn Steinsland Kristiansen and Martin Srholec for theircrucial assistance regarding data preparation in Section 3, the ResearchCouncil of Norway for funding (grant no. 148191/510) and CharlesEdquist, Jan Fagerberg, Leif Hommen, Svein Olav Nås, Annika Rickne,Kung Wang and Olav Wicken for comments on early drafts.
LIST OF INTERVIEWEES
Marianne Botten, Project Manager, SIVA.Henning Qvale, Manager of Qubator AS, previously manager of Kampus
Kjeller Science Park.Lars Monrad Krohn, Manager of training programme for entrepreneurs
Grunderskolen and adviser at Oslo Research Park.
314 Slow growth countries

NOTES
1. An extended discussion of the various hypotheses on innovation intensity is given inSection 5.
2. Higher education is defined as four years or more with education at the university orcollege level.
3. Cf. also Kallerud et al. (2006, p. 58) for recent figures confirming this situation withspecial reference to SMEs.
4. Stambøl (2005) bases his figures on the accumulation of NACE codes 642, 72, 671–672,73 and 74. Other comparative measurements (Eurostat, 2005) state the share of employ-ment as considerably lower due to a much more narrow conception of the KIBS concept,and here the Norwegian level is stated as higher than in the Netherlands, but lower thanin Sweden, Finland and Denmark.
5. It may be noted that a crucial and long-standing part of networking programmes hasindeed been to create incentives for collaboration. We are indebted to Svein Olav Nås forthis observation.
6. For more detailed descriptions of recent and contemporary policy instruments, seeRemøe et al. (2004), Aanstad et al. (2005) and Kallerud et al. (2006).
7. At the time of completing this manuscript (2007) the government is in the process ofpreparing a White Paper on innovation, which may or may not include initiatives ofanother character when compared to those described here.
REFERENCES
Aanstad, S., P. Koch and A. Kaloudis (2005), European Trend Chart on Innovation:Annual Innovation Policy Trends and Appraisal Report Norway 2004–2005,Brussels: European Commission.
Archibugi, D. (2001), ‘Pavitt’s taxonomy sixteen years on: a review article’,Economics of Innovation and New Technology, 10, 415–25.
Arnold, E. (2004), ‘Evaluating research and innovation policy: a systems worldneeds systems evaluations’, Research Evaluation, 13(1), 3–17.
Askevold, E.O., T. Halvorsen, T. Laudal and J.M. Steineke (2003), ‘Norske forsk-ningsparker: mot en bedre organisert nyskaping?’, RF-2003/174, Stavanger:Rogalandsforskning.
Aslesen, H.W. (2004), ‘Knowledge intensive service activities and innovation in theNorwegian aquaculture industry: part project report from the OECD KISAstudy’, STEP Report 05, 2004, Oslo: STEP.
Bank of Norway (2003), Årsrapport om Betalingsformidling 2003, Oslo: NorgesBank.
Baygan, G. (2003), ‘Venture capital review Norway’, STI Working Paper 2003/17,Industry Issues, Paris: OECD.
Benner, M. (2003), ‘The Scandinavian challenge: the future of advanced welfarestates in the knowledge economy’, Acta Sociologica, 46(2), 132–49.
Bøhren, Ø. and B.A. Ødegaard (2003), ‘Norsk eierskap: Særtrekk og sære trekk’,Praktisk økonomi og finans, 20, 3–17.
Borch, O.J. et al. (2002), ‘Kapitalmarkedet for nyetablerte foretak: en studie av etter-spørsels- og tilbudssiden’, KPB-rapport 1/2002, Oslo: KPB.
Broch, M. and A. Isaksen (2004), ‘Knowledge intensive service activities and innov-ation in the Norwegian software industry: part project report from the OECDKISA study’, STEP Report 03/2004, Oslo: STEP.
Norway 315

Cumbers, A. (2000), ‘The national state as mediator of regional development out-comes in a global era: a comparative analysis from the UK and Norway’,European Urban and Regional Studies, 7(3), 237–52.
Eurostat (2005), Employment in Knowledge-intensive Service Sectors: Share of TotalEmployment (%), Brussels: Eurostat.
Eurostat (2007), Business Demography – Survival Rate, Brussels: Eurostat.EVCA (2002), European Venture Capital Association Year Book 2002, Brussels:
EVCA.EVCA (2003), European Venture Capital Association Year Book 2003, Brussels:
EVCA.European Commission (2005), European Innovation Scoreboard 2005, Brussels:
European Commission.FD (2004), Kapitaltilgang og økonomisk utvikling: rapport fra ekspertgruppen som
har vurdert Norges kapitalstyrke, Oslo: FD.Graversen, E. et al. (2003), ‘Migration between the Nordic countries: what do reg-
ister data tell us about the knowledge flows?’, STEP Report 10/2003, Oslo: STEP.Grønning, T., E. Dobos, M. Knell, D.S. Olsen and B.K. Veistein (2006), ‘Norway’,
in C.M. Enzing (ed.), Innovation in Pharmaceutical Biotechnology: ComparingNational Innovation Systems at the Sectoral Level, Paris: OECD, pp. 86–95.
Hansen, T.B., T. Karlsson and H. Godø (2005), ‘Evaluation of the DEMO 2000program’, NIFU STEP Report 7/2005, Oslo: NIFU STEP.
Havnes, P.-A. (2003), ‘Ni norske inkubatorer: midtveis gjennomgang av første puljei SIVAs program’, AgderForskning FoU Report 6/2003, Kristiansand:AgderForskning.
Hodne, F. and O.H. Grytten (1992), Norsk økonomi 1900–1990, Oslo: Tano.Huber, E. and J.D. Stephens (1998), ‘Internationalization and the social democratic
model: crisis and future prospects’, Comparative Political Studies, 31(3), 353–97.Innovation Norway (2004), ‘Tilsagn til nyskaping, og totalt 1994–2003’, unpub-
lished report on resources allocated to establishment of new firms, advice onentrepreneurship etc. per region in the period 1994–2003, Oslo: InnovationNorway.
INTSOK (2005), INTSOK’s home page http://www.intsok.no/, accessed in May2005.
Kallerud, E., J. Hauknes and P. Koch (2006), European Trend Chart on Innovation:Annual Innovation Policy Trends and Appraisal Report Norway 2006, Brussels:European Commission.
Kolvereid, L. and G.A. Alsos (2003), Entreprenørskap i Norge 2002: GlobalEntrepreneurship Monitor, Bodø: Handelshøgskolen i Bodø.
KRD (2003), ‘Storbymeldingen: om utvikling av storbypolitikk’, St.meld. nr. 31(2002–2003), Oslo: KRD.
KUF (1998), ‘Forskning ved et tidsskille’, St meld nr 39 (1998–99), Oslo: KUF.KUF (2000), ‘Frihet med ansvar: om høgre utdanning og forskning i Norge’, NOU
2000/14, Oslo: KUF.Kuhlman, S. and E. Arnold (2001), ‘RCN in the Norwegian Research and
Innovation System’, Report to Ministry of Church, Education and ResearchAffairs, Oslo: KUF.
Lengrand, L. and Associés, PREST and ANRT (2002), ‘Innovation tomorrow:innovation policy and the regulatory framework: making innovation an integralpart of the broader structural agenda’, Innovation Paper No. 28, EuropeanCommission Directorate-General for Enterprise, Brussels: European Commission.
316 Slow growth countries

Matson, E. (2005), ‘Deregistrering og videreføring av nye teknologifirma’, Beta, 2,63–77.
Moen, E. (2002), ‘Globalisering og industripolitiske strategier: en sammenligningmellom Finland og Norge’, Makt- og demokratiutredningens rapportserie, Oslo:Makt- og demokratiutredningen.
Moen, E. (2005), ‘ “Næringsnøytralitet” eller næringsavvikling? Norsk olje-økonomi, næringsutvikling og næringspolitikk i et politisk-institusjonelt per-spektiv’, BI Discussion Paper 1/2005, Oslo: BI.
Munch, A.T. ( 2007), ‘SkatteFUNN begrenses’, Bladet Forskning, 15(1), 10.Narula, R. (2002), ‘Innovation systems and “inertia” in R&D location: Norwegian
firms and the role of systemic lock-in’, Research Policy, 31, 795–816.Nås, S.O., T. Sandven et al. (2003a), ‘High-tech spin-offs in the Nordic countries’,
STEP Report 23/2003, Oslo: STEP.Nås, S.O., T. Sandven et al. (2003b), ‘High-tech spin-offs in the Nordic countries:
statistical annex’, STEP report 22/2003, Oslo: STEP.Nås, S.O. and J. Hauknes (2004), ‘Er det FoU vi skal leve av?, Forskningspolitikk, 27(2).Nerdrum, L. and M. Gulbrandsen (2006), ‘The research institutes in the Norwegian
innovation system’, Paper to TIK-Centre Innovation Seminar, Oslo: Universityof Oslo.
NFR (2003), Det Norske Forsknings- og innovasjonssystemet – statistikk og indika-torer 2003, Oslo: Norges Forskningsråd.
NFR (2005), Det Norske Forsknings- og innovasjonssystemet – statistikk og indika-torer 2005, Oslo: Norges Forskningsråd.
NHD (1997), ‘Offentlige Anskaffelser’, NOU 1997 (21), Oslo: NHD.NHD (2001), ‘Best i test? Referansetesting av rammevilkår for verdiskaping i
næringslivet’, NOU 2001 (29), Oslo: NHD.NHD (2003a), eNorway Status Report, January 2003, Oslo: NHD.NHD (2003b), Plan fra idé til verdi: regjeringens plan for en helhetlig innovasjons-
politikk, Oslo: NHD.NHD (2004), ‘Evaluering av regelverket for offentlige anskaffelser’, Report H2004-
019, Oslo: Asplan Viak.NVCA (2001), Activity in the Norwegian VC-market 2001, Oslo: NVCA.OECD (2004a), Economic Survey Norway 2004, Paris: OECD.OECD (2004b), Learning for Tomorrow’s World: First Results from PISA 2003,
Paris: OECD.OECD (2005), Main Science and Technology Indicators, Paris: OECD.OECD (2006), Economic Policy Reforms: Going for Growth, Structural Policy
Indicators and Priorities in OECD Countries, Paris: OECD.Olsen, O.-E. and F. Sejersted (eds) (1997), Oljevirksomheten som teknologiutviklings-
prosjekt, Oslo: AdNotam Gyldendal.Ørstavik, F. (2000), ‘Innovasjoner – suksesser. Identifiserte innovasjoner 3 år etter’,
STEP report 11/ 2000, Oslo: STEP.Pavitt, K. (1984), ‘Sectoral patterns of innovation: towards a taxonomy and a
theory’, Research Policy, 13, 343–74.Pinder, D. (2001), ‘Offshore oil and gas: global resource knowledge and technolog-
ical change’, Ocean & Coastal Management, 44, 579–600.Remøe, S.O., M. Fraas, A. Kaloudis, Å. Mariussen, R. Røste, F. Ørstavik and
S. Aanstad (2004), ‘Governance of the Norwegian innovation policy system:contribution to the MONIT collaborative project for the OECD’, NIFU STEPReport 6/2004, Oslo: NIFU STEP.
Norway 317

Rothwell, R. (1994), ‘Issues in user–producer relations in the innovation process:the role of government’, International Journal of Technology Management,9(5/6/7), 629–49.
Sejersted, F. (1993), Demokratisk kapitalisme, Oslo: Universitetsforlaget.SIVA (2002), Inkubator April 2002, Oslo: SIVA.SIVA (2004), Norske og internasjonale inkubatorer: Inkubator undersøkelser i andre
land sammenholdt med norske forhold, Oslo: SIVA.Skogli, E. (1998), ‘Offshore engineering, consulting and innovation’, STEP WP
A-04-1998, Oslo: STEP.Srholec, M. and T. Grønning (2006), ‘Sectoral patterns of innovation in Norway’,
paper to TIK-Centre Innovation Seminar, Oslo: University of Oslo.Stambøl, L.S. (2005), Urban and Regional Labour Market Mobility in Norway,
Oslo: Statistics Norway.Statistics Norway (1995), Historical Statistics 1994, Oslo: Statistics Norway.Statistics Norway (2001), Innovation Statistics in the Business Enterprise Sector
2001, Oslo: Statistics Norway.Statistics Norway (2007), 470 000 bedrifter i Norge ved årsskiftet, Oslo: Statistics
Norway.Sydnes, T. and K. Halvorsen (2003), Evaluering av Såkornordningen, Oslo: NHD.UFD (2002), Om lov om endringer i lov 12. mai 1995 nr. 22 om universiteter og
høgskoler og lov 2. juli 1999 nr. 64 om helsepersonell: ot.prp. nr. 40 (2001–2002),Oslo: UFD.
UFD (2005a), Vilje til forskning: st.meld. nr. 20 (2004–2005), Oslo: UFD.UFD (2005b), Realfag, naturligvis! Strategi for styrking av realfagene 2002–2007,
Oslo: UFD.UNCTAD (2004), World Investment Report 2004, Geneva: UNCTAD.von Tunzelmann, N. and V. Acha (2004), ‘Innovation in “low-tech” industries’, in
J. Fagerberg, D.C. Mowery and R. Nelson (eds), The Oxford Handbook ofInnovation, Oxford and New York: Oxford University Press.
Wicken, O. (2000), ‘Forskning, næringsliv og politikk: en historisk fremstilling avnorsk næringslivsforskning og politikk’, Senter for teknologi, innovasjon ogkultur arbeidsnotat 6/2000, Oslo: University of Oslo.
318 Slow growth countries