Predicting change trajectories of neuroticism from baseline ...
10
1 SCIENTIFIC REPORTS | (2020) 10:1207 | https://doi.org/10.1038/s41598-020-58128-x www.nature.com/scientificreports Predicting change trajectories of neuroticism from baseline brain structure using whole brain analyses and latent growth curve models in adolescents Simone Kühn 1,2,22 , Anna Mascherek 1,22* , Tobias Banaschewski 3 , Arun L. W. Bokde 4 , Christian Büchel 5 , Erin Burke Quinlan 6 , Sylvane Desrivières 6 , Herta Flor 7,8 , Antoine Grigis 9 , Hugh Garavan 10 , Penny Gowland 11 , Andreas Heinz 12 , Bernd Ittermann 13 , Jean-Luc Martinot 14 , Marie-Laure Paillère Martinot 15 , Frauke Nees 3,7 , Dimitri Papadopoulos Orfanos 9 , Tomáš Paus 16 , Luise Poustka 17,18 , Sabina Millenet 3 , Juliane H. Fröhner 19 , Michael N. Smolka 19 , Henrik Walter 12 , Robert Whelan 20 , Gunter Schumann 6 , Ulman Lindenberger 2,21 & Jürgen Gallinat 1 Adolescence is a vulnerable time for personality development. Especially neuroticism with its link to the development of psychopathology is of interest concerning influential factors. The present study exploratorily investigates neuroanatomical signatures for developmental trajectories of neuroticism based on a voxel-wise whole-brain structural equation modelling framework. In 1,814 healthy 1 University Medical Center Hamburg-Eppendorf, Department of Psychiatry and Psychotherapy, Martinistrasse 52, 20246, Hamburg, Germany. 2 Lise Meitner Group for Environmental Neuroscience, Max Planck Institute for Human Development, Berlin, Germany. 3 Department of Child and Adolescent Psychiatry and Psychotherapy, Central Institute of Mental Health, Medical Faculty Mannheim, Heidelberg University, Square J5, 68159, Mannheim, Germany. 4 Discipline of Psychiatry, School of Medicine and Trinity College Institute of Neuroscience, Trinity College Dublin, Dublin, Ireland. 5 University Medical Centre Hamburg-Eppendorf, House W34, 3.OG, Martinistr. 52, 20246, Hamburg, Germany. 6 Medical Research Council - Social, Genetic and Developmental Psychiatry Centre, Institute of Psychiatry, Psychology & Neuroscience, King’s College London, London, United Kingdom. 7 Department of Cognitive and Clinical Neuroscience, Central Institute of Mental Health, Medical Faculty Mannheim, Heidelberg University, Square J5, Mannheim, Germany. 8 Department of Psychology, School of Social Sciences, University of Mannheim, 68131, Mannheim, Germany. 9 NeuroSpin, CEA, Université Paris-Saclay, F-91191, Gif-sur-Yvette, France. 10 Departments of Psychiatry and Psychology, University of Vermont, 05405, Burlington, Vermont, USA. 11 Sir Peter Mansfield Imaging Centre School of Physics and Astronomy, University of Nottingham, University Park, Nottingham, United Kingdom. 12 Department of Psychiatry and Psychotherapy, Campus Charité Mitte, Charité, Universitätsmedizin Berlin, Charitéplatz 1, Berlin, Germany. 13 Physikalisch-Technische Bundesanstalt (PTB), Braunschweig and Berlin, Germany. 14 Institut National de la Santé et de la Recherche Médicale, INSERM Unit 1000 “Neuroimaging & Psychiatry”, University Paris Sud, University Paris Descartes - Sorbonne Paris Cité; and Maison de Solenn, Paris, France. 15 Institut National de la Santé et de la Recherche Médicale, INSERM Unit 1000 “Neuroimaging & Psychiatry”, University Paris Sud, University Paris Descartes - Sorbonne Paris Cité; and AP-HP, Department of Adolescent Psychopathology and Medicine, Maison de Solenn, Cochin Hospital, Paris, France. 16 Bloorview Research Institute, Holland Bloorview Kids Rehabilitation Hospital and Departments of Psychology and Psychiatry, University of Toronto, Toronto, Ontario, M6A 2E1, Canada. 17 Department of Child and Adolescent Psychiatry and Psychotherapy, University Medical Centre Göttingen, von-Siebold-Str. 5, 37075, Göttingen, Germany. 18 Clinic for Child and Adolescent Psychiatry, Medical University of Vienna, Währinger Gürtel 18-20, 1090, Vienna, Austria. 19 Department of Psychiatry and Neuroimaging Center, Technische Universität Dresden, Dresden, Germany. 20 School of Psychology and Global Brain Health Institute, Trinity College Dublin, Dublin, Ireland. 21 Max Planck UCL Centre for Computational Psychiatry and Ageing Research, London, United Kingdom. 22 These authors contributed equally: Simone Kühn and Anna Mascherek. *email: [email protected] OPEN
-
Upload
khangminh22 -
Category
Documents
-
view
0 -
download
0
Transcript of Predicting change trajectories of neuroticism from baseline ...
1Scientific RepoRtS | (2020) 10:1207 | https://doi.org/10.1038/s41598-020-58128-x
www.nature.com/scientificreports
predicting change trajectories of neuroticism from baseline brain structure using whole brain analyses and latent growth curve models in adolescentsSimone Kühn1,2,22, Anna Mascherek 1,22*, Tobias Banaschewski 3, Arun L. W. Bokde4, Christian Büchel5, Erin Burke Quinlan6, Sylvane Desrivières 6, Herta flor7,8, Antoine Grigis9, Hugh Garavan10, Penny Gowland11, Andreas Heinz12, Bernd ittermann13, Jean-Luc Martinot14, Marie-Laure Paillère Martinot15, Frauke nees3,7, Dimitri papadopoulos orfanos9, Tomáš paus16, Luise poustka17,18, Sabina Millenet3, Juliane H. fröhner19, Michael N. Smolka 19, Henrik Walter 12, Robert Whelan20, Gunter Schumann6, Ulman Lindenberger 2,21 & Jürgen Gallinat1
Adolescence is a vulnerable time for personality development. Especially neuroticism with its link to the development of psychopathology is of interest concerning influential factors. The present study exploratorily investigates neuroanatomical signatures for developmental trajectories of neuroticism based on a voxel-wise whole-brain structural equation modelling framework. In 1,814 healthy
1University Medical Center Hamburg-Eppendorf, Department of Psychiatry and Psychotherapy, Martinistrasse 52, 20246, Hamburg, Germany. 2Lise Meitner Group for Environmental Neuroscience, Max Planck Institute for Human Development, Berlin, Germany. 3Department of Child and Adolescent Psychiatry and Psychotherapy, Central Institute of Mental Health, Medical Faculty Mannheim, Heidelberg University, Square J5, 68159, Mannheim, Germany. 4Discipline of Psychiatry, School of Medicine and Trinity College Institute of Neuroscience, Trinity College Dublin, Dublin, Ireland. 5University Medical Centre Hamburg-Eppendorf, House W34, 3.OG, Martinistr. 52, 20246, Hamburg, Germany. 6Medical Research Council - Social, Genetic and Developmental Psychiatry Centre, Institute of Psychiatry, Psychology & Neuroscience, King’s College London, London, United Kingdom. 7Department of Cognitive and Clinical Neuroscience, Central Institute of Mental Health, Medical Faculty Mannheim, Heidelberg University, Square J5, Mannheim, Germany. 8Department of Psychology, School of Social Sciences, University of Mannheim, 68131, Mannheim, Germany. 9NeuroSpin, CEA, Université Paris-Saclay, F-91191, Gif-sur-Yvette, France. 10Departments of Psychiatry and Psychology, University of Vermont, 05405, Burlington, Vermont, USA. 11Sir Peter Mansfield Imaging Centre School of Physics and Astronomy, University of Nottingham, University Park, Nottingham, United Kingdom. 12Department of Psychiatry and Psychotherapy, Campus Charité Mitte, Charité, Universitätsmedizin Berlin, Charitéplatz 1, Berlin, Germany. 13Physikalisch-Technische Bundesanstalt (PTB), Braunschweig and Berlin, Germany. 14Institut National de la Santé et de la Recherche Médicale, INSERM Unit 1000 “Neuroimaging & Psychiatry”, University Paris Sud, University Paris Descartes - Sorbonne Paris Cité; and Maison de Solenn, Paris, France. 15Institut National de la Santé et de la Recherche Médicale, INSERM Unit 1000 “Neuroimaging & Psychiatry”, University Paris Sud, University Paris Descartes - Sorbonne Paris Cité; and AP-HP, Department of Adolescent Psychopathology and Medicine, Maison de Solenn, Cochin Hospital, Paris, France. 16Bloorview Research Institute, Holland Bloorview Kids Rehabilitation Hospital and Departments of Psychology and Psychiatry, University of Toronto, Toronto, Ontario, M6A 2E1, Canada. 17Department of Child and Adolescent Psychiatry and Psychotherapy, University Medical Centre Göttingen, von-Siebold-Str. 5, 37075, Göttingen, Germany. 18Clinic for Child and Adolescent Psychiatry, Medical University of Vienna, Währinger Gürtel 18-20, 1090, Vienna, Austria. 19Department of Psychiatry and Neuroimaging Center, Technische Universität Dresden, Dresden, Germany. 20School of Psychology and Global Brain Health Institute, Trinity College Dublin, Dublin, Ireland. 21Max Planck UCL Centre for Computational Psychiatry and Ageing Research, London, United Kingdom. 22These authors contributed equally: Simone Kühn and Anna Mascherek. *email: [email protected]
open
2Scientific RepoRtS | (2020) 10:1207 | https://doi.org/10.1038/s41598-020-58128-x
www.nature.com/scientificreportswww.nature.com/scientificreports/
adolescents of the IMAGEN sample, the NEO-FFI was acquired at three measurement occasions across five years. Based on a partial measurement invariance second-order latent growth curve model we conducted whole-brain analyses on structural MRI data at age 14 years, predicting change in neuroticism over time. We observed that a reduced volume in the pituitary gland was associated with the slope of neuroticism over time. However, no relations with prefrontal areas emerged. Both findings are discussed against the background of possible genetic and social influences that may account for this result.
The search for neural correlates as underlying foundation of personality has received reasonable attention in the field of personality neuroscience, where traits as one core aspect of personality are linked to underlying brain areas and function in order to understand personality and individual differences on ‘biological’ level1. The Five Factor Model of personality2,3 has generally been applied as theoretical taxonomy, comprising Neuroticism (i.e., being emotionally unstable, worried, and negative), Extraversion (i.e., being assertive), Openness to experience (reflect-ing a curiosity in novelty and distraction), Conscientiousness (i.e., being self-organized), and Agreeableness (i.e., being cooperative) as main traits. Although the Five Factor Model is historically as well as currently only one of many, it remains the most influential, ubiquitous, and most often applied theory in the scientific discourse. Broad consensus across theories can be found for Extraversion and Neuroticism, which are basically present in all theories, though differing in detail and exact labeling4–7. Of the five personality traits, neuroticism has been most intensively studied and is linked most clearly to brain structure8–11. It is also most consistently linked to psychopa-thology, especially depression and anxiety, but also to the development of posttraumatic stress disorder (PTSD)12. Different brain structural measures have been linked to personality, such as the volume of specific regions and cortical thickness9. Also, endocrinological aspects such as the relation between personality and cortisol levels in neurotic individuals have been evaluated13.
Neuroticism changes across the lifespan, with adolescence as a vulnerable time of developmental change. In general, results point towards maturation with neuroticism peaking in early adulthood and decreasing from then2,14. Depending on selected samples, different age profiles are described, despite the general similarity in shape of trajectories15–17. This is attributable to interindividual differences that are common in personality development18.
During adolescence multiple endocrinological changes occur, influencing behavioral, physical, emotional, and brain structural changes19,20. For neuroticism, the hypothalamic–pituitary–adrenal (HPA) axis activity and cortisol-levels as a proxy for HPA-activity, have been focused on. The HPA axis coordinates stress-reactions in an organism. The interplay of hypothalamus, pituitary gland, and adrenal gland (together forming the HPA axis) maintains the secretion of adrenocorticotropic hormone (ACTH) and cortisol, which regulate the system’s reac-tion to stress. A body of research shows that higher levels of neuroticism are associated with lower levels of cor-tisol13,21–23. However, also contradictory results emerge24 which may, not least, be due to the difficulty to assess cortisol level without confounders. Studies on the relation between brain structural aspects of the HPA-axis and its function are scarce to date.
Turning to neural correlates, adolescence is likewise a vulnerable time for brain structural development. With the onset of puberty, hormones drive changes in white and grey matter, most often measured by means of vol-ume, size of surface area, and cortical thickness19,20. Although there is no general answer to the developmental trajectories of grey and white matter, it might be best summarized that development of cortical grey matter fol-lows a nonlinear trajectory increasing across childhood, reaching a peak in adolescence and declining into early adulthood (cortical thinning) with lobe-specific differentiation25,26. For white matter integrity, increases across childhood and adolescence have been found until the 3rd or 4th decade followed by decline, hence, also generally following a nonlinear trajectory but delayed in time19,25,27–29. Neuroticism has been associated with reduced rates of cortical thinning. Ferschmann, et al.30 speculated that individuals higher in neuroticism might demonstrate slower rates of cortical maturation, that is, exhibit a thicker cortex compared to less neurotic individuals. In their study in a sample of participants aged 8–19 years, emotional stability was related to cortical thinning in the right superior temporal cortex, as well as in different prefrontal regions. Their study corroborates results from Riccelli, et al.31, but not Holmes, et al.32. A meta-analysis by Mincic9 on neuroanatomical correlates of negative emotionality-related traits showed that, most consistently, neuroticism was associated with reduced grey mat-ter in prefrontal areas, especially in the medial and lateral orbitofrontal cortex. Also, reduced grey matter was reported in the parietal cortex, whereas results for motor and premotor areas were mixed. Mixed results were also reported for subcortical structures, however, connections to the amygdala and hippocampal areas were reported. Abram and DeYoung8 summarized current knowledge concerning neural correlates of neuroticism similarly. Structural and functional magnetic resonance imaging (MRI)-studies repeatedly show relations between neu-roticism and regions within the prefrontal cortex and its connections to the amygdala. This region is involved in emotion-processing and the development of mood-disorders33.
In the present study we investigate the value of voxel-based whole-brain analyses at baseline in a structural equation modelling framework for the prediction of longitudinal change (i.e., predicting the slope) in neuroticism in a large sample of adolescents. Methodologically, this goes beyond previous analyses, as we apply whole-brain structural data as predictor for developmental change of a self-reported measure, instead of extracted regions of interests or global brain measures (intracranial volume, white matter hyperintensities). Despite the explorative nature of our analyses (whole-brain vs ROI), we expect to find smaller volumes in prefrontal areas, amygdala, and temporal lobe in neurotic individuals. We also expect that smaller volumes will predict less decrease in neurot-icism across time. We further speculate to find smaller hypothalamus and pituitary gland in individuals high in neuroticism, as this should be the structural analogue of lower cortisol levels.
3Scientific RepoRtS | (2020) 10:1207 | https://doi.org/10.1038/s41598-020-58128-x
www.nature.com/scientificreportswww.nature.com/scientificreports/
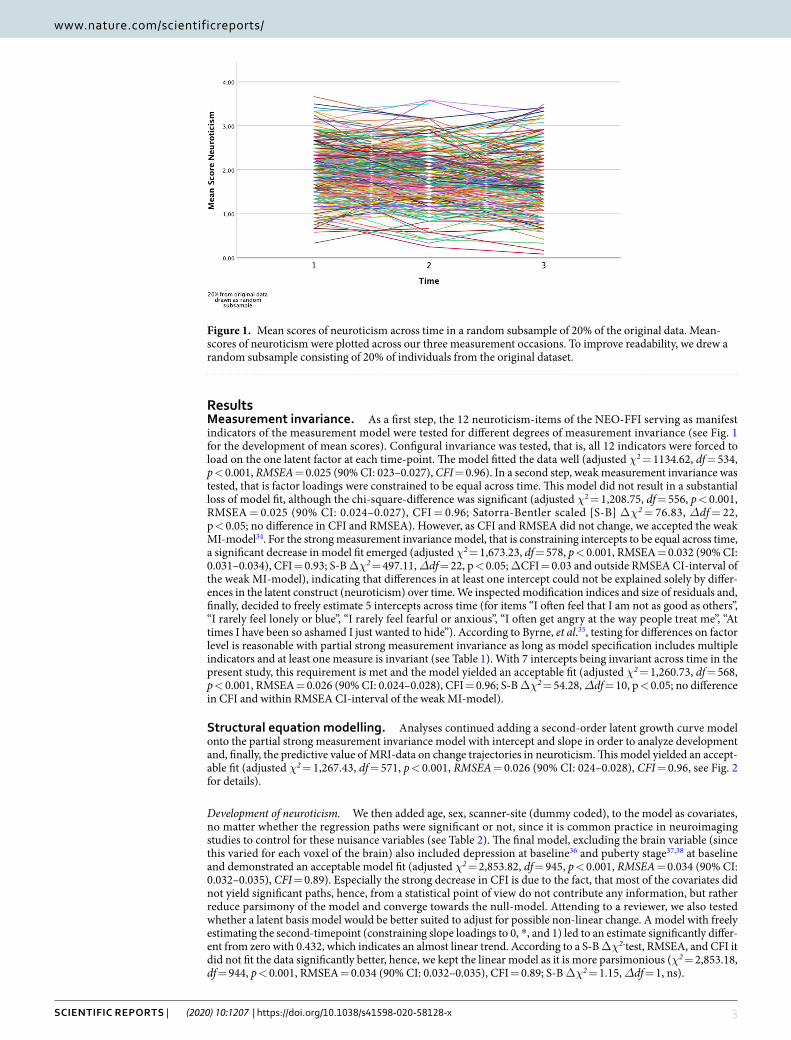
ResultsMeasurement invariance. As a first step, the 12 neuroticism-items of the NEO-FFI serving as manifest indicators of the measurement model were tested for different degrees of measurement invariance (see Fig. 1 for the development of mean scores). Configural invariance was tested, that is, all 12 indicators were forced to load on the one latent factor at each time-point. The model fitted the data well (adjusted χ2 = 1134.62, df = 534, p < 0.001, RMSEA = 0.025 (90% CI: 023–0.027), CFI = 0.96). In a second step, weak measurement invariance was tested, that is factor loadings were constrained to be equal across time. This model did not result in a substantial loss of model fit, although the chi-square-difference was significant (adjusted χ2 = 1,208.75, df = 556, p < 0.001, RMSEA = 0.025 (90% CI: 0.024–0.027), CFI = 0.96; Satorra-Bentler scaled [S-B] Δχ2 = 76.83, Δdf = 22, p < 0.05; no difference in CFI and RMSEA). However, as CFI and RMSEA did not change, we accepted the weak MI-model34. For the strong measurement invariance model, that is constraining intercepts to be equal across time, a significant decrease in model fit emerged (adjusted χ2 = 1,673.23, df = 578, p < 0.001, RMSEA = 0.032 (90% CI: 0.031–0.034), CFI = 0.93; S-B Δχ2 = 497.11, Δdf = 22, p < 0.05; ΔCFI = 0.03 and outside RMSEA CI-interval of the weak MI-model), indicating that differences in at least one intercept could not be explained solely by differ-ences in the latent construct (neuroticism) over time. We inspected modification indices and size of residuals and, finally, decided to freely estimate 5 intercepts across time (for items “I often feel that I am not as good as others”, “I rarely feel lonely or blue”, “I rarely feel fearful or anxious”, “I often get angry at the way people treat me”, “At times I have been so ashamed I just wanted to hide”). According to Byrne, et al.35, testing for differences on factor level is reasonable with partial strong measurement invariance as long as model specification includes multiple indicators and at least one measure is invariant (see Table 1). With 7 intercepts being invariant across time in the present study, this requirement is met and the model yielded an acceptable fit (adjusted χ2 = 1,260.73, df = 568, p < 0.001, RMSEA = 0.026 (90% CI: 0.024–0.028), CFI = 0.96; S-B Δχ2 = 54.28, Δdf = 10, p < 0.05; no difference in CFI and within RMSEA CI-interval of the weak MI-model).
Structural equation modelling. Analyses continued adding a second-order latent growth curve model onto the partial strong measurement invariance model with intercept and slope in order to analyze development and, finally, the predictive value of MRI-data on change trajectories in neuroticism. This model yielded an accept-able fit (adjusted χ2 = 1,267.43, df = 571, p < 0.001, RMSEA = 0.026 (90% CI: 024–0.028), CFI = 0.96, see Fig. 2 for details).
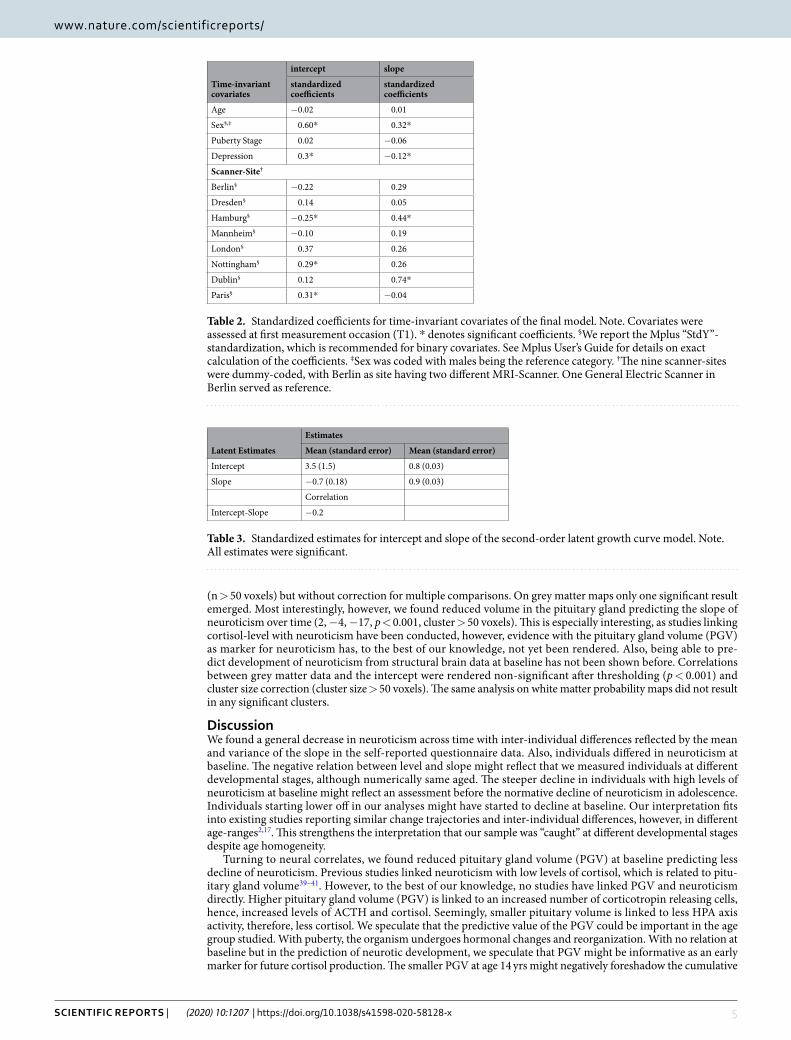
Development of neuroticism. We then added age, sex, scanner-site (dummy coded), to the model as covariates, no matter whether the regression paths were significant or not, since it is common practice in neuroimaging studies to control for these nuisance variables (see Table 2). The final model, excluding the brain variable (since this varied for each voxel of the brain) also included depression at baseline36 and puberty stage37,38 at baseline and demonstrated an acceptable model fit (adjusted χ2 = 2,853.82, df = 945, p < 0.001, RMSEA = 0.034 (90% CI: 0.032–0.035), CFI = 0.89). Especially the strong decrease in CFI is due to the fact, that most of the covariates did not yield significant paths, hence, from a statistical point of view do not contribute any information, but rather reduce parsimony of the model and converge towards the null-model. Attending to a reviewer, we also tested whether a latent basis model would be better suited to adjust for possible non-linear change. A model with freely estimating the second-timepoint (constraining slope loadings to 0, *, and 1) led to an estimate significantly differ-ent from zero with 0.432, which indicates an almost linear trend. According to a S-B Δχ2-test, RMSEA, and CFI it did not fit the data significantly better, hence, we kept the linear model as it is more parsimonious (χ2 = 2,853.18, df = 944, p < 0.001, RMSEA = 0.034 (90% CI: 0.032–0.035), CFI = 0.89; S-B Δχ2 = 1.15, Δdf = 1, ns).
Figure 1. Mean scores of neuroticism across time in a random subsample of 20% of the original data. Mean-scores of neuroticism were plotted across our three measurement occasions. To improve readability, we drew a random subsample consisting of 20% of individuals from the original dataset.
4Scientific RepoRtS | (2020) 10:1207 | https://doi.org/10.1038/s41598-020-58128-x
www.nature.com/scientificreportswww.nature.com/scientificreports/
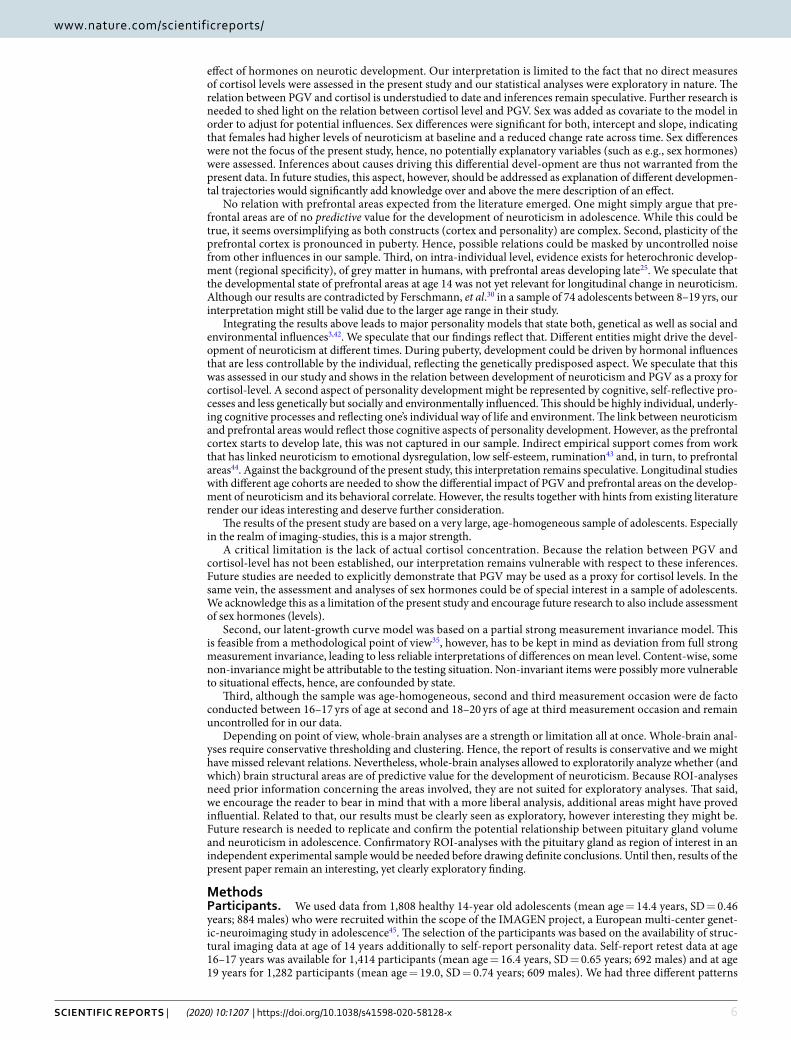
Turning to the results from the growth-curve model we report significant decreases in neuroticism on mean level (negative mean of the slope), with significant inter-individual differences (significant variance). Additionally, we found significant variances for the level, indicating inter-individual differences in the initial value at baseline. We also found a negative relation between level and slope indicating that individuals higher in neuroticism at baseline tend to decrease stronger over time (see Table 3).
Brain volume as predictor. In a final and most important step, we conducted an exploratory whole-brain anal-ysis on brain (grey and white matter) probability maps to predict change in neuroticism on latent level over time from each voxel. We chose exploratory analyses with conservative thresholding (p > 0.001) and clustering
Manifest Indicators T1 T2 T3
I am not a worrier 0.28 0.26 0.29
I often feel that Im not as good as others* 0.59 0.59 0.65
When I’m under a great deal of stress, sometimes I feel like I’m going to pieces 0.59 0.61 0.65
I rarely feel lonely or blue* 0.50 0.54 0.58
I often feel tense and jittery 0.59 0.61 0.65
Sometimes I feel completely worthless 0.71 0.72 0.78
I rarely feel fearful or anxious* 0.49 0.50 0.55
I often get angry at the way people treat me* 0.44 0.46 0.49
Too often, when things go wrong, I get discouraged and feel like giving up 0.59 0.63 0.68
I am seldom sad or depressed 0.47 0.52 0.56
I often feel helpless and want someone else to solve my problems 0.62 0.64 0.69
At times I have been so ashamed I just wanted to hide* 0.49 0.45 0.49
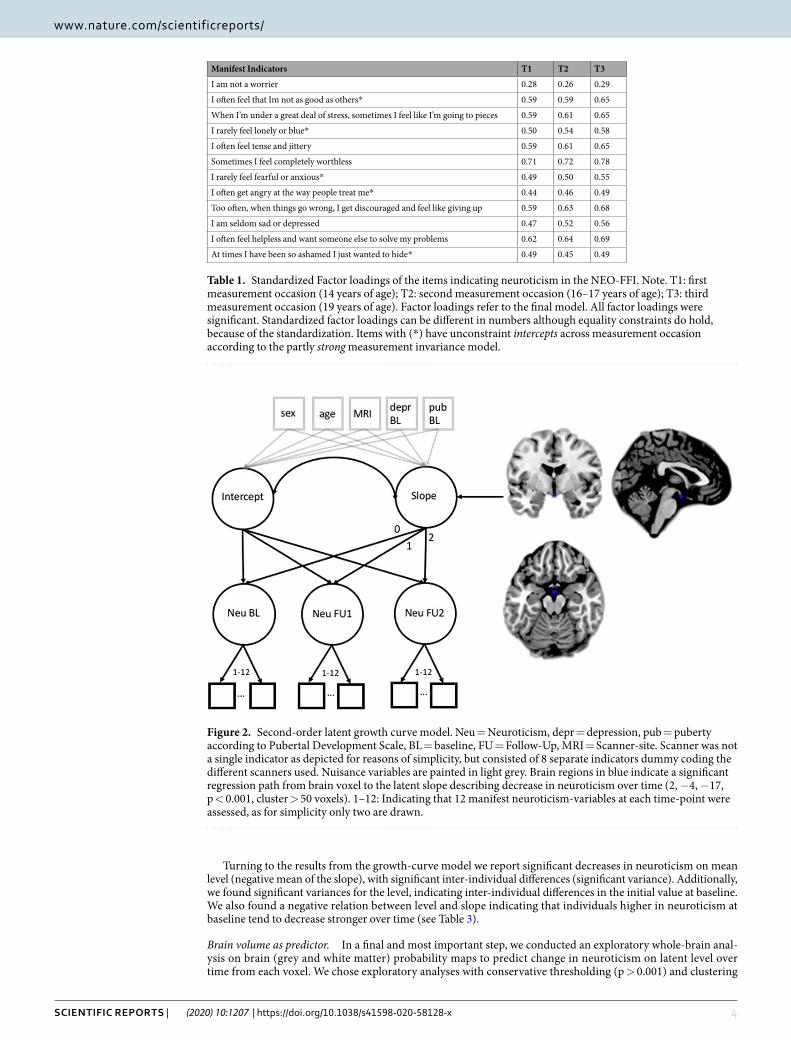
Table 1. Standardized Factor loadings of the items indicating neuroticism in the NEO-FFI. Note. T1: first measurement occasion (14 years of age); T2: second measurement occasion (16–17 years of age); T3: third measurement occasion (19 years of age). Factor loadings refer to the final model. All factor loadings were significant. Standardized factor loadings can be different in numbers although equality constraints do hold, because of the standardization. Items with (*) have unconstraint intercepts across measurement occasion according to the partly strong measurement invariance model.
Figure 2. Second-order latent growth curve model. Neu = Neuroticism, depr = depression, pub = puberty according to Pubertal Development Scale, BL = baseline, FU = Follow-Up, MRI = Scanner-site. Scanner was not a single indicator as depicted for reasons of simplicity, but consisted of 8 separate indicators dummy coding the different scanners used. Nuisance variables are painted in light grey. Brain regions in blue indicate a significant regression path from brain voxel to the latent slope describing decrease in neuroticism over time (2, −4, −17, p < 0.001, cluster > 50 voxels). 1–12: Indicating that 12 manifest neuroticism-variables at each time-point were assessed, as for simplicity only two are drawn.
5Scientific RepoRtS | (2020) 10:1207 | https://doi.org/10.1038/s41598-020-58128-x
www.nature.com/scientificreportswww.nature.com/scientificreports/
(n > 50 voxels) but without correction for multiple comparisons. On grey matter maps only one significant result emerged. Most interestingly, however, we found reduced volume in the pituitary gland predicting the slope of neuroticism over time (2, −4, −17, p < 0.001, cluster > 50 voxels). This is especially interesting, as studies linking cortisol-level with neuroticism have been conducted, however, evidence with the pituitary gland volume (PGV) as marker for neuroticism has, to the best of our knowledge, not yet been rendered. Also, being able to pre-dict development of neuroticism from structural brain data at baseline has not been shown before. Correlations between grey matter data and the intercept were rendered non-significant after thresholding (p < 0.001) and cluster size correction (cluster size > 50 voxels). The same analysis on white matter probability maps did not result in any significant clusters.
DiscussionWe found a general decrease in neuroticism across time with inter-individual differences reflected by the mean and variance of the slope in the self-reported questionnaire data. Also, individuals differed in neuroticism at baseline. The negative relation between level and slope might reflect that we measured individuals at different developmental stages, although numerically same aged. The steeper decline in individuals with high levels of neuroticism at baseline might reflect an assessment before the normative decline of neuroticism in adolescence. Individuals starting lower off in our analyses might have started to decline at baseline. Our interpretation fits into existing studies reporting similar change trajectories and inter-individual differences, however, in different age-ranges2,17. This strengthens the interpretation that our sample was “caught” at different developmental stages despite age homogeneity.
Turning to neural correlates, we found reduced pituitary gland volume (PGV) at baseline predicting less decline of neuroticism. Previous studies linked neuroticism with low levels of cortisol, which is related to pitu-itary gland volume39–41. However, to the best of our knowledge, no studies have linked PGV and neuroticism directly. Higher pituitary gland volume (PGV) is linked to an increased number of corticotropin releasing cells, hence, increased levels of ACTH and cortisol. Seemingly, smaller pituitary volume is linked to less HPA axis activity, therefore, less cortisol. We speculate that the predictive value of the PGV could be important in the age group studied. With puberty, the organism undergoes hormonal changes and reorganization. With no relation at baseline but in the prediction of neurotic development, we speculate that PGV might be informative as an early marker for future cortisol production. The smaller PGV at age 14 yrs might negatively foreshadow the cumulative
Time-invariant covariates
intercept slope
standardized coefficients
standardized coefficients
Age −0.02 0.01
Sex§,‡ 0.60* 0.32*
Puberty Stage 0.02 −0.06
Depression 0.3* −0.12*
Scanner-Site†
Berlin§ −0.22 0.29
Dresden§ 0.14 0.05
Hamburg§ −0.25* 0.44*
Mannheim§ −0.10 0.19
London§ 0.37 0.26
Nottingham§ 0.29* 0.26
Dublin§ 0.12 0.74*
Paris§ 0.31* −0.04
Table 2. Standardized coefficients for time-invariant covariates of the final model. Note. Covariates were assessed at first measurement occasion (T1). * denotes significant coefficients. §We report the Mplus “StdY”-standardization, which is recommended for binary covariates. See Mplus User’s Guide for details on exact calculation of the coefficients. ‡Sex was coded with males being the reference category. †The nine scanner-sites were dummy-coded, with Berlin as site having two different MRI-Scanner. One General Electric Scanner in Berlin served as reference.
Latent Estimates
Estimates
Mean (standard error) Mean (standard error)
Intercept 3.5 (1.5) 0.8 (0.03)
Slope −0.7 (0.18) 0.9 (0.03)
Correlation
Intercept-Slope −0.2
Table 3. Standardized estimates for intercept and slope of the second-order latent growth curve model. Note. All estimates were significant.
6Scientific RepoRtS | (2020) 10:1207 | https://doi.org/10.1038/s41598-020-58128-x
www.nature.com/scientificreportswww.nature.com/scientificreports/
effect of hormones on neurotic development. Our interpretation is limited to the fact that no direct measures of cortisol levels were assessed in the present study and our statistical analyses were exploratory in nature. The relation between PGV and cortisol is understudied to date and inferences remain speculative. Further research is needed to shed light on the relation between cortisol level and PGV. Sex was added as covariate to the model in order to adjust for potential influences. Sex differences were significant for both, intercept and slope, indicating that females had higher levels of neuroticism at baseline and a reduced change rate across time. Sex differences were not the focus of the present study, hence, no potentially explanatory variables (such as e.g., sex hormones) were assessed. Inferences about causes driving this differential devel-opment are thus not warranted from the present data. In future studies, this aspect, however, should be addressed as explanation of different developmen-tal trajectories would significantly add knowledge over and above the mere description of an effect.
No relation with prefrontal areas expected from the literature emerged. One might simply argue that pre-frontal areas are of no predictive value for the development of neuroticism in adolescence. While this could be true, it seems oversimplifying as both constructs (cortex and personality) are complex. Second, plasticity of the prefrontal cortex is pronounced in puberty. Hence, possible relations could be masked by uncontrolled noise from other influences in our sample. Third, on intra-individual level, evidence exists for heterochronic develop-ment (regional specificity), of grey matter in humans, with prefrontal areas developing late25. We speculate that the developmental state of prefrontal areas at age 14 was not yet relevant for longitudinal change in neuroticism. Although our results are contradicted by Ferschmann, et al.30 in a sample of 74 adolescents between 8–19 yrs, our interpretation might still be valid due to the larger age range in their study.
Integrating the results above leads to major personality models that state both, genetical as well as social and environmental influences3,42. We speculate that our findings reflect that. Different entities might drive the devel-opment of neuroticism at different times. During puberty, development could be driven by hormonal influences that are less controllable by the individual, reflecting the genetically predisposed aspect. We speculate that this was assessed in our study and shows in the relation between development of neuroticism and PGV as a proxy for cortisol-level. A second aspect of personality development might be represented by cognitive, self-reflective pro-cesses and less genetically but socially and environmentally influenced. This should be highly individual, underly-ing cognitive processes and reflecting one’s individual way of life and environment. The link between neuroticism and prefrontal areas would reflect those cognitive aspects of personality development. However, as the prefrontal cortex starts to develop late, this was not captured in our sample. Indirect empirical support comes from work that has linked neuroticism to emotional dysregulation, low self-esteem, rumination43 and, in turn, to prefrontal areas44. Against the background of the present study, this interpretation remains speculative. Longitudinal studies with different age cohorts are needed to show the differential impact of PGV and prefrontal areas on the develop-ment of neuroticism and its behavioral correlate. However, the results together with hints from existing literature render our ideas interesting and deserve further consideration.
The results of the present study are based on a very large, age-homogeneous sample of adolescents. Especially in the realm of imaging-studies, this is a major strength.
A critical limitation is the lack of actual cortisol concentration. Because the relation between PGV and cortisol-level has not been established, our interpretation remains vulnerable with respect to these inferences. Future studies are needed to explicitly demonstrate that PGV may be used as a proxy for cortisol levels. In the same vein, the assessment and analyses of sex hormones could be of special interest in a sample of adolescents. We acknowledge this as a limitation of the present study and encourage future research to also include assessment of sex hormones (levels).
Second, our latent-growth curve model was based on a partial strong measurement invariance model. This is feasible from a methodological point of view35, however, has to be kept in mind as deviation from full strong measurement invariance, leading to less reliable interpretations of differences on mean level. Content-wise, some non-invariance might be attributable to the testing situation. Non-invariant items were possibly more vulnerable to situational effects, hence, are confounded by state.
Third, although the sample was age-homogeneous, second and third measurement occasion were de facto conducted between 16–17 yrs of age at second and 18–20 yrs of age at third measurement occasion and remain uncontrolled for in our data.
Depending on point of view, whole-brain analyses are a strength or limitation all at once. Whole-brain anal-yses require conservative thresholding and clustering. Hence, the report of results is conservative and we might have missed relevant relations. Nevertheless, whole-brain analyses allowed to exploratorily analyze whether (and which) brain structural areas are of predictive value for the development of neuroticism. Because ROI-analyses need prior information concerning the areas involved, they are not suited for exploratory analyses. That said, we encourage the reader to bear in mind that with a more liberal analysis, additional areas might have proved influential. Related to that, our results must be clearly seen as exploratory, however interesting they might be. Future research is needed to replicate and confirm the potential relationship between pituitary gland volume and neuroticism in adolescence. Confirmatory ROI-analyses with the pituitary gland as region of interest in an independent experimental sample would be needed before drawing definite conclusions. Until then, results of the present paper remain an interesting, yet clearly exploratory finding.
MethodsParticipants. We used data from 1,808 healthy 14-year old adolescents (mean age = 14.4 years, SD = 0.46 years; 884 males) who were recruited within the scope of the IMAGEN project, a European multi-center genet-ic-neuroimaging study in adolescence45. The selection of the participants was based on the availability of struc-tural imaging data at age of 14 years additionally to self-report personality data. Self-report retest data at age 16–17 years was available for 1,414 participants (mean age = 16.4 years, SD = 0.65 years; 692 males) and at age 19 years for 1,282 participants (mean age = 19.0, SD = 0.74 years; 609 males). We had three different patterns
7Scientific RepoRtS | (2020) 10:1207 | https://doi.org/10.1038/s41598-020-58128-x
www.nature.com/scientificreportswww.nature.com/scientificreports/
of dropout: dropout after baseline, dropout after second measurement occasion, and intermittent dropout after second measurement occasion with return for the third measurement occasion. The dropout-groups (including completers) did not differ significantly with respect to sex and depression at baseline. Originally measured in days of age, means for the respective dropout-groups were as follows: non-dropout group mean age = 5256 days, SD = 161 days; dropout after first measurement occasion: mean age = 5290 days, SD = 150 days; dropout after second measurement occasion: mean age = 5265 days, SD = 199 days; intermittent dropout after second meas-urement occasion with return for the third measurement occasion: mean age = 5311 days, SD = 161 days. Age differences were statistically significant between completers and dropout after first measurement occasion and intermittent dropout, respectively. Also, the difference between dropout after second measurement occasion and intermittent dropout proved statistically significant. However, all differences were interpreted as irrelevant for the study. All analyses were performed in accordance with relevant guidelines and written informed consent was obtained from all participants as well as from their legal guardians. The adolescents were recruited from second-ary schools. The study was approved by the ethics committee of the University of Mannheim and also approved by the head teachers of the respective schools. Participants with a medical condition or neurological disorders were excluded. All participating subjects were assessed by means of self-rating and two external ratings (by their parents and a psychiatrist specialized in pediatrics) based on ICD-10 as well as DSM-IV and the Development and Well-Being Assessment Interview (DAWBA)36.
Questionnaire. The NEO-Five Factor Inventory (NEO-FFI)46 was administered at three measurement occa-sions (Baseline: 14 years of age; Follow-up 1: 16–17 years of age; Follow-up 2: 19 years of age) to assess personality on the basis of self report. 12 Items describing neuroticism from the 60-item-scale were selected for the present analyses. The NEO-FFI represents a short form of the extensive 240-item NEO-PI-R. Items were assessed on a 5-point-Likert scale from strongly disagree to strongly agree. Four items had to be reverse coded.
Scanning procedure. Structural MRI was performed on 3 Tesla scanners from three manufacturers (Siemens: 5 sites; Philips: 2 sites; and General Electric: 2 sites). The details of the entire MR protocol are described elsewhere. In this study, we used the T1-weighted images. These high-resolution anatomical MRIs were obtained using a three-dimensional sequence based on the ADNI protocol (http://adni.loni.ucla.edu/research/protocols/mri-protocols/).
Voxel-based morphometry. In order to evaluate if and how structural data from baseline predict developmental changes at following measurement occasions, we applied whole-brain voxel-wise analyses. In ROI-analyses information concerning potentially influential areas is needed, hence rendering it unsuitable for exploratory analyses. Structural data was preprocessed by means of the VBM8 toolbox (http://dbm.neuro.uni-jena.de/vbm.html) and SPM8 (http://www.fil.ion.ucl.ac.uk/spm) with default parameters. The VBM8 toolbox involves bias correction, tissue classification and affine registration. The affine registered grey matter (GM) and white matter (WM) segmentations were used to build a customized DARTEL (diffeomorphic anatomical registra-tion through exponentiated lie algebra) template. Then warped GM and WM segments were created. Modulation was applied in order to preserve the volume of a particular tissue within a voxel by multiplying voxel values in the segmented images by the Jacobian determinants derived from the spatial normalization step. In effect, the anal-ysis of modulated data tests for regional differences in the absolute amount (volume) of GM/WM. Images were smoothed with a FWHM (full-width at half maximum) kernel of 8 mm47.
Structural equation modelling. We applied structural equation modelling to analyze development of neuroticism on self-reported questionnaire data. After testing different degrees of measurement invariance across time, second-order latent growth curve models were used to model development. Applying second-order latent growth curve models in the present study has the advantage that, first, measurement invariance can be tested for and, second, reliability of the estimation of the slope and intercept is improved (for details on the latter see48). Measurement invariance describes the degree of stability of psychometric characteristics of a question-naire allowing for interpretation of change on latent level without confounding measurement errors or different underlying psychometric properties49. Measurement invariance is most often tacitly assumed, for example in applying first-order growth curve models with sum scores as indicator, but rarely explicitly tested. Three degrees of measurement invariance were assessed in the present study. Configural invariance requires the same items to load on the same factor across time, implying that the same items can be assigned to the same theoretical construct across measurement occasions. For weak invariance to hold, factor loadings are constrained to be equal across time, implying that the information contributed by every item to the underlying construct remains the same across time. Strong factorial invariance requires constraining the intercepts to be equal across time. Establishing strong measurement invariance enables interpretation of mean changes on latent level as changes of the latent construct and not changes due to systematic differences on item-level. We used MLR estimator in our analyses (i.e., a maximum likelihood estimator with robust standard errors). As criteria for model fit, we report the Comparative Fit Index (CFI), and the Root Mean Square Error of Approximation (RMSEA). Values of the CFI above 0.95 denote a well-fitting model, whereas for the RMSEA values less than 0.06 may be interpreted as acceptable model fit50. In addition, we report adjusted χ2-values, degrees of freedom (df), and corresponding p-values for all models examined as well as the Satorra-Bentler scaled χ2-difference-test for comparing nested models51. A total of 12 manifest variables from the NEO-FFI served as indicators for the latent neuroticism-factor in a one-factor-model, measured across three time-points. For model identification, effects-coding method was used according to Little et al.52. As time-invariant covariates measured at baseline, sex, age, scanner-site, puberty stage, depression at baseline and, finally, voxelwise whole-brain MRI-data were added. We chose time-invariant covariates over time-varying covariates as the former are well suited for explaining variation of intercept and
8Scientific RepoRtS | (2020) 10:1207 | https://doi.org/10.1038/s41598-020-58128-x
www.nature.com/scientificreportswww.nature.com/scientificreports/
slope, whereas the latter rather address occasion-specific variance in the dependent variables, which was not the focus of our paper53. Sex was dummy-coded with 1 = female and 0 = male. Age was assessed as days since birth. The nine different scanner-sites were dummy-coded each with Berlin as reference. Puberty was assessed with the Pubertal Development Scale54. Depression was extracted from the Development and Well-Being Assessment Interview (DAWBA)36.
Throughout the analyses we used R (3.1.1) and Mplus version 8.055.
Data availabilityThe dataset analyzed during the current study is available from the first author Simone Kühn on reasonable request.
Received: 5 September 2019; Accepted: 9 January 2020;Published: xx xx xxxx
References 1. DeYoung, C. G. Personality Neuroscience and the Biology of Traits. Social and Personality Psychology Compass 4, 1165–1180, https://
doi.org/10.1111/j.1751-9004.2010.00327.x (2010). 2. McCrae, R. R. et al. Personality trait development from age 12 to age 18: longitudinal, cross-sectional, and cross-cultural analyses.
Journal of personality and social psychology 83, 1456–1468 (2002). 3. McCrae, R. & Costa, P. The five factor model of personality: Theoretical Perspective. (1996). 4. John, O., Naumann, L. & Soto, C. In Handbook of Personality. Theory and Research Vol. 3 (eds Oliver John, Richard Robins, &
Lawrence Pervin) Ch. 4, 114–158 (The Guilford Press, 2008). 5. Funder, D. C. Personality. Annual review of psychology 52, 197–221, https://doi.org/10.1146/annurev.psych.52.1.197 (2001). 6. McAdams, D. P. & Pals, J. L. A new Big Five: Fundamental principles for an integrative science of personality. American Psychologist
61, 204–217, https://doi.org/10.1037/0003-066X.61.3.204 (2006). 7. Hooker, K. & McAdams, D. P. Personality reconsidered: a new agenda for aging research. The Journals of Gerontology: Series B 58,
P296–P304, https://doi.org/10.1093/geronb/58.6.P296 (2003). 8. Abram, S. V. & DeYoung, C. G. Using personality neuroscience to study personality disorder. Personality disorders 8, 2–13, https://
doi.org/10.1037/per0000195 (2017). 9. Mincic, A. M. Neuroanatomical correlates of negative emotionality-related traits: A systematic review and meta-analysis.
Neuropsychologia 77, 97–118, https://doi.org/10.1016/j.neuropsychologia.2015.08.007 (2015). 10. Lahey, B. B. Public health significance of neuroticism. The American psychologist 64, 241–256, https://doi.org/10.1037/a0015309
(2009). 11. Bjornebekk, A. et al. Neuronal correlates of the five factor model (FFM) of human personality: Multimodal imaging in a large
healthy sample. NeuroImage 65, 194–208, https://doi.org/10.1016/j.neuroimage.2012.10.009 (2013). 12. Malouff, J. M., Thorsteinsson, E. B. & Schutte, N. S. The Relationship Between the Five-Factor Model of Personality and Symptoms
of Clinical Disorders: A Meta-Analysis. Journal of Psychopathology and Behavioral Assessment 27, 101–114, https://doi.org/10.1007/s10862-005-5384-y (2005).
13. Hauner, K. K. Y. et al. Neuroticism and introversion are associated with salivary cortisol patterns in adolescents. Psychoneuroendocrinology 33, 1344–1356, https://doi.org/10.1016/j.psyneuen.2008.07.011 (2008).
14. Roberts, B. W. & Mroczek, D. Personality Trait Change in Adulthood. Curr Dir Psychol Sci 17, 31–35 (2008). 15. Lamb, M. E., Chuang, S. S., Wessels, H., Broberg, A. G. & Hwang, C. P. Emergence and Construct Validation of the Big Five Factors
in Early Childhood: A Longitudinal Analysis of Their Ontogeny in Sweden. 73, 1517–1524, https://doi.org/10.1111/1467-8624.00487 (2002).
16. Wängqvist, M., Lamb, M. E., Frisén, A. & Hwang, C. P. Child and Adolescent Predictors of Personality in Early Adulthood. 86, 1253–1261, https://doi.org/10.1111/cdev.12362 (2015).
17. Aldinger, M. et al. Neuroticism developmental courses - implications for depression, anxiety and everyday emotional experience; a prospective study from adolescence to young adulthood. 14, 210, https://doi.org/10.1186/s12888-014-0210-2 (2014).
18. Allemand, M., Zimprich, D. & Hendriks, A. A. Age differences in five personality domains across the life span. Dev Psychol 44, 758–770, https://doi.org/10.1037/0012-1649.44.3.758 (2008).
19. Blakemore, S.-J., Burnett, S. & Dahl, R. E. The role of puberty in the developing adolescent brain 31, 926–933, https://doi.org/10.1002/hbm.21052 (2010).
20. Herting, M. M. & Sowell, E. R. Puberty and structural brain development in humans. Frontiers in Neuroendocrinology 44, 122–137, https://doi.org/10.1016/j.yfrne.2016.12.003 (2017).
21. Ouanes, S. et al. Personality, Cortisol, and Cognition in Non-demented Elderly Subjects: Results from a Population-Based Study. 9, https://doi.org/10.3389/fnagi.2017.00063 (2017).
22. Puig-Perez, S., Almela, M., Pulopulos, M. M., Hidalgo, V. & Salvador, A. Are neuroticism and extraversion related to morning cortisol release in healthy older people? International Journal of Psychophysiology 110, 243–248, https://doi.org/10.1016/j.ijpsycho.2016.07.497 (2016).
23. Mangold, D., Mintz, J., Javors, M. & Marino, E. Neuroticism, acculturation and the cortisol awakening response in Mexican American adults. Hormones and Behavior 61, 23–30, https://doi.org/10.1016/j.yhbeh.2011.09.009 (2012).
24. Hill, E., Billington, R. & Krägeloh, C. The cortisol awakening response and the big five personality dimensions. Vol. 55 (2013). 25. Giedd, J. N. et al. Brain development during childhood and adolescence: a longitudinal MRI study. Nature neuroscience 2, 861–863,
https://doi.org/10.1038/13158 (1999). 26. Walhovd, K. B., Fjell, A. M., Giedd, J., Dale, A. M. & Brown, T. T. Through Thick and Thin: a Need to Reconcile Contradictory
Results on Trajectories in Human Cortical Development. Cerebral cortex (New York, N.Y.: 1991) 27, 1472–1481, https://doi.org/10.1093/cercor/bhv301 (2017).
27. Kochunov, P. et al. Fractional anisotropy of cerebral white matter and thickness of cortical gray matter across the lifespan. NeuroImage 58, 41–49 (2011).
28. Gogtay, N. et al. Dynamic mapping of human cortical development during childhood through early adulthood. Proc. Natl. Acad. Sci. USA 101, 8174–8179 (2004).
29. Kochunov, P. et al. Fractional anisotropy of water diffusion in cerebral white matter across the lifespan. Neurobiology of aging 33, 9–20 (2012).
30. Ferschmann, L. et al. Personality Traits Are Associated With Cortical Development Across Adolescence: A Longitudinal Structural MRI Study. 89, 811–822, https://doi.org/10.1111/cdev.13016 (2018).
31. Riccelli, R., Toschi, N., Nigro, S., Passamonti, L. & Terracciano, A. Surface-based morphometry reveals the neuroanatomical basis of the five-factor model of personality. Social cognitive and affective neuroscience 12, 671–684, https://doi.org/10.1093/scan/nsw175%J (2017).
9Scientific RepoRtS | (2020) 10:1207 | https://doi.org/10.1038/s41598-020-58128-x
www.nature.com/scientificreportswww.nature.com/scientificreports/
32. Holmes, A. J. et al. Individual Differences in Amygdala-Medial Prefrontal Anatomy Link Negative Affect, Impaired Social Functioning, and Polygenic Depression Risk. The Journal of Neuroscience 32, 18087, https://doi.org/10.1523/JNEUROSCI.2531-12.2012 (2012).
33. Price, J. L. & Drevets, W. C. Neurocircuitry of Mood Disorders. Neuropsychopharmacology 35, 192, https://doi.org/10.1038/npp.2009.104 (2009).
34. Cheung, G. W. & Rensvold, R. B. Evaluating Goodness-of-Fit Indexes for Testing Measurement Invariance. Structural Equation Modeling: A Multidisciplinary Journal 9, 233–255, https://doi.org/10.1207/S15328007SEM0902_5 (2002).
35. Byrne, B. M., Shavelson, R. & Muthén, B. O. Testing for the Equivalence of Factor Covariance and Mean Structures: The Issue of Partial Measurement Invariance. Vol. 105 (1989).
36. Goodman, R., Ford, T., Richards, H., Gatward, R. & Meltzer, H. The Development and Well-Being Assessment: description and initial validation of an integrated assessment of child and adolescent psychopathology. Journal of child psychology and psychiatry, and allied disciplines 41, 645–655 (2000).
37. Crockett, L. J. & Petersen, A. C. In Biological-Psychosocial Interactions in Early Adolescence (eds. Richard M. Lerner & Terryl T. Foch) Ch. 8, 173–188 (Lawrence Erlbaum Associates, 1987).
38. Wong, A. P.-Y. et al. Estimating volumes of the pituitary gland from T1-weighted magnetic-resonance images: Effects of age, puberty, testosterone, and estradiol. NeuroImage 94, 216–221, https://doi.org/10.1016/j.neuroimage.2014.02.030 (2014).
39. Axelson, D. A. et al. In vivo assessment of pituitary volume with magnetic resonance imaging and systematic stereology: Relationship to dexamethasone suppression test results in patients. Psychiatry research 44, 63–70, https://doi.org/10.1016/0165-1781(92)90070-J (1992).
40. Kaess, M. et al. Sex-specific prediction of hypothalamic-pituitary-adrenal axis activity by pituitary volume during adolescence: A longitudinal study from 12 to 17 years of age. Psychoneuroendocrinology 38, 2694–2704, https://doi.org/10.1016/j.psyneuen.2013.06.028 (2013).
41. Lorenzetti, V. et al. Pituitary gland volume in currently depressed and remitted depressed patients. Psychiatry Research: Neuroimaging 172, 55–60, https://doi.org/10.1016/j.pscychresns.2008.06.006 (2009).
42. Cloninger, C. R., Svrakic, D. M. & Przybeck, T. R. A psychobiological model of temperament and character. Arch Gen Psychiatry 50, 975–990 (1993).
43. DeYoung, C. G. et al. Testing predictions from personality neuroscience. Brain structure and the big five. Psychological science 21, 820–828, https://doi.org/10.1177/0956797610370159 (2010).
44. Ochsner, K. N. & Gross, J. J. The cognitive control of emotion. Trends in cognitive sciences 9, 242–249, https://doi.org/10.1016/j.tics.2005.03.010 (2005).
45. Schumann, G. et al. The IMAGEN study: reinforcement-related behaviour in normal brain function and psychopathology. Molecular Psychiatry 15, 1128, https://doi.org/10.1038/mp.2010.4, https://www.nature.com/articles/mp20104#supplementary-information (2010).
46. Costa, P. & McCrae, R. Normal Personality Assessment in Clinical Practice: The NEO Personality Inventory. Vol. 4 (1992). 47. Kühn, S. et al. Predicting development of adolescent drinking behaviour from whole brain structure at 14 years of age. eLife 8,
e44056, https://doi.org/10.7554/eLife.44056 (2019). 48. von Oertzen, T., Hertzog, C., Lindenberger, U. & Ghisletta, P. The effect of multiple indicators on the power to detect inter-individual
differences in change. British Journal of Mathematical and Statistical Psychology 63, 627–646, https://doi.org/10.1348/000711010X486633 (2010).
49. Meredith, W. & Horn, J. in New methods for the analysis of change. Decade of behavior. 203–240 (American Psychological Association, 2001).
50. Hu, L. T. & Bentler, P. M. Cutoff criteria for fit indexes in covariance structure analysis: Conventional criteria versus new alternatives. Structural Equation Modeling: A Multidisciplinary Journal 6, 1–55, https://doi.org/10.1080/10705519909540118 (1999).
51. Satorra, A. & Bentler, P. M. J. P. A scaled difference chi-square test statistic for moment structure analysis. 66, 507–514, https://doi.org/10.1007/bf02296192 (2001).
52. Little, T. D., Slegers, D. W. & Card, N. A. A Non-arbitrary Method of Identifying and Scaling Latent Variables in SEM and MACS Models. Structural Equation Modeling: A Multidisciplinary Journal 13, 59–72, https://doi.org/10.1207/s15328007sem1301_3 (2006).
53. Newsom, J. T. Longitudinal structural equation modeling: a comprehensive introduction. (Routledge, 2015). 54. Petersen, A. C., Crockett, L., Richards, M. & Boxer, A. A self-report measure of pubertal status: Reliability, validity, and initial norms.
Journal of Youth and Adolescence 17, 117–133, https://doi.org/10.1007/BF01537962 (1988). 55. Muthén, L. K. & Muthén, B. O. Mplus User’s Guide. Eighth Edition edn, (Muthén & Muthén, 1998–2017).
AcknowledgementsS.K. has been funded by a Heisenberg grant from the German Science Foundation (DFG KU 3322/1-1), the European Union (ERC-2016-StG-Self-Control-677804) and the Jacobs Foundation (JRF 2016-2018). FN has been funded by a Heisenberg grant from the German Science Foundation (NE 1383/14-1). Thanks to Micha Kraus for the programming support.
Author contributionsS.K., A.M., and G.S. designed research; T.B., A.L.W.B., C.B., E.B.Q., S.D., H.F., A.G., H.G., P.G., A.H., B.I., J.-L.M., M.-L.P.M., F.N., D.P.O., T.P., L.P., S.M., J.H.F., M.N.S., H.W., R.W., G.S., J.G. and U.L. performed research; S.K. and A.M. analyzed data: S.K. and A.M. wrote the first draft of the manuscript and all authors contributed to and have approved the final manuscript.
competing interestsDr. Banaschewski has served as an advisor or consultant to Bristol-Myers Squibb, Desitin Arzneimittel, Eli Lilly, Medice, Novartis, Pfizer, Shire, UCB, and Vifor Pharma; he has received conference attendance support, conference support, or speaking fees from Eli Lilly, Janssen McNeil, Medice, Novartis, Shire, and UCB; and he is involved in clinical trials conducted by Eli Lilly, Novartis, and Shire; the present work is unrelated to these relationships. The other authors report no biomedical financial interests or potential conflicts of interest.
Additional informationCorrespondence and requests for materials should be addressed to A.M.Reprints and permissions information is available at www.nature.com/reprints.

1 0Scientific RepoRtS | (2020) 10:1207 | https://doi.org/10.1038/s41598-020-58128-x
www.nature.com/scientificreportswww.nature.com/scientificreports/
Publisher’s note Springer Nature remains neutral with regard to jurisdictional claims in published maps and institutional affiliations.
Open Access This article is licensed under a Creative Commons Attribution 4.0 International License, which permits use, sharing, adaptation, distribution and reproduction in any medium or
format, as long as you give appropriate credit to the original author(s) and the source, provide a link to the Cre-ative Commons license, and indicate if changes were made. The images or other third party material in this article are included in the article’s Creative Commons license, unless indicated otherwise in a credit line to the material. If material is not included in the article’s Creative Commons license and your intended use is not per-mitted by statutory regulation or exceeds the permitted use, you will need to obtain permission directly from the copyright holder. To view a copy of this license, visit http://creativecommons.org/licenses/by/4.0/. © The Author(s) 2020