East Baseline Risk Assessment Study Results
32
RAC July 20, 2017 Southeast Louisiana Flood Protection Authority - East Baseline Risk Assessment Study Results
-
Upload
khangminh22 -
Category
Documents
-
view
0 -
download
0
Transcript of East Baseline Risk Assessment Study Results
RACEngineers & Economists, LLC
July 20, 2017
Southeast Louisiana Flood Protection Authority - EastBaseline Risk Assessment Study Results
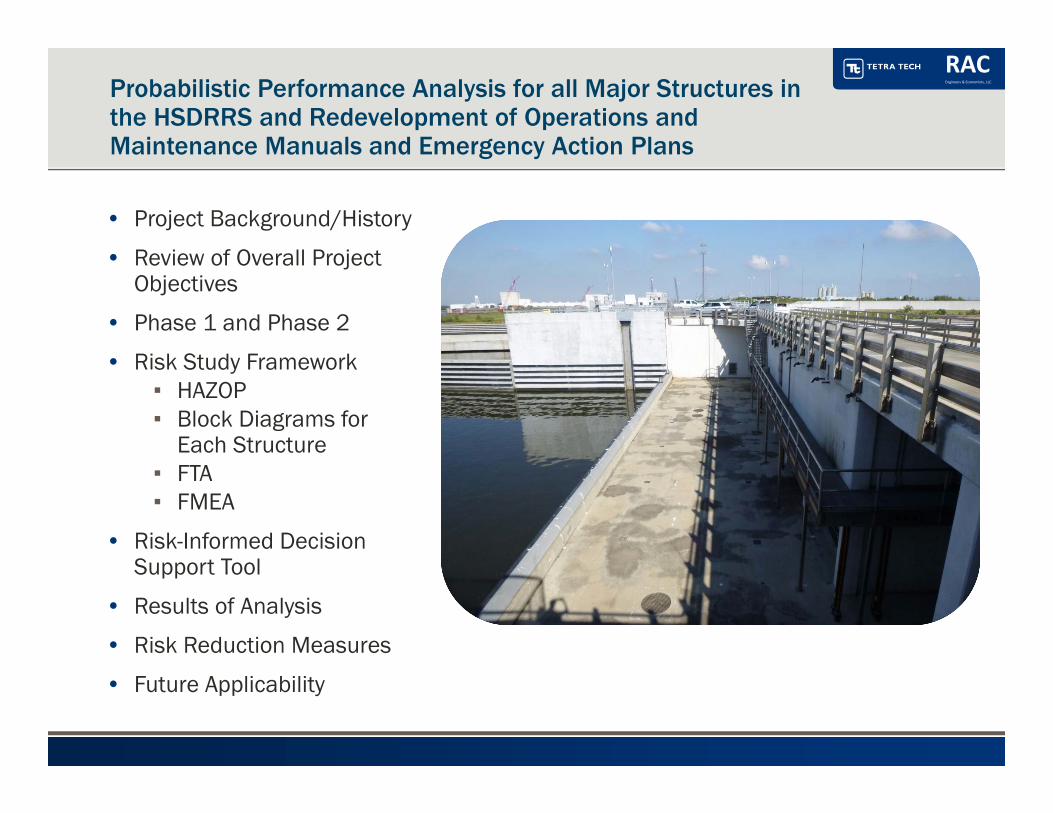
RACEngineers & Economists, LLCProbabilistic Performance Analysis for all Major Structures in
the HSDRRS and Redevelopment of Operations and Maintenance Manuals and Emergency Action Plans
• Project Background/History
• Review of Overall Project Objectives
• Phase 1 and Phase 2
• Risk Study Framework▪ HAZOP▪ Block Diagrams for
Each Structure▪ FTA▪ FMEA
• Risk-Informed Decision Support Tool
• Results of Analysis
• Risk Reduction Measures
• Future Applicability
RACEngineers & Economists, LLC
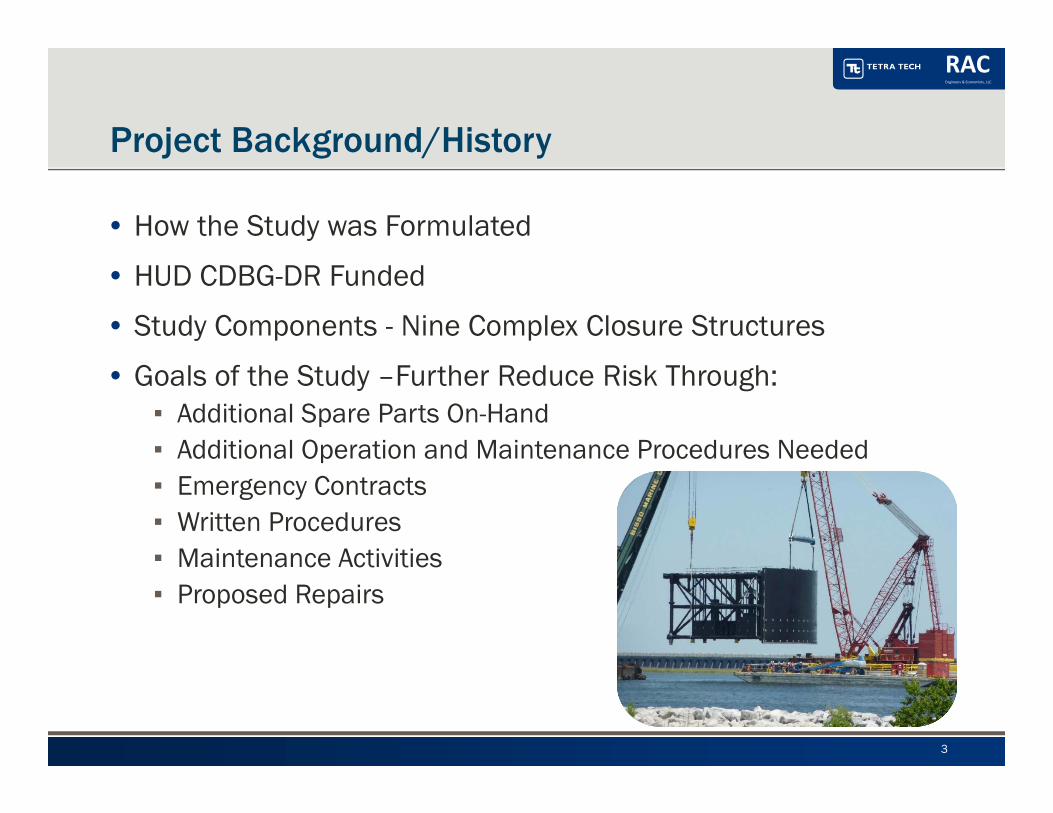
Project Background/History
• How the Study was Formulated
• HUD CDBG-DR Funded
• Study Components - Nine Complex Closure Structures
• Goals of the Study –Further Reduce Risk Through:▪ Additional Spare Parts On-Hand▪ Additional Operation and Maintenance Procedures Needed▪ Emergency Contracts▪ Written Procedures▪ Maintenance Activities▪ Proposed Repairs
3


RACEngineers & Economists, LLC
• Manage risks associated with closure of nine gates during a hurricane or tropical storm warning (HTSW).
• Identify the main risk contributors
• Identify an initial set of potential risk reduction measures
• Provide a foundation for developing a risk-informed maintenance program – Risk-Informed Decision Support Tool
Project Objectives
5
It should be noted that this study was not a system-wide risk assessment or a conditionassessment. It addressed only the performance of the nine complex gate structures and did notinclude the performance of the levees, floodwalls or other HSDRRS features. The study includedthe normal components of the risk assessment process, including risk identification, riskestimation, risk analysis, risk evaluation and risk assessment, as described in the final report. Thestudy did not identify any immediate cause for concern for public safety.

RACEngineers & Economists, LLC
Risk Management Definition
6
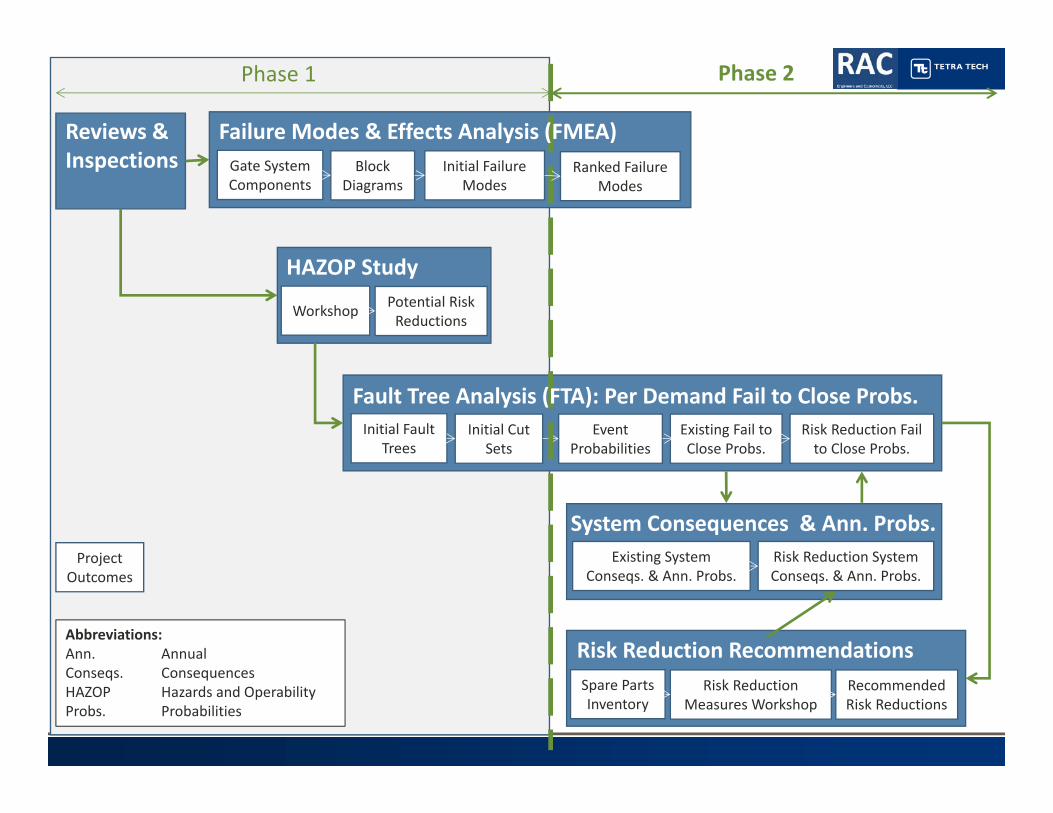
Phase 1
Phase 2
RACEngineers & Economists, LLC
HAZOP Study
Gate System Components
Initial Fault Trees
Initial Cut Sets
Block Diagrams
Event Probabilities
Workshop
Existing Fail to Close Probs.
Reviews & Inspections
Risk Reduction Fail to Close Probs.
Initial Failure Modes
Spare Parts Inventory
Potential Risk Reductions
Risk Reduction RecommendationsRisk Reduction
Measures WorkshopRecommended Risk Reductions
System Consequences & Ann. Probs.Existing System
Conseqs. & Ann. Probs.Risk Reduction System Conseqs. & Ann. Probs.
Phase 1 Phase 2
Ranked Failure Modes
Failure Modes & Effects Analysis (FMEA)
Fault Tree Analysis (FTA): Per Demand Fail to Close Probs.
Abbreviations:Ann. AnnualConseqs. ConsequencesHAZOP Hazards and OperabilityProbs. Probabilities
Project Outcomes
RACEngineers & Economists, LLC
Risk Framework - HAZOP Overview
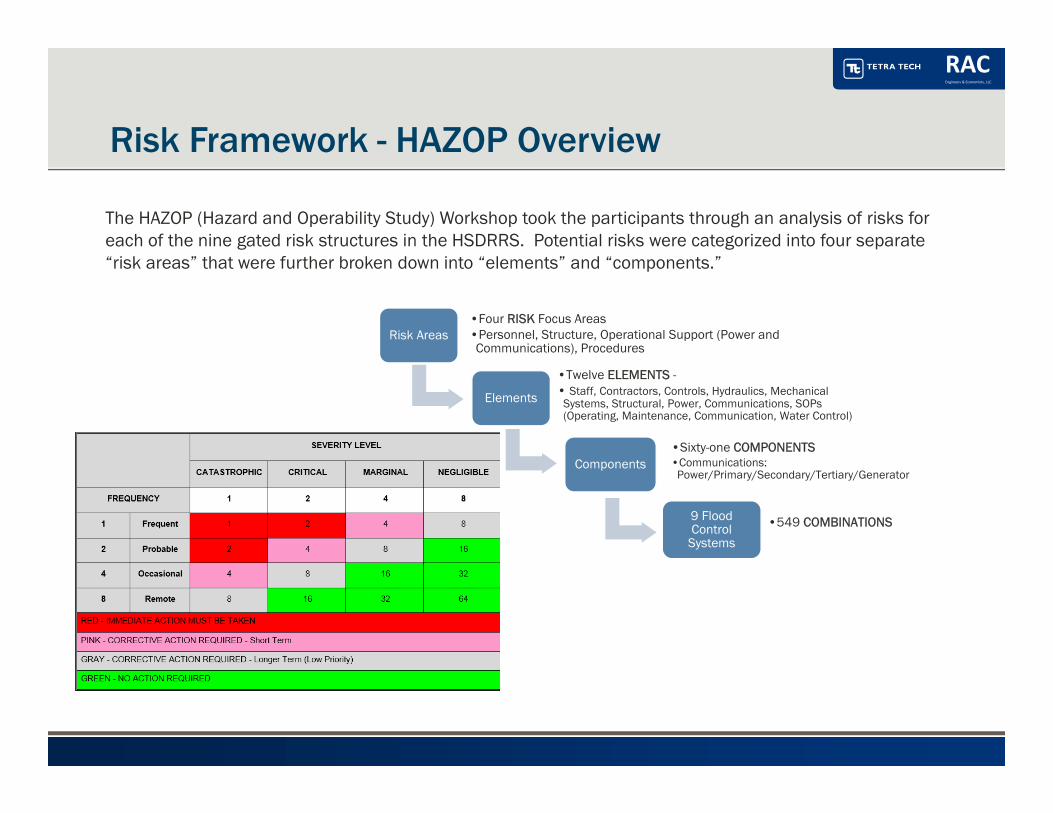
The HAZOP (Hazard and Operability Study) Workshop took the participants through an analysis of risks for each of the nine gated risk structures in the HSDRRS. Potential risks were categorized into four separate “risk areas” that were further broken down into “elements” and “components.”
Risk Areas•Four RISK Focus Areas•Personnel, Structure, Operational Support (Power and Communications), Procedures
Elements
•Twelve ELEMENTS -• Staff, Contractors, Controls, Hydraulics, Mechanical
Systems, Structural, Power, Communications, SOPs (Operating, Maintenance, Communication, Water Control)
Components•Sixty-one COMPONENTS•Communications: Power/Primary/Secondary/Tertiary/Generator
9 Flood Control
Systems
•549 COMBINATIONS
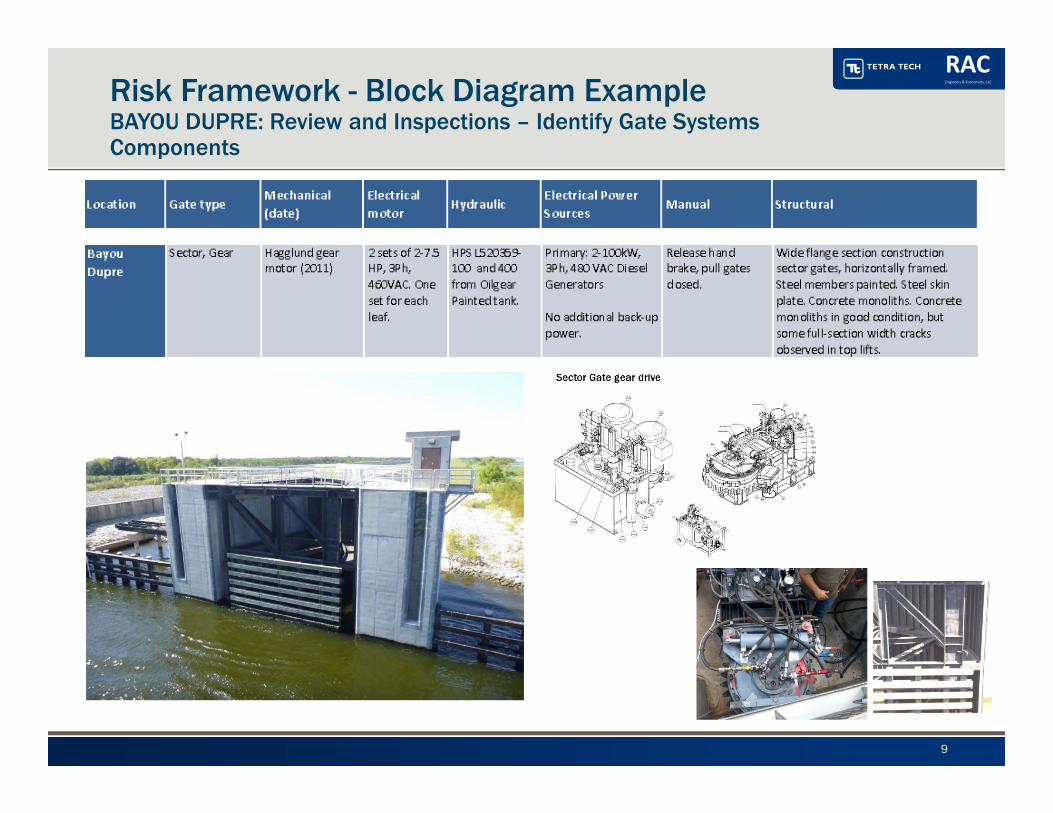
RACEngineers & Economists, LLCRisk Framework - Block Diagram Example
BAYOU DUPRE: Review and Inspections – Identify Gate Systems Components
9
10
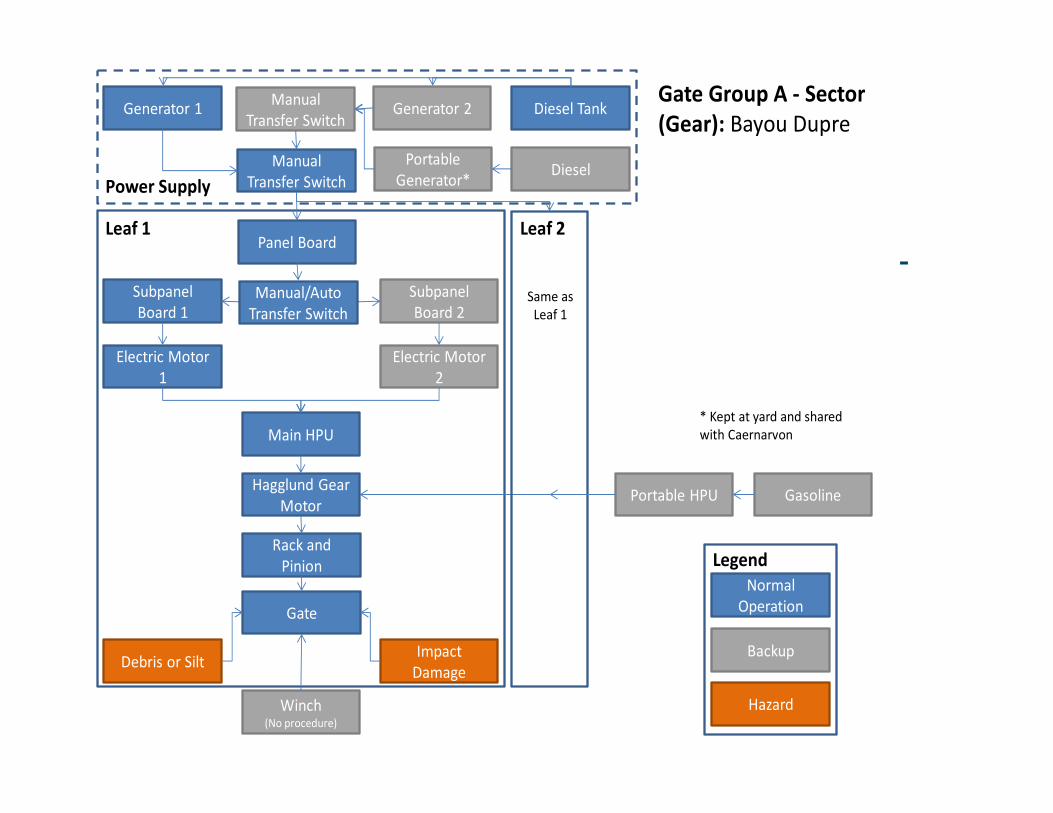
Risk Framework -Functional Block Diagram
Subpanel Board 1
Subpanel Board 2
Electric Motor 1
Electric Motor 2
Gate Group A ‐ Sector (Gear): Bayou Dupre
Main HPU
Rack and Pinion
Gasoline
Gate
Portable HPUHagglund Gear Motor
Debris or Silt
Panel Board
Normal Operation
Backup
Hazard
Leaf 1 Leaf 2
Legend
Impact Damage
Same as Leaf 1
Power Supply
Generator 1 Generator 2 Diesel Tank
Manual Transfer Switch
Winch (No procedure)
Portable Generator* Diesel
Manual Transfer Switch
Manual/Auto Transfer Switch
* Kept at yard and shared with Caernarvon
RACEngineers & Economists, LLC
FERC Risk Training CoursePhase 1Logan, Utah
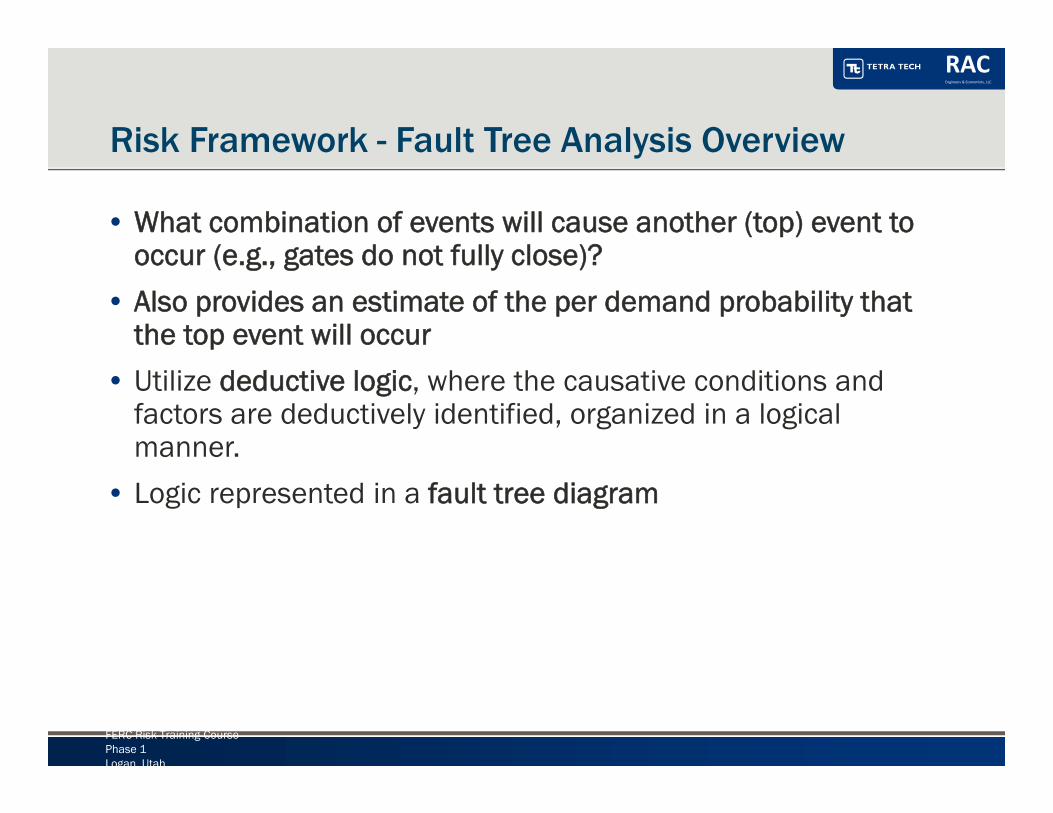
Risk Framework - Fault Tree Analysis Overview
• What combination of events will cause another (top) event to occur (e.g., gates do not fully close)?
• Also provides an estimate of the per demand probability that the top event will occur
• Utilize deductive logic, where the causative conditions and factors are deductively identified, organized in a logical manner.
• Logic represented in a fault tree diagram
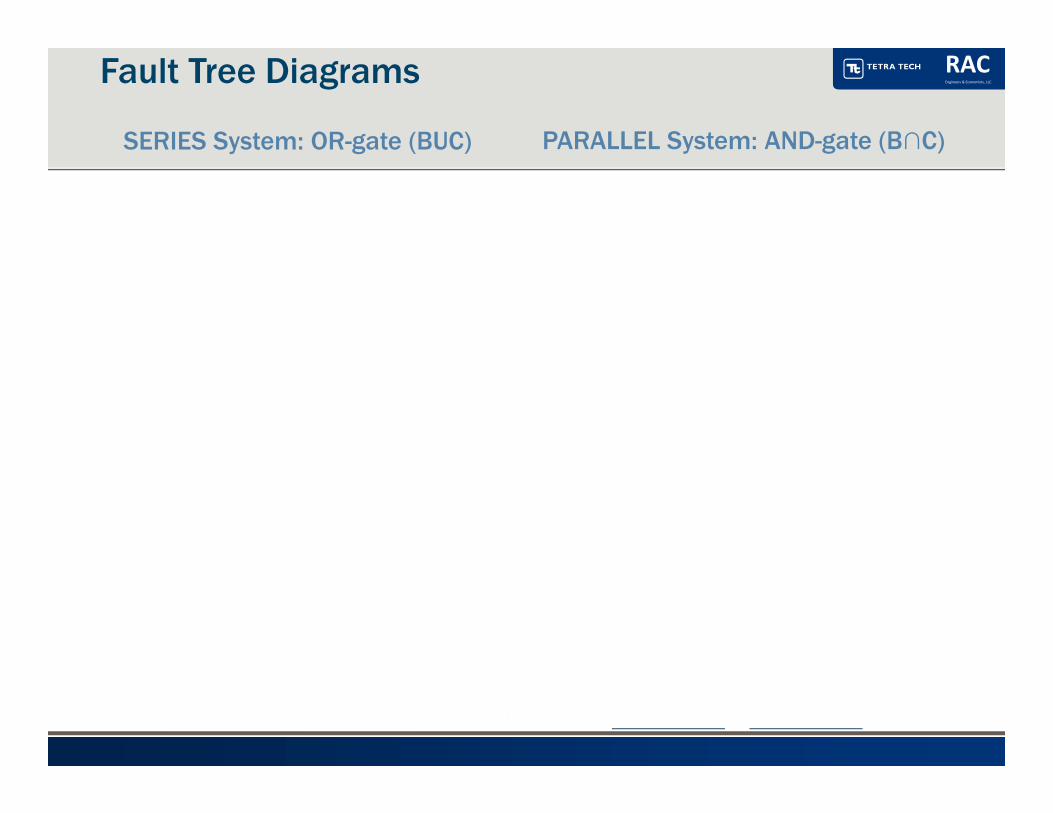
RACEngineers & Economists, LLCFault Tree Diagrams
SERIES System: OR-gate (BUC)
Failure of system A occurs if one or both of the input events B and C occur
PARALLEL System: AND-gate (B∩C)
Failure of system A occurs if both of the input events B and C occur
System A Fails
Event B Occurs
Event C Occurs
Event B Occurs
Event C Occurs
System A Fails
Event B Occurs
Event C Occurs
Input OutputEvent B Occurs
Event C Occurs
Input Output
System A
System A
OR-gate AND-gate
Top Event
Fault Events
RACEngineers & Economists, LLC
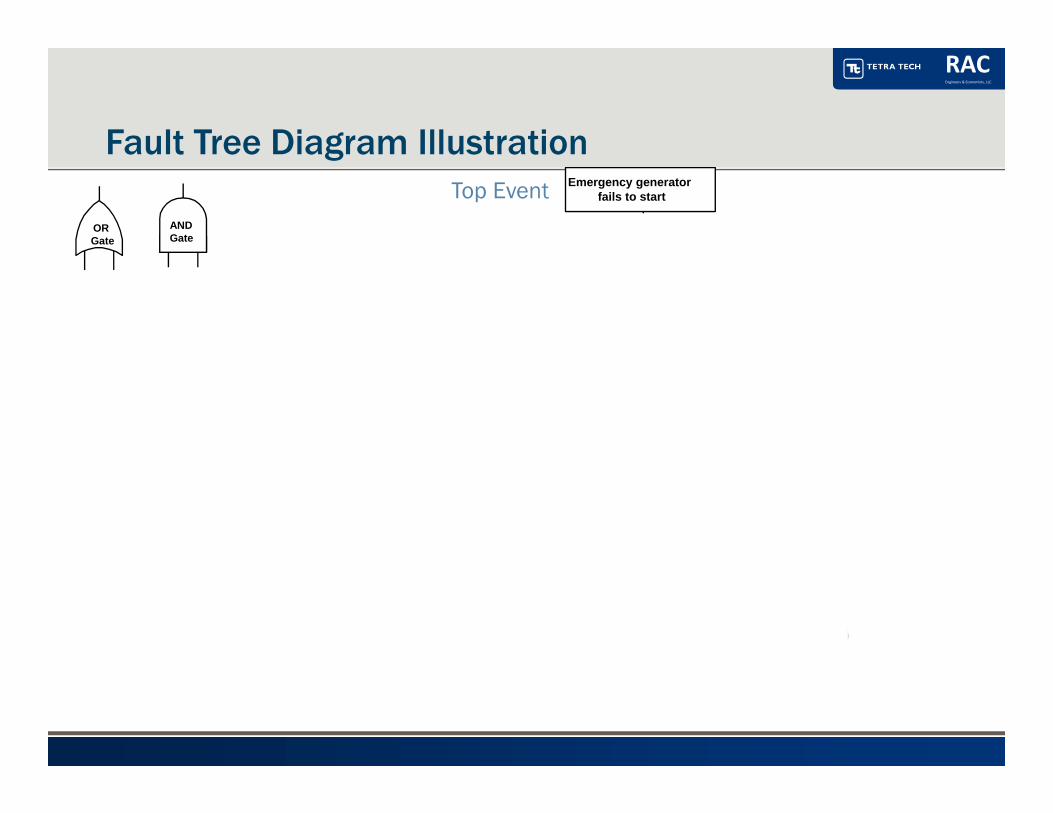
Fault Tree Diagram Illustration
ANDGate
ORGate
Emergency generatorfails to start
Fault in dieselgenerator
Mechanicalfault in diesel
generator
2
Fuel supplyproblem
Blockedfuel
intakeNofuel
Fault in start-up signalfor diesel generator
Fault insending the
signal
Fault inreception of
of signal
3
Fault intransmission
of signal
Top Event
Or-gate
Fault Events
Fault Events
Or-gateOr-gate
Or-gate
Basic Event
Transfer Event – Page 3

RACEngineers & Economists, LLC
Fault Tree Illustration: First Order Cut Sets
ANDGate
ORGate
Emergency generatorfails to start
Fault in dieselgenerator
Mechanicalfault in diesel
generator
2
Fuel supplyproblem
Blockedfuel
intakeNofuel
Fault in start-up signalfor diesel generator
Fault insending the
signal
Fault inreception of
of signal
3
Fault intransmission
of signal
Top Event
Or-gate
Fault Events
Fault Events
Or-gateOr-gate
Or-gate
Basic Event
Transfer Event – Page 3
Cut set - the event(s) that must occur simultaneously for a system to fail
True
True
TrueTrue
True
RACEngineers & Economists, LLC
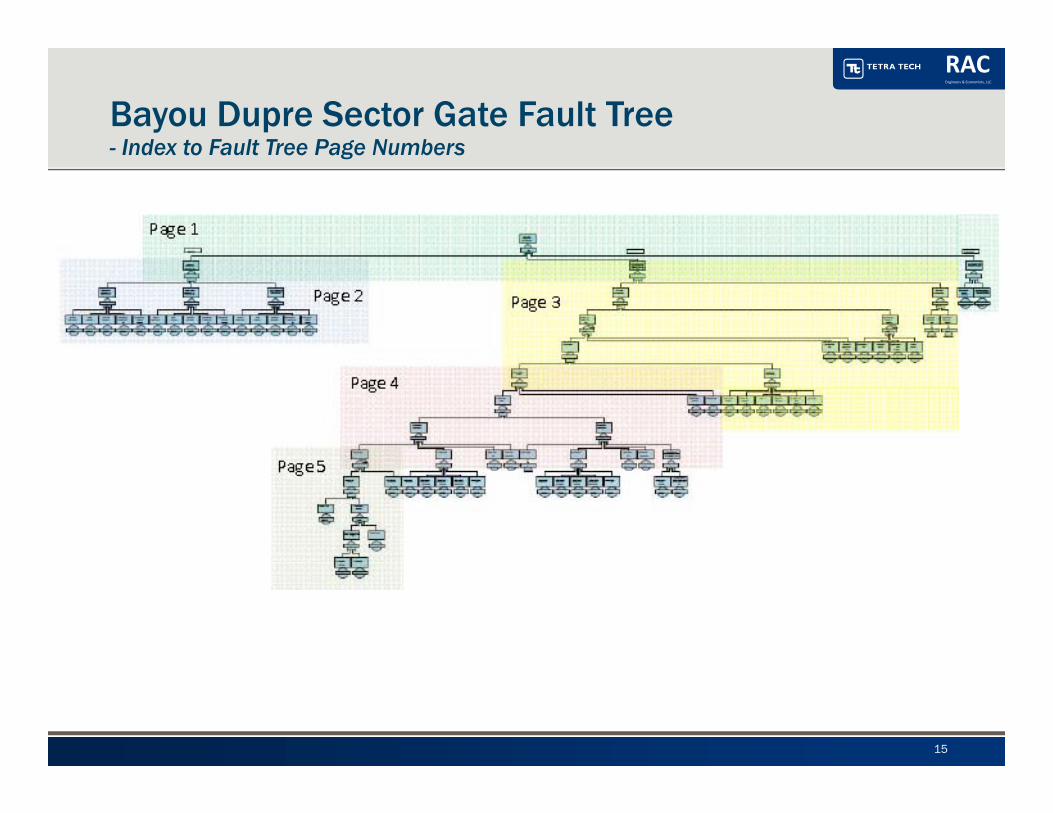
Bayou Dupre Sector Gate Fault Tree- Index to Fault Tree Page Numbers
15
RACEngineers & Economists, LLC
• A systematic procedure for the analysis of a system to identify the potential failure modes, their causes and effects on system performance
• The system is represented as a functional block diagram where performance of its elements can be defined
• The analysis proceeds in a bottom-up fashion until the end effect on the system is identified
• A thorough FMEA is a result of team work that stimulates the thought process, and ensures necessary expertise
• FMEA generally deals with individual failure modes and the effect of these failure modes on the system.
• Each failure mode is treated as independent.
Risk Framework - Failure Modes and Effects Analysis (FMEA) Overview
16

RACEngineers & Economists, LLC
PFM # Failure Progression Resulting ImpactsAdverse Factors
(more likely)
Favorable
Factors
(less likely)
Fault Tree
Analysis
Order
BD1* - BD125 Operators or equipment fail to reach the site in time to close the gates during
an event.
Uncontrolled flooding of the Central Wetlands and possible failure of the
secondary protection system.
A1, A2, A3 F1, F2 Third
BD126 – BD174 The Main Hydraulic Power Unit (HPU) fails due to either; failure of shared
electric cables, panel board failure, or failure of electric motor. In addition, the
Portable HPU fails due to; bad fuel, mechanical issues, blown hose, operator
injury, lack of knowledge, or the Portable HPU is unavailable. The gate is
then, unable to be closed manually via tugboat due to; lack of knowledge, lack
of written procedure, the tug boat breaks down or is unavailable.
Uncontrolled flooding of the Central Wetlands and possible failure of the
secondary protection system. Additional damage to the gates due to
vibration/surging
A3, A5, A8 F4, F12, F13 Third
BD174 – BD177 The Rack and Pinion fails. The gate is then, unable to be closed manually via
tugboat due to; lack of knowledge, lack of written procedure, the tug boat
breaks down or is unavailable.
Uncontrolled flooding of the Central Wetlands and possible failure of the
secondary protection system. Additional damage to the gates due to
vibration/surging
A3, A4 F5, F6 Second
BD178 – BD181 A hydraulic hose on one of the Hagglund Gear Motor bursts. The gate is then,
unable to be closed manually via tugboat due to; lack of knowledge, lack of
written procedure, tug boat breaks down or is unavailable.
Uncontrolled flooding of the Central Wetlands and possible failure of the
secondary protection system. Additional damage to the gates due to
vibration/surging
A3, A4, A5 F4, F5 Second
BD182 Debris accumulates on the sill that keep the gates from completely
closing/sealing during a storm surge or extratropical storm event. The gate is
then, unable to be closed manually via tugboat due to; lack of knowledge, lack
of written procedure, the tug boat breaks down or is unavailable.
Uncontrolled flooding of the Central Wetlands and possible failure of the
secondary protection system. Additional damage to the gates due to
vibration/surging.
A3, A6, A7 F6, F7, F11 First
BD183 The gate is severely damaged prior to the event by vessel or other impact and
is unable to close or seat properly. The gate is then, unable to be closed
manually via tugboat due to; lack of knowledge, lack of written procedure, the
tug boat breaks down or is unavailable.
Uncontrolled flooding of Central Wetlands and possible failure of the
secondary protection system. Additional damage to the gates due to
vibration/surging.
A3, A7 F8, F9, F10 First
FMEA Example – Bayou Dupre
17
From Initial FTA Cut Set
First Discussion of Consequences
Outside the HAZOP
Risk Elements to Possibly Mitigate
F6 – Regular Exercising, Operation and Maintenance
of Gates
Verbal Description of The Failure Mode –
Based on Block Diagram
Existing Risk Reduction Measures

RACEngineers & Economists, LLC
Basic Event Probability Estimation
Event Reliability (per demand) Descriptor
10-1 1 in 10 Critical
10-2 1 in 100 Low-Poor
10-3 1 in 1,000 Moderate
10-4 1 in 10,000 Moderate-High
10-5 1 in 100,000 High
10-6 1 in 1,000,000 Very High
• Initial Probability Estimates
• Expert elicitation▪ Probability mapping table
• Snap Shot in Time
• Resources: ▪ Project information▪ Off Shore (OREDA)▪ USACE: Age and frequency of
use-testing for flood control projects
▪ Industry failure rate data for mechanical hardware, electrical equipment
▪ Human reliability – available for individual actions –considered critical actions
• Life Safety and Operator Injuries are not accounted for
18

RACEngineers & Economists, LLC
• Estimated for each event as:▪ Zero hours for “Quick Fix” = Diagnosis plus repair is less than 1 hour
▪ Hours for diagnosis, decision and resolution
▪ “No” for times exceeding time available during gate closing – assigned a nominal value of “1,000” hours
• Estimates considered:▪ Diagnosis of problem
▪ Decision to repair
▪ Resources and Available Spare Parts
▪ Getting parts to site
▪ Repair
▪ Feasibility during emergency within total 96 hr. window
▪ Procedure Available/in-place
• Assume very low nominal probability for quick fixes under current situation = 1 in 10,000
• Sum Repair Times for each cut set and reduce gate unavailability to account for repairs
• Are repair times reasonable?
• Are spares or other resources (equipment, special skills) currently available or do procedures/contracts need to be developed?
• Are there opportunities for faster diagnosis and repair (based on importance) as risk reduction measures (RRMs)
Repair/Recovery Time
19
RACEngineers & Economists, LLC
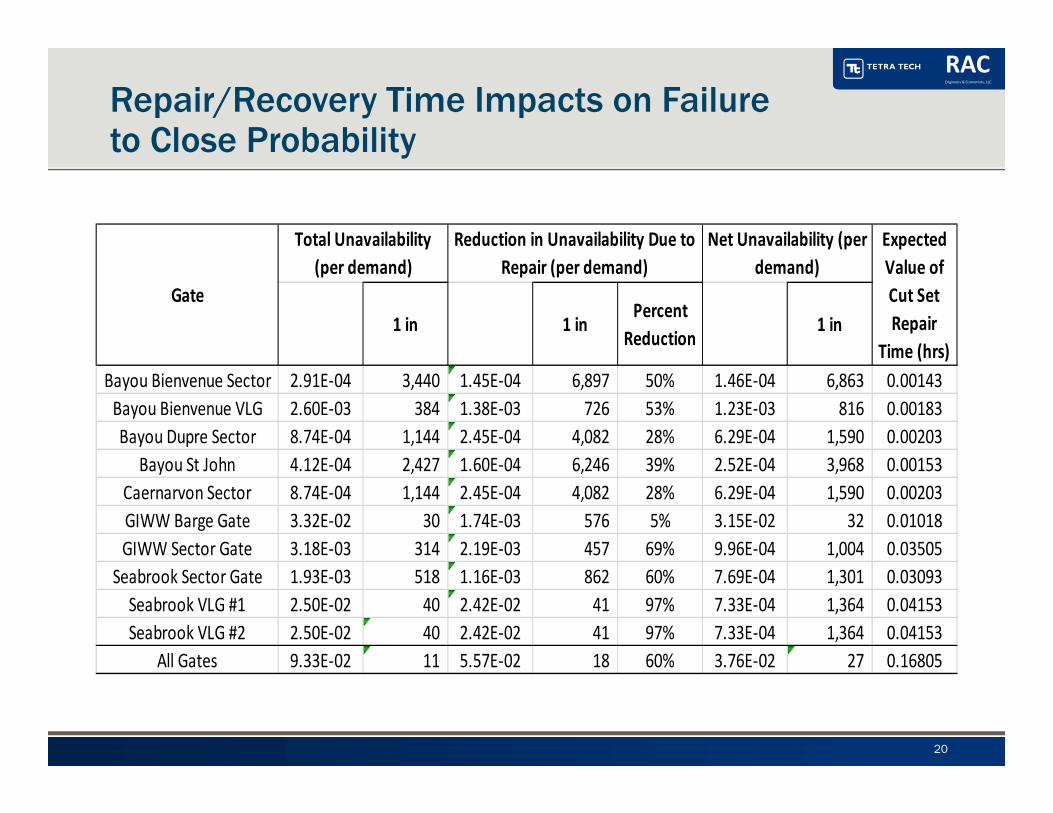
Repair/Recovery Time Impacts on Failure to Close Probability
20
1 in 1 inPercent
Reduction1 in
Bayou Bienvenue Sector 2.91E‐04 3,440 1.45E‐04 6,897 50% 1.46E‐04 6,863 0.00143Bayou Bienvenue VLG 2.60E‐03 384 1.38E‐03 726 53% 1.23E‐03 816 0.00183Bayou Dupre Sector 8.74E‐04 1,144 2.45E‐04 4,082 28% 6.29E‐04 1,590 0.00203
Bayou St John 4.12E‐04 2,427 1.60E‐04 6,246 39% 2.52E‐04 3,968 0.00153Caernarvon Sector 8.74E‐04 1,144 2.45E‐04 4,082 28% 6.29E‐04 1,590 0.00203GIWW Barge Gate 3.32E‐02 30 1.74E‐03 576 5% 3.15E‐02 32 0.01018GIWW Sector Gate 3.18E‐03 314 2.19E‐03 457 69% 9.96E‐04 1,004 0.03505
Seabrook Sector Gate 1.93E‐03 518 1.16E‐03 862 60% 7.69E‐04 1,301 0.03093Seabrook VLG #1 2.50E‐02 40 2.42E‐02 41 97% 7.33E‐04 1,364 0.04153Seabrook VLG #2 2.50E‐02 40 2.42E‐02 41 97% 7.33E‐04 1,364 0.04153
All Gates 9.33E‐02 11 5.57E‐02 18 60% 3.76E‐02 27 0.16805
Gate
Expected Value of Cut Set Repair
Time (hrs)
Total Unavailability (per demand)
Reduction in Unavailability Due to Repair (per demand)
Net Unavailability (per demand)
RACEngineers & Economists, LLC
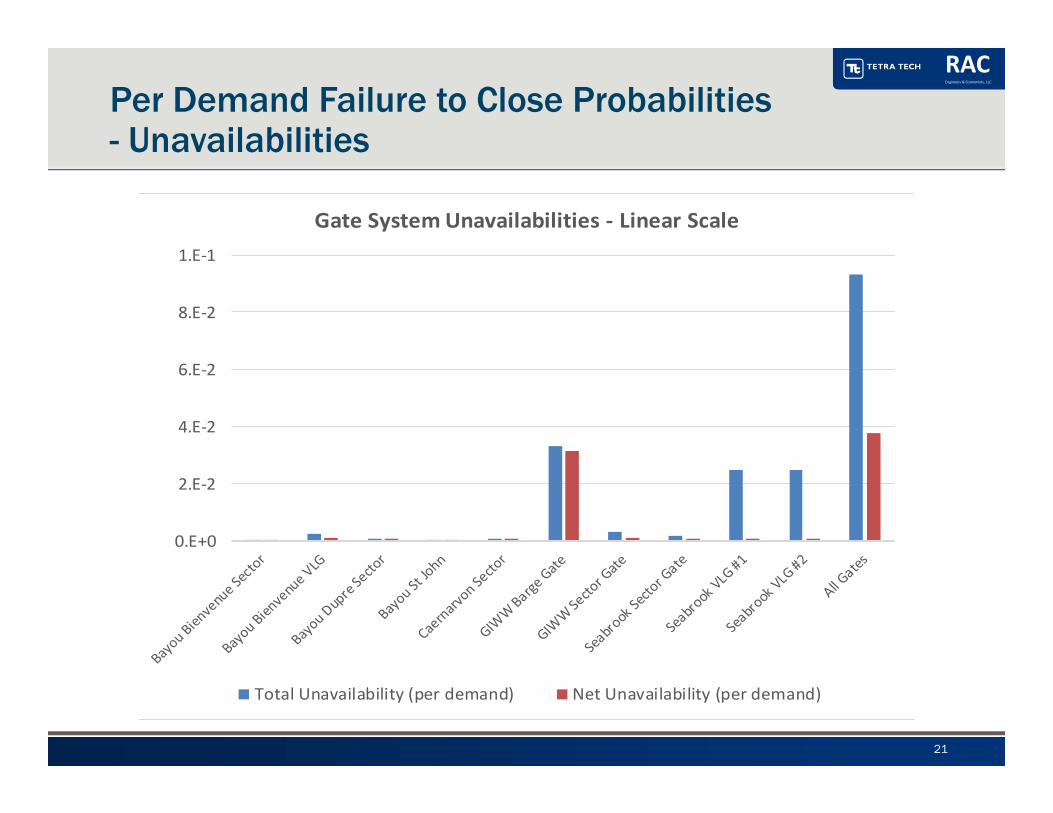
Per Demand Failure to Close Probabilities - Unavailabilities
21
0.E+0
2.E‐2
4.E‐2
6.E‐2
8.E‐2
1.E‐1
Gate System Unavailabilities ‐ Linear Scale
Total Unavailability (per demand) Net Unavailability (per demand)
RACEngineers & Economists, LLC
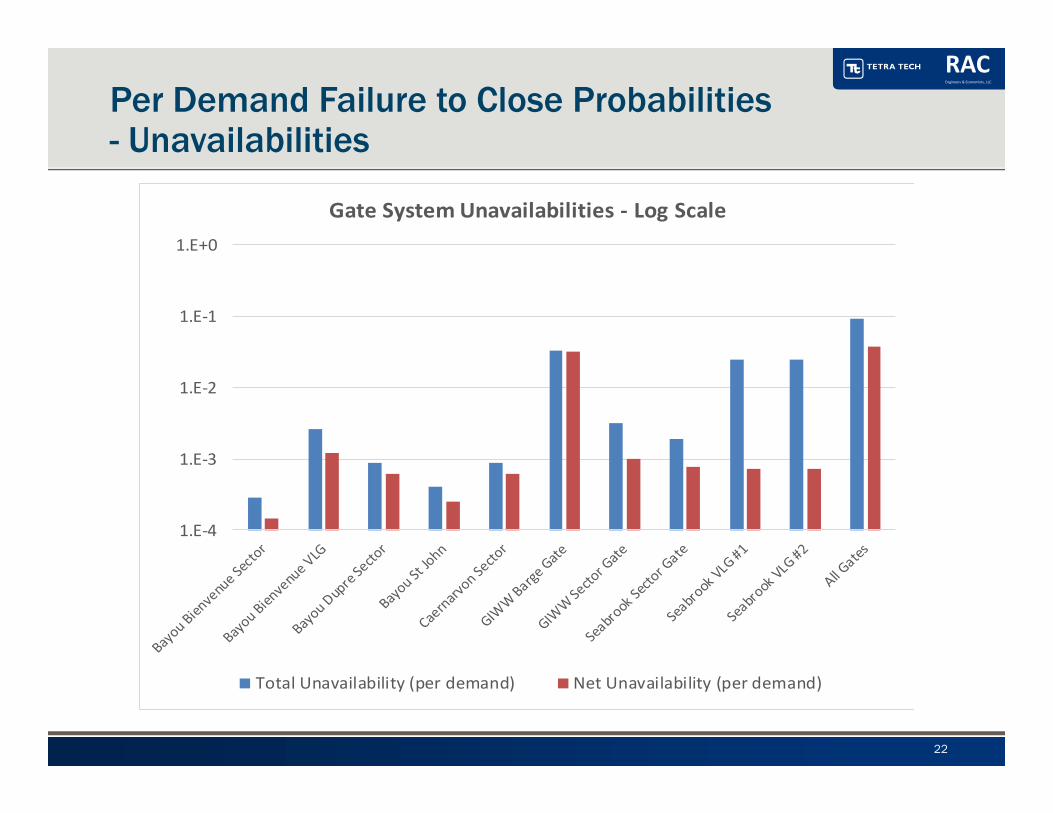
Per Demand Failure to Close Probabilities - Unavailabilities
22
1.E‐4
1.E‐3
1.E‐2
1.E‐1
1.E+0
Gate System Unavailabilities ‐ Log Scale
Total Unavailability (per demand) Net Unavailability (per demand)

RACEngineers & Economists, LLC
HAZOP Study
Gate System Components
Initial Fault Trees
Initial Cut Sets
Block Diagrams
Event Probabilities
Workshop
Existing Fail to Close Probs.
Reviews & Inspections
Risk Reduction Fail to Close Probs.
Initial Failure Modes
Spare Parts Inventory
Potential Risk Reductions
Risk Reduction RecommendationsRisk Reduction
Measures WorkshopRecommended Risk Reductions
System Consequences & Ann. Probs.Existing System
Conseqs. & Ann. Probs.Risk Reduction System Conseqs. & Ann. Probs.
Phase 1 Phase 2
Ranked Failure Modes
Failure Modes & Effects Analysis (FMEA)
Fault Tree Analysis (FTA): Per Demand Fail to Close Probs.
Abbreviations:Ann. AnnualConseqs. ConsequencesHAZOP Hazards and OperabilityProbs. Probabilities
Project Outcomes

RACEngineers & Economists, LLC
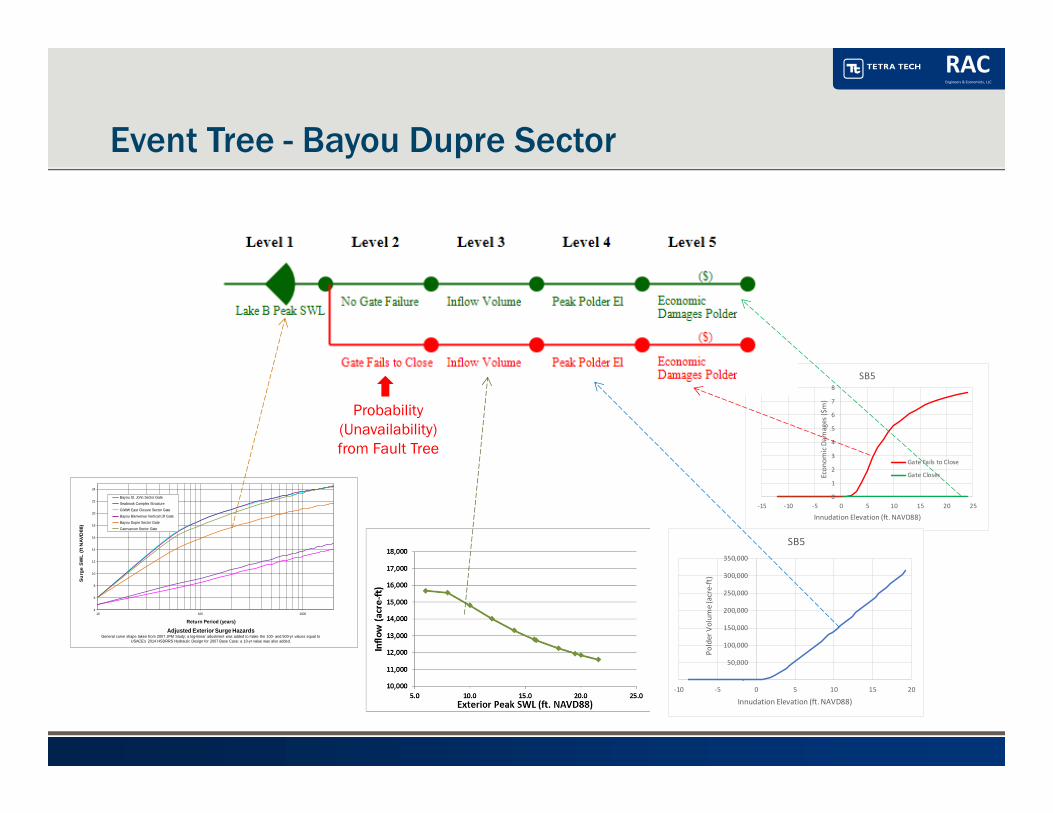
• Objective:▪ Quantify flooding and economic
impacts due to failure of gate to close under various loading conditions (50-year, 100-year, 500-year events)
• Consider event duration to estimate inflows
• Estimated Values▪ Frequency of surge levels in IHNC
basin and on exterior gates▪ Overtopping / breach assumptions of
IHNC floodwalls▪ Flood depths within polders▪ Converting flood depths to damage
estimates
System Consequences & Annual Probabilities
24
RACEngineers & Economists, LLC
0
1
2
3
4
5
6
7
8
‐15 ‐10 ‐5 0 5 10 15 20 25
Econ
omic Dam
ages ($m)
Innudation Elevation (ft. NAVD88)
SB5
Gate Fails to Close
Gate Closes
Event Tree - Bayou Dupre Sector
4
6
8
10
12
14
16
18
20
22
24
10 100 1000
Su
rge
SW
L (f
t NA
VD88
)
Return Period (years)
Adjusted Exterior Surge HazardsGeneral curve shape taken from 2007 JPM Study; a log-linear adustment was added to make the 100- and 500-yr values equal to
USACE's 2014 HSDRRS Hydraulic Design for 2007 Base Case; a 10-yr value was also added.
Bayou St. John Sector Gate
Seabrook Complex Structure
GIWW East Closure Sector Gate
Bayou Bienvenue Vertical Lift Gate
Bayou Dupre Sector Gate
Caervarvon Sector Gate
‐
50,000
100,000
150,000
200,000
250,000
300,000
350,000
‐10 ‐5 0 5 10 15 20
Polder Volum
e (acre‐ft)
Innudation Elevation (ft. NAVD88)
SB5
Probability (Unavailability) from Fault Tree
RACEngineers & Economists, LLC
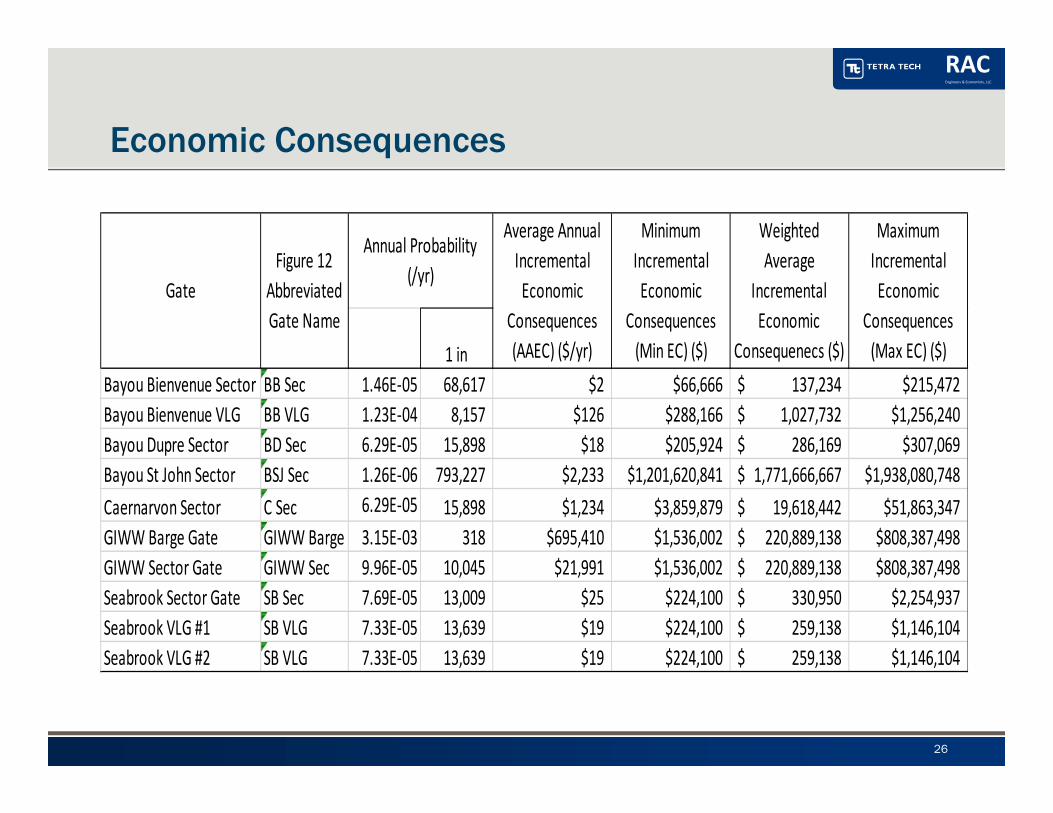
Economic Consequences
26
1 inBayou Bienvenue Sector BB Sec 1.46E‐05 68,617 $2 $66,666 137,234$ $215,472Bayou Bienvenue VLG BB VLG 1.23E‐04 8,157 $126 $288,166 1,027,732$ $1,256,240Bayou Dupre Sector BD Sec 6.29E‐05 15,898 $18 $205,924 286,169$ $307,069Bayou St John Sector BSJ Sec 1.26E‐06 793,227 $2,233 $1,201,620,841 1,771,666,667$ $1,938,080,748Caernarvon Sector C Sec 6.29E‐05 15,898 $1,234 $3,859,879 19,618,442$ $51,863,347GIWW Barge Gate GIWW Barge 3.15E‐03 318 $695,410 $1,536,002 220,889,138$ $808,387,498GIWW Sector Gate GIWW Sec 9.96E‐05 10,045 $21,991 $1,536,002 220,889,138$ $808,387,498Seabrook Sector Gate SB Sec 7.69E‐05 13,009 $25 $224,100 330,950$ $2,254,937Seabrook VLG #1 SB VLG 7.33E‐05 13,639 $19 $224,100 259,138$ $1,146,104Seabrook VLG #2 SB VLG 7.33E‐05 13,639 $19 $224,100 259,138$ $1,146,104
Figure 12 Abbreviated Gate Name
Gate
Annual Probability (/yr)
Average Annual Incremental Economic
Consequences (AAEC) ($/yr)
Minimum Incremental Economic
Consequences (Min EC) ($)
Weighted Average
Incremental Economic
Consequenecs ($)
Maximum Incremental Economic
Consequences (Max EC) ($)
RACEngineers & Economists, LLC
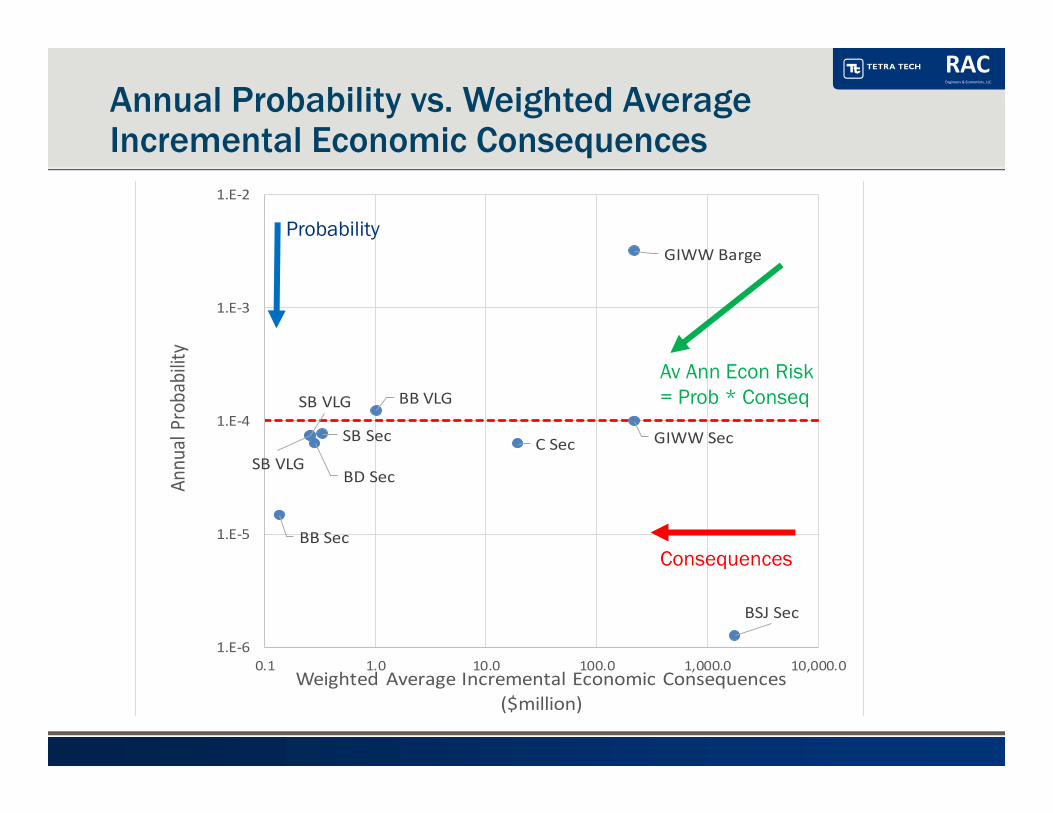
BB Sec
BB VLG
BD Sec
BSJ Sec
C Sec
GIWW Barge
GIWW SecSB Sec
SB VLG
SB VLG
1.E‐6
1.E‐5
1.E‐4
1.E‐3
1.E‐2
0.1 1.0 10.0 100.0 1,000.0 10,000.0
Annu
al Probability
Weighted Average Incremental Economic Consequences ($million)
Annual Probability vs. Weighted Average Incremental Economic Consequences
Probability
Consequences
Av Ann Econ Risk = Prob * Conseq

RACEngineers & Economists, LLC
HAZOP Study
Gate System Components
Initial Fault Trees
Initial Cut Sets
Block Diagrams
Event Probabilities
Workshop
Existing Fail to Close Probs.
Reviews & Inspections
Risk Reduction Fail to Close Probs.
Initial Failure Modes
Spare Parts Inventory
Potential Risk Reductions
Risk Reduction RecommendationsRisk Reduction
Measures WorkshopRecommended Risk Reductions
System Consequences & Ann. Probs.Existing System
Conseqs. & Ann. Probs.Risk Reduction System Conseqs. & Ann. Probs.
Phase 1 Phase 2
Ranked Failure Modes
Failure Modes & Effects Analysis (FMEA)
Fault Tree Analysis (FTA): Per Demand Fail to Close Probs.
Abbreviations:Ann. AnnualConseqs. ConsequencesHAZOP Hazards and OperabilityProbs. Probabilities
Project Outcomes
RACEngineers & Economists, LLC
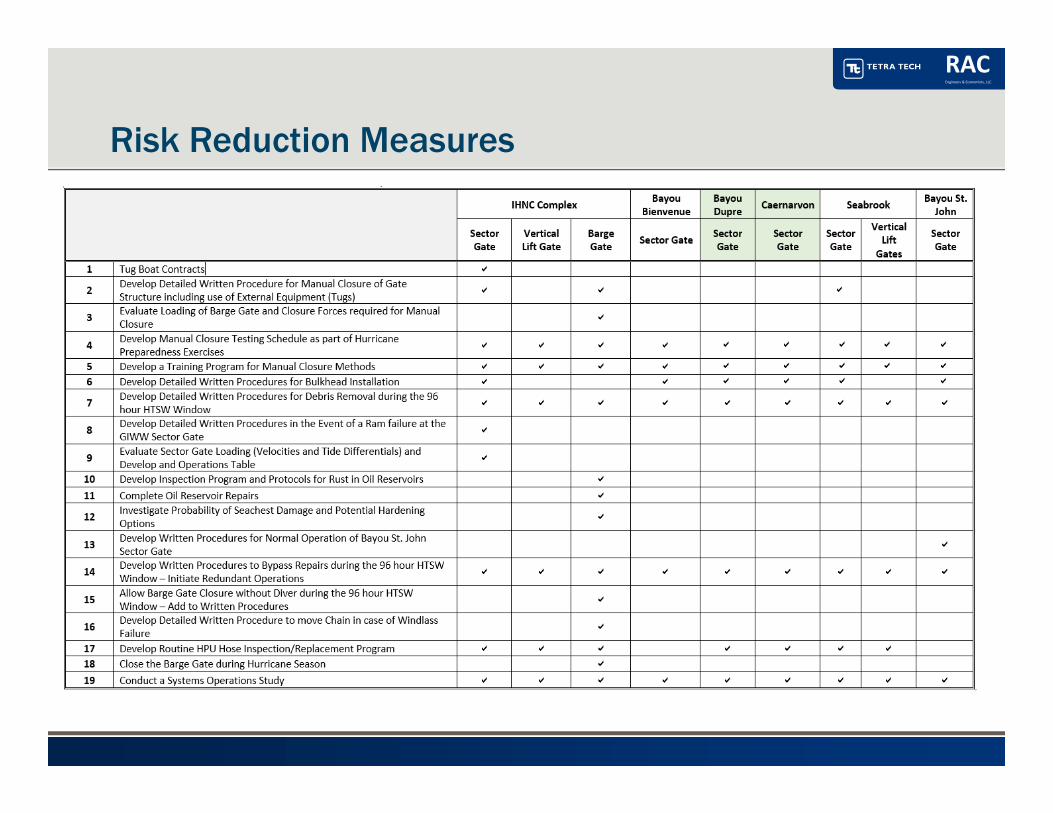
Risk Reduction Measures

RACEngineers & Economists, LLC
Risk Reduction Measures
RACEngineers & Economists, LLC
• Potential Future Benefits ▪ Periodic Update and Assessment▪ Modular
• Maintaining and Improving the Risk-Informed Decision Support Tool/Approach ▪ Maintenance Database Feedback
▪ System Performance
▪ Expand to System-Wide Application
▪ Updated Information – Economics, Fragility, CLARA Model
Risk-Informed Decision Support ToolRealizing Value Into the Future
RACEngineers & Economists, LLC
Robert Turner, Executive Director, Southeast Louisiana Flood Protection Authority – East
David Moore, PE (Tetra Tech)
614-289-0118
Questions?
32