Safer choices 2: Rationale, design issues, and baseline results in evaluating school-based health...
19
Safer Choices 2: Rationale, Design Issues, and Baseline Results in Evaluating School-Based Health Promotion for Alternative School Students Susan R. Tortolero a,* , Christine M. Markham a , Robert C. Addy a , Elizabeth R. Baumler a , Soledad Liliana Escobar-Chaves a , Karen Basen-Engquist b , Nicole K. McKirahan a , and Guys S. Parcel a a Center for Health Promotion and Prevention Research, School of Public Health, University of Texas Health Science Center at Houston, United States b School of Public Health, University of Texas Health Science Center at Houston, United States Abstract Background—Students attending ‘alternative’ high schools form relatively small, highly mobile high-risk populations, presenting challenges for the design and implementation of HIV-, other STI-, and pregnancy-prevention interventions. This paper describes the rationale, study design, and baseline results for the Safer Choices 2 program. Study Design—Modified group-randomized intervention trial with crossover of schools but not of students. The study cohort was defined a priori as those who completed the baseline measures and were still enrolled at the time of first follow-up. Design Results—Of 940 students initially enrolled in the study, 711 (76%) formed the study cohort. There were significant demographic differences between those included and those excluded from the study cohort in sex, age, sexual experience, experience with pregnancy, drug use, and some psychosocial measures. There were no significant differences between the intervention and control groups within the study cohort. The only significant difference between those students excluded from the intervention group and those excluded from the control group was reported age at first intercourse. Baseline Data Results—Students (n = 940) enrolled were predominately African-American (29.7%) and Hispanic (61.3%); 57.3% were female; 66% had ever had sex; and reported drug use in the previous 30 days ran from 4.3% (cocaine) to 26.9% (marijuana). Of the 627 sexually experienced, 41.8% reported their age at first intercourse as 13 years or younger; 28.5% reported ever being or having gotten someone pregnant; 74% reported sex in the past 3 months. Of the 464 sexually active in the last 3 months, 55.4% reported unprotected intercourse and 31.3% reported using drugs beforehand. Conclusion—The cross-over design will provide a rigorous test of the intervention; however, loss to follow-up of this population can result in some selection bias. Students attending dropout prevention and recovery schools are at high risk for HIV, STIs, and pregnancy, and are in need of interventions. *Corresponding author. Tel: +1 713 500 9634. E-mail address: E-mail: [email protected] (Susan Tortolero). Publisher's Disclaimer: This is a PDF file of an unedited manuscript that has been accepted for publication. As a service to our customers we are providing this early version of the manuscript. The manuscript will undergo copyediting, typesetting, and review of the resulting proof before it is published in its final citable form. Please note that during the production process errors may be discovered which could affect the content, and all legal disclaimers that apply to the journal pertain. NIH Public Access Author Manuscript Contemp Clin Trials. Author manuscript; available in PMC 2009 July 6. Published in final edited form as: Contemp Clin Trials. 2008 January ; 29(1): 70–82. doi:10.1016/j.cct.2007.05.003. NIH-PA Author Manuscript NIH-PA Author Manuscript NIH-PA Author Manuscript
Transcript of Safer choices 2: Rationale, design issues, and baseline results in evaluating school-based health...

Safer Choices 2: Rationale, Design Issues, and Baseline Resultsin Evaluating School-Based Health Promotion for AlternativeSchool Students
Susan R. Tortoleroa,*, Christine M. Markhama, Robert C. Addya, Elizabeth R. Baumlera,Soledad Liliana Escobar-Chavesa, Karen Basen-Engquistb, Nicole K. McKirahana, and GuysS. Parcelaa Center for Health Promotion and Prevention Research, School of Public Health, University of Texas HealthScience Center at Houston, United States
b School of Public Health, University of Texas Health Science Center at Houston, United States
AbstractBackground—Students attending ‘alternative’ high schools form relatively small, highly mobilehigh-risk populations, presenting challenges for the design and implementation of HIV-, other STI-,and pregnancy-prevention interventions. This paper describes the rationale, study design, andbaseline results for the Safer Choices 2 program.
Study Design—Modified group-randomized intervention trial with crossover of schools but notof students. The study cohort was defined a priori as those who completed the baseline measuresand were still enrolled at the time of first follow-up.
Design Results—Of 940 students initially enrolled in the study, 711 (76%) formed the studycohort. There were significant demographic differences between those included and those excludedfrom the study cohort in sex, age, sexual experience, experience with pregnancy, drug use, and somepsychosocial measures. There were no significant differences between the intervention and controlgroups within the study cohort. The only significant difference between those students excluded fromthe intervention group and those excluded from the control group was reported age at first intercourse.
Baseline Data Results—Students (n = 940) enrolled were predominately African-American(29.7%) and Hispanic (61.3%); 57.3% were female; 66% had ever had sex; and reported drug use inthe previous 30 days ran from 4.3% (cocaine) to 26.9% (marijuana). Of the 627 sexually experienced,41.8% reported their age at first intercourse as 13 years or younger; 28.5% reported ever being orhaving gotten someone pregnant; 74% reported sex in the past 3 months. Of the 464 sexually activein the last 3 months, 55.4% reported unprotected intercourse and 31.3% reported using drugsbeforehand.
Conclusion—The cross-over design will provide a rigorous test of the intervention; however, lossto follow-up of this population can result in some selection bias. Students attending dropoutprevention and recovery schools are at high risk for HIV, STIs, and pregnancy, and are in need ofinterventions.
*Corresponding author. Tel: +1 713 500 9634. E-mail address: E-mail: [email protected] (Susan Tortolero).Publisher's Disclaimer: This is a PDF file of an unedited manuscript that has been accepted for publication. As a service to our customerswe are providing this early version of the manuscript. The manuscript will undergo copyediting, typesetting, and review of the resultingproof before it is published in its final citable form. Please note that during the production process errors may be discovered which couldaffect the content, and all legal disclaimers that apply to the journal pertain.
NIH Public AccessAuthor ManuscriptContemp Clin Trials. Author manuscript; available in PMC 2009 July 6.
Published in final edited form as:Contemp Clin Trials. 2008 January ; 29(1): 70–82. doi:10.1016/j.cct.2007.05.003.
NIH
-PA Author Manuscript
NIH
-PA Author Manuscript
NIH
-PA Author Manuscript

KeywordsRandomized Controlled Trial; Group Randomized Trial; Adolescent; Sexual Behavior; HIVInfections/prevention and control; Sexually Transmitted Diseases/prevention and control; Pregnancyin Adolescence/prevention and control; Sex Education; African-Americans; Hispanic-Americans;Unsafe Sex
1. Introduction and backgroundHIV, other sexually transmitted infections (STIs), and teen pregnancy are major public healthproblems for adolescents. In the US, nearly one-half of all STIs occur in young people underthe age of 25, with an estimated 9.1 million new STI cases in that age group in 2000. [1]Minority youth are at particularly high risk for STIs, HIV, and pregnancy [2–4]: In 2003, ofreported AIDS cases among 13- to 19-year-olds, 87% were among Black and Hispanic youth.[5]
While a number of research studies have developed and tested interventions to address theseproblems in mainstream school settings [6–12], this approach often fails to reach students whorun the greatest risk of HIV infection [6]. One possible way of reaching a higher-risk populationof students is through implementing programs in alternative schools. Nationally, these schoolshad an enrollment of 612,900 students (1.3% of all public school students) as of October 1,2000. Students may be assigned to attend alternative schools for a variety of reasons, includingbehavioral problems, truancy, excessive absenteeism, poor grades, or pregnancy. Students inalternative schools are more likely to engage in behaviors that put them at high risk ofcontracting HIV [13–16]. The 1998 national Alternative High School Youth Risk BehaviorSurvey (ALT-YRBS) found that 87.8% of students reported having had sexual intercourseduring their lifetime [13], compared to 49.9% of students in regular high schools in 1999[17]. Alternative school students were also more likely to have initiated sexual intercourse atan early age, less likely to report using condoms at last sexual intercourse, and almost twiceas likely to report using alcohol or drugs at last sexual intercourse [13,16,17].
While alternative schools provide a point of access to high-risk adolescents, they also give theresearcher several challenges in designing and evaluating health promotion programs using arandomized trial design. This paper addresses some of the design and methodological issuesin conducting a school-based intervention trial in alternative schools, in the context of adescription of the rationale, study design, and baseline results of a particular intervention. Thediscussion may also be useful for those designing intervention trials to evaluate programs forother settings, such as clinics or community groups, where a small number of groups is availablefor randomization and populations are both high-risk and highly mobile.
2. Study DesignSafer Choices 2 is a 5-year research study to adapt, implement, and evaluate a theoreticallybased, multi-component HIV-, STI-, and pregnancy-prevention program, Safer Choices [7],for use in alternative schools. The adaptation process and program content of Safer Choices 2is described elsewhere [18]. The adapted program consists of 15 lessons, a video, and journalingactivities delivered in a classroom setting by a trained facilitator over an 8-week period. Theintervention is based on social cognitive theories [19] and includes skill-based and experientialactivities. The overall goal of the Safer Choices 2 intervention trial was to evaluateexperimentally the impact of the Safer Choices 2 program in reducing levels of unprotectedsexual intercourse relative to those in the comparison condition.
Tortolero et al. Page 2
Contemp Clin Trials. Author manuscript; available in PMC 2009 July 6.
NIH
-PA Author Manuscript
NIH
-PA Author Manuscript
NIH
-PA Author Manuscript

2.1 Cross-over and randomizationThe goal of any comparative trial is to provide the basis for valid inference that the interventionas implemented caused the result as observed [20]. Currently, the most well-accepted studydesign for assessing the efficacy of school-based interventions is the group-randomized trial,whereby schools are the unit of randomization and students are nested within schools [20].This usual type of design has methodological as well as practical advantages for conductingschool-based research, particularly when examining both individual and school effects fromthe intervention.
The first challenge a researcher faces when using alternative schools as research sites is thatthe number of alternative schools available to randomize is usually limited. Moreover, thereis greater variation among alternative schools in size of the student population, ethnic and racialcomposition, and enrollment criteria: different alternative schools may serve significantlydifferent populations (e.g., adjudicated youth, pregnant and parenting youth, or youth who havefailed academically). It can therefore be difficult to identify enough schools with similarcharacteristics for randomization into comparable groups. The limited number of alternativeschools in any one geographic location and the costs of expanding to a larger geographic regionrestricts our ability to randomize a large number of schools to each condition, which is thetypical way of dealing with this selection issue in school-based research. The nature andcomposition of alternative schools necessitate a different approach.
For this study, we used a modified group-randomized intervention trial to test the effectivenessof the program, as illustrated in Figure 1. The study was to be conducted in two waves. ForWave 1, 10 alternative schools were to be randomized (5 to intervention and 5 to comparisonconditions), and then 500 students recruited and enrolled into the study. For Wave 2, thetreatment conditions among the schools were to be crossed over and 500 new students enrolledinto the study. Recruitment and measurement of Wave 1 and Wave 2 cohorts were conductedone year apart to ensure that the rapidly changing developmental trajectories were relativelyconsistent between cohorts, and that the timing of measurement relative to the school year andholidays was consistent between waves.
Sample size calculations were carried out for each of the primary study outcomes; estimateswere made of the sample sizes necessary to ensure 80% power to detect a significant differencefor each of the primary outcomes between the intervention and control conditions at all threeendpoints. The original sample size calculations were done assuming that the analysis wouldbe performed using continuous outcomes. From previous research on the Safer Choices project,the number of occasions of unprotected sexual intercourse was estimated to have a mean of2.57 (3.40) at the six-month follow-up, 2.87 (3.67) at the 12-month follow-up, and 3.50 (3.77)at the 24-month follow-up [7,21]. We judged that a 35% reduction in the number of occasionsof unprotected sexual intercourse was important to detect. For example, if the control meanwere 2.50, a 35% reduction in the intervention condition would result in a mean of 1.63. (Theoriginal randomized trial of the original Safer Choices program showed a 56% reduction in themean number of occasions of unprotected sexual intercourse.) Assuming an intra-schoolcorrelation of 0.01 and two waves of intervention each consisting of 10 schools, the proposedsample size would yield at least 80% power to detect the hypothesized intervention effect ateach follow-up.
Intra-class correlation among students in the same school was also accounted for in samplesize estimation, and sample sizes were inflated accordingly using an intra-class correlation of0.01 [21]. We estimated that, due to attrition, we would retain 90% of the randomized studentsat the 3-month follow-up, 80% at the 12-month follow-up, and 70% at the 24-month follow-up. Final recruitment sample size was then determined based on the sample size calculations,attrition estimation, and recruitment feasibility. Baseline measurements were to be conducted
Tortolero et al. Page 3
Contemp Clin Trials. Author manuscript; available in PMC 2009 July 6.
NIH
-PA Author Manuscript
NIH
-PA Author Manuscript
NIH
-PA Author Manuscript

prior to implementation of the intervention, and post-intervention measurements were plannedfor 3, 12, and 24 months.
To increase comparability of study groups, before randomization we used a modified versionof the Multiattribute Utility Measurement (MAUM) procedure as described by Graham et al.[22]. The MAUM procedure uses principal components analysis to assign a score for eachschool on a single composite blocking factor. For this study, the blocking factor was used totake into account the percentage of Hispanic students, percentage of African-Americanstudents, and the overall number of students at each school. The MAUM procedure tends toassure balance on the ranking factor and thus on the underlying components of the score. Theten schools were ranked according to the score. Each adjacent pair of schools was then split,with one school assigned at random to either the intervention or control group and its partnergoing to the other group for the first year, with group assignment changing in the second year.
What we did not allow for in planning was the closure of a school after the first year of thestudy. When this happened, the effects were three-fold: First, the school could not be crossed-over to the other condition in Wave 2. Second, a new group of students could not be recruitedfrom that school for Wave 2. Third, the students recruited from that school for Wave 1 wereall lost to long-term follow-up. As the complete loss of a school meant loss of the data forschool-level effects, we made the decision to exclude that school’s 34 students recruited inWave 1 from all analyses. Accordingly, Figure 2 shows a total of 940 students in 9 schools.
2.2 Cohort definitionA second challenge in evaluating the effectiveness of any randomized intervention trial is thedetermination of the cohort: who will be followed to establish whether the intervention iseffective. This is a particularly important problem when recruiting and following a populationthat is both high-risk and highly mobile [23]. The alternative school population is such apopulation; the drop-out rate is high and many students leave for other reasons (e.g., returningto their originating school). Many alternative schools have a rapid turnover of students, withteens enrolled only for 3 or 6 months, then returning to their originating school. Few alternativeschools have stable populations from year to year. As a result, the one-year interval betweenWaves enabled us to have different samples, thereby minimizing cross-arm contamination. Atthe same time, the mobility of this population meant that 12-month followup would requiretracking the widely dispersed students back to, e.g., their originating schools, worksites, andmilitary postings.
While this population needs to be targeted for interventions, standard study designmethodology for school-based intervention research may create nearly insupportable obstacles.Rather than defining the study cohort as those students who consented to participate andcompleted a baseline survey, we a priori defined the Safer Choices 2 study cohort as thosewho both completed the baseline survey and who were still enrolled in the school at the firstfollow-up, which averaged 4 months. This exclusion from the study cohort applied equally tostudents in the intervention and in the control conditions.
2.3 HypothesesWith respect to the study design, we tested two hypotheses. The first hypothesis concerns thea priori definition of the study cohort as those both completing baseline measures and stillenrolled in the same school at the time of first follow-up. The second hypothesis concerns thefeasibility of using a cross-over design and the MAUM procedure to assure comparableintervention and comparison groups.
1. Students included and excluded from the study cohort (based on completion ofbaseline data and enrollment in school at first follow-up) are not significantly different
Tortolero et al. Page 4
Contemp Clin Trials. Author manuscript; available in PMC 2009 July 6.
NIH
-PA Author Manuscript
NIH
-PA Author Manuscript
NIH
-PA Author Manuscript

regarding demographic characteristics, sexual risk behaviors, or psychosocialvariables as measured at baseline.
2. Students in the intervention and control groups are not significantly differentregarding demographic characteristics, sexual risk behaviors, or psychosocialvariables as measured at baseline.
Figure 2 shows the organization of the tables used to report the analyses done to test thesehypotheses.
3. Study Participants3.1.1 Target schools
The inclusion criteria for schools were that they be in the metropolitan area where the studywas conducted, have students in 9th and 10th grades, have a school-wide enrollment of at least100 students, and be alternative schools in the sense that they were focused on dropoutprevention and recovery (high-risk students). The largest school district in the metropolitanarea assisted in locating appropriate schools. The school district itself had 2 schools that metcriteria and had 2 additional private schools under contract; 5 charter schools to which itreferred students also qualified. The tenth school was in an adjoining school district. The schoolthat closed after the first year was one of the charter schools.
3.1.2 Target study populationBecause many of the schools had mixed-grade classrooms, the target population could not bereasonably restricted to 9th and 10th grades. Some schools had ungraded classes, grouped bysubject mastery; others had “pods” targeted to grade level; most had a wide range of agesattending. The target population was therefore English-speaking students enrolled in 7th-through 12th-grade classes in 10 alternative schools located in a large urban school district insoutheast Texas. Students are in these programs for a variety of reasons including low schoolperformance, high absenteeism, truancy, behavior problems, social problems, pregnancy, orbeing in the juvenile justice system. All of the students enrolled in the identified schools areconsidered high-risk adolescents; an estimated 3,605 students were enrolled at the time of thebaseline survey. Study staff recruited subjects by providing information to all students enrolledin the schools and by distributing study materials and consent forms to all students, up to threetimes. Study staff and students were masked as to treatment condition at the time of subjectrecruitment for the Wave 1 data collection. While students at Wave 2 recruitment were unawareof treatment condition, study staff were not masked as to treatment condition assigned toschools during Wave 2 recruitment. The target sample size was to enroll approximately 50students per school.
3.2 ConsentActive parental and student consent were obtained by three rounds of distributing informationand parental consent forms to students in class to take home. To increase participation rates,two $5 gift certificates were offered as incentive to the students, one for returning the consentform and one for participating in the baseline survey. The study received approval from theCommittee for the Protection for Human Subjects at the University of Texas Health ScienceCenter at Houston (HSC-SPH-99-056) and conformed to the principles of the Declaration ofHelsinki.
Tortolero et al. Page 5
Contemp Clin Trials. Author manuscript; available in PMC 2009 July 6.
NIH
-PA Author Manuscript
NIH
-PA Author Manuscript
NIH
-PA Author Manuscript

4. Data CollectionBaseline data were collected in two waves: between November 2000 and March 2001, andbetween November 2001 and March 2002. Data collection for the first follow-up occurred inthe period 3–5 months after the intervention was completed, most commonly at 4 months.
Data collection was done in school, during regular school hours, by audio computer-assistedinterviews (A-CASI) using laptops computers, set up in private meeting rooms and equippedwith headphones to maintain privacy. The use of talking computers has been found to be aneffective and reliable method for obtaining confidential information such as sexual risk-takingbehaviors, and previous studies indicate that adolescents are more likely to disclose sensitiveinformation such as sexual experience when using talking computers [24–29]. Because allquestions are recorded and played back as audio tracks, the use of A-CASI overcomes problemsyouth might have with reading surveys. The data collection staff gave a brief overview of howto use the computer, and the respondent could ask the data collection staff questions, if needed.Students were again assured that their participation was voluntary and that neither their parentsnor their teachers would see their responses. To protect confidentiality, a unique identificationnumber was assigned to each respondent. Due to the nature of the design and the intervention,masking of the treatment groups themselves was not possible; however, data collectors andanalysts were blinded to the treatment conditions.
5. Study MeasuresMeasures were adapted from the Safer Choices questionnaire, which was developed incooperation with the Centers for Disease Control and Prevention and demonstrated to be validand reliable [30]. All measures had been extensively pilot-tested and used among populationsof multi-ethnic, urban-dwelling public school students. It was known at the outset that themajority of students in these schools are sexually experienced, and that it was likely many ifnot most were also currently sexually active; both the content of the intervention and themeasures used reflected these realities. The self-report measures assessed demographiccharacteristics, sexual behaviors, drug behaviors, and sexuality-related psychosocial factors.Based on then-current popularities, drug behaviors queried were the use in the previous 30days of marijuana, cocaine, and codeine cough syrup. Psychosocial factors measured includedattitudes, knowledge, perceived normative beliefs, self-efficacy, and perceived barriers tocondom use. Table 1 lists the psychosocial measures with their response format (e.g., yes/no,Likert scale) and Cronbach’s alpha. The primary outcomes to be examined to evaluate theeffectiveness of the intervention trial will be the proportion of students ever having sexualintercourse, the proportion of students engaging in sexual intercourse in the past 3 months, andthe proportion of students having unprotected sexual intercourse in the previous 3 months. Inlooking at all three factors—initiation, lifetime history, and current activity—the intention isto give a picture of the prevalence and incidence of the behavior in the study population.
6. Statistical MethodsThe primary goal of the analysis was to profile students in each of the study groups to ensurecomparability between groups. The secondary purpose of the analysis was to look at thecharacteristics of those students retained in the cohort vs. those excluded. The results from thisanalysis helped with the ability to generalize the results to the larger population. For both setsof analyses, descriptive statistics were used to profile the characteristics of the groups(intervention vs. control and excluded vs. included). Means and standard deviations werecalculated for the psychosocial and behavioral outcomes at baseline. Distributions of the keydemographic measures were also explored in order to identify any key differences between theintervention and control conditions as well as between those students who were included vs.
Tortolero et al. Page 6
Contemp Clin Trials. Author manuscript; available in PMC 2009 July 6.
NIH
-PA Author Manuscript
NIH
-PA Author Manuscript
NIH
-PA Author Manuscript

excluded from the cohort. Chi-square and t-tests were carried out to formally test for statisticaldifferences between the two sets of conditions with regard to these measures. It was anticipatedthat some intra-class correlation (ICC) would be present among students in the same school.The presence of intra-class correlations can lead to an underestimation of the standard error,which in turn can lead to an increased type I error (probability of falsely finding a significantdifference). Because the tests carried out in this analysis were looking to show no differencesbetween groups, no adjustment for ICC would in fact lead to a more conservative test (a slightlyincreased risk of finding a difference that may not be present). Based on this rational and forsimplicity of analysis and interpretation, no adjustment for ICC was made.
7. ResultsFigure 2 shows the recruitment and retention of the study sample and the organization of thetables reporting the analyses done to test the hypotheses discussed in this paper.
Table 2 displays the overall demographic and behavioral and Table 3 the psychosocialcharacteristics of the study sample, of those students enrolled at the end of the spring semesterand included in the study cohort compared to those not enrolled and excluded, and of those inthe intervention group compared to the control group. Of the 940 students enrolled in theprogram at baseline, 61% were Hispanic, 30% were African American, and 9% were classifiedas “other ethnicities” (White, Asian, and mixed race/ethnicity). The age of students rangedfrom 12 to 20 years, with a median age of 16 years, and 57% were female. As expected, themajority of students had been sexually active, and, among those, more than a quarter had beenpregnant or had gotten someone pregnant. Almost one-quarter (n = 229) of students who hadinitially enrolled in the study and completed baseline were not enrolled in school by the endof the spring semester, and therefore were not considered as part of the cohort to follow.Reasons for not being enrolled in school included dropping out of school, completing highschool requirements and graduating, being arrested, and moving back to their originatingschool. Because of the substantial number (24%) of students who were excluded from thestudy, it is important to understand the differences between those who remained in the studyand those who were excluded from the cohort definition to determine whether a substantialselection bias exists.
Those who were excluded from the study cohort did not differ by race/ethnicity, by the gradesthey made in school, or by the educational level of their parents from those included. Therewere significant differences by gender and age: of the 401 boys initially enrolled in the study,113 (28%) were not enrolled at the spring semester, whereas of the 539 girls initially enrolled,116 (22%) were not enrolled at the end of spring semester. As a result, the included andexcluded groups had different gender ratios (p<.02). Older students were significantly morelikely to not be still enrolled by the end of the spring semester than younger students: 28% ofexcluded students were 18 or more years of age compared to 16% of students included. Incontrast, 5% of excluded students were 13 years of age or younger while 14% of students inthe included group were in that age group.
In examining sexual behavior of those who were included in the study cohort compared tothose who were excluded, those who were excluded from the study had higher levels of everhaving sexual intercourse (85.6% vs. 60.6%). No differences were observed with regard to ageat first intercourse, proportion having sexual intercourse in the last 3 months, or proportionconsistently using condoms. However, those who were excluded from the study were morelikely to have been pregnant or have gotten someone pregnant (37.8% vs. 24.4%), to havereported using drugs before sexual intercourse (37.5% vs. 28.3%), and to report usingmarijuana, cocaine, or codeine in the past 30 days.
Tortolero et al. Page 7
Contemp Clin Trials. Author manuscript; available in PMC 2009 July 6.
NIH
-PA Author Manuscript
NIH
-PA Author Manuscript
NIH
-PA Author Manuscript

Those who were included in the study cohort had more positive attitudes about delaying sexualintercourse and using condoms, but had significantly less knowledge about sexuallytransmitted infections. Students who were enrolled in the study cohort reported moreconfidence in refusing sex, but less confidence in using a condom during sex, while at the sametime identifying more barriers to using condoms than those who were dropped from the study.Those included in the study believed it was more normative to have sexual intercourse. Nodifference in the 2 groups were seen in knowledge, normative beliefs in using condoms, or inself-efficacy in communicating about sex to their partners.
Of the students enrolled in the study cohort, no differences by intervention and control statuswere observed in demographic factors including ethnicity, gender, age, grades in schools, andfamily education. In addition no differences in sexual risk-taking variables, such as age at firstintercourse, ever having sexual intercourse, being currently sexually active, and consistentcondom use, were seen between intervention and control groups. Further, no differencesbetween the intervention and control groups were seen for drug use or for the psychosocialvariables.
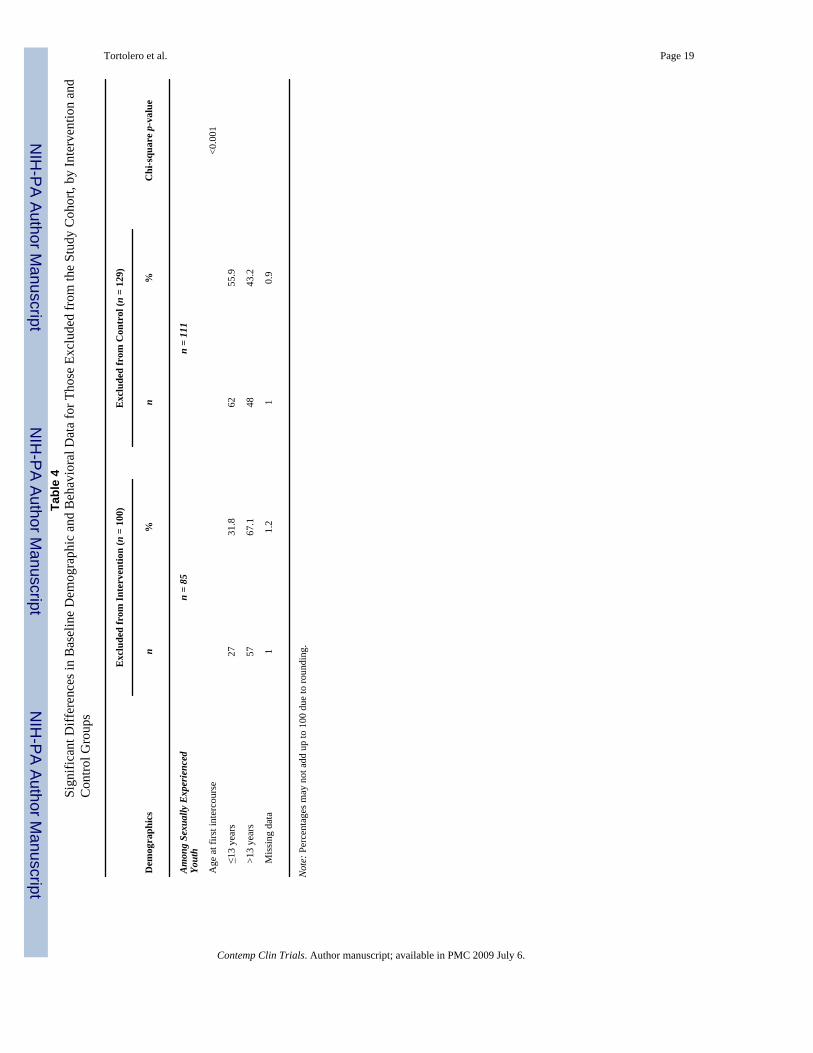
Table 4 shows the one significant difference in the baseline demographic and behavioral dataand in the baseline psychosocial data for those who were excluded from the study cohort, byintervention and control group. There were no significant differences in demographiccharacteristics, in whether or not those in the group were sexually experienced, in the sexualbehaviors of those currently sexually active, in their recent drug use, or in their psychosocialimpact variables. The only significant difference between the two group was in the age at firstintercourse: those excluded from the control group were much more likely to report their firstintercourse as having been at age 13 or younger (55.9%) compared to those who were excludedfrom the intervention group (31.8%).
8. DiscussionThis paper addresses design and methodological issues in conducting school-basedintervention research in alternative schools, including the feasibility of using a cross-overdesign for conducting school-based research and the definition of the cohort for follow-upevaluation. Baseline results suggest that this alternative school population is a predominantlyminority population with parents who are not well educated. The majority are sexually activeand many are not consistently using a condom during sexual intercourse. Many have initiatedsexual intercourse at an early age, and one-fourth of those sexually experienced reported ahistory of pregnancy or getting someone pregnant. Another risk factor in this population is thehigh prevalence of reported drug use: one quarter of the students reported using marijuana inthe past 30 days, 2.3% reported cocaine use, and 8.5% reported codeine use during this timeperiod. These students are at much higher risk for sexual risk-taking than students who attendregular high schools. For example, compared to national data of students attending regular highschools [17], more of these alternative school students report ever having sex than regular highschool students (66.6% vs. 49.9%), being currently sexually active (49.4% vs. 36.3%) andreporting ever being pregnant or getting someone pregnant (19.0% vs. 6.3%).
In our study population, we lost 24% of the students between baseline and the first follow-up.Anticipating the attendance and dropout problem, we chose a priori to define our cohort forthe intervention trial as students who were enrolled at first follow-up. This was the only wayto ensure that the intervention group would have some exposure to the intervention and thatthe definition of the cohort was compatible for both intervention and comparison groups.Accordingly, the cohort we are following for the entire study presents some selection bias inthat they display less risky behaviors than students who were not enrolled at first follow-up.Students who were excluded from the study were more likely to be older, male, to report ever
Tortolero et al. Page 8
Contemp Clin Trials. Author manuscript; available in PMC 2009 July 6.
NIH
-PA Author Manuscript
NIH
-PA Author Manuscript
NIH
-PA Author Manuscript

having sexual intercourse, and to use drugs. These students were also more likely to have lesspositive attitudes toward waiting to have sex and toward using condoms and to report fewerbarriers to using a condom use. In addition those who were excluded from the study cohorthad greater self-efficacy for using a condom, but less self-efficacy for refusing sex. We foundno differences in those who were dropped from the study and those followed in race/ethnicity,parental education, being currently sexually active, or in using a condom. Consequentlyresearchers should be aware of the selection bias [31] that may be operating in these types ofstudies, and intervention strategies designed to target the extremely hard-to-reach populationsshould be designed. Such strategies could include a more intensive approach such as the full-day sessions used by other researchers [32]. Despite the inherent selection bias in these typesof studies, the examined population that is being followed still represents a high-risk populationdeserving of interventions and assessment.
We used a group-randomized study with a crossover design. This type of design deals withseveral limitations in evaluating interventions among alternative schools and similar settingswhile maintaining a rigorous research design. These design challenges included the limitednumber of schools available to randomize and the variations in school size, composition, andenrollment criteria. By evaluating the same schools at different times in the presence and theabsence of the intervention, the variability among schools in the composition of the studentpopulation should not blur true differences in the efficacy of the intervention. We tested thefeasibility of using a cross-over design in assuring comparable intervention and comparisongroups. No differences in intervention and comparison schools were observed in demographicfactors, behavioral factors, or psychosocial factors, providing evidence that the cross-overdesign can provide good balance between groups. This experimental design will provide arigorous test of the intervention. The balance in baseline variables between the interventionand comparison conditions will help provide assurance that the trial’s interventioneffectiveness results will be unbiased.
8.1 LimitationsA possible limitation is this type of crossover design is the potential for overlapping clustermembership. This could be a particular problem in school-based trials since students couldenroll in different schools in successive years or alternately, they could remain in the sameschool and be subsequently randomized to a different condition. We dealt with this issue byexcluding students who were already randomized in the first year of the study.
Another limitation of this study is that the students recruited to the study may not berepresentative of the target population. Because alternative school students are difficult torecruit and because these students were willing to obtain parental consent and to be randomized,they probably have some differences with the overall target population.
The effects of recruitment and measurement of Wave 1 and Wave 2 students at a one yearinterval could introduce two biases: 1) environmental or normative changes could beintroduced during the one-year time intervalng that time period; and 2) while study staff andstudents were masked as to the treatment assignment of schools during Wave 1 recruitmentand data collection, during Wave 2, study staff were aware of treatment conditions of theschools. These potential biases were addressed by examining baseline characteristics of Wave1 and Wave 2 cohorts. No significant differences in demographic or behavioral characteristicswere found when these comparisons were made
8.2 ConclusionsThis paper demonstrates the need to intervene among high-risk youth attending alternativeschools; however, studies should take into consideration special considerations of this high-
Tortolero et al. Page 9
Contemp Clin Trials. Author manuscript; available in PMC 2009 July 6.
NIH
-PA Author Manuscript
NIH
-PA Author Manuscript
NIH
-PA Author Manuscript
risk, highly mobile population. This paper also demonstrates the feasibility of using a crossoverdesign for a group-randomized trial. This design was feasible, efficient, and produced balancedgroups in whom to evaluate the effectiveness of the intervention. This type of study designcould be considered in other school or community settings where a limited number of units areavailable for randomization.
AcknowledgmentsFunding source: NIH, National Institute of Child Health and Human Development, #R01 HD 38457-02.
The authors would like to thank Dr. Ralph Frankowski for his significant input into the study design and Karyn Pophamfor her editorial assistance.
Reference List1. Weinstock, H.; Berman, S.; Cates, W, Jr. Sexually transmitted diseases among American youth:
incidence and prevalence estimates; Perspectives on Sexual and Reproductive Health. 2000. p.6-10.Last updated: 2004. Available: <http://www.guttmacher.org/pubs/journals/3600604.html>
2. DiLorenzo TA, Abramo DM, Hein K, et al. The evaluation of targeted outreach in an adolescent HIV/AIDS program. J Adolesc Health 1993;14(4):301–306. [PubMed: 8347642]
3. Jemmott JB III, Jemmott LS, Fong GT. Reductions in HIV risk-associated sexual behaviors amongblack male adolescents: Effects of an AIDS prevention intervention. Am J Public Health 1992;82(3):372–377. [PubMed: 1536352]
4. MacKay, AP.; Fingerhut, LA.; Duran, CR. Health, United States, 2000 . DHHS Publication No. (PHS)2000-1232-1. Hyattsville, MD: National Center for Health Statistics; 2000 Jul. Adolescent HealthChartbook.
5. National Institutes of Health. National Institute of Allergy and Infectious Diseases. HIV Infection inAdolescents and Young Adults in the U.S. fact sheet. Last updated: 2005 Jul. Available:<http://www.niaid.nih.gov/factsheets/hivadolescent.htm>
6. Kirby, D. Emerging Answers: Research finding on programs to reduce teen pregnancy. Washington,DC: National Campaign to Prevent Teen Pregnancy; 2001.
7. Coyle K, Basen-Engquist K, Kirby D, et al. Safer Choices: Reducing teen pregnancy, HIV, and STDs.Public Health Rep 2001;116(Suppl 1):82–93. [PubMed: 11889277]
8. Hubbard BM, Giese ML, Rainey J. A replication study of Reducing the Risk, a theory-based sexualitycurriculum for adolescents. J Sch Health 1998;68(6):243–247. [PubMed: 9719998]
9. Kirby D, Barth RP, Leland N, Fetro JV. Reducing the risk: Impact of a new curriculum on sexual risk-taking. Fam Plann Perspect 1991;23(6):253–263. [PubMed: 1786806]
10. Main DS, Iverson DC, McGloin J, et al. Preventing HIV infection among adolescents: evaluation ofa school-based education program. Prev Med 1994;23(4):409–417. [PubMed: 7971867]
11. Walter HJ, Vaughan RD. AIDS risk reduction among a multiethnic sample of urban high schoolstudents. JAMA 1993;11(270):725–730. [PubMed: 8336374]
12. Jemmott JB III, Jemmott LS. HIV risk reduction behavioral interventions with heterosexualadolescents. AIDS (London) 2000;14(Suppl 2):s40–s52.
13. Grunbaum JA, Kann L, Kinchen SA, et al. Youth Risk Behavior Surveillance. National AlternativeHigh School Youth Risk Behavior Survey, United States, 1998. J Sch Health 2000;70(1):5–17.[PubMed: 10697808]
14. Markham CM, Tortolero SR, Escobar-Chaves SL, et al. Family connectedness and sexual risk-takingamong urban youth attending alternative high schools. Perspect Sex Reprod Health 2003;35(4):174–179. [PubMed: 12941650]
15. Buzi RS, Tortolero SR, Roberts RE, et al. The impact of a history of sexual abuse on high-risk sexualbehaviors among females attending alternative schools. Adolescence 2003;38(152):595–605.[PubMed: 15053488]
16. Weller NF, Tortolero SR, Kelder SH, et al. Health risk behaviors of Texas students attending dropoutprevention/recovery schools in 1997. J Sch Health 1999;69(1):22–28. [PubMed: 10098115]
Tortolero et al. Page 10
Contemp Clin Trials. Author manuscript; available in PMC 2009 July 6.
NIH
-PA Author Manuscript
NIH
-PA Author Manuscript
NIH
-PA Author Manuscript

17. Kann, L.; Kinchen, SA.; Williams, BI.; Ross, JG.; Lowry, R.; Grunbaum, JA.; Kolbe, LJ. State andlocal YRBSS Coordinators. Youth Risk Behavior Surveillance--United States, 1999; MMWRSurveillance Summaries. p. 1-96.Last updated: 2000 Jun 9 [cited 2006 May 10]. Available:<http://www.cdc.gov/mmwr/PDF/SS/SS4905.pdf>
18. Tortolero SR, Markham CM, Parcel GS, et al. Using Intervention Mapping to adapt an effective HIV,sexually transmitted disease, and pregnancy prevention program for high-risk minority youth. HealthPromot Pract 2005;6(3):286–298. [PubMed: 16020623]
19. Bandura, A. Social Foundations of Thought and Action: A Social Cognitive Theory. EnglewoodCliffs, NJ: Prentice-Hall; 1986.
20. Murray, DM. Design and analysis of group randomized trials. New York: Oxford University Press;1998.
21. Kish, JL. Survey Sampling. NY: John Wiley; 1965.22. Graham JW, Flay BR, Johnson CA, Hansen WB, Collins LM. Group comparability: A multiattribute
utility measurement approach to the use of random assignment with small numbers of aggregatedunits. Eval Rev 1984;8(1):247–260.
23. Gwadz M, Rotheram-Borus MJ. Tracking high-risk adolescents longitudinally. AIDS Educ Prev1992;(Suppl):69–82. [PubMed: 1389872]
24. Perlis TE, Des Jarlais DC, Friedman SR, Arasteh K, Turner CF. Audio-computerized self-interviewing versus face-to-face interviewing for research data collection at drug abuse treatmentprograms. Addiction 2004;99(7):885–896. [PubMed: 15200584]
25. Ellen JM, Gurvey JE, Pasch L, et al. A randomized comparison of A-CASI and phone interviews toassess STD/HIV-related risk behaviors in teens. J Adolesc Health 2002;31(1):26–30. [PubMed:12090962]
26. Jennings TE, Lucenko BA, Malow RM, Devieux JG. Audio-CASI vs interview method ofadministration of an HIV/STD risk of exposure screening instrument for teenagers. Int J STD AIDS2002;13(11):781–784. [PubMed: 12437900]
27. Des Jarlais DC, Paone D, Milliken J, et al. Audio-computer interviewing to measure risk behaviourfor HIV among injecting drug users: a quasi-randomised trial. Lancet 1999;353(9165):1657–1661.[PubMed: 10335785]
28. Turner CF, Ku L, Rogers SM, et al. Adolescent sexual behavior, drug use, and violence: increasedreporting with computer survey technology. Science 1998;280(5365):867–873. [PubMed: 9572724]
29. Lessler, JT.; O’Reilly, JM. Mode of interview and reporting of sensitive issues: Design andimplementation of audio computer-assisted self-interviewing; NIDA Research Monograph. p.366-382.(The Validity of Self-Reported Drug Use: Improving the Accuracy of Survey Estimates)Last updated: 1997. Available:<http://www.drugabuse.gov/pdf/monographs/monograph167/download167.html>
30. Basen-Engquist K, Masse LC, Coyle K, et al. Validity of scales measuring the psychosocialdeterminants of HIV/STD-related risk behavior in adolescents. Health Educ Res 1999;14(1):25–38.[PubMed: 10537945]
31. Green SB. Design of randomized trials. Epidemiol Rev 2002;24(1):4–11. [PubMed: 12119855]32. Jemmott JB III, Jemmott LS, Braverman PK, Fong GT. HIV/STD risk reduction interventions for
African American and Latino adolescent girls at an adolescent medicine clinic: A randomizedcontrolled trial. Arch Pediatr Adolesc Med 2005;159(5):440–449. [PubMed: 15867118]
Tortolero et al. Page 11
Contemp Clin Trials. Author manuscript; available in PMC 2009 July 6.
NIH
-PA Author Manuscript
NIH
-PA Author Manuscript
NIH
-PA Author Manuscript

Figure 1.Planned Study Design: 1000 students, 10 schools
Tortolero et al. Page 12
Contemp Clin Trials. Author manuscript; available in PMC 2009 July 6.
NIH
-PA Author Manuscript
NIH
-PA Author Manuscript
NIH
-PA Author Manuscript

Figure 2.Summary of Recruitment and Retention of Sample and of Organization of Tables Reportingthe AnalysesNote: Vertical axis does not reflect time sequence
Tortolero et al. Page 13
Contemp Clin Trials. Author manuscript; available in PMC 2009 July 6.
NIH
-PA Author Manuscript
NIH
-PA Author Manuscript
NIH
-PA Author Manuscript

NIH
-PA Author Manuscript
NIH
-PA Author Manuscript
NIH
-PA Author Manuscript
Tortolero et al. Page 14
Table 1Psychosocial variables
Construct Number of items Example Response Chronbach’s Alpha
Attitudes
sexual intercourse 2 “I believe it’s OK forpeople my age to have sexwith a steady boyfriend orgirlfriend”
4-point responseformat, from“definitely yes” to“definitely no”
.68
condoms 3 “I believe condoms shouldalways be used if a personmy age has sex.”
.80
Knowledge
HIV 4 “STDs put you at higherrisk of getting infected withHIV.”
truefalsenot sure
.38
Other STDs 5 “Pain when urinating is acommon sign of an STD(not including HIV).”
noyesnot sure
.72
Normative Beliefs
sexual intercourse 2 “Most of my friendsbelieve people my ageshould wait until they areolder before they havesex.”
4-point responseformat, from“definitely yes” to“definitely no”
.51
condoms 3 “Most of my friendsbelieve condoms shouldalways be used if a personmy age has sex.”
.87
Self-Efficacy
refusing sex 3 “How sure are you that youcould keep from having sexuntil you feel ready?”
“totally sure”“kind of sure”“not sure at all”
.69
condom use 3 “How sure are you that youcould use a condom(rubber) correctly orexplain to your partner howto use a condom correctly?”
.69
communicating witha partner about condomuse
3 “How sure are you that youcould convince yourpartner that you also needto use condoms (rubbers)?”
.64
Perceived Barriers 3 “I would feeluncomfortable carryingcondoms with me.”
4-point responseformat, from “Istrongly agree” to“I stronglydisagree”
.8214
Note: Items and Chronbach’s Alphas: Basen-Engquist K, Masse LC, Coyle K, Kirby D, Parcel GS, Banspach S et al. Validity of scales measuring thepsychosocial determinants of HIV/STD-related risk behavior in adolescents. Health Educ Res 1999; 14(1):25–38.
Contemp Clin Trials. Author manuscript; available in PMC 2009 July 6.

NIH
-PA Author Manuscript
NIH
-PA Author Manuscript
NIH
-PA Author Manuscript
Tortolero et al. Page 15Ta
ble
2B
asel
ine
Dem
ogra
phic
and
Beh
avio
ral D
ata
All
Stud
ents
n=9
40E
xclu
ded
n=22
9In
clud
ed n
=711
χ2 p-va
lue
Inte
rven
tion
n=37
5C
ontr
ol n
=336
χ2 p-va
lue
n%
n%
n%
n%
n%
Dem
ogra
phic
s
Ethn
icity
0.16
0.40
A
fric
an-A
mer
ican
279
29.7
7834
.120
128
.311
129
.690
26.8
H
ispa
nic
576
61.3
128
55.9
448
63.0
228
60.8
220
65.5
O
ther
859.
023
10.0
628.
736
9.6
267.
7
Gen
der
0.02
0.89
M
ale
401
42.7
113
49.3
288
40.5
151
40.3
137
40.8
Fe
mal
e53
957
.311
650
.742
359
.522
459
.719
959
.2
Age
<0.0
010.
08
≤1
3 ye
ars
113
12.0
125.
210
114
.251
13.6
5014
.9
14
yea
rs13
814
.719
8.3
119
16.7
5013
.369
20.5
15
yea
rs17
618
.746
20.1
130
18.3
6617
.664
19.0
16
yea
rs17
318
.445
19.7
128
18.0
7319
.555
16.4
17
yea
rs16
117
.142
18.3
119
16.7
7219
.247
14.0
≥1
8 ye
ars
179
19.0
6528
.411
416
.063
16.8
5115
.2
Gra
des i
n sc
hool
(sel
f-re
port)
0.10
0.15
M
ostly
A’s
and
B’s
416
44.3
9340
.632
345
.418
048
.014
342
.6
M
ostly
B’s
and
C’s
416
44.3
100
43.7
316
44.4
153
40.8
163
48.5
M
ostly
C’s
and
D’s
889.
427
11.8
618.
637
9.9
247.
1
M
ostly
D’s
and
F’s
131.
46
2.6
71.
03
0.8
41.
2
M
issi
ng d
ata
70.
73
1.3
40.
62
0.5
20.
6
Hig
hest
leve
l of
pare
ntal
edu
catio
n0.
29
B
oth
pare
nts <
hig
hsc
hool
404
43.0
9139
.731
344
.00.
5515
541
.315
847
.0
Pa
rent
is a
hig
hsc
hool
gra
d24
726
.361
26.6
186
26.2
101
26.9
8525
.3
Pa
rent
has
som
eco
llege
131
13.9
3113
.510
014
.160
16.0
4011
.9
Contemp Clin Trials. Author manuscript; available in PMC 2009 July 6.

NIH
-PA Author Manuscript
NIH
-PA Author Manuscript
NIH
-PA Author Manuscript
Tortolero et al. Page 16
All
Stud
ents
n=9
40E
xclu
ded
n=22
9In
clud
ed n
=711
χ2 p-va
lue
Inte
rven
tion
n=37
5C
ontr
ol n
=336
χ2 p-va
lue
n%
n%
n%
n%
n%
Pa
rent
is a
col
lege
grad
uate
144
15.3
4117
.910
314
.056
14.9
4714
.0
M
issi
ng d
ata
141.
55
2.2
91.
33
0.8
61.
8
Sexu
al B
ehav
ior
All
Ever
had
sex
<0.0
010.
48
N
o31
033
.033
14.4
277
39.0
141
37.6
136
40.5
Y
es62
766
.619
685
.643
160
.623
161
.620
059
.5
M
issi
ng d
ata
30.
30
03
0.4
30.
80
0
Amon
g Se
xual
lyEx
perie
nced
You
thn=
627
n=19
6n=
431
n=23
1n=
200
Age
at f
irst i
nter
cour
se0.
210.
35
≤1
3 ye
ars
262
41.8
8945
.417
340
.188
38.1
8542
.5
>1
3 ye
ars
359
57.3
105
53.6
254
58.9
141
61.0
113
56.5
M
issi
ng d
ata
61.
02
1.0
40.
92
0.9
21.
0
Ever
pre
gnan
t or g
otte
nso
meo
ne p
regn
ant
<0.0
01
N
o44
470
.812
061
.232
475
.217
374
.915
175
.5
Y
es17
928
.574
37.8
105
24.4
5724
.748
24.0
M
issi
ng d
ata
40.
62
1.0
20.
51
0.4
10.
5
Had
sex
in p
ast 3
mon
ths
0.17
0.55
N
o16
326
.044
22.4
119
27.6
6126
.458
29.0
Y
es46
474
.015
277
.631
272
.417
073
.614
271
.0
Amon
g Se
xual
lyAc
tive
in th
e La
st 3
Mon
ths
n=46
4n=
152
n=31
2n=
170
n=14
2
Any
unp
rote
cted
occa
sion
s in
last
3m
onth
s
0.38
0.18
N
o18
940
.758
38.2
131
42.0
7845
.953
37.3
Y
es25
755
.489
58.6
168
53.9
8751
.281
57.0
M
issi
ng d
ata
184.
95
3.3
134.
25
2.9
85.
6
Contemp Clin Trials. Author manuscript; available in PMC 2009 July 6.

NIH
-PA Author Manuscript
NIH
-PA Author Manuscript
NIH
-PA Author Manuscript
Tortolero et al. Page 17
All
Stud
ents
n=9
40E
xclu
ded
n=22
9In
clud
ed n
=711
χ2 p-va
lue
Inte
rven
tion
n=37
5C
ontr
ol n
=336
χ2 p-va
lue
n%
n%
n%
n%
n%
Any
unp
rote
cted
partn
ers i
n la
st 3
mon
ths
0.15
0.40
N
o20
243
.558
38.2
144
46.2
8248
.262
43.7
Y
es25
454
.789
58.6
165
52.9
8650
.679
55.6
M
issi
ng d
ata
81.
75
3.3
31.
02
1.2
10.
7
Use
d dr
ugs b
efor
ese
xual
inte
rcou
rse
0.04
0.46
N
o31
968
.895
62.5
224
71.8
125
73.5
9969
.7
Y
es14
531
.357
37.5
8828
.245
26.5
4330
.3
Dru
g B
ehav
ior
Mar
ijuan
a use
in la
st 3
0da
ys<0
.001
0.78
N
o67
772
.013
860
.353
975
.828
676
.325
375
.3
Y
es25
326
.989
38.9
164
23.1
8522
.779
23.5
M
issi
ng d
ata
101.
12
0.9
81.
14
1.1
41.
2
Coc
aine
use
in la
st 3
0da
ys0.
010.
92
N
o87
693
.220
288
.267
494
.835
895
.531
694
.0
Y
es40
4.3
167.
024
3.4
133.
511
3.3
M
issi
ng d
ata
242.
611
4.8
131.
84
1.1
92.
7
Cod
eine
use
in la
st 3
0da
ys<0
.001
0.78
N
o85
190
.518
982
.566
293
.134
892
.831
493
.5
Y
es80
8.5
3816
.642
5.9
236.
119
5.7
M
issi
ng d
ata
91.
02
0.9
71.
04
1.1
30.
9
Not
e: P
erce
ntag
es m
ay n
ot a
dd u
p to
100
due
to ro
undi
ng.
Contemp Clin Trials. Author manuscript; available in PMC 2009 July 6.

NIH
-PA Author Manuscript
NIH
-PA Author Manuscript
NIH
-PA Author Manuscript
Tortolero et al. Page 18Ta
ble
3B
asel
ine
Psyc
hoso
cial
Dat
a fo
r All
Stud
ents
, for
Tho
se E
xclu
ded
from
Stu
dy C
ohor
t, an
d fo
r Tho
se In
clud
ed in
Stu
dy C
ohor
t
All
Stud
ents
(n=9
40)
Exc
lude
d fr
om S
tudy
Coh
ort (
n =
229)
Incl
uded
in S
tudy
Coh
ort (
n =
711)
Psyc
hoso
cial
nM
ean
SDn
Mea
nSD
nM
ean
SDT
-test
p-v
alue
Scal
e R
ange
Atti
tude
s
Se
xual
inte
rcou
rse
929
1.72
0.86
223
1.51
0.85
706
1.79
0.85
<0.0
01(0
,3)
C
ondo
ms
929
2.62
0.58
225
2.54
0.64
704
2.65
0.55
0.03
(0,3
)
Kno
wle
dge
H
IV93
12.
181.
0622
62.
281.
0470
52.
151.
070.
11(0
,4)
O
ther
STD
s93
23.
041.
5922
63.
231.
5870
62.
981.
590.
04(0
,5)
Nor
mat
ive
belie
fs
Se
xual
inte
rcou
rse
929
1.20
0.86
224
1.10
0.76
705
1.23
0.88
0.04
(0,3
)
C
ondo
ms
925
2.18
0.79
225
2.14
0.85
700
2.19
0.77
0.36
(0,3
)
Self-
effic
acy
R
efus
ing
sex
923
1.47
0.58
225
1.37
0.62
698
1.50
0.56
0.00
4(0
,2)
C
ondo
ms
925
1.41
0.59
224
1.54
0.53
701
1.36
0.61
<0.0
01(0
,2)
C
omm
unic
atio
n92
31.
790.
3822
31.
780.
3870
01.
790.
380.
97(0
,2)
Perc
eive
d ba
rrie
rs to
cond
om u
se92
91.
030.
9622
60.
810.
8870
31.
090.
97<0
.001
(0,3
)
Not
e: A
ll ps
ycho
soci
al sc
ales
repr
esen
t an
aver
age
exce
pt fo
r Kno
wle
dge,
whi
ch is
a su
m.
Contemp Clin Trials. Author manuscript; available in PMC 2009 July 6.
NIH
-PA Author Manuscript
NIH
-PA Author Manuscript
NIH
-PA Author Manuscript
Tortolero et al. Page 19Ta
ble
4Si
gnifi
cant
Diff
eren
ces i
n B
asel
ine
Dem
ogra
phic
and
Beh
avio
ral D
ata
for T
hose
Exc
lude
d fr
om th
e St
udy
Coh
ort,
by In
terv
entio
n an
dC
ontro
l Gro
ups
Exc
lude
d fr
om In
terv
entio
n (n
= 1
00)
Exc
lude
d fr
om C
ontr
ol (n
= 1
29)
Dem
ogra
phic
sn
%n
%C
hi-s
quar
e p-
valu
e
Amon
g Se
xual
ly E
xper
ienc
edYo
uth
n =
85n
= 11
1
Age
at f
irst i
nter
cour
se<0
.001
≤1
3 ye
ars
2731
.862
55.9
>1
3 ye
ars
5767
.148
43.2
M
issi
ng d
ata
11.
21
0.9
Not
e: P
erce
ntag
es m
ay n
ot a
dd u
p to
100
due
to ro
undi
ng.
Contemp Clin Trials. Author manuscript; available in PMC 2009 July 6.