GEAS-Indonesia Baseline Report | 2019
122
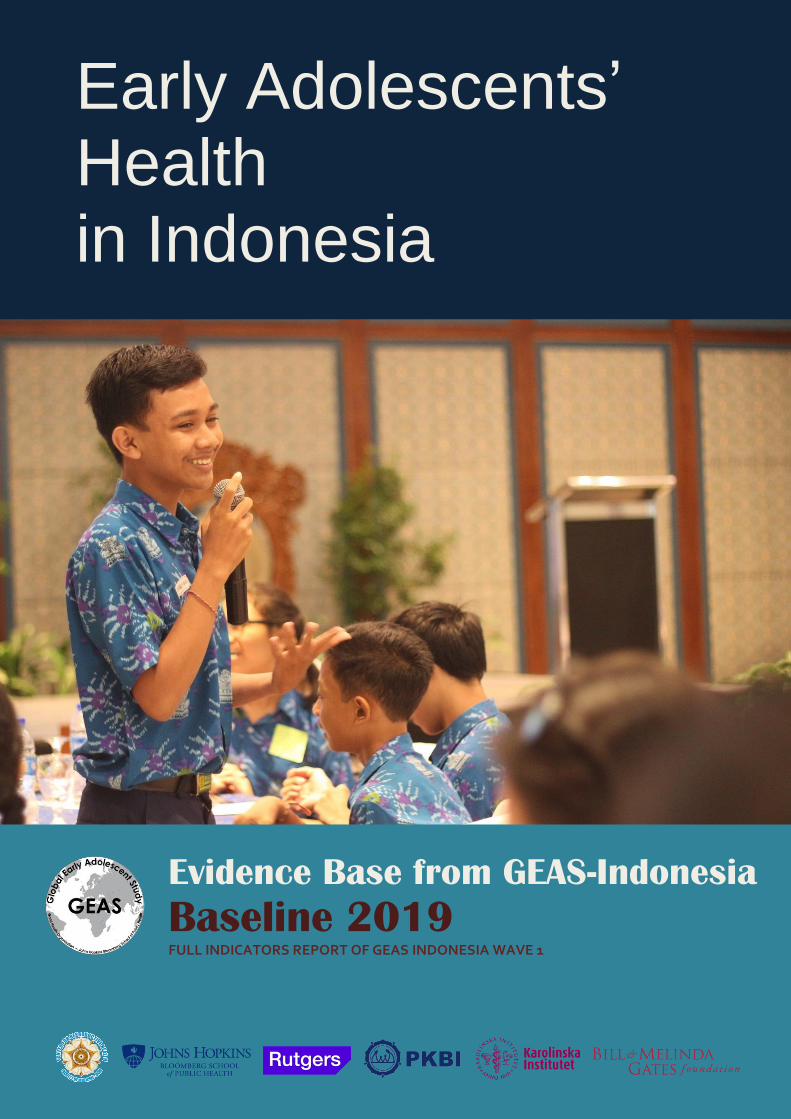
i Early Adolescents’ Health in Indonesia Evidence Base from GEAS-Indonesia Baseline 2019 FULL INDICATORS REPORT OF GEAS INDONESIA WAVE 1
-
Upload
khangminh22 -
Category
Documents
-
view
1 -
download
0
Transcript of GEAS-Indonesia Baseline Report | 2019
GEAS-Indonesia Baseline Report | 2019
i
Early Adolescents’ Health in Indonesia
Evidence Base from GEAS-Indonesia
Baseline 2019 FULL INDICATORS REPORT OF GEAS INDONESIA WAVE 1

GEAS-Indonesia Baseline Report | 2019
ii
Early Adolescent’s Health in Indonesia: Evidence Base from GEAS-Indonesia
Baseline 2019
Center for Reproductive Health, UGM Faculty of Medicine, Public Health and Nursing
Yogyakarta – Indonesia, 2019
Prepared by:
Siswanto Agus Wilopo
Ifta Choiriyah
Anggriyani Wahyu Pinandari
Althaf Setiawan
Agung Nugroho
Grhasta Dian P
Yufan Putri Astrini
Reproduction of part or all of the contents of this report is prohibited in any form without written permission
from the publisher.
First print (English version): 2020
ISBN: 978-602-73904-3-0
Layouting:
Anggriyani Wahyu Pinandari
Akto Adhi Kuntoro
Photo by:
Rutgers WPF
Publisher:
Center for Reproductive Health, UGM Faculty of Medicine, Public Health and Nursing
Gedung Pusat Kesehatan Reproduksi, Jl. Mahoni Blok C-24, Bulaksumur, Yogyakarta 55281 Website:
http://chnrl.org; e-mail: [email protected]
Suggested citation :
Early Adolescent’s Health in Indonesia: Evidence Base from GEAS-Indonesia: Baseline 2019. Yogyakarta:
UGM Center for Reproductive Health.
Copyright ©2020, Center for Reproductive Health, UGM Faculty of Medicine, Public Health and Nursing. All
rights reserved.
www.geastudy.org @geastudy [email protected]
GEAS-Indonesia Baseline Report | 2019
iii
Acknowledgements
We greatfully acknowledge the contributions of many individuals to the development
of this documents.
We received support and assistance in training preparation and logistic procurement
from our colleagues at Rutgers WPF Indonesia, including Nur Jannah, Amala Rahmah,
Puput Susanto, and Wina Baeha. We were also supported by the local PKBI chapters to
coordinate with and apply permit to the schools and local government offices. For this we
appreciate the kindness from Elisabet SA Widyastuti as Executive Director (ED) of PKBI
Jawa Tengah, I Ketut Sukanata as previous ED of PKBI Bali dan the current ED, I
Komang Sutrisna, Dwi Hafsah Handayani as ED of PKBI Lampung, and all PKBI staffs
who were involved in this research.
Valuable technical supports, comments and inputs had been received from GEAS
research team at John Hopkins University since the beginning of the GEAS Indonesia
project. For these we would like to thanks to Robert Wm. Blum, Caroline Moreau, Leah
Koenig, Mengmeng Li, Mark Emerson, Linnea Zimmerman, and Kristin Mmari. The report
drafts also received critical review from Miranda van Reeuwijk and Anna Page from
Rutgers Netherland.
We want to convey our warmest appreciation to local researchers and data
collectors, whose profiles and stories are featured in Appendix 3.
This research would not be a success without the support from local stakeholders,
school headmasters and teachers who allowed us to collect the data and eagerly
participated in all steps of data collection and disseminations.
Finally, our highest appreciation to all adolescents and their parents who shared
their information and experiences so generously with us.
GEAS-Indonesia Baseline Report | 2019
iv
Preface from Director of UGM Center for Reproductive Health
The Global Early Adolescent Study (GEAS) is a research initiative that aims to
understand the gender socialization process and the factors that influence this process in
the early period of adolescence (10-14 years). As part of evaluating the effectiveness of
the Spirit of Youth (SETARA) intervention program, this study also explores how these
two things can be transformed through the provision of comprehensive reproductive
health and sexual education.
SETARA curriculum is a three-years (7th to 9th grade) program, and thus GEAS
Indonesia will be conducted loingitudinally from 2018 to 2021 to evaluate SETARA.
Eighteen schools in three cities in Indonesia (Bandar Lampung, Denpasar and Semarang)
were selected to participate in the GEAS. This study is the first study in Indonesia that
focuses on sexual and reproductive health during early adolescence. This study utilizes
the latest survey developments using smartphone technology to collect, analyze and
disseminate information related to the health and well-being of adolescents. The GEAS is
currently being conducted in 10 countries across five continents working in collaboration
with universities and local research organizations with the aim of increasing local capacity.
This survey has been carried out by local data collectors who will conduct interviews at
least every year.
In Indonesia, the GEAS is undertaken in collaboration with Rutgers WPF, the Center
for Reproductive Health, Faculty of Medicine, Public Health and Nursing, Gadjah Mada
University (UGM), and the Indonesian Family Planning Association (PKBI) with the
support from John Hopkins University (JHU), the Karolinska Institute and The World
Health Organization (WHO). Financial support is provided by the Bill & Melinda Gates
Foundation through a grant to Rutgers Netherlands.
On this occasion the writing team would like to express their deepest gratitude and
appreciation to all research participants; schools; stakeholders and government at the
central and regional levels who have allowed and supported us to collect the data in the
field and provide valuable input during the process of disseminating research results.
Furthermore, we are also very grateful to the team of assistant researchers
(coordinators, young researchers and data collectors) in the field for their participation and
cooperation during this research assuring that it runs smoothly. We also thank Robert
Blum, Miranda van Reeuwijk, Carroline Mureau, Anna Page, and Anna Kagesten for their
continuous assistance and support during this study implementation.
It is our hope that this report will provide the greatest benefit to all stakeholders
involved to support and help youth in Indonesia and the world to realize a better future
through improving health and well-being in the early period of their development.
Prof. dr. Siswanto Agus Wilopo, SU., M.Sc., Sc.D
Center for Reproductive Health
Faculty of Medicine, Public Health and Nursing
Gadjah Mada University

GEAS-Indonesia Baseline Report | 2019
v
Preface from Principal Investigator of GEAS International
We are pleased to present the Global Early Adolescent Study Baseline Report from
Indonesia, the fifth site to complete baseline data collection of the longitudinal study. This
data, collected in Denpasar, Semarang, and Bandar Lampung, provides a first picture of
perceptions of gender norms, health and wellbeing among young adolescents living in
resource-constrainted contexts across three diverse settings in Indonesia.
In addition to implementation of the core survey, Indonesia is the first country
participating in the Global Early Adolescent Study to collect data on attitudes and
practices related to female genital cutting, future planning, and contraceptive self-efficacy,
among other topics. The evaluation of the SETARA program, implemented by Rutgers will
bring vital data to the evidence base about the role of such a comprehensive sexuality
education program in shaping young people’s health and wellbeing during adolescence
and beyond.
The longitudinal Global Early Adolescent Study in Indonesia is made possible
through generous support from the Bill and Melinda Gates Foundation. The global
portfolio of work on the Global Early Adolescent Study is supported by the Bill & Melinda
Gates Foundation, the David & Lucille Packard Foundation, the Oak Foundation, the
United States Agency for International Development (USAID) and the World Health
Organization (WHO).
The report that follows is a collaborative effort between Johns Hopkins, the
University of Gadjah Mada and Rutgers Netherlands which is the lead organization for the
exciting initiative. We also acknowledge the generous support of the Bill and Melinda
Gates Foundation for their investment and trust they have placed in us. We look forward
to the ongoing collaboration as we follow these wonderful young people across time and
see the impacts that the SETARA program has on their health and wellbeing.
Robert Wm. Blum MD, MPH, PhD
Professor, Department of Population, Family and Reproductive Health
Principal Investigator, Globl Early Adolescent Study
Johns Hopkins Bloomberg School of Public Health

GEAS-Indonesia Baseline Report | 2019
vi
Preface from Director of Explore 4action
We are very excited and proud to present the GEAS Indonesia Baseline Report. The
data shed light on the experience, health, wellbeing, norms and attitudes of contemporary
12 years old adolescents from Denpasar, Semarang and Lampung. This data is hugely
important for our understanding of how gender norms influence health and wellbeing. For
Rutgers, joining the GEAS offers us the possibility to look at how our sexuality education
program SETARA impacts on gender attitudes, knowledge, skills and health and
wellbeing outcomes. Sexuality education is often evaluated in terms of it’s impact on
sexual behavior: delayed first sex and use of condoms. But our sexuality education aims
to do much more. It aims to support adolescents positive and healthy development with
the skills and information that are appropriate for their developmental stage and that they
need to feel better about themselves; to understand and manage their emotions; to have
less fears and anxieties about their changing bodies; to have more understanding and
empathy for others and their boundaries; and to make sense of the many (and sometimes
conflicting) messages, norms and expectations they receive about ‘how to behave as a
boy or girl’. Thanks to the GEAS we now know how comfortable 12 years old are with their
bodies and emerging puberty and how much they dare to speak up to unwanted attention
or in case they see something bad happening to someone.
Sexuality and reproductive health is normal, positive and is closely related to health
and welfare. The sexuality and reproductive health of teenagers is not limited to changes
in body, sexual behaviour or health services, but also includes emotional maturity, social
skills, interpersonal relationships and positive self-image.
Some data indicates hope for the future – with a large number of adolescents having
high expectations, ambitions and plans for the future. But the data also give rise to
concerns, especially around the high amount of adverse childhood experiences and
anxiety and depressive symptoms that were reported by adolescents.
What Are the Desired Results?
The desired results in teenagers that have fully participated in this program acquire
the following skills:
Communication, which is the skill to convey ideas, opinions and feelings through
speaking, writing, listening, facial expressions, body language and other means.
This skill is useful for conflict resolution, understanding and managing emotions,
negotiating deals and maintaining interpersonal relationships.
Understanding their own identity and maintaining self-confidence. Teenagers
realize their own potentials, including their strengths and flaws. This will instil
confidence in their ability to make good decisions.
Possessing motivation, leadership and independence. It is very important for
teenagers to realize that they can influence and determine what happens in their
life. This could encourage them to make positive choices and create change. This
skill will in turn develop other aspects, such as decision making, critical thinking,
self-management and collaboration.
GEAS-Indonesia Baseline Report | 2019
vii
Recognizing, expressing and managing emotions and stress. This will help
teenagers adapt to their environment. Proper management of stress and
emotions will help teenagers choose healthy behaviours and avoid risky
behaviours.
Understanding differences, mutual respect and collaboration with other people.
This skill will help teenagers hone their interpersonal skills.
Creativity and innovation. Young people are encouraged to produce ideas and
find new ways in conveying ideas and solving problems.
Planning for and oriented to the future. Teenagers consider how their choices
affect their well-being and others.
Miranda van Reeuwijk
Director of Explore for Action Program
Rutgers Netherland
GEAS-Indonesia Baseline Report | 2019
viii
Table of Content
Acknowledgements ............................................................................................................................................... iii
Preface from Director of UGM Center for Reproductive Health ............................................................ iv
Preface from Principal Investigator of GEAS International .......................................................................... v
Preface from Director of Explore 4action ...................................................................................................... vi
Table of Content ................................................................................................................................................. viii
List of Table ............................................................................................................................................................ ix
List if Figure ............................................................................................................................................................ xi
List of Abbreviations ............................................................................................................................................ xii
CHAPTER I Global Early Adolescent Study (GEAS) ..................................................................................... 2
1.1. Background ............................................................................................................................................. 3
1.2. Objectives ............................................................................................................................................. 5
CHAPTER II How is GEAS carried out? ........................................................................................................... 6
2.1. Organization ............................................................................................................................................. 7
2.2. Research Design ...................................................................................................................................... 7
2.3. Study Population & Sample.................................................................................................................... 9
2.3.1. Sampling ............................................................................................................................ 10
2.3.2. Characteristic of Program Sites .................................................................................. 11
2.3.3. Characteristic of the schools participating in GEAS Indonesia............................ 12
2.4. Questionnaire ........................................................................................................................................ 13
2.5. Data Collection and Processing ........................................................................................................ 13
CHAPTER III Results ......................................................................................................................................... 16
3.1. Sociodemographic Characteristics ................................................................................................... 18
3.1.1. Adolescent Characteristics .......................................................................................... 19
3.1.2. Main Caregiver and Household/ Family Characteristics ....................................... 22
3.2. Contextual Factors .............................................................................................................................. 26
3.2.1. Peers Factor ..................................................................................................................... 27
3.2.2. School factor .................................................................................................................... 30
3.2.3. Neighborhood Environment ........................................................................................ 32
3.3. Gender Norms ...................................................................................................................................... 36
3.4. Empowerment ....................................................................................................................................... 46
3.5. Bullying and Adverse Childhood Experiences (ACEs) ................................................................. 54
3.6. Adolescent Health ................................................................................................................................ 58
3.6.1. Self-Rated Health, Body Image, and Body comfort ................................................ 58
3.6.2. Depression Symptoms and Substance Abuse .......................................................... 62
3.7. Sexual and Reproductive Health ....................................................................................................... 66
3.7.1. Sexual and Reproductive Health Knowledge ........................................................... 66
3.7.2. Puberty .............................................................................................................................. 70
3.7.3. Romantic Experiences ................................................................................................... 76
3.7.4. Sexual and Reproductive Health ................................................................................. 82
3.7.5. Female Genital Cutting .................................................................................................. 88
3.8. Media Access and Use ......................................................................................................................... 94
Appendices ............................................................................................................................................................ 98
Appendix 1. The definition of selected gender development and education sector development
indicators ............................................................................................................................................. 99
Appendix 2. The types of interview administration .................................................................................. 100
References .......................................................................................................................................................... 106
GEAS-Indonesia Baseline Report | 2019
ix
List of Table
Table 1. GEAS Indonesia sample, by site and study arm. ................................................................ 10
Table 2. Characteristics of students in the Indonesia GEAS, by sex. .............................................. 20
Table 3. Parent-child relationship from the child’s perspective, by sex. ......................................... 21
Table 4. Characteristics of parent/main caregivers of the student participants, by sex. ................. 23
Table 5. Family characteristics and parent’s expectation on education and dating, by sex. ........... 24
Table 6. Characteristics of close friends and peers of GEAS participants, by sex. ......................... 29
Table 7. The indicators related to school environment and attitude about school of GEAS
participants, by sex. ............................................................................................................. 31
Table 8. Characteristics of the neighborhood of GEAS participants, by sex. ................................. 34
Table 9. Communication style and peer social inclusion for gender atypical peers of GEAS
participants, by sex. ............................................................................................................. 38
Table 10. Acceptance of heteronormative relationship and sexual double standard of GEAS
participants, by sex. ............................................................................................................. 40
Table 11. Agreement with strereotypical gender traits and roles and social sanction for challenging
stereotypical gender roles among GEAS participants, by sex............................................. 43
Table 12. Gender norms indicators by sex and sites....................................................................... 43
Table 13. Empowerment related to their freedom of movement, freedom of speech, and freedom
of decision making of GEAS participants, by sex. ............................................................... 50
Table 14. Planfullness and aspiration for education, marriage and reproductive life of GEAS
participants, by sex. ............................................................................................................. 51
Table 15. Adverse childhood experiences (ACEs) and experience of being the victim or
perpetrator of bullying and physical violence among GEAS participants, by sex. .............. 56
Table 16. Adolescents’ perception about their health, body comfort and body image by sex. ...... 61
Table 17. Self-reported mental health problems and substance use among GEAS participants, by
sex. ....................................................................................................................................... 64
Table 18. Knowledge about pregnancy, HIV, contraceptive methods and reproductive health
programs among GEAS participants, by sex. ...................................................................... 68
Table 19. Adolescents’ onset of and attitudes about puberty, and communication about puberty.
............................................................................................................................................. 73
Table 20. Experience of romantic relationship, dating violence and communication about sexual
and reproductive issues, by sex........................................................................................... 79
Table 21. Sexual norms, attitudes about abortion, and sexual experiences of GEAS participants, by
sex. ....................................................................................................................................... 84
Table 22. Experience of sexual intercourse among GEAS participants, by sex............................... 85
Table 23. Experience of sexual touch and oral sex among GEAS participants, by sex. .................. 87
Table 24. Attitude on and experience of female genital cutting, among girls. ................................. 90
Table 25. Attitude on and experience of female genital cutting among parent/main caregivers of
GEAS participants, by sex of the students. ......................................................................... 91
GEAS-Indonesia Baseline Report | 2019
x
Table 26. Media and technology access and pornography exposure of GEAS participants, by sex.95
GEAS-Indonesia Baseline Report | 2019
xi
List if Figure
Figure 1. Trend of adolescent and young age group in Indonesia. .............................................................4
Figure 2.The organizational structure of GEAS Indonesia ...........................................................................7
Figure 3. The sites of GEAS Indonesia and SETARA implementation in three provinces (Indonesia
map). ...........................................................................................................................................................9
Figure 4. Flow of GEAS data management. ................................................................................................... 14
Figure 5. Migration status of the adolescents and their parent/caregiver by site. ............................... 19
Figure 6. Distribution of main caregiver’s education, by sex and site. ................................................... 22
Figure 7. Percentage of adolescents who had more than three male/female close friends, by sex
and site. ................................................................................................................................................... 27
Figure 8. Distribution of school resources index, by site. ......................................................................... 30
Figure 9. Perception of neighborhood social control and cohesion, by sex and site. ........................ 32
Figure 10. Percentage of adolescents feeling threatened/unsafe in their neighborhood, by sex and
site. ........................................................................................................................................................... 33
Figure 11. Mean score of communication style (direct or indirect), by sex and site. ........................ 37
Figure 12. Mean score of acceptance of heteronormative relationship, by sex and site. .................. 39
Figure 13. Mean score of sexual double standard, by sex and site. ........................................................ 39
Figure 14. Mean score of agreement to stereotypical gender trait and gender roles, by sex and
site. ........................................................................................................................................................... 41
Figure 15. Acceptance to gender-based teasing by sex and site. ............................................................. 42
Figure 16. Adolescents’ perception of their freedom of movement by sex and site. ......................... 47
Figure 17. Adolescents’ perception about their ability to voice their opinion/thought, by sex and
site. ........................................................................................................................................................... 48
Figure 18. Adolescents’s confidence to talk about reproductive issues and obtain reproductive
service, by sex and site. ....................................................................................................................... 49
Figure 19. Percentage of adolescents who self-reported excellent or good health, by sex and site.
.................................................................................................................................................................. 59
Figure 20. Adolescents’ perception about their body maturation/changescompared with peers by
sex and site. ........................................................................................................................................... 60
Figure 21. Mean score of self-reported depressive symtomps (from 4 question items), by sex and
site. ........................................................................................................................................................... 63
Figure 22. Mean score of knowledge on pregnancy and HIV by sex and site. ..................................... 67
Figure 23. Adolescents’ discussion partner preferences on sexual relationship, pregnancy,
contraception and HIV. ....................................................................................................................... 71

GEAS-Indonesia Baseline Report | 2019
xii
List of Abbreviations
ABRI Angkatan Bersenjata Republik Indonesia/Republic Indonesia Army Force
ACASI Audio Computer-Assisted Self-Interview
ACEs Adverse Childhood Experiences
AIDS Acquired Immune Deficiency Syndrome
ASEAN Association of Southeast Asian Nations
BANSM Badan Akreditasi Nasional Sekolah/Madrasah/ Accreditation Board of National
Schools / Madrasas
BP/BK Bimbingan Penyuluhan /Bimbingan Konseling/Conseling Guide
BKKBN Badan Kependudukan dan Keluarga Berencana Nasional /National Family Planning
Bureau
BPS Badan Pusat Statistik/Central Statistics Bureau
BSNP Badan Standar Nasional Pendidika/ National Education Standards Agency
CAPI Computer-assisted personal interview
CASI Computer-assisted self-interview
CHC Community Health Centre
CIE Counseling, Information and Education
CRH Center for Reproductive Health
DSTV Digital Satellite Television
FGC Female Genital Mutilation
GBV Gender Based Violence
GDI Gender Development Index
GEAS Global Early Adolescent Study
GEI Gender Empowerment Index
GER Gross Enrolment Ratio
GII Gender Inequality Index
GPR Gross Participation Rate
GRDP Gross Regional Domestic Income
HDI Human Development Index
HIV Human Immunodeficiency Viruses
IPA Ilmu Pengetahuan Alam/Natural Science
IPS Ilmu Pengetahuan Sosial/Social Science
IT Information and Technology
JHU John Hopkins University
KIR Kelompok Ilmiah Remaja/Adolescent Science Club
Kodam Komando Militer/ Military Command Center
LE Life Expectancy
MDGs Millennium Development Goals
NER Net Enrolment Rate
NPR Net Participation Rate
OSIS Organisasi intra sekolah/ intra-school organization
Paskibra Pasukan Pengibar Bendera / Flag raisers
PBM Proses Belajar Mengajar/ Teaching and learning process

GEAS-Indonesia Baseline Report | 2019
xiii
Permendiknas Peraturan Menteri Pendidikan Nasional/ Regulation of the Minister of National
Education
PIK-Remaja Program Informasi dan Konseling-Remaja/Adolescent Counseling and Information
Program
PKBI Perkumpulan Keluarga Berencana Indonesia/IPPF
PKBM Pusat Kegiatan Belajar Masyarakat/Center for Community Learning Activity
PKPR Pelayanan Kesehatan Peduli Remaja/ Youth Care Health Service
PMR Palang Merah Remaja/Adolescend Red Cross
PNS Pegawai Negeri Sipil/Public Servant
Polri Polisi Republik Indonesia/Police of Republic Indonesia
Pramuka Praja muda karana/Scout
RPJMN Rencana Pembangunan Jangka Menengah Nasional/ national long-term
development vision
SD Sekolah Dasar/ Elementary School
SD Standard Deviation
SDGs Sustainable Development Goals
SETARA Semangat Dunia Remaja
SMA Sekolah Menengah Atas/ Senior High School
SMP Sekolah Menengah Pertama/ Junior High School
SPR School Participation Rate
STI Sexual Transmited Infection
SRH Self-rated health
TU Tata Usaha/Administration Office
TNI Tentara Nasional Indonesia/ Indonesian National Army
UGM Universitas Gadjah Mada
UKS Usaha Kesehatan Sekolah/Healthy School Effort/Program
UN United Nations
UNESCO United Nations Educational, Scientific and Cultural Organization
UNICEF United Nations International Children's Emergency Fund
UPT Unit Pelayanan Terpadu/Central Service Unit
VCT Voluntary Counseling and Testing
WHO World Health Organization
YCHS Youth Care Health Services
YHC Young Health Cadre

GEAS-Indonesia Baseline Report | 2019
1

GEAS-Indonesia Baseline Report | 2019
2
CHAPTER I
Global Early Adolescent
Study (GEAS)
GEAS-Indonesia Baseline Report | 2019
3
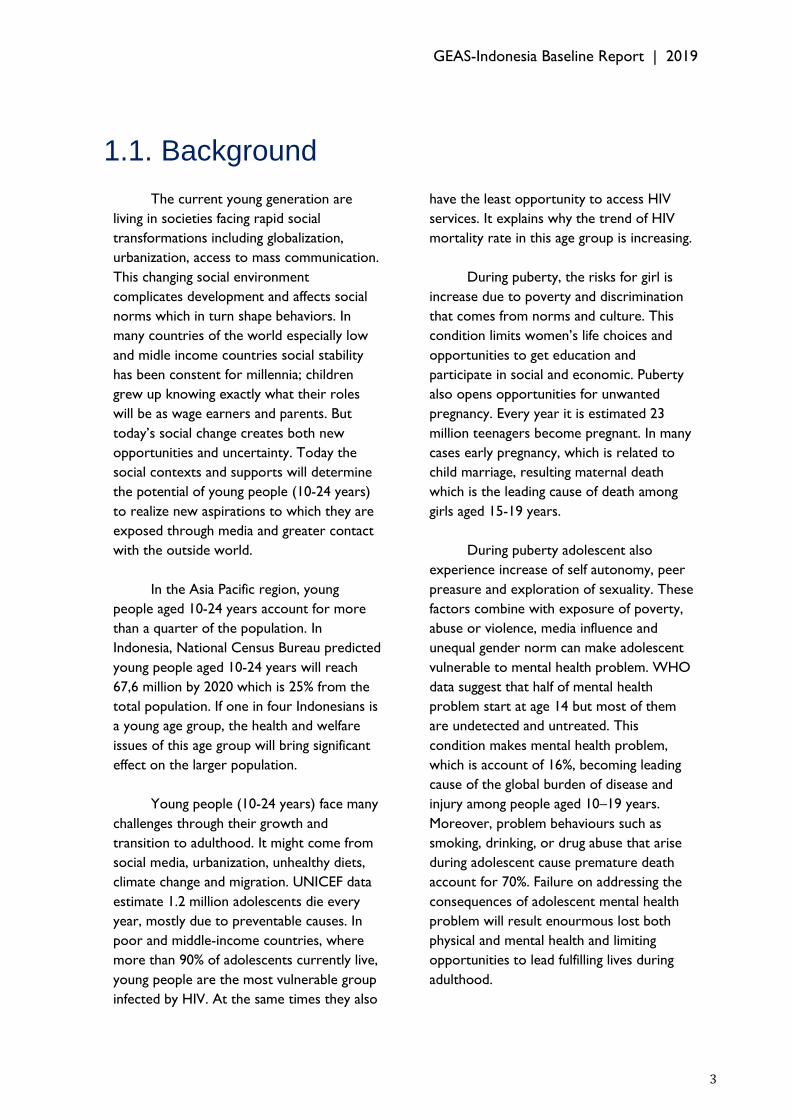
1.1. Background
The current young generation are
living in societies facing rapid social
transformations including globalization,
urbanization, access to mass communication.
This changing social environment
complicates development and affects social
norms which in turn shape behaviors. In
many countries of the world especially low
and midle income countries social stability
has been constent for millennia; children
grew up knowing exactly what their roles
will be as wage earners and parents. But
today’s social change creates both new
opportunities and uncertainty. Today the
social contexts and supports will determine
the potential of young people (10-24 years)
to realize new aspirations to which they are
exposed through media and greater contact
with the outside world.
In the Asia Pacific region, young
people aged 10-24 years account for more
than a quarter of the population. In
Indonesia, National Census Bureau predicted
young people aged 10-24 years will reach
67,6 million by 2020 which is 25% from the
total population. If one in four Indonesians is
a young age group, the health and welfare
issues of this age group will bring significant
effect on the larger population.
Young people (10-24 years) face many
challenges through their growth and
transition to adulthood. It might come from
social media, urbanization, unhealthy diets,
climate change and migration. UNICEF data
estimate 1.2 million adolescents die every
year, mostly due to preventable causes. In
poor and middle-income countries, where
more than 90% of adolescents currently live,
young people are the most vulnerable group
infected by HIV. At the same times they also
have the least opportunity to access HIV
services. It explains why the trend of HIV
mortality rate in this age group is increasing.
During puberty, the risks for girl is
increase due to poverty and discrimination
that comes from norms and culture. This
condition limits women’s life choices and
opportunities to get education and
participate in social and economic. Puberty
also opens opportunities for unwanted
pregnancy. Every year it is estimated 23
million teenagers become pregnant. In many
cases early pregnancy, which is related to
child marriage, resulting maternal death
which is the leading cause of death among
girls aged 15-19 years.
During puberty adolescent also
experience increase of self autonomy, peer
preasure and exploration of sexuality. These
factors combine with exposure of poverty,
abuse or violence, media influence and
unequal gender norm can make adolescent
vulnerable to mental health problem. WHO
data suggest that half of mental health
problem start at age 14 but most of them
are undetected and untreated. This
condition makes mental health problem,
which is account of 16%, becoming leading
cause of the global burden of disease and
injury among people aged 10–19 years.
Moreover, problem behaviours such as
smoking, drinking, or drug abuse that arise
during adolescent cause premature death
account for 70%. Failure on addressing the
consequences of adolescent mental health
problem will result enourmous lost both
physical and mental health and limiting
opportunities to lead fulfilling lives during
adulthood.

GEAS-Indonesia Baseline Report | 2019
4
Source: Population projection from Central Statistics Bureau
Figure 1. Trend of adolescent and young age group in Indonesia.
In the early stage (10-14 years),
adolescents experience a dramatic transition
due to their interrelated brain, cognitive,
social, and sexual development. Interactions
between these factors will greatly determine
their lifeling abilities and aspirations, as well
as their current and long-term health and
well-being, including their sexual and
reproductive health (Blum et al., 2017,
McCarthy et al., 2016). Puberty changes the
physical appearance of adolescents from
young children to mature adults (Blum et al.,
2015). These physical changes are
accompanied by the emergence of different
social expectations from family, peers,
school, and the surrounding environment
regarding the roles and responsibilities of
young adolescents (Blum et al., 2017). In
addition to physical, social and emotional
changes, in this period with brain
development their cognitive ability of
abstract thinking increases as does the ability
to think about the future (Sawyer et al.,
2012).
Over the past 20 years there has been
a growing interest in adolescent health and
development; however, the primary focus
has been on those 15 to 24 years of age. The
Global Early Adolescent Study (GEAS) aims
to fill the void in our knowledge and
understanding by starting with young people
10-14 years old and following them across
adolescence. Adolescence (defined by the
WHO as between 10 and 19 years) is
divided into three stages: early, middle, and
late adolescence (Blum et al., 2015). GEAS
specifically explores the development of
unequal social norms and the consequences
for boys and girls especially related to:
sexual and reproductive health, mental
health, school retention and completion and
interpersonal and gender based violence.
The GEAS is a collaboration lead by
Johns Hopkins (JHU) Bloomberg School of
Public Health in collaboration with the
World Health Organization (WHO) and
various research institutions in 10 countries.
There were two phases, the first of which
concluded at the end of 2017 and involved
qualitative data collection from young
adolescents and a parent or guardian in 15
countries and in addition the development of
measures to be used across sites. In the
longitudinal phase of the project, which
started in 2018, there is an interest in
exploring how gender norms impact

GEAS-Indonesia Baseline Report | 2019
5
adolescent health outcomes and
concurrently in selected sites such as the
three communities in Indonesia the goal is to
explore how gender transformative and
comprehensive sex education interventions
implact adolescent outcomes across time. In
2018, Indonesia joined the longitudinal phase
of the GEAS as a collaboration between:
JHU, WHO, Rutgers Indonesia and the
Centre for Reproductive Health, Faculty of
Medicine, Public Health and Nursing,
Universitas Gadjah Mada and the Karolinska
Instute in Stockholm, Sweden. As currently
structured young people will be followed
over 4 years and three rounds of data
collection starting in 2018.
In addition to the aforementioned
objectives, GEAS also seeks to measure the
impact of the SETARA curriculum. SETARA
is a CSE curriculum for junior high school
students (12-14 year-olds) in Indonesia.
SETARA aims to equip students with a
comprehensive understanding of sexuality,
reproductive health, as well as preparing
young people to become peer educators.
SETARA’s curriculum was based on the
World Starts with Me (WSWM) global
program developed by Rutgers which
follows the International Technical Guidance
on Sexuality Education (ITGSE) set by the
UNESCO, adapted to the Indonesian
context and specific age group, involving
feedbacks from the national workshop with
teachers and students who have received the
past materials and sessions.
On this study we collect information
on contextual variable that might influence
adolescent health and well being such as
socio-economic, family, peer, school and
neighborhood factors. Adolescent health
and well being were measured through
various dimention such as perceive on
gender norm, empowerment, bullying and
adverse childhood experiences (ACEs),
mental health, sexual and reproductive
health, and their media access and use. The
data collection was limited at school level in
urban setting in three cities, Bandar
Lampung, Denpasar and Semarang. These
sites were choosen to represent different
cultural-religious and globalization influences
including print, electronic and social media as
well as tourism and contact with non-
indigenous cultures.s including print,
electronic and social media as well as
tourism and contact with non-indigenous
cultures.
1.2. Objectives
The objective of this report is to:
1) Provide baseline data on socioeconomic
characteristics of early adolescent
involved in SETARA and GEAS in
Indonesia.
2) Exploring profile of gender norm
specificly relates to sexuality among
early adolescent in Indonesia.
3) Provide baseline knowledge prior
SETARA intervention related to
pregnancy prevention, HIV,
contraception, media use and
reproductive health services.
4) Provide information on early adolescent
behavior on violence (such as bullying,
teasing, ACEs), romantic relationship
and access to reproductive health
services.
5) Provide early adolescent health profiles
that can be used by stakeholders to
navigate the direction of health
interventions for them.

GEAS-Indonesia Baseline Report | 2019
6
CHAPTER II
How is GEAS carried out?

GEAS-Indonesia Baseline Report | 2019
7
2.1. Organization
The GEAS Indonesia is carried out by
the Center for Reproductive Health (CRH),
Faculty of Medicine, Public Health and
Nursing, Universitas Gadjah Mada (FKKMK
UGM), with technical supports from Rutgers
WFP and the Johns Hopkins University
(JHU). This study has been approved by the
Ethics Committee of FKKMK UGM and
received approval from the relevant national
and local authorities. Local data collectors
are trained, supported, and monitored by
the CRH and the site research teams. Data
quality checking, data cleaning and
management, and analysis are conducted in
collaboration between the CRH and the
GEAS Coordinating Center at JHU.
Figure 2.The organizational structure of GEAS Indonesia
2.2. Research Design
GEAS Indonesia is a component of
Explore4Action, a research and advocacy
program that aims to build evidence to
support the implementation and scale-up of
comprehensive sexuality education (CSE)
and age-appropriate strategies to improve
Adolescent Sexual and Reproductive Health
(ASRH) in Indonesia. In addition to
observational research, GEAS Indonesia
evaluates the impact of a CSE implemented
by Rutgers Indonesia and PKBI (Indonesia
Planned Parenthood Association) called
SETARA (Semangat Dunia Remaja or Teens’
Aspirations, “SETARA” also means “equal”
in Indonesian language).
Therefore GEAS Indonesia uses
longitudinal quasi-experimental design among
adolescents aged 10-14 years, who were in
7th grade in the selected schools at the
beginning of the study. The study compares
adolescent knowledge, attitudes, and
behaviors between those who are enrolled
in intervention schools and those enrolled in
control schools. The outcomes examined
among students include:
1) Interpersonal and gender-based
violence
2) Perceptions of gender norms
3) Empowerment: voice, freedom of
movement and decision making
4) Self efficacy
5) Body image and body comfort
6) Mental Health (depressive symptoms,
anxiety, adverse child experiences)
7) Sexual and reproductive health
including:
a. Sexual and reproductive health
knowledge and communication
b. Romantic experiences
Field Coordinator
Rutgers & Karolinska Institutet
GEAS Hopkins Coordinating
Center (HCC)
National Advisory Board
Principal Investigator Data Manager
Finance Manager
Local Advisory Board
Site Researcher Team and Local
Enumerators
GEAS-Indonesia Baseline Report | 2019
8
c. Sexual behaviors, contraception
utilization where appropriate
This report presented the results from
the baseline data collection in August-
October 2018 prior to SETARA
implementation.
The Intervention
SETARA is a CSE curriculum for junior
high school students (12-14 year-olds) in
Indonesia. SETARA aims to equip students
with a comprehensive understanding of
sexuality, reproductive health, as well as
preparing young people to become peer
educators. SETARA’s curriculum was based
on the World Starts with Me (WSWM)
global program developed by Rutgers which
follows the International Technical Guidance
on Sexuality Education (ITGSE) set by the
UNESCO, adapted to the Indonesian
context and specific age group, involving
feedbacks from the national workshop with
teachers and students who have received the
past materials and sessions.
SETARA consists of two sets of
guidelines, one for the teachers and another
for students. SETARA is taught in two
stages, in the 7th and 8th grade, covering 15
topics in each stage i.e. self identity,
emotional and physical changes during
puberty, healthy and responsible
relationships, gender, individual human
rights, sexuality and love, pregnancy, sexually
transmitted infections, HIV/AIDS, substance
abuse, healthy and non-violent
romantic/dating relationship, planning for the
future, and peer education. SETARA is
implemented in collaboration with
Perkumpulan Keluarga Berencana Indonesia
(Indonesian Planned Parenthood
Association) and involving the local
government for permission and support.
Rutgers Indonesia conducted the
national master training for educators to
prepare and deliver SETARA. Rutgers
Indonesia established the guideline on
teacher characteristics deemed optimal for
delivering SETARA. Local chapters of PKBI
organized the training of teachers from the
intervention schools, the teachers workshop
to develop teaching plans and for
microteaching1. Rutgers Indonesia developed
the monitoring and evaluation (M&E) tools
for SETARA implementation; the M&E data
collection is organized by the local chapters
of PKBI.
In the intervention schools in
Semarang and Bandar Lampung, SETARA is
delivered during the dedicated “guidance and
counseling” (bimbingan dan konseling (BK))
instructional time by the BK teacher. But
intervention schools in Denpasar decided to
insert SETARA sessions into biology or civic
studies classes. Regardless of the delivery
channel, the intervention schools all deliver
15 sessions and common topics.
1 Micro-teaching is a teacher training facilitates development
of technique and provide constructive feedback from peers and/or students about what has worked and what
improvements can be made to their teaching technique.
GEAS-Indonesia Baseline Report | 2019
9
2.3. Study Population & Sample
Rutgers WFP Indonesia lead the city
and school selection from the cities that are
implementing SETARA. School selection in
each city was based on consultation with the
sub-district Public Health Center and local
chapter of Perkumpulan Keluarga Berencana
Indonesia (PKBI), by reviewing the
demographic, health, social indicators of sub-
district, the health program that are
currently running in which school, the
strategic value of the school/location based
on the strength or history of partnership,
and the willingness of the school to
participate in the research. The school were
also selected on the basis of type of school
(only public, non religious-based schools
were selected) and their agreement to
implement SETARA as integrated course
under counseling subject – rather than as
extracurricular or under natural
science/sports – to aim for uniformity and
high quality of the implementation.
Three public junior high school in
selected subdistrict was assigned as
intervention school, and three nearby public
junior high school with similar demographic
and school characteristics was selected as
the control school. There are 9 intervention
and 9 control schools for a total of 18
schools in three cities.
We obtained permission from the
Ministry of Home Affair (for national level
permit), The Development Planning Agency
(Bappeda) at provincial and distric level and
the City Office of Education before asking
for the schools’ participation. In Bandar
Lampung, the participating schools are
geographically spread across five subdistricts,
while in Denpasar and Semarang, the
participating school are spread across three
subdistricts and five subdistricts,
respectively.
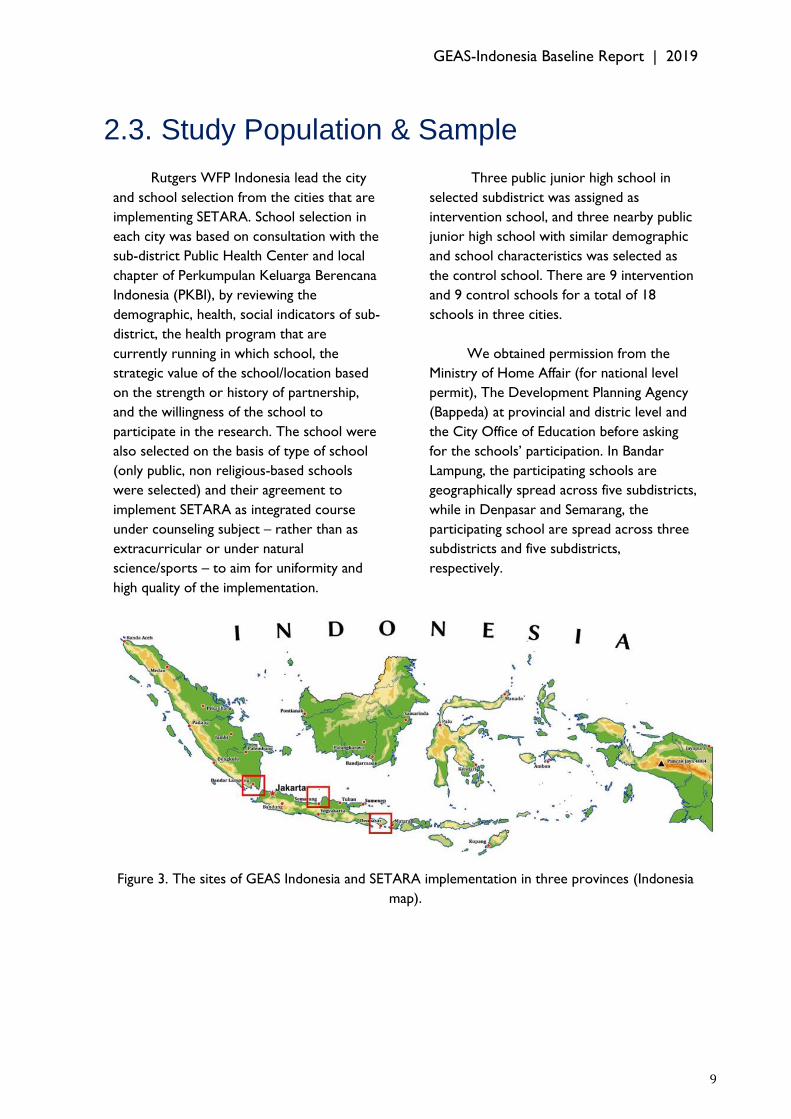
Figure 3. The sites of GEAS Indonesia and SETARA implementation in three provinces (Indonesia
map).
GEAS-Indonesia Baseline Report | 2019
10
2.3.1. Sampling
Sample location
GEAS Indonesia is conducted in three
different geographical sites (Lampung,
Semarung, Denpasar) with the aims to a)
analyze how the diverse local context affects
gender norms and behavior, b) discover
interesting/different cases so that counseling,
information and education (CIE) can be
applied in various contexts, and c) identify
how the local context affects the
implementation of SETARA. The three study
sites have different cultural-religious (e.g.
more conservative Islam in Sumatra
compared to Java, and a more open Hindu
culture in Bali) and globalization influences
including print, electronic and social media as
well as tourism and contact with non-
indigenous cultures.
Eligibility criteria
Eligibility criteria for adolescents
include: 10-14 years old at the time of the
interview, enrolled in 7th grade in the
selected schools, live within the study sites
(city of Bandar Lampung, Denpasar, or
Semarang), assented to participate, and their
parents consented to their child’s
participation.
With the school’s permission, at the
start of the 2018-2019 academic year, we
invited the parents or guardian of all 7th
graders to the school to seek informed
consent for their and their child’s
participation (in the survey and in the
SETARA program) and to collect the basic
sociodemographic and household
information of consenting parents.
On a subsequent day, all 7th graders
whose parents consented for their
participation were given presentation about
the study and asked for their assent to
participate. A total of 1,414 students
consented to participate in the GEAS survey
in Bandar Lampung (75.7% response rate);
with 751 in intervention group and 663 in
control group or 670 boys and 744 girls. In
Denpasar, 1,753 students consented to
participate (92.8% response rate); with 992
in intervention group and 761 in control
group or 854 boys and 899 girls. In
Semarang, 1,517 students assented to
participate (99.3% response rate), with 760
intervention group and 757 in control group
or 683 boys and 834 girls.
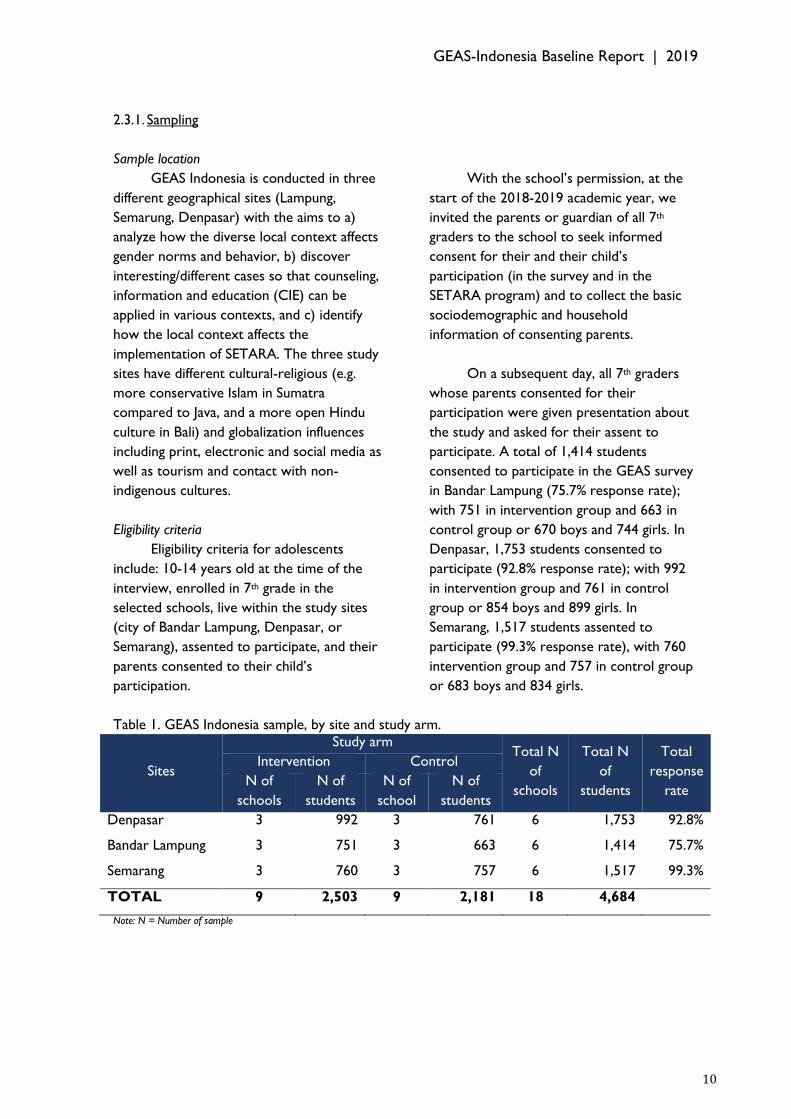
Table 1. GEAS Indonesia sample, by site and study arm.
Sites
Study arm Total N
of
schools
Total N
of
students
Total
response
rate
Intervention Control
N of
schools
N of
students
N of
school
N of
students
Denpasar 3 992 3 761 6 1,753 92.8%
Bandar Lampung 3 751 3 663 6 1,414 75.7%
Semarang 3 760 3 757 6 1,517 99.3%
TOTAL 9 2,503 9 2,181 18 4,684
Note: N = Number of sample

GEAS-Indonesia Baseline Report | 2019
11
2.3.2. Characteristic of Program Sites
The three Explore4Action
communities are predominantly urban,
young (30-34% are <=19 year olds), densely
populated, and bustling with economic
activities. The sites are located in three
different islands and are substantially
different in their ethnic and religious
composition and economic structures. The
Denpasar population is mostly Balinese
(65%) and Javanese (26%) and unlike the rest
of the country, Hindu is the main religion. As
a popular international travel destination,
tourism and its associated service industry
dominate Denpasar’s economy. Bandar
Lampung is a Muslim majority, multi ethnic
city (with 41% Javanese and 16%
Lampungnese) and its main economic
sectors are farming/forestry/mining/fishing,
processing industry, and retail-wholesale
sales. Semarang is a Muslim and Javanese
majority city with and its main economic
sectors are processing industry, retail-
wholesale sales, and construction (BPS,
2010).
Gender development
Compared to the other GEAS sites,
Semarang’s Gender Development Index
(GDI) is higher than Bandar Lampung but
lower than Denpasar. Semarang’s Gender
Empowerment Measure (GEM) is also higher
than the national average score while
Denpasar’s and Bandar Lampung’s scores are
much lower than it. In 2015, Lampung is one
of the five provinces with the lowest GEM in
Indonesia. In Denpasar, low GEM score was
contributed by low proportion of
parliamentary seats occupied by women
while in Bandar Lampung is likely due to
gender inequalities in types of work (BPS,
2016). In Semarang, the GEM continues to
increase since 2012 due to the increase of
two components, i.e. the income
contribution by women and the share of
women in the workforce, but the gaps
between men and women in their
representation in the parliament and their
income contribution are substantial.
The Ministry of Women's
Empowerment and Child Protection
categorized Bali in the quadrant II of gender-
based development suggesting that gender
equality is high, but gender empowerment is
not yet optimal. While gender development
in this group exceed the national averages,
women's involvement in decision making
remain low. Lampung is categorized to be in
the quadrant III of gender-based
development, for a group of provinces with
GDI and GEI below the national score. It
means that Lampung has been able to
improve human quality and reduce the gap
between the development of men and
women, but the rate is relatively lower than
other provinces. Therefore, more effort is
needed to catch up with the other provinces
(National Gender Development Report,
2018). While Bali and Lampung need to
improve their gender development agenda,
Semarang which is located in Jawa Tengah is
categorized as quadrant I along with other
four provinces. It indicates an ideal gender
development setting.
Health services for adolescent
Adolescent Health Services (AHS) is a
government program coordinated by the
Provincial Health Office and administered by
the City Health Office to serve adolescents.
Each district/city is expected to have at least
4 YCHS provided in Community Health
Center (CHC). In Denpasar, all CHCs
include adolescent health services. YCHS
programs include:
a. Counseling services for adolescents
b. Providing health education in at least one
school and conducting Communication,
Information and Education (CIE) twice a
year

GEAS-Indonesia Baseline Report | 2019
12
c. Training of the (YHC) Young Health
Cadre or peer counselor, who are
students of the targeted schools who will
be trained to provide information about
health to their peers
In 2015, Bandar Lampung has 30
CHCs and 50 satellite CHCs. Unfortunately,
there is no official data about the availability
of health services for young people or the
health status of Bandar Lampung’s youth. In
2017, Bandar Lampung chapter of PKBI and
Rutgers Indonesia have started reproductive
health programs for youth that include
training on integrated youth friendly service
providers and comprehensive sexuality and
reproductive health education for youth.
In Semarang, adolescent health
services are provided by several institutions,
such as Pelayanan Kesehatan Peduli Remaja
(PKPR - AHS) by the Ministry of Health
through CHCs, Griya ASA clinic by PKBI,
and Pusat Informasi dan Konseling Remaja
(PIK-R - Youth Information and Counseling
Center) by BKKBN. PKPR is provided by
five CHCs in Semarang. The service includes
counseling, contraception, antenatal care,
STI test, VCT, and safe abortion (Sobatask,
2018). Griya ASA Clinic is organized by PKBI
Semarang. The clinic offers several services,
such as screening and treatment for STIs
including HIV, contraception services, family
planning counseling, teen sexuality
counseling, and premarital counseling
(Sobatask, 2018). There are also 42 PIK-R in
16 subdistricts.
2.3.3. Characteristic of the schools
participating in GEAS Indonesia
The schools selected to participate in
GEAS Indonesia are generally located in safe
neighborhoods but in diverse urban settings,
ranging from the center of densely populated
Denpasar city to the outer ring of the
Bandar Lampung city. All participating
schools are A-accreditated public junior high
schools, except for one control school in
Denpasar that has “B” accreditation score2.
Based on their accreditation status, the
characteristics of the schools are similar
between intervention and control in terms
of curriculum, standard of competence,
educational processes, educator resources,
infrastructure, governance, funding and
assesment standards (BANSM, 2017). Except
for the four schools in Semarang, all other
schools have met the criterion of the ideal
students-teacher ratio of 20:1.
2 The score represents quality of the school compared to
government standard. It is calculated from a set of criteria
that measure curriculum, standard of competence, educational processes, educator resources, infrastructure,
governance, funding and assesment standards. Standarization process is conducted by High School National Accreditation Agency (Badan Akreditasi Nasional Sekolah Menengah
(BANSM)).
GEAS-Indonesia Baseline Report | 2019
13
2.4. Questionnaire
The GEAS survey measure is
comprised of three cross-cultural
components: a 10-module health instrument,
a vignettes-based measure of gender equality
and assessment of gender norms. Together,
these instruments assess a range of socio-
ecological influences at the family, peer,
school and neighborhood level, as well as
behaviors and outcomes related to
adolescent health and wellbeing, including
school retention, adolescent empowerment;
violence and adverse experiences; mental
health, sexuality and sexual health.
The first wave of GEAS data collection
included two questionnaires, one for parents
and the other for the adolescents. The
parent questionnaire collects data on marital
status, education level, and employment
status of the head of household and the
parent/main caregiver, household assets
ownership to generate a wealth index,
household composition, expectation about
their child’s education, and whether they
would approve if their child had a
boy/girlfriend now.
The adolescent questionnaire collects
data on (1) family level characteristics:
connectedness and closeness to the parents,
communication with parents, their
perception of parents’ expectation about
their education; (2) peers characteristics: the
number of close male or female friends;
perception about peers’ norms and
behaviors regarding school, popularity,
romantic relationships and sexual activities;
and drugs/alcohol abuse; (3) school and
neighborhood characteristics: perception of
neighborhood social cohesion and control,
perception of school and neighborhood
safety; (4) measure of gender equality and
assessment of gender norms using vignettes
and statements; (5) health literacy and
information: knowledge of pregnancy &
HIV/AIDS, knowledge of contraceptive
access and youth health services; (6) health:
general health status, mental health status
(depression and anxiety), body image and
comfort, puberty, substance use, (7) sexual
health and behaviours: experience of
romantic relationships, power dynamics and
violence in the relationship, experiences of
sexual activity (8) bullying and violence as
witness, victim or perpetrator; (9) media:
access to and use of media. Additionally,
Indonesia-specific questions include: feelings
about own sexuality, confidence in obtaining
information and services on SRH, comfort
discussing SRH issues, planfullness for life
goals, knowledge and experience of Female
Genital Cutting (FGC).
2.5. Data Collection and Processing
Data collection
The GEAS Indonesia study has been
approved by the Ethics Committee of
FKKMK UGM and received permission from
the regional Development Planning Agency
(Bappeda) and the City Office of Education
before we contacted the selected schools.
Rutgers Indonesia and CRH developed a
Child Protection Policy, Principles and
Guidelines of Conducts, and reporting
protocol to promote awareness of child
safety protection, prevent harmful and
GEAS-Indonesia Baseline Report | 2019
14
unethical conducts, and to investigate and
address reports of child abuse and
exploitation.
Site research team which includes a
site supervisor and two junior researchers
were recruited with the help from the local
chapters of PKBI. The master training, that
included discussion on the questionnaire
wording and purpose to ensure correct
understanding, was conducted by Johns
Hopkins, UGM and Rutgers together in April
2018. A total of 18 site data collectors (6
data collectors for each site) were recruited
by CRH and received information and
training on the background and goals of
GEAS, ethical conduct of the study, informed
consent and protection of confidentiality,
interview process, use of mobile device to
administer the questionnaire and submit the
completed interviews, the walk-through of
the questionnaire, and data quality
supervision in August 2018. Data collection
was conducted in August – October 2018 in
the 3 sites.
Data colection for both adolescents
and parents were conducted in 2 ways:
computer assisted personal (face-to-face)
interview (CAPI) using tablet and computer-
assisted self-interview (CASI). While the
questions are identical, the difference in
survey mode, including the presence of an
interview allowed inclusion of respondents
with low liitteracy levels. In wave 1, most
surveys were conducted using CASI for
adolescents, and CAPI or CASI for parents.
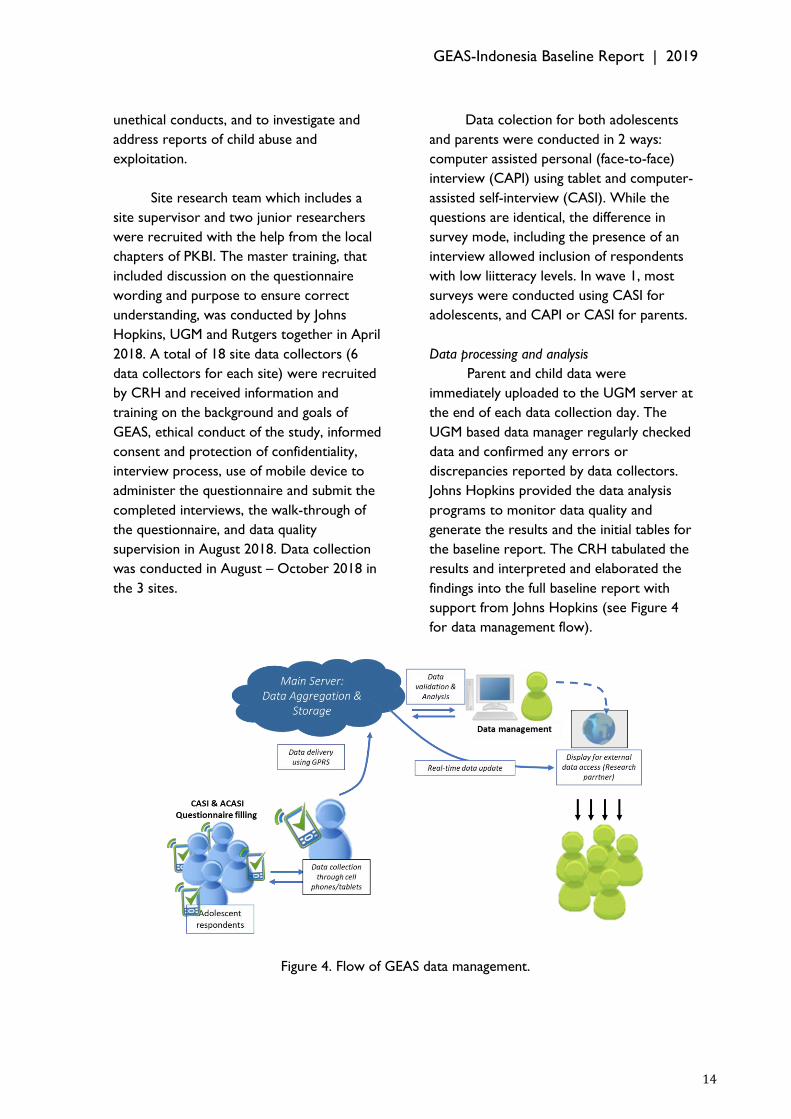
Data processing and analysis
Parent and child data were
immediately uploaded to the UGM server at
the end of each data collection day. The
UGM based data manager regularly checked
data and confirmed any errors or
discrepancies reported by data collectors.
Johns Hopkins provided the data analysis
programs to monitor data quality and
generate the results and the initial tables for
the baseline report. The CRH tabulated the
results and interpreted and elaborated the
findings into the full baseline report with
support from Johns Hopkins (see Figure 4
for data management flow).
Figure 4. Flow of GEAS data management.

GEAS-Indonesia Baseline Report | 2019
15

GEAS-Indonesia Baseline Report | 2019
16
In this report, the results are
presented through cross tabulation
analysis to explore how various
adolescent domains are distributed
differently among boys and girls. It is
followed by naratif section that interprete
the finding and also supported by some
graphs.
CHAPTER III
Results

GEAS-Indonesia Baseline Report | 2019
17
GEAS-Indonesia Baseline Report | 2019
18
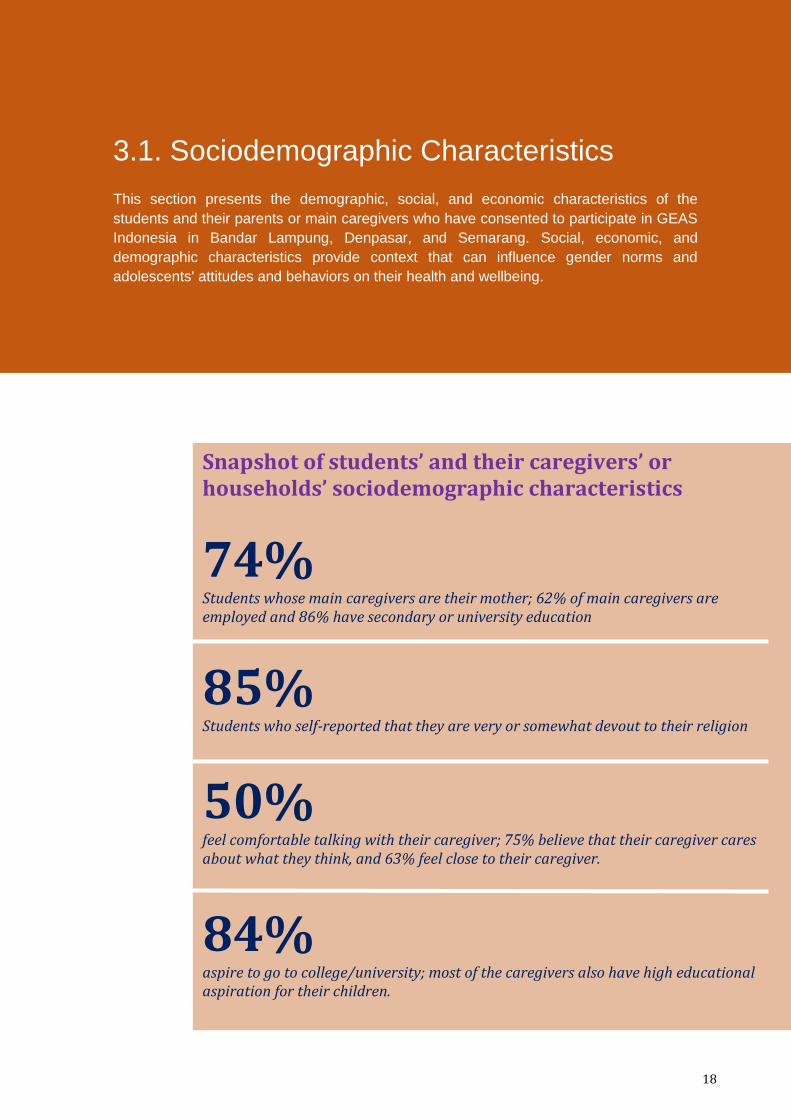
3.1. Sociodemographic Characteristics This section presents the demographic, social, and economic characteristics of the
students and their parents or main caregivers who have consented to participate in GEAS
Indonesia in Bandar Lampung, Denpasar, and Semarang. Social, economic, and
demographic characteristics provide context that can influence gender norms and
adolescents' attitudes and behaviors on their health and wellbeing.
Snapshot of students’ and their caregivers’ or households’ sociodemographic characteristics
74% Students whose main caregivers are their mother; 62% of main caregivers are employed and 86% have secondary or university education
85% Students who self-reported that they are very or somewhat devout to their religion
50% feel comfortable talking with their caregiver; 75% believe that their caregiver cares about what they think, and 63% feel close to their caregiver.
84% aspire to go to college/university; most of the caregivers also have high educational aspiration for their children.

GEAS-Indonesia Baseline Report | 2019
19
3.1.1. Adolescent Characteristics
Table 2 displays the students'
individual and family characteristics. In GEAS
Indonesia, we targeted seventh-grade
students in junior high school; therefore, the
majoriy (72%) are 12 years old. Nearly 9 in
10 students were born in the city where
they lived, but a significant proportion
ranging from 38% in Bandar Lampung and
Semarang to 56% in Denpasar reported their
caregivers were born in a diferent location.
More than two thirds (65%) of the
adolescents were Muslim and one third were
Hindu (predominantly in Denpasar). Eighty
percent of the students reported that they
often attended a religious service in the past
month. This percentage was higher in
Denpasar than Bandar Lampung and
Denpasar probably because many Balinese
Hindu ceremonies and rituals are performed
collectively.
Students in Denpasar also reported higher
perception of devoutness than students in
other sites. Boys were more likely than girls
to report that they attended religious
services frequently (84% vs 76%). The
percentage reported that they are very or
somewhat religiously devout is also higher in
boys (88%) than girls (83%). The sex
difference in devoutness is also seen in all
three cities studied. The level of literacy is
higher in boys than girls.
Figure 5. Migration status of the adolescents and their parent/caregiver by site.

GEAS-Indonesia Baseline Report | 2019
20
Table 2. Characteristics of students in the Indonesia GEAS, by sex.
Socio-demographic characteristics Total % Boys % Girls % P-value
N 4684 2207 2477
Age mean + SD (range) 12.2+0.5 12.3+0.6 12.1+0.5 <0.001
10 years 0.1 0.1 0.1 <0.001
11 years 5.4 4.2 6.6
12 years 72.1 69.2 74.6
13 years 20.8 23.7 18.2
14 years 1.6 2.8 0.6
Migration
Adolescent born in the city 89.0 89.7 88.4 0.19
Caregiver born in the city 56.9 55.8 57.9 0.14
Religion
Islam 64.7 63.6 65.7 0.45
Christian/Catholic 2.1 2.1 2.1
Hinduism 32.9 34.0 31.9
Buddhism 0.3 0.3 0.3
Other 0.04 0.1 0.0
Religiosity
Self report about religious obedience or devoutness
<0.01
Very/somewhat devout 85.2 87.5 83.2
Not very much/not at all devout 14.8 12.5 16.8
Frequency of attending a religious service in the past month <0.01
Often 79.8 83.6 76.4
Not often 20.2 16.4 23.6
Literacy
Able to read simple sentence 98.7 98.0 99.3 <0.01
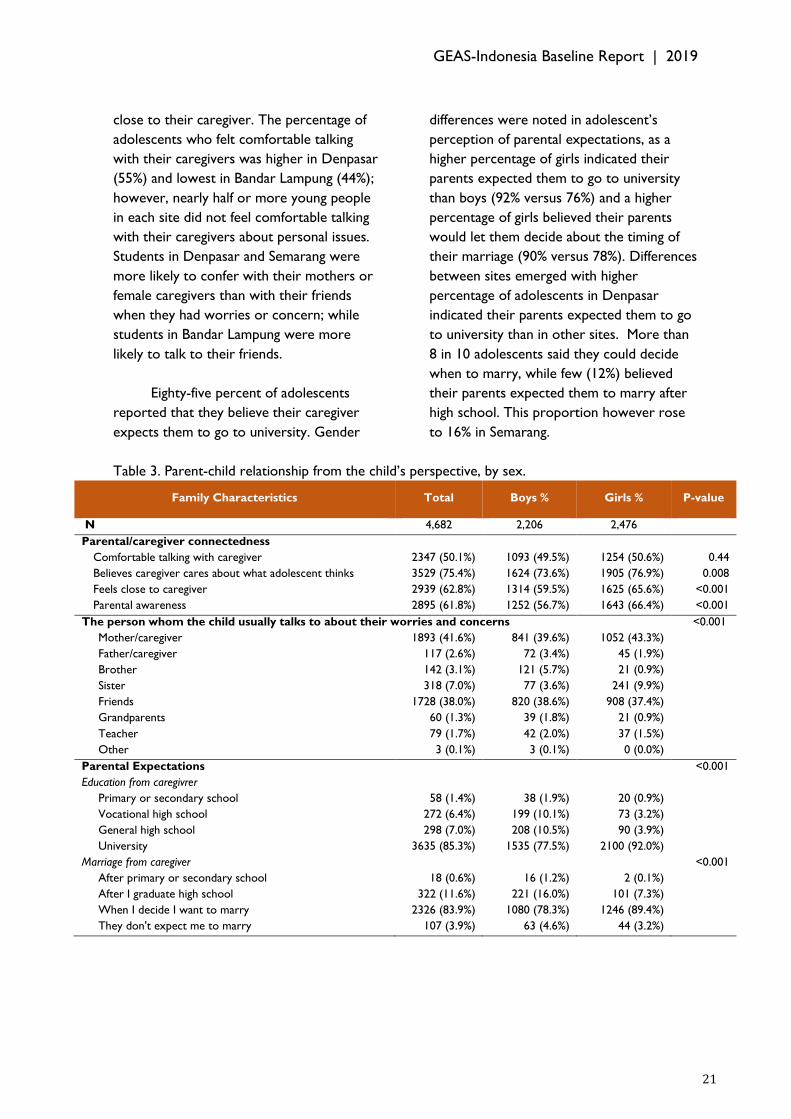
Tabel 3 also displays students’
connectedness to their caregivers, their
perception about their caregivers’
expectation about school and marriage. Half
of the students felt 'very comfortable' or
`somewhat comfortable' talking to their
caregiver about the following: (1) the things
that worry them, (2) changes with their
body, and (3) problem with their boyfriend
or girlfriend (if they have one). Fourty two
percent of adolescents conferred with their
mothers or female caregivers when they had
worries or concerns while 38% usually
conferred with their friends. Less than 3%
said they usually talk to their father or male
caregiver, and only 2% identified their
teacher as a confidant. While comfort in
talking to caregiver was similar for boys and
girls, girls were more likely to confide in
their mothers (43% versus 40%) while boys
were more likely to confide in their brothers
(5% versus 1%).
Girls were significantly more likely to
consider that their caregiver cared about
them or that they felt close to their
caregiver than boys (77% vs. 74% and 66%
vs. 60%, respectively). Gender difference in
the belief of caregiver careness is not
observed in Denpasar and Semarang, and
gender difference in feeling of closeness to
caregiver is not observed in Semarang.
Parent monitoring was assessed by
asking adolescents if their caregiver was
aware of: (1) their friends name, (2) their
grades/how they are doing in school, and (3)
where they usually were. Parental
monitoring varied from 67% in Denpasar to
57% in Bandar Lampung. Parental monitoring
was higher for girls than boys (66% versus
57%).
Most adolescents believed that their
caregiver cared about what they were
thinking or feeling and they said they felt
GEAS-Indonesia Baseline Report | 2019
21
close to their caregiver. The percentage of
adolescents who felt comfortable talking
with their caregivers was higher in Denpasar
(55%) and lowest in Bandar Lampung (44%);
however, nearly half or more young people
in each site did not feel comfortable talking
with their caregivers about personal issues.
Students in Denpasar and Semarang were
more likely to confer with their mothers or
female caregivers than with their friends
when they had worries or concern; while
students in Bandar Lampung were more
likely to talk to their friends.
Eighty-five percent of adolescents
reported that they believe their caregiver
expects them to go to university. Gender
differences were noted in adolescent’s
perception of parental expectations, as a
higher percentage of girls indicated their
parents expected them to go to university
than boys (92% versus 76%) and a higher
percentage of girls believed their parents
would let them decide about the timing of
their marriage (90% versus 78%). Differences
between sites emerged with higher
percentage of adolescents in Denpasar
indicated their parents expected them to go
to university than in other sites. More than
8 in 10 adolescents said they could decide
when to marry, while few (12%) believed
their parents expected them to marry after
high school. This proportion however rose
to 16% in Semarang.
Table 3. Parent-child relationship from the child’s perspective, by sex.
Family Characteristics Total Boys % Girls % P-value
N 4,682 2,206 2,476
Parental/caregiver connectedness
Comfortable talking with caregiver 2347 (50.1%) 1093 (49.5%) 1254 (50.6%) 0.44
Believes caregiver cares about what adolescent thinks 3529 (75.4%) 1624 (73.6%) 1905 (76.9%) 0.008
Feels close to caregiver 2939 (62.8%) 1314 (59.5%) 1625 (65.6%) <0.001
Parental awareness 2895 (61.8%) 1252 (56.7%) 1643 (66.4%) <0.001
The person whom the child usually talks to about their worries and concerns <0.001
Mother/caregiver 1893 (41.6%) 841 (39.6%) 1052 (43.3%)
Father/caregiver 117 (2.6%) 72 (3.4%) 45 (1.9%)
Brother 142 (3.1%) 121 (5.7%) 21 (0.9%)
Sister 318 (7.0%) 77 (3.6%) 241 (9.9%)
Friends 1728 (38.0%) 820 (38.6%) 908 (37.4%)
Grandparents 60 (1.3%) 39 (1.8%) 21 (0.9%)
Teacher 79 (1.7%) 42 (2.0%) 37 (1.5%)
Other 3 (0.1%) 3 (0.1%) 0 (0.0%)
Parental Expectations
<0.001
Education from caregivrer
Primary or secondary school 58 (1.4%) 38 (1.9%) 20 (0.9%)
Vocational high school 272 (6.4%) 199 (10.1%) 73 (3.2%)
General high school 298 (7.0%) 208 (10.5%) 90 (3.9%)
University 3635 (85.3%) 1535 (77.5%) 2100 (92.0%)
Marriage from caregiver
<0.001
After primary or secondary school 18 (0.6%) 16 (1.2%) 2 (0.1%)
After I graduate high school 322 (11.6%) 221 (16.0%) 101 (7.3%)
When I decide I want to marry 2326 (83.9%) 1080 (78.3%) 1246 (89.4%)
They don't expect me to marry 107 (3.9%) 63 (4.6%) 44 (3.2%)

GEAS-Indonesia Baseline Report | 2019
22
3.1.2. Main Caregiver and Household/ Family
Characteristics
We collected information about the
household's asset, household head's and
main caregiver's education and marital status
from the parents' interview. The majority
(87%) of the main caregiver had a secondary
education or higher and 62% were employed
(Table 4). However, education and
employment status varied by site, with a
higher percentage of caregivers with a
college education in Denpasar (42%) than
Bandar Lampung (14%). Likewise, main
caregivers’ employement was highest in
Denpasar (73%) and lowest in Bandar
Lampung (46%).
Figure 6. Distribution of main caregiver’s education, by sex and site.
Wealth index distribution does not
differ by sex but differs by site. The
percentages of students’ households
categorized as 'very poor' or 'poor' were
higher in Bandar Lampung (60%) than in
Denpasar (27%) and Semarang (38%). Three
quarters of adolescents’ main caregiver was
the mother, approximately one-in-five was
the father while only 1% to 2% depending on
site was another family member.
Approximately 90% of adolescents lived with
both parents, 8% lived in a single parent
household and less than 1% lived with
neither parent (Table 5). The percentage of
adolescents who lived with neither parent
was higher in Bandar Lampung (1.1%) than in
other sites (0.3% in Denpasar and 0.7% in
Semarang). The percentage of fathers
identified to be adolescents’ primary
caregiver is higher in Denpasar (25%) and
Semarang (26%) compared to Bandar
Lampung (15%).

GEAS-Indonesia Baseline Report | 2019
23
Table 4. Characteristics of parent/main caregivers of the student participants, by sex.
Socio-demographic characteristics Total % Boys % Girls % P-value
N 4504 2117 2387
Caregiver Education 0.55
No school 34 (0.8%) 14 (0.7%) 20 (0.8%)
Primary school 605 (13.6%) 298 (14.2%) 307 (13.0%)
Secondary school 2592 (58.1%) 1203 (57.4%) 1389 (58.8%)
College/university 1228 (27.5%) 580 (27.7%) 648 (27.4%)
Caregiver Employment
0.35
Employed 2708 (62.1%) 1286 (62.9%) 1422 (61.5%)
Unemployed 1611 (37.0%) 745 (36.4%) 866 (37.4%)
Has retired 40 (0.9%) 15 (0.7%) 25 (1.1%)
Wealth 0.98
Very poor 932 (20.7%) 438 (20.7%) 494 (20.7%)
Poor 871 (19.3%) 411 (19.4%) 460 (19.3%)
Middle 881 (19.6%) 406 (19.2%) 475 (19.9%)
Rich 1028 (22.8%) 488 (23.1%) 540 (22.6%)
Very rich 792 (17.6%) 374 (17.7%) 418 (17.5%)
Main Caregiver's Relationship with the Child 0.47
Mother 73.6 72.8 74.2
Father 22.8 23.2 22.5
Brother 0.1 0.1 0.1
Sister 0.6 0.6 0.7
Uncle/Aunt 0.6 0.5 0.7
Grandparents 1.7 2.1 1.4
Other 0.6 0.6 0.5
There were no significant differences
in caregiver charcateristics between boys
and girls across sites, but a number of
gender differences emerged in terms of
family structure, family relations and
expectations. More than 8 in 10 adolescents
had siblings, in most cases of both sexes. Sex
composition of siblings does not differ by
site but differs by sex. Specifically, boys were
more likely to live in large families (6 siblings
or more) and more likely to report having
brothers and sisters, while girls were more
likely to only have sisters.
About 90% of parents indicated that
They wants their children to complete
university education. The percentage of
parent’s expectation for university degree is
higher in Denpasar (93%) than in Bandar
Lampung (91%) and Semarang (87%). In
Denpasar and Semarang, parent’s
expectation on their child’s education is
similar for boys and girls.
The vast majority of parents (84%)
strongly disapproved of their child dating at
their current age, although this percentage
was lower in Denpasar than in other sites.
Parents were less likely to approve their
girl’s dating than their boy’s dating behaviors
(5% approved for boys versus 3% for girls).
Boys and girls in Bandar Lampung and
Semarang were equally disapproved from
dating by their parent.
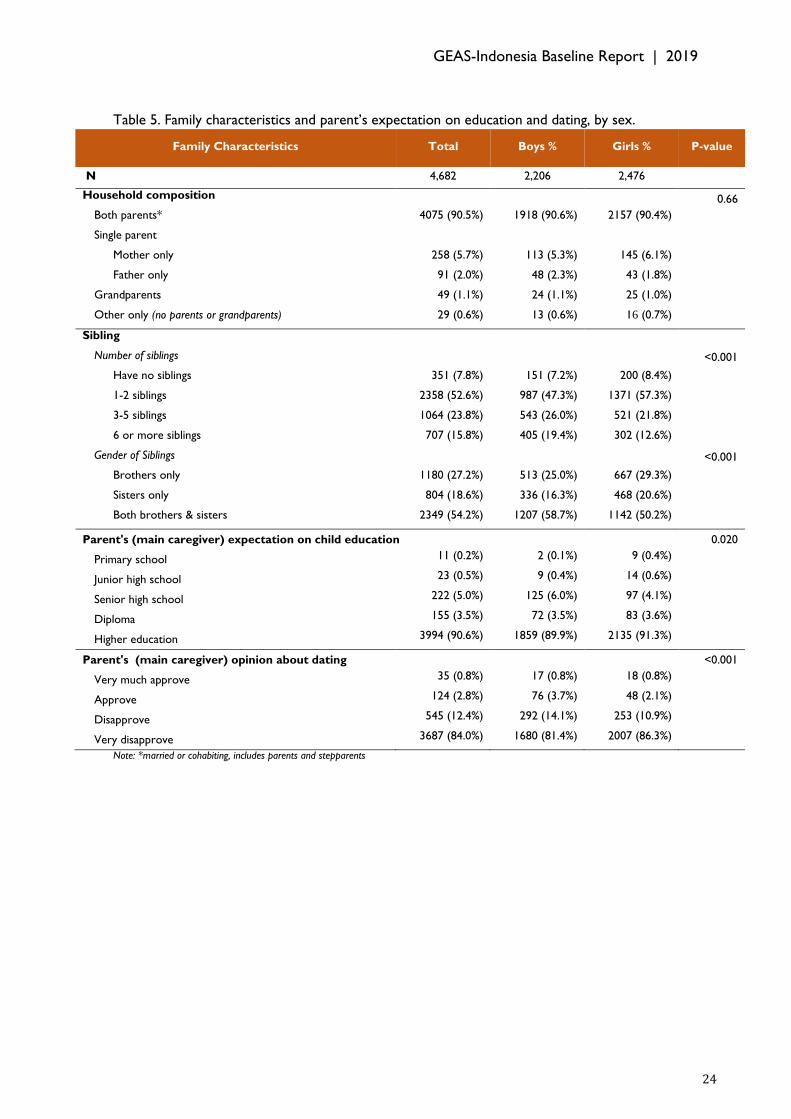
GEAS-Indonesia Baseline Report | 2019
24
Table 5. Family characteristics and parent’s expectation on education and dating, by sex.
Family Characteristics Total Boys % Girls % P-value
N 4,682 2,206 2,476
Household composition
0.66
Both parents* 4075 (90.5%) 1918 (90.6%) 2157 (90.4%)
Single parent
Mother only 258 (5.7%) 113 (5.3%) 145 (6.1%)
Father only 91 (2.0%) 48 (2.3%) 43 (1.8%)
Grandparents 49 (1.1%) 24 (1.1%) 25 (1.0%)
Other only (no parents or grandparents) 29 (0.6%) 13 (0.6%) 16 (0.7%)
Sibling
Number of siblings
<0.001
Have no siblings 351 (7.8%) 151 (7.2%) 200 (8.4%)
1-2 siblings 2358 (52.6%) 987 (47.3%) 1371 (57.3%)
3-5 siblings 1064 (23.8%) 543 (26.0%) 521 (21.8%)
6 or more siblings 707 (15.8%) 405 (19.4%) 302 (12.6%)
Gender of Siblings
<0.001
Brothers only 1180 (27.2%) 513 (25.0%) 667 (29.3%)
Sisters only 804 (18.6%) 336 (16.3%) 468 (20.6%)
Both brothers & sisters 2349 (54.2%) 1207 (58.7%) 1142 (50.2%)
Parent's (main caregiver) expectation on child education
0.020
Primary school 11 (0.2%) 2 (0.1%) 9 (0.4%)
Junior high school 23 (0.5%) 9 (0.4%) 14 (0.6%)
Senior high school 222 (5.0%) 125 (6.0%) 97 (4.1%)
Diploma 155 (3.5%) 72 (3.5%) 83 (3.6%)
Higher education 3994 (90.6%) 1859 (89.9%) 2135 (91.3%)
Parent's (main caregiver) opinion about dating
<0.001
Very much approve 35 (0.8%) 17 (0.8%) 18 (0.8%)
Approve 124 (2.8%) 76 (3.7%) 48 (2.1%)
Disapprove 545 (12.4%) 292 (14.1%) 253 (10.9%)
Very disapprove 3687 (84.0%) 1680 (81.4%) 2007 (86.3%)
Note: *married or cohabiting, includes parents and stepparents

GEAS-Indonesia Baseline Report | 2019
25
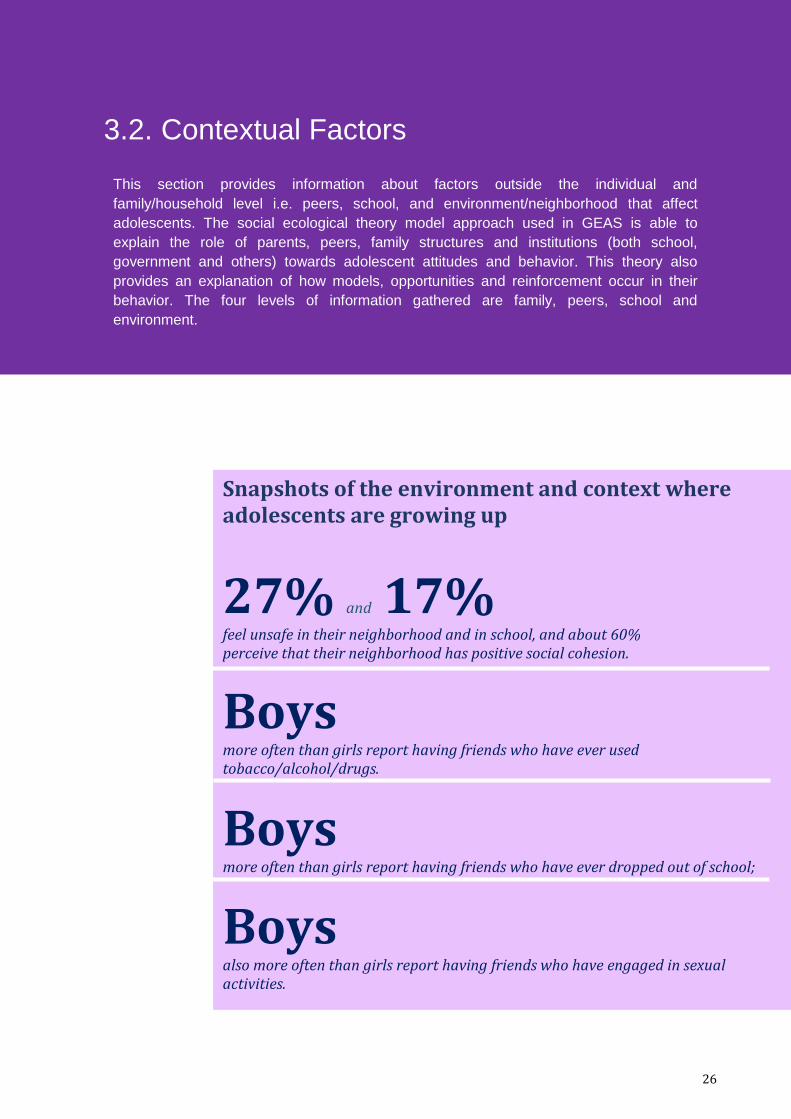
GEAS-Indonesia Baseline Report | 2019
26
3.2. Contextual Factors This section provides information about factors outside the individual and
family/household level i.e. peers, school, and environment/neighborhood that affect
adolescents. The social ecological theory model approach used in GEAS is able to
explain the role of parents, peers, family structures and institutions (both school,
government and others) towards adolescent attitudes and behavior. This theory also
provides an explanation of how models, opportunities and reinforcement occur in their
behavior. The four levels of information gathered are family, peers, school and
environment.
Snapshots of the environment and context where adolescents are growing up
27% and 17% feel unsafe in their neighborhood and in school, and about 60% perceive that their neighborhood has positive social cohesion.
Boys more often than girls report having friends who have ever used tobacco/alcohol/drugs.
Boys more often than girls report having friends who have ever dropped out of school;
Boys also more often than girls report having friends who have engaged in sexual activities.

GEAS-Indonesia Baseline Report | 2019
27
3.2.1. Peers Factor
Many studies have shown that peers
are an important factor in young people's
life. The GEAS also examined several peer
characteristics, including peer structure and
peer attitudes and behaviors related to
school, substance use (tobacco/vapor/
alcohol/drugs), and sexual activity.
Fifty-eight percent of the students
have more than three close friends (i.e. a
friend with whom one can talk about feelings
and share secrets) of the same sex, but a
majority also had at least one friend of the
opposite sex (70% of boys and 60% of girls).
Most adolescents saw their friends once or
twice a week while a third saw their friends
every day. There was no notable difference
in these indicators by site, except that
students in Bandar Lampung (42%) were
more likely to spend time with their friends
nearly every day than those in Denpasar
(33%) and Semarang (33%).
Figure 7. Percentage of adolescents who had more than three male/female close friends, by sex
and site.
Students were asked about their close
friends’ attitudes indicating how important it
was for their friends to (1) attend school
regularly, or (2) be popular with people their
age, (3) study hard, or (4) pay attention to
their appearance, (5) be good in sport, (6)
have a boyfriend or girlfriend, or (7) have
sexual intercourse. Most adolescents
reported school attendance and studying
hard was important to their friends (91% and
84%). More than half also believed being
good in sports and appearance were
important to their friends (67% and 58%)
while 47% thought being popular was
important to their peers and fewer (28%)
indicated that having a boyfriend or girl
friend was important to their friends. Only
4% thought sexual relations were important
for their friends. Peers attitudes varied
across sites, with a greater percentage of
adolescents in Denpasar reporting
education, sports, appearance and being
popular were important for their close
friends than in other sites. For example,
53% of the students in Denpasar reported
that all or most of their close friends
thought that being popular was important,
compared to 44% in Bandar Lampung and
45% in Semarang.
GEAS-Indonesia Baseline Report | 2019
28
Adolescents also reported on their
friends’ behaviors related to substance use
and sexual relations. According to these
perceptions, smoking was prevalent,
particularly in Semarang where 41%
indicated that their close friends smoked
compared to 16% in Denpasar and 27%
Bandar Lampung. Altogether, 10% thought
their friends drank alcohol, rising slightly to
14% in Semarang. Few (7%) indicated that
their friends had dropped out of school, with
a higher percentage in Bandar Lampung (9%).
Few peers were perceived to have engaged
in kissing or petting and fewer than 4%
thought their friends had ever had sexual
relations. Students in Semarang were more
likely to perceive that their peers have
engaged in kissing or petting than students in
other sites. However, students in Bandar
Lampung were more likely than those in
other sites to believe that their peers have
had sexual intercourse.
A number of peer indicators differed
between boys and girls. Boys’ peer network
was larger than girls and more likely to
include both sexes. Boys were also more
likely to spend time with their friends than
girls (46% spent time every day versus 26%
of girls).
Peer attitudes were also different
between boys and girls, with greater
importance devoted to studying hard and
greater attention to appearance among girls’
peers while a greater percentage of boys
indicated that being good in sports, having
romantic relations and having sexual
relations were important to their friends.
Perception on peer attitude
toward risk taking
behaviors among boys is
higher than girls suggests
gendered behaviors
encouraging risk taking
among boys.
Boys were more likely to indicate that
their close friends smoked or consumed
alcohol, or drugs or had ever kissed, fondled
or has sexual relations than girls. For
example, 36% of boys versus 19% of girls
reported their close friends smoked
cigarettes and 13% of boys versus 8% of girls
reported their friends consummed alcohol.
Additionally, 10% of boys and 4% of girls had
close friends who had dropped out of
school. Seven percent of boys versus 1%
believed a close friend had had sex. While
these results reflect perceptions rather than
actual behaviors, they nevertherless suggest
gendered behaviors encouraging risk taking
among boys.
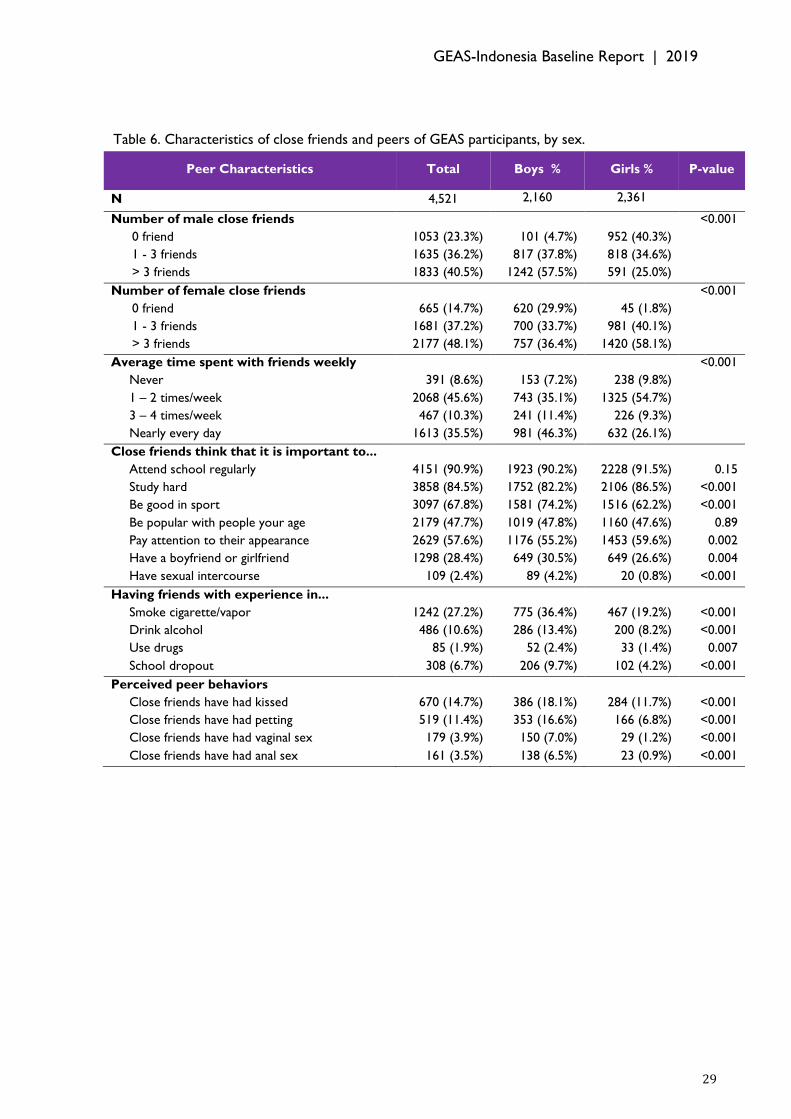
GEAS-Indonesia Baseline Report | 2019
29
Table 6. Characteristics of close friends and peers of GEAS participants, by sex.
Peer Characteristics Total Boys % Girls % P-value
N 4,521 2,160 2,361
Number of male close friends
<0.001
0 friend 1053 (23.3%) 101 (4.7%) 952 (40.3%)
1 - 3 friends 1635 (36.2%) 817 (37.8%) 818 (34.6%)
> 3 friends 1833 (40.5%) 1242 (57.5%) 591 (25.0%)
Number of female close friends
<0.001
0 friend 665 (14.7%) 620 (29.9%) 45 (1.8%)
1 - 3 friends 1681 (37.2%) 700 (33.7%) 981 (40.1%)
> 3 friends 2177 (48.1%) 757 (36.4%) 1420 (58.1%)
Average time spent with friends weekly
<0.001
Never 391 (8.6%) 153 (7.2%) 238 (9.8%)
1 – 2 times/week 2068 (45.6%) 743 (35.1%) 1325 (54.7%)
3 – 4 times/week 467 (10.3%) 241 (11.4%) 226 (9.3%)
Nearly every day 1613 (35.5%) 981 (46.3%) 632 (26.1%)
Close friends think that it is important to...
Attend school regularly 4151 (90.9%) 1923 (90.2%) 2228 (91.5%) 0.15
Study hard 3858 (84.5%) 1752 (82.2%) 2106 (86.5%) <0.001
Be good in sport 3097 (67.8%) 1581 (74.2%) 1516 (62.2%) <0.001
Be popular with people your age 2179 (47.7%) 1019 (47.8%) 1160 (47.6%) 0.89
Pay attention to their appearance 2629 (57.6%) 1176 (55.2%) 1453 (59.6%) 0.002
Have a boyfriend or girlfriend 1298 (28.4%) 649 (30.5%) 649 (26.6%) 0.004
Have sexual intercourse 109 (2.4%) 89 (4.2%) 20 (0.8%) <0.001
Having friends with experience in...
Smoke cigarette/vapor 1242 (27.2%) 775 (36.4%) 467 (19.2%) <0.001
Drink alcohol 486 (10.6%) 286 (13.4%) 200 (8.2%) <0.001
Use drugs 85 (1.9%) 52 (2.4%) 33 (1.4%) 0.007
School dropout 308 (6.7%) 206 (9.7%) 102 (4.2%) <0.001
Perceived peer behaviors
Close friends have had kissed 670 (14.7%) 386 (18.1%) 284 (11.7%) <0.001
Close friends have had petting 519 (11.4%) 353 (16.6%) 166 (6.8%) <0.001
Close friends have had vaginal sex 179 (3.9%) 150 (7.0%) 29 (1.2%) <0.001
Close friends have had anal sex 161 (3.5%) 138 (6.5%) 23 (0.9%) <0.001
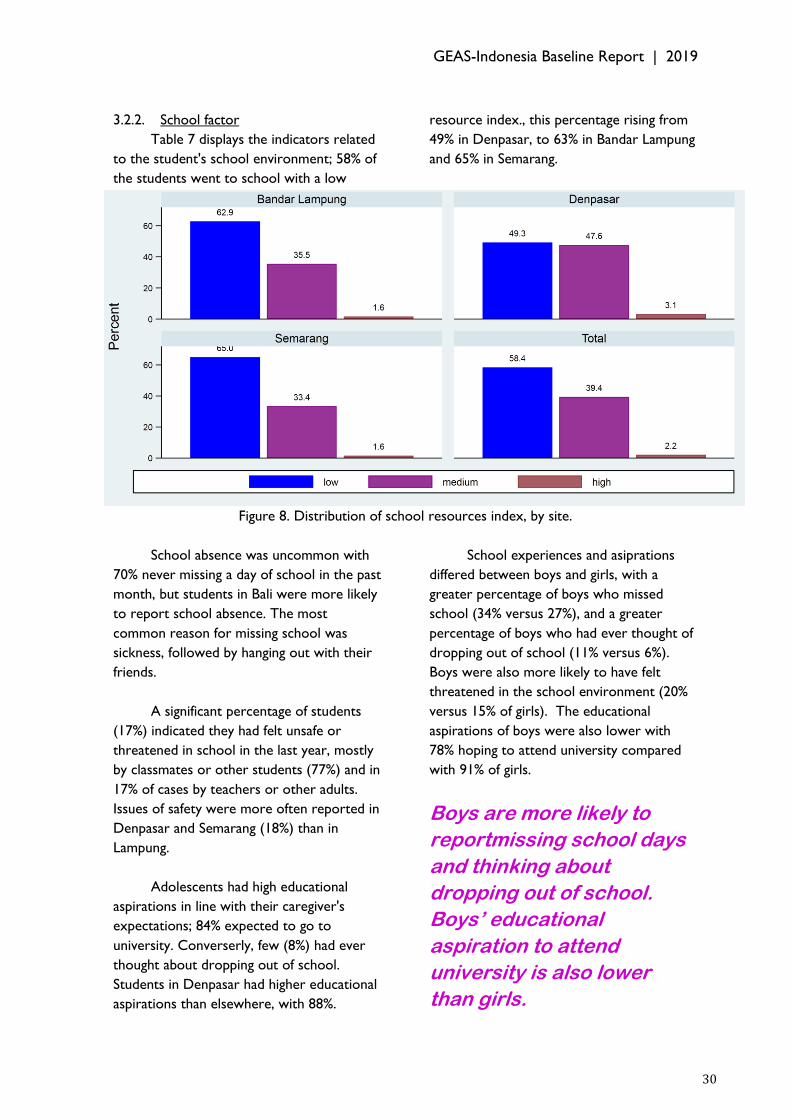
GEAS-Indonesia Baseline Report | 2019
30
3.2.2. School factor
Table 7 displays the indicators related
to the student's school environment; 58% of
the students went to school with a low
resource index., this percentage rising from
49% in Denpasar, to 63% in Bandar Lampung
and 65% in Semarang.
Figure 8. Distribution of school resources index, by site.
School absence was uncommon with
70% never missing a day of school in the past
month, but students in Bali were more likely
to report school absence. The most
common reason for missing school was
sickness, followed by hanging out with their
friends.
A significant percentage of students
(17%) indicated they had felt unsafe or
threatened in school in the last year, mostly
by classmates or other students (77%) and in
17% of cases by teachers or other adults.
Issues of safety were more often reported in
Denpasar and Semarang (18%) than in
Lampung.
Adolescents had high educational
aspirations in line with their caregiver's
expectations; 84% expected to go to
university. Converserly, few (8%) had ever
thought about dropping out of school.
Students in Denpasar had higher educational
aspirations than elsewhere, with 88%.
School experiences and asiprations
differed between boys and girls, with a
greater percentage of boys who missed
school (34% versus 27%), and a greater
percentage of boys who had ever thought of
dropping out of school (11% versus 6%).
Boys were also more likely to have felt
threatened in the school environment (20%
versus 15% of girls). The educational
aspirations of boys were also lower with
78% hoping to attend university compared
with 91% of girls.
Boys are more likely to
reportmissing school days
and thinking about
dropping out of school.
Boys’ educational
aspiration to attend
university is also lower
than girls.

GEAS-Indonesia Baseline Report | 2019
31
Table 7. The indicators related to school environment and attitude about school of GEAS
participants, by sex.
School Context Total Boys % Girls % P-value
N 4,681 2,206 2,475
School Grade
7th grade 100.0 100.0 100.0
Attends Co-ed School 4353 (94.5%) 2040 (94.1%) 2313 (94.8%) 0.30
Average number of school days missed <0.001
0 day 3170 (69.9%) 1407 (66.4%) 1763 (73.0%)
1-2 days 1196 (26.4%) 619 (29.2%) 577 (23.9%)
3-5 days 116 (2.6%) 67 (3.2%) 49 (2.0%)
6 or more days 51 (1.1%) 26 (1.2%) 25 (1.0%)
Most common reasons for missing school
Sickness 1054 (22.5%) 543 (24.6%) 511 (20.6%) 0.001
Hanging out with friends 52 (1.1%) 29 (1.3%) 23 (0.9%) 0.59
Other reason* 65 (1.4%) 43 (2.0%) 22 (0.9%)
The percentage of boys/girls who) ever thought about dropping out of school this year <0.001
Yes 378 (8.1%) 233 (10.6%) 145 (5.9%)
I expect to complete <0.001
Primary or secondary school 132 (2.9%) 95 (4.5%) 37 (1.5%)
Vocational or high school 606 (13.4%) 424 (19.9%) 182 (7.5%)
Graduate degree (university, licensure, or
doctorate) 3795 (83.6%) 1607 (75.5%) 2188 (90.8%)
School Resource Index3 0.42
Low 2371 (58.4%) 1134 (58.7%) 1237 (58.2%)
Medium 1599 (39.4%) 751 (38.9%) 848 (39.9%)
High 89 (2.2%) 48 (2.5%) 41 (1.9%)
Student's knownledge about Healthy School Indicators4
Non-smoking area 3571 (76.2%) 1740 (78.8%) 1831 (73.9%) <0.001
No drugs area 3375 (72.1%) 1675 (75.9%) 1700 (68.6%) <0.001
Non-violence area 3232 (69.0%) 1589 (72.0%) 1643 (66.3%) <0.001
Healthy life skill education 3519 (75.1%) 1694 (76.8%) 1825 (73.7%) 0.015
Felt unsafe or threatened in the school 803 (17.1%) 432 (19.6%) 371 (15.0%) <0.001
Felt unsafe or threatened in the school because of...
Adults or teachers 136 (17.2%) 76 (17.8%) 60 (16.4%) 0.60
Classmates or other students 606 (76.6%) 331 (77.7%) 275 (75.3%) 0.43
Other (e.g. animals, car accidents) 191 (24.1%) 91 (21.4%) 100 (27.4%) 0.048
Note: *Lack of school fees, due to period, help out at home, babysit, work to earn money, study for exam.
3 Calculated through availability of toilets with doors, running water, soap, computer, trash can, and sports club or team. 4 Healthy School Indicator is a set of indicator provided by Indonesia Ministry of Health.

GEAS-Indonesia Baseline Report | 2019
32
3.2.3. Neighborhood Environment
Table 8 displays the indicators related
to the student's neighborhood environment.
The students generally had positive
perceptions of their neighborhoods although
their assessment of social control was lower
then their perceptions of social cohesion.
60% considered they lived in a neighborhood
with high social cohesion, responding
positively to all of the following statements:
(1) People in my neighborhood look out for
and help their neighbors, (2) People in my
neighborhood can be trusted, (3) People in
my neighborhood know who I am, and (4)
People in my neighborhood care about me.
Figure 9. Perception of neighborhood social control and cohesion, by sex and site.
Fewer adolescents (44%) responded
positively to the social cohesion questions:
(1) Adult in your neighborhood would
intervene if children or teenagers were
damaging property, (2) Adult in your
neighborhood would intervene if children or
adult were spraying paint on walls (graffiti),
(3) Adult in your neighborhood would
intervene if children or adult were bullying
or threatening. Students in Denpasar had
more positive perceptions of their
neighborhood's social cohesion compared to
other sites; but perception of social control
was highest in Semarang.

GEAS-Indonesia Baseline Report | 2019
33
Figure 10. Percentage of adolescents feeling threatened/unsafe in their neighborhood, by sex and
site.
A significant proportion of adolescents
(27%) indicated they had felt unsafe or
threatened in their neighborhood in the last
year, and 10% currently felt unsafe. Up to
21% of adolescents carried some kind of
weapon for protection; only 36% had
someone to turn to if they felt unsafe.
Feelings of insecurity in the last year were
more common in Semarang (32%) than in
Bandar Lampung (26%) and Denpasar (23%).
Perceptions of the community
environement differed between boys and
girls, as boys had higher perceptions of social
cohesion but lower perceptions of social
control. While perceptions of safety were
similar among boys and girls, boys were
more likely to have something to protect
themselves (23% versus 19%) while girls
were more likely to have someone to turn
to if they felt threatened (39% versus 34%).
Boys had higher
perceptions of social
cohesion but lower
perceptions of social
control.
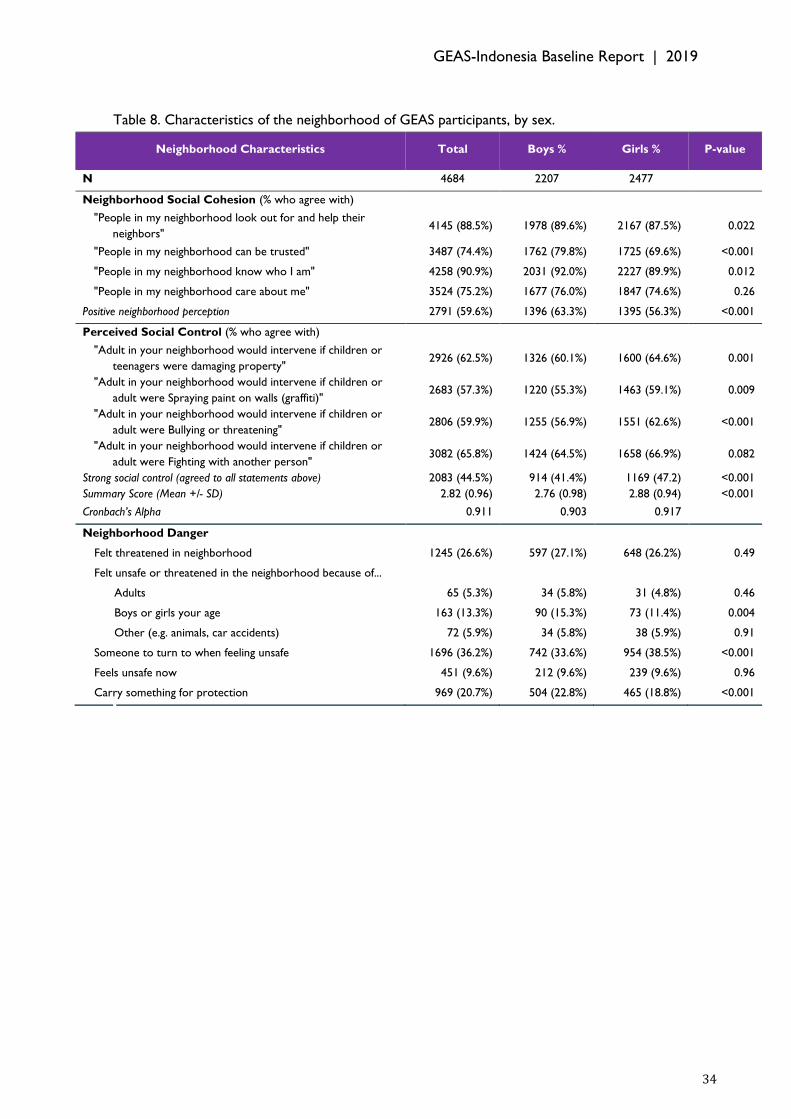
GEAS-Indonesia Baseline Report | 2019
34
Table 8. Characteristics of the neighborhood of GEAS participants, by sex.
Neighborhood Characteristics Total Boys % Girls % P-value
N 4684 2207 2477
Neighborhood Social Cohesion (% who agree with)
"People in my neighborhood look out for and help their
neighbors" 4145 (88.5%) 1978 (89.6%) 2167 (87.5%) 0.022
"People in my neighborhood can be trusted" 3487 (74.4%) 1762 (79.8%) 1725 (69.6%) <0.001
"People in my neighborhood know who I am" 4258 (90.9%) 2031 (92.0%) 2227 (89.9%) 0.012
"People in my neighborhood care about me" 3524 (75.2%) 1677 (76.0%) 1847 (74.6%) 0.26
Positive neighborhood perception 2791 (59.6%) 1396 (63.3%) 1395 (56.3%) <0.001
Perceived Social Control (% who agree with)
"Adult in your neighborhood would intervene if children or
teenagers were damaging property" 2926 (62.5%) 1326 (60.1%) 1600 (64.6%) 0.001
"Adult in your neighborhood would intervene if children or
adult were Spraying paint on walls (graffiti)" 2683 (57.3%) 1220 (55.3%) 1463 (59.1%) 0.009
"Adult in your neighborhood would intervene if children or
adult were Bullying or threatening" 2806 (59.9%) 1255 (56.9%) 1551 (62.6%) <0.001
"Adult in your neighborhood would intervene if children or
adult were Fighting with another person" 3082 (65.8%) 1424 (64.5%) 1658 (66.9%) 0.082
Strong social control (agreed to all statements above) 2083 (44.5%) 914 (41.4%) 1169 (47.2) <0.001
Summary Score (Mean +/- SD) 2.82 (0.96) 2.76 (0.98) 2.88 (0.94) <0.001
Cronbach’s Alpha 0.911 0.903 0.917
Neighborhood Danger
Felt threatened in neighborhood 1245 (26.6%) 597 (27.1%) 648 (26.2%) 0.49
Felt unsafe or threatened in the neighborhood because of...
Adults 65 (5.3%) 34 (5.8%) 31 (4.8%) 0.46
Boys or girls your age 163 (13.3%) 90 (15.3%) 73 (11.4%) 0.004
Other (e.g. animals, car accidents) 72 (5.9%) 34 (5.8%) 38 (5.9%) 0.91
Someone to turn to when feeling unsafe 1696 (36.2%) 742 (33.6%) 954 (38.5%) <0.001
Feels unsafe now 451 (9.6%) 212 (9.6%) 239 (9.6%) 0.96
Carry something for protection 969 (20.7%) 504 (22.8%) 465 (18.8%) <0.001

GEAS-Indonesia Baseline Report | 2019
35
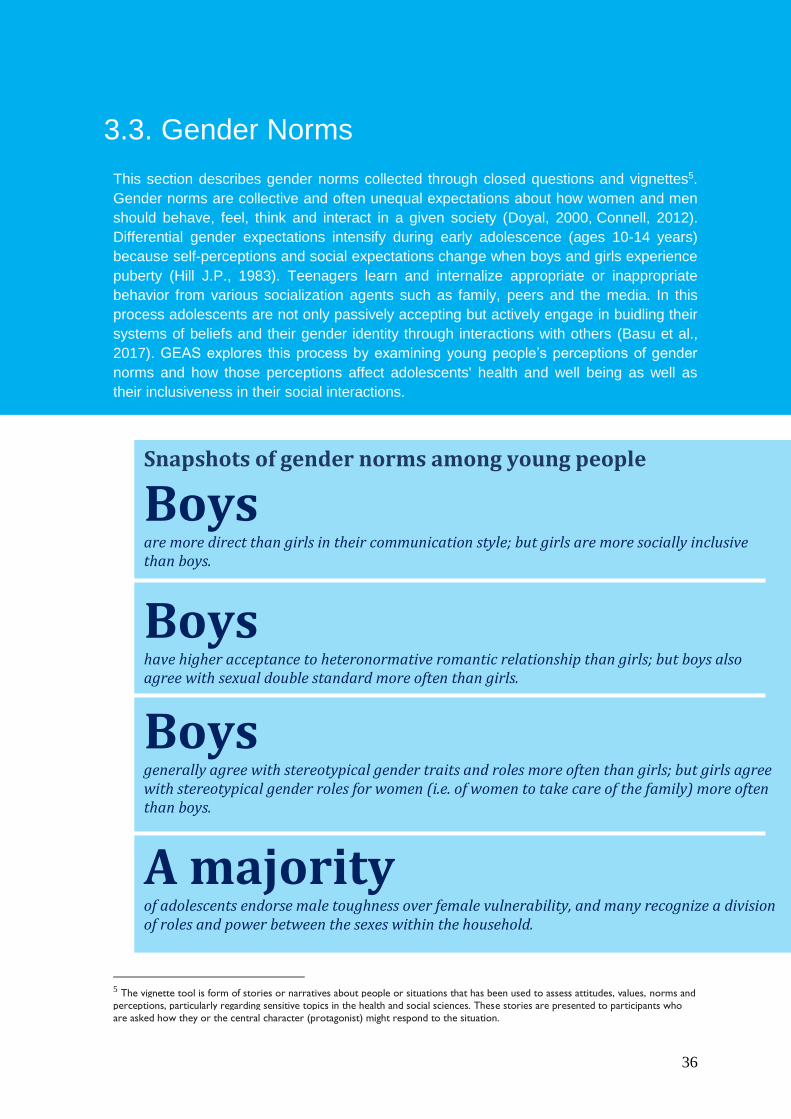
GEAS-Indonesia Baseline Report | 2019
36
3.3. Gender Norms
This section describes gender norms collected through closed questions and vignettes5.
Gender norms are collective and often unequal expectations about how women and men
should behave, feel, think and interact in a given society (Doyal, 2000, Connell, 2012).
Differential gender expectations intensify during early adolescence (ages 10-14 years)
because self-perceptions and social expectations change when boys and girls experience
puberty (Hill J.P., 1983). Teenagers learn and internalize appropriate or inappropriate
behavior from various socialization agents such as family, peers and the media. In this
process adolescents are not only passively accepting but actively engage in buidling their
systems of beliefs and their gender identity through interactions with others (Basu et al.,
2017). GEAS explores this process by examining young people’s perceptions of gender
norms and how those perceptions affect adolescents' health and well being as well as
their inclusiveness in their social interactions.
5 The vignette tool is form of stories or narratives about people or situations that has been used to assess attitudes, values, norms and
perceptions, particularly regarding sensitive topics in the health and social sciences. These stories are presented to participants who
are asked how they or the central character (protagonist) might respond to the situation.
Snapshots of gender norms among young people
Boys are more direct than girls in their communication style; but girls are more socially inclusive than boys.
Boys have higher acceptance to heteronormative romantic relationship than girls; but boys also agree with sexual double standard more often than girls.
Boys generally agree with stereotypical gender traits and roles more often than girls; but girls agree with stereotypical gender roles for women (i.e. of women to take care of the family) more often than boys.
A majority
of adolescents endorse male toughness over female vulnerability, and many recognize a division of roles and power between the sexes within the household.
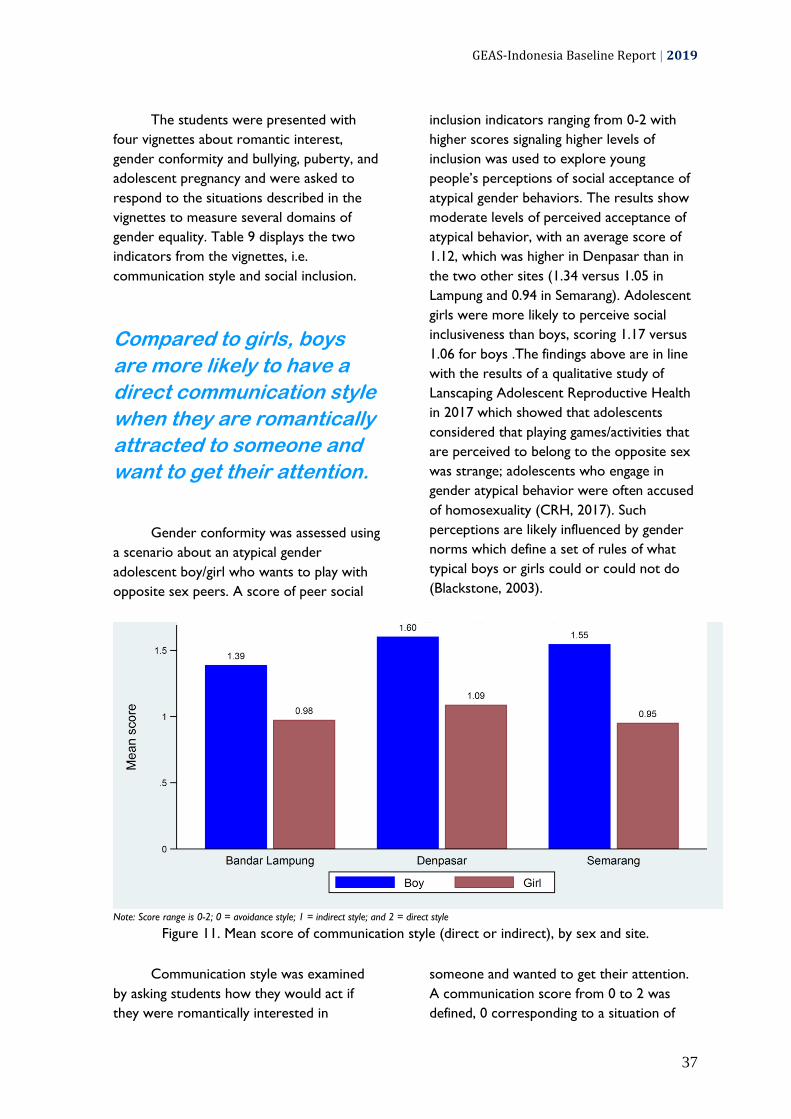
GEAS-Indonesia Baseline Report | 2019
37
The students were presented with
four vignettes about romantic interest,
gender conformity and bullying, puberty, and
adolescent pregnancy and were asked to
respond to the situations described in the
vignettes to measure several domains of
gender equality. Table 9 displays the two
indicators from the vignettes, i.e.
communication style and social inclusion.
Compared to girls, boys
are more likely to have a
direct communication style
when they are romantically
attracted to someone and
want to get their attention.
Gender conformity was assessed using
a scenario about an atypical gender
adolescent boy/girl who wants to play with
opposite sex peers. A score of peer social
inclusion indicators ranging from 0-2 with
higher scores signaling higher levels of
inclusion was used to explore young
people’s perceptions of social acceptance of
atypical gender behaviors. The results show
moderate levels of perceived acceptance of
atypical behavior, with an average score of
1.12, which was higher in Denpasar than in
the two other sites (1.34 versus 1.05 in
Lampung and 0.94 in Semarang). Adolescent
girls were more likely to perceive social
inclusiveness than boys, scoring 1.17 versus
1.06 for boys .The findings above are in line
with the results of a qualitative study of
Lanscaping Adolescent Reproductive Health
in 2017 which showed that adolescents
considered that playing games/activities that
are perceived to belong to the opposite sex
was strange; adolescents who engage in
gender atypical behavior were often accused
of homosexuality (CRH, 2017). Such
perceptions are likely influenced by gender
norms which define a set of rules of what
typical boys or girls could or could not do
(Blackstone, 2003).
Note: Score range is 0-2; 0 = avoidance style; 1 = indirect style; and 2 = direct style
Figure 11. Mean score of communication style (direct or indirect), by sex and site.
Communication style was examined
by asking students how they would act if
they were romantically interested in
someone and wanted to get their attention.
A communication score from 0 to 2 was
defined, 0 corresponding to a situation of
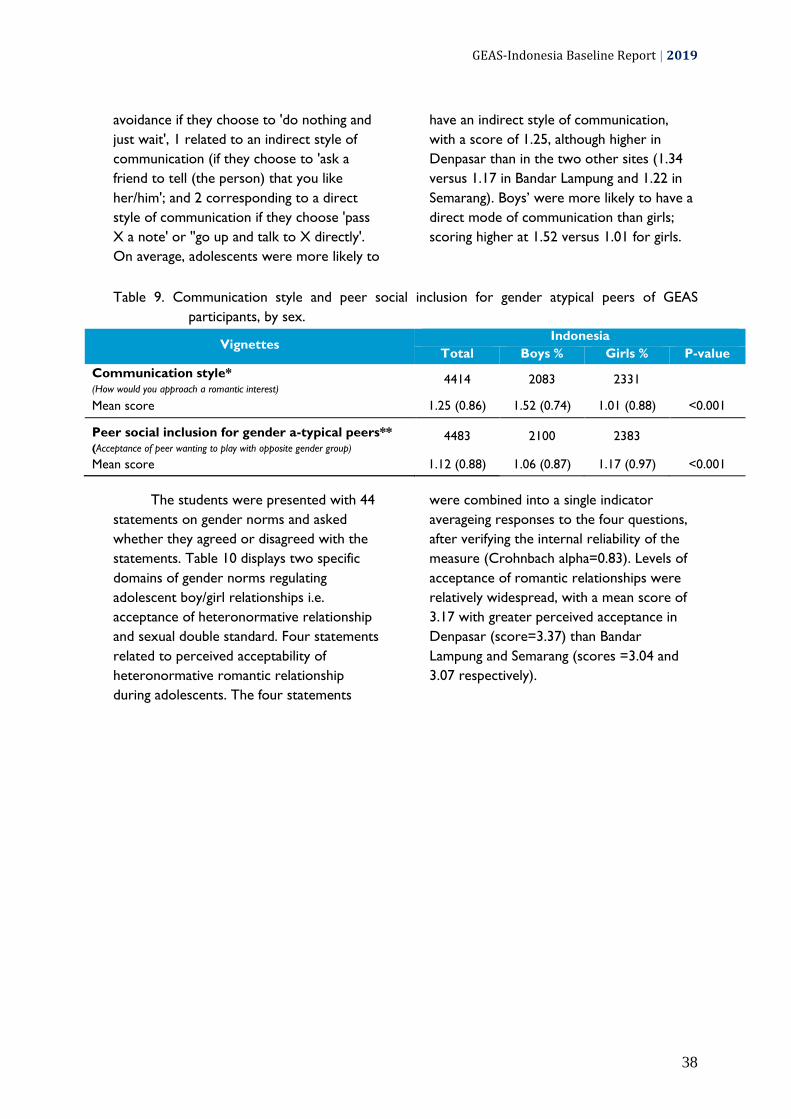
GEAS-Indonesia Baseline Report | 2019
38
avoidance if they choose to 'do nothing and
just wait', 1 related to an indirect style of
communication (if they choose to 'ask a
friend to tell (the person) that you like
her/him'; and 2 corresponding to a direct
style of communication if they choose 'pass
X a note' or ''go up and talk to X directly'.
On average, adolescents were more likely to
have an indirect style of communication,
with a score of 1.25, although higher in
Denpasar than in the two other sites (1.34
versus 1.17 in Bandar Lampung and 1.22 in
Semarang). Boys’ were more likely to have a
direct mode of communication than girls;
scoring higher at 1.52 versus 1.01 for girls.
Table 9. Communication style and peer social inclusion for gender atypical peers of GEAS
participants, by sex.
Vignettes Indonesia
Total Boys % Girls % P-value
Communication style* (How would you approach a romantic interest)
4414 2083 2331
Mean score 1.25 (0.86) 1.52 (0.74) 1.01 (0.88) <0.001
Peer social inclusion for gender a-typical peers** (Acceptance of peer wanting to play with opposite gender group)
4483 2100 2383
Mean score 1.12 (0.88) 1.06 (0.87) 1.17 (0.97) <0.001
The students were presented with 44
statements on gender norms and asked
whether they agreed or disagreed with the
statements. Table 10 displays two specific
domains of gender norms regulating
adolescent boy/girl relationships i.e.
acceptance of heteronormative relationship
and sexual double standard. Four statements
related to perceived acceptability of
heteronormative romantic relationship
during adolescents. The four statements
were combined into a single indicator
averageing responses to the four questions,
after verifying the internal reliability of the
measure (Crohnbach alpha=0.83). Levels of
acceptance of romantic relationships were
relatively widespread, with a mean score of
3.17 with greater perceived acceptance in
Denpasar (score=3.37) than Bandar
Lampung and Semarang (scores =3.04 and
3.07 respectively).
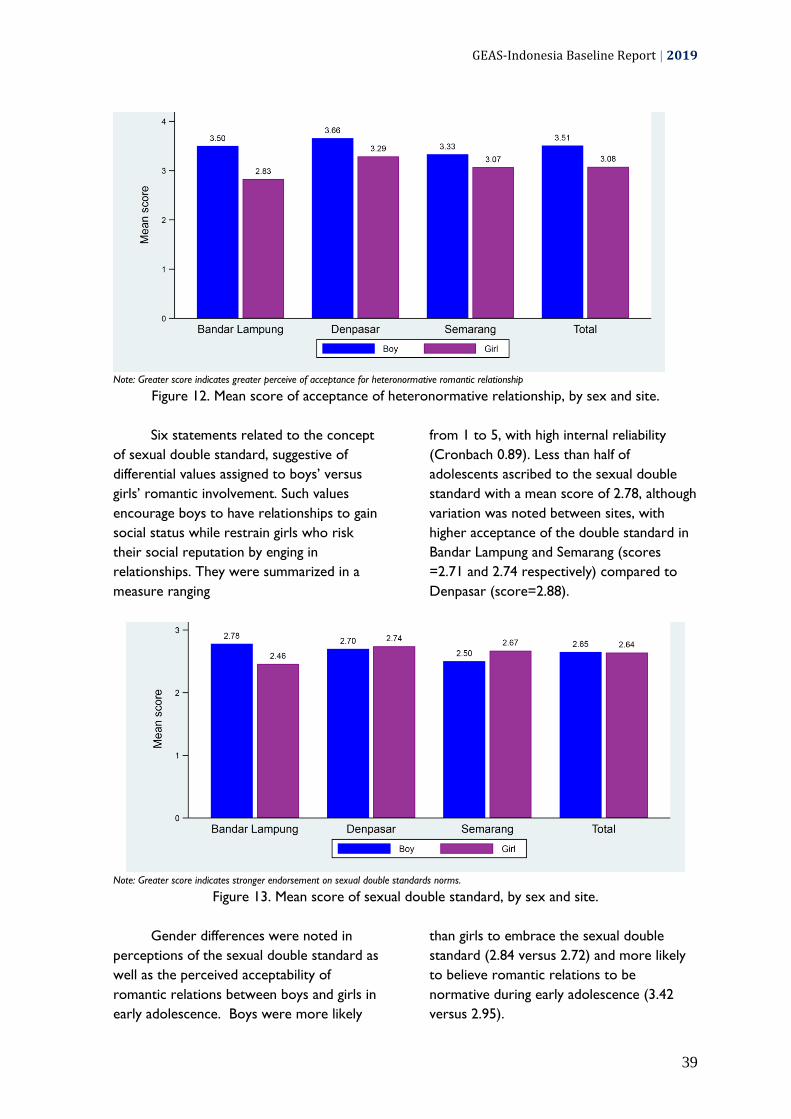
GEAS-Indonesia Baseline Report | 2019
39
Note: Greater score indicates greater perceive of acceptance for heteronormative romantic relationship
Figure 12. Mean score of acceptance of heteronormative relationship, by sex and site.
Six statements related to the concept
of sexual double standard, suggestive of
differential values assigned to boys’ versus
girls’ romantic involvement. Such values
encourage boys to have relationships to gain
social status while restrain girls who risk
their social reputation by enging in
relationships. They were summarized in a
measure ranging
from 1 to 5, with high internal reliability
(Cronbach 0.89). Less than half of
adolescents ascribed to the sexual double
standard with a mean score of 2.78, although
variation was noted between sites, with
higher acceptance of the double standard in
Bandar Lampung and Semarang (scores
=2.71 and 2.74 respectively) compared to
Denpasar (score=2.88).
Note: Greater score indicates stronger endorsement on sexual double standards norms.
Figure 13. Mean score of sexual double standard, by sex and site.
Gender differences were noted in
perceptions of the sexual double standard as
well as the perceived acceptability of
romantic relations between boys and girls in
early adolescence. Boys were more likely
than girls to embrace the sexual double
standard (2.84 versus 2.72) and more likely
to believe romantic relations to be
normative during early adolescence (3.42
versus 2.95).

GEAS-Indonesia Baseline Report | 2019
40
Table 10. Acceptance of heteronormative relationship and sexual double standard of GEAS
participants, by sex.
Gender Norms Indonesia
Total Boys % Girls % P-value
Adolescent Acceptance of Romantic Relationships (%
who agree with…) 4622 2172 2450
It’s normal for a boy your age to want a girlfriend 54.9 60.1 50.3 <0.001
It’s normal for a girl to want a boyfriend at your age 51.5 54.1 49.1 0.001
A girl should be able to have a boyfriend if she wants to 37.4 48.1 27.9 <0.001
A boy should be able to have a girlfriend if he wants to 41.3 54.4 29.6 <0.001
Mean Score* 3.28 (1.04) 3.51 (1.05) 3.08 (1.00) <0.001
Cronbach’s Alpha 0.87
Sexual Double Standard (% who agree with…) 4682 2171 2457
Adolescent boys fool girls into having sex 15.0 17.4 12.9 <0.001
Adolescent girls should avoid boys because they trick them
into having sex 43.9 37.4 49.7 <0.001
Girls are the victims of rumors if they have boyfriends 36.0 35.6 36.3 0.606
Boys have girlfriends to show off to their friends 25.0 23.8 26.0 0.081
Adolescent boys lose interest in a girl after they have sex
with her 23.7 25.3 22.4 0.019
Boys tell girls they love them when they don’t 22.7 23.7 21.8 0.140
Mean Score** 2.64 (0.98) 2.65 (0.98) 2.64 (0.99) 0.71
Cronbach’s Alpha 0.84

GEAS-Indonesia Baseline Report | 2019
41
Note: Greater score indicates stronger endorsement on stereotypical gender norms and gender traits.
Figure 14. Mean score of agreement to stereotypical gender trait and gender roles, by sex and site.
Other dimensions of gender norms,
including stereotypical gender traits and
stereotypical roles are presented in Table
11.
Stereotypical gender traits were
examined in a series of questions contrasting
boys’ toughness with girls’ vulnerabilities.
More than half of the students agreed with
the statements on stereotypical gender
traits, except with 'boys should always
defend themselves even if it means fighting'
(48% agreed) and 'boys who behave like girls
are considered weak' (43% agreed).
Boys show higher
endorsement on norms that
indicate boys’ toughness
over girls’ vulnerabilities,
as well as males’ authority
in the household.

GEAS-Indonesia Baseline Report | 2019
42
A summary measure across all items (with
high internal reliability Chronbach
alpha=0.80) indicates an average score of
3.87, which varied from 3.83 to 3.93 across
sites, suggesting more traditional norms in
Bandar Lampung than other sites.
The majority of students endorsed
stereotypical gender roles, with 52% to 68%
endorsing the series of items portraying the
division of gender roles as well as male
authority in the household. A summary
score ranging from 1 to 5 with high internal
relibability (Cronbach alpha=0.87) shows an
average score of 3.85, higher in Bandar
Lampung than in the 2 other sites.
Figure 15. Acceptance to gender-based teasing by sex and site.
Finally, 18% of students agreed that it
was okay to tease a girl who acted like a boy
or a boy who acted like a girl. Perceptions of
stereotypical gender traits were consistenly
higher among boys than girls (scores 3.91
versus 3.83, respectively) while no
differences were noted with respect to
stereotypical gender roles. Likewise, boys
were more likely to approve of teasing
behaviors against adolescents with atypical
gendered behavior.

GEAS-Indonesia Baseline Report | 2019
43
Table 11. Agreement with strereotypical gender traits and roles and social sanction for challenging
stereotypical gender roles among GEAS participants, by sex.
Gender Norms Concept Total Boys % Girls % P-value
N 4,684 2,207 2,477
Stereotypical gender traits: toughness versus vulnerability (% agree)
Boys should always defend themselves even if it means fighting. 47.8 55.6 41.0 <0.001
It’s important for boys to show they are tough even if they are nervous inside. 50.6 55.6 46.1 <0.001
Boys who behave like girls are considered weak. 42.9 46.4 39.9 <0.001
Boys should be raised to be tough so can overcome any difficulties in life 77.3 77.2 77.4 0.86
Girls are expected to be humble. 72.0 71.4 72.6 0.39
Girls should avoid raising their voice to be lady like. 61.6 65.4 58.2 <0.001
Girls need their parents’ protection more than boys. 75.5 71.6 78.9 <0.001
Mean Score 3.87 (0.72) 3.91 (0.78) 3.83 (0.67) <0.001
Cronbach’s Alpha 0.80
Stereotypical gender roles (% agree)
A woman’s role is taking care of her home and family. 64.5 60.9 67.7 <0.001
A man should have the final word about decisions in the home. 51.7 56.0 47.9 <0.001
A woman should obey her husband in all matters. 55.1 56.6 53.7 0.040
Men should be the ones who bring money home for the family, not women. 68.3 67.1 69.4 0.098
Mean Score* 3.85 (0.99) 3.87 (1.05) 3.84 (0.93) 0.27
Cronbach’s Alpha 0.87
Sanctions for challenging gender roles
It is okay to tease a girl who acts like a boy. 17.6 21.1 14.4 <0.001
It is okay to tease a boy who acts like a girl. 18.5 22.5 14.9 <0.001
Table 12. Gender norms indicators by sex and sites.
Gender Norms Concept Bandar Lampung Denpasar Semarang
Boys Girls Boys Girls Boys Girls
Communication style 1.39(0.78) 0.98 (0.89) 1.60 (0.70) 1.10 (0.89) 1.55 (0.74) 0.95 (0.87)
Peer social inclusion for gender a-typical peers 1.02 (0.87) 1.07 (0.88) 1.24 (0.84) 1.40(0.81) 0.87 (0.87) 1.00 (0.88)
Acceptance of Romantic Relationships 3.50 (1.20) 2.83(1.14) 3.65(0.96) 3.29 (0.92) 3.33 (0.99) 3.0 (0.91)
Sexual Double Standard 2.75 (1.12) 2.46 (1.03) 2.70 (0.93) 2.74 (0.95) 2.49 (0.88) 2.67 (0.97)
Stereotypical gender traits
Mean Score 3.95(0.94)
3.91 (0.73) 3.94 (0.71) 3.78 (0.66) 3.86 (0.68) 3.80 (0.61)
Stereotypical gender roles
Mean Score* 3.74 (1.23)
3.89 (1.10) 3.83 (0.97) 3.72 (0.87) 4.04 (0.94) 3.93 (0.83)
Sanctions for challenging gender roles
It is okay to tease a girl who acts like a boy. 20.7% 13.3% 26.3% 18.1% 14.9% 11.4%
It is okay to tease a boy who acts like a girl. 24.6% 17.2% 24.0% 15.0% 18.6% 12.6%

GEAS-Indonesia Baseline Report | 2019
44
Conclusion
In early adolescence, boys and girls already perceive a number of gender unequal
norms related to gender relations, stereotypical norms and traits.
Acceptability of romantic relationships is split in early adolescence, and a significant
percentage of adolescents recognize a sexual double standard rewarding boys but
penalizing girls for engaging in romantic relations.
A majority of adolescents endorse male toughness over female vulnerability, and many
recognize a division of roles and power between the sexes within the household.
Perceptions of gender norms depend on the social context and are generally more
traditional in Bandar Lampung and Semarang than in Denpasar. These perceptions also
differ by sex, as boys typically embrace more unequal norms about relationships and
gender traits.
Gender is also manifested in different behaviors between boys and girls as boys are
more direct than girls in communicating their romantic interest, while girls are more
socially inclusive and less likely to sanction atypical gender behaviors.

GEAS-Indonesia Baseline Report | 2019
45

GEAS-Indonesia Baseline Report | 2019
46
3.4. Empowerment This section describes empowerment which is measured through three components,
namely freedom of movement, voice and decision-making. In Indonesia, The GEAS also
measured teenagers' aspirations regarding education, marriage and reproduction as well
as their ability to plan their future. This information provides valuable points for
stakeholders to formulate steps that can help youth to realize their dreams in the future.
Snapshots of young people’s empowerment
Boys have greater freedom of movement than girls; but girls are able to voice their opinion or concern and to offer advice more often than boys.
Girls
have identified their goals and value their goals more than boys.
Intentions
to marry, to have a child, and to work are almost universal in both boys and girls; and the majority intend to do so after age 20, as most of the students aspire to go to university.
Only a few students feel confident
about discussing contraception, about obtaining information on pregnancy prevention, and about obtaining contraception if needed; boys are more confident to do so than girls.

GEAS-Indonesia Baseline Report | 2019
47
Table 13 and Table 14 displays the
three empowerment subscales as well as
planfullness for the future, and a measure of
self-confidence. Each empowerment
component forms a subscale comprising
several questions. Internal reliability of each
subscale ranged from 0.69 for the freedom
of movement and decision making subcales
to 0.84 for the voice subscale.
Figure 16. Adolescents’ perception of their freedom of movement by sex and site.
The students were asked how often
they are allowed to meet with friends after
school, go to a party with friends, visit a
friend from the opposite sex, go to the
community center or movies without adult
supervision, or go to a religious center
without adult supervision. A majority of
adolescents were free to do school and
religion-related activities, but few indicated
they could meet or do activities with
opposite sex friends. As a result, the
freedom of movement score averaged 2.45,
with higher scores noted in Semarang (2.51)
compared to Denpasar (2.43) and Bandar
Lampung (2.40). However, students in
Denpasar were more likely to meet opposite
sex friends and go to parties than in other
sites. These resuls need careful
interpretation based on local context, as
restricted mobility may also signal lack of
neighborhood safety.
A majority of adolescents
were free to do school and
religion-related activities,
but few indicated they
could do recreational
activities or meet with
opposite sex friends. The
percentages were lower
among girls compared to
boys.
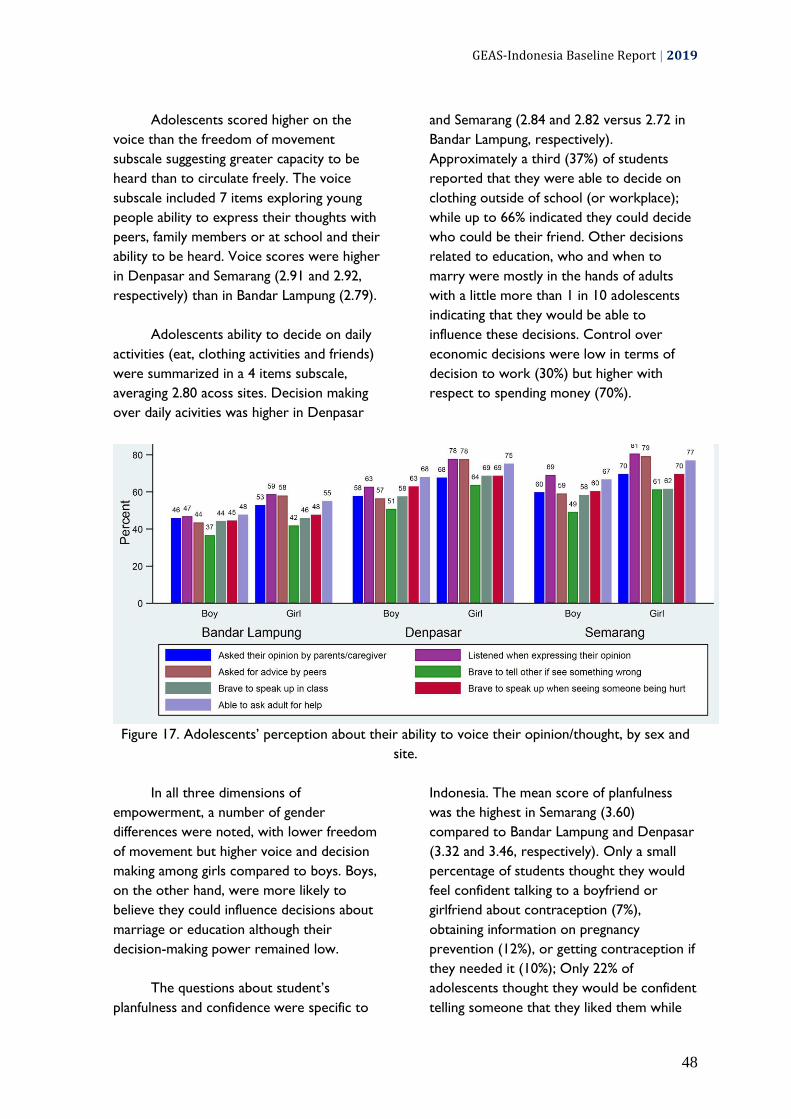
GEAS-Indonesia Baseline Report | 2019
48
Adolescents scored higher on the
voice than the freedom of movement
subscale suggesting greater capacity to be
heard than to circulate freely. The voice
subscale included 7 items exploring young
people ability to express their thoughts with
peers, family members or at school and their
ability to be heard. Voice scores were higher
in Denpasar and Semarang (2.91 and 2.92,
respectively) than in Bandar Lampung (2.79).
Adolescents ability to decide on daily
activities (eat, clothing activities and friends)
were summarized in a 4 items subscale,
averaging 2.80 acoss sites. Decision making
over daily acivities was higher in Denpasar
and Semarang (2.84 and 2.82 versus 2.72 in
Bandar Lampung, respectively).
Approximately a third (37%) of students
reported that they were able to decide on
clothing outside of school (or workplace);
while up to 66% indicated they could decide
who could be their friend. Other decisions
related to education, who and when to
marry were mostly in the hands of adults
with a little more than 1 in 10 adolescents
indicating that they would be able to
influence these decisions. Control over
economic decisions were low in terms of
decision to work (30%) but higher with
respect to spending money (70%).
Figure 17. Adolescents’ perception about their ability to voice their opinion/thought, by sex and
site.
In all three dimensions of
empowerment, a number of gender
differences were noted, with lower freedom
of movement but higher voice and decision
making among girls compared to boys. Boys,
on the other hand, were more likely to
believe they could influence decisions about
marriage or education although their
decision-making power remained low.
The questions about student’s
planfulness and confidence were specific to
Indonesia. The mean score of planfulness
was the highest in Semarang (3.60)
compared to Bandar Lampung and Denpasar
(3.32 and 3.46, respectively). Only a small
percentage of students thought they would
feel confident talking to a boyfriend or
girlfriend about contraception (7%),
obtaining information on pregnancy
prevention (12%), or getting contraception if
they needed it (10%); Only 22% of
adolescents thought they would be confident
telling someone that they liked them while

GEAS-Indonesia Baseline Report | 2019
49
45% thought they would be confident telling
someone no if they were doing something
that they did not want to do. Adolescents in
Bandar Lampung were notably different than
their peers with lower confidence levels than
Denpasar or Semarang.
Figure 18. Adolescents’s confidence to talk about reproductive issues and obtain reproductive
service, by sex and site.
Gender difference were also notable,
with boys reporting greater confidence in
discussing, obtaining infromation about or
obtaining contraception than girls. Boys
were also more confident in telling a girl
about their feeelings while girls had a higher
mean score of planfulness and felt more
confident in saying no when someone was
doing something they didn’t like.
Adolescent aspirations to marry and
have children are presented in Table 14.
These aspirations were almost universal with
96% hoping to marry and 93% intending to
have children. More than half of adolescents
expected to marry by the age of 25 and 35%
expected to have children by the same age.
Marriage and childbearing after 25 years was
more prevalent in Denpasar (at 52% and
71% respectively, versus 38% and 53% in
Bandar Lampung and 40% and 66% in
Semarang), while marriage and childbearing
before the age of 21 was more commoly
expected in Bandar Lampung (12% and 11%
respectively, versus less than 4% for both
variables in Denpasar and Semarang).
Almost all adolescents expected to be
employed starting between 21 and 25 years,
an age at which two thirds indicated they
would be finished with school. Expectations
of early school leaving before 18 was very
uncommon (5%), although more frequently
expected in Bandar Lampung (12%) than in
Denpasar (4%) and Semarang (1%).

GEAS-Indonesia Baseline Report | 2019
50
Table 13. Empowerment related to their freedom of movement, freedom of speech, and freedom
of decision making of GEAS participants, by sex.
Empowerment Total Boys % Girls % P-value
N 4,684 2,207 2,477
Freedom of Movement
% allowed go to after school activities 2856 (61.0%) 1345 (60.9%) 1511 (61.0%) 0.97
% allowed go to religious center 3597 (76.8%) 1626 (73.7%) 1971 (79.6%) <0.001
% allowed meet with friends after school 2953 (63.0%) 1467 (66.5%) 1486 (60.0%) <0.001
% allowed go to party with the opposite sex 1005 (21.5%) 536 (24.3%) 469 (18.9%) <0.001
% allowed go to community center or movies 1205 (25.7%) 609 (27.6%) 596 (24.1%) 0.006
% allowed to visit the opposite sex friend 849 (18.1%) 533 (24.2%) 316 (12.8%) <0.001
Mean Score (Mean +/- SD) 2.45 (0.65) 2.54 (0.69) 2.38 (0.61) <0.001
Cronbach’s Alpha 0.687 0.703 0.660
Freedom of Speech
Asked their opinion by parents/caregiver 2795 (59.7%) 1211 (54.9%) 1584 (63.9%) <0.001
Listened when expressing their opinion 3132 (66.9%) 1322 (59.9%) 1810 (73.1%) <0.001
Asked for advice by peers 2971 (63.4%) 1179 (53.4%) 1792 (72.3%) <0.001
Brave to tell other if see something wrong 2413 (51.5%) 1016 (46.0%) 1397 (56.4%) <0.001
Brave to speak up in class 2662 (56.8%) 1188 (53.8%) 1474 (59.5%) <0.001
Brave to speak up when seeing someone being hurt 2804 (59.9%) 1250 (56.6%) 1554 (62.7%) <0.001
Able to ask adult for help 3086 (65.9%) 1357 (61.5%) 1729 (69.8%) <0.001
Mean Score (Mean +/- SD) 2.88 (0.72) 2.76 (0.77) 2.99 (0.65) <0.001
Cronbach’s Alpha 0.838 0.852 0.815
Freedom of Decision Making
Able to decide…. without adult intervention
Type of clothes to wear outside school 1750 (37.4%) 814 (36.9%) 936 (37.8%) 0.52
Activity during free times 2648 (56.5%) 1211 (54.9%) 1437 (58.0%) 0.030
Food to eat outside home 2720 (58.1%) 1216 (55.1%) 1504 (60.7%) <0.001
Having friends 3085 (65.9%) 1419 (64.3%) 1666 (67.3%) 0.033
Able to influence decision about….
Leave school 564 (12.0%) 302 (13.7%) 262 (10.6%) 0.001
When to marry 587 (12.5%) 313 (14.2%) 274 (11.1%) 0.001
Who to marry 643 (13.7%) 334 (15.1%) 309 (12.5%) 0.008
Working and earn money
Make decision to work 1544 (34.8%) 794 (37.8%) 750 (32.1%) <0.001
Decide how to use the money 2354 (70.7%) 1133 (70.2%) 1221 (71.1%) 0.56
Mean Score (Mean +/- SD) 2.80 (0.80) 2.75 (0.84) 2.85 (0.77) <0.001
Cronbach’s Alpha 0.694 0.707 0.679
Overall Empowerment
Mean Score (Mean +/- SD) 2.65 (0.59) 2.62 (0.64) 2.68 (0.55) <0.001

GEAS-Indonesia Baseline Report | 2019
51
Table 14. Planfullness and aspiration for education, marriage and reproductive life of GEAS
participants, by sex.
Planfullness Total Boys % Girls % P-value
N 4,684 2,207 2,477
Planfulness (very like me or exactly like me)
I made a step plan to achieve my goals 1488 (31.8%) 685 (31.0%) 803 (32.4%) 0.31
I have goals in my life 3034 (64.8%) 1298 (58.8%) 1736 (70.1%) <0.001
I will do what it takes to achieve my goals 2910 (62.1%) 1266 (57.4%) 1644 (66.4%) <0.001
It is important to achieve my goals 3119 (66.6%) 1323 (59.9%) 1796 (72.5%) <0.001
I know how to realize my plan 1847 (39.4%) 849 (38.5%) 998 (40.3%) 0.20
Mean score 3.46 (0.92) 3.34 (1.01) 3.57 (0.82)
Cronbach’s Alpha 0.87 0.89 0.85
Age at which will end school
<0.001
<18 years old 136 (5.3%) 121 (9.2%) 15 (1.2%)
18-20 years old 498 (19.6%) 315 (24.0%) 183 (14.9%)
21-25 years old 1065 (41.8%) 485 (36.9%) 580 (47.1%)
>25 years old 847 (33.3%) 393 (29.9%) 454 (36.9%)
Intends to get married 2490 (96.1%) 1184 (94.1%) 1306 (98.0%) <0.001
Intended Age at marriage
<0.001
<18 years old 12 (0.6%) 12 (1.3%) 0 (0.0%)
18-20 years old 89 (4.8%) 55 (6.1%) 34 (3.6%)
21-25 years old 929 (50.0%) 440 (48.7%) 489 (51.2%)
>25 years old 829 (44.6%) 397 (43.9%) 432 (45.2%)
Intend to have children 1947 (93.4%) 967 (90.7%) 980 (96.2%) <0.001
Intended age at first birth
<0.001
<18 years old 31 (2.2%) 28 (3.8%) 3 (0.4%)
18-20 years old 35 (2.4%) 27 (3.7%) 8 (1.1%)
21-25 years old 437 (30.4%) 219 (30.1%) 218 (30.7%)
>25 years old 934 (65.0%) 454 (62.4%) 480 (67.7%)
Intended number of children
<0.001
<=2 children 1187 (76.2%) 550 (71.5%) 637 (80.8%)
3-5 children 349 (22.4%) 202 (26.3%) 147 (18.7%)
>5 children 21 (1.3%) 17 (2.2%) 4 (0.5%)
Intend to get a job 2657 (97.1%) 1305 (95.5%) 1352 (98.7%) <0.001
Intended Age at first employment
0.007
<18 years old 68 (3.4%) 44 (4.5%) 24 (2.4%)
18-20 years old 483 (24.2%) 256 (26.0%) 227 (22.4%)
21-25 years old 971 (48.6%) 452 (45.8%) 519 (51.2%)
>25 years old 477 (23.9%) 234 (23.7%) 243 (24.0%)
Additional indicators from Indonesia specific question
Felt confident
Talking to a boyfriend or girlfriend about
contraception 341 (7.3%) 239 (10.8%) 102 (4.1%) <0.001
Obtaining information on prevention of pregnancy 541 (11.5%) 299 (13.5%) 242 (9.8%) <0.001
Getting contraception if you need it 445 (9.5%) 262 (11.9%) 183 (7.4%) <0.001
Telling a boy or girl no if they were doing something
that you don’t want 2104 (44.9%) 809 (36.7%) 1295 (52.3%) <0.001
Telling a boy or girl that you like them 1032 (22.0%) 666 (30.2%) 366 (14.8%) <0.001
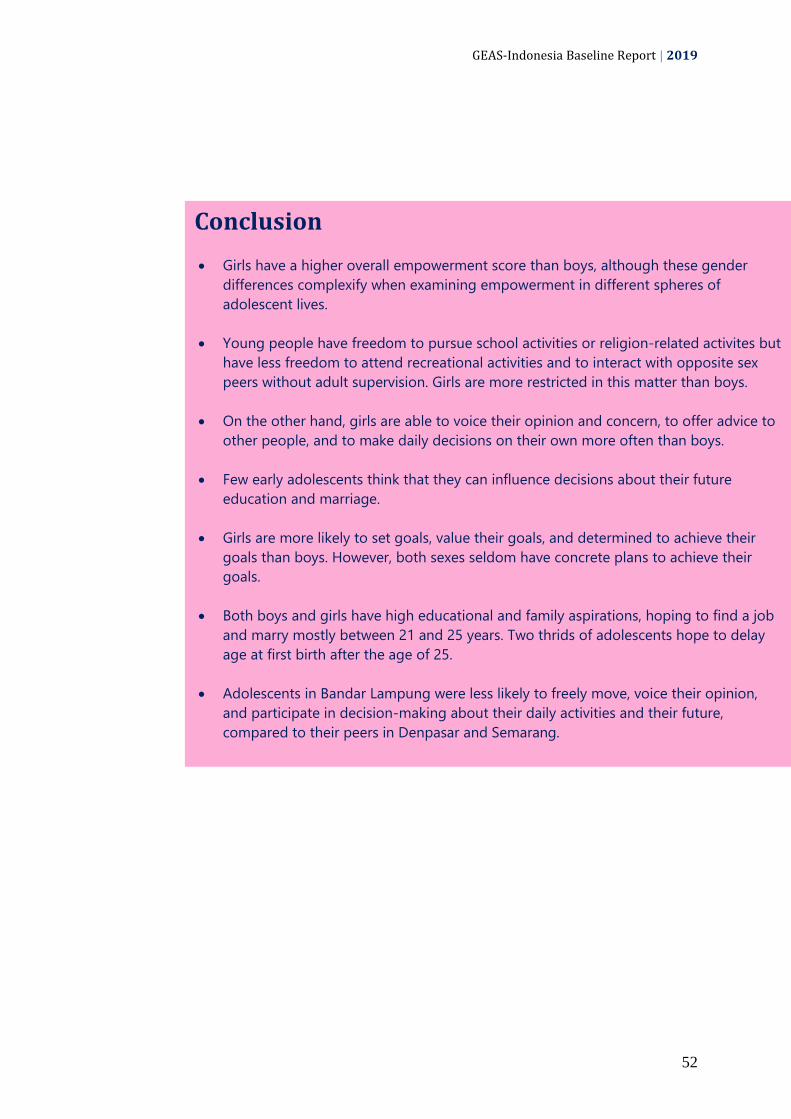
GEAS-Indonesia Baseline Report | 2019
52
Conclusion
Girls have a higher overall empowerment score than boys, although these gender
differences complexify when examining empowerment in different spheres of
adolescent lives.
Young people have freedom to pursue school activities or religion-related activites but
have less freedom to attend recreational activities and to interact with opposite sex
peers without adult supervision. Girls are more restricted in this matter than boys.
On the other hand, girls are able to voice their opinion and concern, to offer advice to
other people, and to make daily decisions on their own more often than boys.
Few early adolescents think that they can influence decisions about their future
education and marriage.
Girls are more likely to set goals, value their goals, and determined to achieve their
goals than boys. However, both sexes seldom have concrete plans to achieve their
goals.
Both boys and girls have high educational and family aspirations, hoping to find a job
and marry mostly between 21 and 25 years. Two thrids of adolescents hope to delay
age at first birth after the age of 25.
Adolescents in Bandar Lampung were less likely to freely move, voice their opinion,
and participate in decision-making about their daily activities and their future,
compared to their peers in Denpasar and Semarang.

GEAS-Indonesia Baseline Report | 2019
53

GEAS-Indonesia Baseline Report | 2019
54
3.5. Bullying and Adverse Childhood
Experiences (ACEs)
This section describes adverse childhood experiences (ACEs), which are stressful or
traumatic experiences including violence, neglect, family dysfunction, domestic violence,
and family drug abuse. Such experiences have a significant impact on future victimization
and violence perpertration, and more broadly on the health and lifetime opportunities of
adolescents.
Snapshots of adverse childhood experiences
78%
have experienced at least one adverse experience such as child abuse or neglect, household economic challenges, and exposure to other adult behavioral challenges in their lifetime.
16% have ever experienced physical bullying by their peers, and 11% and 12% have ever perpetrated verbal and physical bullying against their peers, respectively, in the last 6 months.
54% have ever experienced verbal abuse and teasing by an adult. Twenty-one percent of students experienced five or more ACEs and the percentage is much higher in boys (27%) than girls (16%).
Boys consistently reported verbal and physical abuse and violence more often than girls.

GEAS-Indonesia Baseline Report | 2019
55
Adolescent’s experience of adverse
child events are reported in Table 15.
Results indicate that almost 2 in 5 had been
exposed to at least three adverse
experiences, while one in five adolescents
reported five or more ACEs which is
extremely high. These estimates varied by
site. Experience of at least an ACEs was less
common in Bandar Lampung (61% versus
81% in Denpasar and 82% in Semarang). The
percentages who reported five or more
ACEs are similar in the three sites (19-23%).
The most frequently reported adverse
events related to verbal abuse by an adult
(54%) or feelings of not being loved or cared
for (45%). About a third of students
reporting having felt scared as a child of
being physically abused by a parent or adult
and the same percentage had ever feel have
no one to protect. Over one in five
adolescents reported they had not had
enough food (23%) at some point in their
lives. Additionally, 12% indicated that they
had been touched by an adult in their private
parts and 4% said had been invited or forced
to have sexual intercourse by adults. Other
experiences such as parent incarceration or
house eviction were rare. Experiences of
economic hardship (not having enough food,
house eviction) and parent incarceration
were more common in Bandar Lampung
while physical physical violence victimization
and witenessing domestic violence were
more common in Denpasar. Feelings of
neglect (feeling unloved or having no one
that protects them) were highest in
Semarang.
Exposure to at least three adverse experiences will significantly
influence adolescent health and wellbeing. Results indicate that
almost 2 in 5 adolescents had been exposed to at least three
ACEs, while one in five adolescents reported five or more ACEs.
Girls were more likely to report any
adverse experience, but boys were more
likely to report 5 or more ACEs (27%)
compared to 16% of girls. Girls were more
likely to indicate they felt not loved or cared
about while boys were more likely to report
any other adverse event, except feeling like
they have no one protecting them which was
equally reported by boys and girls. We found
noticable gender differences in sexual abuse,
more commonly reported by boys than girls:
18% had ever been touched versus 6% of
girls and 7% reported a forced sex versus 2%
of girls. Overall findings on adverse events
are in line with research conducted by
Dukes et al. (2010) which states that male
adolescents are more likely to be victim of
physical abuse, carry weapons more
frequently and are more likely injured.
However, results related to sexual abuse are
surprising as prevalence is generally higher
among girls than among boys.
Peer aggression and bullying are also
presented in Table 15. A little more than
one in ten adolescents (12%) reported in the
last 6 months to have ever been slapped or
kicked by a peer and 11% bullied or
threatened someone. These experiences
were notably different in the three sites.
Teasing and physical violence perpertration
or victimization were most common in
Semarang. Boys were more likely to engage
in these behaviors or be the victims of
violence compared to girls.
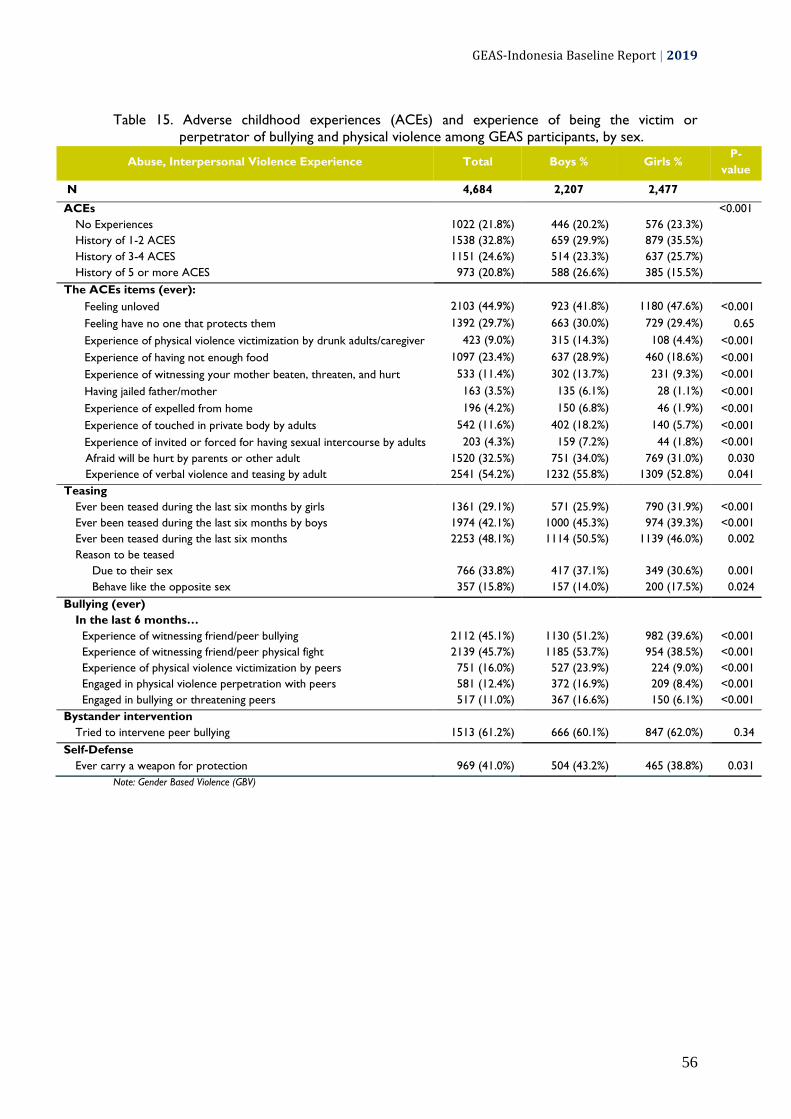
GEAS-Indonesia Baseline Report | 2019
56
Table 15. Adverse childhood experiences (ACEs) and experience of being the victim or
perpetrator of bullying and physical violence among GEAS participants, by sex.
Abuse, Interpersonal Violence Experience Total Boys % Girls % P-
value
N 4,684 2,207 2,477
ACEs
<0.001
No Experiences 1022 (21.8%) 446 (20.2%) 576 (23.3%)
History of 1-2 ACES 1538 (32.8%) 659 (29.9%) 879 (35.5%)
History of 3-4 ACES 1151 (24.6%) 514 (23.3%) 637 (25.7%)
History of 5 or more ACES 973 (20.8%) 588 (26.6%) 385 (15.5%)
The ACEs items (ever):
Feeling unloved 2103 (44.9%) 923 (41.8%) 1180 (47.6%) <0.001
Feeling have no one that protects them 1392 (29.7%) 663 (30.0%) 729 (29.4%) 0.65
Experience of physical violence victimization by drunk adults/caregiver 423 (9.0%) 315 (14.3%) 108 (4.4%) <0.001
Experience of having not enough food 1097 (23.4%) 637 (28.9%) 460 (18.6%) <0.001
Experience of witnessing your mother beaten, threaten, and hurt 533 (11.4%) 302 (13.7%) 231 (9.3%) <0.001
Having jailed father/mother 163 (3.5%) 135 (6.1%) 28 (1.1%) <0.001
Experience of expelled from home 196 (4.2%) 150 (6.8%) 46 (1.9%) <0.001
Experience of touched in private body by adults 542 (11.6%) 402 (18.2%) 140 (5.7%) <0.001
Experience of invited or forced for having sexual intercourse by adults 203 (4.3%) 159 (7.2%) 44 (1.8%) <0.001
Afraid will be hurt by parents or other adult 1520 (32.5%) 751 (34.0%) 769 (31.0%) 0.030
Experience of verbal violence and teasing by adult 2541 (54.2%) 1232 (55.8%) 1309 (52.8%) 0.041
Teasing
Ever been teased during the last six months by girls 1361 (29.1%) 571 (25.9%) 790 (31.9%) <0.001
Ever been teased during the last six months by boys 1974 (42.1%) 1000 (45.3%) 974 (39.3%) <0.001
Ever been teased during the last six months 2253 (48.1%) 1114 (50.5%) 1139 (46.0%) 0.002
Reason to be teased
Due to their sex 766 (33.8%) 417 (37.1%) 349 (30.6%) 0.001
Behave like the opposite sex 357 (15.8%) 157 (14.0%) 200 (17.5%) 0.024
Bullying (ever)
In the last 6 months…
Experience of witnessing friend/peer bullying 2112 (45.1%) 1130 (51.2%) 982 (39.6%) <0.001
Experience of witnessing friend/peer physical fight 2139 (45.7%) 1185 (53.7%) 954 (38.5%) <0.001
Experience of physical violence victimization by peers 751 (16.0%) 527 (23.9%) 224 (9.0%) <0.001
Engaged in physical violence perpetration with peers 581 (12.4%) 372 (16.9%) 209 (8.4%) <0.001
Engaged in bullying or threatening peers 517 (11.0%) 367 (16.6%) 150 (6.1%) <0.001
Bystander intervention
Tried to intervene peer bullying 1513 (61.2%) 666 (60.1%) 847 (62.0%) 0.34
Self-Defense
Ever carry a weapon for protection 969 (41.0%) 504 (43.2%) 465 (38.8%) 0.031
Note: Gender Based Violence (GBV)

GEAS-Indonesia Baseline Report | 2019
57
Conclusion
The majority of adolescents have ever experienced at least an adverse
experience during childhood, mostly in the form of neglect and poverty.
Many students also have ever been verbally teased or abused by an
adult, or have been teased by their peers in the last six months.
Polyvictimzation is more common among boys who are also more likely
to be the subject of sexual abuse.
While the majority of girls do not experience or engage in peer bullying
and physical violence, a substantial percentage of boys have been the
victim or perperator of peer bullying and physical violence.

GEAS-Indonesia Baseline Report | 2019
58
3.6. Adolescent Health
3.6.1. Self-Rated Health, Body Image, and Body comfort
This section describes young people’s perceived health, and their levels of comfort with
their own bodies and pubertal development. These perceptions are shaped by gender
norms and are associated with health-related behaviors including nutrition (such as diet,
eating disorders, obesity, malnutrition, anemia, anxiety and others) and sexual behaviors.
In many situations, the norms regarding body size are related to the incidence of bullying
and victimization.
Snapshots of adolescent health
68%
reported that their health is excellent or good.
Boys are more likely to report excellent or good health than girls.
Majority of students are not satisfied with their current weight or height and many are uncomfortable with their body image.
Majority of students (74-80%) disagreed with the three negative statements about their body i.e. they were worried about the way their body looked, they often wished their body was different, and they were worried that their body was not developing normally.
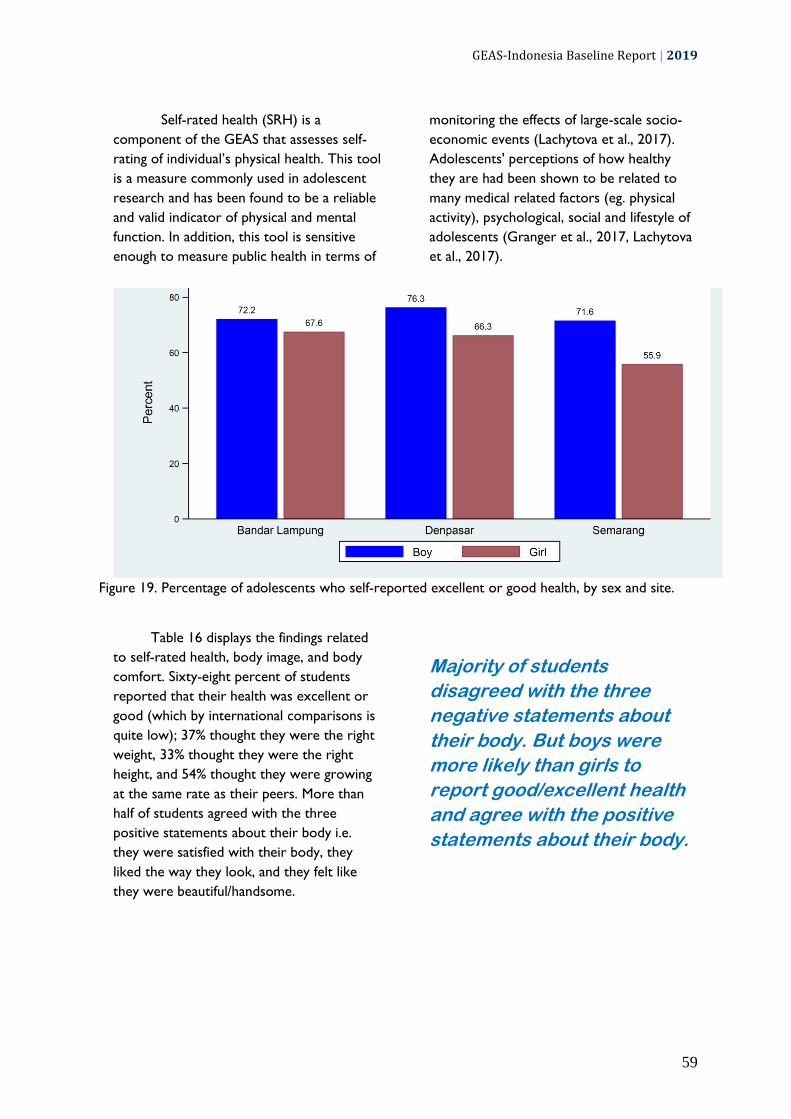
GEAS-Indonesia Baseline Report | 2019
59
Self-rated health (SRH) is a
component of the GEAS that assesses self-
rating of individual’s physical health. This tool
is a measure commonly used in adolescent
research and has been found to be a reliable
and valid indicator of physical and mental
function. In addition, this tool is sensitive
enough to measure public health in terms of
monitoring the effects of large-scale socio-
economic events (Lachytova et al., 2017).
Adolescents' perceptions of how healthy
they are had been shown to be related to
many medical related factors (eg. physical
activity), psychological, social and lifestyle of
adolescents (Granger et al., 2017, Lachytova
et al., 2017).
Figure 19. Percentage of adolescents who self-reported excellent or good health, by sex and site.
Table 16 displays the findings related
to self-rated health, body image, and body
comfort. Sixty-eight percent of students
reported that their health was excellent or
good (which by international comparisons is
quite low); 37% thought they were the right
weight, 33% thought they were the right
height, and 54% thought they were growing
at the same rate as their peers. More than
half of students agreed with the three
positive statements about their body i.e.
they were satisfied with their body, they
liked the way they look, and they felt like
they were beautiful/handsome.
Majority of students
disagreed with the three
negative statements about
their body. But boys were
more likely than girls to
report good/excellent health
and agree with the positive
statements about their body.
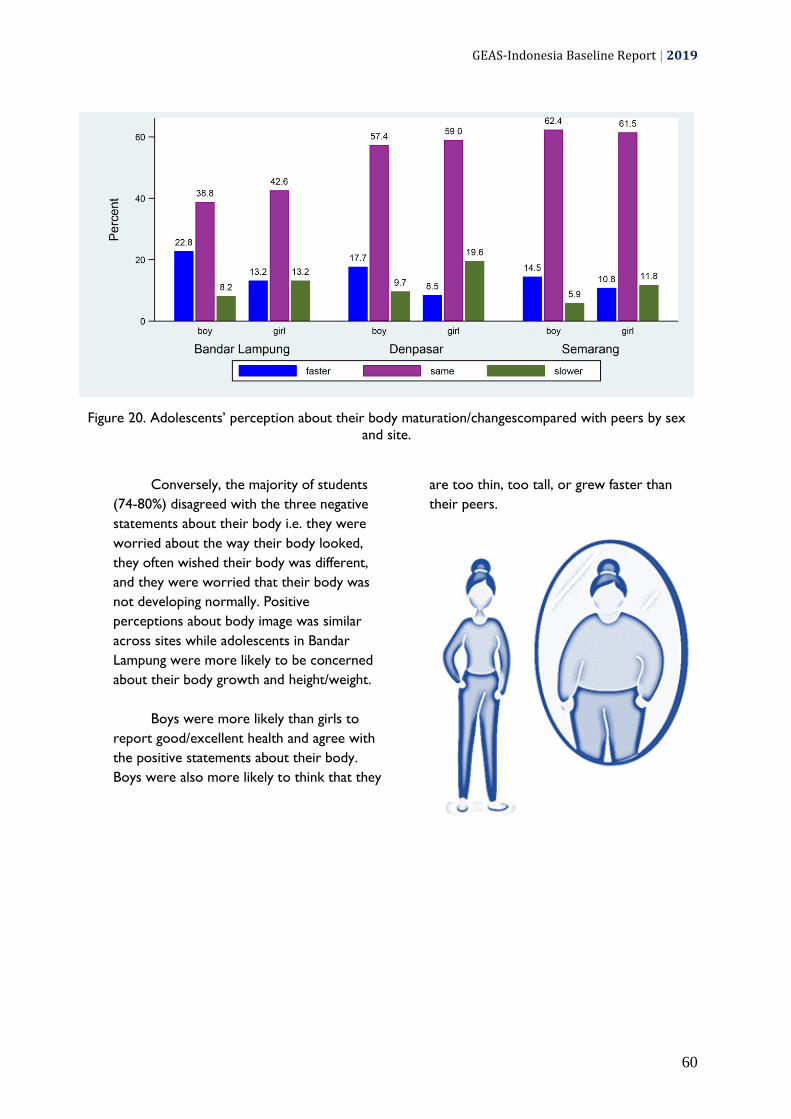
GEAS-Indonesia Baseline Report | 2019
60
Figure 20. Adolescents’ perception about their body maturation/changescompared with peers by sex
and site.
Conversely, the majority of students
(74-80%) disagreed with the three negative
statements about their body i.e. they were
worried about the way their body looked,
they often wished their body was different,
and they were worried that their body was
not developing normally. Positive
perceptions about body image was similar
across sites while adolescents in Bandar
Lampung were more likely to be concerned
about their body growth and height/weight.
Boys were more likely than girls to
report good/excellent health and agree with
the positive statements about their body.
Boys were also more likely to think that they
are too thin, too tall, or grew faster than
their peers.

GEAS-Indonesia Baseline Report | 2019
61
Table 16. Adolescents’ perception about their health, body comfort and body image by sex.
Perception Total Boys % Girls % P-
value
N 6,184 2,207 2,477
Overall perception of own health (good or excellent) 3190 (68.1%) 1625 (73.6%) 1565 (63.2%) <0.001
Body image
Self perception about body weight
<0.001
Think they are too thin 1478 (32.6%) 752 (35.4%) 726 (30.2%)
Right weight 1670 (36.8%) 755 (35.5%) 915 (38.0%)
Think they are too fat 1385 (30.6%) 619 (29.1%) 766 (31.8%)
Self perception about body height
<0.001
Think they are too tall 2240 (49.0%) 1120 (52.1%) 1120 (46.2%)
Right height 1484 (32.5%) 672 (31.3%) 812 (33.5%)
Think they are too short 846 (18.5%) 356 (16.6%) 490 (20.2%)
Self perception about the development of the body
<0.001
Faster than peers 667 (14.2%) 403 (18.3%) 264 (10.7%)
Same with peers 2536 (54.1%) 1176 (53.3%) 1360 (54.9%)
Slower than peers 550 (11.7%) 178 (8.1%) 372 (15.0%)
Body Comfort
% positivity (agree) towards "I am satisfied with my body" 2583 (55.1%) 1407 (63.8%) 1176 (47.5%) <0.001
% positivity (agree) towards "I like the way I look" 2748 (58.7%) 1448 (65.6%) 1300 (52.5%) <0.001
% positivity (agree) towards "I like looking at my body" 1725 (36.8%) 949 (43.0%) 776 (31.3%) <0.001
% positivity (agree) towards "I feel like I am
beautiful/handsome" 2543 (54.3%) 1289 (58.4%) 1254 (50.6%) <0.001
% negativity (disagree) towards "I worry about the way that my
body looks" 3745 (80.0%) 1731 (78.4%) 2014 (81.3%) 0.014
% negativity (disagree) towards "I often wish my body was
different" 3471 (74.1%) 1726 (78.2%) 1745 (70.4%) <0.001
% negativity (disagree) towards "I am worried that my body is
not developing normally" 3451 (73.7%) 1551 (70.3%) 1900 (76.7%) <0.001
Indicated body comfort (positive responses on all above items)
77 (1.6%) 46 (2.1%) 31 (1.3%) 0.025

GEAS-Indonesia Baseline Report | 2019
62
3.6.2. Depression Symptoms and Substance Abuse
Adolescence is a period of dramatic physical, psychological, and social changes which
can prove stressful. According to WHO, mental health problems account for 16% of the
disease burden for the 10-19 year age group. Globally, depression is one of the main
causes of illness and disability among adolescents. Unfortunately, adolescent mental
health problems are often neglected due to lack of data and/or available services. Mental
health during adolescence not only affects their health and well being but also impedes
their social development and thus affects health and well-being throughout their lives. In
this section, we report the prevalence of adolescent depressive symptoms. In addition, we
also describe substance use including tobacco/cigarettes, alcohol and drug use.
Snapshots of adolescent mental health
50%
of students worry for no good reason; 32% are so unhappy they can not sleep at night and 20% are so unhappy they think of harming themselves.
Boys
were generally more likely to report depressive symptoms compared to girls.
16% of boys have ever smoked tobacco cigarettes; only 1% of girls have smoked cigarettes.
Alcohol, marijuana, and other drugs
use are very low among the students.

GEAS-Indonesia Baseline Report | 2019
63
The GEAS included 6 statements
related to depressive symptoms presented in
Table 17. Depressive symptoms were
prevalent with half of the students indicating
that they were worried for no good reason
and almost a third reporting they felt sad or
felt so unhappy they could not sleep at night.
Almost one in five adolescents indicated that
they felt so unhappy they had thought of
harming themselves. A summary score of
these symtomps from 0 to 4, showed
relatively high score of 3.20 with higher
scores in Bandar Lampung (2.93) than in
Denpasar (2.89) and Semarang (2.72).
Note: Score range is 1-5, 5 indicating strongest affirmation for symptoms.
Figure 21. Mean score of self-reported depressive symtomps (from 4 question items), by sex and
site.
Boys were generally more likely to
report depressive symptoms compared to
girls with 36% indicating that they so
unhappy they can not sleep at night versus
28% of girls. Similarly, one-in-four boys felt
so unhappy they had thought of harming
themselves compared to 16% of girls. As a
result, boys mean scores for depressive
symptoms were significantly higher than girls
(3.27 versus 3.14).
Substance use was a highly
gendered behavior with
greater consumption among
boys compared to girls.
Substance use was relatively
uncommon ranging from 2% who indicated
ever using drugs to 8% indicating that they
had ever smoked. Three percent fof
adolescents reported ever consuming
alcohol; These behaviors varied widely
across the three sites, with a greater
proportion of smokers in Semarang than
Bandar Lampung and Denpasar (28% versus
18% and 5% respectively). Alcohol
consumption was more prevalent in
Denpasar.
Substance use was a highly gendered
behavior with greater consumption among
boys compared to girls. For example, 16 %
of boys ever smoked compared to 1% of
girls, 6% used alcohol versus 1% of girls and
2% used other drugs versus 0.5% of girls.
These gender differences were consistent
across sites, with male smoking reaching 28%
in Semarang.

GEAS-Indonesia Baseline Report | 2019
64
Table 17. Self-reported mental health problems and substance use among GEAS participants, by
sex.
Mental Health Total Boys % Girls % P-value
N 4,526 2,125 2,401
Depression symptoms (% agree with)
“In general, I see myself as a happy person” 3275 (71.6%) 1626 (76.0%) 1649 (67.8%) <0.001
“ I blame myself when things go wrong” 2830 (62.2%) 1350 (63.5%) 1480 (61.2%) 0.108
"I worry for no good reason" 2275 (50.3%) 1037 (48.8%) 1238 (51.6%) 0.064
"I am so unhappy I can't sleep at night" 1435 (31.7%) 768 (36.3%) 667 (27.7%) <0.001
"I feel sad" 1419 (31.4%) 659 (31.2%) 760 (31.6%) 0.80
"I am so unhappy I think of harming myself" 924 (19.7%) 531 (24.1%) 393 (15.9%) <0.001
Mean Score (Mean +/- SD)* 3.20 (0.77) 3.27 (0.82) 3.14 (0.71) <0.001
Cronbach's Alpha 0.72 0.74 0.70
Substance Use (ever)
Cigarettes 379 (8.1%) 354 (16.0%) 25 (1.0%) <0.001
Alcohol 151 (3.2%) 128 (5.8%) 23 (0.9%) <0.001
Marijuana 54 (1.2%) 42 (1.9%) 12 (0.5%) <0.001
Other Drugs 74 (1.6%) 59 (2.7%) 15 (0.6%) <0.001
Note: Standard deviation (SD); *(1-5, 5 indicating strongest affirmation for symptoms)
Conclusion
A substantial percentage of students are not satisfied with their weight or
height and are uncomfortable with their body image.
Anxiety and depressive symptoms are common among the students,
including the thought of self-harming. Boys reported some symptoms
more commonly than girls.
A substantial percentage of boys are already exposed to tobacco smoke at
young age; however, the use of other substances (alcohol, marijuana, other
drugs) is low.

GEAS-Indonesia Baseline Report | 2019
65
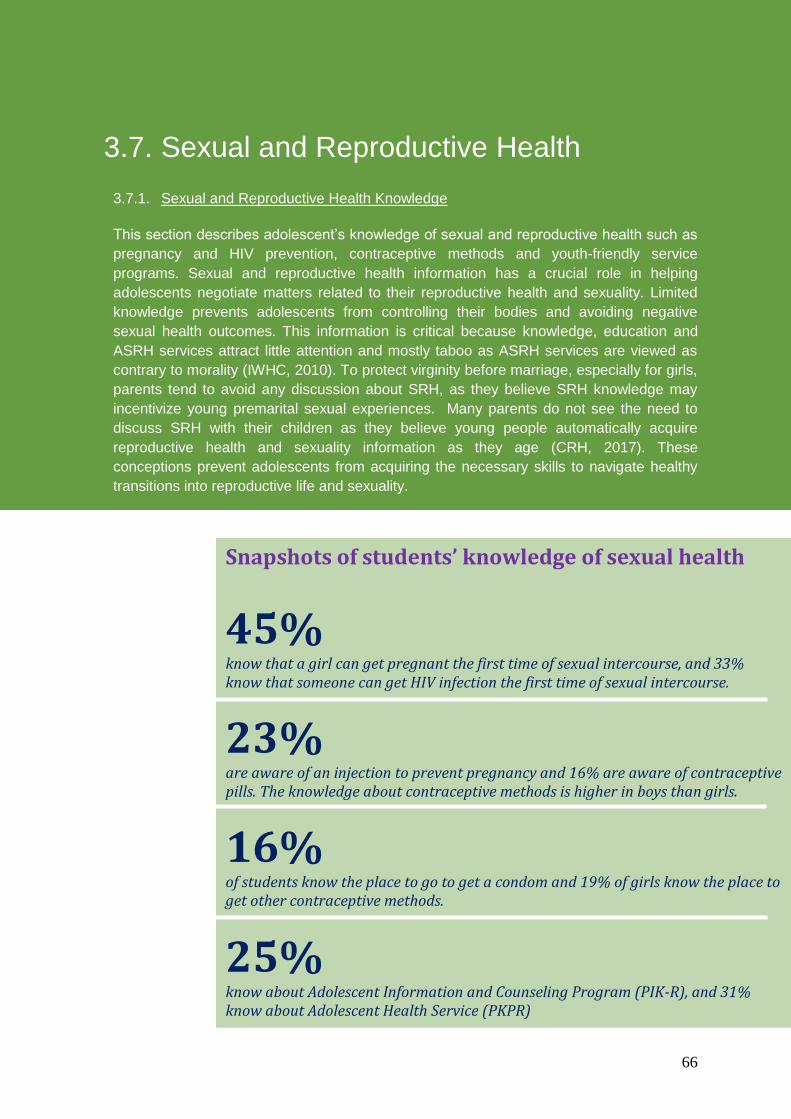
GEAS-Indonesia Baseline Report | 2019
66
3.7. Sexual and Reproductive Health
3.7.1. Sexual and Reproductive Health Knowledge
This section describes adolescent’s knowledge of sexual and reproductive health such as
pregnancy and HIV prevention, contraceptive methods and youth-friendly service
programs. Sexual and reproductive health information has a crucial role in helping
adolescents negotiate matters related to their reproductive health and sexuality. Limited
knowledge prevents adolescents from controlling their bodies and avoiding negative
sexual health outcomes. This information is critical because knowledge, education and
ASRH services attract little attention and mostly taboo as ASRH services are viewed as
contrary to morality (IWHC, 2010). To protect virginity before marriage, especially for girls,
parents tend to avoid any discussion about SRH, as they believe SRH knowledge may
incentivize young premarital sexual experiences. Many parents do not see the need to
discuss SRH with their children as they believe young people automatically acquire
reproductive health and sexuality information as they age (CRH, 2017). These
conceptions prevent adolescents from acquiring the necessary skills to navigate healthy
transitions into reproductive life and sexuality.
Snapshots of students’ knowledge of sexual health
45%
know that a girl can get pregnant the first time of sexual intercourse, and 33% know that someone can get HIV infection the first time of sexual intercourse.
23% are aware of an injection to prevent pregnancy and 16% are aware of contraceptive pills. The knowledge about contraceptive methods is higher in boys than girls.
16% of students know the place to go to get a condom and 19% of girls know the place to get other contraceptive methods.
25%
know about Adolescent Information and Counseling Program (PIK-R), and 31% know about Adolescent Health Service (PKPR)

GEAS-Indonesia Baseline Report | 2019
67
Students' knowledge of sexual health
is presented in Table 18. Students had low
levels of knowledge about pregnancy and
HIV prevention. Only 45% of students
thought a girl could get pregnant at first
sexual intercourse; 62% knew girls could not
get pregnant through kissing or fondling.
Awareness about contraception was also
low as only a third of adolescents believed
condoms could prevent pregnancy, 23%
knew about injectables and 16% were aware
of contraceptive pills as a way to prevent
pregnacy. only 19% of girls knew where to
get contraception if they needed it but up to
a third indicated that they would feel too
embarrassed to go to a clinic or health
center to get contraception.
Note: Knowledge about Pregnancy range score 0-6; Knowledge about HIV range score 0-4.
Figure 22. Mean score of knowledge on pregnancy and HIV by sex and site.
Knoweldge about HIV prevention was
also low with a third of adolescents
recognizing the risk of HIV at first sexual
intercourse, 24% knowing condoms coud
protect against HIV and 13% believed that
taking a pill before sex could protect against
HIV. Levels of pregnancy and HIV knoweldge
varied by study site, with greater awareness
in Denpasar than other sites (score of 2.01
for pregnancy knowledge and 1.27 for HIV
knowledge versus 1.44 and 0.65 for Bandar
Lampung and 1.47 and 0.54 for Semarang,
respectively)
Gender differences were also evident
as boys had better information about
pregnancy and HIV prevention than girls.
Differences were particularly striking with
respect to knowledge of condom use for
pregnancy and HIV prevention, which was
twice as high among boys than girls.
Likewise, boys were more likely to know
where to get a condom than girls (22.4%
versus 8%).
Students had low levels of
knowledge about pregnancy and
HIV prevention, as well as
adolescent-friendly services at
center for community health
service (PKPR) and youth center
(PIK-R).
Girls had lower knowledge about
pregnancy, HIV, and
contraception than boys.

GEAS-Indonesia Baseline Report | 2019
68
Consistent with low levels of
awareness about condom or contraceptive
services, only a quarter of students knew
about PIK-R (Center of Information and
Counseling for Youth), despite the
Indonesian government’s effort to offer
these services at more public health centers
and in the youth communities (often times in
school-based or university-based
organizations). Among who kew about these
services, 32% have ever visited PIK-R. More
students (31%) were aware of PKPR (Youth
Friendly Health Services), offered by the
public health center, and 61% of those who
knew about PKPR had ever visited it.
Students in Denpasar were better informed
about PIK-R and PKPR services than their
peers in other sites.
Table 18. Knowledge about pregnancy, HIV, contraceptive methods and reproductive health
programs among GEAS participants, by sex.
Sexual Health Knowledge Total Boys % Girls % P-value
N 4,684 2,207 2,477
Knowledge (% correct response to...)
A girl can get pregnant the first time of sexual intercourse 2096 (44.7%) 1066 (48.3%) 1030 (41.6%) <0.001
A girl can get pregnant after kissing or hugging 2905 (62.0%) 1236 (56.0%) 1669 (67.4%) <0.001
A girl can swallow a pill every day to protect against pregnancy 748 (16.0%) 420 (19.0%) 328 (13.2%) <0.001
Using a condom can protect against pregnancy 1474 (31.5%) 945 (42.8%) 529 (21.4%) <0.001
A girl can have a shot or injection to protect against pregnancy 1062 (22.7%) 559 (25.3%) 503 (20.3%) <0.001
A girl can use herbs to prevent a pregnancy 612 (13.1%) 327 (14.8%) 285 (11.5%) <0.001
Knowledge about Pregnancy (Mean +/- SD)* 1.66 (1.51) 1.94 (1.57) 1.41 (1.42) <0.001
A boy/girl can get HIV the first time of sexual intercourse 1554 (33.2%) 784 (35.5%) 770 (31.1%) 0.001
Using a condom can protect against HIV 1104 (23.6%) 718 (32.5%) 386 (15.6%) <0.001
You can get HIV through kissing 3963 (84.6%) 1824 (82.6%) 2139 (86.4%) <0.001
A girl or boy can swallow a pill before sex that will protect against
HIV 589 (12.6%) 360 (16.3%) 229 (9.2%) <0.001
Knowledge about HIV (Mean +/- SD)** 0.85 (1.05) 1.02 (1.12) 0.70 (0.95) <0.001
I know where to go to get…
…condoms 727 (15.5%) 538 (24.4%) 189 (7.6%) <0.001
…contraception 459 (18.5%)
I feel embarrassed or shy to...
...go to a clinic or center for contraception (birth control) 807 (32.6%)
...get a condom if I needed it 592 (26.8%)
Adolescent supporting program
I know about PIK-R 1185 (25.3%) 573 (26.0%) 612 (24.7%) 0.32
I have ever visited PIK-R center 115 (32.1%) 77 (38.7%) 38 (23.9%) 0.003
I know about PKPR 1463 (31.2%) 793 (35.9%) 670 (27.0%) <0.001
I have ever visited PKPR 234 (60.8%) 167 (64.5%) 67 (53.2%) 0.033
Note: standard deviation (SD), Human Immunodeficiency Virus (HIV), Adolescent Information and Counseling Program (PIK-R), Adolescent Care Health Service (PKPR); *No. correct answer, 6 Qs in-total; **(No. correct answer, 4 Qs in-total.
GEAS-Indonesia Baseline Report | 2019
69

GEAS-Indonesia Baseline Report | 2019
70
3.7.2. Puberty
Early adolescence which is defined as age between 10-14 years old, is one of the most
critical stages of human development as marked by dramatic physical, social and
cognitive changes. This periode is one of the most neglected stages of development, yet
resulted fewer knowledge especially on how it influences adolescent health and wellbeing
in their current and adulthood life. The rapid changes during this period are also not
followed by adequate transfer of knowledge from parents to their children which cause
navigation failure during the transition. In this section, GEAS presents information about
adolescent’ onset of pubertal and their perception about those changes, uncluding their
sexuality, to have better understanding about the transition and help children and parent
pass it successfully.
Snapshots of puberty
93% have started puberty.
only 49%
of the students have ever talked about puberty with someone – the majority talked to their mother (or female caregiver) or their friends.
95% of girls used sanitation products during their menstruation and only 2% have ever missed school due to their menstruation.
Very few students
feel comfortable to talk about menstruation, pregnancy prevention, or sexual intercourse with their friends.

GEAS-Indonesia Baseline Report | 2019
71
Adolescent’ information on the onset
of puberty, menstrual hygiene sanitation,
perceive of body changes during this periode
and their sexuality, and their discussion
related this topic are presented in Table 19.
Most adolescents had
positive attitudes about
puberty but comfort with
emerging sexuality was
relatively low.
Most of the students had started their
puberty; Sixty-two percent of the girls had
had their first menstruation and 65% of boys
reported having wet dreams. Most
adolescents had positive attitudes about
puberty although with a majority agreeing
that they liked that they were becoming a
man/woman (78%), that they were treated
more like an adult (67%), and that they were
proud of the pubertal changes they were
going through (61%). However, a substantial
proportion of girls who ever had a perod felt
ashamed of their body during menstruation
(38%) and half of them (54%) felt it was
important to keep their periods secret.
However, half of the girls also felt proud that
they had their periods. Most of the girls
recognized that having a period was a sign of
being a woman and two-thirds also agreed
that periods were not a big deal for them.
Substantial differences in girls’ feelings about
menstruation were noted across sites, with
fewer girls reporting feeling of shame in
Denpasar compared to elsewhere.
Twenty-nine percent of the girls
tracked their menstrual cycle and most had
access to recommended producs for
menstrual hygiene management; most of the
girls used feminine hygiene products to
manage their menstruation and only 2% ever
missed school due to their period.
Figure 23. Adolescents’ discussion partner preferences on sexual relationship, pregnancy,
contraception and HIV.
GEAS-Indonesia Baseline Report | 2019
72
The majority of the girls knew where
to get information about menstruation and
had talked with other people (mostly their
mothers and less often their friends or
sisters) about self-care during menstruation,
and 90% of the girls who talk with other
people do so with their mother or female
caregiver. Menstrual hygiene management
and access to information about menstrual
management seemed more problematic for
girls in Bandar Lampung than in other sites.
Half of the students ever talked about
puberty with someone; 70% of those who
talk with someone do so with their mother
or female while 47% talked to fewer talked
to their siblings. However, most of the
students reported not being comfortable
discussing menstruation (8%), pregnancy
prevention (6%), or sexual intercourse (3%)
with their friends. The percentage reported
feeling comfortable talking about being in
love is higher at 23%. The percentage ever
talked with someone about puberty is the
lowest in Bandar Lampung. Discussions
about pubertal development were different
for boys and girls, as girls were more likely
to solicit their mothers (84%) compared to
boys (54%, while boys were more likely talk
with their father or male caregiver (37%)
compared to girls (11%).
More girls reported to have
started puberty and talk
about puberty with someone.
However, fewer boys
reported feelings of guilt
around their sexuality
development and more boys
reported greater acceptance
of pubertal changes.
Comfort with emerging sexuality was
relatively low as almost half of the students
felt guilty for looking at themselves naked
and about a third felt guilty for being
romantically attracted to someone or for
touching the private parts of their own body.
The majority of students felt guilty for having
sexual feelings or urges and 27% thought
that being curious about love or sex was not
normal. Discomfort with sexuality
development was higher in Semarang than in
the other sites.
Compared to boys, more girls
reported to have started puberty and talk
about puberty with someone. However,
fewer boys reported feelings of guilt around
their sexuality development and more boys
reported greater acceptance of pubertal
changes.
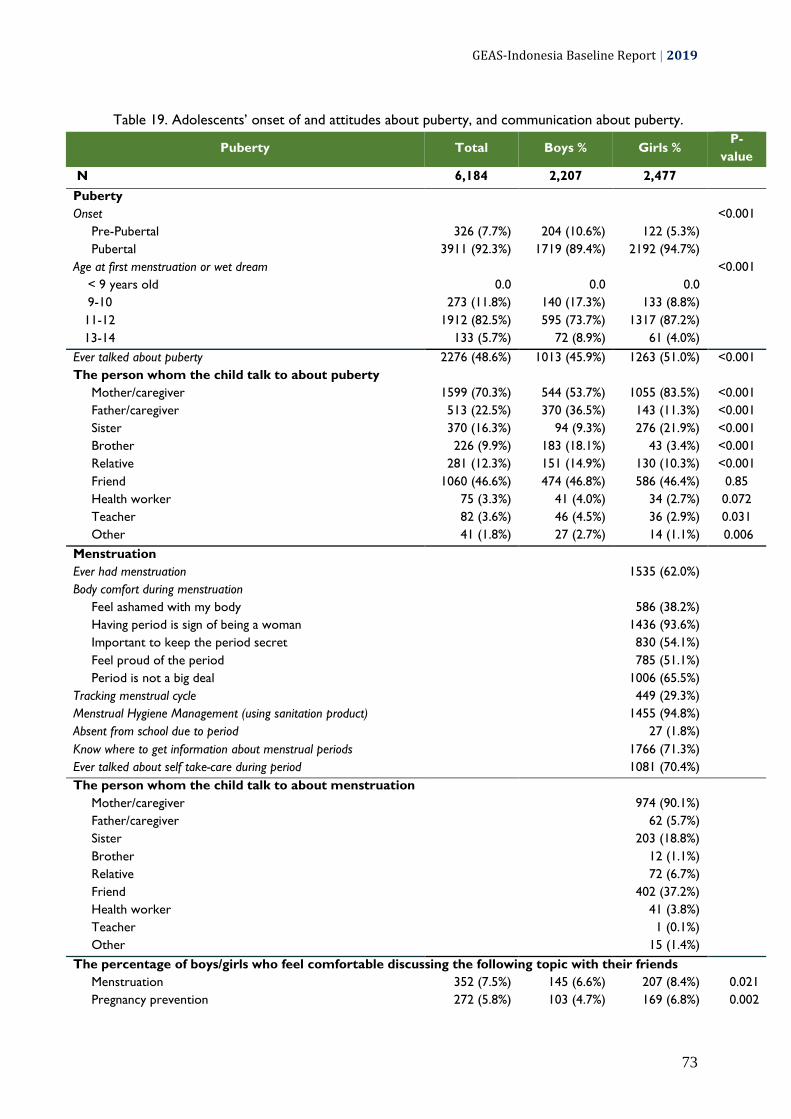
GEAS-Indonesia Baseline Report | 2019
73
Table 19. Adolescents’ onset of and attitudes about puberty, and communication about puberty.
Puberty Total Boys % Girls % P-
value
N 6,184 2,207 2,477
Puberty
Onset
<0.001
Pre-Pubertal 326 (7.7%) 204 (10.6%) 122 (5.3%)
Pubertal 3911 (92.3%) 1719 (89.4%) 2192 (94.7%)
Age at first menstruation or wet dream
<0.001
< 9 years old 0.0 0.0 0.0
9-10 273 (11.8%) 140 (17.3%) 133 (8.8%)
11-12 1912 (82.5%) 595 (73.7%) 1317 (87.2%)
13-14 133 (5.7%) 72 (8.9%) 61 (4.0%)
Ever talked about puberty 2276 (48.6%) 1013 (45.9%) 1263 (51.0%) <0.001
The person whom the child talk to about puberty
Mother/caregiver 1599 (70.3%) 544 (53.7%) 1055 (83.5%) <0.001
Father/caregiver 513 (22.5%) 370 (36.5%) 143 (11.3%) <0.001
Sister 370 (16.3%) 94 (9.3%) 276 (21.9%) <0.001
Brother 226 (9.9%) 183 (18.1%) 43 (3.4%) <0.001
Relative 281 (12.3%) 151 (14.9%) 130 (10.3%) <0.001
Friend 1060 (46.6%) 474 (46.8%) 586 (46.4%) 0.85
Health worker 75 (3.3%) 41 (4.0%) 34 (2.7%) 0.072
Teacher 82 (3.6%) 46 (4.5%) 36 (2.9%) 0.031
Other 41 (1.8%) 27 (2.7%) 14 (1.1%) 0.006
Menstruation
Ever had menstruation
1535 (62.0%)
Body comfort during menstruation
Feel ashamed with my body
586 (38.2%)
Having period is sign of being a woman
1436 (93.6%)
Important to keep the period secret
830 (54.1%)
Feel proud of the period
785 (51.1%)
Period is not a big deal
1006 (65.5%)
Tracking menstrual cycle
449 (29.3%)
Menstrual Hygiene Management (using sanitation product)
1455 (94.8%)
Absent from school due to period 27 (1.8%)
Know where to get information about menstrual periods
1766 (71.3%)
Ever talked about self take-care during period
1081 (70.4%)
The person whom the child talk to about menstruation
Mother/caregiver 974 (90.1%)
Father/caregiver 62 (5.7%)
Sister 203 (18.8%)
Brother 12 (1.1%)
Relative 72 (6.7%)
Friend 402 (37.2%)
Health worker 41 (3.8%)
Teacher 1 (0.1%)
Other 15 (1.4%)
The percentage of boys/girls who feel comfortable discussing the following topic with their friends
Menstruation 352 (7.5%) 145 (6.6%) 207 (8.4%) 0.021
Pregnancy prevention 272 (5.8%) 103 (4.7%) 169 (6.8%) 0.002

GEAS-Indonesia Baseline Report | 2019
74
Puberty Total Boys % Girls % P-
value
Sexual intercourse 141 (3.0%) 89 (4.0%) 52 (2.1%) <0.001
Being in love 1084 (23.1%) 569 (25.8%) 515 (20.8%) <0.001
Perception of body changes during puberty
I like becoming a man/woman 3036 (77.6%) 1417 (82.4%) 1619 (73.9%) <0.001
Treated like an adult 2629 (67.2%) 1236 (71.9%) 1393 (63.5%) <0.001
Proud with pubertal changes 2368 (60.5%) 1148 (66.8%) 1220 (55.7%) <0.001
Feeling about sexual desire
Felt guilty for looking at themselves naked 2242 (47.9%) 988 (44.8%) 1254 (50.6%) <0.001
Felt guilty for being romantically attracted to someone 1564 (33.4%) 653 (29.6%) 911 (36.8%) <0.001
Felt guilty for touching the private parts of their body 1492 (31.9%) 675 (30.6%) 817 (33.0%) 0.079
Felt guilty for having sexual feelings/urges 3549 (75.8%) 1588 (72.0%) 1961 (79.2%) <0.001
It's not normal for being curious about love and sex 1239 (26.5%) 491 (22.2%) 748 (30.2%) <0.001

GEAS-Indonesia Baseline Report | 2019
75
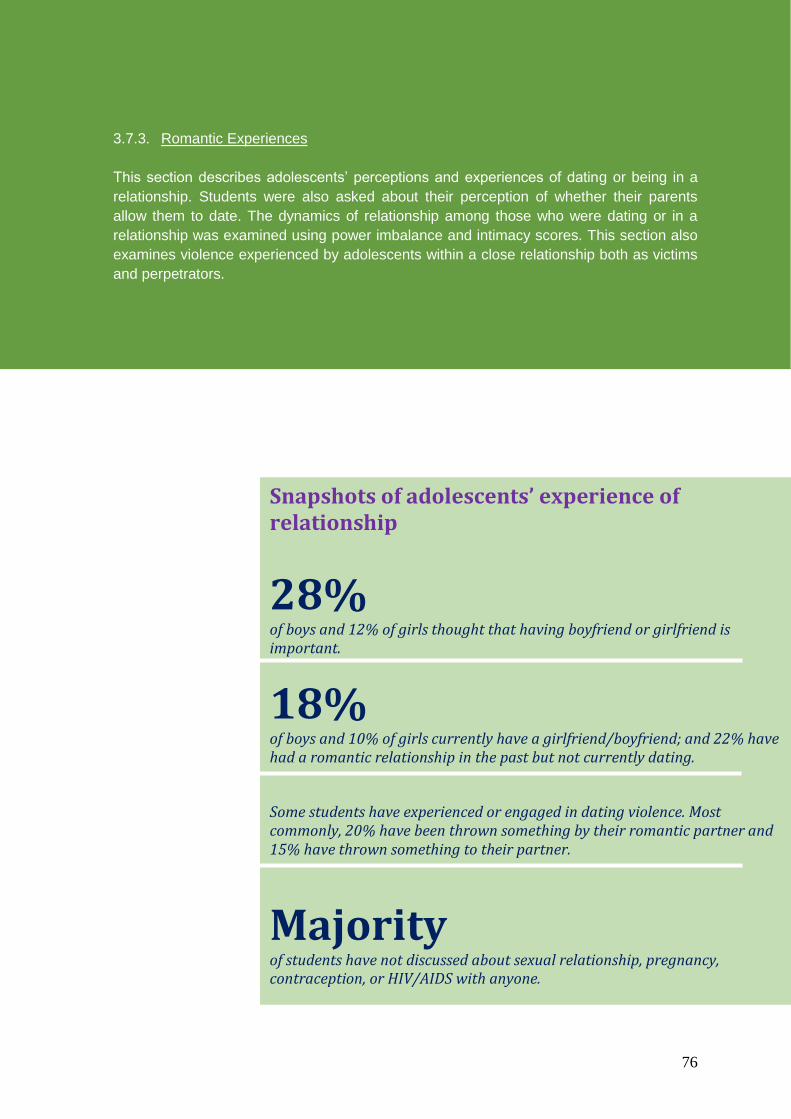
GEAS-Indonesia Baseline Report | 2019
76
3.7.3. Romantic Experiences
This section describes adolescents’ perceptions and experiences of dating or being in a
relationship. Students were also asked about their perception of whether their parents
allow them to date. The dynamics of relationship among those who were dating or in a
relationship was examined using power imbalance and intimacy scores. This section also
examines violence experienced by adolescents within a close relationship both as victims
and perpetrators.
Snapshots of adolescents’ experience of relationship
28%
of boys and 12% of girls thought that having boyfriend or girlfriend is important.
18% of boys and 10% of girls currently have a girlfriend/boyfriend; and 22% have had a romantic relationship in the past but not currently dating.
Some students have experienced or engaged in dating violence. Most commonly, 20% have been thrown something by their romantic partner and 15% have thrown something to their partner.
Majority
of students have not discussed about sexual relationship, pregnancy, contraception, or HIV/AIDS with anyone.
GEAS-Indonesia Baseline Report | 2019
77
Upon entering adolescence, individuals
begin to have romantic interests. Previous
studies suggest that the development of
adolescent romantic relationships follow
sequential phases, where the intensity,
duration, and quality of romantic relations
increase as adolescents become older
(Collins, 2003, Seiffge-Krenke, 2003).
Adolescents were asked about their
romantic relationship and the results are
presented in Table 20. A majority did not
think that their main caregiver would allow
them to have a boyfriend/girlfriend at this
time in their life. The percentage of those
who get approval from their parent were
dropping from 23% in Denpasar to 15% in
Bandar Lampung and 13% in Semarang.
While parent approval was low,
more than two thirds of adolescents
reported that they had ever fallen in love
(including 5% who reported same sex
interest) and almost half (46%) had ever had
a romantic relationship and 14% were in a
current dating relationship. Most adolescents
who had ever had a relation kept it secret. A
minority (5%) were engaged to be married.
These experiences differed across sites with
greater romantic involvement in Semarang
(49% ever been in a romantic relationship
and 16% currently had a boy/girlfriend,
compared to 46% and 13% in Bandar
Lampung and 42% and 12% in Denpasar,
respectively).
Among adolescents who ever had a
romantic relationship (n=1857), 26% spent
time with their partner 1 to 4 times a week
and 12% met every day. The quality of the
current or last relationship was assessed
with respect to power imbalance and
intimacy. Specifically, power imbalance was a
summary measure (scored 1 to 5) of the
four following statements: (1) I sometimes
do things because X (the partner) is doing
them, (2) X often influences what I do, (3) I
sometimes do things because I don’t want to
lose X’s respect, and (4) X sometimes wants
to control what I do. A relationship intimacy
measure summarized (scored 1 to 5)
responses across six statements:(1) X makes
me feel good about myself in a way my
friends can't, (2) I feel comfortable talking
with X when I have a problem; (3) X cares
about me, (4) I would rather be with X than
anyone else, (5) X always seems to be on my
mind, and (6) X and I are practically
inseparable.
GEAS-Indonesia Baseline Report | 2019
78
The development of
adolescent romantic
relationships follows
sequential phases, where the
intensity, duration, and
quality of romantic relations
increase as adolescents
become older. Result
suggests more than two
thirds of students reported
that they had ever fallen in
love.
The average power score generally
signaled a lack of power (3.13) in
relationships while adolescents enjoyed a
higher level of intimacy (3.57). A number of
adolescents described violent behaviors in
the context of their relationships with 20%
indicating that they had ever been thrown
something while 15% had thrown something
at their romantic partner. Additionally, 11%
had ever been pushed/shoved/grabbed, 9%
had ever been slapped on the face or head,
and 11% had ever been hit. The percentages
ever enagaged in these behaviors
(pushing/shoving/grabbing, slapping, hitting)
are less than or equal to 10%. Those
percentages related to dating violence are
consistently highest in Bandar Lampung and
lowest in Semarang. The average power
score among those ever in a romantic
relationship is lower in Semarang than in
other sites (3.0 versus 3.2 in Bandar
Lampung and 3.3 in Denpasar). However,
the average score of intimacy is similar
across 3 sites.
Romantic experiences differed by
gender, with more restrictive views of
parents about these relations for girls than
boys (90% opposed girls dating versus 74%
who opposed boys dating), which also
translated in a higher percentage of boys
indicating that having a boyfriend/girlfriend
was very important to them and more boys
having ever had a romantic relationship (53%
versus 39% of girls). The nature of these
relationships also differed by gender, with
higher perceptions of power imbalance and
higher levels of intimacy reported by boys
compared to girls (3.37 versus 2.86 for
power imbalance and 3.67 versus 3.46 for
intimacy), meaning boys reported feeling of
closeness, connectedness, and bonding in
their relationship more often than girls.
Violence victimization and perpretration in
the context of the last relationship was also
more commonly reported by boys than girls.

GEAS-Indonesia Baseline Report | 2019
79
Table 20. Experience of romantic relationship, dating violence and communication about sexual
and reproductive issues, by sex.
Relationship Factors Total Boys % Girls % P-value
N 4,684 2,207 2,477
Child's perception about having boy/girl friend
Allowed by caregiver 817 (17.4%) 566 (25.6%) 251 (10.1%) <0.001
Romantic Relationships
Having boy/girl friend is important 915 (19.5%) 609 (27.6%) 306 (12.4%) <0.001
Ever fall in love with the same sex 172 (3.7%) 122 (5.5%) 50 (2.0%) <0.001
Ever fall in love with the different sex 2958 (63.2%) 1316 (59.6%) 1642 (66.3%) <0.001
Ever fall in love with both sexes 66 (1.4%) 45 (2.0%) 21 (0.8%) <0.001
Ever having secret relationship 1427 (45.6%) 663 (46.1%) 764 (45.2%) 0.59
Never had a romantic relationship 2213 (54.4%) 875 (47.1%) 1338 (60.5%) <0.001
Past romantic relationship (none currently) 1030 (25.3%) 463 (24.9%) 567 (25.6%) 0.11
Current boyfriend/girlfriend 645 (13.8%) 403 (18.3%) 242 (9.8%) <0.001
Engaged or married 215 (4.6%) 144 (6.5%) 71 (2.9%) <0.001
Power Imbalance in Relationships * 3.13 (1.02) 3.37 (0.99) 2.86 (0.99) <0.001
Intimacy in Relationships** 3.57 (0.90) 3.67 (0.93) 3.46 (0.87) <0.001
Time spent with romantic partner
<0.001
Everyday 199 (11.6%) 135 (14.8%) 64 (7.9%)
1-4 times a week 442 (25.7%) 286 (31.3%) 156 (19.3%)
Dating violence (ever)
Experience of physical violence victimization by romantic partner
Thrown something 350 (20.3%) 237 (26.0%) 113 (14.0%) <0.001
Pushed, shoved, grabbed 197 (11.4%) 155 (17.0%) 42 (5.2%) <0.001
Slapped on face or head (161 161 (9.3%) 137 (15.0%) 24 (3.0%) <0.001
Hitting 185 (10.7%) 144 (15.8%) 41 (5.1%) <0.001
Engaged in physical violence perpetration with romantic partner
Throwing something 255 (14.8%) 147 (16.1%) 108 (13.3%) 0.11
Pushing, shoving, grabbing 147 (8.5%) 97 (10.6%) 50 (6.2%) <0.001
Slapping on face or head 146 (8.5%) 94 (10.3%) 52 (6.4%) 0.004
Hitting 173 (10.0%) 94 (10.3%) 79 (9.8%) 0.71
Ever discussed the following topic with anyone
Sexual relationship 19.6 27.6 12.5 <0.001
Pregnancy 24.6 27.6 21.9 <0.001
Contraception 14.6 19.8 9.9 <0.001
HIV/AIDS 27.7 28.0 27.5 0.675
Person whom the child have discussed sexual relationship with
Mother/caregiver 296 (32.2%) 145 (23.8%) 151 (48.9%) <0.001
Father/caregiver 100 (10.9%) 88 (14.4%) 12 (3.9%) <0.001
Sister 65 (7.1%) 27 (4.4%) 38 (12.3%) <0.001
Brother 75 (8.2%) 73 (12.0%) 2 (0.6%) <0.001
Relative 56 (6.1%) 42 (6.9%) 14 (4.5%) 0.16
Friend 620 (67.5%) 419 (68.7%) 201 (65.0%) 0.27
Health worker 53 (5.8%) 35 (5.7%) 18 (5.8%) 0.96
Teacher 6 (0.7%) 1 (0.2%) 5 (1.6%) 0.010
Other 55 (6.0%) 39 (6.4%) 16 (5.2%) 0.46
Person whom the child have discussed pregnancy with
Mother/caregiver 543 (47.1%) 192 (31.5%) 351 (64.6%) <0.001
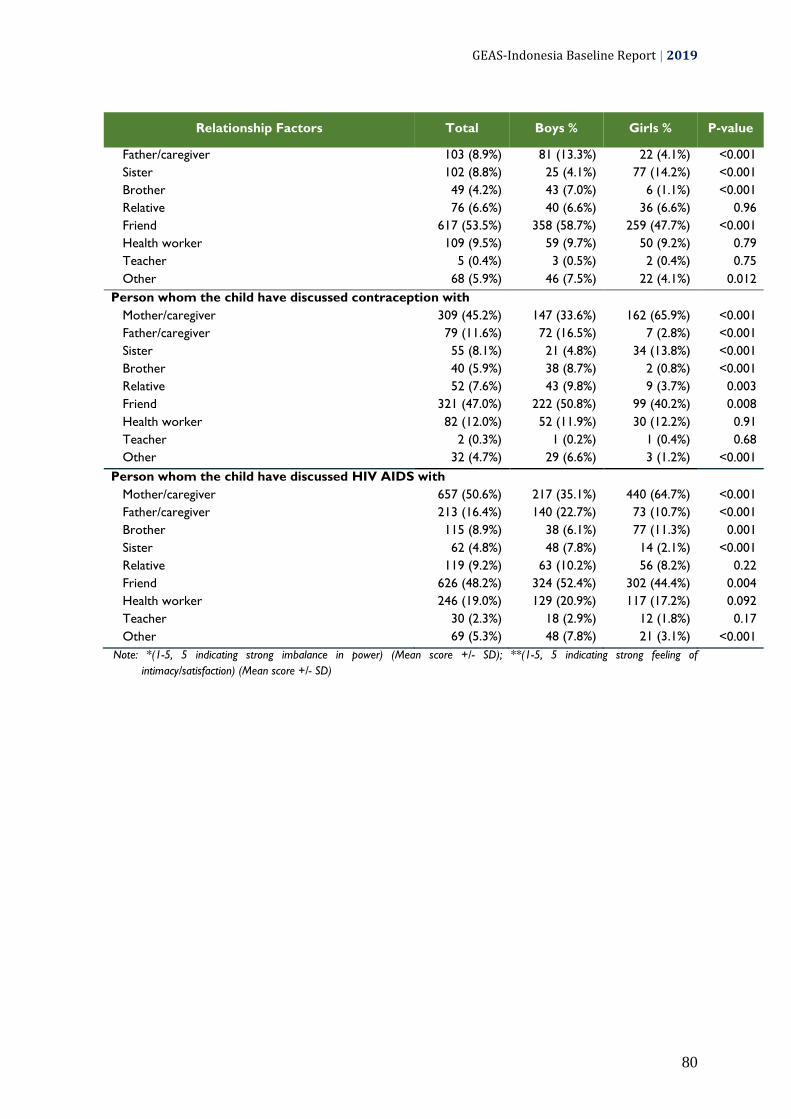
GEAS-Indonesia Baseline Report | 2019
80
Relationship Factors Total Boys % Girls % P-value
Father/caregiver 103 (8.9%) 81 (13.3%) 22 (4.1%) <0.001
Sister 102 (8.8%) 25 (4.1%) 77 (14.2%) <0.001
Brother 49 (4.2%) 43 (7.0%) 6 (1.1%) <0.001
Relative 76 (6.6%) 40 (6.6%) 36 (6.6%) 0.96
Friend 617 (53.5%) 358 (58.7%) 259 (47.7%) <0.001
Health worker 109 (9.5%) 59 (9.7%) 50 (9.2%) 0.79
Teacher 5 (0.4%) 3 (0.5%) 2 (0.4%) 0.75
Other 68 (5.9%) 46 (7.5%) 22 (4.1%) 0.012
Person whom the child have discussed contraception with
Mother/caregiver 309 (45.2%) 147 (33.6%) 162 (65.9%) <0.001
Father/caregiver 79 (11.6%) 72 (16.5%) 7 (2.8%) <0.001
Sister 55 (8.1%) 21 (4.8%) 34 (13.8%) <0.001
Brother 40 (5.9%) 38 (8.7%) 2 (0.8%) <0.001
Relative 52 (7.6%) 43 (9.8%) 9 (3.7%) 0.003
Friend 321 (47.0%) 222 (50.8%) 99 (40.2%) 0.008
Health worker 82 (12.0%) 52 (11.9%) 30 (12.2%) 0.91
Teacher 2 (0.3%) 1 (0.2%) 1 (0.4%) 0.68
Other 32 (4.7%) 29 (6.6%) 3 (1.2%) <0.001
Person whom the child have discussed HIV AIDS with
Mother/caregiver 657 (50.6%) 217 (35.1%) 440 (64.7%) <0.001
Father/caregiver 213 (16.4%) 140 (22.7%) 73 (10.7%) <0.001
Brother 115 (8.9%) 38 (6.1%) 77 (11.3%) 0.001
Sister 62 (4.8%) 48 (7.8%) 14 (2.1%) <0.001
Relative 119 (9.2%) 63 (10.2%) 56 (8.2%) 0.22
Friend 626 (48.2%) 324 (52.4%) 302 (44.4%) 0.004
Health worker 246 (19.0%) 129 (20.9%) 117 (17.2%) 0.092
Teacher 30 (2.3%) 18 (2.9%) 12 (1.8%) 0.17
Other 69 (5.3%) 48 (7.8%) 21 (3.1%) <0.001
Note: *(1-5, 5 indicating strong imbalance in power) (Mean score +/- SD); **(1-5, 5 indicating strong feeling of
intimacy/satisfaction) (Mean score +/- SD)

GEAS-Indonesia Baseline Report | 2019
81
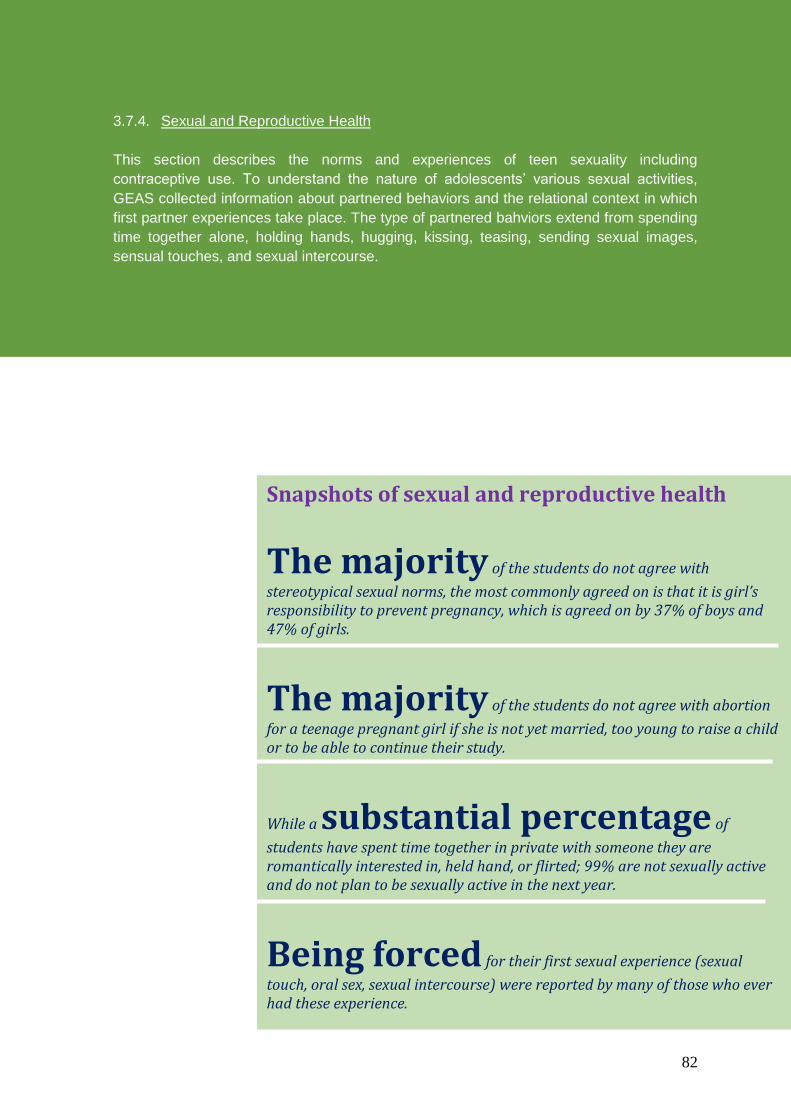
GEAS-Indonesia Baseline Report | 2019
82
3.7.4. Sexual and Reproductive Health
This section describes the norms and experiences of teen sexuality including
contraceptive use. To understand the nature of adolescents’ various sexual activities,
GEAS collected information about partnered behaviors and the relational context in which
first partner experiences take place. The type of partnered bahviors extend from spending
time together alone, holding hands, hugging, kissing, teasing, sending sexual images,
sensual touches, and sexual intercourse.
Snapshots of sexual and reproductive health
The majority of the students do not agree with
stereotypical sexual norms, the most commonly agreed on is that it is girl’s responsibility to prevent pregnancy, which is agreed on by 37% of boys and 47% of girls.
The majority of the students do not agree with abortion
for a teenage pregnant girl if she is not yet married, too young to raise a child or to be able to continue their study.
While a substantial percentage of
students have spent time together in private with someone they are romantically interested in, held hand, or flirted; 99% are not sexually active and do not plan to be sexually active in the next year.
Being forced for their first sexual experience (sexual
touch, oral sex, sexual intercourse) were reported by many of those who ever had these experience.

GEAS-Indonesia Baseline Report | 2019
83
a. Stereotypical sexual norms, attitudes on
abortion, and sexual experience
Stereotypical views about teenage
sexuality were prevalent with a third of
adolescents endorsed the view that women
who carry condoms are easy; and 42%
agreed that pregnancy prevention is the girl's
responsibility. Other sterotypes were less
common, including masculine hypersexuality
(15% agreed that men are always ready for
sex and 10% agreed that a real man should
have as many female partners as he can).
Perceptions of hypersexual masculinity was
notably higher in Bandar Lampung than in
other sites.
Sexual attitudes and
behaviors were highly
gendered with a greater
proportion of boys endorsing
masculine hypersexuality
than girls.
Less than 25% of students agreed that
pregnant adolescent girls should have an
abortion if they are not married or because
they are too young to raise a child and 27%
thought they should have an abortion to stay
in school. Boys had more liberal views on
this matter than girls, with up to 31%
agreeing an adolescent girl their age should
get an abortion to continue studying.
Partnered behaviors were uncommon
in early adolescence, as only a quarter
indicated that they had spent time alone with
a romantic partner, 18.9% had ever held
hands and 9.5 had ever hugged or cuddled.
Only 1% reported ever having had sexual
intercourse or oral sex, while 2% have ever
sent sexual pictures of themselves. Few
adolescents anticipated engaged in sexual
behavior in the following year. Partnered
activities were more common in in Bandar
Lampung where 4% had ever kissed, 9% had
ever cuddled and 2% had ever had vaginal or
oral sex. These activities were least
commonly reported in Semarang
Sexual attitudes and behaviors were
highly gendered with a greater proportion of
boys endorsing masculine hypersexuality
than girls, and a grater proportion of boys
reporting any form of partnered activity:
32% had ever spent time alone with a
partner versus 18% of girls, 21% had ever
held hands versus 17% of girls, 6% had ever
touched in a sexual way versus 2% of girls
and 2% had vere had sex. Four percent of
boys and 0.3% of girls intend to have sex
next year.
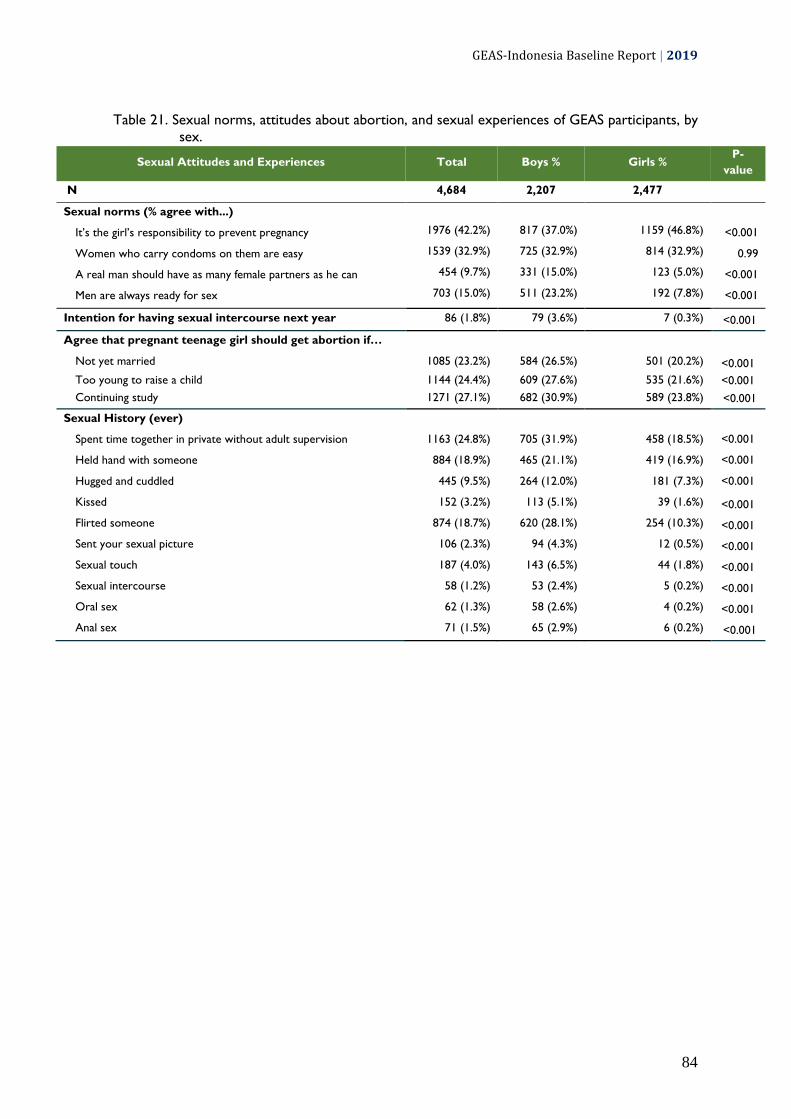
GEAS-Indonesia Baseline Report | 2019
84
Table 21. Sexual norms, attitudes about abortion, and sexual experiences of GEAS participants, by
sex.
Sexual Attitudes and Experiences Total Boys % Girls % P-
value
N 4,684 2,207 2,477
Sexual norms (% agree with...)
It’s the girl’s responsibility to prevent pregnancy 1976 (42.2%) 817 (37.0%) 1159 (46.8%) <0.001
Women who carry condoms on them are easy 1539 (32.9%) 725 (32.9%) 814 (32.9%) 0.99
A real man should have as many female partners as he can 454 (9.7%) 331 (15.0%) 123 (5.0%) <0.001
Men are always ready for sex 703 (15.0%) 511 (23.2%) 192 (7.8%) <0.001
Intention for having sexual intercourse next year 86 (1.8%) 79 (3.6%) 7 (0.3%) <0.001
Agree that pregnant teenage girl should get abortion if…
Not yet married 1085 (23.2%) 584 (26.5%) 501 (20.2%) <0.001
Too young to raise a child 1144 (24.4%) 609 (27.6%) 535 (21.6%) <0.001
Continuing study 1271 (27.1%) 682 (30.9%) 589 (23.8%) <0.001
Sexual History (ever)
Spent time together in private without adult supervision 1163 (24.8%) 705 (31.9%) 458 (18.5%) <0.001
Held hand with someone 884 (18.9%) 465 (21.1%) 419 (16.9%) <0.001
Hugged and cuddled 445 (9.5%) 264 (12.0%) 181 (7.3%) <0.001
Kissed 152 (3.2%) 113 (5.1%) 39 (1.6%) <0.001
Flirted someone 874 (18.7%) 620 (28.1%) 254 (10.3%) <0.001
Sent your sexual picture 106 (2.3%) 94 (4.3%) 12 (0.5%) <0.001
Sexual touch 187 (4.0%) 143 (6.5%) 44 (1.8%) <0.001
Sexual intercourse 58 (1.2%) 53 (2.4%) 5 (0.2%) <0.001
Oral sex 62 (1.3%) 58 (2.6%) 4 (0.2%) <0.001
Anal sex 71 (1.5%) 65 (2.9%) 6 (0.2%) <0.001
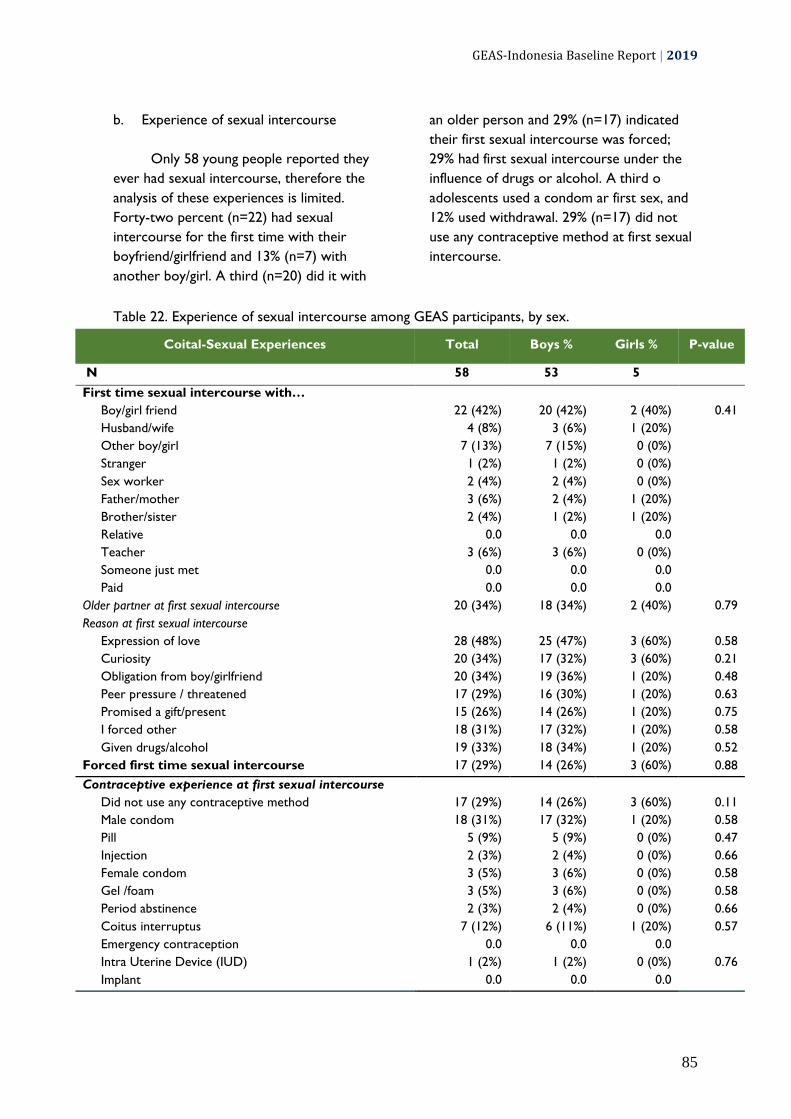
GEAS-Indonesia Baseline Report | 2019
85
b. Experience of sexual intercourse
Only 58 young people reported they
ever had sexual intercourse, therefore the
analysis of these experiences is limited.
Forty-two percent (n=22) had sexual
intercourse for the first time with their
boyfriend/girlfriend and 13% (n=7) with
another boy/girl. A third (n=20) did it with
an older person and 29% (n=17) indicated
their first sexual intercourse was forced;
29% had first sexual intercourse under the
influence of drugs or alcohol. A third o
adolescents used a condom ar first sex, and
12% used withdrawal. 29% (n=17) did not
use any contraceptive method at first sexual
intercourse.
Table 22. Experience of sexual intercourse among GEAS participants, by sex.
Coital-Sexual Experiences Total Boys % Girls % P-value
N 58 53 5
First time sexual intercourse with…
Boy/girl friend 22 (42%) 20 (42%) 2 (40%) 0.41
Husband/wife 4 (8%) 3 (6%) 1 (20%)
Other boy/girl 7 (13%) 7 (15%) 0 (0%)
Stranger 1 (2%) 1 (2%) 0 (0%)
Sex worker 2 (4%) 2 (4%) 0 (0%)
Father/mother 3 (6%) 2 (4%) 1 (20%)
Brother/sister 2 (4%) 1 (2%) 1 (20%)
Relative 0.0 0.0 0.0
Teacher 3 (6%) 3 (6%) 0 (0%)
Someone just met 0.0 0.0 0.0
Paid 0.0 0.0 0.0
Older partner at first sexual intercourse 20 (34%) 18 (34%) 2 (40%) 0.79
Reason at first sexual intercourse
Expression of love 28 (48%) 25 (47%) 3 (60%) 0.58
Curiosity 20 (34%) 17 (32%) 3 (60%) 0.21
Obligation from boy/girlfriend 20 (34%) 19 (36%) 1 (20%) 0.48
Peer pressure / threatened 17 (29%) 16 (30%) 1 (20%) 0.63
Promised a gift/present 15 (26%) 14 (26%) 1 (20%) 0.75
I forced other 18 (31%) 17 (32%) 1 (20%) 0.58
Given drugs/alcohol 19 (33%) 18 (34%) 1 (20%) 0.52
Forced first time sexual intercourse 17 (29%) 14 (26%) 3 (60%) 0.88
Contraceptive experience at first sexual intercourse
Did not use any contraceptive method 17 (29%) 14 (26%) 3 (60%) 0.11
Male condom 18 (31%) 17 (32%) 1 (20%) 0.58
Pill 5 (9%) 5 (9%) 0 (0%) 0.47
Injection 2 (3%) 2 (4%) 0 (0%) 0.66
Female condom 3 (5%) 3 (6%) 0 (0%) 0.58
Gel /foam 3 (5%) 3 (6%) 0 (0%) 0.58
Period abstinence 2 (3%) 2 (4%) 0 (0%) 0.66
Coitus interruptus 7 (12%) 6 (11%) 1 (20%) 0.57
Emergency contraception 0.0 0.0 0.0
Intra Uterine Device (IUD) 1 (2%) 1 (2%) 0 (0%) 0.76
Implant 0.0 0.0 0.0

GEAS-Indonesia Baseline Report | 2019
86
Coital-Sexual Experiences Total Boys % Girls % P-value
Ever had first sexual intercourse under the influence
drugs/alcohol 17 (29%) 17 (32%) 0 (0%) 0.13
Sexual intercourse with current or last boy/girlfriend
Ever had sexual intercourse with current/last boyfriend 18 (40%) 16 (40%) 2 (40%) 1.00
Worried about sexually transmitted disease 17 (94%) 16 (100%) 1 (50%) 0.004
Worried about getting pregnant/impregnate 17 (94%) 16 (100%) 1 (50%) 0.004
Contraceptive experience with current or last boy/girlfriend
Did not use any contraceptive method 8 (44.4%) 8 (50%) 0 (0%) 0.18
Male condom 8 (44.4%) 8 (50%) (0%)
Pill 0.0 0.0 0.0
Injection 0.0 0.0 0.0
Female condom 0.0 0.0 0.0
Gel /foam 0.0 0.0 0.0
Period abstinence 0.0 0.0 0.0
Coitus interruptus 0.0 0.0 0.0
Emergency contraception 0.0 0.0 0.0
Intra Uterine Device (IUD) 0.0 0.0 0.0
Implant 0.0 0.0 0.0
Reason for not using contraceptive method
Too ashamed to talk about contraception 75.0 75.0 0.0
Want to get pregnant 13.0 13.0 0.0
Partner refusal 13.0 13.0 0.0
Less pleasure 0.0 0.0 0.0
Do not know where to find contraception 0.0 0.0 0.0
Do not want to seem too eager for sex 0.0 0.0 0.0
Thinking will not get pregnant or impregnate 0.0 0.0 0.0
Never thought about contraception 0.0 0.0 0.0
Not affordable 0.0 0.0 0.0
Too ashamed/scared to get contraception 0.0 0.0 0.0
c. Experience of sexual touch and oral sex
Sixty-two adolescents reported an
experience of oral sex. Among them, 47%
(n=29) did it the first time with their
boyfriend/girlfriend and 11% (n=7) with
another boy/girl. Thirty-five percent did it
with an older person and 56% were forced
to do it the first time. Students who
reported having experienced sexual touch
also most commonly did it with their
boyfriend/girlfriend; 35% were forced to do
it the first time.

GEAS-Indonesia Baseline Report | 2019
87
Table 23. Experience of sexual touch and oral sex among GEAS participants, by sex.
Non Coital-Sexual Experiences Total Boys % Girls % P-
value
N 237 179 58
First time sexual touch by…
0.052
Boy/girl friend 67 (28.3%) 54 (30.2%) 13 (22.4%)
Husband/wife 10 (4.2%) 10 (5.6%) 0 (0.0%)
Other boy/girl 56 (23.6%) 36 (20.1%) 20 (34.5%)
Stranger 3 (1.3%) 3 (1.7%) 0 (0.0%)
Sex worker 3 (1.3%) 3 (1.7%) 0 (0.0%)
Father/mother 15 (6.3%) 12 (6.7%) 3 (5.2%)
Brother/sister 7 (3.0%) 3 (1.7%) 4 (6.9%)
Relative 5 (2.1%) 2 (1.1%) 3 (5.2%)
Teacher 2 (0.8%) 2 (1.1%) 0 (0.0%)
Someone just met 2 (0.8%) 2 (1.1%) 0 (0.0%)
Paid
Older partner at first sexual touch 67 (28.3%) 50 (27.9%) 17 (29.3%) 0.84
Reason at first sexual touch
Expression of love 106 (44.7%) 83 (46.4%) 23 (39.7%) 0.37
Curiosity 91 (38.4%) 75 (41.9%) 16 (27.6%) 0.051
Obligation from boy/girlfriend 56 (23.6%) 50 (27.9%) 6 (10.3%) 0.006
Peer pressure / threatened 53 (22.4%) 47 (26.3%) 6 (10.3%) 0.011
Promised a gift/present 55 (23.2%) 50 (27.9%) 5 (8.6%) 0.002
Given drugs/alcohol 46 (19.4%) 44 (24.6%) 2 (3.5%) <0.001
I forced other 53 (22.4%) 50 (27.9%) 3 (5.2%) <0.001
Forced first time sexual touch 84 (35.4%) 72 (40.2%) 12 (20.7%) 0.007
N 62 58 4
First time oral sex with… 0.66
Boy/girlfriend 29 (47%) 27 (47%) 2 (50%)
Husband/wife 1 (2%) 1 (2%) 0 (0%)
Other boy/girl 7 (11%) 7 (12%) 0 (0%)
Stranger 3 (5%) 3 (5%) 0 (0%)
Sex worker 2 (3%) 2 (3%) 0 (0%)
Father/mother 3 (5%) 2 (3%) 1 (25%)
Brother/sister 2 (3%) 2 (3%) 0 (0%)
Relative 1 (2%) 1 (2%) 0 (0%)
Teacher 0 (0%) 0 (0%) 0 (0%)
Someone just met 0 (0%) 0 (0%) 0 (0%)
Paid 0 (0%) 0 (0%) 0 (0%)
Older partner at first oral sex 22 (35%) 20 (34%) 2 (50%) 0.53
Reason at first oral sex
Expression of love 29 (47%) 27 (47%) 2 (50%) 0.89
Curiosity 29 (47%) 27 (47%) 2 (50%) 0.89
Obligation from boy/girlfriend 27 (44%) 25 (43%) 2 (50%) 0.79
Peer pressure / threatened 23 (37%) 23 (40%) 0 (0%) 0.11
Promised a gift/present 23 (37%) 22 (38%) 1 (25%) 0.60
Given drugs/alcohol 21 (34%) 20 (34%) 1 (25%) 0.70
I forced other 19 (31%) 17 (29%) 2 (50%) 0.39
Forced first time oral sex 35 (56%) 33 (57%) 2 (50%) 0.79

GEAS-Indonesia Baseline Report | 2019
88
3.7.5. Female Genital Cutting
Female genital cutting (sometimes referred to female genital mutilation or female
circumcision) are all actions that involve removing a small or large portion of the external
female genital organs or other forms of injury to female genital organs for non-medical
reasons. This section of the report describes the knowledge, experience, perceptions of
benefits, motivations, procedures for female circumcision and those who assist in this
process. The information was collected from the perspective of adolescents and parents.
Snapshots of Female Genital Cutting
23%
of students and 86% of main caregivers ever heard of or know about female genital mutilation.
9% of girls reported to have been circumcised; 30% of caregivers have a daughter who was circumcised.
55% of the caregivers whose daughter was circumcised reported that the genital area was nicked without flesh removal.
31% of the girls and the caregivers who know about FGC think that FGC is required by their religion; 21% of the girls and 29% of the caregivers think that FGC should be continued
GEAS-Indonesia Baseline Report | 2019
89
Female genital cutting (FGC) refers to
all procedures involving partial or total
removal of the female external genitalia or
other injury to the female genital organs for
non-medical reasons. The nationally-
representative 2013 Basic Health Survey
found that 49% of girls under the age of 12
had undergone some form of FGC (2013
Basic Health Research (RISKESDAS)). The
practice is strongly related to cultural and
religious norms and therefore the
prevalence varies greatly by province. FGC
generally practiced in Indonesia generally
refers to type I which consists of partial or
total removal of the clitoris and/or its
prepuce and type IV which is less invasive
and consists of pricking, piercing, incising,
scraping, and cauterization.
About third of students who know female genital cutting, they believe this practice is good for girl and required by their religion.
This survey asked both female
students and parent/main caregiver about
their knowledge of and attitude towards
FGC. The majority of the girls (77%) had
never heard about FGC. Among those who
ever heard about FGC, 34% agreed that
FGC is good for girls, 31% thought it was
required by their religion, and 21% thought
that FGC practices should be continued.
Among those agreeing on the benefit of FGC
for girls, 54% thought FGC had a health
benefit, and 9% thought FGC could preserve
a woman's virginity well 12% thought it
brought religious approval. Girls in Bandar
Lampung were more likely to ever heard
about FGC (36% compared to 21% in
Semarang and 11% in Denpasar). Half of
students in Bandar Lampung who know
about FGC agreed that FGC is good for
girls, also half thought that FGC is required
by religion, compared to 20% and 40% in
Denpasar and 8 and 33% in Semarang,
respectively.
Only 9% of girls reported
experiencing FGC: in 49% of cases a flesh
was removed from the genital area (type 1)
and 32% reported that their genital area was
sowed (type 3). In a majority of cases (91%);
FGC was done by a medical professional
(doctor, nurse, or midwives). FGC practices
varied widely by site: 27% of girls in Bandar
Lampung, but 2% of girls in Semarang and
0.8% in Denpasar.
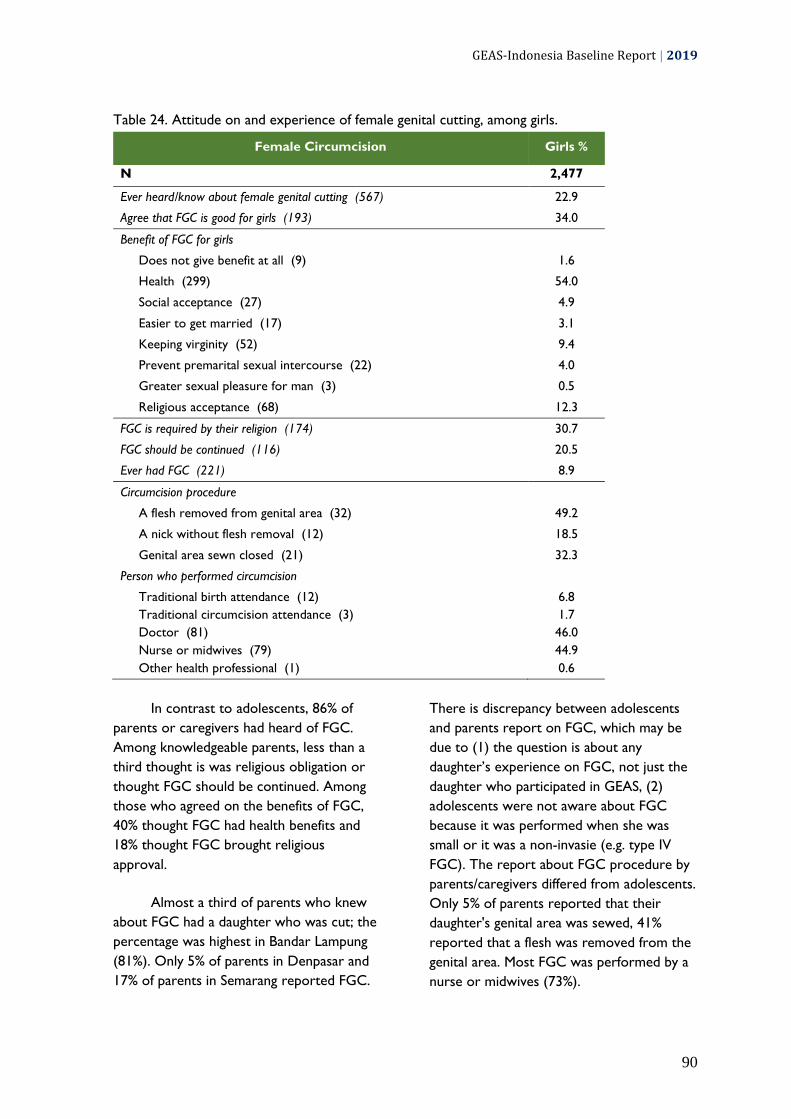
GEAS-Indonesia Baseline Report | 2019
90
Table 24. Attitude on and experience of female genital cutting, among girls.
Female Circumcision Girls %
N 2,477
Ever heard/know about female genital cutting (567) 22.9
Agree that FGC is good for girls (193) 34.0
Benefit of FGC for girls
Does not give benefit at all (9) 1.6
Health (299) 54.0
Social acceptance (27) 4.9
Easier to get married (17) 3.1
Keeping virginity (52) 9.4
Prevent premarital sexual intercourse (22) 4.0
Greater sexual pleasure for man (3) 0.5
Religious acceptance (68) 12.3
FGC is required by their religion (174) 30.7
FGC should be continued (116) 20.5
Ever had FGC (221) 8.9
Circumcision procedure
A flesh removed from genital area (32) 49.2
A nick without flesh removal (12) 18.5
Genital area sewn closed (21) 32.3
Person who performed circumcision
Traditional birth attendance (12) 6.8
Traditional circumcision attendance (3) 1.7
Doctor (81) 46.0
Nurse or midwives (79) 44.9
Other health professional (1) 0.6
In contrast to adolescents, 86% of
parents or caregivers had heard of FGC.
Among knowledgeable parents, less than a
third thought is was religious obligation or
thought FGC should be continued. Among
those who agreed on the benefits of FGC,
40% thought FGC had health benefits and
18% thought FGC brought religious
approval.
Almost a third of parents who knew
about FGC had a daughter who was cut; the
percentage was highest in Bandar Lampung
(81%). Only 5% of parents in Denpasar and
17% of parents in Semarang reported FGC.
There is discrepancy between adolescents
and parents report on FGC, which may be
due to (1) the question is about any
daughter’s experience on FGC, not just the
daughter who participated in GEAS, (2)
adolescents were not aware about FGC
because it was performed when she was
small or it was a non-invasie (e.g. type IV
FGC). The report about FGC procedure by
parents/caregivers differed from adolescents.
Only 5% of parents reported that their
daughter's genital area was sewed, 41%
reported that a flesh was removed from the
genital area. Most FGC was performed by a
nurse or midwives (73%).

GEAS-Indonesia Baseline Report | 2019
91
Table 25. Attitude on and experience of female genital cutting among parent/main caregivers of
GEAS participants, by sex of the students.
Female Circumcision Total % Boys % Girls % P-value
N 4,225 1,710 2,477
Ever heard/know about female genital cutting 3637 (86.1%) 1710 (85.7%) 1927 (86.4%) 0.51
Benefit of FGC for girls
Does not give benefit at all 137 (3.7%) 58 (3.4%) 79 (4.1%) 0.41
Health 1481 (40.3%) 684 (39.6%) 797 (40.9%) <0.001
Social acceptance 184 (5.0%) 61 (3.5%) 123 (6.3%) 0.86
Easier to get married 33 (0.9%) 15 (0.9%) 18 (0.9%) 0.23
Keeping virginity 61 (1.7%) 24 (1.4%) 37 (1.9%) 0.43
Prevent premarital sexual intercourse 82 (2.2%) 35 (2.0%) 47 (2.4%) 0.86
Greater sexual pleasure for man 33 (0.9%) 15 (0.9%) 18 (0.9%) 0.049
Religious acceptance 657 (17.9%) 286 (16.5%) 371 (19.0%) 0.26
FGC is required by their religion 1127 (30.6%) 514 (29.7%) 613 (31.5%) 0.26
FGC should be continued 1052 (28.6%) 490 (28.3%) 562 (28.8%) 0.74
Had a daughter who was circumcised 1110 (29.6%) 385 (25.6%) 725 (32.3%) <0.001
Circumcision procedure
0.19
A flesh removed from genital area 301 (40.9%) 114 (42.7%) 187 (39.9%)
A nick without flesh removal 402 (54.6%) 137 (51.3%) 265 (56.5%)
Genital area sewn closed 33 (4.5%) 16 (6.0%) 17 (3.6%)
Person who performed circumcision 0.53
Traditional birth attendance 193 (17.4%) 65 (16.9%) 128 (17.7%)
Traditional circumcision attendance 28 (2.5%) 12 (3.1%) 16 (2.2%)
Doctor 68 (6.1%) 25 (6.5%) 43 (5.9%)
Nurse or midwives 806 (72.6%) 281 (73.0%) 525 (72.4%)
Other health professional 8 (0.7%) 2 (0.5%) 6 (0.8%)

GEAS-Indonesia Baseline Report | 2019
92
Conclusion A substantial percentage of students are uncomfortable with their romantic or sexual
feelings. While the majority have positive perception of their body changes during
puberty, a lot of students never talk about puberty with someone. For those who do,
they most commonly talk with their mother or friends. Students feel uncomfortable to
talk about menstruation, pregnancy prevention, and sexual intercourse with their
friends.
While most girls are able to use sanitation products and do not miss school during
menstruation, many feel ashamed with their body and want to keep their
menstruation secret.
Most of the students have not talked about sexual relationship, pregnancy,
contraception, and HIV/AIDS with someone. More people talked about HIV/AIDS than
the other topics. Knowledge about pregnancy and HIV prevention was very low,
particular among girls who are seem ill equipped to protect themselves once they
become sexually active. The majority do not know where to go to get condom or
other contraceptive methods or aware of the government’s sexual health services
available to young people.
The majority do not agree with the stereotypical sexual norms. However, it seems that
adolescents have mixed views about adolescent sexuality, rejecting hypersexual
masculinity but at the same time endorsing female sexual shaming.
The majoriy of the students have had romantic interest in someone, but most do not
think that having a boyfriend/girlfriend is important and most are not currently dating.
Romantic interest is common among young people despite parent’s restriction and
disapproval. Boys were more likely than girls to have experienced a romantic
relationship. Boys experience romantic relationship differently than girls, with greater
power imbalance but also greater feeling of intimacy.
Almost all of the students are not yet sexually active and do not plan to be sexually
active in the near future. Few had experienced any partnered activity, mostly in the
form of spending time together in private, holding hands, and cuddling/hugging.
Among those who have ever been dating, being thrown something and throw
something at their partner is the most common form of dating violence. Boys
experience and perpetrate dating violence more commonly than girls.
The majority of the students do not know about FGC, but the majority of the
caregivers know about FGC. FGC is not commonly practiced by the parents who have
a daughter; the majority of the circumcision did not involve flesh removal. The
majority of the students and caregivers do not think that FGC is required by their
religion or that FGC should be continued.

GEAS-Indonesia Baseline Report | 2019
93

GEAS-Indonesia Baseline Report | 2019
94
3.8. Media Access and Use
Massive technological developments have transformed lives of adolescents globally.
Today's integration of media and technology raises new patterns or ways for young
people to find, share, create information, including information on sexuality, reproductive
health and contraception. Technology and social media are ubiquitous in young people’s
lives. Teenagers use social media and the internet to connect with their peers, find
entertainments and information. Therefore, technology and social media may significantly
impact adolescents’ identity and social development and have potential benefits and risks
for their health and wellbeing. This section provides information about youth access to and
use of several types of mass media and social media as well as consumption of
pornographic content.
Snapshots of media access and use
84%
have access to mobile phone, and 91% and 75% have access to social media and computer, respectively.
29% spend more than two hours per day on social media, 31% spend more than two hours per day watching TV/film/online videos.
68% text their friend everyday, but only 19% call their friend everyday.
83%
have never watched pornography.
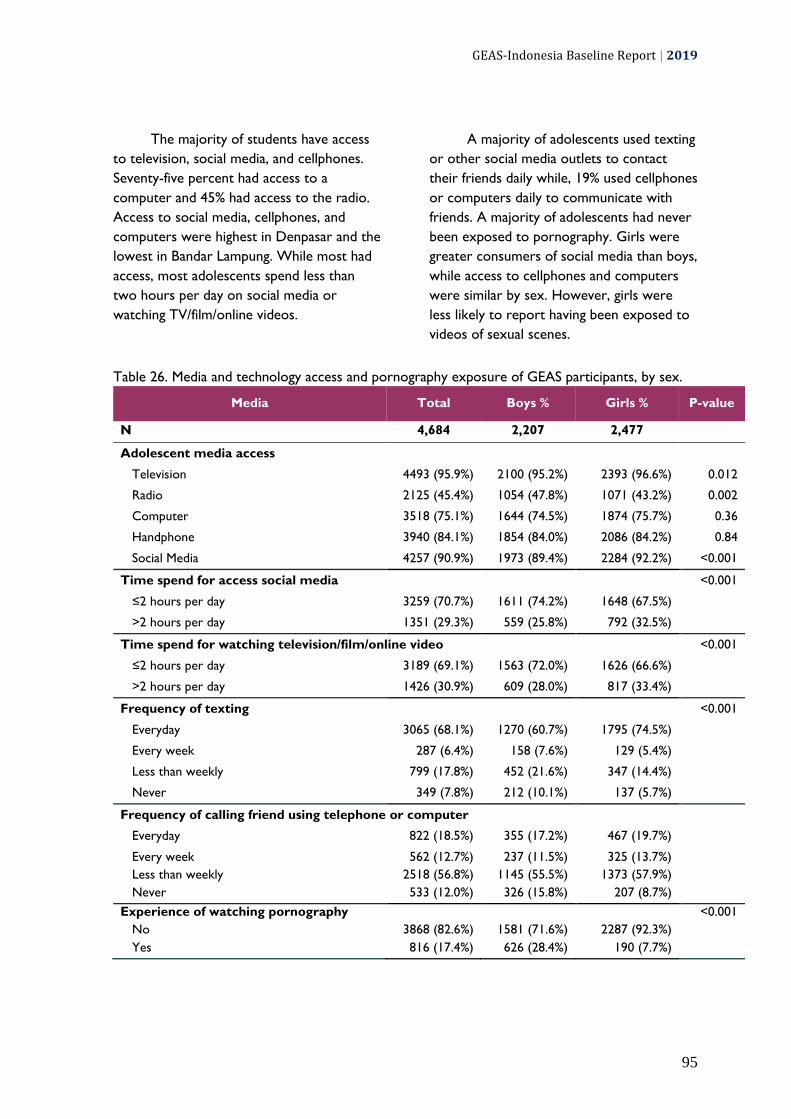
GEAS-Indonesia Baseline Report | 2019
95
The majority of students have access
to television, social media, and cellphones.
Seventy-five percent had access to a
computer and 45% had access to the radio.
Access to social media, cellphones, and
computers were highest in Denpasar and the
lowest in Bandar Lampung. While most had
access, most adolescents spend less than
two hours per day on social media or
watching TV/film/online videos.
A majority of adolescents used texting
or other social media outlets to contact
their friends daily while, 19% used cellphones
or computers daily to communicate with
friends. A majority of adolescents had never
been exposed to pornography. Girls were
greater consumers of social media than boys,
while access to cellphones and computers
were similar by sex. However, girls were
less likely to report having been exposed to
videos of sexual scenes.
Table 26. Media and technology access and pornography exposure of GEAS participants, by sex.
Media Total Boys % Girls % P-value
N 4,684 2,207 2,477
Adolescent media access
Television 4493 (95.9%) 2100 (95.2%) 2393 (96.6%) 0.012
Radio 2125 (45.4%) 1054 (47.8%) 1071 (43.2%) 0.002
Computer 3518 (75.1%) 1644 (74.5%) 1874 (75.7%) 0.36
Handphone 3940 (84.1%) 1854 (84.0%) 2086 (84.2%) 0.84
Social Media 4257 (90.9%) 1973 (89.4%) 2284 (92.2%) <0.001
Time spend for access social media
<0.001
≤2 hours per day 3259 (70.7%) 1611 (74.2%) 1648 (67.5%)
>2 hours per day 1351 (29.3%) 559 (25.8%) 792 (32.5%)
Time spend for watching television/film/online video
<0.001
≤2 hours per day 3189 (69.1%) 1563 (72.0%) 1626 (66.6%)
>2 hours per day 1426 (30.9%) 609 (28.0%) 817 (33.4%)
Frequency of texting
<0.001
Everyday 3065 (68.1%) 1270 (60.7%) 1795 (74.5%)
Every week 287 (6.4%) 158 (7.6%) 129 (5.4%)
Less than weekly 799 (17.8%) 452 (21.6%) 347 (14.4%)
Never 349 (7.8%) 212 (10.1%) 137 (5.7%)
Frequency of calling friend using telephone or computer
Everyday 822 (18.5%) 355 (17.2%) 467 (19.7%)
Every week 562 (12.7%) 237 (11.5%) 325 (13.7%)
Less than weekly 2518 (56.8%) 1145 (55.5%) 1373 (57.9%)
Never 533 (12.0%) 326 (15.8%) 207 (8.7%)
Experience of watching pornography
<0.001
No 3868 (82.6%) 1581 (71.6%) 2287 (92.3%)
Yes 816 (17.4%) 626 (28.4%) 190 (7.7%)
GEAS-Indonesia Baseline Report | 2019
96
Conclusion The majority of the students have access to technology and media, and a
substantial percentage spend a long time on them everyday.
Texting is the main mode to communicate with friends.
The majority of the students never been exposed to pornography.

GEAS-Indonesia Baseline Report | 2019
97

GEAS-Indonesia Baseline Report | 2019
98
Appendices

GEAS-Indonesia Baseline Report | 2019
99
Appendix 1. The definition of selected gender development and education sector development
indicators
Indonesia has adopted the UN
Sustainable Development Goals (SDGs) in its
national development agenda. Gender
equality, as one of the main goal of the
SDGs, is outlined in the national long-term
development plan (RPJMN) 2005-2025. The
following indicators are used by Indonesia
government to evaluate the results of gender
perspective development:
a. The Gender Development
Index (GDI) is used to measure
gender gap in human development
achievements, thus revealing
disparities between men and women
in basic dimensions of human
development – health, knowledge,
and living standard. The GDI is the
ratio of the HDIs calculated
separately for females and males,
using indicators of life expectancy,
average number of years of
schooling, expected years of
schooling, and income. The value of
GDI ranges from zero and one.
b. The Gender Empowerment
Measure (GEM) shows whether
women can play an active role in
economic and political life. GEI
focuses on participation, by
measuring gender inequality in the
fields of economy, political
participation and decision making.
The indicators used to measure
GEM are the proportion of seats
held by women in parliament, the
proportion of women administrators
and managers, the proportion of
women professionals and technical
workers, and the ratio of women
and men earned income. The GEM
value also ranges from 0 (lowest) to
1 (highest).
The Development of The Education Sector
Participation in education is an
important component in the development of
human resources quality, as well as
development and gender empowerment.
The monitoring of school participation relies
on several indicators, including:
a) School Participation Rate
(SPR) is the enrolment of a specific
age group, expressed as a
percentage of the population of a
specific age group who are
currently in school, regardless of
level.
b) Gross Enrollment Ratio (GER)
is the total enrolment in a specific
level of education, regardless of age,
expressed as a percentage of the
eligible official school-age
population corresponding to the
same level of education in a given
school year. The GER shows the
general level of participation in a
given level of education.
c) Net Enrollment Ratio (NER) is
the enrolment of the official age
group for a given level of education
expressed as a percentage of the
corresponding population.
The NER show the extent of
coverage in a given level of
education of children and youths
belonging to the official age group
corresponding to the given level of
education.

GEAS-Indonesia Baseline Report | 2019
100
Appendix 2. The types of interview administration
1. Computer-assisted personal
interview (CAPI) or face-to-face
interview
Computer-assisted personal interview
(CAPI) is carried out when the
enumerator/data collector sits face-to-
face with the respondent and helps him
participate in the survey together. When
conducting a CAPI survey, the
enumerator/data collector will be the
one who holds the device/tablet, read
aloud the questions (and answers if
needed) to the respondent, and enter
the respondent's answer into the
device/tablet.
2. Computer-assisted self-interview
(CASI)
When conducting a survey using
computer-assisted self-interview (CASI),
respondents are expected to read each
question and answer it themselves.
When using CASI, the enumerator/data
collector can monitor several
respondents at one time, as long as they
work on the questionnaire
independently, and the enumerator/data
collector will have to be ready to
provide assistance if they encounter
problems during the process. One of the
advantages of CASI is that data
collectors/data collectors can collect
more data at one time, but this can be
quite challenging for respondents who
are too young to read and work on the
questionnaire themselves for a long time.
3. Audio Computer-Assisted Self-
Interview (ACASI)
Audio computer-assisted self-interview
(ACASI) is similar to the combination of
CAPI and CASI. In ACASI, respondent
holds the device themselves, so the
privacy is better. Respondents will also
use headphones so that they can listen
to the questions and answer choices that
are read out loud. This method minimize
‘headache’ they could get after reading
too many questions and allow the data
collectors to monitor more respondents
at one time.
GEAS-Indonesia Baseline Report | 2019
101
Appendix 3: GEAS-Indonesia Team Profile
1. Principal investigator: Prof Siswanto
Agus Wilopo, SU., M.Sc, ScD
Siswanto Agus Wilopo, is a Professor
of Population Health and the Director of
Center for Reproductive Health (CRH),
Faculty of Medicine, Public Health and
Nursing, Universitas Gadjah Mada,
Yogyakarta Indonesia. He is a medical doctor
and received Master of Science degree from
McMaster University, Canada in 1984 and
Doctor of Science degree from the Johns
Hopkins School of Public Health in 1990. He
is a former Chair of Indonesia Public Health
Physician Association (2011-2015) and the
First Chairpersons of Indonesia
Demographic Association (IPADI) from
2010-2017. He is also a former the Deputy
Chairperson of National Family Planning
Coordinating Board (BKKBN), Indonesia
(2001-2008) and the Deputy Assistant
Minister of Population and Environment and
Population/FP from 1991-2000. He is
currently working for Indonesia’s FP2020
working group on Data and Monitoring
Evaluation (a leader on Performance
Monitoring Accountability for PMA2020).
His research and publications are mainly in
area of population health, especially in family
planning and reproductive health issues.
2. Field Manager & Researcher: Anggriyani
Wahyu Pinandari, SKM., MPH
Anggriyani Wahyu Pinandari is a
researcher at the Center for Reproductive
Health (CRH), Faculty of Medicine, Public
Health and Nursing, Universitas Gadjah
Mada, Yogyakarta Indonesia. She studied
public health and received her Master of
Public Health degree from Gadjah Mada
University. During her masters she took
Maternal Child and Reproductive Health as
her major with concentration on family and
population health. She studied
comprehensive sexual and reproductive
health education at formal education and the
cohort effect on adolescent and young adult
premarital sexual intercourse using the data
collected through the nationally-
representative Indonesia Adolescent
Reproductive Health Survey. She is a former
lecturer at Universitas Lambung Mangkurat,
Kalimantan Selatan. She is currently working
for CRH and was involved in several
projects under Global Commitment FP2020
(PMA2020 and Track20), Landscaping
Adolescent Reproductive Study, and
Adolescent Mental Health Survey. Her
research and publications are mainly in area
of population health, especially in family
planning and reproductive health issues.
3. Researcher: Agung Nugroho, MPH
Agung Nugroho is researcher at the
Center for Reproductive Health (CRH),
Faculty of Medicine, Public Health and
Nursing The Universitas Gadjah Mada,
Yogyakarta, Indonesia. He is a nutritionist
and finished his master on Epidemiology and
Public Health in 2001 from Umea University
Sweden. He is involved in various
quantitative and qualitative research projects
conducted by CRH. Together with the CRH
team, he became a consultant to draft a
district-level legislation on HIV prevention
for Magelang district, Central Java (2017). He
also teaches research methodology,
epidemiology and biostatistics for graduate
and master students. He is currently
pursuing his doctoral degree at UCD Dublin,
starting in 2017.
4. Researcher and Data Analyst: dr. Ifta
Choiriyyah, MSPH., PhD
Ifta Choiriyyah is a researcher for
GEAS in Indonesia and obtained her PhD
from John Hopkins University. She has a
medical degree from Universitas Gadjah
Mada (UGM) School of Medicine
in Indonesia and a Master of Science in
Public Health from the Johns Hopkins
Bloomberg School of Public health. Before

GEAS-Indonesia Baseline Report | 2019
102
coming to Baltimore for her doctoral
degree, she worked as a lecturer at
Department of Biostatistics, Epidemiology
and Population Health, Faculty of Medicine,
UGM and research assistant at the Center
for Reproductive Health. She provides
support for instrument adaptation, data
management and analysis for GEAS in
Indonesia.
5. Researcher: Grhasta Dian P, MKes
Grhasta Dian Perestroika became a
lecturer in a midwivery diploma program
(D3 Kebidanan) at the General Achmad Yani
University (UNJAYA) from 2014 to 2016
after earning a Masters degree in health from
the Epidemiology Study Program, Applied
Health Science Concentration at the UNDIP
Postgraduate School. The subjects she has
taught include: Midwifery Concepts,
Communication and Counseling, Midwifery
Care for Postpartum Period. Currently she
is pursuing her doctoral degree in the
Doctorate Program, FK-KMK UGM with an
interest on adolescent reproductive health.
During her doctoral study, she has been
involved in GEAS, with the supervision from
her promotor.
6. Data Manager: Althaf Setiawan, MPH
Althaf Setyawan is GEAS Indonesia
data manager, who is responsible in
managing all incoming data, maintaining the
survey databases and performing routine
maintenance as needed to ensure high data
integrity. He is also a biostatistician at the
Center for Reproductive Health (CRH),
Universitas Gadjah Mada, responsible for
statisitical data analysis. He is also an
epidemiologist by training and earned his
MPH on Field Epidemiology from Universitas
Gadjah Mada. He is also very experienced in
computer programming for data
management, data analysis, development and
design of research. He has consulted various
research project and many students on
biostatistics and epidemiology methods. He
is currently learning the machine algorithms,
techniques and tools that are capable of
handling, managing and analyzing Big Data.
7. Field Research Team:
a. Bandar Lampung
Field Coordinator: DR. Sindung Hartanto
Sindung Haryanto was born in
Temanggung, Central Java, July 23, 1964. In
1987 he graduated cum laude from the
Faculty of Sociology, UGM. Since 1988 he
has devoted himself as a lecturer at the
University of Lampung. In 1991-1995, he
pursued his master degree in sociology at
UGM. In addition to teaching, he is also
active in several non-governmental
organizations (NGOs) in Bandar Lampung as
researcher and program coordinator. He has
written several books, the titles are: Land of
Lampung; Farmer Struggle and Movement,
Economic Sociology, Spectrum of Social
Theory: from classical to postmodern,
World Symbol of Javanese, Edelweiss van
Jogja, Religious Sociology, and
Transformation of Masculinity. He is writing
actively in several national and international
scientific journals. He also graduated cum
laude from the Doctoral Program in Social
Sciences Study Program at Airlangga
University, in 2012.
Young Researcher:
1) Ines Sherly Zahrina, S.Tr.AK
Ines Sherly Zahrina was born and
raised in Bandar Lampung. She completed
her undergraduate degree in health analyst
program at the Tanjungkarang Polytechnic in
2017 as the best graduate. During her study,
she was a teaching assistant of a course on
health research. Ines realized that she has a
lot of interests in health, women and social
issues that she joins several social
communities that focus on various issues as
administrators and facilitators, such as Janis
(Social Innovation Path) which focuses on

GEAS-Indonesia Baseline Report | 2019
103
social and environmental issues;
Empowomen which is directly supported by
the Australian Grand Scheme to empower
Lampungnese women; and IMATELKI which
is the Association of Students of medical
laboratory technology program. In addition,
Ines is also a medical volunteer of the
National Gas Company and Zakat House
which focuses on improving the health status
of people in disadvantaged areas (2016-
present). In 2017 she joined as a volunteer in
Indonesian Family Planning Association
(PKBI) Lampung’s program addressing
reproductive health and child protection in
the. This activity introduced her to the
Explore 4Action research program, and she
was selected as a young researcher for the
Bandar Lampung region.
2) Rizkia Meutia Putri, SP
Rizkia Meutia Putri, was born in
Bandar Lampung. She completed her
undergraduate degree at the Department of
Agrotechnology, Faculty of Agriculture,
University of Lampung (2013-2017). In 2015,
she was elected as the faculty ambassador
and carried out activities that were directly
involved with the community. Her busy life
during college did not dampen her high
interest in social activities. She also joined
many on-campus and off-campus
organizations and communities. The Path of
Social Innovation (Janis) is one of the
organization she was involved in that fulfilled
her passion for children and society’s issues.
She was invited as a young speaker at the
"Voices and Actions of Young People"
(2017) organized by Save the Children about
the Sustainable Development Goals. In
addition, she was a facilitator of the
Empowomen social project (2017-2018)
which has the full support of the Alumni
Grant Scheme (Australian Embassy) which
focuses on increasing the capacity of women
in Lampung. Previously, she was facilitator
for North Lampung district (2018) for
"Integration Strategy for the Sustainable
Development Goals Program (TPB) to the
Region" by the United Nation Development
Program (UNDP). She is currently a young
researcher for the Explore 4 Action (E4A)
program since June 2018 for Bandar
Lampung region.
Enumerator:
1) M. Eriyansa Perdana Putra
2) Maria Finka Rena Avrelia
3) Fakhmi Umar
4) Ika Khodijah
5) Debby Agsari
6) Shinta Wahyuningtias
b. Denpasar
Field Coordinator: I Gusti Agung Agus Mahendra,
SKM., MPH
I Gusti Agung Agus Mahendra was
born in Bali. Since 2009, he has been actively
volunteering at KISARA (Kita Sayang
Remaja) which is a youth center managed by
the Indonesian Family Planning Association
(PKBI) Bali. In 2010, he was selected as a
youth staff to be in charge of research and
empowerment, then in 2011 was selected as
the KISARA coordinator. In addition, in the
same year he was selected as the "I am
young with Choices" Project Manager, a
project that implements comprehensive
sexual education in schools, aims to increase
visit to youth-friendly health service, and
increase the awareness of program and
policy makers on reproductive health issues
and teen sexuality. I Gusti Agung Agus
Mahendra completed his undergraduate
degree in public health at Udayana University
in 2012, then obtained his master degree in
public health at Gadjah Mada University in
2017, majoring in Maternal and Child Health
- Reproductive Health. Upon graduation, he
joined the Center of Public Health
Innovation (CPHI) at the Faculty of Medicine,
Udayana University as a research staff. In
2018 he joined the Explore4Action project

GEAS-Indonesia Baseline Report | 2019
104
research team, as the coordinator of the
Denpasar area researchers. In addition, I
Gusti Agung Agus Mahendra is also a
lecturer in the Public Health, Technology
and Science Study Program at Dhyana Pura
University, Bali. His recent organizational
activities include: member of the Association
of the Public Health Educators, chair of the
research division of PKBI Bali.
Young Researcher:
1) Iwan Abdi Suandana, SKM
Iwan Abdi Suandana graduated from
Public Health undergraduate degree
program, Faculty of Medicine, Udayana
University and currently is a young
researcher in the Explore 4 Action program
for Denpasar region. Before joining the
Explore 4 Action program, he was a
research assistant in a research project
organized by the Department of Community
Medicine and Disease Prevention (IKK-IKP)
Faculty of Medicine, Udayana University and
Center for Public Health Innovation (CPHI)
Faculty of Medicine, Udayana University in
2018. In addition, he was also a volunteer in
KISARA PKBI Bali on reproductive health,
sexuality and HIV / AIDS.
2) Putri Septyaning Rahayu Ariesta
S.Sosio., M.Sosio
Putri Septyaning Rahayu Ariesta was
born in Surabaya. Septy obtained her
undergraduate degree at the Sociology study
program (2010-2015) and master degree at
Airlangga University. Sociology is the
opening door for Septy to dig deeper into
people's lives through conducting research
or doing community services. She also has
special interest on gender issues. She has
been involved in a number of social research,
including a research project conducted in
collaboration between the provincial
government and several agencies in East Java
Province (2012-2017); a research for
Ministry of Research, Technology and Higher
Education (2015-2018) and the Ministry of
Women's Empowerment and Child
Protection (2016). She is currently research
assistant at the Center for Gender and
Child-LPI Studies at Airlangga University
(2015-present), member of the PUSPA
Forum for research and women of the East
Java Provincial Office of Women's
Empowerment and Child Protection, and
young researcher for the Explore 4Action
(E4A) program since June 2018 for the
Denpasar City area.
Enumerator:
1) Ni Kadek Wiwik Dwipayanti
2) Ni Putu Yunika Gamayanti
3) I Putu Agus Purnama Wirawan
4) Made Adhyatma Prawira Natha
Kusuma
5) Ni Putu Sri Widhi Andayani
6) Ni Made Padma Batiari
c. Semarang
Field Coordinator: Solia Mince Muzir, S.Sos
Solia Mince Muzir is a Minangnese
woman migrated to Yogyakarta to do her
undergraduate study in the Department of
Sociology of Religion, Yogyakarta State
Islamic University in 2004. Since college, she
has actively participated in training, seminars
and workshops related to gender and
reproductive health issues. Since her
introduction to PKBI DIY in 2009, she has
begun to focus on the research and
services/assistance on reproductive health
for young people. She joined the Explore for
Action program as research coordinator for
the Semarang Region in Central Java.
Previously, she was a facilitator for
reproductive health education program for
female domestic workers in the Tjoet Njak
Dien Grass Institute. She was also involved
in humanitarian work in conducting studies
on the fulfillment of reproductive health
rights of victims of disasters by joining the
Gender Working Group of Yogyakarta.
GEAS-Indonesia Baseline Report | 2019
105
Being a R&D staff at the Center for
Advocacy for Women, Children and
Disabilities, she focuses on conducting
research on reproductive health for persons
with disabilities. Her work on reproductive
health and sexuality that has been published
is "Lost Weed; Teenage Short Story in
Different and Colored","Adolescent Sexual
and Reproductive Health Education with
disabilities; Parental Guidance and Child
Assistance with Disabilities.
Young Researcher:
1. Lina Agnesia, S.Sos
Lina Agnesia, is a graduate of the
Anthropology Study Program (2012-2016),
Faculty of Cultural Sciences, Brawijaya
University, Malang, Indonesia in 2016. Lina
has an interest in the social field, especially
on religious and gender issues. Through
anthropology, Lina explores qualitative
research using ethnographic approaches and
life history. Anthropology has led Lina to
devote herself to research, especially social
research. Since 2013-2016, Lina has been
involved as a surveyor and observer in
political activities with the MNC Group. In
2016, Lina was involved as a researcher from
the Indonesian Human Service Foundation
(IIM). In 2017, Lina was involved in several
studies in Faculty of Cultural Sciences and
Institute for Research and Community
Service (LPPM) Universitas Brawijaya,
Airlangga University and Bogor Agricultural
Institute, and UNICEF CRBP. Lina also
served as an administrative apprentice staff
in the Anthropology Study Program from
2016-2017. At present, Lina is part of the
Explore 4 Action program as a young
researcher in the Semarang area. By raising
the issue of reproductive health and
sexuality in adolescents and youth, the
Explore 4 Action program makes Lina
increasingly interested in exploring the issue,
and sees the phenomenon from a social,
religious and gender perspective. She is
currently a young researcher for the Explore
4 Action (E4A) program since June 2018 for
the Semarang City area.
2. Putri Indah Novitasari, SKM
Putri Indah Novitasari, a young person
who has been concerned in the world of
reproductive health and teen sexuality for
the past 5 years. She graduated from the
undergraduate Public Health program at
Muhammadyah University Semarang
(UNIMUS) in 2017. Between February 2014-
October 2017 she volunteered at PKBI
Central Java for the PILAR teenage program
(Youth Information and Service Center). She
was a research assistant in several research
projects on Comprehensive Sexual
Education (CSE), Comprehensive Sexual
Services (CSS), Child Marriage and Maternal
and Child Health (MCH) in several
institutions such as the UI Gender and
Sexuality Study Center, the Women
Research Institute, Rutgers WPF Indonesia
and ASEAN Regional UNFPA. She is
currently a young researcher for the Explore
4 Action (E4A) program since June 2018 for
the Semarang City area. The existence of
young researchers is an important value in
this study in voicing the voices of young
children.
Enumerator:
1) Siti Muflikhatur Rosyada
2) Ikha Solikha
3) Fiky Nurmawati Sutikno Putri
4) Nesya Saricha
5) Izza Kumalasari
6) Dwi Ernawati
GEAS-Indonesia Baseline Report | 2019
106
References
Allen, J. P., Schad, M. M., Oudekerk, B. &
Chango, J. (2014) What ever
happened to the "cool" kids? Long-
term sequelae of early adolescent
pseudomature behavior. Child Dev,
85(5): 1866-80.
BANSM (2017) Perangkat Akreditasi SMP-
MTs Tahun 2017. Jakarta: Badan
Akreditasi Nasional
Sekolah/Madrasah.
Barbalat, G., Domenech, P., Vernet, M. &
Fourneret, P. (2010) Risk-taking in
adolescence: A neuroeconomics
approach. Encephale, 36(2): 147-54.
Basu, S., Zuo, X., Lou, C., Acharya, R. &
Lundgren, R. (2017) Learning to Be
Gendered: Gender Socialization in
Early Adolescence Among Urban
Poor in Delhi, India, and Shanghai,
China. Journal of Adolescent Health,
61(4, Supplement): S24-S29.
Bearinger, L. H., Sieving, R. E., Ferguson, J. &
Sharma, V. (2007) Global
perspectives on the sexual and
reproductive health of adolescents:
patterns, prevention, and potential.
Lancet, 369(9568): 1220-1231.
Blackstone, A. (2003) Gender Roles and
Society. Human Ecology: An
Encyclopedia of Children, Families,
Communities, and Environments. Santa
Barbara, CA.
Blum, R. (2002) Mothers’ Influence on Teen
Sex: Connections That Promote Sexual
Intercourse. , Minneapolis, MN:Center
for Adolescent Health and
Development, University of
Minnesota.
Blum, R. W., Astone, N. M., Decker, M. R. &
Mouli, V. C. (2015) A conceptual
framework for early adolescence: a
platform for research. Int J Adolesc
Med Health, 26(3): 321-31.
Blum, R. W., Mmari, K. & Moreau, C. (2017)
It Begins at 10: How Gender
Expectations Shape Early
Adolescence Around the World.
Journal of Adolescent Health, 61(4,
Supplement): S3-S4.
BSNP (2019) Standar Sarana dan Prasarana
Fasilitas Pendidikan [Online]. Badan
Standar Nasional Pendidikan.
[Accessed 23 Januari 2019 2019].
Centers for Disease Control and Prevention
(2002) Trends in sexual risk
behaviors among high school
students—United States, 1991–
2001. Morb Mortal Wkly Rep,
51(38):856-9.
Collins, A. W. (2003) More than myth: The
developmental significance of
romantic relationships during
adolescence. Journal of Research on
Adolescence 13(1): 1-24.
CRH (2017) Studi Kualitatif Kesehatan
Reproduksi Remaja di Indonesia:
Program, Kebutuhan dan Strategi
Pemenuhan Akses Layanan bagi
Remaja Belum Menikah. Daerah
Istimewa Yogyakarta: Pusat
Kesehatan Reproduksi FKKMK
UGM.
Del Giudice, M., Angeleri, R. & Manera, V.
(2009) The juvenile transition: A
developmental switch point in
human life history. Developmental
Review, 29(1): 1-31.
Dukes, R., A Stein, J. & I Zane, J. (2010)
Gender differences in the relative
impact of physical and relational
bullying on adolescent injury and
weapon carrying.
Gladden, R. M., Vivolo-Kantor, A. M.,
Hamburger, M. E. & Lumpkin, C. D.
(2014) Bullying Surveillance Among
Youths: Uniform Definitions for Public
Health and Recommended Data
GEAS-Indonesia Baseline Report | 2019
107
Elements, Version 1.0 Atlanta, GA
National Center for Injury
Prevention and Control, Centers for
Disease Control and Prevention and
U.S. Department of Education.
Granger, E., Williams, G., Di Nardo, F.,
Harrison, A. & Verma, A. (2017) The
relationship between physical activity
and self-rated health status in
European adolescents: Results of the
EURO-URHIS 2 survey. Eur J Public
Health, 27(suppl_2): 107-111.
Hallfors, D., Waller, M. & Bauer DJ, e. a.
(2005) Which comes first in
adolescence-sex and drugs or
depression? . Am J Prev Med 29:163–
70.
Hill J.P., L. M. E. (1983) The Intensification of
Gender-Related Role Expectations
during Early Adolescence. Boston,
MA: Springer.
Igras SM, Macieira M, Murphy E & R, L.
(2014) Investing in very young
adolescents' sexual and reproductive
health. Global public health, 9555-569.
IWHC (2010) Young adolescents’ sexual and
reproductive health and rights:
South and Southeast Asia.
Jatmiko, Y. A. & Agustin, T. (2015) Proyeksi
Penduduk Kabupaten/Kota Provinsi
Jawa Tengah, Jakarta:Badan Pusat
Statistik
UNFPA.
Kaestle, C., Halpern, C., Miller , W. & Ford,
C. (2005) Young age at first sexual
intercourse and sexually transmitted
infections in adolescents and young
adults. Am J Epidemiol . 161:774–80.
Lachytova, M., Katreniakova, Z., Mikula, P.,
Jendrichovsky, M. & Nagyova, I.
(2017) Associations between self-
rated health, mental health problems
and physical inactivity among urban
adolescents. Eur J Public Health,
27(6): 984-989.
McCarthy, K., Brady, M. & Hallman, K.
(2016) Investing when it counts:
Reviewing the evidence and charting
a course of research and action for
very young adolescents.
Niccolai, L., Ethier, K. & Kershaw, T., et al.
(2004) New sex partner acquisition
and sexually transmitted disease risk
among adolescent females. J Adolesc
Health 34:216–23.
Parkes, A., Wight, D., Henderson, M. &
West, P. (2010) Does early sexual
debut reduce teenagers'
participation in tertiary education?
Evidence from the SHARE
longitudinal study. J Adolesc Health,
33(5): 741-754.
Permendiknas (2007) Standar Sarana dan
Prasarana Untuk SD/MI, SMP/MTs,
dan SMA/MA. Jakarta: Kementerian
Pendidikan Nasional.
Santelli, J., Brener, N. & Lowry R, e. a. (1998)
Multiple sexual partners among U.S.
adolescents and young adults. Fam
Plann Perspect 30:271–5.
Sawyer, S. M., Afifi, R. A., Bearinger, L. H.,
Blakemore, S. J., Dick, B., Ezeh, A. C.
& Patton, G. C. (2012) Adolescence:
a foundation for future health.
Lancet, 379(9826): 1630-40.
Seiffge-Krenke, I. (2003) Testing theories of
romantic development from
adolescence to young adulthood:
Evidence of a developmental
sequence. International Journal of
Behavioral Development, 27(6): 519-
531.
Semarang, B. K. (2018a) Angka Partisipasi
Kasar dan Angka Partisipasi Murni
Kota Semarang [Online]. Available:
https://semarangkota.bps.go.id/subjec
t/28/pendidikan.html#subjekViewTab
3 [Accessed 28 Desember 2018].
Semarang, B. P. S. K. (2017) Indeks
Pembangunan Manusia Kota
Semarang 2017.

GEAS-Indonesia Baseline Report | 2019
108
Semarang, D. K. K. (2018b) Profil Kesehatan
Kota Semarang Tahun 2017.
Simons, L., Sutton, T., Shannon, S., Berg, M.
& X Gibbons, F. (2017) The Cost of
Being Cool: How Adolescent
Pseudomature Behavior Maps onto
Adult Adjustment.
Young, J. T. (2014) "Role magnets"? An
empirical investigation of popularity
trajectories for life-course persistent
individuals during adolescence. J
Youth Adolesc, 43(1): 104-15.

GEAS-Indonesia Baseline Report | 2019
109