Butwal Baseline Report 25Sep 2012
31
World Vision International Nepal Butwal Area Development Programme Baseline Measurement Report August 2012 Contents 0. General Programme Information.....................................3 1. Background Information:...........................................3 2. Purpose of the Baseline...........................................4 3. Methodology and Process:..........................................4 4. Profile of Survey Respondents (ADP baseline)......................6 5. Findings according to the indicators..............................7 5.2.1. Programme:...................................................7 5.2.2. Livelihood Project..........................................8 5.2.3. Education Project..........................................11 5.2.4. WASH Project...............................................13 5.2.5. MCHN Project...............................................15 5.2.6. Sponsorship Project........................................18 6. Recommendation................................................... 20 6.1. Programme:....................................................20 6. 2. Livelihood Project..........................................20 6.3. Education Project............................................20 6.4. WASH Project.................................................20 6.5. MCHN Project.................................................21 6.6. Sponsorship Project..........................................21 7. Attachment....................................................... 21
-
Upload
independent -
Category
Documents
-
view
8 -
download
0
Transcript of Butwal Baseline Report 25Sep 2012

World Vision International NepalButwal Area Development Programme
Baseline Measurement ReportAugust 2012
Contents0. General Programme Information.....................................31. Background Information:...........................................32. Purpose of the Baseline...........................................43. Methodology and Process:..........................................44. Profile of Survey Respondents (ADP baseline)......................65. Findings according to the indicators..............................75.2.1. Programme:...................................................75.2.2. Livelihood Project..........................................85.2.3. Education Project..........................................115.2.4. WASH Project...............................................135.2.5. MCHN Project...............................................155.2.6. Sponsorship Project........................................18
6. Recommendation...................................................206.1. Programme:....................................................206. 2. Livelihood Project..........................................206.3. Education Project............................................206.4. WASH Project.................................................206.5. MCHN Project.................................................216.6. Sponsorship Project..........................................21
7. Attachment.......................................................21

List of AcronymsADP Area Development ProgrammeCBO Community Based OrganizationCWBO/I Child Well Being Outcome/IndicatorDDC District Development CommitteeDEO District Education OfficeDME Design, Monitoring and EvaluationDPHO District Public Health OfficeDWSSDO Department of Water Supply & Sanitation, District OfficeECDC Early Childhood Development CentreFCHV Female Community Health VolunteerFGD Focus Group DiscussionI/NGO International/ Non Government OrganizationITT Indicator Tracking tableMC Management CommitteeNO National OfficeNOD No Open DefecationODF Open Defecation Free (which is also called NOD)PNC Post Natal careRC Registered ChildrenRC/P Resource Centre/Person (an unit under DEO)S/HP Sub/Health PostSIP School Improvement PlanSMC School management CommitteeSMP Sponsorship Management Project SSRP School Sector Reformation PlanToR Terms of ReferencesW/UC/UG Water/Users Committee/Users GroupsVDC Village Development CommitteeWASH Water, Sanitation and HygieneWHO World Health OrganizationWV/IN World Vision/International Nepal


0. General Programme InformationNational Office Name World Vision International NepalProgramme Name Butwal Area Development ProgrammeProgramme Number 0188Programme Location 8 VDCs in Rupandehi district namely Makrahar,
Gangoliya, Manmateriya, Pa.Amawa, Kha.Bangai,Harnaiya, Mainahiya and Manpakadi
Programme Goal Programme interventions contribute to ensure andsustain the holistic development of children in the families and communities.
Programme Outcomes:Livelihood
Household livelihood of marginalized and poor families in the communities is improved and sustainable
Education Girls and boys of programme impact area have access to quality education
Maternal Child Health &Nutrition
To improve the health of children under five andtheir mothers.
Water Sanitation andHygiene
Sponsorship Management
To prevent incidents of water born diseases.Sponsorship operations contribute to the transformation of RCs, their families, communities and sponsors, and do not create negative issues in communities.
Programme Area Population
63,502
Target Population 36,564Estimated Programme PhasePeriod
5 years – Oct 2011 to September 2016
Programme Phase transitionProgramme Phase Budget USD 20,75,300Anticipated FundingSources Source 1
WV Canada Sponsorship Funding
Registered Children Numbers
2500 per year
Baseline Lead Dhruba Raj Ghimire, DME Manager, [email protected]
Support Office Name World Vision CanadaTravel Information (FromNational Office)
ADP Office can be reached from Kathmandu both byair and vehicle. More than two airlines providing their frequent services to Bhairahawa,from where it takes 30 minutes drive to reach toButwal ADP Office. By road, 6 hours drive from Kathmandu to Butwal.

1. Background Information:
Butwal ADP started in Rupandehi district in FY02. Rupandehi is situated insouth west part of Nepal. With the altitude ranging from 100 meter (in theplain) to 1,229 meter (in hill) from the sea level, more than 95% of the areafalls in the plain region, which is called Terai region. With tropicalclimate, the temperature varies from minimum 8.75 degree C to maximum 42.4degree C.
The district has 79 VDCs and 2 Municipalities. Out of this, programme impactarea covers 8 VDCs. There are Registered Children in all VDCs exceptManpakadi. Each of the programme VDCs can be reached within an hour fromButwal by vehicle. Brahmin Chhetries (21%), Tharu (10.57%), Molsem (8.87%),Magar (8.78% , Yadav (7.69%), Tamang, Gurung, Limbu, Sarki, Chamar, Harijan,Kurmi, Dhanup, Dusad, Pasi, Paswan, Sunar, Kalwar, Gharti, Bhujel, Nai,Rajbansi, Surdhi, Tattma, Dhobi, Nuniya, Haluwai, Kayestha, Jhagad, Kunwar,Lodh, Dhami, Bhote are the main ethnic groups in Rupandehi. The largestnumber of people in Rupandehi is Hindus, followed by Buddhists, Moslems andChristians respectively. There are more than 12 churches in Butwal itself andthere are churches in every VDCs..
The methodology of Integrated Programming Model, now called DevelopmentProgramme Approach, was adopted for the 5 years redesign. The programme has 5projects viz. 1) Education, 2) Livelihood, 3) Maternal Child Health &Nutrition (MCHN), 4) Water Sanitation & Hygine and 5) Sponsorship.
Baseline of Butwal ADP was done in two part:
1) Evaluation of Butwal Nutrition Project cum Baseline of Maternal ChildHealth and Nutrition ProjectThe former project is a NSFP, which closed in FY11. The later is one of theprojects funded with sponsorship. Given that there were some commonindicators between these projects, survey including anthropometricmeasurement was done jointly for these two projects.
2) Baseline of 4 projects and programme:Baseline measurement that included Household Survey, Child Survey, FocusGroup Discussions, collecting facts and figures from the partners was done tocarry out the baseline.
2. Purpose of the Baseline
The main purpose of the baseline is to measure a starting point from which tojudge change over time for programmes and the projects associated. According

to LEAP 2.0 requirement, baseline values for all indicators in programme and project design documents must be established within the first year of implementation for long-term programmes. The objectives are to: establish the baseline values on the indicators especially of programme
goal and project goals & outcomes in order to prepare a base forevaluation and on-going monitoring.
finalize the project designs by setting target values for the indicatorsand make any necessary adjustment in the designs documents based onbaseline findings.
3. Methodology and Process:
Programme M&E plan was the basis for developing the methodology. The baselineincluded both quantitative and qualitative approaches considering thesignificance of the indicator, cost effectiveness in measuring and usefulnessfor on-going monitoring. In determining sample size, high degree of accuracy(i.e. 95% confidence level) was considered. For both MCHN and ADP baselinesurveys, mobile phone technology based on episurveyor, an internet basedsoftware, was used for on the spot data recording.
MCHN:MCHN baseline was done using systematic random sampling technique. The listof mothers a) who had children 0-24 months and b) 24-69 months was preparedby the NGO partners for the entire PIA. From these list, the desired numberof samples i.e. 600 for each category was taken. This makes altogether 1200HHs/ respondents.
ADP Baseline excluding MCHN:The ADP baseline methodology includes : 1) Household Survey, 2) FGD includingspecial study in the poorest clusters, 3) Child Survey, 4) Facts and Figuresfrom local partners called Partners' Profile. Please refer to the attachment#9 entitled "Summary of methodology- Butwal".
A 30 cluster survey with 720 sample size was applied for the second baseline,which includes additional 10% as buffer for any inconsistent data. Samplesize calculation sheet is being attached for 4 projects and programmebaseline. Please refer to the attachment#10 entitled "Sample SizeCalculation-Butwal".
The following key steps were taken to measure the baselines.
Baseline measurement process:SN Key Steps Locat
ionWorkdays
Led by Supported by

1 Basic preparation for MCHN/ BNPsurvey: Preparing mobile phone sets for data
recording, questionnaire with supportfrom Barabara Mein of WVC and WVIN ITManager.
Collecting HH data about mothers andu5/u2 children
Selection of the enumerators Communicating to the local
governmental authorities about thesurvey
NO &ADP
15 DMECoordinator, ADPManager
WVC(Barbara), ITManager,ADP team
2 6 Days Workshop with enumerators andADP for MCHN/BNP survey: Discussion on survey questionnaire,
minimizing bias, verifying,anthropometric measurement technique,
Field test, revision of questionnaire Orientation to use mobile phone for
data recording; householdinformation.
ADP 6 DME ADP
3 MCHN/BNP HH Survey To ensure proper survey, DME & ADP
Manager observed and provided feedbackto the enumerators; and the followingdays supervised by Survey Supervisors.
Consistency check and on-goingfeedback from ADP Manager and DMECoordinator based on the data comingto the website for necessary
PIA 13 Enumerators
Supervisors, DMECoordinator
4 Data analysis for MCHN/BNP NO 5 DMECoordinator
Barbara,Consultant
5 Basic Preparation for ADP baseline(Programme and 4 projects) ToR preparation and sharing with ADP Preparing questionnaire
NO 3 DMEManager(BaselineLead)
ADP
5 One day baseline orientation workshopwith ADP for 4 projects and programmebaseline Methodologies to be used for each of
the indicators, sample sizecalculation, sharing the questionnairefor necessary inputs
ADP 1 BaselineLead
ADP, DMECoordinator,
6 4 Days ADP Baseline workshop withEnumerators and ADP staff members Discussion about the survey
ADP 4 BaselineLead
ADP, DMECoordinator

questionnaire, practices, discussionon effective HH survey, minimizingbias
One day field test followed byreflection
Necessary revision on the questions,sampling procedure, survey plan
7 ADP Baseline HH Survey To ensure proper survey, Baseline
Lead/ DME observed and providedfeedback to the enumerators; and thefollowing days supervised by SurveySupervisors.
Consistency check and on-goingfeedback from DME based on the datacoming to the website for necessary
PIA 7 Enumerators
Supervisors, DME
8 Data analysis of ADP Baseline Survey NO 5 DME Consultant
9 Community Partners Profile Preparation Collecting information (facts and
figures) from community partners forbaseline and on-going monitoring(Schools, ECD Centres, Cooperatives ofthe programme area)
ADP 7 DCs,Volunteers
ADP Team
9 Basic preparation for qualitativemeasurement and child survey developing questions, selecting the
FGD facilitators
NO &ADP
3 BaselineLead, ADPManager
ADP
10 2 days workshop with FGD team and ADP Discussion on FGD question guide,
selecting the sample for longitudinalstudy, child survey questionnaire andsample selection, translation of thedocument
ADP 2 BaselineLead
ADP,BaselineLead
11 Carrying out FGD, child survey. The first day works were observed by ADPManager, DME and provided feedback to theFGD team
PIA 5 FGD Team DCs
12 Compilation & Collation BaselineLead
5
13 Findings sharing workshop with ADP indicator -wise sharing, associatedfactors, setting the targets, adjustmentin the programming
BaselineLead
2 BaselineLead
14 Report review and finalization 3 Baselinelead

4. Profile of Survey Respondents (ADP baseline)
VDC wise ethnic/caste composition of respondents is as follows:Table: Respondent HHs according to the category of ethnicity.VDC Ethnic/caste (Percentage)
BrahmanChhetri Thakuri
Sanyasi
Janjati Dalit Muslim Madhesi Adibasi
Khadga Bangain
8.3 22.2 19.4 0.0 20.8 29.2
Manpakadi 2.8 13.9 2.8 1.4 43.1 36.1Manmateriya 1.4 4.2 16.7 2.8 68.1 6.9Paschim Amawa
3.3 43.0 6.6 7.4 23.1 16.5
Harnaiya 6.3 14.6 10.4 2.1 10.4 56.3Mainahiya 4.2 6.9 22.2 12.5 30.6 23.6Gangoliya 5.6 2.8 8.3 2.8 34.7 45.8Makrahar 26.2 4.7 5.2 0.5 8.9 54.5Total 10.1 14.4 10.1 3.5 26.7 35.1
RC families: 26% of the respondents were RC families which is very similarto the ratio of RC and total families in the programme area. The figurebelow shows that RCs were more intentionally selected from backward castesuch as Dalit and Jannati.
Table: Respondent HHs on the basis of RC/ Non RC families according to the category of ethnicity.RC/ Non-RC Brahman Chhetri
Thakuri SanyasiJanjat
iDali
tMuslim Madhes
eAdibas
iRC 4.8 13.9 17.
13.7 26.7 33.7 100
Non-RC 12.0 14.6 7.7 3.4 26.6 35.6 100Overall 10.1 14.4 10.
13.5 26.7 35.1 100
(Ref: Table -HH.7 from attached" Butwal ADP Baseline HH Survey Analysis Table")
Based on the survey, 62.1% of HHs are involved in saving credit groups and59.2% are involved in cooperatives. Analyzing further, 76.8% are either inthe saving & credit groups or cooperatives; and 48.6% are in both.
The facts and figures collected from Cooperatives (refer to CommunityPartners' Profile) shows 10,538 of the community members are involved inthe cooperatives; which also indicate a good number. (Ref: Table -LL.1, LL.2)

According to government definition, families living on agriculture havingless than 10 Kattha of land are categorized as marginal farm families. In thePIA, 45% of HHs are marginal farmer in this definition. However, based on theWVIN assessment, HHs having below 5 Kattha were considered marginalizedfamilies. With this standard, thus 33.4% of HHs have below 5 Kattha of land.HHs whose main source of income is agriculture and their own land is below 5Kattha comes to be 30%. These can be considered marginalized farm families.The following table shows land ownership pattern.
Table: Status of own land size Land size (in Kattha) Percentage0-2 16.43-5 16.96-9 11.910-19 21.920 and above 32.8Total 100
(Ref: Table -LL.5)
5. Findings according to the indicators
5.2.1. Programme:
Goal IndicatorsProgramme interventions contribute to ensure and sustain the holistic development of children in the families and communities.
01. Social sustainability of community based organizations
02. % of families who are able to meet basic needs(food, shelter, education)
03. Families express the during the evaluation that quality of life of children in the families has improved
01. Social sustainability of community based organizations (Qualitative)
For the purpose of on-going monitoring, during the baseline measurement,various facts and figures on governance, performance and financial managementof 38 School Management Committees, 52 ECD Centres and 41 Cooperatives werecollected in the programme area. These are the community partners that WV hasbeen working with.
Schools: Taking 3 indicators (a) Preparation of SIP in the past year bySMC, (b) At least 6 meetings held, (c) At least one social audit held, 26out of 38 schools (67%) show an acceptable governance.

ECD Centres: Taking 3 indicators (a) Preparation of ECD plan, (b) At least6 meetings held per year, (c) At least one social audit done, 30 ECDcentres out of 52 (61%) show an acceptable governance.
Cooperatives: Taking 3 indicators (a) Having annual general assembly (b)At least 2/3rd attending general assembly, (c) Having 2 or more writtenpolicies, 31 out of 41 (75%) show an acceptable governance.
(Ref : attachment#3 entitled " Partners' Profile data-Butwal ADP")
02. % of families who are able to meet basic needs (food, shelter, education)(Value: 63.9%)(Operational indicator: % of HHs with children who (a) had food security in the past 12 months with theirregular source of income, (b) have their shelter not temporary or kacchi (c) provided 3 or more pairs of clothes to their children under 18 years. ) 63.9% (95% CI: 60.4%-67.4%) of HHs with children were found to be able to
meet the basis needs based on the parameters cited in the operational indicator. (Ref Table HH.16)
This means 36.1% are not able to meet the basic need. When compared with the district data on % people below poverty line, the situation appears similar since 33% of district population is poor, based on Rupandehi DDC profile 2009.
03. Families express the during the evaluation that quality of life of children in the families has improved(will be measured only in the evaluation)
5.2.2. Livelihood Project
Goal and Outcomes IndicatorsGoal Household livelihood
of marginalized and poor families in the communities is improved and sustainable
Oa. % families with increased annual income from agriculture
Ob. % increase in food security month Oc. % households who have adopted adaptivecoping strategy to overcome a shock in thelast twelve months.
Outcome1
Farming practices of the marginalized families is improved to increase agro-production.
1a. Improved production and productivity of land
1b. % farmers who express they changed 1 or more farming techniques for better production
Outcome2
Livestock produces ofthe marginalized families is
2a. % families with increased number and value of livestock

increased. Outcome3
Business capacity ofcooperatives and income generation groups is improved
3a. Increase trend of fund mobilization ofthe cooperatives
3b. # Cooperatives who have adequately included marginal families in the membership
Oa. % families with increased annual income from agriculture (value: 17.7%)(Operational indicator: % of HHs who produced vegetable worth more than Rs. 20,000 per year)
In terms of the first main source of income, agriculture is for 71% of HHs; similarly foreign employment (remittance) is for 9.6% HHs in the PIA, based on the survey. But based on the special study done in the sample 4 poorest clusters, 3/4th of HHs live on agriculture and 1/6th HHs on livestock. ADP is putting focus on the poorest clusters.
Based on the survey, only 0.4% have Livestock / poultry as the first-most source of income. (Ref: Table LL.8)
Survey shows 17.7% of HHs produced vegetable worth more than Rs 20,000 peryear. This is compared with the facts that 16.6% of HHs indicate they soldthe vegetables (Ref: Table LL.13, LL.14).
Based on the survey, 43.5% produced very little vegetable worth Rs 0- Rs 5,000. (Ref: Table LL.11 ). But based on FGD (special study) in poorest clusters, an selling of vegetable shares about half of the total agricultural and livestock sale. This indicates scope of promotion of vegetable production for the poor families.
Table LL.12 reveals that the production level is based on the land size (as Chi square value =15.68, p value =0.000)
The above table reveals that the production level is based on the land size (as Chi square value =15.68, p value =0.000)
Below 50005001-10000
10001-2000020001-30000
Above 30000
0%
50%
100%
Area of land and vegetable production
0- 2 kattha 2-5 Kattha 6-9 Katha10-19 Kattha Above 20 Kattha

Ob. % increase in food security month (value: 85.4%)(Operational indicator: % of HHs who had food security for 12 or more months from their regular sourceof income ) 85.4% of HH (95% CI. 82.6%- 88.2%) had food security for 12 or more month
from their regular source of income in the past year. (Ref Table 38.1) Based on the special study in the 4 poorest clusters, about 3/5th of the
HHs had food insecurity in the past year. This verifies the assumption that the majority of the food insecure HHs live in the poorest clusters identified by the ADP.
Based on the survey, there is a positive relation between food security and size of land of the HHs who live on agriculture (Ref Table LL.29, 30),with Chi square value 52.368.
Oc. % households who have adopted adaptive coping strategy to overcome a shock in the last twelve months. (value: 56.1%)(Operational indicator: % of HHs who had food crisis in the past 12 months adopted positive coping mechanism, to deal with the food crisis, such as care givers working more hours than normal; obtainingloan from institutions, selling of livestock more than usual, selling of non-productive assets).
Based on survey, 15% HHs reported that they had some months of food crisisin the past year from the regular source of income. However, 56.1% (95% CI: 46.6%-65.6%) adopted positive(adaptive) coping mechanism and the rest adopted the negative mechanism.
The positive coping mechanism includes care givers working longer hours and borrowing money from institutional money lenders. Working longer hourshas been reported by 50% HHs which means daily work is available in the PIA. (Ref Table LL.27, LL.28).
The one who adopted negative coping mechanism (i.e. 43.9%) mainly includedborrowing money from relatives and friends (17.9%), taking lower quality food (11.3%) and going out to seek job (10.4%).
1a. Improved production and productivity of land (Qualitative)(Operational Indicator: Production of Cereal, Vegetables Oil Crops per unit area of land in the poorest clusters)
Special study through FGD with 4 poorest clusters was done to figure out the production and productivity of land, the comparison will be possible in the future studies in the same area. Families in the poorest clusters cultivate average 22 Kathha of land (6%
sukumbasi which means squattered, 67% registered land, 27% tenancy land). In average, each 22 Kattha (7450 sqmt) produced: Paddy 15 Qtl, Wheat 9
Qtl, Pulse 0.3 Qtl, Oil crop 0.4 Qtl, Potato 0.9 Qtl, Totato 1.8 Qtl,

Spices 0.1 Qtl, Other vegetable 7.2 Qtl in the past year. (Appendix: Poorest Cluster FGD)
1b. % farmers who express they changed 1 or more farming techniques for better production (Value: 38.3%)(Operational indicator: % of HHs did any of the following for better production in the past 12 months: a)off-seasonal farming, b) cultivate 3 or more crops per year and (c) carry out organic farming.
Based on the survey, only 7.1% HHs did the off-season farming. It was alsofound that 22.4% HHs cultivated 3 or more crops per year, 14% did organic manure.
The proportion of HHs adopt any of these is 38.3% (95% CI: 34.7%-41.8%). (Table LL.20)
Based on the special study in the poorest clusters, 1/5th HHs do organic farming and 1/20th did the soil test. About 2/5th of the arable land in the poorest cluster does not have year round irrigation facility.
2a. % families with increased number and value of livestock (value: 51%)(Operational indicator: % of HHs who kept livestock amounting more than Rs. 20,000)
Based on survey, 5.4% of HH's main source of income is livestock. (Table 37).
32.9% HHs sold livestcok produce in the past 12 months. Among the total HHs, 12.7% keep livestock for purely commercial purpose.
51% HHs kept the livestock amounting more than Rs, 20,000 (Table 49) Based on the special study in the poorest cluster, an average HH sells
livestock produce equal to Rs. 9,700 per year. Main source of income for 1/6th of the HHs in the poorest cluster is livestock. This shows, livestock is more feasible than vegetable farming for the HHs having less or no land for farming.
3a. Increase trend of fund mobilization of the cooperatives (Qualitative)
Based on the facts a and figures from 41 Cooperatives: 38 out of 41 Cooperatives were able to provide their record of saving. The
saving amount of the cooperatives varied from Rs 3,000 for new to Rs 16,032,364 of old and big ones (average: Rs, 1,964,542).
33 out of 41 Cooperatives were able to provide their record of loan disbursement. The cumulative amount of loan disbursement varied from Rs.33,000 to Rs. 33,000,000 (average: Rs 5,177,767) (Ref: Partners Profile).
The trend of fund mobilization will have to be assessed every year. It is advised to collect the information regarding the fund that is in investment

at present. This will give the ratio of TOTAL SAVING FUND: FUND IN INVESTMENT.
3b. # Cooperatives who have adequately included marginal families in the membership (value: 3)(Operational Indicator: # Cooperatives where members from marginal families count up more than 1/3rd of the total members)
Out of 396 members, 183 women members are in the Executive Board; which is46%. In these, 57 members are from the marginalized community in the Executive Board; which is 14%.
Out of 10,538 total members, there are 7,915 women members, which is 75%. Among the total; 2,195 members are from the marginalized community, which is 14%.
3 Cooperatives have been found to include more than 33% of marginal families in the cooperatives membership. (Partners Profile).
From the HH survey, 59.1% of HHs are involved in the cooperatives. The 62.1% of the HHs are in the saving credit groups.
With a further analysis, 76.8% are either involved in Cooperatives or saving credit groups; and 45.0% of HHs are involved in both Cooperatives and Saving Credit Groups. (Ref Table LL.1, LL.2)
5.2.3. Education Project
Goal and Outcomes IndicatorsGoal
Girls and boys of programme impact area have access toquality education
0a. % increase net enrollment rate of girls and boys in the basic level
0b. % children completed of basic level (class eight)
0c. % increase in the learning achievement ratings of the girls and boys
Outcome-1
Improved child friendly environment in basic education (class 1 to 8)
1a. % teachers using child friendly, inclusive teaching methods.
1b. # schools meeting minimun standards for child friendly teaching learning
Outcome-2
Improved girls learning environment in secondary and higher secondary level (class 9 to 12)
2a. % girls (and boys), whose attendance rate is at least 80% in class 9 & 12
2b. Proportion of girls and boys enrolled inclass 9 and 12
Improved quality of 3a. # ECD centres maintaining the ECD

Outcome-3
ECD centers standard 3b. % of children enrolled in ECD centres, pre-primary schools
Outcome-4
Children participate and areencouraged for leading towards good future
4a. % girls and boys who report that they take part in ECAs and community developmentprocess
0a. % increase net enrollment rate of girls and boys in the basic level
From the HH survey, enrolment of girls of age 5-18 in the school is 93.1% (95% CI: 91.2-95.0) and that of boys is 93.2% (95% CI : 91.4-95.0). This shows a good status and no difference between enrolment of girls and boys. (Ref Table ED.6). Based on DoE data, NER at primary level is 92.8% and at thesecondary level is 85%
While proportion of children not going to school is low, the reasons are presented below in the diagram, which indicates that major reasons in case ofgirls are associated with household chore and financial problem; whereas thatin case of boys are that they don't want to go. More of the girls / boys who not going to school are from the higher food insecure families. ( Ref Table LL.31)
Main reasons of children of age group 5-18 not going to school
Girls Boys Girls Boys Girls BoysHousehold chore Financial problem Does not want to go
0102030405060
2510.5
32.123.7 25
55.3
Percentage
0b. % children completed of basic level (class eight)(Not measured due to data measurement complication. )
0c. % increase in the learning achievement ratings of the girls and boys(Not measured. However, it is recommended to collect information from the schools for the on-going monitoring purpose)

1a. % teachers using child friendly, inclusive teaching methods. (Value: 14%)There are 428 teachers in the 38 schools supported by WVIN. The schools claimthat 84 teachers are trained on child friendly teaching learning methods. Theschools claim that 63 teachers use this, which is interesting, and worthknowing more about the reality of this and the quality. If 63 taken asclaimed, 14% of the teachers use child friendly teaching methods. In futuremonitoring, it is recommended that ADP ask specific questions to the teacherto probe more about this to get the real data.
1b. # schools meeting minimum standards for child friendly teaching learning (Value: 0 schools)
From 38 schools' facts and figure, 7 schools expressed that they have startedchild friendly teaching learning. Of this, 5 schools perceived that theirchild friendly teaching learning was of good standard. However, this is stillsomething to explore more during the regular monitoring. It is recommended tocarry out continuous monitoring of child friendly standards. But based on thediscussion with ADP, the actual number of meeting the standards is at presentzero.
2a. % girls (and boys), whose attendance rate is at least 80% in class 9 & 12(Value: 75% average)
From the facts and figures of PIA schools (public schools), the following isproportion of girls and boys who attend at least 80% of the class openingdays.
644 of 918 in the 12 schools in class 9 (girls 76%, boys 66%, & girls:boys ratio: 1.22) .
126 of 156 in the 4 schools in class 12 (girls 79%, boys 80%)
This indicates attendance in the high school level is better than secondarylevel; and attendance of boys is less than girl in the lower classes. At thesame time this is also to recognize that people prefer sending their sons toprivate schools, which is there in the girls: boys ratio.
2b. Proportion of girls and boys enrolled in class 9 and 12 (Value: 44:56) Girls: Boys ratio was found 44: 56 based on the school data.
3a. # ECD centres maintaining the ECD standard (Value: 13) 28 out of 53 ECD centres had adequate reading materials. 34 ECD centres had adequate space 19 ECD centres had separate kitchen, but not all meeting the standard 15 ECD centres reported they fairly implemented plan 28 ECD Centres had toilet in good condition

48 ECD centres had their Facilitators who had had basic training 13 ECD centres met all of these above indicators.
3b. % of children enrolled in ECD centres, pre-primary schools (Value: 53.7%) (Operational Indicator: % of 3-4 years children who attend ECD/PPC/Nursery/KG)
From HH survey, 53.7% (95% CI: 50.1-57.3) 3-4 years children attended ECD / PPC/ Nursery, KG. Based on NDHS 2011, 30.1% of 3-4 years attend suchcentres in Nepal.
Ratio of girls: boys who attend ECD/PPC/Nursery, KG is 54:46, which is interesting and worth exploring further.
Regarding the reason why not sending to the centres, among those who do not send, 59.8% respondents said it was not the right age to send, 26.5% said ECD centres are too far to send, 7.8% said the child does not want togo.
Based on the ECD centres data, the ratio of girls: boys in the community based or public school based ECD centres is 59:41, which means girls are sent to these type of ECD centres.
4a. % girls and boys who report that they take part in ECAs and community development process (Value: 9 %)(Operational Indicator: % of children who participated in the decision making process of development work of WVIN and partners)
A special child survey was done to gather this information. Based on the survey: 32% school children said they often participated ECA last year; while 49%
said they participated sometimes. 11% said they were interested but did not get opportunity. During the survey, 5.5% said they don't like ECAs.
9% children participated in the decision making process of development work of WVIN and partners.
Similarly, % of children who participated in development work initiated bydifferent stakeholders are: VDC 1%, other NGOs 2.5%, other local group 8%.
Overall, 34% of children either often participated in ECA or decision process of development works as above.
5.2.4. WASH Project
Goal and Outcomes Indicators Goal
To reduce incidence of water-borne diseases in the communities.
0a. % decrease in the incidents of water born disease
0b. % reduction in the incidence of dihorrea among children

Outcome-1
Improved hygiene and sanitatation behaviours
1a % parents or caregivers who recall practicing hand-washing using an effective product such as soap or ash at least two out of five critical times during the last 24 hours
1b. # VDCs & Wards with declared and maintaing no open defecation.
Outcome -2
Improved quality of drinking water
2a.% families with access to adequate safe drinking water.
Outcome -3
Improved sanitation facilities
3.a.% households with access to sanitationfacilities
0a. % decrease in the incidents of water born disease(Not measured except diahorrea, which is measured for Indicator 0b. )
0b. % reduction in the incidence of diahorrea among children (Value: 16.8%)
Based on HH survey: 16.8% (95% CI: 13.8%-19.8%) of children suffered from diarrhea in the
past 2 weeks of survey. (Ref Table: WS.1). Based on NDSH 2011, 14% U5 children suffer from diahorrea in Nepal and 17.9% in the Western Terai.
In terms of treatment methods, 35.4% treated with ORS, 32.3% with ORS and zinc, 23.2% with other methods; and 9.1% did not treat. (Ref Table: WS-3), Based on NDSH 2011, only 5.2% treat with ORS and zinc in Nepal and 3.1% the Western Development Region.
Prevalence of dihrrea has been found nearly three times more in the HHs who defecate openly than the HHs who defecate in the toilet. (Ref Table : WS.5)
1a % parents or caregivers who recall practicing hand-washing using an effective product such as soap or ash at least two out of five critical timesduring the last 24 hours (Value: 38%)
(In Operational Indicator, the following 5 parameters were included in terms of the five critical times): Based on MCHNsed on Survey, 37.8% wash hand with soap in the five critical times (99% using soap, among those who said they wash hand).
Hand washing Percentage1. At least after latrine use, 99%2. At least after cleaning child, 94%

3. At least before preparing food, 89%4. At least before feeding or eating 55%5. At least after caringfor animals
41%
6. In all above criticaltimes
38%
1b. # VDCs & Wards with declared and maintaining no open defecation (Value: 0). Based on the ADP's record the baseline value is zero,
2a.% families with access to adequate safe drinking water. (Value: 76%)(Operational Indicator: % of HHs who fetch drinking water within 10 minutes in dry season and they perceive the water as safe. )
Based on the HH survey: 94.2% HHs are able to fetch water in 0-5 10 minutes during dry season. 70.4% HHs are able to fetch water in 0-5 minutes. (Ref Table-WS.10) 85.6% (95% CI: 83.0%-88.2%) collect water from tube well (hand pump),
12.1% (95% CI: 9.7%-14.5%) from public taps and 1.1% (95% CI: 0.5%-2.1%)from the artisan (boring). (Ref Table-WS.8)
81% HHs perceive that the water they use is safe; and therefore no need totreat. (Ref Table-WS.11)
Multiplying the proportion of perceived quality with the proportion of HHswho have water fetching time below 10 minutes, it can be concluded that 76%of people have access to perceived safe drinking water. Measuring the qualityof water was not an preferred option in this baseline, as it takes asignificant amount of time and resources. From the DDC profile, 92% of HHshave access to drinking water. These facts show good enough access ofdrinking water. 3.a.% households with access to sanitation facilities (Value: 34%)(Operational Indicator: % of HHs who have toilet for defecation)
34% (95% CI: 30%-38%) HHs have toilets for defecation. Among those whohave toilets, 94.3% have pakki (durable) toilet. (Table WS.4). From thecross tabulation, 76.3% of the diahorreal case occured to those HHs whodon't use toilet for defecation, indicating a relationship betweenoccurance of diaroea and absence of toilet. (Table: WS.5). This issimilar to the survey done by Division Office of Water Supply and

Sanitation done in PIA in 2012, the value of which is 39%. Based on NDSH2011, 38% of HHs in Nepal have toilet.
Based on MCHN survey, done 3 months earlier, 37% of HHs (95% CI: 34%-42%),had toilet for defecation. With CI, both surveys are giving the similarresults.
Among those who have toilets, 94% have pakki (durable) and 6% have kacchi(temporary) toilet. (Ref Table: WS.6)
The cross tabulation shows that absence of toilet is more prevalent infood insecure HHs. Survey shows, 82% of the food insecure HHs does nothave toilet.
Food secured
Food inscured
0 10 20 30 40 50 60 70 80 90
36.7
18.1
63.3
81.9 Not having toiletsHaving toilets
5.2.5. MCHN Project
Goal and outcomes Indicators
Goal
To improve thehealth of children underfive and theirmothers.
0a. Prevalence of stunting among Under five children
0b. Low birth weight incidence is reduced 0c. Prevalence of BMI among women
Outcome-1
Improved care for pregnant women and lactating mothers
1a. Proportion of mother of children 0-23 months who completed recommended number of ante-natal check ups at the health institutions
1b.Proportion of mother of children 12-23 months who completed recommended number of

post natal checkups at the health institution 1c.% women with children who consumed 2 additional meals daily during most recent pregnancy;
1d.%women with children who had additional rest daily during most recent pregnancy
1e. % infants whose births were attended by skilled birth attendant (SBA)
1f.% infants whose births were conducted at a health facility having birthing centre
Outcome-2
Improved practices of nutritional food for U2 children
2a. Prevalence of underweight among preschool children
2b. Proportion of children receiving early initiation of breastfeeding
2c. Proportion of Children receiving exclusivebreastfeeding
2d. Proportion of children receiving breastfeeding for 24+ months
2e. Proportion of children who have appropriate complementary foods (quality & frequency) introduced into their diets after 6months of age
Outcome3
Common childhood illnesses prevented and treated
3a. Proportion of children under five, with diarrhea in the past 2 weeks who were treated with oral rehydration therapy and zinc
3b. % children with illness in past 2 weeks who sought care from appropriate care provider
0a. Prevalence of stunting among under five children (Value: 25.2%)
Based on MCHN Survey: 25.2% (95% CI: 22.6-27.72) Children were found with stunting. When
compared with average situation of Nepal and that of Western Terai, withNepal Demographic Health Survey (NDSH) 2011 findings, this is a bit lower as the prevalence of this is 41% and 39.9% respectively.
0b. Low birth weight incidence is reduced (Value: 14.5%)(Operational Indicator: Children age 0-59 months who have health card and birth weight recorded in the card.)
Based on MCHN Survey:

Babies with 2.5 KG and above during birth were found 86.5%(95% CI: 82.3-90)
Low birth weight is 14.5%. Based on the NDSH 2011, national average is 12.4%.
0c. Prevalence of BMI among women (This indicator was not considered important to measure. Advised to delete this from M&E plan). Based on NDSH 18% women in Nepal are in low BMI.
1a. Proportion of mother of children 0-23 months who completed recommended number of ante-natal checkup at the health institutions (Value: 79.8%)
Based on MCHN Survey: 78.9% (95% CI: 76.2-83.0)women completed ANC 4 times or more. Based on
NDHS 2011, 15.2% do not attend any ANC in Nepal.
1b.Proportion of mother of children 12-23 months who completed recommendednumber of post natal checkups at the health institution (Value: 2.5%)
Based on the MCHN survey, PNC visit among mothers of 0 to 23 aged child thosewho visited ANC is as follows:
3 times or more 2.5% (1.5-4.2) Less than 1-2 times 27.5% (24.0-31.2) No PNC 69.0% (65.0-72.7)
This indicate that women are serious about the ANC but not so much for PNC.
1c.% women with children who consumed 2 additional meals daily during mostrecent pregnancy (Value: 11.8%)
Based on the MCHN survey: 2 or more than 2 :11.8% (95% CI: 9.4-14.7) Same or 1 more time :75.4% (95% CI: 71.7-78.8) Less than usual : 12.8% (95% CI: 10.3-15.8)
This indicates that meal intake for the women was significantly inadequate.
1d.% women with children who had additional rest daily during recentpregnancy (Value: 77.4%)
Based on the MCHN survey, the status of women about rest daily during themost recent pregnancy is as follows:
Had rest 77.4% (95% CI: 73.8- 80.7) Did not have rest: 22.6% 19.3-(95% CI: 26.2)
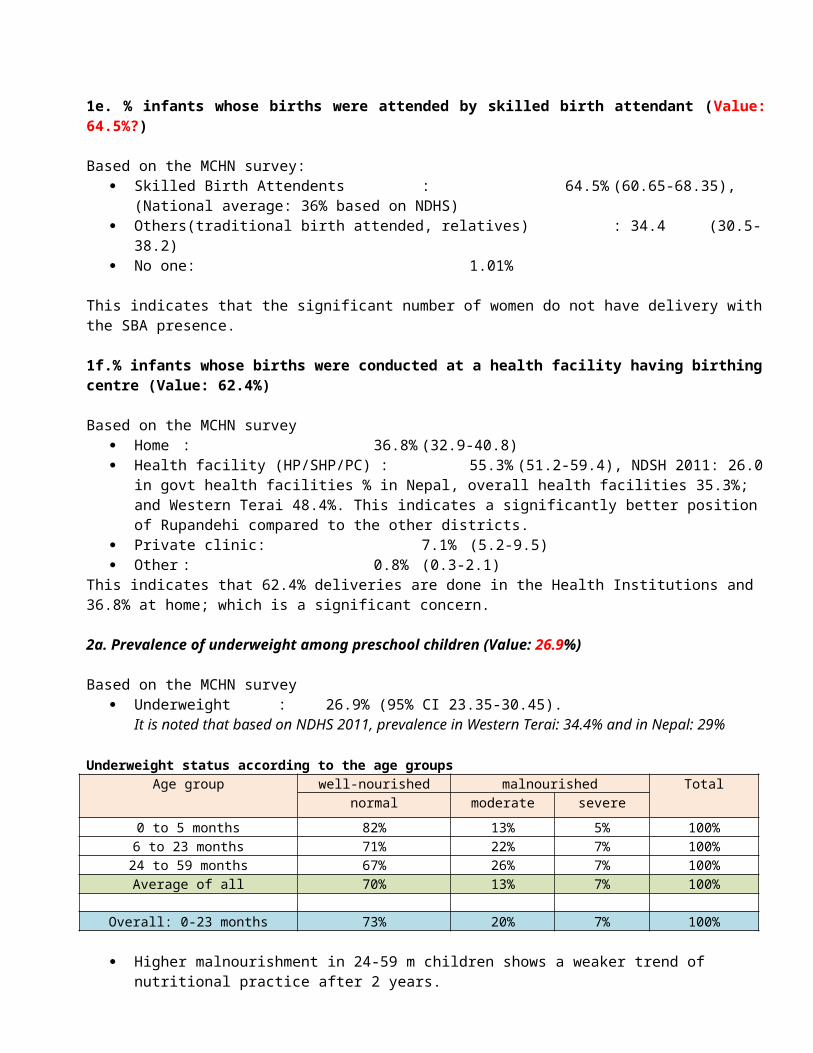
1e. % infants whose births were attended by skilled birth attendant (Value:64.5%?)
Based on the MCHN survey: Skilled Birth Attendents : 64.5% (60.65-68.35),
(National average: 36% based on NDHS) Others(traditional birth attended, relatives) : 34.4 (30.5-
38.2) No one: 1.01%
This indicates that the significant number of women do not have delivery withthe SBA presence.
1f.% infants whose births were conducted at a health facility having birthingcentre (Value: 62.4%)
Based on the MCHN survey Home : 36.8% (32.9-40.8) Health facility (HP/SHP/PC) : 55.3% (51.2-59.4), NDSH 2011: 26.0
in govt health facilities % in Nepal, overall health facilities 35.3%; and Western Terai 48.4%. This indicates a significantly better position of Rupandehi compared to the other districts.
Private clinic: 7.1% (5.2-9.5) Other : 0.8% (0.3-2.1)
This indicates that 62.4% deliveries are done in the Health Institutions and 36.8% at home; which is a significant concern.
2a. Prevalence of underweight among preschool children (Value: 26.9%)
Based on the MCHN survey Underweight : 26.9% (95% CI 23.35-30.45).
It is noted that based on NDHS 2011, prevalence in Western Terai: 34.4% and in Nepal: 29%
Underweight status according to the age groupsAge group well-nourished malnourished Total
normal moderate severe0 to 5 months 82% 13% 5% 100%6 to 23 months 71% 22% 7% 100%24 to 59 months 67% 26% 7% 100%Average of all 70% 13% 7% 100%
Overall: 0-23 months 73% 20% 7% 100%
Higher malnourishment in 24-59 m children shows a weaker trend of nutritional practice after 2 years.

Prevalence of wasting among preschool children Wasting : 11.7 (95% CI: 9.8-13.5).
It is noted that when compared with NDSH data, National: 11%, Western Terai: 15.2% .
2b. Proportion of children receiving early initiation of breastfeeding(Value: 74.2%)
Based on the MCHN survey: 74.2% (70.4-77.6) mothers initiate breastfeeding within one hour : (National : 44.5% , Western Terai: 51.9%, based on NDHS 2011)
2c. Proportion of Children receiving exclusive breastfeeding (Value: 31.7%)
Based on the MCHN survey 31.7% (95% CI: 28.0-35.6) children receive exclusive breastfeeding for 6
months.
2d. Proportion of children receiving breastfeeding for 24+ months
Based on the MCHN survey: 67.1% (95% CI: 64.4%-69.8%) of children are being currently breastfed
(0-59)
2e. Proportion of children who have appropriate complementary foods (quality & frequency) introduced into their diets after 6 months of age
Based on the MCHN survey 47.0% (95% CI: 42.3%-51.6%) children get appropriate complementary foods
(quality & frequency) introduced into their diets after 6 months of age
3a. Proportion of children under five, with diarrhea in the past 2 weeks whowere treated with oral rehydration therapy and zinc (Value: 23.2%)
Based on HH survey, 16.8% (95% CI: 13.8%-19.8%) of children suffered from diarrhea in the
past 2 weeks of survey. (Ref Table-WS.2.) In terms of treatment methods, 35.4% treated with ORS, 32.3% with ORS
and zinc, 23.2% with other methods; and 9.1% did not treat. (Ref Table-WS.3.)
Prevalence of dihrrea has been found nearly three times more in the HHs who defecate openly than the HHs who defecate in the toilet. (Ref Table WS.5)

3b. % children with illness in past 2 weeks who sought care from appropriate care provider (Value: 66.3%)
Based on MCHN Survey, the % of care providers sought for care when children were ill were found as follows:
Appropriate care provider 66.3% (95% CI: 61.6-71) Others (pharmacy, traditional healer, relative) 33.7% (95% CI: 29-
38.4)
5.2.6. Sponsorship Project Goal and Outcomes Indicators
Goal
Sponsorship operations contribute to the transformation of RCs, their families, communities and sponsors, and do not create negative issues in communities.
0a. Community members care for each other and show higher levels of participation.No negative issues about sponsorship raised in evaluations
Outcome1
Communities, families and registered children participate in sponsorship in a way that contributes to improved community relations
1a. Requests for direct benefits to sponsored children are reduced1b. Non RCs and their families speak positively about sponsorship and its impact on their children (change to: % of RC and Non RC families who can tell why photos of RCs are taken)
Outcome2
The presence, participation and quality of life of RCs is monitored, analysed and reported in a way that provides useful feedback to other projects
2a. Project reports of other sectoral projects utilise RC monitoring data as part of their monitoring system2b. Aggregated data for key data such aseducation status of RCs is available for6-month reports
Outcome3
Interactions between sponsors and children promote improved understanding of both community and sponsor situations
3a. RCs and families indicate a positiverelationship with sponsors and can describe key details about sponsor3b. reduced number of queries from sponsors
0a. Community members care for each other and show higher levels of participation. (Qualitative)

Based on FGD with girls, boys, men and women; there is a practice to lend money as short term lending to the neighbors' in need; sometimes to give kinds; to help family in managing feasts and wedding. Households carry out development works collectively such as drainage and road construction. Women's participate in the social works in a great deal, while crucial decisions lies on men. There is a increasing trend of listening children's thoughts while children are not normally consulted in decision making in the community development activities. Difference in political opinion, high /low caste are common dividers. Taking liquor also a cause of household conflict. When major quarrel occurs, police are called; some minor conflicts are managed by the communities. Some minor conflicts include quarrelling when someone's cattle trespasses to neighbors' land; when someone is bothered by behavior of neighbors' children such as when the child plays or takes others to play. Based on the analysis table, the value is 3 out of 5. (Fair)
1a. Requests for direct benefits to sponsored children are reduced (Qualitative)
There is less request coming from the community compared with the past years.But especially when a RC is ill and hospitalized, the request for treatment support is coming where there is rare request for the similar case of Non-RC.The treatment requests from RC families came 2 times in the past year.
1b. Non RCs and their families speak positively about sponsorship and its impact on their children (Value: 21.8%)(Operational Indicator: % of RC and Non RC families who can tell why photos of RCs are taken. )
Based on HH survey: 79.2% of respondents said they did not know why RC's photo are taken.
(Table ). To say this, RC family were 57.8% and Non RC family 86.7%. 21.8% respondents were able to correctly tell the purpose of photo taking.
2a. Project reports of other sectoral projects utilise RC monitoring data as part of their monitoring system (Qualitative)
STEP data are produced regularly on six monthly basis but rarely shared in the discussion although sent through emails. None of the projects have taken its reference to improve the programming.
2b. Aggregated data for key data such as education status of RCs is availablefor 6-month reportsEducation status is part of the STEP report.

3a. RCs and families indicate a positive relationship with sponsors and can describe key details about sponsor (4%)(Operational Indicator: % of RC family who know the name of sponsor to their child)Based on HH Survey:
17.4% of RC HH correctly mentioned the country of sponsor but only 4% said they know the name who is sponsor to their child. These indicate a very poor relation with sponsor.
3b. reduced number of queries from sponsorsBase on discussion with ADP, 5 queries were received in the past year; which means not significant number of queries have been received.
Other important information; Only 2.6% respondents said they knew when ADP is going to be phased out;
while 6.1% were not sure and 91.3% said they didn't know. Out of those who said they knew, only 26.3% were able to exactly tell the
year of ADP phase out. This indicate a very poor understanding of community about WV's phase out.
6. Recommendation 6.1. Programme: Need to focus our programme in the poorest clusters which have been
identified. However, as in the poorest clusters, there are mixed economicgroups, well-being ranking of the HHs will be a good approach to focus.Focusing to the poorest HHs will provide a greater integration of theprojects.
As ADP is being phased out, it is important that the phase out plan isprepared and shared with the community partners. There is very poorunderstanding of communities about ADP phase out.
6. 2. Livelihood Project It is worth recognizing that majority of the families who had food
shortage were who had daily wage as main source of income; and those whohad land below 2 Kattha. From HH Survey, 2.3% of the families depend ondaily wage but from the special studies done in 4 clusters, one tenth ofthe families depend on the daily wages. It is recommended to provide off-farm skills to the needy community people.
Presence of Cooperatives and coverage is high. Activity related toformation of cooperatives should be reduced as there are already asignificantly high number, focusing to the place where there is no or lessnumber.

The involvement of marginalized in the Cooperatives is still weak (14% inaverage). Efforts should be made when working with Cooperatives to includethe marginalized families in the cooperatives.
Activities should be focused to the poorest clusters, targeting poorestHHs based on wellbeing ranking as majority of the food insecure familiesare from the poorest clusters.
Skill development training related to off farm focused to HHs having land(<2 kattha) since HHs having less than 2 kattha are larger in number inour working VDCs
As people's practice of organic farming is very low, farming techniquespromotion should not be limited to the organic farming system. Minimizinguse of pesticides and chemical fertilizers (IPM) could be still the focusif not full organic concept.
6.3. Education Project As the enrollment rate is less than the national level, so activities
related to enrollment campaigns should be included. Project design focus on child friendly teaching learning environment and
girls attendance in the higher classes prove relevant. Need to put focusmore on this. It is recommended to use government guidelines and standardson child friendly teaching and child friendly concepts.
Half of the 3 years children do not attend the ECD centres or simialrclasses; and there are limitations in the schools and ECD centresregarding the maximum number that could be served. ADP could advocate onthe more ECD classes in the schools where children are overcrowded.
6.4. WASH Project Access and availability of water is not a problem. Quality of water is
perceived good by 81% of the respondents. There is high risk ofcontamination in the tube wells not having the platforms. It isrecommended ADP to work with VDC in promoting platform construction forthe needy areas.
As the management of childhood diarrhoea with ORS and Zn is poor,intensive activities should be focused on appropriate method, this couldbe incorporated in the FCHVs counseling to pregnant and lactating women;which has been in the MCHN design.
DDC has a plan to declare Rupandehi as a non open defecation area. ADP hasopportunity to work together with the DDC, VDCs, Water and SanitationOffice in this campaign.
Since toilet construction is also associated with poverty, ADP could lobbyfor greater subsidy to the poor HHs. Well-being ranking of HHs isrecommended to develop and implement subsidy criteria and category.

6.5. MCHN Project Malnourishment practice found weaker after children cross 2 years suggest
that there is need for continuous follow up and counseling of mothers.Mothers Group meeting is an appropriate platform to provide on-goingcounseling to mothers. In addition, awareness raising such as to fathersof the children, as part of ECD parental orientation would also addressthis issue.
There is a need for more focus to PNC and mother's care such as dietarypractice. The intervention is already there in the design but this issomething that needs to be taken more care.
It is recommended to focus more on advocacy related activities for usingexisting health care services, esp. institutional delivery. In addition,it is recommended to support for materials and equipment and capacitybuilding of LHI staffs to create enabling environment in birthing centers
6.6. Sponsorship Project It is recommended that ADP prepare a phase out plan including RC
reduction/ phase out strategy in conjunction with partners. Work to create community understanding on ADP phase out as well as RC
phase out. Awareness to RC families through development of RC reduction concrete plan
and criteria, disseminated through community gatherings
7. Attachment
Appendix no.
Name of the attachment Attachment
1 Completed Baseline and End line Target Table
2 Data Analysis Table of Butwal HH Survey
3 Partners' Profile of Butwal HH Survey
4 Special Study in the Poorest Clusters
5 Child Survey Spreadsheet

6 Butwal ADP Baseline Survey Spreadsheet
7 MCHN Baseline Survey Spreadsheet
8 Terms of Reference of Butwal ADP baseline
9 Summary of Baseline Survey Methodology
10 Sample determination of Buteal Baseline Survey
11 30 cluster Sampling of Butwal Baseline Survey
12 Questionnaire of Butwal Baseline Survey