Northwest Agro-Pastoral Livelihood Zone Baseline Report
46
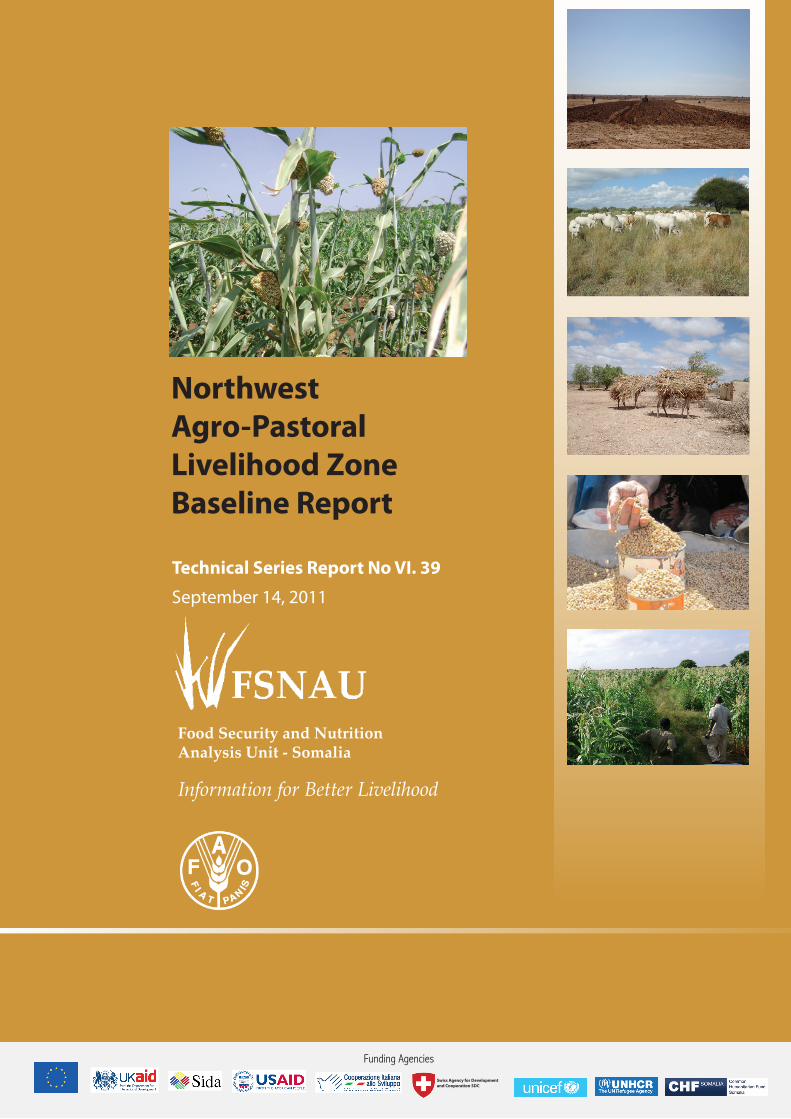
Swiss Agency for Development and Cooperation SDC Funding Agencies September 14, 2011 Food Security and Nutrition Analysis Unit - Somalia Information for Better Livelihood Technical Series Report No VI. 39 Northwest Agro-Pastoral Livelihood Zone Baseline Report
-
Upload
khangminh22 -
Category
Documents
-
view
3 -
download
0
Transcript of Northwest Agro-Pastoral Livelihood Zone Baseline Report
Exec
utiv
e Su
mm
ary
I
Northwest Baseline Report Issued September 14, 2011Swiss Agency for Development and Cooperation SDCSwiss Agency for Development and Cooperation SDC
Funding Agencies
September 14, 2011
Food Security and Nutrition Analysis Unit - Somalia
Information for Better Livelihood
Technical Series Report No VI. 39
Northwest Agro-Pastoral Livelihood Zone Baseline Report
Northwest Baseline Report Issued September 14, 2011
II
III
Northwest Baseline Report Issued September 14, 2011
Ack
now
ledg
emen
t
ACKNOWLEDGEMENT
FSNAU would like to acknowledge the special contributions from representatives of the Government partners of Somaliland, for the administrative, technical and logistical support they provided in conducting the baseline assessment.
A sincere note of appreciation goes to FSNAU Deputy Food Security Manager, Roble Abdi, Senior Livelihood Analysts, Ahmed Jezira, Junior Baseline and livelihood Analyst, Charles Songok and FSNAU Livelihoods Baseline Team (Yusuf Mire, Mahdi Kayad, Diyire Roble, Nur Moalim, Hussein Adan Adde, Mohamed Salad) for the leadership and assistance in conducting fieldwork, data analysis and delivery of quality outputs. Special thanks to FSNAU Gender Analyst, Josephine Gichuhi for her contribution in the training workshop, and particularly in provoking discourse on engendering FSNAU baseline assessment.
Utmost gratitude also goes to FSNAU Technical Support Team for the time and effort in preparing and editing this technical series. Special thanks to FSNAU; Data Systems Team Manager, Kamau Wanjohi; Data Processor, Mary Peter; and GIS Specialist, Alex Koton. The authors acknowledge nutrition information provided by Nutrition Manager, Ahono Busili and the editorial input provided by the publications team consisting of the Graphics Assistant, Catherine Kimani and Publications Officer, Barasa Sindani.
Finally, special thanks to Livelihoods and Policy Research Technical Manager, Zoltan Tiba for reviewing and giving detailed comments on the report and FSNAU Chief Technical Advisor, Grainne Moloney, for her overall supervision of the assessment.
III

Exec
utiv
e Su
mm
ary
IV
Northwest Baseline Report Issued September 14, 2011
VII
Northwest Baseline Report Issued September 14, 2011
Exec
utiv
e Su
mm
ary
EXECUTIVE SUMMARY
Livelihood Zone Description: North West Agro-Pastoral (NWAP) livelihood zone extends west of Togdheer agro-pastoral livelihood and is bordered by West Golis Pastoral to the North, Hawd Pastoral to the south and Zone 5 of Ethiopia to the west. The livelihood zone lies between latitudes 90 17’ to 100 10’N and longitudes 440 43‘ to 420 50’E, and occupies approximately 6590 km2. NWAP is a prime crop (sorghum and maize) and cattle production area. The livelihood exhibits bimodal rainfall: the main Gu/Karan rains last from April to August and Hays rains from January to March. Most of NWAP is composed of scattered acacia trees, but in the arid areas of the livelihood, grasslands give way to a combination of low brushes and grass clumps. The main water sources are Ballis in the slopes of the Golis mountains and shallow wells in the northern part. Crop, livestock production and trade are the socio-economic activities that contribute significantly to meeting household food consumption needs.
Seasonal Calendar: Peak Gu Karan rains were realized around east Golis mountains. Guban of North West received Hays rains from January to mid-March, resulting in peak water (Ballis) availability from May to October. Land preparation began in October (before Hays) and in late March (before Gu/Karan). Long duration (6 months) sorghum and short cycle (3 months) maize varieties are the main cereal crops grown: sorghum is planted in the end of March to mid-April and harvested in October, while maize is planted in Feb to March and harvested in July. Other crops cultivated are water melon (in Gebiley region) and Bulrush millet (in Awdal region). Seed broadcasting is the main sowing method. Crop pests and diseases coincide with weeding (mid-march to June and November-December). Harvested crops are stored in underground pits, which are highly susceptible to pest attacks and soil moisture levels, resulting in post-harvest losses. Peak cereal trade coincides with the harvest period.
Main FindingsWealth breakdown: Households in NWAP livelihood zone are categorised into: Poor (30%), Middle (50%) and Better-off (20%). Notable changes were observed in Livestock holding with all species indicating an increase from the 2002 baseline data. However livestock holdings increase from the poor to the better-off wealth groups.
Livelihood Assets
Soci
al c
apita
ls
Social support: Strong social support network exist. The better-off and some middle households receive remittances and access loans in times of crises. Goos (inter-communal collaboration in farming activities), is practiced through the growing season. Neighbourhood support (community money contributions for the vulnerable), food gifts, kinship support and religious obligation are common in the livelihood.Formal support (Zakat) and Informal support (other gifts): Obligatory Zakat is given annually by the better-off to the poor, and is in the form of livestock and crops, alongside other gifts in cash and in kind. The middle and better-off also donate meat and milk to poor households, and dry food contributions and loans in cash and/or in kind.
Hum
an c
apita
l
Household size and composition: The Poor (Danyare) have 5-7, the middle (Dhexdhexaad), 6-8 and better off (Ladane) 9-11 members. Most HHs are male-headed (90% for the poor and 95% each for the middle and better-off). Most poor HHs and middle groups are monogamous, while the better off have 1-2 wives. Education: Both formal and non-formal schools are available in most villages, although the infrastructure is poor. Enrolment and attendance is regular for children in the better off wealth group, and irregular for children in the poor and middle wealth groups. More boys (60%) than girls (40%) attend formal schools. Among the better off, at least 2 boys and 1 girl go to school, whereas 1 boy and girl attend formal school among the poor and middle.Health and nutrition: The main health facilities available in NWAP are health posts, private clinics and hospitals. Remoteness of most poor villages, high transport, consultation (10000-15000 Slsh) and drugs constrain access to basic health services. Poor health and sanitation, unsafe drinking water, poor childcare and feeding practices remain critical health and nutrition concerns.
Phys
ical
cap
ital Transport: Weather roads form the main transport systems in NWAP, but inaccessible in the wet season.
Telecommunications: About 4 cellular agencies: Telsom, Telecom, Somtel, and Nation link operate in the livelihood. Communication services facilitate remittance flows, local money transfers as well as receiving and sharing information on rainfall/pasture availability, water tracking and market prices of commodities. Water infrastructure: The main water sources are water catchments and shallow wells. Most of the better off and part of the middle have at least 1 berkad. In the wet season, water is available, but in Jilaal, water is purchased, at sometimes high costs for 3-4 months.
V
VIII
Northwest Baseline Report Issued September 14, 2011
Exec
utiv
e Su
mm
ary
Fina
ncia
l ass
ets Loans and credit access: Access to cash loans is normal for the middle and better-off wealth groups. Poor HHs,
with smaller holdings have very limited access to loans since their repayment ability is limited. Livestock: Sale of livestock and livestock products provides the main financial capital. In the reference year, normal Gu/Karan rains ensured normal pasture, fodder and crop harvests, translating to good livestock body conditions, improved livestock production, enhanced marketability of saleable animals, increased incomes and purchasing power of HHs. Women from all wealth groups sell most of livestock products although those in the middle and better off wealth groups engage in petty trade and small business.
Nat
ural
cap
ital Water resources: Most water catchments (Ballis) and shallow wells are recharged by seasonal rains. Short periods
of water trucking in some places, increased transport costs to 500-800 Slsh 20 litre jerrican.Environmental resources: The main soil type in the livelihood zone is loamy-clay, which supports rain-fed farming. The terrain is undulating. In most of NWAP scattered low trees, including various acacias, have been degraded by overgrazing, intensified cultivation, charcoal and indiscriminate tree cutting. As a result, soil erosion and gully formation has increased leading to land degradation (lowering land productivity).
Livelihood Strategies Sources of income: Sale of livestock and livestock products are the primary sources of cash income for all wealth groups, followed by self-employment, agricultural labour and crop sales. Urban towns provide the main labor markets for rural communities during times of crisis. The major portion of the poor household’s income comes livestock product sales (40%), livestock sale (11%), self-employment (26%), agricultural labour (16%) and crop sales (8%). Due to increased number of livestock species, the middle wealth category sold 1 local cattle, 8 goat/sheep, livestock products and crops for income. The better-off households get about 81% of their income from the sale of livestock and livestock products. Crop sales contribute 12% and remittances 7%.
Sources of food: In the reference year, the poor obtained their main food items through market purchase, own production, relief food aid and gifts. The amount of grain harvested by the poor household was estimated at 18.4 bags of 50kg each (11 bags of sorghum and 7.4 bags of maize), of which 56% (10 bags) was consumed, enabling the poor to only meet 34% of their minimum energy required. Purchase of imported rice, wheat flour and non-staple (sugar and vegetable oil) foods contributed 46% of the energy requirements of the poor. The poor obtained 1100 litres of milk (86% from cattle and 14% from goat). Consumption of milk accounted for 7% of the total kcal intake. The poor obtained 10% of food aid and gifts. Crop and livestock products contributed about 64% and 67% of the kcal intake for the middle and better off, while non-staple food covers about 44% and 49%, translating to a total of 108% and 116% kcal per person/day respectively.
Expenditure Sources: Households in the poor wealth group spent 14% of their income on staple food, 24% on non-staple food purchases, 12% on HH items and 19% on clothes. The amount on staple food also includes other costs related to food preparation (salt, kerosene, soap etc) and water for domestic use. The middle and better-off households spend most of their incomes on farm inputs (19% and 20% respectively), non-staple purchase (16% and 14% respectively) and clothes (15% and 13% respectively). The inputs that the middle and better-off wealth groups spend more are for livestock (water, salt, fodder and drugs) and agricultural activities (tractor ploughing hours, planting, sowing, weeding, harvesting and storage, and other forms of agricultural labour).
Future monitoring: • Rainfall pattern, distribution and amount (RFE)• Vegetation conditions • Market prices of staples (cereal)• Livestock market prices• Water access and availability• Livestock and human disease outbreaks • Livestock production and body conditions• Security situation• Livestock migration patterns • Market prices and ToTMajor Hazards
VI
IX
Northwest Baseline Report Issued September 14, 2011
Exec
utiv
e Su
mm
ary
• Drought• Inflation• Insecurity• Pests and birds (Quelea quelea)• Human & livestock diseases• Chronic water shortages• Environmental degradation
Recommendations: • Improvement and expansion in water infrastructure through drilling of new boreholes and repairing dilapidated ones,
particularly in Rako, Waaciye, College and Adinsone in Qardho district.• Build community capacity for the promotion, adoption and use of rainwater harvesting techniques in order to improve
livelihood and food security as well as adapt to periodic climate-induced water stress.• Develop and implement rangeland management programmes (water and soil conservation) in consultation with the
local community, government authorities and local and international non-governmental organisation.• Institution and stringent implementation and control of charcoal production and private enclosures in order to reduce
environmental degradation and enhance sustainability.• Improve access to veterinary, educational and health services through establishment of schools and health posts in
remote areas as well as extension of essential livestock services to the rural areas.• Capacity building and resource mobilisation to identify and establish alternative income generating options. This
should aim at reducing the potential long-term impacts of unsustainable income generating activities like charcoal burning and venturing on alternatives that integrate appropriate technology (rainwater harvesting and irrigation farming), value addition and diversification of agricultural activities.
• Enhance integrated farming techniques that utilise mechanised methods as well as conserve agriculture that aims at soil and water conservation.
VII
X
Northwest Baseline Report Issued September 14, 2011
Tabl
e of
Con
tent
s
VIII
TABLE OF CONTENTS
ACKNOWLEDGEMENT iii
EXECUTIVE SUMMARY v
TABLE OF CONTENTS viii
1. INTRODUCTION 1
1.1 Objectives of the assessment 11.2 Baseline analytical approach 11.3 Integrated Food Security Phase Classification (IPC) Progression 1
2. LIVELIHOOD ZONE DESCRIPTION 3
2.1 Location and size 32.2 Climate 32.3 Natural resources 32.4 Socio-economic activities 3
3. HISTORICAL TIMELINE AND REFERENCE YEAR 4
4. SEASONALITY 6
4.1 Rainfall patterns 64.2 Agricultural activities 64.3 Trading activities 7
5. MARKETS 8
5.1 Livestock prices 85.2 Milk Prices 95.3 Wage labour Rates 95.4 Food prices 105.5 Terms of trade 10
6. LIVELIHOOD ASSETS 12
6.1 Human Capital 126.1.1 Household size and composition 126.1.2 Education 126.1.3 Health and nutrition 126.2 Social Capital 126.2.1 Social support 126.2.2 Formal support (Zakat) and Informal support (other gifts) 126.3 Physical Capital 136.3.1 Transport 136.3.2 Telecommunications 136.3.3 Water infrastructure 136.4 Financial Capital 136.4.1 Loans and credit access 136.4.2 Livestock 136.5 Natural Capital 136.5.1 Water resources 136.5.2 Environmental resources 13
7. WEALTH BREAKDOWN AND DESCRIPTION 14
7.1 Household breakdown 147.2 Crop production and land cultivated 14

XI
Northwest Baseline Report Issued September 14, 2011
Tabl
e O
f Con
tent
s
IX
8. HERD DYNAMICS AND LIVESTOCK HOLDING 15
8.1 Herd dynamics 158.2 Livestock holding 158.3 Change in Livestock holding 16
9. LIVELIHOOD STRATEGIES 17
9.1 Sources of income 179.2 Sources of food 179.3 Expenditure patterns 18
10. MAJOR HAZARDS 23
10.1 Drought 2310.2 Pests and Diseases 1910.3 Market Disruption 1910.4 Environmental degradation 19
11. COPING STRATEGIES 21
12. CONCLUSION AND RECOMMENDATIONS 22
12.1 CONCLUSION 2212.2 RECOMMENDATIONS 22
REFERENCES 23
Annex 1: Livestock holding by wealth group 24Annex 2: Number of livestock sold in the reference year 24Annex 3: Source of income 24Annex 4: Percentage contribution of each food source 24Annex 5: Expenditure patterns by wealth group 24Annex 6: Community Representatives Interview Form: General Topics & Wealth Breakdown 25Annex 7: Rural Wealth Group Interview Form 28
LIST OF FIGURES
Figure 1: IPC progression in North west Agro-pastoral LZ 2Figure 2: Seasonal calendar of critical activities and events in NWAP 6Figure 3: Market price trends in local quality goat 8 Figure 4: Market price trends in export quality goat 8Figure 5: Trends in camel milk prices 8Figure 6: Trends in labour wage rates 9Figure 7: Trends in wheat flour 9Figure 8: Trends in white sorghum price 9Figure 9: Trends in red rice price 10Figure 10: Trends in daily labour to sorghum ToT 10Figure 11: Trends in export quality goat/rice ToT 10Figure 12: Trends in daily labour to rice ToT 10Figure 13: Trends in local goat to rice ToT 10Figure 14: Trends in cattle milk price 11Figure 15: Trends in exchange rate 16Figure 16: Proportional distribution of wealth groups 17Figure 17: Sources of Income 17Figure 18: Sources of food 17Figure 19: Expenditure patterns 18
XII
Northwest Baseline Report Issued September 14, 2011
Acr
onym
s
X
LIST OF TABLESTable 1: IPC progression in NWAP between 2006-2010 2Table 2: Population in North West Agro-Pastoral Livelihood zone 3Table 3: Historical timeline 4 Table 4: Average commodity prices in Hargeisa and Boroma markets 8Table 5: Summary of wealth group characteristics 14Table 6: Average Yield for Sorghum and Maize crop in 50 kg bags 14Table 7: Changes in area cultivated 14Table 8: Camel Herd Dynamics 15Table 9: Sheep and Goat herd dynamics 15Table 10: Cattle dynamics 15Table 11: Changes in livestock holding in Northwest agro pastoral livelihood zone 16
LIST OF MAPS
Map 1: Location of North West Agro-Pastoral Livelihood zone 3Map 2: Cereal markets and cereal flow pattern in NWAP 9
XIII
Northwest Baseline Report Issued September 14, 2011
Glo
ssar
y
LIST OF ACRONYMSBLAF Baseline Livelihood Analysis frameworkFEWS NET Famine Early Warning Systems NetworkFSNAU Food Security and Nutritional Analysis UnitGAM Global Acute MalnutritionHEA Household Economy ApproachIDPs Internally Displaced PersonsLTA Long term AverageMCH Maternal Child Health Centers MEB Minimum Expenditure BasketMUAC Mid Upper Arm Circumference NGO Non-Governmental OrganizationSAM Severe Acute MalnutritionSLA Sustainable Livelihood ApproachSoSh Somali ShillingToT Terms of TradeUN United NationsUNDP United Nations Development ProgramUNICEF United Nations Children FundUSD United States DollarWFP World Food ProgramWHO World Health OrganizationMOHL Ministry of Health SomalilandITCZ InterTropical Convergence Zone SWIMS Somalia Water sources Information Management Systems
GLOSSARY OF TERMS
Deyr The minor wet season, October to NovemberGu The major wet season, April to JuneHagaa July to September, minor dry seasonJilaal December to March major dry season in SomaliaKharif Strong winds experienced in July in most parts of northern Somalia.
MonsoonWind pattern that changes direction depending on the season. The term is applied to seasonal winds in which the wind blows from e.g. southwest monsoon originates from southwest direction.
Tropics
This is the geographic region of the earth centred on the Equator and limited in latitude by the Tropic of Cancer in the northern hemisphere, at approximately 23°30’ (23.5°) N latitude, and the Tropic of Capricorn in the southern hemisphere at 23°30’ (23.5°) S latitude. This region is also referred to as the tropical or arid zone.

XIV
Northwest Baseline Report Issued September 14, 2011
1
Northwest Baseline Report Issued September 14, 2011
Intr
oduc
tion 1. INTRODUCTION
Baseline livelihood assessments are important in describing household livelihood status and changes in climatic and socio-economic conditions over time. Using on a combination of participatory research techniques, baseline assessments explain how the ”most at risk” live, how their common (public) and household assets status change over time, how shifts in livelihood strategies occur and how coping mechanisms are employed in bad and in good years. Beside providing a rich information base for making comparisons and for measuring recurrent or new threats to the population’s livelihood and food security situation, baselines also inform priotitization for recovery, programming and policy development.
In April-May 2011, FSNAU conducted a livelihoods baseline assessment of the North West Agro-Pastoral (NWAP) livelihood zone. This was necessary because livelihood strategies have changed in response to persistent droughts that have affected the livelihood systems in northern Somalia in the past years.
1.1 Objectives of the assessmentThe baseline assessment focussed on the following objectives:• To identify the socio-economic changes in NWAP livelihood zone as well as the main asset determinants in each
wealth group.• To assess the effects of recurrent shocks on livelihoods in order to establish shifts in livelihood strategies and wealth
groups within the livelihood.• To identify the major risk factors influencing NWAP livelihood system and the different coping strategies employed in
times of crises.• To document information for decision and policy makers to plan and implement appropriate interventions aimed at
enhancing the general welfare of the communities.
1.2 Baseline analytical approachBefore collecting data a baseline assessment training and field planning workshop was organized by FSNAU in collaboration with the Ministry of Planning, Puntland Authority, in Garowe, Puntland. The workshop discussions focussed on modifications in the data collection tools and planning for fieldwork. The core activities involved grouping, selecting and moving to the next level:
• At the district level, target villages in NWAP were grouped and samples were selected. • At the community/village level, purposively selected community representatives grouped households (HHs) according
to common wealth determinants. A community representative interview form was used for this purpose.• HH representatives from each wealth group were selected to participate in focus group discussions (FGDs). Using a
rural wealth group (HH Representative) interview form details of livelihood strategies (food, income and expenditure patterns) were recorded.
• In addition, secondary information on markets as well as other reference information were reviewed and used to support reporting.
The baseline assessment involved conducting interviews with community leaders, who assisted in stratifying the HHs in purposively selected villages into different wealth groups. From the selected HH representatives, the wealth group questionnaire was administered and relevant data were gathered. Data analysis involved compiling, summarising and cross-checking data for accuracy and consistency.
This report describes how seasonality influences livelihood activities and market performance in NWAP livelihood zone, summarises livelihood assets, analyses livelihood strategies (income and cash sources, expenditure patterns) and examines risks and vulnerability factors. Finally, the recommendations of the assessment provide useful information to decision makers, both in government and non-governmental agencies, that facilitate timely and appropriate response to crises. Additionally, the findings also provide a basis for food security indicator monitoring and for prioritisation of development/humanitarian programmes.
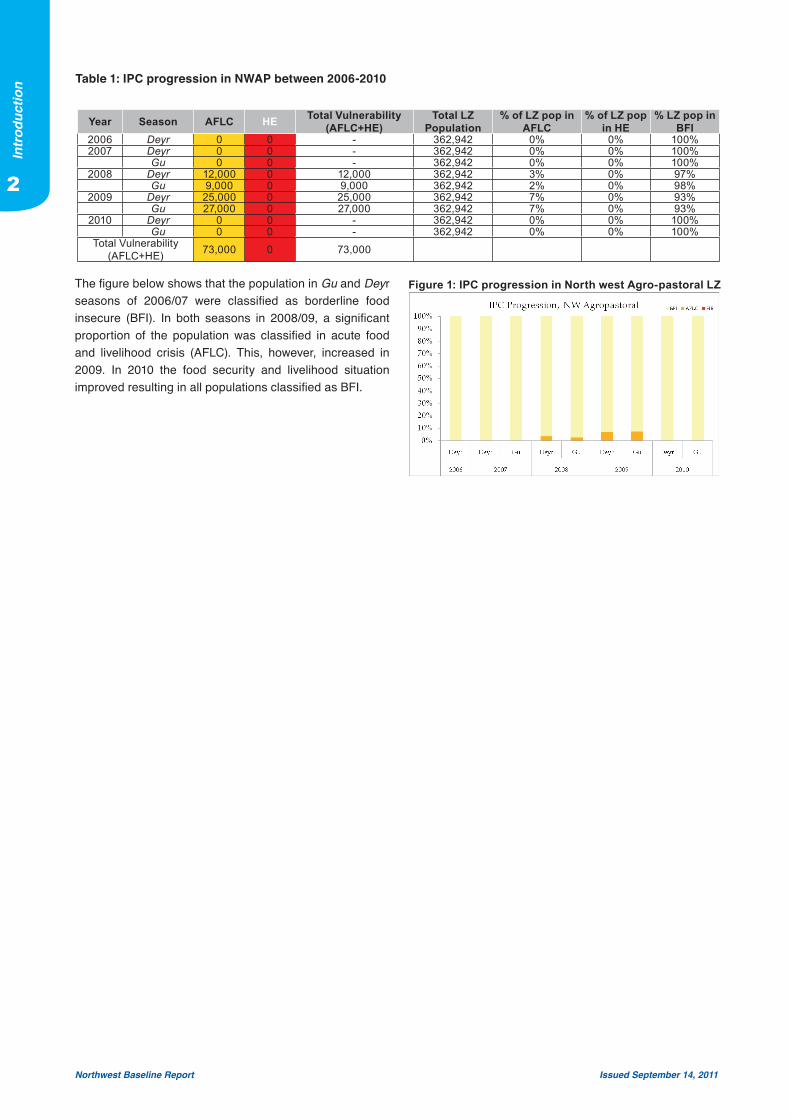
1.3 Integrated Food Security Phase Classification (IPC) Progression The table below shows the Integrated Food Security Phase Classification (IPC) Progression in North West Agro-Pastoral (NWAP) livelihood zone from 2006-2010, identifying vulnerability and the number of people affected over time.
1
2
Northwest Baseline Report Issued September 14, 2011
Intr
oduc
tion
The figure below shows that the population in Gu and Deyr seasons of 2006/07 were classified as borderline food insecure (BFI). In both seasons in 2008/09, a significant proportion of the population was classified in acute food and livelihood crisis (AFLC). This, however, increased in 2009. In 2010 the food security and livelihood situation improved resulting in all populations classified as BFI.
2
Figure 1: IPC progression in North west Agro-pastoral LZ
Year Season AFLC HE Total Vulnerability (AFLC+HE)
Total LZ Population
% of LZ pop in AFLC
% of LZ pop in HE
% LZ pop in BFI
2006 Deyr 0 0 - 362,942 0% 0% 100%2007 Deyr 0 0 - 362,942 0% 0% 100%
Gu 0 0 - 362,942 0% 0% 100%2008 Deyr 12,000 0 12,000 362,942 3% 0% 97%
Gu 9,000 0 9,000 362,942 2% 0% 98%2009 Deyr 25,000 0 25,000 362,942 7% 0% 93%
Gu 27,000 0 27,000 362,942 7% 0% 93%2010 Deyr 0 0 - 362,942 0% 0% 100%
Gu 0 0 - 362,942 0% 0% 100%Total Vulnerability
(AFLC+HE) 73,000 0 73,000
Table 1: IPC progression in NWAP between 2006-2010
3
Northwest Baseline Report Issued September 14, 2011
Live
lihoo
d Zo
ne
Des
crip
tion
2. LIVELIHOOD ZONE DESCRIPTION
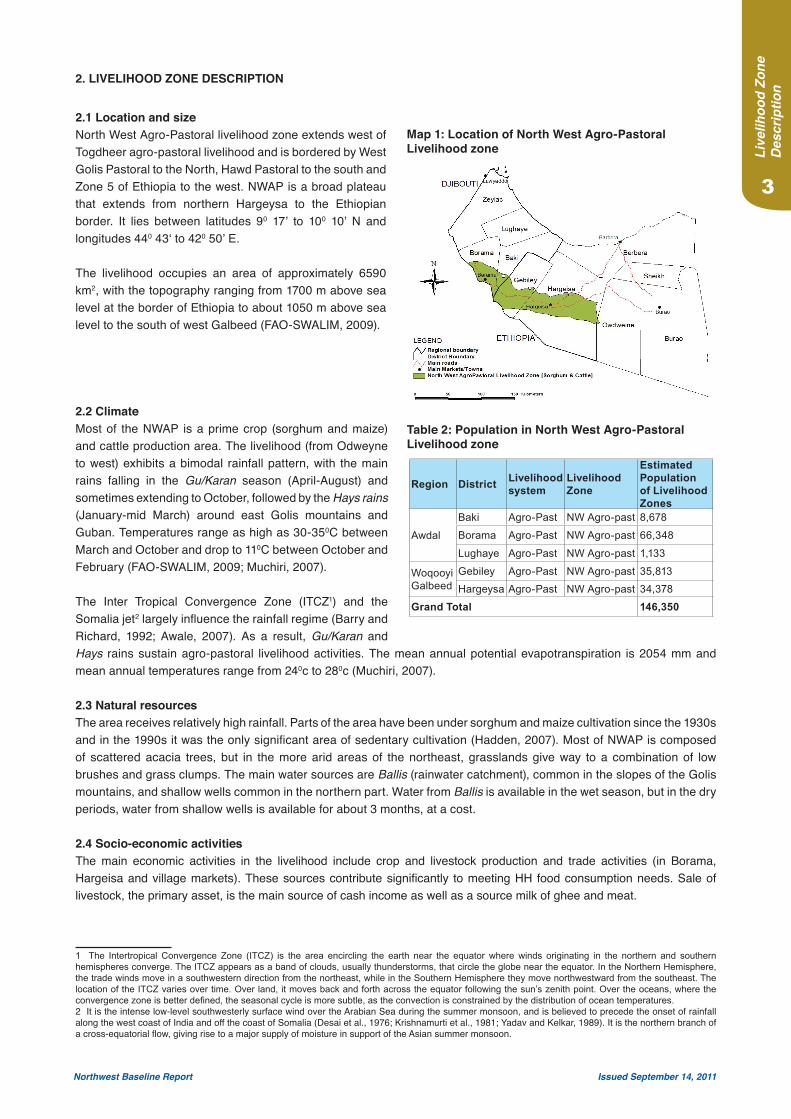
2.1 Location and sizeNorth West Agro-Pastoral livelihood zone extends west of Togdheer agro-pastoral livelihood and is bordered by West Golis Pastoral to the North, Hawd Pastoral to the south and Zone 5 of Ethiopia to the west. NWAP is a broad plateau that extends from northern Hargeysa to the Ethiopian border. It lies between latitudes 90 17’ to 100 10’ N and longitudes 440 43‘ to 420 50’ E.
The livelihood occupies an area of approximately 6590 km2, with the topography ranging from 1700 m above sea level at the border of Ethiopia to about 1050 m above sea level to the south of west Galbeed (FAO-SWALIM, 2009).
2.2 Climate Most of the NWAP is a prime crop (sorghum and maize) and cattle production area. The livelihood (from Odweyne to west) exhibits a bimodal rainfall pattern, with the main rains falling in the Gu/Karan season (April-August) and sometimes extending to October, followed by the Hays rains (January-mid March) around east Golis mountains and Guban. Temperatures range as high as 30-350C between March and October and drop to 110C between October and February (FAO-SWALIM, 2009; Muchiri, 2007).
The Inter Tropical Convergence Zone (ITCZ1) and the Somalia jet2 largely influence the rainfall regime (Barry and Richard, 1992; Awale, 2007). As a result, Gu/Karan and Hays rains sustain agro-pastoral livelihood activities. The mean annual potential evapotranspiration is 2054 mm and mean annual temperatures range from 240c to 280c (Muchiri, 2007).
2.3 Natural resourcesThe area receives relatively high rainfall. Parts of the area have been under sorghum and maize cultivation since the 1930s and in the 1990s it was the only significant area of sedentary cultivation (Hadden, 2007). Most of NWAP is composed of scattered acacia trees, but in the more arid areas of the northeast, grasslands give way to a combination of low brushes and grass clumps. The main water sources are Ballis (rainwater catchment), common in the slopes of the Golis mountains, and shallow wells common in the northern part. Water from Ballis is available in the wet season, but in the dry periods, water from shallow wells is available for about 3 months, at a cost.
2.4 Socio-economic activitiesThe main economic activities in the livelihood include crop and livestock production and trade activities (in Borama, Hargeisa and village markets). These sources contribute significantly to meeting HH food consumption needs. Sale of livestock, the primary asset, is the main source of cash income as well as a source milk of ghee and meat.
1 The Intertropical Convergence Zone (ITCZ) is the area encircling the earth near the equator where winds originating in the northern and southern hemispheres converge. The ITCZ appears as a band of clouds, usually thunderstorms, that circle the globe near the equator. In the Northern Hemisphere, the trade winds move in a southwestern direction from the northeast, while in the Southern Hemisphere they move northwestward from the southeast. The location of the ITCZ varies over time. Over land, it moves back and forth across the equator following the sun’s zenith point. Over the oceans, where the convergence zone is better defined, the seasonal cycle is more subtle, as the convection is constrained by the distribution of ocean temperatures. 2 It is the intense low-level southwesterly surface wind over the Arabian Sea during the summer monsoon, and is believed to precede the onset of rainfall along the west coast of India and off the coast of Somalia (Desai et al., 1976; Krishnamurti et al., 1981; Yadav and Kelkar, 1989). It is the northern branch of a cross-equatorial flow, giving rise to a major supply of moisture in support of the Asian summer monsoon.
3
Map 1: Location of North West Agro-Pastoral Livelihood zone
Table 2: Population in North West Agro-Pastoral Livelihood zone
Region District Livelihood system
Livelihood Zone
Estimated Population of Livelihood Zones
Awdal
Baki Agro-Past NW Agro-past 8,678
Borama Agro-Past NW Agro-past 66,348
Lughaye Agro-Past NW Agro-past 1,133
Woqooyi Galbeed
Gebiley Agro-Past NW Agro-past 35,813
Hargeysa Agro-Past NW Agro-past 34,378
Grand Total 146,350

Northwest Baseline Report Issued September 14, 2011
4
His
toric
al T
imel
ine
3. HISTORICAL TIMELINE
The historical timeline provides a broader understanding of the socio-economic and climatic trends in NWAP livelihood zone and assists to identify the reference year. The table below outlines the overall performance of the main productive seasons in the past five years (2006-2010), including key events, impacts on livelihoods (access to food, cash income and expenditure) and responses to shocks during this period.
Table 3: Historical timeline
Year Season Rank1 Event(s) Effects Responses
2010
(ave
rage
yea
r) Deyr 2
• Poor rains• Water crisis• Crop disease
• Poor crop production• Average milk production• Average livestock body condition• Stable milk prices
• Increased water trucking• Increased seeking of social
support
Gu/Karan 4
• Good rains• Floods• Pest
infestation
• Good crop production• Increased milk production• Low cereal prices
• Normal coping strategies
2009
(Slig
htly
bel
ow a
vera
ge)
Deyr 2
• Poor rains • Poor crop and livestock production• Poor pasture and water conditions • Increased cereal prices
• Increased seeking of social support
• Increased self employment like charcoal burning and collection of firewood
• Outmigration of livestock
Gu/Karan 3
• Normal rains • Average cereal production• Normal water and pasture conditions• Average milk production• Stable cereal prices
• Normal coping strategies • Normal migration of
livestock
2008
(ave
rage
)
Deyr 3
• Normal rains• High inflation
• Average crop and livestock productions
• High prices of imported cereals• Devaluation of Somaliland shilling
• Increased livestock sales
Gu/Karan 3• Normal rains • Low availability of local cereals due
impact of pests• Normal coping strategies
2007
(ave
rage
) Deyr 3
• Army worm infestation
• Poor crop production• Increased cereal prices• Increased imported food
commodities• Low purchasing power
• Increased seeking of social support
• Farms tillage support
Gu/Karan 3• Normal rains • Average crop production
• Average livestock production• Stable cereal prices
• Normal coping strategies
2006 Deyr 3
• Normal rains • Average crop production• Average livestock production• Stable cereal prices
• Normal coping strategies
Following preliminary discussions with the FSNAU Baseline team, field analysts and community representatives, the period between April 2010-March 2011 was determined as the reference year for the baseline assessment. This was because the period was an average (normal) consumption year characterised by average climatic conditions (good Gu/Karan rains compensated for the poor Deyr season), peaceful presidential elections (in June 2010), good crop production, increased milk production (Gu/Karan), stable milk prices (Deyr), low cereal prices, average livestock body conditions in Deyr, and use of normal coping strategies by most poor HHs. These conditions provided stable conditions, hence the justification to select it as the reference year.
The Gu season of 2009 experienced normal rainfall, therefore it can be regarded as an average year. As a result, average cereal production stabilized the prices of essential cereals (sorghum and maize), although the prices increased slightly in the Deyr season. During the Gu season normal pasture and water conditions enhanced livestock production. However, in Deyr, poor rains resulted in low crop and livestock production. While normal coping strategies were employed in Gu, the main response mechanisms employed in Deyr included seeking social support, increased self employment in charcoal burning and firewood collection (high cost coping strategies) and outmigration of livestock in search of pasture and water.

Northwest Baseline Report Issued September 14, 2011
5
His
toric
al T
imel
ine
In 2008, in spite of the inflation from the printing of fake Somaliland currency, normal rainfall events prevailed in Gu and Deyr seasons. In effect, the seasons were characterized by average crop and livestock production, high prices of imported cereals (the result of low availability of local cereals due to the impact of pests) and devaluation of the Somaliland shilling (aimed at stabilizing the currency). To cope with these shocks, there was increased livestock sales, alongside other normal coping strategies.
Similarly, average rainfall conditions prevailed in both the Gu and Deyr seasons of 2007, with normal rains in Gu and army worm infestation in Deyr. This particularly reduced crop production (due to increased army worm attacks and destruction of standing crops), and lowered yields and incomes from sale of crops. This increased cereal prices, as a result of low supply of locally produced cereals on the one hand, and increased demand of imported food commodities on the other. However, low incomes forced most poor HHs to seek more social support and farm tillage assistance from the middle and better-off wealth groups. In Deyr’06 and Gu’07, average crop production, livestock conditions and stable cereal prices resulted in the use of normal coping strategies by most HHs across the wealth groups.
6
Northwest Baseline Report Issued September 14, 2011
4. SEASONALITY
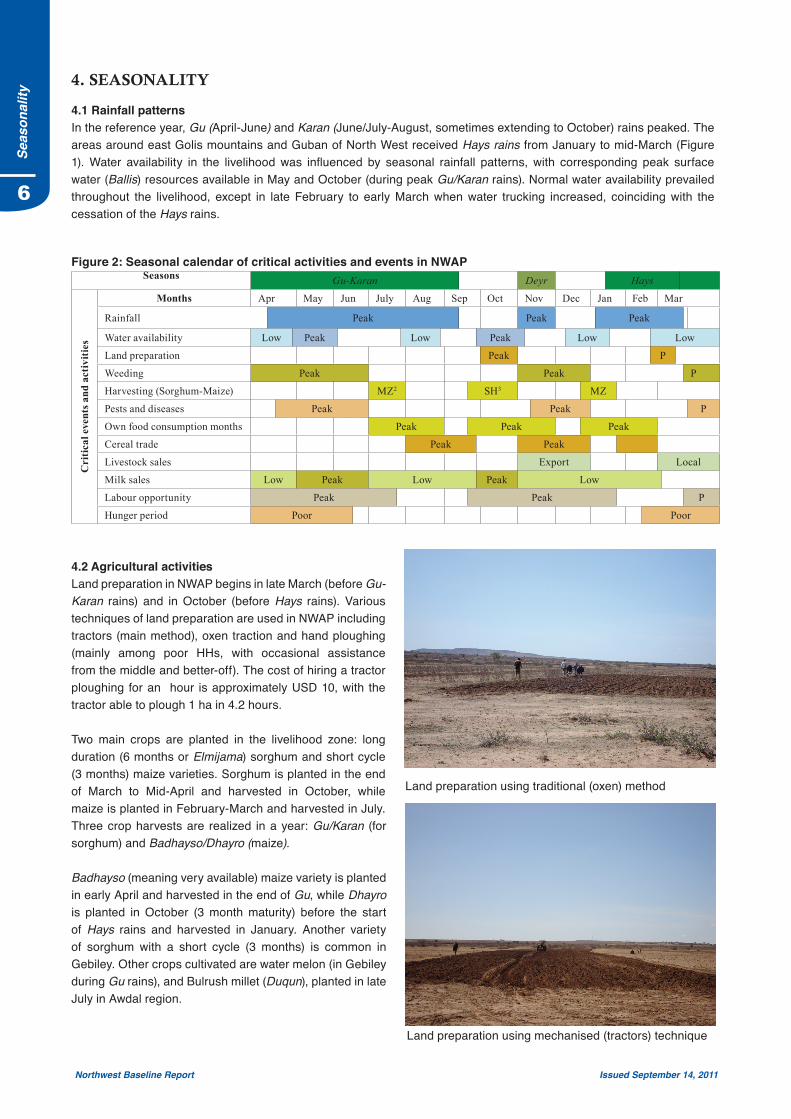
4.1 Rainfall patternsIn the reference year, Gu (April-June) and Karan (June/July-August, sometimes extending to October) rains peaked. The areas around east Golis mountains and Guban of North West received Hays rains from January to mid-March (Figure 1). Water availability in the livelihood was influenced by seasonal rainfall patterns, with corresponding peak surface water (Ballis) resources available in May and October (during peak Gu/Karan rains). Normal water availability prevailed throughout the livelihood, except in late February to early March when water trucking increased, coinciding with the cessation of the Hays rains.
Figure 2: Seasonal calendar of critical activities and events in NWAPSeasons Gu-Karan Deyr Hays
Cri
tical
eve
nts a
nd a
ctiv
ities
Months Apr May Jun July Aug Sep Oct Nov Dec Jan Feb Mar
Rainfall Peak Peak Peak
Water availability Low Peak Low Peak Low Low
Land preparation Peak P
Weeding Peak Peak P
Harvesting (Sorghum-Maize) MZ2 SH3 MZ
Pests and diseases Peak Peak P
Own food consumption months Peak Peak Peak
Cereal trade Peak Peak
Livestock sales Export Local
Milk sales Low Peak Low Peak Low
Labour opportunity Peak Peak P
Hunger period Poor Poor
4.2 Agricultural activitiesLand preparation in NWAP begins in late March (before Gu-Karan rains) and in October (before Hays rains). Various techniques of land preparation are used in NWAP including tractors (main method), oxen traction and hand ploughing (mainly among poor HHs, with occasional assistance from the middle and better-off). The cost of hiring a tractor ploughing for an hour is approximately USD 10, with the tractor able to plough 1 ha in 4.2 hours.
Two main crops are planted in the livelihood zone: long duration (6 months or Elmijama) sorghum and short cycle (3 months) maize varieties. Sorghum is planted in the end of March to Mid-April and harvested in October, while maize is planted in February-March and harvested in July. Three crop harvests are realized in a year: Gu/Karan (for sorghum) and Badhayso/Dhayro (maize).
Badhayso (meaning very available) maize variety is planted in early April and harvested in the end of Gu, while Dhayro is planted in October (3 month maturity) before the start of Hays rains and harvested in January. Another variety of sorghum with a short cycle (3 months) is common in Gebiley. Other crops cultivated are water melon (in Gebiley during Gu rains), and Bulrush millet (Duqun), planted in late July in Awdal region.
Seas
onal
ity
Land preparation using mechanised (tractors) technique
Land preparation using traditional (oxen) method

7
Northwest Baseline Report Issued September 14, 2011
Seas
onal
ity
Agro-pastoralists in NWAP use broadcasting as the main method of seed sowing, although dry sowing (Shinni aware) is also used in the dry season. Weeding (Harrameyn) is normally done using oxen or manually (Goos), throughout the growing season till harvest, while thinning (Baaq-baaq) is done using oxen after seed germination (mostly during the first weeding). Crop pests and disease outbreaks coincide with the weeding periods (mid-march to June and November-December). Harvested crops are mainly stored in underground pits (Bakaar), while a few HHs use drums (Fuusto/Barmiil). Crops stored in underground pits are highly susceptible to pest attacks and sensitve to soil moisture, contributing to post-harvest losses.
In the reference year, no major livestock migration occurred in NWAP livelihood zone. However, in recent bad seasons when Karan and Hays rains were poor, all animals moved to Zone 5 of Ethiopia and remained through Gu-Karan season. During this period, men and boys herd camel and cattle, while women and girls herd shoats.
4.3 Trading activitiesTrade in cereal commodities peaks after harvest. However, the dry periods coincide with a peak in local livestock sales, and with export peaks during Hajj. Milk sales are continuous throughout the year, with peaks in May/June and in October. As an agro-pastoral livelihood, labour opportunities normally coincide with the peak of agricultural activities (land preparation, weeding, guarding and harvesting).
8
Northwest Baseline Report Issued September 14, 2011
Mar
kets
5. MARKETS
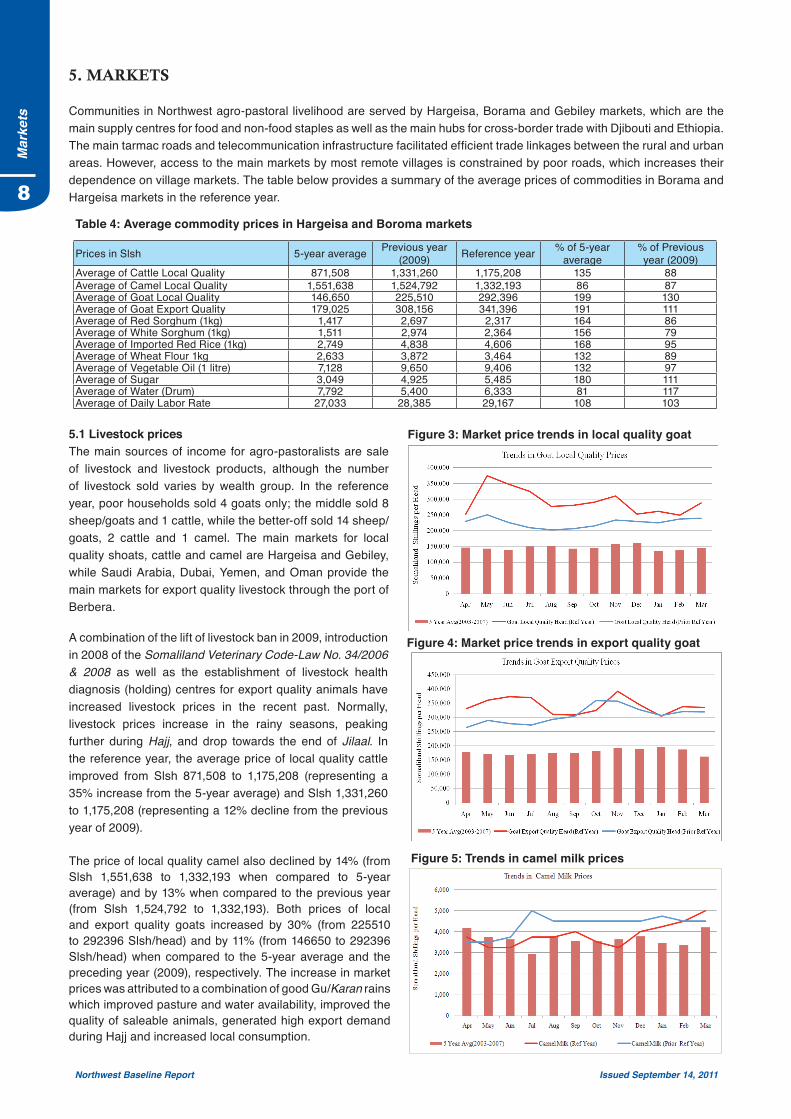
Communities in Northwest agro-pastoral livelihood are served by Hargeisa, Borama and Gebiley markets, which are the main supply centres for food and non-food staples as well as the main hubs for cross-border trade with Djibouti and Ethiopia. The main tarmac roads and telecommunication infrastructure facilitated efficient trade linkages between the rural and urban areas. However, access to the main markets by most remote villages is constrained by poor roads, which increases their dependence on village markets. The table below provides a summary of the average prices of commodities in Borama and Hargeisa markets in the reference year.
5.1 Livestock pricesThe main sources of income for agro-pastoralists are sale of livestock and livestock products, although the number of livestock sold varies by wealth group. In the reference year, poor households sold 4 goats only; the middle sold 8 sheep/goats and 1 cattle, while the better-off sold 14 sheep/goats, 2 cattle and 1 camel. The main markets for local quality shoats, cattle and camel are Hargeisa and Gebiley, while Saudi Arabia, Dubai, Yemen, and Oman provide the main markets for export quality livestock through the port of Berbera.
A combination of the lift of livestock ban in 2009, introduction in 2008 of the Somaliland Veterinary Code-Law No. 34/2006 & 2008 as well as the establishment of livestock health diagnosis (holding) centres for export quality animals have increased livestock prices in the recent past. Normally, livestock prices increase in the rainy seasons, peaking further during Hajj, and drop towards the end of Jilaal. In the reference year, the average price of local quality cattle improved from Slsh 871,508 to 1,175,208 (representing a 35% increase from the 5-year average) and Slsh 1,331,260 to 1,175,208 (representing a 12% decline from the previous year of 2009).
The price of local quality camel also declined by 14% (from Slsh 1,551,638 to 1,332,193 when compared to 5-year average) and by 13% when compared to the previous year (from Slsh 1,524,792 to 1,332,193). Both prices of local and export quality goats increased by 30% (from 225510 to 292396 Slsh/head) and by 11% (from 146650 to 292396 Slsh/head) when compared to the 5-year average and the preceding year (2009), respectively. The increase in market prices was attributed to a combination of good Gu/Karan rains which improved pasture and water availability, improved the quality of saleable animals, generated high export demand during Hajj and increased local consumption.
Figure 4: Market price trends in export quality goat
Figure 3: Market price trends in local quality goat
Figure 5: Trends in camel milk prices
Prices in Slsh 5-year average Previous year (2009) Reference year % of 5-year
average% of Previous year (2009)
Average of Cattle Local Quality 871,508 1,331,260 1,175,208 135 88Average of Camel Local Quality 1,551,638 1,524,792 1,332,193 86 87Average of Goat Local Quality 146,650 225,510 292,396 199 130Average of Goat Export Quality 179,025 308,156 341,396 191 111Average of Red Sorghum (1kg) 1,417 2,697 2,317 164 86Average of White Sorghum (1kg) 1,511 2,974 2,364 156 79Average of Imported Red Rice (1kg) 2,749 4,838 4,606 168 95Average of Wheat Flour 1kg 2,633 3,872 3,464 132 89Average of Vegetable Oil (1 litre) 7,128 9,650 9,406 132 97Average of Sugar 3,049 4,925 5,485 180 111Average of Water (Drum) 7,792 5,400 6,333 81 117Average of Daily Labor Rate 27,033 28,385 29,167 108 103
Table 4: Average commodity prices in Hargeisa and Boroma markets
9
Northwest Baseline Report Issued September 14, 2011
Mar
kets
5.2 Milk PricesIn general sale of livestock products is one of the most important income source in Northwest Agro-pastoral livelihood. This is because most households, with the exception of the poor, rely on more than one species of animals for milk production. In the reference year, poor households sold 774 litres of fresh milk on average, mainly from cattle, while the middle sold about 2,360 litres of fresh milk (66% from camel and 34% cattle). The better-off wealth group sold 2,600 litres of fresh milk (67% from camel and 33% cattle milk) on average. Despite normal calving and kidding rates, camel fresh milk prices in the reference year were 7% lower than the previous (2009) year, but 5-13% higher than the 5-year average.
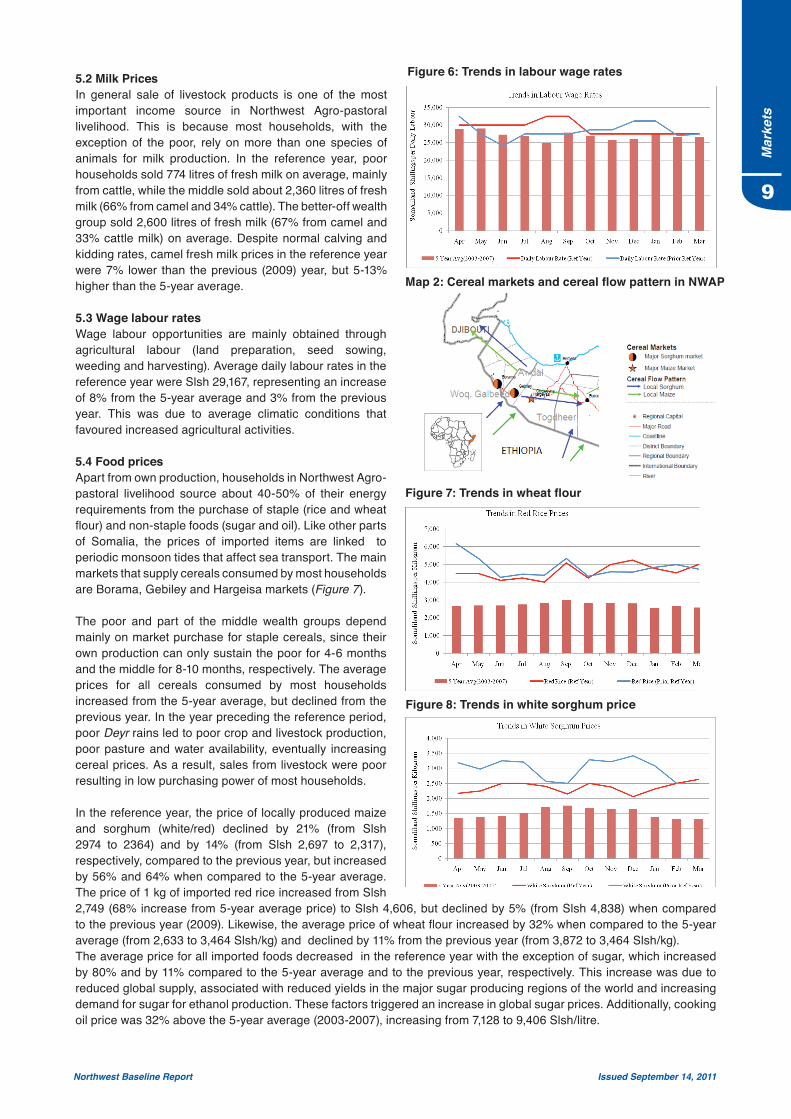
5.3 Wage labour ratesWage labour opportunities are mainly obtained through agricultural labour (land preparation, seed sowing, weeding and harvesting). Average daily labour rates in the reference year were Slsh 29,167, representing an increase of 8% from the 5-year average and 3% from the previous year. This was due to average climatic conditions that favoured increased agricultural activities.
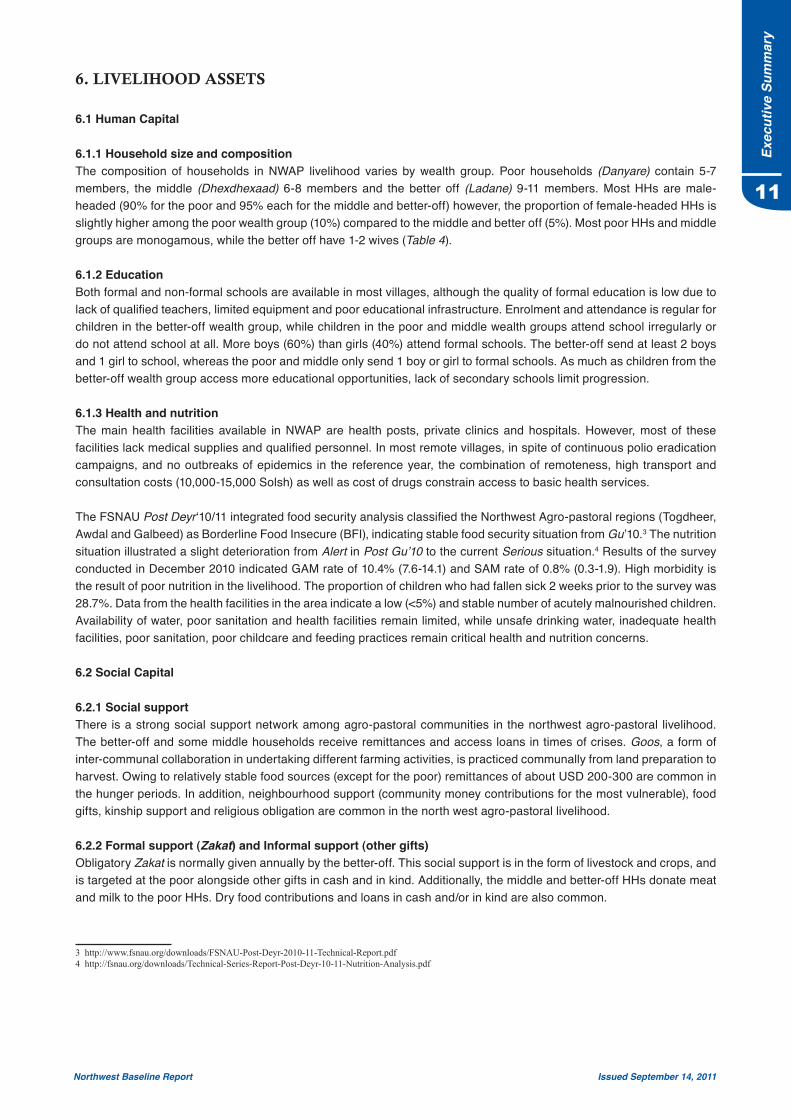
5.4 Food pricesApart from own production, households in Northwest Agro-pastoral livelihood source about 40-50% of their energy requirements from the purchase of staple (rice and wheat flour) and non-staple foods (sugar and oil). Like other parts of Somalia, the prices of imported items are linked to periodic monsoon tides that affect sea transport. The main markets that supply cereals consumed by most households are Borama, Gebiley and Hargeisa markets (Figure 7).
The poor and part of the middle wealth groups depend mainly on market purchase for staple cereals, since their own production can only sustain the poor for 4-6 months and the middle for 8-10 months, respectively. The average prices for all cereals consumed by most households increased from the 5-year average, but declined from the previous year. In the year preceding the reference period, poor Deyr rains led to poor crop and livestock production, poor pasture and water availability, eventually increasing cereal prices. As a result, sales from livestock were poor resulting in low purchasing power of most households.
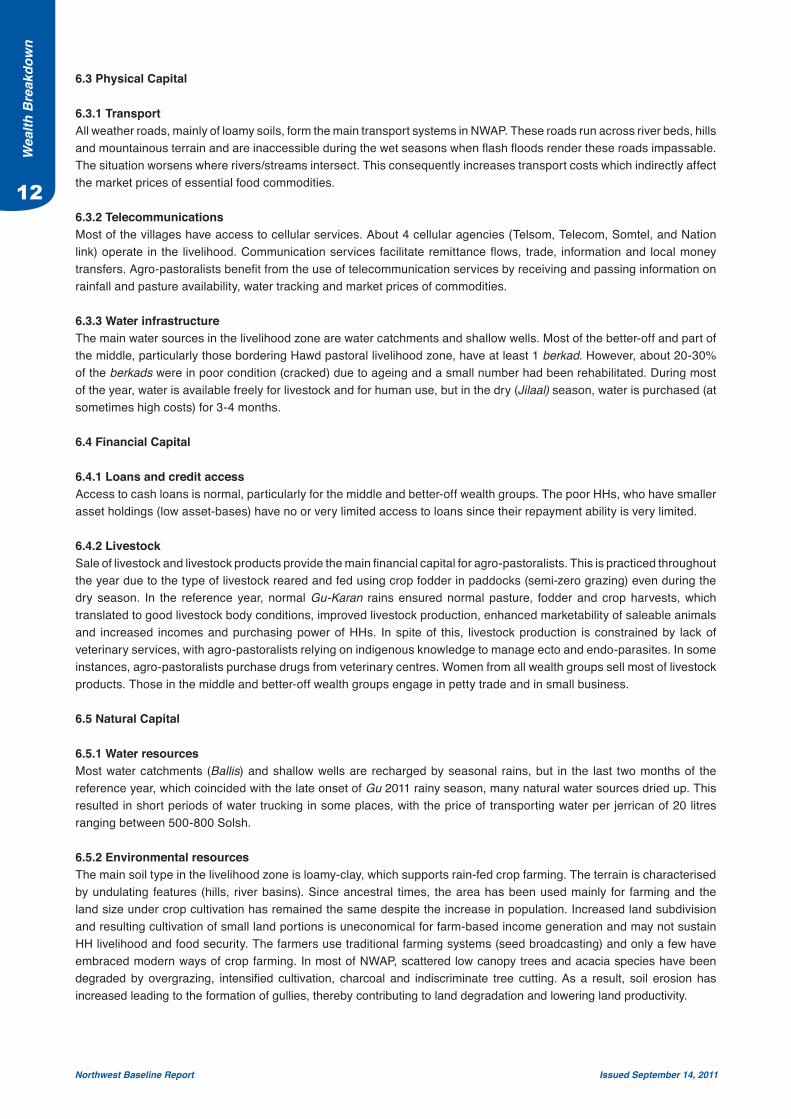
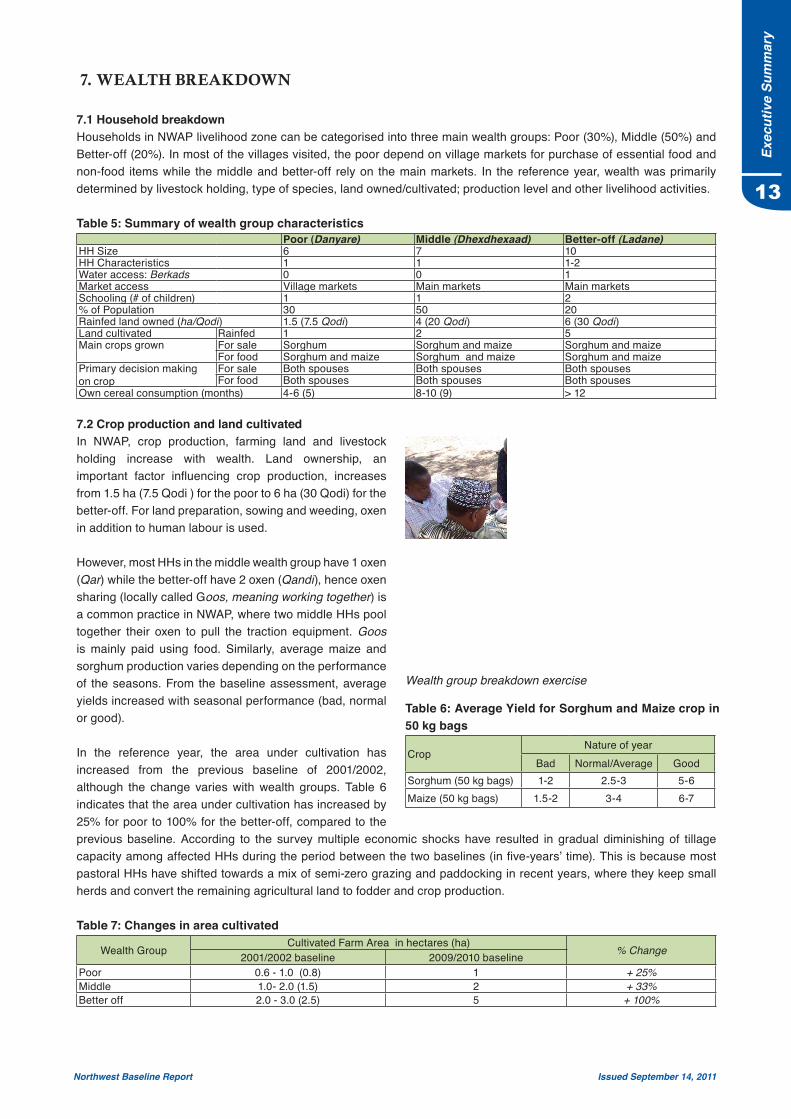
In the reference year, the price of locally produced maize and sorghum (white/red) declined by 21% (from Slsh 2974 to 2364) and by 14% (from Slsh 2,697 to 2,317), respectively, compared to the previous year, but increased by 56% and 64% when compared to the 5-year average. The price of 1 kg of imported red rice increased from Slsh 2,749 (68% increase from 5-year average price) to Slsh 4,606, but declined by 5% (from Slsh 4,838) when compared to the previous year (2009). Likewise, the average price of wheat flour increased by 32% when compared to the 5-year average (from 2,633 to 3,464 Slsh/kg) and declined by 11% from the previous year (from 3,872 to 3,464 Slsh/kg). The average price for all imported foods decreased in the reference year with the exception of sugar, which increased by 80% and by 11% compared to the 5-year average and to the previous year, respectively. This increase was due to reduced global supply, associated with reduced yields in the major sugar producing regions of the world and increasing demand for sugar for ethanol production. These factors triggered an increase in global sugar prices. Additionally, cooking oil price was 32% above the 5-year average (2003-2007), increasing from 7,128 to 9,406 Slsh/litre.
Figure 6: Trends in labour wage rates
Map 2: Cereal markets and cereal flow pattern in NWAP
Figure 7: Trends in wheat flour
Figure 8: Trends in white sorghum price

Northwest Baseline Report Issued September 14, 2011
10
Mar
kets
5.5 Terms of tradeThe main source of income for the poor households include sale of livestock, self employment and other casual employment opportunities. The purchasing power of the poor, improved in the reference year, due to improved income earnings on the one hand and decline in the market prices of essential food commodities, on the other. Labour to sorghum terms of trade (ToT) increased by 29% (from 10kg/daily wage to 12kg/daily wage) compared to the previous year. This is equivalent to at least 4 days’ consumption for a poor household of 7 people.
Conversely, ToT for the same item dropped by 34% from the 5-year average due to inflation and to the global food crisis which resulted in an increase in food commodity prices. Similarly, local goat to rice ToT increased by 37% (from 47 kg/head to 64 kg/head), while imported rice to milk ToT was lower than local rice to milk ToT. The 9% increase in cattle milk to white sorghum ToT compared to the previous year was attributed to good crop production in the Gu/Karan season.
Figure 9: Trends in Red rice price
Figure 10: Trends in Daily labour to sorghum ToT
Figure 12: Trends in daily labour to rice ToT Figure 13: Trends in local goat to rice ToT
Figure 14: Trends in cattle milk price
Figure 11: Trends in export quality goat/rice ToT
Figure 15: Trends in Exchange rate
Live
lihoo
d A
sset
s
10
Exec
utiv
e Su
mm
ary
11
Northwest Baseline Report Issued September 14, 2011
6. LIVELIHOOD ASSETS
6.1 Human Capital
6.1.1 Household size and compositionThe composition of households in NWAP livelihood varies by wealth group. Poor households (Danyare) contain 5-7 members, the middle (Dhexdhexaad) 6-8 members and the better off (Ladane) 9-11 members. Most HHs are male-headed (90% for the poor and 95% each for the middle and better-off) however, the proportion of female-headed HHs is slightly higher among the poor wealth group (10%) compared to the middle and better off (5%). Most poor HHs and middle groups are monogamous, while the better off have 1-2 wives (Table 4).
6.1.2 EducationBoth formal and non-formal schools are available in most villages, although the quality of formal education is low due to lack of qualified teachers, limited equipment and poor educational infrastructure. Enrolment and attendance is regular for children in the better-off wealth group, while children in the poor and middle wealth groups attend school irregularly or do not attend school at all. More boys (60%) than girls (40%) attend formal schools. The better-off send at least 2 boys and 1 girl to school, whereas the poor and middle only send 1 boy or girl to formal schools. As much as children from the better-off wealth group access more educational opportunities, lack of secondary schools limit progression.
6.1.3 Health and nutritionThe main health facilities available in NWAP are health posts, private clinics and hospitals. However, most of these facilities lack medical supplies and qualified personnel. In most remote villages, in spite of continuous polio eradication campaigns, and no outbreaks of epidemics in the reference year, the combination of remoteness, high transport and consultation costs (10,000-15,000 Solsh) as well as cost of drugs constrain access to basic health services.
The FSNAU Post Deyr‘10/11 integrated food security analysis classified the Northwest Agro-pastoral regions (Togdheer, Awdal and Galbeed) as Borderline Food Insecure (BFI), indicating stable food security situation from Gu’10.3 The nutrition situation illustrated a slight deterioration from Alert in Post Gu’10 to the current Serious situation.4 Results of the survey conducted in December 2010 indicated GAM rate of 10.4% (7.6-14.1) and SAM rate of 0.8% (0.3-1.9). High morbidity is the result of poor nutrition in the livelihood. The proportion of children who had fallen sick 2 weeks prior to the survey was 28.7%. Data from the health facilities in the area indicate a low (<5%) and stable number of acutely malnourished children. Availability of water, poor sanitation and health facilities remain limited, while unsafe drinking water, inadequate health facilities, poor sanitation, poor childcare and feeding practices remain critical health and nutrition concerns.
6.2 Social Capital
6.2.1 Social supportThere is a strong social support network among agro-pastoral communities in the northwest agro-pastoral livelihood. The better-off and some middle households receive remittances and access loans in times of crises. Goos, a form of inter-communal collaboration in undertaking different farming activities, is practiced communally from land preparation to harvest. Owing to relatively stable food sources (except for the poor) remittances of about USD 200-300 are common in the hunger periods. In addition, neighbourhood support (community money contributions for the most vulnerable), food gifts, kinship support and religious obligation are common in the north west agro-pastoral livelihood.
6.2.2 Formal support (Zakat) and Informal support (other gifts)Obligatory Zakat is normally given annually by the better-off. This social support is in the form of livestock and crops, and is targeted at the poor alongside other gifts in cash and in kind. Additionally, the middle and better-off HHs donate meat and milk to the poor HHs. Dry food contributions and loans in cash and/or in kind are also common.
3 http://www.fsnau.org/downloads/FSNAU-Post-Deyr-2010-11-Technical-Report.pdf4 http://fsnau.org/downloads/Technical-Series-Report-Post-Deyr-10-11-Nutrition-Analysis.pdf
Exec
utiv
e Su
mm
ary
12
Northwest Baseline Report Issued September 14, 2011
6.3 Physical Capital
6.3.1 TransportAll weather roads, mainly of loamy soils, form the main transport systems in NWAP. These roads run across river beds, hills and mountainous terrain and are inaccessible during the wet seasons when flash floods render these roads impassable. The situation worsens where rivers/streams intersect. This consequently increases transport costs which indirectly affect the market prices of essential food commodities.
6.3.2 TelecommunicationsMost of the villages have access to cellular services. About 4 cellular agencies (Telsom, Telecom, Somtel, and Nation link) operate in the livelihood. Communication services facilitate remittance flows, trade, information and local money transfers. Agro-pastoralists benefit from the use of telecommunication services by receiving and passing information on rainfall and pasture availability, water tracking and market prices of commodities.
6.3.3 Water infrastructureThe main water sources in the livelihood zone are water catchments and shallow wells. Most of the better-off and part of the middle, particularly those bordering Hawd pastoral livelihood zone, have at least 1 berkad. However, about 20-30% of the berkads were in poor condition (cracked) due to ageing and a small number had been rehabilitated. During most of the year, water is available freely for livestock and for human use, but in the dry (Jilaal) season, water is purchased (at sometimes high costs) for 3-4 months.
6.4 Financial Capital
6.4.1 Loans and credit accessAccess to cash loans is normal, particularly for the middle and better-off wealth groups. The poor HHs, who have smaller asset holdings (low asset-bases) have no or very limited access to loans since their repayment ability is very limited.
6.4.2 LivestockSale of livestock and livestock products provide the main financial capital for agro-pastoralists. This is practiced throughout the year due to the type of livestock reared and fed using crop fodder in paddocks (semi-zero grazing) even during the dry season. In the reference year, normal Gu-Karan rains ensured normal pasture, fodder and crop harvests, which translated to good livestock body conditions, improved livestock production, enhanced marketability of saleable animals and increased incomes and purchasing power of HHs. In spite of this, livestock production is constrained by lack of veterinary services, with agro-pastoralists relying on indigenous knowledge to manage ecto and endo-parasites. In some instances, agro-pastoralists purchase drugs from veterinary centres. Women from all wealth groups sell most of livestock products. Those in the middle and better-off wealth groups engage in petty trade and in small business.
6.5 Natural Capital
6.5.1 Water resourcesMost water catchments (Ballis) and shallow wells are recharged by seasonal rains, but in the last two months of the reference year, which coincided with the late onset of Gu 2011 rainy season, many natural water sources dried up. This resulted in short periods of water trucking in some places, with the price of transporting water per jerrican of 20 litres ranging between 500-800 Solsh.
6.5.2 Environmental resourcesThe main soil type in the livelihood zone is loamy-clay, which supports rain-fed crop farming. The terrain is characterised by undulating features (hills, river basins). Since ancestral times, the area has been used mainly for farming and the land size under crop cultivation has remained the same despite the increase in population. Increased land subdivision and resulting cultivation of small land portions is uneconomical for farm-based income generation and may not sustain HH livelihood and food security. The farmers use traditional farming systems (seed broadcasting) and only a few have embraced modern ways of crop farming. In most of NWAP, scattered low canopy trees and acacia species have been degraded by overgrazing, intensified cultivation, charcoal and indiscriminate tree cutting. As a result, soil erosion has increased leading to the formation of gullies, thereby contributing to land degradation and lowering land productivity.
Wea
lth B
reak
dow
n
12
Exec
utiv
e Su
mm
ary
13
Northwest Baseline Report Issued September 14, 2011
7. WEALTH BREAKDOWN
7.1 Household breakdownHouseholds in NWAP livelihood zone can be categorised into three main wealth groups: Poor (30%), Middle (50%) and Better-off (20%). In most of the villages visited, the poor depend on village markets for purchase of essential food and non-food items while the middle and better-off rely on the main markets. In the reference year, wealth was primarily determined by livestock holding, type of species, land owned/cultivated; production level and other livelihood activities.
Table 5: Summary of wealth group characteristicsPoor (Danyare) Middle (Dhexdhexaad) Better-off (Ladane)
HH Size 6 7 10 HH Characteristics 1 1 1-2 Water access: Berkads 0 0 1Market access Village markets Main markets Main markets Schooling (# of children) 1 1 2 % of Population 30 50 20 Rainfed land owned (ha/Qodi) 1.5 (7.5 Qodi) 4 (20 Qodi) 6 (30 Qodi)Land cultivated Rainfed 1 2 5Main crops grown For sale Sorghum Sorghum and maize Sorghum and maize
For food Sorghum and maize Sorghum and maize Sorghum and maize Primary decision making on crop
For sale Both spouses Both spouses Both spousesFor food Both spouses Both spouses Both spouses
Own cereal consumption (months) 4-6 (5) 8-10 (9) > 12
7.2 Crop production and land cultivatedIn NWAP, crop production, farming land and livestock holding increase with wealth. Land ownership, an important factor influencing crop production, increases from 1.5 ha (7.5 Qodi ) for the poor to 6 ha (30 Qodi) for the better-off. For land preparation, sowing and weeding, oxen in addition to human labour is used.
However, most HHs in the middle wealth group have 1 oxen (Qar) while the better-off have 2 oxen (Qandi), hence oxen sharing (locally called Goos, meaning working together) is a common practice in NWAP, where two middle HHs pool together their oxen to pull the traction equipment. Goos is mainly paid using food. Similarly, average maize and sorghum production varies depending on the performance of the seasons. From the baseline assessment, average yields increased with seasonal performance (bad, normal or good).
In the reference year, the area under cultivation has increased from the previous baseline of 2001/2002, although the change varies with wealth groups. Table 6 indicates that the area under cultivation has increased by 25% for poor to 100% for the better-off, compared to the previous baseline. According to the survey multiple economic shocks have resulted in gradual diminishing of tillage capacity among affected HHs during the period between the two baselines (in five-years’ time). This is because most pastoral HHs have shifted towards a mix of semi-zero grazing and paddocking in recent years, where they keep small herds and convert the remaining agricultural land to fodder and crop production.
Table 7: Changes in area cultivated
Wealth GroupCultivated Farm Area in hectares (ha)
% Change2001/2002 baseline 2009/2010 baselinePoor 0.6 - 1.0 (0.8) 1 + 25%Middle 1.0- 2.0 (1.5) 2 + 33%Better off 2.0 - 3.0 (2.5) 5 + 100%
Wealth group breakdown exercise
Table 6: Average Yield for Sorghum and Maize crop in 50 kg bags
CropNature of year
Bad Normal/Average GoodSorghum (50 kg bags) 1-2 2.5-3 5-6Maize (50 kg bags) 1.5-2 3-4 6-7
Northwest Baseline Report Issued September 14, 2011
Exec
utiv
e Su
mm
ary
14
8. HERD DYNAMICS AND LIVESTOCK HOLDING
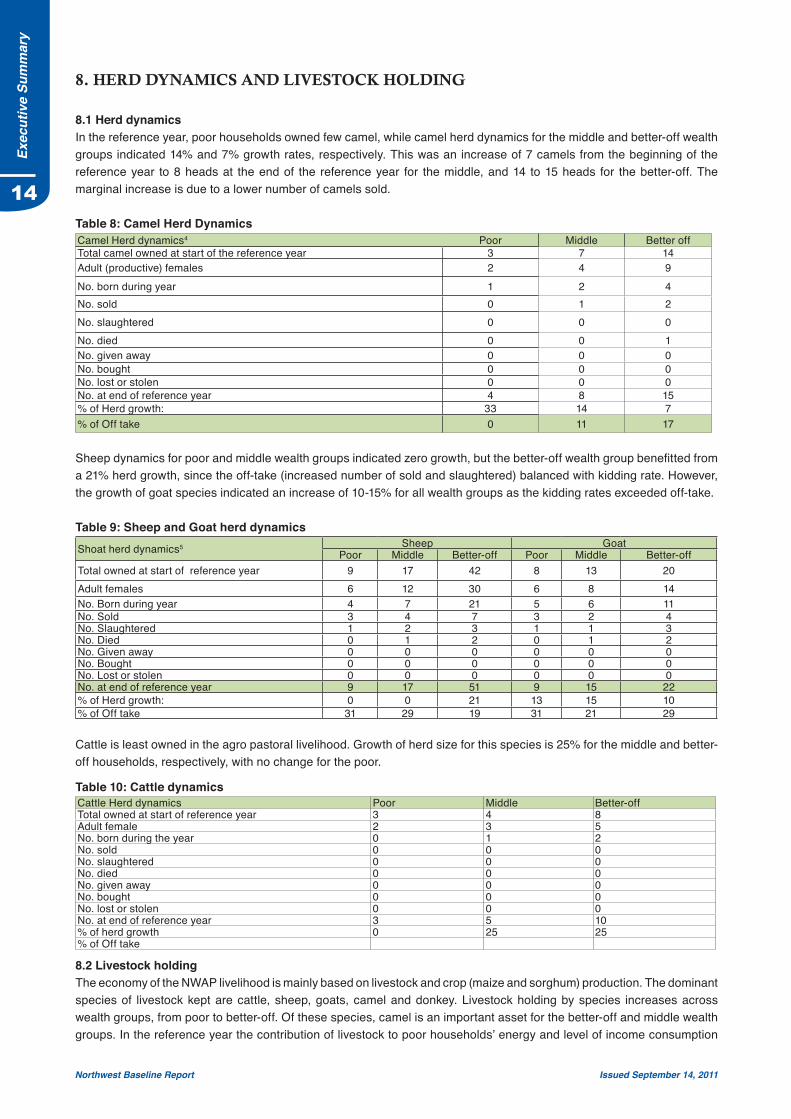
8.1 Herd dynamicsIn the reference year, poor households owned few camel, while camel herd dynamics for the middle and better-off wealth groups indicated 14% and 7% growth rates, respectively. This was an increase of 7 camels from the beginning of the reference year to 8 heads at the end of the reference year for the middle, and 14 to 15 heads for the better-off. The marginal increase is due to a lower number of camels sold.
Table 8: Camel Herd DynamicsCamel Herd dynamics4 Poor Middle Better offTotal camel owned at start of the reference year 3 7 14Adult (productive) females 2 4 9No. born during year 1 2 4No. sold 0 1 2No. slaughtered 0 0 0No. died 0 0 1No. given away 0 0 0No. bought 0 0 0No. lost or stolen 0 0 0No. at end of reference year 4 8 15% of Herd growth: 33 14 7% of Off take 0 11 17
Sheep dynamics for poor and middle wealth groups indicated zero growth, but the better-off wealth group benefitted from a 21% herd growth, since the off-take (increased number of sold and slaughtered) balanced with kidding rate. However, the growth of goat species indicated an increase of 10-15% for all wealth groups as the kidding rates exceeded off-take.
Table 9: Sheep and Goat herd dynamicsShoat herd dynamics5 Sheep Goat
Poor Middle Better-off Poor Middle Better-offTotal owned at start of reference year 9 17 42 8 13 20Adult females 6 12 30 6 8 14No. Born during year 4 7 21 5 6 11No. Sold 3 4 7 3 2 4No. Slaughtered 1 2 3 1 1 3No. Died 0 1 2 0 1 2No. Given away 0 0 0 0 0 0No. Bought 0 0 0 0 0 0No. Lost or stolen 0 0 0 0 0 0No. at end of reference year 9 17 51 9 15 22% of Herd growth: 0 0 21 13 15 10% of Off take 31 29 19 31 21 29
Cattle is least owned in the agro pastoral livelihood. Growth of herd size for this species is 25% for the middle and better-off households, respectively, with no change for the poor.
Table 10: Cattle dynamicsCattle Herd dynamics Poor Middle Better-offTotal owned at start of reference year 3 4 8Adult female 2 3 5No. born during the year 0 1 2No. sold 0 0 0No. slaughtered 0 0 0No. died 0 0 0No. given away 0 0 0No. bought 0 0 0No. lost or stolen 0 0 0No. at end of reference year 3 5 10% of herd growth 0 25 25% of Off take
8.2 Livestock holding The economy of the NWAP livelihood is mainly based on livestock and crop (maize and sorghum) production. The dominant species of livestock kept are cattle, sheep, goats, camel and donkey. Livestock holding by species increases across wealth groups, from poor to better-off. Of these species, camel is an important asset for the better-off and middle wealth groups. In the reference year the contribution of livestock to poor households’ energy and level of income consumption
15
Northwest Baseline Report Issued September 14, 2011
Har
d D
ynam
ics
and
Live
stoc
k H
oldi
ng
15
was very limited due to low asset holding (Table 10). Although shoats are owned by all wealth groups, they are very significant in contributing to the poor households’ food and income sources. The middle and better-off wealth groups sold more shoats and camel than the poor. Typically, poor households depend on agricultural labour, sale of livestock and livestock products as well as on crop product sales for income. Own food consumption period varies across wealth groups; the poor survive on their own production for 4-6 months; the middle wealth group for 8-10 months and better-off throughout the year. Thus the hunger period for the poor peaks in February-April.
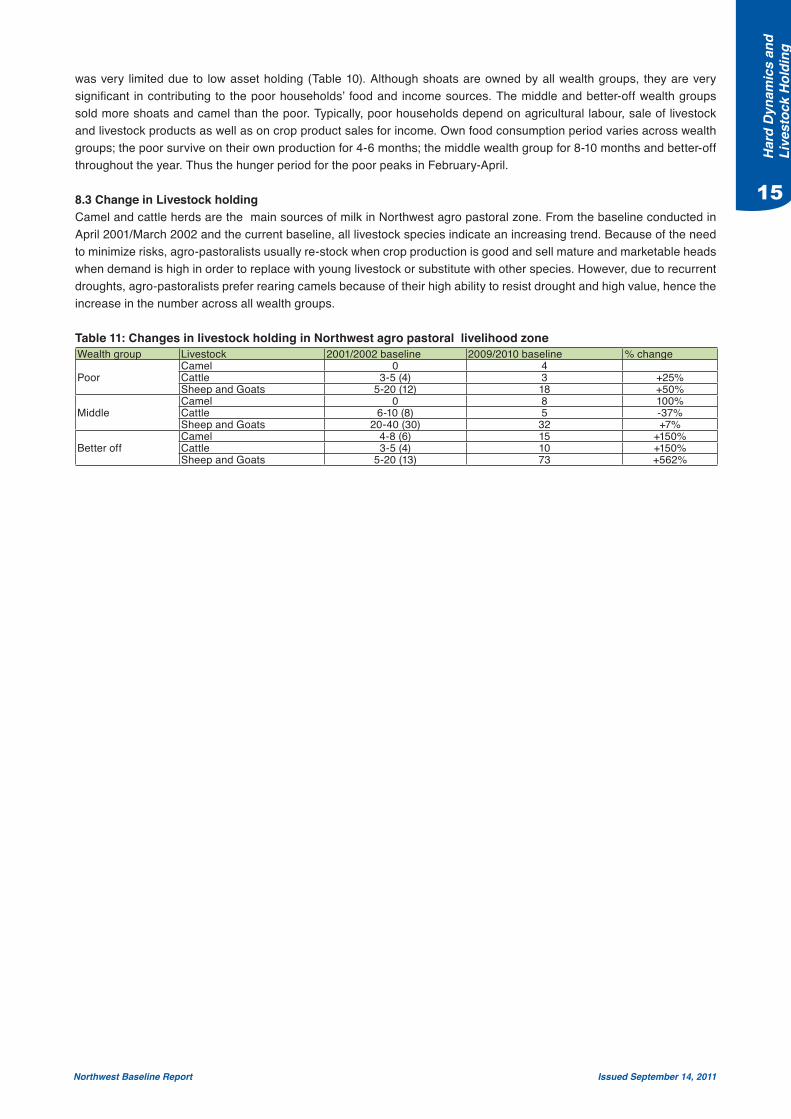
8.3 Change in Livestock holding Camel and cattle herds are the main sources of milk in Northwest agro pastoral zone. From the baseline conducted in April 2001/March 2002 and the current baseline, all livestock species indicate an increasing trend. Because of the need to minimize risks, agro-pastoralists usually re-stock when crop production is good and sell mature and marketable heads when demand is high in order to replace with young livestock or substitute with other species. However, due to recurrent droughts, agro-pastoralists prefer rearing camels because of their high ability to resist drought and high value, hence the increase in the number across all wealth groups.
Table 11: Changes in livestock holding in Northwest agro pastoral livelihood zoneWealth group Livestock 2001/2002 baseline 2009/2010 baseline % change
PoorCamel 0 4Cattle 3-5 (4) 3 +25%Sheep and Goats 5-20 (12) 18 +50%
MiddleCamel 0 8 100%Cattle 6-10 (8) 5 -37%Sheep and Goats 20-40 (30) 32 +7%
Better offCamel 4-8 (6) 15 +150%Cattle 3-5 (4) 10 +150%Sheep and Goats 5-20 (13) 73 +562%
16
Northwest Baseline Report Issued September 14, 2011
Live
lihoo
d St
rate
gies
9. LIVELIHOOD STRATEGIES
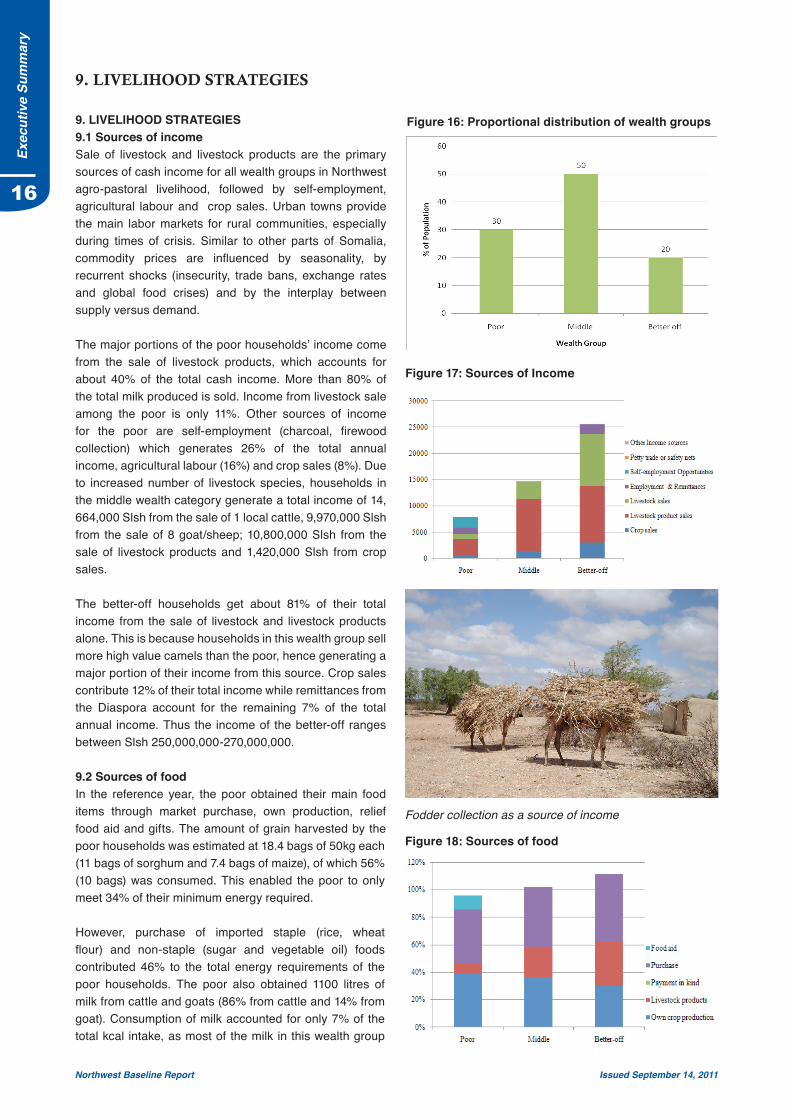
9. LIVELIHOOD STRATEGIES 9.1 Sources of income Sale of livestock and livestock products are the primary sources of cash income for all wealth groups in Northwest agro-pastoral livelihood, followed by self-employment, agricultural labour and crop sales. Urban towns provide the main labor markets for rural communities, especially during times of crisis. Similar to other parts of Somalia, commodity prices are influenced by seasonality, by recurrent shocks (insecurity, trade bans, exchange rates and global food crises) and by the interplay between supply versus demand.
The major portions of the poor households’ income come from the sale of livestock products, which accounts for about 40% of the total cash income. More than 80% of the total milk produced is sold. Income from livestock sale among the poor is only 11%. Other sources of income for the poor are self-employment (charcoal, firewood collection) which generates 26% of the total annual income, agricultural labour (16%) and crop sales (8%). Due to increased number of livestock species, households in the middle wealth category generate a total income of 14, 664,000 Slsh from the sale of 1 local cattle, 9,970,000 Slsh from the sale of 8 goat/sheep; 10,800,000 Slsh from the sale of livestock products and 1,420,000 Slsh from crop sales.
The better-off households get about 81% of their total income from the sale of livestock and livestock products alone. This is because households in this wealth group sell more high value camels than the poor, hence generating a major portion of their income from this source. Crop sales contribute 12% of their total income while remittances from the Diaspora account for the remaining 7% of the total annual income. Thus the income of the better-off ranges between Slsh 250,000,000-270,000,000.
9.2 Sources of foodIn the reference year, the poor obtained their main food items through market purchase, own production, relief food aid and gifts. The amount of grain harvested by the poor households was estimated at 18.4 bags of 50kg each (11 bags of sorghum and 7.4 bags of maize), of which 56% (10 bags) was consumed. This enabled the poor to only meet 34% of their minimum energy required.
However, purchase of imported staple (rice, wheat flour) and non-staple (sugar and vegetable oil) foods contributed 46% to the total energy requirements of the poor households. The poor also obtained 1100 litres of milk from cattle and goats (86% from cattle and 14% from goat). Consumption of milk accounted for only 7% of the total kcal intake, as most of the milk in this wealth group
Figure 17: Sources of Income
Figure 18: Sources of food
Figure 16: Proportional distribution of wealth groups
Fodder collection as a source of income
Exec
utiv
e Su
mm
ary
16
17
Northwest Baseline Report Issued September 14, 2011
Live
lihoo
d St
rate
gies
was sold. Since the reference year was slightly below average, crop failure experienced before the Gu-karan season meant that most poor households did not meet their minimum survival threshold, and obtained 10% of food aid and gifts.
The middle and better-off wealth groups obtained a significantly higher proportion of their total food requirements from the combination of own crop production and purchase. Despite own crop production contributing a slightly lower percentage of food source compared to the poor, the middle and better-off wealth groups had better access to larger number of livestock sales, which were used to purchase food. Hence crop and livestock products contributed about 64% and 67% of their kcal intake, since a significant portion of milk produced was consumed. Staple and non-staple food purchase covers about 44% and 49% of the total kcal intake for middle and better-off households, respectively. This means that households in the two wealth groups met their minimum energy requirements in the reference year, translating to a total of 108% and 116% kcal per person/day, respectively.
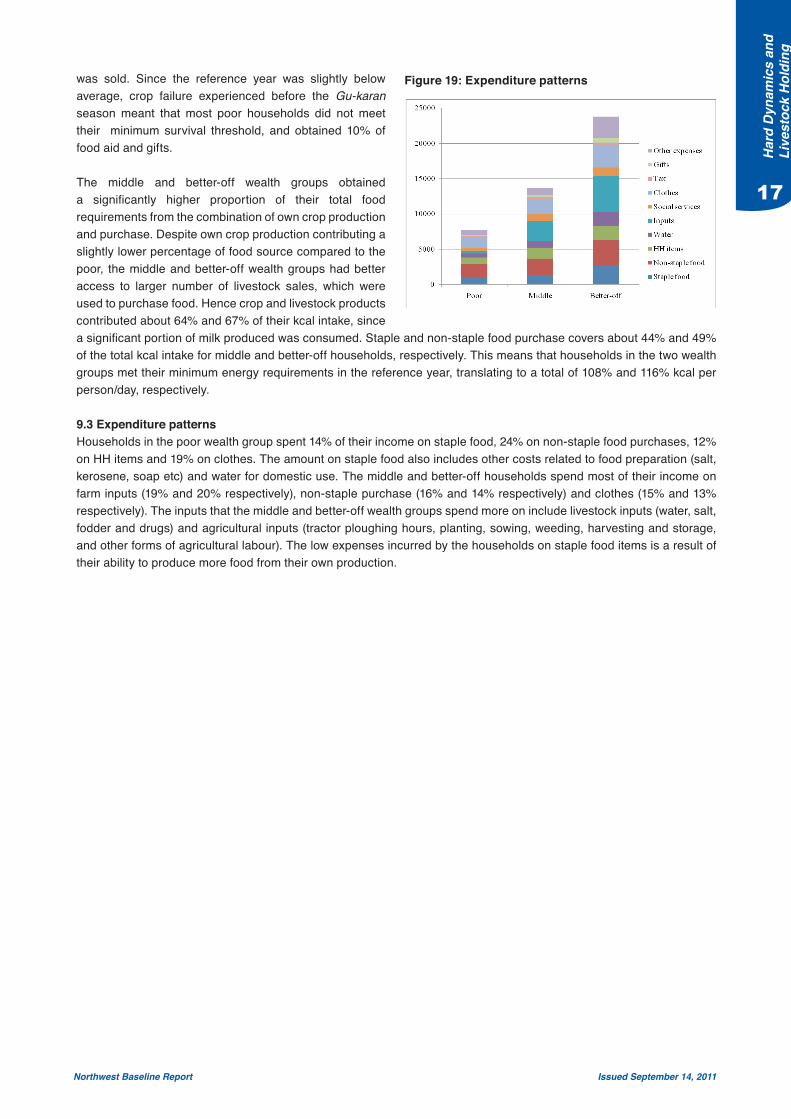
9.3 Expenditure patterns Households in the poor wealth group spent 14% of their income on staple food, 24% on non-staple food purchases, 12% on HH items and 19% on clothes. The amount on staple food also includes other costs related to food preparation (salt, kerosene, soap etc) and water for domestic use. The middle and better-off households spend most of their income on farm inputs (19% and 20% respectively), non-staple purchase (16% and 14% respectively) and clothes (15% and 13% respectively). The inputs that the middle and better-off wealth groups spend more on include livestock inputs (water, salt, fodder and drugs) and agricultural inputs (tractor ploughing hours, planting, sowing, weeding, harvesting and storage, and other forms of agricultural labour). The low expenses incurred by the households on staple food items is a result of their ability to produce more food from their own production.
Figure 19: Expenditure patterns
Har
d D
ynam
ics
and
Live
stoc
k H
oldi
ng
17
18
Northwest Baseline Report Issued September 14, 2011
Maj
or h
azar
ds10. MAJOR HAZARDS
The main chronic hazards affecting HHs in north west agro-pastoral livelihood in order of importance, are: drought, inflation, insecurity (clan rivalry), pests, Quelea quelea birds, diseases (human & livestock), chronic water shortages, and environmental degradation.
10.1 DroughtThe north west region experienced 4 successive below normal rainy seasons which affected the key agro-pastoral livelihood systems. In the reference year, poor performance of Deyr rains negatively affected pasture and water availability as well as crop and livestock production. This resulted in a decline in the yields of cereal production (sorghum and maize), deteriorated livestock body conditions (which in turn reduced calving, kidding and livestock conceiving rates), increased water trucking and seeking social support, and resulted in a loss of agricultural labour opportunities, reduced wild food production as well as migration across the border to zone 5 of Ethiopia. Persistent droughts in NWAP ruin investments in crop production and livestock and hinder access to household basic services including school, clothing and health services. The main constraints to accessing food and income in NWAP are recurrent droughts and erratic rains, which reduce pasture and fodder availability, resulting in poor livestock body conditions and low market value. Drought also leads to crop losses, reduces milk and butter production, thus affecting livelihood security.
10.2 Pests and DiseasesCrop pests, human and livestock diseases as well as quelea birds (Quelea quelea), that attack sorghum and maize crops, are the two main hazards affecting the overall livelihood and food security situation in NWAP. Major livestock disease outbreaks, such as tick-borne disease and Contagious Caprine Pleura Pneumonia (CCPP), can cause significant deterioration in livestock body conditions, cause livestock deaths, reduce livestock sales and livelihood asset holding. This is further exacerbated by the limited availability of veterinary drugs and services. For instance, the suspected Rift Valley Fever (RVF) in Somalia triggered livestock import ban by the government of Saudi Arabia. This affected the livestock export market, income sources, and the purchasing power of the households within and outside the livelihood zone. Livestock disease hazards can have a greater impact on better-off households who have larger livestock holdings.
10.3 Market DisruptionAlthough most of the better-off produce sorghum and maize that is sufficient to sustain their cereal requirements for most of the year until the next harvest, the poor and middle rely on market purchases to fill the deficit of 7 and 3 months, respectively. In addition, the markets are important sources of own produced cereal crops and of non-essential food and non-food requirements such as sugar, tea leaves and cooking oil. Any fluctuations in the market, such as rough monsoon winds that hinder shipping activities, ban in livestock export trade and price increases, reduce household income and purchasing power, which in extreme situations can impair household survival. Therefore, almost all households in the livelihood are vulnerable to factors that disrupt markets. Unprecedented port closures also affect the supply and costs of imported foods as well as employment opportunities. Locally, opportunistic conflicts (political and tribal-driven) can disrupt flow of commodities and access to labour, goods and services. This not only has negative implications for households’ access to food and income, but also cause displacements and disruption of social networks.
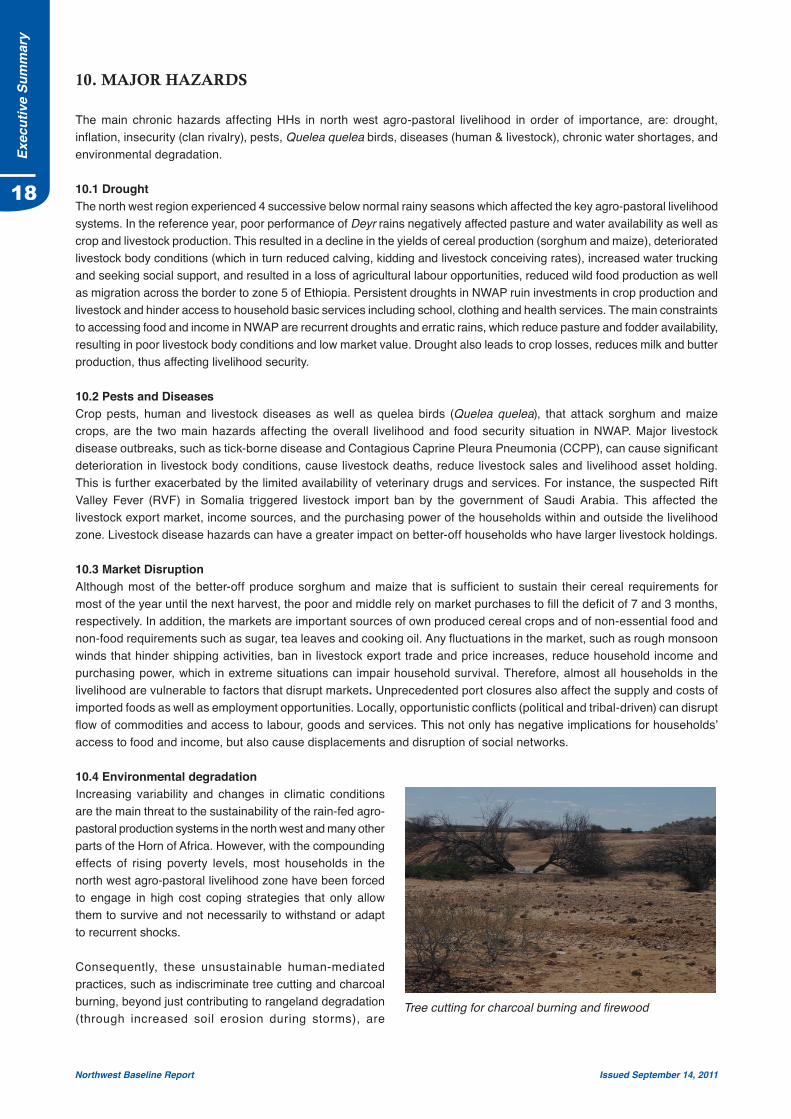
10.4 Environmental degradationIncreasing variability and changes in climatic conditions are the main threat to the sustainability of the rain-fed agro-pastoral production systems in the north west and many other parts of the Horn of Africa. However, with the compounding effects of rising poverty levels, most households in the north west agro-pastoral livelihood zone have been forced to engage in high cost coping strategies that only allow them to survive and not necessarily to withstand or adapt to recurrent shocks.
Consequently, these unsustainable human-mediated practices, such as indiscriminate tree cutting and charcoal burning, beyond just contributing to rangeland degradation (through increased soil erosion during storms), are
Tree cutting for charcoal burning and firewood
Exec
utiv
e Su
mm
ary
18
19
Northwest Baseline Report Issued September 14, 2011
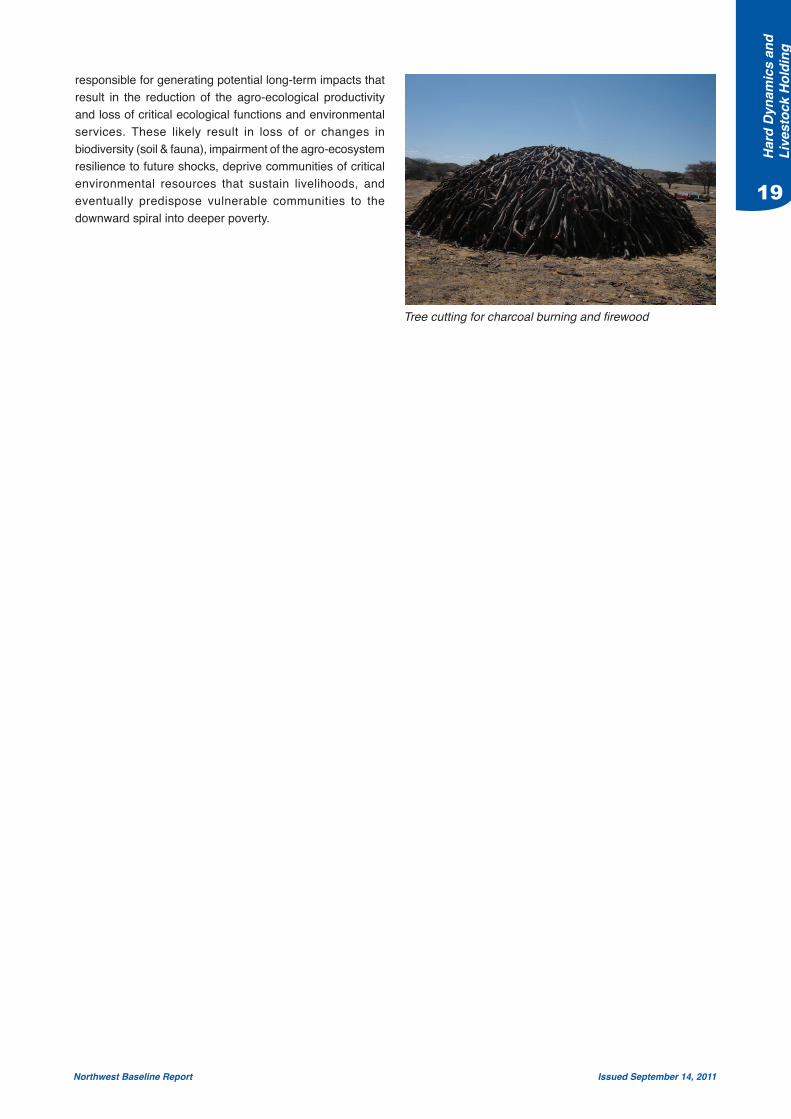
responsible for generating potential long-term impacts that result in the reduction of the agro-ecological productivity and loss of critical ecological functions and environmental services. These likely result in loss of or changes in biodiversity (soil & fauna), impairment of the agro-ecosystem resilience to future shocks, deprive communities of critical environmental resources that sustain livelihoods, and eventually predispose vulnerable communities to the downward spiral into deeper poverty.
Tree cutting for charcoal burning and firewood
Har
d D
ynam
ics
and
Live
stoc
k H
oldi
ng
19
Exec
utiv
e Su
mm
ary
20
Northwest Baseline Report Issued September 14, 2011
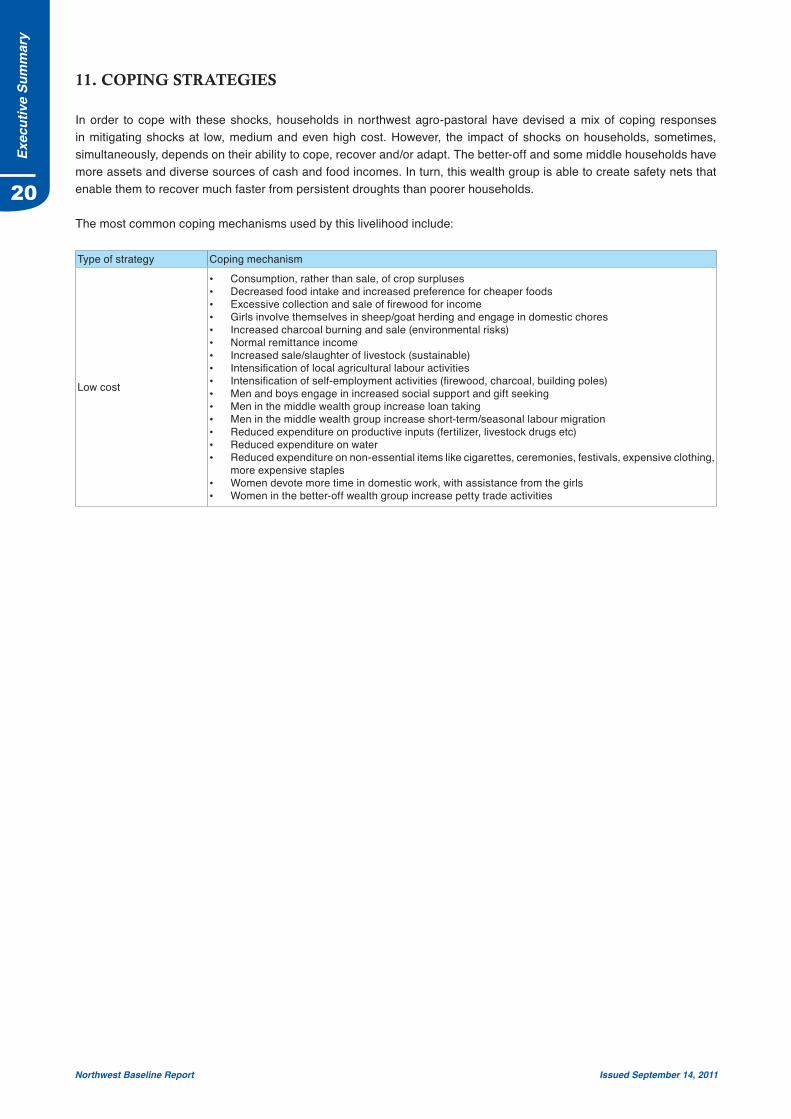
11. COPING STRATEGIES
In order to cope with these shocks, households in northwest agro-pastoral have devised a mix of coping responses in mitigating shocks at low, medium and even high cost. However, the impact of shocks on households, sometimes, simultaneously, depends on their ability to cope, recover and/or adapt. The better-off and some middle households have more assets and diverse sources of cash and food incomes. In turn, this wealth group is able to create safety nets that enable them to recover much faster from persistent droughts than poorer households.
The most common coping mechanisms used by this livelihood include:
Type of strategy Coping mechanism
Low cost
• Consumption, rather than sale, of crop surpluses • Decreased food intake and increased preference for cheaper foods • Excessive collection and sale of firewood for income• Girls involve themselves in sheep/goat herding and engage in domestic chores• Increased charcoal burning and sale (environmental risks)• Normal remittance income • Increased sale/slaughter of livestock (sustainable)• Intensification of local agricultural labour activities• Intensification of self-employment activities (firewood, charcoal, building poles)• Men and boys engage in increased social support and gift seeking• Men in the middle wealth group increase loan taking • Men in the middle wealth group increase short-term/seasonal labour migration• Reduced expenditure on productive inputs (fertilizer, livestock drugs etc)• Reduced expenditure on water• Reduced expenditure on non-essential items like cigarettes, ceremonies, festivals, expensive clothing,
more expensive staples• Women devote more time in domestic work, with assistance from the girls• Women in the better-off wealth group increase petty trade activities
Exec
utiv
e Su
mm
ary
21
Northwest Baseline Report Issued September 14, 2011
Con
clus
ion
and
Rec
omen
datio
ns
12. CONCLUSION AND RECOMMENDATIONS
12.1 CONCLUSION The findings of the baseline assessment show that good Gu/Karan rains resulted in improved water and pasture. Average climatic conditions facilitated good crop production, which sustained the poor (4-6 months), middle (8-10 months) and better-off (more than 12 months). Generally, the market prices of all cereals (locally produced and imported) and vegetable oil increased from the 5-year average (except sugar), but decreased marginally from the previous year. Locally produced sorghum (white/red) price declined by 21% and 14%, respectively, from the previous year, and increased by 56% and by 64% from the 5-year average. Livestock prices increased due to a combination of lift in trade ban, regulatory interventions by government authorities, good Gu/Karan seasonal performance, high export demand during Hajj and increased local consumption. Agricultural wage labour rates increased by 8% and by 3% from the 5-year average and from 2009, respectively.
Households in the poor and middle wealth groups account for about 70% of the population. The area under cultivation increased from the 2001/2002 baseline, although the change varies with wealth group. Camel herd dynamics for the poor is lower than the middle and better-off, who experienced 14% and 7% growth rates, respectively. Sheep dynamics for poor and middle wealth groups indicated zero growth because off-take and kidding rates cancelled out. Cattle herd growth was 25% for middle and better-off households respectively. Livestock holding indicated a comparatively higher positive change among the better-off. Sale of livestock and livestock products are the primary income sources for all wealth groups, followed by self-employment, agricultural labour and crop sales. Among the poor, sale of livestock products accounts for 40% of the total income, while households in the better-off category get about 81% of their total income from the sale of livestock and livestock products alone, 12% from crop sales and 7% from remittances.
The poor obtained their main food items through market purchase, relief food aid, own production (small portion) and gifts. Own production accounts for 34% of their minimum energy requirements, while purchase of imported staple (rice, wheat flour) and non-staple (sugar and vegetable oil) foods contribute 46% to the total energy kcal intake. The middle and better-off wealth groups obtained a higher proportion of their total food requirements from the combination of own crop production and purchase. Crop and livestock products contribute by about 64% and 67% to the kcal intake, while staple and non-staple food purchase covers about 44% and 49% of the total kcal intake for middle and better-off, respectively. This implies that both wealth groups meet 108% and 116% of the kcal per person/day respectively.
The poor wealth group spends most of their income on staple and non-staple foods, including costs related to food preparation (salt, kerosene), soap and water for domestic use. The middle and better-off spend most of their incomes on farm inputs, non-staple purchase and clothes. The low expenses incurred by the households on staple food items is the result of their ability to produce more food from own production. The main chronic hazards affecting HHs in north west agro-pastoral livelihood ranked by importance are: drought, inflation, insecurity, pests and diseases, chronic water shortages, environmental degradation. In coping with these shocks, households have devised a mix of coping responses ranging from reduction in expenditure on non-essential items, increased social support/remittance seeking, increased labour migration and charcoal burning, decreased food intake and increased preference for cheaper foods.
12.2 RECOMMENDATIONSIn view of the above, the main development priorities for consideration in designing interventions strategies within the northwest agro-pastoral livelihood zone are the following:
• Improvement and expansion in water infrastructure through drilling of new boreholes and repairing dilapidated ones, particularly in Rako, Waaciye, College and Adinsone in Qardho district.
• Build community capacity for the promotion, adoption and use of rainwater harvesting techniques in order to improve food security as well as adapt to periodic climate-induced water stress.
• Develop and implement rangeland management programmes (water and soil conservation) in consultation with the local community, government authorities and local and international non-governmental organisations.
• Implementation and control of charcoal production and private enclosures in order to reduce environmental degradation and enhance sustainability.
• Improve access to veterinary, educational and health services through establishment of schools and health posts in remote areas as well as extension of essential livestock services to the rural areas.
• Capacity building and resource mobilisation to identify and establish alternative income generating options. This should aim at reducing the potential long-term impacts of unsustainable income generating activities like charcoal burning and venturing on alternatives that integrate appropriate technology (rainwater harvesting and irrigation farming), value addition and diversification of agricultural activities.
• Enhance integrated farming techniques that utilise mechanised methods as well as conserve agriculture that aims at soil and water conservation.

Exec
utiv
e Su
mm
ary
22
Northwest Baseline Report Issued September 14, 2011
REFERENCES
Barry, R.G., and Richard J.C. (1992). Atmosphere, weather, and climate. London: Routledge. ISBN: 9780415077606.Chambers, R., and Conway, G.R. (1992). Sustainable Rural Livelihoods: Practical Concepts for the 21st Century, Institute
of Development Studies Discussion Papers, 296. Cambridge. Desai, N.N., N. Rangachari, and Subramanian, S.K. (1976). Structure of low-level jet-stream over the Arabian Sea and the
Peninsulaas revealed by observations in June and July during the monsoon experiment 1973 and probable origin, Indian J. Met. Hydro. Geophys., 27,263-274.
Devereux, S. (2001). Livelihood Insecurity and Social Protection: A Re-emerging Issue in Rural Development. Development Policy Review, 19(4): 507-519.
DFID (2000). Sustainable Livelihoods Guidance Sheets. Department for International Development. www.livelihood.org/info/info_guidancesheets.html
Faillace, C and Faillace, E.R. (1987). Water Quality Data Book of Somalia. General Report. GTZ Project No. 80.2193.3-09.112. GTZ and Water Development Agency (WDA), Somalia.
FAO – SWALIM, (2009). Atlas of Somali Water and Land Resources. 1st edition, Nairobi, Kenya.FAO – SWALIM, (2009). Atlas of Somali Water and Land Resources. First edition, Nairobi, Kenya.FAO-SWALIM Technical Report L-10: Vargas, R. R., Omuto, C.T., Alim, M.S., Ismail, A., Njeru, L. (2009). Land degradation
assessment and recommendation for a monitoring framework in Somaliland. Nairobi, Kenya.Food Economy Group (FEG) Consulting and Save the Children (2008). The Practitioners’ Guide to the Household
Economy Approach, Regional Hunger and Vulnerability Programme, JohannesburgFood Security and Nutrition Analysis Unit – Somalia, (2011). Nutrition Analysis Post Deyr 2010/11. Technical Series
Report No VI. 35, issued February 25, 2011Food Security and Nutrition Analysis Unit – Somalia, 2011. Food security and Nutrition Analysis Post Deyr 2010/11.
Technical Series Report No VI. 36, issued March 4, 2011Gomes, N. Oduori, S.M., and Musse, S.A. (2006). Environmental study of degradation in the Sool plateau and Gebi
valley: Sanaag Region of Northern Somalia, Final Report, February 2006, Nairobi: Horn ReliefGriffiths, J.F. (ed.) (1972). Climates of Africa. Amsterdam, London, New York; Elsevier Publishing Company,. Pp. xvi+ 604Hadden, R. L. (2007). The Geology of Somalia – A Selected Bibliography of Somalian Geology Geography and Earth
Science. Topographic Engineering Center, US Army Corps of Engineers, Virginia, USAHemming, C.F. (1966). The vegetation of the northern region of the Somali Republic. Proceedings of the Linnean Society
of London. Vol. 177, No. 2, Pg. 173 – 250.Hutchinson, P., and Polishchouk, O. (1989). The Agroclimatology of Somalia. Somali Democratic Republic, Ministry of
Agriculture, Food Early Warning Department, Mogadishu, 186 ppKrishnamurti, T.N., P. Ardanuy, Y. Ramanathan, and Pasch, R. (1981). On the onset vortex of the summer monsoon, Mon.
Wea. Rev., 109, 344-363.Mohamed I. F. (1994). Politics and Society in Somalia’s North-Eastern Region. Life & Peace Review 8 (4). Retrieved
2011-04-19.Muchiri P.W. (2007). Climate of Somalia. Technical Report No W-01, FAO-SWALIM, Nairobi, Kenya.Muchiri, P. W. (2009). Inventory of Northern Somalia Drainage Basins. Technical Report No W-18, FAO-SWALIM, Nairobi,
KenyaMuchiri, P.W. (2007). Climate of Somalia. Technical Report No.W-01,FAO-SWALIM, Nairobi, Kenya.Soumare, B., Tempia, S., Cagnolati, V. Mohamoud, A. Van Huylenbroeck, G., and Berkvens, D. (2007). Screening for Rift
Valley fever infection in northern Somalia: A GIS based survey method to overcome the lack of sampling frame. Veterinary Microbiology, 121, 249–256.
SwissGroup (2006). An Ex-Post Assessment for Planning Purposes: Rural Water Supply and Community Management in Hargeisa, North West Somalia. Som – 11FC 289
UNICEF (2007). Children and The Millennium Development goals. Division of Communication, United Nations Children’s Fund (UNICEF), New York, NY 10017, USA. ISBN: 978-92-806-4164-6
United Nations (UN) 2003. Inter-Agency Assessment of Sool Plateau and Gebi Valley Sool & Sanaag regions, October 2003, Nairobi
Yadav, B. R., and Kelkar, R.R. (1989). Lower level windflow over the Indian Ocean’ during the onset of monsoon -1987, Mausam, 40,323-328.

23
Northwest Baseline Report Issued September 14, 2011
Ann
exes
Annex 1: Livestock holding by wealth group
Livestock species Poor Middle Better-offCamel Total 0 4-5 9-11 (10)
Adult female 2 4
Cattle Total 3-4 7-8 13-15 (14)Adult female 1 3 5
Goats Total 6 15 34Adult female 3 7 15
Sheep Total 10 20 35Adult female 4 8 18
Shoats Total 14-18 (16) 30-40 (35) 57-67 (62)Adult female 5-9 (7) 14-18 (16) 30-40 (35)% of sheep : goat ratio 50/50 70/30 75/25
Other assets (Donkey) 1 2 3
Annex 2:Number of livestock sold in the reference year
Poor Middle Better offExport Local Export Local Export Local
Camel 0 0 0 1 1 1Goat 5 4 7 6 10 8Sheep 4 5 6 5 10 8Total Camel (Export + Local) 0 1 3Total Shoat (Export + Local) 18 24 36
Annex 3: Source of income Poor Middle Better-off
Slsh % Slsh % Slsh %Crop sales 600 8 1420 10 3000 12Livestock product sales 3104 40 9844 67 10800 42Livestock sales 850 11 3400 23 9970 39Employment and Remittances 1250 16 0 0 1800 7Self-employment Opportunities 2040 26 0 0 0 0Petty trade or safety nets 0 0 0 0 0 0Other Income sources 0 0 10 0 12Total 7844 100 14664 100 25570 100
Annex 4: Percentage contribution of each food sourcePoor Middle Better-off
Own crop production 39 36 30Livestock products 7 22 32Payment in kind 0 0 0Purchase 39 44 49Food aid 10 0 0Gifts and other sources 0 0 0
Annex 5: Expenditure patterns by wealth groupSlsh % of Income Slsh % of Income Slsh % of Income
Poor Middle Better-offStaple food 1056 13.5 1380 9.4 2766 10.8Non-staple food 1872 23.9 2304 15.7 3564 13.9HH items 920 11.7 1568 10.7 2020 7.9Water 555 7.1 975 6.7 1965 7.9Inputs 350 4.5 2775 18.9 5050 19.8Social services 450 5.7 950 6.5 1250 4.9Clothes 1500 19.1 2200 15.0 3200 12.5Tax 200 2.6 250 1.7 300 1.2Gifts 150 1.9 300 2.1 700 2.7Other expenses 700 8.9 1000 6.8 3000 11.7Total expenses 7753 13702 23815
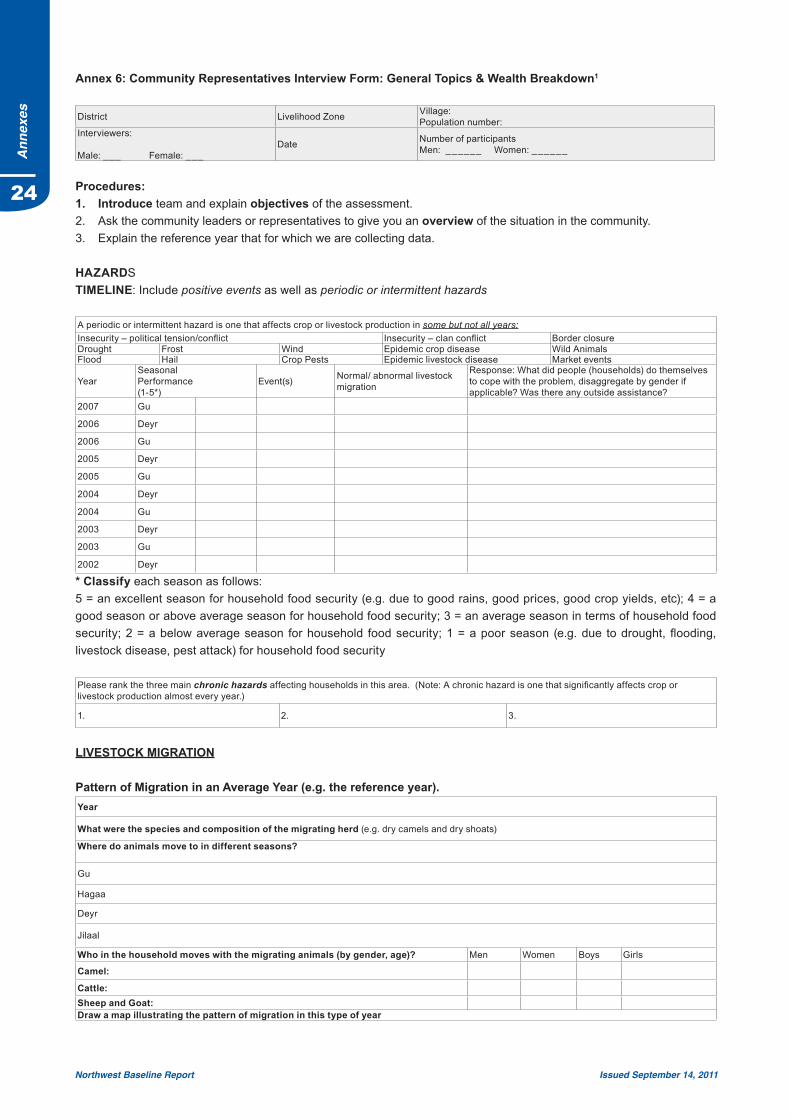
24
Northwest Baseline Report Issued September 14, 2011
Ann
exes
Annex 6: Community Representatives Interview Form: General Topics & Wealth Breakdown1
District Livelihood Zone Village:Population number:
Interviewers:
Male: ___ Female: ___Date Number of participants
Men: ______ Women: ______
Procedures:1. Introduce team and explain objectives of the assessment. 2. Ask the community leaders or representatives to give you an overview of the situation in the community. 3. Explain the reference year that for which we are collecting data.
HAZARDSTIMELINE: Include positive events as well as periodic or intermittent hazards
A periodic or intermittent hazard is one that affects crop or livestock production in some but not all years:Insecurity – political tension/conflict Insecurity – clan conflict Border closureDrought Frost Wind Epidemic crop disease Wild Animals Flood Hail Crop Pests Epidemic livestock disease Market events
YearSeasonal Performance (1-5*)
Event(s) Normal/ abnormal livestock migration
Response: What did people (households) do themselves to cope with the problem, disaggregate by gender if applicable? Was there any outside assistance?
2007 Gu
2006 Deyr
2006 Gu
2005 Deyr
2005 Gu
2004 Deyr
2004 Gu
2003 Deyr
2003 Gu
2002 Deyr
* Classify each season as follows:5 = an excellent season for household food security (e.g. due to good rains, good prices, good crop yields, etc); 4 = a good season or above average season for household food security; 3 = an average season in terms of household food security; 2 = a below average season for household food security; 1 = a poor season (e.g. due to drought, flooding, livestock disease, pest attack) for household food security
Please rank the three main chronic hazards affecting households in this area. (Note: A chronic hazard is one that significantly affects crop or livestock production almost every year.)
1. 2. 3.
LIVESTOCK MIGRATION
Pattern of Migration in an Average Year (e.g. the reference year).Year
What were the species and composition of the migrating herd (e.g. dry camels and dry shoats)
Where do animals move to in different seasons?
Gu
Hagaa
Deyr
Jilaal
Who in the household moves with the migrating animals (by gender, age)? Men Women Boys Girls
Camel:
Cattle: Sheep and Goat:Draw a map illustrating the pattern of migration in this type of year
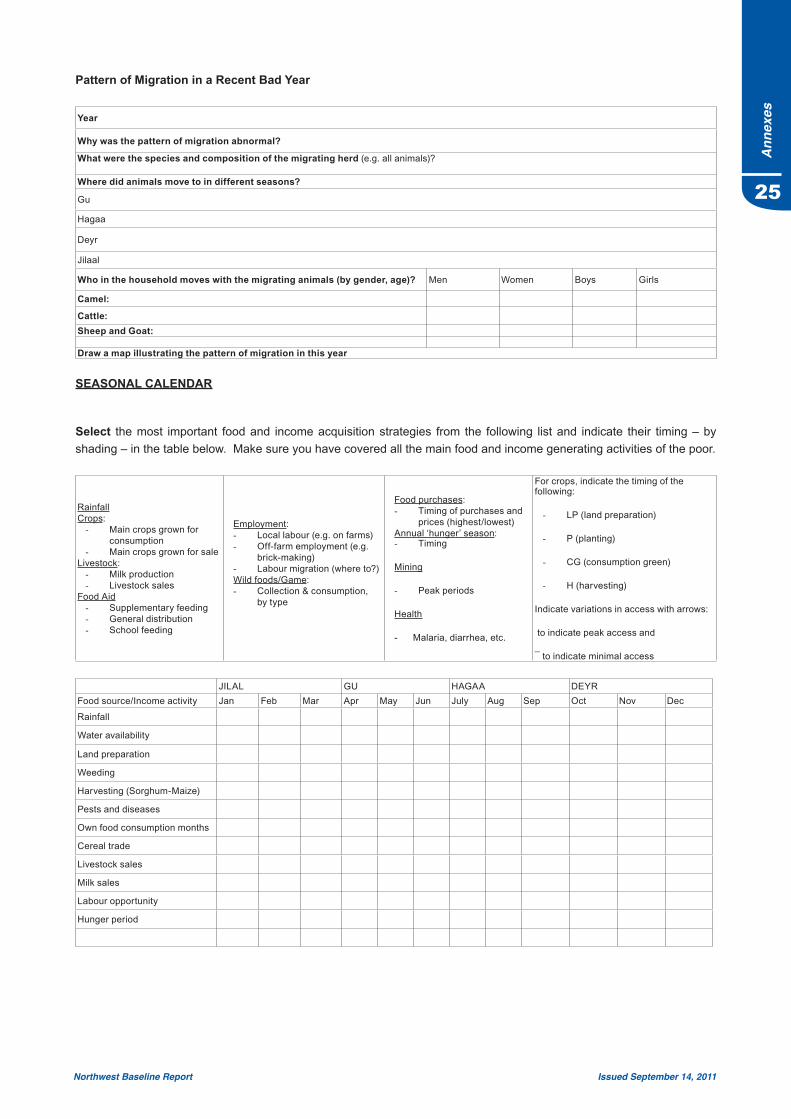
25
Northwest Baseline Report Issued September 14, 2011
Ann
exes
Pattern of Migration in a Recent Bad Year
Year
Why was the pattern of migration abnormal?
What were the species and composition of the migrating herd (e.g. all animals)?
Where did animals move to in different seasons?
Gu
Hagaa
Deyr
Jilaal
Who in the household moves with the migrating animals (by gender, age)? Men Women Boys Girls
Camel:
Cattle: Sheep and Goat:
Draw a map illustrating the pattern of migration in this year
SEASONAL CALENDAR
Select the most important food and income acquisition strategies from the following list and indicate their timing – by shading – in the table below. Make sure you have covered all the main food and income generating activities of the poor.
RainfallCrops:
- Main crops grown for consumption
- Main crops grown for saleLivestock:
- Milk production- Livestock sales
Food Aid- Supplementary feeding- General distribution - School feeding
Employment:- Local labour (e.g. on farms)- Off-farm employment (e.g.
brick-making)- Labour migration (where to?)Wild foods/Game:- Collection & consumption,
by type
Food purchases:- Timing of purchases and
prices (highest/lowest)Annual ‘hunger’ season:- Timing
Mining
- Peak periods
Health
- Malaria, diarrhea, etc.
For crops, indicate the timing of the following:
- LP (land preparation)
- P (planting)
- CG (consumption green)
- H (harvesting)
Indicate variations in access with arrows:
to indicate peak access and
¯ to indicate minimal access
JILAL GU HAGAA DEYRFood source/Income activity Jan Feb Mar Apr May Jun July Aug Sep Oct Nov Dec
Rainfall
Water availability
Land preparation
Weeding
Harvesting (Sorghum-Maize)
Pests and diseases
Own food consumption months
Cereal trade
Livestock sales
Milk sales
Labour opportunity
Hunger period
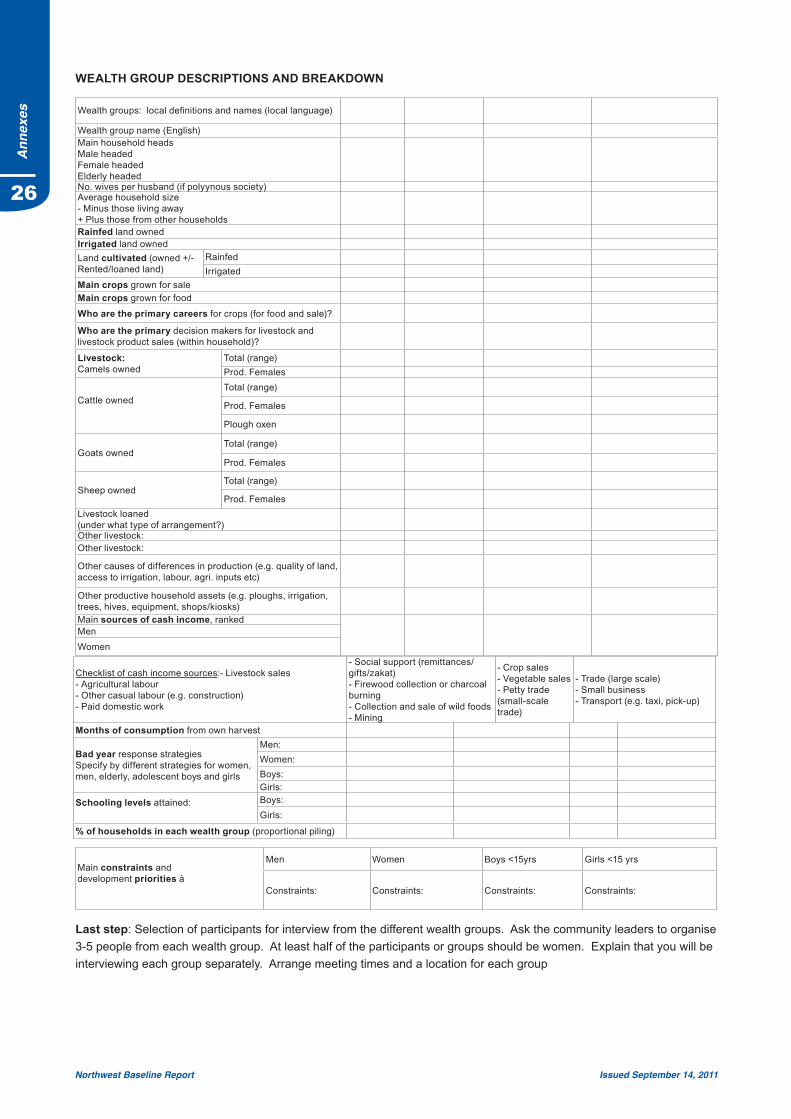
26
Northwest Baseline Report Issued September 14, 2011
Ann
exes
WEALTH GROUP DESCRIPTIONS AND BREAKDOWN
Wealth groups: local definitions and names (local language)
Wealth group name (English)Main household headsMale headedFemale headedElderly headedNo. wives per husband (if polyynous society)Average household size - Minus those living away+ Plus those from other householdsRainfed land owned Irrigated land owned Land cultivated (owned +/- Rented/loaned land)
RainfedIrrigated
Main crops grown for saleMain crops grown for food
Who are the primary careers for crops (for food and sale)?
Who are the primary decision makers for livestock and livestock product sales (within household)?
Livestock: Camels owned
Total (range)Prod. Females
Cattle ownedTotal (range)
Prod. Females
Plough oxen
Goats ownedTotal (range)
Prod. Females
Sheep ownedTotal (range)
Prod. FemalesLivestock loaned(under what type of arrangement?)Other livestock:Other livestock:
Other causes of differences in production (e.g. quality of land, access to irrigation, labour, agri. inputs etc)
Other productive household assets (e.g. ploughs, irrigation, trees, hives, equipment, shops/kiosks)Main sources of cash income, rankedMenWomen
Checklist of cash income sources:- Livestock sales- Agricultural labour - Other casual labour (e.g. construction)- Paid domestic work
- Social support (remittances/gifts/zakat)- Firewood collection or charcoal burning- Collection and sale of wild foods- Mining
- Crop sales- Vegetable sales- Petty trade (small-scale trade)
- Trade (large scale)- Small business - Transport (e.g. taxi, pick-up)
Months of consumption from own harvest
Bad year response strategiesSpecify by different strategies for women, men, elderly, adolescent boys and girls
Men:Women:Boys:Girls:
Schooling levels attained:
Boys:Girls:
% of households in each wealth group (proportional piling)
Main constraints and development priorities à
Men Women Boys <15yrs Girls <15 yrs
Constraints: Constraints: Constraints: Constraints:
Last step: Selection of participants for interview from the different wealth groups. Ask the community leaders to organise 3-5 people from each wealth group. At least half of the participants or groups should be women. Explain that you will be interviewing each group separately. Arrange meeting times and a location for each group
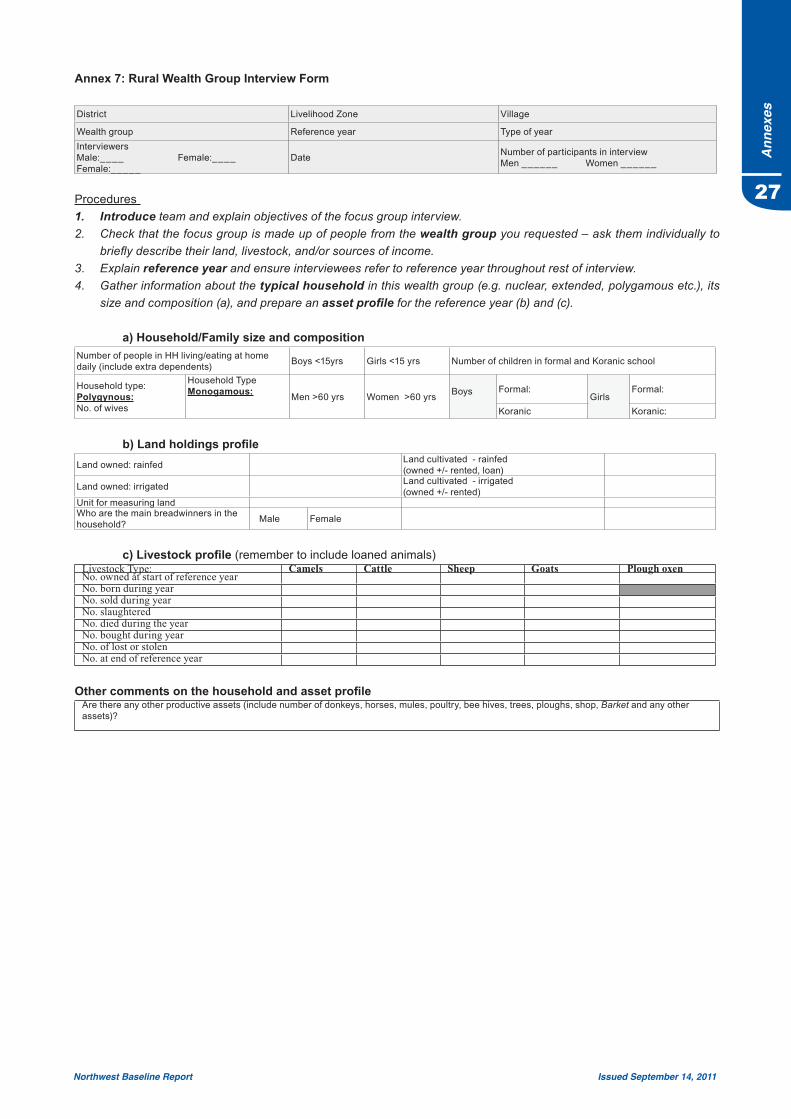
27
Northwest Baseline Report Issued September 14, 2011
Ann
exes
Annex 7: Rural Wealth Group Interview Form
District Livelihood Zone Village
Wealth group Reference year Type of yearInterviewersMale:____ Female:____ Female:_____
Date Number of participants in interviewMen ______ Women ______
Procedures 1. Introduce team and explain objectives of the focus group interview. 2. Check that the focus group is made up of people from the wealth group you requested – ask them individually to
briefly describe their land, livestock, and/or sources of income. 3. Explain reference year and ensure interviewees refer to reference year throughout rest of interview.4. Gather information about the typical household in this wealth group (e.g. nuclear, extended, polygamous etc.), its
size and composition (a), and prepare an asset profile for the reference year (b) and (c).
a) Household/Family size and compositionNumber of people in HH living/eating at home daily (include extra dependents) Boys <15yrs Girls <15 yrs Number of children in formal and Koranic school
Household type:Polygynous:No. of wives
Household TypeMonogamous: Men >60 yrs Women >60 yrs Boys Formal:
GirlsFormal:
Koranic Koranic:
b)LandholdingsprofileLand owned: rainfed Land cultivated - rainfed
(owned +/- rented, loan)
Land owned: irrigated Land cultivated - irrigated(owned +/- rented)
Unit for measuring landWho are the main breadwinners in the household? Male Female
c)Livestockprofile(remember to include loaned animals)Livestock Type: Camels Cattle Sheep Goats Plough oxenNo. owned at start of reference yearNo. born during yearNo. sold during yearNo. slaughteredNo. died during the yearNo. bought during yearNo. of lost or stolenNo. at end of reference year
OthercommentsonthehouseholdandassetprofileAre there any other productive assets (include number of donkeys, horses, mules, poultry, bee hives, trees, ploughs, shop, Barket and any other assets)?

28
Northwest Baseline Report Issued September 14, 2011
Ann
exes
LIVESTOCK PRODUCTION (milk, butter, meat, eggs)
Consumption and sale of milk, milk products, & eggs
# of milking animals (a)[reconfirm from pg 1]
Season
Length of lactation (in days) (b)
Average milk production per animal per day (c)
Total production per season = (a) x (b) x (c)
Quantity sold or exchanged (note skim or whole)
Price per unit sold
Cash income
Who makes decisions on livestock product sales?
Other use (e.g. gifts, payment for labour)
Balance consumed (note skim or whole)
% of annual kcal needs
Husband Wife*
Camels milkWet
Dry
Camels butter/ghee*
Cows milkWet
Dry
Cows butter/ghee6
Sheeps milkWet
Dry
Sheeps butter/ghee*
Goats milkWet
Dry
Goats butter/ghee*
Consumption and sale of meat (from own livestock)
Total number of animals slaughtered
Meat per carcass (kg)
Total meat (kg)
Sold or exchanged
When sold?
Price per unit sold
Cash income
Who does the sale of meat Other use
(e.g. gifts)Balance consumed
% of HH kcal needs
Men Women
Camel
Cattle
Goat
Sheep
** You can interchange husband/wife with men/women depending on the setting
SALE OF LIVESTOCK (e.g. camels, cows, goats, sheep, chickens)REMEMBER TO SEPARATE LOCAL AND EXPORT SALES
Total Sold When? Price per unit sold Cash income
Who makes decision on livestock sales?
Men Women
Camels - exportCamels - localCows – exportCows – localGoats - exportGoats - localSheep - exportSheep - localChickensDonkeyOTHER INCOME FROM LIVESTOCK: e.g. livestock rental, oxen fattening, hides, eggs
TOTAL Income = TOTAL % kcals=
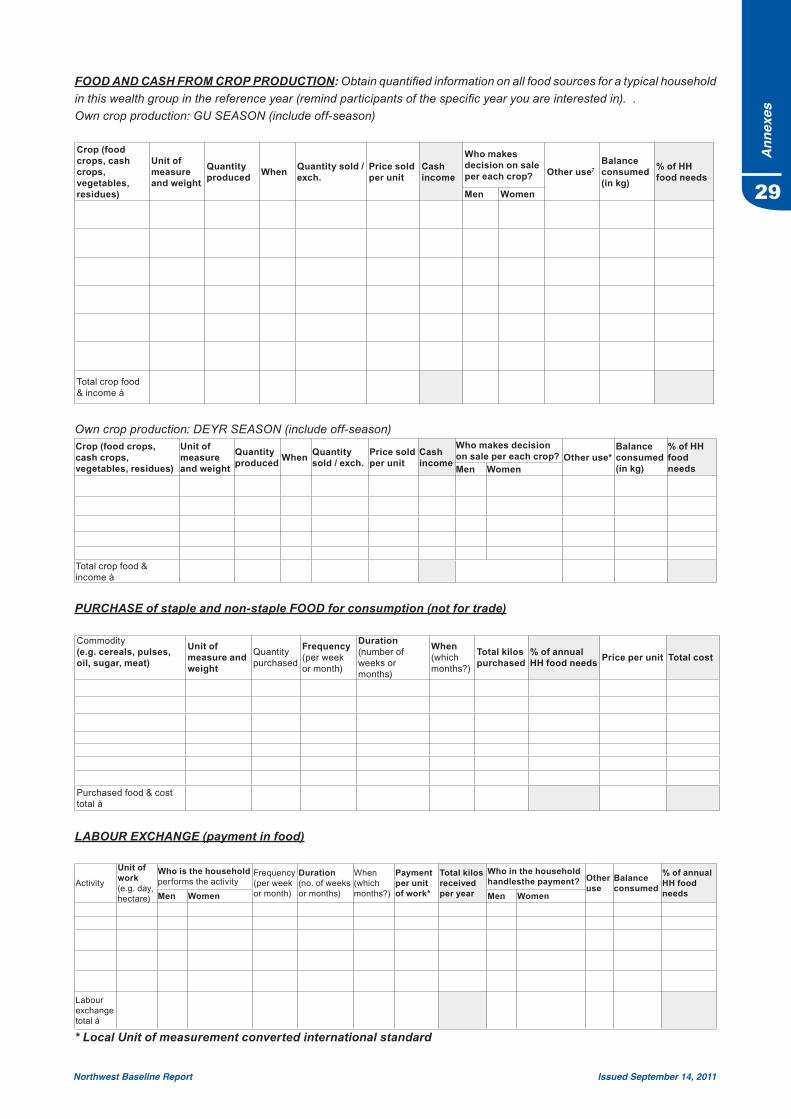
29
Northwest Baseline Report Issued September 14, 2011
Ann
exes
FOOD AND CASH FROM CROP PRODUCTION: Obtain quantified information on all food sources for a typical household in this wealth group in the reference year (remind participants of the specific year you are interested in). .Own crop production: GU SEASON (include off-season)
Crop (food crops, cash crops, vegetables, residues)
Unit of measure and weight
Quantity produced When Quantity sold /
exch.Price sold per unit
Cash income
Who makes decision on sale per each crop? Other use7
Balance consumed (in kg)
% of HHfood needs
Men Women
Total crop food & income à
Own crop production: DEYR SEASON (include off-season)Crop (food crops, cash crops, vegetables, residues)
Unit of measure and weight
Quantity produced When Quantity
sold / exch.Price sold per unit
Cash income
Who makes decision on sale per each crop? Other use*
Balance consumed (in kg)
% of HHfood needsMen Women
Total crop food & income à
PURCHASE of staple and non-staple FOOD for consumption (not for trade)
Commodity (e.g. cereals, pulses, oil, sugar, meat)
Unit of measure and weight
Quantity purchased
Frequency (per week or month)
Duration (number of weeks or months)
When(which months?)
Total kilos purchased
% of annual HH food needs Price per unit Total cost
Purchased food & cost total à
LABOUR EXCHANGE (payment in food)
Activity
Unit of work (e.g. day, hectare)
Who is the household performs the activity
Frequency (per week or month)
Duration (no. of weeks or months)
When(which months?)
Payment per unit of work*
Total kilos received per year
Who in the household handlesthe payment? Other
useBalance consumed
% of annual HH food needsMen Women Men Women
Labour exchange total à
* Local Unit of measurement converted international standard
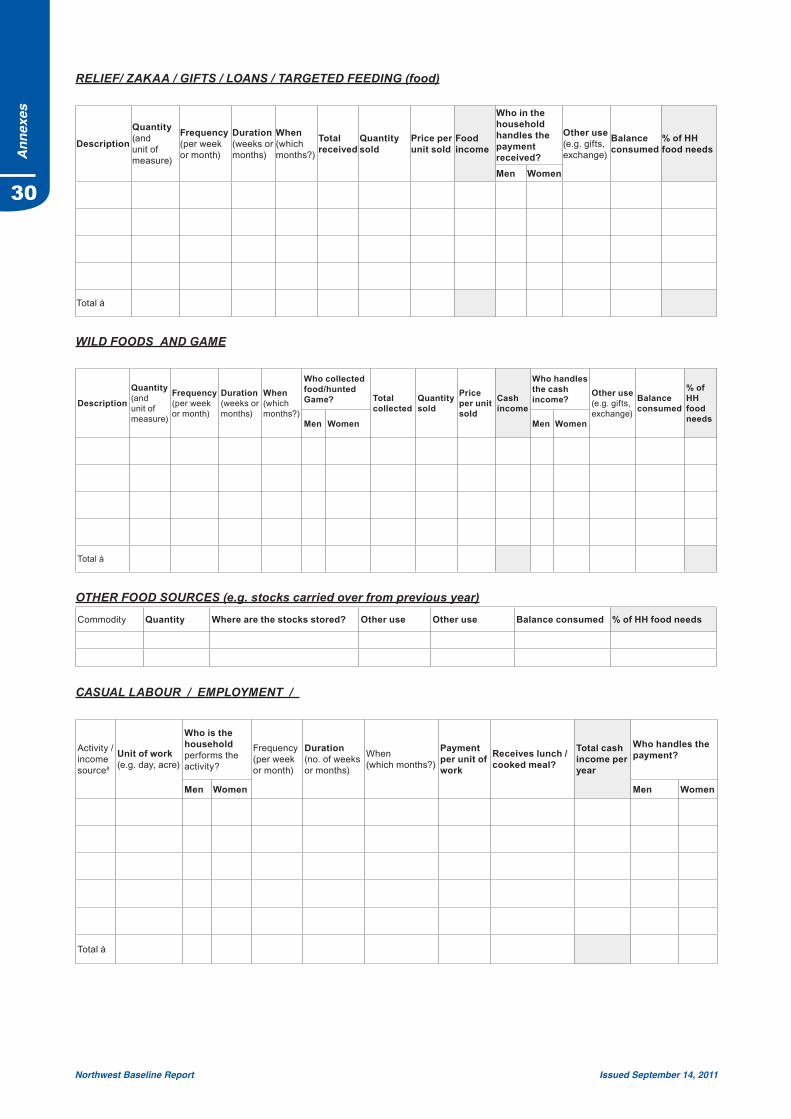
30
Northwest Baseline Report Issued September 14, 2011
Ann
exes
RELIEF/ ZAKAA / GIFTS / LOANS / TARGETED FEEDING (food)
Description
Quantity (and unit of measure)
Frequency (per week or month)
Duration (weeks or months)
When (which months?)
Total received
Quantity sold
Price per unit sold
Food income
Who in the household handles the payment received?
Other use (e.g. gifts, exchange)
Balance consumed
% of HH food needs
Men Women
Total à
WILD FOODS AND GAME
Description
Quantity (and unit of measure)
Frequency (per week or month)
Duration (weeks or months)
When (which months?)
Who collected food/hunted Game? Total
collectedQuantity sold
Price per unit sold
Cash income
Who handles the cash income?
Other use (e.g. gifts, exchange)
Balance consumed
% of HH food needsMen Women Men Women
Total à
OTHER FOOD SOURCES (e.g. stocks carried over from previous year)
Commodity Quantity Where are the stocks stored? Other use Other use Balance consumed % of HH food needs
CASUAL LABOUR / EMPLOYMENT /
Activity / income source8
Unit of work (e.g. day, acre)
Who is the household performs the activity?
Frequency (per week or month)
Duration (no. of weeks or months)
When(which months?)
Payment per unit of work
Receives lunch / cooked meal?
Total cash income per year
Who handles the payment?
Men Women Men Women
Total à
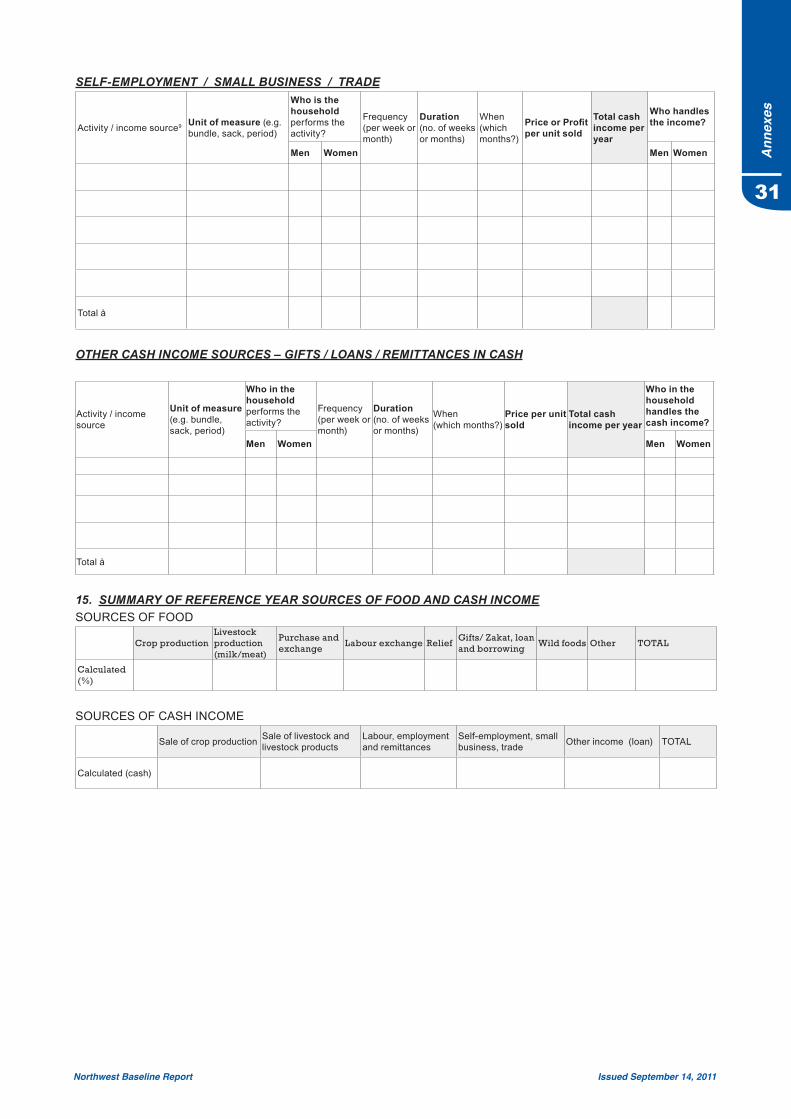
31
Northwest Baseline Report Issued September 14, 2011
Ann
exes
SELF-EMPLOYMENT / SMALL BUSINESS / TRADE
Activity / income source9 Unit of measure (e.g. bundle, sack, period)
Who is the household performs the activity?
Frequency (per week or month)
Duration (no. of weeks or months)
When(which months?)
PriceorProfitper unit sold
Total cash income per year
Who handles the income?
Men Women Men Women
Total à
OTHER CASH INCOME SOURCES – GIFTS / LOANS / REMITTANCES IN CASH
Activity / income source
Unit of measure (e.g. bundle, sack, period)
Who in the household performs the activity?
Frequency (per week or month)
Duration (no. of weeks or months)
When(which months?)
Price per unit sold
Total cash income per year
Who in the household handles the cash income?
Men Women Men Women
Total à
15. SUMMARY OF REFERENCE YEAR SOURCES OF FOOD AND CASH INCOMESOURCES OF FOOD
Crop productionLivestock production (milk/meat)
Purchase andexchange
Labour exchange Relief Gifts/ Zakat, loan and borrowing
Wild foods Other TOTAL
Calculated (%)
SOURCES OF CASH INCOME
Sale of crop production Sale of livestock and livestock products
Labour, employment and remittances
Self-employment, small business, trade Other income (loan) TOTAL
Calculated (cash)
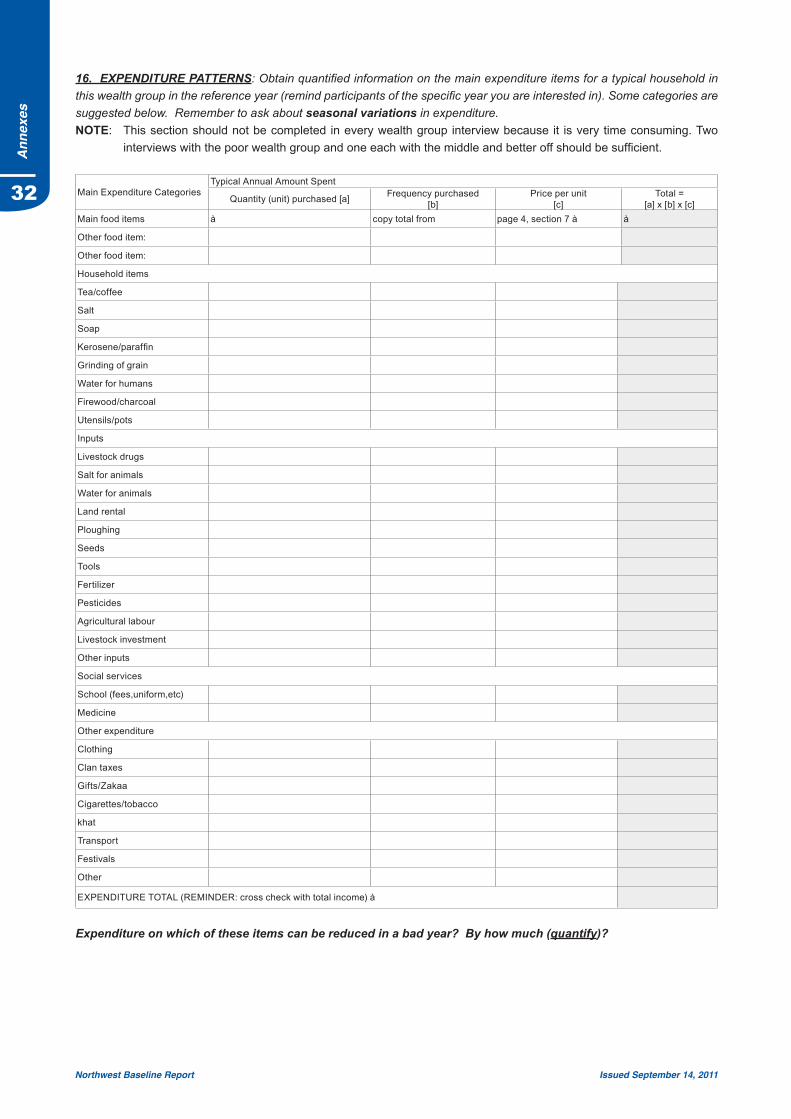
32
Northwest Baseline Report Issued September 14, 2011
Ann
exes
16. EXPENDITURE PATTERNS: Obtain quantified information on the main expenditure items for a typical household in this wealth group in the reference year (remind participants of the specific year you are interested in). Some categories are suggested below. Remember to ask about seasonal variations in expenditure. NOTE: This section should not be completed in every wealth group interview because it is very time consuming. Two
interviews with the poor wealth group and one each with the middle and better off should be sufficient.
Main Expenditure CategoriesTypical Annual Amount Spent
Quantity (unit) purchased [a] Frequency purchased [b]
Price per unit[c]
Total =[a] x [b] x [c]
Main food items à copy total from page 4, section 7 à à
Other food item:
Other food item:
Household items
Tea/coffee
Salt
Soap
Kerosene/paraffin
Grinding of grain
Water for humans
Firewood/charcoal
Utensils/pots
Inputs
Livestock drugs
Salt for animals
Water for animals
Land rental
Ploughing
Seeds
Tools
Fertilizer
Pesticides
Agricultural labour
Livestock investment
Other inputs
Social services
School (fees,uniform,etc)
Medicine
Other expenditure
Clothing
Clan taxes
Gifts/Zakaa
Cigarettes/tobacco
khat
Transport
Festivals
Other
EXPENDITURE TOTAL (REMINDER: cross check with total income) à
Expenditure on which of these items can be reduced in a bad year? By how much (quantify)?
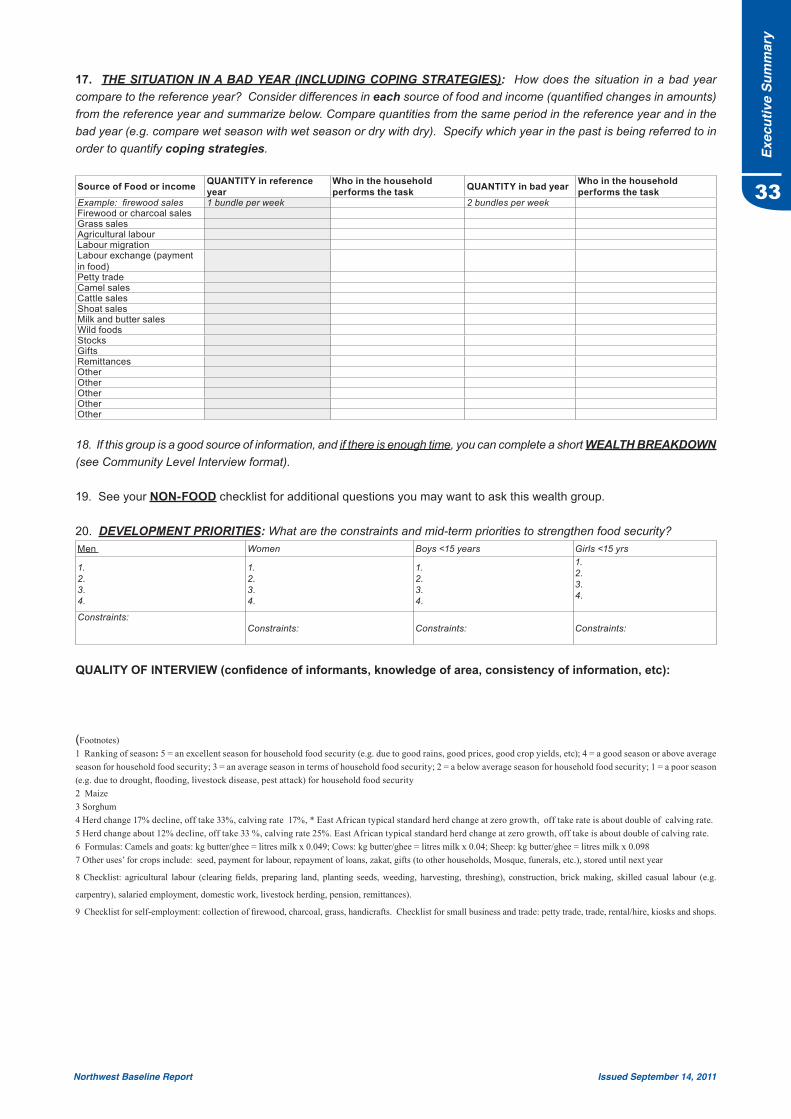
Exec
utiv
e Su
mm
ary
33
Northwest Baseline Report Issued September 14, 2011
17. THE SITUATION IN A BAD YEAR (INCLUDING COPING STRATEGIES): How does the situation in a bad year compare to the reference year? Consider differences in each source of food and income (quantified changes in amounts) from the reference year and summarize below. Compare quantities from the same period in the reference year and in the bad year (e.g. compare wet season with wet season or dry with dry). Specify which year in the past is being referred to in order to quantify coping strategies.
Source of Food or income QUANTITY in reference year
Who in the household performs the task QUANTITY in bad year Who in the household
performs the taskExample: firewood sales 1 bundle per week 2 bundles per weekFirewood or charcoal salesGrass salesAgricultural labourLabour migrationLabour exchange (payment in food)Petty tradeCamel salesCattle salesShoat salesMilk and butter salesWild foodsStocksGiftsRemittancesOtherOtherOtherOtherOther
18. If this group is a good source of information, and if there is enough time, you can complete a short WEALTH BREAKDOWN (see Community Level Interview format).
19. See your NON-FOOD checklist for additional questions you may want to ask this wealth group.
20. DEVELOPMENT PRIORITIES: What are the constraints and mid-term priorities to strengthen food security?Men Women Boys <15 years Girls <15 yrs
1.2.3.4.
1.2.3.4.
1.2.3.4.
1.2.3.4.
Constraints:Constraints: Constraints: Constraints:
QUALITYOFINTERVIEW(confidenceofinformants,knowledgeofarea,consistencyofinformation,etc):
(Footnotes)1 Ranking of season: 5 = an excellent season for household food security (e.g. due to good rains, good prices, good crop yields, etc); 4 = a good season or above average season for household food security; 3 = an average season in terms of household food security; 2 = a below average season for household food security; 1 = a poor season (e.g. due to drought, flooding, livestock disease, pest attack) for household food security2 Maize3 Sorghum4 Herd change 17% decline, off take 33%, calving rate 17%, * East African typical standard herd change at zero growth, off take rate is about double of calving rate.5 Herd change about 12% decline, off take 33 %, calving rate 25%. East African typical standard herd change at zero growth, off take is about double of calving rate. 6 Formulas: Camels and goats: kg butter/ghee = litres milk x 0.049; Cows: kg butter/ghee = litres milk x 0.04; Sheep: kg butter/ghee = litres milk x 0.0987 Other uses’ for crops include: seed, payment for labour, repayment of loans, zakat, gifts (to other households, Mosque, funerals, etc.), stored until next year
8 Checklist: agricultural labour (clearing fields, preparing land, planting seeds, weeding, harvesting, threshing), construction, brick making, skilled casual labour (e.g.
carpentry), salaried employment, domestic work, livestock herding, pension, remittances).
9 Checklist for self-employment: collection of firewood, charcoal, grass, handicrafts. Checklist for small business and trade: petty trade, trade, rental/hire, kiosks and shops.
Exec
utiv
e Su
mm
ary
34
Northwest Baseline Report Issued September 14, 2011
The Information Management Process Gathering & processing• FSNAUhasauniquenetworkof32specialistsalloverSomalia,whoassessthefoodsecurityandnutritionsituation
regularlyand120enumeratorsthroughoutthecountry,whoprovidearichsourceofinformationtoensureagoodcoverageofdata.
• Foodsecurityinformationisgatheredthroughrapidassessmentsaswellasmonthlymonitoringofmarketprices,climate,cropandlivestocksituations.
• BaselinelivelihoodanalysisisconductedusinganexpandedHouseholdEconomyApproach(HEA).• The IntegratedDatabase System (IDS), anonline repositoryon FSNAU’sofficialwebsitewww.fsnau.org, provides
a web-based user interface for data query, data import and export facilities from and intoMS Excel, graphing,spreadsheetmanagementandeditfunctions.
• Nutritiondata isprocessedandanalyzedusing theStatisticalPackage forSocialSciences (SPSS), EPInfo/ENAandSTATAsoftwareformeta-analysis.
• FSNAUdeveloped the IntegratedPhaseClassification (IPC), a setofprotocols for consolidatingand summarizingsituationalanalysis.Themappingtoolprovidesacommonclassificationsystemforfoodsecuritythatdrawsfromthestrengthsofexistingclassificationsystemsandintegratesthemwithsupportingtoolsforanalysisandcommunicationoffoodinsecurity.
Validation of Analysis• Quality control of nutrition data is done using the automated plausibility checks function in ENA software. The
parameterstestedinclude;missing/flaggeddata,agedistribution,kurtosis,digitpreference,skewnessandoverallsexratio.
• Quality control of food security data is done through exploratory and trend analysis of the different variablesincluding checks for completeness/missing data,market price consistency, seasonal and pattern trends, groundtruthingandtriangulationofdatawithstaffandotherpartneragencies,andsecondarydatasuchassatelitteimagery,internationalmarketprices,FSNAUbaselinedata,etc.
• Beforethelaunchofthebiannualseasonalassessmentresults(GuandDeyr),twoseparateday-longvettingmeetingsareheldcomprisingofmajortechnicalorganizationsandagenciesinSomalia’sFoodSecurityandNutritionclusters.TheteamcriticallyreviewstheanalysispresentedbyFSNAUandchallengestheoverallanalysiswherenecessary.Thisisanopportunitytosharethedetailedanalysis,whichisoftennotpossibleduringshorterpresentationsorinthebriefs.
Products and Dissemination • A broad range of FSNAU information products include, monthly, quarterly and biannual reports on food and
livelihoodinsecurity,markets,climateandnutrition,whicharedistributedbothinprintanddigitalformatsincludingPowerPointpresentationsanddownloadablefileavailableontheFSNAUsite.
• Feedbackmeetingswith key audiences enableus to evaluate the effectivenessof our informationproducts.Weconstantlyrefineourinformationtomakesureitiseasilyunderstandabletoourdifferentaudiences.
• FSNAUhasalsodevelopedathreeyearintegratedcommunicationstrategytoensurethatitsinformationproductsaremadeavailableinwaysappropriatetodifferentaudiencesincluding,donors,aidanddevelopmentagencies,themedia,Somaliaauthoritiesandthegeneralpublic.
United Nations Somalia, Ngecha Road Campus Box1230,VillageMarket,Nairobi,Kenya
Tel:+254-(0)20-4000000/500,Cell:+254-(0)722202146/(0)733-616881Fax:+254-20-4000555Email:[email protected]
Website:www.fsnau.org