Motor Vehicles, Air Pollution, and PublicHealth - CDC stacks
Upload
khangminh22Category
view
3download
0
China Council for International Cooperation on Environment andDevelopment (CCICED)
Performance Evaluation on the Action Planof Air Pollution Prevention and Control and
Regional Coordination Mechanism
CCICED Special Policy Study Report
CCICED 2014 Annual General MeetingDecember 1-3, 2014
i
Special Policy Study Members
Co-chairs*
Jiming HAO, CCICED Council Member; Academician, Chinese Academy ofEngineering; Professor, School of Environment, Tsinghua University
Michael P. WALSH, International expert; Founding Chairman of the Board ,International Council on Clean Transportation
Special Policy Study Members*:
Jintian YANG, Deputy Chief Engineer, Director of Air Department andResearch Fellow, MEP Environmental Planning Institute
Kebin HE, Professor, Dean, School of Environment, Tsinghua University Xiaofeng BAO, Deputy Chief Engineer and Research Professor, Chinese
Research Academy of Environmental Sciences, Chief Scientist of MobileSource Pollution Control Research Base
Steinar LARSSEN, International Expert; Deputy Former Research Directorof Research, Norwegian Institute for Air Research
Jeremy SCHREIFELS, Senior Specialist, US Environmental ProtectionAgency
Markus AMANN, Program Director, International Institute for AppliedSystems Analysis
Martin LUTZ, Head of Air Quality Management Department, BerlinRegional Ministry for Urban Development and the Environment, Germany
Support Experts
Shuxiao WANG, Professor and Director, Air Pollution Division, School ofEnvironment, Tsinghua University
YeWU, Associate professor, School of Environment, Tsinghua University Huan LIU, Associate professor, School of Environment, Tsinghua University Yu LEI, Associate Research Fellow and Deputy Director, Air Department,
MEP Environmental Planning Institute Miao NING, Associate Research Fellow, Air Department, MEP
Environmental Planning Institute Jingnan HU, Research Professor, Chinese Research Academy of
Environmental Sciences, Institute of Atmospheric Environment Qingyan FU, Chief Engineer and Research Fellow, Shanghai Environmental
Monitoring Center

ii
Dawei ZHANG, Director, Beijing Environmental Monitoring Center
Consultants
Hongchun ZHOU, Research Fellow and Director, Office of ResearchDepartment of Social Development, Development Research Center of theState Council
Yingmin ZHAO, Director, MEP Department of Pollution Prevention andControl
Dadi ZHOU, Research Fellow and Director, NDRC Energy Research Institute
Coordinators
YeWU, Associate professor, School of Environment, Tsinghua University Miao NING, Associate Research Fellow, Air Department, MEP
Environmental Planning Institute
* Co-Chairs and Special Policy Study Members serve in their personal capacities.

iii
Summary of Key Findings
A Thorough Appraisal System is Needed for Air Pollution Plans
China is confronted with severe air pollution, especially regional atmosphericproblems, including PM2.5, which is becoming increasingly prominent. Among the 74cities that first launched PM2.5 monitoring networks in the year 2013, 71 cannot reachthe secondary air quality standard. The annual average concentration of PM2.5 of the74 cities is 2.1 times the secondary standard. The average annual concentrations of theBeijing-Tianjin-Hebei Region, Yangtze River Delta and Pearl River Delta were 3.0,1.9 and 1.3 times the secondary standard, respectively.
In order to improve air quality and protect the public health, the new government hasadopted the Action Plan of Air Pollution Prevention and Control (hereinafter referredas “action plan”), the strictest air pollution control measures ever adopted in China. Itis imperative to also establish a thorough performance appraisal system for scientificevaluation of the environmental, social and economic benefits generated by thepollution prevention and control measures. An integrated performance appraisalsystem should include pre-implementation analyses of implementation plans andfollow-up appraisals of program implementation and results. An index system,including air quality improvement and program performance indicators, etc. needs tobe established.
According to the pre-implementation analysis of the Beijing-Tianjin-Hebei Regionaction plan, PM2.5 concentrations are expected to drop significantly afterimplementation of the action plan. However, Tianjin municipality and Hebei provincemay not reach the 25% PM2.5 concentration reduction target by the year 2017.Resources and capacity for comprehensive implementation of the policy measuresmust be enhanced. We suggest that different regions should further refine the actionplan and clearly quantify the various control measures and the expected emissionreductions. Meanwhile, China should enhance control of NOX, VOC and NH3 – keycomponents of PM2.5 – in order to realize synergistic air quality improvements.
China Faces Great Challenges to Reduce Emissions and Meet the AirQuality Standard
Air quality in key cities should achieve the ambient air quality standard for PM2.5 (i.e.,annual limit of 35 µg/m3) by 2030. Keeping this target in mind, we calculated thepollutant emission reduction targets nationwide and in all provinces. On the basis of2012 emissions, SO2, NOX, PM2.5 and VOC emissions nationwide should be reducedby at least 52%, 65%, 57%, and 39%, respectively, by 2030, and NH3 should decreaseslightly. We should intensify emission control in heavily polluted areas. For example,

iv
SO2, NOX, PM2.5, VOC and NH3 emissions in the Beijing-Tianjin-Hebei Region in2030 should be reduced by at least 59%, 72%, 70%, 44%, and 21% respectively.
In order to reach the above emission reduction targets, China should carry outcoordinated control efforts for multiple pollutants and emission sources in differentregions, adopting control measures that can complement the process of adjusting theenergy structure, improving energy efficiency and enhancing end-of-pipe pollutioncontrol, etc. In terms of energy structure and energy efficiency, China should cap itscoal consumption; promote new energy and clean power generation, including cleanfuels for commercial and residential sectors; promote advanced production techniquesto accelerate the elimination of backward industrial capacity; increase fuel efficiencyof motor vehicles and promote the application of the energy saving and new energyvehicles. With regard to end-of-pipe controls, power plants should adoptdesulfurization, particulate controls and nitrogen oxides controls technologies;industrial sectors should gradually adopt efficient pollution control technologies,especially the most advanced particulate controls technology; residential andcommercial sectors should gradually adopt efficient particulate controls technologies,advanced thermal coal and biomass combustion technologies; the vehicle populationin cities should be properly controlled, and the new vehicle emission standards shouldbe accelerated and strictly implemented and enforced, along with much strongerpollution prevention and control of non-road mobile sources, and unified fuel qualitystandards for road vehicles and non-road machines; and apply the EU VOCs emissionstandard in manufacturing and solvent use.

v
China’s air pollution problem will require years to solve
China’s air pollution problem is quite severe and it has evolved over several years of rapidindustrialization. Therefore it is unrealistic to expect that it can be reversed overnight even withthe best of intentions. High pollution episodes are inevitable in the short term when unfavorableweather conditions and stagnant air occur. International experience indicates that it usually takesdecades to initially reverse the increasing pollution trends and then to bring about substantial airquality improvements. In order to achieve the short term 2017 targets laid out by the StateCouncil, China needs to reduce the national SO2, NOX, PM2.5 and VOC emissions by at least24%, 15%, 16%, and 2%, respectively, and limit the increase of NH3 emissions to less than 10%,compared with that in 2012. The SO2, NOX, PM2.5 and VOC emissions in Beijing-Tianjin-HebeiRegion must be reduced by at least 32%, 25%, 30%, and 11%, respectively, by 2017 on the basisof 2012 levels, and NH3 emissions can only increase slightly.
In September 2013, the Action Plan was officially issued by the State Council, which included tenair pollution prevention and control measures. The Action Plan includes the strictest air pollutioncontrol measures ever adopted in China. However, the Action Plan has only been in effect for oneyear and will require several years to begin to show significant benefits. Cleaner and moreefficient new cars and trucks take several years before they dominate the vehicle fleet. Reducingthe increases in coal consumption and shutting down or relocating high polluting industrialfacilities requires some time to develop alternatives. Designing and installing end of pipe controlson major power plants and industrial sources will also take several years. In the meantime, whenpoor meteorological conditions occur, high pollution episodes are inevitable. But with eachpassing year, international experience suggests that effective implementation of the Action Plancomplemented by local air pollution control measures should result in gradual improvements inair quality and fewer and fewer high pollution episodes. By 2030, the SO2, NOX, PM2.5, VOC andNH3 emissions in Beijing-Tianjin-Hebei Region shall be reduced by at least 59%, 72%, 70%,44%, and 21%, respectively and high air pollution episodes should be greatly diminished if noteliminated.

vi
International Experience is an Important Reference for Regional AirPollution Control and Coordination
Europe and the US demand that the relevant local and state/national authoritiesachieve air quality standards within specified time frames. In order to realize thetargets, the European Air Quality Plans (AQPs) and the American StateImplementation Plans (SIPs) outline comprehensive strategies for emission reductionsand air quality improvements. The strategies consist of (1) pollution prevention andcontrol policies; (2) policy implementation timetables; (3) scientific and economicevaluation of emission reduction policies; (4) emergency programs for seriousepisodes of atmospheric pollution; and (5) resource adequacy demonstrations1 forimplementation and enforcement. Comprehensive air quality monitoring networks areused to evaluate progress toward meeting ambient air quality standards, and ensuretransparency of relevant environment monitoring information.
Both Europe and the US have established integrated management mechanisms forregional air quality to coordinate regional air pollution prevention acrossstates/nations. For example, the Convention on Long Range Transboundary AirPollution (CLRTAP) aims to establish common strategies and policies, andmonitoring systems for air quality under the United Nations Economic Commissionfor Europe (UN-ECE). All parties agree to restrict and gradually reduce air pollutionas much as possible, including long-distance and cross border air pollution; theAmerican Regional Planning Organizations (RPOs), set up through the concertedefforts of USEPA, the state governments and other stakeholders, enhances regionalcoordination and cooperation on air pollution planning and control.
China Lacks Strong Regional Coordination Institutions and Unified Plans,Objectives and Management
Conventional air pollution control and management in China lacks consideration ofair pollution transport and a systematic analysis of air pollution. For example, the airpollution problems in the Beijing-Tianjin-Hebei Region, the Yangtze River Delta,Shandong and Henan are greatly impacted by pollutants that are transported fromsurrounding areas. Therefore, integrated regional control must be adopted in theseareas. In the future, regions should be scientifically grouped based on quantitativeresearch based on satellites, ambient monitors and air quality models to enhance airquality management.
Because the government performance appraisal focuses on total emission control ofSO2 and NOX pollution, local governments have, to some extent, not focused on airquality improvements. A lack of unified air quality objectives and lack of coordinationamong cities and provinces in terms of reducing PM and VOC emissions havehindered regional air quality improvements. Unless this is corrected by adoption of
1 Including financial commitments as well as staffing.

vii
unified air quality objectives and coordinated control measures and strategies, airquality objectives will not be achieved.
An initial mechanism has been established to support regional decision making andconsultations in the three key regions. However, the regional coordination mechanismis limited, focused primarily on heavy pollution weather alerts and joint emergencyresponses. The regions lack unified plans, objectives, control requirements,supervision and administration. As to environmental information sharing, significantprogress is needed to meet the requirements for regional air pollution prevention andcontrol.

viii
Summary of Main Policy Recommendations
Recommendation 1: Build an Air Quality-Oriented Air Pollution ManagementSystem
Improve the Legal Status of Standard Air Quality
The Atmospheric Pollution Prevention Law should explicitly state that provincial andlocal governments must implement and enforce atmospheric protection programsbased on air quality objectives. Government at all levels should improve air quality insubstandard areas and prevent deterioration of air quality in compliant areas. Theseobjectives should be binding requirements in performance evaluations of officials.Accountability provisions should levy economic punishments for areas that cannotachieve air quality goals on time, and include administrative accountability forpersons in charge of the regional and/or local government.
Atmospheric Management Regions should be Based on Science
The atmospheric management regions should not be based purely on politicalboundaries, but should be based on scientific assessments that consider spatial andtemporal distribution of emissions, meteorology, terrain and pollution transport. Theeastern provinces with heavy air pollution should be grouped into one region.Atmospheric management regions should have regional coordination organizationsand mechanisms, unified laws and regulations, and united management andenforcement on air quality to enhance overall regional efforts to meet air qualityobjectives.
Recommendation 2: Deepen Joint Prevention and Control for Regional AirPollution
Establish a Unified Standard Program for Regional Air Quality
Based on the target of regional air quality compliance in key regions, such as easternprovinces, the schedule for achieving air quality standards in different cities should beconsidered at the national level, aiming to improve air quality while providing areasonable and feasible pathway. Policies should promote coordinated control ofregional air pollution, rigorously control the total emission amount and reducepollution transport. The population, industry, energy and motor vehicle patterns in theregion should be established or adjusted based on the distribution of regionalatmospheric carrying capacity. Integrated and unified monitoring of air quality shouldbe designed and conducted in the regions to support scientific assessment on theplans.

ix
Establish a Clear-cut, Unified and Integrated Regional Air Pollution Controland Management Mechanism
To enhance regional coordination, an environmental decision-making and consultationmechanism is needed along with enhanced information sharing about air qualitymanagement. Regional coordination can also be enhanced with consultationmechanisms for environment impact assessments (EIAs), including EIAs for majorpollution sources, and for industrial planning; regional environmental lawenforcement mechanisms for unified supervision and enforcement, as well as strictinspection and accountability; joint emergency response for episodes of heavypollution with coordinated temporary emission reduction measures; and unifiedsupervision.
Establish Regional Decision Support and Planning Agency
Establish regional planning organizations funded by various ministries andcommissions like the Ministry of Environmental Protection to provide national andlocal scientific and technological resources, and facilitate coordination among localand regional governments. To enhance our understanding of pollution transport,conduct research on emission tracking, transport, atmospheric pollutanttransformation, and source identification of regional air pollution. To address airpollution cost effectively, recommend air pollution control techniques that can beeffectively applied to all cities in the region.
Recommendation 3: Enhance Air Pollution Control Based on the ExistingMeasures
Clean, efficient and sustainable use of coal
It is preferable to use coal in large-scale facilities with high-efficiency end-of-pipecontrol technologies; small-scale boilers and stoves should be phased out gradually,and district heating should be strongly promoted. China should make great effort toimprove the energy efficiency of major coal-consuming sectors, such as power plantsand industry. For example, the average energy efficiency of coal-fired power plantsshould be increased from 36% in 2010 to 42% in 2030 and the energy consumptionper unit of production of industrial coal-fired boilers, cement production and cokeovens should be 24%, 16%, and 44% lower, respectively, in 2030 compared with2010. China should increase the proportion of coal washing and promote clean coaltechnologies.
Accelerate Adjustment of the Energy Structure and Increase Clean Energy
It is essential to commit to energy structure adjustments and cap the coal consumption.Coal’s share of total energy consumption should be less than 50% by 2030. This will

x
require increased clean energy utilization, including natural gas, nuclear energy andrenewable energy (biomass not included), up to 25% by 2030, and the cleanutilization of biomass.
Enhance Coordinated Control over Various Sources of Pollution andContaminants
In order to meet the atmospheric quality and air pollutant emission control goals,China should stick to the strategic concept of “coordination”, “integration” and “jointaction”. That is, China should carry out coordinated control over pollutants includingSO2, NOX, primary PM2.5, VOCs and NH3. Regarding control of various pollutionsources, China should launch comprehensive pollutant control of industrial sources,domestic and rural non-point sources and mobile sources. These policies shouldrequire joint prevention and control between regions and cities, and consider the keyemitting sectors, the feasibility of control technologies, the challenges for differentregions to reach the standard and the multiple environmental implications of pollutantemission reductions. Region-specific air pollution prevention and control strategiesare likely necessary to address regional characteristics.
Recommendation 4: Establish Scientific Appraisal System
Establish Pre-implementation andAnnual Appraisal System
Pre-implementation and annual appraisal systems should be established so that localgovernments can assess progress and adjust measures as necessary to meet the goals.The pre-implementation indicators include projected reductions of PM2.5
concentrations and frequency of heavy pollution days. The annual appraisal indicatorsshould include the actual monitored PM2.5 concentration (multi-year moving average),pollutant emission reductions and progress on control measures such as improvingenergy efficiency and adjusting the energy structure.
Establish Final Appraisal System
A final appraisal system should be established to provide a technological basis for thesustained improvement of air quality. The appraisal indicators should include PM2.5
concentrations (multi-year moving average); number of heavy pollution days;economic, industrial and energy structures; and benefits to human health attributableto improved air quality.

xi
Background and Implementation of the Project
With the rapid economic development and urbanization in China, especially theindustrial development pattern featuring the chemical industry, coal-oriented energystructure and the rapid increase of motor vehicles, China’s emissions of key pollutantsranks first in the world. This has generated serious atmospheric contamination withmarked features like the superposition of various pollution sources and contaminants,the dual and overlapping challenges of urban and regional pollution, the connectionbetween pollution and climate changes, etc. Thus the governance of China’s airquality management is far more difficult than that in developed countries. Since 2011,the frequent and extensive dust-haze with heavy pollution has troubled the central andeastern region of China in winter and spring, seriously influencing industrialproduction as well as the lives and health of the people. The new government adoptedair pollution control measures that are the strictest in the history of China so as toimprove the air quality and protect the public health. The government also releasedthe first Action Plan of Air Pollution Prevention and Control (hereinafter referred toas Action Plan) in August, 2013.
The Action Plan explicitly states the objective to improve air quality nationwide andin key areas, and provides ten measures, including 35 specific actions, to help achievethese objectives. In order to evaluate the progress in the implementation of the variousmeasures and the relevant environmental, social and economic benefits which serve asthe basis for future policy adjustment, this project focuses on exploring andestablishing performance appraisal indicators and an appraisal system for the ActionPlan. At the same time, this project also conducts pre-appraisal and follow-upappraisal on the implementation progress and the impact of the plan, for the purposeof recognizing the key factors that hinder the realization of the Action Plan goals, andraises the relevant policies and measures; the research incorporates the medium termobjective of the 13th Five-Year Plan and the long term objective of 2030 in terms of airpollution prevention and control. The research has presented the medium andlong-term air pollution prevention and control strategy and has projected the roadmapfor air pollution prevention and control; meanwhile, it studies the solution for buildinga regional coordination mechanism and provides policy suggestions for improvingregional air quality.
Since its proposal in February 2014, the project group held four working meetings insix months. The first meeting after the project launch adopted the implementationprogram through deliberation, and finalized topics, division of labor and schedule forthe project research. At the second meeting held on May 26th, the individuals incharge of each subject reported the research progress and the initial conclusions. Theproject group conducted in-depth discussions and listened to the ideas of otherresearch organizations, government sectors, non-government organizations and theindustrial sectors. The group also identified the modifications and improvements to

xii
the research, and reached consensus on future work. The third meeting was held onJuly 30th to August1st in Washington. The Chinese members and the foreign experts ofthe research group conducted intensive communications on several important subjects.For example, the regulation on regional air quality management under the Clean AirAct in the US, the function and mode of operation of regional planning organizations,the formulation and implementation of cross-state air pollution rules, and the trafficpollution control, etc. The communication on these subjects enabled the researchers tobetter draw on the international experiences and summarize the policy suggestions.The fourth meeting was held on August 29th where researchers in charge of varioussubjects reported final research results. The project group and the experts whoparticipated in the meeting carried out extensive discussions on the major researchresults and the policy suggestions, and put forward advice and direction for furthermodification of the first draft of the research report. The project group had fullknowledge of further modification and promised to submit the revised draft onschedule.
In addition, on the 2014 ICDF round-table conference in May and the Third JointWork Meeting between Chief Advisor and Secretariat of 2014 ICDF in July, ProfessorKebin He, the core expert of the subject group, and the Chinese group leaderAcademician Jiming Hao reported the research progress and the future work planrespectively, which gained helpful suggestions from foreign and domestic experts atthe meeting. Internal meetings were repeatedly held inside the project group. In short,the project group had absorbed the combined wisdom of experts from home andabroad by means of European and American experience case study, national analysisof conditions and assessment of the current policies in China, exchange of views andbrainstorming, investigation, survey and discussion of special project policies, etc.The project group defined the ultimate policy suggestions after research andcomparison of domestic and foreign systems, providing important scientific andtechnological support for the establishment of the performance appraisal methodsystem of the Action Plan and the regional coordination mechanism.
Key Words: air pollution, air quality standard, regional coordination mechanism,energy conservation and emission reduction, policy, PM2.5

xiii
Contents
Special Policy Study Members..................................................................................... i
Summary of Key Findings..........................................................................................iii
Summary of Main Policy Recommendations......................................................... viii
Background and Implementation of the Project......................................................xi
1. RESEARCH ON PERFORMANCE EVALUATION INDICATORS ANDMETHODOLOGY OF THE ACTION PLAN........................................................... 1
1.1 Establishment of Performance Evaluation Indicators and Methodology..... 11.2 Pre-Evaluation Case Analysis-Based on the Beijing-Tianjin-Hebei Region51.3 Follow-up Evaluation Case Analysis-based on the Beijing-Tianjin-HebeiRegion..................................................................................................................... 91.4 Policy Proposals..........................................................................................11
2. THE THIRTEENTH FIVE-YEAR PLAN AND THE GOAL ANDROADMAP OF AIR POLLUTION PREVENTION IN 2030............................... 11
2.1 Prediction of Social and Economic Development From the ThirteenthFive-Year Plan Period to the Year 2030................................................................ 112.2 Medium-term Goal of Air Pollution Prevention in the Thirteenth Five-yearPlan and the Long-term Goal up to 2030.............................................................. 122.3 The Roadmap for Controlling and Preventing Air Pollution in Medium andLong Term............................................................................................................. 132.4 Medium and Long Term Strategies For Controlling and Preventing AirPollution................................................................................................................ 192.5 Policy Suggestion....................................................................................... 22
3. INTERNATIONAL EXPERIENCES OF COORDINATION MECHANISMFOR REGIONAL AIR POLLUTION MANAGEMENT...................................... 23
3.1 International Experience.............................................................................233.2 Recommendations for China’s Air Quality Management based on theInternational Experience....................................................................................... 28
4. COORDINATION MECHANISM AND POLICY RESEARCH FOR THEREGIONAL AIR POLLUTION CONTROL..........................................................32
4.1 Current Situation of the Coordination Mechanism and Policies................ 324.2 Policy Recommendations........................................................................... 40

1
1. RESEARCH ON PERFORMANCE EVALUATION INDICATORS ANDMETHODOLOGYOF THE ACTION PLAN
At present, the atmospheric pollution situation in China is grim and regionalatmospheric environmental problems, such as fine particle (PM2.5) and inhalableparticle (PM10) concentrations, are increasingly prominent. According to the airquality monitoring data of 2013 issued by the China National EnvironmentalMonitoring Centre (“CNEMC”), among the 74 cities that first launched the PM2.5
monitoring, 71 failed to reach the prescribed standard; the annual averageconcentration of PM2.5 in the 74 cities was 2.1 times the class II standard; the annualaverage concentrations of PM2.5 in the Beijing-Tianjin-Hebei Region, the YangtzeRiver Delta, and the Pearl River Delta were 3.0, 1.9, and 1.3 times the class IIstandard, respectively.2
In September 2013, the Action Plan of Air Pollution Prevention and Control wasofficially issued by the State Council, which included ten air pollution prevention andcontrol measures (hereinafter referred to as “Ten Measures”). The Ten Measuresinclude air quality improvement targets for 31 provinces in 2017 based on eachprovince’s current situations of social and economic development and air quality oflocalities and agreed to through the signing of commitment letters about targets. Thewhole country is divided into key regions and non-key regions, and gradedimprovement targets are set for each region. Under this approach, to promote theimplementation of provinces’ and municipalities’ responsibilities, it is necessary toestablish an effective system of performance evaluation indicators and a methodologyfor the implementation of the Action Plan so as to evaluate and assist in offeringguidance on the implementation of the Action Plan by all localities across the country.
1.1 Establishment of Performance Evaluation Indicators and Methodology
1.1.1 Performance Evaluation Methodology
The performance evaluation methodology involved in this research includes twoevaluation methods, namely, pre-evaluation (ex-ante) of the implementationperformance and follow-up evaluation (ex-post) of the implementation performance,as shown in Figure 1-1.
2 According to the World Health Organization’s Global Body Burden of Disease study, approximately1.2 million people died prematurely in 2010 in China as a result of exposure to particulate air pollution.

2
Figure 1-1 Performance evaluation methodology of the Action Plan
The term “pre-evaluation of the implementation performance” refers to apre-evaluation of the effects of the current control measures on emission reductionsand air quality improvements using emission inventories and an air quality model,with the aim to predict the atmospheric improvements after implementation of currentpolicies and identify weaknesses in the current policies and the direction of furtherefforts. The term “follow-up evaluation of the implementation performance” refers toan evaluation of progress of control measure implementation and the actual impactson air quality, with the aim to promote the gradual development of various tasks andthe actual effects of the evaluation work.
1.1.2 Methods for Pre-evaluation of the Implementation Performance
In the pre-evaluation of the implementation performance, the implementation effectsof the current control measures are evaluated using emission inventories and an airquality model. The specific pre-evaluation methods are illustrated by Figure 1-2.
Figure 1-2 Methods for pre-evaluation of the implementation performance

3
1.1.3 Indicator System for Follow-up Evaluation of the ImplementationPerformance
In the follow-up evaluation of the implementation performance, two parts areexamined: one is the ambient air quality, for assessing the impact of the controlmeasures already implemented; and the other is the progress in implementing theplanned control measures by all localities. Thus, two indicators are created, namely, aperformance indicator of air quality improvement and an indicator of control strategyimplementation. In particular, the performance indicator of air quality improvementshall serve as the key evaluation indicator for nationwide evaluation; and the indicatorof control strategy implementation serves as the auxiliary secondary evaluationindicator for the annual evaluation in key regions.
1.1.3.1 Performance indicator of air quality improvement
The decrease, expressed as a percentage of the annual average concentration of PM10
or PM2.5 is the key evaluation indicator of air quality improvement. Reductions in thenumber of days with heavy pollution and the percentage decrease of annual averageconcentrations of other pollutants (NO2, SO2, CO, O3) serve as secondary evaluationindicators of air quality improvement. Table 1-1 summarizes the annual averageconcentration improvement targets of PM10 or PM2.5 of all provinces andprovincial-level municipalities in 2017 in the Commitment Letter on Targets. TheBeijing-Tianjin-Hebei region and surrounding areas, the Yangtze River Delta, thePearl River Delta, and Chongqing City have PM2.5 targets, and other regions havePM10 targets.
Table 1-1 Air quality improvement targets of all localities in the CommitmentLetter on Targets
Province
Decrease in theAnnual AverageConcentration of
PM2.5
Province
Decrease in theAnnual AverageConcentration of
PM10
Province
Decrease in theAnnual AverageConcentration of
PM10
Beijing -25% (60 ug/m3) Henan -15% Sichuan -10%
Tianjin -25% Shaanxi -15% Ningxia -10%
Hebei -25% Qinghai -15% Heilongjiang -5%
Shanxi -20% Xinjiang -15% Fujian -5%
Shanghai -20% Hubei -12% Jiangxi -5%
Jiangsu -20% Gansu -12% Guangxi -5%
Zhejiang -20% Liaoning -10% Guizhou -5%
Shandong -20% Jilin -10% HainanContinuousimprovement

4
GuangdongPearl River Delta
-15%Anhui -10% Yunnan
Continuousimprovement
Chongqing -15% Hunan -10% TibetContinuousimprovement
Inner Mongolia -10% Guangdong Other cities -10%
Since the nationwide routine monitoring of PM2.5 was not initiated until 2013 and bytaking the availability of monitoring data into account, 2012 was set as the base yearfor PM10 and 2013 was set as the base year for PM2.5. To avoid any inaction by localgovernments in the early years, an annual progress assessment should be established.For the annual assessment targets of PM2.5, the annual average PM2.5 concentrationdeclines from 2014 to 2017 could be set at 10%, 40%, 70%, and 100% of the targetsin the Commitment Letter on Targets. It is proposed that the moving annual average(for example, the moving average values over three years) should be adopted forpurposes of evaluation so as to remove the interference of meteorological factors andemphasize the role of human-influenced emission reductions.
1.1.3.2 Indicators of control strategy implementation
Indicators of control strategy implementation and indicators of emission reductions ofair pollutants are used for investigating the completion of key tasks. Key work tasks inthe Ten Measures are shown in Table 1-2, including industrial restructuring, energystructure optimization, industrial atmospheric pollution control, dust pollution control,motor vehicle pollution prevention and control, and heavy-pollution weather warningand so on. Meanwhile, a rating mechanism should be established for assessment ofadequacy of measures and evaluation of progress toward air quality goals. Airpollutants closely related to particulate pollution (e.g., SO2, NOx, PM2.5, VOC, NH3)are considered for evaluating progress on the emission reduction measures. Taskscores are determined on the basis of the importance of such tasks in the effects on airquality improvement and the operability and costs of the tasks. Indicators ofassessment tasks shall be quantitative in principle.
Table 1-2 Indicators of control strategy implementation
Indicator Sub-indicator Indicator Sub-indicator
Industrialrestructuring
Reduction of surplus productioncapacity
Elimination of outdated productioncapacity
Relocation of enterprises with heavypollution
Dust pollutioncontrol
Control of dust pollutionin construction sites
Control of dust pollutionon roads

5
Energy structureoptimization
Control of total coal consumptionOptimization of coal consumption
structureImprovement of coal quality
Improvement of energy efficiency
Motor vehiclepollution
prevention andcontrol
Elimination ofyellow-label
(high-polluting) vehiclesImprovement of fuelquality (diesel &
gasoline)Strict standards for
emissions of new motorvehicles
Vehicle population anduse restrictions
Sales of New EnergyVehicles
Industrialatmospheric
pollution control
Elimination of small and inefficientcoal-fired boilers
Desulfurization, nitrogen oxidescontrols, and particulate controls
control of key sectorsControl of volatile organic
compoundsVapor recovery
Heavy-pollutionweather warning
Real-time warningissuance
Building of emergencyresponse plan system
1.2 Pre-Evaluation Case Analysis-Based on the Beijing-Tianjin-Hebei Region
1.2.1 Summary of Measures in the Action Plan
The measures for the Beijing-Tianjin-Hebei Region in the Action Plan were mainlyfrom the following several documents: the Air Pollution Prevention and ControlAction Plan, the Detailed Rules for the Implementation of the Air Pollution Preventionand Control Action Plan in the Beijing-Tianjin-Hebei Region and Surrounding Areas,the Action Plan of Beijing for Clean Air from 2013 to 2017, the Action Plan of Tianjinfor Clean Air, and the Plan of Hebei for the Implementation of the Air PollutionPrevention and Control Action Plan. These measures could be classified into twocategories: structural adjustment measures and end-of-pipe control measures.Structural adjustment measures aim to reduce emissions from the front-end; andend-of-pipe control measures refer to the application and upgrading of end-of-pipecontrol technologies.
Energy structural adjustment is a prominent policy in the Ten Measures. Figure 1-2shows projections of energy consumption in the Beijing-Tianjin-Hebei Region in2017. By 2017, coal consumption in Beijing-Tianjin-Hebei shall be reduced by 63million tons compared to 2012 according to the Ten Measures, specifically, 13, 10 and40 million tons for Beijing, Tianjin and Hebei, respectively. In 2017, the proportion ofcoal in total energy consumption will be reduced to 65% or below and coal will be

6
replaced by taking such measures as gradual increase in the percentage of electricityfrom other regions, increase in natural gas supply, and increased use of non-fossilenergy. Industrial restructuring is another important measure. By 2017, theBeijing-Tianjin-Hebei Region plans to eliminate outdated production capacity ofcement of 70 million tons and steel production capacity in Hebei is to be reduced by60 million tons compared to 2012.
(a) Beijing (b) Tianjin (c) Hebei
(d) Beijing-Tianjin-Hebei (combined)
Figure 1-3 Projections of energy consumption in the Beijing-Tianjin-HebeiRegion
The Ten Measures put forward a series of end-of-pipe control measures foraccelerating the projects of desulfurization, nitrogen oxides controls, and particulatecontrols. All iron and steel mills shall install desulfurization technologies on sinteringoperations. Coal-fired boilers with capacity of 20 t/h (1 t/h=0.73 MW) or above shalluse desulfurization technologies or techniques. Coal-fired units except circulatingfluidized bed boilers shall install nitrogen oxides controls technologies. Precalcinercement kilns shall implement the technical transformation to low NOx burners andinstall end-of-pipe nitrogen oxides controls technologies. Existing de-dusting facilitiesof coal-fired boilers and industrial kilns shall be upgraded. Control over vehicleemissions shall be continuously tightened. In 2015, the Beijing-Tianjin-Hebei Regionwill implement the China 5/V vehicle emission standard; Beijing plans to implement astricter China 6/VI vehicle emission standard in 2016. It is further recommended that

7
China’s three developed regions including the Beijing-Tianjin-Hebei Regionimplement China 6/VI in 2018 as fuels with a maximum sulfur content of 10 ppm willbe mandatory across the entire country by the end of 2017.3
1.2.2 Evaluation of Emission Reduction Effects of Air Pollutants
The emission inventory of the base year (2012) is based on the Multi-resolutionEmission Inventory for China (MEIC)4 developed by Tsinghua University and theemission inventory of the target year (2017) is quantified on the basis of the emissioninventory of the base year and in accordance with the Ten Measures and the projectionof energy consumption and penetrations of control technologies. The emissions ofSO2, NOX, PM2.5 and VOCs of the Beijing-Tianjin-Hebei Region in 2017 areestimated to be 1.395 million, 2.212 million, 0.902 million, and 1.999 million tons,which are projected to decline by 32%, 21%, 24%, and 6%, respectively, comparedwith 2012 levels (see Figure 1-4). Hebei contributes the most in the emissionreduction of pollutants of the Beijing-Tianjin-Hebei Region and it accounts for 71%,71%, 74%, and 45% of emission reduction of SO2, NOx, PM2.5, and VOC in theBeijing-Tianjin-Hebei Region; and the emission reduction rate of Beijing is the largestbecause it implements relatively stricter control measures.
(a) SO2 (b) NOx
3 As China’s vehicle population continues to grow rapidly and as it increasingly dominates the newvehicle market, China should consider also taking a leadership role in the development of clean andefficient vehicle requirements. For example, California and the US EPA recently adopted standards fornew cars that are 70% cleaner than Euro 6/VI requirements in addition to mandating longer in-usevehicle durability performance. In the future, China should consider not only adopting similar limitsbut also becoming the leader in pushing the clean vehicle technology envelope.4 http://www.meicmodel.org

8
(c) VOC (d) PM2.5
Figure 1-4 Emissions of key pollutants in the Beijing-Tianjin-Hebei Region in2012 and 2017
The most effective control measures for SO2 emission reductions are energy structureadjustment measures (contributes 41% of reductions) followed by desulfurization inthe power sector (24%); the most effective control measures for NOx emissionreductions are nitrogen oxides controls in the power sector (46%) followed byreductions from vehicles (20%) and energy structure adjustment measures (19%); themost effective control measures for primary PM2.5 emission reductions are upgradingof dust collectors in the steel industry (29%) followed by energy structure adjustmentmeasures (20%).
1.2.3 Evaluation of Air Quality Improvement Effects
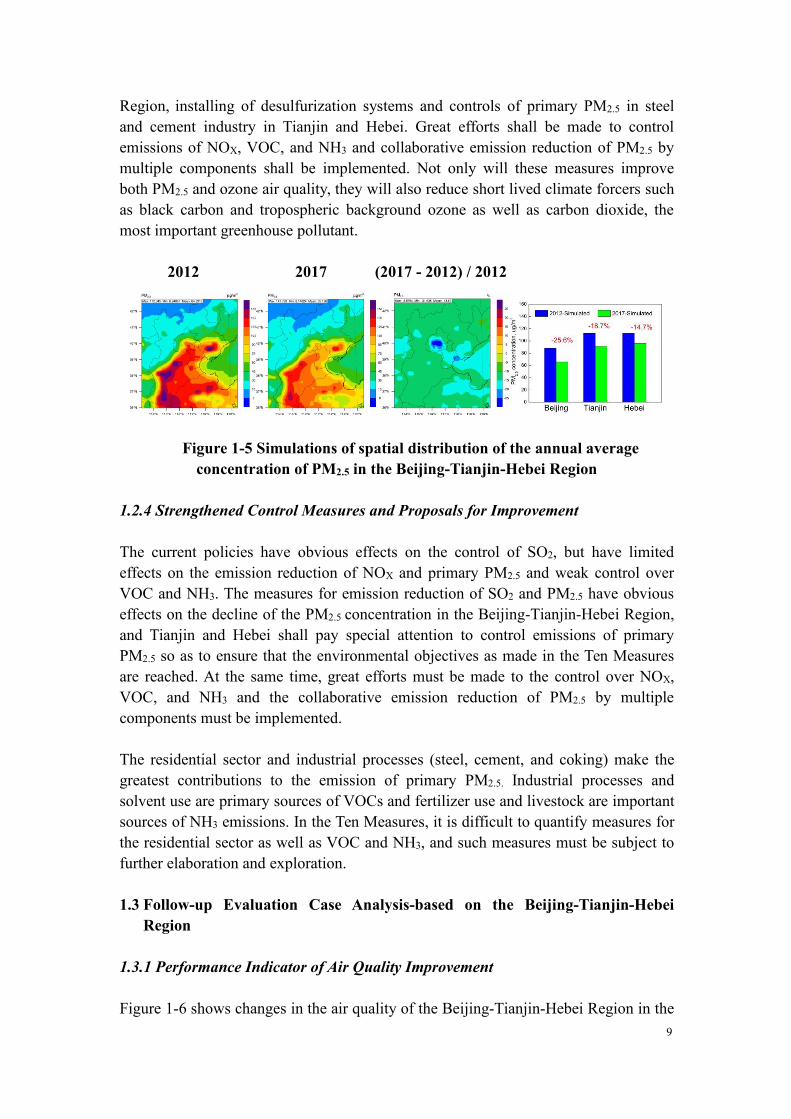
To assess air quality improvement effects in the Beijing-Tianjin-Hebei Region underthe Ten Measures, two air quality simulations was conducted based on the base year(2012) emission inventory and the target year (2017) emission scenario under the TenMeasures by using the Community Multiscale Air Quality (CMAQ)5 model.According to the simulated results (Figure 1-5), after the implementation of the TenMeasures, the annual average concentration of PM2.5 in Beijing, Tianjin and Hebeiwill be reduced to 65.8 μg/m3, 91.6 μg/m3, and 96.3 μg/m3 in 2017 from 88.3 μg/m3,112.7 μg/m3, and 112.9 μg/m3 in 2012, declines of 25.6%, 18.7%, and 14.7%,respectively. The declines of the PM2.5 concentration in the Beijing-Tianjin-HebeiRegion is remarkable, but there are still risks of failing to reach the targetconcentration reduction of 25% in 2017 in some areas in Tianjin and Hebei. In thedecrease of the concentration of PM2.5, sulfate, elemental carbon, organic componentsand other components make the largest contributions; nitrate makes relatively smallercontributions and its concentration even slightly increases, which is related to thenonlinear chemical reaction. The emission reduction measures of SO2 and primaryPM2.5 play great roles in the decline of the PM2.5 concentration. These effectivemeasures include significant reductions in the use of coal in the Beijing-Tianjin-Hebei
5 http://www.cmascenter.org
9
Region, installing of desulfurization systems and controls of primary PM2.5 in steeland cement industry in Tianjin and Hebei. Great efforts shall be made to controlemissions of NOX, VOC, and NH3 and collaborative emission reduction of PM2.5 bymultiple components shall be implemented. Not only will these measures improveboth PM2.5 and ozone air quality, they will also reduce short lived climate forcers suchas black carbon and tropospheric background ozone as well as carbon dioxide, themost important greenhouse pollutant.
2012 2017 (2017 - 2012) / 2012
Figure 1-5 Simulations of spatial distribution of the annual averageconcentration of PM2.5 in the Beijing-Tianjin-Hebei Region
1.2.4 Strengthened Control Measures and Proposals for Improvement
The current policies have obvious effects on the control of SO2, but have limitedeffects on the emission reduction of NOX and primary PM2.5 and weak control overVOC and NH3. The measures for emission reduction of SO2 and PM2.5 have obviouseffects on the decline of the PM2.5 concentration in the Beijing-Tianjin-Hebei Region,and Tianjin and Hebei shall pay special attention to control emissions of primaryPM2.5 so as to ensure that the environmental objectives as made in the Ten Measuresare reached. At the same time, great efforts must be made to the control over NOX,VOC, and NH3 and the collaborative emission reduction of PM2.5 by multiplecomponents must be implemented.
The residential sector and industrial processes (steel, cement, and coking) make thegreatest contributions to the emission of primary PM2.5. Industrial processes andsolvent use are primary sources of VOCs and fertilizer use and livestock are importantsources of NH3 emissions. In the Ten Measures, it is difficult to quantify measures forthe residential sector as well as VOC and NH3, and such measures must be subject tofurther elaboration and exploration.
1.3 Follow-up Evaluation Case Analysis-based on the Beijing-Tianjin-HebeiRegion
1.3.1 Performance Indicator of Air Quality Improvement
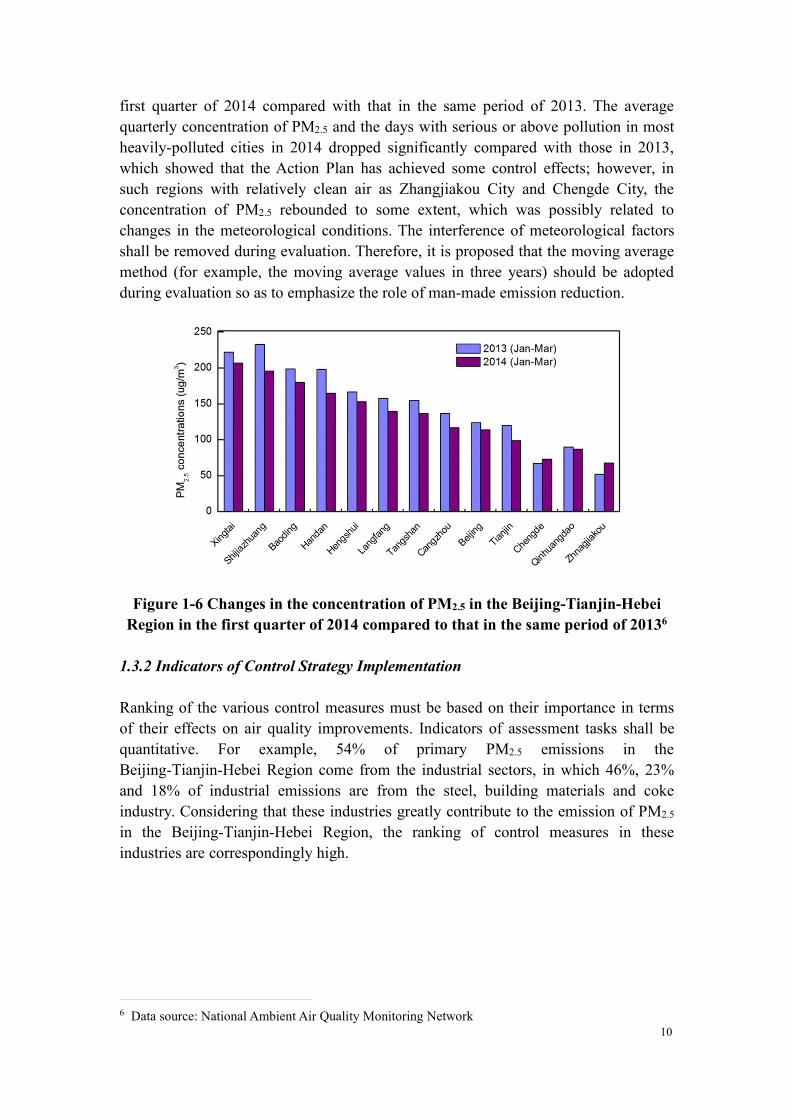
Figure 1-6 shows changes in the air quality of the Beijing-Tianjin-Hebei Region in the
10
first quarter of 2014 compared with that in the same period of 2013. The averagequarterly concentration of PM2.5 and the days with serious or above pollution in mostheavily-polluted cities in 2014 dropped significantly compared with those in 2013,which showed that the Action Plan has achieved some control effects; however, insuch regions with relatively clean air as Zhangjiakou City and Chengde City, theconcentration of PM2.5 rebounded to some extent, which was possibly related tochanges in the meteorological conditions. The interference of meteorological factorsshall be removed during evaluation. Therefore, it is proposed that the moving averagemethod (for example, the moving average values in three years) should be adoptedduring evaluation so as to emphasize the role of man-made emission reduction.
Figure 1-6 Changes in the concentration of PM2.5 in the Beijing-Tianjin-HebeiRegion in the first quarter of 2014 compared to that in the same period of 20136
1.3.2 Indicators of Control Strategy Implementation
Ranking of the various control measures must be based on their importance in termsof their effects on air quality improvements. Indicators of assessment tasks shall bequantitative. For example, 54% of primary PM2.5 emissions in theBeijing-Tianjin-Hebei Region come from the industrial sectors, in which 46%, 23%and 18% of industrial emissions are from the steel, building materials and cokeindustry. Considering that these industries greatly contribute to the emission of PM2.5
in the Beijing-Tianjin-Hebei Region, the ranking of control measures in theseindustries are correspondingly high.
6 Data source: National Ambient Air Quality Monitoring Network
11
1.4 Policy Proposals
1.4.1 Establishment of Pre-evaluation and Annual Evaluation Systems andAdjustment of Measures on the Basis of the Evaluation
Through the establishment of pre-evaluation and annual evaluation systems, annualmeasures can be adjusted on the basis of the evaluation so as to ensure that expectedcontrol targets are achieved. It is proposed that pre-evaluation indicators shall include:decreased concentration percentage of PM2.5 and decreased days with heavy pollution;and annual evaluation indicators shall include: annual reduction of the PM2.5
concentration (multi-years moving average), pollutant emission reduction, energyefficiency improvement, energy structure adjustment, and other completion progressof measures.
1.4.2 Establishment of Final Evaluation System
The final evaluation system provides a technological base for the continuousimprovement of air quality. Indicators incorporated into the final evaluation shallinclude: decrease percentage of the concentration of PM2.5, decreased days with heavypollution, changes in economic and industrial structure, and human health benefits.Improvements in air quality should result in such health indicators as reduced asthmaattacks in school children, and reduced hospital admissions due to a variety ofrespiratory and cardiovascular diseases.
1.4.3 Further Intensifying and Improving the Implementation Plans of Key Regionsfor the Action Plan
Pre-evaluation case results show that the concentration of PM2.5 in theBeijing-Tianjin-Hebei Region after the implementation of the Ten Measures has fallenremarkably; however, Tianjin and Hebei still have risks of failing to reach the targetconcentration reduction of 25% in 2017. All localities are advised to refine the TenMeasures, specify and quantify various control measures one by one, and implementthe Ten Measures to reduce actual emissions. At the same time, more efforts shall bemade to control NOX, VOCs, and NH3, each of which contributes to ambient levels ofPM2.5.
2. THE THIRTEENTH FIVE-YEAR PLAN AND THE GOAL ANDROADMAPOFAIR POLLUTION PREVENTION IN 2030
2.1 Prediction of Social and Economic Development From the ThirteenthFive-Year Plan Period to the Year 2030
Researchers used appropriate mathematical models to make prediction on thedevelopment trends of population, economy, energy, industry and transportation. In

12
this study, the BAU (Business as usual) scenario stuck to the existing policies, withenforcement of them staying as usual, and no new polices of energy conservation andemission reduction are adopted. Representative policies include: firstly, grossdomestic production (GDP) will reach the level of moderately developed countries by2050, which means the per capita GDP is 20,000 dollars; secondly, CO2 emissionsper-unit GDP will be reduced by 40%-45% compared with the year of 2005; thirdly,emission standards issued for power plant, cement, industrial furnace and motorvehicles before 2010 will continue to be put into force. Based on the aboveassumptions, under the BAU scenario, the researchers forecast the economicdevelopment trends, industrial and energy structures, urbanization rates andtransportation modes and trends during the 13th Five-Year plan period and continuingup to 2030. Predictions are summarized in Table 2-1:
Table 2-1 Predictions for economic and social development from the 13thFive-Year to 2030 (BAU scenario)
Item 2010 2020 2030
GDP (2005 price)/billion yuan 31165 65741 117718Population /billion 1.340 1.440 1.474Urbanization rate /% 49.7 58.0 63.0
Electricity production/TWh 4205 6690 8506
Percentage of coal-fired power /% 75 74 73Crude steel output /Mt 627 770 770Cement output /Mt 1880 2400 2450
Vehicle held per thousand people 58.2 191.2 380.2Share of new and renewable energy
/% a
7.5 8.3 8.9
CO2 emission per GDP/(t/tenthousand yuan)
2.67 1.82 1.20
a Includes hydropower, solar energy, wind electricity, ocean energy and nuclear power, etc. Noutilization of biomass.
2.2 Medium-term Goal of Air Pollution Prevention in the Thirteenth Five-yearPlan and the Long-term Goal up to 2030
Setting the medium and long term goal to prevent air pollution is based primarily onrelevant plans and reports like the Clean Air Action Plan by the State Council, AirQuality Guidelines (update version in 2005) by WHO, and the Macro StrategyResearch on China’s Environment by Chinese Academy of Engineering and Ministryof Environmental Protection. Therefore, goals for controlling and preventing airpollution adapted to china’s situation have been put forward, as given in Table 2-2:

13
Table 2-2 Medium and long term goals for control and prevention of air pollutionin China
Year National goal Goals in key regions
2017
Reducing PM10 of cities atprefecture level and above byover 10% compared with the
year of 2012
Reducing PM2.5 in Beijing-Tianjin-Hebei Region,Yangtze River Delta and Pearl River Delta PM2.5
by 25%, 20% and 15% respectively, and annualconcentration of PM2.5 in Beijing should be
reduced to 60 μg/m3
2020
Concentration of PM2.5 incities at prefecture level andabove should be reduced byover 15% compared with that
in 2012.
Concentration of PM2.5 in Beijing-Tianjin-HebeiRegion and Yangtze River Delta should be
reduced by over 35% and 30% respectively, andannual concentration of PM2.5 in Pearl River Deltashould reach the standards, annual concentrationof PM2.5 in Beijing should be reduced to 50 μg/m3
2030
Annual concentration ofambient PM2.5 in most citiesat prefecture level and aboveshould meet the standard
(GB3095-2012)
2.3 The Roadmap for Controlling and Preventing Air Pollution in Medium andLong Term
2.3.1 Scenario Design
The researchers have developed different scenarios to prevent pollution in the mediumand long term using an energy technology and pollution control model frameworkdeveloped by Tsinghua University7. This research, based on the BAU, firstly designeda scenario for the sustainable energy policy (PC). Then, we set up threepollution-controlling strategies, namely the baseline strategy ([0] strategy), theprogressive strategy ([1] strategy), and the maximum feasible reduction strategy ([2]strategy). After combining these two energy scenarios with three pollution-controllingstrategies, six different pollution-controlling scenarios come into being, namely BAU[0], BAU [1], BAU [2], PC [0], PC [1], and PC [2]. Definitions of these scenarios aregiven in Table 2-3:
7 Zhao, B., et al. NOX emissions in China: historical trends and future perspectives. AtmosphericChemistry and Physics, 2013, 13: 9869-9897.

14
Table 2-3 Names and definitions of these six scenarios
EnergyScenario
EnergyScenarioDefinition
PollutionControlStrategy
Pollution Control StrategyDefinition
Emissionscenario
Business asUsual(BAU)
Current policiesand compliance(till the end of2010) areassumed,
especially thatCO2 intensity
will be40%-45% lowerin 2020 than that
of 2005.
Reference([0])
Current policies and currentimplementation status (till the end of
2010).
BAU[0]
Progressive([1])
New pollution control policies areimplemented from 2011 to 2015,representing progressive approachtowards future environmental
policies after 2016.
BAU[1]
MaximumFeasibleReduction
([2])
Technically feasible controltechnologies are fully applied andregarded as the maximum feasible
reduction strategy
BAU[2]
AlternativePolicy Scenario
(PC)
Newenergy-savingpolicies are
introduced andenforced morestringently,including lifestyle changes,structural
adjustment andenergy efficiencyimprovement.
Reference([0])
Current policies and currentimplementation status (till the end of
2010).
PC[0]
Progressive([1])
New pollution control policies areimplemented from 2011 to 2015,representing progressive approachtowards future environmental
policies after 2016.
PC[1]
MaximumFeasibleReduction
([2])
Technically feasible controltechnologies are fully applied andregarded as the maximum feasible
reduction strategy
PC[2]

15
2.3.2 Results of the Energy Scenarios
aBiomass includes traditional burning material, methane, bio-fuel and biomass powerbOther renewable energy resources include hydropower, solar energy, wind and ocean energy
Figure 2-1 Prediction on China’s total energy consumption
Under the circumstances of BAU and PC scenarios, total energy consumed in Chinawill increase from 4,159 Mtce in 2010 to 6,817 Mtce and 5,295 Mtce respectively in2030. Coal has dominated the energy consumption, but its proportion will be reducedfrom 68.1% in 2010 to 59.5% and 51.8% in BAU and PC scenarios, respectively, in2030. However, the proportion of crude oil will increase; this is mainly resulting fromthe continuous increase in the vehicle population. In terms of the PC scenario, due tothe implementation of the sustainable energy strategy, the proportions of natural gas,clean utilization of biomass, nuclear power and other renewable energy resources arehigher than that in the BAU scenario. Energy consumption of different resources isgiven in Figure 2-1.
2.3.3 Emission Control Scenarios
2.3.3.1 Design of emission control scenarios
BAU [0]/ PC [0] is mainly based on the current policy and standard.
For the BAU [1]/ PC [1] scenario:
For the power sector implementation of the National 12th Five-Year Plan for

16
Environmental Protection and Emission Standard of Air Pollutants forThermal Power Plants (2011) is assumed.
For the industrial sector, it is assumed that the National 12th Five-Year Plan forEnvironmental Protection and relevant emission standards are put into practicefrom 2011 to 2015, and new polices come into being gradually after 2015.
For the residential sector, it is assumed that high-efficiency particulate controlsand low-sulfur coal will be adopted gradually; the total proportion of them willreach 20% in 2020 and 40% in 2030. In addition, this research has taken theapplication of advanced stoves and advanced biomass stoves intoconsideration.
For the transportation sector, it is assumed that the vehicle ownership perthousand people will decrease from 380 to 325, to properly control the totalvehicle population in cities. This scenario also assumes that the existingstandards in Europe will be carried out in China step by step, and the intervalof carrying out these two different standards should stay the same as orslightly shorter than in Europe.
For the solvent use sector, we assume that the new emission standards ofNMVOC (equivalent to the European standards of 1999/13/EC and2004/42/EC) will be issued and carried out in key provinces during the 12thFive-Year Plan period, and they will be issued and carried out in the rest of theprovinces during the 13th Five-Year Plan period. Later, the emission standardsof NMVOC will become even stricter.
BAU [2]/ PC [2] assumes that China takes full advantage of the most advancedemission reduction technology available. Flue gas desulfurization (FGD) technology,low-nitrogen combustion (LNB) + selective catalytic reduction (SCR) technology, andparticulate control will be fully applied for the power and industrial sectors. Apartfrom these control technologies, we will also promote advanced coal/biomass stovesin the residential sector and prohibit open burning with stronger enforcement. We willalso accelerate our efforts to eliminate high-emission vehicles, and make sure allvehicles in use meet the most stringent emission standards of Europe by 2030.
2.3.4 Prediction of Atmospheric Pollutants Emissions
Emission of atmospheric pollutants from 2005 to 2030 is given in Figure 2-2. In 2010,the anthropogenic emissions of SO2, NOX, PM10, PM2.5 and NMVOC in China wereestimated to be 24.4 Mt, 26.1 Mt, 15.8 Mt, 11.8 Mt, and 22.9 Mt, respectively. Undercurrent legislation and current implementation status (BAU[0] scenario), NOX, SO2,PM2.5, and NMVOC emissions in China are estimated to change by 36%, 26%, -8%,and 27% respectively by 2030 from 2010 levels. Assuming enforcement of newenergy-saving policies (PC [0] scenario), emissions of NOX, SO2, and PM2.5 in Chinaare expected to decrease by about a third while NMVOC by 16% by 2030 comparedwith the BAU [0] scenario. The implementation of the “progressive” end-of-pipe

17
control measures (reflected by the difference between PC [1] and PC [0]) is expectedto lead to about 55%, 41%, 31%, and 29% reductions of the baseline emissions ofNOX, SO2, PM2.5, and NMVOC, respectively. With the full implementation ofmaximum feasible reduction measures (PC [2] scenario), China’s emissions of NOX,SO2, and PM2.5 would account in 2030 for only a quarter and NMVOC for a third ofthe baseline case (BAU [0] scenario).
NOX
SO2
PM10
PM2.5
NMVOC
Figure 2-2 Air pollutant emissions from 2005 to 2030
2.3.5 Air Pollution Simulation and Emission Reduction to Achieve the Air QualityTarget
In this study, the scientists used the CMAQ4.7.1 model developed by US EPA tosimulate China’s atmospheric conditions and assess air quality impacts of differentemission levels. Based on simulation and experiment results, the scientists conducted

18
a statistical analysis and developed a response surface methodology (RSM) foremissions and pollutant concentrations. This allows them to rapidly estimate theimpact different emission levels from different source categories can have onatmospheric pollutant concentrations. In addition, the RSM makes it possible toquickly assess different control measures for different regions to ensure that pollutantconcentrations in target provinces and cities can reach the standards. Results of theanalysis show that in 2017 China needs to reduce the national SO2, NOX, PM2.5 andVOC emissions by at least 24%, 15%, 16%, and 2%, respectively, and the increase ofNH3 emissions shall be limited to less than 10%, compared with that in 2012. By 2030,China needs to reduce national SO2, NOX, PM2.5 and VOC emissions by at least 52%,65%, 57%, and 36%, respectively, and NH3 emissions shall also decrease gradually.China needs to intensify the emission control in heavily polluted areas. For example,the SO2, NOX, PM2.5, and VOC emissions in Beijing-Tianjin-Hebei Region shall bereduced by at least 32%, 25%, 30%, and 11%, respectively, by 2017 on the basis of2012 levels, and NH3 emissions can only increase slightly. By 2030, the SO2, NOX,PM2.5, VOC and NH3 emissions in Beijing-Tianjin-Hebei Region shall be reduced byat least 59%, 72%, 70%, 44%, and 21%, respectively. The emission targets for majorpollutants in all provinces are given in Table 2-4.
Table 2-4 Target emission ratio for major pollutants in all provinces, taking 2012as the benchmark (namely 1.0)
Pollutants Primary PM2.5 SO2 NOX NH3
Year 2017 2030 2017 2030 2017 2030 2017 2030
The country 0.85 0.39 0.85 0.56 0.86 0.37 1.10 1.00Beijing 0.65 0.43 0.62 0.48 0.66 0.26 1.10 0.65Tianjin 0.70 0.33 0.70 0.45 0.69 0.28 1.10 1.00
Hebei 0.71 0.37 0.72 0.63 0.71 0.39 1.10 1.00
Shanxi 0.80 0.31 0.79 0.56 0.88 0.36 1.10 1.00Inner
Mongolia0.82 0.35 0.85 0.67 0.89 0.36 1.10 1.00
Liaoning 0.92 0.33 0.99 0.62 0.93 0.36 1.10 1.00Jilin 0.86 0.36 0.81 0.58 0.75 0.36 1.10 1.00
Heilongjiang 0.78 0.29 0.77 0.55 0.85 0.35 1.10 1.00Shanghai 0.75 0.43 0.82 0.58 0.89 0.34 1.10 1.00Jiangsu 0.77 0.38 0.88 0.58 0.86 0.34 1.10 1.00Zhejiang 0.71 0.34 0.85 0.56 0.85 0.31 1.10 1.00Anhui 0.90 0.42 0.88 0.66 0.87 0.42 1.10 1.00Fujian 0.93 0.39 0.85 0.48 1.06 0.44 1.10 1.00Jiangxi 0.92 0.33 0.80 0.50 0.91 0.42 1.10 1.00
Shandong 0.74 0.33 0.79 0.45 0.89 0.34 1.10 1.00Henan 1.00 0.35 0.92 0.56 0.92 0.40 1.10 1.00Hubei 0.84 0.40 0.65 0.45 0.76 0.35 1.10 1.00Hunan 0.89 0.45 0.86 0.54 0.88 0.42 1.10 1.00

19
Guangdong 0.81 0.43 0.93 0.52 0.93 0.36 1.10 1.00Guangxi 1.02 0.58 1.08 0.54 0.87 0.41 1.10 1.00Hainan 0.86 0.52 1.09 0.49 0.87 0.36 1.10 1.00
Chongqing 0.92 0.45 0.86 0.54 0.83 0.41 1.10 1.00Sichuan 0.89 0.36 0.84 0.51 0.85 0.37 1.10 1.00Guizhou 1.06 0.71 1.05 0.94 0.89 0.46 1.10 1.00Yunnan 0.83 0.46 0.95 0.54 0.83 0.39 1.10 1.00Tibet 0.77 0.35 0.85 0.62 0.78 0.33 1.10 1.00
Shaanxi 0.86 0.29 0.86 0.61 0.83 0.36 1.10 1.00Gansu 0.88 0.34 0.95 0.64 0.89 0.40 1.10 1.00Qinghai 0.75 0.27 0.70 0.49 0.72 0.32 1.10 1.00Ningxia 0.85 0.32 0.83 0.49 0.84 0.33 1.10 1.00Xinjiang 0.87 0.38 0.81 0.43 0.81 0.34 1.10 1.0
2.4 Medium and Long Term Strategies For Controlling and Preventing AirPollution
After determining the goals of emission reductions for different regions, sectors andpollutants, we use the technical model of energy and pollutant emission to furtheranalyze the possible technical measures to achieve the above goals.
In terms of industrial restructuring and energy consumption, the percentage of coalaccounting for the total energy consumption must be no more than 65% in 2017.Beijing-Tianjin-Hebei Region, Yangtze River Delta and Pearl River Delta willendeavor to achieve negative growth in coal consumption by means of increasingpower transmission from other regions and natural gas supply, and using non-fossilenergy to replace coal. Apart from keeping what is necessary, urban areas shouldeliminate coal-fired boilers with capacity of 10t/h or less, and forbid the building ofcoal-fired boilers with capacity of no more than 20 t/h. In industrial cluster districtslike the chemical industry, paper making, tanning and pharmacy, must focus onconstructing co-generation units to eliminate scattered coal-fired boilers. InBeijing-Tianjin-Hebei Region, Yangtze River Delta and Pearl River Delta, China mustclosely restrict vehicle ownership and use, and speed up upgrading and transformingthe petroleum processing companies.
In 2030, besides the above measures, China must close down more facilities withoutdated capacity, compress facilities with excess capacity and strive to developenergy-saving and environment-friendly industries. China must promote cleanerproduction in agriculture, industry, construction and the business service sector; toreduce the energy consumption and emissions of air pollutants. China should promotethe cascaded utilization of energy and construction circular economy.
As for end-of-pipe emissions, China must implement the following technicalmeasures in order to achieve the air quality targets.

20
2.4.1 Power Sector
Newly-built power plant must be equipped with low NOx burners (LNB) andselective catalytic reduction (SCR), selective non-catalytic reduction (SNCR), orhybrid SCR/SNCR devices. The existing generator sets with capacity of more than300 MW should install and operate SCR before 2015, and generator sets with capacityless than 300 MW should be gradually equipped with SCR after 2015.High-efficiency particulate controls, such as fabric filters, should be promotedgradually and should be used universally in key regions before 2030.
2.4.2 Industrial Enterprises
As to SO2, flue gas desulfurization (FGD) will be put into use on a large scale. As toNOX, newly-built industrial furnaces will be equipped with LNB and the existingboilers shall have the transformation to LNB from 2012 to 2017, and most of theboilers will be equipped with LNB by 2020. As to PM, electrostatic precipitators (ESP)and high efficiency particulate controls will gradually replace the inefficient wet PMscrubbers (WET).
2.4.3 Residential Sector and Open-Burning of Biomass
Adjustments of energy structure will play a key role in reducing emission inresidential sector. In terms of end-of-pipe control, high efficiency particulate controlsand coal with low sulfur will be utilized gradually in residential sector. In addition,China shall consider the use of advanced boilers and biomass stoves (such asrestructuring combustion mode and using catalytic stoves), and take measures toforbid open burning.
2.4.4 Transport Sector
By the end of 2017, gasoline and diesel fuel for vehicle use that meet China 5/Vstandards will be provided nationwide; in the three key regions China 5/V fuels willbe introduced even earlier, by the end of 2015. China must control the emissions fromnew vehicles; east China must implement the China 5/V emission standards ahead ofthe national schedule; China must eliminate the production of low speed agriculturaltrucks and substitute modern light-duty diesel vehicles meeting national emissionsstandards instead. Compliance with vehicle emissions standards must be greatlyimproved by strengthening the conformity of production enforcement and enhancingthe oversight on in-use compliance. In addition, China must deal with high-emissionvehicles by scrapping all the light vehicles produced before the implementation of thefirst-stage (China 1) national standards, and launch a pilot project to either scrapheavy-duty diesel vehicles with high emissions (i.e. produced before China III wasimplemented) or retrofit them with high performing diesel particulate filters (DPFs).China must vigorously develop energy-saving and new energy vehicles (like hybrid

21
vehicles, plug-in hybrid vehicles, battery electric vehicles and natural gas vehicles) forpublic transportation vehicles with high annual mileage (like taxis and buses). Chinamust implement the China III emission standards for non-road machines in the year2015.
From 2018 to 2030, except for the three key regions which will proceed on a quickerschedule, China shall establish a sound regulatory system along with a goodenforcement capability for the rest of China. By the end of 2019, the gasoline anddiesel fuel for vehicle use that meet China 6/VI standards will be provided nationwide,and the three key regions should achieve this goal in advance, to cut the evaporationof gasoline significantly. China must properly control the total vehicle population incities by various means including a lottery system such as used in Beijing or anauction system as used in Shanghai. China must also implement the China 5/Vemission standards for new vehicles nationwide in 2018, and phase in the China 6/VIemission standards for new vehicles nationwide in 2020. China 6/VI emissionstandards for new cars, trucks and buses must be introduced in 2018 in the three keyregions; Beijing will introduce China 6/VI standards even earlier. China must activelydevelop the energy-conserving and new energy vehicles in the private vehicles; Chinamust introduce the China IV emission standards for non-road machines in the year2020, and unify the fuel standards for road vehicles and non-road machines step bystep, to ensure that the emissions from non-road machines are at the same level as thatfrom on-road motor vehicles. When it comes to formulating national emissionstandards for inland vessels and domestic flights, China should base requirements onair quality levels near the airports, ports and waterways in China, transport ofpollutants from these localities, and the health and environmental damages whichresult, and also promote the use of cleaner fuel for ocean-going vessels.
2.4.5 The Utilization of Solvent
During the 12th Five-Year Plan, the new emission standards of NMVOC shall beissued and implemented in key provinces. While during the 13th Five-Year, the rest ofthe provinces shall follow the example of those key provinces. Later, emissionstandards of NMVOC will become stricter.
2.4.6 Agricultural Sector
Fertilizer utilization and livestock farming are important sources of NH3 emissions.Improving fertilizer application structure and reducing the emission factor of urea areimportant in reducing emission in fertilizer utilization. For livestock emissionreduction, the application of low-nitrogen feed, breeding house renovation, quickwaste collection and mulch compost will be effective.
Conclusions Regarding Medium and Long Term Strategies

22
In short, to improve the ambient air quality and achieve the goals of controllingemissions of major air pollutants in stages, China should adhere to the coordinated,integrated and joint strategy. In controlling pollutants, China should exercisecoordinated control over SO2, NOX, PM, NH3 and NMVOC; in controlling pollutionsources, China should attach importance to industrial pollution sources, area pollutionsources and mobile pollution sources; and in making control strategies, China shouldmake joint measures to connect regions and cities.
2.5 Policy Suggestion
2.5.1 Identify Medium and Long Term Targets for Control and Prevention of AirPollution
China should identify the medium and long term targets to control and prevent airpollution: in 2020, concentration of PM2.5 in cities at prefecture level and aboveshould be reduced by over 15% compared with that in 2012. Concentration of PM2.5
in Beijing-Tianjin-Hebei Region and Yangtze River Delta should be reduced by over35% and 30% respectively, and annual concentration of PM2.5 in Pearl River Deltashould reach the Chinese air quality standard; annual concentration of PM2.5 inBeijing should be reduced to 50 μg/m3. Annual concentration of ambient PM2.5 inmost cities at prefecture level and above should meet the Chinese air quality standard(GB3095-2012).
2.5.2 Clean, Efficient and Sustainable Use of Coal
It is preferable to use coal in large-scale facilities with high-efficiency end-of-pipecontrol technologies; small-scale boilers and stoves should be phased out gradually,and district heating should be greatly promoted but with fully metered use.
China must make great effort to improve the energy efficiency of coal utilization. Theaverage energy efficiency of coal-fired power plants should be increased from 36% in2010 to 42% in 2030. The energy consumption per unit product of industrialcoal-fired boilers, blast furnaces, cement production, coke ovens, and brick kilns isassumed to be 24%, 13%, 16%, 44%, and 27% lower, respectively, in 2030 comparedwith 2010.
Clean coal technologies should be encouraged. China should increase the proportionof coal washing. The import of high-ash and high-sulfur coal should be banned.
2.5.3 Speed up the Adjustment of Energy Structure; Increase the Use of CleanEnergy
The total consumption of coal should be stringently restricted. By 2017, the share ofcoal in total energy consumption should be reduced to 65% or less, and Beijing,

23
Tianjin, the Yangtze River Delta, Pearl River Delta region should strive to achieve anegative growth of total coal consumption. By 2030, the proportion of the nationalcoal consumption should account for no more than 50% of the total energy use.
China will speed up developing and exploiting clean energy to ensure that the totalproportion of natural gas, nuclear and renewable resources (biomass not included)amounts to 25% of energy consumption. The supply of natural gas should beincreased, and natural gas should satisfy the need of residential sector in priority.Hydro power, nuclear power, wind power, and solar power should be greatlypromoted.
2.5.4 Strengthen the Coordinated Control on Multi-Sources and Multi-Pollutants
To improve the ambient air quality targets, China should adhere to the coordinated,integrated and joint strategies. That is to say: in controlling pollutants, China shouldexercise coordinated control over SO2, NOX, PM , VOCs and NH3; in controllingpollution sources, China should attach importance to industrial pollution sources, areapollution sources and mobile pollution sources; and in making control strategies,China should make joint measures to connect regions and cities.
The recommended future emission reductions are as follows: On the basis of 2012emissions, the national SO2, NOX, PM2.5 and VOC emissions should be reduced by atleast 52%, 65%, 57%, and 39%, respectively, by 2030, and NH3 should have a littledecline. China should intensify the emission control in heavily polluted areas. Forexample, the SO2, NOX, PM2.5, VOC and NH3 emissions in Beijing-Tianjin-HebeiRegion should be reduced by at least 59%, 72%, 70%, 44%, and 21%, respectively, by2030 from the 2012 levels.
3. INTERNATIONAL EXPERIENCES OF COORDINATION MECHANISMFOR REGIONALAIR POLLUTION MANAGEMENT
3.1 International Experience
3.1.1 Ambient Air Quality Standards, Action Plans, and Monitoring
Europe and the US establish science-based ambient air quality standards to adequatelyprotect human health and the environment from excessive levels of pollution.Attainment of the standards is also required at hot spots where the public is exposed topollution. Local and state/national authorities are given a timeframe to meet theambient air quality standards. If an area fails to meet the ambient air quality standards,the relevant air quality authority is legally required to take actions to reduce pollutionconcentrations in an effort to bring the area into compliance with the standards. If anarea fails to take sufficient action to meet ambient air quality standards, authoritiescan withdraw subsidies (e.g., highway construction funds in the US) provided by

24
national authorities.
Air Quality Plans (AQPs) [Europe] and State Implementation Plans (SIPS) [US]provide a comprehensive strategy for reducing emissions and pollution concentrations;AQPs and SIPs include among other items: (i) Analysis of source contributions, (ii)Pollution prevention and control policies, (iii) Schedules for implementing policies,(iv) Scientific and economic assessments to illustrate the potential emissionreductions and their costs, (v) Emergency plans for severe air pollution episodes, and(vi) Implementation and enforcement resource adequacy demonstrations.
Europe and the US require comprehensive air quality monitoring networks to trackprogress toward attaining the ambient air quality standards.
In the US, EPA designates “nonattainment” areas – an area that includes one or moreambient monitors that are not attaining the standard, and nearby areas with emissionsthat contribute to the air quality problem. Europe has a similar procedure. Monitorsare sited in different locations based on their measurement objectives – “background”stations, whether in urban or regional/rural areas, are placed in areas that are notaffected by nearby sources (e.g., industrial areas or roadways); “traffic” and“industrial” stations are sited in hot spot areas (e.g., roadways) that represent thehighest likely concentrations to which the general population may be exposed.Rigorous procedures to assure high data quality are set down.
Monitoring data are published and easily accessed by the public and interest groups;the public and interest groups can use the data to challenge air quality authorities incourt if they believe the government is not adequately addressing the air pollutionchallenges.
In Europe, SO2 and NOX emissions have been reduced at roughly equal sharesthrough (i) energy efficiency improvements (decoupling between GDP and energyconsumption), (ii) changes in fuel input, i.e., substitution of coal by cleaner fuels, and(iii) dedicated end-of-pipe emission control measures, with strict enforcementmechanisms. Economic incentives have proven to be a very effective tool toencourage clean technologies. As a co-benefit, this triple approach has also led to adecline in CO2 emissions.
3.1.2 Regional Air Quality Management
Europe and the US have spatially distributed emission reduction targets based onextensive measurements and modelling in an effort to determine the least costapproach to reducing emissions that cause or contribute to the ozone or PM2.5
problems.
European PM2.5 levels are significantly affected by NH3 emissions, increasing the

25
prominence of NH3 reductions in efforts to improve air quality.
European Member States must meet treaty obligations to limit pollution thatcontributes to downwind areas and adhere to national emission ceilings (i.e., totalemission caps). European national emission ceilings are based on cost-effectivenessand distributional impacts. In addition, joint air quality planning cooperation isencouraged in the event of non-compliance with air quality standards due totransboundary pollution transport.
The US Clean Air Act requires upwind areas to prevent or control emissions thatcause a downwind area to exceed the National Ambient Air Quality Standards. EPAworked with state governments and other stakeholders to create regional planningorganizations (RPOs) to foster regional coordination and cooperation; RPOs weretasked to: (i) compile regional emission inventories, (ii) improve regional modelingcapabilities, (iii) bolster monitoring programs, and (iv) build capacity for air qualitymanagement.
The US RPOs are independent organizations that facilitate regional coordination, butthe legal forcing mechanisms within the US Clean Air Act (e.g., “Good Neighbor”provision, State Implementation Plan requirements) encourage participation andrequire action
The US focused many of the regional control programs on the power sector becausethe sector was responsible for a significant portion of total emissions and provided themost cost-effective emission prevention and control opportunities; other sectors (e.g.,transportation) were also subject to stricter pollution prevention and controlrequirements.
US regional emission limits are based on the contribution to downwind air quality,cost-effectiveness of emission control, and the time required to implement controltechnologies.

26
3.1.3 National Emission Standards for Major Stationary Sources
The Industrial Emissions Directive (IED) [Europe] and New Source PerformanceStandards (NSPS) [US] establish emission limits for large stationary sources. The IEDrequires Member States to develop a plan outlining the strategy for implementing andenforcing the limits and to apply “best available emission control technology” definedEU-wide by institutionalized expert groups. The US and the EU requires that largestationary sources obtain a pre-construction permit (similar to an EIA) and anoperating permit from the state environmental agency; the operating permitconsolidates into a single document all the various air pollution and monitoring andreporting requirements that apply to the facility or enterprise.
Column 3-1 The Convention on Long-range Transboundary AirPollution (CLRTAP)
CLRTAP is an international agreement for the establishment of common policies onstrategies, monitoring systems and measurements in relation to air quality under the UnitedNations Economic Commission for Europe’ (UN-ECE), Parties as fully-sovereign statesagreed to limit and, as far as possible, gradually reduce and prevent air pollution includinglong-range transboundary air pollution. Parties to the Convention have agreed to specificobligations in 10 protocols, which among other things established common air qualitymonitoring and atmospheric dispersion modelling activities, and specific quantitativeobligations to reduce emissions of single pollutants, such as SO2, NOX, VOC, heavy metalsand POPs. Most recently, Parties agreed to an amendment of the Gothenburg protocol thatalso addresses health impacts from PM2.5 and includes country-specific emission reductionobligations to limit their national emissions of SO2, NOX, NH3, VOCs and PM2.5 belowspecified ceilings and to recognize the close linkages between regional air pollution andglobal climate change.

27
Column 3-2 US experience in regional air quality management
The amendments to the Clean Air Act (CAA) in 1977 and 1990 include a “good neighbor”provision, which requires each state to have provisions in its overall air quality management planthat prohibit activities that lead to interstate transport of pollution that can “interfere” with theattainment and maintenance of the ambient air quality standards by another state. The CAA alsoincludes a “bad neighbor” provision. This provision allows a downwind state to petition EPA torequire emission reductions in a neighboring state, and gives EPA the authority to directly regulatea specific source (or group of sources) in the upwind state.
In the 1990 CAA amendments, Congress established the Ozone Transport Commission (OTC),charged with evaluating the interstate transport of ozone and its precursors, and designing regionalpollution prevention and control policies. The 1990 CAA amendments also called for theestablishment of the Grand Canyon Visibility Transport Commission (GCVTC). The GCVTC wasa regional organization established in 1991 (comprised of 9 western states and 4 Tribal nations)charged with developing recommendations for measures to reduce visibility impairment (caused byemissions of fine particles and precursors such as SO2 and NOX) in 16 national parks andwilderness areas. The Commission’s report in 1996 provided important technical and policyfoundation for the EPA to establish the Regional Haze program in 1999. In addition, the CAA alsogives EPA the general authority to establish other interstate transport commissions.
In 2000 EPA provided initial funding for five Regional Planning Organizations (RPOs) across theUS to assist with the coordination and cooperation needed to provide the technical, scientificfoundation necessary to assist state agencies with developing regional air quality SIPs. EPA alsodeveloped guidelines for improving coordination among states and organized biannual meetings ofall RPOs to share information and lessons. Among other activities, the RPOs were tasked withcompiling emissions inventories, establishing emissions tracking systems, improving regionalmodeling capabilities, bolstering monitoring programs, and providing capacity building to state airquality agencies.
In the past, when states have been unable to agree on a final policy option for all states to adopt,EPA has then taken a lead role in developing a regulatory program applicable to a large group ofstates to reduce SO2 and/or NOX to address regional PM2.5 and ozone problems. The 2005 CleanAir Interstate Rule (CAIR) and the 2011 Cross-State Air Pollution Rule (CSAPR), both regionalcap-and-trade programs designed to reduce emissions of SO2 and NOX from the power sector, weredeveloped to address this type of situation. CSAPR established emission caps for each upwind statebased on the state’s significant contribution to nonattainment in downwind states, includingemission levels, sources to be controlled, and schedules for CSAPR, and under the CSAPR, stateswere required to develop a SIP describing how they would achieve state-level emission limits (i.e.,emission caps). States also had the option of developing state-specific policies.

28
3.1.4 National Emission Standards for Mobile Sources
Europe and the US have stringent emission standards for on road vehicles and areexpanding the standards to include more off road sources (e.g., construction andagricultural equipment and in some areas marine vessels and fuels).
The US has an effective recall program that requires vehicle manufacturers andimporters to recall and correct engines or pollution controls that are unable to meetemission or durability requirements. It has also added a wide range of test conditionsto type approval and in use compliance regimes.
Euro 6/VI substantially improves the type approval testing and in use compliancerequirements compared to previous mandates.
As the above summary indicates, both Europe and the United States have strong andmature strategies to address air pollution. While they differ significantly in details,they have many important common elements. Based on the long term experience inboth Europe and the United States, the following measures are recommended.
3.2 Recommendations for China’s Air Quality Management based on theInternational Experience
3.2.1 China should adopt a strong regional program to assure close coordination byall parties whose emissions contribute to the air quality in a given air shed
Effective reductions of ambient PM2.5 and ozone in China require a coordinatedregional approach taking into account that PM2.5, ozone and their precursors aretransported in the atmosphere over hundreds of kilometers. Therefore regionalplanning centers (RPCs) should be established to: (i) facilitate coordination andcooperation among provincial and municipal air and energy officials, (ii) buildcapacity through training, and sharing experiences and lessons, (iii) bring consistencyto emission data, monitoring networks and methods, and modeling analysis, and (iv)leverage resources.
RPCs will likely require Central government financial and logistical support,oversight, and authority to compel provincial and municipal governments toparticipate in the RPC.
Definitions of air sheds should be based on meteorological, topographical and otherconditions that define appropriate boundaries for effective emissions control to assurethat air quality standards can be met. Consideration should be given to combining thethree key regions – JJJ, YRD and PRD - and other associated provinces in EasternChina’s industrialized, highly populated and highly polluted area into a single region.Such an approach would still likely require multiple sub regional planning centers tomaximize the overall effectiveness.

29
3.2.2 Effective pollution prevention and control policies and planning are critical;therefore, China should carefully analyze experience with control measures andimplement those found to be both environmentally and cost effective
Cost-effective reductions of ambient PM2.5 require significant cuts of SO2, NOX andVOC emissions from industrial sources and transportation are needed. Withoutadditional and appropriate measures to control NH3 emissions from agriculturalsources, it is unlikely that the benefits from the reductions of SO2 and NOX will berealized, especially during peak pollution episodes. Emission reductions and thespatial and sectoral distributions of those reductions should be based on integratedmodelling of all precursor emissions and regional discrepancies.
Integrated multi-sectorial policy approaches have been used to cost-effectively reduceemissions in Europe and the US and should be used in China – SO2, NOX, PM andVOCs emissions can be reduced through: (i) energy efficiency improvements(decoupling between GDP and energy consumption), (ii) changes in fuel input, i.e.,substitution of coal by cleaner fuels, (iii) dedicated end-of-pipe emission controlmeasures, with strict enforcement mechanisms. These policy approaches can take theform of regulatory measures or economic incentives and disincentives. Integratedmulti-sectorial approaches should be used to maximize co-benefits of air pollutioncontrol, energy conservation, greenhouse gas emissions, oil imports, water resourcesand others.
Stationary sources: Minimum performance standards, which relate to what isachievable with advanced emission control technologies while not entailing excessivecosts, should be required for all new major sources and any major sources undergoingsignificant modification or relocation from high-density urban areas. An institutionalframework should be established to define “minimum performance standards” fordifferent types of industries. In pollution control areas, local authorities should beauthorized to impose stricter standards.
Mobile sources: Because motor vehicles travel across political boundaries, vehicleemission controls should be nationally consistent to the degree of stringencynecessary to address the most serious air pollution problems. Local controls cansupplement but not replace national controls. Once fuel of sufficient quality can bemade available, the most stringent feasible vehicle standards have been found to bevery cost effective in Europe and the US and should be adopted in China. Economicincentives, such as emission-dependent vehicle taxes and motorway charging schemes,should be used to promote faster modernization of the vehicle fleet or retrofit withexhaust gas treatment systems, like diesel particulate filters.
In parallel with tighter vehicle and fuel standards, Europe and the US have found itcritical to substantially increase the focus on in-use compliance throughout the widerange of real in-use driving conditions; an upgraded compliance program is critical to

30
the success of China’s vehicle pollution control efforts.
Air quality planning: Air quality action plans are a critical tool to help provincial andmunicipal air, energy, economic, and health officials develop strategies for enhancingair quality and reducing energy consumption; plans should include: (i) emissioninventories to identify, assess, and rank pollution sources and sectors, and to evaluateprogress in reducing emissions, (ii) pollution prevention and control strategies toachieve air quality targets, (iii) air quality modeling to assess the impact of economictrends and the expected effects of pollution prevention and control strategies, (iv)ambient monitoring and assessment strategies to measure progress toward air qualitytargets (v) implementation strategies to identify the required resources to implementand enforce the pollution prevention and control strategies, (vi) program evaluationprocedures to assess progress and identify gaps, and (vii) contingency plans that canbe implemented if the region fails to make reasonable progress toward the air qualitytargets. Air quality attainment and emission prevention and control timelines in theplan should be realistic; repeated failure of compliance despite reasonable effortsmight compromise the policy approach.
In areas exceeding the air quality standards, economic growth should be conditionedon measures to offset any additional emissions; the amount of offset should bedependent on the degree the air quality standard is exceeded.
Assessments of the plan should be based on the air quality assessment, complianceassessment, and the pollution prevention and control measure impact analysis andimplementation assessment.
3.2.3 China should focus on building a strong and effective compliance program
The effectiveness of the policies and control measures adopted by China is ultimatelydependent on a well-funded and staffed compliance program. Forecasts of successfulemission control efforts are dependent on the assumption that control measures arefully effective. Based on international experience, strong compliance programs mustbe included in all administrative levels of the clean air program to assure thiseffectiveness.
3.2.4 Setting appropriate air quality standards that will adequately protect publichealth and implementing a monitoring network that accurately assesses compliancewith those standards should be the backbone of China’s Clean Air Program
Air quality standards, that need to be attained, should be defined for and monitored inall areas, including in areas with high concentrations (e.g., hot spots), like road sidelocations or industrial centers, where the population is exposed to air pollution.
Ambient air pollution data quality should be ensured through carefully designed and

31
operated data quality assurance and quality control (QA/QC) procedures, including: (i)specifying the differing objectives of the various monitors (e.g., hot spots, backgroundlevels) and the appropriate siting conditions for each type, (ii) specifying the neededaccuracy of the monitoring data specifically for the Beijing or other Action Planswork (data quality objectives), especially with a view to the need for accuratelyassessing annual improvements in the PM2.5 concentration, (iii) ensuring that theQA/QC procedures are adequate to provide the needed accuracy, (iv) ensuring themonitoring stations on which the PM2.5 reduction assessment is based are properlylocated, subjected to QA/QC, and stable, especially in terms of changes in nearby areause and activities. This requires regular cross-comparisons among the monitoringnetworks and calibration with the national standard to ensure data consistency acrossall networks. Finally, a successful air monitoring program will require an infusion ofresources dedicated to this effort along with training and capacity building.
Ambient monitoring networks should be designed to enable the apportioning of thecontributions from local sources, urban conurbations, and regional pollution sourcesbased upon the data from the network, as an additional source of apportionment tothat given by modelling.
3.2.5 A process for measuring the effectiveness of control measures anddetermining progress in improving air quality should be a priority for China
Meteorological and other conditions can significantly affect ambient pollutionconcentrations. The evaluation of annual air quality changes should be adjusted forinter-annual differences in these conditions in order to assess the progress towards theair quality goals as a result of the control measures, which is a main indicator for thesuccess of the air quality action plans in JJJ, YRD and PRD. No specific method canbe recommended, because it needs to be tailored to the meteorological conditions inChina. Given the strong relevance the adjustment method should as far as possible beapplicable everywhere to ensure a consistent and transparent way of measuring andcomparing the achieved progress. However, it is important to recognize that air quality,regardless of meteorological conditions, has human health implications. Therefore,achieving the air quality standards in absolute terms under all meteorologicalconditions should be the goal for every region.
Measuring annual improvement in air quality is strongly linked with quality/accuracyof the monitored data, and the needed capacity for QAQC procedures. Air qualitymodeling can supplement air pollution monitoring to assess the annual pollutionreduction rate, based upon the assessment of the annual reductions in the emissions.
3.2.6 China should highlight the climate change co-benefits of the air pollutioncontrol effort
China’s air pollution control effort will reduce coal consumption, facilitate industrial

32
modernization, increase the use of renewable fuels, improve vehicle efficiency, andstimulate the increased production and sale of new energy vehicles beyond businessas usual; each of these air pollution control steps will reduce CO2 emissions as aco-benefit. Other clean air control strategies will also reduce CO2 emissions. Further,actions to reduce PM emissions from diesel vehicles and other sources will also lowerblack carbon emission, a very important short lived climate forcing pollutant whichrecent evidence indicates may be second in importance only to CO2 in terms of itsclimate impact. Finally, the reduction in NOx and VOC emissions from all sources asa result of the clean air control measures should contribute to lowering of globaltropospheric background ozone levels, also a potent greenhouse pollutant.
In light of the increasing urgency in addressing global climate change as well asChina’s recent emergence as the largest contributor to the problem along with theUnited States, it is extremely important to highlight the climate benefits of the cleanair strategy and the win-win nature of the effort.
4. COORDINATION MECHANISM AND POLICY RESEARCH FOR THEREGIONALAIR POLLUTION CONTROL
4.1 Current Situation of the Coordination Mechanism and Policies
4.1.1 The Zones Designated for Regional Air Pollution Control
4.1.1.1 Traditional management zones of regional air pollution control
Prior to year 2010, the scope of air pollution control was defined by administrativeregions. Different administrative regions respectively make their own pollutioncontrol policies to achieve their own goals. However, air pollution does not abide bythe administrative boundaries, so the “Twelfth Five-Year” Plan for the Key RegionalAir Pollution Control (hereinafter referred to as the Key Regional Planning ) breaksthe administrative boundary constraints for the first time, marking out 13 areas (3regions and 10 city clusters) for air pollution control, as shown in Figure 4-1.Defining of these zones is based on the fact that air pollution in China is highlydependent on economic development level and population density.

33
Figure 4-1 Regions set out in “Twelfth Five-Year” Plan for the Key Regional AirPollution Control
4.1.1.2 Defining the zones based on the satellite remote sensing
According to the satellite remote sensing data, areas with high PM2.5 concentrationinclude the following regions: Beijing-Tianjin-Hebei region, Yangtze River Deltaregion, Shandong, Chengdu-Chongqing, Wuhan, Chang-Zhu-Tan, Henan provinceand Anhui province. Northern China, Central China and Eastern China have formedinto a large area of heavy PM2.5 pollution.
Figure 4-2 Spatial distribution of aerosol optical depth during 2011-20128
8 Based on the data retrieved from MODIS, NASA.

34
4.1.1.3 Defining the zones based on the ground measurement
The neighboring cities always present similar trend and characteristics of air pollutiondue to similar surface and meteorology condition. Wang (2008)9 grouped 86 Chinesecities into 14 areas based on statistical analysis of API data, which is derived fromground measurement of air pollution concentrations (Figure 4-3).
a b
Figure 4-3 Partitioning of air pollution control
4.1.1.4 Indication from simulation of air pollution transport
Based on simulations of PM2.5 transport with Particulate matter sources trackingtechnology (PSAT) of CAMx air quality model, a PM2.5 transport matrix between 31provinces (sources) to 333 prefecture cities (receptors) was developed10. The analysisresults show that more than 50% of PM2.5 in the Beijing-Tianjin-Hebei region comesfrom Hebei province, followed by Beijing and Tianjin, with the contribution rate of12% and 10% respectively; there are about 20% from regional transmission, such asShandong, Henan and Shanxi, with the contribution rate of 6%, 5% and 5%respectively. The key zones for regional air pollution control should be adjustedaccording to the result.
9 Wang, B. Analyzing spatial and temporal characteristics of regional air pollution of China Based onAir Pollution Index (API), Dissertation of Ocean University of China, Qingdao, China. 2008.10 Xue, W, et al. Numerical study on the characteristics of regional transport of PM2.5 in China. ChinaEnvironmental Science, 34(6):1361-1368, 2014.

35
a. Arithmetic average b. Area weighting
Figure 4-4 Source apportionment of PM2.5 in Beijing-Tianjin-Hebei region
4.1.1.5 A brief summary
The Key Regional Planning defines “three regions and ten city clusters” based on theregional characteristics of social and economic development. As more and more factsindicate a significant contribution from transport of air pollutants amongprovinces/regions, there should be adjustments to the definition of zones, based onfacts from satellite observation, ground monitoring and modelling. The eastern part ofChina should be considered as a whole for regional management.
4.1.2 How Atmospheric Environmental Management Organized
4.1.2.1 From total emission control to air quality improvement
Since early 1970s, atmospheric environmental management in China has experienceda significant evolution. The management metric changed from emission standardsduring 1970-1995 to total emission control during 1995-2010, then to air quality after2010.
During the “11th Five-Year Plan” period, total emission control was set as a nationalstrategic target. Achieving the target led to a significant reduction of SO2 emissions.However, the feelings of the public regarding bad air quality stimulated thegovernment to change the goal of air pollution management from total emissioncontrol to air quality improvement.
In September 2013, the Action Plan on Air Pollution Prevention and Control(hereinafter referred to as the Action Plan) was issued. The binding targets of PM2.5
concentration reduction were agreed between central and provincial government.Annual average PM2.5 concentration should decline by 25%, 20% and 15% in theBeijing-Tianjin-Hebei region, Yangtze River Delta region and the Pearl River Deltaregion, respectively. Annual average PM10 concentration should decline by 10% forother part of China.

36
4.1.2.2 Top-down approach
The top-down approach is applied in China’s atmospheric environment management.Namely the central government determines the overall target and puts the target intodetail from the top down. Then the target is decomposed to each province, taking intoaccount the local environment quality as well as the economic and social developmentstatus. Then the target is further decomposed to even lower level such as cities.
4.1.2.3 A brief summary
To date, atmospheric environmental management in China has focused more on totalemission control of SO2 and NOX. It contributed significantly to air qualityimprovement; however, improving air quality needs more integrated approaches. Inone hand, the local governments should take air quality, instead of emission reductionof SO2 and NOX, as their soul target, in the other hand, approaches to reduce PM andVOCs emission should be more considered as well.
4.1.3. Coordination Mechanism of the Regional Air Pollution Control
4.1.3.1 Working mechanism
The state council has developed the MEP leading inter-ministerial coordinationmechanism of the air pollution control to strengthen information communicationbetween departments. The coordination mechanism for air pollution control inBeijing-Tianjin-Hebei region and its surrounding, Yangtze River Delta region and thePearl River Delta region, is also developed, respectively led by Beijing, Shanghai andGuangdong provinces. Working rules were made to claim the explicit responsibilityand focuses, and working conferences were held routinely to discuss the key issues ofthe cooperation.
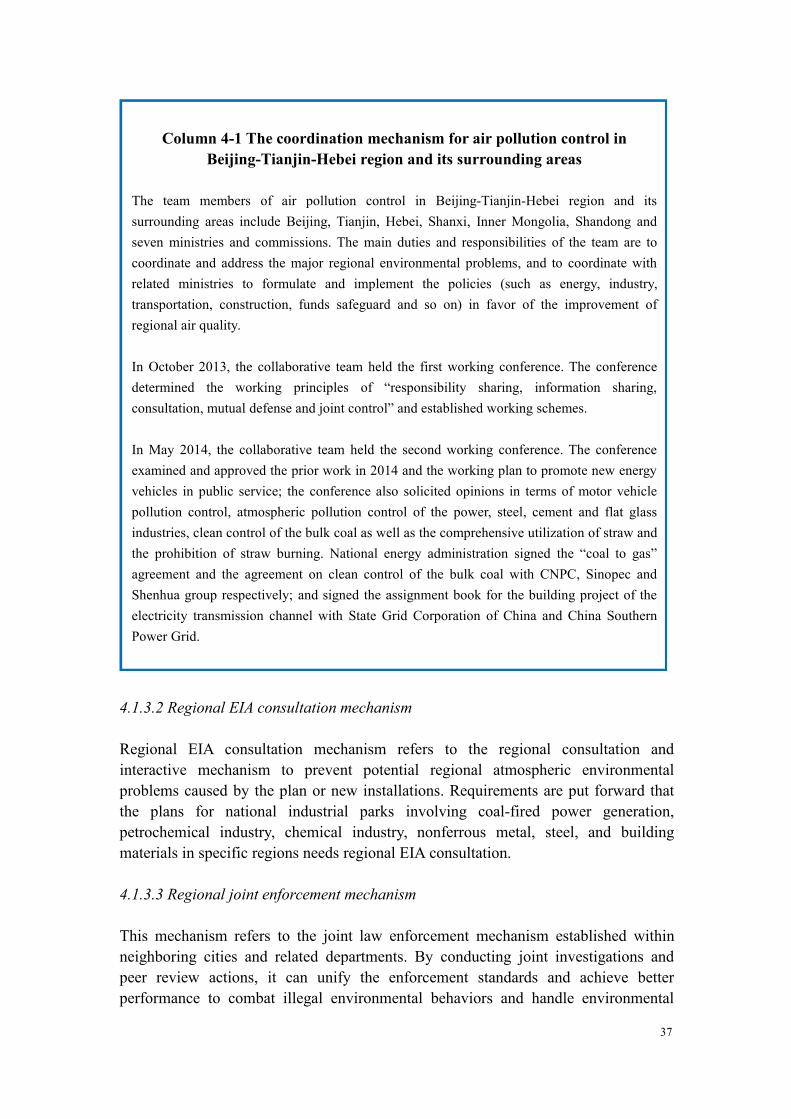
37
Column 4-1 The coordination mechanism for air pollution control inBeijing-Tianjin-Hebei region and its surrounding areas
The team members of air pollution control in Beijing-Tianjin-Hebei region and itssurrounding areas include Beijing, Tianjin, Hebei, Shanxi, Inner Mongolia, Shandong andseven ministries and commissions. The main duties and responsibilities of the team are tocoordinate and address the major regional environmental problems, and to coordinate withrelated ministries to formulate and implement the policies (such as energy, industry,transportation, construction, funds safeguard and so on) in favor of the improvement ofregional air quality.
In October 2013, the collaborative team held the first working conference. The conferencedetermined the working principles of “responsibility sharing, information sharing,consultation, mutual defense and joint control” and established working schemes.
In May 2014, the collaborative team held the second working conference. The conferenceexamined and approved the prior work in 2014 and the working plan to promote new energyvehicles in public service; the conference also solicited opinions in terms of motor vehiclepollution control, atmospheric pollution control of the power, steel, cement and flat glassindustries, clean control of the bulk coal as well as the comprehensive utilization of straw andthe prohibition of straw burning. National energy administration signed the “coal to gas”agreement and the agreement on clean control of the bulk coal with CNPC, Sinopec andShenhua group respectively; and signed the assignment book for the building project of theelectricity transmission channel with State Grid Corporation of China and China SouthernPower Grid.
4.1.3.2 Regional EIA consultation mechanism
Regional EIA consultation mechanism refers to the regional consultation andinteractive mechanism to prevent potential regional atmospheric environmentalproblems caused by the plan or new installations. Requirements are put forward thatthe plans for national industrial parks involving coal-fired power generation,petrochemical industry, chemical industry, nonferrous metal, steel, and buildingmaterials in specific regions needs regional EIA consultation.
4.1.3.3 Regional joint enforcement mechanism
This mechanism refers to the joint law enforcement mechanism established withinneighboring cities and related departments. By conducting joint investigations andpeer review actions, it can unify the enforcement standards and achieve betterperformance to combat illegal environmental behaviors and handle environmental
38
events reasonably and in a coordinated manner.
After the publication of Action Plan, MEP launched monthly inspections in theBeijing-Tianjin-Hebei region. The results are reported to the government andpublished for the public. In addition, MEP and the MPS (Ministry of Public Security)jointly issued opinions on strengthening the cooperation with public securitydepartments in law enforcement of environmental protection so as to improve thedeterrent power of law enforcement.
4.1.3.4 Emergency response mechanism for heavy regional pollution
A 4-levels (country-key areas-province-city) air quality forecast framework has beenpreliminarily established. Among them, the national forecast and early-warning centerand the center for Beijing-Tianjin-Hebei region have been operational, providingsupportive information for regional emergency response.
Followed the Guide for Emergency Plans of Cities’ Heavy Atmospheric Pollution, thelocal governments have made their specific emergency response plans for heavy airpollution. Emergency response will go into force followed the instruction fromforecast and early-warning centers.
4.1.3.5 Information sharing mechanism
Regional environmental information sharing refers to sharing and exchanginginformation about air pollution control among different districts, departments andlevels. It is clearly required in Environmental Disclosure rules (trial implementation)that environmental protection departments should offer 17 kinds of environmentalinformation to the public with their extent of competence. To date, sharing of airquality information has been realized through real-time publication of air qualitymonitoring data; sharing of emissions information has been realized through annualreport of the environmental status; and sharing of environmental performanceinformation of key enterprises has been realized through the annual reports disclosuresystem for the 16 kinds of heavy pollution industries in stock markets.
MEP and MPC have established a trans-department information sharing system.Within this system, MEP transfers the legal cases to MPC, and MPC shares the statusinformation of case processing with MEP, as well as the environmental pollution casesinvestigated and discovered by MPC.
MEP and Meteorological Administration have established a cooperation framework,including information sharing of chemical composition of air pollutants, monitoringdata of ambient air quality, meteorological observation and forecasting, and data fromthe satellite.

39
4.1.3.6 A brief summary
China has developed a unified environmental decision-making and consultationworking mechanism in three key areas. However, cooperation on pollution controland supervision still need to be strengthened. In addition, improving the air quality ofthe whole region rather than some key cities should be more focused.
In regard to regional EIA and Consultation, some specific aspects like confirming thescope and content of consultation and handling of the opinions from Consultationneed further research and exploration. In regard to regional joint enforcement, there isa demand to further improve the regime of regional joint enforcement, explorediversified forms of regional joint enforcement, establish multi-sector joint lawenforcement mechanisms, and perfect the linkage mechanism of law-enforcing andjudicial departments. In regard to early weather warning of regional heavy pollution,grading standards of early warning in some areas still fails to achieve completeunification, and the emergency response plans need cost-effectiveness analysis. Inregard to environmental information sharing, sharing of some key information such asEIA information of new installations, emission of air pollutants in some enterprises isstill lacking, and the communication between local governments and relevantdepartments also needs to be enhanced.
4.1.4. Policies for regional air pollution control
In order to promote regional air pollution control, MEP together with other relevantdepartments has put forward 22 supporting policies and measures, which include 3aspects like energy restructuring, economic incentives and responsibility. 11 of these22 supporting policies and measures have been issued, and the rest will be put intoeffect before the end of this year.
Among these policies, an environmental electricity tariff, a tariff for bettervehicle-used fuels, and cascading electricity prices for electrolytic aluminum wereformulated by NDRC. MOF issued policies to promote new energy vehicles, and setup special funds for the control of air pollution. MEP issued the guidelines to appraisethe performance of local governments to implement the Action Plan, as well as therequirement on information publication and the guidance on promoting publicparticipation.
However, some aspects have not been covered yet. For example, some policies areneeded to promote elimination of “yellow label” and old vehicles, and to expand thedepth and breadth of information disclosure and public participation.

40
4.2 Policy Recommendations
4.2.1 Targeting Air Pollution Management to Better Air Quality
4.2.1.1 Set air quality compliance as a legally-binding target
An accountability and evaluation system with air quality compliance as the soulshould be explicitly provided for in the Law on the Prevention and Control ofAtmospheric Pollution. Compliance with ambient PM2.5 concentration standardsshould be set as a binding target for all cities.
4.2.1.2 Redefine the zones based on scientific evidence
The key zones for regional air quality control should be redefined taking into accountthe spatial and temporal distribution of air pollution, meteorology and topography, aswell as pollution dispersion and transport. A wider region includingBeijing-Tianjin-Hebei, the Yangtze-River Delta, and provinces between them shouldbe considered as a whole for more effective regional air pollution control.
4.2.2 Developing the Coordination Mechanism for Joint Prevention and Control ofAir Pollution
4.2.2.1 Developing a unified planning toward regional air quality compliance
A regional compliance plan should be formulated for the eastern part of China,clarifying the compliance timetable and roadmap, as well as reasonable and feasiblecontrol schemes for different parts of this region. An integrated approach in terms ofeconomic and energy restructuring, urbanization and mobility, should be consideredaccordingly.
4.2.2.2 Perfecting the unified and coordinated working mechanism for regional airpollution control
Based on the established coordination mechanism and inter-ministerial coordinationmechanism, more formal rules and procedures for coordination and policy makingshould be developed, and in-depth regional coordination on economy and energyissues that impact the regional air quality should be conducted.
4.2.2.3 Establishing regional EIA consultation mechanism
The major planning and the list of projects with significant impact on regional airquality should be asked for regional EIA consultation. The superior environmentalprotection administrative departments should organize the consultation, and theadvice should be collected from those relevant administrative regions whose air

41
quality could possibly be affected by the planning or project.
4.2.2.4 Improving the regional joint enforcement mechanism
The regional enforcement capacity should be enhanced by developing a regionalenvironmental supervision network and exploring cross investigations. Themulti-sector joint enforcement system should be developed involving MEP, MIIT, andother administrations. A joint working system of the environmental administrativeenforcing departments and judicial organs shall be perfected and the force againstenvironmental crime will be intensified.
4.2.2.5 Integrating national science and technology power to offer regional decisionsupport and scientific planning
Taking the full use of the national and provincial science and technology resources,there is a need to establish a regional planning organization, funded by MEP and otherministries, to carry out basic researches on causes, transport and changes of theregional atmospheric pollution. This organization could provide basic information tosupport regional PM2.5 pollution control, including emission inventory, sourceapportionment, emission abatement technologies, and cost-effect analysis. Thisorganization could also develop regional air quality control planning and evaluationsfor central and provincial government.
4.2.2.6 Further deepening information sharing
The scope and content of environmental information sharing should be expanded,including early-warning and emergency response to heavy pollution, consultationmechanism of environmental impact assessment, joint environmental enforcement,and joint pollution control. There is a special demand in promoting the environmentalimpact assessment involved in the regional air quality monitoring, polluting sourceemission, key pollution sources, meteorological data and new projects, as well as keyenvironmental information sharing such as supporting data, achievements ofmanagement technology, management experience and so on.
4.2.3. Improving the Policies for the Regional Air Pollution Control
4.2.3.1 Increasing the policy and financial support for the industrial structureadjustment in the key areas
The directories and standards of industrial restructuring should be strictly created inthe key areas. Their special funds and fiscal transfer payments should be increased toboost the structure adjustment. Meanwhile, the number of the pilot cities substitutingsubsidies with rewards should be increased and more incentives are needed to reducethe outdated capacity and curb new projects in industries with overcapacity.
42
4.2.3.2 Setting economic incentive policies for the technical innovation of enterprises’environmental protection
The related state departments and local governments should explore the economicguiding policy of air pollution control to lead existing enterprises to the technicalinnovation of air pollution control and the sharp reduction in pollutant discharge, withthe help of many approaches such as setting up special funds, issuing bonds, andoffering discount, subsidies, and incentives.
4.2.3.3 Improving economic incentive policies for motor vehicle pollution control
It is proposed that motor vehicle fuel surcharge should be collected timely to lowerthe vehicle operation intensity. An atmospheric pollution control fund could beestablished with the surcharge to support infrastructure construction such as localpublic transportation and the control of air pollution. The policies should be made forthe scrapping of the old motor vehicles, and the financial subsidies strength should beimproved to eliminate yellow label and old vehicles, with the fiscal funds playing aguiding role. The “cash-for-clunkers” policy should be implemented under thecoordination of related departments to promote the elimination of yellow labelvehicles.
This Report was submitted by the Special Policy Study on Performance Evaluation on theAction Plan of Air Pollution Prevention and Control and Regional Coordination Mechanism
Copyright © 2022 FDOKUMEN