Mapping Urban Air Pollution Using GIS: A Regression-Based Approach
Upload
independentCategory
view
0download
0
International Conference SDI 2010 – Skopje; 15-17.09.2010
105
MAPPING AIR POLLUTION IN URBAN TIRANA AREA USING
GIS
Manjola BANJA1, Elvin COMO
2, Bledar MURTAJ
3 , Albana ZOTAJ
4
ABSTRACT
The recent development of spatial data infrastructure in the frame of geographic information
systems (GISs) has created the new era of different applications in the field of environment. The
scope and the scale of urban areas problems make the GIS a powerful tool for management of
spatial and temporal data, complex analyses and visualization. The ability to manage a number of
spatial and temporal data formats, data structures created in the frame of the GISs open the ways
to building air quality information systems that synthesize geospatial and temporal air quality data
to support spatial-temporal analysis and dynamic modeling. Mapping of air pollution within a
GIS environment for 6 selected points at the urban area of Tirana during 2009 was developed.
Surveys for air pollutants as NOx, NO2, O3 and SO2 were conducted using passive sampler
Analyst based on European Directive (EC Directive 96/62 EC ed EC Directive 99/30) that
indicates the passive sampling as an indicative method for preliminary evaluation of air quality.
Two-one month periods over winter and summer period are chosen to expose the passive
samplers. The pollutant concentrations for each period are visualized in the planar view of the
Tirana urban area. GIS was used to compare the two planar views representing the periods of
passive sampling in order to investigate the influence of meteorological conditions. The
visualized result has the potential to provide valuable information for pollution impact analysis,
by including also the dimension of the influenced area and population. The spatial assessment of
air pollution within Tirana urban area can be exploited by environmental and medical authorities
in order to plan their future strategies.
Key word: Air pollution, GIS, passive sampling, Tirana
1. INTRODUCTION
Usually, air pollution monitoring in urban environments is performed by operating a
certain number of monitoring stations located in several sites which are representative
of the general exposure to pollution by population ( Allegrini I., et al, 2002).. In such
situations, pollutant concentrations are measured by means of proper analyzers. Such a
1 PhD. Manjola BANJA, [email protected]
Institute of Energy, Water and Environment, Polytechnic University of Tirana
Tel.: +35542222202
Rr.“Durresit“, 219, Tirana,Albania. 2 MSc. Elvin COMO, [email protected]
Institute of Energy, Water and Environment, Polytechnic University of Tirana
Tel.: +35542222202
Rr.”Durersit”, 219, Tirana, Albania 3 M.Sc. Bledar Myrtaj, [email protected]
Institute of Energy, Water and Environment, Polytechnic University of Tirana
Tel.: +35542222202
Rr.”Durersit”, 219, Tirana, Albania 4 M.Sc. Albana Zoaj, [email protected]
GIS Specialist

International Conference SDI 2010 – Skopje; 15-17.09.2010
106
conventional approach, although found satisfactory in many instances, has a number of
definite limitations: standard monitoring stations require high investment costs,
extensive maintenance and training and highly specialized personnel, data gathered by
automatic analyzers are not suitable for a rapid interpretation and, unless used to
compare the values with pre-defined limits or air quality standards, they are not always
useful. Another method to assess pollutant concentration is based on the use of diffusive
devices which is an ideal tool to determine the pollutant distribution over a large area
and to assess integrated concentration levels, over long period of time. The different
techniques are used in the monitoring process in order to determine the individual
factors of pollution and stress of the urban environment, to estimate short term and long
term changes and to develop models that can simulate a real environmental situation to
aid the decision making process. Considering the nature of collected measurements, the
research requires a spatio-temporal data management. The increase in computing power
and graphics is facilitating the advance of geographic information systems-GIS, which
can effectively satisfy these tasks. Capabilities of the GIS include mainly management
of spatial data in the form of map layers, which can visualize real objects by vector and
raster data formats together with graphs and multimedia presentations. Data analysis in
the frame of the GIS represents one of the next steps. A number of definitions describe
capabilities of the GIS to solve a wide range of environmental problems, which are
related to urban areas. Burrough (1998) defines the GIS as a powerful set of tools for
collecting, storing, retrieving at will, transforming and displaying spatial data from the
real world for a particular set of purposes. The GIS contains a huge range of spatial
analyses and temporal comparisons, which allow carrying out and display of output data
in the GIS’s layers. Air pollution maps are potentially powerful tools particularly for
urban areas for use in epidemiological studies. They can help to identify the “hot-spots”
in need of special investigation or monitoring. In Tirana urban area according to 2007
traffic data, average traffic counts have increased 13.1% over the previous year and
have been climbing at about that same rate for the past 7 years. The combined increase
in road traffic and lack of significant improvement in road infrastructure has caused
chronic congestion on all principle roads and dangerously high levels of pollution.
Vehicle emissions are responsible for the majority of CO, hydrocarbons, NOx, SO2 and
inhaled particulate matter present in the atmosphere of the city (Kim J.J., et al, 2001).
Due to increasing attention devoted to the direct health risks associated with air
pollution from local traffic sources, two-one month passive monitoring field campaign
were conducted during year 2009. Mapping of air pollutants as NOx, O3 and SO2 is
visualized in the planar view of Tirana urban area using GIS. The planar visualization is
displayed to improve its interpretability and to point the hot spots where the highest
pollution occurs which can be easily detected by representing pollution level using an
appropriate color ramp. The spatial and temporal of air pollution in Tirana urban area is
investigated based on ambient air quality levels in summer and winter. At the same time
the influence of meteorological conditions is analyzed.
1. METHODOLOGY
The assessment of atmospheric pollution in urban area is a very important step for the
definition of locations where to deploy the monitoring stations. Such locations are
selected according to several information, which include: type and intensity of emitting
sources; distribution of polluting sources in the urban area; expected maximum

International Conference SDI 2010 – Skopje; 15-17.09.2010
107
concentration points in relationship to the presence of human targets (population
exposition); prevailing meteorological conditions; model applications; geographical
context; other proper studies (Allegrini I, et al, 2002).. The monitoring sites have to be
representative of a sufficiently large area in the vicinity, so that the sampling station can
be considered representative of a larger area or representative of sites characterized by
similar environmental conditions. The methodology of this study is based on grid
selection which is used to identify the measuring points (figure 1) and a number of 6
points is defined. Every point is chosen to represent as well as possible the air pollutants
emission sources of the entire grid to which it belongs. It takes also accounts of traffic
flow and the number of the inhabitants per grid. An area of influence for each sample
was defined considering a circle of 200 m of radius. This choice is partially arbitrary but
it was a result of the attempt to locate the passive samplers on a grid. A receptor grid is
elaborated with a distance between points of 200 m. The data was structured and stored
in the temporal database while Tirana’s digital map at scale 1: 20000 was being
uploaded and topologically structured using ArcView and ArcInfo GIS software. The
location of stations in the maps was determined. Attribute data were assigned to spatial
objects and the system become ready for spatio-temporal analysis and management.
After the experimental campaigns, the results of this technique are complemented by
proper studies, which take into account for the location of emitting sources, the
distribution of exposed population and the prevailing meteorological conditions.
Figure 1. Tirana urban area and the passive monitoring points

International Conference SDI 2010 – Skopje; 15-17.09.2010
108
2.1 Site description
Tirana city is located at the central part of Albania and is the capital of the country. The
greater urban area occupies ~31 km2 and extends approximately 25 km far away from
Adriatic Sea. At a distance of approximately 7 km of the eastern part are the foothills of
Dajti Mountain, (1612 m maximum height). The western part is surrounded by small
hills, whose height is ~400 m. Topography, is not intense to the northwestern part of the
city, so air from the sea could reach the urban area via this physical channel, when sea
breeze circulation is developed. In the urban area of Tirana live ~700,000 inhabitants
(INSTAT, 2005), but most likely the population is increase thenceforth. The area is
dominated by a Mediterranean climate with dry and hot summer. The main wind
direction during summer is NW and during winter is SE. The wind velocity is lower
during almost all year (figure 2).
1.5 2 2.5 3 3.5 4 4.5
1
1.5
2
2.5
3
3.5
4
1 1.5 2 2.5 3 3.5 4 4.5 5 5.5
1
1.5
2
2.5
3
3.5
4
Figure 2. Wind direction and wind velocity in Tirana area
International Conference SDI 2010 – Skopje; 15-17.09.2010
109
2.2 Passive sampling
Measurements with passive samplers turned out to be an appropriate method when one
wants to get a spatial distribution of air pollution (Brown R. H., 1993).. With passive
samplers, it is possible to measure NO2, NOx, SO2, O3 and some other pollutants as
well. The key principle for passive samplers is the Fick’s diffusion law and the transport
of pollutant molecule from entrance of the sampler to its end, where membrane with
absorbent is located. Among several kinds of passive samplers that have been
developed, Analyst® samplers are chosen for this purpose. The Analyst®, was
developed, patented and certified by CNR (Rome, Italy), by the Institute for
Atmospheric Pollution (Primary Reference Laboratory for Atmospheric Pollution), as
equivalent method for the determination of the concentration in ambient air of sulphur
dioxide, nitrogen oxides, and benzene in accordance with Italian legislation. The
Analyst® (Manes F. et al, 2003) has been tested over a relatively long periods of time
and their performances are documented in a large number of scientific publications.
Since the technique is very inexpensive, a large number of passive samplers may be
deployed in the urban environment (Seinfeld J.H., et al, 2006) in order to gain detailed
information about spatial distribution of pollution and about the occurrence of sites
where the exposition of population is at high levels. The ambient concentration of NO2,
NOx, and SO2 is known to follow a seasonal cycle (Lin Y.T.,et al,2001) with peak
values in winter and lower concentrations during summer period while O3 seasonal
cycle present higher values during summer period and lower values during winter. For
this reason the first one-month sampling campaign was conducted during 13 March – 16
April 2009 when elevated values of NO2, NOx and SO2 are expected and the second
sampling campaign was conducted during period 03 July – 04 August 2009 when
elevated values of O3 are expected. During our campaigns, samplers were exposed
together with shelters. We fixed shelters with samplers on different objects. We chose
mainly traffic lights, street lights, trees or something similar. Samplers were set 2,5-3,5
m above the ground and depending by the site type 0,5-300 m away from road-side.
Samplers exposed for one-month, after installation were collected in the same order
they were deployed. The Analyst® samplers were sent to the Italian institute in order to
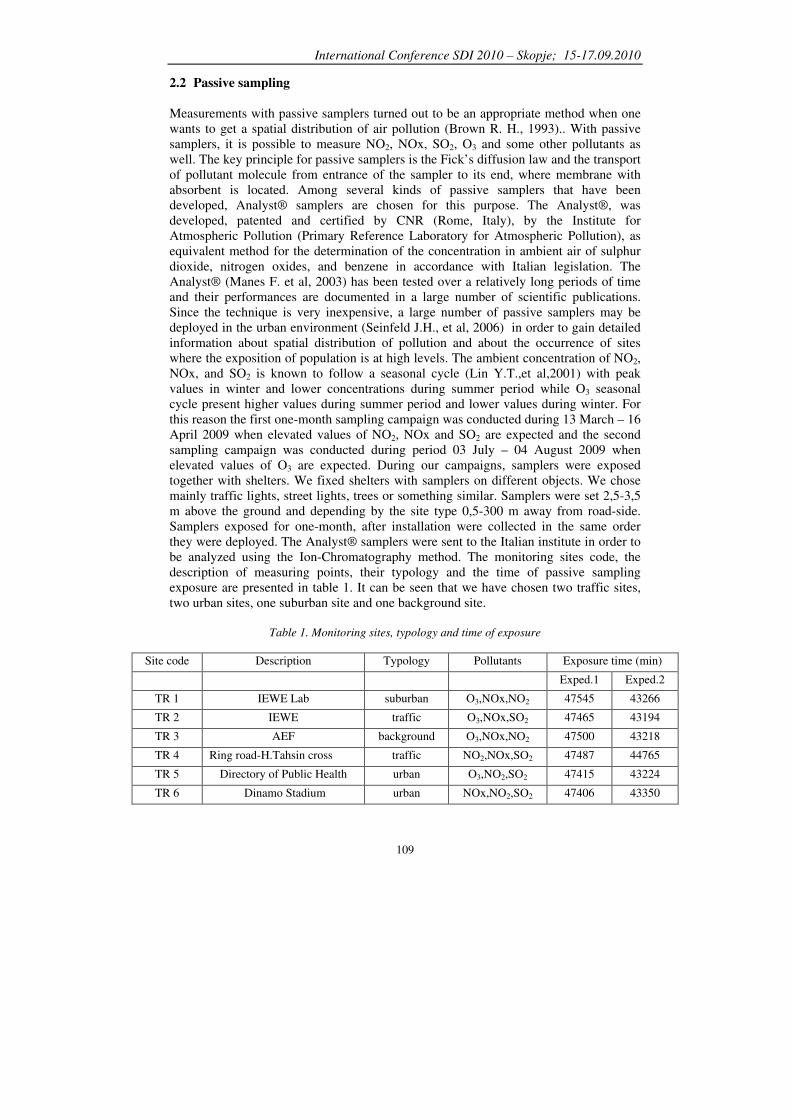
be analyzed using the Ion-Chromatography method. The monitoring sites code, the
description of measuring points, their typology and the time of passive sampling
exposure are presented in table 1. It can be seen that we have chosen two traffic sites,
two urban sites, one suburban site and one background site.
Table 1. Monitoring sites, typology and time of exposure
Site code Description Typology Pollutants Exposure time (min)
Exped.1 Exped.2
TR 1 IEWE Lab suburban O3,NOx,NO2 47545 43266
TR 2 IEWE traffic O3,NOx,SO2 47465 43194
TR 3 AEF background O3,NOx,NO2 47500 43218
TR 4 Ring road-H.Tahsin cross traffic NO2,NOx,SO2 47487 44765
TR 5 Directory of Public Health urban O3,NO2,SO2 47415 43224
TR 6 Dinamo Stadium urban NOx,NO2,SO2 47406 43350

International Conference SDI 2010 – Skopje; 15-17.09.2010
110
3. RESULTS AND DISCUSSIONS
The analysis reveals that Tirana urban area is characterized by more than one hot-spot
related to pollutants as nitrogen oxides and ozone. For this reason the analysis is
focused on these pollutants and a comparison between two expeditions is conducted in
order to investigate the influence of meteorological conditions. The figures 3 & 4
present the comparison between two passive sampling periods for the nitrogen dioxide.
It can be seen that site Tr2 presents levels of nitrogen oxides during both expeditions
approximately 3 times higher than the annual limit value equals to 40 µg/m3 of the
National Standard of Air Quality (NSAQ). This site situated at the eastern part of the
city center and directly at the cross-road with elevated traffic is capable to represent the
peak values of nitrogen oxides and sulphur dioxide concentrations. Due to the fact that
the content of the sulphur in fuels is low the sulphur concentration doesn’t overcome the
limit value of the NSAQ. It can be seen that the nitrogen dioxide concentrations are
more elevated during the cold period which is related to the influence of the
meteorological conditions that tends to trap the pollutants at the layers near the surface.
During summer period, due to the mixing of the atmosphere layers related to the
elevated temperature and high solar radiation, the nitrogen oxides and sulphur dioxide
concentrations are lower.
Figure 3. NO2 concentration in Tirana urban area, expedition I

International Conference SDI 2010 – Skopje; 15-17.09.2010
111
Figure 4. NO2 concentration in Tirana urban area, expedition II
In figures 5 & 6 is presented the comparison between two passive sampling periods for
ozone. It can be seen that the ozone concentrations at sites Tr1, Tr3 and Tr5 are higher
than at the other sites. Site Tr1 present levels of ozone which are higher than the limit
value of 65 µg/m3 of the NSAQ. This site is situated to the western part of the city
center and the main source of pollution is the construction activity. Since the site is
situated at the city suburbs it is capable to represent adequately the peak values of ozone
concentration. The ozone concentrations measured are more elevated during summer
period when the photochemical reactions are present due to the effect of high solar
radiation and air temperatures.

International Conference SDI 2010 – Skopje; 15-17.09.2010
112
Figure 5. O3 concentration in Tirana urban area, expedition I
Figure 6. O3 concetration in Tirana urban area, expedition II

International Conference SDI 2010 – Skopje; 15-17.09.2010
113
4. CONCLUSIONS
GIS is one of the important technologies which help us to monitor, analyze and decide
on the air pollution quality in the urban area. The Tirana urban area is characterized by
more than one hot-spot site mainly influenced by the road emissions. The highest
nitrogen oxides values were found near streets with high traffic volume. The ambient air
quality situation for ozone is strongly influenced by the meteorological conditions.
Obtained data from passive monitoring process show that the pollution levels in Tirana
urban area are going higher. This problem leads us through creating a statistically valid
surface which subsequently is used in GIS for optimum decision making based on the
air quality factors which can be collected as maps and ground stations data.
Geostatistical methods are urgently needed for the amount of pollution in everywhere.
The spatial assessment of air pollution within Tirana urban area can be exploited by
environmental and medical authorities in order to plan their future strategies.
5. REFERENCES
Lorentz, T., Friebertshaeuser, J., Lohmeyer, A., 2003. GIS based urban scale air pollution
modeling within a German-Bulgarian twinning project. Contr. to 17th Intl. Conf. Informatics for
Environmental Protection, Cottbus
Pummakarnchanaa,O., Tripathia, N., Duttab, J., 2005. Air pollution monitoring and GIS
modeling: a new use of nanotechnology based solid state gas sensors. Science and Technology of
Advanced Materials 6.
Kim J.J., Smorodinsky S., Lipsett M., Singer B.C.,Hodgson A.T., Ostro B., 2004, “Traffic-related
Air Pollution near Busy Roads”, Am J Respir Crit Care Med Vol 170
Brown R. H., 1993. The use of diffusive samplers for monitoring of ambient air.Pure&Appl.
Chern., Vol. 65, No. 8
Agrawal1 I.C., Gupta R.D., Gupta V.K., 2003. GIS as modelling and decision support tool for air
quality management: a conceptual framework. Map India Conference
Lin Y.T., Young H.L., Wang S.Ch., 2001. Spatial variations of ground level ozone concentrations
in areas of different scales”, Atmospheric Environment 35
Institute of Statistics of Albania ( INSTAT), ( 2005)., “ Albania in figures 2005”
Matejicek L., Spatial Modelling of Air Pollution in Urban Areas with GIS: A Case Study on
Integrated Database Development. Project GACR 205020898,
Seinfeld J.H., Pandis S.N., 2006. Atmospheric chemistry and physics. John Wiley & Sons, INC.
Second edition
Briggs, D.J., 2007. The use of GIS to evaluate the traffic related pollution. Occup Environ Med
64
Shad, R., Ashoori, H., Afshari, N., 2008. Evaluation of optimum methods for predicting pollution
concentration in GIS environment. International Archives in the Photogrammetry, Remote
sensing and Spatial Information Sciences.
Burrough, PA; and RA McDonnell. 1998. Principles of Geographic Information Systems. Oxford.
EC Directive 96/62 EC & EC Directive 99/30, 1996 & 1999., Official Journal of European
Communities
Allegrini I., Costabile F., 2002, “ A new approach for monitoring atmospheric pollution in urban
environment”, Global Conference “ Building a Sustainable World”, San-Paolo, Brasil
Manes F., De Santis F., Giannini M.A., Vazzana C., Capogna F., Allegrini I., 2003, “ Integrated
ambient ozone evaluation by passive samplers and clover biomonitoring mini-stations”, The
Science of the Total Environment, Vol 308, issues 1-3, pp. 133-141.

International Conference SDI 2010 – Skopje; 15-17.09.2010
114
6. BIOGRAPHICAL NOTES OF THE AUTHORS
PhD. Manjola BANJA is currently a scientific researcher at Institute of
Energy, Water and Environment, Polytechnic University of Tirana. She
develops her scientific activity as part of the Department of Climate and
Environment. During period 2003- 2008 she has been Deputy Director of
Hydrometeorological Institute, Academy of Sciences of Albania. The main
field of her activity is study and monitoring of environment (air and water).
She has participated in different studies and projects dealing with
environment monitoring in the role of coordinator and expert.
M.Sc. Elvin COMO is currently a scientific researcher at Institute of
Energy, Water and Environment, Polytechnic University of Tirana. He
develops his scientific activity as part of the Department of Climate and
Environment. The main field of his activity is study and monitoring of
environment (air and water). He has participated in different studies and
projects dealing with environment monitoring.
M.Sc. Bledar MYRTAJ is currently a scientific researcher at Institute of Energy, Water and
Environment, Polytechnic University of Tirana. He develops his scientific activity as part of the
Department of Climate and Environment. The main field of his activity is study and monitoring of
environment (air and water). He has participated in different studies and projects dealing with
environment monitoring.
M.Sc. Albana ZOTAJ is a GIS and remote sensing specialist. She has worked as a researcher at
the Geographic Center of the Academy of Sciences till 2008. For the last 4 years she has held the
position of Head of GIS & Remote Sensing Department at the Geographic Center. Her main
responsibilities were to find foreign and domestic partners through different kinds of projects and
the management of them. During her career she has participated in a number of projects as
consultant. Through these activities, she gained extensive knowledge and experience in the fields
of GIS and mapping and she is well acquainted with the availability and quality of the existing
map material in Albania as well as the existing GIS environment
Copyright © 2022 FDOKUMEN