Air Pollution: - ICP Vegetation
76
Editors: Harry Harmens and Gina Mills ICP Vegetation Programme Coordination Centre, March 2014 Deposition to and impacts on vegetation in (South-)East Europe, Caucasus, Central Asia (EECCA/SEE) and South-East Asia Air Pollution: Air Pollution:
-
Upload
khangminh22 -
Category
Documents
-
view
4 -
download
0
Transcript of Air Pollution: - ICP Vegetation

Editors: Harry Harmens and Gina MillsICP Vegetation Programme CoordinationCentre, March 2014
Deposition to and impacts on vegetation in
(South-)East Europe,Caucasus, Central Asia
(EECCA/SEE) and South-East Asia
Air Pollution:Air Pollution:


Air Pollution: Deposition to and
impacts on vegetation in (South-)East
Europe, Caucasus, Central Asia
(EECCA/SEE) and South-East Asia
Report prepared by the ICP Vegetation1
March, 2014
Harry Harmens and Gina Mills (Editors)
ICP Vegetation Programme Coordination Centre,
Centre for Ecology and Hydrology,
Environment Centre Wales,
Deiniol Road, Bangor, Gwynedd, LL57 2UW, UK
Tel: + 44 (0) 1248 374500, Fax: + 44 (0) 1248 362133, Email: [email protected]
http://icpvegetation.ceh.ac.uk
1 International Cooperative Programme on Effects of Air Pollution on Natural Vegetation and Crops.

2
Acknowledgements
We wish to thank the UK Department for Environment, Food and Rural Affairs (Defra) for the
continued financial support of the ICP Vegetation (Contract AQ0816). The United Nations Economic
Commission for Europe (UNECE) and the UK Natural Environment Research Council (NERC) are
also thanked for contributions to the funding of the ICP Vegetation Programme Coordination Centre.
We wish to thank all the contributors to this report (listed below), ICP Vegetation participants that
submitted country reports (see Annex 1) and ICP Vegetation participants who have provided data in
the past that have been used in this report.
Contributors to this report
Harry Harmens
Gina Mills
Katrina Sharps
Centre for Ecology and Hydrology,
Bangor
United Kingdom
Lisa Emberson
Patrick Büker
Joanne Morris
Stockholm Environment Institute –
York, University of York
United Kingdom
Max Posch
Jaap Slootweg
Jean-Paul Hettelingh
Coordination Centre for Effects,
RIVM, Bilthoven
The Netherlands
Ilia Ilyin EMEP/MSC-East Russian Federation
Michael Gauss Anna Benedictow
EMEP/MSC-West Norway
This report should be quoted as: Harmens, H. and Mills, G. (Eds.) (2014). Air Pollution: Deposition
to and impacts on vegetation in (South-)East Europe, Caucasus, Central Asia (EECCA/SEE) and
South-East Asia. ICP Vegetation Programme Coordination Centre, Centre for Ecology and Hydrology,
Bangor, UK.
Cover photos were supplied by Patrick Büker, Martin Forsius, Felicity Hayes, Ilia Ilyin (map), Katrina Sharps
(map), Norbert Schnyder, Dimitris Velissariou and Shutterstock (UK),
__________________________________________________________________________________________
This report is the Copyright of Defra and has been prepared by CEH under contract to Defra (AQ0816). The
contents of this report may not be reproduced in whole or in part, nor passed to any organisation or person
without the specific prior written permission of Defra. CEH accepts no liability whatsoever to any third party for
any loss or damage arising from any interpretation or use of the information contained in this report, or reliance
on any views expressed therein. The NERC and CEH trademarks and logos (‘the Trademarks’) are registered
trademarks of NERC in the UK and other countries, and may not be used without the prior written consent of the
Trademark owner.

3
Executive summary
Increased ratification of the Protocols of the Convention on Long-range Transboundary Air Pollution
(LRTAP) was identified as a high priority in the new long-term strategy of the Convention. Increased
ratification and full implementation of air pollution abatement policies is particularly desirable for
countries of Eastern Europe, the Caucasus and Central Asia (EECCA) and South-Eastern Europe
(SEE). Hence, scientific activities within the Convention will need to involve these countries. In the
current report, the ICP Vegetation has reviewed current knowledge on the deposition of air pollutants
to and their impacts on vegetation in EECCA (Armenia, Azerbaijan, Belarus, Georgia, Kazakhstan,
Kyrgyzstan, Moldova, Russian Federation, Tajikistan, Turkmenistan, Ukraine and Uzbekistan) and
SEE countries (Albania, Bosnia and Herzegovina, Bulgaria, Croatia, Cyprus, Greece, Macedonia,
Montenegro, Romania, Serbia, Slovenia and Turkey). As an outreach activity to Asia we have also
reviewed current knowledge on this subject for the Malé Declaration countries in South-East Asia
(SEA; Bangladesh, Bhutan, India, Iran, Maldives, Nepal, Pakistan and Sri Lanka). Air pollution is a
main concern in Asia due to enhanced industrialisation, which is directly linked to continued strong
economic growth in recent decades.
In these regions, there is generally a lack of an extensive network of monitoring stations to assess the
magnitude of air concentrations and depositions of pollutants. In addition, emission inventories are
often incomplete or not reported at all for some pollutants, which makes it difficult to validate
atmospheric transport models for these regions. Furthermore, there is often a lack of coordinated
monitoring networks to assess the impacts of air pollution on vegetation. Hence, the risk of adverse
impacts on vegetation often has to be assessed using atmospheric transport models in conjunction
with metrics developed to compute the risk of air pollution impacts on vegetation, such as critical
loads and levels. Here we have focussed on the following air pollutants: nitrogen, ozone, heavy
metals, POPs (EECCA/SEE countries) and aerosols, including black carbon as a component (South-
East Asia).
Nitrogen Critical load exceedances for nutrient nitrogen are only available for a limited number of EECCA
countries. Compared with Western and Central Europe, available computed critical load exceedances
for nitrogen have historically been lower in SEE and large areas of the EECCA region, particularly the
northern part, and this was also the case in 2010. However, the critical load is expected to still be
exceeded in large areas in 2020 with improvements since 2005 generally being lower than in Western
and Central Europe, particularly in the EECCA region. Nitrogen concentrations in mosses were found
to be intermediate to high in SEE compared to other European countries, indicating potentially a
higher risk of nitrogen effects on ecosystems than computed by the critical loads. Little data is
available on nitrogen deposition and impacts on vegetation in South-East Asia.
Ozone
For the first time, the ICP Vegetation has mapped the risk of adverse impacts of ozone on vegetation
for the extended EMEP domain using the flux-based metric PODY2. The concentration-based
approach (AOT403) identifies the southern part of the EECCA region at highest risk, whereas the
biologically more relevant flux-based approach (PODY) identifies the south-western part of the region
bordering with Central Europe at highest risk. Both approaches indicate that the northern part of the
region is at lowest risk of adverse impacts from ozone pollution. Field-based evidence is available for
ozone impacts on crops in Greece and Slovenia, with many crop species showing visible leaf injury in
Greece. Both AOT40 and PODY are computed to be high in SEE, indicating that this area is at high
risk of ozone damage to vegetation. Staple food crops (maize, rice, soybean and wheat) are sensitive
to moderately sensitive to ozone, threatening global food security. Recent flux-based risk assessment
of ozone-induced wheat yield loss show that the estimated relative yield loss was 6.4-14.9% for China
and 8.2-22.3% for India in 2000, with higher yield losses predicted for 2020, indicating the urgent
2 Phytotoxic ozone dose above a flux threshold of Y nmol m
-2 projected leaf area s
-1 3 The accumulated hourly mean ozone concentration above 40 ppb, during daylight hours

4
need for curbing the rapid increase in surface ozone concentrations in this region. Worryingly, yield
reductions of 20-35% have been recorded for various crop species when comparing yield in clean air
with that in current ambient ozone concentrations in South-East Asia.
Heavy metals Generally, deposition of heavy metals has declined in recent decades in EECCA and SEE countries,
in agreement with the general decline computed for the rest of Europe, with the highest decline being
reported for lead. However, apart from the western part of the EECCA region, the decline has
generally been lower for EECCA and SEE countries compared to the rest of Europe. In 2011, the
highest levels of metal deposition were computed in SEE countries, the south-western part and some
(south-)eastern parts of the EECCA region. This might explain the relatively high concentrations of
many heavy metals in mosses in countries in SEE Europe compared to the rest of Europe in recent
years. High critical load exceedances have been reported for Macedonia for cadmium and lead and
for Bosnia-Herzegovina and Russian Federation for lead. Widespread exceedance of the critical load
for mercury has been observed in this region, similar to the rest of Europe. In India, the deposition of
many heavy metals onto fruit and vegetables has been found to exceed WHO and Indian national
limits for safe consumption.
Persistent organic pollutants (POPs) Model assessment indicate a reduction of POP pollution in most of the EECCA and SEE countries
between 1990 to 2011, particularly for hexachlorobenzene (HCB), although generally lower than for
the rest of Europe; highest reductions were observed in the western part of the region. In 2011, the
highest deposition for benzo[a]pyrene and polychlorinated dibenzodioxin were computed in the south-
western part of the region, whereas HCB levels were high for large parts of the Russian Federation.
Aerosols South Asia is a region with high aerosol load compared to other regions, due its rapid growth and the
arid climate. In particular the Indo-Gangetic Plain, South Asia’s most important agricultural region,
persistently has very high aerosol load, reducing visibility as well as solar radiation reaching the
surface. Reduced photosynthesis might occur as a result of reduced solar radiation and larger
aerosols blocking leaf pores, although the increase in diffuse radiation might have the opposite effect.
Conclusions and recommendations This review highlights the lack of monitoring data regarding the deposition to and impacts of air
pollutants on vegetation in EECCA/SEE countries and South-East Asia. It would be desirable to
further enlarge coordinated networks to measure air concentrations and depositions of air pollutants,
i.e. to extend the EMEP monitoring network in the EECCA/SEE region and establish a similar network
in South-East Asia, for example by extending the Acid Deposition Monitoring Network in East Asia
(EANET) by including other regions and more pollutants. International Cooperative Programmes of
the LRTAP Convention might consider further stimulating the development of coordinated networks in
these regions with the aim to establish widespread monitoring networks assessing the impacts of air
pollutants on ecosystems. More measurement data are urgently needed to validate model outputs
regarding the concentrations, deposition and associated risk for impacts of air pollutants on
vegetation. The successful implementation of air pollution abatement policies in many other parts of
Europe has highlighted the slower progress made with some of the air pollution abatement in the
Eastern Europe, the Caucasus, Central and South-East Asia. Improvement of air quality in these
regions will also benefit the rest of Europe due to a reduction on long-range transport of air pollutants,
particularly those of hemispheric nature such as ozone and mercury. Many air pollution issues are
remaining in the studied areas that require urgent attention, especially in regions of fast economic and
population growth, ensuring future sustainable development without significant impacts on the
functionality of ecosystems, the services they provide and food production.

5
Contents Executive summary ............................................................................................................ 3
1. Introduction ..................................................................................................................... 7
1.1 Background ................................................................................................................. 7
1.2 ICP Vegetation ............................................................................................................ 7
1.3 Aim and structure of the report .................................................................................... 8
2. Air pollution deposition and impacts on vegetation in EECCA and SEE .................... 9
2.1 Introduction .................................................................................................................. 9
2.2 Nitrogen ..................................................................................................................... 10
2.2.1 Background ......................................................................................................... 10
2.2.2 Nitrogen critical load exceedances ...................................................................... 11
2.2.3 Nitrogen concentrations in mosses ..................................................................... 12
2.3 Ozone ........................................................................................................................ 13
2.3.1 Background ......................................................................................................... 13
2.3.2 Field-based evidence of ozone impacts .............................................................. 14
2.3.3 Modelled ozone risk assessment ........................................................................ 15
2.4 Heavy metals ............................................................................................................. 16
2.4.1 Background ......................................................................................................... 16
2.4.2 Modelled heavy metal deposition ........................................................................ 17
2.4.3 Concentrations of heavy metals in mosses ......................................................... 18
2.4.4 Critical load exceedances for heavy metals ......................................................... 21
2.5 Persistent organic pollutants (POPs) ......................................................................... 23
2.5.1 Background ......................................................................................................... 23
2.5.2 Modelled deposition of POPs .............................................................................. 23
2.5.3 POPs concentrations in mosses .......................................................................... 24
3. Concentrations and effects of air pollutants on vegetation in
South-East Asia ............................................................................................................ 25
3.1 Background ............................................................................................................... 25
3.2 Emission sources ...................................................................................................... 25
3.3 Atmospheric concentration and deposition ................................................................ 26
3.3.1 Ozone ................................................................................................................. 26
3.3.2 Nitrogen .............................................................................................................. 29
3.3.3 Atmospheric aerosols .......................................................................................... 30
3.3.4 Heavy metals ...................................................................................................... 31

6
3.4 Effects on vegetation ................................................................................................. 33
3.4.1 Ozone impacts .................................................................................................... 33
3.4.2 Heavy metal impacts ........................................................................................... 34
3.4.3 Nitrogen and sulphur impacts .............................................................................. 35
3.4.4 Aerosol impacts .................................................................................................. 35
4. Conclusions and recommendations ............................................................................ 45
4.1 Conclusions .......................................................................................................... 45
4.1.1 Eastern Europe, Caucasus and Central Asia (EECCA) ....................................... 45
4.1.2 South-East Europe (SEE) ................................................................................... 45
4.1.3 South-East Asia (SEA; Malé Declaration countries) ............................................ 46
4.2 Recommendations ..................................................................................................... 46
References ........................................................................................................................ 47
Annex 1: Country reports ................................................................................................. 51
Albania ................................................................................................................ 52
Croatia ................................................................................................................ 54
Egypt* ................................................................................................................. 56
Greece ................................................................................................................ 59
Macedonia........................................................................................................... 61
Romania .............................................................................................................. 63
Russian Federation ............................................................................................. 65
Serbia .................................................................................................................. 68
Slovenia .............................................................................................................. 70
* As outreach to North Africa

7
1. Introduction
Harry Harmens, Gina Mills
1.1 Background
Since being established in 1979, the Convention on Long-range Transboundary Air Pollution (LRTAP)
has delivered demonstrable improvements in air quality resulting in, for example, reduced acidification
of the environment, reductions in the highest peak levels of ozone and photochemical smog, and
reductions in atmospheric heavy metal concentration and deposition. The LRTAP Convention has
also begun to make improvements in atmospheric levels and deposition of nitrogen. Despite such
good progress, air pollution in the UNECE region still causes significant environmental and health
problems and new problems are emerging. Major strenghts and successes of the Convention are:
Science-based policy decision making and the effects-oriented approach;
Its geographical coverage of most of the northern hemisphere;
The multi-pollutant/multi-effects approach of the Gothenburg Protocol on acidification,
eutrophication (primarily nitrogen enrichment) and ground-level ozone, established in 1999;
Establishment of the Protocols on Persistent Organic Pollutants (POPs) and on Heavy Metals in
1998, leading the way for a wider global approach to these problems, i.e. development of the
Stockholm Convention on POPs and Minamata Convention on Mercury.
In 2010, the Convention adopted its long-term strategy for the next 10 years (EB Decision 2010/18).
The strategy identified remaining challenges facing the UNECE region and emphasised that the focus
of the work of the Convention should be on ozone, nitrogen and particulate matter, the latter primarily
in relation to adverse impacts on human health. The Convention will pursue initiatives in addressing
the synergies and trade-offs between policies to address air pollution, climate change and
biodiversity. For example, there is a growing interest in the so-called short-lived climate forcers
(SLCFs) as a potential means of mitigating short-term climate change before the effects of the longer-
lived greenhouse gases are seen. SLCFs such as black carbon (a component of particulate matter)
and ozone are being addressed in the revision of the Gothenburg Protocol, adopted in 2012.
Increased ratification of the Protocol on Heavy Metals, the Protocol on POPs and the Gothenburg
Protocol was identified as a high priority in the new long-term strategy of the Convention. A viable
future for the Convention depends on positive and vigorous participation by the Parties in all parts of
the region, and on ensuring its extensive geographical coverage. Increased ratification and full
implementation of air pollution abatement policies is particularly desirable for countries of Eastern
Europe, the Caucasus and Central Asia (EECCA) and South-Eastern Europe (SEE). Hence, scientific
activities within the Convention will need to involve these countries. In the current report, the ICP
Vegetation has reviewed the knowledge on the deposition of air pollutants and their impacts on
vegetation in EECCA (Armenia, Azerbaijan, Belarus, Georgia, Kazakhstan, Kyrgyzstan, Moldova,
Russian Federation, Tajikistan, Turkmenistan, Ukraine and Uzbekistan) and SEE countries (Albania,
Bosnia and Herzegovina, Bulgaria, Croatia, Cyprus, Greece, Macedonia, Montenegro, Romania,
Serbia, Slovenia and Turkey). As an outreach activity to Asia we have also reviewed the current
knowledge on this subject for the Malé Declaration countries in South-East Asia (Bangladesh, Bhutan,
India, Iran, Maldives, Nepal, Pakistan and Sri Lanka).
1.2 ICP Vegetation
The International Cooperative Programme on Effects of Air Pollution on Natural Vegetation and Crops
(ICP Vegetation) was established in 1987, initially with the aim to assess the impacts of air pollutants
on crops, but in later years also on (semi-)natural vegetation. The ICP Vegetation is led by the UK
and has its Programme Coordination Centre at the Centre for Ecology and Hydrology (CEH) in
Bangor. The ICP Vegetation is one of seven ICPs and Task Forces that report to the Working Group
on Effects (WGE) of the Convention on Long-range Transboundary Air Pollution (LRTAP Convention)
on the effects of atmospheric pollutants on different components of the environment (e.g. forests,

8
fresh waters, materials) and health in Europe and North-America. The ICP Vegetation comprises an
enthusiastic group of scientists from more than 40 countries (Harmens et al., 2013b), including
scientists from outside the UNECE region as the ICP Vegetation stimulates outreach activities to
other regions in the world. Table 1.1 provides an overview of EECCA, SEE and Asian countries
currently participating in the ICP Vegetation.
Table 1.1 EECCA, SEEa and Asian countries participating in the ICP Vegetation. Within brackets:
pollutant(s) studied in the country.
a Kosovo (United Nations administered territory, Security Council resolution 1244 (1999)) also participates (HM).
HM = moss survey on heavy metals; N = moss survey on nitrogen; O3 = ozone; POPs = moss survey on POPs.
Historically, the ICP Vegetation has focussed on the impacts of ozone pollution on vegetation. In
recent years, the ICP Vegetation has reported on the widespread occurrence of ozone damage to
vegetation (Hayes et al., 2007; Mills et al., 2011a), the threat of ozone pollution to food security (Mills
and Harmens, 2011), impacts of ozone on the carbon sequestration in the living biomass of trees
(Harmens and Mills, 2012), and impacts of ozone on ecosystem services and biodiversity (Mills et al.,
2013). Furthermore, the ICP Vegetation has been instrumental in developing the methodology for
establishing ozone critical levels for vegetation (Mills et al., 2011b; LRTAP Convention, 2011). The
ICP Vegetation is also studying the interactive impacts of ozone and nitrogen on vegetation and the
impacts of ozone on vegetation in a future climate (Vandermeiren et al., 2009). Participation from
EECCA and SEE countries in the ozone work of the ICP Vegetation is very limited (Table 1.1).
Since 2000/1, the ICP Vegetation has conducted the European moss survey on heavy metals. It
involves the collection of naturally-occurring mosses and determination of their heavy metal
concentration at five-year intervals. European surveys have taken place every five years since 1990,
and the latest survey was conducted in 2010/11. Mosses were collected at thousands of sites across
Europe and their heavy metal (since 1990; Harmens et al., 2010, 2013c), nitrogen (since 2005;
Harmens et al., 2011, 2013c) and POPs concentration (pilot study in 2010; see Harmens et al.,
2013b) were determined. Participation from a limited number of EECCA countries mainly concerns
the European moss survey on heavy metals, whereas participation in the moss survey in SEE
countries is more widespread and also included nitrogen in a limited number of countries (Table 1.1).
1.3 Aim and structure of the report
In this report we review the current knowledge on the deposition of air pollutants to and their impacts
on vegetation in EECCA and SEE countries (Chapter 2) and South-East Asia (Chapter 3). Knowledge
is presented for the pollutants nitrogen, ozone, heavy metals, POPs and aerosols including black
carbon (South-East Asia only). Conclusions and recommendations are presented in Chapter 4. Some
countries have provided a country report and these are included in Annex 1; the annex also contains
a country report submitted by Egypt.
EECCA SEE Asia
Belarus (HM) Albania (HM) China (O3)
Russian Federation (HM) Bulgaria (HM, N) India (HM, O3)
Ukraine (HM, O3) Croatia (HM, N, O3) Japan (O3)
Greece (O3) Pakistan (O3)
Macedonia (HM, N)
Romania (HM)
Serbia (HM)
Slovenia (HM, N, O3, POPs)
Turkey (HM, N)
9
2. Air pollution deposition and impacts on vegetation in EECCA
and SEE
Harry Harmens, Gina Mills, Katrina Sharps, with contributions from Max Posch, Jaap Slootweg, Jean-
Paul Hettelingh, Ilia Ilyin, Michael Gauss, Anna Benedictow
2.1 Introduction
Each year EMEP (European Monitoring and Evaluation Programme; http://www.emep.int) provides
scientific information on transboundary air pollution fluxes inside the EMEP area, relying on
information on emission sources and monitoring results provided by the Parties to the LRTAP
Convention. EMEP consists of three main elements: (1) collection of emission data, (2)
measurements of air and precipitation quality and (3) modelling of atmospheric transport and
deposition of air pollutions. Officially submitted emission data by Parties to the Convention are used
as input to atmospheric chemistry and transport models developed by EMEP. The Meteorological
Synthesizing Centre - West (MSC-W) is responsible for the modelling assessment of sulphur,
nitrogen, photo-oxidant pollutants and atmospheric particles. The modelling development for heavy
metals and POPs is the responsibility of the Meteorological Synthesizing Centre - East (MSC-E). The
performance of the models is evaluated through field-based measurements of air concentrations and
deposition within the EMEP monitoring network.
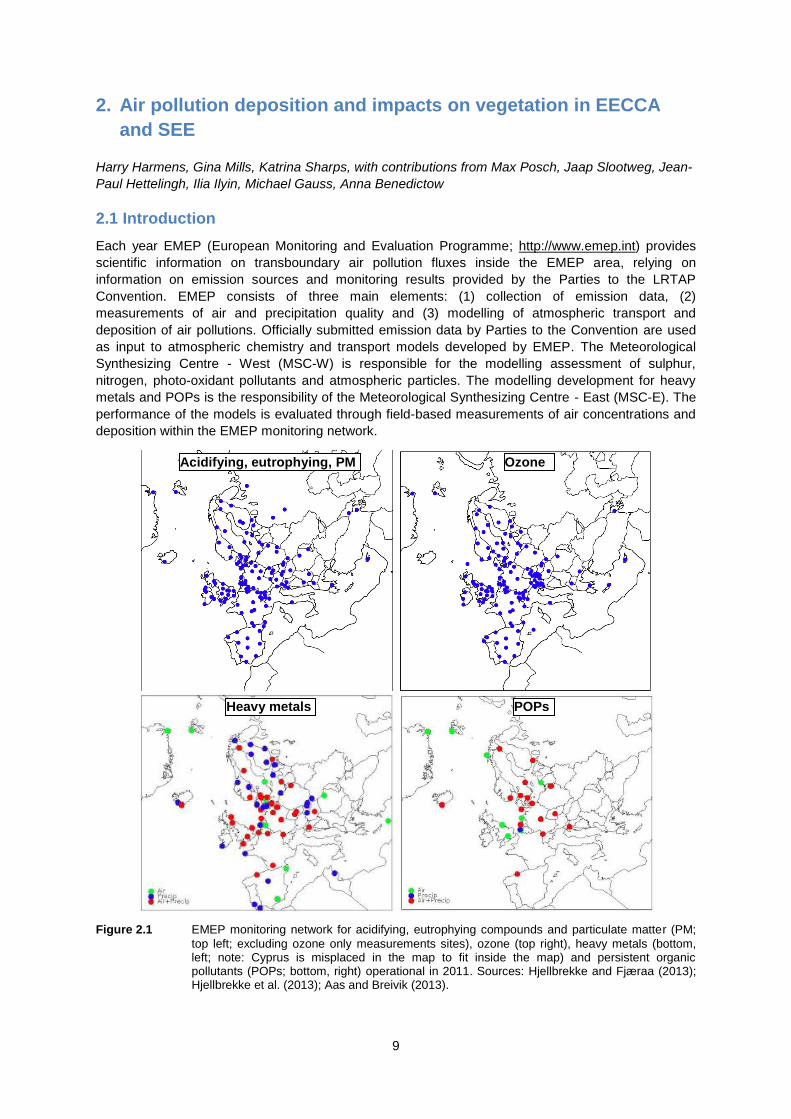
Figure 2.1 EMEP monitoring network for acidifying, eutrophying compounds and particulate matter (PM;
top left; excluding ozone only measurements sites), ozone (top right), heavy metals (bottom, left; note: Cyprus is misplaced in the map to fit inside the map) and persistent organic pollutants (POPs; bottom, right) operational in 2011. Sources: Hjellbrekke and Fjæraa (2013); Hjellbrekke et al. (2013); Aas and Breivik (2013).
Acidifying, eutrophying, PM Ozone
Heavy metals POPs

10
Figure 2.1 and Table 2.1 provide an overview of the EMEP measurement sites in operation in 2011.
Not all sites measure all pollutants and the number of monitoring sites is limited, particularly in
EECCA but also SEE countries compared to the rest of Europe. For heavy metals, 68 sites were
measuring cadmium and/or lead concentrations in air, precipitation or both in 2011, of which only half
were measuring one form mercury (Aas and Breivik, 2013).
Table 2.1 EMEP monitoring sites operational in 2011 in EECCA and SEE countries, the components
measured at each site are indicated.
* Acidifying (A), eutrophying (E) compounds and particulate matter (PM); X
Hg: also measuring mercury (Hg).
The Working Group on Effects (http://www.unece.org/env/lrtap/workinggroups/wge/welcome.html)
provides scientific support to the LRTAP Convention by developing dose-response relationships for
effects of air pollutants on ecosystems, human health and materials. Based on these relationships,
critical loads and levels are calculated to protect the environment and human health from adverse
impacts of air pollutants (LRTAP Convention, 2011). A critical load or level is defined as a quantitative
estimate of an exposure to one or more pollutants below which significant harmful effects on specified
sensitive elements of the environment do not occur according to present knowledge (Nilsson and
Grennfelt, 1988). The main objective of EMEP and WGE is to provide governments and subsidiary
bodies under the LRTAP Convention with scientific information to support the development and
further evaluation of the international protocols on emission reductions negotiated within the
Convention. In the following sections we will describe the deposition of air pollutants to and impacts
on terrestrial ecosystems for nitrogen (N), ozone (O3), heavy metals and POPs.
2.2 Nitrogen
2.2.1 Background
Nearly 80% of the earth’s atmosphere is made up of di-nitrogen (N2). Whereas N2 is unreactive and
cannot be assimilated by most organisms, many reactive nitrogen (Nr) forms are essential for life, but
are naturally in short supply. These include ammonia, nitrates, amino acids, proteins and many other
forms (Sutton et al., 2011). At the start of the twentieth century, several industrial processes were
developed to fix N2 into Nr. Since the 1950s, the production of Nr has greatly increased to meet the
demand for fertilizer to feed the world’s growing population as well as industrial and other needs for
Nr. Emission sources of reduced forms of N are primarily related to agricultural activities such as
animal husbandry (manure) and the application and production of fertilizers. The main anthropogenic
sources for oxidised forms of N are combustion processes in transport, industry and energy
Country Station Latitude Longitude A&E compounds & PM* Ozone Heavy metals POPs
EECCA
Armenia Amberd 40 23 4 N 44 15 38 E X X
Belarus Vysokoe 52 20 0 N 23 26 0 E X
Georgia Abastumani 41 45 18 N 42 49 31 E X
Moldova Leova II 46 29 18 N 28 17 0 E X
Russian Federation Janiskoski 68 56 0 N 28 51 0 E X
Russian Federation Pinega 64 42 0 N 43 24 0 E X
Russian Federation Danki 54 54 0 N 37 48 0 E X
Russian Federation Lesnoy 56 31 48 N 32 56 24 E X
SEE country
Bulgaria Rojen peak 41 41 45 N 24 44 19 E X
Croatia Puntijarka 45 54 0 N 15 58 0 E X
Croatia Zavizan 44 49 0 N 14 59 0 E X
Cyprus Ayia Marina 35 2 20 N 33 3 29 E X X XHgX
Greece Aliartos 38 22 0 N 23 5 0 E X
Greece Finokalia 35 19 0 N 25 40 0 E X
Macedonia Lazaropole 41 19 12 N 20 25 12 E X X
Montenegro Zabljak 43 9 0 N 19 8 0 E X
Romania Poiana Stampei 47 19 29 N 25 8 4 E X X X
Serbia Kamenicki vis 43 24 0 N 21 57 0 E X X
Slovenia Iskrba 45 34 0 N 14 52 0 E X X XHgX
Slovenia Zarodnje 46 25 43 N 15 0 12 E X
Slovenia Krvavec 46 17 58 N 14 32 19 E X X
Slovenia Kovk 46 7 43 N 15 6 50 E X

11
production (up to 70% of oxidised N emissions). Oxidised N forms also contribute to the formation of
ozone (O3). However, Nr is a key societal threat to the environment, with adverse effects on water
quality, air quality, greenhouse balance, ecosystems and biodiversity, and soil quality. Cost-benefit
analysis highlights how the overall environmental costs of all Nr losses in Europe (70 – 320 billion
Euros per year) outweigh the direct economic benefits of Nr in agriculture (Sutton et al., 2011).
2.2.2 Nitrogen critical load exceedances
Nr has been identified as one of the major drivers of biodiversity loss in Europe, in particular for
vegetation diversity. Impacts on vegetation diversity are through direct foliar damage, eutrophication
(N enrichment), acidification, and susceptibility to secondary stress (Dise et al., 2011). Evidence is
strong that plant communities respond to the accumulated pool of plant-available N in the soil,
therefore, the cumulative load of N to ecosystems is probably highly important. European emission
controls for sulphur and N are based on the critical loads concept, an effects-based approach
(Spranger et al., 2008; Bobbink and Hettelingh, 2011; LRTAP Convention, 2004; Reinds et al., 2008).
Figure 2.2 Areas in Eastern Europe where critical loads for eutrophication are exceeded by nutrient
nitrogen deposition in 1990 (left) and 2010 (right). Note: The 1990 map is on the EMEP 50 km × 50 km
grid whereas the 2010 map is on the 0.5 × 0.25 degree longitude – latitude grid using
the latest EMEP model output; the critical loads are from the 2011/12 data base. Source: Coordination Centre for Effects, RIVM, Bilthoven, The Netherlands.
Although implementation of air pollution abatement policies developed under the LRTAP Convention
have resulted in a decline of the exceedance of N critical loads across Europe since 1980, terrestrial
N enrichment continues to be a serious threat to European ecosystems (Hettelingh et al., 2012;
Working Group on Effects, 2013a). Areas most at risk in recent decades were those in Western and
Central Europe, and those predicted to be most at risk in 2020 are parts of the Netherlands and West-
France (Hettelingh et al., 2012). Figure 2.2 shows the areas at risk of eutrophication in 1990 and
2010 for EECCA and SEE countries for which data were available. The magnitude of exceedance has
clearly declined in the last two decades, with areas at highest risk in 1990 being areas in the central
part of the region and those nearest to Central Europe. The area on the border with Central Europe
still showed the highest exceedances in 2020. The recently updated Guidance Document on Health
and Environmental Improvements (Working Group on Effects, 2013b) reflects the commitments of the
Revised Gothenburg Protocol to include 2005 as the base year for emission reductions reporting and
2020 emission reduction commitments. For EECCA countries, the Guidance Document only contains
information for Belarus, Moldova, Russian Federation and Ukraine. The 2020 emission reduction
commitments for Belarus, Moldova and Ukraine will not result in a change in the percentage of area
where critical loads of N are exceededed in 2020 compared to 2005, i.e. the area of exceedance will
remain 100% (Table 2.2), but the average accumulated exceedance (AAE; Posch et al., 2001), an
indication of the magnitude of exceedance, will be reduced by 14 (Belarus) to 24% (Moldova).
In the Russian Federation, the percentage area of exceedance will decline from 48% in 2005 to 40%
in 2020, with AAE being reduced by 33%. The predicted improvements of AAE in the EECCA

12
countries are relatively low compared to those in SEE countries (apart from Cyprus and Albania) and
those in countries in other parts of Europe (Table 2.2; Working Group on Effects, 2013b). Although
large areas in Europe are predicted to still exceed the N critical loads in 2020 under the current
Gothenburg Protocol emission reduction commitments, the magnitude of exceedance as indicated by
the AAE will be much lower. Hence, eutrophication will remain a threat to ecosystems in the near
future, preventing recovery of ecosystems from higher N deposition in recent decades.
Table 2.2 Percentage area per country where critical loads for eutrophication of ecosystems are
exceeded and average accumulated exceedance (AAE) in those areas for the base year 2005 and the 2020 emission reduction commitments of the revised Gothenburg Protocol. The percentage improvement between 2005 and 2020 is also shown. Source: Working Group on Effects (2013b). Guidance document for Health and Environmental Improvements.
2.2.3 Nitrogen concentrations in mosses
Several studies have shown that mosses have the potential to be indicators of atmospheric N
deposition (Harmens et al., 2011, and references therein). However, sometimes the relationship
between atmospheric N deposition and the N concentration in mosses is weak (e.g. Stevens et al.,
2011) or shown to be species-specific (Arroniz-Crespo et al., 2008; Salemaa et al., 2008). In 2005,
ectohydric moss species were sampled for the first time at the European scale to indicate spatial
patterns of atmospheric N deposition across Europe (Harmens et al., 2011). Detailed statistical
analysis of the European moss data (Schröder et al., 2010a) revealed that the total N concentration in
mosses is significantly and best correlated with EMEP modelled air concentrations and atmospheric N
deposition rates in comparison to other predictors that might contribute to the spatial variation of N
concentrations in mosses. The variation in the total N concentration in mosses was best explained by
the variation in ammonium (NH4+) concentration in air, followed by nitrogen dioxide (NO2)
concentrations in air. An apparent asymptotic relationship was found between EMEP modelled total
atmospheric N deposition and the total N concentration in mosses (Harmens et al., 2011). Factors
potentially affecting this relationship were discussed in more detail in the same study. Saturation
appears to start at N deposition rates of ca. 15 kg ha-1
y-1
, which might indicate the threshold of
adverse impacts of N on the moss species sampled. For many habitats in Europe a N deposition of
15 kg ha-1
y-1
is within the range or even above the empirical critical load for N (Bobbink and
Hettelingh, 2011).
So far, no EECCA countries have reported data on the N concentration in mosses and limited data is
available from SEE countries. N concentrations in mosses have been determined in 2005 and 2010 in
Bulgaria, Croatia, Macedonia and Slovenia (Table 2.3). The data for these countries are within the
mid-range of those observed in European countries in general (Harmens et al., 2011; Harmens et al.,
2013c). In all these countries, a decline in the N concentration in mosses has been observed between
Area AAE Area AAE Area AAE
(%) (eq ha-1 a-1) (%) (eq ha-1 a-1) (%) (eq ha-1 a-1)
EECCA
Belarus 100 460 100 397 0 14
Moldova 100 407 100 309 0 24
Russian Federation 48 78 40 52 17 33
Ukraine 100 520 100 424 0 18
SEE
Albania 92 289 81 218 12 25
Bosnia & Herzegovina 72 233 67 131 7 44
Bulgaria 77 165 38 52 51 68
Croatia 96 502 82 262 15 48
Cyprus 100 281 100 243 0 14
Greece 100 377 95 219 5 42
Macedonia 91 280 73 151 20 46
Romania 99 493 92 269 7 45
Slovenia 91 265 34 42 63 84
Other European countries
Austria 81 316 51 134 37 58
Belgium 4 7 1 1 75 86
Czech Republic 94 516 80 229 15 56
Denmark 110 718 99 365 10 49
Estonia 37 38 18 16 51 58
Finland 11 7 3 1 73 86
France 89 437 74 230 17 47
Germany 57 373 46 218 19 42
Hungary 100 667 90 370 10 45
Ireland 24 39 11 14 54 64
Italy 74 367 48 195 35 47
Latvia 93 201 75 112 19 44
Liechtenstein 100 455 100 288 0 37
Lithuania 98 390 97 318 1 18
Luxembourg 100 727 97 504 3 31
Netherlands 90 957 85 559 6 42
Norway 5 5 1 1 80 80
Poland 74 328 64 223 14 32
Portual 100 264 99 194 1 27
Slovakia 98 524 89 287 9 45
Spain 99 400 95 273 4 32
Sweden 36 62 19 19 47 69
Switzerland 75 579 66 403 12 30
United Kingdom 53 170 27 38 49 78
2005 2020 % improvement 2005-2020

13
2005 and 2010, indicating that the atmospheric deposition of N has declined since 2005 in these
countries. The decline (30%) in the median concentration in mosses in Slovenia is most likely due to a
change in methodology (see Annex 1), where the impact of canopy drip on N concentrations in
mosses (Kluge et al., 2013) was minimised in the 2010 survey.
Table 2.3 Median nitrogen concentration in mosses in countries in South-East Europe that reported these
concentrations for the 2005 and 2010 European moss survey.
Little is known about the relationship between N concentration in terrestrial mosses and impacts of N
on terrestrial ecosystems (Harmens et al., 2012b). Empirical critical loads have been defined for
various habitats (Bobbink and Hettelingh, 2011), however, the effects indicators for exceedance have
not been related so far to N concentrations in mosses per se. For many terrestrial ecosystems with an
empirical critical load below 15 kg ha-1
y-1
N effects have been reported on moss species (e.g.
changes in moss species composition or abundance).
2.3 Ozone
2.3.1 Background
Ozone (O3) is a secondary air pollutant formed, and destroyed, by a series of complex photochemical
reactions involving nitrogen oxides (NOx = NO + NO2), methane (CH4), carbon monoxide (CO) and
non-methane volatile organic carbons (NMVOC) (Avnery et al., 2011; Royal Society, 2008). Although
tropospheric (ground-level) O3 is a natural phenomenon, since the industrial revolution O3
concentrations in the troposphere have substantially increased from around 10-15 parts per billion
(10-15 ppb), to present day values of 30-40 ppb (Simmonds et al., 2004; Sitch et al., 2007) with the
steepest rise being from 1950 to 2000 (Vingarzan, 2004; Parrish et al., 2012). Future projections of
O3 concentrations are closely coupled to levels of anthropogenic precursor emissions (Dentener et al.,
2006). With the global population estimated to reach 9.2 billion by 2050, associated increased
demand for resources such as fossil fuels, energy production, transport and agriculture is likely to
further increase precursor emissions (Oltmans et al., 2006). Tropospheric O3 pollution is, therefore, a
major concern at a local, regional and global (hemispheric) scale (Jenkin, 2008; Van Dingenen et al.,
2009). Future O3 trends will not only depend on the anthropogenic emission levels of precursors, but
also on trends in temperature, humidity and solar radiation. A multi-model study of impacts of climate
change alone on O3 concentrations in Europe predicts increases in the mean O3 concentration in the
range 0.9 to 3.6 ppb for 2040-49 climates compared to 2000-09 climates (Langner et al., 2012).
As well as these steady increases in background O3 concentrations across Europe, it is also of
concern that O3 episodes frequently occur in which the O3 concentration exceeds 60 ppb, sometimes
for several days at a time. In recent hot, dry years, O3 episodes have been widespread across
Europe. For example, in July 2006, two significant O3 episodes occurred between 17 – 22 July and 25
– 28 July. During these episodes, O3 concentrations in excess of 90 ppb were experienced in
countries such as the UK, Belgium, Netherlands, France, Germany, Switzerland and Italy with the
highest one hour value recorded being over 180 ppb in Italy (EEA, 2007). Even in a cooler, wetter
year such as 2011, the EU’s information threshold (one hour at 180 μg m-3
(or 90 ppb) was exceeded
in 16 Member States whilst the alert threshold of 240 μg m-3
(or 120 ppb) was exceeded in Bulgaria,
France, Greece, Italy, Portugal and Spain. O3 concentrations are usually highest in rural and upland
areas downwind of major conurbations, where unlike in cities, fewer other pollutants are present to
react with O3 to reduce the concentration. These rural/upland areas are where many of the
ecosystems occur that provide essential services for man (agricultural production, forest production,
water catchments etc.). Here, O3 impacts on ecosystems will vary from direct toxicity and cell
Decline (%)
Country 2005 2010 2005-2010
Bulgaria 1.37 1.32 4
Croatia 1.60 1.49 7
Macedonia 1.21 1.06 13
Slovenia 1.84 1.29 30
Turkey 1.41 - -
N moss (%)

14
damage, to indirect effects mediated by changes in individual organisms and their ecological
interactions, and in the rate and nature of chemical and biological processes (Ainsworth et al., 2012;
Ashmore, 2005).
Excessive uptake of O3 by vegetation in the short-term can cause altered physiology (photosynthesis,
respiration, C allocation and stomatal functioning), reduced growth (both above– and below-ground),
altered phenology and increased senescence (Mills et al., 2013). In the long-term, it may lead to
changes in species and genetic composition and functioning of (semi-)natural plant communities
(hence, ecosystems), and to changes in water economy and C stocks. Thus, O3 acts primarily on the
processes which underlie the functioning of ecological systems whilst the benefits we derive from
ecosystems are often many steps removed from these functional processes (Mills et al., 2013).
Recently, the ICP Vegetation has reviewed impacts of O3 on food security (Mills and Harmens, 2011),
carbon sequestration (Harmens and Mills, 2012) and ecosystem services and biodiversity (Mills et al.,
2013).
The ICP Vegetation has been instrumental in developing O3 risk methodology for application at the
European scale. Initially, O3 exposure indices based on accumulated exposure above a threshold
concentration (e.g. AOT40) were recommended for use across Europe. In the last decade, a method
has been developed that takes into account the instantaneous effects of climatic factors (temperature,
humidity, light), soil factors (soil moisture) and plant factors (growth stage) on the amount of O3 that is
taken up by the stomatal pores on the leaf surface (O3 flux or phytotoxic O3 dose over a threshold flux
of Y, PODY). O3 effects detected in the field are better correlated with O3 flux than AOT40 (Hayes et
al., 2007; Mills et al., 2011a), and the flux-based methodology has now been accepted by the LRTAP
Convention as the preferred approach within the revised Gothenburg Protocol (Mills et al., 2011b).
Critical levels of O3 for vegetation are defined in detail in Chapter 3 of the Modelling and Mapping
Manual of the LRTAP Convention (http://icpvegetation.ceh.ac.uk/manuals/mapping_manual.html).
Data used for developing critical levels of O3 for vegetation are primarily based on data from other
parts of Europe than the EECCA and SEE region, due to a lack of data from that region.
2.3.2 Field-based evidence of ozone impacts
In 2007, the ICP Vegetation reported on field-based evidence of widespread O3 damage to vegetation
in Europe for the period 1990 to 2006 (Hayes et al., 2007). Although evidence was provided for
impacts in the Eastern Mediterranean area, data was limited to impacts observed at selected sites in
Greece and Slovenia, with the longest time series of data being available for Slovenia. In Slovenia
(Ljubljana), the three-month AOT40 during June - August was very variable from year to year and
ranged from 8.1 ppm h to 18.6 ppm h during 2003 to 2006. During April - October 2003, O3
concentrations in Ljubljana frequently exceeded 60 ppb, with several O3 episodes exceeding 80 ppb
during June - August. In Greece, during June - August 2003 and 2004, O3 concentrations in Kalamata
and Athens reached values up to 120 and 100 ppb respectively (Hayes et al., 2007). In 1998, O3
peaks up to 180 ppb were recorded during a four-day period in October, resulting in commercial value
losses of €15,000 overnight in glass houses cultivating lettuce (Figure 2.3). O3 injury has also been
reported for wheat, maize, cotton, potato, water melon, musk melon, bean, onion, grapevine,
courgette, chicory and fodder crops (Velissariou and Davidson, 1996; Velissariou and Skretis, 1999;
Velissariou et al., 2000; Fumagali et al., 2001; see Annex 1 for further details).
Figure 2.3 Ozone-induced leaf damage in lettuce (left), cotton (middle) and water melon (right) in Greece.
Source: Dimitris Velissariou.

15
Injury records from this region are mainly from crops; there are only a few records for trees and
shrubs and no records of O3 injury on grasses or forbs. It may well be that in this region O3 uptake is
high in crops as they are often irrigated, whereas the majority of naturally occurring vegetation
experiences hot, dry conditions during the highest O3 episodes, coinciding with low stomatal
conductances and thus low stomatal O3 fluxes. When exposing plants in biomonitoring studies to
ambient air, extensive O3-induced visible leaf injury has been observed on the O3-sensitive variety of
white clover (Hayes et al., 2007) and bean in Greece and Slovenia and also on Bel-W3 tobacco
plants exposed at several sites across the Greater Athens Region. In addition, Velissariou et al.
(1992) reported O3-like lesions in needles of Aleppo pine within a 75 km radius from Athens. Further
details on the impacts of O3 on vegetation in Greece and Slovenia are provided in the country reports
in Annex 1. Few data are available on the impacts of O3 on vegetation in EECCA countries. In recent
years, Ukraine has been participating in the O3 biomonitoring experiments of the ICP Vegetation. In
2007, impacts of O3 on white clover were reported for Karadag, and in 2010, impacts of O3 on bean
were reported for Kiev. In 2007, no clear impact of O3 on the sensitive cultivar of clover was observed
in Karadag. In 2010, despite O3 injury being observed on the leaves of the sensitive variety of bean,
this did not affect bean yield or weight.
2.3.3 Modelled ozone risk assessment
Due to the lack of measurements in the field on the impacts of O3 on vegetation in EECCA and SEE
countries, modelling of O3 risk is required to assess the potential risk of O3 on vegetation in this
region. AOT40 and PODygen (for a generic crop and deciduous tree species) were calculated with the
EMEP atmospheric transport model (Simpson et al., 2012) using the parameterisations as defined in
the Modelling and Mapping Manual of the LRTAP Convention (LRTAP Convention, 2011). The data
was downloaded from the EMEP web site (http://webdab.emep.int/Unified_Model_Results/ydata.html;
downloaded 14-02-2014, model version 2013) for the extended EMEP domain.
AOT40 and PODygen values per 50 km x 50 km grid were averaged over five years (2007 to 2011) to
smooth the annual fluctuations in these values. It should be noted that the modelled data only provide
an indication of risk of O3 impacts on crops and tree species and cannot be used to calculate
exceedances of critical levels as these have not been defined so far for a generic tree species; a
response function for a generic crop will be evaluated shortly.
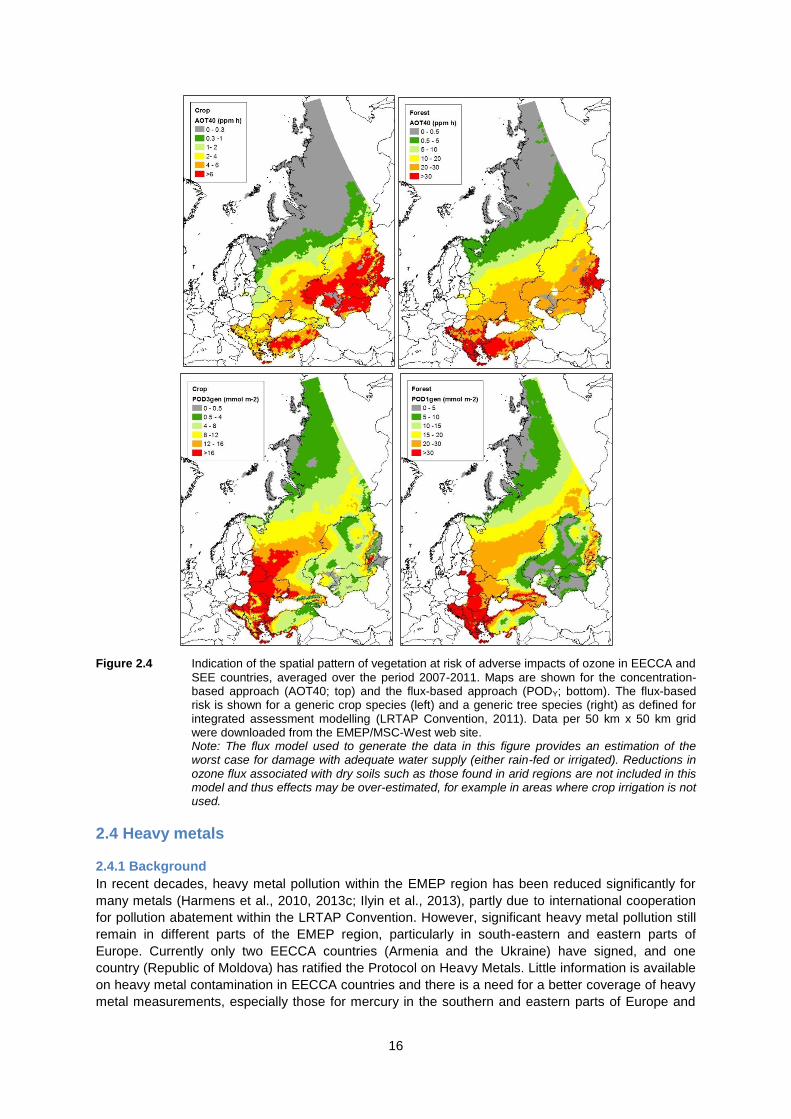
The spatial pattern of the risk of O3 impacts on vegetation is shown in Figure 2.4. As often identified
before for other parts of Europe, there is a clear north south gradient for AOT40, with the risk of
impact increasing from north to south. The gradient mimics the increasing level of O3 concentration
from north to south. According to the AOT40 approach, sensitive crop and forest species are most at
risk from O3 impacts in SEE countries and in the southern part of the EMEP region, in particular those
areas in the east (the ‘-stan’ countries) bordering with Central (China) and South-East Asia
(Afghanistan, Pakistan, India). The AOT40-based critical level for agricultural crops and forest trees of
3 and 5 ppm h respectively is exceeded in the southern part of the EMEP region. Large parts of the
Russian Federation, particularly the northern and central part, are at low risk of O3 impacts on
sensitive crop and tree species. As mentioned above, the O3 flux-based approach is biologically more
relevant and correlates better with impacts on vegetation observed in the field in other parts of Europe
(Hayes et al., 2007; Mills et al., 2011a). When modelling the risk of O3 impacts on vegetation
according to the stomatal flux-based approach, determining the level of O3 entering the leaves as a
measure of phytotoxic O3 dose (POD), then the pattern of risk is different from the concentration-
based (AOT40) approach. Both for crops and trees, the area at highest risk of O3 impact in the
EECCA countries is the region bordering with Central Europe, i.e. the western part of the Russian
Federation, Belarus, Ukraine and Moldova. Many parts of SEE are also at high risk from O3 impacts
on vegetation, particularly for trees, with the risk being lowest in Turkey. It should be noted that the
AOT40 and flux-based approach used here provides an estimation of the worst case for damage with
adequate water supply (either rain-fed or irrigated). Reductions in ozone flux associated with dry soils
such as those found in arid regions are not included in this model and thus effects may be over-
estimated particularly in the southern part of the region, including areas where crop irrigation is not
used. More field-based evidence is required to confirm the spatial pattern of O3 risk as indicated by
the flux-based approach, as was done before for other parts of Europe (Hayes et al., 2007).
16
Figure 2.4 Indication of the spatial pattern of vegetation at risk of adverse impacts of ozone in EECCA and
SEE countries, averaged over the period 2007-2011. Maps are shown for the concentration-based approach (AOT40; top) and the flux-based approach (PODY; bottom). The flux-based risk is shown for a generic crop species (left) and a generic tree species (right) as defined for integrated assessment modelling (LRTAP Convention, 2011). Data per 50 km x 50 km grid were downloaded from the EMEP/MSC-West web site. Note: The flux model used to generate the data in this figure provides an estimation of the worst case for damage with adequate water supply (either rain-fed or irrigated). Reductions in ozone flux associated with dry soils such as those found in arid regions are not included in this model and thus effects may be over-estimated, for example in areas where crop irrigation is not used.
2.4 Heavy metals
2.4.1 Background
In recent decades, heavy metal pollution within the EMEP region has been reduced significantly for
many metals (Harmens et al., 2010, 2013c; Ilyin et al., 2013), partly due to international cooperation
for pollution abatement within the LRTAP Convention. However, significant heavy metal pollution still
remain in different parts of the EMEP region, particularly in south-eastern and eastern parts of
Europe. Currently only two EECCA countries (Armenia and the Ukraine) have signed, and one
country (Republic of Moldova) has ratified the Protocol on Heavy Metals. Little information is available
on heavy metal contamination in EECCA countries and there is a need for a better coverage of heavy
metal measurements, especially those for mercury in the southern and eastern parts of Europe and

17
Central Asia (Ilyin et al., 2013; see Figure 2.1 and Table 2.1). This might be partly achieved by
involvement of national monitoring networks available in the countries. Only two countries - Republic
of Moldova and Belarus officially reported their long-term trends on emissions of the three metals for
1990 – 2011 (Ilyin et al., 2013). As for other countries, their data on trends are incomplete. To fill the
gaps in the emission data in these countries expert estimates are used. A peculiarity of the Caucasus
countries is the fact that the contribution of non-EMEP sources to pollution is much higher than that in
the western part of the EECCA region. Therefore, information about emissions in nearby non-EMEP
countries presented in the EMEP domain (e.g., Iran, Syria, Iraq etc.) is needed to improve
calculations of pollution levels in the EECCA countries. It should be stressed that the quality of the
pollution assessment strongly depends on the availability and quality of input information, first of all,
on emissions. Since monitoring information for the EECCA countries is limited, assessment of
pollution levels in these countries relies entirely on modelling. Given the large gaps of knowledge on
national emissions and a lack of monitoring data, assessment of pollution levels in this region is rather
uncertain. Official data on anthropogenic emissions are reported only by five of the 12 EECCA
countries. However, no monitoring data on heavy metal concentration in air and precipitation are
reported so far. Therefore, additional efforts are needed to facilitate development of national emission
inventories and monitoring networks in these countries (Ilyin et al., 2013).
2.4.2 Modelled heavy metal deposition
As for the rest of Europe, in most EECCA and SEE countries heavy metal deposition has declined
between 1990 and 2011 for cadmium (Cd), lead (Pb) and mercury (Hg), with the highest reductions
being computed for Pb (Figure 2.5). The spatial distribution of the changes in heavy metal deposition
between 1990 and 2011 is shown in Figure 2.6. The comparable level of pollution reduction is only a
characteristic of the western part of the EECCA region (Ukraine, Republic of Moldova, Belarus,
Russian Federation), which is largely affected by emission changes in other European countries (Ilyin
et al., 2013). Although similar reductions were computed for Pb for Kazakhstan, Uzbekistan,
Turkmenistan, Kyrgyzstan and Tajikistan as for other European countries, lower reductions were
computed for Cd and Hg. The lowest reductions were reported for the Caucasus, i.e. Georgia,
Armenia and Azerbaijan. In SEE, the lowest reductions were also reported for the eastern part of the
region, i.e. Greece, Turkey and Cyprus, with increases being computed for Cd in Turkey and Cyprus
(Figures 2.5 & 2.6). On average, reductions (not weighted by area) in deposition for Pb, Cd and Hg
(ca. 60, 26 and 27% respectively) were similar in EECCA and SEE countries, but lower than in the
rest of Europe (ca. 74, 50 and 47%).
Hg differs from other heavy metals by its long-range dispersion in the atmosphere. Therefore, Hg
pollution levels in Europe are largely affected by emission sources from other regions. The major
external contributor to Hg anthropogenic deposition in Europe is East Asia. Transport from this region
to Europe is almost double of the reverse transport from Europe to the region. As to other regions
including North and South Americas, South and Central Asia, Africa, Australia and Oceania, Europe
acts as a net exporter of atmospheric mercury transporting significantly more pollution to these
regions than receiving from them (Ilyin et al., 2013).
Figure 2.5 Percentage reductions in computed Pb, Cd and Hg deposition in EECCA countries (left) and
SEE countries (right) between 1990 and 2011. The average percentage reduction in deposition (not weighted by area) for the rest of Europe is shown for comparison. Data source: EMEP/MSC-East.
-10
10
30
50
70
90
Ukra
ine
Mo
ldo
va
Be
laru
s
Ru
ssia
Ka
za
kh
sta
n
Uzb
ekis
tan
Tu
rkm
en
ista
n
Kyrg
yzsta
n
Ta
jikis
tan
Ge
org
ia
Arm
en
ia
Aze
rba
ijan
Re
st E
uro
pe
De
po
sitio
n re
du
ctio
n (%
)
Pb Cd Hg
-30
-10
10
30
50
70
90
Cro
atia
Slo
ve
nia
Ro
ma
nia
Bo
sn
. He
rz.
Mo
nte
ne
gro
Alb
an
ia
Ma
ce
don
ia
Se
rbia
Bu
lga
ria
Gre
ece
Tu
rke
y
Cyp
rus
Re
st E
uro
peD
ep
ositio
n re
du
ctio
n (%
)
Pb Cd Hg

18
In 2011, the highest levels of metal deposition were computed in SEE countries (although lower
depositions were noted for parts of Turkey and in Cyprus), the south-western part of the EECCA
region (the Ukraine, Belarus, Caucasus), some eastern parts of the Russian Federation and the
south-eastern (Kyrgyzstan, Tajikistan) parts of the EECCA region (Figure 2.6). Relatively high levels
in these areas are caused by location of emission sources, and partly because of transboundary
transport from neighbouring countries. Elevated levels of Pb and Cd deposition in 2011 are partly
explained by a significant contribution of dust re-suspension. The lowest levels were found in the
Arctic regions of the Russian Federation, where emissions are low. In addition, deposition of metals is
low in the desert areas of Central Asia, which can be explained by low precipitation (Ilyin et al., 2013).
Ilyin et al. (2013) concluded that the contributions of anthropogenic, secondary and non-EMEP
sources to pollution levels differ largely among the EECCA countries. Individual peculiarities of each
EECCA country should be taken into account when assessing heavy metal pollution levels.
Cadmium Lead Mercury
Figure 2.6 Deposition fields of cadmium, lead and net flux of mercury in EECCA and SEE countries (top)
and percentage change in deposition fields of cadmium, lead and net flux of mercury in EECCA and SEE countries between 1990 and 2011(bottom), with positive values indicating an increase and negative values a decrease. Source: EMEP/MSC-East (modified from Ilyin et al., 2013).
2.4.3 Concentrations of heavy metals in mosses
Mosses have successfully been used as biomonitors of atmospheric heavy metal deposition, in
particular for Cd and Pb (Harmens et al., 2010, 2012a; Schröder et al., 2010b). The first European
moss survey was conducted in 1990 and has since then be repeated at five-yearly intervals, and the
latest survey was conducted in 2010 (Harmens et al., 2013c). Heavy metal concentrations in mosses
provide an indication of areas at risk from high deposition of these pollutants. Temporal trends in Cd,
Pb and Hg concentrations in mosses agree very well with temporal trends in their deposition modelled
by EMEP/MSC-East (Harmens et al., 2010, 2012a, 2013c). One of the advantages of determining
heavy metal concentrations in mosses is that it is cheaper than long-term monitoring of precipitation,
so a higher sampling density can be achieved. There is a lack of EMEP monitoring stations that
measure heavy metal deposition in south-eastern and eastern parts of Europe (see Figure 2.1 and
Table 2.1; Ilyin et al., 2013). Some EECCA countries (or regions of EECCA countries) and several
SEE countries have been participating in the European moss survey since 1990 (Table 2.4). Table
2.5 provides an overview of the median concentration of heavy metals in mosses since 1995.

19
Table 2.4 Participation of EECCA and SEE countries in the European heavy metals in mosses survey
since 1990. Values indicate the number of sampling sites.
1
Data were also reported for Kosovo from 25 sites.
Table 2.5 Median concentration of metals in mosses sampled in EECCA and SEE countries between
1995 and 2010.
Note: separate data were provided for Albania and Kosovo in 2010; Rus. Fed. = Russian Federation, Bosn.&Herz. = Bosnia and Herzegovina. Data in brackets indicate values not corresponding with general temporal trends (or indicate contrasting levels in neighbouring areas, e.g. for Hg in Albania and Kosovo).
EECCA 1990 1995 2000 2005 2010
Belarus 45 58 76
Russian Federation 216 621 319 220 91
Ukraine 75 115 53 17
SEE
Albania1 61
Bosnia & Herzegovina 23
Bulgaria 215 217 213 129
Croatia 94 121
Macedonia 73 72 72
Romania 56 84 214 333
Serbia 92 193
Slovenia 29 82 57 102
Turkey 74
Metal EECCA SEE
(mg kg-1) Year Belarus Rus. Fed. Ukraine Albania Kosovo Bos.&Herz. Bulgaria Croatia Macedonia Romania Serbia Slovenia Turkey
Arsenic 1995 0.24 0.10 0.96 0.38
2000 0.21 0.24 1.01 0.21 0.80 1.56 1.44 0.33
2005 0.15 0.23 0.22 0.37 0.68 1.41 0.43 1.71
2010 0.12 0.15 0.24 0.63 0.28 0.69 0.68 0.26
Cadmium 1995 0.29 0.18 0.18 0.38 0.60 0.73
2000 0.25 0.29 0.38 0.16 0.46 0.43
2005 0.24 0.32 0.31 0.28 0.29 0.26 0.33 0.30
2010 0.07 0.36 0.11 0.13 0.21 0.38 0.22 (1.20) 0.27
Chromium 1995 1.53 1.27 1.70 2.30 9.15 4.29
2000 1.43 1.50 3.45 2.41 7.46 8.46 5.07 2.59
2005 1.20 3.64 1.86 2.43 2.75 6.79 6.44 2.14 4.41
2010 3.21 (9.16) 0.73 4.83 2.63 2.06 1.94 3.48 4.97 1.56
Copper 1995 4.50 7.12 6.20 14.70 11.30 8.40
2000 5.84 7.31 14.51 10.82
2005 8.94 7.20 10.72 7.54 6.65 11.11 8.17 6.32
2010 7.22 (21.2) 3.96 3.04 7.01 6.06 3.54 (17.79) 5.42
Iron 1995 651 436 333 1587 1937 1007
2000 537 313 1350 1412 2412 2518 2365 713
2005 394 679 450 1399 991 2239 2267 943 1709
2010 416 419 (1414) 1629 312 1101 789 1490 1670 548
Lead 1995 8.16 4.45 3.40 19.0 26.5 8.55
2000 6.62 6.80 18.9 5.97 14.4
2005 7.65 14.8 2.57 7.62 16.7 10.1 5.09
2010 7.07 2.42 7.78 8.00 3.21 4.61 (30.8) 5.01
Mercury 1995 0.050 0.060
2000 0.040 0.039 0.056
2005 0.064 0.068 0.095
2010 (0.13) (0.033) 0.043 0.093 0.050
Nickel 1995 1.95 4.98 2.69 3.06 2.19 2.76
2000 2.01 2.06 4.85 3.33 2.39 3.35 5.65
2005 1.25 2.74 1.70 2.99 2.68 5.82 4.43 2.75 4.04
2010 (0.23) 2.82 (6.70) 5.81 2.00 2.61 3.16 3.45 3.60 2.12
Vanadium 1995 3.36 3.03 1.80 4.90 6.40 4.00
2000 2.79 1.29 7.16 4.95 6.95 7.99 9.26
2005 1.33 2.27 2.13 3.88 3.10 6.38 5.76 3.38 6.28
2010 1.19 2.45 2.63 3.52 3.07 2.55 3.49 4.89 2.30
Zinc 1995 34.7 38.0 31.0 30.5 43.9 38.8
2000 35.3 29.3 23.9 32.6 39.4 (79.6) 32.6 34.5
2005 31.3 40.1 36.2 27.9 29.0 35.6 29.0 38.6 27.5
2010 34.1 33.6 54.9 13.8 38.5 22.2 24.8 19.9 42.3 29.0
Aluminium 2005 758 850 625 1495 1346 3600 3946 2260
2010 557 922 1476 1650 1245 878 1878 3150
Antimony 2005 0.11 0.12 0.23 0.15 0.15 0.24 0.21 0.19
2010 0.096 0.092 0.21 0.12
20
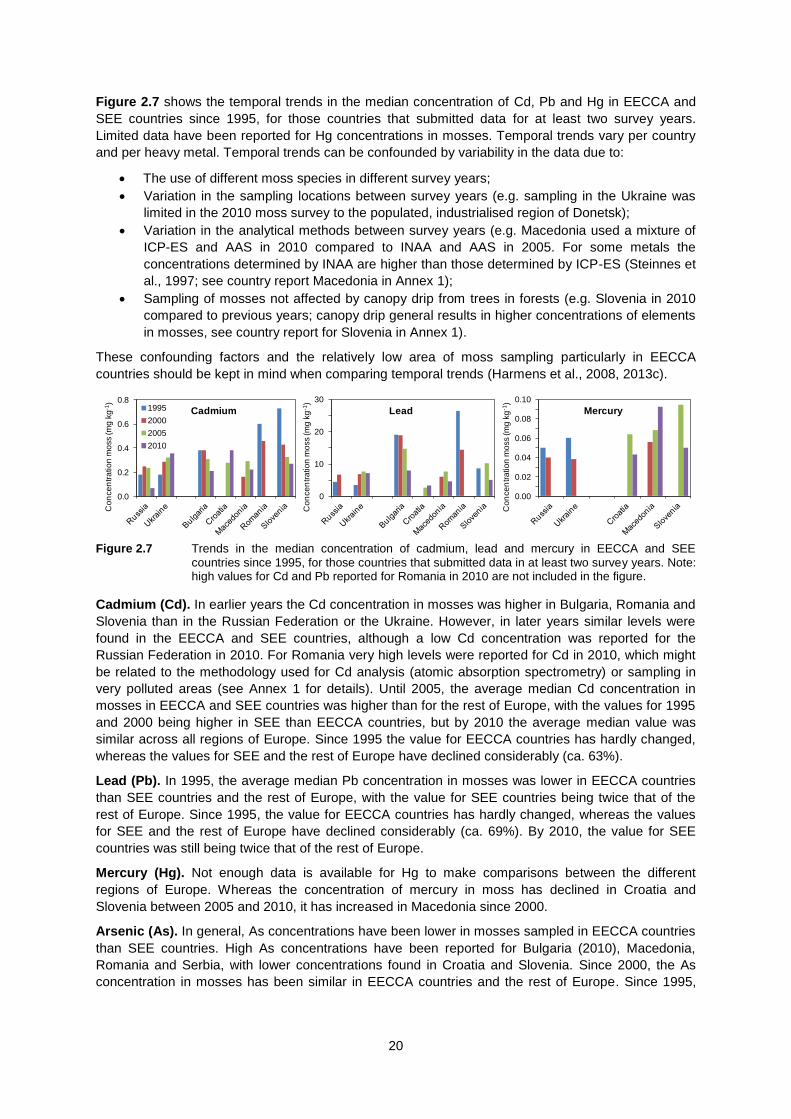
Figure 2.7 shows the temporal trends in the median concentration of Cd, Pb and Hg in EECCA and
SEE countries since 1995, for those countries that submitted data for at least two survey years.
Limited data have been reported for Hg concentrations in mosses. Temporal trends vary per country
and per heavy metal. Temporal trends can be confounded by variability in the data due to:
The use of different moss species in different survey years;
Variation in the sampling locations between survey years (e.g. sampling in the Ukraine was
limited in the 2010 moss survey to the populated, industrialised region of Donetsk);
Variation in the analytical methods between survey years (e.g. Macedonia used a mixture of
ICP-ES and AAS in 2010 compared to INAA and AAS in 2005. For some metals the
concentrations determined by INAA are higher than those determined by ICP-ES (Steinnes et
al., 1997; see country report Macedonia in Annex 1);
Sampling of mosses not affected by canopy drip from trees in forests (e.g. Slovenia in 2010
compared to previous years; canopy drip general results in higher concentrations of elements
in mosses, see country report for Slovenia in Annex 1).
These confounding factors and the relatively low area of moss sampling particularly in EECCA
countries should be kept in mind when comparing temporal trends (Harmens et al., 2008, 2013c).
Figure 2.7 Trends in the median concentration of cadmium, lead and mercury in EECCA and SEE
countries since 1995, for those countries that submitted data in at least two survey years. Note: high values for Cd and Pb reported for Romania in 2010 are not included in the figure.
Cadmium (Cd). In earlier years the Cd concentration in mosses was higher in Bulgaria, Romania and
Slovenia than in the Russian Federation or the Ukraine. However, in later years similar levels were
found in the EECCA and SEE countries, although a low Cd concentration was reported for the
Russian Federation in 2010. For Romania very high levels were reported for Cd in 2010, which might
be related to the methodology used for Cd analysis (atomic absorption spectrometry) or sampling in
very polluted areas (see Annex 1 for details). Until 2005, the average median Cd concentration in
mosses in EECCA and SEE countries was higher than for the rest of Europe, with the values for 1995
and 2000 being higher in SEE than EECCA countries, but by 2010 the average median value was
similar across all regions of Europe. Since 1995 the value for EECCA countries has hardly changed,
whereas the values for SEE and the rest of Europe have declined considerably (ca. 63%).
Lead (Pb). In 1995, the average median Pb concentration in mosses was lower in EECCA countries
than SEE countries and the rest of Europe, with the value for SEE countries being twice that of the
rest of Europe. Since 1995, the value for EECCA countries has hardly changed, whereas the values
for SEE and the rest of Europe have declined considerably (ca. 69%). By 2010, the value for SEE
countries was still being twice that of the rest of Europe.
Mercury (Hg). Not enough data is available for Hg to make comparisons between the different
regions of Europe. Whereas the concentration of mercury in moss has declined in Croatia and
Slovenia between 2005 and 2010, it has increased in Macedonia since 2000.
Arsenic (As). In general, As concentrations have been lower in mosses sampled in EECCA countries
than SEE countries. High As concentrations have been reported for Bulgaria (2010), Macedonia,
Romania and Serbia, with lower concentrations found in Croatia and Slovenia. Since 2000, the As
concentration in mosses has been similar in EECCA countries and the rest of Europe. Since 1995,
0.0
0.2
0.4
0.6
0.8
Co
nce
ntr
atio
n m
oss (m
g k
g-1
)
Cadmium1995
2000
2005
2010
0.00
0.02
0.04
0.06
0.08
0.10
Co
nce
ntr
atio
n m
oss (m
g k
g-1
)
Mercury
0
10
20
30
Co
nce
ntr
atio
n m
oss (m
g k
g-1
)
Lead

21
the median concentration of As has declined between 19% (EECCA) and 35% (rest of Europe) on
average.
Chromium (Cr). Cr concentrations in mosses have been higher in SEE than EECCA countries due to
the high levels reported for Macedonia, Romania and Serbia. On average, the median values were
lower in EECCA countries than in the rest of Europe in 1995 and 2000, but the opposite was true for
2005 and 2010. Whereas the average median Cr concentration for EECCA countries has risen by
31% since 1995, it has declined by ca. 48% in SEE countries and the rest of Europe.
Copper (Cu). In 1995 and 2000, Cu concentrations in mosses were higher in SEE than EECCA
countries due to high concentrations being observed in Bulgaria and Romania. However, by 2005 this
difference had disappeared and since 2005 the median Cu concentration in mosses has been similar
in EECCA and SEE countries and the rest of Europe. Whereas the average median Cu concentration
for EECCA countries has risen by 22% since 1995, it has declined by 20 and 56% in the rest of
Europe and SEE countries respectively.
Nickel (Ni). Ni concentrations in mosses were quite similar in 1995 and 2010 in EECCA and SEE
countries, but were higher in SEE countries in 2000 and 2005, partly due to data being reported for
Serbia where relatively high Ni concentrations were found in mosses in those years. Unusually high
and low Ni concentrations were reported for Ukraine and Belarus respectively in 2010, which for
Ukraine can be explained by sampling mosses in a smaller, more polluted region compared to
previous years. Whereas the average median Ni concentration for EECCA and SEE countries has
hardly changed since 1995, it has declined by 50% in the rest of Europe.
Vanadium (V). Relatively high V concentrations in mosses have been observed in Bulgaria,
Macedonia, Romania and Serbia, in particular until 2005. Therefore, on average the median V
concentration in mosses has been higher in SEE than EECCA countries, with the difference being
smaller in 2010. Median values in the rest of Europe were on average similar as those in EECCA
countries. Since 1995, the median V concentration has declined on average by ca. 24% in EECCA
countries and the rest of Europe, and by 36% in SEE countries.
Zinc (Zn). Zn concentration in mosses vary the least between countries (Harmens et al., 2010,
2013c). Small fluctuations between years resulted in higher Zn concentrations in one of the regions in
one year and in another region in another year. Between 1995 and 2010, the median Zn
concentration has increased on average by 18% in EECCA countries, it has declined by 18 and 22%
in the rest of Europe and SEE countries respectively.
Although we have tried to compare and generalise trends between EECCA, SEE and the rest of
Europe, one should bear in mind that data availability is limited, particularly for EECCA countries. In
addition, considerable variations in heavy metal concentrations in mosses and temporal trends were
observed in the rest of Europe. Participation of EECCA and SEE countries in future moss surveys
should be stimulated considering the fact that either relatively high levels of heavy metal pollution
remain in these countries and/or the decline in pollution levels has been less than in the rest of
Europe.
A review of the scientific literature showed that little is known about the relationship between heavy
metal concentrations in mosses and the impacts of heavy metals on terrestrial ecosystems. Toxicity
effects of heavy metals on vegetation are usually limited to areas close to pollution sources, with
impacts often declining exponentially with distance from the pollution source (Harmens et al., 2012b,
and reference therein). However, in the European survey, mosses are not sampled close to pollution
sources and hence concentrations are often too low to be associated with an impact on terrestrial
ecosystems in the sampling areas. This does not mean, however, that we should not be concerned
about heavy metal deposition in remote areas as metals will accumulate in the soil and might become
a problem in the future if bio-available concentrations reach critical limits.
2.4.4 Critical load exceedances for heavy metals
Although deposition of heavy metals to above-ground plant parts can lead to uptake via the leaves
(Harmens et al., 2005), the risk of heavy metal toxicity to terrestrial ecosystems is often expressed as
a function of the free metal ion concentration in soil solution. The LRTAP Convention has developed
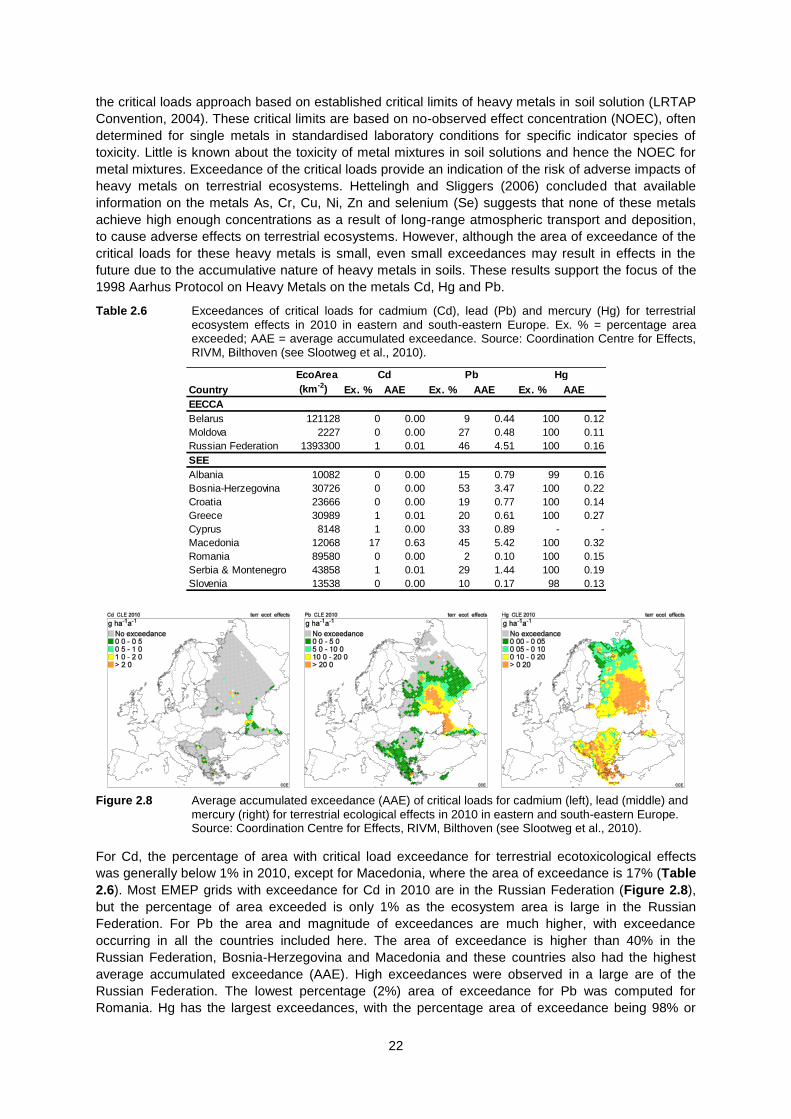
22
the critical loads approach based on established critical limits of heavy metals in soil solution (LRTAP
Convention, 2004). These critical limits are based on no-observed effect concentration (NOEC), often
determined for single metals in standardised laboratory conditions for specific indicator species of
toxicity. Little is known about the toxicity of metal mixtures in soil solutions and hence the NOEC for
metal mixtures. Exceedance of the critical loads provide an indication of the risk of adverse impacts of
heavy metals on terrestrial ecosystems. Hettelingh and Sliggers (2006) concluded that available
information on the metals As, Cr, Cu, Ni, Zn and selenium (Se) suggests that none of these metals
achieve high enough concentrations as a result of long-range atmospheric transport and deposition,
to cause adverse effects on terrestrial ecosystems. However, although the area of exceedance of the
critical loads for these heavy metals is small, even small exceedances may result in effects in the
future due to the accumulative nature of heavy metals in soils. These results support the focus of the
1998 Aarhus Protocol on Heavy Metals on the metals Cd, Hg and Pb.
Table 2.6 Exceedances of critical loads for cadmium (Cd), lead (Pb) and mercury (Hg) for terrestrial
ecosystem effects in 2010 in eastern and south-eastern Europe. Ex. % = percentage area exceeded; AAE = average accumulated exceedance. Source: Coordination Centre for Effects, RIVM, Bilthoven (see Slootweg et al., 2010).
Figure 2.8 Average accumulated exceedance (AAE) of critical loads for cadmium (left), lead (middle) and
mercury (right) for terrestrial ecological effects in 2010 in eastern and south-eastern Europe. Source: Coordination Centre for Effects, RIVM, Bilthoven (see Slootweg et al., 2010).
For Cd, the percentage of area with critical load exceedance for terrestrial ecotoxicological effects
was generally below 1% in 2010, except for Macedonia, where the area of exceedance is 17% (Table
2.6). Most EMEP grids with exceedance for Cd in 2010 are in the Russian Federation (Figure 2.8),
but the percentage of area exceeded is only 1% as the ecosystem area is large in the Russian
Federation. For Pb the area and magnitude of exceedances are much higher, with exceedance
occurring in all the countries included here. The area of exceedance is higher than 40% in the
Russian Federation, Bosnia-Herzegovina and Macedonia and these countries also had the highest
average accumulated exceedance (AAE). High exceedances were observed in a large are of the
Russian Federation. The lowest percentage (2%) area of exceedance for Pb was computed for
Romania. Hg has the largest exceedances, with the percentage area of exceedance being 98% or
EcoArea
Country (km-2) Ex. % AAE Ex. % AAE Ex. % AAE
EECCA
Belarus 121128 0 0.00 9 0.44 100 0.12
Moldova 2227 0 0.00 27 0.48 100 0.11
Russian Federation 1393300 1 0.01 46 4.51 100 0.16
SEE
Albania 10082 0 0.00 15 0.79 99 0.16
Bosnia-Herzegovina 30726 0 0.00 53 3.47 100 0.22
Croatia 23666 0 0.00 19 0.77 100 0.14
Greece 30989 1 0.01 20 0.61 100 0.27
Cyprus 8148 1 0.00 33 0.89 - -
Macedonia 12068 17 0.63 45 5.42 100 0.32
Romania 89580 0 0.00 2 0.10 100 0.15
Serbia & Montenegro 43858 1 0.01 29 1.44 100 0.19
Slovenia 13538 0 0.00 10 0.17 98 0.13
Cd Pb Hg

23
more in all countries. The lowest exceedances for Hg were computed for northern parts of the
Russian Federation, widespread exceedance was computed for all the other areas. Continued effort
is required to reduce the exceedances of the critical load for Pb in the Russian Federation and
continued effort is required in all EECCA and SEE countries to reduce the exceedances of the critical
load for Hg. As Hg is a global pollutant, efforts are required at the hemispheric scale under the
Minamata Convention to reduce Hg pollution. Hardly any field-based evidence is available to validate
the critical load exceedance calculations for terrestrial ecosystems. De Zwart et al. (2010) made a first
attempt to estimate the loss of species due to Cd and Pb depositions in Europe. They concluded that
toxicity effects of Cd and Pb are close to zero in the vast majority of ecosystems across Europe.
2.5 Persistent organic pollutants (POPs)
2.5.1 Background
Persistent organic pollutants (POPs) are organic substances which are a concern for the environment
and human health as they: possess toxic characteristics; are persistent; bioaccumulate; are prone to
long-range transboundary atmospheric transport and deposition; are likely to cause significant
adverse human health or environmental effects near to and distant from their source (LRTAP
Convention, 1998). POPs are mainly of anthropogenic origin (Breivik et al., 2006), for example from
waste incineration, industrial production and application (e.g. pesticides, flame retardants, coolant
fluids) and fossil fuel burning. They show weak degradability and consequently are accumulating in
the environment across the globe, including in remote areas such as the polar regions. The
combination of resistance to metabolism and lipophilicity (‘fat-loving’) means that POPs accumulate in
food chains (Jones and de Voogt, 1999). Their ecotoxicity has been highlighted in aquatic (Leipe et
al., 2005) and terrestrial ecosystems (e.g. Oguntimehin et al., 2008; Smith et al., 2007).
2.5.2 Modelled deposition of POPs
Due to international cooperation and measures for pollution abatement within the LRTAP Convention,
pollution from POPs has substantially decreased during the past two decades. However, levels of
POP concentrations in the EMEP countries still pose risk to human health and ecosystems (Gusev et
al., 2013). Currently only two of the EECCA countries (Armenia and the Ukraine) have signed, and
one country (Republic of Moldova) – has ratified the Protocol on POPs. Only two countries (Slovenia
and Greece) in the EECCA/SEE region monitor the deposition of POPs at EMEP monitoring sites
(see Table 2.1).
Figure 2.9 Percentage reductions in computed B[a]P and PCCD deposition in EECCA countries (left) and
SEE countries (right) between 1990 and 2011. The average percentage reduction in deposition (not weighted by area) for the rest of Europe is shown for comparison.
Model assessment indicates reduction of POP pollution in the most of the EECCA and SEE countries
from 1990 to 2011 (Figure 2.9). In most of the studied region, the computed deposition of HCB has
dropped by more than 87% since 1990 (Gusev et al., 2013; data not shown), while for polychlorinated
dibenzodioxin (PCDD) and benzo[a]pyrene (B[a]P; representing polycyclic aromatic hydrocarbons -
PAHs) the decline was relatively small, especially in EECCA countries. The decrease in POP pollution
particularly in EECCA countries but also SEE countries does not follow the magnitude of decline in
the rest of Europe. Comparable levels of pollution reduction were seen in the western part of the
-30
-10
10
30
50
70
90
Ukra
ine
Mo
ldo
va
Be
laru
s
Ru
ssia
Ka
za
kh
sta
n
Uzb
ekis
tan
Tu
rkm
en
ista
n
Kyrg
yzsta
n
Ta
jikis
tan
Ge
org
ia
Arm
en
ia
Aze
rba
ijan
Re
st E
uro
pe
De
po
sitio
n re
du
ctio
n (%
)
B[a]P PCDD
-50
-30
-10
10
30
50
70
90
Cro
atia
Slo
ve
nia
Ro
ma
nia
Bo
sn
. He
rz.
Mo
nte
ne
gro
Alb
an
ia
Ma
ce
don
ia
Se
rbia
Bu
lga
ria
Gre
ece
Tu
rke
y
Cyp
rus
Re
st E
uro
peD
ep
ositio
n re
du
ctio
n (%
)
B[a]P PCDD
24
region, which is mostly affected by the emission changes in the EU countries (Gusev et al., 2013).
Further improvement of the evaluation of POP pollution levels in the EECCA and SEE countries
requires the refinement of information on their emissions.
B[a]P PCDD HCB
Figure 2.10 Deposition fields of B[a]P, PCDD and HCB in EECCA and SEE countries in 2011 Source:
EMEP/MSC-East.
Polycyclic Aromatic Hydrocarbons (PAHs). Model assessment indicates that PAH pollution
represented by B[a]P decreased by 30% from 1990 to 2011 in the EMEP region (Gusev et al., 2013).
The highest decline was computed for the EU countries (almost 40%). Reduction of B[a]P pollution
levels was more significant during the 1990s. Pollution by PAHs varies considerably in the EECCA
and SEE countries (Figure 2.10). In 2011, the highest levels of B[a]P deposition were computed for
the western part of the region. Between 1990 and 2011, the highest reductions in B[a]P deposition
were reported for the south-western part of the Russian Federation and the border with the Ukraine,
Armenia, Cyprus and Albania. A slight increase in the B[a]P deposition was calculated for many
eastern parts of the EECCA region (Gusev et al., 2013).
Polychlorinated dibenzo-p-dioxins and dibenzofurans (PCDD/Fs). Complex assessment of
PCDD/F pollution in the EMEP countries is currently hampered by the absence of regular
measurements of PCDD/Fs at the EMEP monitoring sites (Gusev et al., 2013). According to model
assessments, PCDD/F pollution levels in the EMEP region decreased from 1990 to 2011 by 55%.
Similar to PAHs, the highest decline was indicated for the EU countries (75%). The highest deposition
of PCDD/Fs in 2011 was computed for SEE countries and the south-western part of the EECCA
region. Relatively low concentrations were computed for large areas of the EECCA region (Figure
2.10). For PCDD/Fs, the decrease in deposition in the EECCA and SEE region is generally higher
than for PAHs (Figure 2.9).
Hexachlorobenzene (HCB). HCB is a pollutant of global dispersion with significant potential to
cycling between the environment compartments (Gusev et al., 2013). Modelling of HCB global
transport and accumulation in the environment, performed on the basis of the scenario of historic and
contemporary HCB emissions, indicated significant decline of HCB pollution within the EMEP region
from 1990 to 2011 by almost 90%. In 2011, elevated deposition of HCB can be seen in areas with
historic emissions, which led to substantial accumulation of HCB in the soil. The highest levels of HCB
were generally computed for the Russian Federation, especially in the north-east, and the western
part of the EECCA and SEE region (Figure 2.10).
2.5.3 POPs concentrations in mosses
Although mosses can also be used as biomonitors of atmospheric POPs pollution (Harmens et al.,
2013a), the concentration of polycyclic aromatic hydrocarbons (PAHs) have only been determined at
selected sampling sites in Slovenia in 2010 (Harmens et al., 2013b) and not in any other EECCA or
SEE country taking part in the European moss survey. PAHs concentration in mosses in Slovenia
were of a similar magnitude as those found in mosses sampled in Norway and were much lower than
those reported for France, Spain (Navarra region) and Switzerland.

25
3. Concentrations and effects of air pollutants on vegetation in
South-East Asia
Lisa Emberson, Joanne Morris, Patrick Büker, Harry Harmens, Gina Mills
3.1 Background
This review provides information describing current knowledge on concentrations, deposition and
vegetation impacts of a number of air pollutants identified as particularly important across the South-
East Asian region. This region encompasses the eight Malé Declaration countries: Bangladesh,
Bhutan, India, Iran, Maldives, Nepal, Pakistan and Sri Lanka. The pollutants investigated are ozone
(O3); nitrogen species (oxidised (NOx) and reduced (NHy) forms that impact both as toxic gases as
well as via deposition leading to soil acidification); aerosols (with a special focus on black carbon
(BC)) and heavy metals (with a special focus on lead (Pb), cadmium (Cd), iron (Fe), zinc (Zn), nickel
(Ni) and mercury (Hg)). This report provides new data from that presented in a previous ICP
Vegetation food security report (Mills and Harmens, 2011) which had collated data up to 2010,
focussing on O3.
Since the late 1990s, emissions of air pollutants have increased rapidly in Asia due to enhanced
industrialisation, which is directly linked to continued strong economic growth of about 10% in China
and India. Although legislation has attempted to curb emissions from the transport and power plant
sector, emissions continue to grow, with the Asian contribution to the global emissions of SO2 and
NOx increasing from 30 and 20% at the beginning of the 1990s to 50 and 35% in 2005, respectively
(WMO/UNEP, 2011). Emissions in Asia make up a substantial fraction of the global emissions for all
pollutants, with China responsible for 60 to 80% of all ‘North-East Asia, South-East Asia and the
Pacific’ emissions. A number of reviews of emissions from the Asian region (often focussing on the
main polluters, India and China) have been published recently (Cofala et al., 2007; Fang et al., 2010;
Klimont et al., 2009; Wu et al., 2007) and scientists are starting to make good use of remote sensed
data to verify emission inventory work and models (Klimont et al., 2009).
3.2 Emission sources
The following sectors were identified as main emitters of key air pollutants:
NOx. Power plants and road transport. Economic growth is accompanied by strong growth in vehicle
mileage and freight transport volumes with transport demand in Asia expected to increase by a factor
of 4-5. The emission control legislations present in most Asian countries will limit growth in Asian NOx
emissions by no more than 45 to 50% by 2030. In South Asia, NOx emissions are expected to
increase from 6 Tg NO2 yr-1
in 2000 to 10 Tg NO2 yr-1
in 2030 according to current legislation
scenarios (Cofala et al., 2007).
Volatile Organic Compounds (VOCs, including methane - CH4). The absence of widespread
mitigation policies together with the projected economic growth indicates approximately 50% higher
emissions of CH4 for 2030 compared to 2000 (Cofala et al., 2007). In South Asia, CH4 emissions are
expected to increase from 35 Tg CH4 yr-1
in 2000 to 47 Tg CH4 yr-1
in 2030 according to current
legislation. Increases are expected from all sectors except from the use of solid biomass for energy
purposes.
Carbon monoxide (CO). CO is emitted whenever fossil fuels and vegetation are incompletely
combusted, whether in residential stoves, industrial boilers, vehicles or through biomass burning. CO
emissions have been declining globally due to a decoupling from economic growth with declining use
of coal and fuel wood in domestic small stoves and the use of three-way catalysts (Cofala et al.,
2007). In South Asia, CO emissions are expected to decrease from 61 Tg CO yr-1
in 2000 to 52 Tg
CO yr-1
in 2030 according to current legislation scenarios (Cofala et al., 2007).

26
Ammonia (NH3). No data could be found describing NH3 emissions specifically for South Asia (or
South Asian countries). More general studies investigating across Asia suggest that animal excreta is
the main source of NH3 emissions across the region (WMO/UNEP, 2011).
BC and organic carbon (OC). The main sector currently contributing to both BC and OC emissions
is biomass burning in the residential sector (Klimont et al., 2009). BC emissions are expected to
remain relatively stable in South Asia with values of 0.8 Tg C yr-1
in 2000 compared with 0.7 Tg C yr-1
in 2030 according to current legislation scenarios (Cofala et al., 2007). This is mainly due to the
increase in road transport and likely continued reliance on traditional cooking and heating appliances
and practice of crop residue burning up to 2030 in this region. OC emissions are likely to decrease
rather more substantially in South Asia with values of 1.9 Tg C yr-1
in 2000 compared to 1.0 Tg C yr-1
in 2030 according to current legislation scenarios (Cofala et al., 2007).
Sulphur dioxide (SO2). Emissions from power plant emissions account for over 50% of all SO2
emissions (Klimont et al., 2009). SO2 emissions across the whole of Asia are expected to grow by a
factor of 2–3 due to the large increase in coal use for power generation without adequate pollution
control. In South Asia, SO2 emissions are expected to increase from 7 Tg SO2 yr-1
in 2000 to 22 Tg
SO2 yr-1
in 2030 according to current legislation scenarios (Cofala et al., 2007).
Heavy metals. A recent review by Fang et al. (2010) provides details of atmospheric metallic element
pollution in Asia over the past decade. Most studies were conducted in East Asia though the
contribution sources that occur most often will be relevant for the whole of Asia. The study found that
the combustion of waste and fuel generates particulate matter such as Pb, Cd, and Cr; higher
concentrations of Pb were often related to high vehicle emissions close to the measurement site.
Calcium (Ca), magnesium (Mg) and manganese (Mn) indicate construction materials as sources,
while aluminium (Al), potassium (K), tin (Ti) and Mn indicate sources from wind-blown soils. Metallic
element concentrations of Cd, Mn, Ni and Zn were significantly higher at industrial sites and are
attributed to the pyrometallurgical processes (Pb and Zn smelters, non-ferrous metal industries, etc.).
Analysing Hg flows in India, Burger Chakraborty et al. (2013) found coal power plants to be the
predominant source of mercury emitted to the air, followed by metal production, mainly Zn. Other Hg
sources are consumer products (e.g. lamps, dental amalgam) and the chlor-alkali industry.
3.3 Atmospheric concentration and deposition
This section provides some details of either monitored or modelled data of pollutant concentrations
(O3, N deposition, atmospheric aerosol and heavy metals) in South-East Asia and gives an indication
of the magnitude and extent of pollutant concentrations across the region, together with the level of
risk from each pollutant region-wide.
3.3.1 Ozone
Despite being a main polluter, monitored data from rural locations are relatively sparse across India
and are often measured by individuals (i.e. not part of a co-ordinated monitoring campaign). A number
of recent modelling studies have reviewed these ad hoc monitoring data in an effort to assess the
accuracy of photochemical models used in risk assessment. These comparisons tend to focus on
seasonal variation (Avnery et al., 2011; Van Dingenen et al., 2009) though one study also looked at
diurnal variation (Engardt, 2008) in terms of capturing profiles of O3 concentrations at locations across
the region. An example of such comparisons is provided in Figure 3.1.
Most of these studies conclude that i) the seasonal O3 profile is captured reasonably well; ii) O3
concentrations tend to be overestimated, especially in Northern India. For example, Avnery et al.
(2011) reported that the O3 concentrations simulated by MOZART-2 in northern India were
significantly overestimated by ca. 10-18 % throughout the year. The greater overestimates in North
India may be due to the use of measured urban O3 data for these comparisons that will tend to be
lower than concentrations in rural areas. Other reasons may be due to modelled data often
representing a specific height above the ground surface, e.g. Van Dingenen et al. (2009) used
modelled data at a height of 30 and 10 m for the comparison, which is likely to overestimate
concentrations compared to crop height. The data from Engardt (2008) shows the model tendency to

27
overestimate night time O3 concentrations which may be a consequence of models struggling to
represent stable conditions when O3 would be expected to be titrated out of the atmosphere by
reactions with NOx or via deposition. Similar night time overestimations were also found in modelled
vs. observed comparisons performed by Mittal et al. (2007) with the HANK model.
Figure 3.1 Comparisons of annual monthly mean surface ozone concentrations with modelled estimates
based on the TM5 model for North India and South India (Reproduced from Van Dingenen et al., 2009). Dots and error bars indicate observed data, solid lines modelled data at a height of 30 m and dashed lines modelled data at a height of 10 m.
Figure 3.2 Modelled monthly mean ozone concentrations for February to May 2000 across the south
Asian region using the HANK model (N.B. values given in ppb v; reproduced from Mittal et al., 2007).
In spite of these model limitations, the picture provided is of peak diurnal O3 concentrations around
midday often extending into late afternoon and during the months of October through to April. The

28
depression in seasonal O3 concentrations during the monsoon period (around July to September) is
also captured reasonably well in most models. Despite dissimilarities of, for example, the MATCH
model (Engardt, 2008) and the HANK model (Mittal et al., 2007) regarding the absolute O3
concentrations per region, both models show that the spatial pattern differs seasonally and that
Northern India (and the corresponding South Asian region) tend to show higher O3 concentrations
than in South India (Figure 3.2), most likely due to a higher density of industrial and urban emissions
in the north and ocean influenced atmospheric circulation patterns in the south. Hence, the models
provide a useful indication of the geo-spatial extent of O3 concentrations across the South Asian
region.
Figure 3.3 Spatial distribution of (a) 90 days AOT40, (b) 75 days AOT40, (c) POD6, and (d) POD12 over
the study domain for the years 2000 (left) and 2020 (right; reproduced from Tang et al., 2013).

29
Recently, studies have begun to focus on estimating metrics that relate O3 concentrations to plant
damage. Engardt (2008) and Mittal et al. (2007) both used the AOT40 index to characterize O3
concentrations across the region. Both studies found AOT40 to exceed the critical level of 3 ppm h for
crops set by the UNECE LRTAP Convention (LRTAP Convention, 2011) across many parts of India
and particularly during the period March to May inclusive.
More recently, studies have also investigated the flux based metric (PODY; Mills et al., 2011b). Tang
et al. (2013) simulated surface O3 concentrations and evaluated O3-induced wheat production loss in
China and India for the years 2000 and 2020 using dose–response functions based on AOT40 and
PODY. Two O3 dose metrics (90 days AOT40 and POD6 - Pleijel et al., 2007) were derived from
European experiments, and the other two (75 days AOT40 and POD12 - Feng et al., 2012) were
adapted from Asian studies (Figure 3.3). The AOT40 metrics indicated greater O3 exposure in
central-eastern China, the Pearl River Delta and Tibet for China, and around the northernmost
regions, Indo-Gangetic Plain, and mega cities for India. With large future increases in O3
concentrations, some areas in the Yangzi River Delta and the most northern part of India will
experience more than 15 ppm h for 90 days AOT40 in 2020. The spatial distribution for POD12 is
similar to that of AOT40 as the effect of temperature on opening of the leaf pores is not considered
(Tang et al., 2013). POD6 is close to zero in the Tibetan plateau, but elevated in southern and central
India due to stomatal closure in cold climates and opening in warm climates, respectively.
3.3.2 Nitrogen
Similar to the situation for O3, the Indian and south Asian region has not had a comprehensive
systematic network to monitor deposition fluxes of N species. The ‘Composition of the Atmospheric
Deposition’ (CAD) program was an effort to study wet and dry deposition in Asia focusing upon quality
of data (www.sei-international.org/rapidc/networks-cad.htm). The CAD programme results highlighted
the deposition of nitrate and ammonia at rural and urban sites in India (Kulshrestha et al., 2005). In
India, most of the rainfall occurs during the monsoon period (June–September) and the remaining
period is dominated by dry weather conditions. Even during monsoons, there are gaps of several
days when it does not rain. Thus, the importance of dry deposition of atmospheric constituents in the
Indian region should not be overlooked. Indeed, according to Kulshrestha et al. (2005), dry deposition
of gaseous ammonia is more significant than its wet deposition in India.
Figure 3.4 Concentration (μeq l-1
) of ammonium (NH4+; left) and nitrate (NO3
-; right) in rain in India. Data
from measurements at rural and suburban (underlined) sites obtained with bulk (black) and wet only (red) collectors compared with the concentration field with the MATCH model for the year 2000 (reproduced from Kulshrestha et al., 2005).
Unfortunately, not many reports are available on dry deposition in India. Among the limited studies
available, most of these consider dust fall as dry deposition without differentiating dry deposition of
gases and particles. Figure 3.4 shows the ammonium (NH4+) and nitrate (NO3
-) concentration in
rainwater in India in comparison with the concentration fields obtained with the Match model for the

30
year 2000. In an estimate based on EMEP dry deposition velocities, Singh et al. (2001) found that dry
deposition of NH4+ was 9 times more significant than wet deposition at Agra. Wet deposition of NH4
+
has been reported as 3.4 kg ha−1
yr−1
as compared with 39 kg ha−1
yr−1
of dry deposition.
3.3.3 Atmospheric aerosols
Rather than characterising concentrations for specific aerosol classes, e.g. BC, OC, sulfates etc., for
which information – often only for short periods of time - is typically available for some South Asian
cities only (e.g. Dutkiewicz et al., 2009; Rengarajan et al., 2007), here the focus will be on the aerosol
optical depth (AOD) as a measure for assessing the total load of atmospheric aerosols of a particular
area. As such AOD represents the sum of aerosols of different provenances (e.g. urban haze, smoke,
(sand) dust, sea salt) distributed within a column of air ranging from the top of the atmosphere to the
ground surface or vegetated canopy. The higher the AOD value, the higher the aerosol load; and the
higher the aerosol load, the lower the visibility as well as the solar radiation reaching the ground
surface. Remer et al. (2008) published a global study of modelled AOD based on daily MODIS
(Moderate Resolution Imaging Spectroradiometer) aerosol products. South Asia exhibits especially
high AOD values frequently exceeding a value of 0.4 during the northern summer, with an annual
mean of approx. 0.34.
Table 3.1 Reported aerosol optical depth (AOD) values for South Asia.
Location AOD (average for indicated period)
Comment Reference
Trivandrum, SW India 0.37 (Dec. – May) Average of multi-wavelength-radiometer (MWR) observations at four wavelengths
Krishna Moorthy et al. (2007) 0.30 (June - Aug)
0.32 (Oct. - Nov.)
Kathmandu, Nepal 0.41-0.62 (Dec. – Feb) Ground-based measurements at 500 nm
Di Girolamo (2004)
Kanpur (IGP), India 0.44-0.72 (Dec. – Feb.)
Manora Peak, Himalaya, India
0.02-0.12 (Dec. – Feb.)
Port Blair, Andaman Islands, India
0.34 (Feb.)
Bangalore, India 0.26-0.28 (Dec. – Feb.)
Anantapur, South India
0.44-0.48 (winter) Multi-wavelength-radiometer (MWR) observations at ten wavelengths
Kumar et al. (2009)
0.49-0.51 (summer)
0.28-0.46 (monsoon)
Hyderabad, India 0.65 (pre-monsoon) Ground-based measurements at 500 nm
Kaskaoutis et al. (2009) 0.46 (post-monsoon)
Visakhapatnam (AP), India
0.64 (May) Ground-based measurements at 500 nm
Niranjan et al. (2011) 0.33 (Nov.)
Kanpur (UP), India 0.57 (winter) Ground-based measurements at 500 nm
Singh (2004)
0.54 (pre-monsoon)
0.66 (monsoon)
0.63 (post-monsoon)
Dibrugarh (Assam), India
0.45 (pre-monsoon) Ground-based measurements at 500 nm
Gogoi et al. (2009)
0.19 (post-monsoon)
0.31 (winter)
Patiala (IGP), India 0.26 (March) Multi-wavelength-radiometer (MWR) observations at 500 nm
Singh et al. (2008)
0.36 (April)
0.58 (May)
Table 3.1 summarises some observed AOD values (either using remote sensing techniques or
ground-based measurements) from South Asia, averaged over different time steps varying from
months to seasons. There are large variations in AOD values, mainly due to the seasonality of
aerosol loading. It should be noted that in general ground stations measuring the loading and
speciation of aerosol are sparse in the region (Li et al., 2007). The AOD values given in Table 3.1 are

31
in agreement with various other sources (e.g. Holben et al., 1998; Kaufman et al., 2002; Badarinath et
al., 2007) that have confirmed that South Asia is a region of high AOD as compared to other regions,
due to rapid growth leading to various anthropogenic aerosol sources and the adjacency to large arid
areas (Streets et al., 2009). In particular the Indo-Gangetic Plain, South Asia’s most important
agricultural region, persistently has very high AOD values (Di Girolamo, 2004; Singh et al., 2008).
3.3.4 Heavy metals
Heavy metal deposition varies significantly according to location and season. Concentrations increase
with proximity to emission sources, and vary with type of industry or land use as well as traffic density
(Sharma et al., 2008a). Changes in climatic factors between summer, winter and monsoon seasons
affect seasonal variations in heavy metal deposition (Khillare and Sarkar, 2012; Khillare et al., 2012;
Shah et al., 2006), with concentrations of crustal metals such as Fe being higher in summer aided by
dust storms, while industrial metals such as Cd, Ni, Zn and Cr are higher in winter due to being
trapped beneath inversion layers. Rains in the monsoon season remove particles from the air,
reducing atmospheric metal concentrations. Monitoring of dry deposition of heavy metals in the area
surrounding Udaipur city, Rajasthan, India, Pandey & Pandey (2009a, 2009b) found steady increases
in Cd, Cu, Ni and Zn from 1999 to 2005, but a significant decrease in Pb, suggested to be the result of
the increasing use of unleaded fuel (Figure 3.5). In general, these values are deemed comparable to
other regions in India, attributed to urban-industrial emissions. The higher Zn values are attributed to
a nearby zinc smelter and mining.
Figure 3.5 Temporal trends (1999 – 2005) in annual deposition of heavy metals in Udaipur, Rajasthan,
India (adapted from Pandey & Pandey (2009a). Note that Zn is drawn on the second axis.
Limit values and heavy metal concentrations in soil, air and plants in South Asia are shown in Table
3.2. For limit values, comparisons are shown with Canada, Europe and UK. The deposition of some
or all of the heavy metals Zn, Cu, Cd, Pb and Fe onto fruit and vegetables across India has been
found to exceed WHO and Indian national limits for safe consumption, during production (Figure 3.6 -
vegetables (Pandey and Pandey, 2009a); cereals (Pandey and Pandey, 2009b)), during transport to
markets (Sharma et al., 2009), or while being sold at the roadside in urban areas: Berhampur City,
Odisha (Adhikary, 2012); Varanasi, Uttar Pradesh (Sharma et al., 2008b)). This deposition comes
predominantly from traffic and industrial emissions during production, traffic emissions during
transport from farms to market, as well as urban traffic and industrial emissions while being sold.
53.2 63.0
172
220
59.2 73.0
261
85.8
575
613
300
350
400
450
500
550
600
650
0
50
100
150
200
250
300
1998 1999 2000 2001 2002 2003 2004 2005 2006
Zin
c d
ep
osi
tio
n (
g h
a-1
yr-1
)
Me
tal d
ep
osi
tio
n (
g h
a-1
yr-1
)
Year
Cd
Cu
Ni
Pb
Zn

32
Table 3.2 Limit values and recorded heavy metal concentrations in soil, air and plants in South Asia. For
limit values, comparisons are shown with Canada, Europe and UK.
Metal Limit in agric soil (µg g
-1)
Min-max Pakistan (Ishaq et al., 2013)
Mean(max) Varanasi, IN (Sharma et al., 2009)
Limit in plants (µg g
-1)
(Nagajyoti et al., 2010)
ppm min-max (Ishaq et al., 2013)
min-max Pakistan (Hussain et al., 2005)
min-max Uttar Pradesh (R. Bajpai et al., 2010a)
Cd 1.4 (CA)1
1.8 (UK)2
3-6 (IN)(Nagajyoti et al., 2010)
0 - 1.89 1.27 (2.3) 1.5 0-0.41
Pb 70 (CA) 250-500 (IN)
4.23 - 16.24 6.4 (10.3) 2.5 0.74-12.19
0.02 - 0.2 0.5 - 9.3
Fe 19.05-60.03 2.36-45.10
18.23 - 62.24
206-1500
Zn 200 (CA) 300-600 (IN)
32.95 - 59 109 (133) 50 2.39-31.25
0.97 - 2.24 7.8 - 60
Ni 50 (CA) 75-150 (IN)
4.21 - 18.01 1.5 1.05-5.08
0.13 - 0.43 0.6 - 18.3
Cr 64 (CA) 1.84-2.95 20 0.07-1.10
0.09 - 0.94 0.93 - 12.1
Limit in air (ng m
-3)
3
(ng m-3
)
Mashhad, Iran
(Pourkhabbaz
et al., 2010)
mean(max) ng m
-3
Islamabad (Shah et al., 2006)
mean ng m
-3
Tehran (Shah et al., 2006)
mean ng m
-3
Delhi (Shah et al., 2006)
mean ng m
-3 Dhaka
(Shah et al., 2006)
mean(max) ng m
-3 Ahvaz, Iran
(Burger Chakraborty et al., 2013)
Cd 5 2 (17) - 6.7 2.51
Pb 500 98.2 - 7.5 210 (4075) 1020 380 279
Fe 930 (5979) 2230 5220 24800
Zn 4.8 - 2.0 542 (2350) 327 801
Ni 20 31.2 - 24.0 9 (157) 37 97
Cr 49.6 - 9.3 42 (398) 48 104
Hg 20.7 (48.6)
India Air Quality Guidelines (µg m
-3)
4 annual
(24hr)
min-max (peak) Varanasi (Pandey and Pandey, 1994)
Min-max: Uttar Pradesh (Agrawal and Singh, 2000)
(Pandey, 2005)
Ozone 100(180) 16 - 48 (30 - 149)
SO2 50(80) 15 - 79 (39 - 238)
48-233 Avg: 15 - 86 Peak: 27 - 191
NO2 40(80) 19 - 59 (42 - 159)
PM10 60(100) (TSP) 126-336 (215-1056)
CA - Canada; IN - India; UK - United Kingdom 1 Canada: Canadian Environmental Quality Guidelines (http://ceqg-rcqe.ccme.ca/)
2 UK: http://www.environment-agency.gov.uk
3 Europe: http://ec.europa.eu/environment/air/quality/standards.htm
4 India: India Air Quality Guidelines (http://cpcb.nic.in/National_Ambient_Air_Quality_Standards.php)

33
Figure 3.6 Heavy metal concentrations (μg g−1
dry wt) relative to the Indian safe limit in edible parts of
vegetables grown outdoors in Udaipur, Rajasthan (adapted from Table 5, Pandey & Pandey (2009a)); Concentrations relative to the safe limit as per the Prevention of Food Adulteration Act 1954.
3.4 Effects on vegetation
This section provides data describing site-specific pollutant effects on vegetation. Data were searched
for using a variety of search terms that included the pollutant, the countries of the South Asian region
and a reference to vegetation damage. These searches only found site-specific data for O3 (Table
3.3) and heavy metal (Table 3.4) impacts. The tables provide details of the study reference, the
pollutant in question, the site location, the land use type (e.g. field, forest, proximity to road traffic
highways etc.), the year the study was performed, the plant species investigated, the pollutant
concentration levels involved in the study, the plant response (damage parameter and magnitude)
and any other information that was considered relevant.
3.4.1 Ozone impacts
Food security of many countries of South Asia is under threat due to the rapidly increasing population,
industrialisation and economic growth. In Asia there are currently no air quality standards to protect
agriculture from ground level O3. Knowledge on the impacts of O3 on crops in South Asia was recently
presented in Mills and Harmens (2011) and updated here. From studies mainly conducted in Europe
and the USA, it is clear that many of the staple foods in the region are either sensitive or moderately
sensitive to O3, including maize, rice, soybean and wheat (Mills et al., 2007). The majority of studies
conducted in South-East Asia report on the impacts on crop yield, although some studies also report
on visible leaf injury. For example, Ahmad et al. (2013) reported 30-70% foliar injury to crop species
(onion, potato, cotton) in Pakistan. Agrawal (2006) reported an increase in leaf injury from 8 to ca.
30% on tobacco along a transect away from the urban area of Varanasi, India. Evidence of the
impacts of O3 on crop yield in South-East Asia is mainly available from chemical protectant and air
filtration and fumigation studies (Mills and Harmens, 2011). Data show that in India and Pakistan yield
losses due to O3 are frequently in the range of 10 to 20%, and occasionally more than 50% (Mills and
Harmens, 2011). It should be noted that most of these studies were conducted at one site in India
(Varanasi) and one site in Pakistan, close to Lahore. With O3 concentrations predicted to rise in the
future in South-East Asia, higher yield reductions are to be expected (see Section 3.3.1).
Since the Mills and Harmens (2011) report, most new experimental studies of O3 impacts are from
India and use filtration open top chamber (OTC) methods investigating a range of grain and vegetable
crop species (rice, mustard seed, linseed, wheat, vegetables; Table 3.3). The results broadly agree
with global modelling assessments of estimated O3 damage to crops, showing reduced yield and seed
quality with higher O3 concentrations. Yield reductions of 20-35% have been recorded across species
when comparing yield under ‘clean’ (filtered) air with ambient O3 concentrations (Table 3.3). It was
also found that increasing CO2 concentrations mitigate the impact of O3 (Singh et al., 2013; Mishra et
al., 2013). A 40-50% reduction in oil production was recorded in linseed (Tripathi and Agrawal, 2013);
0
1
2
3
4
5
6
7
8
Tomato Eggplant Spinach Amaranthus Carrot Radish
Re
lati
ve m
eta
l co
nce
ntr
atio
n
Cd Cu Ni Pb Zn Safe limit
34
in mustard seeds, Singh et al. (2013) recorded a 20% reduction in oil content and 8% reduction in
protein, which was enhanced by higher CO2 concentration.
Modelling-based studies to assess the extent and magnitude of O3 risk to agriculture in Asia suggest
that yield losses of 5–20% for important crops may be common in areas experiencing elevated O3
concentrations (Mills and Harmens, 2011). Using a concentration-based approach, the highest
relative yield losses for wheat are observed in India and China: present day losses for wheat are
possibly up to 19% for China and 28% for India (Van Dingenen et al., 2009). The relative losses for
rice is significantly higher in India (6–8%) than in the other regions (<5%). For soybean, high relative
losses are found in China (11–21%). In terms of weight, wheat is by far the most affected crop: Van
Dingenen et al. (2009) estimate a possible loss between 45 and 82 million metric tons globally, of
which 30% occurs in India and 25% in China. Production losses for rice, maize and soybean are of
the order 17–23 million metric tons globally. India and China account for 47% and 37% respectively of
the rice production losses. The high losses obtained for India have to be considered with care,
considering the large discrepancy between modelled and measured ozone concentrations in
Southern India. Present day economic losses for China and India are estimated between $3 and $6
billion each. China and India each account for about 20% of the global economic damage. In many
South-East Asian countries the relative yield losses are predicted to rise by 2030 (Van Dingenen et
al., 2009).
The above-mentioned assessments have relied on European and North American dose–response
relationships based on AOT40 and hence assumed an equivalent Asian crop response to O3 for local
cultivars, pollutant conditions and climate. However, comparison of the Asian data with European and
North American dose-response relationships show that, almost without exception, Asian crops have a
higher sensitivity to equivalent O3 concentrations. Hence, Asian crop yield and economic loss
assessments made using North American or similar European based dose-response relationships
may underestimate the damage caused by ozone (Emberson et al., 2009). As such, there is an urgent
need for co-ordinated experimental field campaigns to assess the effects of ozone across South-East
Asia (and the rest of Asia) to allow the development of dose-response relationships for Asian cultivars
and growing conditions leading to improved quantification of current and future impacts.
Tang et al. (2013) compared the flux-based and AOT40 based approach, using both European and
Asian parameterisations (see Section 3.3.1 and Figure 3.3). They estimated relative yield loss (RYL)
of wheat in 2000 to be 6.4–14.9% for China and 8.2–22.3% for India. POD6 predicted greater RYL,
especially for the warm regions of India, whereas the 90 days AOT40 gave the lowest estimates. For
the future projection, all the O3 dose metrics gave comparable estimates of an increase in RYL from
2000 to 2020 in the range 8.1–9.4% and 5.4–7.7% for China and India, respectively. The lower
projected increase in RYL for India may be due to conservative estimation of the emission increase in
2020. Sensitivity tests of the model showed that the PODY-based estimates of RYL are highly
sensitive to perturbations in the meteorological inputs, but that the estimated increase in RYL from
2000 to 2020 is much more robust. The projected increase in wheat production loss in China and
India in the near future is substantially larger than the uncertainties in the estimation and indicates an
urgent need for curbing the rapid increase in surface O3 concentrations in this region.
3.4.2 Heavy metal impacts
While many heavy metals are essential nutrients to plant growth in small quantities, they are toxic at
many of the higher concentrations reported in soils across South Asia (Table 3.4), inhibiting growth,
causing chlorosis, and in some cases death (Nagajyoti et al., 2010). Laboratory-based growth
experiments in India have shown:
Reduced growth and increased free radical production at Zn concentrations higher than 5mM
(Prasad et al., 1999);
Similar effects for Cd with 40% reduction in chlorophyll at 100 µM concentration (Somashekaraiah
et al., 1992);
Increasing concentrations of Pb (10-6
M - 0.1M) caused significant reduction in percentage
germination, shoot and root length, biomass production, and increasing inhibition of chlorophyll
and protein synthesis; concentrations above 0.01M were lethal (Datta et al., 2009).

35
Observational studies of growth response to airborne heavy metal contamination found reduced
chlorophyll a but often increased protein levels in lichen in India (Bajpai et al., 2010b; Majumder et al.,
2012; Shukla and Upreti, 2007), and stunted growth in medicinal plants in Pakistan (Hussain et al.,
2005). In sewage-sludge irrigated soils in India added Cd contamination above critical levels (25 mg
kg-1
soil) reduced yield by 20 - 54% in biomass produced for spinach, radish, coriander and fenugreek
(Mani et al., 2012). Added Pb had marginal impact on yield. The added Cd also reduced sugar and
vitamin C content of the vegetables significantly, and the leaves bioaccumulated up to 30% of the Cd
concentration in the soil. Pb has marginal impact on vitamin C and sugar content, slightly increasing
the sugar level under high Pb concentration. The accumulation of heavy metals in soils from air
deposition affects plant growth, by disrupting the soil chemistry and microbial activities (Pandey and
Pandey, 2009a, 2009b).
A number of studies investigated the role that different species could play as biomonitors. Species
found useful for biomonitoring of heavy metal concentrations in South Asia include: lichens (Bajpai et
al., 2010b; Saxena et al., 2008c); mosses (Saxena et al., 2008a,b,c; Conocarpus erectus (Gholami et
al., 2013); pollen (Kalbande et al., 2007) or cypress, silky oak or bottlebrush (Gautam et al., 2005).
Tolerant species that can be used as bioaccumulators to clean the air in urban centres have also
been identified in the literature and include different species of plane trees (Pourkhabbaz et al., 2010)
as well as Morus alba, Fraxinus excesior, Cupressus sempervirens and Ligustrum ovalifolium (Amini
et al., 2011).
3.4.3 Nitrogen and sulphur impacts
Hardly any data describing site-specific effects of N deposition were found in the literature. The
exception was a study that found a significant reduction in chlorophyll and sugar content in trees,
correlated to levels of air pollution from a coal fired power plant in Uttar Pradesh. The main air
pollutant at this location was SO2, but significant concentrations of NO2 and particulate matter were
also measured (Sharma and Tripathi, 2009). Maximum reductions of chlorophyll of 40-55% occurred
in winter, when SO2 and NO2 concentrations were highest, and minimum reductions of 20-40% in the
rainy season.
3.4.4 Aerosol impacts
Both direct and indirect effects of atmospheric aerosols on vegetation have been reported. Direct
effects include a blocking of leaf pores (stomata) due to larger aerosols (Krajívcková and Mejstvrik,
1984; Kulshreshtha et al., 1994) and a change in the quantity and quality of solar radiation reaching
the plant canopy (Steiner and Chameides, 2005). This second effect is of higher importance and
consists of the scattering and/or absorption of solar radiation due to the aerosol loading as well as the
alteration of cloud properties (Penner et al., 2001), both of which reduce the solar radiation and
photosynthetically active radiation (PAR) reaching the plant surface (Moon et al., 2009; Mercado et
al., 2009) while at the same time increasing its diffuse fraction (Twomey, 1977; Schwartz, 1996). The
blocking of stomata can have contrasting effects on the photosynthetic activity of plants depending on
the type of aerosols and plant species (Yamaguchi et al., 2014). However, the reduction in total solar
radiation/PAR usually reduces photosynthetic activity (Mercado et al., 2009; Jing et al., 2010), while
the increase in the diffuse fraction of solar radiation/PAR leads to an increased photosynthetic rate
(Mercado et al., 2009; Zheng et al., 2010). Indirect effects are mainly associated with a change in the
regional climate with knock-on effects on plant growth and yield. Rajeev and Ramanathan (2001) and
Meehl et al. (2008) showed that aerosols might have an effect on the South Asian summer monsoon
due to a change in the dynamics of the atmosphere. In addition, Takemura (2005) reported a negative
effect of anthropogenic aerosols on the precipitation amount through a change in cloud formation.
These findings are backed by an earlier study that showed how tropical aerosols can slow down the
hydrological cycle (Satheesh and Ramanathan, 2000).
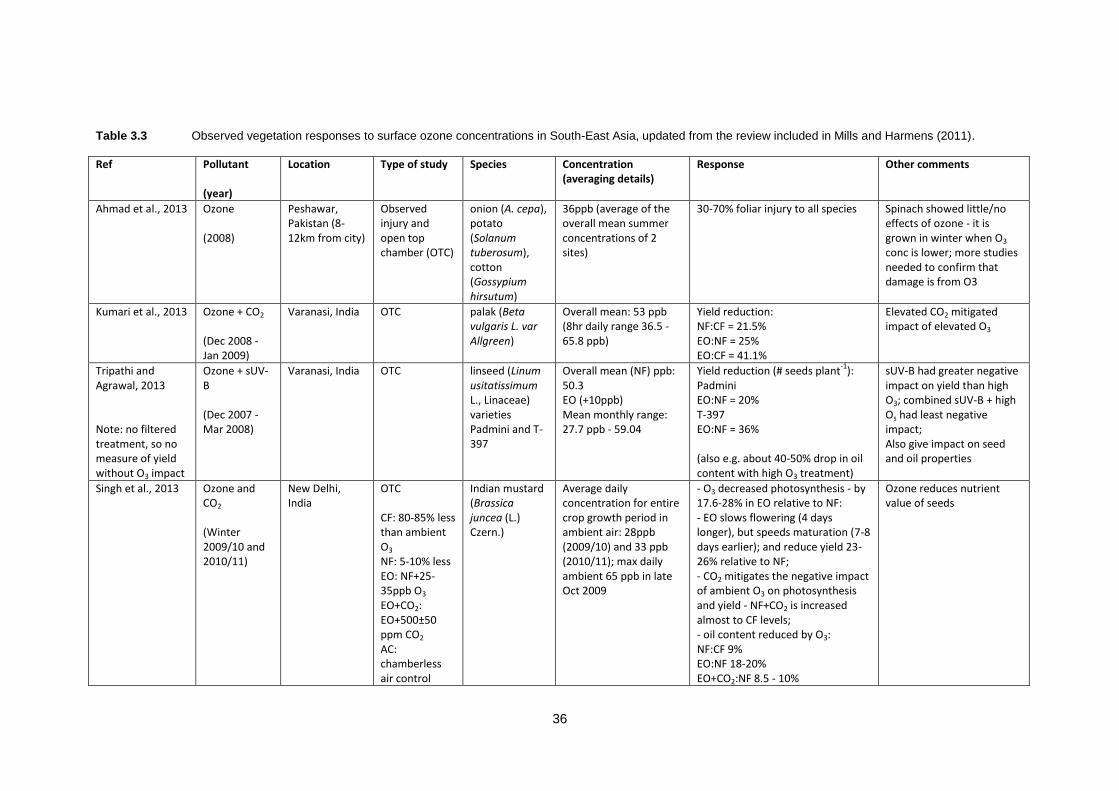
36
Table 3.3 Observed vegetation responses to surface ozone concentrations in South-East Asia, updated from the review included in Mills and Harmens (2011).
Ref Pollutant (year)
Location Type of study Species Concentration (averaging details)
Response Other comments
Ahmad et al., 2013 Ozone (2008)
Peshawar, Pakistan (8-12km from city)
Observed injury and open top chamber (OTC)
onion (A. cepa), potato (Solanum tuberosum), cotton (Gossypium hirsutum)
36ppb (average of the overall mean summer concentrations of 2 sites)
30-70% foliar injury to all species Spinach showed little/no effects of ozone - it is grown in winter when O3 conc is lower; more studies needed to confirm that damage is from O3
Kumari et al., 2013 Ozone + CO2
(Dec 2008 - Jan 2009)
Varanasi, India OTC palak (Beta vulgaris L. var Allgreen)
Overall mean: 53 ppb (8hr daily range 36.5 - 65.8 ppb)
Yield reduction: NF:CF = 21.5% EO:NF = 25% EO:CF = 41.1%
Elevated CO2 mitigated impact of elevated O3
Tripathi and Agrawal, 2013 Note: no filtered treatment, so no measure of yield without O3 impact
Ozone + sUV-B (Dec 2007 - Mar 2008)
Varanasi, India OTC linseed (Linum usitatissimum L., Linaceae) varieties Padmini and T-397
Overall mean (NF) ppb: 50.3 EO (+10ppb) Mean monthly range: 27.7 ppb - 59.04
Yield reduction (# seeds plant-1
): Padmini EO:NF = 20% T-397 EO:NF = 36% (also e.g. about 40-50% drop in oil content with high O3 treatment)
sUV-B had greater negative impact on yield than high O3; combined sUV-B + high Os had least negative impact; Also give impact on seed and oil properties
Singh et al., 2013 Ozone and CO2
(Winter 2009/10 and 2010/11)
New Delhi, India
OTC CF: 80-85% less than ambient O3 NF: 5-10% less EO: NF+25-35ppb O3 EO+CO2: EO+500±50 ppm CO2 AC: chamberless air control
Indian mustard (Brassica juncea (L.) Czern.)
Average daily concentration for entire crop growth period in ambient air: 28ppb (2009/10) and 33 ppb (2010/11); max daily ambient 65 ppb in late Oct 2009
- O3 decreased photosynthesis - by 17.6-28% in EO relative to NF: - EO slows flowering (4 days longer), but speeds maturation (7-8 days earlier); and reduce yield 23-26% relative to NF; - CO2 mitigates the negative impact of ambient O3 on photosynthesis and yield - NF+CO2 is increased almost to CF levels; - oil content reduced by O3: NF:CF 9% EO:NF 18-20% EO+CO2:NF 8.5 - 10%
Ozone reduces nutrient value of seeds

37
Ref Pollutant (year)
Location Type of study Species Concentration (averaging details)
Response Other comments
- protein content reduced by O3: EO:NF 7-8% NF:CF 13-15% inc CO2 enhances protein loss - EO+CO2:NF 12-17%
Sarkar and Agrawal, 2012
Ozone (Jun - Oct 2007)
Varanasi, India OTC Indian rice (Oryza sativa L., cultivars Malviya dhan 36 and Shivani)
Mean monthly ppb: 41.3 - 59.9 (June: 42.7; July: 41.3; Aug: 44.7; Sept: 58.2; Oct: 59.9 )
Yield reduction (weight of grains): Malviya dhan NF:CF = 14.3% EO++:NF = 28.4% EO++:CF = 38.7% Shivani NF:CF = 12.6% EO++:NF = 36.3% EO++:CF = 44.4%
Two levels of increased O3 tested (+10ppb and +20ppb). Yield reductions calculated for +20ppb
Singh et al., 2012 Ozone (Nov 2007 - Mar 2008)
Varanasi, India OTC mustard (B. campestris L.) varieties Vardan and Aashirwad
12 mean ppb: CF: 3.4 NF: 44.6 OP: 45 Monthly means in NF (Peaks): Nov: 41.6 (90), Dec: 27.7 (73), Jan: 46.3 (64), Feb: 48.6 (96), Mar: 59.04 (121)
Yield reduction (at RNPK): Vardan NF:CF = 7% Aashirwad NF:CF = 19.4%
No significant reduction at 1.5 RNPK (1.5 times the recommended NPK rate). Other growth parameters also measured
Tripathi and Agrawal, 2012 Note: no filtered treatment, so no measure of yield without O3 impact
Ozone (Nov 2010 - Mar 2011)
Varanasi, India
OTC Brassica campestris L. (cv.Sanjukta and Vardan)
Overall mean ambient (NF) ppb: 49.4 EO: ambient + 10ppb Daily mean ppb range: 26.3 (Jan) - 69.5 (Mar)
Yield reduction (# seeds plant-1
): Sanjukta EO:NF = 41% Vardan EO:NF = 46%
Accumulated AOT40 was 7371 ppbh during whole growth period of plant.
Bhatia et al., 2011 Ozone (2007 and 2008)
Indian Agricultural Research Institute (IARI),
OTC Indian rice variety Pusa Sugandh-5 (PS-5)
Mean monthly O3 (ppb, mean of two daily readings) CF: < 5ppb
2007: NF:CF = 14.4% dec yield EO:NF = 11.4% dec yield 2008:

38
Ref Pollutant (year)
Location Type of study Species Concentration (averaging details)
Response Other comments
New Delhi
EO: 59.1±4.2 ppb (2007); 69.7 ± 3.9 ppb (2008) NF: 26.2 ± 1.9 ppb (2007); 37.2 ± 2.5 ppb (2008) AA:
NF:CF = 17.9% dec yield EO:NF = 12.3% dec yield
Rai et al., 2011 Ozone Varanasi, India OTC Wheat (Triticum aestivum L.) cultivar M 533
Overall daily mean for study period (ppb): 45.1 Overall daily mean for reproductive phase (ppb): 50.2 CF: 88% reduction cf NF
O3 reduces net photosynthetic rate and gs during reproductive phase, impacting the assimilates required for grain-filling, suggesting significant negative repercussions for grain yield
Tiwari and Agrawal, 2011
Ozone (Jan-Mar 2006)
Varanasi, India
OTC Radish (Raphnus sativus L. var. Pusa Reshmi) and brinjal (Solanum melongena L. var. Pusa hybrid-6)
Eight hourly mean concentration: NF: 40.8 ppb
Radish: 18.8% reduced Ps; 54.7% reduced Cs; 20.8% reduced WUE Brinjal: 32% reduced Ps; 26.7% reduced Cs; 17.6% reduced WUE
Radish is more sensitive to ozone stress than brinjal

39
Table 3.4 Observed vegetation responses to heavy metals in South-East Asia.
Ref Pollutant Location Type of study (e.g. obser, exp (fum, filt etc.)
Species Concentration (averaging details)
Response Other comments
Rajesh Bajpai et
al., 2010b
Al, Cr, Fe, Pb, Zn (2008)
Firoz Gandhi Unchahar National Thermal Power Plant Corporation (FGUNTPC), Raebareli, Uttar Pradesh
observation Lichen (P. cocoes)
Min - max concentrations (µg g
-
1 dry weight, 15km -
5km from source): Fe: 206-1500 Al: 297 - 1630 Cr: 0.93 - 12.1 Cu: 0.9 - 9.9 Ni: 0.6 - 18.3 Pb: 0.5 - 9.3 Zn: 7.8 - 60
Reduced chlorophyll a concentration by up to 99%; up to 97.5% reduction in chlorophyll b; up to 80% reduction in total chlorophyll; protein and carotenoids increased
The lichen P. cocoes was found to be a good accumulator and therefore useful for biomonitoring
Mani et al., 2012 Cd and Pb Allahabad, India
Field experiment
Spinach Radish Coriander Fenugreek
Concentrations added to soil: Cd: 25 & 50 mg kg
-1
Pb: 250 & 500 mg kg-
1
1) Yield reduction (min-max across species): Cd: 23-54% , root growth inhibited Pb: marginal decrease 2) Vit C and sugar content: Cd (50mg kg
-1):
Up to 67% reduction Cd 50 + Pb 500 mg kg
-1:
slightly less reduction, up to 60%; but mostly Pb (500 mg kg
-1) addition increased
sugar content
Cd above critical level (25mg kg
-1 soil) impacts growth and
nutritional quality significantly. Pb even at higher doses has much less impact; leafy vegetables can bioaccumulate up to 30% of added soil Cd in leaves, and at low Cd but high Pb up to 65% of added soil Cd; very little bioaccumulation of Pb
Hussain et al., 2005
Cd, Cr, Pb, Cu, Mn, Zn, Fe
Peshawar, Pakistan
observation Milk thistle (Silybum marianum)
4 - 2 - 0km from source (mg kg
-1) in
leaves: Pb: 0.2; 0.02; 0.02 Cr: 0.09; 0.94; 0.79 Cd: not detected
32% reduced height, 10% reduced weight in plants at polluted site than 4km away (control);
Heavy metals accumulated in different amounts in various plant parts (roots, leaves, seeds, oil) and not always highest at pollution source

40
Ref Pollutant Location Type of study (e.g. obser, exp (fum, filt etc.)
Species Concentration (averaging details)
Response Other comments
Fe: 18.23; 59.85; 62.24 Cu: 0.25; 0.49; 0.72 Mn: 1.9; 5.84; 5.68 Zn: 0.97; 2.24; 1.46 Ni: 0.16; 0.43; 0.13
Mohsenzadeh et al., 2011 and Yousefi et al., 2009
Zn, Mn, Pb and Fe
Hamedan, Iran
observation Reseda lutea and Chenopodium botrys L.
Mean soil concentration (mg kg
-1):
Zn: 2672 Mn: 827 Pb: 8490 Fe: 9299
1) Abnormal pollen formation - thicker walls, irregular formation; 2) new proteins found in roots
Changes in polluted plants may be adaptations to toxic levels of metals
Prasad et al., 1999
Zn Delhi, India Growth experiment
Brassica juncea
Added concentration of zinc sulphate: 0.007, 0.05, 5 and 10 mM
Up to 0.05mM promoted growth; above 5mM significantly reduced growth, accelerated free radical generation
Increased enzyme activity towards detoxification stimulated by toxic Zn levels
Datta et al., 2009
Pb India Growth experiment
five wheat (Triticum aestivum L.) cultivars (HW 2045, HD 2733, KO307, KO 402 and HD 2954)
Added Pb concentration: 0.1M - 10
-6M
-significant reduction in % germination, shoot and root length, biomass production; Increasing inhibition of chlorophyll and protein synthesis
0.1M and 0.01M were lethal to germination and growth
Somashekaraiah et al., 1992
Cd India Growth experiment
Mung bean (Phaseolus vulgaris)
Added Cd2+
concentration: 10, 50, 100µM
52% increase in lipoxygenase activity (indicates free radical production and tissue damage); 40% reduction in chlorophyll

41
Ref Pollutant Location Type of study (e.g. obser, exp (fum, filt etc.)
Species Concentration (averaging details)
Response Other comments
production at 100 µM, 6DAG
Majumder et al., 2012
Fe, Cr, Cu, Zn, and Pb
Kolkata, India observation Lichen F. caperata (L.) Hale
Mean site values (min-max) of 5 replicates per site: Fe: 1,970 to 3,981 mgkg
−1;
Reduction in chlorophyll a with increase in Fe, Pb, Cu; MDA (membrane lipid peroxidation) increase with higher Cr, Fe, Pb; no significant difference in electrical conductivity (cell injury), but related to Fe, Cu, Pb; Zn not influencing any physiology
Lichen seen to be an efficient accumulator of Pb; Other lichen studies: (Shukla and Upreti, 2007)
Ishaq et al., 2013 Fe, Zn, Mn, Ni, Cr, Cd and Pb
Khyber Pakhtunkhwa, Pakistan
observation Herbal drug sreen (Albizia lebbeck)
Min - max (ppm) in soil across sites (no clear gradient): Fe: 19.05-60.03 Zn: 32.95-59.00 Mn: 8.94-28.28 Ni: 4.21-18.01 Pb: 4.23-16.24 Cr: 1.84-2.95 Cd: 0-1.89 Min - max (ppm) in plant across sites (no clear gradient): Fe: 2.36-45.10 Zn: 2.39-31.25 Mn: 1.03-23.89 Ni: 1.05-5.08 Pb: 0.74-12.19 Cr: 0.07-1.10 Cd: 0-0.41
Fe and Zn may be soil contamination; Mn both soil and air contamination - also below critical limits; Ni likely soil contamination from wastewater; Pb from traffic emissions - max levels exceed WHO limit of 10 ppm; Cr from air dust - far exceed FDA limit of 0.12 ppm; Cd from soil and air - max far exceed WHO limit of 0.3 ppm
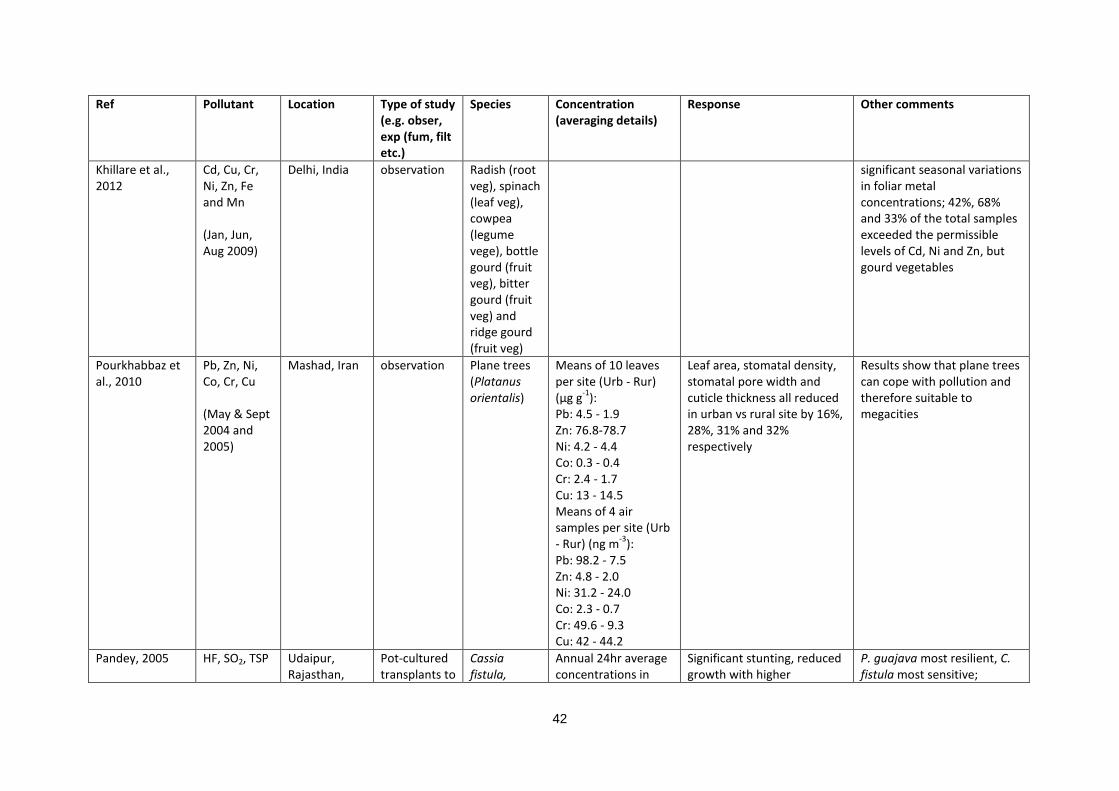
42
Ref Pollutant Location Type of study (e.g. obser, exp (fum, filt etc.)
Species Concentration (averaging details)
Response Other comments
Khillare et al., 2012
Cd, Cu, Cr, Ni, Zn, Fe and Mn (Jan, Jun, Aug 2009)
Delhi, India
observation Radish (root veg), spinach (leaf veg), cowpea (legume vege), bottle gourd (fruit veg), bitter gourd (fruit veg) and ridge gourd (fruit veg)
significant seasonal variations in foliar metal concentrations; 42%, 68% and 33% of the total samples exceeded the permissible levels of Cd, Ni and Zn, but gourd vegetables
Pourkhabbaz et al., 2010
Pb, Zn, Ni, Co, Cr, Cu (May & Sept 2004 and 2005)
Mashad, Iran
observation Plane trees (Platanus orientalis)
Means of 10 leaves per site (Urb - Rur) (µg g
-1):
Pb: 4.5 - 1.9 Zn: 76.8-78.7 Ni: 4.2 - 4.4 Co: 0.3 - 0.4 Cr: 2.4 - 1.7 Cu: 13 - 14.5 Means of 4 air samples per site (Urb - Rur) (ng m
-3):
Pb: 98.2 - 7.5 Zn: 4.8 - 2.0 Ni: 31.2 - 24.0 Co: 2.3 - 0.7 Cr: 49.6 - 9.3 Cu: 42 - 44.2
Leaf area, stomatal density, stomatal pore width and cuticle thickness all reduced in urban vs rural site by 16%, 28%, 31% and 32% respectively
Results show that plane trees can cope with pollution and therefore suitable to megacities
Pandey, 2005 HF, SO2, TSP
Udaipur, Rajasthan,
Pot-cultured transplants to
Cassia fistula,
Annual 24hr average concentrations in
Significant stunting, reduced growth with higher
P. guajava most resilient, C. fistula most sensitive;

43
Ref Pollutant Location Type of study (e.g. obser, exp (fum, filt etc.)
Species Concentration (averaging details)
Response Other comments
(2000-2001) India siteas around factory (pollutant source)
Psidium guajava and Carissa carandas
2000 (µg m-3
min-max with distance from factory): HF: 0.2 - 3.5 SO2: 15 - 86 TSP: 175 - 352
Emissions: e.g. up to 66% reduced height; foliar injury in 2
nd year only, 17-21% leaf
area damaged; mean relative growth rate reduced significantly
Impacts mainly from HF
Pandey and Pandey, 1994
SO2, NOs, O3, TSP (Jan 1989 - Dec 1990)
Varanasi, India
Observation Mangifera indica L. Psidium guajava L. Delonix regia Rafin Peltophorum pterocarpum Dalbergia sissoo Roxb Bougainvillea spectabilis, Wild Carissa carandas L
Annual 24hr average concentrations in 1990 (µg m
-3 min-
max across pollution zones) SO2: 15 - 79 NOs: 19 - 59 O3: 16 - 48 TSP: 126-336 2hr peak concentrations in 1990 (µg m
-3 min-
max across pollution zones) SO2: 39 - 238 NOs: 42 - 159 O3: 30 - 149 TSP: 215-1056
Foliar injury (highest in winter): 6 - 19% across species in highest pollution zone vs 3 - 9% in lowest zone; Up to 31 % and 36% reduced leaf area and specific leaf weight (C carandas); reduction in chlorophyll, esp chlorophyll a: 35 - 58% dec in total chloroph.
C carandas is most sensitive,
Bougainvillea is most tolerant

44

45
4. Conclusions and recommendations
Harry Harmens, Gina Mills In this report we have provided a review on the current state of knowledge on the deposition of air
pollutants to and impacts on vegetation in Eastern Europe, Caucasus and Central Asia (EECCA),
South-East Europe (SEE) and South-East Asia. In these regions, there is generally a lack of a
network of monitoring stations to assess the magnitude of air concentrations and depositions of
pollutants. In addition, emission inventories are often incomplete or not reported at all for some
pollutants, which makes it difficult to validate atmospheric transport models for these regions.
Furthermore, there is a lack of coordinated monitoring networks to assess the impacts of air pollution
on vegetation. Hence, the risk of adverse impacts on vegetation often has to be assessed using
atmospheric transport models in conjunction with metrics developed to compute the risk of air
pollution impacts on vegetation in Europe, such as critical loads and levels. Here we have focussed
on the following air pollutants: nitrogen, ozone, heavy metals, POPs (EECCA/SEE countries) and
aerosols, including black carbon as a component (South-East Asia).
4.1 Conclusions
4.1.1 Eastern Europe, Caucasus and Central Asia (EECCA)
Currently, for EECCA countries information on critical load exceedances for nutrient N is only
available for a limited number of countries. Although the percentage area of exceedance is predicted
not to change much between 2005 and 2020, the magnitude of exceedance is predicted to be
reduced by 14 (Belarus) to 33% (Russian Federation) in 2020 compared to 2005, assuming full
implementation of the revised Gothenburg Protocol. For modelling risks of adverse impacts of O3 on
vegetation, the concentration-based approach (AOT40) identifies the southern part of the EECCA
region at highest risk, whereas the biologically more relevant flux-based approach (PODY) identifies
the south-western part of the region bordering with Central Europe at highest risk. Both approaches
identify the northern part of the region at lowest risk of adverse impacts from ozone pollution. In 2011,
the highest levels of heavy metal deposition were computed for the south-western part (the Ukraine,
Belarus, Caucasus), some eastern parts of the Russian Federation and the south-eastern
(Kyrgyzstan, Tajikistan) parts of the EECCA region. As for the rest of Europe, in most EECCA
countries heavy metal deposition has declined between 1990 and 2011 for Cd, Pb and Hg, with the
highest reductions being computed for Pb. Reductions comparable to the rest of Europe were only
computed for the western part of the EECCA region (Ukraine, Moldova, Belarus, Russian Federation)
and for Pb in Kazakhstan, Uzbekistan, Turkmenistan, Kyrgyzstan and Tajikistan. Otherwise, lower
reductions were reported for EECCA countries compared to the rest of Europe. Heavy metal
concentrations in mosses have only been reported for Belarus, Russian Federation and Ukraine and
critical loads exceedance data have only been reported for Belarus, Moldova and Russian Federation.
Almost no critical load exceedance for terrestrial ecosystems effects has been reported for Cd, but for
Pb exceedances were reported for more than 40% of the area of the Russian Federation and the area
of exceedance was 100% for Hg in 2010. Model assessment indicated reduction of POP pollution in
most of the EECCA countries from 1990 to 2011, although generally lower than in the rest of Europe;
highest reductions were observed in the western part of the region. In 2011, the highest deposition for
B[a]P and PCDD were computed in the south-western part of the region, whereas HCB levels were
high for large parts of the Russian Federation.
4.1.2 South-East Europe (SEE)
Compared with Western and Central Europe, computed critical load exceedances for nutrient N have
historically been lower in SEE and this was also the case in 2010. However, large areas are still
predicted to be exceeded in 2020 with improvements since 2005 generally being lower than in
Western and Central Europe. N concentrations in mosses were found to be intermediate to high in
SEE compared to other European countries, indicating potentially a higher risk of N effects on
ecosystems than computed by the critical loads. Field-based evidence is available for O3 impacts
particularly on crops in Greece and Slovenia, with many crops species showing visible leaf injury in

46
Greece. Both AOT40 and PODY are computed to be high in SEE, indicating that this area is at high
risk of ozone damage to vegetation. Although heavy metal deposition has declined since 1990 in this
region, the decline has generally been lower than for the rest of Europe. This might explain the
relatively high concentrations of many heavy metals in mosses in countries in SEE Europe compared
to the rest of Europe in recent years (Harmens et al., 2010; 2013c). Another explanation could be the
amount of wind-re-suspension of historically deposited heavy metal in this more arid part of Europe,
as indicated by high levels of iron and aluminium concentrations in mosses in this region. High critical
load exceedances have been reported for Macedonia for Cd and Pb and for Bosnia-Herzegovina for
Pb. Widespread exceedance of the critical load for Hg has been observed in this region, similar as for
the rest of Europe. Model assessment indicated reduction of POP pollution in most of the SEE
countries from 1990 to 2011, particularly for HCB, although generally lower than in the rest of Europe.
Increases in B[a]P were computed for Serbia, Bulgaria and Greece.
4.1.3 South-East Asia (SEA; Malé Declaration countries)
Since the late 1990s, emissions of air pollutants have increased rapidly in Asia due to enhanced
industrialisation, which is directly linked to continued strong economic growth of about 10% in China
and India. Little information is available on N deposition and its impact on vegetation in SEA.
According to Kulshrestha et al. (2005), dry deposition of gaseous ammonia is more important than its
wet deposition in India. Staple food crops (maize, rice, soybean and wheat) are sensitive to
moderately sensitive to O3, threatening global food security. Recent flux-based risk assessment of O3-
induced wheat yield loss show that the relative yield loss was 6.4-14.9% for China and 8.2-22.3% for
India (Tang et al., 2013), with higher yield losses predicted for 2020, indicating the urgent need for
curbing the rapid increase in surface O3 concentrations in this region. Yield reductions of 20-35%
have been recorded for various crop species when comparing yield in clear air with current ambient
O3 concentrations. South Asia is a region with high aerosol load compared to other regions, due its
rapid growth and the arid climate. In particular the Indo-Gangetic Plain, South Asia’s most important
agricultural region, persistently has very high aerosol load, reducing visibility as well as solar radiation
reaching the surface. Reduced photosynthesis might occur as a result of reduced solar radiation and
larger aerosols blocking leaf pores, although the increase in diffuse radiation might have the opposite
effect. The deposition of many heavy metals onto fruit and vegetables across India has been found
to exceed WHO and Indian national limits for safe consumption.
4.2 Recommendations
This review highlights the lack of monitoring data regarding the deposition to and impacts of air
pollutants on vegetation in EECCA/SEE countries and South-East Asia. It would be desirable to
further enlarge coordinated networks to measure air concentrations and depositions of air pollutants,
i.e. to extend the EMEP monitoring network particularly in the EECCA region and establish a similar
network in South-East Asia, for example by extending the Acid Deposition Monitoring Network in East
Asia (EANET) by including other regions and more pollutants. International Cooperative Programmes
might consider stimulating the development of coordinated networks in these regions with the aim to
establish widespread monitoring networks assessing the impacts of air pollutants on ecosystems.
More measurement data are urgently needed to validate model outputs regarding the concentrations,
deposition and associated risk for impacts of air pollutants on vegetation. The successful
implementation of air pollution abatement policies in many other parts of Europe has highlighted the
slower progress made with some of the air pollution abatement in the Eastern Europe, the Caucasus,
Central and South-East Asia. Improvement of air quality in these regions will also benefit the rest of
Europe due to a reduction in long-range transport of air pollutants and their precursors, particularly
those of hemispheric nature such as ozone and mercury. Many air pollution issues are remaining in
the studied areas that require urgent attention, especially in regions of fast economic and population
growth, ensuring future sustainable development without significant impacts on the functionality of
ecosystems, the services they provide and food production.

47
References Aas, W., Breivik, K. (2013). Heavy metals and POP measurements, 2011. EMEP/CCC-Report 4/2013. Adhikary, S.P. (2012). Assessment of heavy metal toxicity on some vegetables and fruits sold in the streets of Berhampur City, Odisha,
India. Pollution Research 31: 601–603. Agrawal, M. (2006) Crop loss assessment under ambient air pollution around Varanasi. Project report (30-137/2004/SR) submitted to
University Grants Commission, New Delhi. Agrawal, M. and Singh, J. (2000). Impact of coal power plant emission on the foliar elemental concentrations in plants in a low rainfall
tropical region. Environmental Monitoring and Assessment 60: 261–282. Ahmad, M.N., Büker, P. et al. (2013). Effects of ozone on crops in north-west Pakistan. Environmental Pollution 174: 244–249. Ainsworth, E. A., Yendrek, C. R. et al. (2012). The effects of tropospheric ozone on net primary productivity and implications for climate
change. Annual Review of Plant Biology, 63: 637-661. Amini, H., Hoodaji, M. et al. (2011). Evaluation of some tree species for heavy metal biomonitoring and pollution tolerance index in
Isfahan urban zone. African Journal of Biotechnology 10. Arroniz-Crespo, M., Leake, J.R. et al. (2008). Bryophyte physiological responses to, and recovery from, long-term nitrogen deposition
and phosphorus fertilisation in acidic grassland. New Phytologist 180: 864-874. Ashmore, M. R. (2005). Assessing the future global impacts of ozone on vegetation. Plant Cell and Environment 28(8): 949-964. Avnery, S., Mauzerall, D.L. et al. (2011). Global crop yield reductions due to surface ozone exposure: 1. Year 2000 crop production
losses and economic damage. Atmospheric. Environment. 45: 2284–2296. Badarinath, K.V.S., Kharol, S.K. (2007). Case study of a dust storm over Hyderabad area, India: Its impact on solar radiation using
satellite data and ground measurements. Sci. Total Environ. 384: 316–332. Bajpai, R., Upreti, D.K. et al (2010a). Passive monitoring of atmospheric heavy metals in a historical city of central India by Lepraria
lobificans Nyl. Environ. Monit. Assess. 166: 477–484. Bajpai, R., Upreti, D.K., et al. (2010b). Biodiversity, bioaccumulation and physiological changes in lichens growing in the vicinity of coal-
based thermal power plant of Raebareli district, north India. J. Hazard. Mater. 174: 429–436. Bhatia, A., Ghosh, A. et al. (2011). Effect of elevated tropospheric ozone on methane and nitrous oxide emission from rice soil in north
India. Agric. Ecosyst. Environ. 144: 21–28. Bobbink, R., Hettelingh, J-P. (Eds.) (2011). Review and revision of empirical critical loads and dose-response relationships.
Proceedings of an international expert workshop, Noordwijkerhout, 23-25 June 2010. RIVM report 680359002, Bilthoven, The Netherlands.
Breivik, K., Vestreng, V. et al. (2006). Atmospheric emissions of some POPs in Europe: a discussion of existing inventories and data needs. Environmental Science and Policy 9: 663 – 674.
Burger Chakraborty, L., Qureshi, A. et al. (2013). Anthropogenic Mercury Flows in India and Impacts of Emission Controls. Environ. Sci. Technol. 47: 8105–8113.
Cofala, J., Amann, M.et al. (2007). Scenarios of global anthropogenic emissions of air pollutants and methane until 2030. Atmospheric Environment 41: 8486–8499.
Datta, J.K., Ghanty, S.et al. (2009). Impact of lead on germination physiology of certain wheat cultivars (Triticum aestivum L.). J. Ecophysiol. Occup. Health 9: 145–151.
De Zwart, D., Slootweg, J. et al. (2010). Loss of species due to cadmium and lead depositions in Europe. In: Slootweg, J., Posch, M. et al. (Eds). Progress in the modelling of critical thresholds and dynamic modelling, including impacts on vegetation in Europe. CCE Status Report 2010, Coordination Centre for Effects, RIVM, Bilthoven, The Netherlands.
Dentener, F., Stevenson, D. et al. (2006). The global atmospheric environment for the next generation. Environmental Science & Technology 40(11): 3586-3594.
Di Girolamo, L. (2004). Analysis of Multi-angle Imaging SpectroRadiometer (MISR) aerosol optical depths over greater India during winter 2001–2004. Geophys. Res. Lett. 31.
Dise, N. B., Ashmore, M. et al. (2011) Nitrogen as a threat to European Terrestical Biodiversity, page 463-494. In: Sutton, M. A., Howard, C. M. et al. (Eds.) The European Nitrogen Assessment. Cambridge University Press, Cambridge.
Dutkiewicz, V.A., Alvi, S.et al. (2009). Black carbon aerosols in urban air in South Asia. Atmos. Environ. 43: 1737–1744. EEA (2007). Air pollution by ozone in Europe in summer 2006. European Environment Agency Technical Report No 5/2007.
Copenhagen, Denmark. Emberson, L.D., Büker, P., et al (2009). Dose-response relationships derived in North America underestimate the effects of ozone (O3)
on crop yields in Asia. Atmospheric Environment 43: 1945-1953 Engardt, M. (2008). Modelling of near-surface ozone over South Asia. J. Atmospheric Chem. 59, 61–80. Fang, G.-C., Huang, Y.-L. et al. (2010). Study of atmospheric metallic elements pollution in Asia during 2000–2007. J. Hazard. Mater.
180: 115 – 121. Feng, Z., Tang, H.et al. (2012). A stomatal ozone flux–response relationship to assess ozone-induced yield loss of winter wheat in
subtropical China. Environ. Pollut. 164: 16–23. Fumagalli, I., Gimeno, B. S. et al. (2001). Evidence of ozone-induced adverse effects on crops in the Meditteranean region. Atmospheric Environment 35: 2583-2587. Gautam, P., Blaha, U. et al. (2005). Magnetic susceptibility of dust-loaded leaves as a proxy of traffic-related heavy metal pollution in
Kathmandu city, Nepal. Atmos. Environ. 39: 2201–2211. Gholami, A., Davami, A.H.et al. (2013). Evaluation of “Conocarpus erectus” Plant as Biomonitoring of Soil and Air Pollution in Ahwaz
Region. Middle-East J. Sci. Res. 13: 1319–1324. Gogoi, M.M., Krishna Moorthy, K.et al. (2009). Climatology of columnar aerosol properties and the influence of synoptic conditions:
First‐time results from the northeastern region of India. J. Geophys. Res. 114. Gusev, A., Rozovskaya, O. et al. (2013). Persistent organic pollutants in the environment. EMEP Status Report 3/2013. Harmens, H., Foan, L. et al. (2013a). Terrestrial mosses as biomonitors of atmospheric POPs pollution: A review. Environmental
Pollution 173: 245-254. Harmens, H., Ilyin, I. et al. (2012a). Country-specific correlations across Europe between modelled atmospheric cadmium and lead
deposition and concentrations in mosses. Environmental Pollution 166: 1-9. Harmens, H., Mills, G. (2012). Ozone pollution: Impacts on carbon sequestration in Europe. Programme Coordination Centre for the ICP
Vegetation, Centre for Ecology and Hydrology, Bangor, UK. ISBN 978-1-906698-31-7. Harmens, H., Mills, G. et al. (2005). Air pollution and vegetation. ICP Vegetation annual report 2004/2005. Programme Coordination
Centre for the ICP Vegetation, Centre for Ecology and Hydrology, Bangor, UK. ISBN: 1-870393-80-5. Harmens, H., Mills, G. et al. (2012b). Air pollution and vegetation. ICP Vegetation annual report 2011/2012. Programme Coordination
Centre for the ICP Vegetation, Centre for Ecology and Hydrology, Bangor, UK. ISBN: 978-1-906698-35-5. Harmens, H., Mills, G. et al. (2013b). Air pollution and vegetation. ICP Vegetation annual report 2012/2013. Programme Coordination
Centre for the ICP Vegetation, Centre for Ecology and Hydrology, Bangor, UK. ISBN: 978-1-906698-43-0. Harmens, H., Norris, D.A. et al. (2010). Mosses as biomonitors of atmospheric heavy metal deposition: spatial and temporal trends in
Europe. Environmental Pollution 158: 3144-3156.

48
Harmens, H., Norris, D. A. et al. (2011). Nitrogen concentrations in mosses indicate the spatial distribution of atmospheric nitrogen deposition in Europe. Environmental Pollution 159: 2852-2860.
Harmens, H., Norris, D. et al. (2013c). Heavy metals and nitrogen in mosses: spatial patterns in 2010/2011 and long-term temporal trends in Europe. ICP Vegetation Programme Coordination Centre, CEH Bangor, UK. ISBN: 978-1-906698-38-6.
Hayes, F., Mills, G. et al. (2007). Evidence of widespread ozone damage to vegetation in Europe (1990 – 2006). Programme Coordination Centre of the ICP Vegetation, Centre for Ecology and Hydrology, Bangor, UK. ISBN 978-0-95576-721-0.
Hettelingh, J.-P., Posch, M. et al. (2012). In: Posch, M., Slootweg, J. et al. (Eds.). Modelling and mapping of atmospherically-induced ecosystem impacts in Europe. CCE Status Report 2012, RIVM Bilthoven, The Netherlands.
Hettelingh, JP, Sliggers, J (Eds.) (2006). Heavy Metal Emissions, Depositions, Critical Loads and Exceedances in Europe. Ministry of the Environment VROM DGM, Netherlands.
Hjellbrekke, A.-G., Fjæraa, A.M. (2013). Data report 2011: Acidifying and eutrophying compounds and particulate matter. EMEP/CCC-Report 2/2013.
Hjellbrekke, A.-G., Solberg, S., Fjæraa, A.M. (2013). Ozone measurements 2011. EMEP/CCC-Report 3/2013. Holben, B.N., Eck, T.F. et al. (1998). AERONET—A federated instrument network and data archive for aerosol characterization.
Remote Sens. Environ. 66: 1–16. Hussain, I., Khan, L.et al. (2005). Effect of heavy metals on the growth and development of Silybum marianum, in various polluted areas
of Peshawar, Pakistan. J. Chem. Soc. Pak. 27: 367–373. Ilyin, I., Rozovskaya, O. et al. (2013). Heavy metal transboundary pollution of the environment. EMEP Status Report 2/2013. Ishaq, M., Rehman, A. et al. (2013). Comparative study of heavy metals in Albizia lebbeck, collected from different environmental sites.
Int. J. Pharm. Sci. Rev. Res. 20: 5–9. Jenkin, M. E. (2008). Trends in ozone concentration distributions in the UK since 1990: Local, regional and global influences.
Atmospheric Environment 42(21): 5434-5445. Jing, X., Huang, J. et al. (2010). The effects of clouds and aerosols on net ecosystem CO<sub>2</sub> exchange over semi-
arid Loess Plateau of Northwest China. Atmospheric Chem. Phys. 10: 8205–8218. Jones K.C. and De Voogt, P. (1999). Persistent organic pollutants (POPs): State of the science. Environmental Pollution 100: 209-221. Kalbande, D.M., Dhadse, S.N. et al. (2007). Biomonitoring of heavy metals by pollen in urban environment. Environ. Monit. Assess. 138:
233–238. Kaskaoutis, D.G., Badarinath, K.V.S., et al. (2009). Variations in the aerosol optical properties and types over the tropical urban site of
Hyderabad, India. J. Geophys. Res. 114. Kaufman, Y.J., Tanré, D. et al. (2002). A satellite view of aerosols in the climate system. Nature 419: 215–223. Khillare, P.S., Jyethi, D.S. et al. (2012). Health risk assessment of polycyclic aromatic hydrocarbons and heavy metals via dietary intake
of vegetables grown in the vicinity of thermal power plants. Food Chem. Toxicol. 50: 1642–1652. Khillare, P.S. and Sarkar, S. (2012). Airborne inhalable metals in residential areas of Delhi, India: distribution, source apportionment and
health risks. Atmospheric Pollut. Res. 3: 46-54. Klimont, Z., Cofala, J. (2009). Projections of SO2, NOx and carbonaceous aerosols emissions in Asia. Tellus Series B-Chem. Phys.
Meteorol. 61: 602–617. Kluge, M., Pesch, R. et al. (2013). Accounting for canopy drip effects of spatiotemporal trends of concentrations of N in mosses,
atmospheric N depositions and critical load exceedances: a case study from North-Western Germany. Environmental Sciences Europe 25: 26.
Krajívcková, A. and Mejstvrik, V. (1984). The effect of fly ash particles on the plugging of stomata. Environ. Pollut. Ser. Ecol. Biol. 36: 83–93.
Krishna Moorthy, K., Babu, S.S. et al. (2007). Temporal heterogeneity in aerosol characteristics and the resulting radiative impact at a tropical coastal station-Part 1: Microphysical and optical properties, in: Annales Geophysicae. European Geosciences Union, pp. 2293–2308.
Kulshreshtha, K., Farooqui, A. et al. (1994). Effect of diesel exhaust pollution on cuticular and epidermal features of Lantana camara L. and Syzygium cuminii L. (Skeels.). J Env Sci Health Part Env Sci Eng. Toxicol. 29: 301–308.
Kulshrestha, U., Granat, L. et al. (2005). Review of precipitation monitoring studies in India—a search for regional patterns. Atmos. Environ. 39: 7403–7419.
Kumar, K.R., Narasimhulu, K. et al. (2009). Temporal and spectral characteristics of aerosol optical depths in a semi-arid region of southern India. Sci. Total Environ. 407: 2673–2688.
Kumari, S., Agrawal, M. et al. (2013). Impact of elevated CO2 and elevated O3 on Beta vulgaris L.: Pigments, metabolites, antioxidants, growth and yield. Environ. Pollut. 174: 279–288.
Langner, J., Engardt, M. et al. (2012). A multi-model study of impacts of climate change on surface ozone in Europe. Atmospheric Chemistry and Physics 12: 10423-10440.
Leipe T., Kersten M. et al. (2005). Ecotoxicity assessment of natural attenuation effects at a historical dumping site in the western Baltic Sea. Marine Pollution Bulletin 50: 446-459.
Li, Z., Chen, H. et al. (2007). Preface to special section on East Asian Studies of Tropospheric Aerosols: An International Regional Experiment (EAST-AIRE). J. Geophys. Res. 112.
LRTAP Convention (2004). Manual on methodologies and criteria for modelling and mapping critical loads and levels and air pollution effects, risks and trends. UNECE Convention on Long-range Transboundary Air Pollution. http://wge-cce.org/Publications/Mapping_Manual (18-02-2014).
LRTAP Convention (1998). Protocol to the 1979 Convention on Long-range Transboundary Air Pollution on Persistent Organic Pollutants. http://www.unece.org/env/lrtap/
LRTAP Convention (2011). Manual on methodologies and criteria for modelling and mapping critical loads and levels and air pollution effects, risks and trends. Chapter 3: Mapping critical levels for vegetation. http://icpvegetation.ceh.ac.uk/manuals/documents/Ch%203%20revised%20summer%202010,%20updated%20June%202011.pdf (12-03-2014).
Majumder, S., Mishra, D. et al. (2012). Physiological and chemical response of the lichen, Flavoparmelia caperata (L.) Hale, to the urban environment of Kolkata, India. Environ. Sci. Pollut. Res. 20: 3077–3085.
Mani, D., Sharma, B. et al. (2012). Cadmium and Lead Bioaccumulation During Growth Stages Alters Sugar and Vitamin C Content in Dietary Vegetables. Proc. Natl. Acad. Sci. India Sect. B Biol. Sci. 82: 477–488.
Meehl, G.A., Arblaster, J.M. et al. (2008). Effects of Black Carbon Aerosols on the Indian Monsoon. J. Clim. 21: 2869–2882. Mercado, L.M., Bellouin, N. et al. (2009). Impact of changes in diffuse radiation on the global land carbon sink. Nature 458: 1014–1017. Mills G, Buse A, et al (2007). A synthesis of AOT40-based response functions and critical levels of ozone for agricultural and
horticultural crops. Atmospheric Environment 41: 2630-2643. Mills, G., Harmens, H. (Eds.) (2011). Ozone pollution: A hidden threat to food security. ICP Vegetation Programme Coordination Centre,
Centre for Ecology and Hydrology, UK. ISBN: 978-1-906698-27-0. Mills, G., Hayes, F. et al. (2011a). Evidence of widespread effects of ozone on crops and (semi-)natural vegetation in Europe (1990 -
2006) in relation to AOT40 - and flux-based risk maps. Global Change Biology 17: 592-613.

49
Mills, G., Pleijel, H. et al. (2011b). New stomatal flux-based critical levels for ozone effects on vegetation. Atmospheric Environment 45: 5064-5068.
Mills, G., Wagg, S. et al (2013). Ozone Pollution: Impacts on ecosystem services and biodiversity. Programme Coordination Centre for the ICP Vegetation, Centre for Ecology and Hydrology, Bangor, UK. ISBN: 978-1-906698-39-3.
Mishra, A.K., Rai, R., Agrawal, S.B. (2013). Differential response of dwarf and tall tropical wheat cultivars to elevated ozone with and without carbon dioxide enrichment: Growth, yield and grain quality. Field Crops Research 145: 21-32.
Mittal, M.L., Hess, P.G. et al. (2007). Surface ozone in the Indian region. Atmos. Environ. 41: 6572–6584. Mohsenzadeh, F., Chehregani, A. et al. (2011). Effect of the Heavy Metals on Developmental Stages of Ovule, Pollen, and Root
Proteins in Reseda lutea L. (Resedaceae). Biol. Trace Elem. Res. 143: 1777–1788. Moon, K., Kim, J. et al. (2009). Effect of aerosol optical depth on diffuse photosynthetically active solar irradiance. Asia-Pac. J.
Atmospheric Sci. 45: 307–317. Nagajyoti, P.C., Lee, K.D. et al. (2010). Heavy metals, occurrence and toxicity for plants: a review. Environ. Chem. Lett. 8: 199–216. Nilsson, J., Grennfelt, P. (Eds.) (1988). Critical loads for sulphur and nitrogen. UNECE/Nordic Council report, Skokloster, Sweden.
Nordic Council of Ministers, Copenhagen. Niranjan, K., Spandana, B. et al., (2011). Measurements of aerosol intensive properties over Visakhapatnam, India for 2007. Ann.
Geophys. 29: 973–985. Oguntimehin, I., Nakatani, N. et al. (2008). Phytotoxicities of fluoranthene and phenanthrene deposited on needle surfaces of the
evergreen conifer, Japanese red pine (Pinus densiflora Sieb. et Zucc.). Environmental Pollution 154: 264-271. Oltmans, S. J., Lefohn, A. S. et al. (2006). Long-term changes in tropospheric ozone. Atmospheric Environment 40(17): 3156-3173. Pandey, J. (2005). Evaluation of air pollution phytotoxicity downwind of a phosphate fertilizer factory in India. Environ. Monit. Assess.
100: 249–266. Pandey, J. and Pandey, U. (1994). Evaluation of air pollution phytotoxicity in a seasonally dry tropical urban environment. Environ.
Monit. Assess. 33: 195–213. Pandey, J. and Pandey, U. (2009a). Accumulation of heavy metals in dietary vegetables and cultivated soil horizon in organic farming
system in relation to atmospheric deposition in a seasonally dry tropical region of India. Environ. Monit. Assess. 148: 61–74. Pandey, J. and Pandey, U. (2009b). Atmospheric deposition and heavy metal contamination in an organic farming system in a
seasonally dry tropical region of India. J. Sustain. Agric. 33: 361–378. Parrish, D. D., Law, K.S. et al. (2012) Long-term changes in lower tropospheric baseline ozone concentrations at northern mid-latitudes.
Atmospheric Chemistry and Physics Discussions 12: 11485-11504. Penner, J.E. et al. (2001). Aerosols, their Direct and Indirect Effects, page 289-348. In: Houghton, J.T., et al. (Eds.), Climate Change
2001: The Scientific Basis. Cambridge University Press, Cambridge, UK. Pleijel, H., Danielsson, H. et al. (2007). Ozone risk assessment for agricultural crops in Europe: Further development of stomatal flux
and flux–response relationships for European wheat and potato. Atmos. Environ. 41: 3022–3040. Posch, M., Hettelingh, J.-P. et al. (2001). Characterization of critical load exceedances in Europe. Water, Air and Soil Pollution 130:
1139–1144. Pourkhabbaz, A., Rastin, N. et al. (2010). Influence of Environmental Pollution on Leaf Properties of Urban Plane Trees, Platanus
orientalis L. Bull. Environ. Contam. Toxicol. 85: 251–255. Prasad, K.V.S.., Paradha Saradhi, P. et al. (1999). Concerted action of antioxidant enzymes and curtailed growth under zinc toxicity in
Brassica juncea. Environ. Exp. Bot. 42: 1–10. Rai, R., Agrawal, M. et al. (2011). Effects of ambient O3 on wheat during reproductive development: Gas exchange, photosynthetic
pigments, chlorophyll fluorescence, and carbohydrates. Photosynthetica 49: 285–294. Rajeev, K. and Ramanathan, V. (2001). Direct observations of clear-sky aerosol radiative forcing from space during the Indian Ocean
Experiment. J. Geophys. Res. Atmospheres 1984–2012. 106: 17221–17235. Reinds, G.J., Posch, M., et al. (2008). Critical loads of sulphur and nitrogen for terrestrial ecosystems in European and Northern Asia
using different soil chemical criteria. Water, Air and Soil Pollution 193: 269-287. Remer, L.A., Kleidman, R.G.et al. (2008). Global aerosol climatology from the MODIS satellite sensors. J. Geophys. Res. 113. Rengarajan, R., Sarin, M.M. et al. (2007). Carbonaceous and inorganic species in atmospheric aerosols during wintertime over urban
and high-altitude sites in North India. J. Geophys. Res. 112. Royal-Society (2008). Ground-level ozone in the 21st century: future trends, impacts and policy implications. Science Policy Report
15/08. Salemaa, M., Mäkipää, R. et al. (2008). Differences in the growth response of three bryophyte species to nitrogen. Environmental
Pollution 152: 82-91. Sarkar, A. and Agrawal, S.B. (2012). Evaluating the response of two high yielding Indian rice cultivars against ambient and elevated
levels of ozone by using open top chambers. J. Environ. Manage. 95: S19–S24. Satheesh, S.K. and Ramanathan, V. (2000). Large differences in tropical aerosol forcing at the top of the atmosphere and Earth’s
surface. Nature 405: 60–63. Saxena, D.K., Singh, S. et al. (2008a). Atmospheric heavy metal deposition in Garhwal Hill Area (India): Estimation based on native
moss analysis. Aerosol and Air Quality Research 8: 94-111. Saxena, D.K., Singh, S. et al. (2008b). Retrospective metal data of the last 100 years deduced by moss, Barbula sp. from Mussoorie
city, Garhwal Hills, India. Current Science 94:901-904. Saxena, D.K., Srivastava, K.et al. (2008c). Biomonitoring of metal deposition by using moss transplant method through Hypnum
cupressiforme (Hedw.) in Mussoorie. Journal of Environmental Biology 29: 683-688. Schröder, W., Holy, M. et al. (2010a). First Europe-wide correlation analysis identifying factors best explaining the total nitrogen
concentration in mosses. Atmospheric Environment 44: 3485-3491. Schröder, W., Holy, M. et al. (2010b). Are cadmium, lead and mercury concentrations in mosses across Europe primarily determined by
atmospheric deposition of these metals? Journal of Soils and Sediments 10: 1572-1584. Schwartz, S.E. (1996). The Whitehouse Effect - Shortwave radiative forcing of climate by anthropogenic aerosols: An overview. J.
Atmospheric Sci. 27: 359–382. Shah, M.H., Shaheen, N.et al. (2006). Characterization, Source Identification and Apportionment of Selected Metals in TSP in an Urban
Atmosphere. Environ. Monit. Assess. 114: 573–587. Sharma, A.P. and Tripathi, B.D. (2009). Biochemical responses in tree foliage exposed to coal-fired power plant emission in seasonally
dry tropical environment. Environ. Monit. Assess. 158: 197–212. Sharma, R.K., Agrawal, M.et al. (2008a). Atmospheric deposition of heavy metals (Cu, Zn, Cd and Pb) in Varanasi City, India. Environ.
Monit. Assess. 142: 269–278. Sharma, R.K., Agrawal, M.et al. (2008b). Heavy metal (Cu, Zn, Cd and Pb) contamination of vegetables in urban India: A case study in
Varanasi. Environ. Pollut. 154: 254–263. Sharma, R.K., Agrawal, M.et al. (2009). Heavy metals in vegetables collected from production and market sites of a tropical urban area
of India. Food Chem. Toxicol. 47: 583–591. Shukla, V. and Upreti, D.K. (2007). Effect of metallic pollutants on the physiology of lichen, Pyxine subcinerea Stirton in Garhwal
Himalayas. Environ. Monit. Assess. 141: 237–243.

50
Simmonds, P. G., Derwent, et al. R. G. (2004). Significant growth in surface ozone at Mace Head, Ireland, 1987-2003. Atmospheric Environment 38(28): 4769-4778.
Simpson, D., Benedictow, A. et al. (2012). The EMEP MSC-W chemical transport model – technical description. Atmospheric Chemistry and Physics 12: 7825-7865.
Singh, M., Singh, D.et al. (2008). Aerosol characteristics at Patiala during ICARB—2006. J. Earth Syst. Sci. 117: 407–411. Singh, P., Singh, S.et al. (2012). Assessment of the interactive effects of ambient O 3 and NPK levels on two tropical mustard varieties
(Brassica campestris L.) using open-top chambers. Environ. Monit. Assess. 184: 5863–5874. Singh, R.P. (2004). Variability of aerosol parameters over Kanpur, northern India. J. Geophys. Res. 109. Singh, S., Bhatia, A.et al. (2013). Synergistic action of tropospheric ozone and carbon dioxide on yield and nutritional quality of Indian
mustard (Brassica juncea (L.) Czern.). Environ. Monit. Assess. 185: 6517–6529. Singh, S.P., Satsangi, G.S.et al. (2001). Multiphase measurement of atmospheric ammonia. Chemosphere - Glob. Change Sci. 3: 107–
116. Sitch, S., Cox, P. M. et al. (2007). Indirect radiative forcing of climate change through ozone effects on the land-carbon sink. Nature 448
(7155): 791-U794. Slootweg, J., Hettelingh, J.-P. et al. (2010). Critical loads of heavy metals and their exceedances. In: Slootweg, J., Posch, M. et al.
(Eds). Progress in the modelling of critical thresholds and dynamic modelling, including impacts on vegetation in Europe. CCE Status Report 2010, Coordination Centre for Effects, RIVM, Bilthoven, The Netherlands.
Somashekaraiah, B.V., Padmaja, K.et al. (1992). Phytotoxicity of cadmium ions on germinating seedlings of mung bean (Phaseolus vulgaris): Involvement of lipid peroxides in chlorphyll degradation. Physiol. Plant. 85: 85–89.Smith P.N., Cobb G.P. et al. (2007). Contaminant exposure in terrestrial vertebrates. Environmental Pollution 150: 41-64.
Spranger, T., Hettelingh, J.-P. et al. (2008). Modelling and mapping long-term risks due to reactive nitrogen effects: an overview of the LRTAP Convention activities. Environmental Pollution, 154:482-487.
Steiner, A.L. and Chameides, W.L. (2005). Aerosol-induced thermal effects increase modelled terrestrial photosynthesis and transpiration. Tellus B 57: 404–411.
Steinnes, E., Rühling, Å. et al. (1997). Reference material for large-scale metal deposition surveys. Accreditation and Quality Assurance 2: 243-249.
Stevens, C.J., Duprè, C. et al. (2011).The impact of nitrogen deposition on acid grasslands in the Atlantic region of Europe. Environmental Pollution 159: 2243-2250.
Streets, D.G., Yan, F.et al. (2009). Anthropogenic and natural contributions to regional trends in aerosol optical depth, 1980–2006. J. Geophys. Res. 114.
Sutton, M.A., Howard, C.M. et al. (2011). The European nitrogen assessment: sources, effects and policy perspectives. Cambridge University Press, UK.
Takemura, T. (2005). Simulation of climate response to aerosol direct and indirect effects with aerosol transport-radiation model. J. Geophys. Res. 110.
Tang, H., Takigawa, M.et al. (2013). A projection of ozone-induced wheat production loss in China and India for the years 2000 and 2020 with exposure-based and flux-based approaches. Glob. Change Biol. 19: 2739–2752.
Tiwari, S. and Agrawal, M. (2011). Assessment of the variability in response of radish and brinjal at biochemical and physiological levels under similar ozone exposure conditions. Environ. Monit. Assess. 175: 443–454.
Tripathi, R. and Agrawal, S.B. (2012). Effects of ambient and elevated level of ozone on Brassica campestris L. with special reference to yield and oil quality parameters. Ecotoxicol. Environ. Saf. 85: 1–12.
Tripathi, R. and Agrawal, S.B. (2013). Interactive effect of supplemental ultraviolet B and elevated ozone on seed yield and oil quality of two cultivars of linseed (Linum usitatissimum L.) carried out in open top chambers. J. Sci. Food Agric. 93: 1016–1025.
Twomey, S. (1977). Atmospheric aerosols. Elsevier, Amsterdam, Netherlands. Vandermeiren, K., Harmens H. et al. (2009) Impacts of ground level ozone on crop production in a changing climate, page 213-243. In:
Singh S.N. (Ed.). Climate Change and Crops. Springer, Berlin, pp. 213 – 243. ISBN: 978-3-540-88245-9. Van Dingenen, R., Dentener, F.J. et al. (2009). The global impact of ozone on agricultural crop yields under current and future air quality
legislation. Atmospheric Environment 43: 604–618. Velissariou, D. and Davison A. W. (1996). The adverse effects of ozone on six Greek wheat varieties and five F1 lines of maize.
Phytopathologia Mediterranea. 35: 215. Velissariou, D., Davison, A.W. et al. (1992). Effects of air pollution on Pinus halepensis Mill. 1. Pollution levels in Attica, Greece.
Atmospheric Environment 26A: 373-380. Velissariou, D. and Skretis, L. (1999). Critical levels exceedances and ozone biomonitoring in the Greek fir forest (Abies cephalonica
loud.) at the Parnis mountain national park in Attica, Greece, page 205- 208. In: Fuhrer, J. and Achermann, B. (Eds.). Critical Levels for Ozone - Level II. UNECE Convention on LRTAP. SAEFL, Bern
Velissariou, D., Venouziou, J. et al. (2000). Cases of necrotic symptoms on Greek crop plants. Is air pollution a cause for many of them? A case study at Gomfi, Trikala, Thessaly. Phytopathologia Mediterranea 39: 322.
Vingarzan, R. (2004). A review of surface ozone background levels and trends. Atmospheric Environment 38(21): 3431-3442. WMO/UNEP, 2011. Integrated Assessment of Black Carbon and Tropospheric Ozone ( No. ISBN: 92-807-3141-6). UNEP
(DEW/1351/NA). Working Group on Effects (2013a). Benefits of air pollution control for biodiversity and ecosystem services. 32nd Session WGE, informal
document 1. http://www.unece.org/fileadmin/DAM/env/documents/2013/air/wge/No.1__Benefits_of_air_pollution_control_for_biodiversity_and_ecosystem_services.pdf
Working Group on Effects (2013b). Guidance document on health and environmental improvements using new knowledge, methodsand data. Document ECE/EB.AIR/2013/8. http://www.unece.org/fileadmin/DAM/env/documents/2013/air/eb/ECE_EB.AIR_2013_8_E.pdfEW/1351/NA.
Wu, Y.-S., Fang, G.-C.et al. (2007). A review of atmospheric fine particulate matter and its associated trace metal pollutants in Asian countries during the period 1995–2005. J. Hazard. Mater. 143: 511 – 515.
Yamaguchi, M., Otani, Y.et al. (2014). Effects of long-term exposure to ammonium sulfate particles on growth and gas exchange rates of Fagus crenata, Castanopsis sieboldii, Larix kaempferi and Cryptomeria japonica seedlings. Atmosperhic Environ. In press.
Yousefi, N., Chehregani, A.et al. (2009). Effect of the Heavy Metals on the Developmental Stages of Ovule and Seed Proteins in Chenopodium botrys L. (Chenopodiaceae). Biol. Trace Elem. Res. 144: 1142–1149.
Zheng, B., Ma, Y.et al. (2010). Assessment of the influence of global dimming on the photosynthetic production of rice based on three-dimensional modeling. Sci. China Earth Sci. 54: 290–297.

51
Annex 1: Country reports
Here we have included country reports from participants of the programme of the ICP Vegetation. The
short reports summarise their research; the responsibility for their content lies with the participants.
Country reports have been submitted by:
Albania
Croatia
Egypt (as outreach to North Africa)
Greece
Macedonia
Romania
Russian Federation
Serbia
Slovenia

52
Albania
Survey of atmospheric deposition of heavy metals in Albania using mosses
Pranvera Lazo1, Flora Qarri
2, Lirim Bekteshi
3, Trajce Stafilov
4, Katerina Baceva
4 Jani Marka
1
1 Department of Chemistry, Faculty of Natural Sciences, University of Tirana, Albania. [email protected]
2 Department of Chemistry, University of Vlora, Albania.
3 Department of Chemistry, Faculty of Natural Sciences, University of Elbasan, Albania.
4 Institute of Chemistry, Faculty of Science, Sts. Cyril and Methodius University, Skopje, Macedonia.
Background and aims the study Albania is a small county (28 000 km
2) with a complex topography, climate, geology, and is
characterized by high anthropogenic influences. The first study monitoring atmospheric deposition of metals using mosses in Albania was performed within the framework of the ICP Vegetation (Harmens et al., 2010). The main aim of this study is to express the spatial patterns of heavy metals distribution in mosses in 2010/11 in Albania and to identify the main polluted areas in the country. Materials and methods The carpet-forming mosses Hypnum cupressiforme and Pseudoscleropodium purum were collected according to the guidelines set out in the experimental protocol for the 2010/11 survey (ICP Vegetation, 2010). The distribution of the sampling sites throughout Albania was shown in a previous publication (Qarri et al., 2013). Ten elements (Al, As, Cd, Cr, Cu, Fe, Ni, Pb, V and Zn) were measured in moss samples collected from 62 sampling sites across Albania during the dry autumn and summer period of 2010 and 2011. The total digestion of moss samples was done according to the method presented by Barandovski et al. (2008). The quality of the data was checked by multiple analyses of samples and by analyzing the certified moss reference materials M2 and M3 (Steinnes et al., 1997; Harmens et al., 2010). Results and Discussions The 2010 data on the concentration of 10 elements in 62 moss samples from Albania are summarized below, using descriptive statistics (Table 1) and multivariate analysis (Pearson Correlation, Table 2). Table 1 Descriptive statistics of the element concentrations (mg/kg, DW) in mosses sampled (n=62) in
Albania in 2010.
The median values of Cr, Fe, Ni, V, Zn and Al are similar to those of neighbouring countries (Qarri et al. 2013), but higher than those of European countries (Harmens et.al. 2013). The highest values of these elements were measured near industrial centres (the central part of the country). To distinguish between lithogenic and anthropogenic origin of the elements in mosses, correlation analysis was carried out (Table 2). Good correlations (R
2>0.5, P>0.001) were found between Fe and Cr, Ni, V, Al,
which can be explained by their lithogenic (Fe-Al, V correlation) and geogenic (Fe-Cr, Ni correlation) origin. Aluminium, chromium, iron, nickel and vanadium The background level of Al in Albanian moss samples was higher than in other European countries (Harmens et al., 2013). The highest Al concentration was found in the south and in central part of Albania. The main contribution of Cr, Fe, Ni and V elements is coming from the Elbasan ferrochromium metallurgical plant (Lazo et al., 2013) and the mining industry in Albania. A high level of wind-blown dust occurs in the south and a high level (for most metals) of industrial activity is present in the mid-east of Albania. The association of Cr and Fe is also related to current air pollution (Lazo et al. 2013). Their highest concentration is present near the ferrochromium metallurgy in Elbasan town and chromites deposition areas of Albania.
Parameters Fe Ni V Al Cr As Pb Cd Cu Zn
Range 469–5488 1.6–131 1.15–16.9 535–6974 1.6–31.7 0.05–2.9 1.3–19.7 0.038–0.89 2.14–16 1.0–68
Mean 1892 11.36 4.23 1958 6.38 0.541 3.28 0.17 6.07 14.06
Median 1618 5.85 3.51 1638 4.75 0.305 2.41 0.107 5.58 13.8
St dev. 1105 19.3 2.79 1178 5.39 0.64 3.21 0.16 2.8 11.6

53
Table 2 Pearson Correlation Coefficients between element concentrations in mosses in Albania in 2010.
1 P<0.001,
2 P<0.005,
3 P<0.01; bold – Pearson Correlation Coefficient > 0.50.
Arsenic, cadmium, copper and zinc Arsenic concentrations in mosses were generally low in the western part and higher in eastern part of Albania, but lower than in neighbouring countries (Harmens et al., 2013). Cu, Cd and Zn concentrations were generally low in mosses sampled in Albania compared to many other European countries (Harmens et al., 2013). Road transport may have a considerable effect on the distribution of these elements in air pollution in Albania. Conclusions Moss biomonitoring provides a cheap, complementary method to deposition analysis for the identification of areas at risk from high atmospheric deposition fluxes of heavy metals. Based on the median distribution of Albanian data of moss survey 2010/2011 we suggest that the elements Zn, Cd, Cu, Pb and As do not reach high enough concentrations as a result of long-range atmospheric transport and deposition to cause adverse effects on terrestrial ecosystems. However, the elements Al, Fe, Cr, Ni and V appear to have the highest median values among European countries and this may result in effects on vegetation due to the accumulative nature of heavy metals in soils and vegetation. Soil dust, industry emissions, waste incineration and road traffic were identified as main factors causing air pollution from heavy metals in Albania. References Barandovski, L., Cekova, M., Frontasyeva, M.V., Pavlov, S.S., Stafilov, T., Steinnes, E., Urumov, V. (2008). Atmospheric
deposition of trace element pollutants in Macedonia studied by the moss biomonitoring technique. Environmental Monitoring and Assessment 138: 107-118.
Harmens H, Norris D, Mills G. and the participants of the moss survey (2013). Heavy metals and nitrogen in mosses: spatial patterns in 2010/2011 and long-term temporal trends in Europe. ICP Vegetation Programme Coordination Centre, Centre for Ecology and Hydrology, Bangor, UK, 63 p. http://icpvegetation.ceh.ac.uk
Harmens, H., Norris, D.A., Steinnes, E., Kubin, E., et al. (2010). Mosses as biomonitors of atmospheric heavy metal deposition: spatial and temporal trends in Europe. Environmental Pollution 158: 3144-3156.
ICP Vegetation (2010). Heavy Metals in European Mosses: Survey. Monitoring Manual. International Cooperative Programme on Effects of Air Pollution on Natural Vegetation and Crops, http://icpvegetation.ceh.ac.uk/manuals/ documents/ UNECEHEAVYMETALSMOSSMANUAL2010POPsadaptedfinal_220510_.pdf
Lazo, P., Bekteshi, L., Shehu, A. (2013). Active moss biomonitoring technique for atmospheric deposition of heavy metals study in Elbasan city, Albania, Fresenius Environmental Bulletin 23 – No 1a: 213-219.
Qarri, F., Lazo, P., Stafilov, T., Frontasyeva, M., Harmens, H., Bekteshi, L., Baceva, K., Goryainova, Z. (2013). Multi-elements atmospheric deposition study in Albania. Environmental Science and Pollution Research, October 2013.
Steinnes, E., Rühling, Å., Lippo, H., Makinen, A. (1997). Reference materials for large-scale metal deposition surveys. Accreditation and Quality Assurance 2: 243-249.
Cd As Cr Cu Pb Ni V Zn Al Fe
Cd 1
As 0.19 1
Cr 0.461
0.18 1
Cu 0.392
-0.05 0.31 1
Pb 0.353
0.08 0.26 0.451
1
Ni 0.21 -0.01 0.641
0.14 0.06 1
V 0.30 0.343
0.511
0.30 0.31 0.13 1
Zn 0.431
-0.09 0.43 0.621
0.521 0.21 0.34
3 1
Al 0.343
0.601
0.431
0.11 0.12 0.08 0.671
0.02 1
Fe 0.432
0.441
0.811
0.382
0.30 0.511 0.72
1 0.39 0.75
1 1

54
Croatia
Lead institute: Zdravko Spiric and Vladimir Kusan, Oikon Ltd. - Institute for Applied Ecology, Trg senjskih
uskoka 1, Zagreb, Croatia. [email protected] Collaborating institutes: Trajce Stafilov and Ivana Vuckovic, Institute of Chemistry, Faculty of Science, Ss. Cyril
and Methodius University, Skopje, Macedonia. [email protected] Mariana Frontasyeva, Frank Laboratory of Neutron Physics, Joint Institute for Nuclear Research, Dubna, Russian Federation. [email protected] Delko Barisic and Branko Vekic, Ruđer Bošković Institute Zagreb, Croatia Marin Glad, Teaching Institute of Public Health, Primorsko-Goranska County, Rijeka, Croatia. [email protected]
Background
Since 2006, Croatia has participated in the European moss survey. Moss samples were collected in 2006 and 2010 on a nearly regular grid of 23 km x 23 km. Moss samples were collected during the summer of 2006 and summer/autumn of 2010 (Figure 1), from 98 and 121 locations respectively, evenly distributed over the country with additional samples taken in/around urban/industrial areas. The most dominant moss species were Hypnum cupressiforme, Pleurozium schreberi, Brachythecium rutabulum and Homalothecium sericeum. This study was undertaken in order to provide an assessment of air quality throughout Croatia and to generate information needed for better identification of local pollution sources as well as transboundary pollution, and improving the potential for assessing environmental and health risks in Croatia associated with dry and wet deposition of toxic metals.
Figure 1 Locations of moss sampling sites in Croatia in 2006 (left) and 2010 (right).
Metals, nitrogen & radionuclide concentrations in mosses
Here we present the results obtained in the 2010 moss survey in Croatia and compare these results
with those obtained in the previous survey in 2006, in order to evaluate spatial patterns and temporal
deposition trends. As an example, the spatial pattern of Pb concentrations in mosses in 2010 is
shown (Figure 2). The content of 21 elements was determined by ICP-AES and atomic absorption
spectrometry (AAS). Principal component analysis (PCA) was applied in order to show association
between the elements. Six factors (F1 to F6) were determined, of which two are anthropogenic (F3
and F6), two are mixed geogenic-anthropogenic (F1 and F5) and two are geogenic factors (F2 and
F4). In addition, 22 out of 121 representative moss samples were subjected to gamma-spectrometric
analyses for assessing the activity of the naturally occurring radionuclides (data not shown). In 2010,
the nitrogen concentration in mosses was determined for the first time using the Kjeldahl method
(Figure 4). From data obtained in 2010 (Špirić et al., 2013), it can be concluded that the median
values and ranges of all elements obtained in this study are very similar to the median values and
ranges obtained in the previous study in 2006 (Špirić et al., 2012). Only a few elements (Cd, Cu, Mg,
Ni and Pb) have a slightly higher median value (Table 1). For some typical anthropogenic elements
such as Cr, Hg, V and Zn, lower median values were recorded in 2010.

55
Table 1 Comparison of the results of the 2006 and 2010 Croatian moss survey.
Figure 2 Distribution of Pb (left) and N concentrations (right) in mosses in 2010.
Discussion and conclusion
From the moss data it can be concluded that anthropogenic heavy metal pollution has not changed significantly in Croatia between 2006 and 2010. The main anthropogenic sources of heavy metals are light and heavy industry, transportation, steel industry, textile industry, thermoelectric plant and oil deposits and refineries whose activities are carried out near big industrialized cities such as Zagreb, Sisak, Rijeka, Kutina, Split and Sibenik. Moss samples collected near these regions showed the highest content of typical air pollution from heavy metals. In comparison with the results obtained in other European countries, it can be concluded that Croatia is more polluted than many parts of northern and western Europe, but less polluted than many of its neighbouring countries. There is a clear need to continue the moss survey in order to assess air quality throughout Croatia and to produce information needed for better identification of pollution sources and assessment of environmental and health risks associated with dry and wet deposition of toxic metals in Croatia. Špiric Z, Frontasyeva M, Steinnes E & Stafilov T (2012). Multi-element atmospheric deposition study in Croatia, International
Journal of Environmental Analytical Chemistry 92: 1200-1214.
Špiric, Z., Vuckovic, I., Stafilov, T., Kusan, V., & Frontasyeva, M. (2013). Air Pollution Study in Croatia Using Moss Biomonitoring and ICP–AES and AAS Analytical Techniques. Archives of Environmental Contamination and Toxicology 65: 33-46.
Croatia 2010 Croatia 2006
No. of samples n= 121 n= 94
Element Median Range Median Range
Ag 0.032 0.001-0.155 - -
Al 878 112-4493 1350 398-2146
As 0.36 0.05-1.00 0.37 0.10-6
Ba 20.64 4.49-94.30 32 7-192
Ca 6632 2649-20795 7623 2832-26740
Cd 0.38 0.10-1.42 0.27 0.07-1.9
Cr 1.94 0.41-8.55 2.8 0.76-33
Cu 8.53 4.72-22.69 7.5 3.7-22.7
Fe 789 85.00-4028 1000 320-12140
Hg 0.043 0.010-0.145 0.064 0.007-0.301
K 3891 1552-9279 8085 2565-23720
Li 0.55 0.11-4.27 - -
Mg 3059 1619-4740 2120 676-12740
Mn 99.1 16.10-928 106 20-1421
Na 120 65.00-304 169 67-2332
Ni 3.16 1.04-14.66 2.7 0.66-18
P 1134 419-3117 - -
Pb 3.21 1.11-36.64 2.46 0.06-82.4
Sr 16.00 4.74-54.03 21 4-125
V 2.55 0.23-37.26 3.1 0.91-32
Zn 24.80 11.64-77.13 29 12-283

56
Egypt*
Samia Madkour, Damanhour University, Damanhour
Lead institute: 1) The Egyptian Environmental Affairs Agency (EEAA), Ministry of State for Environmental
Affairs (MSEA), Cairo, Egypt. www.eeaa.gov.eg [Ahmed Abou Elseoud, Air Quality Dept.]. 2) National Research Center, El-Dokki, Cairo,Egypt. [email protected] . [Nasser M. Abdellatif, Air Pollution Department (Ozone + Heavy metals)] Collaborating Institute: Institute of Environmental Studies and Research, Ein-Shams University, Abbassia,
Cairo [Ibrahim M. El-Gamal (Heavy metals only)]
Background Air pollution is one of the most important challenges and obstacles facing development in Egypt at present. Air pollution emissions pose an increasing threat to agriculture. High rates of consumption of fossil fuel caused by the extensive urbanization, industrial development and the increase in motorized vehicular traffic coupled with the rapid growth in population during the last few decades have enhanced the overall air pollution level.
As the control of air pollution represents one of the primary concerns of the Ministry of State for Environmental Affairs (MSEA) and the Egyptian Environmental Affairs Agency (EEAA), continuous efforts are made for enforcing existing environmental legislation and dealing with the air quality problem (Law 4/1994 for the Environment and its amendment law 9/2009). Accordingly, a comprehensive national air quality monitoring system has been established as part of the Environmental Information and Monitoring Program (EIMP) of EEAA as a long-term commitment to this issue. The monitoring network started with 38 stations and was initially implemented with support from the Danish Government (MSEA/EEAA Air Quality Report, 2001). The monitoring system has been operational between the years 1998-2009, measuring concentrations of common air pollution parameters such as sulphur dioxide (SO2), nitrogen dioxide (NO2), carbon monoxide (CO), ozone (O3), particulate matter (PM10) and lead (Pb). This effort was carried out by monitoring stations distributed throughout the country. In 2001, EEAA took over full responsibility for the operation and maintenance of the system and the number of stations increased gradually to a total of 87 monitoring sites in 2007. This report will focus on O3, NO2 and Pb which have been known to have a great impact on agriculture and therefore have been the most studied. Despite the differences between the monitoring locations, levels of the ambient gaseous pollutants O3 (25-92 ppb) and NO2 (32-62 ppb) are high enough to have significant impacts on the growth and yield of local varieties of crops (Egypt State of the Environment Reports, 2008 & 2009).
Egyptian agriculture is characterized by the limited cultivable area, mainly along the Nile banks and the Delta since the river is almost the single main source of irrigation water. The cultivated area represents 3.7% of the total area of Egypt (1 million km
2). It is considered as one of the most intensive
agricultural systems in the world. The agricultural surface unit is cultivated two or three times a year, thus, intensifying the harvested area 2-3 folds above the cultivated area. Economically important crops which are at risk from air pollution include cereals (e.g. wheat, maize & rice), fodder (clover & alfalfa), legumes (beans & lentil), fibre (cotton) and vegetables (e.g. tomato, potato & onion).
Main air pollution problems
Ozone. The increases in air pollution that have occurred around the urban industrial centres of Cairo
and Alexandria in Egypt are particularly problematical since these are in the same location as the primary agricultural region, which is limited to the Nile river basin and the Delta. Studies of the effects of O3 pollution on vegetation have been carried out in the last 20 years in the greater Cairo area and around the main roads within the Nile Delta and Upper Egypt region. Temporal and spatial patterns were followed and recorded by the MSEA/EEAA. Results of these efforts are presented in Figure 1. Ozone levels recorded were consistently greater than the universally accepted 40ppb vegetation damage threshold. Hourly means of O3 further exceeded the above levels and reached 100 ppb or more depending on the site, the weather conditions and the season. Visible injuries included necrosis, black or red spots and chlorosis especially on bioindicator species such as Jew's mallow, white clover (60 % and 54% leaves injured respectively), lettuce and rocket (Madkour & Laurence, 2002).
_________________________
* As outreach to North Africa

57
Figure 1 Temporal (left) and spatial (right) trends of the annual average ozone concentrations in Egypt.
Controlled environmental studies aiming to determine the sensitivity of local Egyptian crops and cultivars to O3 were conducted since 1994. Sensitive species included radish and turnip (Hassan et al., 1995), common bean (Madkour, 1998 & Madkour et al., 2011), clover (El-Shamy and Madkour, 2008) and tomato (Madkour and Abou Salem, 2014).
The impact of O3 on the growth and yield of local varieties has been assessed. Plant biomass of radish (Raphanus sativus L. cv. Balady) and turnip (Brassica rapa L. cv. Sultani) were reduced at sub-urban and rural sites in Alexandria. The study proved that levels of ambient O3 in Egypt are high enough to have significant impacts on the growth and yield of local varieties of vegetable crops, even at a time of the year when O3 levels are relatively low (Hassan et al., 1995). Open Top Chambers (OTC) experiments were conducted to study O3 effects on the yield of an Egyptian cultivar of wheat. Results showed that exposure to 61 ppb O3 caused 60% decrease in the total grain dry weight/plant and 20-48% decrease in other yield parameters (Hassan et al., 1999). O3-induced yield reductions have also been observed with other economically important crops. Estimated yield losses due to ozone exposure in the range 77-166 ppb at four different open field sites were proportional to the ozone level at each site. Reductions in yield of wheat (Triticum aestivum L. cv. Giza 68), broad bean (Vicia faba L. cv. Lara), kidney bean (Phaseoulus vulgaris L. cv. Giza 3) and pea (Pisum sativum L.
Perfection) were 9-46%; 13-33%; 20-45%; 3-30% respectively (Ali et al., 2008). The combined impact
of O3, NO2 and SO2 in ambient air were assessed using three cultivars of pea at urban (90 ppb O3, 24 ppb NO2 & 30 ppb SO2) and rural (76 ppb O3, 12 ppb NO2 & 13 ppb SO2) sites in Sharkia Province north east of Egypt. Losses in growth and decrease in yield of pea plants reached 40% and 10% respectively, at the urban site and were less at rural sites (Ali, 2004).
Nitrogen dioxide. Results of the air monitoring network (1999-2990, Figure 2) show that recorded NO2 concentrations in ambient air has always exceeded the maximum allowable standard set by the World Health Organization (40 μg/m3). It is noteworthy that this problem is not a new one, the increase in vehicle number in recent years led to a rise in the average annual concentrations of NO2. In addition, the expansion in using natural gas either in industry, production of electricity or as fuel for vehicles contributed in increasing NO2 concentrations.
Figure 2 Temporal (left) and spatial (right) trends of the annual average concentrations of nitrogen dioxide in Egypt.
Lead. Monitoring results for lead (Pb) concentrations in Greater Cairo (1999- 2009) show a significant decrease (0.4-0.7 μg/m
3) during 2007 and 2008 when compared to concentrations observed between
2000 and 2002 (1.7 μg/m3; Figure 3). This reduction in Pb was a result of the exerted efforts of the
MSEA to implement a National Programme aimed at reducing Pb pollution loads in Shoubra El-Khaimah, an extensive industrial area within the greater Cairo region. This programme began in 1998 and ended in March 2008 and consisted of a project to transfer all the foundries and cleaning their

58
lead-contaminated sites in Shoubra al-Khaimah; the expansion in producing unleaded gasoline by the Ministry of Petroleum; and the gradual replacement of gasoline with compressed natural gas as fuel for public transport. These efforts had been accompanied with MSEA amendment of Law 4 /1994 with respect to the permissible limits of lead concentrations in air to become 0.5 μg/m
3 in residential areas
and 1.5 μg/m3 in industrial areas instead of the general limit of 1 μg/m
3, in both industrial and
residential areas. Bio-accumulator plants (Lolium multiflorum L.) were used to assess Pb and Cd levels in plants in great Cairo. Evidence presented show that both Pb and Cd levels decreased with distance from highways, traffic volume and the existence of green barriers (El-Gamal, 2000).
Figure 3 Annual average lead concentration in air between 2000 and 2009.
Lead concentrations collected on leaf surfaces were high near industrial sites and lower at urban and suburban locations (Abou –El Saadat et al., 2011). Efforts to measure the accumulation of Pb in soils showed that at El-Fayoum Governorate the concentration was below the maximum permissible limits and were highest in soil surface especially near the main roads (Abdel-gawad et al., 2007). Conclusions
Air pollutant emissions pose an increasing threat to agriculture in Egypt;
There is a great need to assess the current and future impact of air pollution and to develop air quality guidelines for agriculture in Egypt, related to the local cropping pattern and climate;
Air pollution monitoring has tended to focus on urban areas, and there is a requirement for more rural monitoring on a regular basis.
References Abd Elgawad, M., Mahmoud, H.A.A., Shendi, M. and Ghabour, S.I. (2007). Status of some heavy metals in Fayoum district
soils. Proceeding of the 3rd Conference for Sustainable Agricultural Development, Faclty of Agriculture, El-Fayoum
University (12-14 Nov.) pp. 507-526. Abou El Saadat, E.M., Hassan, M.R., Hassan, I.A.and Weheda,B.M. (2001). Heavy metal content in leaves of Fiscus retusa
collected from contaminated and uncontaminated sites in Northern Egypt: Mitigation of toxicity by washing treatments. Universal Journal of Env. Research and Tech. 1(4): 408-415.
Ali, A. A. (2004). An open top chambersstudy to evaluate the impact of airborne pollutants on the growth of pea (Pisum sativum L.) cultivars at three sites of Sharkia Province, Egypt. Egyptian Journal of Biology 6: 52-61.
Ali, A., Alfarhan, A., Robinson, E., Bokhari, N., Al-Rasheid, K. and Al-Koraishy, S. (2008). Tropospheric ozone effects on the productivity of some crops in central Saudia Arabia. American Journal of Environmental Sciences 4(6): 631-637.
El-Gamal, I.M. (2000). Distribution pattern of some heavy metals in soil and plants along El-Moukattam highway. ICEHM,Cairo University,Egypt.pp. 518-524.
El-Shamy, Sawsan and Madkour, Samia (2008). Some physiological and biochemical changes in economic crops caused by the air pollutant ozone. M SC. Thesis. Alexandria University, Alexandria, Egypt.
Hassan, I., Anttoneen, S., Ashmore, M., Bell, J.N.B., Bender, J. & Weigel, H.J. (1999). Effect of ozone on ethylene biosynthesis and yield of wheat (Triticum aestivum L.). Pak. J. Biol. Sci. 332 - 335
Hassan, I.A. , Ashmore, M.R. & Bell, J.N.B. (1995). Effects of O3 on radish and turnip under Egyptian field conditions. Environ Pollut. 89: 99 - 108.
Madkour, S.A. and Laurence J.A. (2002). Egyptian plant species as new ozone indicators. Environmental Pollution 120:339-353.
Madkour, S.A., Abou-Salem, A. (2008). The role of salicylic acid and jasmonate in conferring tolerance against ozone injury in tomato plants. (In preparation).
Madkour, S.A., Abou-Salem, A. (2014). The role of salicylic acid and jasmonate in conferring tolerance against ozone injury in tomato plants. Proceedings of the 27
th Task Force Meeting of the UNECE ICP Vegetation, Jan. 28
- 30, 2014 – Paris,
France. Madkour, S.A., Saitanis, K., Saad, E.M. (2011). Egyptian bean genotypes as ozone bioindicators. Proceedings of the 24
th Task
Force Meeting of the UNECE ICP Vegetation, Jan. 31st
- Feb.2nd
,2011 - Rapperswil, Switzerland. Madkour, Samia A. (1998). Defense mechanisms against ozone injury in beans (Phaseolus vulgaris L.) genotypes differing in
ozone tolerance. J. Agric. Sci. Mansoura Univ. 23(7): 3203-3225. MSEA/EEAA (2008). Egypt State of the Environment Report. MSEA/EEAA (2009). Egypt State of the Environment Report.
59
Greece
Phytotoxicity of tropospheric ozone
Institutes: Dimitris Velissariou, Technological Educational Institute of Peloponnese (1999 - today), Benaki
Phytopathological Institute (1988-1999). [email protected] Costas J. Saitanis, Karandinos M.G., Riga-Karandinos A.N., Lekkas D., Agathokleous E., Agricultural University of Athens, Laboratory of Ecology and Environmental Sciences, Iera Odos 75, Votanikos, Athens, Greece. [email protected]
Background
Tropospheric ozone is the major air pollutant in major Greek cities (Athens, Thessaloniki, Patra, Volos, etc.) these days. There is also evidence that ambient ozone occurs at increased levels in many rural places across the country. This happens because Greece, along with other Mediterranean countries, is characterized by long periods of strong sunlight favouring photochemical pollution formation. Air pollution effects on plants have been studied in Greece since the mid seventies, mainly from point source air pollutants (airborne fluoride) (Holevas & Velissariou, 1986). In 1988, the first ozone Bel-W3 tobacco bio-monitoring campaign was carried out in Greece, at 23 sites in Attica, as well as a visible injury survey on Aleppo pine (Pinus halepensis Mill.) at 18 sites and short term ozone monitoring in two rural areas (Velissariou et al., 1989, 1990, 1992, Velissariou, 1993). In addition, an ozone exposure study was conducted on main Greek crops in fumigation chambers at Newcastle University (U.K.) from 1988 to 1990 (Velissariou, 1993, Velissariou & Davison, 1996). In recent years, tropospheric ozone impacts have been studied in major Greek cities (Saitanis et al., 2004; Riga-Karandinos & Saitanis. 2005; Riga-Karandinos et al., 2006), as well as in many rural places across the country (Saitanis & Karandinos, 2001; Saitanis, 2003, 2008; Kalabokas & Reparis, 2004).
Impacts of ozone on vegetation
Severe damages on agricultural crops (yield losses and/or commercial value losses) due to ozone toxicity have been reported in Greece since 1993, on crops like wheat, maize, cotton, potato, watermelon, muskmelon, beans, lettuce (Figure 1), onion, fodder crops (Velissariou, 1996, 1999; Velissariou et al., 2000; Fumagali et al., 2001). These damages usually occur during short term acute photochemical episodes (Figure 1), common in Mediterranean climates, all over the year and particularly in areas favouring temperature inversions. Transboundary ozone is also being detected in Greece, probably affecting crop plants and natural flora in the long term. Moreover, ozone toxicity symptoms have been detected on the needles of Greek fir (Abies cephalonica loud.) and high ozone concentrations have been measured in two Greek fir forest ecosystems: Parnis mountain in Attica (Velissariou & Skrekis, 1999) and Taygetos mountain in Peloponnese southern Greece, (Velissariou & Salmas, 2008). Bioindicator campaigns with Bel-W3 tobacco and white clover (Figure 2) have also shown high ozone levels in other mountainous regions (Central Peloponnese and Pelion Mountain, Thessaly) (Saitanis et al., 2004, 2006), causing visible leaf injury.
Figure 1 Left: A typical photochemical episode in the Greater Athens basin, over a four day period (9-13
October 1998). Damages appeared universally in an extensive agricultural area near to the
basin, just after the photochemical episode. Right: Leaf injury on glasshouse soilless lettuce
cultivation caused commercial value losses of € 15000 overnight, during this episode.
Ambient ozone fluctuation during a photochemical episode in
the Greater Athens basin, 9-13 October 1998
0
20
40
60
80
100
120
140
160
180
200
9/1
0/9
8 0
:00
9/1
0/9
8 4
:00
9/1
0/9
8 8
:00
9/1
0/9
8 1
2:0
0
9/1
0/9
8 1
6:0
0
9/1
0/9
8 2
0:0
0
10
/10
/98
0:0
0
10
/10
/98
4:0
0
10
/10
/98
8:0
0
10
/10
/98
12
:00
10
/10
/98
16
:00
10
/10
/98
20
:00
11
/10
/98
0:0
0
11
/10
/98
4:0
0
11
/10
/98
8:0
0
11
/10
/98
12
:00
11
/10
/98
16
:00
11
/10
/98
20
:00
12
/10
/98
0:0
0
12
/10
/98
4:0
0
12
/10
/98
8:0
0
12
/10
/98
12
:00
12
/10
/98
16
:00
12
/10
/98
20
:00
13
/10
/98
0:0
0
13
/10
/98
4:0
0
13
/10
/98
8:0
0
13
/10
/98
12
:00
13
/10
/98
16
:00
13
/10
/98
20
:00
DATE/TIME
Ozo
ne
Ho
url
y M
ean
in
pp
b
Short Term AOT40 = 1246 ppb.hours

60
Figure 2 Left: 3-month (May-July) AOT40 in Kalamata in 2003 in relation to the ozone critical level for
crops. Right: growth of an ozone-sensitive variety (on the left) and ozone-resistant variety (on the right) of white clover in ambient air during the same period.
Discussion, conclusions, recommendations Photochemicals and particularly tropospheric ozone are the dominating air pollution problem for vegetation in Greece in the last decades. High levels of tropospheric ozone due to the climatic conditions in Mediterranean countries, including Greece, such as strong and prolonged solar irradiation, favour ozone formation. Complex topography (valleys and basins) causing temperature inversions enhance the problem. Irrigated crops (vegetables, arable crops, etc.) are at high risk of ozone exposure due to high ozone uptake when water supply is non-limiting. Severe damages on agricultural crops (yield losses and/or commercial value losses) have been reported for the most important agricultural areas in the country (Thessaly, Peloponnese, Crete, etc.). Moreover, there is evidence that ozone may play important role to the decline of sensitive Greek fir (Abies cephalonica loud.) forest ecosystems. References Fumagalli, I., Gimeno, B. S., Velissariou, D., De Temmerman, L., Mills, G. (2001). Atmospheric Environment 35: 2583-2587. Holevas C.D. and Velissariou D.E. (1986). Airborne Fluoride injury to Vegetation in Greece. In : "How are effects of air
pollutants on agricultural crops influenced by interaction with other limiting factors". CEC, Concerted Action ‘Effects of Air Pollution on Terrestrial and Aquatic Ecosystems’, pp 119-123, RISO, Denmark, 1986.
Kalabokas and Reparis (2004). Atmospheric Chemistry and Physics 4:1139–1147. Riga-Karandinos and Saitanis (2005). Chemosphere 59:1125-1136. Riga-Karandinos et al (2006). International Journal of Environment and Pollution 27(4): 300-312. Saitanis (2003). Chemosphere 51(9):913-923. Saitanis (2008). Italian Journal of Agronomy 3(1):71-77. Saitanis and Karandinos (2001). Chemosphere 44:813-821. Saitanis et al. 2004. Bulletin of Environmental Contamination and Toxicology 72(6):1268-1277. Velissariou D. (1996). Phytopathol. Mediterr. 35: 228. Velissariou D. (1999). In : Critical Levels for Ozone - Level II. UNECE Convention on LRTAP, Edited by : Fuhrer J. & Acherman
B. Published by : SAEFL, Bern, 1999 (UM-115-E). pp 253-256. Velissariou D. and Davison A. W. (1996). Phytopathol. Mediterr. 35: 215. Velissariou D. and Salmas I. (2008). Phytopathol. Mediterr. 47: 162. Velissariou D. and Skretis L. (1999). In : Critical Levels for Ozone - Level II. UNECE Convention on LRTAP, Edited by : Fuhrer
J. & Acherman B. Published by : SAEFL, Bern, 1999 (UM-115-E). pp 205-208. Velissariou D., Barnes, J., Davison A., et al. (1990). Effects of ozone on crops and forests in Attica. Ιn : Environment : air
pollution and its effects on vegetation water and soil. Spanish-British Workshop. Madrid 2-5 Oct. 1990. Velissariou D., Davison A.W., Barnes J.D., et al. (1992). Atmospheric Environment 26A: 373-380.. Velissariou D., Venouziou J. and Papas K. (2000). Phytopathol. Mediterr. 39: 322. Velissariou D.E. (1993). Ozone sensitivity of important crop plants around Athens, Greece. PhD Thesis, University of
Newcastle Upon Tyne, UK. Velissariou D.E., Davison A. and Ollerenshaw J. (1989). Ozone in Greece. Summaries of Reports of the Committee for Air
Pollutions Effects Research (CAPER), Manchester University, April 1989.
3000
16108
0
3000
6000
9000
12000
15000
18000 A
OT
40 (
ppb h
) Critical Level
Critical Period
(13 days missing)

61
Macedonia
Lead institute: Trajče Stafilov (Coordinator), Lambe Barandovski, Katerina Bačeva, Faculty of Natural Sciences
and Mathematics, Ss. Cyril and Methodius University, POB 162, 1000 Skopje, Macedonia. [email protected]; [email protected]; [email protected]
Collaborating institutes: Marina V. Frontasyeva, Frank Laboratory of Neutron Physics, Joint Institute for
Nuclear Research, str. Joliot-Curie, 6, 141980 Dubna, Moscow Region, Russian Federation. [email protected] Robert Šajn, Geological Survey of Slovenia, Dimičeva ul. 14, 1000 Ljubljana, Slovenia. [email protected]
Background The Republic of Macedonia was involved in the European moss survey under UNECE ICP Vegetation for the first time in 2002, when the atmospheric deposition of trace elements was studied in the whole country. The moss survey was also performed again in 2005 and 2010 using samples of terrestrial mosses Hypnum cupressiforme Hedw. and Homalothecium sericeum (Hedw.) B.S. & G. Moss samples were collected at 73 sites in 2002 and at 72 sites in 2005 and 2010 evenly distributed over the area of the country, using a dense net of 17x17 km
2 in accordance with the sampling strategy of
the European moss survey programme. The analyses of 42 elements were performed by using of neutron activation analysis (NAA) and atomic absorption spectrometry (AAS) as analytical techniques. The most important emission sources were determined (smelters and drainage systems near the towns of Veles, Tetovo, Kavadarci and Radoviš, as well as mines Sasa, Toranica and Zletovo in the east), and some uranium deposition patterns were identified from the activity of power plants (near Bitola and Kičevo) using lignite coal as fuel. Concentrations of heavy metals and nitrogen To determine the content of various elements in the mosses collected in 2010, AAS, ICP-AES and NAA were used. The content of 18 elements (Al, Ba, Ca, Cd, Co, Cr, Cu, Fe, K, Li, Mg, Mn, Ni, P, Pb, Sr, V and Zn) was determined by using AAS and ICP-AES. The analyses were performed at the Institute of Chemistry, Faculty of Natural Sciences and Mathematics, Skopje, Macedonia, while NAA was performed at the Joint Institute for Nuclear Research, Frank Laboratory of Neutron Physics, Department of Neutron Activation Analysis in Dubna, Russian Federation. The content of 42 elements was determined: (Na, Mg, Al, Cl, K, Ca, Sc, Ti, V, Cr, Mn, Fe, Co, Ni, Cu, Zn, As, Se, Br, Rb, Sr, Zr, Mo, Ag, In, Sb, I, Cs, Ba, La, Ce, Sm, Eu, Tb, Dy, Yb, Hf, Ta, W, Au, Th, and U). For the determination of the content of N, the Kjeldahl analytical method was applied. Results and discussion Analysing the trend of the median values calculated for the three moss surveys in Macedonia, it can be seen that in the last survey lower median values are observed for all elements, usually related to heavy metal pollution. The analysis with AAS as well as ICP-AES (2010 survey) is based on nitric acid digestion, and in non-destructive NAA determination (2002 and 2005 surveys) the total amount of the elements in question is analysed. The lower median values for Al, Ba, Ca, Cr, Cu, Fe, K, Mg, Mn, Na, Ni, Sr, V and Zn in 2010 can be explained by the difference of the analytical techniques and potentially not determining the total amount of elements using nitric acid digestion, due to their refractory minerals. Due to the intensive ferronickel production in Kavadarci region, the median value for nickel, in the 2005 survey is 2.5 fold higher than the data obtained for 2002. There are cases when the content of some anthropogenic elements are lower in the 2005 survey than those reported for 2002 (As, Cr, Cu, Sb, Se). For example, the newly introduced protective measures on the slag dump from the closed ferrochromium smelter located near Tetovo, contributed a decrease in the content of Cr in the samples from 2005 compared to 2002.
To explain the variation and to reveal associations of chemical elements all moss samples were examined by multivariate analysis. Five factors were identified and 80.3% of the variability of the investigated elements is explained. Factors were identified by visual inspection of similarities of spatial distribution of element patterns, the correlation coefficient, comparison of basic statistical parameters and the results of multivariate analyses. Factor 1 (As, Al, Ce, Cs, Dy, Fe, Hf, La, Li, Mg, Na, Nd, Yb, Sc, Sm, Ta, Tb, Th, Ti, U, V, W, Zr) represents chemical elements that are naturally distributed near to the region of Bitola, which is affected by the fly ash from the power plant using coal as a fuel and where the content of U and Th is higher than in the other regions. The content of these elements in mosses is significantly influenced by mineral particles released into the atmosphere by wind erosion of local sources or particles attached to the moss in the periods when the soil surface is

62
covered by water. Factor 2 (Ni, Cr, Co) represents a mixed (geogenic-anthropogenic) association of elements. These elements are affected primarily by natural factors such as lithological background, but are also affected by anthropogenic influence (ferronickel smelter plant near the town of Kavadarci). Factor 3 (Cd, Pb, Sb, Zn) represents the second anthropogenic geochemical association of elements due to the activities of three Pb-Zn mines in the eastern part of the country and due to the pollution from the former Pb-Zn smelter plant in the town of Veles. Factor 4 (Sr, Ba) represents another geogenic association of elements with the highest factor scores in the north-eastern part of the country. Factor 5 (I, Br) indicates marine influences and the highest values of these elements are present in the south-central and eastern part of the country. The spatial distribution of Factors scores is shown in Figure 1.
Figure 1 Spatial distribution of Factor 1 (As, Al, Ce, Cs, Dy, Fe, Hf, La, Li, Mg, Na, Nd, Yb, Sc, Sm, Ta,
Tb, Th, Ti, U, V, W, Zr), Factor 2 (Ni, Cr, Co), Factor 3 (Cd, Pb, Sb, Zn), Factor 4 (Sr, Ba) and Factor 5 (I, Br) scores for element concentrations in mosses.
Nitrogen was also analyzed in the moss samples collected in 2005 and 2010 survey. The median value of nitrogen in moss samples was 1.21% (range: 0.70 - 1.54%) in 2005 and 1.06% (range: 0.68 - 1.75%) in 2010.
The results obtained from the investigation show that in comparison with similar studies made in neighbouring countries the pollution situation in the Republic of Macedonia is more favourable, but comparison with more pristine territories in other parts of Europe still shows that the country is exposed to considerable atmospheric metal pollution. Trends of lower median content in the mosses is noticeable in recent years for some elements, due to closing of some of the smelters, using non-leaded fuels and some protective measures taken for some of the dump slugs in the country.
References L. Barandovski, M. Cekova, M. V. Frontasyeva, S. S. Pavlov, T. Stafilov, E. Steinnes, V. Urumov (2008). Atmospheric
deposition of trace element pollutants in Macedonia studied by the moss biomonitoring technique, Environmental Monitoring and Assessment 138: 107-118.
L. Barandovski, M. V. Frontasyeva, T. Stafilov, R. Šajn, S. Pavlov, V. Enimiteva (2012). Trends of atmospheric deposition of trace elements in Macedonia studied by the moss biomonitoring technique, Journal of Environmental Science and Health, Part A, 47(13): 2000-2015.
L. Barandovski, T. Stafilov, R. Šajn, M. V. Frontasyeva, K. Bačeva, Air pollution study in Macedonia by using moss biomonitoring technique ICP-AES and AAS (2013). Macedonian Journal of Chemistry and Chemical Engineering, 32(2): 265-281.

63
Romania
Lead institute: Ion V. Popescu, Claudia Stihi, Valahia University of Targoviste, Faculty of Sciences and Arts,
Targoviste, Romania. [email protected], [email protected] Collaborating institute(s): Antoaneta Ene, Dunarea de Jos University of Galati, Faculty of Sciences and
Environment, Galati, Romania. [email protected] Simona Cucu-Man, Alexandru Ioan Cuza University of Iasi, Romania. [email protected] Radu Todoran, Technical University of Cluj-Napoca, North University Center, Baia Mare, Romania. [email protected] Marina V. Frontasyeva, Otilia Culicov, Joint Institute for Nuclear Research, Dubna, Russian Federation. [email protected], [email protected]
Background
The first systematic study on atmospheric pollution from heavy metals and other toxic elements based on moss analysis was undertaken as a Romanian–Russian–Norwegian collaboration, in order to assess the general state of heavy metal pollution in Romania in the period 1995–2001 (Lucaciu et al., 2004 and the citations herein). The results on moss samples collected in different regions of Romania in 1990, 1995 and 2000 were unified and reported by Harmens et al. (2008); Romania did not submit data for the 2005/6 European moss survey.
Results and discussion
Nationwide moss survey undertaken in 2010/2011 by four Romanian Universities from Targoviste, Galati, Iasi and Baia Mare comprised 330 sampling sites evenly distributed over 75% of the Romanian territory. A total of 34 elements (Na, Mg, Al, Cl, K, Ca, Sc, Ti, V, Cr, Mn, Fe, Co, Ni, Cu*, Zn, As, Br, Rb, Sr, Cd*, Sb, Ba, Cs, La, Ce, Sm, Tb, Hf, Ta, W, Pb*, Th, and U) were determined in the large-scale concentration range — from 10000 mg/kg for Al and K to 0.001 mg/kg for some rare earth elements — by two complementary methods: instrumental epithermal neutron activation analysis (INAA) at the IBR-2 reactor at the Joint Institute for Nuclear Research at Dubna, Russian Federation, and graphite furnace/flame atomic absorption spectrometry (GFAAS /FAAS)
* in the Multidisciplinary Research Institute for Science
and Technologies from Valahia University of Targoviste, Romania. Principal component (factor) analysis was used to identify the most polluted areas and characterize different pollution sources. Four factors were revealed (Figure 1).
Figure 1 Spatial distribution of factor scores based on element concentrations in mosses in Romania in
2010.
Factor 1 is a mixture of light and heavy crust components (Na, Al, Sc, Ti, V, Cr, Fe, Ni, Co, Ba, La, Ce, Sm, Tb, Hf, Ta, W, Th, U). Factor 2 is of anthropogenic origin: Zn (0.82), As (0.73), Sb (0.92), the

64
main contributors to this factor being mining and industrial sites from north-western parts of the country. Factor 3 is a mixture of "marine elements" Cl (0.79) and Br (0.62); Ca (0.78), K (0.57) and Sr (0.45) may originate from fertilizer components — Sr most probably originates from phosphate fertilizers in agricultural areas and Ca and K from saltpeter (nitre) ones. Factor 4 comprises Pb (0.63), Cd (0.66), Cu (0.64) which can originate from gasoline or copper mining industry. Although the concentrations of heavy metals in mosses collected in Romania are high compared to other European countries (Harmens et al., 2013), the temporal trends presented in Figure 2 based on the reported values (Harmens et al., 2008, 2013) for selected metals reveal a decrease for the majority of elements, with the exception of Pb, Cd and Cu.
Figure 2 Temporal trends of metal concentrations in mosses in Romania since 1990.
Conclusion From the presented results it can be concluded that atmospheric deposition of trace metals is a considerable problem in the northern and western parts of Romania. This study contributes to the national monitoring system of Romania for long range transported elements of air pollutants, and along with epidemiological data it may serve as a baseline for human health risk assessments. References Lucaciu, A., Timofte, L., Culicov, O., Frontasyeva, M.V., Oprea, C., Cucu-Man, S., Mocanu, R., Steinnes, E. (2004).
Atmospheric deposition of trace elements in Romania studied by the moss biomonitoring technique, Journal of Atmospheric Chemistry 49: 533–548.
Harmens, H., Norris, D. & the participants of the moss survey (2008). Spatial and temporal trends in heavy metal accumulation in mosses in Europe (1990-2005). Programme Coordination Centre for the ICP Vegetation, Centre for Ecology and Hydrology, Bangor, UK.
Harmens, H., Norris, D., Mills, G., and the participants of the moss survey (2013). Heavy metals and nitrogen in mosses: spatial patterns in 2010/2011 and long-term temporal trends in Europe. ICP Vegetation Programme Coordination Centre, Centre for Ecology and Hydrology, Bangor, UK.

65
Russian Federation
Lead institute: Marina V. Frontasyeva, Joint Institute for Nuclear Research, Dubna, Russian Federation,
Collaborating institutes: Anatoly M. Dunaev, Ivanovo State University of Chemistry and Technology,Ivanovo,
Juliya Koroleva, Immanuel Kant Baltic Federal University, Kaliningrad, [email protected]; Inna V. Vikhrova, Municipal Educational Centre, Tikhhvin, Leningradskaya Region; Nina A. Lebedeva, Liceum # 1, Volgorechensk, Kostromskaya Region.
Background
The sporadic contributions of the Russian Federation to the European moss survey started in the early nineties of the last century in North-West Russia, Sankt-Petersburg, Kaliningrad, Pskov, Novgorod, part of Vologda and part of Karelia (by Goltsova and Fedoretz; Goltsova et al., 1992; Kharin et al., 2001). In 2000, results from Central Russia, Tver, Yaroslavl and Tula Regions were reported (by Ermakova and Frontasyeva; Ermakova et al., 2004). The next moss survey in 2005 was represented by the South Urals, part of the Republic of Udmurtia (by Pankratova and Frontasyeva; Yu et al., 2009) and the region North-East of Moscow Region (by Vergel and Frontasyeva; Vergel et al., 2009). In 2010/2011, moss sampling was carried out in Central Russia, in Ivanovo Region, and on a local scale around the towns of Tikhvin, Lenindradskaya Region, and Volgorechensk, Kostromskaya Region. Apart from maybe Vologda, all sampled areas are affected by industrial activity, such as ferrovanadium plant “Vanadium-Tula” in the city of Tula, ferrochromium smelter “Tikhvin Ferroalloy Plant” in the Tikhvin district known for its bauxite, limestone and dolomite deposits, and many others. A clustering of heavy and machine industries in the Republic of Udmurtia along with oil mining and processing industry severely affect the environment in this area.
Results and discussion
The moss survey in 2010/2011 was undertaken by the postgraduate students of Ivanovo State University of Chemistry and Technology and two teachers and their pupils of the secondary schools in Tikhvin and Volgorechensk districts in collaboration with the Joint Institute of Nuclear Research in Dubna, which provided neutron activation analysis (NAA) at the reactor IBR-2 of FLNP JINR. Ivanovo State University of Chemistry and Technology provided atomic absorption spectrometry (AAS) for the samples from their region. The results obtained by AAS from the last moss survey in 2010 in Kaliningrad by Koroleva and colleagues (Koroleva et al., 2012), though not included in the report of the 2010/2011 European moss survey, were presented at the 27
th ICP Vegetation Task Force meeting in Paris (Tables 1 and 2).
Table 1 Median metal concentrations (mg/kg) in mosses in the Kaliningrad Region from 1994–2010.
year Cu Zn Mn Fe Ni Pb Ag Cr Cd
1994
5.26 37 - 530 1.85 8.05 - 1.58 0.29
2000
5.03 29 256 192 4.11 13.5 0.13 0.14 0.12
2005
9.59 36 139 220 3.55 4.63 0.04 0.99 0.21
2010 2.84 - 245 168 1.21 1.91 0.03 1.41 0.05
Table 2 Heavy metal concentrations in Pleurozium shreberi in the Kaliningrad Region in 2010 (mg/kg).
Cu Ni Pb Cr Cd Ag Mn Fe
mean 4.46 1.20 2.51 2.16 0.109 0.044 346 217
min 1.68 0.36 0.39 0.69 0.006 0.007 73 113
max 19.7 2.54 9.33 12.1 1.12 0.233 960 700
The low values (relatively to Norwegian ones) are evidence for the absence of potential sources of heavy metal emissions in Kaliningrad. The highest concentrations were determined in the western part (Sambia peninsula, Baltic Sea coast), elevated levels were observed in the North, North-East and South-West parts, and the lowest ones were in the centre of the Region. A total of 34 elements (Na, Mg, Al, Cl, K, Ca, Sc, Ti, V, Cr, Mn, Fe, Co, Ni, Cu*, Zn, As, Br, Rb, Sr, Cd*, Sb, Ba, Cs, La, Ce, Sm, Tb, Hf, Ta, W, Pb*, Th, and U) were determined by NAA and AAS (marked with *) in

66
moss samples collected in Ivanovo region, Tikhvin and Vilgorechensk districts. Some results of moss samples collected from the Ivanovo Region are shown in Figures 1 and 2.
Figure 1 Distribution map of the molybdenum concentration (mg/kg) in moss in Ivanovo Region in 2010.
Industrial activity is not a characteristic feature for the Ivanovo Region, except for small industrial enterprises in the city of Ivanovo. Therefore, the main contribution in atmospheric deposition is due to transboundary air pollution. The most probable sources of emission of pollutants are situated in the neighbouring regions (Yaroslavl, Kostroma, Vladimir): oil-refinery, metal processing, thermal power plants, and chemical industry. The combined analysis of moss and associated soil allows establishing the main source of anthropogenic impact on the wildlife preserve “Klyazminskii”. These are metallurgical plants in Kovrov and Klyazminskii gorodok. Tula and Udmurtia are industrial centres and show the highest concentrations for most of the heavy metals (Figure 2).
Figure 2 Comparison of the mean values of some trace element concentrations (mg/kg) in moss in Ivanovo,
Yaroslavl, Tula Regions and the Republic of Udmurtia. Y-axis: logarithmic scale.
An example of the deposition patterns of Fe and Cr, the main contaminants of the town of Tikhvin in
Leningradskaya Region, is shown in Figure 3.
Element
Concentration
moss (mg/kg)

67
Figure 3 Distribution maps for iron (left) and chromium (right), the main contaminants of the “Tikhvin
Ferroalloy Plant” in the Tikhvin district.
It was shown that the main source of contamination of the environment in the town of Volgorechensk of Kostromskaya Region is the thermal power plant allocated in the suburbs of the town. Multivariate statistical analysis (PCA) was applied to the analytical results obtained for all samples areas to reveal and characterize the pollution sources.
Conclusions
It follows from the results obtained in the moss survey 2010/2011 in the sampled areas under different
anthropogenic loadings of pollutants that contamination with heavy metals and other toxic elements is
rather local but it may lead to the environmental stress. Attempts were made to use the results in
environmental and human health risk assessments.
References N.I. Goltsova, T.V. Vasina (1992). Heavy metal content in fores moss Pleurozium schreberi in Leningradskaya Region.
Environmental Chemistry 2:.27. V. N. Kharin, N.G. Fedorets, G V. Shiltsova, V.V. Dyakonov, E.N. Spektor (2001). Geographic trends in the accumulation of
heavy metals in mosses and forest litters in Karelia. Russian Journal of Ecology 32: 138–141. Translated from Ekologiya 2: 155–158.
E.V. Ermakova, M.V. Frontasyeva, S.S. Pavlov, E.A. Povtoreyko, E. Steinnes, Ye.N. Cheremisina (2004). Air pollution studies in Central Russia (Tver and Yaroslavl Regions) using the moss biomonitoring technique and neutron activation analysis. Journal of Atmospheric Chemistry 49: 549-56.
K.N. Vergel, M.V. Frontasyeva, I.Z. Kamanina, S.S. Pavlov (2009). Biomonitoring of atmospheric heavy metal deposition in the north-east of Moscow Region by means of moss biomonitoring technique. Ecology of Urbinized Terrotories (RF) 3: 88-95 (in Russian).
Yu. S. Pankratova, M.V. Frontasyeva, S.S. Pavlov, N.I. Zelnitchenko (2009). Atmospheric pollution in the Republic of Udmutria – estimations based on moss analysis. Problems of Regional Ecology 1: 57-63, с. 99-107.
Koroleva Y.V., Barinova G.M., Krasnov E. V. (2012). Indicative Modeling and Spatial Evaluation of Air Pollution Risk: Risk Models and Application, Collected Paper, Co-Data - Germany, Berlin, p. 23-34.
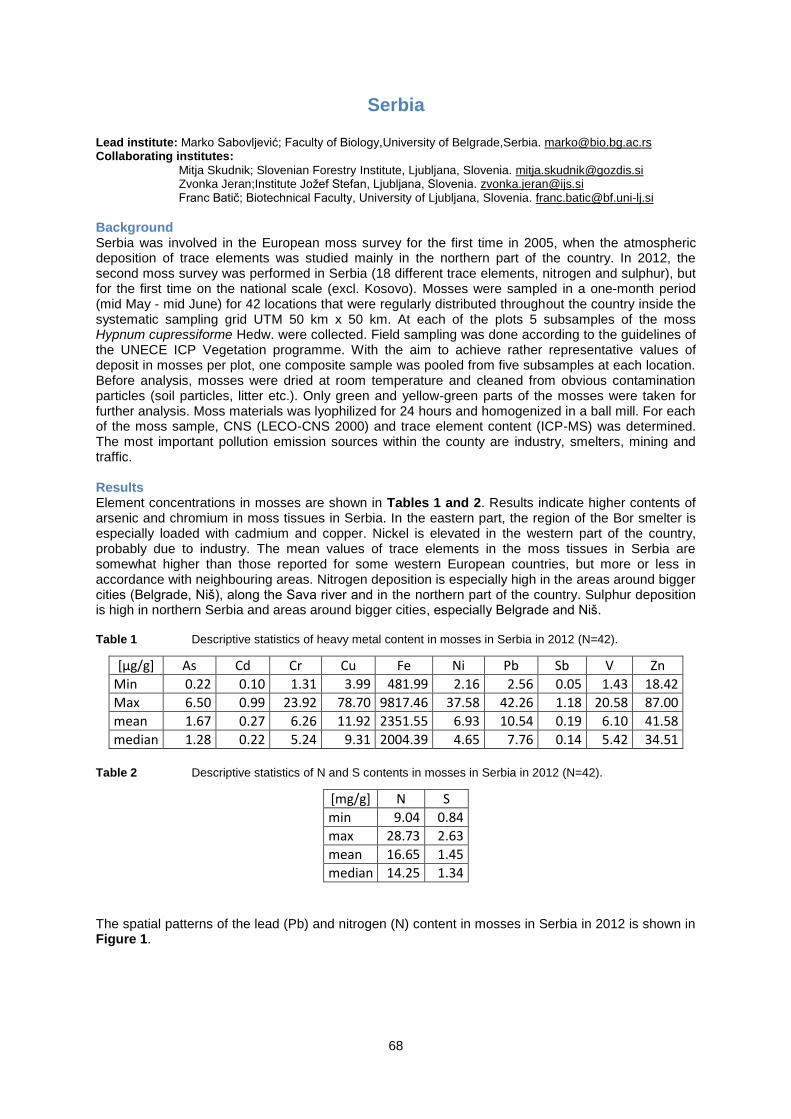
68
Serbia
Lead institute: Marko Sabovljević; Faculty of Biology,University of Belgrade,Serbia. [email protected] Collaborating institutes:
Mitja Skudnik; Slovenian Forestry Institute, Ljubljana, Slovenia. [email protected] Zvonka Jeran;Institute Jožef Stefan, Ljubljana, Slovenia. [email protected] Franc Batič; Biotechnical Faculty, University of Ljubljana, Slovenia. [email protected]
Background Serbia was involved in the European moss survey for the first time in 2005, when the atmospheric deposition of trace elements was studied mainly in the northern part of the country. In 2012, the second moss survey was performed in Serbia (18 different trace elements, nitrogen and sulphur), but for the first time on the national scale (excl. Kosovo). Mosses were sampled in a one-month period (mid May - mid June) for 42 locations that were regularly distributed throughout the country inside the systematic sampling grid UTM 50 km x 50 km. At each of the plots 5 subsamples of the moss Hypnum cupressiforme Hedw. were collected. Field sampling was done according to the guidelines of the UNECE ICP Vegetation programme. With the aim to achieve rather representative values of deposit in mosses per plot, one composite sample was pooled from five subsamples at each location. Before analysis, mosses were dried at room temperature and cleaned from obvious contamination particles (soil particles, litter etc.). Only green and yellow-green parts of the mosses were taken for further analysis. Moss materials was lyophilized for 24 hours and homogenized in a ball mill. For each of the moss sample, CNS (LECO-CNS 2000) and trace element content (ICP-MS) was determined. The most important pollution emission sources within the county are industry, smelters, mining and traffic. Results Element concentrations in mosses are shown in Tables 1 and 2. Results indicate higher contents of arsenic and chromium in moss tissues in Serbia. In the eastern part, the region of the Bor smelter is especially loaded with cadmium and copper. Nickel is elevated in the western part of the country, probably due to industry. The mean values of trace elements in the moss tissues in Serbia are somewhat higher than those reported for some western European countries, but more or less in accordance with neighbouring areas. Nitrogen deposition is especially high in the areas around bigger cities (Belgrade, Niš), along the Sava river and in the northern part of the country. Sulphur deposition is high in northern Serbia and areas around bigger cities, especially Belgrade and Niš. Table 1 Descriptive statistics of heavy metal content in mosses in Serbia in 2012 (N=42).
[µg/g] As Cd Cr Cu Fe Ni Pb Sb V Zn
Min 0.22 0.10 1.31 3.99 481.99 2.16 2.56 0.05 1.43 18.42
Max 6.50 0.99 23.92 78.70 9817.46 37.58 42.26 1.18 20.58 87.00
mean 1.67 0.27 6.26 11.92 2351.55 6.93 10.54 0.19 6.10 41.58
median 1.28 0.22 5.24 9.31 2004.39 4.65 7.76 0.14 5.42 34.51 Table 2 Descriptive statistics of N and S contents in mosses in Serbia in 2012 (N=42).
[mg/g] N S
min 9.04 0.84
max 28.73 2.63
mean 16.65 1.45
median 14.25 1.34
The spatial patterns of the lead (Pb) and nitrogen (N) content in mosses in Serbia in 2012 is shown in Figure 1.

69
Figure 1 Spatial patterns of Pb (left) and N (right) content in the moss Hypnum cupressiforme in Serbia
in 2012 per 50 km x 50 km grid.
Discussion, conclusions, recommendations The spatial variability of trace elements, nitrogen and sulphur, accumulated in mosses correlates well with the spatial variability in the level of the industrialization, traffic intensity and other anthropogenic activities. Because the analysis was done for the first time on the national scale, we cannot report on temporal trends. The abundance of the moss Hypnum cupressiforme is not equal in the whole territory of Serbia. In some areas (especially in northern parts of the country) it was difficult to collect five sub-samples at suitable sites. The monitoring with some other moss species should be regarded as an option. Microhabitat characteristics could be the reason for slightly differences in deposit values, due to the differences to precipitate exposures and further studies are needed. Individual and regional efforts, so far, do not allow for extensive analyses, such as long-term spatial deposition changes, spatial pattern changes or temporal national or transboundary patterns. Both research and/or screening as well as permanent monitoring are needed. National monitoring systems of atmospheric deposition including moss survey should be established long term as a National air quality control programme.
The authorities should establish a national network for atmospheric pollution biomonitoring, as well as national permanent sampling plots. Moss monitoring with at least the current sampling density, expanded to include more atmospheric pollutants and new technologies should be established. The nationwide moss survey should be conducted frequently, providing a detailed record of spatial patterns and temporal trends of atmospheric deposition over Serbia. This is an important and valuable supplement to the national monitoring of trace metals in precipitation, which is limited to a small number of sites.

70
Slovenia
Lead institutes: Franc Batič, Boris Turk, University of Ljubljana, Biotechnical Faculty, Agronomy Department.,
Jamnikarjeva 101, 1000 Ljubljana, Slovenia; [email protected], [email protected] (ozone research). Zvonka Jeran, Darja Mazej, Jožef Stefan Institute, Department of Environmental Sciences, Ljubljana, Slovenia; [email protected], [email protected] (moss survey).
Collaborating institutes: Nataša Kopušar Institute for Ecological Research Velenje, Koroška cesta 58, 3320
Velenje; [email protected] (ozone research). Mitja Skudnik, Daniel Žlindra, Slovenian Forestry Institute, Ljubljana, Slovenia;
[email protected], [email protected] (moss survey).
Background
Slovenia has been involved in the European moss survey since 1995 and in ozone research since 1996. Mosses have been collected every five years between the middle of June and the end of July on a regular grid. The following elements were determined: As, Cd, Cr, Co, Cu, Fe, Hg, Mo, Ni, Pb, Sb, Se, Sr, V, Ti and Zn. Since 2001, nitrogen and sulphur were included, and in 2010 the first results for polycyclic aromatic hydrocarbons (PAHs) in mosses were obtained from a selected number of plots. Regarding ozone, the main objective is to monitor effects of tropospheric ozone on crops and semi-natural vegetation in agreement with the Slovenian National Environmental Program. Three permanent experimental sites were established by the group in Ljubljana representing air pollution and land use types in Slovenia: Ljubljana (urban site with moderate level of ozone), Iskrba (rural site, with elevated level of ozone) and Rakican (EMEP station, rural site important for crop production, affected by high traffic) and several sites around the thermal power plant Šoštanj established by the group in Velenje. In the years 1996-2007, white clover (Trifolium repens ‘Regal’) was used as indicator species, then brown knapweed (Centaurea jacea) and bush bean (Phaseolus vulgaris) were introduced as ozone indicators in 2008-2010 following the ICP Vegetation protocols.
The emissions of ozone precursors in Slovenia are showing 41% decline from 1990 to 2011. NOx emissions declined 25%, CO emissions 56%, non-methane VOCs 51% and methane emissions 7%. The main reason for the decline is introduction of new emission standards for motor vehicles. Additional reasons for the decline are new legislation on storing and transport of fuels, technological improvements in thermal power plants, installation of exhaust cleaning devices and improvement of incineration processes in industry. Tropospheric ozone concentration shows distinct fluctuation during the year, and among the years, depending on sunlight. They are the highest in the western parts of Slovenia, due to the transboundary transport of precursors from northern Italy. Measured ozone concentrations are mostly above target values, all over the country. No significant trend can be observed in long-term measurements of ozone concentrations.
Results
Ozone. Tropospheric ozone concentrations, expressed as AOT40 values, are showing fluctuation with time, mostly depending on weather conditions and thus not following the general ozone precursors decline, discussed above (Figure 1). Due to transboundary inflow of precursors and higher elevation, significantly higher concentration are observed at the Iskrba site.
Figure 1 AOT40 calculated at three sites in Slovenia between 1998 and 2007.
0
5000
10000
15000
20000
25000
30000
1998 1999 2000 2001 2002 2003 2004 2005 2006 2007
AO
T40 (
pp
b h
)
Year
Cumulative AOT40 (April - October)
Ljubljana
Iskrba
Rakičan

71
Observed ozone-induced leaf injuries of white clover (Figure 2) showed some correlation with measured AOT40 values of ozone, but are confounded by other environmental influences (drought, temperature, pests) and the subjective nature of assessment (different assessors with time and location). White clover proved not to be a reliable indicator of ozone impacts on plants, at least at such small scale, bush bean seems to be slightly more reliable (data not shown).
Figure 2 Ozone-induced leaf injury on white clover for an ozone sensitive and resistant clone.
Figure 3 Concentrations of cadmium and nitrogen in H. cupressiforme collected at 102 locations in
Slovenia in 2010 (left) and concentrations of cadmium and nitrogen at 32 plots which were the same in the last three surveys, i.e. 2001, 2006 and 2010 (right).
Heavy metals and nitrogen. The overall spatial pattern (Figure 3) of levels of anthropogenically derived elements especially Pb, Cd, Mo, Zn, Sb and N in Slovenia can be explained on the one hand by the population density and the locations of the main pollution sources (steel factories at Jesenice and Ravne, coal burning thermal power plants at Šoštanj and Trbovlje, a former Pb-smelter) and on the other hand by transboundary transport of air pollutants from neighbouring countries, mainly as a consequence of meteorological conditions (wind, precipitation). The northern and north-western parts of Slovenia are the regions receiving the highest yearly amounts of precipitation, while the precipitation pattern gradually decreases toward the east. The heavy transit traffic that crosses
0
0.5
1
1.5
2
2.5
3
3.5
S R S R S R S R S R
2003 2004 2005 2006 2007
Inju
ry c
lass
Median of injury class (Trifolium repens 'Regal' ozone sensitive [S] and resistant [R] clone)
Ljubljana
Iskrba
Rakičan

72
Slovenia along the diagonal from the port of Koper or Gorica in the south-west to the Hungarian or Austrian border in the north-east might be an additional source of traffic-derived metals such as Sb, as well as for N. Higher values of N in moss in the north-eastern region can additionally point to the agricultural activity that dominates this area.
Similar to the majority of European countries, a decrease of heavy metal concentrations in mosses was observed in Slovenia since 1995 (Figure 4), which was most probably due to economic factors because some of the heavy polluters have shut down or modernized their technology to reduce emissions. Another reason for the relatively big decline between 2005 and 2010 could be a change in sampling strategy. Influence of canopy drip was avoided in 2010. Comparative analyses had shown that significantly higher concentrations were found in mosses under the canopy in comparison to those at least 1 m away; on average about 20% for Cu, As and Hg, to up to 30- 50% for Cu, Hg, Ni, V, Pb and N 3 m away from the nearest tree.
Figure 4 Median Cd and N concentrations in H. cupressiforme in 2001 at 82 plots, 2006 at 57 plots and
2010 at 102 plots (blue line) and at the same 32 plots (green line) in all three surveys.
Discussion, conclusions, recommendations
Biomonitoring of tropospheric ozone effects in Slovenia, carried out within the activity of ICP-
Vegetation, has proven that there is a high potential for ozone formation in the country but the
observed damage on bioindicator plants used was much smaller than expected, based on AOT
values. The reason for this discrepancy might be over-sensibility of used indicator plants to drought
stress, especially white clover, what was proven by some diurnal measurements of photosynthesis
and transpiration at the site in Ljubljana. We got similar results with bush bean when the plants were
covered with a hail protection net. The net reduced sunlight intensity and typical ozone damages were
observed in both biotypes of plants. High potential risk of ozone damage on plants was also proven
by ozone biomonitoring with tobacco (Nicotiana tabacum 'Bel-W3') and the high frequency of ozone
damage on forest vegetation and ornamental plants. Biomonitoring of ozone impacts on vegetation as
developed within activities of Working Group on Effects of the LRTAP Convention should be
integrated in the future in European environmental policy and common agro-environmental
programmes to ensure continuity and enhance chances of funding.
Although there were slight modifications in moss sampling over the 15 year period, the spatial pattern of elements and their temporal trends reflect the overall pollution in the country, as well as the natural background. The application of factor analysis to the moss data resulted in similar elemental associations in a particular factor and its spatial distribution in all three surveys, including a lichen survey (Jeran et al., 2007). Moss monitoring should be used in the future as a supplement to the official national air monitoring programmes performed by the Slovenian Environment Agency, as it could provide additional data on air pollution (elements, nitrogen, organic pollutants and radionuclides) at a higher number of sites than covered by their current programmes. References Jeran, Z., Mrak, T., Jaćimović, R., Batič, F., Kastelec, D., Mavsar, R., Simončič, P. (2007). Epiphytic lichens as biomonitors of
atmospheric pollution in Slovenian forests. Environmental pollution 146: 324-331.
0,00
0,10
0,20
0,30
0,40
0,50
2001 2006 2010
Cd (µg/g
)
median (32) median (82,57,102)
0,00
0,50
1,00
1,50
2,00
2,50
2001 2006 2010
N %
median (32) median (82,57,102)
Figure 2: Median Cd and N concentrations in H. cupressiforme in 2001 at 82 plots, 2006 at 57 plots and
2010 at 102 plots and at the same 32 plots in all three surveys.

Air Pollution: Deposition to and impactson vegetation in (South-)East Europe,Caucasus, Central Asia (EECCA/SEE) and South-East Asia
This report is a synthesis of current knowledge on the deposition of air pollutants toterrestrial ecosystems and their impacts on vegetation in countries in Eastern Europe,Caucasus and Central Asia (EECCA), South-East Europe (SEE) and South-East Asia (Malé Declaration countries). Pollutants included are primarily ozone, nitrogen and heavy metals but also persistent organic pollutants (POPs) for EECCA/SEE countriesand black carbon (as a component of aerosol) for South-East Asia. One of the currentpriorities of the Convention on Long-range Transboundairy Air Pollution (LRTAP) is the ratification of its Protocols by EECCA countries, with the aim to reduce airpollution in those countries and in neighbouring countries from long-range transport. In recent decades, the decline in air pollution in EECCA and SEE countries has generallybeen lower than the reductions achieved in Northern, Western and Central Europe.Furthermore, the Convention is keen to stimulate outreach activities to regions outsidethe UNECE area. Hence the focus of this review on the above-mentioned countries.
For further information or copies contact: Harry HarmensCentre for Ecology and Hydrology Environment Centre WalesDeiniol RoadBangorGwynedd LL57 2UWUnited KingdomTel.: +44 (0) 1248 374500 Fax: +44 (0) 1248 362133 Email: [email protected]
ICP Vegetation web site:http://icpvegetation.ceh.ac.uk
ISBN: 978-1-906698-48-5