China's Water Pollution Crisis
19
China’s Water Pollution Crisis Diagnosis and Comparative Policy Analysis 5/7/2013 Lucas Blaustein
-
Upload
independent -
Category
Documents
-
view
0 -
download
0
Transcript of China's Water Pollution Crisis

China’s Water Pollution Crisis Diagnosis and Comparative Policy Analysis
5/7/2013
Lucas Blaustein
B l a u s t e i n
Page 1
The Economics of Environmental Quality
Environmental pollution is understood as the negative effects that users of the
environment experience as a consequence of that environment’s degradation (Ward).
These negative effects manifest in many forms, but all are generally referred to as
damages. With these damages come ablative costs – cleaning up an oil spill or
increased filtration are both examples of ablative costs incurred by society when the
environment is damaged. The relationship
between damages and ablative costs
results in a simple trade-off situation,
where reducing emissions minimizes the
damages of environmental degradation,
but also robs resources from other areas
of the economy (Field).
Simple quantitative tools exist to measure the relationship between the functional forms
of these damages and costs. Shown graphically in figure 1; there is an understood
efficient level of emission, where marginal damages equal marginal ablative costs.
Because a trade-off exists, an equilibrium level of emission is formed, where society
reaps the maximum benefits of having a clean environment, without sacrificing too
many resources in the attempt to rectify environmental pollution.
Figure 1
B l a u s t e i n
Page 2
While all pollutants share some characteristics, differences are abundant. In order to
correct for these differences, environmental policy must consider the unique attributes
of each form of pollutant. In terms of water resource economics, water pollution
manifests in two unique ways that are particularly important when constructing relevant
water policy: 1) recreation benefits are significant when considering water pollution
control; and 2) large economies of scale in water treatment allow for one centralized
system of environmental cleanup (Tietenberg).
In terms of environmental pollution, water is divided along its two main categories –
surface and ground. In terms of ground water, most forms of pollutants infiltrate ground
water supplies through leaching into water saturated regions. Once such pollutants
become present in a ground water supply, they are much harder to remove. Unlike
ground water, surface water pollutants further divide into point and non-point sources.
Non-point sources affect water diffusely and indirectly, whereas point sources are
usually associated with discharge directly into surface water from a specific location.
The last division that takes place when discussing water pollution is determined by the
environments capacity to handle the pollutant. Fund pollutants are defined as having
some assimilative capacity, so that either over time, or through the natural course of the
environment the pollutant dissipates. The more troublesome pollutants are defined as
stock pollutants, which accumulate in the environment usually in relation to manmade
B l a u s t e i n
Page 3
activity. The most harmful and renown group of stock pollutants are heavy metals
(Tietenberg).
China’s Ministry of Water Resources ranks water into three main categories – good
water quality, fair water quality, and poor water quality. Good water quality is broken
down into three subcategories: 1) the source of the natural body (nature reserve); 2) a
class one water source (protected area) for drinking water and aquatic species; and 3) a
class two water source for drinking water, swimming, and common aquatic species. Fair
water quality is broken down into two subcategories: 1) class four water sources, for
general industrial water supply and recreational (non-human contact) use; and 2) class
four water sources, for agriculture and landscaping. Lastly, poor water quality is broken
down into only one subcategory: a class five water source that is highly polluted.
For the purposes of this paper, water pollution is restricted to the measuring of stock
pollutants, paying special attention to heavy metals. A list of priority pollutants, as
defined by the United States Environmental Protection Agency (EPA), was used as the
basis for restricting research methodology. The EPA uses four criteria in its
determination of whether or not a pollutant is considered a priority: 1) the pollutant must
be on the list of toxic pollutants; 2) there has to be a chemical standard available for the
pollutant, so that testing for the pollutant can be performed; 3) the pollutant must have
been reported as being found in water with a frequency of occurrence of at least 2.5%;
and 4) the pollutant has to have been produced in significant quantities, as reported in
Stanford Research Institute’s 1976 Directory of Chemical Producers, USA. The list of
B l a u s t e i n
Page 4
priority pollutants was used as a guideline for the purposes of comparative analysis in
understanding the environmental degradation of pollutants within China.
China’s Water Resources
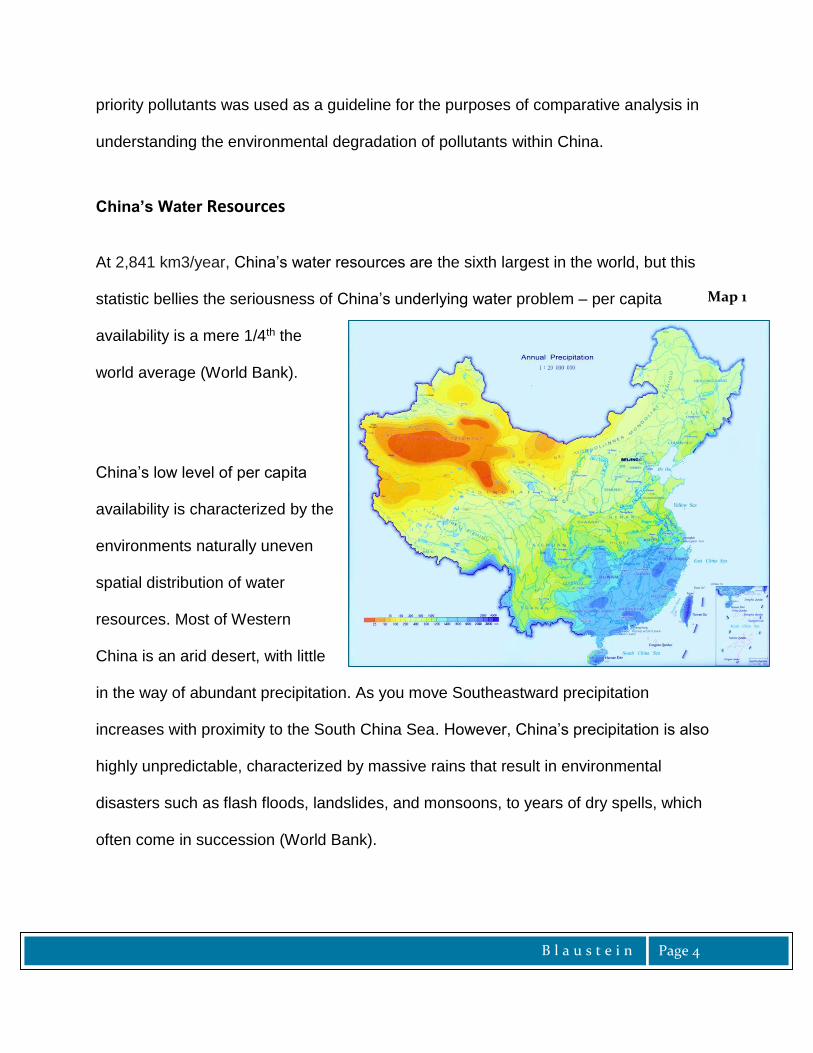
At 2,841 km3/year, China’s water resources are the sixth largest in the world, but this
statistic bellies the seriousness of China’s underlying water problem – per capita
availability is a mere 1/4th the
world average (World Bank).
China’s low level of per capita
availability is characterized by the
environments naturally uneven
spatial distribution of water
resources. Most of Western
China is an arid desert, with little
in the way of abundant precipitation. As you move Southeastward precipitation
increases with proximity to the South China Sea. However, China’s precipitation is also
highly unpredictable, characterized by massive rains that result in environmental
disasters such as flash floods, landslides, and monsoons, to years of dry spells, which
often come in succession (World Bank).
Map 1
B l a u s t e i n
Page 5
Demand within China for water resources is growing and unabated. From Deng
Xiaoping’s ‘To Get Rich is Glorious’ to Xi Jinping’s ‘Chinese Dream,’ the residents of the
world’s most populous country are transforming their nation in a development push that
could end divergence within 40 years, returning China to a place it held for eighteen of
the last twenty-one centuries, as the world’s largest economy. But such rapid
development is further taxing the already limited water resources within China.
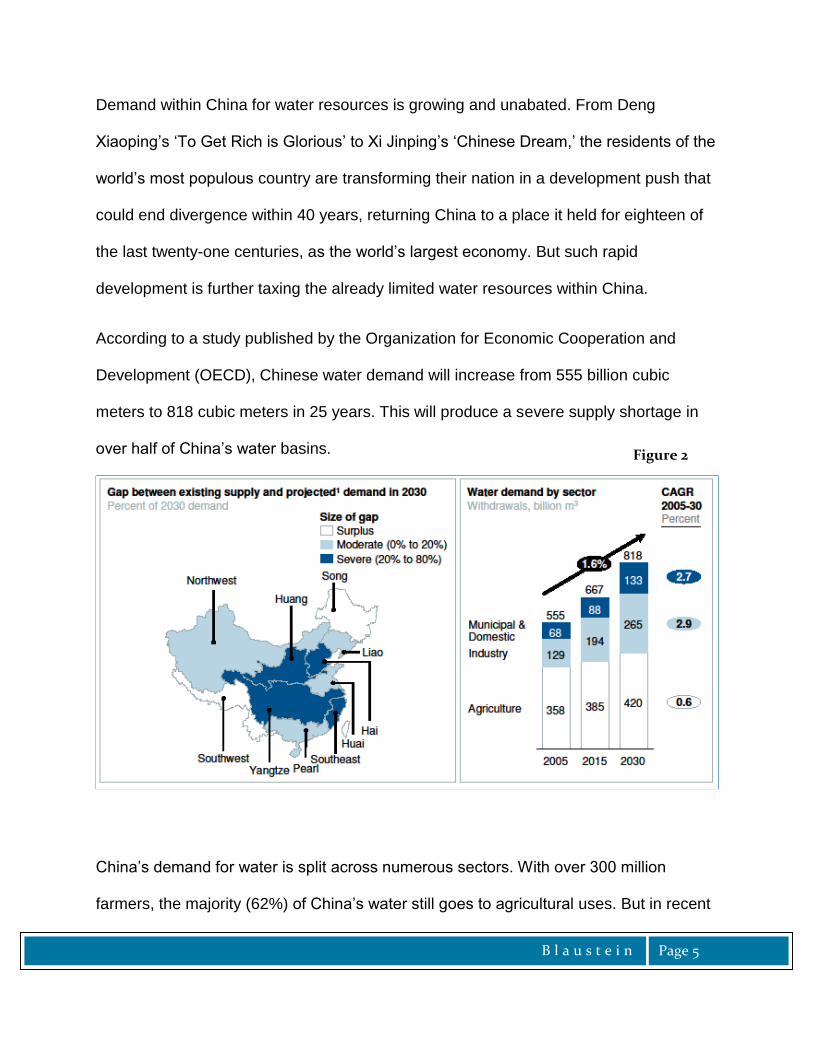
According to a study published by the Organization for Economic Cooperation and
Development (OECD), Chinese water demand will increase from 555 billion cubic
meters to 818 cubic meters in 25 years. This will produce a severe supply shortage in
over half of China’s water basins.
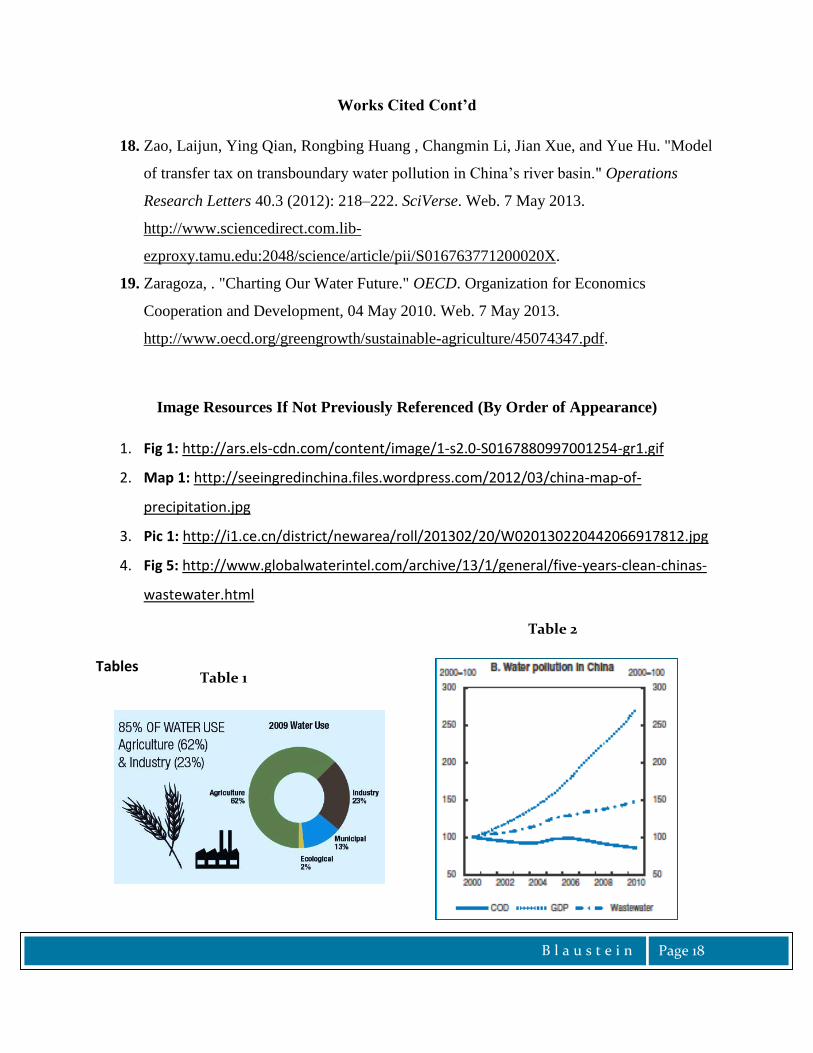
China’s demand for water is split across numerous sectors. With over 300 million
farmers, the majority (62%) of China’s water still goes to agricultural uses. But in recent
Figure 2
B l a u s t e i n
Page 6
years industry’s demand for water resources has grown rapidly within China, now
accounting for 23% of use. Municipality or residential use is China’s fastest growing
area of demand, but only accounts for 13% of China’s domestic water consumption.
Only 2% of China’s water is allocated for the purposes of environmental protection
(Refer to Table 1).
In every corner of China, water is becoming an issue. With China’s water resources so
heavily taxed, the damages caused by environmental degradation cannot afford to be
overlooked.
China’s Water Pollution Crisis
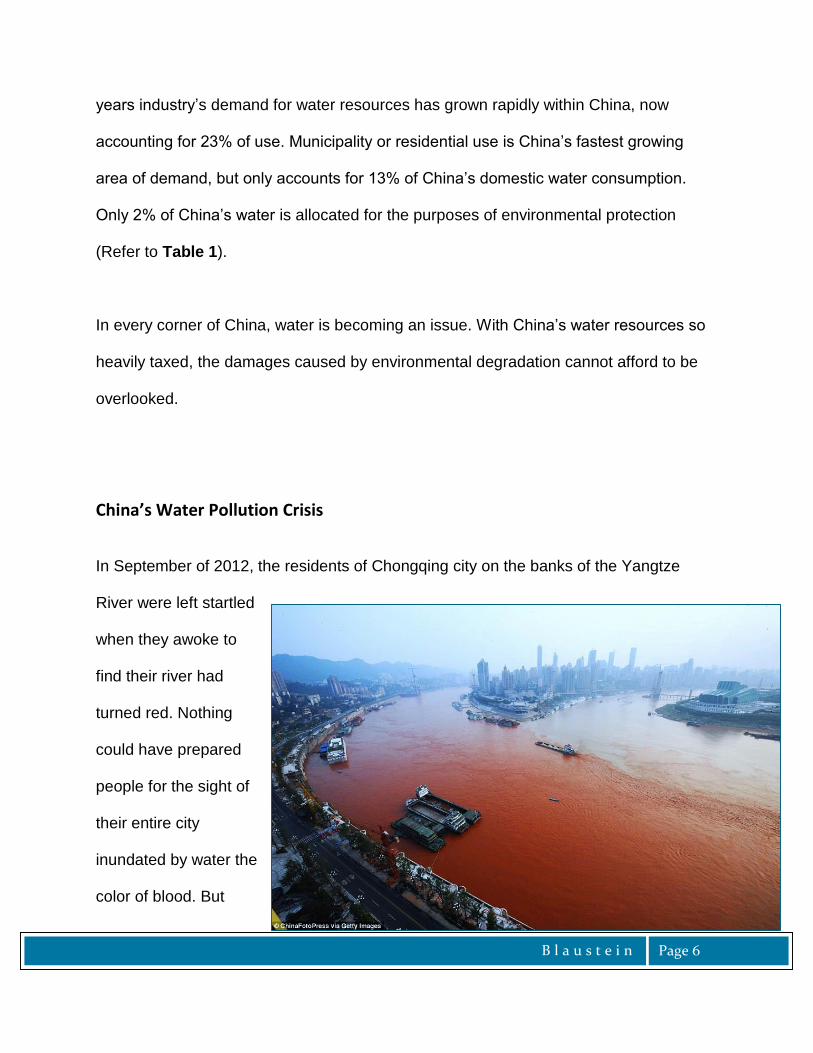
In September of 2012, the residents of Chongqing city on the banks of the Yangtze
River were left startled
when they awoke to
find their river had
turned red. Nothing
could have prepared
people for the sight of
their entire city
inundated by water the
color of blood. But

B l a u s t e i n
Page 7
what occurred in Chongqing wasn’t a biblical plague, or the ominous foretelling’s of an
angel of Revelations, for what occurred in Chongqing had happened before.
In 2011, powerful dye had been illegally dumped into the municipal water supply of the
Central Chinese city of Luoyang, turning the city’s water an ominous red color. After a
government investigation, the perpetrators of the illegal dumping were arrested and
their factories shuttered. Nonetheless, harmful environmental degradation had already
occurred (DailyMail).
This one story is but an example of China’s ongoing water pollution crisis. According to
a report coauthored by China’s State Environmental Protection Agency and the World
Bank, over 90% of China’s surface water resources near cities are polluted, of the 27
lakes and reservoirs being monitored in 2007 – none were safe for human contact.
Nationally, 70% of China’s surface water resources are polluted, with major pollution
being concentrated in Northern China, where water resources are less abundant and
population density is greater.
In total, only 42% of surface water in
China is safe for human consumption.
30% of surface water is considered
safe for agricultural or industrial use.
42
30
28
Surface Water Pollution
Human Consumption Ag and Industry Unusable
Figure 3
B l a u s t e i n
Page 8
28% is so heavily polluted as to be currently unusable. In 2007, 72% of China’s low-
income population (over 115 million people) lacked access to piped water, relying solely
on surface water for consumption. This has resulted in a growing health crisis among
poorer Chinese.
Concerning groundwater, approximately 90% of China’s urban groundwater resources
are polluted and 60% are unsafe for human consumption (MEP). The two main priority
pollutants that affect groundwater are arsenic and fluoride. With China’s surface water
being rapidly depleted in Northern provinces, in addition to insecurity over the safety of
surface water, Chinese municipalities are increasingly turning to ground water
resources.
In recent years, China’s water crisis is changing. As the Chinese economy transforms,
with economic stability and standard of living being emphasized over economic growth,
the number of heavy metals and point sources of water pollutants have been steadily
decreasing. But this decrease is being offset by an increase in non-point sources,
attributed mainly to greater uses of fertilizers and chemicals within agricultural
production.
Dr. Pei Guo of China Agricultural University, cited pollutants from China’s agricultural
industry as being one of the major environmental issues facing the Chinese
B l a u s t e i n
Page 9
government. Such forms of non-point pollution are much harder to measure, contain,
and monitor than traditional point sources. Furthermore, due to lower purchasing power
parity, and poor economies of scale, most Chinese farmers lack the capabilities of
improving the products or methods they use for agricultural production. China currently
has 300 million farmers on an average of an acre and a half of land, with rural income
well below national average income.
In total, the World Bank estimates that China’s water crisis is already costing the nation
upward of 2.3 percent of its total GDP, with 1.3 percent being due to water scarcity, and
1 percent being due to water pollution respectively. The impact on human health is
staggering, and estimates from the early 2000’s are as high as 3.9 billion dollars in
medical expenses. Some recent studies suggest a 10% rise in the incident of cancer
due to the exposure of greater numbers of the population to water borne heavy metals
(OECD).
The Water Policy of the People’s Republic of China
The Chinese government understands that it faces a water pollution crisis. Beginning
with the 11th Five Year Plan, the People’s Republic of China (PRC) began to emphasize
cleaner growth and less pollution. Environmental governance is being concentrated, by
bringing the 14 different ministries tasked with environmental protection under one
umbrella.

B l a u s t e i n
Page 10
The latest 12th Five Year Plan is being lauded by environmental groups, boldly stating
its objective to replace economic growth above all costs, with what it describes as
‘quality growth’. Many new pollutants have been added to the list of target pollutants for
reduction, furthering helping to improve water quality. As well, a large investment is
being made in both rural and urban wastewater projects, to help not only improve water
resource management, but help curb pollution and better water quality.
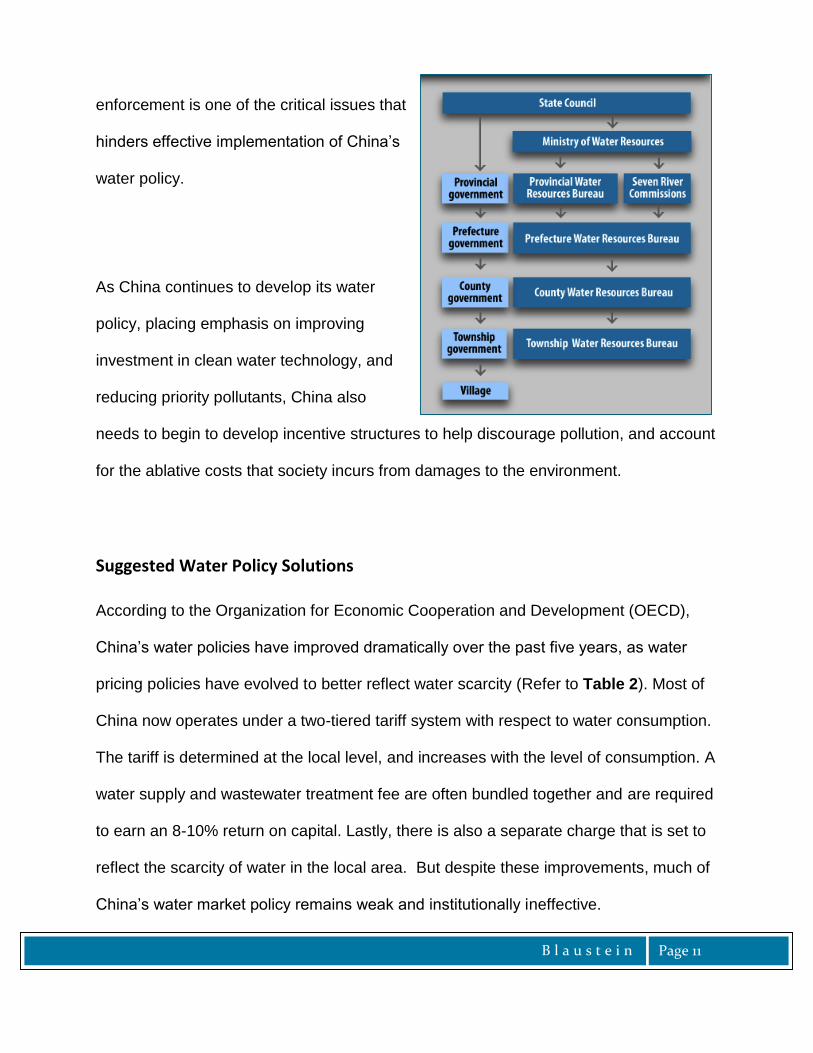
Despite the progress that has been made, the governance structure that enacts and
then affects Chinese water policy is still both complicated and fragmented. China’s
State Council sits as its largest body, overseeing all aspects of legal formulation and
implementation. From the State Council, power branches off to provincial governments,
as well as to the Ministry of Water Resources. While The Ministry of Water Resources
monitors pollution throughout China, and is tasked with putting in place China’s water
policy, it has no power over the provincial governments – who only answer to the State
Council. Due to this bizarre governance structure, most water policy lacks teeth, and
Figure 4
B l a u s t e i n
Page 11
enforcement is one of the critical issues that
hinders effective implementation of China’s
water policy.
As China continues to develop its water
policy, placing emphasis on improving
investment in clean water technology, and
reducing priority pollutants, China also
needs to begin to develop incentive structures to help discourage pollution, and account
for the ablative costs that society incurs from damages to the environment.
Suggested Water Policy Solutions
According to the Organization for Economic Cooperation and Development (OECD),
China’s water policies have improved dramatically over the past five years, as water
pricing policies have evolved to better reflect water scarcity (Refer to Table 2). Most of
China now operates under a two-tiered tariff system with respect to water consumption.
The tariff is determined at the local level, and increases with the level of consumption. A
water supply and wastewater treatment fee are often bundled together and are required
to earn an 8-10% return on capital. Lastly, there is also a separate charge that is set to
reflect the scarcity of water in the local area. But despite these improvements, much of
China’s water market policy remains weak and institutionally ineffective.
Figure 5
B l a u s t e i n
Page 12
The OECD sets out a number of corrective measures that could aid China in improving
its water policy and accounting for the ablative costs of water pollution, the corrective
measures are to: 1) better staff local municipalities, as to get more accurate data on
pollution figures; 2) introduce taxes and levies on emissions; or 3) implement an
emissions trading scheme (ETS) that creates a market for the right to pollute – model
an ETS system after an already existing system such as the United States cap-and-
trade system.
ETS systems implement a form of transferable pollution rights. They can reduce
pollution by insuring that the marginal cost of abatement is equalized across polluters
and pollution reduction is achieved at the lowest possible aggregate cost. ETS systems
also promote dynamic efficiency by encouraging the researching of alternative
technologies. Lastly, ETS systems can create a double-dividend, boosting revenue that
can be used to further cut other harmful forms of pollutants and invest in water
treatment projects. China already has a number of ETS systems in place, but the small
scale of these systems and their lack of regulatory power have mitigated their success.
One of China’s largest failures in water policy has been related to the issue of trans-
jurisdictional water pollution. China’s current water policy fails to address the negative
externalities that downstream third parties face when subject to pollution conducted
upstream. The failure to address trans-jurisdictional water pollution arises mainly from
the institutional framework that currently governs Chinese water policy.
B l a u s t e i n
Page 13
As discussed earlier, China’s water policy is enacted by a range of organizations that
often have little in the way of punishment that can be enforced at the local level.
National organization have no method for ordering local officials to enforce policy, as
local officials only answer to China’s State Council. The largest problem that arises from
China’s current water policy is that without one organization that both governs and
enforces water policy, trans-jurisdictional water pollution goes unaccounted for.
According to Edwin Ongley and Xuejun Wang of the International Water Resources
Association, China must take the following steps to address trans-jurisdictional water
pollution: 1) give power to one organization to regulate and enforce China’s water
policy; 2) allow for greater transparency, so that local residents within an area can
participate in the analysis and creation of effective water policy; 3) gather better data at
the local and regional level; 4) enforce accountability by creating a legal basis to which
officials can be held; 5) create better descriptive laws that sets out concrete metrics to
make targeting certain pollution levels easier; and 6) allow public participation and
dispute settlement so that third parties injured by pollution may voice their concerns and
seek remedy.
According to Lan, Livermore, and Wenner in their essay Water Pollution and Regulatory
Cooperation in China, “in the face of inter-jurisdictional externalities, one can expect a
race-to-the-bottom in which jurisdictions compete to deliver a friendly business

B l a u s t e i n
Page 14
environment by offering lower environmental standards.” Within China this presents a
particularly difficult situation, as the system of Hukous does not allow for the free
movement of citizens between provinces. Yet, while citizens are restricted, businesses
are able to move freely, meaning that the while businesses can escape the tax indices
of their polluting activities by moving to an area with looser environmental regulations,
Chinese people cannot, and are left to suffer with the environmental damage a business
leaves behind.
Lan, Livermore, and Wenner suggest that China adopts the concept of “cooperative
federalism” from the United States, in which local governments within China agree to
comply and abide by the same regulations set forth by the national government.
Another policy suggestion is the use of cost-benefit analysis, where ablative costs are
compared to the willingness to pay for clean water. The goal of such cost-benefit
analysis is the maximization of net benefits by equalizing marginal damages and
marginal ablative costs (Refer to Figure 1). By comparing the costs of implementing
these policies to their associated benefits, the hope is to reduce the politics inherent
within the localized decision making process, and ground all decisions in metrics that
are uniform within China.
B l a u s t e i n
Page 15
Conclusion
China faces immense challenges in confronting its water pollution crisis. The levels of
priority pollutants within China have already had harmful effects on the environment,
resulting in economic loss, harm to the health of the population, and damage to China’s
water resources. While current policy is an improvement over past policy, much work
still remains in order to effectively reduce water pollution in China. Current weaknesses
in China’s water policy exist in the institutional framework and cooperation that governs
the regulation of water pollution. Other problems exist in the collection of pollution data,
and issues related to trans-jurisdictional water control. Luckily for China, corrective
policy already exists to address these challenges in the forms of numerous economic
tools and policies. Through comparative policy analysis, China could borrow
transferable pollution rights or (ETS), cooperative federalism, and cost-benefit analysis
from other nations such as the United States to help ease their water pollution
problems. One can only hope that the leaders of China can learn from the mistakes of
the nations that have developed before them, as they define their countries path to
quality growth, and seek to solve China’s water pollution crisis.

B l a u s t e i n
Page 16
Work’s Cited
1. Bu, Hongmei, Wei Meng, and Yuan Zhang. "Nitrogen pollution and source identification
in the Haicheng River basin in Northeast China." Science of The Total Environment
409.18 (2011): 3394–3402. SciVerse. Web. 7 May 2013.
http://www.sciencedirect.com.lib-
ezproxy.tamu.edu:2048/science/article/pii/S004896971100533X?np=y.
2. "China Water Risk." China's 12th Five Year Plan. China Water Risk, n.d. Web. 7 May
2013. http://chinawaterrisk.org/regulations/water-policy/12th-five-year-plan/.
3. Field, Barry. Environmental Economics: An Introduction. 2nd. New York: The McGraw-
Hill Companies Inc., 1997. Print.
4. "Five Years To Clean Up China's Wastewater." Global Water Intelligence. Global Water
Intelligence, 1 Jan 2012. Web. 7 May 2013.
http://www.globalwaterintel.com/archive/13/1/general/five-years-clean-chinas-
wastewater.html/.
5. Nygard, James, ed. "COST OF POLLUTION IN CHINA ECONOMIC ESTIMATES OF
PHYSICAL DAMAGES." World Bank. The World Bank, n.d. Web. 7 May 2013.
http://siteresources.worldbank.org/INTEAPREGTOPENVIRONMENT/Resources/China
_Cost_of_Pollution.pdf.
6. Livermore, Michael, Craig Wenner , and Hong Lan. "Water Pollution and Regulatory
Cooperation in China." Cornell International Law Journal 44.2 (2011): n.pag. Social
Science Research Network. Web. 7 May 2013.
http://papers.ssrn.com/sol3/papers.cfm?abstract_id=2137799.
7. "OECD Economic Surveys: China 2013." OECD. Organization for Economic
Cooperation and Development, n.d. Web. 7 May 2013. http://www.oecd-ilibrary.org.lib-
ezproxy.tamu.edu:2048/docserver/download/1013051ec005.pdf?expires=1367924128&i
d=id&accname=ocid177419&checksum=349F3E89711597DFFB64DD4083F8ACEB.
8. Ongley, Edwin, and Xuejun Wang. "Transjurisdictional Water Pollution Management in
China: The Legal and Institutional Framework." Water International 29.3 (2009): 270-
281. Taylor and Francis Online. Web. 7 May 2013. http://www.tandfonline.com.lib-
ezproxy.tamu.edu:2048/doi/abs/10.1080/02508060408691781/.
B l a u s t e i n
Page 17
Works Cited Cont’d
9. Peplow, Mark. "Why has the Yangtze River turned red?." Nature. Newsblog, 11 Sept
2012. Web. 7 May. 2013. http://blogs.nature.com/news/2012/09/why-has-the-yangtze-
river-turned-red.html.
10. Tietenberg, Tom. Environmental and Natural Resource Economics. 6th. New York:
Pearson Education, Inc., 2003. Print.
11. The People's Republic of China. Ministry of Environmental Protection. Environmental
Laws. 1984. Web.
http://english.mep.gov.cn/Policies_Regulations/laws/environmental_laws/200710/t20071
009_109915.htm.
12. "The river that DID run red: Residents of Chinese city left baffled after Yangtze turns
scarlet Read more: http://www.dailymail.co.uk/news/article-2199800/The-river-DID-run-
red-Residents-Chinese-city-left-baffled-Yangtze-turns-scarlet.html.
13. Ward, Frank. Environmental and Natural Resource Economics. Upper Saddle River,
New Jersey: Pearson Education, Inc., 2006. Print.
14. "Water Governance." World Wildlife Organization. World Wildlife Organization, n.d.
Web. 7 May 2013.
http://en.wwfchina.org/en/what_we_do/freshwater/water_governance/.
15. "Water, health, and economics." World Health Organization. World Health Organization,
n.d. Web. 7 May 2013. http://www.who.int/water_sanitation_health/economic/en/.
16. Xie, Jian. "Addressing China’s Water Scarcity." World Bank. The World Bank, n.d. Web.
7 May 2013. http://www-
wds.worldbank.org/external/default/WDSContentServer/WDSP/IB/2009/01/14/00033303
7_20090114011126/Rendered/PDF/471110PUB0CHA0101OFFICIAL0USE0ONLY1.pd
f.
17. Yang, Yong, Ying Chen, Xiaolin Zhang, Edwin Ongley, and Lei Zhao. "Methodology for
agricultural and rural NPS pollution in a typical county of the North China Plain."
Environmental Pollution 168. (2012): 170-176. SciVerse. Web. 7 May 2013.
http://www.sciencedirect.com.lib-
ezproxy.tamu.edu:2048/science/article/pii/S0269749112001996.
B l a u s t e i n
Page 18
Works Cited Cont’d
18. Zao, Laijun, Ying Qian, Rongbing Huang , Changmin Li, Jian Xue, and Yue Hu. "Model
of transfer tax on transboundary water pollution in China’s river basin." Operations
Research Letters 40.3 (2012): 218–222. SciVerse. Web. 7 May 2013.
http://www.sciencedirect.com.lib-
ezproxy.tamu.edu:2048/science/article/pii/S016763771200020X.
19. Zaragoza, . "Charting Our Water Future." OECD. Organization for Economics
Cooperation and Development, 04 May 2010. Web. 7 May 2013.
http://www.oecd.org/greengrowth/sustainable-agriculture/45074347.pdf.
Image Resources If Not Previously Referenced (By Order of Appearance)
1. Fig 1: http://ars.els-cdn.com/content/image/1-s2.0-S0167880997001254-gr1.gif
2. Map 1: http://seeingredinchina.files.wordpress.com/2012/03/china-map-of-
precipitation.jpg
3. Pic 1: http://i1.ce.cn/district/newarea/roll/201302/20/W020130220442066917812.jpg
4. Fig 5: http://www.globalwaterintel.com/archive/13/1/general/five-years-clean-chinas-
wastewater.html
Tables
Table 1
Table 2