Géochronologie par méthodes ponctuelles (SIMS & LA-ICP-MS)
315
Géochronologie par méthodes ponctuelles (SIMS & LA-ICP-MS) [1] Bosch D, Bruguier O & Pidgeon RT (1996) The evolution of an Archaean metamorphic belt: A conventional and SHRIMP U-Pb study of accessory minerals from the Jimperding Metamorphic Belt, Yilgarn Craton, Western Australia. Journal of Geology, 104: 695-711. [2] Pidgeon RT, Bosch D & Bruguier O (1996). Petrogenetic implications of inherited zircon and titanite in the Archaean Katrine syenite, Southwestern Yilgarn Craton, Western Australia. Earth and Planetary Science Letters, 141: 187-198. [3] Bruguier O, Telouk P, Cocherie A, Fouillac AM & Albarède F (2001) Evaluation of Pb-Pb and U-Pb laser ablation ICP-MS zircon dating using matrix-matched calibration samples with a frequency quadrupled (266 nm) Nd:YAG laser. Geostandards Newsletters 25: 361-373. [4] Bosch D, Hammor D, Bruguier O, Caby R & Luck JM (2002) Monazite "in situ" 207 Pb/ 206 Pb geochronology using a small geometry High-Resolution Ion Probe. Evaluation and application to Archean and Proterozoic rocks. Chemical Geology 184: 151-165. [5] Bruguier O, Becq-Giraudon JF, Champenois M, Deloule E, Ludden J & Mangin D (2003) Application of in situ zircon geochronology and accessory phase chemistry to constraining basin development during post-collisional extension: a case study from the French Massif Central. Chemical Geology 201: 319-336. [6] Hammor D, Bosch D, Caby R & Bruguier O (2006) A two-stage exhumation of the Variscan crust: U-Pb LA-ICP-MS and Rb-Sr ages from Greater Kabylia, Maghrebides. Terra Nova 18: 299-307. [7] Neves S, Bruguier O, Vauchez A, Bosch D, Rangel da Silva JM & Mariano G (2006) Timing of crust formation, deposition of supracrustal sequences, and Transamazonian and Brasiliano metamorphism in the East Pernambuco belt (central domain, Borborema Province, NE Brazil): implications for western Gondwana assembly. Precambrian Research 149: 197-216. [8] Beccaletto L, Bonev N, Bosch D & Bruguier O (2007) Record of a Paleogene syn- orogenic extension in the north Aegean region: Evidence from the Kemer micaschists (NW Turkey). Geological Magazine 144: 393-400. [9] Dhuime B, Bosch D, Bruguier O, Caby R & Pourtales S (2007) Age, provenance and post-deposition metamorphic overprint of detrital zircons from the prograde metasedimentary sequence of the Nathorst Land group (Eleonore Bay
-
Upload
khangminh22 -
Category
Documents
-
view
0 -
download
0
Transcript of Géochronologie par méthodes ponctuelles (SIMS & LA-ICP-MS)

Géochronologie par méthodes ponctuelles
(SIMS & LA-ICP-MS)
[1] Bosch D, Bruguier O & Pidgeon RT (1996) The evolution of an Archaean metamorphic belt: A conventional and SHRIMP U-Pb study of accessory minerals from the Jimperding Metamorphic Belt, Yilgarn Craton, Western Australia. Journal of Geology, 104: 695-711.
[2] Pidgeon RT, Bosch D & Bruguier O (1996). Petrogenetic implications of inherited
zircon and titanite in the Archaean Katrine syenite, Southwestern Yilgarn Craton, Western Australia. Earth and Planetary Science Letters, 141: 187-198.
[3] Bruguier O, Telouk P, Cocherie A, Fouillac AM & Albarède F (2001) Evaluation of
Pb-Pb and U-Pb laser ablation ICP-MS zircon dating using matrix-matched calibration samples with a frequency quadrupled (266 nm) Nd:YAG laser. Geostandards Newsletters 25: 361-373.
[4] Bosch D, Hammor D, Bruguier O, Caby R & Luck JM (2002) Monazite "in situ"
207Pb/206Pb geochronology using a small geometry High-Resolution Ion Probe. Evaluation and application to Archean and Proterozoic rocks. Chemical Geology 184: 151-165.
[5] Bruguier O, Becq-Giraudon JF, Champenois M, Deloule E, Ludden J & Mangin D
(2003) Application of in situ zircon geochronology and accessory phase chemistry to constraining basin development during post-collisional extension: a case study from the French Massif Central. Chemical Geology 201: 319-336.
[6] Hammor D, Bosch D, Caby R & Bruguier O (2006) A two-stage exhumation of the
Variscan crust: U-Pb LA-ICP-MS and Rb-Sr ages from Greater Kabylia, Maghrebides. Terra Nova 18: 299-307.
[7] Neves S, Bruguier O, Vauchez A, Bosch D, Rangel da Silva JM & Mariano G
(2006) Timing of crust formation, deposition of supracrustal sequences, and Transamazonian and Brasiliano metamorphism in the East Pernambuco belt (central domain, Borborema Province, NE Brazil): implications for western Gondwana assembly. Precambrian Research 149: 197-216.
[8] Beccaletto L, Bonev N, Bosch D & Bruguier O (2007) Record of a Paleogene syn-
orogenic extension in the north Aegean region: Evidence from the Kemer micaschists (NW Turkey). Geological Magazine 144: 393-400.
[9] Dhuime B, Bosch D, Bruguier O, Caby R & Pourtales S (2007) Age, provenance
and post-deposition metamorphic overprint of detrital zircons from the prograde metasedimentary sequence of the Nathorst Land group (Eleonore Bay

Supergroup, NE Greenland) — a LA-ICP-MS and SIMS study. Precambrian Research 155: 24-46.
[10] Faure M, Trap P, Li W, Monié P & Bruguier O (2007) Paleoproterozoic
continental collisions in the North China Craton: the example of the Lüliangshan-Hengshan-Wutaishan-Fuping massifs. Episodes 30: 95-106.
[11] Bendaoud A, Ouzegane K, Godard G, Liégeois JP, Kienast JR, Bruguier O &
Drareni A (2008) Geochronology and metamorphic P-T-X evolution of the Eburnean granulite-facies metapelites of Tidjenouine (Central Hoggar, Algeria): witness of the LATEA metacratonic evolution. In " The boundaries of the west-African craton", Ennih, N. & Liegeois J.P. (eds), The Geological Society of London. Special Publication 297: 111-146.
[12] Neves S, Bruguier O, Bosch D, Rangel da Silva JM & Mariano G (2008) U-Pb
ages of plutonic and metaplutonic rocks south of the East Pernambuco shear zone system: timing of Brasiliano deformation and magmatism in southern Borborema Province (NE Brazil). Journal of South American Earth Sciences 25: 285-297.
[13] Seranne M, Bruguier O & Moussavou M (2008) U-Pb single zircon grain dating
of present fluvial and Cenozoic aeolian sediments from Gabon: consequences on sediment provenance, reworking and erosion processes on the equatorial West African Margin. Bulletin de la Société Géologique de France 179: 29-40.
[14] Trap P, Faure M, Lin W, Bruguier O & Monié P (2008) Contrasted tectonic styles
for the Paleoproterozoic evolution of the North China Craton. Evidence for a ~2.1 Ga thermal and tectonic event in the Fuping Massif. Journal of Structural Geology 30, 1109-1125.
[15] Bruguier O, Hammor D, Bosch D & Caby R (2009) Miocene incorporation of
peridotite into the Hercynian basement of the Maghrebides (Edough Massif, NE Algeria): implications for the geodynamic evolution of the Western Mediterranean. Chemical Geology 261: 171-183.
[16] Petitgirard S, Vauchez A, Egydio-Silva M, Bruguier O, Camps P, Monié P,
Babinsky M & Mondou M (2009) Conflicting structural and geochronological data from the Ibituruna quartz-syenite (SE Brazil): Effect of protracted "hot" orogeny and slow cooling rate? Tectonophysics, in press.
[17] Henry B, Liégeois JP, Nouar O, Derder NEM, Bayou B, Bruguier O, Ouabadi A,
Belhai D, Amenna M, Hemmi A & Ayache M (2009) Repeated igranitoid intrusions during the Neoproterozoic along the western boundary of the Saharan metacraton, eastern Hoggar, Tuareg Shield, Algeria: an AMS and U-Pb zircon age study. Tectonophysics, in press.


EPSL ELSEVIER Earth and Planetary Science Letters 141 (1996) 187-198
Inherited zircon and titanite U-Pb systems in an Archaean syenite from southwestern Australia: implications for U-Pb stability of
titanite
R.T. Pidgeon a, * , D. Bosch b, 0. Bruguier b
a School of Applied Geology, Curtin University of Technology, Bentley. Western Australia. 6102
b Laboratoire’ de GPochronologie-Giochemie-Petrologie, U.R.A. 1763, Case courrier 066, U.M. II, place E. Bataillon, 34095 Montpellier Cedex 5, France
Received 20 July 1995; accepted 22 March 1996
Abstract
Inherited zircon and titanite have been identified in a syenite from the Archaean of southwestern Australia. Conventional
and SHRIMP analyses on euhedral zoned zircon and zoned rims on complex grains define a crystallisation age of 2654 f 5 Ma for the syenite. In addition, SHRIMP analyses on zircon cores and unzoned subhedral zircons show that zircon has a ca. 3250 Ma inherited component. Conventional U-W ages on titanite also fall between ca. 3250 Ma and ca. 2650 Ma, demonstrating that inherited titanite as well as zircon is present in the syenite. The syenite has been affected by regional
upper amphibolite facies metamorphism at an estimated temperature of 625-650°C. Retention of the inherited radiogenic Pb in the titanite is evidence that the closure temperature for titanite is greater than 650°C. The presence of inherited titanite and zircon also demonstrates a crustal source component for the syenite and indicates it originated by partial assimilation of crustal rocks by a potassic magma at < 75O”C, rather than from a homogeneous high T magma.
Keywords: Archean; U/Pb; zircon; titanite; diffusion; SHRIMP data; isotopes
1. Introduction
Detailed studies of U-Pb ages on coexisting ac- cessory minerals such as zircon, titanite, monazite,
garnet and apatite are providing a new dimension in the understanding of tectonic and metamorphic pro-
cesses. However, although considerable information exists, more case histories are needed to determine the U-PI, stability of these minerals under magmatic and metamorphic conditions. In this report we pre-
_ Corresponding author. E-mail: [email protected]
sent the results of a TIMS and SHRIMP study of the
U-Pb systems of zircon and titanite from an Ar- chaean syenite from the Jimperding Metamorphic Belt in the Yilgam Craton of southwestern Australia
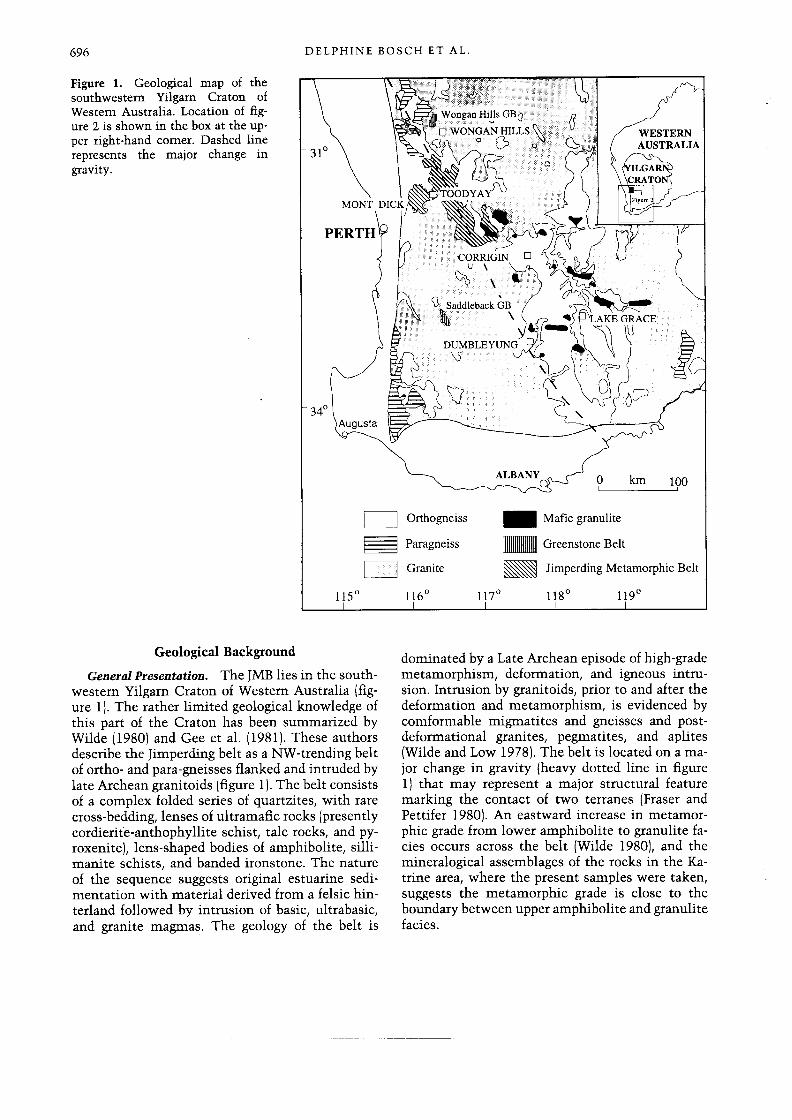
(Fig. 1) [l]. Th e nginal purpose of the project was o .
to investigate the timing of emplacement of the syenite within the context of the complex igneous and metamorphic events associated with the evolu- tion of the Jimperding Metamorphic Belt. Results of this broader study will be presented elsewhere [2]. In this contribution our main purpose is to consider the implications of the presence of inherited U-Pb sys- tems in zircon and titanite on estimates of the block-
0012-821X/96/$12.00 0 1996 Elsevier Science B.V. All rights reserved
PII SOOl2-821X(96)00068-4

188 R.T. Pidgeon et al/Earth and Planetaq Science Letters 141 (1996) 187-198
ing temperature for diffusion of radiogenic Pb in titanite.
2. Geological setting of the Katrine syenite
Syenitic rocks, consisting of microcline, oligo- clase, altered pyroxene and amphibole, with minor
quartz, titanite and apatite, are associated with the
gneisses of the Jimperding Metamorphic Belt [3], which is part of the Archaean Western Gneiss Ter-
rane [l] in southwestern Australia. The Katrine syen-
ite is the largest of these and occurs as an ellipsoidal body about 1.8 km in length with a maximum width
of 0.8 km (Fig. 1). This is described [3] as a gneissic
rock with a foliation marked by stringers of mafic minerals, blades of quartz and microcline, or differ- ences in grain size, The body is surrounded by
I 1Km
amphibolite
sillimanite schist
porphyritic granite quart&e
* * N t
granitic gneiss colluvium NNN
Fig. 1. Geological sketch map of the Katrine area near Toodyay,
Western Australia, showing sample locations.
quartz-feldspar-biotite gneiss and sillimanite-
muscovite schist (Fig. 1) and has a lineation parallel to that in the gneisses and no preserved intrusive
contacts [3]. Further observations by the authors broadly confirm those of [3]. The main body of the
syenite is coarse grained, with only 5--10% mafic minerals, which occur as separate aligned grains and
as wispy patches of pyroxene partly or completely altered to amphibole. Minor parts of the syenite
consist of a banded rock with pyroxene and plagio- clase dominated bands interrupted by patches and
diffusely bounded dykes of undeformed, coarse
grained syenite. The contact of the syenite with the flanking medium-grained biotite gneiss appears to
parallel the foliation in the gneiss. This, together
with the ellipsoidal shape of the syenite body (Fig. 1) and the linear mineral fabric, suggests that the syen- ite has undergone deformation and has also acted as a competent block during regional metamorphism.
Regional metamorphism in the southwest Yilgam is characterised by low pressure granulite facies in
the east, decreasing to amphibolite facies to the west. Estimates of the temperature of the granulite facies
metamorphism are consistent at about 700°C [4-61.
The Katrine syenite is situated in a transitional zone close to the boundary between upper amphibolite
and low pressure granulite facies [7]. It is surrounded by granitic gneisses, muscovite-plagioclase-sil- limanite schists, and amphibolites without hypers-
thene, which supports upper amphibolite facies con- ditions. The lack of significant anatexis of the schists
also suggests a temperature for this metamorphic overprint of the Katrine syenite of about 625-675°C [8]. The age of the high grade metamorphism in the southwest Yilgam Craton has been determined as
2749-2640 Ma [9]. Conventional, single-grain U-Pb ages on metamorphic zircons from mafic granulites from Mt. Dick, approximately 12 km to the east of
the Katrine syenite, agree at 2649 &- 6 Ma and this is accepted as the best estimate of the age of the granulite facies metamorphism in this part of the Yilgam Craton [9].
Geochronology samples (CT3 and W395) were taken from the weakly lineated, mafic-poor part of the body (Fig. 1). In thin section the samples consist of microcline, quartz, plagioclase, amphibole, and accessory titanite and apatite. Examination of min- eral relationships shows interdigitation of feldspar

R.T. Pidgeon et al./Earth and Planetary Science Letters 141 (19961 187-198 189
boundaries, suggesting crystallisation from a magma. as single, aligned, anhedral grains and also as clus- However, dynamic recrystallisation of quartz and ters of incompletely formed gra’ns. Idiomorphic ti- breakdown of original pyroxene to amphibole with tanite prisms are frequently associated with meta- some chlorite and epidote testify to the effects of the morphic amphibole, suggesting formation of titanite metamorphism. The metamorphic amphibole occurs during the breakdown of the original pyroxene, but
Table 1 Conventional U-Pb data for two samples of the Katrine syenite
Sample Weight U Pb 206pb/ 208pw “Pb*/ 207pb*/ 207Pb*/
(w) (pp@ (pi@ 2wPb 206Pb 716 age
238~ 235~ 2MPb* Rula)
ZIRCONS SampleW395 0l.k pk 02.k pk 03.h pk 04.k pk 05.11 pk 06.h pk 07.h pk 08.h pk 09.h pk Sample CT3 10.h pk 11 .It pk 12.11 pk 13.h pk 14.11 pk 15.k pk 16.k pk
TlTANlTES Sample w395 17.dk br 18.dk br, eu 19dk br 2O.dk br a 2 1 .dk br, a+ 22.dk br, a+ 23.dk br, a+ Sample cl-3 24. 25. 26.org 27.h yl 28.dk br 29. 3O.dk b 31dk br 32.~1 33dk br 34dk br 35.dk br 36.~1
APATITES Sample w395 37.mlt gr 38.mk gr 39.mlt gr 40.rnll gr 41.mh gr 42.mlt gr Sample CT3 43.mlt gr 44.mlt gr 45.mlt gr
,003 387 216 .003 534 310 ,004 463 261 ,005 833 461 ,003 724 428 ,002 444 251 .003 406 231 ,003 538 300 ,003 922 514
,005 ,005 ,005 ,005 .005 .005 ,005
El 292 308 469 175 170
092 2202 .I217 240 3164 .0894 156 1418 .1312 172 1916 .I415 266 2433 .1305 098 1251 .I184 096 1412 .1352
,344 ,078 ,082 ,042 ,027 ,026 ,023
68 64 90 87 141 129 90 90
;: ::, 71 61
.05 1 ,037 ,044 ,016 ,098 ,054 ,036 ,052 ,017 ,028 ,013 ,020 ,017
91 69 107 169
z
::
z:
2: 72
143
l?6 217 70 89 128 65
E 58 100 93
.068 ,073 ,108 .029 ,016 ,040
119 109 48 96
;:
,137 .07 1 ,048
36
%
1128 2417 1583 4166
5”E 710
2986 3447
396 .7960 .5592f 6 662 .9496 .5204*11 565 .7856 .5419f 6 545 .9850 .5311* 9 731 .8165 .5164ill 693 .6844 .5074*13 404 .7109 .5287+114
1279 657 651 437 388 867 868
% 762 459 629 623
1.918 .576M 7 1.561 .5071+ 8 1.719 .5716*11 1.725 .5124*18 1.426 .5076f 7 1.917 .5518fll 2.053 S824fll 1.628 .5106flO 1.401 .5128?20 1.730 .5251f14 1.175 .5147f34 1.216 .5201f19 1.733 .5118k21
563 1.003 .4888+ 6 11.99*3 344 .8438 .4866f 6 11.90&4 228 .9703 .4401* 8 10.72+6 530 ,828s .4979ztlO 12.21M 256 1.031 .4622+15 I 1.25M 291 .9173 .4961flO 12.12s
285 228 214
.4967f 8 .4979&12 .4986*11
.1343 .5062*20 12.57s .1801f2 2654ti
.1695 .5046*10 12.59f3 .181&2 2662fl
.1319 .5074*13 12.63&4 .1805f2 2657s
.1329 .4934? 8 12.12s .1781+1 2635k.3
.2150 .5062*28 12.57zt8 .1801f3 2654f3
.1772 .5046f32 12.57?9 .1807f4 266014
.I576 .5088f20 12.63f5 .18Ol?r3 2654+3
.I161 .5042*10 12.47*3 .1794*1 2647tl
.I163 .5016f 8 12.39i2 .1792fl 2646ztl
.4876f15 12.38*4
.4924fll 12.10f3
.4764i16 11.72*4
.4902f12 12.1Oi3
.5033*10 12.49f3
.5054*14 12.54i4
.5057*15 12.55*4
.1841f2 2691s
.1783+2 2637s
.1785zt2 2639i2
.1791f2 2644&2
.lSOtil 2653+1
.1799f2 2652f2
.1800%2 2653+2
1.054 .9632 .9947
16.49*5 14.03*4 15.16i4 14.89f4 13.4Oi4 12.7M4 15.39+6
17.8of3 12.77f3 17.54*4 13.03f6 12.8Oi4 16.00&4 18.31M 12.95M 13.07f6 13.93M
13.64ilO 13.87f6 13.00+6
12.23+7 12.23f8 12.11*8
.2138f6 2935*4
.1955f3 2789f3
.2029f4 285M3
.2034*4 2854f3
.1883f3 2727f3
.1815f3 2666*3
.2111&5 2914*4
.224lf2 301 If1
.I82623 2677+2
.2225f3 2999f2
.1844f4 2693+3
.1828f5 267w4
.2103i2 2908f2
.2281*2 3038+2
.1839+3 2688?3
.1849*3 2697*3
.1924f3 2763f2
.1921fi 2761+4
.1935*3 2772&3
.1842+3 2691+3
.1779*4 2633*4
.1773i5 2628s
.1766f7 2622+7
.1779*3 2634+3
.1766+6 2621+6
.1772+7 2627f7
.1786f7 264M7 ,1782f8 2636f8 .1773*9 2628zt9
Errors are ?I 1 CT. It pk = light pink; dk br = dark brown; eu = euhedral; a = abraded; org = orange; yl = yellow; mlt gr = multi grain.
* Radiogenic.

190 R.T. Pidgeon et al. / Earth and Planetary Science Letters I41 (1996) 187-198
euhedral and anhedral titanite also occur elsewhere
in the rock, raising the possibility that there could be
more than one generation of this mineral.
3. Analytical methods
Zircon, titanite and apatite were separated using a
Wilfley table, heavy liquid and magnetic techniques
and finally hand picked to obtain pure mineral con- centrates. Zircons were abraded prior to selecting
grains for conventional single grain analysis. TIMS
U-W analyses were made on single grains of zircon
and titanite, as described by [9] following the tech-
niques of [IO,1 11, using the Curtin VG354 mass
spectrometer equipped with a Daly detector. Multi- grain apatite aliquots were analysed using a tech-
nique similar to that employed for titanite. The Pb
blank over the period of the analyses varied from 5 to 20 pg. The calculation of common Pb was made by subtracting blank Pb and then assuming a compo- sition of the remaining common Pb determined from
the model of [ 121 at 2650 Ma. For complex titanite
grains that contain a significant portion of inherited
3250 Ma titanite this correction could introduce un-
certainty in excess of that built into the calculation of f 0.5 for the *06 Pb/ 204Pb and *“Pb/ *04Pb ratios at
2650 Ma and +0.8 for *08Pb/ *04Pb. Errors in cor-
rected ratios are reported as 1 cr in Table 1. Concor-
dia intercepts and weighted means of *“Pb/ *06Pb ages were calculated using the Isoplot 200 program [ 131 and uncertainties in intercept ages are reported
as 95% confidence limits. Decay constants used were
those advocated by the Subcommission of
Geochronology [ 141. Zircons were also analysed on the Curtin SHRIMP
II ion microprobe using techniques described by [ 151.
The performance of the WA SHRIMP II has been described by [16]. The zircon standard (CZ3), pre-
pared from a gem quality Sri Lankan zircon, has an age of 564 Ma and a uranium content of 530-560 ppm [ 171. The present SHRIMP runs used a 2 nA primary beam of 02- focused to a 30 pm diameter spot. Reproducibility for the standard Pb/U ratio was + 1.7% and 2.2% (SD) for the two SHRIMP sessions required to analyse the samples and these uncertainties were combined in quadrature with the counting error to determine uncertainties of individ-
Fig. 2. Transmitted light photomicrographs of two zircons anal-
ysed on SHRIMP. White circles show the position of SHRIMP
analytical areas on the polished grain surface. Grain 30 (A) is
composed entirely of multiple euhedral zones, dated at ca. 2654
Ma, and is interpreted as having crystallised from the syenite
magma at this time. Grain 18 (B) is a complex grain consisting of
a ca. 2654 Ma rim of zoned zircon surrounding a euhedrally zoned
fragment of inherited zircon. The radiating fracture pattern in the
rim is due to differential expansion of the core and rim as a result
of relative differences in the extent of radiation damage.
ual Pb/U analyses. These are given as 1 (+ in Table
2 and this 1 (T error is used to construct error boxes for data points on a concordia plot (Fig. 4). Uncer-
tainties in 207Pb/ ‘06 Pb ages are determined solely from counting statistics. Uncertainties of pooled esti- mates of SHRIMP ages are given as the 95% confi-
dence interval of the mean.
Zircons were mounted and polished and surfaces were etched with HF to identify zoned and unzoned parts. The extremely weak cathodoluminescence
emission from these zircons prevented investigation of their internal structure using this technique. Pho-
tos of zoned zircons presented here (Fig. 2) are transmitted light photomicrographs of polished zir- cons from the SHRIMP grain mount.
4. Conventional single grain analyses of zircon
Conventional analyses were made on 16 of the most optically clear, unfractured and abraded single

R.T. Pidgeon et al/Earth and Planetary Science Letters 141 /I9961 187-198 191
0.496
0.488
0.480
0.472
TJMS ZIRCON RESULTS 2655+3Ma-,
zircon grains from both samples (CT3 and W395).
Analysed zircons from CT3 are generally more dis-
cordant than those from W395 (Fig. 31, which may be due to the extent of the abrasion. However, the mean *O’Pb/ ‘06Pb age of 2657 k 4 Ma for the 6
most concordant zircons from sample W395 (Table I and Fig. 3) is within error of the mean “‘Pb/ ‘06Pb age of 2653 + 4 Ma for concordant zircons (3 out of
7 analyses) from sample CT3. A pooled estimate of the age from the 11 analyses which form the concor-
dant group on Fig. 3 gives 2655 + 3 Ma (MSWD = q-q
Fig. 3. Concordia plot showing data points of conventional TIMS
analyses of single zircon grains from Katrine syenite samples CT3
and W395. Error boxes are 2a.
6.8). Grain 10 has a significantly higher L”’ Pb/ ‘“‘Pb
age of 2691 + 3 Ma (Table 1) and falls well to the
right of the concordant cluster of points on Fig. 3,
Table 2
Ion-microprobe U-Th-Pb data for zircons from Katrine syenite sample W395
l-h/U *Pb z@+Pb %P@~P,-, 208pt,/206pb 206pb*/238u 2O'pb*/235U 207p,,*/206pb* li6ag.T
@pm) (ppb) (Ma)
l-l 490 2-1 391 3-1 702 4-1 410 5-l 888 6-l 295 7-l 1366 8-l 601 9-l 233 lo-l 1230 11-1 329 11-2 324 12-1 508 13-l 742 14-1 636 15-1 932 16-l 640 16-2 483 17-1 316 18-l 2212 18-2 2167 18-3 962 18-4 992 19-l 120 20-I 374 21-I 2102 21-2 528 22- 1 203 23- 1 232 24-l 457 25-1 488 26- 1 678 27-1 854 28-l 462 30-l 421 30-2 537
153 0.31 407 262 0.67 233 327 0.47 403 261 0.59 244 579 0.65 516 368 1.25 251 289 0.21 916 205 0.34 323 051 0.22 123 293 0.24 714 138 0.42 249
0.28 220 z: 0.71 305 500 0.67 585 329 0.52 359 527 0.57 531 191 0.30 435 120 0.25 267 133 0.42 163 540 0.24 1205 438 0.20 1307 149 0.15 505 242 0.24 544 039 0.32 068 191 0.51 214 738 0.35 1160 170 0.32 297 loo 0.49 157 053 0.23 145 135 0.30 246 173 0.35 266 252 0.37 373 710 0.83 498
:GY 00::: 22;: 162 0.30 307
55 38 15 01 21
Ai 24 28 4
:; 513 20 13 48 77 41 39 173 125
z: 22 16
:;
ii
z 90 28
Iii 165
55560 8380 22570 6763 18170 13880 14520 10400 3574 11850 9003 3721
2zo 8119 837 1 4334 5177 3270 7790 8306 3240 7813 1828 4920 11440 3514 2338 2576 4426 4812 325 1 12730 11750 1245 1484
0.0834 0.721f17 25.29m3 0.1881 0.507f12 12.66f32 0.1286 0.509+12 12.7Ozt30 0.1587 0.479fll 12.07f28 0.1755 0.498fll 12.46f29 0.3282 0.424f14 22.23*52 0.0543 0.599*13 20.27*46 0.0905 0.4921tll 12.15f28 0.0609 0.496fll 12.51f30 0.0607 0.525f12 16.05f37 0.1071 0645f15 22.8OS3 0.0734 0.599*14 19.96f47 0.0827 0.528f12 17.27f42 0.1747 0.64ti14 22.57f.52 0.1400 0.496fll 12.29+29 0.1506 0.498fll 12.30f28 0.0609 0.604+14 20.6U48 0.0523 0.517+12 13.59f32 0.0988 0.470fll 11.6Ozt28 0.0666 0.505fll 13.24f30 0.0541 0.558f14 15.58k39 0.0401 0.500*12 12.44*21 0.0644 0.512-113 12.68f32 0.0842 0.519f12 13.02f33 0.1373 0.501fll 12.54f30 0.1540 0.471fll 13.42f30 0.0838 0.517*13 12.77f33 0.1275 0.647f15 23.25L56 0.1408 0.570f13 17.22*42 0.1348 0.497fll 12.36?29 0.1351 0.497fll 12.28%29 0.0998 0.499fll 12.39%29 0.2224 0.483fll 11.99f27 0.0888 0.542f12 15.74f36 0.1927 0.543*14 13.41f38 0.0790 0.527f13 13.07*35
0.2544f12 3212m8 0.1808f13 2661f12 0.1810M8 2662m8 0.1827m8 2678m7 0.1816m4 2668m4 0.2585m9 3237m5 0.2454m4 3156rn3 0.1791f06 2644m5 0.1831flO 2681m9 0.2217m4 2993m3 0.2565-108 3226rn5 0.2417M8 313im5 0.2373f15 3102klO 0.2557m5 322Om3 0.1796m6 265Om6 0.179MM 2645m4 0.2481m6 3173m4 0. i 905m7 2746M6 0.1791m9 2644m9 0.1903m3 2745m2 0.2024m3 2846m2 0.1805rn5 2658m5 0.1796m4 2649m4 0.1819k13 2671f12 0.1814M7 2666m7 0.2067m3 288Om2 0.1791m8 2645m7 0.2608f13 3252rn8 0.219ofll 2973M8 0.1802rn7 2655m7 0. i792m7 2646m6 0.1798m6 2651m6 0.18OOm4 2653m4 0.2106m6 291Om5 0.1790+18 2644f! 6 0 1798m6 265 1509
Errors are + 1 g. * Radiogenic.

192 R.T. Pidgeon et al. /Earth and Planetary Science L.etters 141 (19%) 187-198
indicating that this grain contains a component of
inherited radiogenic Pb which is not evident in anal-
yses of other grains.
5. SHRIMP II analyses of zircons
In total, 29 zircons from syenite sample W395
were analysed on the Cm-tin SHRIMP II and the
results are presented in Table 2 and on a concordia
plot (Fig. 4). In preparation for SHRIMP analyses
the internal structures of the polished sections of zircon grains were examined in transmitted and re-
flected light after I-IF etching. It was observed that some grains are composed entirely of oscillatory
zoned zircon (Fig. 21, some have cores of zoned or unzoned zircon surrounded unconformably by a mantle of oscillatory zoned zircon and others are
completely unzoned. Eighteen analyses of com-
pletely zoned grains and two analyses of zoned rims around cores (grains 18 and 21) have concordant to
slightly discordant analytical points (Table 2 and Fig.
4) with a weighted average ‘07Pb/ ‘06Pb age of 2654 f X95%) Ma, which is the same within error
as the conventional age reported above. We have adopted this as the best estimate of the age of the
zoned zircon. We also interpret this as the age of
crystallisation of zircon from the syenitic magma.
Fourteen analyses of unzoned zircons and zircon cores (Table 2 and Fig. 4) are significantly older than 2654 Ma, demonstrating that the syenite zircon popu-
lation has a significant inherited component. This contrasts with the results of the conventional analy-
ses which did not identify the extent of this compo-
nent. This failure is attributed to a bias against
inherited zircons in selecting the optically clearest,
unflawed zircons for single grain conventional analy- ses. On a concordia plot (Fig. 4) most SHRIMP data
points fall on, or slightly below, a chord which intersects concordia at about 2700 Ma and 3250 Ma.
One point is reversely discordant (l-1, Table 2) and three data points fall significantly below the 2650- 3250 Ma chord. The ‘07Pb/ 206Pb age of the re-
versely discordant analysis agrees with that of other magmatic zircon, suggesting that the discrepancy in
this point is due to an unknown error in the determi- nation of the Pb/U ratios. The scattered position of
three points below the chord might be analytical error but can also be explained if the inherited
zircons derive from source rocks with a range of ages older than 3200 Ma, or if the zircons are from a
single source but have undergone various degrees of
SHRIMP ZIRCON RESULTS
10 12 14 16 18 20 22 24 26 28
Fig. 4. Concordia plot showing SHRIMF’ analytical points for zircons from Katrine syenite sample W395. Error boxes
line traces a chord between 3260 Ma and 2650 Ma.
are 1~. The dashed

R.T. Pidgeon et al. /Earth and Planetan, Science Letters 141 f 1996) 187-198 193
recent isotopic disturbance, which would move points
off the discordia in the direction of Pb loss. Apparent recent loss of Pb from high U, radiation damaged
zircon grains is a common observation (e.g. 1181) and the observed discordance in conventional single grain zircon analyses from sample CT3 (Fig. 31, despite
abrasion of the grains, and the small degree of discordance in the 2654 Ma SHRIMP data points
(Fig. 4) is evidence that the zircons have experienced a mild, relatively recent Pb loss.
6. Conventional single grain analyses of titanite
The results of 20 single grain analyses of titanite
from both syenite samples are presented in Table 1. Titanite grains include small, euhedral, brown grains
and dark brown, irregular fragments of larger crys-
tals. Grains can be clear or contain inclusions of apatite and also contain irregular patches of a REE- rich form of titanite plus quartz. The extremely irregular boundaries of this material suggest it formed
by exsolution from original titanite, possibly during regional metamorphism. Analyses were made on
abraded and unabraded grains (Table 1). Grains se-
lected for analysis were free of alteration and inclu-
sions, as determined by optical examination of indi-
vidual grains under propanol. To aid selection of
inclusion-free grains further, a group of the clearest
grains were abraded and the most transparent un-
blemished fragments were selected for analysis (see Table 1). Some grains were dark translucent others
were honey coloured and transparent and grains with a variety of colours were analysed to seek correla-
tions for observed isotopic behaviour (Table 1). We have polished and etched grains but have not been successful in revealing internal structures. Uranium
contents range from 53 to 169 ppm and the lowest
‘06Pb/ lo4Pb ratio is 388. On a concordia plot (Fig.
51, most data points are quite well correlated on a single chord, which passes through the lower group
of points (22, 25 and 28, Fig. 5) and can be projected
to an upper intersection age not significantly differ-
ent from 3250 Ma. A least-squares calculation of the intersection ages is not realistic as a number of
points appear to have undergone a second isotopic
disturbance and fall below this line (e.g. 18, 20. 23, 34 and 35, Fig. 5). This might also be taken as
evidence for more than one age of inherited titanite. However, the interpretation that primary, ca. 3250
Ma titanite has been strongly isotopically disturbed
at ca. 2650 Ma and has also been subjected to a variable but minor ‘zero age’ Pb loss is consistent
with our interpretation of the zircon results. We have
not identified any correlation between the degree of
discordance of the titanites and the uranium or tho-
0.60
0.56
0.52
TIMS RESULTS
11.2 12.8 14.4 16.0 17.6
Fig. 5. Concordia plot showing conventional TIMS results on titanite from Katrine syenite samples W395 and CT3. The
a reference chord intersecting concordia at 3260 Ma and 2600 Ma. Error boxes are 2~. dashed line defines

194 R.T. Pidgeon et al./Earth and Planetary Science Letters 141 (1996) 187-198
rium concentrations, the presence or absence of eu- hedral forms, or the depth of colour of the grains
(Table 1). We have taken great care to avoid inclu- sions and other blemishes in analysed crystals, par- ticularly in later samples which were abraded before
selection for analysis. Very small inclusions of zir-
con or monazite could introduce memory into the
titanite grains. There is some suggestion of this in
sample CT3 (Table 11, where titanite grains with the
largest inheritance signature have the highest 208Pb/ *06Pb ratios (Table 1). This could be ex-
plained by the nature of the original titanite but it
could also suggest the possible presence of inclu-
sions of 3250 Ma monazite. However, this relation-
ship is not supported by analyses of single fragments of titanite from sample W395, which have lower 208Pb/ *“Pb ratios than grains from sample CT3
(Table 1) and show no correlation between ‘08Pb/ *06Pb ratio and inherited component. Our
conclusion is that the inherited 3250 Ma component
in the titanite is most probably titanite itself, which
crystallised originally at ca. 3250 Ma and subse-
quently has been partially disturbed by diffusive Pb
loss or undergone recrystallisation and or new growth
at ca. 2650 Ma.
7. Conventional U-Pb analyses of apatite
Conventional analyses of apatites from samples
W395 and CT3 were made to investigate the post- metamorphic cooling history of the syenite. The
apatites have a range in uranium content of 33- 119
0.498
0.486
0.474
0.462
APAm RESULTS (W395 & CT3)
/. I %
9.3 9.9 10.5 11.1 11.7 12.3
Fig. 6. Concordia plot showing data points of conventional U-Pb analyses of apatites from Katrine syenite samples W395 and CT3.
ppm and 206Pb/ 204Pb ratios of 214-563 (Table 1).
The apatite results show no indication of any inher-
ited radiogenic lead. Despite a relatively high com- mon Pb correction, 5 data points are close to concor- dant and all points fall on a chord (Fig. 6) with an
upper intersection at 2633 f 6 Ma and a lower inter- section, which is the result of a long extrapolation, of
223 f 284 Ma, which is not significantly different
from zero million years. The consistency of the
U-Pb systems in the analysed apatite aliquots, within
and between the two samples, suggests a common
control for the apatite age. The apatite is younger by between 13 and 30 Ma than the ca. 2654 Ma mag-
matic zircons and by about 13 Ma than the age of the
amphibolite facies metamorphism. Consequently, we interpret the apatite age as recording the point in time where the region has cooled to a temperature where diffusive loss of radiogenic Pb from apatite
ceased.
8. Significance of the internal structure of the zircons
The zircon population contains a number of com-
pletely zoned zircons with euhedral forms that re- semble typical igneous zircons of type D of Pupin [ 191. These zoned zircons contain fine euhedral oscil-
latory zones with no suggestion, from optical exami-
nation, of older cores (Fig. 2A). SHRIMP analyses at the centres of these grains gave no evidence of
inherited radiogenic Pb, confirming that these grains
crystallised at ca. 2654 Ma. An alternative explana- tion, that the euhedral zircons and their internal
zoned structures formed by metamorphic growth dur- ing the regional granulite facies metamorphism dated at ca. 2649 Ma [9], which affected the syenite, is
contrary to results from a number of morphological studies of zircons which have crystallised or recrys- tallised in the solid state under high grade metamor- phism [9,20,21]. Such zircons are characterised by anhedral to rounded external forms with high-order faces and unzoned, or irregularly zoned, internal structures. This is in contrast to the oscillatory zoned
2654 Ma zircons in the syenite. On the basis of these studies and the description of magmatic zircons by Vavra [22] and others, our conclusions are that the

R.T. Pidgeon et al./Earth and Planetary Science Letters 141 (1996) 187-198 195
zoned zircon formed by crystallisation from a magma. This conclusion is critical to the interpretation of the
titanite results. Older (up to 3250 Ma) SHRIMP ages have been
determined on analytical areas located within central
parts of zircons which are surrounded by rims of
euhedrally zoned 2654 Ma zircon (Fig. 2Bl. Central areas determined to be older inherited zircon can be
zoned or unzoned. For example, in grain 18 (Fig. 2B) the older core shows oscillatory zoning, suggest-
ing a magmatic origin for the inherited zircon, and is set in a weakly oscillatory zoned 2654 Ma zircon
rim. A number of anhedral, unzoned grains (e.g., grain 16) consist entirely of inherited zircon. The
occurrence of such zircon grains, together with other
grains that consist entirely of 2654 Ma zircon with no obvious older cores, and complex grains with
2654 Ma rims and inherited centres, reflects the
history of formation of the present syenite. The
nature of the zircon structures may indicate a rela- tively low ratio of ca. 2654 Ma magma to unmelted
rock, where a proportion of old zircons was shielded
from the 2654 Ma crystallising magma, which plated
new zircon onto exposed nuclei. The presence of zoned zircon without inherited cores might reflect a form of magma mingling where zoned zircon crys-
tallised in the magma (at 2654 Ma) before it inter- acted with the 3250 Ma source rocks.
9. Stability of U-Pb systems in zircon, titanite and apatite
Zircon: On a concordia plot both the titanite and
zircon data points approximate to a common discor- dia line, which can be explained in terms of a
two-stage history, where initial crystallisation at ca. 3250 Ma was followed by either isotopic disturbance at ca. 2654 Ma, or new titanite and zircon growth at
this time. However, the zircon morphology and the SHRIMP analyses indicate that new magmatic zircon
formed at 2654 &- 5 Ma and it follows that titanite, and a portion of its 3250 Ma inherited radiogenic Pb,
has survived this 2654 Ma magmatic stage in the history of the syenite and the subsequent granulite facies metamorphism. It is well known that the U-Pb system of zircon is extremely stable and can survive anatexis, granite emplacement and crystalli-
sation [23], and high grade metamorphism but this
has not been documented before for the U-PI, sys- tem of titanite. The ages and stability of the U-Pb systems are dependent on the ‘closure temperatures’
CT’,> for Pb diffusion in the minerals [24]. The clo-
sure temperature for zircon has been estimated to be in excess of 900°C [25].
Titanite: Estimates for T, for titanite are much
lower and are not well defined. Mezger et al. [25] proposed a closure temperature (T,) of about 500°C
for diffusion of radiogenic Pb in titanite smaller than
1 mm, and about 670°C for grains with a maximum dimension of 30 mm, assuming a cooling rate of
2”C/Ma. An estimate of 500°C was also reported by Gascoyne [26] for the T, of titanite grains with an
effective diffusion radius of 0.05 cm, although Cliff
and Cohen [27] estimated T, of titanite to be > 550°C. Significantly higher T, estimates of 737°C
and 778°C for crystalline titanite with 0.5 cm diffu-
sion radii and cooling rates of 2°C and 10°C have
been reported by Chemiak [28]. Chemiak recognised
this discrepancy with earlier results and proposed
that this could be explained by uncertainty in select- ing the effective diffusion radius. The size of the
crystals may not necessarily determine the effective diffusion radius and it is possible that Mezger et al.
[25] underestimated the effective grain size in deter-
mining values for T, titanite. Another important factor in controlling the closure temperature of titan-
ite, also discussed by Chemiak [28], is the effect of
radiation damage on the diffusion behaviour of Pb.
The values of T, for titanite reported by [28] show a
dramatic decrease with increasing radiation damage, and for an effective diffusion radius of 0.1-0.5 cm,
which is within the size range of the titanite from the
Katrine syenite, T, values are as low as 300-400°C. Model curves based on experimentally determined
diffusion parameters and Dodson’s equation [28] show that, for metamict titanite, all Pb would be lost after 1 Ma at a temperature as low as 300°C and for
longer times the temperature needed for complete
removal of Pb would be even lower. This result is not in accord with the presence of inherited radio-
genie Pb in the titanite from the Katrine syenite and we conclude that model curves for crystalline titanite (fig. 8 in [28]) provide a more realistic description of the likely behaviour of titanite from the syenite. In this model, titanite with an effective diffusion radius

196 R.T. Pidgeon et al./Earth and Planetary Science Letters 141(1996) 187-198
of 0.5 cm has a closure temperature of 737°C and
778°C for cooling rates of 2°C and lO”C, respec-
tively. A T, for titanite close to 700°C is supported by a recent estimate of a minimum closure tempera-
ture for Pb diffusion in titanite of 650-700°C [29]
and also by results which have just come to our
notice [30], on the discovery of inherited titanite in a 35 Ma intrusive syenite from south China.
Aputite: From the results of ion implantation ex-
periments, Cherniak et al. [31] proposed that the T, for apatite falls within the range 550-450°C for cooling rates of 1 -lO”C/Ma and crystal radii of
0.01-0.05 cm. This estimate of T, for apatite is
supported by other investigators [32-341, who found that K-Ar ages of homblendes were almost identical
to U-Pb ages of co-existing apatite in cooling meta-
morphosed rocks, implying that T, values for the
two systems are very similar and approximately
500°C. However, agreement is not total as the T,
values of Chemiak et al. [31] are about 70°C lower than those reported by Watson et al. [35]. Also, Krogstad and Walker [36] reported a q value of
620°C for apatites with diameters of l-2 cm for the Tin Mountain Pegmatite in South Dakota. This value
appears high but, taking grain size into account, these authors calculated that this T, value is compat-
ible with the result of Chemiak et al. [31,35]. This
further emphasises the sensitivity of calculations of
closure temperatures (T,) to estimates of the effec-
tive diffusion grain size. Questions of effective diffu- sion radii and closure temperature calculations be-
come more complex when a significant proportion of the diffusion of species takes place via high diffusiv-
ity pathways, such as extended crystal defects, re- ferred to as short circuit diffusion [37]. Nevertheless, we have in this case assumed that the grain size of
apatite in the Katrine syenite, of about 0.01-0.05 cm, can be taken as the effective grain size and T, apatite, estimated from the above results [31], is
500 L- 50°C. Model curves [31] indicate that apatite xenocrysts in a granite magma would not retain a memory of any original radiogenic Pb if subjected to temperatures in excess of 600°C for 1 .O Ma or 550°C for 10 million years. From this model, and the lack of any inherited radiogenic Pb in the apatite, we infer that the syenite experienced conditions in excess of these and that the age of the apatites records the time the syenite cooled to a temperature of about 500°C.
10. Implications for the closure temperature of titan&e
The presence of inherited radiogenic Pb in titanite from the syenite is surprising in that it has survived,
firstly, a magmatic stage during formation of the
syenite, and, secondly, the upper amphibolite facies metamorphism which has affected this region. Titan-
ite ages have also been reported by Bosch et al. [2] for a granitic gneiss and an amphibolite in the pack- age of metamorphic rocks surrounding the Katrine
syenite (Fig. 1). Titanites from the gneiss register a
2650 Ma age and either formed, or were isotopically reset, during the metamorphism, which peaked about
625-650°C [8] in the Katrine region, whereas titanite
from the amphibolite registers an earlier event at
2711+ 7 Ma, and was not updated during the 2650 Ma metamorphism. These results suggest a possible
differential stability of titanite U-Pb systems be-
tween the two rock types, but the resistance of the titanite from the amphibolite, as well as the syenite, supports a closure temperature for titanite of greater
than about 650°C. Our results are in agreement with [29], that the T, of titanite is between 650°C and
700°C. The cooling rate relevant to this closure
temperature can be estimated very approximately at about 5-30”C/Ma, based on an age of 2649 f 6 Ma
for the peak of metamorphism at ca. 650°C and 2633 f 6 Ma for the closure of Pb diffusion from
apatite at ca. 500°C.
11. Implications for the origin of the syenite
The survival of inherited radiogenic Pb in titanite from the syenite magma raises questions about the U-Pb stability and blocking temperature of titanite,
and also about the origin of the syenite. It has been
proposed [38,39], from observations of large areas of syenitic rocks, that quartz syenites are formed by mixing of crustal and mantle-derived melts at high temperatures coupled with fractional crystallisation. The temperature contemplated for the above model of syenite formation [38,39], in excess of lOOO”C, is incompatible with all estimates, which range up to 75O”C, for the closure temperature of titanite. The presence of inherited titanite and zircon indicate an early crustal component in the Katrine syenite, but

R.T. Pidgeon et af. / Earth and Planetary Science Letters I41 119%) 187-198 197
also indicates it cannot have formed by crystallisa-
tion of a > 1000°C magma. Formation of the syenite by anatexis of adjacent quartz-muscovite-sil- limanite schists or the 3250 Ma parents of the granitic gneisses [40] can also be dismissed, as these would
form granitic melts after dehydration melting at tem-
peratures of over 800°C [41]. Similarly, the possibil-
ity that the syenite formed by partial melting of an
original (3250 Ma), essentially dry syenitic body
during the 2650 Ma high-grade metamorphic episode is unlikely, as melting temperatures would also be in excess of 800°C [42], which is not compatible with
the presence of inherited radiogenic Pb in the titan-
ite. These constraints require a low temperature magma and it is proposed that the syenite formed by
the introduction of a mobile, K-rich hydrous magma
into a 3250 Ma amphibolite-quartzo-feldspathic gneiss sequence during the 2650 Ma high grade
metamorphic episode. This would also explain the composite nature of the body with, local develop-
ment of coarse K-feldspar rich bands and thin bands of pyroxene-rich rock. The injected magma may
have affinities with pegmatite, as described by [43], and, conceivably, be emplaced at a temperature of
650-700°C. A higher temperature would be possible where injection of the magma into preexisting
gneisses, followed by cooling and crystallisation, was relatively quick, such that only minor dissolu-
tion of the original zircon and titanite occurred.
12. Conclusions
Inherited U-W systems in zircon and titanite from the Katrine syenite have survived a magmatic
stage in the formation of the syenite and also re- gional upper amphibolite facies metamorphism. This
suggests a closure temperature of between 650°C and 700°C for Pb diffusion in titanite. This conclusion
constrains the origin of the syenite and it is proposed
that the syenite formed by mixing of old, 3250 Ma crust with K-rich magma at 2654 + 5 Ma and a temperature of 650-700°C just prior to the peak of metamorphism at ca. 2649 + 6 Ma. Subsequent cool- ing to a temperature of ca. 500°C occurred at 2633 f 6 Ma.
Acknowledgements
We wish to acknowledge support for the project by a grant from the Australian Research Council and
an ARC International Fellowship awarded to Dr. 0.
Bruguier. The project also received support from the
National Key Centre for Resource Exploration. We
are grateful to Dr. A. Nemchin, Dr. D. Nelson, Dr.
N. Oliver, and Dr. S.A. Wilde for helpful discussions
and for commenting on the manuscript. The paper also benefited from constructive comments by Dr. R.
Frei and two other referees. 1FAl
References
111 R.D. Gee, J.L. Baxter, S.A. Wilde and I.R. Williams, Crustal
development in the Archaean Yilgam Block, Western Aus-
tralia, Spec. Publ. Geol. Sot. Aust. 7, 43-56, 1981.
[2] D. Bosch, 0. Bruguier, R.T. Pidgeon and D. Furfaro, Age
and evolution of the Jimperding Metamorphic Belt (Yilgarn
Craton, Western Australia): Conventional and SHRlMP U-Pb
analyses on accessory minerals, J. Geol., submitted.
[3] S.A. Wilde, Perth, Western Australia SH50-14, 1:25O,OKl
Geological Series - Explanatory Notes, 36 pp., 1987.
[4] A.F. Wilson and D.C. Green, The use of oxygen isotopes for
geothermometry of Proterozoic and Archaean granulites, in:
J.E. Glover, ed., Symp. on Archaean Rocks, Geol. Sot. Aust.
Spec. Publ. 3, 3899400, 1971.
[5] D.H. Lindsley, Pyroxene thermometry, Am. Mineral. 68,
477-493, 1983.
161 S.A. Wilde and R.T. Pidgeon, U-Pb geochronology,
geothermometry and petrology of the main areas of gold
mineralisation in the “Wheat Belt” region of Western Aus-
tralia, West. Aust. Miner. Pet. Res. Inst. Rep. 30, 171 pp.,
1987.
[7] S.A. Wilde, Geology and cmstal evolution of the southwest-
em Yiigam Craton. Excursion Guidebook, 3rd Int. Archaean
Symp., Perth, pp. 98-118, 1990.
IS] F.S. Spear, Metamorphic Phase Equilibrium and Pressure
Temperature Paths, 799 pp., Miner. Sot. Am. Monograph,
BookCrafters, Michigan, 1993.
[9] A.A. Nemchin, R.T. Pidgeon and S.A. Wilde, Timing of late
Archaean granulite facies metamorphism in the southwestern
Yilgarn Craton of Western Australia: evidence from U-W
systems of zircons in matic granulites, Precam. Res. 68,
307-321, 1994.
[lo] T.E. Krogh, A low-contamination method for hydrothermal
decomposition of zircons and extraction of U and Pb for
isotopic age determinations, Geochim. Cosmochim. Acta 37.
485-494, 1973.
[l 11 T.E. Krogh, Improved accuracy of U-Pb zircon ages by the

198 R.T. Pidgeon et al. / Earth and Planetary Science Letters 141 (1996) 187-198
creation of more concordant systems using the air abrasion
technique, Geochim. Cosmochim. Acta 46, 637-649, 1982.
[12] J.S. Stacey and J.D. Kramers, Approximation of terrestrial
lead isotope evolution by a two-stage model, Earth Planet.
Sci. Lett. 26, 207-221, 1975.
[13] K.R. Ludwig, Isoplot200, a plotting and regression program
for isotope geochemists, for use with HP series 200 comput-
ers, U.S. Geol. Surv. Open-file Rep. 85-513, 1987.
[14] R.H. Steiger and E. Jager, Subcommission on Geochronol-
ogy: Convention in the use of decay constants in geo- and
cosmochronology, Earth Planet. Sci. Lett. 36, 359-362, 1977.
[15] W. Compston, 1.S. Williams and C. Meyer, U-Pb
geochronologj of zircons from Lunar breccia 73217 using a
sensitive high mass-resolution ion microprobe, in: Proc. XIV
Lunar Planetary Science Conf., J. Geophys. Res. 89, suppl.,
B525-B534, 1984.
in a regionally metamorphosed tonalite from the Eastern
Alps, Earth Planet. Sci. Lett. 50, 211-218, 1980.
[28] D.J. Chemiak, Lead diffusion in titanite and preliminary
results on the effects of radiation damage on Pb transport,
Chem. Geol. 110, 177-194, 1993.
[29] D.J. Scott and M.R. St-Onge, Constraints on Pb closure
temperature in titanite based on rocks from the Ungava
orogen, Canada: Implications for U-Pb geochronology and
P-T-t path determinations, Geology 23, 1123-l 126, 1995.
[30] Lian-Sheng Zhang and U. S&tier, Inherited Pb components
in magmatic titanite and their consequence for the interpreta-
tion of U-Pb ages, Earth Planet Sci. Lett. (in press).
[31] D.J. Chemiak, W.A. Lanford and F.J. Ryerson, Lead diffu-
sion in apatite and zircon using ion implantation and Ruther-
ford backscattering techniques, Geochim. Cosmochim. Acta
55, 1663-1673, 1991.
[16] A.K. Kennedy and J.R. de Laeter, The performance charac-
teristics of the WA SHRIMP II ion microprobe, 8th Int.
Conf. on Geochronology, Cosmochronology and Isotope Ge-
ology, Berkeley, USGS Circ. 1107, 166, 1994.
[ 171 R.T. Pidgeon, D. Furfaro, A.K. Kennedy, A.A. Nemchin and
W. Van Bronswjk, Calibration of zircon standards for the
Curtin SHRIMP II, in: 8th Int. Conf. on Geochronology,
Cosmochronology and Isotope Geology, Berkeley, USGS
Circ. 1107, 251, 1994.
[18] L.T. Silver and S. Deutsch, Uranium-lead isotopic variations
in zircons: a case study, J. Geol. 71, 721-758, 1963.
[19] J.P. Pupin, Zircon and granite petrology, Contrib. Mineral.
Petrol. 73, 207-220, 1980.
[32] J.M. Mattinson, Age, origin, and thermal histories of some
plutonic rocks from the Salinian Block of California, Con-
trib. Mineral. Petrol. 67, 233-245, 1978.
[33] T.M. Harrison, Diffusion of “‘Ar in hornblende, Contrib.
Mineral. Petrol. 78, 324-331, 1981.
[34] T.M. Harrison and I. McDougall, Excess 40Ar in metamor-
phic rocks from Broken Hill, N.S.W. Implications for
40Ar/ 39Ar age spectra and the thermal history of the region,
Earth Planet. Sci. Lett. 55, 123-149, 1981.
[35] E.B. Watson, T.M. Harrison and F.J. Ryerson, Diffusion of
Sm, Sr, and Pb in fluorapatite, Geochim. Cosmochim. Acta
49, 1813-1823, 1985.
[20] 0. Van Breemen, A. Davidson, W.D. Loveridge and R.W.
Sullivan, U-Pb zircon geochronology of Grenville tectonites,
granulites and igneous precursors, Parry Sound, Ontario, in:
J.M. More, A. Davidson and A.J. Baer, eds., The Grenville
Province, Geol. Assoc. Can. Spec. Pap. 31, 191-207, 1986.
[21] R.T. Pidgeon, Recrystallisation of oscillatory zoned zircon:
some geochronological and petrological implications, Con-
trib. Mineral. Petrol. 110, 463-472, 1992.
[22] G. Vavra, Systematics of internal zircon morphology in
major Variscan granitoid types, Contrib. Mineral. Petrol.
117, 331-344, 1994.
[23] R.T. Pidgeon and M. Aftalion, Cogenetic and inherited zir-
con U-Pb systems in granites: Palaeozoic granites of Scot-
land and England, in: D.R. Bowes and B.E. Leake, eds.,
Crustal Evolution in Northwestern Britain and Adjacent Re-
gions, Geol. J. Spec. Issue 10, 183-220, 1978.
[24] M.H. Dodson, Closure temperature in cooling geochronologi-
cal and petrological systems, Contrib. Mineral. Petrol. 40,
259-274, 1973.
[36] E.J. Krogstad and R.J. Walker, High closure temperatures of
the U-Pb system in large apatites from the Tin Mountain
pegmatite, Black Hills, South Dakota, USA, Geochim. Cos-
mochim. Acta 58, 3845-3853, 1994.
[37] J.W. Lee, Multipath diffusion in geochronology, Contrib.
Mineral. Petrol. 120, 60-82, 1995.
[38] K.A. Foland, J.D. Landoll, C.M.B. Henderson and Chen
Jiangfeng, Formation of cogenetic quartz and nepheline syen-
ites, Geochim. Cosmochim. Acta 57, 697-704, 1993.
[39] B.A. Litvinovsky, S.M. Wickham, A.N. Zanvilevich and
R.C. Newton, Origin of syenite magmas in anorogenic grani-
toid series: Field, geochemical and experimental data from
east central Asia. III Hutton Symp. on the Origin of Granites
and Related Rocks, USGS Circ. 1129, 88-89, 1995.
[40] D.A. Nieuwland and W. Compston. Crustal evolution in the
Yilgam Block near Perth, Western Australia, Spec. Pub].
Geol. Sot. Aust. 7, 159-171, 1981.
[41] A.E. Patiiio and J.S. Beard. Dehydration-melting of biotite
gneiss and quartz amphibolite from 3 to 15 kbar, J. Petrol.
36, 707-738, 1995.
1251 K. Mezger, Geochronology in granulites, in: D. Vielzeuf and [42] S.D. MC Dowel1 and P.J. Wyllie, Experimental studies of
Ph. Vidal, eds., Granulites and Crustal Evolution, pp. 45 l- igneous rock series: The Kungnat syenite complex of south-
470, Kluwer, Dordrecht, The Netherlands, 1990. east Greenland, J. Geol. 79, 173-194, 1971.
[26] M. Gascoyne, Evidence for the stability of potential nuclear [43] R.H. Jahns and C.W. Bumham, Experimental studies of
waste host, sphene, over geological time, from uranium-lead pegmatite genesis: 1. A model for the derivation and crystal-
ages and uranium series disequilibrium measurements, Appl. lization of granitic pegmatites, Econ. Geol. 64, 843-864,
Geochem. 1, 199-210, 1986. 1969.
[27] R.A. Cliff and A. Cohen, Uranium-lead isotope systematics
GEOSTANDARDSNEWSLETTERThe Journal of Geostandards and Geoanalysis
Evaluation of Pb-Pb and U-Pb Laser Ablation ICP-MS Zircon Dating using Matrix-Matched Calibration Sampleswith a Frequency Quadrupled (266 nm) Nd-YAG Laser
Vol. 25 — N° 2-3 p . 3 6 1 - 3 7 3
This paper reports the successful application of laser ablation (LA) ICP-MS to the in situ analysis of207Pb/206Pb and 206Pb/238U isotopic ratios on zircon crystals using matrix-matched calibrationsamples as external calibrators. For 207Pb/206Pbanalyses, LA-ICP-MS results on reference materials(UQ-Z1 and G91500) indicated individual precisionsin the range 1-10% (2s), most analyses being betterthan 6%. The resulting weighted means were associated with errors typically better than 1% withages of 1148 ± 5 Ma (2s) and 1069 ± 9 Ma (2s) respectively. Analyses of well-dated late Archaeangranitic rocks from the western margin of the YilgarnCraton (Australia) are presented and show a close agreement with the reference values. An orthogneissdated at 2662 ± 4 Ma (2s) by ion microprobe(SHRIMP) gave a 207Pb/206Pb age of 2657 ± 6 Ma(2s). A more complex zircon population from a syenite emplaced at 2654 ± 5 Ma containing a ≤ 3.25 Ga inherited component has been investigated using a spot size of approximately 45µm. LA-ICP-MS provides a 207Pb/206Pb age of 2653± 6 Ma with older grains yielding ages of up to3.23 Ga. Dating of younger rocks (< 1 Ga), however,was limited by poor precision in the measurement ofthe 207Pb/206Pb isotopic ratios and by inter-elementfractionation between Pb and U during the ablationprocesses. Using a high power density, variations ofthe 206Pb/238U ratios during one spot analysis appeared to correlate positively with time over the first minute of ablation. A linear fit of the dataacquired during this period allowed a 206Pb/238Uratio to be calculated, thus reducing the magnitudeof the fractionation and improving precision toaround 5% (2s). Results on the G91500 zircon
Cet article présente l’application de la techniqued’ablation laser par ICP-MS à l’analyse in situ desrapports isotopiques 207Pb/206Pb et 206Pb/238U surcristaux de zircons en utilisant un matériel de référence de matrice identique. Pour les analyses207Pb/206Pb, les résultats des expériences d’ablationlaser sur zircons gemmes (UQ-Z1 et G91500) fournissent des précisions analytiques de l’ordre de 1 à 10% (2s) , la plupart des analyses étantmeilleures que 6% (2s). Les moyennes pondéréesfournissent des erreurs typiques de l’ordre de 1%avec des âges de 1148 ± 5 Ma (2s) et 1069 ± 9 Ma(2s) respectivement. Les résultats obtenus sur desgranitoïdes Archéens d’âge connu affleurant sur la bordure Ouest du Craton du Yilgarn (AustralieOccidentale) sont présentés et sont en bon accordavec les valeurs de référence. Un orthogneiss, datéà 2662 ± 4 Ma (2s) par sonde ionique (SHRIMP),fournit un âge 207Pb/206Pb de 2657 ± 6 Ma (2s).Une syénite, mise en place à 2654 ± 5 Ma (2s) etprésentant une population de zircon plus complexeavec un héritage ancien pouvant atteindre 3.25 Gaa été datée par ablation laser à 2653 ± 6 Ma (2s).Des âges plus anciens, pouvant atteindre 3.23 Ga, ont également été reconnus sur des cœurs hérités.L’application à des roches plus récentes (< 1 Ga) estcependant limitée par la faible précision dans lamesure des rapports isotopiques 207Pb/206Pb et parun fractionnement inter élémentaire important entrele Pb et l’U durant le processus d’ablation. En utilisant une puissance importante, la variation desrapports 206Pb/238U présente une corrélation linéaireavec le temps durant la première minute d’analyse.Une régression des données obtenues durant cetintervalle permet de calculer le rapport 206Pb/238U
3 6 1
1201
Olivier Bruguier (1)*, Philippe Télouk (2), Alain Cocherie (3), Anne-Marie Fouillac (3) and Francis Albarède (2)
(1) ISTEEM-CNRS, Service ICP-MS, cc 049, Université de Montpellier II, Place E. Bataillon, 34095 Montpellier, France. * Corresponding author, e-mail: [email protected](2) Laboratoire des Sciences de la Terre, Ecole Normale Supérieure de Lyon, 46 Allée d’Italie, 69364 Lyon Cedex 7, France(3) BRGM, 3 Avenue C. Guillemin, BP 6009, 45060 Orléans, France
Received 10 Nov 00 — Accepted 04 Jun 01

U-Pb zircon geochronology is probably one of themost widely used and reliable dating techniques forthe determination of (re)crystallisation age of rocks ina wide variety of environments. This is partly due tothe ubiquitous presence of zircon and to the robust-ness of the U-Th-Pb systems in this mineral, whichmake it prone to survive anatexis and high-grademetamorphic conditions, as well as to pass throughthe sedimentary cycle (e.g. Compston and Pidgeon1986). To date, the different competing techniquescapable of dating zircon with reasonable precisionare limited to the somewhat expensive SIMS andID-TIMS analyses. Laser ablation (LA) ICP-MS hasbeen shown recently to be a potentially valuablealternative to Pb-Pb dating (Feng et al. 1993, Fryere t al . 1993, Ludden et al . 1995, Machado andGauthier 1996, Machado et al . 1996, Scott andGauthier 1996). Although less precise, this techniquehas been shown to be cheaper and faster thanthe other two and still has the advantage of in situanalysis at the scale of a few tenths of a micrometresquare, thus allowing the determination of parts ofgrains identified within one crystal. The first work onLA-ICP-MS used a Nd:YAG laser operated at 1064nm (e.g. Machado and Gauthier 1996), but recent
progress in laser technology make it possible to qua-druple and even to quintuple (Jeffries et al. 1998) thefundamental wavelength and to use the fourth (266nm) and f i f th (213 nm) harmonic , so improv ingabsorption of the laser beam by the target materialand thus increasing laser efficiency as well as reducingthe spot size. The large inter-element fractionationobserved during ablation processes (Longerich et al.1996) , however, has hampered the wide use ofLA - ICP-MS in U -Pb g e o c h r o n o l o g y . O n l y f e wa t t e m p t s h a v e b e e n s u c ce s s f u l i n ob ta i n i ng206Pb/238U ratios and these studies have so far dealtwith the evaluation of the method using either inter-national NIST certified reference materials, which arevery different from natural zircon crystals (Hirata andNesbitt 1995, Hirata 1997) or l iquid calibrations(Horn et al. 2000). In this study, we chose to investi-gate the capabil i t ies of a frequency quadrupledNd:YAG laser in U-Pb zircon geochronology usingmatr ix-matched reference mater ials (UQ-Z1 andG91500 zircon crystals). The aim of these preliminaryexperiments was to establish whether an analyticalprotocol could be proposed that would providereproducible 238U-206Pb ratios at the precision levelexpected for a quadrupole ICP-MS.
3 6 2
GEOSTANDARDSNEWSLETTERThe Journal of Geostandards and Geoanalysis
reference sample yielded a 206Pb/238U age of 1057± 14 Ma, in good agreement with the publishedreference value (1062.4 Ma). Late Hercynian zirconsfrom a Corsican alkali granite dated at ca. 285 Maby TIMS and SHRIMP yielded a younger but consistent age of 277 ± 11 Ma. These results showthat using a somewhat simple apparatus (quadrupole ICP-MS and 266 nm Nd:YAG laser),the technique has the capability of producing precise and reliable 207Pb/206Pb and 206Pb/238Uages with a minimal sample preparation and a highthroughput. The present limitations are associatedwith the high density power used in this study, asanalyses must be conducted on grains larger than80 µm that are free of inclusions and fractures,which often result in “catastrophic” ablation. Shorterwavelength lasers, which yield a better laser-targetcoupling and which produce smaller ablated particles, should help to reduce these drawbacks.
Keywords: laser ablation, ICP-MS, U-Pb geochronology,zircon, inter-element fractionation.
avec une meilleure précision (ca. 5%), tout en réduisant l’amplitude du fractionnement. Les résultats obtenus sur le cristal gemme G91500 fournissent un âge 206Pb/238U de 1057 ± 14 Ma en bon accord avec la valeur publiée de 1062.4Ma. Un granite alcalin hercynien daté à 285 Mapar TIMS et par SHRIMP, fournit un âge par ablation laser de 277 ± 11 Ma. Ces résultats montrent que grâce à un appareillage relativementsimple (ICP-MS quadrupôlaire et laser Nd:YAG à266 nm) la technique d’ablation laser permet d’obtenir rapidement des âges 207Pb/206Pb et206Pb/238U fiables et précis avec un minimum depréparation. Une limite à cette technique résidedans le fait que la puissance utilisée nécessite descristaux de taille supérieure à 80 µm, dépourvusd’inclusions et de fractures qui, souvent produisentune ablation catastrophique. L’utilisation de lasers àlongueur d’onde plus courte, qui présentent unemeilleure absorption du faisceau et qui produisentdes particules de taille plus petite, devrait permettrede contourner ces problèmes.
Mots-clés : ablation laser, ICP-MS, géochronologie U-Pb, zircon, fractionnement inter élémentaire.

Experimental
Apparatus
Ablation experiments were carried out using aSpectraphysic GCR-130 Nd-YAG pulsed laser, opera-ting in the ultraviolet region at 266 nm. The laser wasoperated in the Q-switched mode at a repetition rateof 10 Hz and a pulse duration of 5 ns. Under theseconditions, the maximum laser energy output was 50mJ per shot at 266 nm. A plano-convex lens was usedto focus the laser beam onto the sample surface andthe ablation pit diameter for zircon was kept constantat ca. 40-50 µm throughout this study. The ablationcell was made in-house of Teflon with a silica windowon top with a total volume of ca. 5 cm3. Samples wereplaced in the cell and flushed with an argon flow forabout fifteen minutes before starting measurements.Sample preparat ion requirements were minimal .Zircons grains, selected using a binocular microscopef rom non-magnet ic concent ra tes , were mountedtogether with chips of reference samples in epoxy resinand slightly polished to expose the top of the grainsand to give a reasonably flat surface. The mounts werethen carefully washed with tri-distilled water, soap andalcohol and flushed with nitrogen before their intro-duction into the ablation cell. The laser apparatus wascoupled to a VG Plasmaquad II ICP-MS modified byaddition of a rotary pump, allowing a two fold decreaseof the vacuum in the expansion chamber and, thus,enhancing sensitivity. Before each laser session, initialset-up of the instrument was done using a 5 ng g-1
solution of In, Pb and U, which typically yielded a sen-sitivity of 100 x 106 cps per µg g-1 of In. The machinewas then quickly set to the laser mode by diverting theargon nebu l i se r gas f low to the ab la t ion ce l l .Conditions were subsequently refined for dry plasmaanalysis by ablating a NIST SRM 610 silicate glassCRM containing ca. 500 µg g-1 of Pb and other traceelements. The torch box position, lens setting, gas flowsand resolution were optimized and the machine wastuned on 208Pb in order to minimise background andHg interference. This generally resulted in a loss of sen-sitivity, but in a more favourable signal/backgroundratio. Under these conditions, the ICP-MS achieved atypical sensitivity of up to 2000 cps per µg g-1 Pb.Laser and ICP-MS operating parameters are summari-zed in Table 1.
All laser ablation experiments were conducted inthe peak jumping acquisition mode using three pointsper peak. The dwell time for all peaks was set to
10.24 ms except for 202Hg, 204Pb and 232Th, whichwere counted in 5.12 ms and 207Pb, which was mea-sured for a longer time (20.48 ms). A typical acquisi-tion consisted of five repeats of 10 s each. 238U wasalso used to screen the data and repeats with lessthan 10 000 cps on this isotope were rejected fromthe calculation in a similar way to that described byMachado and Gauthier (1996). The samples werepre-ablated for 10 s before measurement to avoid theinitial signal pulses and to achieve enhanced preci-sion. The typical procedural runs included one gasblank measurement fol lowed by three calibrationsamples, one gas blank, six unknowns, one gas blank,six unknowns and finally three calibration samples.Blanks were averaged and the values were subtractedfrom calibration samples and unknowns.
Pb and U-Pb fractionation
Early studies (e.g. Feng et al. 1993, Hirata andNesbitt 1995) have shown that the main problem inPb-Pb and U-Pb laser ablation isotopic analyses arerelated to mass bias, inter-elemental fractionation andinterferences that can combine to restrict seriously pre-cision and accuracy of the results. Mass bias is mainlythe result of space charge effects taking place in both
GEOSTANDARDSNEWSLETTERThe Journal of Geostandards and Geoanalysis
3 6 3
Table 1.Laser and ICP-MS operating parameters
LaserLaser type Quadrupled Nd-YAGWavelength 266 nmLaser mode Q-switchedRepetition rate 10 HzPrimary output power 50 mJ per pulse at 266 nmPulse width 5 nsAblation cell Teflon made, 5 cm3 internal volumeTransportation system Tygon tube, ca. 3 m total length
ICP-MSModel VG PQII+ (with one additional rotary pump)Forward power 1350 WReflected power < 5 WCool gas 14-15 l min-1
Auxilliary Gas 1-1.1 l min-1
Carrier gas 1.1 l min-1
Acquisition ParametersDetector mode Pulse countingMeasured isotopes 202Hg, 204Pb, 206Pb, 207Pb, 208Pb, 232Th, 238UDwell time per isotope 10.24 ms (20.48 on 207Pb, 5.12 on 202Hg,
204Pb and 232Th)Quad settle time 10 msPoints/peak 3Pre-ablation time 3-10 sAcquisition time 10 sNo. of repeats 5

the plasma and the sampler-skimmer cone interfaceregion (Hirata 1996). This fractionation favours theheavy isotopes, which are preferentially transmitted,while lighter isotopes are more easily dispersed awayfrom their trajectory. In this work, the magnitude ofmass bias was evaluated using external calibrationprocedures either on the silicate glass NIST SRM 610or on the natural zircon crystals UQZ1 and G91500.Results of these ablation experiments are reported in
Figure 1, which shows a series of 207Pb/206Pb ratiomeasurements performed within a period of a singleday (Figure 1a and 1b) or over a few weeks (Figure 1c).For the NIST SRM 610 glass, the data yielded a weigh-ted mean of 0.9111 ± 0.0052 (2s), which gives a massbias value of 0.16% when compared to the referencevalue of Walder at al. (1993). Measurements achievedon the G91500 gem crystal (Wiedenbeck et al. 1995)provided a weighted mean of 0.07503 ± 0.00032
3 6 4
GEOSTANDARDSNEWSLETTERThe Journal of Geostandards and Geoanalysis
Figure 1. Mass bias diagrams calculated from a set of 207Pb/206Pb measurements performed on (a) the silicate
glass CRM NIST SRM 610 (where the mass bias = 0.16%; reference value = 0.9096 ± 0.0008 (Walder et al. 1993),
mean value = 0.9111 ± 0.0052 mean square of the weighted deviates MSWD = 0.22) and natural gem zircon crystals,
(b) the zircon reference sample G91500 (mass bias = 0.19%; reference value = 0.07488 ± 0.00002, age = 1065 ± 1
Ma (Wiedenbeck et al. 1995); mean value = 0.07503 ± 0.00032, age = 1069 ± 9 Ma MSWD = 0.49) and (c) the zircon
reference sample UQ-Z1 (mass bias = 0.29%; reference value = 0.07784 ± 0.00004, age = 1143 ± 1 Ma (Machado
and Gauthier 1996); mean value = 0.07807 ± 0.00019, age = 1148 ± 5 Ma MSWD = 2.8). Error bars represent 2s in
all cases. In (b) the determination shown by the filled symbol was discarded from the age calculation as it includes a
significant proportion of non-radiogenic Pb. In all of these diagrams the dashed line corresponds to the reference value.
Number of measurements
Number of measurements Number of measurements
20
7Pb
/20
6Pb
isot
opic
ra
tio2
07Pb
/20
6Pb
isot
opic
ra
tio
20
7Pb
/20
6Pb
isot
opic
ra
tio
0.067
0.069
0.071
0.073
0.075
0.077
0.079
0.081
0.083
0.085
0 10 20
G91500 zircon reference sample
b
0.70
0.74
0.78
0.82
0.86
0.90
0.94
0.98
1.02
1.06
0 10
NIST SRM 610 Glass CRM a
5 150.068
0.070
0.072
0.074
0.076
0.078
0.080
0.082
0.084
0 10 20 30 40 50
UQ-Z1 zircon reference material
c

(2s) corresponding to an apparent age of 1069 ± 9Ma. The calculated mass bias is almost identical tothat obtained on the NIST SRM 610 glass referencematerial, with a value of 0.19%. The zircon referencesample UQZ1 (Machado and Gauthier 1996) wasalso measured over a period of several months andthe results of more than fifty spots gave a weightedmean 207Pb/206Pb ratio of 0.07807 ± 0.00019 (2s),which results in an apparent age of 1148 ± 5 Ma anda mean calculated mass bias of about 0.3%. Thisslightly higher value is thought to reflect variations inmass bias that are also dependent on the daily opera-ting conditions. In spite of very different optical, thermal,chemical and mineralogical characteristics, the NISTSRM 610 synthetic silicate glass (rhyolitic glass) andnatural zircon crystals (light pink zirconium silicates)yielded similar mass bias values, which suggests that,for the nanosecond UV laser, and at the precision levelachieved with our apparatus, this parameter is notcontrolled by properties of the target material. Therequirement for matrix matched calibration samples,which is so important for quantitative analyses (Jarvisand Williams 1993), is thus not necessary in Pb-Pbisotopic ratio determination. Based on this observation,the NIST SRM silicate glass or the UQ-Z1 zircon wereboth used to correct for mass bias, although, takinginto account the requirements of sample preparation, itwas found easier to include chips of the UQ-Z1 zircontogether with “unknown” zircon crystals in the epoxyresin. During a set of measurements (see sect ion
above), the mean of the first three calibration sampleswas used to correct the first six unknowns. The last sixunknowns were corrected using the mean of the lastthree calibration samples. Each ratio was corrected formass bias following the relationship below:
Rcorr = Rmeas. • (1 + C)δm (1)
where δm is the mass difference and C the mass biascorrecting factor determined from measurements onreference samples.
In contrast to Pb/Pb ratios, for which the mass biascorrection is straightforward and significantly lowerthan the individual analytical precision of each spotanalysis (between 0.5 and 5% at the 1s level), ele-mental fractionation between U and Pb is a moreserious problem. As a consequence of the very diffe-rent behaviour of U relative to Pb during ablation, U-Pb ratios evolve during each individual spot analysis.Figure 2a shows the evolution of the 206Pb/238U ratioagainst time for laser experiments performed with a ca.30 µm spot on the NIST SRM 610, where each repeathad a 2 s duration. Excluding the 10 s initial pulse, thefirst part of the diagram (i.e. from 10 to 30 s), yields aregular inc rease in the 206Pb/238U ra t io , whichappears to be a linear function of time (see inset inFigure 2a). Using a linear least squares fit, the “initial”206Pb/238U ratio can be calculated with a precision ofaround 5% (2s), which compares favourably with the
GEOSTANDARDSNEWSLETTERThe Journal of Geostandards and Geoanalysis
3 6 5
0.15
0.19
0.23
0.27
0.31
0.35
0.39
0.43
0.47
0.51
0.55
0.59
0 10 20 30 40 50
UQ-Z1 true value��(0.1933)
UQ-Z1��F = 45 µm
b
0.0
0.1
0.2
0.3
0.4
0.5
0.6
0.7
0.8
0.9
1.0
0 10 20 30 40 50 60
10 15 25 30
0.25
0.2
0.3
0.35
0.4
y = 0.0048x + 0.2298
R2 = 0.9938
20 35
NIST SRM 610
NIST true ratio: 0.2249
a
F = 30 µm
0.15
0.19
0.23
0.27
0.31
0.35
0.39
0.43
10 20 30 40 50
G91500 true value��(0.1791)
G91500��
c0
F = 45 µm
Figure 2. (a) Evolution of the 206Pb/238U ratio
against time for a 30 µm diameter spot (F)
drilled in the NIST SRM 610 glass CRM. After the
first 10 s, which corresponds to the initial pulse,
the 206Pb/238U ratio yielded a linear correlation
with time (inset). Defocusing of the laser beam
and loss of energy coupled to the sample is
responsible for the large increase of the U-Pb
ratio observed (main figure). (b) Plot of 206Pb/238U
ratio against time for the zircon reference sample
UQ-Z1 (Machado and Gauthier 1996) for a spot
diameter (F) of ca. 45 µm; slope of the best-fit
line = 0.0318 ± 0.0060, intercept = 0.3915 ±
0.019, MSWD = 0.29, probability = 0.83. (c) Plot
of 206Pb/238U ratio against time for the zircon
reference sample G91500 (Wiedenbeck et al.
1995) for a spot diameter (F) of ca. 45 µm; slope
of best-fit line = 0.0223 ± 0.0051, intercept
= 0.3429 ± 0.016, MSWD = 0.70, probability
= 0.55. All error bars represent 2s.
20
6Pb
/23
8U
ra
tio
Time (s)

10-15% measurement error. In addition, the magnitudeof the inter-element fractionation correction is signifi-cantly reduced, thus improving accuracy in the deter-mination of the 206Pb/238U ratio. The calculated ratiois then used to define the magnitude of the elementalfractionation, and is corrected by comparison withvalues obtained from a set of measurements performedon a reference material (Figures 2b and c). In the lastpart of the diagram, the 206Pb/238U ratio increasessignificantly and can even reach four times the valueof the true ratio. Absorption of the optical energyinvolves a series of mechanisms that can cause melting,vaporisation, ionisation, ejection of particles (clustersand solid fragments), plasma initiation and expansion.At the laser power density used in this study, we observedthat the true isotopic ratio (0.2249 for NIST SRM 610)was approached in the first measurements but ratioswere always higher, suggesting that laser ablation isdominated by thermal vaporisation. If ionisation werethe main operating mechanism, the 206Pb/238U ratiowould be lower than the true value, since U is easierto ionise (6.194 eV) than Pb (7.417 eV). The regularincrease of the 206Pb/238U ratio is thought to reflectprogressive defocusing of the laser beam as it drillsthrough the sample and an associated loss of energyimparted to the sample. This results in a preferentialenrichment of Pb in the vapour phase due to analmost two times lower latent heat of vaporisation ofPb than for U. Absorption or scattering of a proportionof the laser energy by the optically dense vapourplume above the ablation crater can further cause adecrease in the amount of energy transferred into thesample and thus contribute to the selective enrichmentof Pb in the vapour phase. A plot of the 206Pb/238Uratio against laser flashlamp voltage (Figure 3) showsthat the Pb/U rat ios are more reproducible anddecrease with increasing laser energy. Decreasing theflashlamp voltage causes a decrease in the laser inci-dent power, which results in lower signal intensity andpoorer reproducibili ty. The Pb/U ratio, however, issignificantly different, indicating preferential Pb enrich-ment and, thus, substantiating the suggestion that athermal mechanism appears to govern the laser abla-tion process and could describe the ablation beha-viour and inter-element fractionation at low laserpower density. Horn et al. (2000) observed a similarpositive correlation between Pb/U fractionation anddepth with a 15 ns pulse duration excimer laser (193nm) and proposed that, at this wavelength, a mecha-nism such as selective condensation of refractory ele-ments (U) on the crater walls successfully describesinter-element fractionation. A less efficient ejection of
the particles as the crater deepens can also be invokedat 266 nm and could explain the large increase of theU-Pb ratio in the last part of Figure 2a. From this pointof view, it is interesting to note that the relationshipbetween crater aspect ratio (diameter against depth)and fractionation observed by Eggins et al. (1998) isan important parameter and that the best results areobtained with a ratio close to 1. Although the drillingrate should be different in the case of the NIST SRM610 and natural zircons, it can be seen that the biggerthe spot diameter, the longer the linear correlation.
Interference and common lead correction
Using a dry plasma, interferences are generally nota problem except for isobaric interferences of 204Hgon 204Pb. Hirata and Nesbitt (1995) suggested thatmost of the Hg comes from the argon itself and that fil-tering the gas using charcoal reduced this interferenceby 30 to 90%. In the course of this study, this interfe-rence was corrected by monitoring 202Hg and assu-ming a 204Hg/202Hg ratio of 0.2293. The remaining204Pb was ascribed to common Pb. The difficulty ofmeasuring precisely the small 204Pb isotope generallymakes any common lead correction inaccurate and
3 6 6
GEOSTANDARDSNEWSLETTERThe Journal of Geostandards and Geoanalysis
0.6
1.1
1.6
2.1
2.6
0 2 4 6 8 10
NIST SRM 610 Glass Flash Lamp: 80%Mean: 2.02 ± 0.28
Flash Lamp: 90%Mean: 1.10 ± 0.07
Figure 3. Measured/true ratios diagram for the U-Pb ratios of
NIST SRM 610 glass CRM at different laser flashlamp voltages.
Adjusting laser flashlamp voltage from 80 to 90% of the
maximum resulted in a higher ablation rate and consequently
a better precision and reproducibility. The 206Pb/238U ratio
tends to be lower at higher flashlamp voltage. Since almost
twice as much energy is needed to vaporise U than Pb, the
amount of vaporised U increases faster with increasing energy,
which can be predicted from a thermal vaporisation model.
Error bars represent 2s.
Measurements
Pb/U
ra
tios
(mea
sure
d/t
rue)

we used therefore a correction threshold based on thelimit of detection (LOD), defined as three times thestandard deviation of the intensity in cps of 204Pb inthe blank. Most analyses (unknowns and calibrationsamples) yielded a 204Pb intensity lower than the LODand, thus, were not corrected for common Pb. For theother analyses, a 204Pb correction was applied, basedon an assumed common Pb composition modelled ascontemporaneous Pb (Stacey and Kramers 1975).Corrected isotopic ratios and weighted averages werethen calculated according to Ludwig (1987). Analyticaluncertainties are listed as 1s and uncertainties in agesas 95% confidence levels. Decay constants are thoserecommended by the IUGS subcommission on geo-chronology (Steiger and Jäger 1977).
Results
The zircon populations selected for this study havewell known ages as they have already been subjectedto U-Pb analyses, either by the conventional ID-TIMSmethod, or by using the SHRIMP, or in some cases byboth. The samples come from a wide variety of rocksand cover an age span ranging from late Archaean toLate Palaeozoic . The two f i rs t examples are f romArchaean rocks of the Jimperding Metamorphic Beltlocated on the western margin of the Yilgarn Craton(Western Australia), which have been investigatedonly for 207Pb/206Pb systematics. U-Pb analyses arepresented for younger material, i.e. the ca. 1 Ga oldG91500 zircon reference sample and Late Palaeozoiczircons from an alkali granite from Corsica (France). Inall cases, the UQ-Z1 zircon crystal (Machado andGauthier 1996) was used as an external calibrationsample for evaluating the magnitude of the mass biasand inter-element fractionation.
207Pb/206Pb isotopic measurements
Samples W400 and W395 (Jimperding Meta-morphic Belt, Western Australia): U-Pb ages fromthese two samples have been obtained previously byID-TIMS and SHRIMP analyses (see details in Bosch etal. 1996 and Pidgeon et al. 1996). W400 is an ortho-gneiss for which crystallisation and emplacement hasbeen dated at 2662 ± 4 Ma by SHRIMP (Figure 4a).The zircon population shows a simple behaviour withall points being concordant to slightly discordant. SEMobservation of SHRIMP spots showed the occurrenceof unzoned recrystallised domains that have statis-tically younger ages (black symbols in Figure 4a).Recrystallisation is attributed to amphibolite facies
regional metamorphism which peaked at ca. 2650Ma in this area (Nemchin et al. 1994). Laser ablationanalyses were performed on non-magnetic zircon crys-tals selected to be flawless, with no visible fractures orinclusions. The 207Pb/206Pb ratios for thirteen spots onthirteen grains are reported in Table 2. All analysesshowed a small amount of 204Pb, but below the LOD(55 cps), except analysis #3, which yielded an unu-sually high 204Pb intensity (246 cps). The appliedcorrection gave a much younger age than the remainder
GEOSTANDARDSNEWSLETTERThe Journal of Geostandards and Geoanalysis
3 6 7
Figure 4. Isotopic results for the W400 orthogneiss
(Jimperding Metamorphic Belt, Western Australia).
(a) Concordia diagram for SHRIMP analyses. Polygons
represent 1s uncertainties. Unfilled polygons: main euhedral
population (2664 ± 4 Ma); black polygons: unzoned
domains (2640 ± 16 Ma); grey polygon: core (2684 ± 14
Ma). (b) Laser ablation ICP-MS 207Pb/206Pb diagram,
showing a mean value of 0.18050 ± 0.00064 (MSWD
= 0.5), giving an age of 2657 ± 6 Ma. Error bars are 2s.
Number of measurements
207Pb/235U
20
6Pb
/23
8U
20
7Pb
/20
6Pb
isot
opic
ra
tio
a0.480
0.500
0.520
0.540
0.560
11 12 13 14 15
2550
2600
2650
2700
2750
2800
W400 OrthogneissSHRIMP analyses
0.170
0.172
0.174
0.176
0.178
0.180
0.182
0.184
0.186
0.188
0 5 10
Age: 2657 ± 6 Ma
W400 OrthogneissLA-ICP-MS analyses b
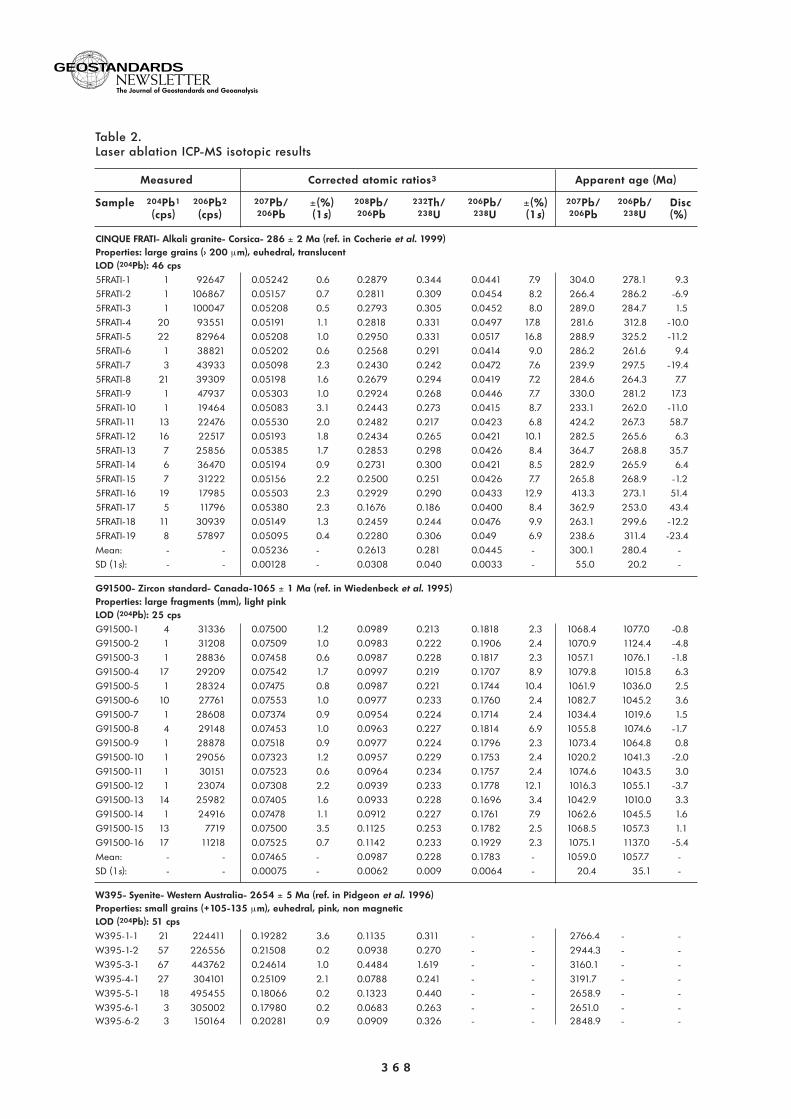
3 6 8
GEOSTANDARDSNEWSLETTERThe Journal of Geostandards and Geoanalysis
Table 2.Laser ablation ICP-MS isotopic results
Measured Corrected atomic ratios3 Apparent age (Ma)
Sample 204Pb1 206Pb2 207Pb/ ±(%) 208Pb/ 232Th/ 206Pb/ ±(%) 207Pb/ 206Pb/ Disc(cps) (cps) 206Pb (1s) 206Pb 238U 238U (1s) 206Pb 238U (%)
CINQUE FRATI- Alkali granite- Corsica- 286 ± 2 Ma (ref. in Cocherie et al. 1999)Properties: large grains (> 200 µm), euhedral, translucentLOD (204Pb): 46 cps5FRATI-1 1 92647 0.05242 0.6 0.2879 0.344 0.0441 7.9 304.0 278.1 9.35FRATI-2 1 106867 0.05157 0.7 0.2811 0.309 0.0454 8.2 266.4 286.2 -6.95FRATI-3 1 100047 0.05208 0.5 0.2793 0.305 0.0452 8.0 289.0 284.7 1.55FRATI-4 20 93551 0.05191 1.1 0.2818 0.331 0.0497 17.8 281.6 312.8 -10.05FRATI-5 22 82964 0.05208 1.0 0.2950 0.331 0.0517 16.8 288.9 325.2 -11.25FRATI-6 1 38821 0.05202 0.6 0.2568 0.291 0.0414 9.0 286.2 261.6 9.45FRATI-7 3 43933 0.05098 2.3 0.2430 0.242 0.0472 7.6 239.9 297.5 -19.45FRATI-8 21 39309 0.05198 1.6 0.2679 0.294 0.0419 7.2 284.6 264.3 7.75FRATI-9 1 47937 0.05303 1.0 0.2924 0.268 0.0446 7.7 330.0 281.2 17.35FRATI-10 1 19464 0.05083 3.1 0.2443 0.273 0.0415 8.7 233.1 262.0 -11.05FRATI-11 13 22476 0.05530 2.0 0.2482 0.217 0.0423 6.8 424.2 267.3 58.75FRATI-12 16 22517 0.05193 1.8 0.2434 0.265 0.0421 10.1 282.5 265.6 6.35FRATI-13 7 25856 0.05385 1.7 0.2853 0.298 0.0426 8.4 364.7 268.8 35.75FRATI-14 6 36470 0.05194 0.9 0.2731 0.300 0.0421 8.5 282.9 265.9 6.45FRATI-15 7 31222 0.05156 2.2 0.2500 0.251 0.0426 7.7 265.8 268.9 -1.25FRATI-16 19 17985 0.05503 2.3 0.2929 0.290 0.0433 12.9 413.3 273.1 51.45FRATI-17 5 11796 0.05380 2.3 0.1676 0.186 0.0400 8.4 362.9 253.0 43.45FRATI-18 11 30939 0.05149 1.3 0.2459 0.244 0.0476 9.9 263.1 299.6 -12.25FRATI-19 8 57897 0.05095 0.4 0.2280 0.306 0.049 6.9 238.6 311.4 -23.4Mean: - - 0.05236 - 0.2613 0.281 0.0445 - 300.1 280.4 -SD (1s): - - 0.00128 - 0.0308 0.040 0.0033 - 55.0 20.2 -
G91500- Zircon standard- Canada-1065 ± 1 Ma (ref. in Wiedenbeck et al. 1995)Properties: large fragments (mm), light pinkLOD (204Pb): 25 cpsG91500-1 4 31336 0.07500 1.2 0.0989 0.213 0.1818 2.3 1068.4 1077.0 -0.8G91500-2 1 31208 0.07509 1.0 0.0983 0.222 0.1906 2.4 1070.9 1124.4 -4.8G91500-3 1 28836 0.07458 0.6 0.0987 0.228 0.1817 2.3 1057.1 1076.1 -1.8G91500-4 17 29209 0.07542 1.7 0.0997 0.219 0.1707 8.9 1079.8 1015.8 6.3G91500-5 1 28324 0.07475 0.8 0.0987 0.221 0.1744 10.4 1061.9 1036.0 2.5G91500-6 10 27761 0.07553 1.0 0.0977 0.233 0.1760 2.4 1082.7 1045.2 3.6G91500-7 1 28608 0.07374 0.9 0.0954 0.224 0.1714 2.4 1034.4 1019.6 1.5G91500-8 4 29148 0.07453 1.0 0.0963 0.227 0.1814 6.9 1055.8 1074.6 -1.7G91500-9 1 28878 0.07518 0.9 0.0977 0.224 0.1796 2.3 1073.4 1064.8 0.8G91500-10 1 29056 0.07323 1.2 0.0957 0.229 0.1753 2.4 1020.2 1041.3 -2.0G91500-11 1 30151 0.07523 0.6 0.0964 0.234 0.1757 2.4 1074.6 1043.5 3.0G91500-12 1 23074 0.07308 2.2 0.0939 0.233 0.1778 12.1 1016.3 1055.1 -3.7G91500-13 14 25982 0.07405 1.6 0.0933 0.228 0.1696 3.4 1042.9 1010.0 3.3G91500-14 1 24916 0.07478 1.1 0.0912 0.227 0.1761 7.9 1062.6 1045.5 1.6G91500-15 13 7719 0.07500 3.5 0.1125 0.253 0.1782 2.5 1068.5 1057.3 1.1G91500-16 17 11218 0.07525 0.7 0.1142 0.233 0.1929 2.3 1075.1 1137.0 -5.4Mean: - - 0.07465 - 0.0987 0.228 0.1783 - 1059.0 1057.7 -SD (1s): - - 0.00075 - 0.0062 0.009 0.0064 - 20.4 35.1 -
W395- Syenite- Western Australia- 2654 ± 5 Ma (ref. in Pidgeon et al. 1996)Properties: small grains (+105-135 µm), euhedral, pink, non magneticLOD (204Pb): 51 cpsW395-1-1 21 224411 0.19282 3.6 0.1135 0.311 - - 2766.4 - -W395-1-2 57 226556 0.21508 0.2 0.0938 0.270 - - 2944.3 - -W395-3-1 67 443762 0.24614 1.0 0.4484 1.619 - - 3160.1 - -W395-4-1 27 304101 0.25109 2.1 0.0788 0.241 - - 3191.7 - -W395-5-1 18 495455 0.18066 0.2 0.1323 0.440 - - 2658.9 - -W395-6-1 3 305002 0.17980 0.2 0.0683 0.263 - - 2651.0 - -W395-6-2 3 150164 0.20281 0.9 0.0909 0.326 - - 2848.9 - -

and this point was, therefore, discarded from the agecalculation. The twelve remaining analyses were com-b ined to g i ve a we igh ted mean o f 0 .18050 ±0.00064 (2s) corresponding to an age of 2657 ± 6Ma (Figure 4b). The laser ablation value is very closeto the 2662 Ma SHRIMP reference value and shows
comparable error margins. Unlike the SHRIMP analyses,LA-ICP-MS analyses were not capable of detecting theyounger recrystallised domains, although some youngages would suggest that such domains could havebeen sampled by the laser beam. The short time spanbetween igneous crystallisation and recrystallisation,
GEOSTANDARDSNEWSLETTERThe Journal of Geostandards and Geoanalysis
3 6 9
Table 2 (continued).Laser ablation ICP-MS isotopic results
Measured Corrected atomic ratios3 Apparent age (Ma)
Sample 204Pb1 206Pb2 207Pb/ ±(%) 208Pb/ 232Th/ 206Pb/ ±(%) 207Pb/ 206Pb/ Disc(cps) (cps) 206Pb (1s) 206Pb 238U 238U (1s) 206Pb 238U (%)
W395-7-1 1 68423 0.17953 1.1 0.0803 0.285 - - 2648.5 - -W395-7-2 23 363556 0.18070 0.6 0.0793 0.208 - - 2659.3 - -W395-8-1 1 15288 0.25785 0.8 0.1778 0.479 - - 3233.6 - -W395-9-1 1 321503 0.18307 0.4 0.0882 0.241 - - 2680.9 - -W395-9-2 3 273131 0.18086 0.6 0.1071 0.246 - - 2660.7 - -W395-9-3 22 538830 0.18143 0.8 0.0871 0.205 - - 2666.0 - -W395-10-1 1 86592 0.18084 0.6 0.1235 0.461 - - 2660.6 - -W395-11-1 38 418562 0.23796 3.4 0.0753 0.219 - - 3106.4 - -W395-12-1 3 52307 0.17792 1.0 0.1579 0.908 - - 2633.6 - -W395-12-2 9 161414 0.17622 0.8 0.1132 0.261 - - 2617.6 - -W395-12-3 1 148068 0.17890 0.9 0.1250 0.306 - - 2642.7 - -W395-13-1 1 83300 0.17654 1.7 0.0566 0.168 - - 2620.7 - -W395-14-1 31 161352 0.17652 0.8 0.1297 0.348 - - 2620.5 - -W395-15-1 20 80342 0.17608 1.2 0.1150 0.310 - - 2616.3 - -W395-15-2 1 27094 0.17751 1.0 0.1027 0.264 - - 2629.8 - -W395-16-1 18 54051 0.24584 0.3 0.1084 0.399 - - 3158.2 - -W395-16-2 25 41186 0.24422 1.0 0.1101 0.317 - - 3147.7 - -W395-17-1 1 31956 0.18083 0.8 0.0851 0.215 - - 2660.5 - -W395-17-2 17 73407 0.18011 0.7 0.1471 0.367 - - 2653.9 - -Mean (young): - - 0.17927 - 0.1058 0.323 - - 2646.0 - -SD (1s): - - 0.00211 - 0.0283 0.171 - - 19.5 - -
W400- Orthogneiss- Western Australia- 2662 ± 4 Ma (ref. in Bosch et al. 1996)Properties: small grains (+135-180 µm), euhedral, light brown, non magneticLOD (204Pb): 48 cpsW400-1 14 271020 0.18011 0.8 0.2315 0.821 - - 2653.9 - -W400-2 23 242838 0.18030 0.4 0.0972 0.300 - - 2655.7 - -W400-3 246 233821 0.17709 1.8 0.1469 0.368 - - 2625.8 - -W400-4 23 233087 0.18062 1.2 0.1347 0.426 - - 2658.5 - -W400-5 1 93040 0.17995 0.3 0.1150 0.385 - - 2652.4 - -W400-6 40 163381 0.18217 0.5 0.1572 0.541 - - 2672.7 - -W400-7 9 76292 0.18066 0.8 0.1088 0.330 - - 2659.0 - -W400-8 1 66784 0.18112 1.0 0.1657 0.514 - - 2663.2 - -W400-9 14 73459 0.18278 1.3 0.0940 0.308 - - 2678.3 - -W400-10 7 106168 0.18055 1.1 0.1050 0.272 - - 2658.0 - -W400-11 23 141211 0.18000 0.8 0.1926 0.624 - - 2652.9 - -W400-12 51 210877 0.18163 1.1 0.1517 0.360 - - 2667.9 - -W400-13 23 94853 0.17969 1.7 0.1732 0.487 - - 2650.0 - -Mean: - - 0.18080 - 0.1439 0.447 - - 2660.2 - -SD (1s): - - 0.00096 - 0.0426 0.161 - - 8.7 - -
All zircon grains have been taken from the least magnetic bulk fractions.1 corrected for background and Hg isobaric interference based on a 204Hg/202Hg = 0.2293.2 corrected for background.3 lead isotopic ratios have been corrected for background, mass bias by reference to UQ-Z1 zircon reference sample (Machado andGauthier 1996) and initial common Pb (after Stacey and Kramers 1975) for measurements where 204Pb was found to be greater than the determined LOD. U-Pb ratios have been calibrated against a 206Pb/238U ratio of 0.1933 calculated by averaging the most concordant analyses given in Machado and Gauthier (1996). The 207Pb/235U ratios were calculated using the corrected 207Pb/206Pb ratio and according to a 238U/235U ratio of 137.88. Errors are 1s and refer to last digits.The right hand column (“disc”) is the percentage discordance assuming recent lead losses.

and the low precision of the LA-ICP-MS analyses makethe age difference unresolvable.
The syenite W395 outcrops in the same area andwas analysed because of a more complex zirconpopulation with evidence of an inherited component inthe source region of the magma (Figure 5a). SHRIMPanalyses yielded an age of 2654 ± 5 Ma, interpretedas dating emplacement and crystallisation of the syenite.In addition, SHRIMP spot analyses identified an inheri-ted component with ages reaching values of about3.25 Ga and very discordant analyses between 2660and 3250 Ma. Seventeen grains were analysed byLA-ICP-MS and were found to contain a small amountof 204Pb, below the LOD, except for two spots (#1-2
and 3-1) for which the beam may have struck a crackin the grain or an inclusion. The 207Pb/206Pb agespectrum, ranges from 2616 ± 88 Ma (2s) to 3233 ±56 Ma (2s), and confirms the age pattern observed bySHRIMP analyses. A histogram showing the distributionof the 207Pb/206Pb ratios (Figure 5b) indicates thatmost analyses cluster close to 2650 Ma with a weigh-ted mean of 0.18002 ± 0.00063 (2s), correspondingto an age of 2653 ± 6 Ma. This age is in close agree-ment with the SHRIMP value of 2654 ± 5 Ma. Anotherinteresting result is the identification of the inheritedcomponent, with the oldest LA-ICP-MS value (3233Ma) being also very close to the oldest SHRIMP value(3250 Ma). Results from grain #6, which was probedin two places, also demonstrate that the spatial resolu-tion available with our laser system has the capabilityto analyse distinct domains present within one crystal(see Table 2), although the intermediate value of 2848Ma for the core (#6-2) may indicate that the beamstraddled the magmatic growth zone.
206Pb/238U isotopic measurements
Sample G91500 (Ontario, Canada): Fragmentsof this 238 g zircon crystal are used as a referencesample for the calibration of the U-Pb ratios measuredby SIMS on the CAMECA IMS1270 commissioned atthe CRPG Nancy (France) and at Stockholm (Sweden).The crystal has been calibrated by different laborato-ries (see Wiedenbeck et al. 1995) and is known to behomogeneous and concordant at about 1065 Mawith a 207Pb/206Pb of 0.07488 ± 0.00002 (2s) and a206Pb/238U ratio of 0.1792 ± 0.0002 (2s). Sixteenspots were measured on several fragments of thissample (see Table 2) and were all found to be lessthan 10% discordant. The measured 204Pb counts werevery low (less than 20 cps) in good agreement withthe low common lead content of this crystal (seeWiedenbeck et al. 1995). The corrected 206Pb/238Uages range from 1010 ± 30 Ma to 1137 ± 23 Ma.Reported on the concordia diagram (Figure 6), ana-lyses define a discordia line which has an upperintercept age of 1060 ± 36 Ma and a lower interceptnot significantly different from zero (300 ± 960 Ma),which is the result of a long extrapolation. All pointscan be combined to give a 206Pb/238U weightedaverage of 0.1781 ± 0.0026 (MSWD = 1.13) corres-ponding to a mean age of 1057 ± 14 Ma (2s). ThisLA-ICP-MS age is well within the error of the TIMSvalue of 1062.4 ± 0.4 Ma (Wiedenbeck et al. 1995).Two analy ses (# 2 and 16) have s l igh t l y o lder206Pb/238U ages, but can be considered as reversely
3 7 0
GEOSTANDARDSNEWSLETTERThe Journal of Geostandards and Geoanalysis
Figure 5. Isotopic results for the W395 syenite (Jimperding
Metamorphic Belt, Western Australia). (a) Concordia diagram
for SHRIMP analyses. Polygons represent 1s uncertainties.
(b) Histogram showing the distribution of the 207Pb/206Pb ages
measured by laser ablation ICP-MS.
Age (Ma)
207Pb/235U
20
6Pb
/23
8U
Freq
uenc
y
0.45
0.55
0.65
0.75
10 12 14 16 18 20 22 24 26 28
2600
2800
3000
3200
3400
0.46
0.48
0.50
0.51
0.53
12
13
2550
2600
26502700
2654 ± 5 Ma
Weighted Av.
207Pb / 206Pb
a W395 SyeniteSHRIMP analyses
2650 2750 2850 2950 3050 3150 3250
2
0
4
6
8 W395 SyeniteLA-ICP-MS analyses
b
Age: 2653 ± 6 Man = 16
Mean: 0.18002 ± 0.00063(MSWD = 1.9)

discordant ( see Table 2) . Th is feature , which i sfrequently observed during in situ analyses (Williamset al. 1984), can also be ascribed to a quick drift inthe U-Pb fractionation.
Sample Cinque Frat i : Th is sample i s a La tePalaeozoic alkali granite from Corsica which has beenpreviously dated by ID-TIMS at 286.4 ± 1.8 Ma andby SHRIMP at 284.8 ± 2.3 Ma (Cocherie et al. 1999).The TIMS value corresponds to a 206Pb/238U ratio of0.0454 ± 0.0003 (2s). Nineteen spots were measuredby laser ablation on large, translucent crystals (> 200µm) devoid of fractures or inclusions. All analysesyielded very low 204Pb counts (< 25 cps) below theLOD and no common lead correction was applied tothese measurements. The nineteen analyses plot on orclose to the concordia curve (Figure 7) with 206Pb/238Uages ranging from 253 ± 21 Ma to 325 ± 53 Ma (seeTable 2). Because of their tight clustering, no discordiacan be calculated. A weighted mean for all spots givesa 206Pb/238U ratio of 0.0439 ± 0.0017 (MSWD =0.53) corresponding to an age of 277 ± 11 Ma (2s).Although slightly younger, the mean LA-ICP-MS ageoverlaps the more precise TIMS and SHRIMP values.
Discussion and conclusions
The results presented in this study demonstrate thatcoupling a 266 nm UV laser to a quadrupole ICP-MScan be succes s fu l l y u sed to de te rm ine in s i t u207Pb/206Pb and 206Pb/238U ratios for geochronologi-cal purposes. The external calibration can be achievedusing either a naturally occurring zircon crystal or amore widely available synthetic glass reference material.Both materials yielded comparable mass bias valuesand could thus be used to correct the 207Pb/206Pbratios. Measurements could be routinely achieved onsingle zircon grains with a spatial resolution of ca.40-50 µm without the need for matrix matched refe-rence materials. As a single measurement requiredonly 1 minute of data acquisition, a comprehensivestudy of a zircon population could be achieved withina few hours. This is the case even for heterogeneouszircon populations, such as those from granitic rockswith multiple inherited components and/or sedimentaryrocks, which often result from erosion of a wide varietyof source rocks, both in terms of ages and composi-tions. Analysis of the 207Pb/206Pb ratios in these zirconpopulations can thus provide a wealth of informationto pinpoint the deep-seated source regions of magmasor to fingerprint the sources of clastic sediments, bothof which may have important geodynamic implications.The high throughput rate of the technique is, in theseapplications, a major advantage over TIMS or SIMStechniques. Open system behaviour, which is frequentlyobserved on zircon but also on monazite, is a seriousdrawback but can be minimised by selecting the least
GEOSTANDARDSNEWSLETTERThe Journal of Geostandards and Geoanalysis
3 7 1
Figure 6. Concordia diagram for LA-ICP-MS analyses of fragments
of the G91500 zircon crystal. All analyses are represented by
ellipses sized according to their 2s uncertainties. The weighted
mean 207Pb/206Pb ratio = 0.07479 ± 0.00035 (MSWD = 0.7),
representing an age of 1063 ± 9 Ma. The 206Pb/238U
weighted mean age = 1057 ± 14 Ma.
207Pb/235U
20
6Pb
/23
8U
Figure 7. Concordia diagram for LA-ICP-MS analyses of zircons
from the Late Palaeozoic Cinque Frati alkali granite (Corsica,
France). All analyses are represented by ellipses sized according
to their 2s uncertainties. The weighted mean 207Pb/206Pb ratio
= 0.05178 ± 0.00036 (MSWD = 2.8), representing an age of
276 ± 16 Ma. The 206Pb/238U weighted mean age = 277 ± 11 Ma.
207Pb/235U
20
6Pb
/23
8U
1140
1060
980
900
0.145
0.155
0.165
0.175
0.185
0.195
0.205
0.8 1.2 1.6 2.0 2.4 2.8
Upper Intercepts at:1060 ± 36 Ma(MSWD = 0.1)
To 309 ± 960 Ma
G91500 (Canada)Zircon
206Pb/238U AgeWeighted Mean: 1057 ± 14 Ma
400
500
300
200
100
0.00
0.02
0.04
0.06
0.08
0.0 0.2 0.4 0.6
Cinque Fratti (Corsica)Zircon
206Pb/238U Age
Weighted Mean: 277 ± 11 Ma
magnetic grains. Potentially discordant analyses canbe detected and discarded from age calculation, asthey result in a spread of ages towards lower valuesand skewed 207Pb/206Pb histograms. The 204Pb isotopecannot be measured accurately by ICP-MS because ofboth very low counts on this isotope and a significantHg interference. We are, therefore, generally unable tocorrect precisely for the common lead contributionusing the 206Pb/204Pb ratio (see Table 2). This howeverdoes not seem to be a problem for laser ablation ana-lyses and generally we observed that the measured207Pb/206Pb values were very close to the expectedvalue. This is partly due to the high sensitivity of theICP-MS, which results in a high count rate on the206Pb isotope ( > 20 000 cps and up to 400 000cps) and to the fact that pristine zircons are usuallydevoid of common lead. For Archaean and Proterozoiczircons, the common lead contribution is generallyundetectable.
The external calibration technique used in thisstudy allowed us to control the high inter-element frac-tionation observed between U and Pb and to correctthis fract ionation to achieve a precision down toaround 5%. This is due to the linear correlation obser-ved between the variation of the 206Pb/238U ratio andtime during ablation. The calculated ratio showed amuch better precision than the measured ratio. Thissimple technique allowed the age determination ofyoung material for which the 207Pb/206Pb ratio couldnot be used. Due to the high sensitivity of the ICP sour-ce, this opens up new possibilities in the dating of veryyoung rocks with a precision that should exceed thecapabilities of SIMS analyses. In terms of precision andaccuracy, analyses performed during the course of thisstudy using matrix matched calibration samples sho-wed comparable or slightly worse results than thoseobtained by external calibration using a NIST glassCRM (Hirata and Nesbitt 1995) or a liquid calibration(Horn et al. 2000) respectively. Thus, the capability oflaser ablation ICP-MS analyses to determine U-Pbages without the need to use well calibrated naturallyoccurring gem-quality reference samples constitutes amajor advantage over matrix-dependent SIMS ana-lyses, particularly when investigating other accessoryminerals for which phase mineral relationships are betterdocumented than for zircon (e.g. sphene, allanite) or evenon high U-Pb ratio calcretes or biogenic phosphates.
An important problem inherent to the methodis related to the quality of the grains selected foranalyses. Several experiments on zircon populations
containing fractures or inclusions revealed that catas-trophic ablation often occurred, during which grainsshattered, even when tightly embedded in epoxy.Ejection of the large fragments led to spiky signals thatproduced high relative standard deviations. In suchcases, the ablation behaviour did not match that of thecalibration sample and this precluded any acceptablecalibration from being made. Grains must, therefore,be carefully selected from the non-magnetic concen-trate, in a similar manner to the conventional isotopedilution method, and the laser beam must be focusedon homogeneous grain domains. There is, therefore, arisk of analyses biased towards the highest qualitycrystals from the zircon population yielding an unre-presentative age spectrum. Shorter wavelength lasersoperating in the far UV region have the smoothestablation behaviour and are expected to reduce thisdrawback to a significant extent.
The spatial resolution used in this study was abouttwo times worse than that normally achieved by SIMS(20-30 µm), which can be a disadvantage for highspatial resolution studies (overgrowth, recrystalliseddomains). However, previous studies have shown that,providing sensitivity can be enhanced, comparable(Horn et al. 2000) or even smaller (Hirata and Nesbitt1995) spot sizes can be achieved. Our results, obtai-ned on Palaeozoic and Precambrian zircons, show thathigh precision age measurements can be obtained byLA-ICP-MS instrumentation that is more widely avai-lable than high resolution secondary ion microprobes.
Acknowledgements
This work was supported by a BRGM post-doctoralgrant to the first author. Thanks are due to NunoMachado (UQAM, Montréal, Canada) and EtienneDeloule (CRPG, Nancy, France) for providing chips ofthe zircon standards UQ-Z1 and G91500 respectively.Constructive reviews by two anonymous reviewershelped improve this manuscript.
References
Bosch D., Bruguier O. and Pidgeon R.T. (1996)The evolution of an Archaean Metamorphic Belt: Aconventional and SHRIMP U-Pb study of accessory minerals from the Jimperding Metamorphic Belt, YilgarnCraton, Western Australia. Journal of Geology, 104,695-711.
Compston W. and Pidgeon R.T. (1986)Jack Hills, evidence of more very old zircons in WesternAustralia. Nature, 321, 766-769.
3 7 2
GEOSTANDARDSNEWSLETTERThe Journal of Geostandards and Geoanalysis

references
Cocherie A., Rossi P., Fanning M. and Guerrot C. (1999)Comparative use of TIMS and SHRIMP for zircon dating:A reappraisal of the estimation of age uncertainties.Some examples from Corsica, France. In: Barbarin ?(ed.), 4th Hutton Symposium on the Origin of Granitesand Related Rocks, Clermont-Ferrand, France, BRGMedition, 290, 206.
Eggins S.M., Kinsley L.P.J. and Shelley J.M.M. (1998)Deposition and element fractionation processes duringatmospheric pressure laser sampling for analysis by ICP-MS.Applied Surface Science, 127, 278-286.
Feng R., Machado N. and Ludden J.N. (1993)Lead geochronology of zircon by laser probe-inductivelycoupled plasma-mass spectrometry (LP-ICP-MS).Geochimica et Cosmochimica Acta, 57, 3479-3486.
Fryer B.J., Jackson S.E. and Longerich H.P. (1993)The application of laser ablation microprobe-inductivelycoupled-mass spectrometry (LAM-ICP-MS) to in situ (U)-Pbgeochronology. Chemical Geology, 109, 1-8.
Hirata T. and Nesbitt R.W. (1995)U-Pb isotope geochronology of zircon: Evaluation of thelaser probe-inductively coupled plasma spectrometrytechnique. Geochimica et Cosmochimica Acta, 59,2491-2500.
Hirata T. (1996)Lead isotopic analyses of NIST standard reference materials using multiple collector inductively coupledplasma-mass spectrometry coupled with a modifiedexternal correction method for mass discrimination effect.Analyst, 121, 1407-1411.
Hirata T. (1997)Soft ablation technique for laser ablation-inductively coupled plasma-mass spectrometry. Journal of AnalyticalAtomic Spectrometry, 12, 1337-1342.
Horn I., Rudnick R.L. and McDonough W. (2000)Precise elemental and isotope ratio determination bysimultaneous solution nebulization and laser ablation-ICP-MS: Application to U-Pb geochronology. ChemicalGeology, 167, 405-425.
Jarvis K.E. and Williams J.G. (1993)Laser ablation inductively coupled plasma-mass spectrometry (LA-ICP-MS): A rapid technique for the direct,quantitative determination of major, trace and rare-earthelements in geological samples. Chemical Geology,106, 251-262.
Jeffries T.E., Jackson S.E. and Longerich H.P. (1998)Application of a frequency quintupled Nd:YAG source (λ = 213 nm) for laser ablation ICP-MS analysis of minerals.Journal of Analytical Atomic Spectroscopy, 13, 935-940.
Longerich H.P., Günther D. and Jackson S.E. (1996)Elemental fractionation in laser ablation inductively coupled plasma-mass spectrometry. Fresenius’ Journal ofAnalytical Chemistry, 355, 538-542.
Ludden J.N., Feng R., Gauthier G., Stix J., Shi L.,Francis D., Machado N. and Wu G. (1995)Applications of LAM-ICP-MS analysis to minerals.Canadian Mineralogist, 33, 419-434.
Ludwig K.R. (1987)Isoplot200, a plotting and regression program for isotope geochemists, for use with HP series 200 computers. USGS Open-file report 85-513.
Machado N. and Gauthier G. (1996)Determination of 207Pb/206Pb ages on zircon and monazite by laser ablation ICP-MS and application to astudy of sedimentary provenance and metamorphism insoutheastern Brazil. Geochimica et Cosmochimica Acta,60, 5063-5073.
Machado N., Schrank A., Noce C.M. and Gauthier G. (1996)Ages of detrital zircon from Archaean-Paleoproterozoicsequences: Implications for Greenstone Belt setting andevolution of a Transamazonian foreland basin inQuadrilatero Ferrifero southeast Brazil. Earth andPlanetary Science Letters, 141, 259-276.
Nemchin A.A., Pidgeon R.T. and Wilde S.A. (1994)Timing of Late Archaean granulite facies metamorphismin the southwestern Yilgarn Craton of Western Australia:Evidence from U-Pb ages of zircons from mafic granulites.Precambrian Research, 68, 307-321.
Pidgeon R.T., Bosch D. and Bruguier O. (1996)Petrogenetic implications of inherited zircon and titanite inthe Archaean Katrine syenite, Southwestern YilgarnCraton, Western Australia. Earth and Planetary ScienceLetters, 141, 187-198.
Scott D.J. and Gauthier G. (1996)Comparison of TIMS (U-Pb) and laser ablation microprobeICP-MS (Pb) techniques for age determination of detritalzircons from Paleoproterozoic metasedimentary rocksfrom northeastern Laurentia, Canada, with tectonic implications. Chemical Geology, 131, 127-142.
Stacey J.S. and Kramers J.D. (1975)Approximation of terrestrial lead isotope evolution by atwo stage model. Earth and Planetary Science Letters, 6,15-25.
Steiger R.H. and Jäger E. (1977)Subcommission on geochronology: Convention on theuse of decay constants in geo- and cosmochronology.Earth and Planetary Science Letters, 36, 359-362.
Walder A.J., Abell I.D., Platzner I. and Freedman P.A. (1993)Lead ratio measurement of NIST 610 glass by laser ablation inductively coupled plasma-mass spectrometry.Spectrochimica Acta, 48, 397-402.
Wiedenbeck M., Allé P., Corfu F., Griffin W.L., Meier M., Oberli F., Von Quadt A., Roddick J.C.and Spiegel W. (1995)Three natural zircon standards for U-Th-Pb, Lu-Hf, traceelement and REE analyses. Geostandards Newsletter, 19, 1-23.
Williams I.S., Compston W., Black L.P., Ireland T.R.and Foster J.J. (1984)Unsupported radiogenic Pb in zircon: A cause of anomalously high Pb-Pb, U-Pb and Th-Pb ages.Contributions to Mineralogy and Petrology, 88, 322-327.
GEOSTANDARDSNEWSLETTERThe Journal of Geostandards and Geoanalysis
3 7 3
Monazite ‘‘in situ’’ 207Pb/206Pb geochronology using a small
geometry high-resolution ion probe. Application to
Archaean and Proterozoic rocks
Delphine Bosch a,*, Dalila Hammor b, Olivier Bruguier c, Renaud Caby a,Jean-Marc Luck d
aLaboratoire de Tectonophysique, Universite Montpellier II, CNRS-UMR 5568, cc 066, Place Eugene Bataillon,
34095 Montpellier Cedex 05, FrancebDepartement de Geologie, Universite d’Annaba, B.P. 12, El Hadjar Annaba, Algeria
cService ICP-MS, ISTEEM, Universite Montpellier II, cc 049, Place Eugene Bataillon, 34 095 Montpellier Cedex 5, FrancedLaboratoire de Geophysique, Tectonique et Sedimentologie, Universite Montpellier II, CNRS-UMR 5573,
cc 060, Place Eugene Bataillon, 34 095 Montpellier Cedex 5, France
Received 19 March 2001; accepted 2 August 2001
Abstract
This paper reports the application of secondary ion mass spectrometry (SIMS) using a small geometry Cameca IMS4f ion
probe to provide reliable in situ 207Pb/206Pb ages on monazite populations of Archaean and Proterozoic age. The reliability of
the SIMS technique has been assessed on two samples previously dated by the conventional ID-TIMS method at 2661F1
Ma for monazites extracted from a pelitic schist from the Jimperding Metamorphic Belt (Yilgarn Craton, Western Australia)
and 1083F 3 Ma for monazites from a high-grade paragneiss from the Northampton Metamorphic Complex (Pinjarra
Orogen, Western Australia). SIMS results provide 207Pb/206Pb weighted mean ages of 2659F 3 Ma (n = 28) and 1086F 6 Ma
(n = 21) in close agreement with ID-TIMS reference values for the main monazite growth event. Monazites from the
Northampton Complex document a complex history. The spatial resolution of about 30 mm and the precision achieved
successfully identify within-grain heterogeneities and indicate that monazite growth and recrystallisation occurred during
several events. This includes detection of one inherited grain dated at ca. 1360 Ma, which is identical to the age of the
youngest group of detrital zircons in the paragneiss. Younger ages at ca. 1120 Ma are tentatively interpreted as dating a
growth event during the prograde stages of metamorphism. These results demonstrate that the closure temperature for lead
diffusion in monazite can be as high as 800 �C. At last, ages down to ca. 990 Ma are coeval with late pegmatitic activity and
may reflect either lead losses or partial recrystallisation during the waning stages of metamorphism. A third unknown sample
was analysed to test the capability of the in situ method to date younger monazite populations. The sample, a pelitic
metatexite from Northwestern Hoggar (Algeria), contains rounded metamorphic monazites that provide a 207Pb/206Pb
weighted mean age of 603F 11 Ma (n = 20). This age is interpreted as recording emplacement of a gabbronoritic body during
amphibolite facies regional metamorphism and is representative of the late pulse of the Pan-African tectonometamorphic
0009-2541/02/$ - see front matter D 2002 Elsevier Science B.V. All rights reserved.
PII: S0009-2541 (01 )00361 -8
* Corresponding author.
E-mail addresses: [email protected] (D. Bosch), [email protected] (O. Bruguier), [email protected]
(R. Caby), [email protected] (J.-M. Luck).
www.elsevier.com/locate/chemgeo
Chemical Geology 184 (2002) 151–165
evolution in the western part of the Tuareg shield. In situ SIMS analyses using a widely available, small geometry ion probe,
can thus be successfully used to accurately determine ages for complex Precambrian monazite populations. D 2002 Elsevier
Science B.V. All rights reserved.
Keywords: SIMS; Monazite; 207Pb/206Pb geochronology; Metamorphism
1. Introduction
Over the last decade, monazite, a lanthanide-rich
phosphate, has been widely used as a geochronometer
and this mineral is, after zircon, probably the most
used U-rich phase in geochronology. Monazite is a
common accessory mineral occurring in a wide
variety of rock types (sedimentary, metamorphic
and magmatic), therefore allowing the dating of
various events such as the emplacement of magmatic
rocks or the growth of minerals (or cooling) in
metamorphic terranes (e.g. Parrish, 1990), or the
tracing of source region for detritus that accumulated
in sedimentary basins. Monazite is thought to have a
relatively simple behaviour in comparison to zircon
and is often found in concordant position in the con-
cordia diagram, thus indicating closed system behav-
iour with respect to the U–Pb system. In contrast to
silicate minerals such as zircon, which have a ten-
dency to become metamict, monazite rarely exhibits
radiation damage of the crystal lattice in spite of very
high U and Th contents (thousands of parts per
million).
Recent studies, however, have highlighted com-
plexities in the behaviour of this mineral such as
inheritance (Copeland et al., 1988), secondary
replacement (De Wolf et al., 1993; Zhu et al., 1997;
Bingen and van Breemen, 1998) and Pb loss by
volume diffusion during a metamorphic event (Black
et al., 1984; Suzuki et al., 1994) or enhanced by
damage to the crystal lattice (Hawkins and Bowring,
1997). Implicit to this is the growing need for part
grain analyses, either by conventional method or by in
situ high-resolution ion microprobe.
Up to now, three techniques allow in situ analyses
of monazites for geochronological purposes. Sensitive
high-resolution ion microprobes (such as SHRIMP)
have been used to successfully determine U–Pb ages
(e.g. Williams et al., 1996), but this requires character-
isation of monazite standards, which should match the
Th content of the unknown samples (Zhu et al., 1998).
Moreover, these large geometry ion probes are not yet
widely available, which reduces their use as a world-
wide routine method.
Electron microprobe (EMPA) has also been shown
to be a valuable alternative to monazite dating (Mon-
tel et al., 1996; Cocherie et al., 1998). The main
advantage of this technique being the very high spatial
resolution of around 1 mm compared to the 20- to 30-
mm spots used by most ion microprobes. The preci-
sion, however, is limited to around 20 Ma, which
precludes identification of monazite-forming events
occurring in a limited time span.
There is a growing interest (e.g. Poitrasson et al.,
2000) for monazite dating by laser ablation induc-
tively coupled plasma mass spectrometry (LA-ICP-
MS) which revealed to be a very fast technique with a
spatial resolution comparable to secondary ion mass
spectrometry (SIMS). The high drilling rate (ca. 0.5–
1 mm/s) can, however, constitute a serious drawback
when analysing heterogeneous material.
In this paper, the capability of the more widely
available, small geometry Cameca IMS4f ion microp-
robe for rapid, in situ, isotopic analyses of selected
areas of monazite crystals has been investigated as an
alternative way to analyse complex metamorphic
populations. We present results from two well-dated
late Archaean and Proterozoic samples and from a
third unknown sample outcropping in the Hoggar
Mountains (Algeria). In addition, the results shed
some light on the behaviour of monazite, which has
implications for its use as a U–Pb geochronometer.
2. Analytical techniques
Separation of minerals was performed using stand-
ard techniques (Wifley table and heavy liquids). After
cleaning in dilute 0.5 N HNO3 and tridistilled water,
the monazite grains were subsequently mounted in
D. Bosch et al. / Chemical Geology 184 (2002) 151–165152

epoxy resin and polished to approximately half their
thickness to expose internal structures. The mounts
were then carefully washed with tridistilled water,
soap and alcohol and stored in a clean environment
before analysis. SIMS analyses were carried out on
the Cameca IMS4f ion microprobe with a spot size of
about 30 mm. To avoid sample charging by the 16O �
primary beam, the mounts were coated by ca. 100-
nm-thick gold film. Before its introduction within the
sample lock, the surface conductivity of the mount
was checked to be less than 20 V and it was then held
under vacuum overnight to ensure degassing. Before
each analysis, a 10-min rastering was conducted to
pass through the gold coat and to reach steady
sputtering conditions. The primary beam currents
ranged from 8 to 20 nA, the highest current being
used for the youngest sample. The primary beam was
accelerated onto the sample surface by a 12.65-keV
potential and stability was better than 0.6%. Positive
secondary ions were extracted using a 4.5-keV poten-
tial and the energy window was set at 50 eV to
remove low-energy ions and molecular species. The
beam passed then through a double focussing mass
spectrometer operated at a high mass resolution to
resolve molecular and isobaric interferences in the
204–208 mass range.
High-resolution mass spectrum of monazites
shows that the main interferences are mostly due to
REE-oxides. The most significant molecular interfer-
ences are related to PrPO2, GdPO and YbO2 which
occur near the 204Pb (see Fig. 1a). As the measured207Pb/206Pb ratios must be corrected from common
lead contribution by referring to the 206Pb/204Pb
measured ratios, good separation of the 204Pb peak
from these neighbouring interferences is essential.
Indeed, any unresolved interference on the small204Pb peak will be responsible for an overcorrection
of the 207Pb/206Pb ratio resulting in too young an age.
A mass resolving power of 3500 is necessary to
ensure integrity of the 204Pb as well as of the other
lead isotopes (Fig. 1a and b). Increasing the mass
resolution leads to a decrease of ions arriving to the
detector and, thus large contrast aperture (400 mm)
and field aperture (750 mm) were used during the
course of this study.
Ion beams were measured in the peak jumping
sequence with an electron multiplier operating in
pulse counting mode with a 65% yield and a 30-ns
integrated dead-time measured using Pb standards.
Under these operating conditions, the IMS4f ma-
chine achieves an overall instrumental Pb sensitivity
of 3–4 cps/ppm/nA of primary beam based on
analyses of monazites from sample W404 presented
in this study. This sensitivity is about five times low-
er than that achieved by large geometry ion probes
(e.g. Harrison et al., 1995; Williams et al., 1996) but
compares well with sensitivity of the Isolab machine
operated in the SIMS mode (e.g. De Wolf et al.,
1993).
Fig. 1. Typical mass scans of monazites obtained with the IMS4f ion
probe at a mass resolving power of 3500. (a) Molecular ions
interferences in the 204 mass range spectrum. The main inter-
ferences are from PrPO2 and to a lesser degree to GdPO and YbO2.
(b) Molecular ion interferences in the 208 mass range spectrum are
related to Sm species (SmSiO2, SmCaO, SmPSi).
D. Bosch et al. / Chemical Geology 184 (2002) 151–165 153

Data were collected in three blocks of 10 cycles
each and the total duration for one analysis was about
60 min. A background correction, monitored at
204.10 amu, as close as possible to the 204Pb peak,
was applied to the measured Pb peaks. Typical
analytical parameters for Pb analyses are listed in
Table 1. Common Pb corrections were based on the
measured 204Pb and for all the data, the assumed
common Pb composition was modelled as contempo-
raneous Pb (Stacey and Kramers, 1975). Corrected
isotopic ratios and ages were calculated after Ludwig
(1999). The quoted ages and related uncertainties
are based on weighted averages of the calculated207Pb/206Pb ages.
In the absence of U–Pb and Th–Pb analyses due
to unavailable suitable monazite standards, a review
of the possible effects that can bias the 207Pb/206Pb
ages is warranted. Indeed, although monazite gener-
ally shows a high degree of concordance, a great
number of studies have been faced to discordant
analyses, both normal and reverse. For example,
studies of the diffusion of Pb in monazite (i.e.
Suzuki et al., 1994; Smith and Giletti, 1997) indicate
that diffusive Pb loss may be experienced by the
crystals during a high-temperature metamorphic
event. Significant ancient diffusion-controlled Pb
loss would be responsible for younger ages, with
no geological meaning, whereas present-day Pb loss
will move the points towards the origin thus leaving
the 207Pb/206Pb ratio and age unaffected. In the
former case, 207Pb/206Pb ages should be considered
only as minimum values. Straddling by the ion beam
of growth zones with different ages may also result
in intermediate ages, but this can be avoided by
careful SEM imaging before analysis. Discordance
can also arise from recrystallisation which is accom-
panied by transport and migration of elements (Pidg-
eon, 1992). Although this generally results in a Pb-
free recrystallised lattice, residual radiogenic Pb can
potentially remain partially trapped in the newly
formed domain, thus leading to incomplete resetting
of the U–Pb systems and ages older than the true
age of recrystallisation. Finally, reverse discordance
has been also observed and is generally assumed to
derive from incorporation of intermediate daughter
products into the 238U/206Pb decay chain at the time
of crystal growth (Scharer, 1984). In old, Precam-
brian, monazites, unsupported thorogenic 206Pb
should be swamped by uranogenic 206Pb and thus
should not be responsible for reverse discordance.
Bingen and van Breemen (1998), however, showed
that this phenomenon could be invoked to account
for reverse discordance of monazites as old as
1 Ga. Hawkins and Bowring (1997) on the contrary
proposed that reverse discordance results from dis-
equilibrium of the U–Pb system due to postcrystal-
lisation local enrichment of Pb by diffusion. In any
case, the 207Pb/206Pb ratios do not yield reliable
ages.
The above discussion pertains to analyses falling
outside the main monazite population, for which a
discussion about the effects of potential discordance
on the interpretation of ages is warranted. It is clear
that only age grouping can be considered as reflecting
growth or recrystallisation events and that analyses
yielding intermediate ages should be treated with
caution as they possibly derived from complex mon-
azite grains.
3. Results and discussion
The reliability of the method has been assessed on
two Precambrian metamorphic monazite populations
previously dated by ID-TIMS (see Bosch et al., 1996;
Bruguier et al., 1999). The first sample is a late
Archaean pelitic schist from the Jimperding Metamor-
phic Belt located on the western margin of the Yilgarn
Craton (Western Australia), whereas the second sam-
ple is a paragneiss from the Proterozoic Northampton
Complex of the Pinjarra Orogen (Western Australia).
Results are reported in Table 2 and presented in
Figs. 2–4.
Table 1
Analytical parameters for Pb/Pb isotopic analyses of monazites
using the Cameca IMS4f ion probe
Mass
(amu)
Isotope Waiting time
for magnetic
settling (s)
Counting
time (s)
203.973 204Pb 3 20
204.100 background 2 20
205.974 206Pb 2 15
206.976 207Pb 2 30
207.977 208Pb 2 5
D. Bosch et al. / Chemical Geology 184 (2002) 151–165154

3.1. Pelitic schist W398
This sample consists mostly of muscovite (25%),
pinitised cordierite (25%), red biotite (20%), quartz
(17%), with minor sillimanite (8%), oligoclase (3%),
opaques (2%), and trace zircon and monazite. The
schist is medium grained with an average grain size
of about 0.5 mm, although biotite grains vary up
to 1.0 mm in length. The rock possesses a sinuous
subcontinuous foliation defined by biotite, muscovite
and sillimanite, which may have been crenulated.
Granoblastic areas defined by quartz and cordierite
occur between the biotite, sillimanite and muscovite
grains. Muscovite and biotite are intergrown, where-
as sillimanite is present as clusters and as inclusions
within biotite and muscovite. In places, biotite and
muscovite appear to overprint cordierite. Biotite + -
quartz and muscovite + quartz symplectites are also
present.
The sample underwent amphibolite facies regional
metamorphism with P–T conditions in the range of
650–700 �C and 2–5 kbars. It contains a population
of rounded, pale yellow monazite crystals interpreted
as metamorphic in origin. Five single crystals, pre-
viously analysed by ID-TIMS (Bosch et al., 1996), are
slightly discordant ( < 1%) with ages ranging from
2652 to 2665 Ma (Fig. 2a). The ca. 10-Ma range in
ages suggests that the schist contains a heterogeneous
monazite population and that growth or recrystallisa-
tion occurred during several events. A neighbouring
pelitic schist (W399), however, yields a homogeneous
population precisely dated by ID-TIMS at 2661F1
Ma. This ca. 2660-Ma age is interpreted as reflecting
the main monazite growth event during the prograde
stages of regional metamorphism at a temperature of
about 500 �C, similarly to cases reported for meta-
morphic monazites in pelitic schists (e.g. Smith and
Barreiro, 1990). Monazites dated at ca. 2665 Ma are
coeval with granitic intrusions (2660–2670 Ma),
whereas the younger age of 2652 Ma corresponds to
the peak of regional metamorphism in this area
(Bosch et al., 1996; Nemchin et al., 1994; Pidgeon
et al., 1996). Homogeneity of monazite ages in sample
W399 contrasts with the spread observed in sample
W398 that suggests the growth of monazite was
controlled by local conditions and that monazites
may have been armoured against Pb loss and recrys-
tallisation.
Thirty SIMS 207Pb/206Pb spot analyses were per-
formed on 15 grains. Intra-grain analyses generally
overlap each other except in two cases (see Table 2).
Analysis #4-2 gives a significantly older age (2671F6 Ma) than the two other spot analyses from the same
grain (2653F 8 and 2650F 8 Ma). The discrepancy
between these two ages is attributed to preservation of
the first monazite population (ca. 2665 Ma), which
underwent recrystallisation or resorption during the
subsequent main monazite growth event. One spot
analysis (#10-3) yields an anomalously young207Pb/206Pb corrected value of 2604F 6 Ma, whereas
the two other spots on this grain give ages of
2648F 12 and 2650F 8 Ma. This young age is not
reproduced in the present data set and is also younger
than any reported event in this part of theYilgarnCraton
and, in particular, than the apatite cooling age of
2636F 6 Ma from a nearby syenitic body (Pidgeon et
al., 1996). This suggests that ancient Pb loss during a
metamorphic event is unlikely. Moreover, the uncor-
rected 207Pb/206Pb ratio is close to the expected value
(see Table 2), but the 204Pb/206Pb ratio is among the
highest one, which suggests that this young age stems
from an overcorrection due to high count rate on the204Pb peak. This might be related to edge effects or to a
small unresolved molecular contribution possibly
related to a drift in the mass calibration, shifting the204Pb measurement towards the neighbouring PrPO2
peak. This analysiswas therefore discarded from the age
calculation. The 28 remaining analyses (Fig. 2b) have
ages ranging from 2636F 28 to 2686F 29Ma and give
a weighted mean of 0.18066F 0.00030 (2r) corre-
sponding to an ageof 2659F 3Ma (MSWD=2.2). This
mean age is well within the range of ID-TIMS values
(2652–2665Ma), and identical to the 2661-Ma age for
the main monazite growth event in this area of the
Jimperding Belt. A cumulative probability treatment
of the data (Ludwig, 1999) tends to suggest a bimodal
distribution with mean values around 2655 and 2665
Ma. One spot age excluded (#4-2), SIMS analyses,
however, did not detect unequivocally the different
monazite populations identified by ID-TIMS and the
analysed crystals would thus appear to have formed
during a single growth event. The short time span
between the three growth episodes (ca. 15 Ma) and the
relatively low precision of the SIMS analyses (from 4 to
32Maat the2r level)make theagedifferencedifficult to
resolve.
D. Bosch et al. / Chemical Geology 184 (2002) 151–165 155
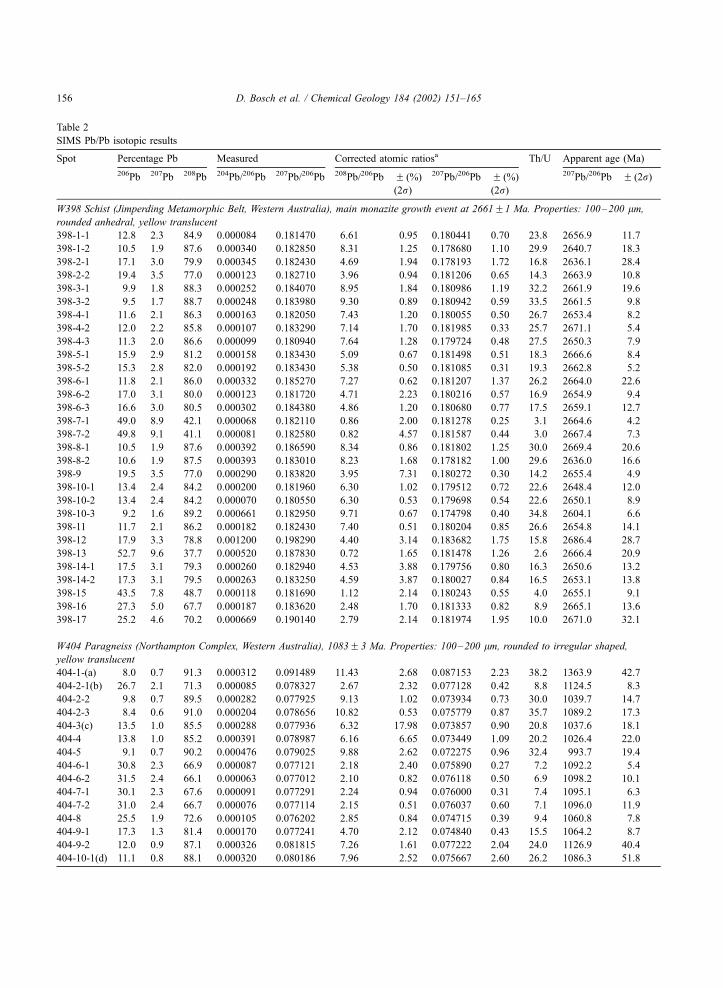
Table 2
SIMS Pb/Pb isotopic results
Spot Percentage Pb Measured Corrected atomic ratiosa Th/U Apparent age (Ma)
206Pb 207Pb 208Pb 204Pb/206Pb 207Pb/206Pb 208Pb/206Pb F (%)
(2r)
207Pb/206Pb F (%)
(2r)
207Pb/206Pb F (2r)
W398 Schist (Jimperding Metamorphic Belt, Western Australia), main monazite growth event at 2661F1 Ma. Properties: 100–200 lm,rounded anhedral, yellow translucent
398-1-1 12.8 2.3 84.9 0.000084 0.181470 6.61 0.95 0.180441 0.70 23.8 2656.9 11.7
398-1-2 10.5 1.9 87.6 0.000340 0.182850 8.31 1.25 0.178680 1.10 29.9 2640.7 18.3
398-2-1 17.1 3.0 79.9 0.000345 0.182430 4.69 1.94 0.178193 1.72 16.8 2636.1 28.4
398-2-2 19.4 3.5 77.0 0.000123 0.182710 3.96 0.94 0.181206 0.65 14.3 2663.9 10.8
398-3-1 9.9 1.8 88.3 0.000252 0.184070 8.95 1.84 0.180986 1.19 32.2 2661.9 19.6
398-3-2 9.5 1.7 88.7 0.000248 0.183980 9.30 0.89 0.180942 0.59 33.5 2661.5 9.8
398-4-1 11.6 2.1 86.3 0.000163 0.182050 7.43 1.20 0.180055 0.50 26.7 2653.4 8.2
398-4-2 12.0 2.2 85.8 0.000107 0.183290 7.14 1.70 0.181985 0.33 25.7 2671.1 5.4
398-4-3 11.3 2.0 86.6 0.000099 0.180940 7.64 1.28 0.179724 0.48 27.5 2650.3 7.9
398-5-1 15.9 2.9 81.2 0.000158 0.183430 5.09 0.67 0.181498 0.51 18.3 2666.6 8.4
398-5-2 15.3 2.8 82.0 0.000192 0.183430 5.38 0.50 0.181085 0.31 19.3 2662.8 5.2
398-6-1 11.8 2.1 86.0 0.000332 0.185270 7.27 0.62 0.181207 1.37 26.2 2664.0 22.6
398-6-2 17.0 3.1 80.0 0.000123 0.181720 4.71 2.23 0.180216 0.57 16.9 2654.9 9.4
398-6-3 16.6 3.0 80.5 0.000302 0.184380 4.86 1.20 0.180680 0.77 17.5 2659.1 12.7
398-7-1 49.0 8.9 42.1 0.000068 0.182110 0.86 2.00 0.181278 0.25 3.1 2664.6 4.2
398-7-2 49.8 9.1 41.1 0.000081 0.182580 0.82 4.57 0.181587 0.44 3.0 2667.4 7.3
398-8-1 10.5 1.9 87.6 0.000392 0.186590 8.34 0.86 0.181802 1.25 30.0 2669.4 20.6
398-8-2 10.6 1.9 87.5 0.000393 0.183010 8.23 1.68 0.178182 1.00 29.6 2636.0 16.6
398-9 19.5 3.5 77.0 0.000290 0.183820 3.95 7.31 0.180272 0.30 14.2 2655.4 4.9
398-10-1 13.4 2.4 84.2 0.000200 0.181960 6.30 1.02 0.179512 0.72 22.6 2648.4 12.0
398-10-2 13.4 2.4 84.2 0.000070 0.180550 6.30 0.53 0.179698 0.54 22.6 2650.1 8.9
398-10-3 9.2 1.6 89.2 0.000661 0.182950 9.71 0.67 0.174798 0.40 34.8 2604.1 6.6
398-11 11.7 2.1 86.2 0.000182 0.182430 7.40 0.51 0.180204 0.85 26.6 2654.8 14.1
398-12 17.9 3.3 78.8 0.001200 0.198290 4.40 3.14 0.183682 1.75 15.8 2686.4 28.7
398-13 52.7 9.6 37.7 0.000520 0.187830 0.72 1.65 0.181478 1.26 2.6 2666.4 20.9
398-14-1 17.5 3.1 79.3 0.000260 0.182940 4.53 3.88 0.179756 0.80 16.3 2650.6 13.2
398-14-2 17.3 3.1 79.5 0.000263 0.183250 4.59 3.87 0.180027 0.84 16.5 2653.1 13.8
398-15 43.5 7.8 48.7 0.000118 0.181690 1.12 2.14 0.180243 0.55 4.0 2655.1 9.1
398-16 27.3 5.0 67.7 0.000187 0.183620 2.48 1.70 0.181333 0.82 8.9 2665.1 13.6
398-17 25.2 4.6 70.2 0.000669 0.190140 2.79 2.14 0.181974 1.95 10.0 2671.0 32.1
W404 Paragneiss (Northampton Complex, Western Australia), 1083F 3 Ma. Properties: 100–200 lm, rounded to irregular shaped,
yellow translucent
404-1-(a) 8.0 0.7 91.3 0.000312 0.091489 11.43 2.68 0.087153 2.23 38.2 1363.9 42.7
404-2-1(b) 26.7 2.1 71.3 0.000085 0.078327 2.67 2.32 0.077128 0.42 8.8 1124.5 8.3
404-2-2 9.8 0.7 89.5 0.000282 0.077925 9.13 1.02 0.073934 0.73 30.0 1039.7 14.7
404-2-3 8.4 0.6 91.0 0.000204 0.078656 10.82 0.53 0.075779 0.87 35.7 1089.2 17.3
404-3(c) 13.5 1.0 85.5 0.000288 0.077936 6.32 17.98 0.073857 0.90 20.8 1037.6 18.1
404-4 13.8 1.0 85.2 0.000391 0.078987 6.16 6.65 0.073449 1.09 20.2 1026.4 22.0
404-5 9.1 0.7 90.2 0.000476 0.079025 9.88 2.62 0.072275 0.96 32.4 993.7 19.4
404-6-1 30.8 2.3 66.9 0.000087 0.077121 2.18 2.40 0.075890 0.27 7.2 1092.2 5.4
404-6-2 31.5 2.4 66.1 0.000063 0.077012 2.10 0.82 0.076118 0.50 6.9 1098.2 10.1
404-7-1 30.1 2.3 67.6 0.000091 0.077291 2.24 0.94 0.076000 0.31 7.4 1095.1 6.3
404-7-2 31.0 2.4 66.7 0.000076 0.077114 2.15 0.51 0.076037 0.60 7.1 1096.0 11.9
404-8 25.5 1.9 72.6 0.000105 0.076202 2.85 0.84 0.074715 0.39 9.4 1060.8 7.8
404-9-1 17.3 1.3 81.4 0.000170 0.077241 4.70 2.12 0.074840 0.43 15.5 1064.2 8.7
404-9-2 12.0 0.9 87.1 0.000326 0.081815 7.26 1.61 0.077222 2.04 24.0 1126.9 40.4
404-10-1(d) 11.1 0.8 88.1 0.000320 0.080186 7.96 2.52 0.075667 2.60 26.2 1086.3 51.8
D. Bosch et al. / Chemical Geology 184 (2002) 151–165156

3.2. Paragneiss W404
This sample is a quartzofeldspathic gneiss yielding
a granoblastic texture, although where there is a high
proportion of phlogopite, one, and in some cases two,
foliations can be recognised. Both foliations are
defined by sparsely distributed phlogopite and ilmen-
ite, and phlogopite pressure shadows around garnets.
The gneiss is composed of quartz (25–40%), micro-
perthitic microcline (25–35%), andesine (10–20%),
phlogopite (5–15%) and garnet (5–15%), with minor
ilmenite ( < 5%) and graphite ( < 5%), and trace mus-
covite, zircon, monazite and rutile. The sample expe-
rienced granulite facies metamorphism with peak
temperatures and pressures of 850F 50 �C and 5–6
kbars.
Table 2 (continued )
Spot Percentage Pb Measured Corrected atomic ratiosa Th/U Apparent age (Ma)
206Pb 207Pb 208Pb 204Pb/206Pb 207Pb/206Pb 208Pb/206Pb F (%)
(2r)
207Pb/206Pb F (%)
(2r)
207Pb/206Pb F (2r)
W404 Paragneiss (Northampton Complex, Western Australia), 1083F 3 Ma. Properties: 100–200 lm, rounded to irregular shaped,
yellow translucent
404-10-2 8.9 0.7 90.4 0.000146 0.079072 10.13 2.23 0.077018 1.60 33.4 1121.7 31.8
404-11 10.4 0.8 88.8 0.000265 0.079178 8.52 1.49 0.075435 0.86 28.1 1080.1 17.2
404-12-1(e) 17.8 1.3 80.9 0.000167 0.077989 4.55 2.25 0.075623 0.52 15.0 1085.1 10.4
404-12-2 16.8 1.3 81.9 0.000115 0.076989 4.87 3.01 0.075359 1.29 16.0 1078.1 25.8
404-13 15.0 1.1 83.9 0.000208 0.078927 5.60 2.20 0.075989 0.68 18.5 1094.8 13.6
404-14 21.7 1.6 76.7 0.000271 0.079418 3.53 1.53 0.075594 1.02 11.6 1084.3 20.5
404-15 35.2 2.7 62.2 0.000077 0.076868 1.77 2.55 0.075785 0.44 5.8 1089.4 8.7
404-16 10.5 0.8 88.7 0.000179 0.078066 8.42 0.64 0.075536 0.90 27.7 1082.8 18.0
404-17-1(f) 28.9 2.2 68.9 0.000069 0.077211 2.38 0.69 0.076235 0.75 7.9 1101.3 14.9
404-17-2 12.9 1.0 86.2 0.000185 0.077866 6.71 4.78 0.075245 0.97 22.1 1075.1 19.3
404-17-3 14.8 1.1 84.1 0.000063 0.076959 5.70 5.71 0.076073 1.33 18.8 1097.0 26.6
404-18 20.7 1.6 77.7 0.000146 0.078235 3.75 1.75 0.076173 0.71 12.4 1099.6 14.1
404-19 14.7 1.1 84.2 0.000247 0.078574 5.74 2.19 0.075077 1.39 18.9 1070.6 27.8
404-20 28.4 2.1 69.5 0.000084 0.076761 2.45 5.92 0.075576 0.42 8.1 1083.9 8.4
C106 Gneiss (Hoggar). Properties: 80–125 lm, rounded anhedral, colourless to yellow translucent
C106-1 23.2 1.4 75.4 0.000328 0.063840 3.25 1.86 0.059115 2.36 10.41 571.4 50.9
C106-2 24.0 1.4 74.6 0.000400 0.065676 3.11 3.90 0.059914 2.55 9.97 600.5 54.7
C106-3 26.9 1.6 71.6 0.000340 0.061724 2.66 1.90 0.058070 1.38 8.51 532.4 30.1
C106-4 28.8 1.7 69.5 0.000182 0.058962 2.42 5.14 0.058953 2.86 7.74 565.4 61.7
C106-5 24.1 1.5 74.5 0.000122 0.062905 3.09 10.50 0.060930 1.14 9.94 636.8 24.4
C106-6 27.1 1.6 71.3 0.000295 0.062388 2.63 0.93 0.059052 2.16 8.43 569.0 46.7
C106-7 25.0 1.5 73.5 0.000145 0.062527 2.94 1.55 0.060442 0.89 9.45 619.4 19.1
C106-8 23.8 1.4 74.8 0.000569 0.068650 3.14 0.71 0.060352 1.28 10.09 616.2 27.5
C106-9 22.9 1.4 75.7 0.000175 0.063015 3.31 1.98 0.060497 2.42 10.64 621.4 51.8
C106-10 27.2 1.7 71.1 0.000403 0.062005 2.61 1.01 0.061513 2.64 8.40 657.2 56.1
C106-11 39.1 2.3 58.5 0.000409 0.065362 1.50 0.58 0.059463 1.16 4.80 584.1 25.0
C106-12 39.1 2.4 58.6 0.000298 0.066007 1.50 0.58 0.060312 1.14 4.82 614.8 24.5
C106-13 41.7 2.5 55.8 0.001124 0.077400 1.34 2.46 0.059977 3.52 4.29 602.8 75.3
C106-14-1 23.2 1.4 75.5 0.000159 0.064257 3.26 1.88 0.059412 1.08 10.45 582.2 23.4
C106-14-2 25.4 1.5 73.1 0.000280 0.063127 2.88 2.65 0.059086 2.85 9.22 570.3 61.4
C106-15 28.3 1.7 70.1 0.000460 0.065102 2.48 3.10 0.058455 4.49 7.92 546.9 96.6
C106-16-1 24.3 1.5 74.2 0.000572 0.067958 3.05 4.40 0.059714 1.11 9.79 593.2 24.1
C106-16-2 24.8 1.5 73.7 0.000593 0.068230 2.97 4.63 0.059687 1.11 9.54 592.3 24.0
C106-17 23.0 1.4 75.6 0.000431 0.066112 3.29 0.77 0.059895 1.33 10.56 599.8 28.7
Th/U ratios were calculated from the radiogenic 208Pb/206Pb assuming concordance between the U–Pb and Th–Pb systems.
Each analysis was labelled as follows: sample name-grain analyzed-spot number.
Letters (from a to f) into brackets refer to SEM images of Fig. 4.a Lead isotopic ratios have been corrected for background and common lead.
D. Bosch et al. / Chemical Geology 184 (2002) 151–165 157

Five single grains previously analysed by ID-TIMS
(Bruguier et al., 1999) provided an age of 1080F 5Ma
(Fig. 3a). Discordant analyses were interpreted as
reflecting disturbances of the original monazite and,
on thegroundofoneconcordant analysis, amoreprecise
age of 1083F 3Ma was proposed for the metamorphic
growth of these minerals. This age is identical to the
zircon age of a mafic granulite (1079F 3 Ma) inter-
preted as dating granulite facies metamorphism.
Twenty-nine SIMS analyses were performed on 20
grains (Fig. 3b). The age spectrum is complex and
analyses conducted at different places of monazite
grains do not overlap completely at the 2r level. The
oldest age (1364F 42 Ma) is from grain #1 which
appears to contain a partly recrystallised central
rounded core (Fig. 4a) about 200 Ma older than the
main metamorphic population. This value falls in the
age spectrum (1150–1450 Ma) given by a group of
detrital zircons from this paragneiss (Bruguier et al.,
1999) and this, along with the rounded shape of the
core, suggests a detrital origin for the original crystal.
Preservation of this old age clearly implies that the
U–Th–Pb systems of the original monazite crystal
has not been reset and survived high-grade granulitic
conditions with peak temperatures and pressures in
the range 800–900 �C and 5–6 kbars. These con-
ditions are well above the nominal closure temper-
ature proposed by Copeland et al. (1988) and is
another example of the robustness of the U–Th–Pb
system in monazite (De Wolf et al., 1993; Bingen and
van Breemen, 1998).
SEM imaging of some monazite crystals show
evidence for recrystallisation/resorption along irregu-
Fig. 2. Isotopic results for monazites from the W398 pelitic schist
(Jimperding Metamorphic belt, Western Australia). (a) Concordia
diagram for ID-TIMS analyses. U–Pb analyses from metamorphic
monazites extracted from W399 schist are also shown. Black boxes:
W399; shaded boxes: W398. Boxes are 2r errors. (b) SIMS207Pb/206Pb diagram. Error bars are 2r.
Fig. 3. Isotopic results for monazites from the W404 paragneiss
(Northampton Metamorphic Complex, Western Australia). (a)
Concordia diagram for ID-TIMS analyses. Boxes are 2r errors.
(b) SIMS 207Pb/206Pb diagram. Error bars are 2r.
D. Bosch et al. / Chemical Geology 184 (2002) 151–165158
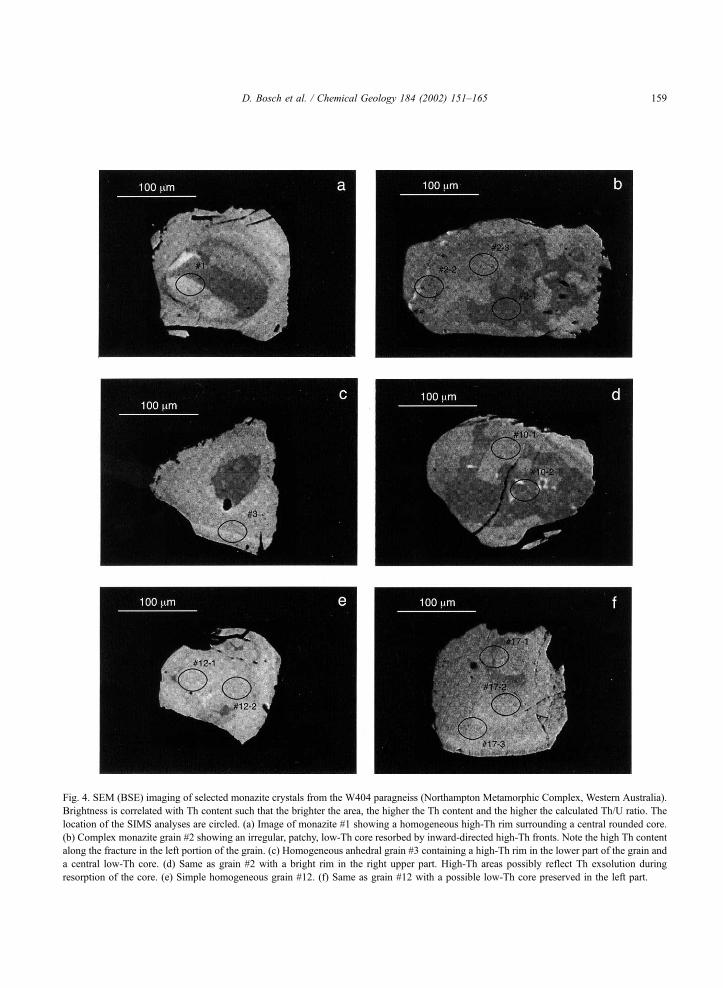
Fig. 4. SEM (BSE) imaging of selected monazite crystals from the W404 paragneiss (Northampton Metamorphic Complex, Western Australia).
Brightness is correlated with Th content such that the brighter the area, the higher the Th content and the higher the calculated Th/U ratio. The
location of the SIMS analyses are circled. (a) Image of monazite #1 showing a homogeneous high-Th rim surrounding a central rounded core.
(b) Complex monazite grain #2 showing an irregular, patchy, low-Th core resorbed by inward-directed high-Th fronts. Note the high Th content
along the fracture in the left portion of the grain. (c) Homogeneous anhedral grain #3 containing a high-Th rim in the lower part of the grain and
a central low-Th core. (d) Same as grain #2 with a bright rim in the right upper part. High-Th areas possibly reflect Th exsolution during
resorption of the core. (e) Simple homogeneous grain #12. (f) Same as grain #12 with a possible low-Th core preserved in the left part.
D. Bosch et al. / Chemical Geology 184 (2002) 151–165 159

lar intra-grains discontinuities which look like inward-
directed reaction fronts (see Fig. 4b and d). These
processes resulted in a patchy replacement of a low-
Th core by a bright, high-Th, material and is some-
times accompanied by Th exsolution in the core (see
the bright dots in Fig. 4d), possibly occurring in the
first stages, and before completion, of this secondary
replacement. This suggests redistribution of the ele-
ments at least on a local (subgrain) scale. Preservation
of chemically distinct zones, however, implies that Th
did not homogenise completely within the grain. One
spot analysis conducted on the low-Th core of grain
#2 gave an age of 1125F 8 Ma, which although
younger than the core analysis of grain #1, is still
significantly older than the main monazite growth
event. Since losses of elements from the crystal lattice
may have accompanied the replacement processes,
this intermediate age may reflect partial lead losses
from an old core. Thus, it cannot be ruled out that
measurement was not influenced by a component of
inherited Pb from a ca. 1360-Ma-old core that has
biased the age to be too old. This age, however, is
reproduced by analyses #9-2 (1127F 40 Ma) and
#10-2 (1122F 32 Ma), the latter being associated
with an internal structure consistent with analysis
#2-1. It is unlikely that each analysed domain from
three different grains had lost the same amount of Pb
to produce identical 207Pb/206Pb ratios and ages.
Moreover, the lack of analyses yielding ages inter-
mediates between 1360 and ca. 1125 Ma, suggests
that 1125 Ma may constitute a true age grouping and
is thus unlikely to derive from crystal zones having
suffered lead losses during partial secondary replace-
ment. An alternative interpretation is to consider that
they reflect an early growth event during the prograde
stage of metamorphism. This hypothesis again implies
that radiogenic lead in monazite can be preserved at
temperatures above 800 �C and that this mineral can
thus potentially be used to calculate burial and heating
rates to provide key information on the tectonothermal
evolution of ancient orogen even for rocks subjected
to high-grade metamorphic conditions. The large
grain size of the analysed monazites (100–250 mm)
may be responsible for Pb retention under these high-
temperature conditions as suggested by experimental
modelling by Smith and Giletti (1997). The sharp age
discontinuities and complex internal structures, how-
ever, suggest that recrystallisation and the associated
element migration was a more efficient way for
resetting of the U–Pb isotope system of pre-existent
monazite than volume diffusion of Pb, although
admittedly without information on how potentially
discordant the data are, this cannot be warranted.
Most analyses (21 out of 29) yield ages ranging from
1061F 8 to 1101F15 Ma and can be combined to
give a weighted mean 207Pb/206Pb ratio of
0.07566F 0.00021 (MSWD=5.2) corresponding to
an age of 1086F 6 Ma (2r). This age is slightly older,
but similar to the 1083F 3 Ma ID-TIMS reference
value and reflects the main monazite growth event
close to the peak of granulite facies metamorphism.
Younger ages are also present in the monazite age
spectrum. These include ages in the range 1026–1040
Ma (#2-2, #3, #4) and one analysis at 994F 19 Ma
(#5). Grain #2, with three distinct ages of ca. 1125,
1040 and 1090 Ma, again illustrates the subgrain
complexity of this composite population. Ages in
the range 1020–1040 Ma are difficult to relate to
any known geological activity in the complex,
although Rb–Sr ages of 1020 and 1037 Ma have
been reported for granulites by Compston and Arriens
(1968) and Richards et al. (1985). These ages were
first interpreted as dating granulite facies metamor-
phism, but given the susceptibility of the Rb–Sr
system to fluid intervention, they can as well be
related to pegmatitic activity in the complex. An
alternative interpretation is that the in situ 207Pb/206Pb
ages of 1020–1040 Ma reflect discordance associated
with lead losses (Black et al., 1984; Suzuki et al.,
1994), or that the beam straddled zones of different
ages. This interpretation is supported by SEM images
of analysis #2-2 where the beam appears to have
struck a crack underlined by bright, high-Th, dots
and analysis of grain #3 that clearly straddled a high-
Th domain. We thus favour the interpretation that ages
in the range 1020–1040 Ma reflect discordance and
have no geological significance. However, they sug-
gest a younger disturbance event. The youngest age
from grain #5 (994F 19 Ma) is identical to the zircon
age from an undeformed pegmatitic dyke of 989F 2
Ma (Bruguier et al., 1999) and could be related to
pegmatite intrusion and fluid infiltration in the quartz-
ofeldspathic gneissic sequence. Deformation in the
complex ceased by this time (ca. 990 Ma) but ana-
tectic conditions and related fluid flows were still
active at least on a local scale. We speculate that these
D. Bosch et al. / Chemical Geology 184 (2002) 151–165160

conditions were sufficient to trigger partial recrystal-
lisation or Pb loss by diffusion in some monazite
grains during fluid–mineral interaction in the waning
stages of regional metamorphism and reflect the
susceptibility of monazite to fluid flows even in the
late stage of metamorphism. Such conclusion is sup-
ported by U–Pb dating of metapelites that indicates
growth of metamorphic monazites associated with
pegmatite intrusion (Lanzirotti and Hanson, 1995).
The scarcity of these young ages also indicates that
monazites from one single rock can respond differ-
ently under similar conditions, possibly because of
relatively mild conditions and/or shielding by host
minerals.
3.3. Metapelitic gneiss C106 (Egatalis/In Tassak area,
NW Hoggar)
The studied sample comes from the Egatalis/In
Tassak area of Northwestern Hoggar and was col-
lected as part of a comprehensive study to determine
the magmatic and metamorphic Precambrian evolu-
tion of this part of the Pan-African belt of the Tuareg
Shield. The western branch of the Pan-African belt in
NW Hoggar (Algeria) comprises fresh granulite facies
rocks in the Egatalis area considered as the deepest
crustal level exposed south of the Tassendjanet terrane
(Caby, 1970, 1987; Black et al., 1994). In this belt,
late low-pressure high-temperature metamorphic con-
ditions are progressively evidenced westward by the
overprint of kyanite-bearing mineral assemblages by
andalusite. The passage towards the sillimanite zone is
observed in schists and aluminous quartzites of Late
Paleoproterozoic age (Caby and Andreopoulos-
Renaud, 1983) beneath the syn-kinematic Tin Edehou
granodiorite–tonalite composite pluton that has the
geometry of a gently E-dipping, 2- to 4-km-thick
sheet.
The C106 sample is a coarse-grained pelitic meta-
texite collected at a few metres from the root of a
gabbronoritic body. It contains the very fresh mineral
assemblage quartz, garnet (alm 73-83, pyr 17-10, gro
02, spe 8-5 from core to rim), brown biotite, cordier-
ite, plagioclase (An 24%), perthitic K-feldspar, Fe
spinel (1% ZnO), ilmenite and graphite as major
phases. The leucosomes contain both antiperthitic
plagioclase and perthitic K-feldspar, and fresh cordier-
ite containing numerous inclusions of sillimanite and
green spinel, relict corundum being present in an
adjacent sample. Garnet–biotite thermometry (Ferry
and Spear, 1978) gives for this sample, temperatures
of 800–820 �C for garnet core/primary biotite inclu-
sion pairs, and of only 540–560 �C for garnet rim/
biotite (for P fixed at 4 kbars). The garnet–cordierite
pair gives consistent temperatures of 740 �C for the
same pressure. Amphibole–plagioclase geothermom-
etry (Blundy and Holland, 1990) from the adjacent
amphibolitised gabbro–norite gives rather high tem-
perature of equilibration ranging from 880 to 970 �C.The analysed monazite grains appear as metamor-
phic blasts included in cordierite. Nineteen SIMS
analyses were conducted on 17 monazite crystals
(Fig. 5). Analyses yielded a spectrum of 207Pb/206Pb
ages from 532 to 657 Ma. Of the 19 analyses, the
youngest was considered as an outlier and rejected
from calculation. The remaining 18 analyses can be
combined to provide a weighted mean 207Pb/206Pb
ratio of 0.05998F 0.00030 (MSWD = 1.8) corre-
sponding to an age of 603F 11 Ma. The low MSWD
value suggests that the sample contains a single
monazite population, although, on this basis alone, it
cannot be ruled out that heterogeneous grains with
composite age pattern are present as indicated by
scattering of the 207Pb/206Pb ages. In this age range,
the time resolution of the SIMS technique does not
allow distinguishing possible second-order events,
which are not separated by about 20 Ma. However,
these results indicate that monazite, as young as late
Fig. 5. SIMS 207Pb/206Pb diagram for monazites from the C106
metapelitic gneiss (Egatalis zone, Hoggar). Error bars are 2r.
D. Bosch et al. / Chemical Geology 184 (2002) 151–165 161

Proterozoic in age, can be successfully investigated
with the Cameca IMS4f ion probe.
The Hoggar mountains represent the northernmost
exposure of the Trans-Saharan Pan-African belt which
formed by aggregation and suturing of continental
fragments along the eastern margin of the West
African craton. Further south in Northern Mali,
UHP metamorphism has been dated at ca. 620 Ma
(Jahn et al., in press), whereas granulite facies meta-
morphism in the Dahomeyide belt of Western Africa
and amphibolite facies metamorphism in the mobile
belt of Nigeria have been dated at 610–620 Ma
(Bruguier et al., 1994; Attoh, 1998; Affaton et al.,
2000). The 620- to 610-Ma age range thus appears to
correspond to an active period of high-grade meta-
morphism along the eastern margin of the West
African craton with subduction of continental litho-
sphere, collision and suturing of continental fragments
resulting in the formation of the Gondwana super-
continent at the end of the Proterozoic. The temporal
relationship between the 603F 11 Ma monazite age
and regional metamorphism in Northwestern Hoggar
is unclear. Although slightly younger, this age over-
laps the period of high-grade metamorphism along the
western margin of the West African Craton and may
be related to the climax of regional metamorphism,
which peaked at 800–900 �C in this part of the
Hoggar Mountains. This age is also consistent with
the migmatisation age of 609F 17 Ma of the Aleksod
eclogites further west (Barbey et al., 1989). However,
at In Tassak, the progressive passage from two-mica
schists to kinzigites and metatexites only occurs over
a distance of 150–300 m. This rather sharp thermal
paleogradient is related to the synmetamorphic
emplacement of a 300- to 500-m-thick sheet of
gabbronoritic composition (Caby, 1987). This sug-
gests that monazites record a later event that accom-
panied emplacement of the gabbronoritic body.
In the southern part of Central Hoggar (Laouni
Terrane), troctolites, olivine-bearing gabbros and nor-
ites (Cottin et al., 1998) have been emplaced at the
end of regional metamorphism within syn-kinematic
Pan-African granitoids dated at 630–600 Ma by
Bertrand et al. (1986). In this area, field relationships
have been used to bracket emplacement age of the
mafic–ultramafic intrusions between 600 and 520
Ma, the latter corresponding to the age of the N–S
elongated late orogenic Taourirt granites (Paquette et
al., 1998). In the Tassendjanet terrane of Western
Hoggar, the Tin-Zebane dyke swarm, which includes
dykes and stocks of gabbros, has been dated at
592F 8 Ma (Hadj-Kaddour et al., 1998). All these
mafic–ultramafic rocks were emplaced during asthe-
nospheric upwelling related to a rapid lithospheric
thinning which affected most of the Hoggar (Cottin et
al., 1998; Hadj-Kaddour et al., 1998). The 603F 11
Ma monazite age is consistent with the 592F 8 Ma
Rb–Sr age of the Tin-Zebane dyke swarm, and the
closeness of the C106 metapelite sample with a
gabbro–norite massif suggests that monazite may date
some point in the retrograde path of the regional
metamorphism following metamorphic peak that
was, in the present case, closely related to crystallisa-
tion of the gabbronoritic magma at ca. � 10–12 km
depth. Taking into account the 620-Ma U–Pb zircon
age of the syn-kinematic diorite–granodiorite associ-
ation typical of the same belt farther south in Mali
(Caby and Andreopoulos-Renaud, 1989), this age is
representative of the late pulse of Pan-African tecto-
nometamorphic evolution in the western part of the
Tuareg shield.
4. Conclusions
The Cameca IMS4f ion microprobe has been
successfully used to determine in situ 207Pb/206Pb
ages on monazite crystals from Archaean to Late
Proterozoic ages. Molecular interferences can be sep-
arated with a mass resolving power of ca. 3500 and an
energy filtering of 50 eV. Large field and contrast
apertures have been used to increase the number of
ions arriving at the detector resulting in an overall
instrumental sensitivity of 3–4 cps/ppm of Pb/nA of
primary beam. Measurements can be routinely
achieved with a spatial resolution of ca. 30 mm. As
a single measurement requires only 60 min of data
acquisition, a comprehensive study of a monazite
population can be performed in a few days even for
heterogeneous monazite populations such as those
often present in metamorphic rocks.
Two sets of Proterozoic and Archaean monazites,
analysed earlier by ID-TIMS technique, yielded
nearly identical SIMS and TIMS ages for the main
monazite growth events. SIMS analyses provided207Pb/206Pb weighted mean ages with uncertainties
D. Bosch et al. / Chemical Geology 184 (2002) 151–165162

ranging from 3 Ma (2r) for Archaean monazites to 6
Ma (2r) for Grenvillian population and to 11 Ma (2r)for Pan-African monazite grains. In addition, SIMS
analyses make it possible to analyse separately dis-
tinct age domains present within one single grain.
Although second-order events that are not separated
by ca. 20 Ma cannot be resolved successfully, the age
spectrum given by SIMS analyses shows a greater
complexity and the technique makes it possible to
unravel complex age patterns presented by composite
monazite populations. The technique is thus capable
of dating discrete events that are not represented by
new growth or complete recrystallisation of pre-exist-
ing grains. In situ analyses of 207Pb/206Pb ratios in
such monazite populations can therefore provide a
wealth of information on the timing of metamorphic
events and have implications for U–Pb systematic in
monazite. In the examples presented above, monazite
crystals show complex internal structures, comparable
to those commonly observed for zircons (e.g. Hanchar
and Miller, 1993). As for zircon, new growth and
recrystallisation appear to be a very efficient phenom-
enon in monazite and substantiate the usefulness of in
situ analyses. In metamorphic environments, monazite
growth can occur at several periods during the whole
metamorphic history, from the prograde stages to the
retrograde part of the metamorphic path. In amphib-
olite facies metapelites, monazite grows during the
prograde stage and, due to the robustness of the U–
Th–Pb systems, generally preserves information on
this part of the P–T– t path. In such environments and
providing textural relationship can be established,
monazite can be used to estimate burial and heating
rates. In granulite facies rocks, recrystallisation of
crystals inherited from source regions or grown during
the prograde stages of metamorphism is almost com-
plete, but preservation of radiogenic lead in monazite
domains substantiates robustness of the U–Pb system
in this mineral which was not completely reset by
peak temperature of 800–900 �C. In situ analysis of
such domains constitutes a window to look back into
parts of the metamorphic history, which are generally
inaccessible due to blotting out of primary assemb-
lages. Monazite populations can even show a greater
complexity due to possible new growth, recrystallisa-
tion or partial Pb loss during the retrograde part of
metamorphism, which is often dominated by an
important magmatic activity. In the case of the North-
ampton Complex, pegmatite intrusion during the
waning stage of metamorphism was possibly respon-
sible for discrete disturbances or even partial recrys-
tallisation in pre-existing minerals. In the close
vicinity of magmatic bodies, as documented by the
Hoggar sample C106, resetting of the U–Pb isotope
system can reach completion, possibly due to fluid
flows and high-temperature gradients.
The polycyclic growth and complexity of monazite
has opposite consequences, as it can constitute a
serious drawback to the use of this mineral in U–Pb
geochronology or, on the contrary, provide a wealth of
information that can open up new perspectives in our
understanding of metamorphic processes, providing
tools can be developed to unravel such within-grain
complexity.
Acknowledgements
We thank J. Kieffer and E. Lebeau from the
‘‘Service Commun National du SIMS de l’Universite
de Montpellier II’’ for their help when running the
samples. Helpful and constructive reviews by Antonio
Lanzirotti, Alexander Nemchin, and Roberta Rudnick
are greatly appreciated. RR
References
Affaton, P., Kroner, A., Seddoh, K.F., 2000. Pan-African granulite
formation in the Kabye massif of northern Togo (West Africa):
Pb–Pb zircon ages. Int. J. Earth Sci. 88, 778–790.
Attoh, K., 1998. High-pressure granulite facies metamorphism in
the Pan-African Dahomeyide orogen, West Africa. J. Geol. 106,
236–246.
Barbey, P., Bertrand, J.M., Angoua, S., Dautel, D., 1989. Petrology
and U–Pb geochronology of the Telohat migmatites, Aleksod,
central Hoggar, Algeria. Contrib. Mineral. Petrol. 10, 207–219.
Bertrand, J.M., Michard, A., Boullier, A.M., Dautel, D., 1986.
Structure and U/Pb geochronology of Central Hoggar (Algeria):
a reappraisal of its Pan-African evolution. Tectonic 5, 955–972.
Bingen, B., van Breemen, O., 1998. U–Pb monazite ages in am-
phibolite- to granulite-facies orthogneiss reflect hydrous mineral
breakdown reactions: Sveconorwegian Province of SW Norway.
Contrib. Mineral. Petrol. 132, 336–353.
Black, L.P., Fitzgerald, J.D., Harley, S.L., 1984. Pb isotopic com-
position, colour and microstructure of monazites from a poly-
metamorphic rock in Antarctica. Contrib. Mineral. Petrol. 85,
141–148.
Black, R., Latouche, L., Liegeois, J.P., Caby, R., Bertrand, J.M.,
D. Bosch et al. / Chemical Geology 184 (2002) 151–165 163

1994. Pan-African displaced terranes in the Tuareg shield (cen-
tral Sahara). Geology 22, 641–644.
Blundy, J.D., Holland, T.J.B., 1990. Calcic amphibole equilibria and
a new amphibole–plagioclase geothermometer. Contrib. Miner-
al. Petrol. 104, 208–224.
Bosch, D., Bruguier, O., Pidgeon, R.T., 1996. Evolution of an Ar-
chean metamorphic belt: a conventional and SHRIMP U–Pb
study of accessory minerals from the Jimperding Metamorphic
Belt, Yilgran Craton, Western Australia. J. Geol. 104, 695–711.
Bruguier, O., Dada, S.S., Lancelot, J.R., 1994. Early Archean com-
ponent ( > 3.5 Ga) within a 3.05 Ga orthogneiss from Northern
Nigeria: U–Pb zircon evidence. Earth Planet. Sci. Lett. 125,
89–103.
Bruguier, O., Bosch, D., Pidgeon, R.T., Byrne, D., Harris, L., 1999.
U–Pb chronology of the Northampton Complex, Western Aus-
tralia—evidence for Grenvillian sedimentation, metamorphism
and deformation and geodynamic implications. Contrib. Miner-
al. Petrol. 136, 258–272.
Caby, R., 1970. La chaine pharusienne dans le NW de l’Ahaggar
(Sahara central; Algerie): sa place dans l’orogenese du Precam-
brien superieur en Afrique. PhD Thesis, University of Montpel-
lier, 289 pp.
Caby, R., 1987. The Pan-African belt of west Africa from the Sa-
hara Desert to the Gulf of Benin. In: Schaer, J., Rodgers, P.
(Eds.), Anatomy of Mountain Ranges. Princeton Univ. Press,
Princeton, NJ, pp. 129–170.
Caby, R., Andreopoulos-Renaud, U., 1983. Age a 1800 Ma du
magmatisme sub-alcalin associe aux metasediments monocycli-
ques dans la chaıne Pan-Africaine du Sahara central. J. Afr.
Earth Sci. 1, 193–197.
Caby, R., Andreopoulos-Renaud, U., 1989. Age U–Pb a 620 Ma
d’un pluton synorogenique de l’Adrar des Iforas (Mali). Con-
sequences pour l’age de la phase majeure de l’orogene Pan-
Africaine. C. R. Acad. Sci. Paris 308, 307–314.
Cocherie, A., Legendre, O., Peucat, J.J., Kouamelan, A.N., 1998.
Geochronology of polygenetic monazites constrained by in situ
electron microprobe Th–U– total lead determination: implica-
tions for lead behaviour in monazite. Geochim. Cosmochim.
Acta 62, 2475–2497.
Compston, W., Arriens, P.A., 1968. The Precambrian geochronol-
ogy of Australia. Can. J. Earth Sci. 5, 561–583.
Copeland, P., Parrish, R.R., Harrison, T.M., 1988. Identification of
inherited radiogenic Pb in monazite and its implications for U–
Pb systematics. Nature 333, 760–763.
Cottin, J.Y., Lorand, J.P., Agrinier, P., Bodinier, J.L., Liegeois, J.P.,
1998. Isotopic (O, Sr, Nd) and trace element geochemistry of the
Laouni layered intrusions (Pan-African belt, Hoggar, Algeria):
evidence for post-collisional continental tholeiitic magmas var-
iably contaminated by continental crust. Lithos 45, 197–222.
De Wolf, C.P., Belshaw, N., O’Nions, R.K., 1993. A metamorphic
history from micron-scale 207Pb/206Pb chronometry of Archean
monazite. Earth Planet. Sci. Lett. 120, 207–220.
Ferry, J.M., Spear, F.S., 1978. Experimental calibration of the par-
titioning of Fe and Mg between biotite and garnet. Contrib.
Mineral. Petrol. 66, 113–117.
Hadj-Kaddour, Z., Liegeois, J.P., Demaiffe, D., Caby, R., 1998. The
alkaline–peralkaline granitic post-collisional Tin Zebane dyke
swarm (Pan-African Tuareg Shield, Algeria): prevalent mantle
signature and late agpaitic differentiation. Lithos 45, 223–243.
Hanchar, J.M., Miller, C.F., 1993. Zircon zonation patterns as re-
vealed by cathodoluminescence and backscattered electron im-
ages: implications for interpretation of complex crustal histories.
Chem. Geol. 11, 1–15.
Harrison, T.M., Mackeegan, K.D., Lefort, P., 1995. Detection of
inherited monazite in the Manaslu leucogranite by 208Pb/232Th
ion microprobe dating: crystallization age and tectonic implica-
tions. Earth Planet. Sci. Lett. 133, 271–282.
Hawkins, D.P., Bowring, S.A., 1997. U–Pb systematics of mona-
zite and xenotime: case studies from the Paleoproterozoic of the
Grand Canyon, Arizona. Contrib. Mineral. Petrol. 127, 87–103.
Jahn, B.M., Caby, R., Monie, P., in press. Precambrian UHP eclo-
gites from Northern Mali, West Africa: age of UHP metamor-
phism, nature of protoliths and tectonic implications. Chem.
Geol.
Lanzirotti, A., Hanson, G.N., 1995. U–Pb dating of major and
accessory minerals formed during metamorphism and deforma-
tion of metapelites. Geochim. Cosmochim. Acta 59, 2513–
2526.
Ludwig, K.R., 1999. User’s Manual for Isoplot/Ex, version 2.06.
Berkeley Geochronology Center Spec. Publ., no. 1a, 49 pp.
Montel, J.M., Foret, S., Veschambre, M., Nicollet, C., Provost, A.,
1996. Electron microprobe dating of monazite. Chem. Geol.
131, 37–53.
Nemchin, A.A., Pidgeon, R.T., Wilde, S.A., 1994. Timing of Late
Archean granulite facies metamorphism in the Southwestern
Yilgarn Craton of Western Australia: evidence from U–Pb ages
of zircons from mafic granulites. Precambrian Res. 68, 307–
321.
Paquette, J.L., Caby, R., Djouadi, M.T., Bouchez, J.L., 1998. U–Pb
dating of the Pan-African orogeny in the Tuareg shield: the post-
collisional syn-shear Tioueine pluton (western Hoggar, Algeria).
Lithos 45, 245–253.
Parrish, R., 1990. U–Pb dating of monazite and its application to
geological problems. Can. J. Earth Sci. 27, 1431–1450.
Pidgeon, R.T., 1992. Recrystallisation of oscillatory zoned zircon:
some geochronological and petrological implications. Contrib.
Mineral. Petrol. 110, 463–472.
Pidgeon, R.T., Bosch, D., Bruguier, O., 1996. Inherited zircon and
titanite U–Pb systems in an Archean Katrine syenite from
southwestern Australia: implications for U–Pb stability of titan-
ite. Earth Planet. Sci. Lett. 141, 187–198.
Poitrasson, F., Chenery, S., Shepherd, T.J., 2000. Electron microp-
robe and LA-ICP-MS study of monazite hydrothermal altera-
tion: implications for U–Th–Pb geochronology and nuclear
ceramics. Geochim. Cosmochim. Acta 64, 3283–3297.
Richards, J.R., Blockley, J.G., De Laeter, J.R., 1985. Rb–Sr and Pb
isotope data from the Northampton Block, Western Australia.
Bull. Proc.-Australia Inst. Min. Metall. 290, 43–55.
Scharer, U., 1984. The effect of initial 230Th disequilibrium on
young U–Pb ages: the Makalu case, Himalaya. Earth Planet.
Sci. Lett. 67, 191–194.
Smith, H.A., Barreiro, B., 1990. Monazite U–Pb dating of staur-
olite grade metamorphism in pelitic schists. Contrib. Mineral.
Petrol. 105, 602–615.
D. Bosch et al. / Chemical Geology 184 (2002) 151–165164

Smith, H.A., Giletti, B.J., 1997. Lead diffusion in monazite. Geo-
chim. Cosmochim. Acta 61, 1047–1055.
Stacey, J.S., Kramers, J.D., 1975. Approximation of terrestrial lead
isotope evolution by a two stage model. Earth Planet. Sci. Lett.
6, 15–25.
Suzuki, K., Adachi, M., Kajizuka, I., 1994. Electron microprobe
observations of Pb diffusion in metamorphosed detrital mona-
zites. Earth Planet. Sci. Lett. 128, 391–405.
Williams, I.S., Buick, L.S., Cartwright, I., 1996. An extended epi-
sode of early Mesoproterozoic metamorphic fluid flow in the
Reynolds Range, Central Australia. J. Met. Petrol. 14, 29–47.
Zhu, X.K., O’Nions, R.K., Belshaw, N.S., Gibb, A.J., 1997. Sig-
nificance of in situ SIMS chronometry of zoned monazite from
the Lewisian granulites, NW Scotland. Chem. Geol. 135, 35–
53.
Zhu, X.K., O’Nions, R.K., Gibb, A.J., 1998. SIMS analysis of U–
Pb isotopes in monazite: matrix effects. Chem. Geol. 144, 305–
312.
D. Bosch et al. / Chemical Geology 184 (2002) 151–165 165

www.elsevier.com/locate/chemgeo
Chemical Geology 201 (2003) 319–336
Application of in situ zircon geochronology and accessory
phase chemistry to constraining basin development
during post-collisional extension: a case study
from the French Massif Central
O. Bruguiera,*, J.F. Becq-Giraudonb, M. Champenoisc, E. Deloulec,J. Luddenc, D. Manginc
aService ICP-MS, cc 056, ISTEEM, Universite de Montpellier II, Place Eugene Bataillon, 34095 Montpellier Cedex 5, FrancebBRGM, 3 Avenue C. Guillemin, BP 6009, 45 060 Orleans, France
cCRPG, 15 rue Notre Dame des Pauvres, 54 000 Vandoeuvre-les-Nancy, France
Accepted 7 August 2003
Abstract
A series of five volcanic ash layers interbedded in Late Carboniferous sedimentary basins from the southern part of the French
Massif Central (FMC, France) have been studied by ion-microprobe analyses of zircons in order to constrain the age of basin
formation and sedimentation. Weighted mean 206Pb/238U ages for the five studied tuffs are indistinguishable at the 95%
confidence level and range from 295.5F 5.1 Ma (Graissessac) to 297.9F 5.1 Ma (Roujan–Neffies). These U–Pb ages support
the argument for intense magmatic activity in the southern part of the French Massif Central during the period 295–300 Ma.
Inherited zircons were identified in two out of the five dated tuff horizons and indicate a anatexis of basement source rocks with
ages of ca. 2400 (Jaujac basin), 1900 and 600Ma (Graissessac basin). The Proterozoic components suggest a Gondwanan affinity
for the deep-seated material. Chemical compositions of apatites and of one single zircon grain from the Roujan–Neffies bentonite
further indicate magma generation mainly from anatexis of the continental crust and a rhyolitic affiliation. Conversely, the same
minerals extracted from the Jaujac bentonite indicate involvement of a mantle component in the source of the magmas and a
trachytic affiliation. The 295–300 Ma volcanic episode in the French Massif Central is contemporaneous with volcanic events
identified in other parts of the Variscan Belt which suggests it was triggered by orogen-wide processes. Contemporaneous
eruption of trachytic and rhyolitic magmas may be related to replenishment of magma chambers at depth by influx of mantle-
derived magmas triggering the Late Carboniferous flare-up.
D 2003 Elsevier B.V. All rights reserved.
Keywords: Stephanian basins; Ash-fall tuffs; Zircon; Apatite; French Massif Central; Variscan orogen
0009-2541/$ - see front matter D 2003 Elsevier B.V. All rights reserved.
doi:10.1016/j.chemgeo.2003.08.005
* Corresponding author.
E-mail address: [email protected] (O. Bruguier).
1. Introduction
Extensional tectonics is preferentially located
along orogenic belts with a thickened crust and is
an important feature of post-collisional orogenic
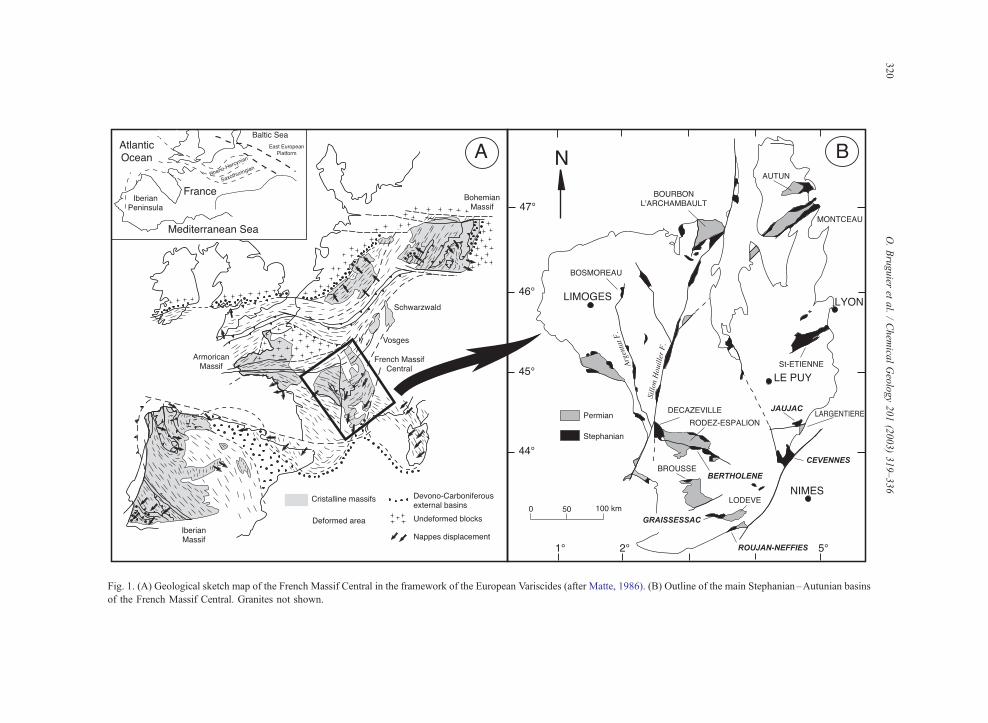
Fig. 1. (A) Geological sketch map of the French Massif Central in the framework of the European Variscides (after Matte, 1986). (B) Outline of the main Stephanian–Autunian basins
of the French Massif Central. Granites not shown.
O.Bruguier
etal./Chem
icalGeology201(2003)319–336
320
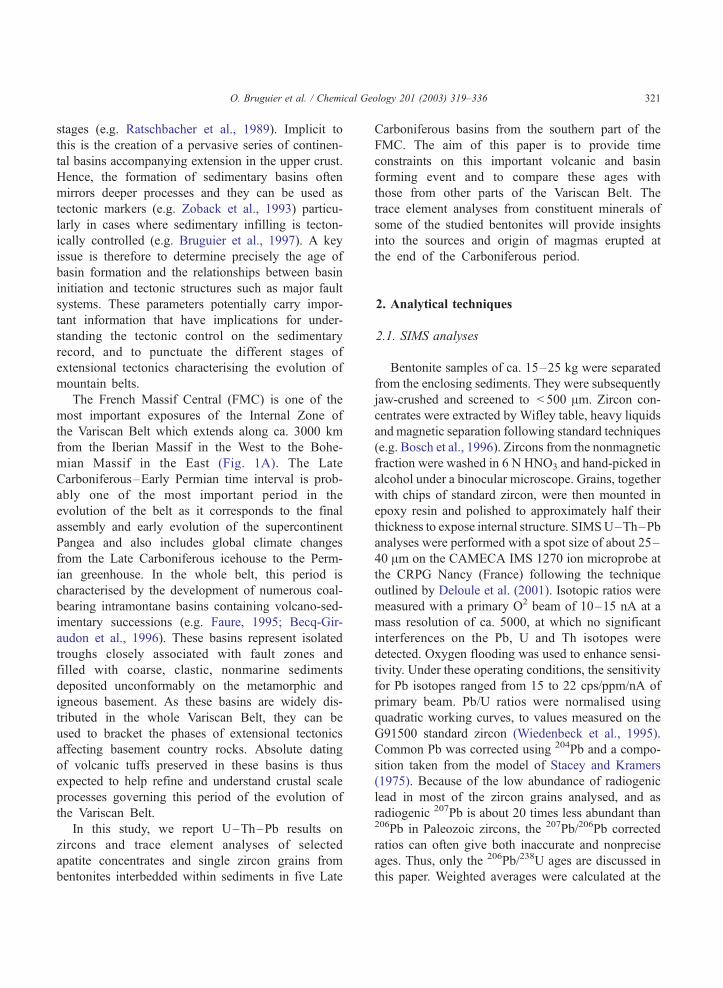
O. Bruguier et al. / Chemical Geology 201 (2003) 319–336 321
stages (e.g. Ratschbacher et al., 1989). Implicit to
this is the creation of a pervasive series of continen-
tal basins accompanying extension in the upper crust.
Hence, the formation of sedimentary basins often
mirrors deeper processes and they can be used as
tectonic markers (e.g. Zoback et al., 1993) particu-
larly in cases where sedimentary infilling is tecton-
ically controlled (e.g. Bruguier et al., 1997). A key
issue is therefore to determine precisely the age of
basin formation and the relationships between basin
initiation and tectonic structures such as major fault
systems. These parameters potentially carry impor-
tant information that have implications for under-
standing the tectonic control on the sedimentary
record, and to punctuate the different stages of
extensional tectonics characterising the evolution of
mountain belts.
The French Massif Central (FMC) is one of the
most important exposures of the Internal Zone of
the Variscan Belt which extends along ca. 3000 km
from the Iberian Massif in the West to the Bohe-
mian Massif in the East (Fig. 1A). The Late
Carboniferous–Early Permian time interval is prob-
ably one of the most important period in the
evolution of the belt as it corresponds to the final
assembly and early evolution of the supercontinent
Pangea and also includes global climate changes
from the Late Carboniferous icehouse to the Perm-
ian greenhouse. In the whole belt, this period is
characterised by the development of numerous coal-
bearing intramontane basins containing volcano-sed-
imentary successions (e.g. Faure, 1995; Becq-Gir-
audon et al., 1996). These basins represent isolated
troughs closely associated with fault zones and
filled with coarse, clastic, nonmarine sediments
deposited unconformably on the metamorphic and
igneous basement. As these basins are widely dis-
tributed in the whole Variscan Belt, they can be
used to bracket the phases of extensional tectonics
affecting basement country rocks. Absolute dating
of volcanic tuffs preserved in these basins is thus
expected to help refine and understand crustal scale
processes governing this period of the evolution of
the Variscan Belt.
In this study, we report U–Th–Pb results on
zircons and trace element analyses of selected
apatite concentrates and single zircon grains from
bentonites interbedded within sediments in five Late
Carboniferous basins from the southern part of the
FMC. The aim of this paper is to provide time
constraints on this important volcanic and basin
forming event and to compare these ages with
those from other parts of the Variscan Belt. The
trace element analyses from constituent minerals of
some of the studied bentonites will provide insights
into the sources and origin of magmas erupted at
the end of the Carboniferous period.
2. Analytical techniques
2.1. SIMS analyses
Bentonite samples of ca. 15–25 kg were separated
from the enclosing sediments. They were subsequently
jaw-crushed and screened to < 500 Am. Zircon con-
centrates were extracted by Wifley table, heavy liquids
and magnetic separation following standard techniques
(e.g. Bosch et al., 1996). Zircons from the nonmagnetic
fraction were washed in 6 N HNO3 and hand-picked in
alcohol under a binocular microscope. Grains, together
with chips of standard zircon, were then mounted in
epoxy resin and polished to approximately half their
thickness to expose internal structure. SIMSU–Th–Pb
analyses were performed with a spot size of about 25–
40 Am on the CAMECA IMS 1270 ion microprobe at
the CRPG Nancy (France) following the technique
outlined by Deloule et al. (2001). Isotopic ratios were
measured with a primary O2 beam of 10–15 nA at a
mass resolution of ca. 5000, at which no significant
interferences on the Pb, U and Th isotopes were
detected. Oxygen flooding was used to enhance sensi-
tivity. Under these operating conditions, the sensitivity
for Pb isotopes ranged from 15 to 22 cps/ppm/nA of
primary beam. Pb/U ratios were normalised using
quadratic working curves, to values measured on the
G91500 standard zircon (Wiedenbeck et al., 1995).
Common Pb was corrected using 204Pb and a compo-
sition taken from the model of Stacey and Kramers
(1975). Because of the low abundance of radiogenic
lead in most of the zircon grains analysed, and as
radiogenic 207Pb is about 20 times less abundant than206Pb in Paleozoic zircons, the 207Pb/206Pb corrected
ratios can often give both inaccurate and nonprecise
ages. Thus, only the 206Pb/238U ages are discussed in
this paper. Weighted averages were calculated at the

Table 1
IMS 1270 U–Th–Pb results for zircons extracted from Carboniferous volcanics of the French Massif Central (France)
Grain U Th Pb Th/ 204Pb/ 208Pb/ 206Pb/ F 207Pb/ F Rho 207Pb/ F Apparent age (Ma)
area (ppm) (ppm) (ppm) U 206Pb 206Pb 238U (1rerror)
235U (1rerror)
206Pb (1rerror)
206Pb/238U
F 207Pb206Pb/
F
Bertholene basin (296.2F 7.2 Ma)
Ci5-1 596 609 23 1.02 0.00580 0.321 0.0462 0.0005 0.326 0.028 0.77 0.0513 0.0042 291 3 254 176
Ci5-2 449 112 17 0.25 0.00047 0.063 0.0448 0.0023 0.298 0.015 0.86 0.0482 0.0013 283 14 109 60
Ci5-3 484 130 20 0.27 0.00014 0.074 0.0473 0.0026 0.330 0.019 0.91 0.0507 0.0012 298 17 227 54
Ci5-4 760 319 32 0.42 0.00012 0.132 0.0484 0.0004 0.343 0.004 0.90 0.0513 0.0002 305 3 254 10
Ci5-5 251 173 10 0.69 0.00069 0.207 0.0442 0.0004 0.297 0.013 0.75 0.0488 0.0020 279 3 138 94
Ci5-6 489 183 21 0.37 0.00022 0.101 0.0498 0.0007 0.349 0.005 0.88 0.0508 0.0004 313 5 232 17
Ci5-7 418 159 18 0.38 0.00022 0.100 0.0500 0.0029 0.329 0.022 0.92 0.0477 0.0013 315 18 84 64
Ci5-8 265 181 10 0.68 0.00052 0.176 0.0454 0.0025 0.345 0.021 0.74 0.0551 0.0024 286 16 416 93
Ci5-9 278 195 11 0.70 0.00039 0.162 0.0467 0.0024 0.299 0.022 0.87 0.0464 0.0017 294 15 18 86
Ci5-10 351 265 15 0.76 0.00115 0.237 0.0482 0.0007 0.328 0.008 0.65 0.0494 0.0009 303 5 167 43
Ci5-11 745 252 32 0.34 0.00010 0.096 0.0500 0.0008 0.351 0.006 0.95 0.0509 0.0028 315 5 236 122
Ci5-12 736 317 31 0.43 0.00009 0.133 0.0482 0.0011 0.343 0.008 0.97 0.0516 0.0003 303 7 268 12
Ci5-13 475 162 20 0.34 0.00068 0.099 0.0480 0.0012 0.336 0.009 0.87 0.0508 0.0007 302 8 232 32
Ci5-14 417 114 17 0.27 0.00014 0.080 0.0487 0.0008 0.350 0.007 0.92 0.0521 0.0004 307 8 290 17
Ci5-15 794 378 30 0.48 0.00472 0.103 0.0443 0.0011 0.282 0.009 0.88 0.0473 0.0007 279 7 64 33
Average 501 237 20 0.49 0.139
Roujan–Neffies basin (297.9F 5.1 Ma)
Ci7-1 913 288 44 0.32 0.00002 0.064 0.0560 0.0034 0.421 0.026 0.99 0.0546 0.0005 351 21 394 20
Ci7-2 803 389 32 0.48 0.00004 0.140 0.0464 0.0026 0.337 0.019 0.99 0.0527 0.0001 293 16 314 4
Ci7-3 438 208 18 0.48 0.00006 0.138 0.0488 0.0014 0.356 0.011 0.99 0.0529 0.0002 307 9 326 10
Ci7-4 554 289 22 0.52 0.00020 0.139 0.0462 0.0014 0.322 0.011 0.92 0.0506 0.0007 291 9 223 30
Ci7-5 623 158 24 0.25 0.00005 0.071 0.0449 0.0013 0.323 0.010 0.99 0.0522 0.0002 283 8 296 7
Ci7-6 655 161 26 0.25 0.00004 0.070 0.0464 0.0015 0.336 0.011 0.99 0.0526 0.0002 292 9 312 8
Ci7-7 512 367 26 0.72 0.00009 0.195 0.0600 0.0064 0.433 0.047 0.98 0.0523 0.0011 376 39 299 48
Ci7-8 768 344 57 0.45 0.00012 0.071 0.0870 0.0077 0.643 0.059 0.98 0.0537 0.0011 538 46 356 44
Ci7-9 420 178 17 0.42 0.00024 0.121 0.0480 0.0015 0.346 0.012 0.94 0.0522 0.0006 303 9 296 26
Ci7-10 1092 363 42 0.33 0.00008 0.067 0.0443 0.0013 0.330 0.010 0.99 0.0540 0.0002 279 8 370 8
Ci7-11 571 235 22 0.41 0.00013 0.095 0.0451 0.0010 0.326 0.007 0.98 0.0525 0.0002 284 6 305 10
Ci7-12 275 71 11 0.26 0.00010 0.081 0.0477 0.0003 0.346 0.003 0.61 0.0526 0.0004 300 2 313 17
Average 635 254 29 0.41 0.104
Graissessac basin (295.3F 4.8 Ma)
Ci9-1 141 44 6 0.31 0.00043 0.082 0.0482 0.0007 0.319 0.005 0.78 0.0480 0.0007 303 4 99 34
Ci9-2 980 803 39 0.82 0.00020 0.245 0.0458 0.0006 0.329 0.004 0.92 0.0520 0.0005 289 4 288 21
Ci9-3-1 264 149 11 0.56 0.00027 0.159 0.0466 0.0005 0.334 0.005 0.94 0.0521 0.0006 294 3 289 27
Ci9-3-2 322 131 13 0.41 0.00030 0.111 0.0466 0.0035 0.323 0.004 0.73 0.0503 0.0005 293 22 211 24
Ci9-5 276 88 11 0.32 0.00017 0.086 0.0464 0.0013 0.341 0.005 0.66 0.0533 0.0007 293 8 342 28
Ci9-7 539 196 22 0.36 0.00022 0.102 0.0479 0.0011 0.343 0.003 0.56 0.0519 0.0004 302 7 282 17
Ci9-8 636 204 25 0.32 0.00025 0.083 0.0462 0.0029 0.330 0.004 0.25 0.0518 0.0005 291 18 277 24
Ci9-9 203 63 8 0.31 0.00021 0.076 0.0485 0.0012 0.348 0.006 0.32 0.0520 0.0007 305 7 287 32
Ci9-10 247 84 9 0.34 0.00023 0.094 0.0426 0.0010 0.312 0.005 0.98 0.0531 0.0008 269 6 333 33
Ci9-4 340 137 28 0.40 0.00013 0.105 0.0976 0.0011 0.805 0.008 0.54 0.0598 0.0004 601 6 596 15
Ci9-6 122 84 29 0.69 0.00011 0.211 0.2795 0.0021 4.439 0.050 0.52 0.1152 0.0004 1589 11 1883 6
Average 370 180 18 0.44 0.123
Jaujac basin (296.0F 6.8 Ma)
Ci12-1 177 127 7 0.72 0.00006 0.234 0.0460 0.0007 0.332 0.004 0.45 0.0523 0.0001 290 4 299 4
Ci12-2 252 215 10 0.85 0.00018 0.276 0.0466 0.0017 0.339 0.010 0.42 0.0529 0.0002 293 10 323 10
O. Bruguier et al. / Chemical Geology 201 (2003) 319–336322

Grain U Th Pb Th/ 204Pb/ 208Pb/ 206Pb/ F 207Pb/ F Rho 207Pb/ F Apparent age (Ma)
area (ppm) (ppm) (ppm) U 206Pb 206Pb 238U (1rerror)
235U (1rerror)
206Pb (1rerror)
206Pb/238U
F 207Pb206Pb/
F
Jaujac basin (296.0F 6.8 Ma)
Ci12-3 115 63 5 0.55 0.00016 0.190 0.0479 0.0017 0.357 0.008 0.54 0.0541 0.0002 302 10 375 7
Ci12-4 715 374 28 0.52 0.00197 0.176 0.0462 0.0030 0.376 0.022 0.42 0.0590 0.0005 291 19 567 18
Ci12-5 400 324 16 0.81 0.00129 0.267 0.0453 0.0031 0.318 0.016 0.43 0.0508 0.0004 286 19 234 17
Ci12-6 1405 1629 48 1.16 0.00761 0.382 0.0400 0.0011 0.311 0.025 0.11 0.0563 0.0008 253 7 463 31
Ci12-7-1 278 114 11 0.41 0.00090 0.129 0.0474 0.0015 0.335 0.025 0.15 0.0512 0.0006 299 9 250 26
Ci12-7-2 81 71 22 0.88 0.00008 0.312 0.3185 0.0045 6.610 0.049 0.81 0.1505 0.0009 1782 63 2352 10
Ci12-8 137 96 5 0.70 0.00012 0.245 0.0455 0.0016 0.334 0.010 0.41 0.0532 0.0002 287 10 338 9
Ci12-9 185 104 8 0.56 0.00054 0.200 0.0485 0.0028 0.356 0.022 0.33 0.0533 0.0005 305 17 339 19
Ci12-10 195 103 8 0.53 0.00144 0.157 0.0493 0.0034 0.304 0.052 0.12 0.0448 0.0011 310 21 � 67 60
Ci12-11 145 99 7 0.68 0.00095 0.203 0.0523 0.0049 0.347 0.040 0.28 0.0481 0.0007 328 30 104 36
Ci12-12 202 120 8 0.59 0.00133 0.187 0.0459 0.0043 0.327 0.041 0.24 0.0516 0.0010 289 27 268 44
Ci12-13 293 394 12 1.34 0.00011 0.372 0.0458 0.0016 0.359 0.024 0.52 0.0569 0.0032 289 10 487 120
Ci12-14 125 93 6 0.74 0.00001 0.231 0.0518 0.0016 0.401 0.022 0.55 0.0562 0.0026 326 10 459 98
Ci12-15 128 64 6 0.50 0.00020 0.170 0.0506 0.0027 0.435 0.050 0.47 0.0624 0.0063 318 17 686 202
Average 302 249 13 0.72 0.233
Ales basin (297.4F 4.4 Ma)
Ci13/1/1-1 487 238 23 0.49 0.00003 0.081 0.0504 0.0015 0.354 0.011 0.97 0.0510 0.0003 317 9 240 15
Ci13/1/1-2 115 44 6 0.38 0.00027 0.076 0.0419 0.0012 0.255 0.011 0.68 0.0441 0.0013 265 7 � 103 73
Ci13/1/2-1 227 158 12 0.70 0.00016 0.131 0.0414 0.0012 0.295 0.009 0.89 0.0516 0.0008 262 8 269 33
Ci13/1/2-2 674 342 15 0.51 0.00009 0.146 0.0365 0.0027 0.265 0.020 0.99 0.0526 0.0006 231 17 312 25
Ci13/1/3 221 144 16 0.65 0.00010 0.104 0.0487 0.0017 0.359 0.013 0.95 0.0534 0.0006 307 10 348 26
Ci13/1/4 129 78 10 0.60 0.00011 0.098 0.0492 0.0017 0.355 0.013 0.92 0.0524 0.0008 310 10 302 33
Ci13/1/5 743 409 31 0.55 0.00017 0.087 0.0502 0.0014 0.356 0.010 0.97 0.0515 0.0003 316 8 262 15
Ci13/1/6 508 109 22 0.21 0.00011 0.212 0.0467 0.0016 0.338 0.012 0.99 0.0525 0.0003 294 10 307 13
Ci13/1/7 230 97 10 0.42 0.00022 0.106 0.0492 0.0015 0.355 0.011 0.95 0.0523 0.0005 310 9 299 22
Ci13/1/8 698 158 30 0.23 0.00025 0.089 0.0479 0.0019 0.329 0.013 0.90 0.0498 0.0009 301 11 186 40
Ci13/1/9 183 53 7 0.29 0.00021 0.074 0.0482 0.0014 0.349 0.010 0.97 0.0524 0.0004 304 9 302 17
Ci13/1/10 349 162 14 0.47 0.00023 0.097 0.0446 0.0014 0.329 0.012 0.88 0.0534 0.0009 282 9 347 37
Ci13/2/1 219 37 9 0.17 0.00059 0.042 0.0468 0.0007 0.313 0.008 0.59 0.0485 0.0010 295 5 122 50
Ci13/2/2-1 636 365 26 0.57 0.00140 0.147 0.0470 0.0008 0.362 0.011 0.58 0.0559 0.0014 296 5 449 55
Ci13/2/2-2 651 391 27 0.60 0.00149 0.147 0.0482 0.0008 0.363 0.013 0.45 0.0547 0.0017 303 5 400 69
Ci13/2/3 263 148 11 0.56 0.00284 0.178 0.0469 0.0024 0.423 0.025 0.26 0.0655 0.0126 295 15 790 360
Ci13/2/4 597 261 24 0.44 0.00054 0.133 0.0464 0.0006 0.335 0.008 0.52 0.0523 0.0011 292 4 300 46
Ci13/2/5 568 256 22 0.45 0.00024 0.137 0.0458 0.0008 0.342 0.009 0.70 0.0542 0.0010 289 5 380 42
Ci13/2/6 392 121 16 0.31 0.00005 0.100 0.0470 0.0009 0.342 0.007 0.90 0.0527 0.0005 296 5 317 20
Average 415 188 17 0.45 0.115
Table 1 (continued)
O. Bruguier et al. / Chemical Geology 201 (2003) 319–336 323
95% confidence level using the Isoplot program
(Ludwig, 1999). Standard decay constants are those
recommended by the IUGS Subcommission on Geo-
chronology (Steiger and Jager, 1977). Analytical un-
certainties are listed as 1r in Table 1.
2.2. ICP-MS analyses
Trace element on accessory minerals (apatite and
zircon) from three bentonite samples were analysed
by conventional, nebulisation, ICP-MS using a VG
Plasmaquad II turbo at the University of Montpel-
lier II. Small samples were weighed on a Cahn
electrobalance. Zircons were dissolved under pres-
sure during 3 days at 195 jC with 10 Al of
suprapure tridistilled HF 48% using micro-capsule
dissolution (Parrish, 1987). Fluorides were subse-
quently converted to chlorides by dissolution over-
night under pressure in 6 N HCl. Apatites were
dissolved on a hot plate at 130 jC using suprapure
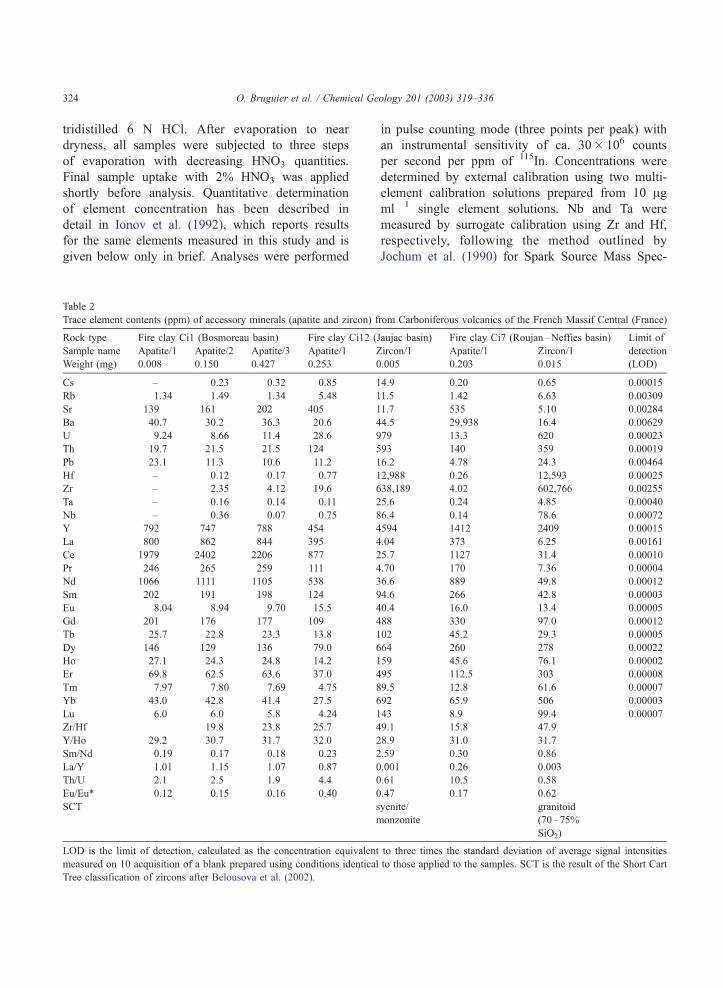
O. Bruguier et al. / Chemical Geology 201 (2003) 319–336324
tridistilled 6 N HCl. After evaporation to near
dryness, all samples were subjected to three steps
of evaporation with decreasing HNO3 quantities.
Final sample uptake with 2% HNO3 was applied
shortly before analysis. Quantitative determination
of element concentration has been described in
detail in Ionov et al. (1992), which reports results
for the same elements measured in this study and is
given below only in brief. Analyses were performed
Table 2
Trace element contents (ppm) of accessory minerals (apatite and zircon) f
Rock type Fire clay Ci1 (Bosmoreau basin) Fire clay Ci12 (
Sample name Apatite/1 Apatite/2 Apatite/3 Apatite/1 Z
Weight (mg) 0.008 0.150 0.427 0.253 0
Cs – 0.23 0.32 0.85 1
Rb 1.34 1.49 1.34 5.48 1
Sr 139 161 202 405 1
Ba 40.7 30.2 36.3 20.6 4
U 9.24 8.66 11.4 28.6 9
Th 19.7 21.5 21.5 124 5
Pb 23.1 11.3 10.6 11.2 1
Hf – 0.12 0.17 0.77 1
Zr – 2.35 4.12 19.6 6
Ta – 0.16 0.14 0.11 2
Nb – 0.36 0.07 0.75 8
Y 792 747 788 454 4
La 800 862 844 395 4
Ce 1979 2402 2206 877 2
Pr 246 265 259 111 4
Nd 1066 1111 1105 538 3
Sm 202 191 198 124 9
Eu 8.04 8.94 9.70 15.5 4
Gd 201 176 177 109 4
Tb 25.7 22.8 23.3 13.8 1
Dy 146 129 136 79.0 6
Ho 27.1 24.3 24.8 14.2 1
Er 69.8 62.5 63.6 37.0 4
Tm 7.97 7.80 7.69 4.75 8
Yb 43.0 42.8 41.4 27.5 6
Lu 6.0 6.0 5.8 4.24 1
Zr/Hf 19.8 23.8 25.7 4
Y/Ho 29.2 30.7 31.7 32.0 2
Sm/Nd 0.19 0.17 0.18 0.23 2
La/Y 1.01 1.15 1.07 0.87 0
Th/U 2.1 2.5 1.9 4.4 0
Eu/Eu* 0.12 0.15 0.16 0.40 0
SCT s
m
LOD is the limit of detection, calculated as the concentration equivalent
measured on 10 acquisition of a blank prepared using conditions identical
Tree classification of zircons after Belousova et al. (2002).
in pulse counting mode (three points per peak) with
an instrumental sensitivity of ca. 30� 106 counts
per second per ppm of 115In. Concentrations were
determined by external calibration using two multi-
element calibration solutions prepared from 10 Agml� 1 single element solutions. Nb and Ta were
measured by surrogate calibration using Zr and Hf,
respectively, following the method outlined by
Jochum et al. (1990) for Spark Source Mass Spec-
rom Carboniferous volcanics of the French Massif Central (France)
Jaujac basin) Fire clay Ci7 (Roujan–Neffies basin) Limit of
ircon/1 Apatite/1 Zircon/1
.005 0.203 0.015
detection
(LOD)
4.9 0.20 0.65 0.00015
1.5 1.42 6.63 0.00309
1.7 535 5.10 0.00284
4.5 29,938 16.4 0.00629
79 13.3 620 0.00023
93 140 359 0.00019
6.2 4.78 24.3 0.00464
2,988 0.26 12,593 0.00025
38,189 4.02 602,766 0.00255
5.6 0.24 4.85 0.00040
6.4 0.14 78.6 0.00072
594 1412 2409 0.00015
.04 373 6.25 0.00161
5.7 1127 31.4 0.00010
.70 170 7.36 0.00004
6.6 889 49.8 0.00012
4.6 266 42.8 0.00003
0.4 16.0 13.4 0.00005
88 330 97.0 0.00012
02 45.2 29.3 0.00005
64 260 278 0.00022
59 45.6 76.1 0.00002
95 112.5 303 0.00008
9.5 12.8 61.6 0.00007
92 65.9 506 0.00003
43 8.9 99.4 0.00007
9.1 15.8 47.9
8.9 31.0 31.7
.59 0.30 0.86
.001 0.26 0.003
.61 10.5 0.58
.47 0.17 0.62
yenite/
onzonite
granitoid
(70–75%
SiO2)
to three times the standard deviation of average signal intensities
to those applied to the samples. SCT is the result of the Short Cart
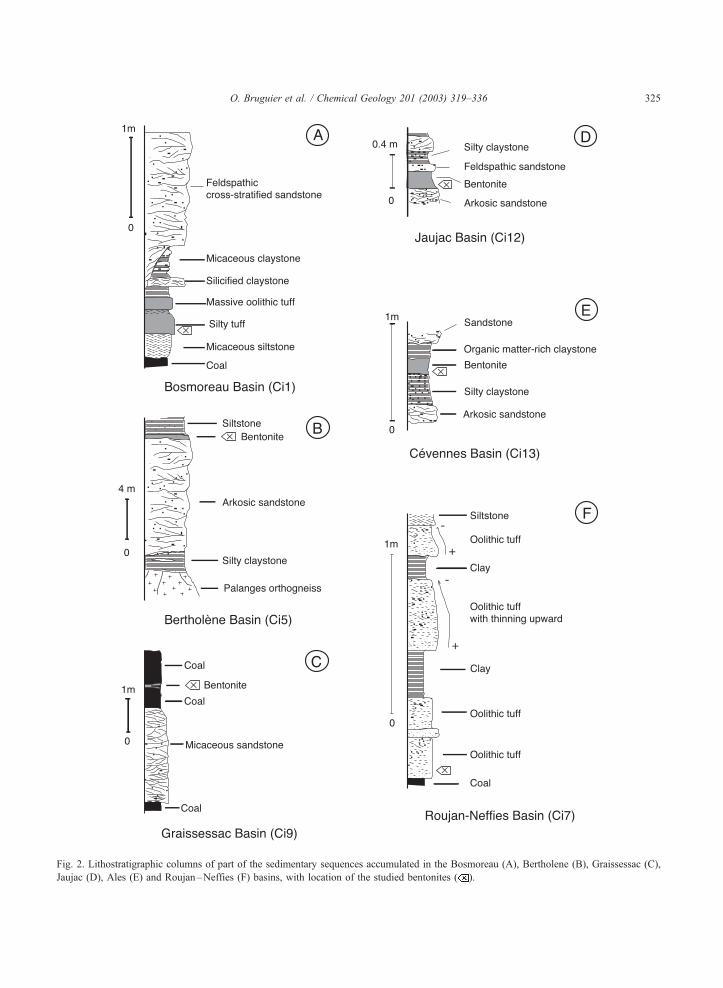
Fig. 2. Lithostratigraphic columns of part of the sedimentary sequences accumulated in the Bosmoreau (A), Bertholene (B), Graissessac (C),
Jaujac (D), Ales (E) and Roujan–Neffies (F) basins, with location of the studied bentonites ( ).
O. Bruguier et al. / Chemical Geology 201 (2003) 319–336 325

O. Bruguier et al. / Chemical Geology 201 (2003) 319–336326
trometry and applied to ICP-MS in this study.
Instrumental drift was corrected for by addition of
doping elements, namely In and Bi, at a concen-
tration level of 10 ng ml� 1. Polyatomic interfer-
ences were reduced by optimising the system to an
oxide production level < 1.5% measured on Ce and
corrections were applied using yields for MO+ and
MOH+ determined periodically by running batches
of synthetic solutions containing interfering ele-
ments. The analytical results are listed in Table 2.
Analytical precision of the ICP-MS measurements
is generally better than 5% (1r RSD) except for
low concentration elements which show precision
up to 10%.
3. Geological setting
The ash layers studied here are from Stephanian
(terrestrial Uppermost Carboniferous of northwestern
Europe) basins located in the southern part of the
FMC (Fig. 1B). All of these basins are characterised

Fig. 3. SEM photomicrographs of zircons from bentonites sampled in the studied basins. White ellipses show the approximate location of
the analysed area. Polished surfaces have been HF-etched to highlight internal structures. White patches along crystals or filling fractures
are due to gold remains. (a) Grain Ci5-10, from the Bertholene basin, is a euhedrally zoned zircon with a fine central channel of volcanic
origin. The crystal shows a slight rounding of the concentric oscillatory zoning (marked R) which indicates changes in the growth medium
and a temporary episode of Zr undersaturation with local dissolution. (b) About 350 Am long fragment of oscillatory zoned zircon with a
minimum length to width ratio of ca. 4. The pyramidal form grew assymetrically and shows an inversion of the length of the faces (see
white arrow) in the unbroken termination. The late stage of crystallisation shows a strongly reduced growth rate of the prism (Roujan–
Neffies basin). (c) Fragment of oscillatory zoned zircon showing fluctuation of the prism growth rate. Episodes of strongly inhibited
growth of the prism are related to slow cooling, possibly in the magmatic chamber, before eruption (Roujan Neffies basin). (d) Euhedral,
sector-zoned zircon with superposed oscillatory zoning (Graissessac basin). (e) Faintly zoned shard-like zircon fragment showing a central
gas tube characteristic of a volcanic origin (Jaujac basin). (f) Euhedral oscillatory zoned zircon with length to width ratio of ca. 3. The
crystal shows rounding of the internal zoning suggesting a low Zr undersaturation episode (Cevennes basin). (g) Example of euhedral
oscillatory zoned zircon with a euhedral core. The core is inclusion-rich which gives it a sponge-like texture and is partly resorbed on the
right side of the picture. Accordance of zoning between the core and the overgrowth, and the sponge-like texture suggest the core may
have crystallised in the early history of the magma and that the strongly zoned rim formed later in the magma chamber. The width of the
grain is due to the core, whereas the growth rate of the prism is inhibited in the rim. Volume expansion of the core due to radiation
damage induced radial micro-fracturation of the rim (Roujan–Neffies basin). (h) Euhedrally zoned zircon dated at ca. 290 Ma surrounding
a euhedral, sector-zoned core. Sector zoning of the core indicates an igneous precursor (Graissessac basin). (i) Euhedrally zoned zircon
consisting of a 299F 9 Ma (1r) magmatic overgrowth surrounding a strongly embayed ca. 2.4 Ga old core. Oscillatory zoning of the core
indicates melting of igneous source rocks (Jaujac basin). (j) Euhedrally zoned zircon with a central, strongly embayed, ca. 1.9 Ga old core
(Graissessac basin).
O. Bruguier et al. / Chemical Geology 201 (2003) 319–336 327
by thick accumulations (ca. 500 to up to 2500 m) of
fluvio-lacustrine sediments (see a review in Faure,
1995). Volcanic intercalations are common and occur
as thin (10–50 cm) irregular ash layers that are
considered to be products of an explosive, possibly
rhyolitic to rhyodacitic, volcanism (Bouroz, 1966).
The thicker bentonites (such as in the Roujan–Neffies
basin, see Fig. 2) are generally coarse-grained, hence
O. Bruguier et al. / Chemical Geology 201 (2003) 319–336328
suggesting transportation over shorter distance than
thin, fine-grained volcanics (e.g. Graissessac basin)
although volcanic centres have not been identified.
The occurrence of accretionary lapilli in several tuffs
suggests that at least some of them were transported as
eruption cloud and were subsequently deposited as
fallout particles in the basins. All studied bentonites
consist of an argillaceous matrix and contain phenoc-
rysts of quartz, biotite, feldspar and variable amounts
of zircon and apatite. They are generally well pre-
served within low-energy deposits such as siltstones,
claystones or coals but can also occur intercalated
with sandstones where they are generally only locally
preserved and truncated by erosion surfaces.
4. Results
4.1. U–Th–Pb results
U–Th–Pb results of the five dated ash layers are
listed in Table 1 and presented on concordia plots
(Fig. 4a–e). The internal structures of the grains were
examined under SEM imaging after HF etching (Fig.
3a–j) to highlight zoned and unzoned domains. Se-
lected grains have euhedral shapes with sharp termi-
nations suggesting short sedimentary transport. They
occur either as long prismatic grains or as fragments
that reach 300 Am in length. Crystals are mostly clear
and colourless but sometimes cracked and inclusion
rich (mainly small apatite grains). They are entirely
(Fig. 3a–c) or faintly (Fig. 3e) oscillatory zoned, a
feature commonly interpreted as reflecting growth in a
magma. In addition, many grains contain a central gas
tube or a channel filled with glassy material (Fig. 3a
and e) which is typical of a volcanic origin (Pupin,
1976). Some grains show examples of sector zoning
(Fig. 3d) with superimposed oscillatory zoning. Al-
though first described as an unusual growth phenom-
enon (Hoffmann and Long, 1984), sector zoning has
since been reported for zircons from numerous igne-
ous rocks (Vavra, 1990; Benisek and Finger, 1993)
and is regarded as resulting from the incorporation of
different levels of trace element (mainly REE and Y)
in different portions of the crystal, depending on the
crystallographic orientation of the growing surface.
Although kinetic factors can be invoked, in particular
for rapidly grown volcanic phenocrysts, sector zoning
cannot be taken as a typical volcanic feature as it can
also simply result from slow lattice diffusion (Watson
and Liang, 1995). Lastly, cores of zircon, both oscil-
latory (Fig. 3g and i) and sector-zoned (Fig. 3h)
surrounded by zoned zircon are also present and
may represent either earlier stages of crystallisation
or inheritance from the source region of the magmas.
The euhedral shape of some cores (Fig. 3g and h)
indicates zircon saturation of the melt (Watson and
Harrison, 1983). Conversely, strong embayment of
others suggests resorption/dissolution reaction in a
zirconium undersaturated melt (Fig. 3i and j) subse-
quently followed by plating of new magmatic zircon
on exposed nuclei.
4.1.1. Bertholene basin (Strait of Rodez)
Sample Ci5 was taken close to the Bertholene U
mine and corresponds to a 20-cm-thick grey layer
located at the base of the sedimentary column, about
12 m above the basement represented by the Palanges
orthogneiss (see Fig. 2). Fifteen grains have been
analysed from this sample. They are U-rich (251–
794 ppm, average: 501 ppm) and yield an average Th/
U ratio of 0.49. The latter is in the range of typical
magmatic values (>0.1) as proposed by Williams and
Claesson (1987). The 15 analyses cluster close to
concordia (Fig. 4a) and, when combined, provide a
weighted mean 206Pb/238U age of 296.2F 7.2 Ma
(MSWD = 6.3). No inherited components were
detected in the analysed grains and the 296 Ma age
is thus interpreted as the crystallisation age of the
zircon.
4.1.2. Roujan–Neffies basin (Montagne Noire)
The volcanic horizon is located at the base of the
sedimentary pile, which is exposed in a grapevine
close to the village of Neffies. Sample Ci7 was taken
from the base of a 50-cm-thick pink to reddish colour
layer containing numerous accretionary lapillis and
overlying a coal layer (see Fig. 2). Twelve grains
were analysed which, on average (see Table 1) have
U, Th and Pb content and mean Th/U ratio (0.41)
similar to the Bertholene bentonite. Three grains (#7-
1, #7-7 and #7-8 excluded from Fig. 4b) have ages
older than the remainder of the analyses which could
indicate inheritance, but their high error margins
preclude any interpretations. The nine remaining
analyses plot close to concordia as a coherent group

Fig. 4. Concordia plots showing SIMS zircon analyses. Analytical uncertainty is represented by 2r error ellipses.
O. Bruguier et al. / Chemical Geology 201 (2003) 319–336 329
O. Bruguier et al. / Chemical Geology 201 (2003) 319–336330
and define a mean 206Pb/238U age of 297.9F 5.1 Ma
(MSWD=2.3) which is interpreted as the eruption
age.
4.1.3. Graissessac basin (Montagne Noire)
Sample Ci9 was taken from a 10- to 20-cm-thick
layer of a yellow clay-altered ash intercalated within a
coal seam and outcropping in the Senegra quarry.
Eleven spots have been performed on 10 grains.
Although the U and Th contents of these grains are
generally lower than in the two other bentonites, their
mean Th/U ratio is identical and has a value of 0.44,
once more within the range of magmatic values. Eight
spots show a simple distribution with almost over-
lapping 206Pb/238U ratios (Fig. 4c). A pooled estimate
of the age from these analyses gives 295.3F 4.8 Ma
(MSWD=1.4). Analyses #9-4 and #9-6 have signif-
icantly older ages indicating that these grains contain
a component of inherited radiogenic Pb. Analysis #9-
4 with a 207Pb/206Pb age of 596F 30 Ma is from a
grain which has a euhedral form resembling igneous
zircons. This indicates no resorption or plating of new
magmatic zircon on the original crystal thus suggest-
ing a relatively short residence time in a Zr saturated
melt. This grain is thus interpreted as a xenocryst,
either inherited from basement rocks during ascent of
the magma and mixed with the volcanic ash during
the explosive stage of the eruption, or stripped from
wall rocks in the magma chamber at depth, shortly
before eruption. The oldest value, from analysis #9-6,
yields a 207Pb/206Pb age of 1883F 12 Ma and corre-
sponds to a strongly embayed core from a euhedral,
oscillatory zoned crystal (see Fig. 3j). Since the spot
partly overlaps the surrounding magmatic overgrowth,
the ca. 1.9 Ga age is interpreted as a minimum age for
the inherited component in this grain. The core–rim
relationship, observed in grain #9-6, indicates deriva-
tion of the magma through partial melting of Paleo-
proterozoic deep-seated crustal units. Analysis #9-10
defines a lower Saxonian age (ca. 269 Ma), which is
too young for the chronostratigraphic framework of
the basin. This suggests the grain has undergone
recent isotopic disturbance responsible for some Pb
loss.
4.1.4. Jaujac basin (Tanargue area)
Sample Ci12 is from a 15- to 20-cm-thick layer of
pale green colour. Only the base of the layer was
sampled, as detrital muscovite progressively appeared
upward in the bed. Sixteen spots were measured on 15
grains and, except for two analyses (#6 and #7-2)
discussed below, analyses cluster close to concordia
with overlapping error margins (Fig. 4d). Overall,
zircons from this volcanic ash have lower U content
(mean of 302 ppm), but higher Th content (mean of 249
ppm) and Th/U ratio (mean of 0.72) than the other
studied tuffs. Analysis 6 has the highest U and Th
content (both >1400 ppm) and the highest 204Pb/206Pb
ratio (0.00761) suggesting the beam struck a high U, Th
and Pb inclusion. This grain moreover yields a206Pb/238U Thuringian age (ca. 253 Ma) suggesting
disturbance of its U–Th–Pb system, which was there-
fore discarded from calculation. Thirteen analyses of
euhedrally zoned zircons and one analysis of a zoned
rim around core have concordant and overlapping
analytical points (Fig. 3d) with a weighted 206Pb/238U
age of 296.0F 6.8 Ma (MSWD=1.4). This is adopted
as our best estimate of the age of the magmatic zoned
zircons. Analysis #7-2 is from a strongly embayed,
euhedrally zoned core which yields a minimum appar-
ent 207Pb/206Pb age of 2352F 20 Ma. This core is
surrounded by ca. 299Ma oscillatory zoned zircon (see
Table 1). The zircon morphology and ages indicate that
new (i.e. Stephanian) magmatic zircon grew around
and shielded an older zircon during partial melting and
interaction with deep-seated source rocks. The euhe-
dral shape and zoning of the core is evidence for an
igneous precursor.
4.1.5. Cevennes basin
The Cevennes basin is probably one of the most
important Carboniferous basin of the French Massif
Central. Sample Ci13 is from a 10- to 15-cm-thick
blue-grey coloured layer sampled close to the local-
ity of Portes, i.e. in the middle part of the sedimen-
tary pile accumulated in this basin. A total of 19
spots were measured on 16 grains during two indi-
vidual sessions (see Table 1 and Fig. 4e). Zircons
have U and Th contents consistent with those from
the other studied volcanites and Th/U ratio (mean of
0.45), typical of a magmatic origin. No inherited
component was detected during the two SIMS ses-
sions and 16 analyses out of the 19 data points were
combined to provide a weighted mean 206Pb/238U
age of 297.4F4.4 Ma (MSWD=1.6). This is inter-
preted as the crystallisation and eruption age of the

O. Bruguier et al. / Chemical Geology 201 (2003) 319–336 331
magma. Three analyses (#1/1-2, #1/2-1 and #1/2-2)
gave younger 206Pb/238U ages of ca. 260–265 Ma
and ca. 230 Ma, interpreted as reflecting recent Pb
losses.
4.2. Trace element analyses of apatites and zircons
Small samples of apatites (weight ranging from
200 to 250 Ag) were analysed by solution ICP-MS
along with two single zircon grains from ash layers
from the Jaujac and Roujan–Neffies basins. In
addition, one single grain (weight of 8 Ag) and two
small fractions of apatite (150–425 Ag) from a
Visean bentonite collected in the Bosmoreau basin
(see Bruguier et al., 1998) were also analysed.
Chemical analyses of trace elements are reported in
Table 2 and shown in the chondrite-normalized
diagram of Fig. 5.
Apatites from bentonite Ci1 (Bosmoreau basin),
Ci7 (Roujan–Neffies basin) and Ci12 (Jaujac basin)
have chondrite-normalised LREE-enriched patterns.
One single apatite grain from sample Ci1 has trace
element concentrations and pattern similar to the two
apatite concentrates from the same rock. This indi-
cates that apatite crystallised from a magma which
remained homogeneous over the entire crystallisation
interval of this mineral in the magma chamber or
Fig. 5. Chondrite-normalized rare earth element patterns for apatites and
from McDonough and Sun (1995).
during ascent of the magma. All apatite REE-normal-
ised patterns show pronounced negative Eu anomalies
which are not typical of magmas of crustal origin as
this has been observed for apatites from undifferenti-
ated material such as the Acapulco meteorite (Zipfel et
al., 1995). On the other hand, the magnitude of the Eu
depletion is related to the oxygen fugacity of the
magma and crystal chemistry of apatite (Sha and
Chappell, 1999). Apatites from sample Ci1 and Ci7
have similar Eu anomalies with Eu/Eu* ranging from
0.12 to 0.17 whereas apatite from sample Ci12 has a
less pronounced Eu anomaly (Eu/Eu* = 0.40). Apatite
favors Eu3 + vs. Eu2 + in its structure. Eu3 + is less
abundant in S-type and felsic I-type magmas which
have a lower oxygen fugacity than mafic I-type
magmas thus leading to a pronounced Eu anomaly
in the formers. The greater Eu depletion in apatites
from Ci1 and Ci7 may thus be taken as indicating a
more reduced and peraluminous character of the
parent magmas, although this can also result from
plagioclase crystallisation. Some element ratios can be
used to characterise the different types of magmas
from which apatite crystallised such as the La/Y and
Sm/Nd ratios. From this standpoint (see Fig. 6),
apatites from samples Ci1 and Ci12 share similar
characteristics with La/Y and Sm/Nd ratios clearly in
the range of mafic I-type magmas (>0.2–3.25 and
zircons from ash-fall tuffs Ci1, Ci7 and Ci12. Chondrite values are
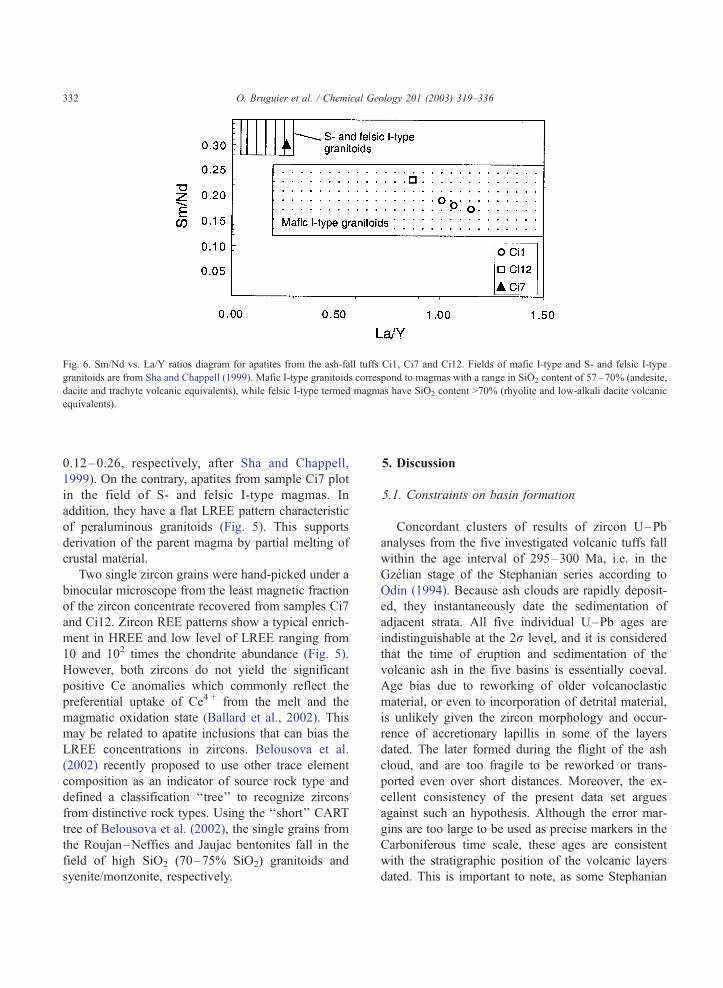
Fig. 6. Sm/Nd vs. La/Y ratios diagram for apatites from the ash-fall tuffs Ci1, Ci7 and Ci12. Fields of mafic I-type and S- and felsic I-type
granitoids are from Sha and Chappell (1999). Mafic I-type granitoids correspond to magmas with a range in SiO2 content of 57–70% (andesite,
dacite and trachyte volcanic equivalents), while felsic I-type termed magmas have SiO2 content >70% (rhyolite and low-alkali dacite volcanic
equivalents).
O. Bruguier et al. / Chemical Geology 201 (2003) 319–336332
0.12–0.26, respectively, after Sha and Chappell,
1999). On the contrary, apatites from sample Ci7 plot
in the field of S- and felsic I-type magmas. In
addition, they have a flat LREE pattern characteristic
of peraluminous granitoids (Fig. 5). This supports
derivation of the parent magma by partial melting of
crustal material.
Two single zircon grains were hand-picked under a
binocular microscope from the least magnetic fraction
of the zircon concentrate recovered from samples Ci7
and Ci12. Zircon REE patterns show a typical enrich-
ment in HREE and low level of LREE ranging from
10 and 102 times the chondrite abundance (Fig. 5).
However, both zircons do not yield the significant
positive Ce anomalies which commonly reflect the
preferential uptake of Ce4 + from the melt and the
magmatic oxidation state (Ballard et al., 2002). This
may be related to apatite inclusions that can bias the
LREE concentrations in zircons. Belousova et al.
(2002) recently proposed to use other trace element
composition as an indicator of source rock type and
defined a classification ‘‘tree’’ to recognize zircons
from distinctive rock types. Using the ‘‘short’’ CART
tree of Belousova et al. (2002), the single grains from
the Roujan–Neffies and Jaujac bentonites fall in the
field of high SiO2 (70–75% SiO2) granitoids and
syenite/monzonite, respectively.
5. Discussion
5.1. Constraints on basin formation
Concordant clusters of results of zircon U–Pb
analyses from the five investigated volcanic tuffs fall
within the age interval of 295–300 Ma, i.e. in the
Gzelian stage of the Stephanian series according to
Odin (1994). Because ash clouds are rapidly deposit-
ed, they instantaneously date the sedimentation of
adjacent strata. All five individual U–Pb ages are
indistinguishable at the 2r level, and it is considered
that the time of eruption and sedimentation of the
volcanic ash in the five basins is essentially coeval.
Age bias due to reworking of older volcanoclastic
material, or even to incorporation of detrital material,
is unlikely given the zircon morphology and occur-
rence of accretionary lapillis in some of the layers
dated. The later formed during the flight of the ash
cloud, and are too fragile to be reworked or trans-
ported even over short distances. Moreover, the ex-
cellent consistency of the present data set argues
against such an hypothesis. Although the error mar-
gins are too large to be used as precise markers in the
Carboniferous time scale, these ages are consistent
with the stratigraphic position of the volcanic layers
dated. This is important to note, as some Stephanian

O. Bruguier et al. / Chemical Geology 201 (2003) 319–336 333
basins in the FMC (Bruguier et al., 1998) and also
within other parts of the Variscan Belt (Schaltegger
and Corfu, 1995; Von Raumer, 1998) are clearly
successors of older basins, that indicate an earlier
phase of extensional tectonics. All spot analyses have
been combined (see Fig. 7) to give a weighted mean206Pb/238U age of 297.9F 2.1 Ma (95% confidence
level) which is interpreted as bracketing the range of
the Stephanian volcanic activity in the southern part of
the FMC. Further studies must reveal whether this is
real or rather an artifact due to the limited number of
samples studied. This 295–300 Ma time interval is in
good agreement with K–Ar dating of clay particles
from the Bosmoreau basin in the northwestern part of
the FMC which gave a mean deposition age of
296.5F 3.5 Ma (Bruguier et al., in press). This
similarity suggests that basin formation during the
Stephanian was synchronous through the entire FMC.
The upper Stephanian volcanic and basin forming
event in the FMC is contemporaneous with volcanic
events identified in other parts of the Variscan Belt
which yield ages broadly ranging from 295 to 300
Ma, although slightly older ages (300–305 Ma) have
been also obtained (see Schaltegger and Corfu, 1995;
Fig. 7. Frequency histogram showing the distribution of the 206Pb/238U
Breitkreuz and Kennedy, 1999; Koninger et al., 2002).
Since the different basins throughout the Variscan Belt
may have different geodynamic positions, they do not
need to be strictly contemporaneous but clustering of
ages in the 295–300 Ma time range suggests that this
period may be the climax of a short-lived pulse of
explosive volcanism close to the Carboniferous/Perm-
ian boundary.
5.2. Constraints on source material and origin of the
magmas
Inherited cores have been identified in some of the
sudied bentonites (see Fig. 3i and j) and are taken as
evidence for melting of crustal material involved in
magma genesis. Analyses indicate melting of a Pre-
cambrian basement (ca. 600, 2000 and 2400 Ma).
Although the age of the crust below the southern part
of the FMC and Montagne Noire is not known, the
Pan-African, Eburnean and Early Proterozoic/Late
Archean ages of these inherited components point to
a Gondwanan affinity (West African Craton) for deep-
seated basement components beneath the FMC. This
observation is in good agreement with studies of
ages of SIMS zircon analyses from the investigated ash-fall tuffs.
O. Bruguier et al. / Chemical Geology 201 (2003) 319–336334
lower-crustal granulitic xenoliths (Ben Othman et al.,
1984; Downes et al., 1990) from the FMC, as well as
from volcanic products from the Montagne Noire area
(Simien et al., 1999) which have Nd model ages
broadly ranging from 1.2 to 2.0 Ga. Remnants of
volcanic edifices do not exist to help establishing
regional correlations with possible source areas for
the volcanic ash and add geochemical constraints on
magma genesis. As most of the original volcanic
material has been altered, tuffs now consist predom-
inantly of clay minerals, and only phenocrysts of
accessory minerals resistant to alteration can be used
to shed some light on the source of the magmas. From
this standpoint, REE chemistry of zircons from a wide
variety of rock types gave remarkably similar results
(Hoskin and Ireland, 2000) and only a combination of
trace element abundances (Belousova et al., 2002)
indicates that zircon can be sensitive to its crystal-
lisation environment. The classification mentioned
above (Belousova et al., 2002) indicates that the two
single zircon grains from the Jaujac and Roujan–
Neffies basins crystallised from different types of
source magma (see Table 2) and shows that these
bentonites can be related to trachytic/andesitic and
rhyolitic volcanism, respectively.
Apatite has been shown to be sensitive to changes
in the concentrations of the REE during igneous
processes (Gromet and Silver, 1983) and can even
record the different stages of differentiation of one
single magma (Buhn et al., 2001). Apatites from the
upper Visean ash-fall tuff Ci1 sampled in the Bos-
moreau basin (Bruguier et al., 1998) have a chemical
signature indicating growth in a magma akin to those
producing mafic I-type granitoids and a likely dacitic
to trachytic affiliation. The most likely source could
then be found in the rhyodacitic to trachytic upper
Visean «tuffs anthraciferes» located ca. 60 km east of
the Bosmoreau basin in the Roanne area of the FMC
(Scott et al., 1984). Chemical composition of the
apatite concentrate from the Stephanian Jaujac basin
has a similar affiliation. This is supported both by the
REE pattern in Fig. 5 and by the inter-element
correlation diagram of Fig. 6. Combined with the
observation given by the zircons analyses, this sug-
gests for the volcanic ash layer Ci12 an origin of the
magma by partial melting of crustal units (including a
ca. 2.4 Ga source component) with a contribution of a
mantle-derived component to explain both the apatite
and zircon trace element signature. In contrast, apatite
from the Roujan–Neffies tuff has a flat LREE pattern
and plots in the field of S- and felsic I-type granitoids
suggesting a rhyolitic affiliation and magma genera-
tion mainly through anatexis of continental crust
again supported by the trace element signature of
the single zircon grain. Eruption can result from two
different processes, one of which is the injection of
mafic magmas from a deep source into a crustal
reservoir (Eichelberger, 1980). This represents a high
heat influx, a significant volume increment and can
generate vapor overpressure responsible for fractura-
tion and opening of a conduit. A second possible
mechanism is related to crystallisation in the mag-
matic reservoir which results in a volume expansion
and significant overpressure (Tait et al., 1989). In
addition, the remaining melts are more silicic and thus
more buoyant. Crystallisation alone can be responsi-
ble for some individual eruptions but, it is very
unlikely that, at orogenic belt scale, all crustal reser-
voirs had reached at the same time an overpressure
level driving magmas to the surface. The volcanic
activity prevailing at the end of the Carboniferous in
the whole Variscan Belt, on the contrary, pleads for
large-scale processes. The observed rhyolitic and
trachytic parentage of volcanic products from the
Roujan–Neffies and Jaujac basins, respectively, is
consistent with injection of mafic magmas which,
while adding heat to an already thickened crust,
may have triggered eruptions. This is broadly similar
to the South Bohemian Massif and Central Iberian
Zone, wherein granitoids emplaced at ca. 305 Ma
have characteristics pointing to a genesis by melting
of the lower crust with varying degrees of involve-
ment of a mantle component (see references in Gerdes
et al., 2000; Fernandez-Suarez et al., 2000, respec-
tively). Involvement of mantle sources does not rule
out a model of crustal anatexis by accumulation of
radioactive heat as proposed by Gerdes et al. (2000),
but simply provides extra heat to an already hot and
softened continental crust. This can explain both the
long-lived Carboniferous magmatic activity (see re-
view of ages in Ledru et al., 1994 for the FMC) and
episodicity of volcanic pulses at orogenic belt scale.
Lithospheric delamination has been invoked to ex-
plain the origin of these pulses (Pin and Duthou,
1990; Schaltegger, 1997; Fernandez-Suarez et al.,
2000) but is a long-lived phenomenon with a charac-
O. Bruguier et al. / Chemical Geology 201 (2003) 319–336 335
teristic wavelength of ca. 60 Ma (Nelson, 1992). The
Stephanian volcanic flare-up requires an additional
phenomenon which may tentatively be found in large
strike-slip faults cutting accross Central Europe and
Northern Africa (Bard, 1997). These faults are asso-
ciated with the Late Carboniferous–Early Permian
clockwise rotation of Gondwana (Matte, 2001) and
may have intersected parts of the sinking slab. As a
result of slab break-off, it is expected that the orogen
uplifted and extended due to gravitational instabil-
ities. Since the lower crust was hot and already
softened by about 30 Ma of heat advection and/or
production, it was able to flow rapidly. Mechanical
extension was thus predominant over erosion as
suggested by the preservation of the Stephanian intra-
montane basins.
Acknowledgements
Samples were collected by the two first authors
during the course of the GeoFrance3D program and
was supported by the BRGM. Preparation of the
mounts were performed by Christophe Nevado from
the «Service Commun de Litholamellage» and SEM
imaging by Claude Grill from the «Service Commun
de Microscopie Electronique» from the University of
Montpellier II. We thank J. Fernandez-Suarez, R.
Rudnick and U. Schaltegger for helpful and con-
structive reviews. [RR]
References
Ballard, J.R., Palin, J.M., Campbell, I.H., 2002. Relative oxidation
states of magmas inferred from Ce(IV)/Ce(III) in zircon: appli-
cation to porphyry copper deposits of northern Chile. Contrib.
Mineral. Petrol. 144, 347–364.
Bard, J.P., 1997. Demembrement ante-mesozoique de la chaıne
varisque d’Europe Occidentale et d’Afrique du Nord: role es-
sentiel des grands decrochements transpressifs dextres accom-
pagnant la rotation-translation horaire de l’Afrique durant le
stephanien. C. R. Acad. Sci. Paris 324, 693–704.
Becq-Giraudon, J.F., Montenat, C., Van den Driessche, J., 1996.
Hercynian high-altitude phenomena in the French Massif Cen-
tral: tectonic implications. Palaeogeogr. Palaeoclimatol. Palae-
oecol. 122, 227–241.
Belousova, E.A., Griffin, W.L., O’Reilly, S.Y., Fisher, N.I., 2002.
Igneous zircon: trace element composition as an indicator of
source rock type. Contrib. Mineral. Petrol. 143, 602–622.
Benisek, A., Finger, F., 1993. Factors controlling the development
of prism faces in granite zircons: a microprobe study. Contrib.
Mineral. Petrol. 114, 441–451.
Ben Othman, D., Polve, M., Allegre, C.J., 1984. Nd–Sr isotopic
composition of granulites and constraints on the evolution of the
lower continental crust. Nature 307, 510–515.
Bosch, D., Bruguier, O., Pidgeon, R.T., 1996. The evolution of an
ArchaeanMetamorphic Belt: a conventional and SHRIMPU–Pb
study of accessory minerals from the Jimperding Metamorphic
Belt, Yilgarn Craton, Western Australia. J. Geol. 104, 695–711.
Bouroz, A., 1966. Frequence des manifestations volcaniques au
Carbonifere superieur en France. C. R. Acad. Paris 263,
1025–1028.
Breitkreuz, C., Kennedy, A., 1999. Magmatic flare-up at the Car-
boniferous/Permian boundary in the NE German Basin revealed
by SHRIMP zircon ages. Tectonophysics 302, 307–326.
Bruguier, O., Lancelot, J.R., Malavieille, J., 1997. U–Pb dating on
single detrital zircon grains from the Triassic Songpan–Ganze
flysch (Central China)—provenance and tectonic correlations.
Earth Planet. Sci. Lett. 152, 217–231.
Bruguier, O., Becq-Giraudon, J.F., Bosch, D., Lancelot, J.R., 1998.
Late Visean hidden basins in the French Massif Central. U–Pb
zircon evidence. Geology 26, 627–630.
Bruguier, O., Becq-Giraudon, J.F., Clauer, N., Maluski, H., 2003.
From late Visean to Stephanian: pinpointing a two stage basinal
evolution in the Variscan belt. A case study from the Bosmoreau
basin (French Massif Central) and its geodynamical implication.
Int. J. Earth Sci. 92, 338–347.
Buhn, B., Wall, F., Le Bas, M.J., 2001. Rare-earth element system-
atics of carbonatitic fluoroapatites, and their significance for
carbonatite magma evolution. Contrib. Mineral. Petrol. 141,
572–591.
Deloule, E., Chaussidon, M., Glass, B.P., Koeberl, C., 2001. U–Pb
isotopic study of relict zircon inclusions recovered from Muong
Nong-type tektites. Geochim. Cosmochim. Acta 65, 1833–1838.
Downes, H., Dupuy, C., Leyreloup, A.F., 1990. Crustal evolution of
the Hercynian Belt of Western Europe: evidence from lower-
crustal granulitic xenoliths (French Massif Central). Chem.
Geol. 83, 209–231.
Eichelberger, J.C., 1980. Vesiculation of mafic magma during re-
plenishment of silicic reservoirs. Nature 288, 446–450.
Faure, M., 1995. Late orogenic carboniferous extensions in the
Variscan French Massif Central. Tectonics 14, 132–153.
Fernandez-Suarez, J., Dunning, G.R., Jenner, G.A., Gutierrez-
Alonso, G., 2000. Variscan collisional magmatism and deforma-
tion in NW Iberia: constraints from U–Pb geochronology of gra-
nitoids. J. Geol. Soc. (Lond.) 157, 565–576.
Gerdes, A., Worner, G., Henk, A., 2000. Post-collisional granite
generation and HT-LP metamorphism by radiogenic heating:
the Variscan South Bohemian Batholith. J. Geol. Soc. (Lond.)
157, 577–587.
Gromet, L.P., Silver, L.T., 1983. Rare earth element distributions
among minerals in a granodiorite and their petrogenetic impli-
cations. Geochim. Cosmochim. Acta 47, 925–939.
Hoffmann, J.F., Long, J.V.P., 1984. Unusual sector zoning in Lewi-
sian zircons. Mineral. Mag. 48, 513–517.
Hoskin, P.W.O., Ireland, T.R., 2000. Rare earth element chemistry

O. Bruguier et al. / Chemical Geology 201 (2003) 319–336336
of zircon and its use as a provenance indicator. Geology 28,
627–630.
Ionov, D.A., Savoyant, L., Dupuy, C., 1992. Application of the
ICP-MS technique to trace element analysis of peridotites and
their minerals. Geostand. Newsl. 16, 311–315.
Jochum, K.P., Seufert, H.M., Thirlwall, M.F., 1990. High-sensitiv-
ity Nb analysis by spark-source mass spectrometry (SSMS) and
calibration of XRF Nb and Zr. Chem. Geol. 81, 1–16.
Koninger, S., Lorenz, V., Stolhofen, H., Armstrong, R.A., 2002.
Origin, age and stratigraphic significance of distal fallout ash
tuffs from the Carboniferous–Permian continental Saar–Nahe
basin (SW Germany). Int. J. Earth Sci. 91, 341–356.
Ledru, P., Costa, S., Echtler, H., 1994. Structures in the Massif
Central. In: Keppie, J.D. (Ed.), Pre-Mesozoic Geology in France
and Related Areas. Springer-Verlag, Berlin, pp. 305–323.
Ludwig, K.R., 1999. Users manual for ISOPLOT/EX version 2. A
geochronological toolkit for Microsoft Excel. Berkeley Geo-
chronology Center, Spec. Pub. 1a.
Matte, P., 1986. Tectonics and plate tectonics model for the Varis-
can belt of Europe. Tectonophysics 126, 329–374.
Matte, P., 2001. The Variscan collage and orogeny (480–290 Ma)
and the tectonic definition of the Armorica microplate: a review.
Terra Nova 13, 122–128.
McDonough, W.F., Sun, S.S., 1995. The composition of the Earth.
Chem. Geol. 120, 223–253.
Nelson, K.D., 1992. Are crustal thickness variations in old moun-
tain belts like the Appalachians a consequence of lithospheric
delamination? Geology 20, 498–502.
Odin, G.S., 1994. Geological time scale. C. R. Acad. Sci. Paris 312,
59–71.
Parrish, R.R., 1987. An improved micro-capsule for zircon disso-
lution in U–Pb geochronology. Chem. Geol. 66, 99–102.
Pin, C., Duthou, J.L., 1990. Sources of Hercynian granitoids from
the French Massif Central: inferences from Nd isotopes and
consequences for crustal evolution. Chem. Geol. 83, 281–296.
Pupin, J.P., 1976. Signification des caracteres morphologiques du
zircon commun des roches en petrologie. Base de la methode
typologique et applications. PhD Thesis, University of Nice
(France). 394 pp.
Ratschbacher, L., Frisch, W., Neubauer, F., Schmid, S.M., Neuge-
bauer, J., 1989. Extension in compressional orogenic belts: the
eastern Alps. Geology 17, 404–407.
Schaltegger, U., 1997. Magma pulses in the Central Variscan Belt:
episodic melt generation and emplacement during lithospheric
thinning. Terra Nova 9, 242–245.
Schaltegger, U., Corfu, F., 1995. Late Variscan ‘Basin and Range’
magmatism and tectonics in the Central Alps: evidence from
U–Pb geochronology. Geodin. Acta 8, 82–98.
Scott, A.C., Galtier, J., Clayton, G., 1984. Distribution of anatom-
ically-preserved floras in the lower carboniferous in Western
Europe. Trans. R. Soc. Edinb. 75, 311–340.
Sha, L.K., Chappell, B.W., 1999. Apatite chemical composition
determined by electron microprobe and laser ablation induc-
tively coupled plasma mass spectrometry as a probe into granite
petrogenesis. Geochim. Cosmochim. Acta 63, 3861–3881.
Simien, F., Mattauer, M., Allegre, C.J., 1999. Nd isotopes in the
stratigraphic record of the Montagne Noire (French Massif Cen-
tral): no significant Paleozoic juvenile inputs, and pre-Hercynian
paleogeography. J. Geol., 107, 87–97.
Stacey, J.S., Kramers, J.D., 1975. Approximation of terrestrial lead
isotope evolution by a two stage model. Earth Planet. Sci. Lett.
6, 15–25.
Steiger, R.H., Jager, E., 1977. Subcommission on geochronology:
convention on the use of decay constants in geo and cosmo-
chronology. Earth Planet. Sci. Lett. 36, 359–362.
Tait, S., Jaupart, C., Vergniolle, S., 1989. Pressure, gas content and
eruption periodicity of a shallow crystallizing magma chamber.
Earth Planet. Sci. Lett. 92, 107–123.
Vavra, G., 1990. On the kinematics of zircon growth and its petro-
genetic significance: a cathodoluminescence study. Contrib.
Mineral. Petrol. 106, 90–99.
Von Raumer, J.F., 1998. The Palaeozoic evolution in the Alps: from
Gondwana to Pangea. Int. J. Earth Sci. 87, 407–435.
Watson, E.B., Harrison, T.M., 1983. Zircon saturation revisited:
temperature and composition effects in a variety of crustal mag-
ma types. Earth Planet. Sci. Lett. 64, 295–304.
Watson, E.B., Liang, Y., 1995. A simple model for sector zoning in
slowly grown crystals: implications for growth rate and lattice
diffusion, with emphasis on accessory minerals in crustal rocks.
Am. Mineral. 80, 1179–1187.
Wiedenbeck, M., Alle, P., Corfu, F., Griffin, W.L., Meier, M., Oberli,
F., Von Quadt, A., Roddick, J.C., Spiegel, W., 1995. Three nat-
ural zircon standards for U–Th–Pb, Lu–Hf, trace element and
REE analyses. Geostand. Newsl. 19, 1–23.
Williams, I.S., Claesson, S., 1987. Isotopic evidence for the Pre-
cambrian provenance and Caledonian metamorphism of high
grade paragneiss from the Seve Nappes, Scandinavian Caledo-
nides. Contrib. Mineral. Petrol. 97, 205–217.
Zipfel, J., Palme, H., Kennedy, A.K., Hutcheon, I.D., 1995. Chem-
ical composition and origin of the Acapulco meteorite. Geo-
chim. Cosmochim. Acta 59, 3607–3627.
Zoback, M.D., Stephenson, R.A., Cloething, S., Larsen, B.T., Van
Horn, B., Robinson, A., Horvath, F., Puigdefabregas, C., Ben
Avraham, Z., 1993. Stresses in the lithosphere and sedimentary
basin formation. Tectonophysics 226, 1–13.

A two-stage exhumation of the Variscan crust: U–Pb LA-ICP-MSand Rb–Sr ages from Greater Kabylia, Maghrebides
D. Hammor,1,2 D. Bosch,2 R. Caby2 and O. Bruguier3
1Universite Badji-Mokhtar, BP12, El-Hadjar, Annaba 23 000, Algeria; 2Laboratoire de Tectonophysique, Universite de Montpellier II, Place
Eugene Bataillon, 34 095 Montpellier Cedex 5, France; 3Service ICP-MS, Universite de Montpellier II, Place Eugene Bataillon, 34 095
Montpellier Cedex 5, France
Introduction
The Maghrebides are part of the peri-Mediterranean belt of late Tertiaryage that delimits the African and theEuropean plates and runs from theBetico-Rifan arc to Calabria (Fig. 1a,inset). Classical interpretations (e.g.Ricou, 1994) consider that theyformed during the 40–25 Ma timespan as a result of underthrusting ofthe North African margin beneath theAlboran plate (Betic-Rif-Kabylies).The inner zones of the Maghrebidesare represented by the Kabylies,mainly formed by inliers of crystallinerocks surrounded by Oligo-Mioceneand younger Miocene sediments. Pre-Oligocene reconstructions locate theKabylies at ‡700 km NNW from theirpresent-day location, along with theircounterparts in the Betico-Rifan arcand Calabria-Sicily (Lonergan andWhite, 1997; Gueguen et al., 1998).Classical ideas considered that the
Kabylies underwent only slight Alpineoverprint (e.g. Peucat et al., 1996).However, 40Ar/39Ar ages of high-tem-perature minerals obtained in GreaterKabylia (Monie et al., 1988) and Rb/Sr Alpine ages of biotites in Lesser
Kabylia (Peucat et al., 1996) suggestthat Alpine events were not negligiblein the Kabylian basement units. Inthis study, we present LA-ICP-MSU–Pb results from monazites and Rb–Sr analyses from biotites extractedfrom a major high-temperature crustalshear zone from Greater Kabylia.This study was undertaken in orderto give time constraints on the mainhigh-temperature shearing event thataffected the crystalline rocks of theKabylian basement and on its possiblereactivation during subsequent events,which has implications for unravellingthe tectonometamorphic evolutionthrough time of this part of the peri-Mediterranean fold belt.
Geological setting
Greater Kabylia comprises three ma-jor domains: Central Greater Kabylia(CGK), Eastern Greater Kabylia(EGK) and the Sidi Ali Bou Nab(SABN) domain (Saadallah andCaby, 1996) (Fig. 1a,b). In CGK, theKabylian Detachment Fault is amajor low-angle ductile to cataclasticextensional shear zone that sharplydelimits a lower unit of amphibolitefacies rocks below, from overlyinggreenschist facies phyllites with 295–315 Ma 40Ar/39Ar mineral ages (Mon-ie et al., 1988) and non-metamorphicfossiliferous Palaeozoic sediments.This upper unit, free of Alpine ductiledeformation, is unconformably over-
lain by the Mesozoic to Tertiarysedimentary cover of the CalcareousRange capped by allochthonousKabylian flyschs. The lower unit,exposed in two half domes, comprisesa continuous tectonic pile, 6–8 kmthick, of orthogneisses, paragneisses,marbles and micaschists affected byhigh-temperature syn-metamorphicductile deformation and yielding40Ar/39Ar ages bracketed between 80and 120 Ma (Monie et al., 1988). TheSABN unit that is dealt with thisstudy exposes another tectono-meta-morphic pile showing a normal meta-morphic polarity with downwardpressure and temperature increase. Itis in tectonic contact with the Naceriadiatexites in the north. The SABNgranite has been dated by the U–Pbzircon conventional method at284 ± 3 Ma (Peucat et al., 1996). Itdisplays a low-pressure thermal au-reole (biotite, andalusite, cordierite,K-feldspar, corundum) formed at£3 kbar pressure. Hornfelses wereprogressively sheared downwards andaffected by a distinct synkinematicmetamorphic overprint portrayed bythe replacement of andalusite bystaurolite and kyanite. This metamor-phic field gradient indicates tempera-ture and pressure increase downward.The deepest rocks exposed onthe southern flank of the SABNridge below a north-dipping band ofhigh-temperature ultramylonites com-prise slightly anatectic metapelites,
ABSTRACT
The significance and role of major shear zones are paramount tounderstanding continental deformation and the exhumation ofdeep crustal levels. LA-ICPMS U–Pb dating of monazites,combined with Rb–Sr analyses of biotites, from an anatecticmetapelite from Greater Kabylia (Algeria) highlights the historyof shear zone development and the subsequent exhumation ofdeep crustal levels in the internal zones of the Maghrebides.Monazites give an age of 275.4 ± 4.1 Ma (2r) dating thethermal peak coeval with anatexis. This age is identical to thoserecorded in other crystalline terranes from south-easternmost
Europe (i.e. South Alpine and Austro-Alpine domains) thatsuffered crustal thinning during the continental rifting predat-ing the Tethys opening. Rb–Sr analyses of biotites yield acooling age of 23.7 ± 1.1 Ma related to the exhumation of theburied Variscan crust during the Miocene as an extrusive slice,roughly coeval with the emplacement of nappes, and shortlyfollowed by lithospheric extension leading to the opening ofthe Alboran sea.
Terra Nova, 18, 299–307, 2006
Correspondence: Delphine Bosch, Labora-
toire de Tectonophysique, Universite de
Montpellier II, Place Eugene Bataillon,
34095 Montpellier Cedex 5, France. Tel.:
+33 4 67 14 32 67; fax: +33 4 67 14 36 03;
e-mail: [email protected]
� 2006 Blackwell Publishing Ltd 299
doi: 10.1111/j.1365-3121.2006.00693.x
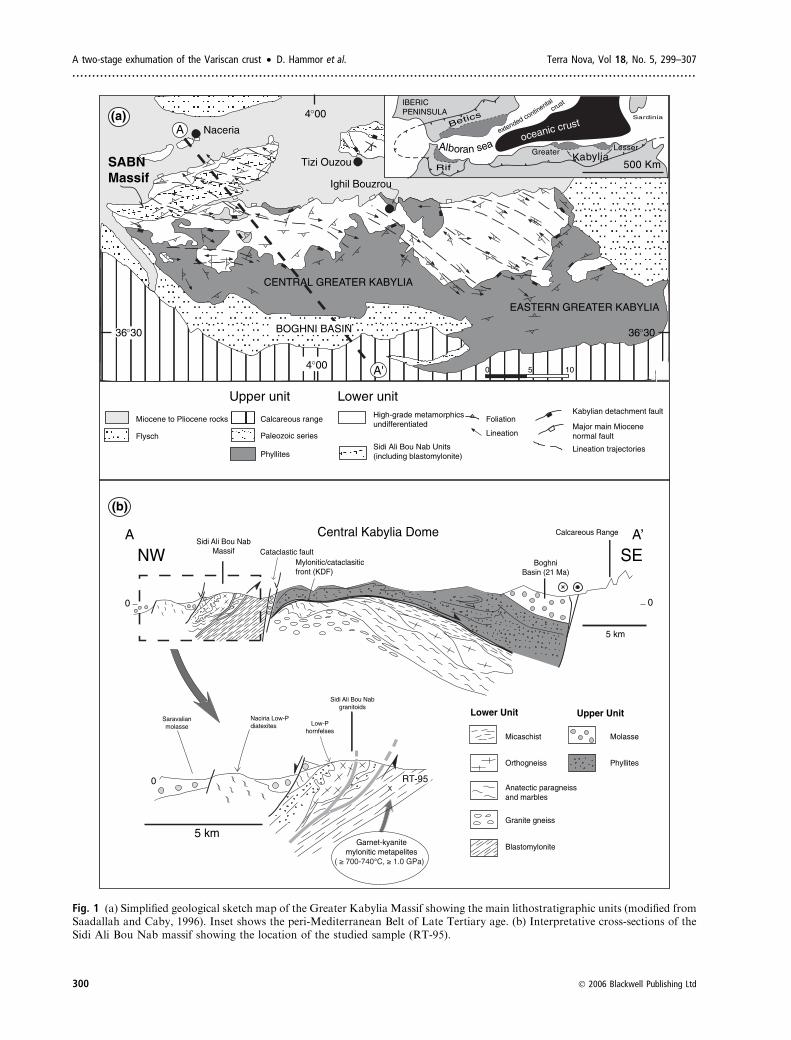
0
SEMylonitic/cataclasiticfront (KDF)
Cataclastic fault
5 km
Calcareous Range
BoghniBasin (21 Ma)
Sidi Ali Bou NabMassif
Central Kabylia Dome
NW
0
5 km
Naciria Low-Pdiatexites
Garnet-kyanitemylonitic metapelites
Sidi Ali Bou Nabgranitoids
Saravalianmolasse Low-P
hornfelses
RT-95
Lower Unit Upper Unit
Micaschist
Orthogneiss
Anatectic paragneissand marbles
Granite gneiss
Molasse
Phyllites
Blastomylonite
0
CENTRAL GREATER KABYLIA
Miocene to Pliocene rocks
Flysch
Calcareous range
Paleozoic series
Phyllites
High-grade metamorphicsundifferentiated
Sidi Ali Bou Nab Units(including blastomylonite)
Foliation
Lineation
Kabylian detachment fault
Major main Miocenenormal fault
Lineation trajectories
Upper unit
EASTERN GREATER KABYLIA
36 30
0 5 10
A
Lower unit
Ighil Bouzrou
Tizi Ouzou
Naceria
4 00
A'
BOGHNI BASIN
4 00
SABNMassif
36 30
oceanic crust
500 Km
Alboran sea
Betics
Kabylia
extended continental
crustIBERICPENINSULA
Rif
Sardinia
Greater Lesser
A A’
(a)
(b)
Fig. 1 (a) Simplified geological sketch map of the Greater Kabylia Massif showing the main lithostratigraphic units (modified fromSaadallah and Caby, 1996). Inset shows the peri-Mediterranean Belt of Late Tertiary age. (b) Interpretative cross-sections of theSidi Ali Bou Nab massif showing the location of the studied sample (RT-95).
A two-stage exhumation of the Variscan crust • D. Hammor et al. Terra Nova, Vol 18, No. 5, 299–307
.............................................................................................................................................................
300 � 2006 Blackwell Publishing Ltd
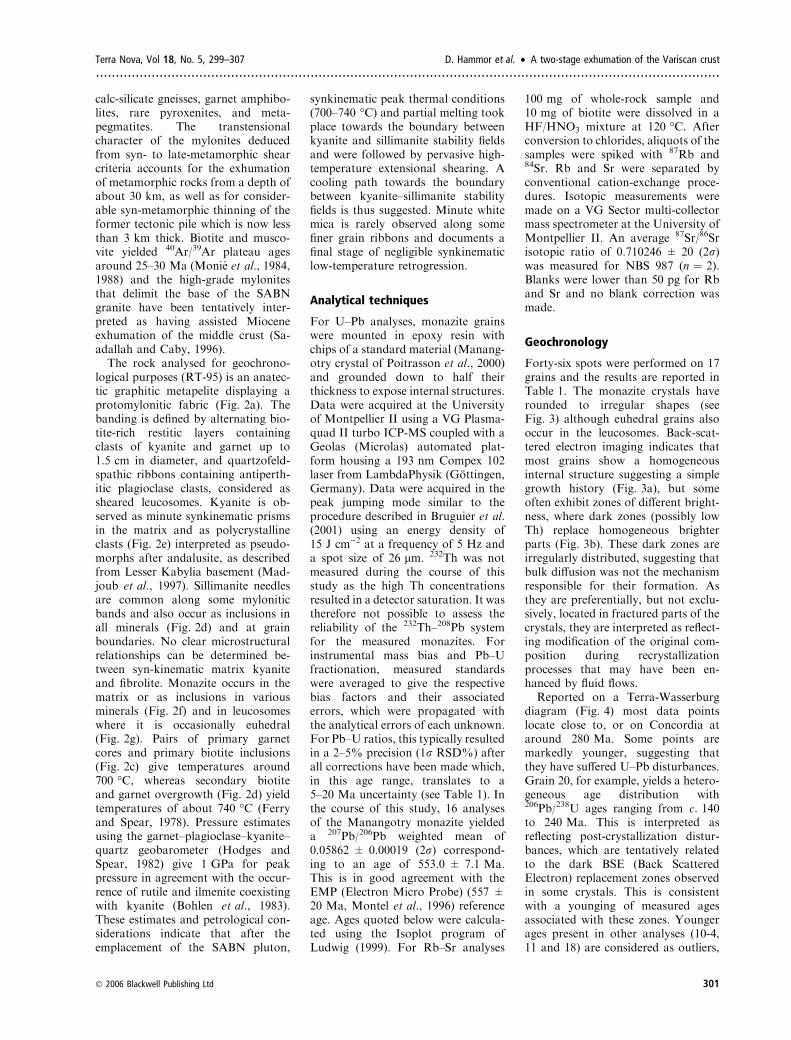
calc-silicate gneisses, garnet amphibo-lites, rare pyroxenites, and meta-pegmatites. The transtensionalcharacter of the mylonites deducedfrom syn- to late-metamorphic shearcriteria accounts for the exhumationof metamorphic rocks from a depth ofabout 30 km, as well as for consider-able syn-metamorphic thinning of theformer tectonic pile which is now lessthan 3 km thick. Biotite and musco-vite yielded 40Ar/39Ar plateau agesaround 25–30 Ma (Monie et al., 1984,1988) and the high-grade mylonitesthat delimit the base of the SABNgranite have been tentatively inter-preted as having assisted Mioceneexhumation of the middle crust (Sa-adallah and Caby, 1996).The rock analysed for geochrono-
logical purposes (RT-95) is an anatec-tic graphitic metapelite displaying aprotomylonitic fabric (Fig. 2a). Thebanding is defined by alternating bio-tite-rich restitic layers containingclasts of kyanite and garnet up to1.5 cm in diameter, and quartzofeld-spathic ribbons containing antiperth-itic plagioclase clasts, considered assheared leucosomes. Kyanite is ob-served as minute synkinematic prismsin the matrix and as polycrystallineclasts (Fig. 2e) interpreted as pseudo-morphs after andalusite, as describedfrom Lesser Kabylia basement (Mad-joub et al., 1997). Sillimanite needlesare common along some myloniticbands and also occur as inclusions inall minerals (Fig. 2d) and at grainboundaries. No clear microstructuralrelationships can be determined be-tween syn-kinematic matrix kyaniteand fibrolite. Monazite occurs in thematrix or as inclusions in variousminerals (Fig. 2f) and in leucosomeswhere it is occasionally euhedral(Fig. 2g). Pairs of primary garnetcores and primary biotite inclusions(Fig. 2c) give temperatures around700 �C, whereas secondary biotiteand garnet overgrowth (Fig. 2d) yieldtemperatures of about 740 �C (Ferryand Spear, 1978). Pressure estimatesusing the garnet–plagioclase–kyanite–quartz geobarometer (Hodges andSpear, 1982) give 1 GPa for peakpressure in agreement with the occur-rence of rutile and ilmenite coexistingwith kyanite (Bohlen et al., 1983).These estimates and petrological con-siderations indicate that after theemplacement of the SABN pluton,
synkinematic peak thermal conditions(700–740 �C) and partial melting tookplace towards the boundary betweenkyanite and sillimanite stability fieldsand were followed by pervasive high-temperature extensional shearing. Acooling path towards the boundarybetween kyanite–sillimanite stabilityfields is thus suggested. Minute whitemica is rarely observed along somefiner grain ribbons and documents afinal stage of negligible synkinematiclow-temperature retrogression.
Analytical techniques
For U–Pb analyses, monazite grainswere mounted in epoxy resin withchips of a standard material (Manang-otry crystal of Poitrasson et al., 2000)and grounded down to half theirthickness to expose internal structures.Data were acquired at the Universityof Montpellier II using a VG Plasma-quad II turbo ICP-MS coupled with aGeolas (Microlas) automated plat-form housing a 193 nm Compex 102laser from LambdaPhysik (Gottingen,Germany). Data were acquired in thepeak jumping mode similar to theprocedure described in Bruguier et al.(2001) using an energy density of15 J cm)2 at a frequency of 5 Hz anda spot size of 26 lm. 232Th was notmeasured during the course of thisstudy as the high Th concentrationsresulted in a detector saturation. It wastherefore not possible to assess thereliability of the 232Th–208Pb systemfor the measured monazites. Forinstrumental mass bias and Pb–Ufractionation, measured standardswere averaged to give the respectivebias factors and their associatederrors, which were propagated withthe analytical errors of each unknown.For Pb–U ratios, this typically resultedin a 2–5% precision (1r RSD%) afterall corrections have been made which,in this age range, translates to a5–20 Ma uncertainty (see Table 1). Inthe course of this study, 16 analysesof the Manangotry monazite yieldeda 207Pb/206Pb weighted mean of0.05862 ± 0.00019 (2r) correspond-ing to an age of 553.0 ± 7.1 Ma.This is in good agreement with theEMP (Electron Micro Probe) (557 ±20 Ma, Montel et al., 1996) referenceage. Ages quoted below were calcula-ted using the Isoplot program ofLudwig (1999). For Rb–Sr analyses
100 mg of whole-rock sample and10 mg of biotite were dissolved in aHF/HNO3 mixture at 120 �C. Afterconversion to chlorides, aliquots of thesamples were spiked with 87Rb and84Sr. Rb and Sr were separated byconventional cation-exchange proce-dures. Isotopic measurements weremade on a VG Sector multi-collectormass spectrometer at the University ofMontpellier II. An average 87Sr/86Srisotopic ratio of 0.710246 ± 20 (2r)was measured for NBS 987 (n ¼ 2).Blanks were lower than 50 pg for Rband Sr and no blank correction wasmade.
Geochronology
Forty-six spots were performed on 17grains and the results are reported inTable 1. The monazite crystals haverounded to irregular shapes (seeFig. 3) although euhedral grains alsooccur in the leucosomes. Back-scat-tered electron imaging indicates thatmost grains show a homogeneousinternal structure suggesting a simplegrowth history (Fig. 3a), but someoften exhibit zones of different bright-ness, where dark zones (possibly lowTh) replace homogeneous brighterparts (Fig. 3b). These dark zones areirregularly distributed, suggesting thatbulk diffusion was not the mechanismresponsible for their formation. Asthey are preferentially, but not exclu-sively, located in fractured parts of thecrystals, they are interpreted as reflect-ing modification of the original com-position during recrystallizationprocesses that may have been en-hanced by fluid flows.Reported on a Terra-Wasserburg
diagram (Fig. 4) most data pointslocate close to, or on Concordia ataround 280 Ma. Some points aremarkedly younger, suggesting thatthey have suffered U–Pb disturbances.Grain 20, for example, yields a hetero-geneous age distribution with206Pb/238U ages ranging from c. 140to 240 Ma. This is interpreted asreflecting post-crystallization distur-bances, which are tentatively relatedto the dark BSE (Back ScatteredElectron) replacement zones observedin some crystals. This is consistentwith a younging of measured agesassociated with these zones. Youngerages present in other analyses (10-4,11 and 18) are considered as outliers,
Terra Nova, Vol 18, No. 5, 299–307 D. Hammor et al. • A two-stage exhumation of the Variscan crust
.............................................................................................................................................................
� 2006 Blackwell Publishing Ltd 301

Pl
Pl
Mnz
Mnz
Qtz
Qtz
Qtz
Qtz
Qtz
Bt
Grt1
Grt2
Grt2
Grt
Grt
Ky
Ky
Ky
Ky
Ky
Bt1
Bt2
Sil
Bt1
Mnz
BtBtBt
MnzKy
Ky
BtBt
Ky
Bt2
(a)
(c)
(e)
(b)
(d)
(f)
(g)
1 mm
1 mm
0.2 mm
0.25 mm
0.5 mm
0.2 mm0.2 mm
Bt1
Grt
A two-stage exhumation of the Variscan crust • D. Hammor et al. Terra Nova, Vol 18, No. 5, 299–307
.............................................................................................................................................................
302 � 2006 Blackwell Publishing Ltd

Table 1 U–Pb LA-ICP-MS results for monazites from the RT-95 metapelite (SABN massif, Greater Kabylia, Algeria).
Sample no. 208Pb/206Pb 238U/206Pb ± (1r) 207Pb/206Pb ± (1r)
Apparent ages (Ma)
206Pb/238U ± (1r)
2 7.4 22.74 0.94 0.0683 0.0053 277 11
3 3.76 22.87 0.62 0.0516 0.0008 276 7
6 7.45 22.41 1.11 0.0508 0.0016 281 14
6-2 8.75 22.53 0.63 0.0542 0.0016 280 8
6-3 4.41 23.42 1.46 0.052 0.0002 270 16
6-4 8.09 22.33 0.74 0.0574 0.0028 282 9
6-5 6.84 21.28 0.63 0.0544 0.0007 296 9
7 3.16 23.58 1.36 0.0531 0.0004 268 15
7-2 3.34 23.84 1.05 0.0606 0.0018 265 11
7-3 3.12 21.42 1.48 0.0702 0.0023 294 20
8 1.32 24.09 1.14 0.0497 0.0004 262 12
8-2 3.36 22.03 1.48 0.0494 0.0001 286 19
8-3 2.96 22.97 1.16 0.0517 0.0011 275 14
8-4 1.38 24.88 1.03 0.0517 0.0008 254 10
8-5 3.76 23.37 0.66 0.052 0.0019 270 7
9 3.32 20.86 0.92 0.0504 0.0013 302 13
9-2 4.05 25.5 1.27 0.051 0.0009 248 12
9-4 3.58 24.21 1.15 0.051 0.0007 261 12
10 2.49 24.34 1.45 0.051 0.0008 260 15
10-2 1.5 24.38 1.32 0.0517 0.0007 259 14
10-3 4.8 24.07 1.04 0.0501 0.0008 262 11
10-4* 8.22 26.62 0.39 0.0505 0.0023 238 3
11* 5.69 26.66 0.86 0.0576 0.003 237 7
11-2 7.1 22.35 0.96 0.0593 0.004 282 12
11-3 7.14 23.82 0.73 0.0541 0.0026 265 8
12 5.95 22.92 0.7 0.0562 0.0015 275 8
12-2 2.75 22.82 1.24 0.0533 0.0006 276 15
13 1.65 23.75 1.19 0.0511 0.0006 266 13
13-2 2.3 23.66 1.14 0.0501 0.0013 267 13
14 2.39 21.65 0.77 0.0492 0.0016 291 10
14-2 3.81 22.15 0.9 0.0491 0.0008 285 11
15 3.5 21.32 0.74 0.0506 0.0004 295 10
15-2 2.32 23.12 0.95 0.053 0.0016 273 11
15-3 2.6 21.48 1.11 0.0506 0.0009 293 15
16 8.89 24.85 1.17 0.0562 0.0038 254 12
16-2 11.71 21.38 1.06 0.068 0.0063 295 14
17 3.81 22.34 0.54 0.0516 0.0009 282 7
17-2 2.53 21.57 0.85 0.0519 0.0009 292 11
17-3 2.69 22.24 1.02 0.0513 0.0012 283 13
18* 3.3 26.24 0.42 0.0608 0.0024 241 4
18-2 2.07 24.43 1.24 0.0573 0.0017 259 13
19 4.72 23.15 1.66 0.0527 0.0014 273 19
19-2 3.87 23.87 1.03 0.054 0.0007 265 11
20* 2.15 44.95 3.93 0.0625 0.0019 142 12
20-2* 2.2 37.29 3.8 0.0568 0.0018 171 17
20-3* 2.85 26.84 2.19 0.0543 0.0016 236 19
*Spot analyses excluded from the age calculation.
Fig. 2 Photomicrographs from the RT-95 sample (symbols of minerals after Kretz, 1983). (a) General aspect of the analysedsample formed by alternating quartz-plagioclase bands and biotite-rich ribbons in which garnet clasts are enclosed. Note thebiotite wings from garnet and the monazite grain in matrix. The lower part of the photograph includes thin biotite ribbons andseveral fresh clasts of polycrystalline kyanite. (b) Xenomorphic monazite in a quartz-plagioclase band and clasts of polycrystallinekyanite. (c) Garnet clast with biotite inclusions adjacent to polycrystalline clasts of plagioclase and kyanite. (d) Garnet displayingtwo stages of growth. The core (Grt1) contains biotite (Bt1) and sillimanite (Sil) inclusions. It is rimmed by a garnet overgrowthrich in kyanite inclusions and displays an external coronitic overgrowth (Grt2) in textural equilibrium with the biotite of thematrix. (e) Polycrystalline kyanite pseudomorph after possible andalusite. (f) Large biotite clast including a monazite grain set upin a fine-grained matrix of biotite 2 and minute acicular kyanite. (g) Euhedral monazite grain in leucosome.
Terra Nova, Vol 18, No. 5, 299–307 D. Hammor et al. • A two-stage exhumation of the Variscan crust
.............................................................................................................................................................
� 2006 Blackwell Publishing Ltd 303

not included in the age calculation.The remaining analyses yield a206Pb/238U weighted mean age of275.4 ± 4.1 Ma (MSWD, meansquare of weighted deviates ¼ 1.4)and fall on a mixing line between thecalculated age and the common leadcomposition estimated from Staceyand Kramers (1975). This is taken asour best estimate for the age of themain monazite growth event. In orderto characterize the low temperatureevolution of the studied sample, Rb–Sr analyses were performed (Table 2).In the Rb–Sr isochron diagram(Fig. 5), the biotite fraction and thewhole rock yielded an early Mioceneage of 23.7 ± 1.1 Ma, identical to Ar/Ar biotite ages (Monie et al., 1984,1988) obtained on rocks from otherlithologies of the SABN massif.
Discussion
The 275.4 ± 4.1 Ma monazite age isc. 10 Ma younger than, but broadlysimilar to the maximum age ofemplacement (284 ± 3 Ma) of theSABN granite (Peucat et al., 1996).According to its microstructural sites,it is likely that monazite formed dur-ing prograde metamorphism throughmetamorphic reactions consumingprecursor minerals such as apatite,xenotime or allanite (e.g. Smith andBarreiro, 1990) and continued underanatectic conditions, as euhedral crys-tals are observed only in leucosomes(Fig. 2g). Peak metamorphic temper-atures (700–740 �C at about 1 GPa)are similar to the classically acceptedclosure temperature for Pb in monaz-ite (Copeland et al., 1988), and the275 Ma Permian age could reflect acooling event or, given the robustnessof the U–Pb system in monazite (Bin-gen and Van Breemen, 1998; Montelet al., 2000; Bosch et al., 2002), itsprograde growth until anatectic con-ditions. The similarity in age betweenmonazites from the studied metapeliteand zircons from a kyanite metapegm-atite (273 ± 6 Ma) emplaced duringthe first stages of mylonitization (Pe-ucat and Bossiere, 1991) suggests thatthe monazite date the high-tempera-ture extensional shear that affected thecrustal section of the SABN domainafter crystallization of the SABN plu-ton. This age compares well withsimilar values obtained on granitoidsand gabbros from outermost domains
50 m
RT-95
50 m
RT-95
292±11 Ma
283±13 Ma
282±7 Ma
275±14 Ma
286±19 Ma
270±7 Ma
254±10 Ma
262±12 Ma
(a)
(b)
Fig. 3 Scanning electron microscope (BSE) images of monazite grains from the RT-95metapelite. Quoted ages are ±1r. (a) Homogeneous elongated bright (high Th) grain(17) with no fractures and detectable age differences. (b) Rounded grain (#8) showingdark, irregularly shaped, domains concentrated in the fractured part of the grain.
Fig. 4 Terra-Wasserburg diagram for monazites from the RT-95 metapelite. Crossesare 1r error.
A two-stage exhumation of the Variscan crust • D. Hammor et al. Terra Nova, Vol 18, No. 5, 299–307
.............................................................................................................................................................
304 � 2006 Blackwell Publishing Ltd

of the Palaeo-European Variscan beltsuch as the Western and Central Alps(Thoni and Jagoutz, 1992; Bertrandet al., 2000; Muntener et al., 2000;Mayer et al., 2000), Calabria (Graess-ner et al., 2000) and Corsica (Paquetteet al., 2003). These ages are within therange of the last late-orogenic mag-matic pulse of the Variscan Belt ofEurope (Schaltegger, 1997). It is thusinferred that high-temperature crys-talline rocks from the Kabylian base-ment represent an analogue of thenorth-western part of Adria thatrecorded pervasive Permian magma-tism related to lithospheric thinningleading to the opening of the Tethyanoceanic domain (Stampfli et al., 2001).The Rb–Sr age of biotite
(24 ± 1 Ma) is in good agreementwith other published Ar ages (rangingfrom 25 to 30 Ma) measured on meta-morphic minerals (biotite and musco-vite) from rocks of the SABN domain
(Monie et al., 1984, 1988). This agefalls within the main Rb–Sr biotitewhole-rock age group (22–26 Ma)defined by Peucat et al. (1996) forbasement rocks of the Lesser Kabylia.Collectively all aforementioned agesplead for regional cooling, down to c.350 �C (Dahl, 1996) during the LateOligocene–Early Miocene, which cor-responds to the main phase of thrust-ing in the internal zone of theMaghrebides (Madjoub et al., 1997),shortly followed by global extensionin the western Mediterranean realm(Gelabert et al., 2002; Mauffret et al.,2004). Do the combination of U–PbPermian ages and 40Ar/39Ar late-Alpine ages imply a two-stage evolu-tion? Or is it simply related to a long-lived burial of the Variscan crustallowing continuous Ar diffusion upto the Miocene?The LA-ICP-MS results indicate
that some monazite grains have suf-fered U–Pb disturbances, which is inagreement with a two-stage model.This suggests that the Rb–Sr biotiteage is more likely related to a regionalcooling subsequent to a reheatingevent that affected the U–Pb systemsof the discordant monazites. Deter-mining the age(s) of these U–Pb dis-turbances is not possible with thepresent data set, but can be bracketedby the Rb–Sr biotite age (24 ± 1 Ma)and the 206Pb/238U age of the young-est discordant monazite (142 ±
24 Ma). In the present case, it canhowever be speculated that thermalconditions prevailing during this eventwere above 300–350 �C, but did notreach 500–550 �C. This is in agree-ment with the preservation of someLate Hercynian Rb–Sr muscovite agesin the Kabylies (Peucat et al., 1996).This is also consistent with partialrejuvenation of monazite under relat-ively low temperature conditions,either during the waning stages ofmetamorphism (e.g. Lanzirotti andHanson, 1995) or linked with fluidcirculations (Townsend et al., 2000).Most U–Pb lower intercepts from
Permian occurrences preserved in theAlpine and peri-Mediterranean areasareMesozoic in age, as domanyRb–Srand 40Ar/39Ar mineral ages (Costa andMaluski, 1988; Gebauer, 1993; Monieet al., 1994). In the southern Alps,long-lived burial of the hot Variscancrust from the Ivrea Zone was followedby crustal attenuation from Triassic toLate Jurassic times (Zingg et al., 1990;Schmid, 1993). Triassic reheatingresulted from asthenosphere upwelling(Snoke et al., 1999) and is well docu-mented by zircon and monazite over-growths and/or nucleation in thegranulites from the Ivrea Zone (Vavraand Schaltegger, 1999; Vavra et al.,1999). A similar evolution also tookplace in Calabria (Graessner et al.,2000). At variance with the southAlpine block where thermal and de-compressional pulses linked to exten-sion led to Permo-Mesozoic crustalthinning leading to continental breakup and opening of the Neothethys(Stampfli et al., 2001), Mesozoic heat-ing periods in Greater Kabylia aremore discrete and are only recordedthrough some mineral ages. Creta-ceous ages (c. 128 Ma) have beeninterpreted as dating a shearing event,responsible for the blastesis of greenbiotite and phengite in gneisses (Cheil-letz et al., 1999). In the SABN domain,pre-Alpine heating events are notclearly documented and are only sug-gested by low temperature replacementzones affecting monazite grains. Thissuggests that, during the Mesozoic,rocks from the middle crust of CGKand SABN were only slightly rehea-ted as they were still attached tosouthern Europe (or possibly formedthe AlKaPeCa (Alboran-Kabylia-Peleritan-Calabria) domain; Loner-gan and White, 1997). At the scale
Table 2 Strontium and rubidium iso-
topic analyses for biotite and whole rock
from the RT-95 metapelite. Rb/Sr ratios
are considered precise to about ±2%.
Sample name Whole rock Biotite
Rb (ppm) 106.13 145.16
Sr (ppm) 155.87 31.2487Sr/86Sr 0.72278 0.72654
± (2r) 0.00002 0.0000187Rb/86Sr 1.93 13.14
0.723
0 4 8 12 16
0.724
0.725
0.726
0.727
87Rb/86Sr
87S
r/86
Sr
RT 95
23.7 ± 1.1 Ma
I0 = 0.72213 ± 6
Biotite
Whole rock
Fig. 5 Rb–Sr isochron diagram for biotite and whole-rock from the RT-95metapelite.
Terra Nova, Vol 18, No. 5, 299–307 D. Hammor et al. • A two-stage exhumation of the Variscan crust
.............................................................................................................................................................
� 2006 Blackwell Publishing Ltd 305

of Northern Africa (Maghrebides +Alboran sea + Betics), it is significantthat no record of exposure and erosionof high-grademetamorphic rocks priorto the unconformable Late Oligoceneor Miocene sediments can be found.This suggests that doming, extrusionand tectonic unroofing were the dom-inant mechanisms leading to exhuma-tion of theKabylian crystalline rocks atthe time of nappe emplacement,slightly before the opening of the west-ern Mediterranean basin (21–11 Ma;Lonergan and White, 1997).
Conclusions
Anatectic metapelites from GreaterKabylia affected by high-temperaturemylonitic deformation reached high-temperature amphibolite facies condi-tions (740 �C at 1 Gpa) at275 ± 4 Ma. This age correlates withsimilar ages from other crustal do-mains from south and south-easternEurope that suffered Permo-Mesozoiccrustal thinning predating the Tethysopening. As a consequence, it is sug-gested that the basement rocks ofGreater Kabylia represent a southerncounterpart of the north-western partof Adria, affected by pervasive Per-mian magmatism and deformation.During Late Oligocene–Early Mio-cene times, exhumation brought deepcrustal units of Greater Kabylia up toshallow levels as indicated by the Rb–Sr biotite age of 23.7 ± 1.1 Ma. Thisevent was synchronous with the mainphase of nappe emplacement wellidentified in Lesser Kabylia (Madjoubet al., 1997) and was followed bydisruption of the Alboran microplateand opening of the Alboran Sea.
Acknowledgements
During the course of this study, the firstauthor (DH) benefited from a CMEPfinancial support and an access to thefacilities of the �Laboratoire de Tectono-physique� (Universite de Montpellier II). B.Galland is thanked for clean laboratorymaintenance, C. Nevado and D. Delmasfor preparation of laser mounts, and C.Grill for SEM imaging. We acknowledgethe constructive criticisms of two anony-mous referees.
References
Bertrand, J.M., Pidgeon, R.T., Leterrier, J.,Guillot, F., Gasquet, D. and Gattiglio,
M., 2000. SHRIMP and IDTIMS U–Pbzircon ages of the pre-Alpine basement inthe Internal Western Alps (Savoy andPiemont).Schweiz.Mineral. Petrol.Mitt.,80, 225–248.
Bingen, B. and Van Breemen, O., 1998.U–Pb monazite ages in amphibolite- togranulite-facies orthogneiss reflecthydrous mineral breakdown reactions:Sveconorwegian province of SWNorway. Contrib. Mineral. Petrol., 132,336–353.
Bohlen, S.R., Wall, V.J. and Boettcher,A.L., 1983. Experimental investigationsand geological applications of equilibriain the system FeO–TiO2–Al2O3–SiO2–H2O. Am. Mineral., 68, 1049–1053.
Bosch, D., Hammor, D., Bruguier, O.,Caby, R. and Luck, J.M., 2002. Mona-zite �in situ� 207Pb/206Pb geochronologyusing a small geometry high-resolutionion probe. Application to Archaean andProterozoic rocks. Chem. Geol., 184,151–165.
Bruguier, O., Telouk, P., Cocherie, A.,Fouillac, A.M. and Albarede, F., 2001.Evaluation of Pb–Pb and U–Pb laserablation ICP-MS zircon dating usingmatrix-matched calibration samples witha frequency quadrupled (266 nm)Nd-YAG laser. Geostandards News, 25,361–373.
Cheilletz, A., Ruffet, G., Marignac, C.,Kolli, O., Gasquet, D., Feraud, G. andBouillin, J.P., 1999. 40Ar/39Ar dating ofshear zones in the Variscan basement ofGreater Kabylia (Algeria). Evidenceof an Eo-Alpine event at 128 Ma(Hauterivian–Barremian boundary): geo-dynamic consequences. Tectonophysics,306, 97–116.
Copeland, P., Parrish, R.R. and Harrison,T.M., 1988. Identification of inheritedradiogenic Pb in monazite and itsimplications for U–Pb systematics.Nature, 333, 760–763.
Costa, S. and Maluski, H., 1988. Use of the40Ar–39Ar stepwise heating method fordating mylonite zones: an examplefrom the Saint Barthelemy Massif(northern Pyrenees, France). Chem.Geol., 72, 127–144.
Dahl, P.S., 1996. The crystal-chemicalbasis for Ar retention in micas: infer-ences from interlayer partitioning andimplications for geochronology. Contrib.Mineral. Petrol., 123, 22–39.
Ferry, J.M. and Spear, F.S., 1978. Experi-mental calibration of the partitioning ofFe and Mg between biotite and garnet.Contrib. Mineral. Petrol., 66, 113–117.
Gebauer, D., 1993. The pre-Alpine evolu-tion of the continental crust of theCentral Alps – an overview. In: Pre-Mesozoic Geology in the Alps (J.F. vonRaumer and F. Neubauer eds), pp. 93–117. Springer-Verlag, Berlin, Heidel-burg.
Gelabert, B., Sabat, F. and Rodriguez-Perea, A., 2002. A new proposal for thelate Cenozoic geodynamic evolution ofthe Western Mediterranean. Terra Nova,14, 93–100.
Graessner, T., Shenk, V., Brocker, M. andMezger, K., 2000. Geochronologicalconstraints on the timing of granitoidmagmatism, metamorphism and post-metamorphic cooling in the Hercyniancross-section of Calabria. J. Metamor-phic Geol., 18, 409–421.
Gueguen, E., Doglioni, C. and Fernandez,M., 1998. On the post-25 Ma geo-dynamic evolution of the western Medi-terranean. Tectonophysics, 298, 259–269.
Hodges, K.V. and Spear, F.S., 1982.Geothermometry, geobarometry and theAl2SiO5 triple point at Mt. Moosilauke,New Hampshire. Am. Mineral., 67,1118–1134.
Kretz, R., 1983. Symbols for rock-formingminerals. Am. Mineral., 68, 276–279.
Lanzirotti, A. and Hanson, G.N., 1995.U–Pb dating of major and accessoryminerals formed during metamorphismand deformation of metapelites. Geo-chim. Cosmochim. Acta, 59, 2513–2526.
Lonergan, L. and White, N., 1997. Originof the Betic-Rif mountain belt. Tecton-ics, 16, 504–522.
Ludwig, K.R., 1999. Users Manual forISOPLOT/EX version 2. A Geochrono-logical Toolkit for Microsoft Excel.Berkeley Geochronology Center, Spec.Pub. 1a, Berkeley, CA.
Madjoub, Y., Choukroune, P. and Kie-nast, J.R., 1997. Kinematics of a com-plex Alpine segment: superimposedtectonic and metamorphic events in thePetite Kabylie Massif (northern Algeria).Bull. Soc. Geol. Fr., 168, 649–661.
Mauffret, A., Frizon de Lamotte, D.,Lallemant, S., Gorini, C. and Maillard,A., 2004. E–W opening of the AlgerianBasin (Western Mediterranean). TerraNova, 16, 257–264.
Mayer, A., Mezger, K. and Sinigoi, S.,2000. New Sm–Nd ages for the Ivrea-Verbano Zone, Sesia and Sesseravalleys (Northern Italy). J. Geodyn.,30, 147–166.
Monie, P., Caby, R. and Maluski, H. 1984.40Ar–39Ar investigations within theGrande-Kabylie massif (northern Alger-ia): evidences for its Alpine structura-tion. Eclogae Geol. Helv., 77, 115–141.
Monie, P., Maluski, H., Saadallah, A. andCaby, R., 1988. New 40Ar/39Ar ages ofHercynian and alpine thermotectonicevents in Grande Kabylie (Algeria).Tectonophysics, 152, 53–69.
Monie, P., Soliva, J., Brunel, M. andMaluski, H., 1994. Les cisaillementsmylonitiques du granite de Milas (Pyr-enees, France). Age cretace 40Ar/39Ar etinterpretation tectonique. Bull. Soc.Geol. Fr., 165, 559–571.
A two-stage exhumation of the Variscan crust • D. Hammor et al. Terra Nova, Vol 18, No. 5, 299–307
.............................................................................................................................................................
306 � 2006 Blackwell Publishing Ltd
Montel, J.M., Foret, S., Veschambre, M.,Nicollet, C. and Provost, A., 1996.Electron microprobe dating of monazite.Chem. Geol., 131, 37–53.
Montel, J.M., Kornprobst, J. and Vielzeuf,D., 2000. Preservation of old U–Th–Pbages in shielded monazite: example fromthe Beni-Bousera hercynian kinzigites(Morocco). J. Metamorphic Geol., 18,335–342.
Muntener, O., Hermann, J. andTrommsdorff, V., 2000. Cooling historyand exhumation of lower-crustalgranulite and upper mantle (Malenco,eastern Central Alps). J. Petrol., 41, 175–200.
Paquette, J.L., Menot, R.P., Pin, C. andOrsini, J.P., 2003. Episodic and short-lived granitic pulses in a post-collisionalsetting: evidence from precise U–Pbzircon dating through a crustal cross-section in Corsica. Chem. Geol., 198,1–20.
Peucat, J.J. and Bossiere, G., 1991. AgesU–Pb fini-hercynien de la ceinture my-lonitique de haute pression-hautetemperature de Grande Kabylie (Alge-rie). C. R. Acad. Sci. Paris, 313, 1261–1267.
Peucat, J.J., Mahdjoub, Y. and Drareni,A., 1996. U–Pb and Rb–Sr geochrono-logical evidence for late Hercynian tec-tonic and Alpine overthrustuing inKabylian metamorphic basement mas-sifs (northern Algeria). Tectonophysics,258, 195–213.
Poitrasson, F., Chenery, S. and Shepperd,T.J., 2000. Electron microprobe and LA-ICP-MS study of monazite hydrother-mal alteration: implications for U–Th–Pb geochronology and nuclear ceramics.
Geochim. Cosmochim. Acta, 64, 3283–3297.
Ricou, L.E., 1994. Tethys reconstructed:plates, continental fragments and theirboundaries since 260 Ma, from centralAmerica to south-eastern Asia. Geo-dinamica Acta, 7, 169–218.
Saadallah, A. and Caby, R., 1996. Alpineextensional detachment tectonics in theGrande Kabylie metamorphic corecomplex of the Maghrebides (northernAlgeria). Tectonophysics, 267, 257–273.
Schaltegger, U., 1997. Magma pulses in theCentral Variscan Belt: episodic meltgeneration and emplacement duringlithospheric thinning. Terra Nova, 9,242–245.
Schmid, S. 1993. Ivrea Zone and adjacentsouthern Alpine basement. In: Pre-Mesozoic Geology in the Alps (J.F. vonRaumer and F. Neubauer eds), pp. 567–584. Springer-Verlag, Berlin, Heidelberg.
Smith, H.A. and Barreiro, B., 1990. Mon-azite U–Pb dating of staurolite grademetamorphism in pelitic schists. Contrib.Mineral. Petrol., 105, 602–615.
Snoke, A.W., Kalakay, T.J., Quick, J.E.and Sinigoi, S., 1999. Development of adeep-crustal shear zone in response tosyntectonic intrusion of mafic magmainto the lower crust, Ivrea-Verbano zone,Italy. Earth Planet. Sci. Lett., 166, 31–45.
Stacey, J.S. and Kramers, J.D., 1975.Approximation of terrestrial lead isotopeevolution by a two stage model. EarthPlanet. Sci. Lett., 26, 206–221.
Stampfli, G.M., Mosar, J., Favre, P., Pil-levuit, A. and Vannay, J.C., 2001. Per-mo-Mesozoic evolution of the westernTethys realm: the Neo-Tethys EastMediterranean Basin connection. In:
Peri-Tehys Memoir 6: Peri-Tethyan Rift/Wrench Basins and Passive Margins(P.A. Ziegler, W. Cavazza, A.H.F. Ro-bertson and S. Crasquin-Soleau, eds),Mem. Mus. Natn. Hist. Nat., 186,51–108.
Thoni, M. and Jagoutz, E., 1992. Somenew aspects of dating eclogites in oro-genic belts: Sm–Nd, Rb–Sr and Pb–Pbisotopic results from the AustroalpineSaualpe and Koralpe type-locality (Car-inthia/Styria, southeastern Austria).Geochim. Cosmochim. Acta, 56, 347–368.
Townsend, K.J., Miller, C.F., D’Andrea,J.L., Ayers, J.C., Harrison, T.M. andCoath, C.D., 2000. Low temperaturereplacement of monazite in the Iretebagranite, Southern Nevada: geochrono-logical implications. Chem. Geol., 172,95–112.
Vavra, G. and Schaltegger, U., 1999. Post-granulite facies monazite growth andrejuvenation during Permian to LowerJurassic thermal and fluid events in theIvrea Zone (Southern Alps). Contrib.Mineral. Petrol., 134, 405–414.
Vavra, G., Schmid, R. and Gebauer, D.,1999. Internal morphology, habit andU–Th–Pb microanalysis of amphibolite-to-granulite facies zircons: geochronolo-gy of the Ivrea Zone (Southern Alps).Contrib. Mineral. Petrol., 134, 380–404.
Zingg, A., Handy, M.R., Hunziker, J.C.and Schmid, S.M., 1990. Tectonometa-morphic history of the Ivrea Zone and itsrelationship to the crustal evolution ofthe Southern Alps. Tectonophysics, 182,169–192.
Received 19 January 2006; revised versionaccepted 21 June 2006
Terra Nova, Vol 18, No. 5, 299–307 D. Hammor et al. • A two-stage exhumation of the Variscan crust
.............................................................................................................................................................
� 2006 Blackwell Publishing Ltd 307

Precambrian Research 149 (2006) 197–216
Timing of crust formation, deposition of supracrustal sequences,and Transamazonian and Brasiliano metamorphism in the East
Pernambuco belt (Borborema Province, NE Brazil):Implications for western Gondwana assembly
Sergio P. Neves a,∗, Olivier Bruguier b, Alain Vauchez c, Delphine Bosch c,Jose Maurıcio Rangel da Silva a, Gorki Mariano a
a Departamento de Geologia, Universidade Federal de Pernambuco, 50740-530 Recife, Brazilb ISTEEM, Service ICP-MS, Universite de Montpellier II, 34095 Montpellier, France
c Laboratoire de Tectonophysique, Universite de Montpellier II, 34095 Montpellier, France
Received 21 July 2005; received in revised form 10 January 2006; accepted 21 June 2006
Abstract
The main structural feature of the central domain of Borborema Province (NE Brazil) is a network of dextral and sinistralshear zones. These shear zones rework an older, regionally developed, flat-lying foliation in orthogneisses and supracrustal belts,which in the East Pernambuco belt was formed under amphibolite facies conditions. This study reports LA-ICP-MS U–Pb zirconages of metaigneous and metasedimentary rocks aiming to constraint the pre-transcurrent tectonothermal evolution in the EasternPernambuco domain. Ages of 2125 ± 7 and 2044 ± 5 Ma in a mafic layer of banded orthogneiss are interpreted as the age of theprotolith of the orthogneiss and of high-grade Transamazonian metamorphism, respectively. The latter age is consistent with theoccurrence of low Th/U, metamorphic zircon xenocrysts, dated at 2041 ± 15 Ma, in the leucosome of a migmatitic paragneiss. Agranitic orthogneiss dated at 1991 ± 5 Ma reflects late to post-Transamazonian magmatic event. A similar age (1972 ± 8 Ma) wasfound in rounded zircon grains from a leucocratic layer of banded orthogneiss. Ages of detrital zircons in a paragneiss sample indicatederivation from sources with ages varying from the Archean to Neoproterozoic, with peak ages at ca. 2220, 2060–1940, 1200–1150and 870–760 Ma. Detrital zircons constrain the deposition of the supracrustal sequence to be younger than 665 Ma. Magmaticzircons with the age of 626 ± 15 Ma are found in the leucosome of a migmatitic paragneiss and constrain the age of the Brasilianohigh-temperature metamorphism. A lower intercept age of 619 ± 36 Ma from a deformed granodiorite dated at 2097 ± 5 Ma and thecrystallization age of 625 ± 24 Ma of the felsic layer of banded orthogneiss also confirm the late Neoproterozoic metamorphism.These results show that the present fabric in basement and supracrustal rocks was produced during the Brasiliano orogeny.
Paleoproterozoic ages reported in this study are similar to those found in other sectors of the Borborema Province, the Cameroonand Nigeria provinces, and the Sao Francisco/Congo craton. They show the importance of the Transamazonian/Eburnean eventand suggest that these tectonic units may have been part of a larger, single continental landmass. Likewise, similarities in post-Transamazonian metamorphic and magmatic events in the Borborema, Nigeria and Cameroon provinces suggest that they shared a
common evolution and remained in close proximity until the opening of the Atlantic Ocean.© 2006 Elsevier B.V. All rights reserved.Keywords: Laser ablation ICP-MS; Zircon U–Pb geochronology; Neoproterozoic belts; Transamazonian orogeny; Brasiliano orogeny
∗ Corresponding author. Tel.: +55 81 2126 8240; fax: +55 81 2126 8236.E-mail address: [email protected] (S.P. Neves).
0301-9268/$ – see front matter © 2006 Elsevier B.V. All rights reserved.doi:10.1016/j.precamres.2006.06.005

ian Res
198 S.P. Neves et al. / Precambr1. Introduction
There is broad consensus that most of westernGondwana was already formed by 600 Ma. Continen-tal reconstructions for this period (e.g., Caby et al.,1991; Castaing et al., 1994; Trompette, 1997) show thatthe Brasiliano/Pan-African Borborema, Cameroon andNigeria provinces occupied a central position in relationto the Amazonian and West Africa cratons, to the west,the Sao Francisco/Congo craton, to the south, and theSaharan metacraton (Abdelsalam et al., 2002), to the east(Fig. 1). In the lack of paleomagnetic data, understand-ing how and when this configuration was reached rely ongeological and geochronological grounds. Knowledgeof the tectonothermal history of the late Neoproterozoicbelts is thus essential to evaluate possible correlationsbetween adjacent (within individual provinces) and dis-tant (transcontinental) units and, therefore, to provideinsights into the dynamics of amalgamation of westernGondwana.
The Precambrian crustal evolution of the BorboremaProvince has been much debated in recent years. Resolv-ing some critical pending issues is necessary to elabo-rate continental reconstructions for the Neoproterozoic.In the central domain, comprised between the Patosand Pernambuco shear zone systems (Fig. 1), the mostcontroversial issues are (1) the existence of a contrac-tional event in the early Neoproterozoic (Cariris Vel-hos orogeny, ∼1 Ga; Brito Neves et al., 1995), and(2) whether or not terranes accretion took place dur-ing this proposed orogeny. The suggestion of an earlyNeoproterozoic orogeny resulted from the discovery of1000–900 Ma-old intermediate to felsic metavolcanicrocks and orthogneisses in the Alto Pajeu belt (Fig. 1;Brito Neves et al., 1995; Van Schmus et al., 1995;Kozuch et al., 1997; Brito Neves et al., 2000, 2001a;Kozuch, 2003). Peraluminous orthogneisses intercalatedin the supracrustal sequence were interpreted as syncol-lisional granites. Santos and Medeiros (1999) proposedthat the Alto Pajeu belt is one of four tectonostrati-graphic terranes that amalgamated during the CaririsVelhos and Brasiliano orogenies to constitute the cen-tral domain. Several authors (Mariano et al., 2001;Guimaraes and Brito Neves, 2004; Neves, 2003 and ref-erences therein) have, however, questioned the existenceof the Cariris Velhos orogeny and the terrane accre-tion model, suggesting, instead, continuity between theproposed terranes since the Paleoproterozoic Transama-
zonian orogeny. Therefore, in this paper, the followingnon-genetic terms will be used to describe supracrustalsuccessions and orthogneisses occurring from west toeast in the central domain: Cachoeirinha belt, Altoearch 149 (2006) 197–216
Pajeu belt, Alto Moxoto belt and East Pernambuco belt(Fig. 1).
To improve knowledge and address the controversialpoints above, zircon grains from samples from the EastPernambuco belt were dated by laser ablation inductivelycoupled plasma-mass spectrometry (LA-ICP-MS). Theaim of this study is threefold: (1) constrain the timingof magmatic and metamorphic events and of depositionof supracrustal sequences, (2) compare its geologicalevolution with other regions in northeastern Brazil andwith the Pan-African belts of Nigeria and Cameroon, and(3) assess how these domains and surrounding cratonspulled together to make up western Gondwana.
2. Geological setting
2.1. Regional geology
The Borborema Province is characterized by a com-plex network of large transcurrent shear zones (Vauchezet al., 1995; Fig. 1). In the central domain, a linked systemof E–W- to ENE–WSW-striking dextral and NNE–SSW-to NE–SW-striking sinistral shear zones is spatiallyassociated with abundant granitic and syenitic plutons(Fig. 1B; Vauchez and Egydio-Silva, 1992; Guimaraesand Da Silva Filho, 1998; Ferreira et al., 1998; Neves andMariano, 1999; Neves et al., 2000; Silva and Mariano,2000). A former shallow-dipping regional foliation ispreserved in orthogneisses and metasediments outcrop-ping between the strike slip-related steeply dipping tovertical mylonitic zones. The metamorphic grade underwhich this foliation was developed differs between theCachoeirinha belt and the Alto Pajeu, Alto Moxoto andEast Pernambuco belts. The Cachoeirinha belt consistsof greenschist facies metapelites, metagreywackes andbimodal metavolcanics (Bittar and Campos Neto, 2000;Kozuch, 2003; Medeiros, 2004) deformed at relativelyhigh pressures (6–9 kbar; Sial, 1993; Caby and Sial,1997). Its low metamorphic grade stands in contrast withthat of the other three belts, which were regionally heatedabove 500 ◦C under low- to medium-pressures metamor-phic conditions (Vauchez and Egydio-Silva, 1992; Bittarand Campos Neto, 2000; Leite et al., 2000a; Neves et al.,2000).
Orthogneiss complexes underlie large areas of theAlto Pajeu, Alto Moxoto and East Pernambuco belts.They yielded U–Pb and Pb–Pb evaporation ages mostlyvarying from 2.2 to 2.0 Ga (Santos, 1995; Van Schmus
et al., 1995; Leite et al., 2000b; Brito Neves et al.,2001b; Melo et al., 2002; Kozuch, 2003; Neves et al.,2004; Santos et al., 2004a), and Sm–Nd data indicate theexistence of Archean protoliths for some of these Pale-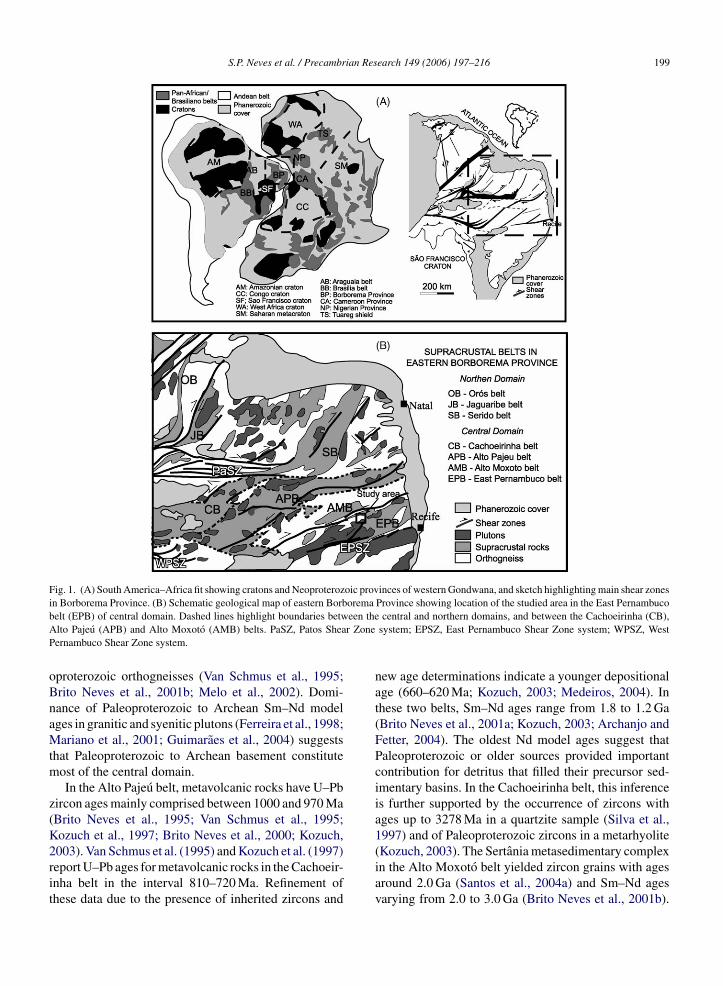
S.P. Neves et al. / Precambrian Research 149 (2006) 197–216 199
Fig. 1. (A) South America–Africa fit showing cratons and Neoproterozoic provinces of western Gondwana, and sketch highlighting main shear zonesin Borborema Province. (B) Schematic geological map of eastern Borborema Province showing location of the studied area in the East Pernambucob een theA r ZoneP
oBnaMtm
z(K2rit
elt (EPB) of central domain. Dashed lines highlight boundaries betwlto Pajeu (APB) and Alto Moxoto (AMB) belts. PaSZ, Patos Sheaernambuco Shear Zone system.
proterozoic orthogneisses (Van Schmus et al., 1995;rito Neves et al., 2001b; Melo et al., 2002). Domi-ance of Paleoproterozoic to Archean Sm–Nd modelges in granitic and syenitic plutons (Ferreira et al., 1998;ariano et al., 2001; Guimaraes et al., 2004) suggests
hat Paleoproterozoic to Archean basement constituteost of the central domain.In the Alto Pajeu belt, metavolcanic rocks have U–Pb
ircon ages mainly comprised between 1000 and 970 MaBrito Neves et al., 1995; Van Schmus et al., 1995;ozuch et al., 1997; Brito Neves et al., 2000; Kozuch,
003). Van Schmus et al. (1995) and Kozuch et al. (1997)eport U–Pb ages for metavolcanic rocks in the Cachoeir-nha belt in the interval 810–720 Ma. Refinement ofhese data due to the presence of inherited zircons andcentral and northern domains, and between the Cachoeirinha (CB),system; EPSZ, East Pernambuco Shear Zone system; WPSZ, West
new age determinations indicate a younger depositionalage (660–620 Ma; Kozuch, 2003; Medeiros, 2004). Inthese two belts, Sm–Nd ages range from 1.8 to 1.2 Ga(Brito Neves et al., 2001a; Kozuch, 2003; Archanjo andFetter, 2004). The oldest Nd model ages suggest thatPaleoproterozoic or older sources provided importantcontribution for detritus that filled their precursor sed-imentary basins. In the Cachoeirinha belt, this inferenceis further supported by the occurrence of zircons withages up to 3278 Ma in a quartzite sample (Silva et al.,1997) and of Paleoproterozoic zircons in a metarhyolite
(Kozuch, 2003). The Sertania metasedimentary complexin the Alto Moxoto belt yielded zircon grains with agesaround 2.0 Ga (Santos et al., 2004a) and Sm–Nd agesvarying from 2.0 to 3.0 Ga (Brito Neves et al., 2001b).
ian Res
200 S.P. Neves et al. / PrecambrThese data indicate its provenance mainly from Pale-oproterozoic and Archean sources, but only places anupper bound on the age of deposition. The age of depo-sition of supracrustal sequences in the East Pernambucobelt is still unknown.
2.2. Study area
The study area is located in the northwestern partof the East Pernambuco belt (Fig. 1). It comprisesbanded orthogneisses, granitic augen gneisses, metased-imentary rocks and igneous intrusions (Fig. 2). Bandedorthogneisses are characterized by alternating bands ofdioritic and granitic compositions. Zircon U–Pb dat-ing from a monzodioritic orthogneiss and a graniticaugen gneiss (Taquaritinga orthogneiss) in the southernpart of the study area yielded ages of 1974 ± 32 and1521 ± 6 Ma, respectively (Sa et al., 2002).
In the geological map of the state of Pernambuco(Gomes, 2001), Surubim and Vertentes complexes arerecognized as two distinct supracrustal units, mainlybased on the occurrence of metavolcanic rocks in thelatter. Metavolcanic rocks were not identified by us inthe study area nor in other localities of the East Pernam-buco belt. Metasedimentary rocks are indistinguishablein terms of rock association, structure or metamorphicgrade between the Surubim and Vertentes complexes.Furthermore, our mapping shows that basement gneisseswere misinterpreted as belonging to the Vertentes com-plex. Therefore, this complex is not considered hereas a valid tectonostratigraphic unit. In consequence,metasedimentary rocks in the study are attributed to theSurubim complex. The main lithotypes are biotite gneiss,biotite schist, quartz-feldspar paragneiss, quartzite andmarble, locally with small lenses of para-amphiboliteand calc-silicate rock. Sillimanite and garnet are ubiqui-tous accessory phases, which together with local migma-tization attest high-temperature metamorphism.
From the structural point of view, the study areais characterized by flat-lying gneissic foliation inorthogneisses and supracrustal rocks. This early fabric isdeformed by recumbent to upright folds and transcurrentshear zones (Neves et al., 2005). Stretching lineationsassociated with the flat-lying foliation have ESE–WNWtrend in supracrustal rocks and NE–SW trend inbanded orthogneiss and Taquaritinga orthogneiss. In themetasedimentary sequence, numerous kinematic indica-tors showing a top-to-the-west/northwest sense of shear
denote a well-developed non-coaxial deformation. Theseoblique lineations were interpreted (Neves et al., 2005) asthe result of extension oblique to the transport directionin the deeper orthogneisses during progressive defor-earch 149 (2006) 197–216
mation. A deformed epidote-bearing biotite granodior-ite (Alcantil pluton; Fig. 2) displays a flat-lying mag-matic/gneissic foliation crosscut by subvertical shearbands. This pluton was previously regarded as a Neo-proterozoic intrusion emplaced during the top-to-the-northwest tectonics (Neves et al., 2005). However, dataacquired in the present study favor its intrusion duringthe Paleoproterozoic, followed by solid-state deforma-tion during the Brasiliano orogeny (see below). Twoplutons partially outcrop in the southern part of the studyarea (Fig. 2). The ca. 585 Ma-old, syenitic Toritama plu-ton (Guimaraes and Da Silva Filho, 1998) is interpretedas early kinematic with respect to strike-slip shearing(Neves et al., 2000). The Santa Cruz do Capibaribe plu-ton is a composite intrusion containing gabbronoritesand diorites in the core and monzonites at the margins,displaying only local solid-state deformation.
3. Studied samples
Samples for this study represent the main lithologicalunits and key relations between age and deformation inthe study area. Six samples weighting 8–12 kg each werecollected from four localities (Fig. 2B). Samples SCC1Aand SCC1B are, respectively, mafic and felsic layersof banded orthogneiss. SCC1A is a medium-grained,dark-colored biotite amphibole gneiss with quartz mon-zodioritic composition. SCC1B is a medium-grained,leucocratic granitic gneiss containing less than 10%biotite. The gneissic banding dips 36◦ towards N104◦Eand a strong stretching lineation plunging gently tonortheast (21◦, N47◦E) is present in both lithologies.Sample SCC9 is a medium to coarse-grained sillimanitebiotite paragneiss containing garnet porphyroblasts upto 1 cm in diameter. Sample SCC12 is the leucosome ofa migmatitic paragneiss, and SCC2 is a granitic gneiss.Since contact relationships are not exposed, it is not pos-sible to determine whether the granitic gneiss is a sheetintercalated in metasedimentary sequence or whether itunderlies it. Quartz ribbons in sample SCC2 attest strongsolid-state deformation and define a lineation plunging7◦, N150◦E. Sample SSC5 is from the Alcantil pluton,showing foliation dipping 36◦ towards N24◦E.
4. Analytical techniques
Zircons were separated using conventional tech-niques. After crushing and sieving of the powdered sam-
ples, heavy minerals were concentrated by panning andthen by heavy liquids. The heavy mineral concentrateswere subsequently processed by magnetic separationusing a Frantz separator. Zircon grains were hand picked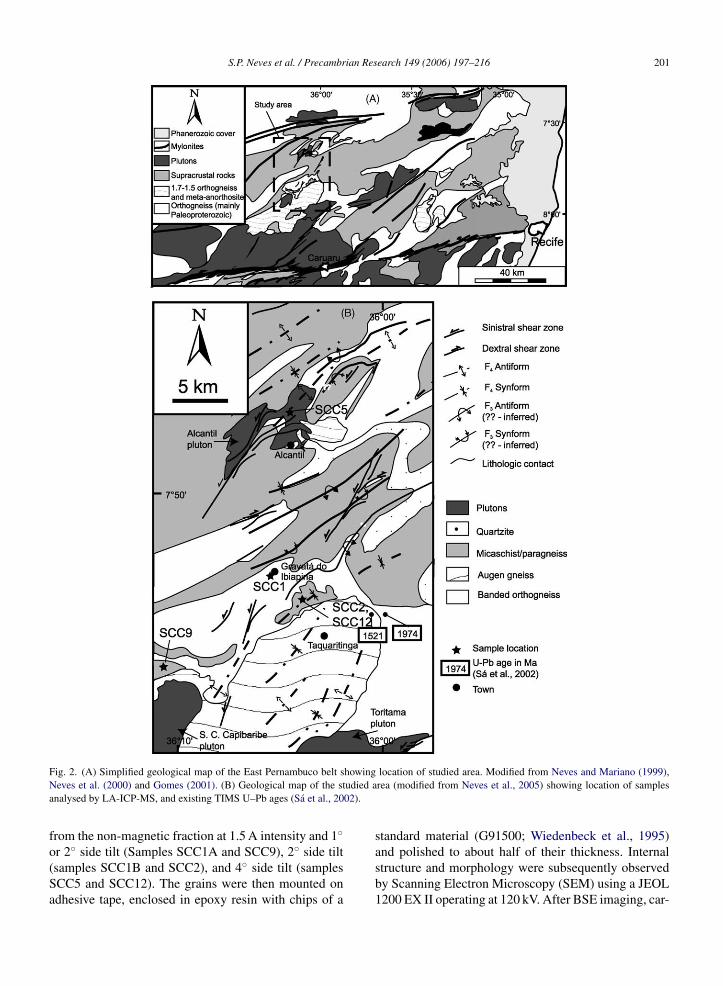
S.P. Neves et al. / Precambrian Research 149 (2006) 197–216 201
F howingN udied aa 02).
fo(Sa
ig. 2. (A) Simplified geological map of the East Pernambuco belt seves et al. (2000) and Gomes (2001). (B) Geological map of the st
nalysed by LA-ICP-MS, and existing TIMS U–Pb ages (Sa et al., 20
rom the non-magnetic fraction at 1.5 A intensity and 1◦
r 2◦ side tilt (Samples SCC1A and SCC9), 2◦ side tiltsamples SCC1B and SCC2), and 4◦ side tilt (samplesCC5 and SCC12). The grains were then mounted ondhesive tape, enclosed in epoxy resin with chips of alocation of studied area. Modified from Neves and Mariano (1999),rea (modified from Neves et al., 2005) showing location of samples
standard material (G91500; Wiedenbeck et al., 1995)
and polished to about half of their thickness. Internalstructure and morphology were subsequently observedby Scanning Electron Microscopy (SEM) using a JEOL1200 EX II operating at 120 kV. After BSE imaging, car-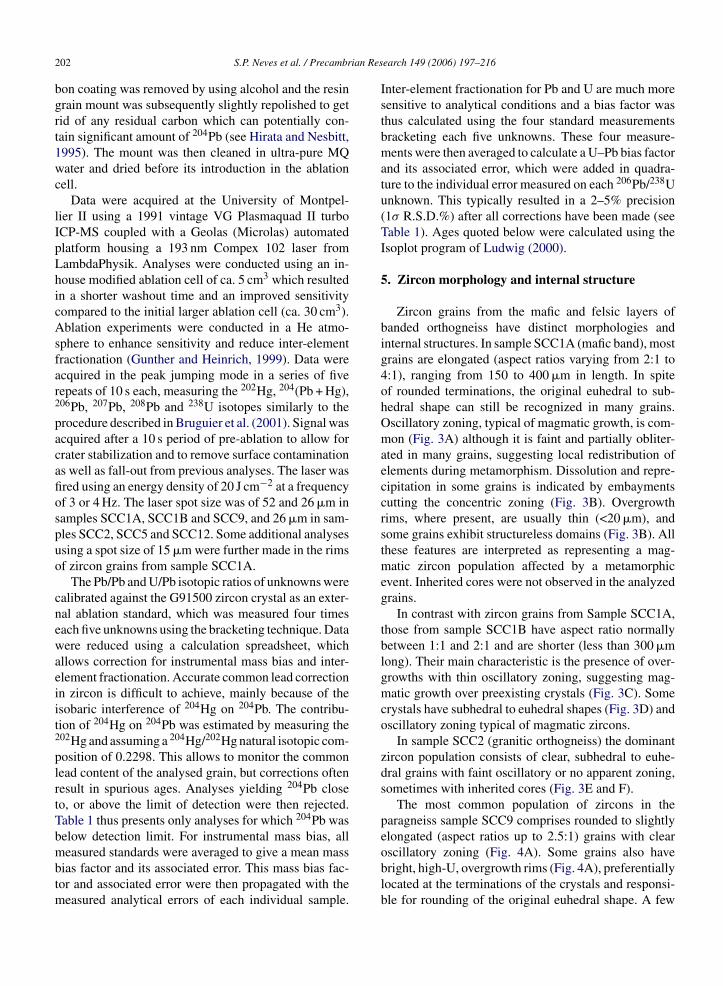
ian Res
202 S.P. Neves et al. / Precambrbon coating was removed by using alcohol and the resingrain mount was subsequently slightly repolished to getrid of any residual carbon which can potentially con-tain significant amount of 204Pb (see Hirata and Nesbitt,1995). The mount was then cleaned in ultra-pure MQwater and dried before its introduction in the ablationcell.
Data were acquired at the University of Montpel-lier II using a 1991 vintage VG Plasmaquad II turboICP-MS coupled with a Geolas (Microlas) automatedplatform housing a 193 nm Compex 102 laser fromLambdaPhysik. Analyses were conducted using an in-house modified ablation cell of ca. 5 cm3 which resultedin a shorter washout time and an improved sensitivitycompared to the initial larger ablation cell (ca. 30 cm3).Ablation experiments were conducted in a He atmo-sphere to enhance sensitivity and reduce inter-elementfractionation (Gunther and Heinrich, 1999). Data wereacquired in the peak jumping mode in a series of fiverepeats of 10 s each, measuring the 202Hg, 204(Pb + Hg),206Pb, 207Pb, 208Pb and 238U isotopes similarly to theprocedure described in Bruguier et al. (2001). Signal wasacquired after a 10 s period of pre-ablation to allow forcrater stabilization and to remove surface contaminationas well as fall-out from previous analyses. The laser wasfired using an energy density of 20 J cm−2 at a frequencyof 3 or 4 Hz. The laser spot size was of 52 and 26 �m insamples SCC1A, SCC1B and SCC9, and 26 �m in sam-ples SCC2, SCC5 and SCC12. Some additional analysesusing a spot size of 15 �m were further made in the rimsof zircon grains from sample SCC1A.
The Pb/Pb and U/Pb isotopic ratios of unknowns werecalibrated against the G91500 zircon crystal as an exter-nal ablation standard, which was measured four timeseach five unknowns using the bracketing technique. Datawere reduced using a calculation spreadsheet, whichallows correction for instrumental mass bias and inter-element fractionation. Accurate common lead correctionin zircon is difficult to achieve, mainly because of theisobaric interference of 204Hg on 204Pb. The contribu-tion of 204Hg on 204Pb was estimated by measuring the202Hg and assuming a 204Hg/202Hg natural isotopic com-position of 0.2298. This allows to monitor the commonlead content of the analysed grain, but corrections oftenresult in spurious ages. Analyses yielding 204Pb closeto, or above the limit of detection were then rejected.Table 1 thus presents only analyses for which 204Pb wasbelow detection limit. For instrumental mass bias, all
measured standards were averaged to give a mean massbias factor and its associated error. This mass bias fac-tor and associated error were then propagated with themeasured analytical errors of each individual sample.earch 149 (2006) 197–216
Inter-element fractionation for Pb and U are much moresensitive to analytical conditions and a bias factor wasthus calculated using the four standard measurementsbracketing each five unknowns. These four measure-ments were then averaged to calculate a U–Pb bias factorand its associated error, which were added in quadra-ture to the individual error measured on each 206Pb/238Uunknown. This typically resulted in a 2–5% precision(1σ R.S.D.%) after all corrections have been made (seeTable 1). Ages quoted below were calculated using theIsoplot program of Ludwig (2000).
5. Zircon morphology and internal structure
Zircon grains from the mafic and felsic layers ofbanded orthogneiss have distinct morphologies andinternal structures. In sample SCC1A (mafic band), mostgrains are elongated (aspect ratios varying from 2:1 to4:1), ranging from 150 to 400 �m in length. In spiteof rounded terminations, the original euhedral to sub-hedral shape can still be recognized in many grains.Oscillatory zoning, typical of magmatic growth, is com-mon (Fig. 3A) although it is faint and partially obliter-ated in many grains, suggesting local redistribution ofelements during metamorphism. Dissolution and repre-cipitation in some grains is indicated by embaymentscutting the concentric zoning (Fig. 3B). Overgrowthrims, where present, are usually thin (<20 �m), andsome grains exhibit structureless domains (Fig. 3B). Allthese features are interpreted as representing a mag-matic zircon population affected by a metamorphicevent. Inherited cores were not observed in the analyzedgrains.
In contrast with zircon grains from Sample SCC1A,those from sample SCC1B have aspect ratio normallybetween 1:1 and 2:1 and are shorter (less than 300 �mlong). Their main characteristic is the presence of over-growths with thin oscillatory zoning, suggesting mag-matic growth over preexisting crystals (Fig. 3C). Somecrystals have subhedral to euhedral shapes (Fig. 3D) andoscillatory zoning typical of magmatic zircons.
In sample SCC2 (granitic orthogneiss) the dominantzircon population consists of clear, subhedral to euhe-dral grains with faint oscillatory or no apparent zoning,sometimes with inherited cores (Fig. 3E and F).
The most common population of zircons in theparagneiss sample SCC9 comprises rounded to slightlyelongated (aspect ratios up to 2.5:1) grains with clear
oscillatory zoning (Fig. 4A). Some grains also havebright, high-U, overgrowth rims (Fig. 4A), preferentiallylocated at the terminations of the crystals and responsi-ble for rounding of the original euhedral shape. A few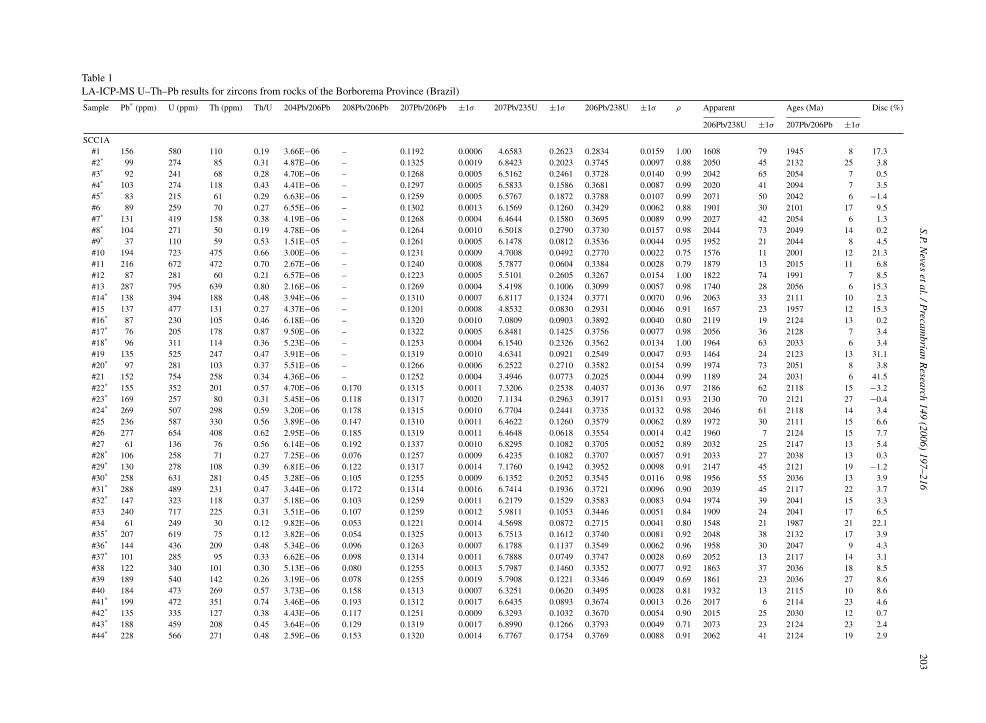
S.P.Neves
etal./Precam
brianR
esearch149
(2006)197–216
203Table 1LA-ICP-MS U–Th–Pb results for zircons from rocks of the Borborema Province (Brazil)
Sample Pb* (ppm) U (ppm) Th (ppm) Th/U 204Pb/206Pb 208Pb/206Pb 207Pb/206Pb ±1σ 207Pb/235U ±1σ 206Pb/238U ±1σ ρ Apparent Ages (Ma) Disc (%)
206Pb/238U ±1σ 207Pb/206Pb ±1σ
SCC1A#1 156 580 110 0.19 3.66E−06 – 0.1192 0.0006 4.6583 0.2623 0.2834 0.0159 1.00 1608 79 1945 8 17.3#2* 99 274 85 0.31 4.87E−06 – 0.1325 0.0019 6.8423 0.2023 0.3745 0.0097 0.88 2050 45 2132 25 3.8#3* 92 241 68 0.28 4.70E−06 – 0.1268 0.0005 6.5162 0.2461 0.3728 0.0140 0.99 2042 65 2054 7 0.5#4* 103 274 118 0.43 4.41E−06 – 0.1297 0.0005 6.5833 0.1586 0.3681 0.0087 0.99 2020 41 2094 7 3.5#5* 83 215 61 0.29 6.63E−06 – 0.1259 0.0005 6.5767 0.1872 0.3788 0.0107 0.99 2071 50 2042 6 −1.4#6 89 259 70 0.27 6.55E−06 – 0.1302 0.0013 6.1569 0.1260 0.3429 0.0062 0.88 1901 30 2101 17 9.5#7* 131 419 158 0.38 4.19E−06 – 0.1268 0.0004 6.4644 0.1580 0.3695 0.0089 0.99 2027 42 2054 6 1.3#8* 104 271 50 0.19 4.78E−06 – 0.1264 0.0010 6.5018 0.2790 0.3730 0.0157 0.98 2044 73 2049 14 0.2#9* 37 110 59 0.53 1.51E−05 – 0.1261 0.0005 6.1478 0.0812 0.3536 0.0044 0.95 1952 21 2044 8 4.5#10 194 723 475 0.66 3.00E−06 – 0.1231 0.0009 4.7008 0.0492 0.2770 0.0022 0.75 1576 11 2001 12 21.3#11 216 672 472 0.70 2.67E−06 – 0.1240 0.0008 5.7877 0.0604 0.3384 0.0028 0.79 1879 13 2015 11 6.8#12 87 281 60 0.21 6.57E−06 – 0.1223 0.0005 5.5101 0.2605 0.3267 0.0154 1.00 1822 74 1991 7 8.5#13 287 795 639 0.80 2.16E−06 – 0.1269 0.0004 5.4198 0.1006 0.3099 0.0057 0.98 1740 28 2056 6 15.3#14* 138 394 188 0.48 3.94E−06 – 0.1310 0.0007 6.8117 0.1324 0.3771 0.0070 0.96 2063 33 2111 10 2.3#15 137 477 131 0.27 4.37E−06 – 0.1201 0.0008 4.8532 0.0830 0.2931 0.0046 0.91 1657 23 1957 12 15.3#16* 87 230 105 0.46 6.18E−06 – 0.1320 0.0010 7.0809 0.0903 0.3892 0.0040 0.80 2119 19 2124 13 0.2#17* 76 205 178 0.87 9.50E−06 – 0.1322 0.0005 6.8481 0.1425 0.3756 0.0077 0.98 2056 36 2128 7 3.4#18* 96 311 114 0.36 5.23E−06 – 0.1253 0.0004 6.1540 0.2326 0.3562 0.0134 1.00 1964 63 2033 6 3.4#19 135 525 247 0.47 3.91E−06 – 0.1319 0.0010 4.6341 0.0921 0.2549 0.0047 0.93 1464 24 2123 13 31.1#20* 97 281 103 0.37 5.51E−06 – 0.1266 0.0006 6.2522 0.2710 0.3582 0.0154 0.99 1974 73 2051 8 3.8#21 152 754 258 0.34 4.36E−06 – 0.1252 0.0004 3.4946 0.0773 0.2025 0.0044 0.99 1189 24 2031 6 41.5#22* 155 352 201 0.57 4.70E−06 0.170 0.1315 0.0011 7.3206 0.2538 0.4037 0.0136 0.97 2186 62 2118 15 −3.2#23* 169 257 80 0.31 5.45E−06 0.118 0.1317 0.0020 7.1134 0.2963 0.3917 0.0151 0.93 2130 70 2121 27 −0.4#24* 269 507 298 0.59 3.20E−06 0.178 0.1315 0.0010 6.7704 0.2441 0.3735 0.0132 0.98 2046 61 2118 14 3.4#25 236 587 330 0.56 3.89E−06 0.147 0.1310 0.0011 6.4622 0.1260 0.3579 0.0062 0.89 1972 30 2111 15 6.6#26 277 654 408 0.62 2.95E−06 0.185 0.1319 0.0011 6.4648 0.0618 0.3554 0.0014 0.42 1960 7 2124 15 7.7#27 61 136 76 0.56 6.14E−06 0.192 0.1337 0.0010 6.8295 0.1082 0.3705 0.0052 0.89 2032 25 2147 13 5.4#28* 106 258 71 0.27 7.25E−06 0.076 0.1257 0.0009 6.4235 0.1082 0.3707 0.0057 0.91 2033 27 2038 13 0.3#29* 130 278 108 0.39 6.81E−06 0.122 0.1317 0.0014 7.1760 0.1942 0.3952 0.0098 0.91 2147 45 2121 19 −1.2#30* 258 631 281 0.45 3.28E−06 0.105 0.1255 0.0009 6.1352 0.2052 0.3545 0.0116 0.98 1956 55 2036 13 3.9#31* 288 489 231 0.47 3.44E−06 0.172 0.1314 0.0016 6.7414 0.1936 0.3721 0.0096 0.90 2039 45 2117 22 3.7#32* 147 323 118 0.37 5.18E−06 0.103 0.1259 0.0011 6.2179 0.1529 0.3583 0.0083 0.94 1974 39 2041 15 3.3#33 240 717 225 0.31 3.51E−06 0.107 0.1259 0.0012 5.9811 0.1053 0.3446 0.0051 0.84 1909 24 2041 17 6.5#34 61 249 30 0.12 9.82E−06 0.053 0.1221 0.0014 4.5698 0.0872 0.2715 0.0041 0.80 1548 21 1987 21 22.1#35* 207 619 75 0.12 3.82E−06 0.054 0.1325 0.0013 6.7513 0.1612 0.3740 0.0081 0.92 2048 38 2132 17 3.9#36* 144 436 209 0.48 5.34E−06 0.096 0.1263 0.0007 6.1788 0.1137 0.3549 0.0062 0.96 1958 30 2047 9 4.3#37* 101 285 95 0.33 6.62E−06 0.098 0.1314 0.0011 6.7888 0.0749 0.3747 0.0028 0.69 2052 13 2117 14 3.1#38 122 340 101 0.30 5.13E−06 0.080 0.1255 0.0013 5.7987 0.1460 0.3352 0.0077 0.92 1863 37 2036 18 8.5#39 189 540 142 0.26 3.19E−06 0.078 0.1255 0.0019 5.7908 0.1221 0.3346 0.0049 0.69 1861 23 2036 27 8.6#40 184 473 269 0.57 3.73E−06 0.158 0.1313 0.0007 6.3251 0.0620 0.3495 0.0028 0.81 1932 13 2115 10 8.6#41* 199 472 351 0.74 3.46E−06 0.193 0.1312 0.0017 6.6435 0.0893 0.3674 0.0013 0.26 2017 6 2114 23 4.6#42* 135 335 127 0.38 4.43E−06 0.117 0.1251 0.0009 6.3293 0.1032 0.3670 0.0054 0.90 2015 25 2030 12 0.7#43* 188 459 208 0.45 3.64E−06 0.129 0.1319 0.0017 6.8990 0.1266 0.3793 0.0049 0.71 2073 23 2124 23 2.4#44* 228 566 271 0.48 2.59E−06 0.153 0.1320 0.0014 6.7767 0.1754 0.3769 0.0088 0.91 2062 41 2124 19 2.9
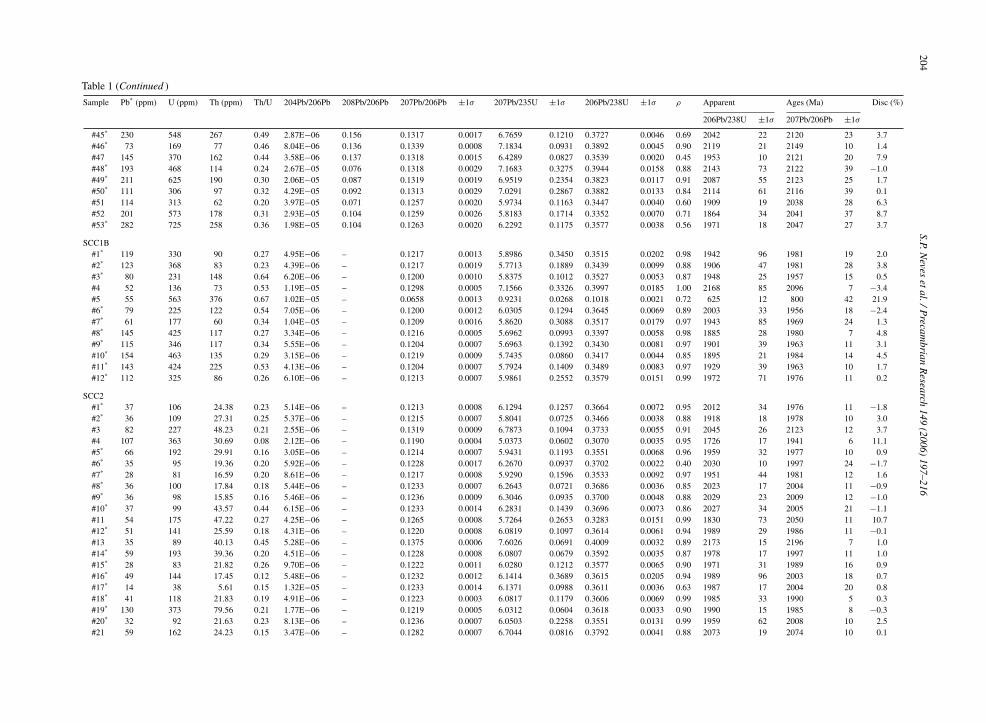
204S.P.N
evesetal./P
recambrian
Research
149(2006)
197–216
Table 1 (Continued )
Sample Pb* (ppm) U (ppm) Th (ppm) Th/U 204Pb/206Pb 208Pb/206Pb 207Pb/206Pb ±1σ 207Pb/235U ±1σ 206Pb/238U ±1σ ρ Apparent Ages (Ma) Disc (%)
206Pb/238U ±1σ 207Pb/206Pb ±1σ
#45* 230 548 267 0.49 2.87E−06 0.156 0.1317 0.0017 6.7659 0.1210 0.3727 0.0046 0.69 2042 22 2120 23 3.7#46* 73 169 77 0.46 8.04E−06 0.136 0.1339 0.0008 7.1834 0.0931 0.3892 0.0045 0.90 2119 21 2149 10 1.4#47 145 370 162 0.44 3.58E−06 0.137 0.1318 0.0015 6.4289 0.0827 0.3539 0.0020 0.45 1953 10 2121 20 7.9#48* 193 468 114 0.24 2.67E−05 0.076 0.1318 0.0029 7.1683 0.3275 0.3944 0.0158 0.88 2143 73 2122 39 −1.0#49* 211 625 190 0.30 2.06E−05 0.087 0.1319 0.0019 6.9519 0.2354 0.3823 0.0117 0.91 2087 55 2123 25 1.7#50* 111 306 97 0.32 4.29E−05 0.092 0.1313 0.0029 7.0291 0.2867 0.3882 0.0133 0.84 2114 61 2116 39 0.1#51 114 313 62 0.20 3.97E−05 0.071 0.1257 0.0020 5.9734 0.1163 0.3447 0.0040 0.60 1909 19 2038 28 6.3#52 201 573 178 0.31 2.93E−05 0.104 0.1259 0.0026 5.8183 0.1714 0.3352 0.0070 0.71 1864 34 2041 37 8.7#53* 282 725 258 0.36 1.98E−05 0.104 0.1263 0.0020 6.2292 0.1175 0.3577 0.0038 0.56 1971 18 2047 27 3.7
SCC1B#1* 119 330 90 0.27 4.95E−06 – 0.1217 0.0013 5.8986 0.3450 0.3515 0.0202 0.98 1942 96 1981 19 2.0#2* 123 368 83 0.23 4.39E−06 – 0.1217 0.0019 5.7713 0.1889 0.3439 0.0099 0.88 1906 47 1981 28 3.8#3* 80 231 148 0.64 6.20E−06 – 0.1200 0.0010 5.8375 0.1012 0.3527 0.0053 0.87 1948 25 1957 15 0.5#4 52 136 73 0.53 1.19E−05 – 0.1298 0.0005 7.1566 0.3326 0.3997 0.0185 1.00 2168 85 2096 7 −3.4#5 55 563 376 0.67 1.02E−05 – 0.0658 0.0013 0.9231 0.0268 0.1018 0.0021 0.72 625 12 800 42 21.9#6* 79 225 122 0.54 7.05E−06 – 0.1200 0.0012 6.0305 0.1294 0.3645 0.0069 0.89 2003 33 1956 18 −2.4#7* 61 177 60 0.34 1.04E−05 – 0.1209 0.0016 5.8620 0.3088 0.3517 0.0179 0.97 1943 85 1969 24 1.3#8* 145 425 117 0.27 3.34E−06 – 0.1216 0.0005 5.6962 0.0993 0.3397 0.0058 0.98 1885 28 1980 7 4.8#9* 115 346 117 0.34 5.55E−06 – 0.1204 0.0007 5.6963 0.1392 0.3430 0.0081 0.97 1901 39 1963 11 3.1#10* 154 463 135 0.29 3.15E−06 – 0.1219 0.0009 5.7435 0.0860 0.3417 0.0044 0.85 1895 21 1984 14 4.5#11* 143 424 225 0.53 4.13E−06 – 0.1204 0.0007 5.7924 0.1409 0.3489 0.0083 0.97 1929 39 1963 10 1.7#12* 112 325 86 0.26 6.10E−06 – 0.1213 0.0007 5.9861 0.2552 0.3579 0.0151 0.99 1972 71 1976 11 0.2
SCC2#1* 37 106 24.38 0.23 5.14E−06 – 0.1213 0.0008 6.1294 0.1257 0.3664 0.0072 0.95 2012 34 1976 11 −1.8#2* 36 109 27.31 0.25 5.37E−06 – 0.1215 0.0007 5.8041 0.0725 0.3466 0.0038 0.88 1918 18 1978 10 3.0#3 82 227 48.23 0.21 2.55E−06 – 0.1319 0.0009 6.7873 0.1094 0.3733 0.0055 0.91 2045 26 2123 12 3.7#4 107 363 30.69 0.08 2.12E−06 – 0.1190 0.0004 5.0373 0.0602 0.3070 0.0035 0.95 1726 17 1941 6 11.1#5* 66 192 29.91 0.16 3.05E−06 – 0.1214 0.0007 5.9431 0.1193 0.3551 0.0068 0.96 1959 32 1977 10 0.9#6* 35 95 19.36 0.20 5.92E−06 – 0.1228 0.0017 6.2670 0.0937 0.3702 0.0022 0.40 2030 10 1997 24 −1.7#7* 28 81 16.59 0.20 8.61E−06 – 0.1217 0.0008 5.9290 0.1596 0.3533 0.0092 0.97 1951 44 1981 12 1.6#8* 36 100 17.84 0.18 5.44E−06 – 0.1233 0.0007 6.2643 0.0721 0.3686 0.0036 0.85 2023 17 2004 11 −0.9#9* 36 98 15.85 0.16 5.46E−06 – 0.1236 0.0009 6.3046 0.0935 0.3700 0.0048 0.88 2029 23 2009 12 −1.0#10* 37 99 43.57 0.44 6.15E−06 – 0.1233 0.0014 6.2831 0.1439 0.3696 0.0073 0.86 2027 34 2005 21 −1.1#11 54 175 47.22 0.27 4.25E−06 – 0.1265 0.0008 5.7264 0.2653 0.3283 0.0151 0.99 1830 73 2050 11 10.7#12* 51 141 25.59 0.18 4.31E−06 – 0.1220 0.0008 6.0819 0.1097 0.3614 0.0061 0.94 1989 29 1986 11 −0.1#13 35 89 40.13 0.45 5.28E−06 – 0.1375 0.0006 7.6026 0.0691 0.4009 0.0032 0.89 2173 15 2196 7 1.0#14* 59 193 39.36 0.20 4.51E−06 – 0.1228 0.0008 6.0807 0.0679 0.3592 0.0035 0.87 1978 17 1997 11 1.0#15* 28 83 21.82 0.26 9.70E−06 – 0.1222 0.0011 6.0280 0.1212 0.3577 0.0065 0.90 1971 31 1989 16 0.9#16* 49 144 17.45 0.12 5.48E−06 – 0.1232 0.0012 6.1414 0.3689 0.3615 0.0205 0.94 1989 96 2003 18 0.7#17* 14 38 5.61 0.15 1.32E−05 – 0.1233 0.0014 6.1371 0.0988 0.3611 0.0036 0.63 1987 17 2004 20 0.8#18* 41 118 21.83 0.19 4.91E−06 – 0.1223 0.0003 6.0817 0.1179 0.3606 0.0069 0.99 1985 33 1990 5 0.3#19* 130 373 79.56 0.21 1.77E−06 – 0.1219 0.0005 6.0312 0.0604 0.3618 0.0033 0.90 1990 15 1985 8 −0.3#20* 32 92 21.63 0.23 8.13E−06 – 0.1236 0.0007 6.0503 0.2258 0.3551 0.0131 0.99 1959 62 2008 10 2.5#21 59 162 24.23 0.15 3.47E−06 – 0.1282 0.0007 6.7044 0.0816 0.3792 0.0041 0.88 2073 19 2074 10 0.1

S.P.Neves
etal./Precam
brianR
esearch149
(2006)197–216
205Table 1 (Continued )
Sample Pb* (ppm) U (ppm) Th (ppm) Th/U 204Pb/206Pb 208Pb/206Pb 207Pb/206Pb ±1σ 207Pb/235U ±1σ 206Pb/238U ±1σ ρ Apparent Ages (Ma) Disc (%)
206Pb/238U ±1σ 207Pb/206Pb ±1σ
SCC5#1 47 134 74 0.55 1.15E−05 – 0.1283 0.0006 5.8296 0.2949 0.3295 0.0156 0.94 1836 75 2075 8 11.5#2 62 188 168 0.89 8.33E−06 – 0.1267 0.0006 5.9225 0.1740 0.3389 0.0099 0.99 1881 48 2053 8 8.4#3 47 171 129 0.76 1.16E−05 – 0.1219 0.0015 4.9253 0.2436 0.2930 0.0132 0.91 1657 65 1984 22 16.5#4 3 31 1 0.04 2.44E−04 – 0.0615 0.0009 0.8451 0.0713 0.0996 0.0046 0.94 612 27 658 30 7.1#5* 44 124 84 0.68 1.14E−05 – 0.1300 0.0010 6.5989 0.1624 0.3680 0.0081 0.90 2020 38 2099 14 3.7#6* 42 115 78 0.68 1.48E−05 – 0.1295 0.0005 6.6790 0.3127 0.3741 0.0173 0.99 2048 81 2091 6 2.0#7 120 341 383 1.12 8.01E−06 – 0.1291 0.0007 6.2820 0.3132 0.3529 0.0172 0.98 1949 81 2086 10 6.6#8 69 291 295 1.01 1.32E−05 – 0.1219 0.0004 4.3412 0.2316 0.2583 0.0136 0.98 1481 69 1984 6 25.4#9* 33 91 58 0.63 2.38E−05 – 0.1299 0.0005 6.5389 0.1601 0.3651 0.0088 0.99 2006 42 2097 7 4.3#10 62 205 156 0.76 1.51E−05 – 0.1235 0.0014 5.3041 0.2700 0.3116 0.0155 0.98 1748 76 2007 20 12.9#11 55 326 125 0.39 1.40E−05 – 0.1004 0.0008 2.5316 0.1016 0.1829 0.0072 0.98 1083 39 1631 15 33.6#12* 66 173 99 0.57 1.93E−05 – 0.1299 0.0004 6.8323 0.3240 0.3814 0.0179 0.99 2083 83 2097 6 0.7#13 33 103 64 0.62 2.57E−05 – 0.1294 0.0011 6.3456 0.1257 0.3557 0.0065 0.92 1962 31 2090 15 6.1#14* 70 186 146 0.78 1.30E−05 – 0.1304 0.0006 7.0925 0.3184 0.3945 0.0174 0.98 2144 80 2103 8 −1.9#15 46 136 84 0.62 2.26E−05 – 0.1246 0.0015 5.5176 0.1346 0.3245 0.0065 0.83 1812 32 2023 21 10.4#16 59 231 98 0.42 1.59E−05 – 0.1196 0.0012 4.3837 0.2096 0.2658 0.0124 0.98 1519 63 1950 18 22.1#17 62 163 118 0.72 1.11E−05 – 0.1278 0.0003 6.4429 0.3484 0.3657 0.0196 0.99 2009 92 2068 4 2.8#18* 63 183 125 0.68 1.45E−05 – 0.1300 0.0005 6.6770 0.3456 0.3725 0.0188 0.92 2041 88 2098 6 2.7#19 28 348 205 0.59 3.09E−05 – 0.0762 0.0024 1.1706 0.2002 0.1114 0.0077 0.98 681 45 1101 61 38.2#20* 52 149 127 0.85 1.48E−05 – 0.1305 0.0010 6.9160 0.1202 0.3843 0.0058 0.81 2096 27 2105 13 0.4#21* 36 102 86 0.85 2.31E−05 – 0.1297 0.0006 6.7763 0.2768 0.3790 0.0148 0.96 2072 69 2094 9 1.0#22 67 221 121 0.55 1.21E−05 – 0.1243 0.0004 5.5019 0.1117 0.3209 0.0065 0.99 1794 31 2020 6 11.2
SCC9#1 45 226 75 0.33 2.21E−05 0.136 0.0828 0.0014 2.1517 0.0465 0.1885 0.0026 0.65 1113 14 1264 32 11.9#2 53 309 28 0.09 1.57E−05 0.096 0.0789 0.0011 1.8376 0.0329 0.1688 0.0024 0.80 1006 13 1171 27 14.1#3 62 150 110 0.73 1.47E−05 0.219 0.1191 0.0002 5.9187 0.2116 0.3603 0.0117 0.91 1984 55 1943 4 −2.1#4 74 556 365 0.66 1.04E−05 0.208 0.0646 0.0001 1.1037 0.0340 0.1238 0.0038 1.00 753 22 763 5 1.3#5 83 566 162 0.29 8.74E−06 0.142 0.0798 0.0012 1.5553 0.0482 0.1414 0.0038 0.86 853 21 1191 31 28.4#6 21 104 78 0.74 3.12E−05 0.239 0.0786 0.0011 1.9876 0.0737 0.1835 0.0063 0.92 1086 34 1161 28 6.5#7 34 92 52 0.57 2.21E−05 0.198 0.1322 0.0018 5.9414 0.2243 0.3259 0.0115 0.93 1818 56 2128 24 14.5#8 292 764 298 0.39 4.39E−06 0.117 0.1234 0.0002 6.2161 0.2047 0.3653 0.0105 0.94 2007 49 2006 3 −0.1#9 29 229 72 0.31 1.74E−05 0.089 0.0658 0.0003 1.1328 0.0484 0.1249 0.0053 0.99 759 30 799 11 5.0#10 56 139 60 0.44 1.47E−05 0.110 0.1273 0.0009 6.7126 0.2754 0.3826 0.0154 0.98 2088 72 2060 13 −1.3#11 18 115 87 0.75 3.09E−05 0.265 0.0669 0.0004 1.2097 0.0333 0.1311 0.0035 0.98 794 20 835 12 4.9#12 20 149 2 0.01 3.40E−05 0.261 0.0678 0.0006 1.0954 0.0308 0.1171 0.0032 0.96 714 18 863 17 17.3#13 38 267 71 0.27 1.94E−05 0.098 0.0719 0.0007 1.3831 0.0179 0.1394 0.0011 0.63 842 6 984 21 14.5#14 27 220 167 0.76 3.00E−05 0.225 0.0677 0.0010 1.1012 0.0319 0.1180 0.0032 0.93 719 18 859 29 16.3#15 22 162 109 0.67 4.12E−05 0.203 0.1086 0.0016 1.7673 0.0339 0.1181 0.0015 0.65 719 8 1776 27 59.5#16 16 135 69 0.51 3.52E−05 0.112 0.0643 0.0010 1.0284 0.0266 0.1159 0.0024 0.80 707 14 752 33 6.0#17 64 181 59 0.32 1.40E−05 0.129 0.1202 0.0004 5.7776 0.2325 0.3487 0.0131 0.93 1928 62 1959 6 1.6#18 58 265 136 0.51 1.17E−05 0.160 0.0803 0.0006 2.1497 0.0673 0.1943 0.0059 0.97 1144 32 1203 16 4.9#19 13 99 65 0.66 5.95E−05 0.203 0.0647 0.0020 1.0637 0.0546 0.1193 0.0048 0.79 727 28 763 67 4.8#20 131 394 67 0.17 5.95E−06 0.087 0.1183 0.0003 5.0870 0.1057 0.3118 0.0064 0.99 1750 31 1931 5 9.4#21 43 349 100 0.29 1.51E−05 0.123 0.0718 0.0005 1.1083 0.0480 0.1120 0.0048 0.99 684 28 980 14 30.2#22 13 75 35 0.46 4.34E−05 0.201 0.0677 0.0005 1.3235 0.0516 0.1418 0.0054 0.98 855 30 860 17 0.6#23 14 90 39 0.43 3.41E−05 0.145 0.0710 0.0010 1.3802 0.0252 0.1411 0.0016 0.62 851 9 956 29 11.1#24 26 131 45 0.34 2.61E−05 0.342 0.1220 0.0010 2.5433 0.0257 0.1512 0.0009 0.62 908 5 1986 14 54.3

206S.P.N
evesetal./P
recambrian
Research
149(2006)
197–216
Table 1 (Continued )
Sample Pb* (ppm) U (ppm) Th (ppm) Th/U 204Pb/206Pb 208Pb/206Pb 207Pb/206Pb ±1σ 207Pb/235U ±1σ 206Pb/238U ±1σ ρ Apparent Ages (Ma) Disc (%)
206Pb/238U ±1σ 207Pb/206Pb ±1σ
#25 47 340 77 0.23 1.43E−05 0.139 0.0669 0.0012 1.1766 0.0228 0.1275 0.0009 0.35 774 5 835 38 7.4#26 27 187 69 0.37 2.23E−05 0.174 0.0780 0.0002 1.4617 0.0354 0.1359 0.0033 1.00 821 19 1147 4 28.4#27 28 201 203 1.01 2.70E−05 0.353 0.0617 0.0005 0.9321 0.0143 0.1095 0.0014 0.86 670 8 665 17 −3.3#28 22 149 42 0.28 2.39E−05 0.119 0.0659 0.0014 1.2907 0.0294 0.1420 0.0012 0.37 856 7 804 44 −6.5#29 21 122 72 0.59 3.85E−05 0.180 0.0734 0.0007 1.5632 0.0481 0.1545 0.0046 0.96 926 26 1025 19 9.6#30 91 725 171 0.24 7.39E−06 0.088 0.0703 0.0004 1.2421 0.0274 0.1282 0.0027 0.97 778 16 936 11 17.0#31 63 301 214 0.71 1.17E−05 0.238 0.0780 0.0005 2.0370 0.0388 0.1894 0.0034 0.94 1118 18 1147 13 2.5#32 87 442 333 0.75 9.36E−06 0.215 0.0787 0.0004 1.9194 0.0303 0.1768 0.0026 0.93 1049 14 1166 11 10.0#33 17 128 70 0.55 3.21E−05 0.178 0.0744 0.0016 1.2313 0.0417 0.1201 0.0031 0.77 731 18 1052 44 30.5#34 74 160 112 0.70 1.16E−05 0.203 0.1387 0.0006 7.5496 0.1135 0.3947 0.0057 0.96 2145 26 2211 7 3.0#35 36 240 110 0.46 1.56E−05 0.173 0.0741 0.0006 1.4389 0.0325 0.1408 0.0029 0.93 849 17 1045 17 18.8#36 44 312 112 0.36 1.90E−05 0.138 0.0682 0.0005 1.2866 0.0258 0.1369 0.0026 0.93 827 14 874 15 5.4#37 121 176 74 0.42 3.78E−06 0.127 0.2721 0.0020 20.9677 0.7087 0.5589 0.0184 0.98 2862 76 3318 11 13.7#38 44 333 156 0.47 1.79E−05 0.207 0.0685 0.0009 1.1344 0.0242 0.1202 0.0020 0.76 731 11 883 28 17.1
SCC12#1* 25 242 13 0.05 2.16E−05 – 0.0625 0.0008 0.8913 0.0227 0.1035 0.0023 0.87 635 13 690 26 7.9#2* 12 133 274 2.06 4.15E−05 – 0.0619 0.0006 0.8332 0.0305 0.0976 0.0034 0.96 600 20 671 22 10.5#3* 3 32 26 0.80 1.42E−04 – 0.0609 0.0018 0.8968 0.0314 0.1067 0.0020 0.55 654 12 637 62 −2.6#4* 4 42 60 1.44 1.35E−04 – 0.0601 0.0010 0.8720 0.0214 0.1053 0.0018 0.71 645 11 605 37 −6.6#5* 68 817 67 0.08 1.10E−05 – 0.0602 0.0004 0.8269 0.0673 0.0996 0.0081 1.00 612 47 611 15 −0.2#6* 20 218 307 1.41 1.77E−05 – 0.0604 0.0012 0.8145 0.0272 0.0978 0.0026 0.81 601 16 619 41 2.8#7 101 315 13 0.04 5.88E−06 – 0.1190 0.0008 5.3509 0.1082 0.3261 0.0062 0.94 1819 30 1942 12 6.3#8* 47 484 52 0.11 2.34E−05 – 0.0603 0.0006 0.8247 0.0275 0.0992 0.0031 0.95 610 18 613 23 0.5#9 57 185 18 0.10 1.22E−05 – 0.1225 0.0010 5.4307 0.0908 0.3214 0.0047 0.88 1797 23 1994 14 9.9#10 137 441 26 0.06 5.25E−06 – 0.1216 0.0010 5.3739 0.0755 0.3204 0.0037 0.81 1792 18 1980 15 9.5#11 125 360 28 0.08 5.56E−06 – 0.1229 0.0005 5.7922 0.2003 0.3418 0.0117 0.99 1895 56 1999 7 5.2#12 117 313 13 0.04 4.51E−06 – 0.1252 0.0011 6.4045 0.0931 0.3710 0.0044 0.81 2034 21 2032 15 −0.1#13* 6 59 20 0.34 1.07E−04 – 0.0607 0.0007 0.8585 0.0278 0.1026 0.0031 0.93 630 18 628 25 −0.3#14 119 355 12 0.03 6.08E−06 – 0.1237 0.0006 5.7574 0.0909 0.3376 0.0051 0.96 1875 24 2010 8 6.7
Errors are 1σ and refer to last digits. The right hand column is percentage discordance assuming recent lead losses. For each studied rock, analyses labelled * were included in the age calculation,whereas others were omitted.
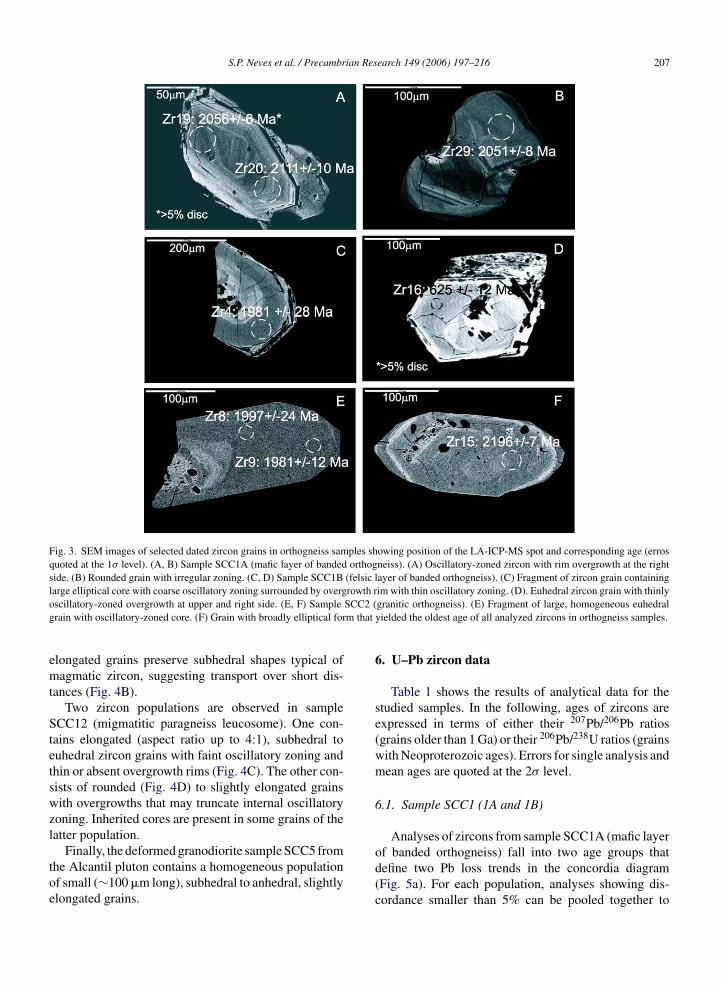
S.P. Neves et al. / Precambrian Research 149 (2006) 197–216 207
Fig. 3. SEM images of selected dated zircon grains in orthogneiss samples showing position of the LA-ICP-MS spot and corresponding age (errosquoted at the 1σ level). (A, B) Sample SCC1A (mafic layer of banded orthogneiss). (A) Oscillatory-zoned zircon with rim overgrowth at the rightside. (B) Rounded grain with irregular zoning. (C, D) Sample SCC1B (felsic layer of banded orthogneiss). (C) Fragment of zircon grain containingl rowth ro SCC2 (g m that
emt
Stetswzl
toe
arge elliptical core with coarse oscillatory zoning surrounded by overgscillatory-zoned overgrowth at upper and right side. (E, F) Samplerain with oscillatory-zoned core. (F) Grain with broadly elliptical for
longated grains preserve subhedral shapes typical ofagmatic zircon, suggesting transport over short dis-
ances (Fig. 4B).Two zircon populations are observed in sample
CC12 (migmatitic paragneiss leucosome). One con-ains elongated (aspect ratio up to 4:1), subhedral touhedral zircon grains with faint oscillatory zoning andhin or absent overgrowth rims (Fig. 4C). The other con-ists of rounded (Fig. 4D) to slightly elongated grainsith overgrowths that may truncate internal oscillatory
oning. Inherited cores are present in some grains of theatter population.
Finally, the deformed granodiorite sample SCC5 fromhe Alcantil pluton contains a homogeneous populationf small (∼100 �m long), subhedral to anhedral, slightlylongated grains.
im with thin oscillatory zoning. (D). Euhedral zircon grain with thinlygranitic orthogneiss). (E) Fragment of large, homogeneous euhedralyielded the oldest age of all analyzed zircons in orthogneiss samples.
6. U–Pb zircon data
Table 1 shows the results of analytical data for thestudied samples. In the following, ages of zircons areexpressed in terms of either their 207Pb/206Pb ratios(grains older than 1 Ga) or their 206Pb/238U ratios (grainswith Neoproterozoic ages). Errors for single analysis andmean ages are quoted at the 2σ level.
6.1. Sample SCC1 (1A and 1B)
Analyses of zircons from sample SCC1A (mafic layer
of banded orthogneiss) fall into two age groups thatdefine two Pb loss trends in the concordia diagram(Fig. 5a). For each population, analyses showing dis-cordance smaller than 5% can be pooled together to
208 S.P. Neves et al. / Precambrian Research 149 (2006) 197–216
Fig. 4. (A, B) SEM images of selected zircon grains in sample SCC9 (pelitic gneiss). (A) Rounded zircon grain with overgrowth rims at upper leftzircon
wing pounded
and lower right sides truncating oscillatory-zoned core. (B) Elongatedgrains in sample SSC12 (leucosome from migmatitic paragneiss) shoat the 1σ level). (C) Subhedral grain with thin overgrowth rim. (D) Ro
define 207Pb/206Pb weighted means of 2125 ± 7 and2044 ± 5 Ma (Fig. 5b). The clear distinction of these twoage groups strongly suggests that they correspond to twodifferent events. The lack of inherited cores in most zir-con grains suggests that the group with the older agerepresents igneous crystallization of the protolith. Thisis consistent with well preserved oscillatory zoning in thegrains where ca. 2125 Ma ages were obtained (Fig. 3A).Truncation of oscillatory zoning, recrystallized zones orregions with fading oscillatory zoning observed in somegrains (Figs. 3A and B) are typical of magmatic zir-cons modified by high-grade metamorphism (e.g. Corfuet al., 2003). The youngest age of ca. 2044 Ma is thusinterpreted as representing the Transamazonian meta-morphic event. Because there is no discernable differ-ence in the Th/U ratios between zircons of the two agegroups (Table 1), local redistribution by recrystalliza-tion processes without new metamorphic growth is themost likely explanation for the igneous-like high Th/U(>0.1; Williams and Claesson, 1987) ratio of the zir-con domains with ca. 2044 Ma ages. Overgrowth rimsthat clearly represent new zircon growth revealed tobe too thin to be accurately dated. Analyses showing
high discordance indicate Pb losses that could be relatedeither to a young (e.g. Brasiliano) event or to recent,zero age, disturbances, or even a combination of both(Fig. 5a).grain with no apparent zoning. (C, D) SEM images of selected zirconsition of the LA-ICP-MS spot and corresponding age (errors quoted
grain with thin overgrowth rims at the left and right sides.
Analyses of zircons from the leucocratic band SCC1Bdisplay a very different distribution when compared withsample SCC1A. Most grains plot close to Concordia(see Fig. 6a) at about 1.98 Ga, and, together with anal-ysis #5 (Table 1), define a discordia line with upperand lower intercepts of 1985 ± 12 and 578 ± 37 Ma(MSWD = 1.2). The upper intercept is well constrainedby concordant analyses and ten highly concordant grainsgive a 207Pb/206Pb weighted mean of 1972 ± 8 Ma(Fig. 6b), in agreement with the upper intercept age.The Th/U ratio of these grains (ranging from 0.2 to 0.7;Table 1) is typical of magmatic zircons (Williams andClaesson, 1987), which suggests that the 1972 Ma agecorresponds to crystallization of the zircons. Since theseanalyses were obtained from large rounded cores sur-rounded by a thin oscillatory zoned rim (see Fig. 3C), itis concluded that the age of 1972 Ma corresponds to thatof the source rocks that underwent anatexis to producethe leucocratic band. It is probably noteworthy that thisage is similar to the U–Pb age of 1974 Ma obtained by Saet al. (2002) from an orthogneiss some kilometers to thesoutheast (Fig. 2), suggesting that the orthogneiss wasthe main source component for the melt. One grain is
concordant at 2096 ± 14 Ma, indicating the source alsoincluded a ca. 2.1 Ga old component. One euhedral zir-con grain (see Fig. 3D) yielded a 206Pb/238U apparent ageof 625 ± 24 Ma (Fig. 6a). The high Th/U ratio (0.67) of
S.P. Neves et al. / Precambrian Research 149 (2006) 197–216 209
F(w
toptttfm
6
fc1eTa
ig. 5. (a) U–Pb concordia diagram for zircons from sample SCC1Amafic layer of banded orthogneiss). (b) Zoom showing the twoeighted mean ages of Paeloproterozoic zircons.
his grain (Table 1), its euhedral shape and the magmaticscillatory zoning of overgrowths (Fig. 3D) are inter-reted as indicating growth from a magma. Therefore,his age most likely corresponds to the crystallization ofhe leucocratic band, implying that the mesoscopic struc-ure of the banded orthogneiss is a late Neoproterozoiceature, resulting from intrusion of syntectonic graniticelts in a preexisting protolith.
.2. Sample SCC2
Sixteen near concordant analyses of zircon grainsrom the orthogneiss sample SCC2 yielded a well-onstrained 207Pb/206Pb weighted mean age of
991 ± 5 Ma (Fig. 7). Some of these grains still preserveuhedral shapes (Fig. 3E), which together with highh/U ratios (see Table 1) indicates crystallization frommagma. The 1991 ± 5 Ma age is thus interpreted asFig. 6. (a) Concordia diagram showing discordia line for zircons fromsample SCC1B (felsic layer of banded orthogneiss). (b) Zoom showingthe 206Pb/207Pb weighted mean age of concordant Paleoproterozoiczircons.
corresponding to crystallization of the granitic pro-tolith. Three other grains yielded older ages indicatinginherited source components of 2196 ± 14 (Fig. 3F),2123 ± 24 and 2074 ± 20 Ma. The two latter roughlycorrespond to the two mean ages obtained in sampleSCC1A. These results are interpreted as indicatingthat the granitic orthogneiss is a late-Transamazonianintrusion containing a small proportion of inheritedzircon grains.
6.3. Sample SCC9
U–Pb data for detrital zircons from paragneiss sam-ple SCC9 exhibit ages ranging from more than 3320 toca. 665 Ma (Table 1). Data is reported in the concor-dia diagram (Fig. 8a) and in a cumulative probability

210 S.P. Neves et al. / Precambrian Research 149 (2006) 197–216
Fig. 8. (a) U–Pb concordia diagram for zircons from sample SCC9(pelitic gneiss). Inset: zoom at the Neoproterzoic showing the U–Pbage of the youngest grain in the zircon population. Green, concor-dant grains; red, discordant grains. (b) Histogram plot for 206Pb/207Pb
Fig. 7. U–Pb concordia diagram for zircons from sample SCC2(granitic orthogneiss).
plot (Fig. 8b). Most analysis fall on or near the con-cordia curve and those with less than 5% discordanceshow age peaks at ca. 2220, 2060–1940, 1200–1150,860–760 and 665 ± 34 Ma. Several discordant grainshave ages between 1100 and 900 Ma and a small peakis observed around 1690 Ma. Grains from all age groupshave high Th/U ratios. Together with the oscillatory zon-ing observed in most grains, this indicates provenance ofgrains from igneous protoliths (Williams and Claesson,1987), which constrain the deposition of the supracrustalsequence to be younger than the youngest grain (ca.665 Ma) in the zircon population.
6.4. Sample SCC12
On a concordia plot (Fig. 9A), analyses of zirconsfrom the leucosome of a paragneiss, except for one (#7;Table 1) define a discordia line (MSWD = 1.1) with upperand lower intercepts at 2041 ± 15 and 626 ± 15 Ma,respectively. Paleoproterozoic ages were obtained fromrounded zircons grains (Fig. 4D) that have low Th/Uratios (0.04–0.1; Table 5), typical of metamorphic zir-cons. These grains are interpreted as inherited froma protolith metamorphosed at ca. 2040 Ma. This is inagreement with analysis #12 (Table 1), which is concor-dant at 2032 ± 30 Ma and reinforces the interpretation ofthe data for sample SCC1A that the peak of Transamazo-nian metamorphism occurred around this time. Zirconswith Neoproterozoic ages plot near the concordia andhave a 206Pb/238U weighted mean age of 632 ± 17 Ma
(Fig. 9b) overlapping the lower intercept of the discordialine. These grains yield both high and low Th/U ratios(Table 1) typical of magmatic and metamorphic zircons,respectively. The high Th/U ratios of some grains (upages of the analyzed zircons. Green, concordant grains; red, discor-dant grains. (For interpretation of the references to colour in this figurelegend, the reader is referred to the web version of the article.)
to 2.06) suggest that the laser beam struck a Th-richinclusion, whereas the euhedral shape (Fig. 4C) and lowTh/U ratio of other grains is typical of zircons grownunder high grade conditions. The most precise lowerintercept age of 626 ± 15 Ma is therefore interpreted asdating crystallization of the leucosome, and is thus takenas our best estimate for the high-grade metamorphism ofthe supracrustal sequence during the Brasiliano orogeny.
6.5. Sample SCC5
Analyses of zircon from the Alcantil pluton (SCC5;Table 1) define a discordia line (Fig. 10a) with upperand lower intercepts of 2103 ± 11 and 619 ± 36 Ma,

S.P. Neves et al. / Precambrian Research 149 (2006) 197–216 211
Fig. 9. (a) Concordia diagram showing discordia line for zircons fromsiz
ry6gophemTnuT
Foa
ample SCC12 (leucosome of migmatitic paragneiss). (b) Zoom show-ng the 206Pb/238U weighted mean age of concordant Neoproterozoicircons.
espectively. The lower intercept is constrained by anal-sis #4 (Table 1), which yielded a 206Pb/238U age of12 ± 54 Ma and a low Th/U ratio of 0.04, typical ofrowth in the solid state. This indicates that the gran-diorite was metamorphosed at 619 ± 36 Ma, the morerecise lower intercept of the discordia line. Most grainsave older, mainly Paleoproterozoic ages, and a batch ofight concordant analyses yields a 207Pb/206Pb weightedean age of 2097 ± 5 Ma (Fig. 10b). One grain (#17;able 1) has a low discordance degree, but yields a sig-ificantly younger age (2068 ± 8 Ma) suggesting it hasndergone disturbances, possibly during the ca. 2044 Maransamazonian event.
The above results could be interpreted in two ways.irst, that intrusion occurred during the Brasilianorogeny and that temperature remained high enoughfter emplacement to allow growth of metamorphic zir-
Fig. 10. (a) Concordia diagram showing discordia line for zircons fromsample SCC5 (Alcantil pluton). (b) Zoom showing the 206Pb/207Pbweighted mean age of concordant Paleoproterozoic zircons.
con. In this hypothesis, the zircon population would con-sist almost entirely of xenocrystic grains inherited from ahomogeneous Paleoproterozoic source. Because this is arather unusual situation for granitic magmas, the secondpossibility, that emplacement took place at 2097 ± 5 Maduring the Transamazonian orogeny, is considered morelikely. The emplacement age of ca. 2100 Ma is youngerbut comparable to that of the older age found in theorthogneiss sample SCC1A (ca. 2125 Ma), suggestingthat the Alcantil pluton could represent less strained por-tions of basement orthogneisses in the region.
7. Discussion
7.1. Tectonothermal evolution of the study area
This work clearly reveals that two main tectonother-mal events affected the study area, one in the Pale-

ian Res
212 S.P. Neves et al. / Precambroproterozoic (Transamazonian orogeny) and the otherat the end of the Neoproterozoic (Brasiliano orogeny).The age pattern of sample SCC1A (mafic layer ofbanded orthogneiss) allows placing tight constraints onthe events associated with the Transamazonian orogeny.The lack of inherited cores, as revealed by SEMimages, suggests that the age cluster of 2125 ± 7 Macorresponds to the crystallization age of the bandedorthogneiss protolith. Six whole-rock samples of bandedorthogneiss display geochemical characteristics simi-lar to calc-alkaline magmas, suggesting generation ina volcanic arc setting (Sa et al., 2002). Consideringthis, the age reported here could correspond to juve-nile crustal accretion. The younger age (2044 ± 5 Ma)found in sample SCC1A is associated with metamor-phic features observed in the analyzed zircon grainsand is interpreted as dating the peak of Transamazo-nian metamorphism, possibly marking a major colli-sional event. This is corroborated by the occurrenceof metamorphic zircons with this age in the paragneissleucosome sample SCC12. The age of 1992 ± 7 Ma ofsample SCC2 (granitic orthogneiss), and the mean ageof 1972 ± 8 Ma for xenocrystic zircons from sampleSCC1B (felsic layer of banded orthogneiss) are inter-preted as reflecting a stage of late to post-orogenicmagmatism.
The age pattern of the paragneiss sample SCC9reveals provenance of its protolith mainly from Paleo-proterozoic and mid-Neoproterozoic sources, and con-strains the deposition of the supracrustal sequence tobe younger than 665 Ma (Fig. 8a and b). The Paleo-proterozoic ages correspond closely to the Transama-zonian event and may represent derivation of detritalgrains from nearby orthogneisses, although more dis-tal sources cannot be excluded. Proximal sources withArchean ages that could provide the oldest analyzedzircon grain (>3320 Ma) have not yet been directlydated in the central domain, but their existence issuggested by Sm–Nd model ages of Paleoproterozoicorthogneisses (Van Schmus et al., 1995; Brito Neveset al., 2001b). However, even the oldest Sm–Nd agesare generally younger than 3300 Ma, which favors amore distal source. This source may be located eitherwithin an Archean nucleus identified in the northeast-ernmost part of the Borborema Province (Dantas etal., 1998, 2004), ∼250 km to the north of the studyarea, or within the Sao Francisco craton. Grains withlate Paleoproterozoic ages of ca. 1690 Ma may have
their source in augen gneisses/meta-anorthositic com-plexes (Accioly et al., 2000), which occur to the eastof the study area (Fig. 2A). The abundance of zir-con grains with ages in the interval 1200–1150 Ma isearch 149 (2006) 197–216
intriguing, as rocks with these ages have not yet beenidentified anywhere in the Borborema Province. It istentatively attributed to late Mesoproterozoic extensionand intraplate magmatism preceding the more exten-sive Cariris Velhos rifting event. Felsic volcanic rocksand granites related to the Cariris Velhos event (nowmetavolcanics and orthogneisses) in the Alto Pajeu beltconstitute the most likely source for zircons with ca.950–1050 Ma ages. A source for the abundant zircongrains with mid-Neoproterozoic ages might be relatedto magmatic episodes preceding and coeval with basinformation.
The Neoproterozoic age of one magmatic zircon inthe felsic layer of banded orthogneiss (625 ± 24 Ma),the maximum deposition age of the Surubim sequence(665 Ma), the crystallization age of the leucosome from amigmatitic paragneiss (626 ± 15 Ma), and the metamor-phic age of the Alcantil pluton (619 ± 36 Ma) show thathigh-temperature metamorphism was coeval with forma-tion of a flat-lying foliation in basement and supracrustalrocks. This metamorphism is clearly separated fromtranscurrent shear zone development because the oldestplutons deformed in the magmatic stage by strike-slipshearing are younger than 592 Ma (Guimaraes and DaSilva Filho, 1998; Neves et al., 2004). Although theimportance of the Transamazonian event in the studyarea is obvious, fieldwork (Neves et al., 2000, 2005) andthe geochronological results from this study indicate thatthe dominant mesoscopic ductile fabric in Paleoprotero-zoic orthogneisses was produced during the Brasilianoorogeny.
7.2. Regional correlations
7.2.1. Basement gneissesThe two age groups in sample SCC1A are similar
to those found in samples from the eastern portion ofthe Sao Francisco craton, where recent SHRIMP U–Pbdata indicate magmatic crystallization at 2.2–2.1 Ga andhigh-grade metamorphism at 2.08–2.05 Ga (Silva et al.,2002). In the Borborema Province, most zircon grainsthat yielded Paleoproterozoic U–Pb ages were analyzedby conventional methods (see Brito Neves et al., 2000,and Neves, 2003, for a review of available data). Thespread of ages, mainly from 2.25 to 2.0 Ga, may in partreflect mixed ages resulting from a combination of inher-ited zircon cores, primary igneous zircon crystalliza-tion, and metamorphic recrystallization. Nevertheless,
the existing data point out to an important period of crustgeneration at 2.2–2.1 Ga, followed by deformation andmetamorphism, and then by intrusion of late- to post-tectonic plutons.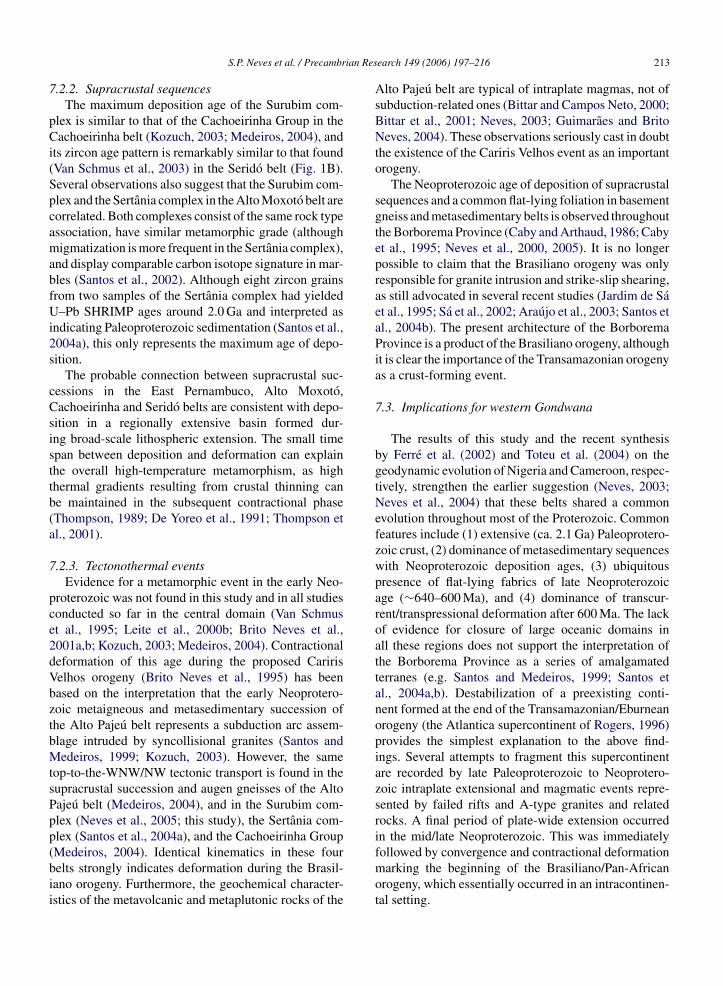
ian Res
7
pCi(SpcamabfUi2s
cCsisttb(a
7
pce2dVbztbMtsPpp(bii
S.P. Neves et al. / Precambr
.2.2. Supracrustal sequencesThe maximum deposition age of the Surubim com-
lex is similar to that of the Cachoeirinha Group in theachoeirinha belt (Kozuch, 2003; Medeiros, 2004), and
ts zircon age pattern is remarkably similar to that foundVan Schmus et al., 2003) in the Serido belt (Fig. 1B).everal observations also suggest that the Surubim com-lex and the Sertania complex in the Alto Moxoto belt areorrelated. Both complexes consist of the same rock typessociation, have similar metamorphic grade (althoughigmatization is more frequent in the Sertania complex),
nd display comparable carbon isotope signature in mar-les (Santos et al., 2002). Although eight zircon grainsrom two samples of the Sertania complex had yielded–Pb SHRIMP ages around 2.0 Ga and interpreted as
ndicating Paleoproterozoic sedimentation (Santos et al.,004a), this only represents the maximum age of depo-ition.
The probable connection between supracrustal suc-essions in the East Pernambuco, Alto Moxoto,achoeirinha and Serido belts are consistent with depo-
ition in a regionally extensive basin formed dur-ng broad-scale lithospheric extension. The small timepan between deposition and deformation can explainhe overall high-temperature metamorphism, as highhermal gradients resulting from crustal thinning cane maintained in the subsequent contractional phaseThompson, 1989; De Yoreo et al., 1991; Thompson etl., 2001).
.2.3. Tectonothermal eventsEvidence for a metamorphic event in the early Neo-
roterozoic was not found in this study and in all studiesonducted so far in the central domain (Van Schmust al., 1995; Leite et al., 2000b; Brito Neves et al.,001a,b; Kozuch, 2003; Medeiros, 2004). Contractionaleformation of this age during the proposed Caririselhos orogeny (Brito Neves et al., 1995) has beenased on the interpretation that the early Neoprotero-oic metaigneous and metasedimentary succession ofhe Alto Pajeu belt represents a subduction arc assem-lage intruded by syncollisional granites (Santos andedeiros, 1999; Kozuch, 2003). However, the same
op-to-the-WNW/NW tectonic transport is found in theupracrustal succession and augen gneisses of the Altoajeu belt (Medeiros, 2004), and in the Surubim com-lex (Neves et al., 2005; this study), the Sertania com-lex (Santos et al., 2004a), and the Cachoeirinha Group
Medeiros, 2004). Identical kinematics in these fourelts strongly indicates deformation during the Brasil-ano orogeny. Furthermore, the geochemical character-stics of the metavolcanic and metaplutonic rocks of theearch 149 (2006) 197–216 213
Alto Pajeu belt are typical of intraplate magmas, not ofsubduction-related ones (Bittar and Campos Neto, 2000;Bittar et al., 2001; Neves, 2003; Guimaraes and BritoNeves, 2004). These observations seriously cast in doubtthe existence of the Cariris Velhos event as an importantorogeny.
The Neoproterozoic age of deposition of supracrustalsequences and a common flat-lying foliation in basementgneiss and metasedimentary belts is observed throughoutthe Borborema Province (Caby and Arthaud, 1986; Cabyet al., 1995; Neves et al., 2000, 2005). It is no longerpossible to claim that the Brasiliano orogeny was onlyresponsible for granite intrusion and strike-slip shearing,as still advocated in several recent studies (Jardim de Saet al., 1995; Sa et al., 2002; Araujo et al., 2003; Santos etal., 2004b). The present architecture of the BorboremaProvince is a product of the Brasiliano orogeny, althoughit is clear the importance of the Transamazonian orogenyas a crust-forming event.
7.3. Implications for western Gondwana
The results of this study and the recent synthesisby Ferre et al. (2002) and Toteu et al. (2004) on thegeodynamic evolution of Nigeria and Cameroon, respec-tively, strengthen the earlier suggestion (Neves, 2003;Neves et al., 2004) that these belts shared a commonevolution throughout most of the Proterozoic. Commonfeatures include (1) extensive (ca. 2.1 Ga) Paleoprotero-zoic crust, (2) dominance of metasedimentary sequenceswith Neoproterozoic deposition ages, (3) ubiquitouspresence of flat-lying fabrics of late Neoproterozoicage (∼640–600 Ma), and (4) dominance of transcur-rent/transpressional deformation after 600 Ma. The lackof evidence for closure of large oceanic domains inall these regions does not support the interpretation ofthe Borborema Province as a series of amalgamatedterranes (e.g. Santos and Medeiros, 1999; Santos etal., 2004a,b). Destabilization of a preexisting conti-nent formed at the end of the Transamazonian/Eburneanorogeny (the Atlantica supercontinent of Rogers, 1996)provides the simplest explanation to the above find-ings. Several attempts to fragment this supercontinentare recorded by late Paleoproterozoic to Neoprotero-zoic intraplate extensional and magmatic events repre-sented by failed rifts and A-type granites and relatedrocks. A final period of plate-wide extension occurredin the mid/late Neoproterozoic. This was immediately
followed by convergence and contractional deformationmarking the beginning of the Brasiliano/Pan-Africanorogeny, which essentially occurred in an intracontinen-tal setting.
ian Res
214 S.P. Neves et al. / Precambr7.4. Summary and conclusions
The main conclusions of this study concerning thePrecambrian tectonic and geochronological evolution ofthe study area in the East Pernambuco belt can be sum-marized as follows: (1) 2.15–2.10 Ga: generation of juve-nile crust, (2) 2.05–2.03 Ga: peak Transamazonian meta-morphism, (3) 1.99–1.97 Ga: intrusion of late orogenicmagmas, (4) after 665 Ma: deposition of supracrustalsequences and (5) 630–610 Ma: development of flat-lying fabrics and Brasiliano high-grade metamorphism.Available data from the literature, in addition, support theintrusion of anorogenic plutons at 1.7–1.5 Ga (Acciolyet al., 2000; Sa et al., 2002), and the development oftranscurrent shear zones and abundant magmatism at590–580 Ma (Neves et al., 2000, 2004). Most of thesefeatures are found in other sectors of the BorboremaProvince (Neves, 2003) and in the Nigeria and Cameroonprovinces (Ferre et al., 2002; Toteu et al., 2004; Njiosseuet al., 2005), suggesting a shared evolution during mostof the Proterorozoic.
Acknowledgments
LA-ICP-MS analyses were conducted as part of post-doctoral studies by SPN financed by the Brazilian agencyConselho Nacional de Desenvolvimento Cientıfico e Tec-nologico (CNPq). Samples were collected during field-work funded by the Fundacao de Amparo a Cienciae Tecnologia do Estado de Pernambuco (FACEPE).The comments from two anonymous reviewers helpedimproving the manuscript.
References
Abdelsalam, M.G., Liegeois, J.-P., Stern, R.J., 2002. The SaharanMetacraton. J. African Earth Sci. 34, 119–136.
Accioly, A.C.A., McReath, I., Santos, E.J., Guimaraes, I.P., Vannuci,R., Bottazzi, R., 2000. The Passira meta-anorthositic complex andits tectonic implication, Borborema Province, Brazil. In: Proceed-ings of the 31st International Geological Congress, InternationalUnion of Geological Sciences, Rio de Janeiro.
Araujo, M.N.C., Silva, F.C.A., Sa, E.F.J., Holcombe, R.J., Vascon-celos, P.M., 2003. Microstructural evolution of the Serido Belt,NE-Brazil: the effect of two tectonic events on development of c-axis preferred orientation in quartz. J. Struct. Geol. 25, 2089–2107.
Archanjo, C.J., Fetter, A.H., 2004. Emplacement setting of the gran-ite sheeted pluton of Esperanca (Brasiliano orogen, northeasternBrazil). Precambrian Res. 133, 193–215.
Bittar, S.M.B., Campos Neto, M.C., 2000. Amalgamation during theBrasiliano orogeny in the Pianco-Alto Brıgida fold belt, Borboremaprovince, NE Brazil. In: Proceedings of the 31st International Geo-logical Congress, Internacional Union of Geological Sciences, Riode Janeiro.
earch 149 (2006) 197–216
Bittar, S.M.B., Guimaraes, I.P., Campos Neto, M.C., Kozuch, M.,Lima, E.S., Accioly, A.C.A., 2001. Geoquımica preliminar demetabasitos do complexo Riacho Gravata, domınio tectonico RioPajeu, PE-Brasil. Estudos Geol. 11, 53–66.
Brito Neves, B.B., Van Schmus, W.R., Santos, E.J., Campos Neto,M.C., Kozuch, M., 1995. O evento Cariris Velhos na Provıncia Bor-borema: integracao de dados, implicacoes e perspectivas. RevistaBrasileira de Geociencias 25, 279–296.
Brito Neves, B.B., Santos, E.J., Van Schmuss, W.R., 2000. Tectonichistory of the Borborema province. In: Cordani, U.G., Milani, E.J.,Thomaz Filho, A., Campos, D.A. (Eds.), Tectonic Evolution ofSouth America. Proceedings of the 31st International GeologicalCongress. Rio de Janeiro, pp. 151–182.
Brito Neves, B.B., Campos Neto, M.C., Van Schmus, W.R., San-tos, E.J., 2001a. O “Sistema” Pajeu-Paraiba e o “Macico” SaoJose do Campestre no leste da Borborema. Revista Brasileira deGeociencias 31, 173–184.
Brito Neves, B.B., Campos Neto, M.C., Van Schmus, W.R., Fer-nandes, T.M.G., Souza, S.L., 2001b. O terreno Alto Moxoto noleste da Paraıba (Macico Caldas Brandao). Revista Brasileira deGeociencias 31, 185–194.
Bruguier, O., Telouk, P., Cocherie, A., Fouillac, A.M., Albarede, F.,2001. Evaluation of Pb–Pb and U–Pb laser ablation ICP-MS zircondating using matrix-matched calibration samples with a frequencyquadrupled (266 nm) Nd-YAG laser. Geostandards Newslett. 25,361–373.
Caby, R., Arthaud, M.H., 1986. Major Precambrian nappes of theBrazilian belt, Ceara, northeast Brazil. Geology 14, 871–874.
Caby, R., Sial, A.N., 1997. Kyanite–garnet–staurolite thermal aure-oles around some Neoproterozoic epidote-bearing granitoids, NEBrazil. In: Proceedings of the II International Symposium on Gran-ites and Associated Mineralizations, Salvador, p. 183 (abstracts).
Caby, R., Sial, A.N., Arthaud, M.H., Vauchez, A., 1991. Crustal evolu-tion and the Brasiliano orogeny in Northeast Brazil. In: Dallmeyer,R.D., Lecorche, J.P. (Eds.), The West African Orogens and Circum-Atlantic Correlatives. Springer, Berlin, pp. 373–397.
Caby, R., Arthaud, M.H., Archanjo, C.J., 1995. Lithostratigraphy andpetrostructural characterization of supracrustal units in the Brasil-iano Belt of Northeast Brazil: geodynamic implications. J. S. Am.Earth Sci. 8, 235–246.
Castaing, C., Feybesse, J.L., Thieblemont, D., Triboulet, C.,Chevremont, P., 1994. Paleogeographical reconstructions of thePan-African/Brasiliano orogen: closure of an oceanic domain orintracontinental convergence between major blocks? PrecambrianRes. 69, 327–344.
Corfu, F., Hanchar, J.M., Hoskin, P.W.O., Kinny, P., 2003. Atlas ofzircon textures. Rev. Mineral. Geochem. 53, 469–500.
Dantas, E.L., Hackspacher, P.C., Van Schmus, W.R., Brito Neves,B.B., 1998. Archean accretion in the Sao Jose do Campestre Mas-sif, Borborema Province, Northeast Brazil. Revista Brasileira deGeociencias 28, 221–228.
Dantas, E.L., Van Schmus, W.R., Hackspacher, P.C., Fetter, A.H., BritoNeves, B.B., Cordani, U., Nutman, A.P., Williams, I.S., 2004. The3.4–3.5 Ga Sao Jose do Campestre massif, NE Brazil: Remnantsof the oldest crust in South America. Precambrian Res. 130, 113–137.
De Yoreo, J.J., Lux, D.R., Guidotti, C.V., 1991. Thermal modelling
in low-pressure/high-temperature metamorphic belts. Tectono-physics 188, 209–238.Ferre, E., Gleizes, G., Caby, R., 2002. Obliquely convergent tecton-ics and granite emplacement in the Trans-Saharan belt of EasternNigeria: a synthesis. Precambrian Res. 114, 199–219.

ian Res
F
G
G
G
G
G
H
J
K
K
L
L
L
M
M
M
S.P. Neves et al. / Precambr
erreira, V.P., Sial, A.N., Jardim de Sa, E.F., 1998. Geochemical andisotopic signatures of Proterozoic granitoids in terranes of the Bor-borema structural province, northeastern Brazil. J. S. Am. EarthSci. 11, 439–455.
omes, H.A., 2001. Geologia e Recursos Minerais do Estado de Per-nambuco. In: Ministerio de Minas e Energia. Secretaria de Minase Metalurgia. CPRM—Servico Geologico do Brasil, p. 127.
uimaraes, I.P., Da Silva Filho, A.F., 1998. Nd- and Sr-isotopicand U–Pb geochronologic constraints for the evolution of theshoshonitic Brasiliano Bom Jardim and Toritama complexes: evi-dence for a Transamazonian enriched mantle under Borborematectonic province, Brazil. Int. Geol. Rev. 40, 500–527.
uimaraes, I.P., Brito Neves, B.B., 2004. Geochemistry characteriza-tion of part of the Early Neoproterozoic plutonism in the CentralStructural Domain of the Borborema Province, NE Brazil. In:Proceedings of the 32nd International Geological Congress, Inter-national Union of Geological Sciences, Firenze.
uimaraes, I.P., Da Silva Filho, A.F., Almeida, C.N., Van Schmus,W.R., Araujo, J.M.M., Melo, S.C., Melo, E.B., 2004. Brasiliano(Pan-African) granite magmatism in the Pajeu-Paraıba belt, North-east Brazil: An isotopic and geochronological approach. Precam-brian Res. 135, 23–53.
unther, D., Heinrich, C.A., 1999. Comparison of the ablation behav-ior of 266 nm Nd:YAG and 193 nm ArF excimer lasers for LA-ICP-MS analyses. J. Anal. Atomic Spectr. 14, 1369–1374.
irata, T., Nesbitt, R.W., 1995. U–Pb isotope geochronology ofzircon—evaluation of the laser probe-inductively coupled plasma-mass spectrometry technique. Geochimica et Cosmochimica Acta59, 2491–2500.
ardim de Sa, E.F., Macedo, M.H.F., Pecault, J.J., Kawashita, K.,Souza, Z.S., Bertrand, J.M., 1995. Pre-brasiliano orogenic evo-lution in the Serido Belt NE Brazil: Conflicting geochronologicaland structural data. Revista Brasileira de Geociencias 25, 307–314.
ozuch, M., 2003. Isotopic and Trace Element Geochemistry of EarlyNeoproterozoic Gneissic and Metavolcanic Rocks in the CaririsVelhos Orogen of the Borborema Province, Brazil, and Their Bear-ing on Tectonic Setting. PhD Thesis. University of Kansas.
ozuch, M., Bittar, S.M.B., Van Schmus, S.M., Brito Neves, B.B.,1997. Late Mesoproterozoic and middle Neoproterozoic magma-tism in the Zona Transversal of the Borborema Province, Brazil.In: SBG-Nucleo Nordeste (Ed.), Proceedings of the 17th Simposiode Geologia do Nordeste. Fortaleza, pp. 47–50.
eite, P.R.B., Lima, E.S., Mariano, G., 2000a. Geochemical charac-terization of granites of distinctly different ages in the Alto PajeuTerrane, Borborema Province, Northeast Brazil. Int. Geol. Rev. 42,555–564.
eite, P.R.B., Bertrand, J.M., Lima, E.S., Leterrier, J., 2000b. Timingof granite magmatism in the northern Borborema Province, Brazil:a U–Pb study of granitoids from the Alto Pajeu Terrain. J. S. Am.Earth Sci. 13, 549–559.
udwig, K.R., 2000. Decay constant errors in U–Pb concordia-intercept ages. Chem. Geol. 166, 315–318.
ariano, G., Neves, S.P., Da Silva Filho, A., Guimaraes, I.P., 2001.Diorites of the high-K calc-alkalic association: Geochemistry andSm–Nd data and implications for the evolution of the BorboremaProvince, Northeast Brazil. Int. Geol. Rev. 43, 921–929.
edeiros, V.C., 2004. Evolucao Geodinamica e Condicionamento
Estrutural dos Terrenos Pianco-Alto Brıgida e Alto Pajeu, Domınioda Zona Transversal, NE do Brasil. PhD Thesis. Universidade Fed-eral do Rio Grande do Norte.elo, O.O., Guimaraes, I.P., Fetter, A., Beurlen, H., 2002. Idades U/Pbem zircao e idades modelo (Sm/Nd) de ortognaisses e enclaves
earch 149 (2006) 197–216 215
metamorficos da area de Barro Vermelho-PE, terreno Alto Moxoto,Provıncia Borborema, Nordeste do Brasil. Revista Brasileira deGeociencias 32, 197–204.
Neves, S.P., 2003. Proterozoic history of the Borborema Province (NEBrazil): correlations with neighboring cratons and Pan-Africanbelts, and implications for the evolution of western Gondwana.Tectonics 22, 1031, doi:10.1029/2001TC001352.
Neves, S.P., Mariano, G., 1999. Assessing the tectonic significanceof a large-scale transcurrent shear zone system: the Pernambucolineament, northeastern Brazil. J. Struct. Geol. 21, 1369–1383.
Neves, S.P., Vauchez, A., Feraud, G., 2000. Tectono-thermal evolution,magma emplacement, and shear zone development in the Caru-aru area (Borborema Province, NE Brazil). Precambrian Res. 99,1–32.
Neves, S.P., Melo, S.C., Moura, C.A.V., Mariano, G., Silva, J.M.R.,2004. Zircon Pb–Pb geochronology of the Caruaru area, north-eastern Brazil: temporal constraints on the Proterozoic evolutionof Borborema Province. Int. Geol. Rev. 46, 52–63.
Neves, S.P., Silva, J.M.R., Mariano, G., 2005. Oblique lineations inorthogneisses and supracrustal rocks: vertical partitioning of strainin a hot crust (eastern Borborema Province, NE Brazil). J. Struct.Geol. 27, 1513–1527.
Njiosseu, E.L.T., Nzenti, J.P., Njanko, T., Kapajika, B., Nedelec, A.,2005. New U–Pb zircon ages from Tonga (Cameroon): coexist-ing Eburnean-Transamazonian (2.1 Ga) and Pan-African (0.6 Ga)imprints. Comptes Rendus Geosci. 337, 551–562.
Rogers, J.J.W., 1996. A history of continents in the past three billionyears. J. Geol. 104, 91–107.
Sa, J.M., Bertrand, J.M., Leterrier, J., Macedo, M.H.F., 2002. Geo-chemistry and geochronology of pre-Brasiliano rocks from theTransversal Zone, Borborema Province, Northeast Brazil. J. S. Am.Earth Sci. 14, 851–866.
Santos, E.J., 1995. O complexo granıtico de Lagoa das Pedras:Acrescao e colisao na regiao de Floresta (PE), Provıncia Bor-borema. PhD Thesis. Universidade de Sao Paulo.
Santos, E.J., Medeiros, V.C., 1999. Constraints from granitic plutonismon Proterozoic crustal growth of the Transverse Zone, BorboremaProvince, NE Brazil. Revista Brasileira de Geociencias 29, 73–84.
Santos, E.J., Nutman, A.P., Brito Neves, B.B., 2004a. Idades SHRIMPU–Pb do Complexo Sertania: implicacoes sobre a evolucaotectonica da zona transversal, Provıncia Borborema. GeologiaUSP: Serie Cientıfica 4, 1–12.
Santos, E.J., Brito Neves, B.B., Van Schmus, W.R., 2004b. Tectonicevents preceding the Brasiliano cycle in the Borborema province,NE Brazil: implications for Rodinia reconstructions. In: Proceed-ings of the 32nd International Geological Congress, InternationalUnion of Geological Sciences, Firenze.
Santos, V.H., Ferreira, V.P., Sial, A.N., Babinski, M., Pimentel, M.M.,2002. C, Pb and Sr isotopic chemostratigraphy in Proterozoiccarbonate sequences in the eastern Transversal Domain of the Bor-borema Province, northeastern Brazil. In: Proceedings of the 41stCongresso Brasileiro de Geologia, Joao Pessoa, p. 507 (abstracts).
Sial, A.N., 1993. Contrasting metaluminous magmatic epidote-bearingsuites from two Precambrian fold belts in Northeast Brazil. Anaisda Academia Brasileira de Ciencias 65, 141–162.
Silva, J.M.R., Mariano, G., 2000. Geometry and kinematics of theAfogados da Ingazeira shear zone, Northeast Brazil. Int. Geol. Rev.
42, 86–95.Silva, L.C., McNaughton, N.J., Vasconcelos, A.L., Gomes, J.C.R.,Fletcher, I.R., 1997. U–Pb SHRIMP ages in southern state of Ceara,Borborema Province, Brazil: Archean TTG accretion and Pro-terozoic crustal reworking. In: Proceedings of the II International
ian Res
216 S.P. Neves et al. / PrecambrSimposium on Granites and Associated Minealizations, Salvador,pp. 280–281.
Silva, L.C., Armstrong, R., Delgado, I.M., Pimentel, M.M., Arcanjo,J.B., Melo, R.C., Teixeira, L.R., Jost, H., Cardoso Filho, J.M.,Pereira, L.H.M., 2002. Reavaliacao da evolucao geologica em ter-renos pre-cambrianos brasileiros com base em novos dados U–PbSHRIMP Parte I: Limite centro-oriental do craton Sao Franciscona Bahia. Revista Brasileira de Geociencias 32, 501–512.
Thompson, P.H., 1989. Moderate overthickening of thinned sialic crustand the origin of granitic magmatism and regional metamorphismin low-P-high-T terranes. Geology 17, 520–523.
Thompson, A.B., Schulmann, K., Jezek, J., Tolar, V., 2001. Thermallysoftened continental extensional zones (arcs and rifts) as precursorsto thickened orogenic belts. Tectonophysics 332, 115–141.
Toteu, S.F., Penaye, J., Djomani, Y.P., 2004. Geodynamic evolutionof the Pan-African belt in central Africa with special reference toCameroon. Can. J. Earth Sci. 41, 73–85.
Trompette, R., 1997. Neoproterozoic (∼600 Ma) aggregation of west-ern Gondwana: a tentative scenario. Precambrian Res. 82, 101–112.
Van Schmus, W.R., Brito Neves, B.B., Hackspacher, P., Babinski, M.,1995. U/Pb and Sm/Nd geochronologic studies of the eastern Bor-
earch 149 (2006) 197–216
borema Province, northeastern Brazil: initial conclusions. J. S. Am.Earth Sci. 8, 267–288.
Van Schmus, W.R., Brito Neves, B.B., Williams, I.S., Hackspacher,P.C., Fetter, A.H., Dantas, E.L., Babinsky, M., 2003. The SeridoGroup of NE Brazil, a late Neoproterozoic pre- to syn-collisionalbasin in West Gondwana: Insights from SHRIMP U–Pb detritalzircon ages and Sm–Nd crustal residence (TDM) ages. PrecambrianRes. 127, 287–327.
Vauchez, A., Egydio-Silva, M., 1992. Termination of a continental-scale strike-slip fault in partially melted crust: the West Pernam-buco shear zone, northeast Brazil. Geology 20, 1007–1010.
Vauchez, A., Neves, S.P., Caby, R., Corsini, M., Egydio-Silva, M.,Arthaud, M.H., Amaro, V., 1995. The Borborema shear zone sys-tem, NE Brazil. J. S. Am. Earth Sci. 8, 247–266.
Wiedenbeck, M., Alle, P., Corfu, F., Griffin, W.L., Meier, M., Oberli,F., von Quadt, A., Ruddick, J.C., Spiegel, W., 1995. Three natu-ral zircon standards for U–Th–Pb, Lu–Hf, trace element and REE
analyses. Geostandards Newslett. 19, 1–23.Williams, I.S., Claesson, S., 1987. Isotopic evidence for the Precam-brian provenance and Caledonian metamorphism of high-gradeparagneiss from the Seve Nappes, Scandinavian Caledonides. Con-tribut. Mineral. Petrol. 97, 205–217.

Geol. Mag.: page 1 of 8. c© 2007 Cambridge University Press 1doi:10.1017/S001675680700310X
Record of a Palaeogene syn-collisional extension in the northAegean region: evidence from the Kemer micaschists
(NW Turkey)
LAURENT BECCALETTO∗, NIKOLAY BONEV†, DELPHINE BOSCH‡& OLIVIER BRUGUIER§
∗Institute of Geology and Paleontology, University of Lausanne, CH-1015 Lausanne, Switzerland†Department of Geology and Paleontology, Sofia University ‘St. Kliment Ohridski’, 15 Tzar Osvoboditel Bd.,
1504 Sofia, Bulgaria‡Laboratoire de Tectonophysique, Universite de Montpellier II, UMR 5568-CNRS/UMII, Place E. Bataillon,
34 095 Montpellier Cedex 05, France§Service ICP-MS, ISTEEM, Universite de Montpellier II, Place E. Bataillon, 34 095 Montpellier Cedex 05, France
(Received 28 February 2006; accepted 29 June 2006)
Abstract – In NW Turkey, the medium-grade Kemer micaschists of the Biga Peninsula record NE-directed extension related to ductile to brittle–ductile shearing during the Palaeogene period: a lowerlimit for their exhumation is given by the Late Maastrichtian age of the HP–LT metamorphism of asimilar nearby area (Camlıca micaschists); an upper limit is given by the Early Eocene intrusion age ofthe post-kinematic Karabiga granitoid, dated as 52.7 ± 1.9 Ma using the U–Pb LA–ICP–MS methodon xenotime. Correlations with the northeasterly Rhodope region and integration into the geodynamicregional frame indicate that the Kemer micaschists experienced an extensional deformation connectedto a collisional context in latest Cretaceous–early Tertiary times. The Kemer micaschists thereforerepresent a new area (the first in Turkey), which suffered synorogenic extension in the north Aegeandomain at the very beginning of Tertiary times.
Keywords: ductile shear, metamorphism, extension, north Aegean, U–Pb (LA–ICP–MS) geochrono-logy, xenotime.
1. Introduction
Since the 1980s, much effort has been made to un-derstand the geodynamic evolution of mountain belts,from the convergent phase to their final collapse. Morespecifically, many studies focused on the exhumationprocesses bringing deformed metamorphic rocks upto the surface. Erosion does not behave alone, and asignificant part of the exhumation relates to extensionalcrustal-scale shear zones (Wernicke, 1981; Platt,1986). Several studies have distinguished synorogenicextension, taking place during the build-up of themountain belt, from post-orogenic extension, occurringonce the building processes have stopped (Malavieille,1997; Jolivet & Goffe, 2000).
The Aegean region is definitively accepted as anatural laboratory for studying extensional processes(e.g. Lister, Banga & Feenstra, 1984; Jolivet & Patriat,1999). In this area, the exhumation-related extensionalshearing took place in both syn- and post-orogeniccontexts, following several cycles of subduction–collision since the Late Cretaceous epoch (Jolivet &Faccenna, 2000).
∗Author for correspondence: [email protected]
Although a few regions, such as the Rhodope Massif,Cycladic Islands and Menderes Massif, have been thefocus of most of the recent studies (Dinter & Royden,1993, Gautier & Brun, 1994; Bozkurt & Oberhansli,2001; Ring & Collins, 2005), there are still some areaswhere the data are scarce, but whose investigationwould significantly increase our knowledge of theexhumation processes in the Aegean region. Despite itskey location in the Aegean region, east of the RhodopeMassif and north of the Menderes Massif, the BigaPeninsula of NW Turkey is one of these poorly knownareas (Fig. 1). Recent studies have already demon-strated the occurrence of Oligo-Miocene exhumationprocesses in the southern peninsula (post-orogenicextension of the Kazdag Core Complex: Okay & Satır,2000a), but there were no results indicating an earlierextensional phase.
In the northern part of the Biga Peninsula, a NE–SW-trending strip of micaschists is exposed along thesouthern coast of the Marmara Sea (Fig. 1). Thesemetamorphic rocks are the northern extension andcounterpart of the Camlıca metamorphics croppingout west of the peninsula (Okay, Siyako & Burkan,1991). There, the metamorphic rocks contain relicsof an eclogitic HP–LT metamorphism, dated as 65–69 Ma (Okay & Satır, 2000b). The kinematic pattern

2 L. BECCALETTO AND OTHERS
Figure 1. Geological map and kinematic pattern of the Kemer micaschists. The metamorphic rocks are intruded by the Eocene Karabigagranitoid, and separated from the Cetmi melange and Palaeocene–Eocene volcanics by recent strike-slip faults. The location of thedated granitoid sample (KB90) is shown in the upper left inset (the geological map of the Biga Peninsula is modified from Sıyako,Burkan & Okay, 1989).
and deformation age of both occurrences, however, arepoorly known. This contribution documents fabrics andkinematics of ductile, extension-related shear deform-ation in the micaschists of the northern occurrence,namely the Kemer micaschists. It also gives new laserablation ICP–MS xenotime U–Pb age data from a post-kinematic granite, which post-dated the extensionaltectonics. Finally, we compare our results to the ex-tensional geodynamic framework of the northernmostAegean region.
2. Geological setting
Noteworthy geological features of the Biga Peninsulainclude (a) the various units of the pre-Liassic KarakayaComplex (Okay et al. 1996; Okay & Goncuoglu,2004); (b) the accretion-related pre-Cenomanian Cetmimelange and the ophiolitic Ezine Zone (Okay, Siyako &Burkan, 1991; Beccaletto & Jenny, 2004; Beccalettoet al. 2005), whose geodynamic evolution is related tothat of the Rhodope; (c) high- to medium-grade meta-morphic rock (Okay & Satır, 2000a,b), including theKemer micaschists, systematically occurring at the
base of the previously mentioned units; and (d) Tertiaryplutonic and associated volcanic rocks, with collisionalto extensional geochemical signatures (Yılmaz et al.1995; Yılmaz et al. 2001).
To the southeast, the Kemer micaschists are tecton-ically bounded by the Cetmi melange (Fig. 1), whichpassively suffered the deformations described in thisstudy. In the west, both are intruded by the post-kinematic Karabiga granitoid. These three units arehidden under the Marmara Sea further to the north.The oldest rocks unconformably overlying the Kemermicaschists are the fluvio-deltaic sediments of pre-Upper Eocene age of the Fıcıtepe Formation, andvolcanics with inferred Palaeocene to Eocene ages(Siyako, Burkan & Okay, 1989).
3. The Kemer micaschists
3.a. Ductile deformation and shear fabrics
The medium-grade metasedimentary sequence of theKemer micaschists consists predominantly of garnet-bearing quartz-white micaschists intercalated with

Palaeogene syn-collisional extension in the north Aegean 3
Figure 2. Lower hemisphere, equal area stereonet projections ofmicaschist fabrics.
quartz-chlorite schists, and subordinate quartz-chlorite-albite schists, phyllites, calc-schists and rarequartzites and metabasites. The metamorphic mineralassemblage of the metapelites includes Qtz + Ms +Chl + Ab ± Grt ± Bt ± Spn ± Ap.
The main regionally penetrative deformation in theKemer micaschists results from a major shearing eventthat produced pervasive ductile fabrics characterized by(Figs 1, 2): (a) a flat-lying to moderately south-dippingregional foliation, representing a ubiquitous schistosityand/or metamorphic layering, parallel to the litholo-gical contacts; (b) a strong NE–SW-trending stretchinglineation, with shallow plunges in both opposite dir-ections, although predominantly south (Fig. 2). Small-scale inclined or intrafolial folds are tight to isoclinalwith a NE vergence. Their hinges vary in attitudefrom orthogonal to mostly parallel to the stretchinglineation (Fig. 2); (c) various shear criteria, indicating aregionally consistent top-to-the-NE tectonic transportin present coordinates, parallel to the lineation. Notethat traces of any earlier deformation(s) are obliteratedby the strong shearing related to the main deformation.Shallow NE-dipping, up to decametre-scale, asym-metric extensional shear bands represent prominentstructures and attest to the development of myloniticfabrics, depicting intense non-coaxial deformation(Fig. 3). Metamorphic layering/foliation progressivelybecomes mylonitic close to the shear bands, producingan asymmetric foliation boudinage in between. Otherasymmetric macro- and micro-structures used as kin-ematic indicators are abundant (porphyroclast systems,drag folds, small-scale shears, flanking structures).Calcite-filled tension gashes account for the transition
Figure 3. C′-type shear band in the Kemer micaschists, withtop-to-the-NE sense of shear.
from ductile to ductile–brittle shear deformation. Rela-tionships between metamorphic mineral assemblagesand deformational structures indicate that ductile shearfabrics were coeval with the upper greenschist-faciesmetamorphism, as demonstrated by crystallization ofsyntectonic albite and sphene porphyroblasts, and pres-sure fringes on garnets that parallel and define thestretching lineation.
Locally, a late non-penetrative deformational fabricis characterized by a discontinuous crenulation cleav-age, axial planar to folds with E–W-oriented axes, andtracing an intersection lineation. This later deforma-tion, spatially linked to a small granodiorite body in thesouthwest, is characterized by the development of retro-gressive chlorite after white micas and calcite. The lastdeformation is a predominant set of NE-dipping high-angle normal faults indicating a relatively pronouncedbrittle deformation at a shallow structural level.
3.b. Extension-related deformation and shearing
The pre-extension, possibly contractional contactbetween the Kemer micaschists and the Cetmi melangeis reworked as late, recent strike-slip faults, mostlikely connected with the activity of the nearby Plio-Quaternary North Anatolian Fault (Armijo, Meyer &Hubert, 1999; Sengor et al. 2005). The dominant shearstructures in the metamorphic rocks are extensionalasymmetric shear bands that have attenuated the meta-morphic layering, parallel to the stretching lineation,equated with the kinematic direction. They contributedto the ductile stretching and thinning of the meta-morphic pile. Shear fabrics and the strain gradient inquartz-mica mylonites are consistent with a top-to-the-NE shear zone, whose uppermost levels, however, arehidden in the Marmara Sea. Moreover, the shear struc-tures are never associated, at any scale, with compress-ional structures, such as folds or thrusts. Therefore,the character of shear structures and the kinematiccontinuity during progressive deformation from ductile

4 L. BECCALETTO AND OTHERS
to ductile–brittle shear, followed by brittle faulting,are consistent with NE–SW-oriented extension andexhumation of the metamorphic pile. Interestingly, thisNE–SW kinematic direction of extension parallels thetrend of the extension known in the southerly Menderesmassif and Lycian nappes of western Turkey (e.g.Walcott & White, 1998).
As a consequence of the extensional regime, adelimited sedimentary basin of pre-Upper Eocene agedeveloped, filling up the available empty space abovethe Kemer micaschists (Karaagac and Fıcıtepe form-ations: Siyako, Burkan & Okay, 1989). As expected,the regressive, shallowing-up sedimentary sequence(turbiditic, then deltaic, then fluviatile facies) containspebbles derived from both the Kemer micaschists andthe Cetmi melange.
4. The Karabiga granitoid: pinning of the shearfabrics
The Karabiga granitoid occurs as an intrusive bodyinto the Kemer metamorphics and the Cetmi melange.Petrographically, it ranges from granodiorite andquartz-monzonite to granite. Its geochemical signatureindicates mature arc or collision affinities, related toa volcanic arc and/or a collisional tectonic setting(Delaloye & Bingol, 2000; Guctekin, Koprubası &Aldanmaz, 2004). The pluton displays a characteristicequigranular texture, and does not contain any foliation,even close to the contacts with the Kemer micaschists.Moreover, numerous veins cross-cut the main foliationof the metamorphics (Fig. 4). All these features leadto interpretation of the Karabiga granitoid as a post-kinematic pluton, post-dating the extensional ductileshearing of the Kemer micaschists.
Delaloye & Bingol (2000) obtained an individualage of 45.3 ± 0.9 Ma from a biotite using the K/Armethod. We interpret it as the cooling age of theplutonic body below the relevant closure temperatureof the biotite with respect to the K/Ar system (about300 ◦C). Depending on the cooling rate, this age couldbe significantly younger than the real intrusion age ofthe granitoid body.
In order to settle this question, we performed U–Pb laser ablation ICP-MS analyses on xenotime. Weselected xenotime and not zircon because of thepoor quality of the recovered zircon grains (fractures,inclusions) and potential complexity of the U–Th–Pbsystems of these minerals in granitoids (inheritance,Pb loss). Details of the analytical procedure can befound in Appendix 1. Although there are relatively fewdata available on the U–Pb systematics in xenotime(YPO4), this mineral is thought to behave like monazite(e.g. Aleinikoff & Grauch, 1990; Hawkins & Bowring,1997), and a similar high closure temperature forPb (725 ± 25 ◦C after Copeland, Parrish & Harrison,1988) is assumed. Thus, the U–Pb xenotime age isexpected to yield a crystallization age close to thereal intrusion age of the Karabiga pluton. Crystals
Figure 4. (a) Cross-cutting relationships between veins from theKarabiga granitoid and the Kemer micaschists; (b) interpretedsketch of the field picture.
separated from the studied sample occur as yellow toorange, euhedral, dipyramidal grains, with no evidenceof complex internal structure (core or inclusions) underbinocular examination. Nine spot analyses have beenperformed on seven grains (Table 1) and all data pointscluster close to concordia with consistent apparentages (Fig. 5). Analyses can be combined to provide a206Pb/238U weighted mean of 52.7 ± 1.9 Ma (2σ ) inter-preted as dating crystallization of the xenotime inthe magma. This Eocene age is thus interpreted asdating the intrusion of the Karabiga granitoid into theKemer micaschists and constitutes a lower limit forthe extensional ductile shearing observed in the mic-aschists. In addition, it is c. 7 Ma older than the K–Arbiotite age of Delaloye & Bingol (2000) and suggestsa high cooling rate of around 57 ◦C Ma−1 followingintrusion of the Karabiga granitoid.
5. Discussion and implications
5.a. Timing of the exhumation of the Kemer micaschists
The U–Pb age indicates that the extensional deform-ation was terminated by Early Eocene times. The

Palaeogene syn-collisional extension in the north Aegean 5
Table 1. U–Pb microprobe analytical data from the Karabiga granitoid (sample KB90)
Spotanalysis U (ppm) 208Pb/206Pb 207Pb/206Pb ±(1σ SD) 207Pb/235U ± (1σ SD) 206Pb/238U ± (1σ SD) Rho Age (Ma) ± (1σ )
Xeno1 5140 0.350 0.0563 0.0150 0.067 0.018 0.0086 0.0003 0.12 55.1 1.7Xeno2–1 10324 0.192 0.0539 0.0055 0.064 0.007 0.0086 0.0005 0.50 54.9 3.2Xeno2–2 9163 0.199 0.0533 0.0067 0.061 0.008 0.0083 0.0004 0.35 53.2 2.5Xeno3–1 8472 0.253 0.0452 0.0050 0.048 0.007 0.0076 0.0008 0.66 49.1 4.8Xeno3–2 7726 0.287 0.0542 0.0094 0.059 0.011 0.0080 0.0003 0.24 51.1 2.2Xeno4 5624 0.217 0.0584 0.0033 0.056 0.005 0.0069 0.0006 0.81 44.5 3.5Xeno5 6081 0.113 0.0379 0.0057 0.045 0.009 0.0085 0.0010 0.61 54.7 6.3Xeno6 4231 0.083 0.0395 0.0070 0.045 0.010 0.0082 0.0012 0.63 52.8 7.5Xeno7 6812 0.106 0.0528 0.0101 0.060 0.012 0.0083 0.0004 0.27 53.2 2.8
Figure 5. Concordia plot showing LA–ICP–MS xenotimeanalyses. Analyses represented by symbols sized according totheir 1σ errors.
metamorphic rocks then reached the surface before theLate Eocene, as shown by the first sedimentary rocksoverlying the metamorphic rocks.
The Kemer micaschists are lithologically andstructurally comparable to the Camlıca micaschists,cropping out southwestward. Both units, representinga continuous metamorphic belt in the Biga Peninsula,are separated by 40 km of volcanics and sedimentaryrocks of various Tertiary ages (Siyako, Burkan & Okay,1989). The only difference concerns the metamorphicconditions reached before their exhumation. Whilethe Kemer micaschists show only medium-gradeconditions, the Camlıca micaschists locally containmetre-scale amphibolite boudins with preserved HP–LT eclogitic parageneses, implying that they have beenburied more deeply than the Kemer micaschists. Theeclogite-facies metamorphism occurred at the end ofthe Maastrichtian (65–69 Ma: Okay & Satır, 2000b).The latter age gives a lower limit for the exhumationof the Camlıca micaschists, and hence, considering thesimilarity between both occurrences of metamorphics,for the exhumation of the Kemer micaschists.
As the extensional processes occurred after the peakmetamorphism (late Maastrichtian) and before theintrusion of the Karabiga granite (Early Eocene),the ductile extensional shear deformation related to
the exhumation of the Kemer micaschists must bePalaeocene–earliest Eocene in age.
5.b. Correlations of the Kemer micaschsists
The regional tectonic framework suggests that themetamorphic terrains suitable for correlation aresituated in the eastern Rhodope Massif of Greeceand Bulgaria. There, the tectonic pattern is dominatedby late Alpine metamorphic culminations, namelythe Kesebir–Kardamos and the Byala reka–Kechrosdomes (Bonev, 2006; Bonev, Burg & Ivanov, 2006;Bonev, Marchev & Singer, 2006). From the base tothe top, both large-scale structures expose a pre-Alpineand Alpine basement consisting of lower and upperhigh-grade tectonic units, and an overlying low-gradeJurassic–Early Cretaceous subduction–accretion unit.Basement units are respectively bounded by contrac-tional, synmetamorphic thrust contacts related to pre-latest Cretaceous crustal thickening, and low-angleextensional detachments related to Tertiary extension(Krohe & Mposkos, 2002; Bonev, Burg & Ivanov,2006; Bonev, Marchev & Singer, 2006). U–Pb zirconages of 71.5 ± 3.5 Ma and 73.5 ± 2.5 Ma for eclogite-facies metamorphism, followed by a greenschist-facies stage at 61.5 ± 2.5 Ma (Liati, Gebauer &Wysoczanski, 2002; Liati, 2005), c. 69–53 Ma late-to post-tectonic granitoids (Ovtcharova et al. 2003;Marchev et al. 2004) and Maastrichtian/Palaeocene–early Eocene sedimentary filling (Boyanov & Goranov,2001), constrain the exhumation processes of the upperhigh-grade unit in the hangingwall of detachmentsbetween the latest Cretaceous and Early Tertiary. Inaddition, recent tectonic studies have shown that NE-directed extension in the eastern Rhodope startedin pre-Eocene times, followed by Middle Eoceneexhumation of the lower high-grade unit in the footwallof detachments (Bonev, Burg & Ivanov, 2006; Bonev,Marchev & Singer, 2006).
Therefore, similar kinematics and overlapping tem-poral constraints on metamorphic ages, regional strati-graphy and intrusive activity collectively imply a directgeodynamic link between the eastern Rhodope andthe Biga Peninsula. The correlation of the pre-TertiaryCetmi melange and Ezine Zone of the Biga Peninsulawith Rhodopian units, plus their common geodynamic
6 L. BECCALETTO AND OTHERS
evolution, fully support the proposed correlation(Beccaletto, 2004; Beccaletto & Jenny, 2004).
5.c. Geodynamic frame
The tectono-metamorphic pattern exposed in easternRhodope and Biga Peninsula (burial then exhumation)further indicates that both regions likely experienceddeformation connected to a collisional context inlatest Cretaceous–early Tertiary times. Indeed, at theregional scale, the extensional deformation describedabove is contemporaneous with the closure of theVardar Ocean and the subsequent collision betweenthe Pelagonian terrane and the Rhodope margin (e.g.Stampfli & Borel, 2004). Moreover, in the samecollisional geodynamic context, Bonev et al. (2006)have recently demonstrated in eastern Rhodope theoccurrence of early Tertiary syn-collisional extensionalfeatures and the exhumation of related units.
Because of (a) the correlation of the extensionalKemer micaschists with similar units in easternRhodope, and (b) the overall collisional context in latestCretaceous–Early Tertiary times in the north Aegeanregion, the Palaeogene record of ductile to ductile–brittle extensional shearing in the Kemer micashistsof NW Turkey may similarly indicate an early NE-directed extension, accommodating exhumation in anorogenic wedge during the closure of the Vardar Ocean(synorogenic extension).
6. Conclusions
The Kemer micaschists of NW Turkey show a con-tinuous ductile to ductile–brittle extensional shearing,related to a NE–SW-oriented extensional regime. Thelower limit for the shear activity is late Maastrichtian,as suggested by comparison with the similar nearbyCamlıca micaschists. Early Eocene is the upper limit, asfound by dating the crystallization age of the Karabigapost-kinematic granitoid. This extensional deformationoccurred in the regional collisional setting of theclosure of the Vardar domain.
The Kemer micaschists therefore represent a newarea which suffered synorogenic extension in theAegean domain at the very beginning of Tertiary times.This result gives the first opportunity to fill the spatialdata gap between the Rhodope and the Menderes/Cycladic Massif. It also provides the chance to questionfurther the temporal/geodynamic relationships betweensyn- and post-orogenic extension in the Aegeanregion.
Acknowledgements. Many thanks to M. Robyr and G. M.Stampfli for discussions. The authors also thank AlanCollins and Erdin Bozkurt for their helpful and constructivereviews. This work was supported by the Societe AcademiqueVaudoise and UNIL 450th Anniversary Fund.
References
ALEINIKOFF, J. N. & GRAUCH, R. I. 1990. U–Pb geo-chronology constraints on the origin of a uniquemonazite-xenotime gneiss, Hudson Highlands, NewYork. American Journal of Science 290, 522–46.
ARMIJO, R., MEYER, B. & HUBERT, A. 1999. Westwardpropagation of the North Anatolian fault into thenorthern Aegean: Timing and kinematics. Geology27(3), 267–70.
BECCALETTO, L. 2004. Geology, Correlations, and Geody-namic Evolution of the Biga Peninsula (NW Turkey).Memoires de Geologie de l’Universite de Lausanne 43,146 pp.
BECCALETTO, L. & JENNY, C. 2004. Geology and Correlationof the Ezine Zone: A Rhodope Fragment in NW Turkey?Turkish Journal of Earth Sciences 13(2), 145–76.
BECCALETTO, L., BARTOLINI, A. C., MARTINI, R., HOCHULI,P. A. & KOZUR, H. 2005. Biostratigraphic data fromthe Cetmi melange, northwest Turkey. Palaeogeographicand tectonic implications. Palaeogeography, Palaeocli-matology, Palaeoecology 221, 215–44.
BONEV, N. 2006. Cenozoic tectonic evolution of the easternRhodope Massif (Bulgaria): basement structure andkinematics of syn- to post-collisional extensional de-formation. In Post-collisional tectonics and magmatismin the eastern Mediterranean Region (eds Y. Dilek &S. Pavlides), pp. 211–35. Geological Society ofAmerica, Special Paper no. 409.
BONEV, N., BURG, J.-P. & IVANOV, Z. 2006. Mesozoic–Tertiary structural evolution of an extensional gneissdome – the Kesebir–Kardamos Dome, Eastern Rhodope,(Bulgaria-Greece). International Journal of Earth Sci-ences 95, 318–40.
BONEV, N., MARCHEV, P. & SINGER, B. 2006. 40Ar/39Argeochronology constraints on the Middle Tertiarybasement extensional exhumation, and its relation toore-forming and magmatic processes in the easternRhodope (Bulgaria). Geodinamica Acta 19, 265–80.
BOYANOV, I. & GORANOV, A. 2001. Late Alpine (Palaeo-gene) superimposed depressions in parts of SoutheastBulgaria. Geologica Balcanica 31, 3–36.
BOZKURT, E. & OBERHANSLI, R. 2001. Menderes Massif(western Turkey): structural, metamorphic and mag-matic evolution – a synthesis. International Journal ofEarth Sciences 89, 679–708.
BRUGUIER, O., TELOUK, P., COCHERIE, A., FOUILLAC,A. M. & ALBAREDE, F. 2001. Evaluation of Pb–Pband U–Pb laser ablation ICP-MS zircon dating usingmatrix-matched calibration samples with a frequencyquadrupled (266 nm) Nd-YAG laser. GeostandardsNewsletter 25, 361–73.
COPELAND, P., PARRISH, R. R. & HARRISON, T. M. 1988.Identification of inherited radiogenic Pb in monaziteand its implications for U–Pb systematics. Nature 333,760–3.
DELALOYE, M. & BINGOL, E. 2000. Granitoids from Westernand Northwestern anatolia: Geochemistry and Model-ing of Geodynamic Evolution. International GeologyReview 42, 241–68.
DINTER, D. A. & ROYDEN, L. 1993. Late Cenozoic extensionin northeastern Greece: Strymon valley detachmentsystem and Rhodope metamorphic core complex.Geology 21, 45–8.
GAUTIER, P. & BRUN, J.-P. 1994. Ductile crust exhumationand extensional detachments in the central Aegean
Palaeogene syn-collisional extension in the north Aegean 7
(Cyclades and Evvia island). Geodinamica Acta 7,57–85.
GUCTEKIN, A., KOPRUBASI, N. & ALDANMAZ, E. 2004.Geochemistry of the Karabiga (Canakkale) granitoid.Yerbilimleri 29, 29–38.
GUNTHER, D. & HEINRICH, C. A. 1999. Enhanced sensitivityin LA–ICP–MS using helium-argon mixtures as aerosolcarrier. Journal of Analytical Atomic Spectrometry 14,1369–74.
HAWKINS, D. P. & BOWRING, S. A. 1997. U–Pb system-atics of monazite and xenotime: case studies fromthe Paleoproterozoic of the Grand Canyon, Arizona.Contributions to Mineralogy and Petrology 127, 87–103.
JOLIVET, L. & PATRIAT, M. 1999. Ductile extension andthe formation of the Aegean Sea. In MediterraneanBasins: Tertiary extension within the Alpine Orogen (edsB. Durand, L. Jolivet, F. Horvath & M. Seranne),pp. 427–56. Geological Society of London, SpecialPublication no. 156.
JOLIVET, L. & FACCENNA, C. 2000. Mediterranean extensionand the Africa–Eurasia collision. Tectonics 16(6), 1095–1106.
JOLIVET, L. & GOFFE, B. 2000. Les domes metamorphiquesextensifs dans les chaınes de montagne. Extensionsynorogenique et post-orogenique. Comptes Rendus del’Academie des Sciences de Paris 330, 739–51.
KROHE, A. & MPOSKOS, E. 2002. Multiple generations ofextensional detachments in the Rhodope Mountains(northern Greece): evidence of episodic exhumation ofhigh-pressure rocks. In The timing and location of majorore deposits in an evolving orogen (eds D. J. Blundell,F. Neubauer & A. Von Quadt), pp. 151–78. GeologicalSociety of London, Special Publication no. 204.
LIATI, A. 2005. Identification of repeated Alpine (ultra)high-pressure metamorphic events by U–Pb SHRIMPgeochronology and REE geochemistry of zircon: theRhodope zone of Northern Greece. Contributions toMineralogy and Petrology 150, 608–30.
LIATI, A., GEBAUER, D. & WYSOCZANSKI, R. 2002. U–PbSHRIMP-dating of zircon domains from UHP garnet-rich mafic rocks and late pegmatoids in the Rhodopezone (N Greece); evidence for Early Cretaceous crystal-lization and Late Cretaceous metamorphism. ChemicalGeology 184, 281–99.
LISTER, G., BANGA, G. & FEENSTRA, A. 1984. Metamorphiccore complexes of Cordilleran type in the Cyclades,Aegean Sea, Greece. Geology 12, 221–5.
LUDWIG, K. R. 2000. User manual for Isoplot/Ex v.2.3. Ageochronological toolkit for Microsoft Excel. BerkeleyGeochronology Center, Special Publication no. 1a.
MALAVIEILLE, J. 1997. Normal faulting and exhumation ofmetamorphic rocks in mountain belts. In Evolution ofgeological structures in Micro- to Macro-scales (ed.S. Sengupta), pp. 47–57. Chapman & Hall.
MARCHEV, P., RAICHEVA, R., DOWNES, H., VASELLI, O.,CHIARADIA, M. & MORITZ, R. 2004. Compositionaldiversity of Eocene–Oligocene basaltic magmatismin the Eastern Rhodopes, SE Bulgaria: implicationsfor genesis and tectonic setting. Tectonophysics 393,301–28.
OKAY, A. I. & GONCUOGLU, M. C. 2004. The KarakayaComplex: A Review of Data and Concepts. TurkishJournal of Earth Sciences 13(2), 77–95.
OKAY, A. I. & SATIR, M. 2000a. Coeval plutonism andmetamorphism in a latest Oligocene metamorphic core
complex in northwest Turkey. Geological Magazine137(5), 495–516.
OKAY, A. I. & SATIR, M. 2000b. Upper Cretaceous Eclogite-Facies Metamorphic Rocks from the Biga Peninsula,Northwest Turkey. Turkish Journal of Earth Sciences 9,47–56.
OKAY, A. I., SATIR, M., MALUSKI, H., SIYAKO, M., MONIE,P., METZGER, R. & AKYUZ, S. 1996. Paleo- and Neo-Tethyan events in northwestern Turkey: geologic andgeochronologic constraints. In The tectonic evolutionof Asia (eds A. Yin & T. M. Harrison), pp. 420–41.Cambridge University Press.
OKAY, A. I., SIYAKO, M. & BURKAN, K. A. 1991. Geologyand tectonic evolution of the Biga Peninsula, northwestTurkey. Bulletin of Istanbul Technical University 44,191–255.
OVTCHAROVA, M., QUADT, A. V., HEINRICH, C. A., FRANK,M., KAISER-ROHMEIER, M., PEYCHEVA, I. & CHERNEVA,Z. 2003. Triggering of hydrothermal ore mineralizationin the Central Rhodopean Core Complex (Bulgaria) –insight from isotope and geochronological studies ontertiary magmatism and migmatisation. In Mineral Ex-ploration and Sustainable Development, vol. 1 (eds D. G.Eliopoulos et al.), pp. 367–70. Millpress: Rotterdam.
PLATT, J. P. 1986. Dynamics of orogenic wedges and theuplift of high-pressure metamorphic rocks. Bulletin ofthe Geological Society of America 97, 1037–53.
POITRASSON, F., CHENERY, S. & SHEPHERD, T. J. 2000.Electron microprobe and LA–ICP–MS study ofmonazite hydrothermal alteration: Implications for U–Th–Pb geochronology and nuclear ceramics. Geochim-ica et Cosmochimica Acta 64, 3283–97.
RING, U. & COLLINS, A. S. 2005. U–Pb SISM dating of syn-kinematic granites: Timing of core-complex formationin the northern Anatolide belt of western Turkey. Journalof the Geological Society, London 162, 289–98.
SENGOR, A. M. C., TUYSUZ, O., IMREN, C., SAKINC, M.,EYIDOGAN, H., GORUR, N., LE-PICHON, X. & RANGIN,C. 2005. The North Anatolian Fault; a new look. AnnualReview of Earth and Planetary Sciences 33, 37–112.
SIYAKO, M., BURKAN, K. A. & OKAY, A. I. 1989. Tertiarygeology and hydrocarbon potential of the Biga andGelibolu Peninsula. Turkish Association of PetroleumGeologists Bulletin 1/3, 183–99.
STAMPFLI, G. M. & BOREL, G. 2004. The TRANSMEDtransects in Space and Time: Constraints on thePaleotectonic Evolution of the Mediterranean Domain.In The TRANSMED Atlas: the Mediterranean Regionfrom Crust to Mantle (eds W. Cavazza, F. Roure,W. Spakman, G. M. Stampfli & P. Ziegler), pp. 53–90.Springer Verlag.
WALCOTT, C. R. & WHITE, S. H. 1998. Constraints onthe kinematics of post-orogenic extension imposed bystretching lineations in the Aegean region. Tectonophys-ics 298, 155–75.
WERNICKE, B. 1981. Low-angle normal faults in the Basinand Range province: nappe tectonics in an extendingorogen. Nature 291, 645–8.
YILMAZ, Y., GENC, S. C., KARACIK, S. & ALTUNKAYNAK,S. 2001. Two contrasting magmatic associations ofNW Anatolia and their tectonic significance. Journalof Geodynamics 31, 243–71.
YILMAZ, Y., GENC, S. C., YIGITBAS, E., BOZCU, M. &YILMAZ, K. 1995. Geological evolution of the lateMesozoic continental margin of Northwestern Anatolia.Tectonophysics 243, 155–71.

8 L. BECCALETTO AND OTHERS
Appendix 1. Analytical techniques and LA–ICP–MSisotopic data for xenotime grains from the Karabigagranitoid (NW Turkey)
For laser ablation (LA–ICP–MS) analyses, xenotime grainswere enclosed in epoxy resin with chips of the 554 Maold Manangotry monazite crystal (Poitrasson, Chenery &Shepherd, 2000) and polished to about half of their thickness.The mount was then cleaned in ultra-pure MQ water anddried before its introduction into the ablation cell. Data wereacquired at the University of Montpellier II using a 1991vintage VG Plasmaquad II turbo ICP–MS coupled with aGeolas (Microlas) automated platform housing a 193 nmCompex 102 laser from LambdaPhysik. Experiments wereconducted in a He atmosphere which enhances sensitivityand reduces inter-element fractionation (Gunther & Heinrich,1999). Data were acquired in the peak jumping mode(1 point per peak) similarly to the procedure describedin Bruguier et al. (2001). The laser was fired using anenergy density of 15 J cm−2 at a frequency of 2 Hz anda laser spot size of 26 µm. This resulted in a sensitivityof around 200 cps/ppm for Pb based on measurementson the NIST 610 certified reference material. The drillingrate was measured on this material to be around 0.15 µmper pulse, which, under the analytical conditions used inthis study, resulted in crater depths of about 18 µm anda removed volume of around 9550 µm3. This resulted ina total consumed monazite weight of approximately 48 ng
by spot. The Pb/Pb and U/Pb isotopic ratios of unknownswere calibrated against the Manangotry monazite crystal asan external standard, which was measured four times foreach five of unknowns using the bracketing technique. Datawere reduced using a calculation spreadsheet, which allowscorrection for instrumental mass bias and inter-elementfractionation. Accurate common lead correction during laserablation analyses is difficult to achieve, mainly because ofthe isobaric interference of 204Hg on 204Pb. The contributionof 204Hg on 204Pb was estimated by measuring the 202Hgand assuming a 204Hg/202Hg natural isotopic compositionof 0.2298. This allows monitoring of the common leadcontent of the analysed grain, but corrections often resulted inspurious ages. Analyses yielding 204Pb close to or above thelimit of detection were thus rejected. For instrumental massbias, all measured standards were averaged to give a meanmass bias factor. This mass bias factor and its associatederror were then propagated with the measured analyticalerrors of each individual unknown analysis. Inter-elementfractionations for Pb and U are much more sensitive toanalytical conditions and a bias factor was thus calculatedusing the four standard measurements bracketing each ofthe five unknowns. These four measurements were thenaveraged to calculate a U–Pb bias factor and its associatederror which were added in quadrature to the individual errormeasured on each 206Pb/238U unknown. The age quoted in thisstudy was calculated using the Isoplot program of Ludwig(2000).

Precambrian Research 155 (2007) 24–46
Age, provenance and post-deposition metamorphicoverprint of detrital zircons from the Nathorst Land group
(NE Greenland)—A LA-ICP-MS and SIMS study
Bruno Dhuime a,∗, Delphine Bosch a, Olivier Bruguier b,Renaud Caby a, Simone Pourtales b
a Laboratoire de Tectonophysique, UMR/CNRS 5568, Universite de Montpellier II, 34095 Montpellier Cedex 05, Franceb Service ICP-MS, ISTEEM, Universite de Montpellier II, 34095 Montpellier Cedex 05, France
Received 24 July 2006; received in revised form 22 December 2006; accepted 3 January 2007
Abstract
LA-ICP-MS and SIMS U–Pb analyses have been performed on detrital zircon grains from four heavy mineral rich metasedimentscollected at different levels of the Nathorst Land Group (Eleonore Bay Supergroup, Greenland). Zircons from high-grade samplescollected in the sillimanite and migmatite zones exhibit modifications to their structure, which are lacking in grains from a low-gradesample (0.3 GPa and 350–400 ◦C). In the sillimanite zone (0.5 GPa, 650 ◦C), thin discontinuous rims (<20 �m) plating detrital zircongrains document a metamorphic overgrowth during the Caledonian event dated at 428 ± 25 Ma (2σ). In the migmatite zone (0.4 GPa,700 ◦C), zircons underwent severe recrystallisation processes but no new zircon growth. Ilmenite, which constitutes over 50% ofthe heavy mineral layers, underwent recrystallisation in both high-grade samples and is likely to represent the main source of Zravailable for growth of zircon rims in the sillimanite zone. However, in the migmatite zone sample, the metamorphic conditionsallowed titanite overgrowth around ilmenite, which acted as a sink for Zr and inhibited new zircon growth.
207Pb/206Pb ages for 152 detrital zircons broadly range between 2800 and 990 Ma. The detrital zircon age signature is characterizedby the large predominance of late Paleoproterozoic (1.85–1.60 Ga) grains in all analysed samples and by lesser amounts of Archean(2.7–2.8 Ga) and Mesoproterozoic (1.2–1.0 Ga) zircons. The overall age range indicates that detritus can be sourced from theLabradorian and Makkovikian provinces of northeastern Laurentia. The youngest grain analysed (987 ± 18 Ma) indicates thatdeposition took place during the Neoproterozoic, in a post-Grenvillian sedimentary environment and was likely coeval with theMid-Neoproterozoic episode of aborted rifting that affected the eastern margin of Laurentia. The lack of detritus originating fromAmazonia or Baltica, placed adjacent to Laurentia during the early stages of Rodinia fragmentation, suggests that these twocontinental landmasses did not constitute a topographic high during the Neoproterozoic or that the Mid-Neoproterozoic rifting
opened toward an open ocean to the north of a combined Laurentia/Baltica, thus resulting in a general south to north direction oftransport of the sediments.© 2007 Elsevier B.V. All rights reserved.Keywords: Detrital zircon; Source region; Zircon behaviour; Greenland; Rod
∗ Corresponding author. Tel.: +33 4 67 14 45 23;fax: +33 4 67 14 36 03.
E-mail address: [email protected] (B. Dhuime).
0301-9268/$ – see front matter © 2007 Elsevier B.V. All rights reserved.doi:10.1016/j.precamres.2007.01.002
inia break-up
1. Introduction
The break-up of the supercontinent Rodinia duringthe Neoproterozoic (e.g. Dalziel, 1994; Soper, 1994)was preceded by several episodes of major extension

rian Re
rpstgoittAN(tmisGSTalotabdosenmzs
2
tBCdo3abtn(Teig
B. Dhuime et al. / Precamb
esulting in crustal thinning and continental rifting. Thisrocess was associated with accumulation of extensiveiliclastic sedimentary successions. Although the exactiming of deposition of these successions and the strati-raphic correlations between them are still the subjectf debate, their study is expected to provide importantnformation on the early stages of continental fragmen-ation that affected the eastern margin of Laurentia andhat ultimately led to the opening of the Iapetus Ocean.mong the clastic sequences now cropping out in theorth Atlantic region, the Eleonore Bay Supergroup
East Greenland Fold Belt) is probably the most impor-ant (Fig. 1) as it is made up of a huge, >13 km-thick
etasedimentary pile (Higgins et al., 2004). These sed-ments were deposited during the Neoproterozoic andubsequently metamorphosed and thrusted over the NEreenland continental margin during the middle to lateilurian collisional phase of the Caledonian orogeny.he present study reports both SIMS and LA-ICP-MSnalyses on detrital zircons from different stratigraphicevels of the Nathorst Land Group constituting the basef the Eleonore Bay Supergroup. The main aims ofhe study are three-fold: (1) to identify potential sourcereas responsible for the detritus in the NLG originalasin; (2) to compare the age distribution spectra withata available from other clastic sequences croppingut in the Caledonian fold belt, in order to establishtratigraphic relationships and to assess depositionalnvironment with implications to Rodinia paleogeody-amics; (3) to constrain the timing of post-depositionetamorphism and to examine the behaviour of the
ircon U–Pb system in a prograde metasedimentaryequence.
. Geological setting
The Eleonore Bay Supergroup is a major sedimen-ary succession exposed in the East Greenland Foldelt (EGFB) and constitutes the highest part of thealedonian thrust sheet (Higgins et al., 2004). The Cale-onian East Greenland Fold Belt (Fig. 1A) trends N–Sver 1300 km between 70◦N and 82◦N and is some00 km width (Henriksen, 1985). Following Higgins etl. (2004), the tectonic architecture of this region cane summarized as a sequence of large thrust sheetshat have been thrust to the west across the forelandow exposed in tectonic windows further to the westFig. 1B). A great part of the thrust sheet (Niggli Spids
hrust Sheet and Hagar Bjerg Thrust Sheet of Higginst al., 2004) structurally overlying the foreland windowsncludes reworked crystalline basement gneisses andranites. These rocks are Archean (mainly 2.8–2.7 Ga)search 155 (2007) 24–46 25
to Paleoproterozoic (1.95–1.80 Ga) in age (Higgins etal., 1978; Steiger et al., 1979; Hansen et al., 1980;Rex and Gledhill, 1981; Kalsbeek et al., 1993; Thrane,2002).
Overlying the crystalline basement complex is a2–4 km thick package of high-grade metasedimentaryrocks of the Krummedal sequence (Higgins, 1988). Thissequence of Laurentian–Amazonian affinity has a depo-sition age in the 1.10–0.93 Ga range (Kalsbeek et al.,2000; Watt et al., 2000) and was affected by Caledo-nian metamorphism and anatexis 425 Ma ago (White etal., 2002). The Krummedal metasedimentary rocks hosta suite of 0.94–0.91 Ga S-type granites (Strachan et al.,1995; Kalsbeek et al., 2000; Watt et al., 2000), indicatinga post-depositional thermal event during the early Neo-proterozoic. These granites are widely distributed withinthe Krummedal sequence preserved in the Hagar BjergThrust Sheet but are absent in the metasediments of theunderlying Niggli Spids Thrust Sheet.
The highest of the Caledonian allochtons is madeof amphibolite facies to unmetamorphosed sedimen-tary formations of the Eleonore Bay Supergroup (EBS).Located at the base of the EBS, the 11 km-thick NathorstLand Group (NLG) is characterised by a downwardincrease of deformation and metamorphism, locallyreaching anatectic conditions (Caby and Bertrand-Sarfati, 1988; Higgins et al., 2004). Quartzites, shalesand mudstones at the base of the NLG are of continen-tal origin, essentially of fluviatile character. Preservedsedimentary structures (cross bedding, flaser bedding,ripple marks) indicate an eastward transport directionfor the sediments (Caby and Bertrand-Sarfati, 1988). TheNLG is conformably overlain by the Lyell Land Group(2 km thick, clastic sedimentary formations), and by theYmer Ø and Andree Land Groups (3 km thick, carbon-ates and mudstones). The timing of deposition of theEBS is not well constrained, although the occurrenceof Acritarchs suggested a maximum early Neoprotero-zoic age (<950 Ma) for the lower part of the EBS (Vidal,1976; Vidal, 1979). The upper age limit is given by theVaranger (c. 610 Ma) age of the overlying Tillite Groupand by a 680 ± 65 Ma Pb–Pb age of a Cu ore stratiformdeposit within sediments of the Ymer Ø Group (upperEBS) (Jensen, 1993).
3. Sample selection
Samples selected for this study are metasediments
showing heavy mineral bands, which are often associ-ated with orthoquartzite layers. They constitute excellentstratigraphic markers evolving westwards across aregional metamorphic gradient from the greenschist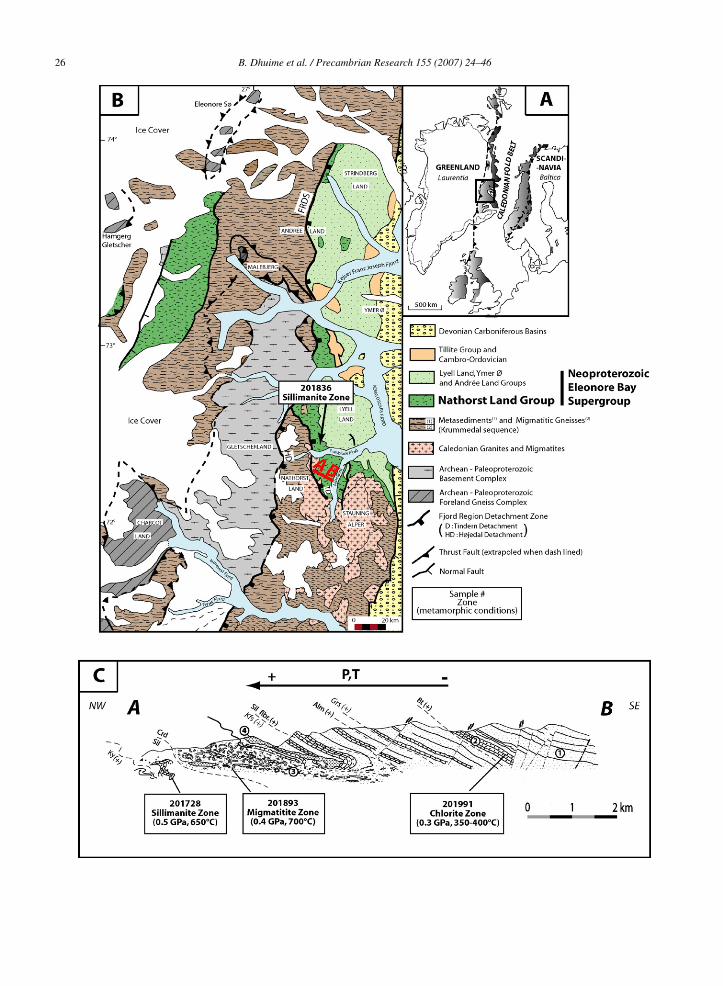
26 B. Dhuime et al. / Precambrian Research 155 (2007) 24–46
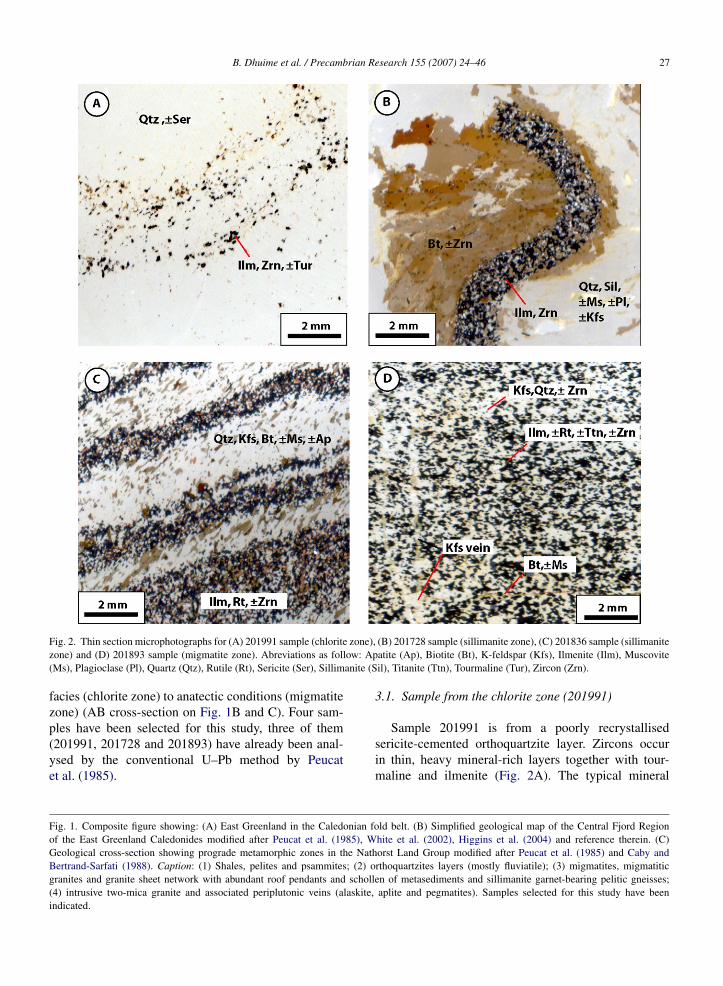
B. Dhuime et al. / Precambrian Research 155 (2007) 24–46 27
F zone),z ow: Ap( anite (S
fzp(ye
FoGBg(i
ig. 2. Thin section microphotographs for (A) 201991 sample (chloriteone) and (D) 201893 sample (migmatite zone). Abreviations as follMs), Plagioclase (Pl), Quartz (Qtz), Rutile (Rt), Sericite (Ser), Sillim
acies (chlorite zone) to anatectic conditions (migmatiteone) (AB cross-section on Fig. 1B and C). Four sam-
les have been selected for this study, three of them201991, 201728 and 201893) have already been anal-sed by the conventional U–Pb method by Peucatt al. (1985).ig. 1. Composite figure showing: (A) East Greenland in the Caledonian fof the East Greenland Caledonides modified after Peucat et al. (1985), Weological cross-section showing prograde metamorphic zones in the Nathertrand-Sarfati (1988). Caption: (1) Shales, pelites and psammites; (2) oranites and granite sheet network with abundant roof pendants and scholle4) intrusive two-mica granite and associated periplutonic veins (alaskite,ndicated.
(B) 201728 sample (sillimanite zone), (C) 201836 sample (sillimaniteatite (Ap), Biotite (Bt), K-feldspar (Kfs), Ilmenite (Ilm), Muscoviteil), Titanite (Ttn), Tourmaline (Tur), Zircon (Zrn).
3.1. Sample from the chlorite zone (201991)
Sample 201991 is from a poorly recrystallisedsericite-cemented orthoquartzite layer. Zircons occurin thin, heavy mineral-rich layers together with tour-maline and ilmenite (Fig. 2A). The typical mineral
ld belt. (B) Simplified geological map of the Central Fjord Regionhite et al. (2002), Higgins et al. (2004) and reference therein. (C)orst Land Group modified after Peucat et al. (1985) and Caby andrthoquartzites layers (mostly fluviatile); (3) migmatites, migmatiticn of metasediments and sillimanite garnet-bearing pelitic gneisses;aplite and pegmatites). Samples selected for this study have been
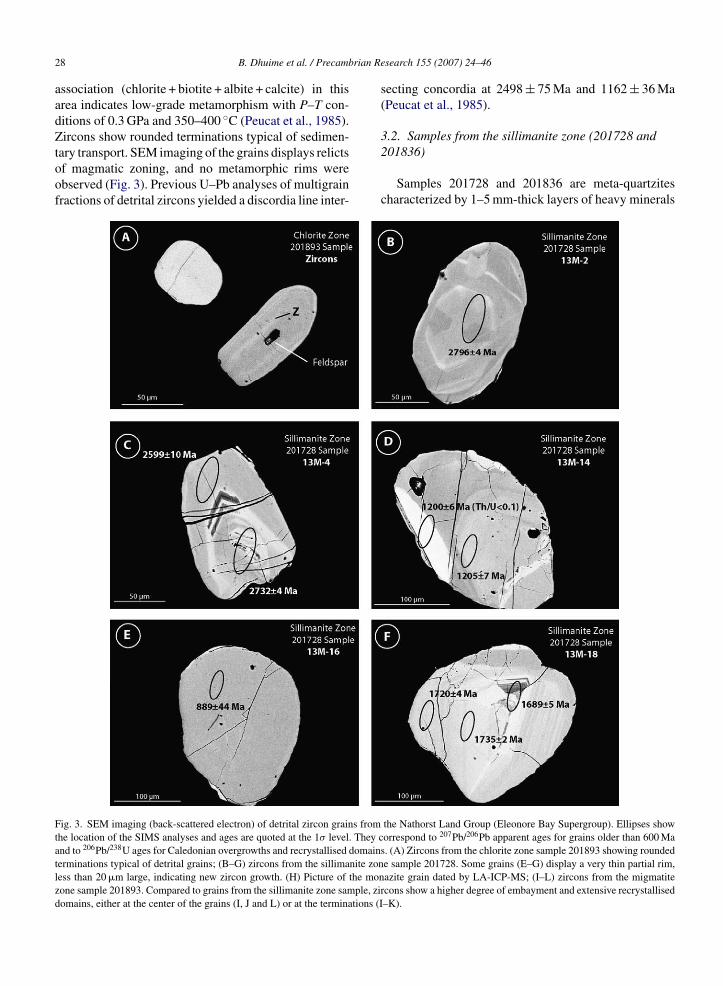
rian R
28 B. Dhuime et al. / Precambassociation (chlorite + biotite + albite + calcite) in thisarea indicates low-grade metamorphism with P–T con-ditions of 0.3 GPa and 350–400 ◦C (Peucat et al., 1985).Zircons show rounded terminations typical of sedimen-
tary transport. SEM imaging of the grains displays relictsof magmatic zoning, and no metamorphic rims wereobserved (Fig. 3). Previous U–Pb analyses of multigrainfractions of detrital zircons yielded a discordia line inter-Fig. 3. SEM imaging (back-scattered electron) of detrital zircon grains fromthe location of the SIMS analyses and ages are quoted at the 1σ level. They cand to 206Pb/238U ages for Caledonian overgrowths and recrystallised domainterminations typical of detrital grains; (B–G) zircons from the sillimanite zonless than 20 �m large, indicating new zircon growth. (H) Picture of the monzone sample 201893. Compared to grains from the sillimanite zone sample, zidomains, either at the center of the grains (I, J and L) or at the terminations (I
esearch 155 (2007) 24–46
secting concordia at 2498 ± 75 Ma and 1162 ± 36 Ma(Peucat et al., 1985).
3.2. Samples from the sillimanite zone (201728 and
201836)Samples 201728 and 201836 are meta-quartzitescharacterized by 1–5 mm-thick layers of heavy minerals
the Nathorst Land Group (Eleonore Bay Supergroup). Ellipses showorrespond to 207Pb/206Pb apparent ages for grains older than 600 Ma
s. (A) Zircons from the chlorite zone sample 201893 showing roundede sample 201728. Some grains (E–G) display a very thin partial rim,azite grain dated by LA-ICP-MS; (I–L) zircons from the migmatite
rcons show a higher degree of embayment and extensive recrystallised–K).

B. Dhuime et al. / Precambrian Research 155 (2007) 24–46 29
(Conti
caalmm(p(Fsc1
Fig. 3.
ontaining 50–70% of opaque recrystallised miner-ls (mainly ilmenite + rutile) associated with zirconnd alternating with leucocratic bands (quartz, fibro-ite sillimanite, scarce K-feldspar, plagioclase, biotite,
uscovite) (Fig. 2B and C). P–T conditions are esti-ated to be around 0.5 GPa and 650 ◦C in this area
Peucat et al., 1985). SEM imaging of zircons from sam-le 201728 (Fig. 3) reveals minute discontinuous rims<20 �m) interpreted as metamorphic overgrowths (see
ig. 3E–G). Previous U–Pb zircon fraction analyses fromample 201728 yielded a discordia line intersecting con-ordia at 2480 ± 130 and 1060 ± 37 Ma (Peucat et al.,985). Zircons from sample 201836 have not been pre-nued ).
viously analysed, but muscovite provided a CaledonianK–Ar age of 410 ± 9 Ma (Peucat et al., 1985).
3.3. Sample from the migmatite zone (201893)
In the migmatite zone, metatexites are associated withanatectic leucogranites and P–T conditions are estimatedaround 0.4 GPa and 700 ◦C (Peucat et al., 1985). Sample201893 is from a xenolith within a migmatitic granite and
shows an alternation of thin (<0.5 mm) layers of recrys-tallised opaque minerals (mostly ilmenite and rutile withtitanite overgrowths) and crystallised coarse-grained K-feldspar + quartz melt, interspersed with brown biotites,
rian R
30 B. Dhuime et al. / Precamba few muscovites and scarce apatite blasts (Fig. 2D).SEM imaging indicates that the zircon grains displayembayments suggesting metamorphic corrosion (Fig. 3I,J and L) and bright, high U, domains either withinthe grains or at their periphery (Fig. 3I–L). PreviousU–Pb multigrain fraction analyses yielded a discor-dia line intersecting concordia at 1735 ± 175 Ma and400 ± 200 Ma (Peucat et al., 1985).
4. Analytical methods
4.1. Sample preparation
Zircon was separated following standard techniquesof mineral separation (e.g. Bosch et al., 1996), includ-ing a Frantz isodynamic separator. Crystals selectedfrom the least magnetic fraction were mounted in epoxytogether with chips of zircon standards. Grains were thenpolished to half their thickness to expose internal struc-tures. Zircon standards used were UQZ-1 (Machado andGauthier, 1996) for LA-ICP-MS analyses and G91500(Wiedenbeck et al., 1995) for SIMS analyses.
4.2. LA-ICP-MS analyses
Analyses by laser ablation inductively coupledplasma mass spectrometery (LA-ICP-MS) were per-formed at the Montpellier II University (ISTEEM),using a VG Plasmaquad II ICP mass spectrometercoupled with a Microlas Geolas Q+ platform housinga deep-UV (193 nm) laser. The sample mounts wereablated under helium (rather than argon) gas flow asit reduces fall out of particles (Fig. 4) and results in a
higher sensitivity and in a significant reduction of interelement fractionation (Eggins et al., 1998; Gunther andHeinrich, 1999). Detailed analytical procedures followthose outlined in Bruguier et al. (2001) and have beenFig. 4. SEM imaging of zircon craters after ablation under Ar (a) and under Hablation craters and improves particle transport from the ablation cell to the p
esearch 155 (2007) 24–46
given in earlier reports (e.g. Neves et al., 2006). They areonly briefly summarised below. During analyses, energydensity of the laser beam was 15 J/cm2, crater sizes var-ied between 15 �m and 77 �m and frequency from 3 Hzto 7 Hz, both as a function of grain size. Unknown werebracketed by measurements of the standard following asequence including four standards and five unknowns.Data reduction was accomplished with a spreadsheetallowing corrections of the measured signals from thebackground and from U–Pb fractionation and mass biasusing the repeated measurement of the zircon standard.For instrumental mass bias, all measured standards wereaveraged to give a mean mass bias factor. This mass biasfactor and its associated error were then propagated withthe measured analytical errors of each individual sample.Inter-element fractionation for Pb and U are much moresensitive to analytical conditions and a bias factor wasthus calculated using the four standard measurementsbracketing each five unknowns. These four measure-ments were then averaged to calculate a U–Pb bias factorand its associated error which were added in quadratureto the individual error measured on each 206Pb/238Uunknown. This typically resulted in a 2–5% precision(1σ R.S.D.%) after all corrections have been made. Theamount of common Pb in zircons analysed in this studywas generally below the limit of detection (LOD), andno common Pb correction was applied to the data. When204Pb was determined to be above the LOD, the analysiswas rejected since any correction often resulted in tooyoung an age. This is mainly due to a major interferenceof 204Hg on the small 204Pb, which is difficult to measureaccurately.
4.3. SIMS analyses
Analyses have been performed on the Cameca IMS1270 SIMS at the CRPG (Nancy), using elliptic spots
e (b). Ablation under He reduces fall-out particles inside and aroundlasma.
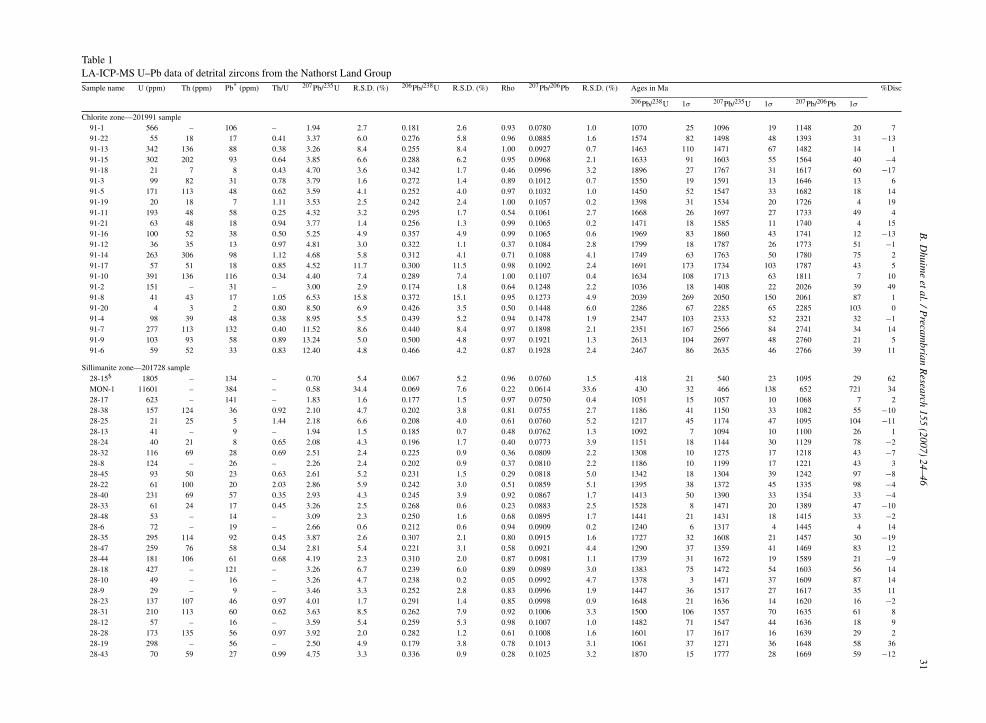
B.D
huime
etal./Precam
brianR
esearch155
(2007)24–46
31Table 1LA-ICP-MS U–Pb data of detrital zircons from the Nathorst Land GroupSample name U (ppm) Th (ppm) Pb* (ppm) Th/U 207Pb/235U R.S.D. (%) 206Pb/238U R.S.D. (%) Rho 207Pb/206Pb R.S.D. (%) Ages in Ma %Disc
206Pb/238U 1σ 207Pb/235U 1σ 207Pb/206Pb 1σ
Chlorite zone—201991 sample91-1 566 – 106 – 1.94 2.7 0.181 2.6 0.93 0.0780 1.0 1070 25 1096 19 1148 20 791-22 55 18 17 0.41 3.37 6.0 0.276 5.8 0.96 0.0885 1.6 1574 82 1498 48 1393 31 −1391-13 342 136 88 0.38 3.26 8.4 0.255 8.4 1.00 0.0927 0.7 1463 110 1471 67 1482 14 191-15 302 202 93 0.64 3.85 6.6 0.288 6.2 0.95 0.0968 2.1 1633 91 1603 55 1564 40 −491-18 21 7 8 0.43 4.70 3.6 0.342 1.7 0.46 0.0996 3.2 1896 27 1767 31 1617 60 −1791-3 99 82 31 0.78 3.79 1.6 0.272 1.4 0.89 0.1012 0.7 1550 19 1591 13 1646 13 691-5 171 113 48 0.62 3.59 4.1 0.252 4.0 0.97 0.1032 1.0 1450 52 1547 33 1682 18 1491-19 20 18 7 1.11 3.53 2.5 0.242 2.4 1.00 0.1057 0.2 1398 31 1534 20 1726 4 1991-11 193 48 58 0.25 4.32 3.2 0.295 1.7 0.54 0.1061 2.7 1668 26 1697 27 1733 49 491-21 63 48 18 0.94 3.77 1.4 0.256 1.3 0.99 0.1065 0.2 1471 18 1585 11 1740 4 1591-16 100 52 38 0.50 5.25 4.9 0.357 4.9 0.99 0.1065 0.6 1969 83 1860 43 1741 12 −1391-12 36 35 13 0.97 4.81 3.0 0.322 1.1 0.37 0.1084 2.8 1799 18 1787 26 1773 51 −191-14 263 306 98 1.12 4.68 5.8 0.312 4.1 0.71 0.1088 4.1 1749 63 1763 50 1780 75 291-17 57 51 18 0.85 4.52 11.7 0.300 11.5 0.98 0.1092 2.4 1691 173 1734 103 1787 43 591-10 391 136 116 0.34 4.40 7.4 0.289 7.4 1.00 0.1107 0.4 1634 108 1713 63 1811 7 1091-2 151 – 31 – 3.00 2.9 0.174 1.8 0.64 0.1248 2.2 1036 18 1408 22 2026 39 4991-8 41 43 17 1.05 6.53 15.8 0.372 15.1 0.95 0.1273 4.9 2039 269 2050 150 2061 87 191-20 4 3 2 0.80 8.50 6.9 0.426 3.5 0.50 0.1448 6.0 2286 67 2285 65 2285 103 091-4 98 39 48 0.38 8.95 5.5 0.439 5.2 0.94 0.1478 1.9 2347 103 2333 52 2321 32 −191-7 277 113 132 0.40 11.52 8.6 0.440 8.4 0.97 0.1898 2.1 2351 167 2566 84 2741 34 1491-9 103 93 58 0.89 13.24 5.0 0.500 4.8 0.97 0.1921 1.3 2613 104 2697 48 2760 21 591-6 59 52 33 0.83 12.40 4.8 0.466 4.2 0.87 0.1928 2.4 2467 86 2635 46 2766 39 11
Sillimanite zone—201728 sample28-15$ 1805 – 134 – 0.70 5.4 0.067 5.2 0.96 0.0760 1.5 418 21 540 23 1095 29 62MON-1 11601 – 384 – 0.58 34.4 0.069 7.6 0.22 0.0614 33.6 430 32 466 138 652 721 3428-17 623 – 141 – 1.83 1.6 0.177 1.5 0.97 0.0750 0.4 1051 15 1057 10 1068 7 228-38 157 124 36 0.92 2.10 4.7 0.202 3.8 0.81 0.0755 2.7 1186 41 1150 33 1082 55 −1028-25 21 25 5 1.44 2.18 6.6 0.208 4.0 0.61 0.0760 5.2 1217 45 1174 47 1095 104 −1128-13 41 – 9 – 1.94 1.5 0.185 0.7 0.48 0.0762 1.3 1092 7 1094 10 1100 26 128-24 40 21 8 0.65 2.08 4.3 0.196 1.7 0.40 0.0773 3.9 1151 18 1144 30 1129 78 −228-32 116 69 28 0.69 2.51 2.4 0.225 0.9 0.36 0.0809 2.2 1308 10 1275 17 1218 43 −728-8 124 – 26 – 2.26 2.4 0.202 0.9 0.37 0.0810 2.2 1186 10 1199 17 1221 43 328-45 93 50 23 0.63 2.61 5.2 0.231 1.5 0.29 0.0818 5.0 1342 18 1304 39 1242 97 −828-22 61 100 20 2.03 2.86 5.9 0.242 3.0 0.51 0.0859 5.1 1395 38 1372 45 1335 98 −428-40 231 69 57 0.35 2.93 4.3 0.245 3.9 0.92 0.0867 1.7 1413 50 1390 33 1354 33 −428-33 61 24 17 0.45 3.26 2.5 0.268 0.6 0.23 0.0883 2.5 1528 8 1471 20 1389 47 −1028-48 53 – 14 – 3.09 2.3 0.250 1.6 0.68 0.0895 1.7 1441 21 1431 18 1415 33 −228-6 72 – 19 – 2.66 0.6 0.212 0.6 0.94 0.0909 0.2 1240 6 1317 4 1445 4 1428-35 295 114 92 0.45 3.87 2.6 0.307 2.1 0.80 0.0915 1.6 1727 32 1608 21 1457 30 −1928-47 259 76 58 0.34 2.81 5.4 0.221 3.1 0.58 0.0921 4.4 1290 37 1359 41 1469 83 1228-44 181 106 61 0.68 4.19 2.3 0.310 2.0 0.87 0.0981 1.1 1739 31 1672 19 1589 21 −928-18 427 – 121 – 3.26 6.7 0.239 6.0 0.89 0.0989 3.0 1383 75 1472 54 1603 56 1428-10 49 – 16 – 3.26 4.7 0.238 0.2 0.05 0.0992 4.7 1378 3 1471 37 1609 87 1428-9 29 – 9 – 3.46 3.3 0.252 2.8 0.83 0.0996 1.9 1447 36 1517 27 1617 35 1128-23 137 107 46 0.97 4.01 1.7 0.291 1.4 0.85 0.0998 0.9 1648 21 1636 14 1620 16 −228-31 210 113 60 0.62 3.63 8.5 0.262 7.9 0.92 0.1006 3.3 1500 106 1557 70 1635 61 828-12 57 – 16 – 3.59 5.4 0.259 5.3 0.98 0.1007 1.0 1482 71 1547 44 1636 18 928-28 173 135 56 0.97 3.92 2.0 0.282 1.2 0.61 0.1008 1.6 1601 17 1617 16 1639 29 228-19 298 – 56 – 2.50 4.9 0.179 3.8 0.78 0.1013 3.1 1061 37 1271 36 1648 58 3628-43 70 59 27 0.99 4.75 3.3 0.336 0.9 0.28 0.1025 3.2 1870 15 1777 28 1669 59 −12

32B
.Dhuim
eetal./P
recambrian
Research
155(2007)
24–46Table 1 (Continued )Sample name U (ppm) Th (ppm) Pb* (ppm) Th/U 207Pb/235U R.S.D. (%) 206Pb/238U R.S.D. (%) Rho 207Pb/206Pb R.S.D. (%) Ages in Ma %Disc
206Pb/238U 1σ 207Pb/235U 1σ 207Pb/206Pb 1σ
28-16 251 – 66 – 3.52 3.2 0.248 1.5 0.46 0.1030 2.8 1426 19 1531 26 1678 52 1528-5 185 – 56 – 4.05 2.9 0.284 1.8 0.63 0.1034 2.2 1613 26 1645 24 1685 41 428-37 184 123 65 0.78 4.56 7.3 0.319 6.8 0.93 0.1038 2.7 1784 106 1742 63 1692 50 −528-1 69 – 25 – 3.73 8.0 0.261 4.9 0.61 0.1038 6.3 1494 66 1578 66 1693 117 1228-7 196 – 53 – 3.50 2.7 0.243 1.8 0.68 0.1043 1.9 1403 23 1526 21 1701 36 1828-42 40 21 13 0.61 4.23 8.4 0.292 5.2 0.62 0.1050 6.5 1653 76 1680 71 1714 120 428-14 164 – 52 – 4.27 1.9 0.294 1.3 0.68 0.1052 1.4 1662 19 1687 16 1718 25 328-41 98 63 37 0.75 4.92 1.9 0.335 1.1 0.59 0.1064 1.5 1863 18 1805 16 1739 28 −728-21 556 – 132 – 3.64 2.0 0.247 1.9 0.95 0.1067 0.6 1424 24 1558 16 1743 11 1828-39 335 83 112 0.29 4.94 2.7 0.336 2.5 0.93 0.1069 1.0 1865 41 1810 23 1747 19 −728-29 541 117 155 0.27 4.27 2.0 0.289 1.8 0.91 0.1074 0.8 1635 26 1688 16 1755 15 728-4 531 – 134 – 3.89 2.0 0.261 1.2 0.59 0.1079 1.6 1497 16 1611 16 1764 29 1528-27 121 49 30 0.50 3.39 4.4 0.228 3.8 0.86 0.1079 2.3 1322 45 1501 35 1765 41 2528-11 96 – 30 – 4.56 2.3 0.301 0.8 0.33 0.1098 2.2 1698 11 1743 19 1796 40 528-34 78 27 19 0.40 3.61 1.1 0.237 0.1 0.10 0.1104 1.1 1370 1 1551 8 1807 19 2428-2 359 – 132 – 4.57 1.4 0.293 1.1 0.80 0.1130 0.8 1658 17 1744 12 1848 15 1028-3 134 – 35 – 3.37 2.0 0.202 1.2 0.58 0.1212 1.6 1184 12 1497 16 1974 29 4028-36 149 50 59 0.39 7.17 5.6 0.364 3.2 0.58 0.1430 4.5 1999 56 2132 51 2263 78 1228-26 606 984 390 2.01 11.22 1.8 0.450 1.7 0.95 0.1808 0.6 2395 34 2541 17 2661 10 1028-46 86 37 42 0.50 11.15 6.1 0.439 5.5 0.90 0.1844 2.7 2344 109 2536 59 2693 45 1328-20 326 – 162 – 11.12 1.1 0.436 0.8 0.77 0.1851 0.7 2332 17 2534 10 2699 12 1428-30 143 69 85 0.60 14.33 1.6 0.542 1.2 0.73 0.1918 1.1 2791 27 2772 16 2758 18 −1
Sillimanite zone—201836 sample36-1 1321 – 232 – 1.80 1.6 0.175 1.6 1.00 0.0744 0.1 1042 15 1045 10 1053 2 136-6 460 – 83 – 1.89 0.9 0.183 0.5 0.54 0.0747 0.8 1085 5 1077 6 1061 15 −236-8 64 – 12 – 1.78 3.5 0.161 2.1 0.61 0.0803 2.7 962 19 1039 23 1205 54 2036-7 72 – 14 – 1.66 1.6 0.144 1.3 0.81 0.0832 0.9 869 11 992 10 1273 18 3236-10 93 – 25 – 3.23 1.6 0.236 0.1 0.08 0.0993 1.6 1366 1 1465 12 1612 29 1536-9 418 – 138 – 3.45 5.2 0.250 5.1 0.99 0.1001 0.8 1440 66 1517 41 1626 16 1136-12 191 – 84 – 5.64 7.9 0.392 7.7 0.97 0.1044 1.8 2132 141 1923 70 1704 33 −2536-13 50 – 22 – 5.07 0.5 0.349 0.1 0.16 0.1052 0.5 1932 1 1831 4 1719 9 −1236-2 141 – 45 – 4.53 1.7 0.308 1.4 0.79 0.1068 1.1 1729 21 1736 15 1745 19 136-3 678 – 235 – 7.66 3.2 0.326 3.1 0.98 0.1706 0.6 1817 49 2192 29 2563 10 2936-4 505 – 194 – 8.36 10.2 0.342 10.1 0.99 0.1776 1.6 1895 168 2271 97 2630 27 2836-5 135 – 84 – 11.94 1.2 0.474 0.9 0.79 0.1826 0.7 2502 19 2599 11 2676 12 736-11 96 – 64 – 19.11 1.0 0.486 1.0 0.97 0.2853 0.2 2553 20 3048 9 3392 3 25
Migmatitic zone—201893 sample93-40$ 1287 104 71 0.08 0.54 6.9 0.058 2.4 0.34 0.0674 6.5 363 8 438 25 849 135 5793-1 2437 288 357 0.11 1.55 13.3 0.154 13.2 0.99 0.0727 1.9 926 115 950 86 1005 38 893-3 1498 492 244 0.40 1.72 1.7 0.166 1.6 0.98 0.0751 0.3 991 15 1016 11 1070 7 793-25 545 321 91 0.81 1.64 5.8 0.156 5.7 0.97 0.0762 1.3 935 50 986 37 1101 26 1593-13 601 333 129 0.69 4.15 1.6 0.389 1.4 0.84 0.0775 0.9 2118 25 1665 14 1134 18 -8793-34 1473 635 246 0.54 1.75 2.5 0.163 2.0 0.80 0.0776 1.5 975 18 1026 16 1136 30 1493-4 193 60 35 0.38 1.94 10.6 0.178 10.5 0.99 0.0793 1.6 1055 103 1097 74 1180 33 1193-6 42 23 10 0.66 2.99 8.7 0.239 7.6 0.88 0.0908 4.1 1381 95 1405 68 1442 78 493-27 199 83 42 0.57 2.41 4.3 0.190 1.8 0.43 0.0920 3.9 1121 19 1245 31 1466 74 2493-28 518 25 71 0.07 1.94 13.0 0.147 9.9 0.76 0.0958 8.5 884 82 1096 91 1544 159 4393-30 95 106 20 1.54 2.63 4.2 0.197 0.9 0.22 0.0965 4.1 1161 10 1308 31 1558 77 2593-14 519 117 108 0.28 5.25 5.1 0.393 4.7 0.93 0.0969 1.9 2137 86 1861 44 1565 36 −3793-24 306 78 72 0.35 3.15 17.3 0.233 17.0 0.99 0.0980 3.0 1352 211 1446 143 1587 56 1593-23 205 123 58 0.83 3.59 4.1 0.261 3.9 0.94 0.0998 1.4 1493 52 1547 33 1620 25 893-32 228 104 72 0.62 3.94 8.0 0.283 8.0 0.99 0.1008 1.0 1609 115 1622 67 1639 19 2

B. Dhuime et al. / Precambrian Re93
-222
714
755
0.80
3.08
5.7
0.21
74.
30.
750.
1030
3.8
1265
5014
2745
1678
7025
93-2
223
128
0.68
4.71
5.9
0.33
02.
90.
490.
1036
5.2
1839
4717
7051
1689
96−9
93-3
352
111
918
10.
304.
852.
10.
339
2.1
0.99
0.10
370.
318
8334
1794
1816
925
−11
93-1
919
715
172
0.95
4.74
4.8
0.32
93.
70.
770.
1046
3.0
1832
5917
7541
1707
56−7
93-1
018
316
550
1.12
6.28
4.2
0.43
42.
90.
700.
1049
3.0
2325
5720
1637
1712
55−3
693
-940
328
084
0.86
5.14
4.8
0.35
54.
60.
970.
1051
1.2
1958
7818
4341
1716
23−1
493
-37
547
118
137
0.29
3.42
7.5
0.23
57.
51.
000.
1055
0.5
1362
9215
0960
1723
921
93-1
512
648
340.
473.
7711
.50.
258
11.5
1.00
0.10
590.
314
8215
415
8797
1730
514
93-8
400
210
114
0.57
4.02
3.1
0.27
62.
90.
930.
1059
1.1
1569
4016
3925
1731
219
93-2
910
418
280.
243.
778.
60.
256
8.2
0.96
0.10
652.
514
7210
915
8571
1740
4515
93-1
716
68
0.44
7.15
8.9
0.48
57.
60.
860.
1069
4.6
2549
162
2130
8217
4783
−46
93-3
133
285
980.
354.
194.
80.
283
3.6
0.76
0.10
723.
216
0852
1672
4017
5358
893
-18
285
176
117
0.77
5.58
7.4
0.37
77.
00.
950.
1073
2.3
2063
125
1913
6617
5343
−18
93-1
138
315
810
20.
517.
264.
90.
490
4.9
1.00
0.10
740.
325
7110
421
4444
1756
5−4
693
-514
460
450.
514.
398.
60.
296
8.4
0.97
0.10
751.
916
7112
417
1074
1757
365
93-7
205
6563
0.35
4.57
3.5
0.30
61.
30.
370.
1082
3.2
1722
2017
4429
1769
593
93-2
680
1623
0.28
4.26
9.8
0.28
21.
90.
200.
1095
9.6
1601
2716
8584
1792
174
1193
-20
217
5968
0.34
4.73
2.7
0.31
22.
50.
920.
1099
1.0
1750
3817
7223
1798
193
93-3
638
926
912
20.
934.
3610
.80.
287
10.6
0.98
0.11
011.
916
2715
517
0494
1800
3510
93-1
614
978
560.
655.
314.
80.
349
3.7
0.78
0.11
053.
019
2862
1871
4218
0854
−793
-12
615
154
157
0.31
7.36
8.1
0.48
18.
01.
000.
1110
0.6
2532
171
2156
7518
1510
−39
93-2
177
2625
0.42
4.95
5.0
0.32
12.
80.
550.
1120
4.2
1793
4318
1143
1832
762
93-3
838
111
811
60.
424.
397.
60.
284
7.0
0.92
0.11
213.
016
1210
017
1165
1834
5412
93-3
938
511
111
30.
384.
296.
20.
276
5.7
0.92
0.11
302.
515
6980
1692
5218
4845
1593
-35
6870
251.
405.
7313
.80.
281
13.3
0.97
0.14
783.
615
9619
219
3512
723
2061
31
$In
dica
tes
anal
yses
ofri
ms
orre
crys
talli
sed
zone
s.*
Rad
ioge
nic
Pb.M
ON
Mon
azite
.
search 155 (2007) 24–46 33
of about 20 �m. Calculation of Pb/U ratios was madeaccording to the technique outlined by Deloule et al.(2001). Common lead was corrected using 204Pb anda composition taken from the model of Stacey andKramers (1975). Pb–Pb and U–Pb ages were calculatedusing the Isoplot program (Ludwig, 2000).
5. U–Pb results
A total of 122 analyses have been performed by LA-ICP-MS and 44 zircons (37 cores and 8 rims on 31crystals) were analysed by SIMS. LA-ICP-MS and SIMSresults are reported in Tables 1 and 2, respectively.
5.1. Sample 201991 (chlorite zone)
LA-ICP-MS results of 22 zircons are reported in theU–Pb concordia diagram of Fig. 5a and in the relativeprobability distribution diagram of Fig. 7. All grainsyield moderate to high Th/U ratios (0.25–1.12), typicalof magmatic zircons. Dated grains have 207Pb/206Pb agesranging from 2766 ± 39 Ma to 1148 ± 20 Ma (1σ), withmost grains being of late Paleoproterozoic to Archeanage. Paleoproterozoic zircons constitute 50% of the anal-ysed grains and include a major age group between c.1811–1650 Ma, among which the most important clusteroccurs between 1811 Ma and 1750 Ma (five grains withdiscordance degree <10%). A subordinate group is con-stituted by two grains of early Paleoproterozoic ages at c.2300–2100 Ma. The oldest concordant grains analysedat 2760 ± 21 Ma (1σ) points to an Archean componentin the source area, which is also supported by two discor-dant analyses yielding 207Pb/206Pb ages of 2741 Ma and2766 Ma. Mesoproterozoic zircons are scarce, and onlyrepresented by concordant analyses at 1564 ± 40 Ma,1482 ± 14 Ma and 1148 ± 20 Ma (1σ), the latter consti-tuting the youngest detrital grain analysed.
5.2. Sample 201728 (sillimanite zone)
A 48 zircon analyses (47 cores and one rim) fromsample 201728 have been performed by LA-ICP-MS.The results are reported in the Figs. 5b and 7. Datedgrains range in age from Archean to Mesoproterozoic.One analysis, concordant at 2758 ± 18 Ma (1σ), docu-ments the occurrence of Archean rocks in the sourcearea. This is supported by three discordant grains withminimum 207Pb/206Pb ages ranging from 2699 ± 12 Ma
to 2661 ± 10 Ma (1σ). Similarly to the chlorite zone sam-ple, the age spectrum is dominated by Paleoproterozoicgrains, with two age peaks at around c. 1.65–1.60 Gaand 1.80–1.75 Ga with an almost equal proportion (see
34B
.Dhuim
eetal./P
recambrian
Research
155(2007)
24–46
Table 2SIMS U–Pb data of detrital zircons from the Nathorst Land GroupSample name U (ppm) Th (ppm) Pb* (ppm) Th/U 204Pb/206Pb 207Pb/235U R.S.D. (%) 206Pb/238U R.S.D. (%) Rho 207Pb/206Pb R.S.D. (%) Ages in Ma %Disc
206Pb/238U 1σ 207Pb/235U 1σ 207Pb/206Pb 1σ
Sillimanite zone—201728 sample13M-10b$ 331 73 20 0.22 0.00861 – – 0.07 4.5 – – – 436 19 – – – – –13M-17c$ 402 61 27 0.15 0.00135 0.584 3.6 0.078 1.7 0.46 0.0543 3.2 484 8 467 13 385 64 −2613M-8a 1268 818 118 0.65 0.0001 1.193 2.0 0.109 2.0 0.99 0.0797 0.3 664 12 797 11 1190 6 4413M-16 42 18 6 0.42 0.00098 1.600 3.0 0.169 1.9 0.61 0.0687 2.4 1006 15 1009 12 889 44 −1313M-15 114 121 18 1.06 0.00024 1.845 1.9 0.186 1.6 0.87 0.072 0.9 1099 16 1062 12 986 17 −1113M-17a 93 69 14 0.74 0.0003 1.727 1.9 0.174 1.6 0.86 0.072 1.0 1033 16 1019 12 987 18 −513M-3 139 157 20 1.13 0.00019 1.703 1.9 0.169 1.7 0.86 0.0731 1.0 1006 15 1010 12 1018 18 113M-24 993 – 145 – 0.0009 1.719 1.7 0.17 1.6 0.97 0.0734 0.4 1010 15 1015 11 1026 8 213M-17b 311 474 47 1.52 0.00013 1.776 1.6 0.175 1.6 0.98 0.0736 0.3 1040 15 1037 11 1029 6 −113M-10a 134 226 22 1.69 0.0001 1.958 1.8 0.19 1.7 0.92 0.0746 0.7 1123 17 1101 12 1059 13 −613M-21 138 94 23 0.68 0.00021 2.022 1.7 0.196 1.6 0.93 0.0748 0.6 1153 17 1123 12 1064 11 −813M-22 134 83 24 0.62 0.00008 2.194 1.7 0.206 1.6 0.96 0.0773 0.5 1207 18 1179 12 1128 9 −713M-1 154 63 26 0.41 0.00016 2.157 1.7 0.197 1.6 0.95 0.0795 0.5 1158 17 1167 12 1184 9 213M-14a$ 815 54 143 0.07 0.00002 2.263 1.6 0.205 1.6 0.98 0.0801 0.3 1201 18 1201 11 1200 6 013M-14b 306 212 55 0.69 0.00004 2.293 1.6 0.207 1.6 0.98 0.0803 0.4 1213 18 1210 12 1205 7 −113M-8b 408 127 99 0.31 0.00003 3.571 1.9 0.282 1.8 0.90 0.0918 0.8 1601 25 1543 15 1464 15 −913M-12 277 155 63 0.56 0.00008 3.362 1.7 0.264 1.6 0.98 0.0925 0.3 1509 22 1496 13 1477 5 −213M-20 175 152 46 0.87 0.00005 4.266 1.6 0.306 1.6 0.98 0.1012 0.3 1719 24 1687 13 1647 5 −413M-7 160 149 43 0.93 0.00003 4.368 1.6 0.312 1.6 0.99 0.1015 0.2 1752 25 1706 13 1651 3 −613M-18a 1424 848 288 0.6 0.00004 3.359 2.4 0.235 2.4 0.99 0.1036 0.3 1362 29 1495 19 1689 5 1913M-18b 388 154 106 0.4 0.00005 4.613 1.7 0.318 1.7 0.99 0.1053 0.2 1778 26 1752 14 1720 4 −313M-23 456 168 126 0.37 0.00005 4.671 1.6 0.32 1.6 0.99 0.1057 0.2 1792 25 1762 14 1727 3 −413M-13 878 463 223 0.53 0.00003 4.321 1.6 0.296 1.6 1.00 0.106 0.2 1670 24 1697 13 1731 3 413M-18c 472 218 134 0.46 0.00002 4.824 1.6 0.329 1.6 1.00 0.1062 0.1 1835 26 1789 13 1735 2 −613M-9 402 161 116 0.4 0.00005 4.912 1.7 0.335 1.6 0.98 0.1063 0.3 1863 26 1804 14 1737 5 −713M-5 147 108 42 0.73 0.00015 4.963 1.7 0.331 1.6 0.97 0.1086 0.4 1845 26 1813 14 1777 7 −413M-4b 279 91 104 0.33 0.00119 10.448 2.0 0.435 1.8 0.92 0.1744 0.8 2326 36 2475 18 2599 10 1113M-25 112 113 52 1.01 0.00008 13.685 1.7 0.54 1.6 0.97 0.1839 0.4 2783 37 2728 16 2688 6 −413M-6 242 178 103 0.74 0.00002 12.737 1.7 0.497 1.7 1.00 0.186 0.1 2599 36 2660 16 2707 2 413M-4a 659 268 200 0.41 0.00004 9.175 2.5 0.352 2.5 0.99 0.1889 0.3 1946 41 2356 22 2732 4 2913M-19 219 95 108 0.43 0.00001 15.192 1.7 0.575 1.6 0.99 0.1915 0.3 2929 38 2827 16 2755 4 −613M-2 136 42 63 0.31 0.00004 14.657 1.7 0.542 1.6 0.99 0.1963 0.3 2790 37 2793 16 2796 4 013M-11 146 88 67 0.61 0.00009 14.703 2.4 0.532 1.9 0.77 0.2004 1.6 2750 42 2796 23 2829 25 3
Migmatitic zone—201893 sample15M-5a$ 1168 60 46 0.05 0.00045 0.396 2.4 0.046 2.2 0.92 0.0624 0.9 290 6 339 7 686 19 5815M-3a$ 973 115 60 0.12 0.00014 0.611 2.7 0.072 2.5 0.94 0.0614 0.9 449 11 484 10 652 18 3115M-2a$ 1031 84 73 0.08 0.00019 0.754 2.6 0.082 2.4 0.92 0.0665 1.0 509 12 570 11 822 19 3815M-6a$ 413 25 34 0.06 0.00021 0.935 2.8 0.096 2.7 0.95 0.0704 0.9 592 15 670 14 941 17 3715M-4 1444 269 241 0.19 0.00001 2.092 2.2 0.194 2.2 1.00 0.0781 0.2 1145 23 1146 15 1148 4 015M-6b 79 55 26 0.69 0.00108 5.040 2.7 0.378 2.5 0.92 0.0968 1.1 2065 44 1826 23 1564 17 −3215M-3b 230 161 58 0.7 0.0001 4.066 2.7 0.293 2.6 0.98 0.1005 0.5 1659 38 1648 21 1633 9 −215M-2b 39 32 7 0.83 0.0003 3.090 2.6 0.209 2.3 0.89 0.1075 1.2 1221 26 1430 20 1757 19 3115M-5b 191 87 34 0.46 0.00064 3.138 2.8 0.207 2.5 0.91 0.1099 1.2 1214 28 1442 21 1797 19 3215M-1b 942 283 286 0.3 0.00003 5.924 2.4 0.353 2.3 0.99 0.1216 0.3 1950 39 1965 20 1980 4 215M-1a 182 79 55 0.43 0.00002 5.923 2.5 0.349 2.4 1.00 0.1232 0.2 1929 41 1965 21 2003 4 4
a, b, c: spot number inside a single grain. $ analyses of rims or recrystallised zones. * Radiogenic Pb.

B. Dhuime et al. / Precambrian Research 155 (2007) 24–46 35
F ne sams
atMbatwr(12
zaobrc2
ig. 5. LA-ICP-MS U–Pb concordia plots for (a) 201991 chlorite zoample and (d) 201893 migmatite zone sample. Error ellipses are 1σ.
lso the histograms in Fig. 7). The main difference withhe chlorite zone sample resides in the occurrence of
esoproterozoic zircons with ages broadly distributedetween c. 1.50–1.30 Ma and 1.20–1.05 Ga and anpparent break between 1.3–1.2 Ma and 1.6–1.5 Ga inhe age spectrum. The youngest concordant detrital grainas dated at 1068 ± 7 Ma (1σ). Finally, a U-rich zircon
im (#28.15) provided a 206Pb/238U age of 418 ± 21 Ma1σ) and a minute (<40 �m) monazite grain (#MON-, Fig. 3H) analysed in a thick section provided a06Pb/238U age of 430 ± 32 Ma (1σ), within error of theircon rim age (#28.15). Therefore, this c. 420–430 Mage is regarded as dating the Caledonian metamorphicverprint. Zircons with complex internal structures have
een investigated by SIMS, which due to lower drillingate than laser ablation, is better suited to analysis ofomplex grains. Results of 33 analyses performed on5 zircons (30 cores and 3 rims) show a similar dis-ple, (b) 201836 sillimanite zone sample, (c) 201728 sillimanite zone
tribution to that obtained by LA-ICP-MS (Figs. 6a and7) although the proportions between the different agegroups are not the same. This may be related to a focusof the SIMS analyses towards complex grains (inher-ited cores, erased domains, rims) when compared to therather random analyses of the LA-ICP-MS approach.Thirteen grains younger than 1.2 Ga were analysed,the youngest of which is dated at 889 ± 44 Ma (1σ).This analysis however is strongly reversely discordant(−13%) and the next youngest grain at 987 ± 18 Ma (1σ)provides a more reliable estimate for the maximum ageof deposition. Among this age group, zircons 13M-18(Fig. 3F) and 13M-4 (Fig. 3C) are both characterizedby cores with relicts of magmatic zoning surrounded by
a homogeneous external structure. Grain 13M-4 showsa normal age distribution with a core (2732 ± 4 Ma)older than the rim (2599 ± 10 Ma), although discordanceof both core and rim hampers a precise determination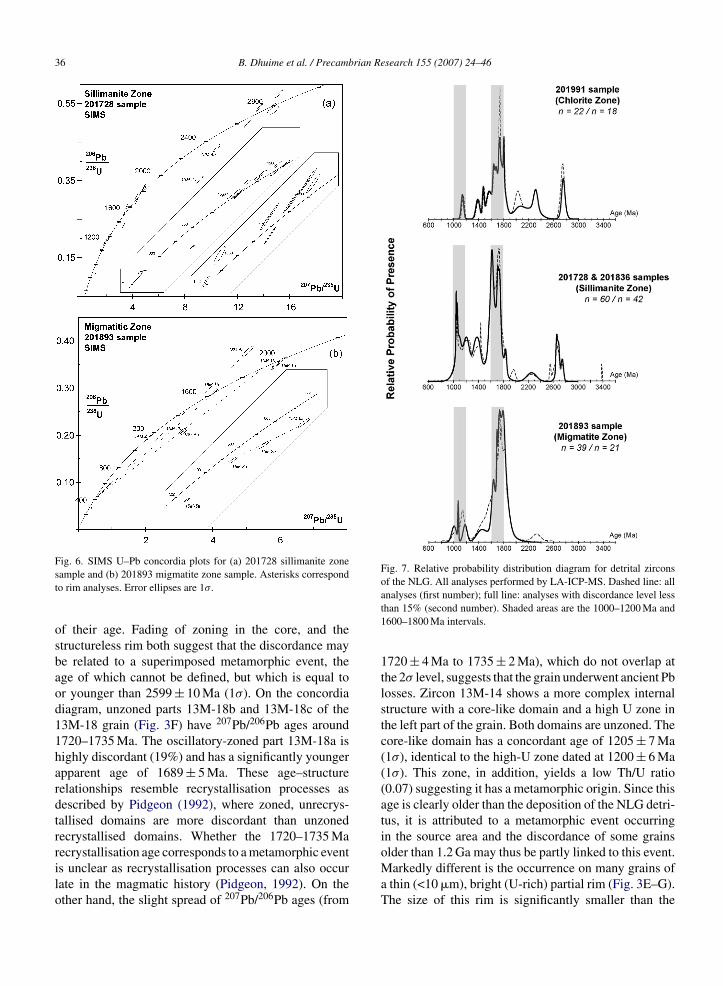
36 B. Dhuime et al. / Precambrian Research 155 (2007) 24–46
Fig. 7. Relative probability distribution diagram for detrital zirconsof the NLG. All analyses performed by LA-ICP-MS. Dashed line: all
Fig. 6. SIMS U–Pb concordia plots for (a) 201728 sillimanite zonesample and (b) 201893 migmatite zone sample. Asterisks correspondto rim analyses. Error ellipses are 1σ.
of their age. Fading of zoning in the core, and thestructureless rim both suggest that the discordance maybe related to a superimposed metamorphic event, theage of which cannot be defined, but which is equal toor younger than 2599 ± 10 Ma (1σ). On the concordiadiagram, unzoned parts 13M-18b and 13M-18c of the13M-18 grain (Fig. 3F) have 207Pb/206Pb ages around1720–1735 Ma. The oscillatory-zoned part 13M-18a ishighly discordant (19%) and has a significantly youngerapparent age of 1689 ± 5 Ma. These age–structurerelationships resemble recrystallisation processes asdescribed by Pidgeon (1992), where zoned, unrecrys-tallised domains are more discordant than unzonedrecrystallised domains. Whether the 1720–1735 Marecrystallisation age corresponds to a metamorphic event
is unclear as recrystallisation processes can also occurlate in the magmatic history (Pidgeon, 1992). On theother hand, the slight spread of 207Pb/206Pb ages (fromanalyses (first number); full line: analyses with discordance level lessthan 15% (second number). Shaded areas are the 1000–1200 Ma and1600–1800 Ma intervals.
1720 ± 4 Ma to 1735 ± 2 Ma), which do not overlap atthe 2σ level, suggests that the grain underwent ancient Pblosses. Zircon 13M-14 shows a more complex internalstructure with a core-like domain and a high U zone inthe left part of the grain. Both domains are unzoned. Thecore-like domain has a concordant age of 1205 ± 7 Ma(1σ), identical to the high-U zone dated at 1200 ± 6 Ma(1σ). This zone, in addition, yields a low Th/U ratio(0.07) suggesting it has a metamorphic origin. Since thisage is clearly older than the deposition of the NLG detri-tus, it is attributed to a metamorphic event occurringin the source area and the discordance of some grainsolder than 1.2 Ga may thus be partly linked to this event.
Markedly different is the occurrence on many grains ofa thin (<10 �m), bright (U-rich) partial rim (Fig. 3E–G).The size of this rim is significantly smaller than the
rian Re
sAo4m1at(f
5
(aTsLc2
ag1galsma
5
a71ti2
ooff1wmocaU
B. Dhuime et al. / Precamb
pot size and only two analyses have been attempted.nalyses 13M-17c straddled the resin, rim and coref the grain and yielded a 206Pb/238U apparent age of84 ± 8 Ma, which is a maximum age for the develop-ent of the rim. In spite of straddling the core, analysis
3M-10b (Fig. 3G) provides a “Caledonian” 206Pb/238Uge of 436 ± 19 Ma (1σ), similar within error marginso those obtained by LA-ICP-MS on one zircon rim418 ± 21 Ma) and on a monazite grain (430 ± 32 Ma)rom the same sample.
.3. Sample 201836 (sillimanite zone)
Thirteen zircons have been analysed by LA-ICP-MSFigs. 5c and 7) and 207Pb/206Pb ages yield a broadge range extending from Mesoproterozoic to Archean.he oldest value is from a single discordant analy-is, which yields a minimum age of 3392 ± 3 Ma (1σ).ate Archean grains are also present, but yield dis-ordant analyses with 207Pb/206Pb ages ranging from676 ± 12 Ma to 2563 ± 10 Ma (1σ).
Other detrital zircon grains are late Paleoproterozoict 1745–1612 Ma and Mesoproterozoic with concordantrains at 1060–1050 Ma. Discordant analyses between.3 Ga and 1.2 Ga may represent older Paleoproterozoicrains, which have undergone U–Pb disturbances. Takens a whole, the detrital zircon signature of this sample,ocated away from the AB cross-section (see Fig. 1), isimilar to that provided by sample 201728 of the sameetamorphic grade. This suggests no major lateral vari-
tion in the detrital input to the NLG original basin.
.4. Sample 201893 (migmatite zone)
LA-ICP-MS results of 40 zircon analyses (39 coresnd one rim) are reported (Table 1; Figs. 5d and). 207Pb/206Pb ages range from 2320 ± 61 Ma to005 ± 38 Ma (1σ). Late Paleoproterozoic zircons formhe main age group with over 50% of the analyses fallingn the 1848–1620 Ma age range. Another 6 analyses have07Pb/206Pb ages ranging from 1590 Ma to 1440 Ma, butnly one is concordant at 1442 ± 78 Ma (1σ) and thether analyses most probably belong to disturbed grainsrom the 1848 Ma to 1620 Ma old group. This is obviousor analysis 93-28, which has a 207Pb/206Pb age of c.544 Ma but a 206Pb/238U age of c. 884 Ma associatedith a Th/U ratio of 0.07 suggesting the beam straddled aetamorphic domain younger than 884 Ma and a Pale-
proterozoic core. A number of analyses plot close tooncordia between 1.2 Ga and 1.0 Ga, with the youngestnalysis at 1005 ± 38 Ma (1σ). This analysis has a highcontent and a low Th/U ratio (0.11) suggesting it has a
search 155 (2007) 24–46 37
metamorphic origin. Finally, only one grain is older than2.0 Ga (93-35) but is very discordant (31%) suggestinga possible Archean age. One analysis (93-40) is char-acterized by a low Th/U ratio of 0.08 and an apparent206Pb/238U age of 363 ± 8 Ma.
Some grains have also been investigated by SIMS.The results (11 analyses on 6 zircons are reported inFig. 6b. 207Pb/206Pb core ages range from 1148 ± 4 Mato 2003 ± 4 Ma (1σ) and have high Th/U ratios from0.19 to 0.83. Bright-SEM areas (Fig. 3I–L) are charac-terized by lower Th/U ratios from 0.05 to 0.12, typicalof a metamorphic origin. Analyses of these bright-SEMareas yield very discordant points, which are seeminglyaligned along a chord intersecting Concordia at around400 Ma suggesting a Caledonian age for the metamor-phic overprint.
6. Discussion
Since the zircons come from different levels of a sin-gle prograde metamorphic sequence, the results can beused to constrain the behaviour of zircon under increas-ing metamorphic conditions. This has implications fora better knowledge and understanding of the zirconU–Pb systems in metamorphic environments. Moreover,in sedimentary units, it is necessary to evaluate post-deposition processes affecting the detrital zircons fromthose which are source related. This has been achievedwith the aim of fingerprinting the source regions con-tributing to the huge detritus accumulation of the NLGand also in order to draw correlations with other similar-aged sequences.
6.1. Behaviour of U–Th–Pb in zircon during aprograde metamorphism
Zircons from the low-grade chlorite zone sample201893 show little or no noticeable metamorphic trans-formations. In particular, no overgrowths were observedon zircons from this rock. At first sight, this may beattributed to the low P–T metamorphic conditions expe-rienced by the sample, but recent studies on low grademetasedimentary rocks (Rasmussen, 2005) indicate thatZr can be mobile at temperatures as low as c. 250 ◦C,which is below the temperature experienced by thissample (350–400 ◦C). We thus speculate that the lackof transformation is mainly related to the mineralog-ical nature of the rock (orthoquartzite), which is not
favourable to breakdown of Zr- and/or halogen-bearingphases susceptible to liberate and transport Zr over shortdistances to nucleation sites as documented for low-grade shales (Rasmussen, 2005). High Th/U ratios of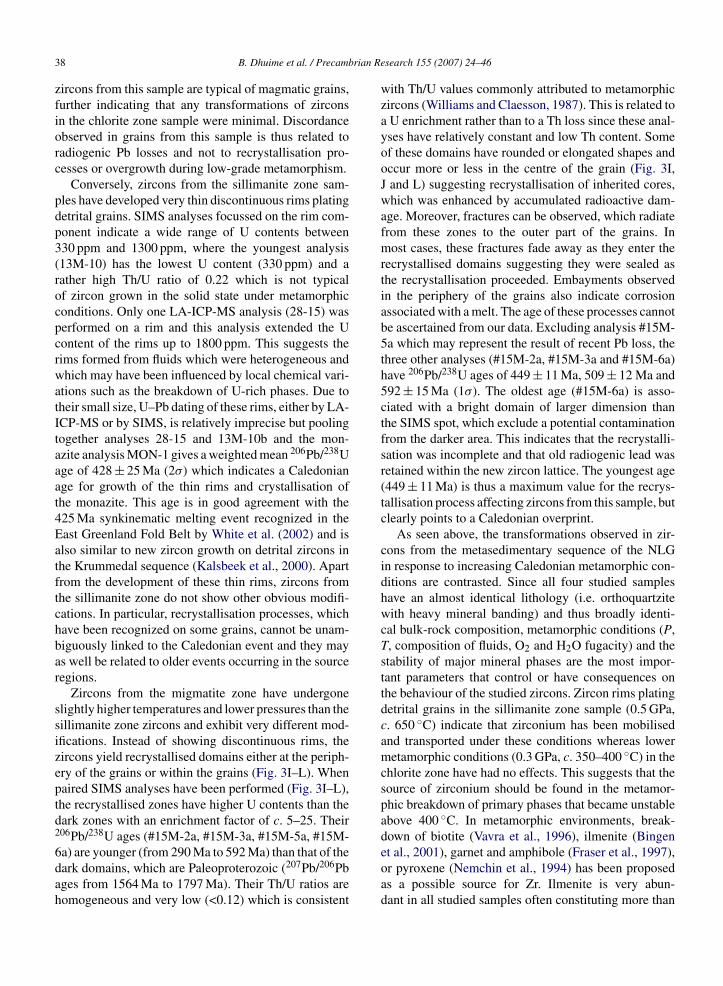
rian R
38 B. Dhuime et al. / Precambzircons from this sample are typical of magmatic grains,further indicating that any transformations of zirconsin the chlorite zone sample were minimal. Discordanceobserved in grains from this sample is thus related toradiogenic Pb losses and not to recrystallisation pro-cesses or overgrowth during low-grade metamorphism.
Conversely, zircons from the sillimanite zone sam-ples have developed very thin discontinuous rims platingdetrital grains. SIMS analyses focussed on the rim com-ponent indicate a wide range of U contents between330 ppm and 1300 ppm, where the youngest analysis(13M-10) has the lowest U content (330 ppm) and arather high Th/U ratio of 0.22 which is not typicalof zircon grown in the solid state under metamorphicconditions. Only one LA-ICP-MS analysis (28-15) wasperformed on a rim and this analysis extended the Ucontent of the rims up to 1800 ppm. This suggests therims formed from fluids which were heterogeneous andwhich may have been influenced by local chemical vari-ations such as the breakdown of U-rich phases. Due totheir small size, U–Pb dating of these rims, either by LA-ICP-MS or by SIMS, is relatively imprecise but poolingtogether analyses 28-15 and 13M-10b and the mon-azite analysis MON-1 gives a weighted mean 206Pb/238Uage of 428 ± 25 Ma (2σ) which indicates a Caledonianage for growth of the thin rims and crystallisation ofthe monazite. This age is in good agreement with the425 Ma synkinematic melting event recognized in theEast Greenland Fold Belt by White et al. (2002) and isalso similar to new zircon growth on detrital zircons inthe Krummedal sequence (Kalsbeek et al., 2000). Apartfrom the development of these thin rims, zircons fromthe sillimanite zone do not show other obvious modifi-cations. In particular, recrystallisation processes, whichhave been recognized on some grains, cannot be unam-biguously linked to the Caledonian event and they mayas well be related to older events occurring in the sourceregions.
Zircons from the migmatite zone have undergoneslightly higher temperatures and lower pressures than thesillimanite zone zircons and exhibit very different mod-ifications. Instead of showing discontinuous rims, thezircons yield recrystallised domains either at the periph-ery of the grains or within the grains (Fig. 3I–L). Whenpaired SIMS analyses have been performed (Fig. 3I–L),the recrystallised zones have higher U contents than thedark zones with an enrichment factor of c. 5–25. Their206Pb/238U ages (#15M-2a, #15M-3a, #15M-5a, #15M-
6a) are younger (from 290 Ma to 592 Ma) than that of thedark domains, which are Paleoproterozoic (207Pb/206Pbages from 1564 Ma to 1797 Ma). Their Th/U ratios arehomogeneous and very low (<0.12) which is consistentesearch 155 (2007) 24–46
with Th/U values commonly attributed to metamorphiczircons (Williams and Claesson, 1987). This is related toa U enrichment rather than to a Th loss since these anal-yses have relatively constant and low Th content. Someof these domains have rounded or elongated shapes andoccur more or less in the centre of the grain (Fig. 3I,J and L) suggesting recrystallisation of inherited cores,which was enhanced by accumulated radioactive dam-age. Moreover, fractures can be observed, which radiatefrom these zones to the outer part of the grains. Inmost cases, these fractures fade away as they enter therecrystallised domains suggesting they were sealed asthe recrystallisation proceeded. Embayments observedin the periphery of the grains also indicate corrosionassociated with a melt. The age of these processes cannotbe ascertained from our data. Excluding analysis #15M-5a which may represent the result of recent Pb loss, thethree other analyses (#15M-2a, #15M-3a and #15M-6a)have 206Pb/238U ages of 449 ± 11 Ma, 509 ± 12 Ma and592 ± 15 Ma (1σ). The oldest age (#15M-6a) is asso-ciated with a bright domain of larger dimension thanthe SIMS spot, which exclude a potential contaminationfrom the darker area. This indicates that the recrystalli-sation was incomplete and that old radiogenic lead wasretained within the new zircon lattice. The youngest age(449 ± 11 Ma) is thus a maximum value for the recrys-tallisation process affecting zircons from this sample, butclearly points to a Caledonian overprint.
As seen above, the transformations observed in zir-cons from the metasedimentary sequence of the NLGin response to increasing Caledonian metamorphic con-ditions are contrasted. Since all four studied sampleshave an almost identical lithology (i.e. orthoquartzitewith heavy mineral banding) and thus broadly identi-cal bulk-rock composition, metamorphic conditions (P,T, composition of fluids, O2 and H2O fugacity) and thestability of major mineral phases are the most impor-tant parameters that control or have consequences onthe behaviour of the studied zircons. Zircon rims platingdetrital grains in the sillimanite zone sample (0.5 GPa,c. 650 ◦C) indicate that zirconium has been mobilisedand transported under these conditions whereas lowermetamorphic conditions (0.3 GPa, c. 350–400 ◦C) in thechlorite zone have had no effects. This suggests that thesource of zirconium should be found in the metamor-phic breakdown of primary phases that became unstableabove 400 ◦C. In metamorphic environments, break-down of biotite (Vavra et al., 1996), ilmenite (Bingen
et al., 2001), garnet and amphibole (Fraser et al., 1997),or pyroxene (Nemchin et al., 1994) has been proposedas a possible source for Zr. Ilmenite is very abun-dant in all studied samples often constituting more than
rian Re
5aarIzhcaescBTacbUTaapatmcrarewIbidimgrtlrmfetcatwmz
B. Dhuime et al. / Precamb
0% of the heavy mineral layers. This mineral is char-cterized by high, high field strength (HFS) elementbundances including Zr, which can be present in theange 100–1000 ppm (e.g. Jang and Naslund, 2002).n addition, ilmenite is recrystallised in the sillimaniteone sample, suggesting its major and minor constituentsave been mobilized, whereas it is unaltered in thehlorite zone sample. We thus suggest that, as earlys under amphibolite facies conditions, and in clasticnvironments where this mineral is abundant, the mainource for Zr (and Hf) available for new zircon growthan be found in ilmenite as previously suggested byingen et al. (2001) under granulite facies conditions.ransport of this immobile element Zr also requireshalogen-rich fluid (Rubin et al., 1989, 1993) whose
omposition was heterogeneous and possibly influencedy local parameters as indicated by the wide range of
content (from 330 ppm to 1800 ppm) of the rims.he likelihood that ilmenite became unstable undermphibolite facies conditions with expulsion of majornd minor constituents is supported by natural exam-les where granular exsolution textures in magnetitend ilmenite are coeval with graphite crystallisation atemperatures of c. 500 ◦C (Satish-Kumar, 2005). In theigmatite sample the transformations undergone by zir-
ons are different since the grains have suffered severeecrystallisation processes and metamorphic corrosion,s demonstrated by embayments, but no metamorphicims were observed. These differences indicate that thenvironment was Zr-saturated in the sillimanite zone,hereas it was undersaturated in the migmatite zone.
t can be argued that the P, T conditions suffered byoth samples are mostly undistinguishable, thus suggest-ng that the observed differences are mainly related toifferent fO2 and fH2O conditions. Whereas ilmenites only recrystallised in the sillimanite sample, in the
igmatite sample this mineral developed a titanite over-rowth. As demonstrated by Harlov et al. (2006), whicheported titanite reaction rims on ilmenite, this is relatedo hydration and oxidation reactions during amphibo-ite facies metamorphism. We thus propose that duringecrystallisation of ilmenite, essential stoichiometric ele-ents and trace elements (such as Zr) were expelled
rom its lattice. In the case of the migmatite zone, theselements were subsequently incorporated in titanite crys-als, which developed around ilmenite under oxidizingonditions. Incorporation of HFS elements in titaniteffected significantly the distribution of trace elements in
he melt and precluded its Zr saturation. This is consistentith the lack of new zircon growth and also with embay-ents and metamorphic corrosion observed on detritalircons from the migmatite zone.
search 155 (2007) 24–46 39
6.2. Deposition and source areas of the NLGsediments
6.2.1. Deposition ageA maximum age for deposition of the NLG sedi-
ments is given by the 207Pb/206Pb age of the youngestconcordant detrital zircon grain analysed (987 ± 18 Ma,1σ). Upward in the sequence, a 680 Ma Pb–Pb ageof a Cu ore stratiform deposit within the overlyingsediments from the Ymer Ø group (Jensen, 1993) con-stitutes a minimum age, indicating that the NLG detrituswere deposited between 990 Ma and 680 Ma. This timeinterval encompasses the c. 760–700 Ma phase of intra-cratonic extension that preceded a second rifting phaseleading to the initiation of the Iapetus Ocean from620 Ma to 550 Ma (Dalziel et al., 1994; Cawood etal., 2001). We thus favour earlier suggestions that theNLG sediments were deposited during the Early toMid-Neoproterozoic and are not a contemporaneousequivalent to the latest Mesoproterozoic to early Neopro-terozoic Krummedal metasediments (Watt and Thrane,2001; Higgins et al., 2004).
6.2.2. Source regionsLA-ICP-MS results (Fig. 7) show that the detrital
zircon signatures vary slightly but significantly, bothin age range and proportions, between samples. Themost prominent feature in the zircon signature is thepredominance in all samples of Paleoproterozoic zir-cons with ages broadly ranging from 1.85 Ga to 1.60 Ga.Samples 201728 and 201836 (from the same meta-morphic grade) grouped together, the 1.85–1.60 Ga oldzircons represent between 49% (sillimanite zone sam-ples) and 67% (migmatite zone sample) of the agespectrum. Since samples were collected from the baseto the top of the NLG, this indicates that the overallsources were similar and did not change significantlyduring deposition of the thick sedimentary pile. Sam-ple 201728 suggests that the broad 1.85–1.60 Ga clustercan be broken into two possible age groups at aroundc. 1.7–1.6 Ga and c. 1.85–1.75 Ga, which may repre-sent distinct events occurring in the source regions.Perhaps the most striking feature is the almost com-plete disappearance of Grenvillian (1.2–1.0 Ga) grainsupward in the sequence (only one analysis concordantat 1148 ± 20 Ma in sample 201991). This is apparentlyaccompanied by an increase of Archean zircons, which,except for one discordant grain, are lacking in the low-
ermost sample 201893. The age of these Archean zircongrains is restricted to 2.8–2.7 Ga. Another characteris-tic of the source regions is the paucity of 2.5–2.0 GaPaleoproterozoic grains and, sample 201728 set apart,
rian R
40 B. Dhuime et al. / Precambthe lack of 1.4–1.2 Ga old grains. Mesoproterozoic zir-cons, other than those belonging to the Grenvillian cycle,include a population of 1.45–1.35 Ga old grains in sam-ple 201728 and 1.56–1.48 Ga in sample 201991. Sincethese zircon populations have not been detected in othersamples of the sedimentary pile, it is suggested that theyhave been contributed by local sources, unroofed andcaptured by the basin drainage, by contrast to the mid-dle Paleoproterozoic zircon grains, which represent thepredominant clastic input in the studied part of the sed-imentary pile. This conclusion is also supported by theanalyses of zircon fractions by Peucat et al. (1985), whichhave 207Pb/206Pb ranging from c. 1.52 Ga to 2.0 Ga.Although these analyses have been performed on bulkgrain fractions, they clearly demonstrate that the middlePaleoproterozoic component dominates the detrital zir-con populations in all studied samples in spite of mixingwith other age components.
During the inferred deposition time period, the NLGsediments accumulated within the Rodinia superconti-nent. In this area its fragmentation involved three cratonsnamely Laurentia, facing Baltica and Amazonia to theeast and southeast, respectively (Torsvik et al., 1996;Hartz and Torsvik, 2002). Recognition of the sourceregions of the NLG is made difficult since, as seen above,the main detrital zircon population is from 1.85 Gato 1.60 Ga old source rocks for which there is ampleevidence on the three plates. Hence, from such a config-uration, NLG detritus could have been derived from anyone of the three continental landmasses. At this pointof the discussion, it is important to note that the sourceregions may contain both crystalline basement and sed-imentary rocks. However, except in only a few cases,sedimentary units overlying the gneissic basements havenot been investigated as to their detrital content and thesource regions for these sedimentary units is, at best,speculative. In the following, we thus focused on thecrystalline basement units recognized on the main cra-tonic landmasses, but we acknowledge that recycling ofdetritus from early basins may significantly affect ourview of the most likely source region(s) and the proposedpalaeogeographical reconstruction.
A comparison of the NLG age distribution with thatof the underlying basement gneisses suggests a dis-tal source region as the basement mainly consists of2.8–2.7 Ga and 2.0–1.8 Ga old rocks (Steiger et al., 1979;Rex and Gledhill, 1981; Kalsbeek et al., 1993, 2000;Thrane, 2002). Although Archean grains from the NLG
metasediments have ages matching those of the base-ment, the 2.0–1.8 Ga age peak is not represented in theNLG detrital zircon signature. The age spectrum of detri-tal zircons from the Krummedal sequence (Kalsbeek etesearch 155 (2007) 24–46
al., 2000; Watt et al., 2000) displays similarities withthat exhibited by the NLG sediments, which may reflectits recycling in the NLG sequence. Lower Neoprotero-zoic granites and c. 930 Ma metamorphic rims on detritalzircons are common in the Krummedal metasediments(Steiger et al., 1993; Strachan et al., 1995; Kalsbeeket al., 2000; Watt et al., 2000) preserved in the HagarBjerg Thrust Sheet, but are lacking in the metasedi-ments of the Niggli Spids Thrust Sheet. The lack of0.94–0.91 Ga old zircons in the NLG age distributionis thus not a convincing argument against recycling ofthe Krummedal metasediments in the NLG sequencebut restrict recycling, if any, to the Krummedal unitspreserved in the Niggli Spids Thrust Sheet. On theother hand, the similarity in age for detrital zirconsfrom the Krummedal metasediments and from the NLGcould also be explained if the two sequences have hadsimilar source regions, an observation supported bythe Amazonian–Laurentian affinity of the Krummedalsequence as discussed in Watt and Thrane (2001). Fur-ther south in Greenland, the Nagssugtoqidian Orogen(Kalsbeek et al., 1987; Kalsbeek and Nutman, 1996),formed by the 1.8–2.0 Ga suturing of the North Atlanticcraton and the Rae craton (Connelly et al., 2006) can alsobe rejected as a possible source region since there is noindication of a substantial sedimentary input from suchaged rocks.
Amazonia exposes lithotectonic units from which theNLG sediments could have been derived. In particular,rocks from the Rio Negro-Juruena Belt (1.8–1.5 Ga),located along the western margin of the Amazonian Cra-ton (Geraldes et al., 2001) can potentially fit the NLGdetrital zircon age spectrum. However, this source areacan be clearly rejected for at least two reasons. The RioNegro-Juruena Belt is made up of a continuum of agesfrom 1.8 Ga to 1.5 Ga, which would restrict the sourceregion of the NLG to selected parts of this belt, exclud-ing others. More importantly, this part of the craton isbounded by the 1.45–1.30 Ga Rondonian-San IgnacioBelt, which had extensively reworked crustal rocks ofthe Rio Negro-Juruena Belt (Tassinari and Macambira,1999). Detrital zircons within this age range are not rep-resented in the NLG detrital zircon signature. Lastly, thecraton underwent a major event of crustal growth andhigh-grade metamorphism during the Trans-Amazonianperiod (c. 2.2–2.0 Ga) (e.g. Santos et al., 2000), which isnot represented in the age spectrum displayed by detritalzircons from the NLG.
Baltica contains numerous 1.8–1.6 Ga old rocks,particularly in the 1.85–1.65 Ga Trans-ScandinavianIgneous Belt of the Svecofennian shield or in the1.65–1.50 Ga Gothian Kongsbergian Belt, and also in
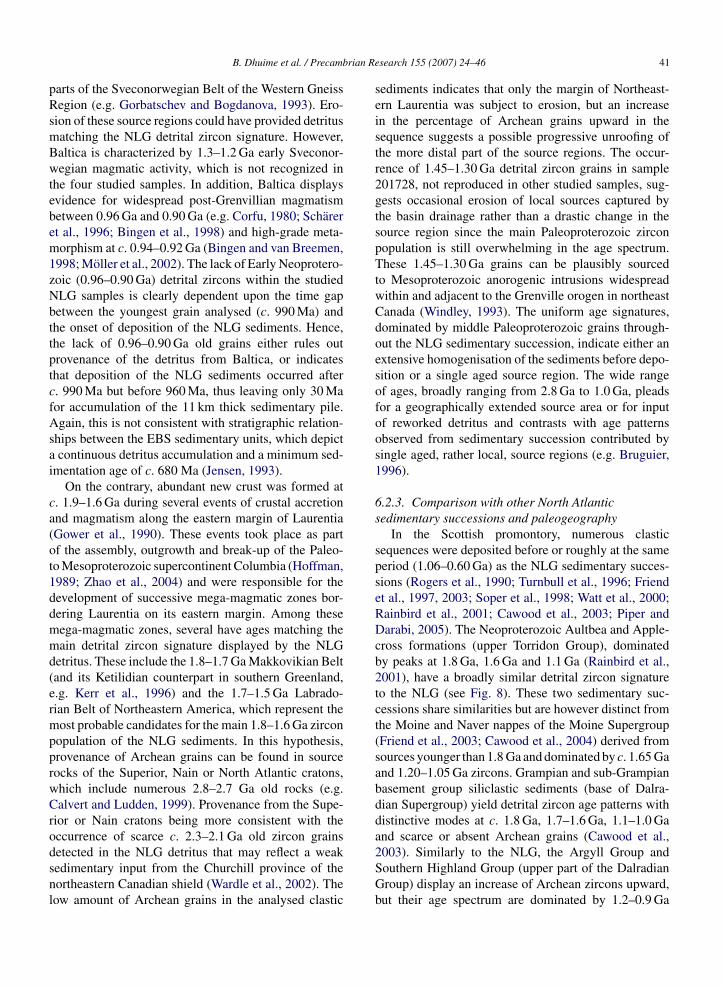
rian Re
pRsmBwtebem1zNbttptcfAsai
ca(ot1ddmmd(ermpprwCrodsnl
B. Dhuime et al. / Precamb
arts of the Sveconorwegian Belt of the Western Gneissegion (e.g. Gorbatschev and Bogdanova, 1993). Ero-
ion of these source regions could have provided detritusatching the NLG detrital zircon signature. However,altica is characterized by 1.3–1.2 Ga early Sveconor-egian magmatic activity, which is not recognized in
he four studied samples. In addition, Baltica displaysvidence for widespread post-Grenvillian magmatismetween 0.96 Ga and 0.90 Ga (e.g. Corfu, 1980; Scharert al., 1996; Bingen et al., 1998) and high-grade meta-orphism at c. 0.94–0.92 Ga (Bingen and van Breemen,
998; Moller et al., 2002). The lack of Early Neoprotero-oic (0.96–0.90 Ga) detrital zircons within the studiedLG samples is clearly dependent upon the time gapetween the youngest grain analysed (c. 990 Ma) andhe onset of deposition of the NLG sediments. Hence,he lack of 0.96–0.90 Ga old grains either rules outrovenance of the detritus from Baltica, or indicateshat deposition of the NLG sediments occurred after. 990 Ma but before 960 Ma, thus leaving only 30 Maor accumulation of the 11 km thick sedimentary pile.gain, this is not consistent with stratigraphic relation-
hips between the EBS sedimentary units, which depictcontinuous detritus accumulation and a minimum sed-
mentation age of c. 680 Ma (Jensen, 1993).On the contrary, abundant new crust was formed at
. 1.9–1.6 Ga during several events of crustal accretionnd magmatism along the eastern margin of LaurentiaGower et al., 1990). These events took place as partf the assembly, outgrowth and break-up of the Paleo-o Mesoproterozoic supercontinent Columbia (Hoffman,989; Zhao et al., 2004) and were responsible for theevelopment of successive mega-magmatic zones bor-ering Laurentia on its eastern margin. Among theseega-magmatic zones, several have ages matching theain detrital zircon signature displayed by the NLG
etritus. These include the 1.8–1.7 Ga Makkovikian Beltand its Ketilidian counterpart in southern Greenland,.g. Kerr et al., 1996) and the 1.7–1.5 Ga Labrado-ian Belt of Northeastern America, which represent theost probable candidates for the main 1.8–1.6 Ga zircon
opulation of the NLG sediments. In this hypothesis,rovenance of Archean grains can be found in sourceocks of the Superior, Nain or North Atlantic cratons,hich include numerous 2.8–2.7 Ga old rocks (e.g.alvert and Ludden, 1999). Provenance from the Supe-
ior or Nain cratons being more consistent with theccurrence of scarce c. 2.3–2.1 Ga old zircon grains
etected in the NLG detritus that may reflect a weakedimentary input from the Churchill province of theortheastern Canadian shield (Wardle et al., 2002). Theow amount of Archean grains in the analysed clasticsearch 155 (2007) 24–46 41
sediments indicates that only the margin of Northeast-ern Laurentia was subject to erosion, but an increasein the percentage of Archean grains upward in thesequence suggests a possible progressive unroofing ofthe more distal part of the source regions. The occur-rence of 1.45–1.30 Ga detrital zircon grains in sample201728, not reproduced in other studied samples, sug-gests occasional erosion of local sources captured bythe basin drainage rather than a drastic change in thesource region since the main Paleoproterozoic zirconpopulation is still overwhelming in the age spectrum.These 1.45–1.30 Ga grains can be plausibly sourcedto Mesoproterozoic anorogenic intrusions widespreadwithin and adjacent to the Grenville orogen in northeastCanada (Windley, 1993). The uniform age signatures,dominated by middle Paleoproterozoic grains through-out the NLG sedimentary succession, indicate either anextensive homogenisation of the sediments before depo-sition or a single aged source region. The wide rangeof ages, broadly ranging from 2.8 Ga to 1.0 Ga, pleadsfor a geographically extended source area or for inputof reworked detritus and contrasts with age patternsobserved from sedimentary succession contributed bysingle aged, rather local, source regions (e.g. Bruguier,1996).
6.2.3. Comparison with other North Atlanticsedimentary successions and paleogeography
In the Scottish promontory, numerous clasticsequences were deposited before or roughly at the sameperiod (1.06–0.60 Ga) as the NLG sedimentary succes-sions (Rogers et al., 1990; Turnbull et al., 1996; Friendet al., 1997, 2003; Soper et al., 1998; Watt et al., 2000;Rainbird et al., 2001; Cawood et al., 2003; Piper andDarabi, 2005). The Neoproterozoic Aultbea and Apple-cross formations (upper Torridon Group), dominatedby peaks at 1.8 Ga, 1.6 Ga and 1.1 Ga (Rainbird et al.,2001), have a broadly similar detrital zircon signatureto the NLG (see Fig. 8). These two sedimentary suc-cessions share similarities but are however distinct fromthe Moine and Naver nappes of the Moine Supergroup(Friend et al., 2003; Cawood et al., 2004) derived fromsources younger than 1.8 Ga and dominated by c. 1.65 Gaand 1.20–1.05 Ga zircons. Grampian and sub-Grampianbasement group siliclastic sediments (base of Dalra-dian Supergroup) yield detrital zircon age patterns withdistinctive modes at c. 1.8 Ga, 1.7–1.6 Ga, 1.1–1.0 Gaand scarce or absent Archean grains (Cawood et al.,
2003). Similarly to the NLG, the Argyll Group andSouthern Highland Group (upper part of the DalradianGroup) display an increase of Archean zircons upward,but their age spectrum are dominated by 1.2–0.9 Ga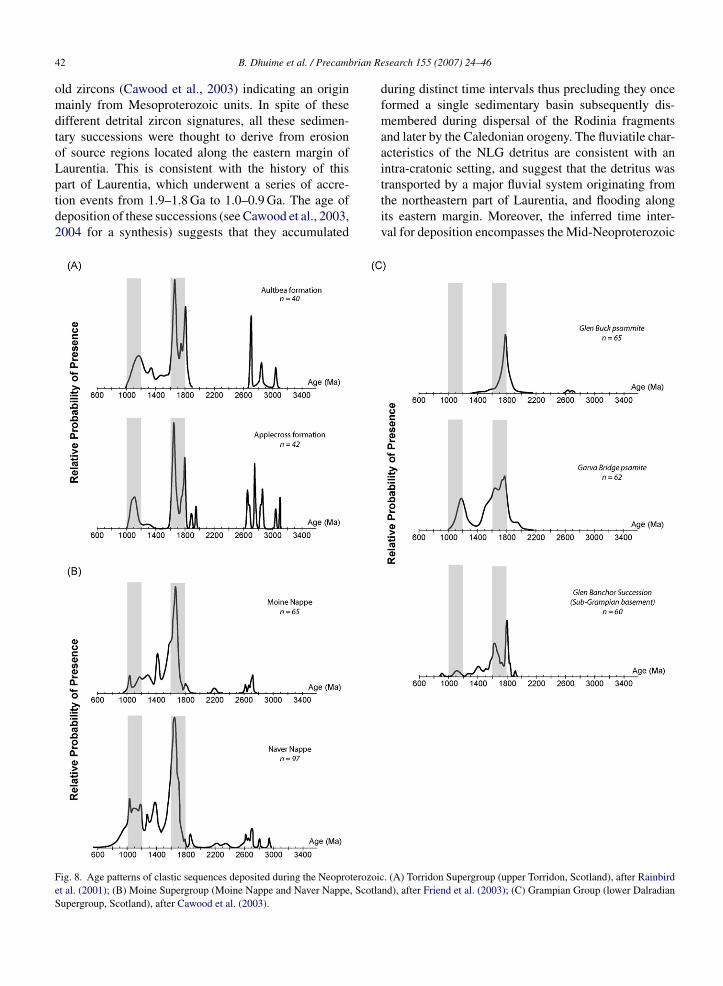
rian R
42 B. Dhuime et al. / Precambold zircons (Cawood et al., 2003) indicating an originmainly from Mesoproterozoic units. In spite of thesedifferent detrital zircon signatures, all these sedimen-tary successions were thought to derive from erosionof source regions located along the eastern margin ofLaurentia. This is consistent with the history of this
part of Laurentia, which underwent a series of accre-tion events from 1.9–1.8 Ga to 1.0–0.9 Ga. The age ofdeposition of these successions (see Cawood et al., 2003,2004 for a synthesis) suggests that they accumulatedFig. 8. Age patterns of clastic sequences deposited during the Neoproterozoicet al. (2001); (B) Moine Supergroup (Moine Nappe and Naver Nappe, ScotlaSupergroup, Scotland), after Cawood et al. (2003).
esearch 155 (2007) 24–46
during distinct time intervals thus precluding they onceformed a single sedimentary basin subsequently dis-membered during dispersal of the Rodinia fragmentsand later by the Caledonian orogeny. The fluviatile char-acteristics of the NLG detritus are consistent with anintra-cratonic setting, and suggest that the detritus was
transported by a major fluvial system originating fromthe northeastern part of Laurentia, and flooding alongits eastern margin. Moreover, the inferred time inter-val for deposition encompasses the Mid-Neoproterozoic. (A) Torridon Supergroup (upper Torridon, Scotland), after Rainbirdnd), after Friend et al. (2003); (C) Grampian Group (lower Dalradian

rian Re
(eaoirGCtmBtwncsfsbocGIcrBtoL
7
(
(
B. Dhuime et al. / Precamb
760–700 Ma) aborted rifting phase that affected theastern margin of Laurentia (Cawood et al., 2001; Dalzielnd Soper, 2001), and is clearly older than openingf the Iapetus Ocean at c. 600 Ma. The NLG is thusnterpreted as being related to the Mid-Neoproterozoicifting event well represented by the extension-relatedrampian and Appin groups in the Scottish promontory.onsidering Rodinia reconstruction during the Neopro-
erozoic, it is striking to note that all the clastic sequencesentioned above originated from Laurentia and not fromaltica or Amazonia, yet located adjacent to Lauren-
ia. This could be explained following two differentays. First, the two latter continental landmasses mayot have been a topographic high at this time, whichonflicts with a model of simple rifting predicting thatediments would have originated from crustal sectionsrom either sides of the rift. This suggests that litho-pheric extension was asymmetrical uplifting Laurentiaut leaving Amazonia and Baltica as lowlands. On thether hand, new paleogeographic reconstructions indi-ate that Amazonia was not that close to northeastreenland between the time of Rodinia assembly and
apetus opening (Cawood and Pisarevsky, 2006), whichould easily explain the lack of detritus input from thategion. In this view, the lack of detritus originating fromaltica can then be due to a general south to north direc-
ion of transport and simply reflects the fact that riftingpened toward an open ocean to the north of a combinedaurentia/Baltica.
. Conclusions
1) Analyses of the detrital zircons recovered from sil-iclastic sediments sampled at different levels of theNathorst Land Group indicate that sedimentationoccurred between c. 990 Ma (the age of the youngestdetrital zircon grain analysed) and 680–610 Ma (theage of a Cu ore stratiform deposit (Jensen, 1993)and that of the overlying Tillite Group, respectively),in a post-Grenvillian sedimentary environment. TheNLG of the Eleonore Bay Supergroup is thus relatedto the aborted Mid-Neoproterozoic rifting phase thatoccurred before rifting and opening of the IapetusOcean.
2) The age spectrum is dominated by Paleoprotero-zoic zircon populations (1.85–1.60 Ga) and alsoyields contributions from Archean (2.8–2.7 Ga)
and Grenvillian (1.2–1.0 Ga) source rocks sug-gesting the detritus derived from the Labrado-rian and Makkovikian provinces of northeasternLaurentia.search 155 (2007) 24–46 43
(3) A comparison with other Late Mesoproterozoic–Neoproterozoic successions of the Scottish promon-tory (Torridon, Moine, Grampian and Dalradian)indicates similarities in detrital zircon signature butalso highlights discrepancies in major age peaks andsuggests varied provenance for the detritus. How-ever, the proposed source regions are consistentwith derivation of the sediments from the easternmargin of Laurentia. Although these sedimentaryformations did not constitute parts of a single basin,they record the Neoproterozoic extensional pulsesthat affected eastern Laurentia before its separationfrom west Gondwana and the opening of the IapetusOcean.
(4) After deposition, sediments of the Nathorst LandGroup were involved in the Caledonian orogenyand metamorphosed at 428 ± 25 Ma. This is withinerrors of the 425 Ma age for Caledonian anatexis inNE Greenland (White et al., 2002).
(5) Metamorphic transformations suffered by zircons ofhigh-grade rocks indicate that the destabilisation ofilmenite and its recrystallisation under amphibolitefacies metamorphic conditions may supply Zr avail-able for new zircon growth. On the contrary, undersimilar P–T conditions but with high fO2 and fH2Oconditions, crystallisation of metamorphic titaniteat the expense of ilmenite acts as a sink for Zrand inhibits zircon growth. New zircon growth inmetamorphic environment is thus also influenced bynewly grown minerals, which can strongly partitionzirconium.
Acknowledgements
This work has benefited from financial support by theCentre National de la Recherche Scientifique. Technicalhelp in the laboratory is acknowledged, particularly C.Nevado and D. Delmas for the thin sections and C. Grillfor SEM imaging. We thank people from the “ServiceCommun National Cameca IMS 1270” (CRPG, Nancy)for their help during SIMS analyses. We are grateful toB. Bingen and P. Cawood for helpful comments on aprevious version of this manuscript. The review by twoanonymous reviewers greatly improved this manuscript.
References
Bingen, B., van Breemen, O., 1998. U–Pb monazite ages in
amphibolite- to granulite-facies orthogneisses reflect hydrousmineral breakdown reactions: Sveconorwegian Province of SWNorway. Contrib. Mineral. Petrol. 132, 336–353.Bingen, B., Austrheim, H., Whitehouse, M., 2001. Ilmenite as a sourcefor zirconium during high-grade metamorphism? Textural evi-

rian R
44 B. Dhuime et al. / Precambdence from the Caledonides of western Norway and implicationsfor zircon geochronology. J. Petrol. 42, 355–375.
Bingen, B., Boven, A., Panzalan, L., Wijbrans, J.R., Demaiffe, D.,1998. Hornblende 40Ar/39Ar geochronology across terrane bound-aries in the sveconorwegian Province of S. Norway. PrecambrianRes. 90, 159–185.
Bosch, D., Bruguier, O., Pidgeon, R.T., 1996. Evolution of an Archaeanmetamorphic belt: a conventional and SHRIMP U–Pb study ofaccessory minerals from the Jimperding metamorphic belt, YilgarnCraton, West Australia. J. Geol. 104, 695–711.
Bruguier, O., 1996. U–Pb ages on single detrital zircon grains fromthe Tasmiyele Group: implications for the evolution of the OlekmaBlock (Aldan Shield, Siberia). Precambrian Res. 78, 197–210.
Bruguier, O., Telouk, P., Cocherie, A., Fouillac, A.M., Albarede, F.,2001. Evaluation of Pb–Pb and U–Pb laser ablation ICP-MS zircondating using matrix-matched calibration samples with a frequencyquadrupled (266 nm) Nd:YAG laser. Geostandards Newslett. 25,361–373.
Caby, R., Bertrand-Sarfati, J., 1988. The Eleonore Bay Group (centralEast Greenland). In: Winchester, J. (Ed.), Late Proterozoic Stratig-raphy of the Northern Atlantic. Blackie and Son Ltd., Glasgow, pp.212–236.
Calvert, A.J., Ludden, J.N., 1999. Archean continental assembly in thesoutheastern Superior Province of Canada. Tectonics 18, 412–429.
Cawood, P.A., Pisarevsky, S.A., 2006. Was baltica right-way-up orupside-down in the Neoproterozoic? J. Geol. Soc. Lond. 163,753–759.
Cawood, P.A., McCausland, P.J.A., Dunning, G.R., 2001. OpeningIapetus: constraints from the Laurentian margin in Newfoundland.Geol. Soc. Am. Bull. 113, 443–453.
Cawood, P.A., Nemchin, A.A., Smith, M., Loewy, S., 2003. Source ofthe Dalradian Supergroup constrained by U–Pb dating of detritalzircon and implications for the East Laurentian margin. J. Geol.Soc. Lond. 160, 231–246.
Cawood, P.A., Nemchin, A.A., Strachan, R.A., Kinny, P.D., Loewy, S.,2004. Laurentian provenance and an intracratonic tectonic settingfor the Moine Supergroup, Scotland, constrained by detrital zirconsfrom the Loch Eil and Glen Urquhart successions. J. Geol. Soc.Lond. 161, 861–874.
Connelly, J., Thrane, K., Krawiec, A., Garde, A., 2006. Linking thePalaeoproterozoic Nagssugtoqidian and Rinkian orogens throughthe Disko Bugt region of West Greenland. J. Geol. Soc. Lond. 163,319–335.
Corfu, F., 1980. U–Pb and Rb–Sr systematics in a polyorogenic seg-ment of the Precambrian shield, central Southern Norway. Lithos13, 305–323.
Dalziel, I.W.D., 1994. Precambrian Scotland as a Laurentia-Gondwanalink: origin and significance of cratonic promontories. Geology 22,589–592.
Dalziel, I.W.D., Dalla, S., Luis, H., Gahagan, L.M., 1994. PaleozoicLaurentia-Gondwana interaction and the origin of the Appalachian-Andean mountain system. Geol. Soc. Am. Bull. 106, 243–252.
Dalziel, I.W.D., Soper, N.J., 2001. Neoproterozoic extension on theScottish promontory of Laurentia: Paleogeographic and tectonicimplications. J. Geol. 109, 299–317.
Deloule, E., Chaussidon, M., Glass, B.P., Koeberl, C., 2001. U–Pbisotopic study of relict zircon inclusions recovered from Muong
Nong-type tektites. Geochim. Cosmochim. Acta 65, 1833–1838.Eggins, S.M., Kinsley, L.P.J., Shelley, J.M.G., 1998. Deposition andelement fractionation processes during atmospheric pressure lasersampling for analysis by ICP-MS. Appl. Surf. Sci. 127–129,278–286.
esearch 155 (2007) 24–46
Fraser, G., Ellis, D., Eggins, S., 1997. Zirconium abundance ingranulite-facies minerals, with implications for zircon geochronol-ogy in high-grade rocks. Geology 25, 607–610.
Friend, C.R.L., Kinny, P.D., Rogers, G., Strachan, R.A., Paterson, B.A.,1997. U–Pb zircon geochronological evidence for Neoproterozoicevents in the Glenfinnan Group (Moine Supergroup): the forma-tion of the Ardgour granite gneiss, North-west Scotland. Contrib.Mineral. Petrol. 128, 101–113.
Friend, C.R.L., Strachan, R.A., Kinny, P.D., Watt, G.R., 2003.Provenance of the Moine Supergroup of NW Scotland: evi-dence from geochronology of detrital and inherited zircons from(meta)sedimentary rocks, granites and migmatites. J. Geol. Soc.Lond. 160, 247–257.
Geraldes, M.C., Van Schmus, W.R., Condie, K.C., Bell, S., Teixeira,W., Babinski, M., 2001. Proterozoic geologic evolution of the SWpart of the Amazonian Craton in Mato Grosso State, Brazil. Pre-cambrian Res. 111, 91–128.
Gorbatschev, R., Bogdanova, S., 1993. Frontiers in the Baltic Shield.Precambrian Res. 64, 3–21.
Gower, C.F., Ryan, A.B., Rivers, T., 1990. Mid-Proterozoic Laurentia-Baltica: an overview of its geological evolution and a summary ofthe contributions made by this volume. In: Gower, C.F., Rivers,T., Ryan, A.B. (Eds.), Mid-Proterozoic Laurentia-Baltica, vol. 38,Geol. Assoc. Can. Spec. Pap., pp. 1–20.
Gunther, D., Heinrich, C.A., 1999. Enhanced sensitivity in LA-ICP-MS using helium–argon mixture as aerosol carrier. J. Anal. At.Spectrom. 14, 1369–1374.
Hansen, B.T., Steiger, R.H., Higgins, A.K., 1980. Isotopic Evidencefor a Precambrian metamorphic event within the Charcot Landwindow, East Greenland Caledonian fold belt. Bull. Geol. Soc.Denmark 29, 151–160.
Harlov, D., Tropper, P., Seifert, W., Nijland, T., Forster, H.J., 2006.Formation of Al-rich titanite (CaTiSiO4O-CaAlSiO4OH) reactionrims on ilmenite in metamorphic rocks as a function of fH2O andfO2. Lithos 88, 72–84.
Hartz, E.H., Torsvik, T.H., 2002. Baltica upside down: a new platetectonic model for Rodinia and the Iapetus Ocean. Geology 30,255–258.
Henriksen, N., 1985. The Caledonides of central East Greenland70◦–76◦N. In: Gee, D.G., Sturt, B.A. (Eds.), The CaledonianOrogen-Scandinavia and Related Areas, Part 2. John Wiley andSons, Chichester, pp. 1095–1113.
Higgins, A.K., 1988. The Krummedal supracrustal sequence in EastGreenland. In: Winchester, J. (Ed.), Late Proterozoic Stratigra-phy of the Northern Atlantic. Blackie and Son Ltd., Glasgow,pp. 86–96.
Higgins, A.K., Elvevold, S., Escher, J.C., Frederiksen, K.S., Gilotti,J.A., Henriksen, N., Jepsen, H.F., Jones, K.A., Kalsbeek, F., Kinny,P.D., Leslie, A.G., Smith, M.P., Thrane, K., Watt, G.R., 2004.The foreland-propagating thrust architecture of the East GreenlandCaledonides 72◦–75◦. N. J. Geol. Soc. Lond. 161, 1009–1026.
Higgins, A.K., Friderichsen, J.D., Rex, D.C., Gledhill, A.R., 1978.Early Proterozoic isotopic ages in the East Greenland CaledonianFold Belt. Contrib. Mineral. Petrol. 67, 87–94.
Hoffman, F.P., 1989. Speculations on Laurentia’s first gigayear (2.0 to1.0 Ga). Geology 17, 135–138.
Jang, Y.D., Naslund, H.R., 2002. Major and trace element variation in
ilmenite in the Skaergaard Intrusion petrologic implications. Chem.Geol. 193, 109–125.Jensen, S.M., 1993. Lead isotope studies on mineral showings and oredeposits in East Greenland. Grønlands Geol. Undersøgelse Rapp.159, 101–108.

rian Re
K
K
K
K
K
L
M
M
N
N
P
P
P
R
R
R
R
B. Dhuime et al. / Precamb
alsbeek, F., Nutman, A.P., 1996. Anatomy of the early ProterozoicNagssugtoqidian orogen, West Greenland, explored by reconnais-sance SHRIMP U–Pb dating. Geology 24, 515–518.
alsbeek, F., Nutman, A.P., Taylor, P.N., 1993. Palaeoproterozoicbasement province in the Caledonian Fold Belt of North-EastGreenland. Precambrian Res. 63, 163–178.
alsbeek, F., Pidgeon, R.T., Taylor, P.N., 1987. Nagssugtoqidianmobile belt of West Greenland; a cryptic 1850 Ma suture betweentwo Archaean continents: chemical and isotopic evidence. EarthPlanet. Sci. Lett. 85, 365–385.
alsbeek, F., Thrane, K., Nutman, A.P., Jepsen, H.F., 2000. Late Meso-proterozoic to early Neoproterozoic history of the East GreenlandCaledonides: evidence for Greenvillian orogenesis? J. Geol. Soc.Lond. 157, 1215–1225.
err, A., Ryan, B., Gower, C.F., Wardle, R.J., 1996. The MakkovikProvince: extension of the Ketilidian mobile belt in mainland NorthAmerica. Geol. Soc. Special Publ. 112, 155–177.
udwig, K.R., 2000. User’s Manual for Isoplot/Ex v.2.3. A Geochrono-logical Toolkit for Microsoft Excel. Berkeley GeochronologyCenter Sp. Pub. No. 1a, Berkeley, California.
achado, N., Gauthier, G., 1996. Determination of 207Pb/206Pb ageson zircon and monazite by laser-ablation ICPMS and applicationto a study of sedimentary provenance and metamorphism in south-eastern Brazil. Geochim. Cosmochim. Acta 60, 5063–5073.
oller, A., O’Brien, P.J., Kennedy, A., Kroner, A., 2002. Polyphase zir-con in ultrahigh-temperature granulites (Rogaland, SW Norway):constraints for Pb diffusion in zircon. J. Meta. Geol. 20, 727–740.
emchin, A.A., Pidgeon, R.T., Wilde, S.A., 1994. Timing of LateArchaean granulite facies metamorphism in the southwestern Yil-garn Craton of Western Austria: evidence from U–Pb ages ofzircons from mafic granulites. Precambrian Res. 68, 307–321.
eves, S., Bruguier, O., Vauchez, A., Bosch, D., Rangel da Silva,J.M., Mariano, G., 2006. Timing of crust formation, depositionof supracrustal sequences, and Transamazonian and Brasilianometamorphism in the East Pernambuco belt (central domain, Bor-borema Province, NE Brazil): implications for western Gondwanaassembly. Precambrian Res. 149, 197–216.
eucat, J.J., Tisserant, D., Caby, R., Clauer, N., 1985. Resistance ofzircons to U–Pb resetting in a prograde metamorphic sequenceof Caledonian age in East Greenland. Can. J. Earth Sci. 22, 330–338.
idgeon, R.T., 1992. Recrystallisation of oscillatory zoned zircon:some geochronological and petrological implications. Contrib.Mineral. Petrol. 110, 463–472.
iper, J.D.A., Darabi, M.H., 2005. Palaeomagnetic study of the (lateMesoproterozoic) Torridon Group, NW Scotland: age, magne-tostratigraphy, tectonic setting and partial magnetic overprintingby Caledonian orogeny. Precambrian Res. 142, 45–81.
ainbird, R.H., Hamilton, M.A., Young, G.M., 2001. Detrital zircongeochronology and provenance of the Torridonian, NW Scotland.J. Geol. Soc. Lond. 158, 15–27.
asmussen, B., 2005. Zircon growth in very low grade metasedimen-tary rocks: evidence for zirconium mobility at c. 250 ◦C. Contrib.Mineral. Petrol. 150, 146–155.
ex, D.C., Gledhill, A.R., 1981. Isotopic studies in the East Green-land Caledonides (72◦–74◦N)—Precambrian and Caledonian ages.Grønlands Geol. Undersøgelse Rapp. 104, 47–72.
ogers, G., Krogh, T.E., Bluck, B.J., Kwok, Y.Y., 1990. Provenanceages of the Torridonian sandstone of NW Scotland using sin-gle grain U–Pb zircon analysis. Seventh International Conferenceon Geochronology Cosmochronology and Isotope Geology. Geol.Soc. Aust. Abs. 27, 84.
search 155 (2007) 24–46 45
Rubin, J.N., Henry, C.D., Price, J.G., 1989. Hydrothermal zircons andzircon overgrowths, Sierra Blanca Peaks, Texas. Am. Mineral. 74,865–869.
Rubin, J.N., Henry, C.D., Price, J.G., 1993. The mobility of zirconiumand other “immobile” elements during hydrothermal alteration.Chem. Geol. 110, 29–47.
Santos, J.O.S., Hartmann, L.A., Gaudette, H.E., Groves, D.I.,McNaughton, N.J., Fletcher, I.R., 2000. A new understanding ofthe provinces of the Amazon Craton based on integration of fieldmapping and U–Pb and Sm–Nd geochronology. Gondwana Res.3, 453–488.
Satish-Kumar, M., 2005. Graphite-bearing CO2-fluid inclusions ingranulites: insights on graphite precipitation and carbon isotopeevolution. Geochim. Cosmochim. Acta 69, 3841–3856.
Scharer, U., Wilmart, E., Duchesne, J.-C., 1996. The short durationand anorogenic character of anorthosite magmatism: U–Pb datingof the Rogaland Complex, Norway. Earth Planet. Sci. Lett. 139,335–350.
Soper, N.J., 1994. Neoproterozoic sedimentation on the northeast mar-gin of Laurentia and the opening of Iapetus. Geol. Mag. 131,291–299.
Soper, N.J., Harris, A.L., Strachan, R.A., 1998. Tectonostratigraphyof the Moine Supergroup: a synthesis. J. Geol. Soc. Lond. 155,13–24.
Stacey, J.S., Kramers, J.D., 1975. Approximation of terrestrial leadisotope evolution by a two stage model. Earth Planet. Sci. Lett. 6,15–25.
Steiger, R.H., Bickel, R.A., Meier, M., 1993. Conventional U–Pbdating of single fragments of zircon for petrogenetic studies ofPhanerozoic granitoids. Earth Planet. Sci. Lett. 115, 197–209.
Steiger, R.H., Hansen, B.T., Schuler, C.H., Bar, M.-T., Henriksen, N.,1979. Polyrogenic nature of the Southern Caledonian Fold Belt inEast Greenland: an isotopic age study. J. Geol. 87, 475–495.
Strachan, R.A., Nutman, A.P., Friderichsen, J.D., 1995. SHRIMPU–Pb geochronology and metamorphic history of the Smallefjordsequence, NE Greenland Caledonides. J. Geol. Soc. Lond. 152,779–784.
Tassinari, C.C.G., Macambira, M.J.B., 1999. Geochronologicalprovinces of the Amazonian Craton. Episodes 22, 174–182.
Thrane, K., 2002. Relationships between Archaean and Palaeoprotero-zoic crystalline basement complexes in the southern part of the EastGreenland Caledonides: an ion microprobe study. PrecambrianRes. 113, 19–42.
Torsvik, T.H., Smethrust, M.A., Meert, J.G., Van der Voo, R., McK-errow, W.S., Brasier, M.D., Sturt, B.A., Walderhaug, H.J., 1996.Continental break-up and collision in the Neoproterozoic andPaleozoic—a tale of Baltica and Laurentia. Earth Sci. Rev. 40,229–258.
Turnbull, M.J.M., Whitehouse, M.J., Moorbath, S., 1996. New isotopicage determinations for the Torridonian, NW Scotland. J. Geol. Soc.Lond. 153, 955–964.
Vavra, G., Gebauer, D., Schmid, R., Compston, W., 1996. Multiplezircon growth and recrystallization during polyphase Late Car-boniferous to Triassic metamorphism in granulites of the IvreaZone (Southern Alps): an ion microprobe (SHRIMP) study. Con-trib. Mineral. Petrol. 122, 337–358.
Vidal, G., 1976. Late Precambrian acritarchs from the Eleonore Bay
Group and Tillite Group in East Greenland: a preliminary report.Grønlands Geol. Undersøgelse Rapp. 78, 1–19.Vidal, G., 1979. Acritarchs from the upper Proterozoic and lowerCambrian of East Greenland. Grønlands Geol. Unders. Bull. 134,1–55.

rian R
46 B. Dhuime et al. / PrecambWardle, R.J., James, D.T., Scott, D.J., Hall, J., 2002. The southeasternChurchill Province: synthesis of a Paleoproterozoic transpressionalorogen. Can. J. Earth Sci. 39, 639–663.
Watt, G.R., Thrane, K., 2001. Early Neoproterozoic events in EastGreenland. Precambrian Res. 110, 165–184.
Watt, G.R., Kinny, P.D., Friderichsen, J.D., 2000. U–Pb geochronol-ogy of Neoproterozoic and Caledonian tectonothermal events inthe East Greenland Caledonides. J. Geol. Soc. Lond. 157, 1031–
1048.White, A.P., Hodges, K.V., Martin, M.W., 2002. Geologic constraintson middle-crustal behavior during broadly synorogenic extensionin the central East Greenland Caledonides. Int. J. Earth Sci. 91,187–208.
esearch 155 (2007) 24–46
Wiedenbeck, M., Alle, P., Corfu, F., Griffin, W.L., Meier, M., 1995.Three natural zircon standards for U–Th–Pb, Lu–Hf, trace elementand REE analyses. Geostandards Newslett. 19, 1–23.
Williams, I.S., Claesson, S., 1987. Isotopic evidence for the Precam-brian provenance and Caledonian metamorphism of high gradeparagneisses from the Seve Nappes, Scandinavian Caledonides;2, Ion microprobe zircon U–Th–Pb. Contrib. Mineral. Petrol. 97,205–217.
Windley, B.F., 1993. Proterozoic anorogenic magmatism and its oro-genic connections. J. Geol. Soc. Lond. 150, 39–50.
Zhao, G., Sun, M., Wilde, S.A., Li, S., 2004. A Paleo-Mesoproterozoicsuper continent: assembly, growth and breakup. Earth Sci. Rev. 67,91–123.

The Trans-North China Belt (TNCB) is a Paleoprotero-zoic collisional orogen (ca. 1.9-1.8 Ga) responsible forthe amalgamation of the North China Craton. Detailfield works in Lüliangshan, Hengshan, Wutaishan andFuping massifs where the belt is well exposed, allow usto draw new tectonic map and crustal-scale cross sec-tions. The available petrologic, radiometric,geochronologic data are integrated in a geodynamicevolution scheme for this orogen. The Low Grade MaficUnit (LGMU) is interpreted as an ophiolitic napperooted in a suture zone located in the western part ofthe Lüliangshan. This ophiolitic nappe overthrusts tothe SE upon the Orthogneiss-Volcanites Unit (OVU)that consists of a bimodal volcanic-sedimentary seriesmetamorphosed under amphibolite facies conditionsintruded by calcalkaline orthogneiss. The OVU is acomposite Neoarchean-Paleoproterozoic magmatic arcdeveloped during two stages (ca. 2500 and 2100 Ma)upon a continental basement corresponding to thewestern extension of the Neoarchean Fuping massif.The OVU overthrusts to the SE the Fuping massif alongthe Longquanguan shear zone. This stack of nappe,coeval with an amphibolite facies metamorphism, isdated at ca 1880 Ma. Subsequently, the metamorphicseries experienced a widespread migmatization at 1850Ma and was intruded by post-orogenic plutons dated at1800 Ma. The weakly to unmetamorphosed HutuoSupergroup unconformably overlies the metamor-phosed and ductilely deformed units (OVU andLGMU), but it is also involved in a second tectonicphase developed in subsurface conditions. These struc-tural features lead us to question the ca 2090 Ma ageattributed to the Hutuo supergroup. Moreover, in theFuping massif, several structural and magmatic linesof evidence argue for an earlier orogenic event at ca2100 Ma that we relate to an older west-directed sub-duction below the Fuping Block. The Taihangshan
Fault might be the location of a possible suture zonebetween the Fuping Block and an eastern one. A geo-dynamic model, at variance with previous ones, is pro-posed to account for the formation of the TNCB. In thisscheme, three Archean continents, namely from West toEast, the Ordos, Fuping and Eastern Blocks are sepa-rated by the Lüliang and Taihang Oceans. The closureof the Taihang Ocean at ca 2100 Ma by westward sub-duction below the Fuping Block accounts for the arcmagmatism and the 2100 Ma orogeny. The second col-lision at 1900–1880 Ma between the Fuping and Ordosblocks is responsible for the main structural, metamor-phic and magmatic features of the Trans-North ChinaBelt.
Introduction
Since a decade, an increasing amount of information through allPrecambrian cratons in the world provided evidence for plate tec-tonics activity with geodynamic features close to those of the pre-sent times since Mesoarchean (ca. 3100 Ma) times (e.g. Smithies etal., 2006; Cawood et al., 2006 and enclosed references). When deal-ing with Paleoproterozoic geodynamics (ca 2000 Ma), ophiolites,calk-alkaline magmatic rocks or nappe tectonics are also docu-mented in many places. For instance, subduction-related magma-tism and arc collage are described in the Trans-Hudson orogen ofCanada (e. g. Hollings and Andell, 2002, Maxeiner et al., 2005),paleoproterozoic eclogitized oceanic crust is reported in theUsagaran Belt of Tanzania (Möller et al., 1995), ophiolites are iden-tified in several Paleoproterozoic belts (Helmstaedt and Scott,1992). These geological features agree with a modern-style platetectonics.
The North China Craton (NCC) contains some of the oldestrocks of Asia: gneiss with 3800 Ma old zircons (Liu et al., 1992) and,although disputed, 2500 Ma old ophiolites (Kusky et al., 2001; Zhaiet al., 2005; Zhao et al., 2005). Most of authors agree that the forma-tion of the NCC results of subduction, arc magmatism, accretion andcollision processes, similar to those of modern-style plate tectonics,its formation remains controversial in the definition of the involvedcontinental masses, timing and modalities of collision. The N-Strending Trans-North China Belt (TNCB), also called Central Oro-genic Belt has been identified as the main place were a western cra-
Episodes, Vol. 30, no. 2
95
by Michel Faure1, Pierre Trap1, Wei Lin2, Patrick Monié3, and Olivier Bruguier3
Polyorogenic evolution of the PaleoproterozoicTrans-North China Belt—New insights from the Lüliangshan-Hengshan-Wutaishan and Fuping massifs
1 Institut des Sciences de la Terre d'Orléans, UMR-CNRS 6113, Bâtiment Géosciences, Université d'Orléans, F-45067 Orléans Cedex 2,France. E-mail: [email protected] and [email protected]
2 State Key Laboratory of Lithospheric Evolution, Institute of Geology and Geophysics, Chinese Academy of Sciences, Beijing 10029, China.E-mail: [email protected]
3 Géociences Montpellier, cc 56, Université Montpellier, 2 Pl. E.-Bataillon, F-34095 Montpellier Cedex, France. E-mail: [email protected] and E-mail: [email protected]

ton (or Ordos Block) and an eastern one collided (Zhao et al., 2000,2001). According to some authors (e. g. Wang et al., 1996; Li et al,2002; Kusky and Li, 2003; Zhai et al., 2005; Polat et al., 2005), theNCC was consolidated in Neoarchean times by welding ofMesoarchean or older blocks along the TNCB. Conversely, otherauthors propose that the TNCB is a Paleoproterozoic collisional belt(Li et al., 1990; Wu and Zhong, 1998; Zhao et al., 2000, 2001, 2005;Kröner et al., 2005 and enclosed references, Figure 1). Furthermore,those western and eastern blocks are likely composed of severalpieces. In the eastern and western blocks, the East-West and SW-NEtrending Paleoproterozoic Liaoji, and Khondalite Belt have beenidentified (e. g. Faure et al., 2004; Zhao et al., 2005; Lu et al., 2006,Figure 1).
Due to the Neogene tectonics related to the Indian collision, theTNCB is well exposed in the Fuping, Wutaishan, Hengshan andLüliangshan of Shanxi and Hebei Provinces, from East to West (Fig-ure 1). These massifs are presently isolated one from another andthus often analyzed separately. However, since similar lithologiesand structures are observed in all the massifs, they obviously experi-enced the same tectonic and metamorphic evolution. Moreover,these massifs are famous places for Precambrian studies of the NorthChina Craton since they are the type localities for the 3.0–2.5 GaFuping cycle, 2.5–2.4 Ga Wutai cycle, and 2.4–1.8 Lüliang cycle(Huang, 1977; Yang et al., 1986; Ma et al., 1987; Wang and Mo,1995).
It is well acknowledged that modern collisional belts can berecognized by various criteria, such as: i) arc magmatism indicat-ing lithospheric subduction, ii) subduction complexes formed dur-ing plate convergence, iii) ophiolites representing the interveningbasin between the two continental blocks, iv) precise definition ofthe involved continents, v) HP metamorphism developed withinthe subducted continental crust of the underlying block, vi) nappestructures and associated ductile deformation such as flat-lyingfoliation and stretching lineation developed by non-coaxial strain,vii) post-collisional crustal melting, responsible for migmatitesand granitoids, formed immediately after the collision, in responseto the exhumation of deeply subducted continental crust. In spiteof the timing problem, the collisional model proposed for theTNCB sounds very attractive but still remains weakly docu-mented. Recently, great advances have been made on the petro-logical, geochronological and geochemical knowledge of theTNCB (Zhao et al., 2000; 2001; 2002; Guan et al., 2002; Liu et al.,2002; 2005; 2006; Wang et al., 2004; Wilde et al., 2004a; 2005;Kröner et al., 2005, 2006; O'Brien et al., 2005; Polat et al., 2005).Nevertheless, the tectonic aspects such as the recognition of thelitho-tectonic units, the bulk architecture of the chain, the kine-matics of the ductile and synmetamorphic deformation and the
deformation-metamorphism relationships remain poorly docu-mented since pioneer studies of Bai (1986) and Tian (1991).Therefore, even if petrological and geochemical data provide evi-dence for arc magmatism and HP granulitic or even eclogiticmetamorphism that support a collisional model, most of the abovelisted features characteristic of continental collision are not con-vincingly documented yet.
This paper aims to present the first comprehensive tectonic mapand representative cross-sections through the TNCB, from Lüliang-shan to Fuping based on our own field survey completed by petro-logical and geochronological works, and using available geologicalinformation. The bulk architecture and timing of the belt aredescribed. A lithosphere scale cross-section and a geodynamicmodel that emphasizes a polyorogenic evolution of the Trans-NorthChina Belt are proposed as working hypotheses for forthcomingworks.
Tectonic zonation of the Trans-NorthChina Belt
From west to east, the TNCB consists of several lithological, meta-morphic and structural units identified in the Lüliangshan, Heng-shan, Wutaishan and Fuping massifs (Figures 2, 3). This sectionintroduces the dominant lithological features for each unit, whereas,the structural relationships between the different units will be dis-cussed in the next section.
The Western (Ordos) TTG basement This unit is restricted to the northwestern part of Lüliangshan.
Gneissic tonalite and granodiorite form the dominant lithology.These rocks exhibit a well-defined foliation. Mylonites with a NW-SE stretching lineation and top-to-the-SE sense of shear form meter-thick shear zones.
The Khondalite Unit To the east of the TTG gneiss, biotite-garnet-sillimanite gneiss
and micaschists of Paleoproterozoic age, called the Jiehekou Groupdevelop (SBGMR, 1989; Wan et al., 2000). These rocks are derivedfrom terrigeneous sediments such as mudstone, feldspathic sand-stone or grauwacke. The Khondalite Unit extends farther north of thestudy area, up to the Jining area where they are intercalated with vol-canic rocks (e. g. Condie et al., 1992; Xia et al., 2005). The Khon-dalite Unit is interpreted as the terrigeneous cover deposited uponthe Ordos continental basement.
The Terrigeneous-Mafic Unit SE of the previous units, sedimentary and mafic metamorphic
rocks crop out. Although placed together with the Khondalite Unit inthe Jiehekou Group (e.g. Geng et al., 2000; Wan et al., 2000; Liu etal, 2006 and enclosed references), this rock assemblage exhibitsquite distinct lithological features and it is considered here as a sep-arate unit. The metasedimentary rocks consist of centimeter tometer-size sandstone-mudstone alternations derived from a tur-biditic series (Figure 4C). Mafic and ultramafic rocks represent thesecond main lithology in this unit. Coarse-grained amphibolites withpreserved gabbroic textures and fine-grained metabasite derivedfrom basalt or diabase support a magmatic origin of the mafic rocks.Some of these mafic rocks crop out as lenses intercalated withinsandstone. Due to the intense ductile deformation, the primary rela-tionships between the two lithologies are not settled. The meter-sizeof the mafic blocks and their scattering in the terrigeneous rocks sug-gest that they might be olistoliths, alternatively, the mafic rockscould represent intrusions subsequently sheared during the forma-
June 2007
96
Figure 1 Simplified tectonic map of the north China Cratonlocating the main Paleoproterozoic belts:Trans North China Belt,Liao-Ji Belt and Khondalite Belt. The Trans North China Belt iswell exposed in the Lüliangshan, Hengshan, Wutaishan andFuping Massifs. The structure of these massifs is shown in figures2 and 3.

tion of the TNCB. However, the first interpretation is preferred heresince in some outcrops, amphibolite forms centimeter to plurimetersized isolated blocks and their terrigeneous host rocks do not exhibitany evidence for thermal annealing such as it would be expected inthe case of intrusion. In the following, the Terrigeneous-Mafic unitwill be interpreted as a subduction complex, associated to the LowGrade Mafic Unit (defined below) exposed in Lüliangshan andWutaishan.
The Orthogneiss-Volcanites Unit (OVU) This litho-tectonic unit is widely developed in Wutaishan,
Lüliangshan and to a lesser extent in Hengshan (Figures 2, 4F). Thetypical rock-type consists of centimeter to meter-scale alternationsof light-colored gneiss and amphibolite. The protoliths of the amphi-bolites are mafic magmatic rocks (i.e. lava flows, dykes or sills) orvolcanic-sedimentary rocks. The acidic gneisses are derived fromfelsic lavas: rhyolite, dacite, and andesite or volcani-clastic rocks.This bimodal magmatic association is cross cut by granitic dykesthat exhibit the same foliation than their host rocks. The OVU corre-sponds to the lower part of the Wutai Group (i.e. the Shizui subgroupof Bai (1991)). We include in the OVU, the garnet-kyanite-staurolitegneisses and amphibolites that crop out in Lüliangshan, Hengshanand Wutaishan where it is known as the Jingankou Group (SBGMR,1989; Tian, 1991). The OVU contains numerous plutons calledChechang-Betai, Ekou, Lanzishan, Sifo, Wangjiahui, Yixingzhaiand the grey facies of the Guangminshi massif (in Figure 2, only thelargest bodies are represented). In Wutaishan, two distinct magmaticepisodes are recognized: i) a Neoarchean (2560–2515 Ma) genera-tion of calc-alkaline diorite, tonalite and granodiorite is coeval with
the felsic volcanic rocks, andii) a Paleoproterozoic genera-tion of monzo-syenite plu-tons, the Dawaliang andWangjiahui ones, is dated atca. 2170–2120 Ma (Wilde etal., 2005). These calc-alka-line plutons present also geo-chemical evidence indicatingthey derived from partialmelting of the Archean base-ment which complies with theoccurrence of 2700 Ma inher-ited zircons. In agreementwith most of previous authors(e. g. Zhao et al., 2001; Wildeet al., 2005; Kröner et al.,2005), we interpret theOrthogneiss-Volcanites Unitas a ductilely deformed mag-matic arc. Since both plutongenerations are convertedinto orthogneiss, the tectonicevents responsible for themain deformation in the OVUmust be younger than 2120Ma, that is to say that theTNCB belongs to a Paleopro-terozoic orogen rather than aNeoarchean one.
The Low Grade MaficUnit (LGMU)
This unit is recognizedin two areas: SW of Lanxianin Lüliangshan and in the cen-tral part of Wutaishan (Fig-ures 2, 4D). The most com-mon rock-types are green-
schist facies sedimentary and magmatic rocks. Metasedimentaryrocks such as pelite, silt, grauwacke and quartzite and volcano-sedi-mentary rocks such as tuffs or pyroclastites are widespread. Basalt,sometimes with pillow structures, dolerite, gabbro, and variouslyserpentinized harzburgite and dunite are also widespread. TheLGMU corresponds to the Middle and Upper parts of the WutaiGroup (Tian, 1991) in Wutaishan and to the Lüliang Group inLüliangshan, respectively. On the contrary, the LGMU is not recog-nized in Hengshan. Several geochemical studies dealt with theWutaishan magmatic rocks (Bai, 1986; Tian, 1991; Wang et al.,2004; Polat et al., 2005). These works emphasize the duality of thegeodynamic settings inferred from the chemical signatures. Theultramafics correspond to the depleted oceanic mantle associated tomafic rocks that present a MORB-like affinity. Conversely, the rhy-olites, dacites, andesites and some basalts have a calc-alkaline signa-ture showing that these rocks formed in a subduction zone settingdeveloped upon a continental active margin (Wang et al., 2004).These two signatures are interpreted to reflect an interaction betweenMid-Oceanic ridge and subduction processes (Polat et al., 2005).However, this conclusion must be considered with caution since theanalyzed samples do not belong to the same tectonic unit. Indeed, thecalc-alkaline and tholeiitic volcanic rocks correspond to the OVUand LGMU Units, respectively.
In Wutaishan, the LGMU greenstones yield U/Pb zircon andSm/Nd whole rock ages around 2515–2535 Ma (Wilde et al., 2004a)and 2471–2535 Ma (Zhang et al., 1998). In Lüliangshan, radiometricages are still rare and quite scattered. The metavolcanites are datedby Sm-Nd method on whole rock at 2360±95 Ma and by U-Pbmethod on zircon at 2051±68 Ma and 2099±41 Ma (Yu et al., 1997;
Episodes, Vol. 30, no. 2
97
Figure 2 Structural map of the Trans North China Belt from Lüliangshan to Fuping massifs with locationof figure 3 cross sections. FP 35 and FP 52 refer to the dated samples of figures 4 and 5.
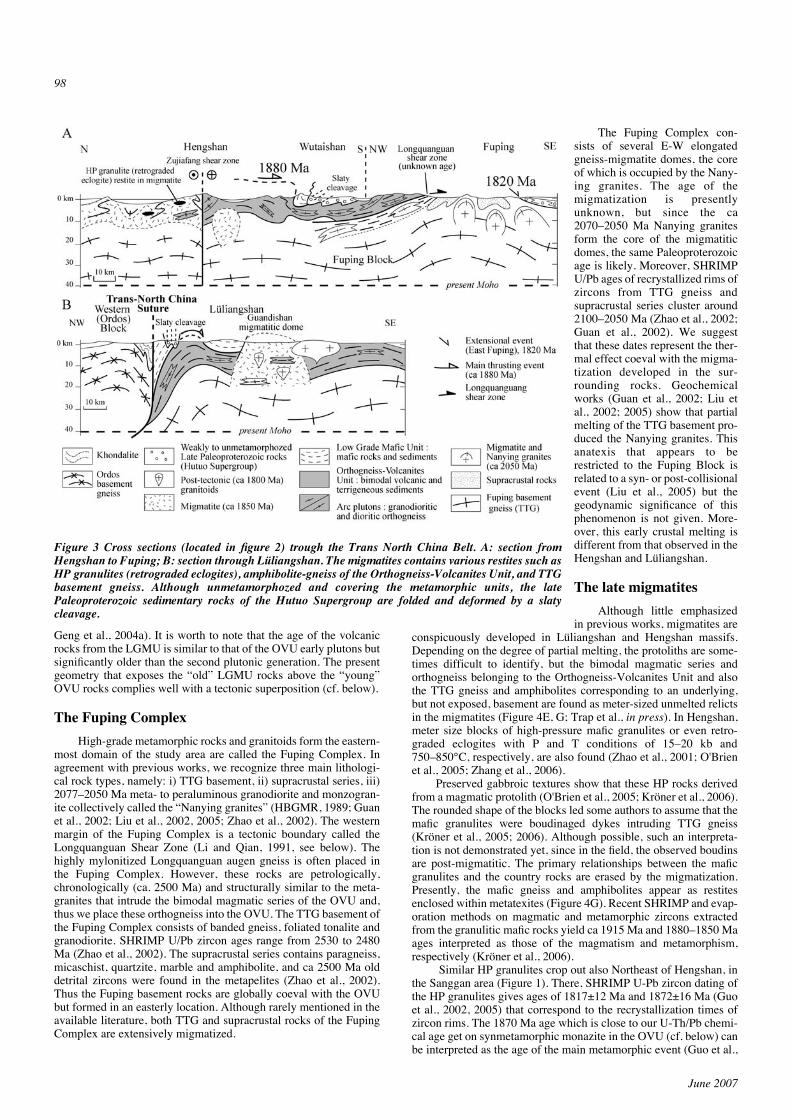
Geng et al., 2004a). It is worth to note that the age of the volcanicrocks from the LGMU is similar to that of the OVU early plutons butsignificantly older than the second plutonic generation. The presentgeometry that exposes the “old” LGMU rocks above the “young”OVU rocks complies well with a tectonic superposition (cf. below).
The Fuping Complex High-grade metamorphic rocks and granitoids form the eastern-
most domain of the study area are called the Fuping Complex. Inagreement with previous works, we recognize three main lithologi-cal rock types, namely: i) TTG basement, ii) supracrustal series, iii)2077–2050 Ma meta- to peraluminous granodiorite and monzogran-ite collectively called the “Nanying granites” (HBGMR, 1989; Guanet al., 2002; Liu et al., 2002, 2005; Zhao et al., 2002). The westernmargin of the Fuping Complex is a tectonic boundary called theLongquanguan Shear Zone (Li and Qian, 1991, see below). Thehighly mylonitized Longquanguan augen gneiss is often placed inthe Fuping Complex. However, these rocks are petrologically,chronologically (ca. 2500 Ma) and structurally similar to the meta-granites that intrude the bimodal magmatic series of the OVU and,thus we place these orthogneiss into the OVU. The TTG basement ofthe Fuping Complex consists of banded gneiss, foliated tonalite andgranodiorite. SHRIMP U/Pb zircon ages range from 2530 to 2480Ma (Zhao et al., 2002). The supracrustal series contains paragneiss,micaschist, quartzite, marble and amphibolite, and ca 2500 Ma olddetrital zircons were found in the metapelites (Zhao et al., 2002).Thus the Fuping basement rocks are globally coeval with the OVUbut formed in an easterly location. Although rarely mentioned in theavailable literature, both TTG and supracrustal rocks of the FupingComplex are extensively migmatized.
The Fuping Complex con-sists of several E-W elongatedgneiss-migmatite domes, the coreof which is occupied by the Nany-ing granites. The age of themigmatization is presentlyunknown, but since the ca2070–2050 Ma Nanying granitesform the core of the migmatiticdomes, the same Paleoproterozoicage is likely. Moreover, SHRIMPU/Pb ages of recrystallized rims ofzircons from TTG gneiss andsupracrustal series cluster around2100–2050 Ma (Zhao et al., 2002;Guan et al., 2002). We suggestthat these dates represent the ther-mal effect coeval with the migma-tization developed in the sur-rounding rocks. Geochemicalworks (Guan et al., 2002; Liu etal., 2002; 2005) show that partialmelting of the TTG basement pro-duced the Nanying granites. Thisanatexis that appears to berestricted to the Fuping Block isrelated to a syn- or post-collisionalevent (Liu et al., 2005) but thegeodynamic significance of thisphenomenon is not given. More-over, this early crustal melting isdifferent from that observed in theHengshan and Lüliangshan.
The late migmatites Although little emphasized
in previous works, migmatites areconspicuously developed in Lüliangshan and Hengshan massifs.Depending on the degree of partial melting, the protoliths are some-times difficult to identify, but the bimodal magmatic series andorthogneiss belonging to the Orthogneiss-Volcanites Unit and alsothe TTG gneiss and amphibolites corresponding to an underlying,but not exposed, basement are found as meter-sized unmelted relictsin the migmatites (Figure 4E, G; Trap et al., in press). In Hengshan,meter size blocks of high-pressure mafic granulites or even retro-graded eclogites with P and T conditions of 15–20 kb and750–850°C, respectively, are also found (Zhao et al., 2001; O'Brienet al., 2005; Zhang et al., 2006).
Preserved gabbroic textures show that these HP rocks derivedfrom a magmatic protolith (O'Brien et al., 2005; Kröner et al., 2006).The rounded shape of the blocks led some authors to assume that themafic granulites were boudinaged dykes intruding TTG gneiss(Kröner et al., 2005; 2006). Although possible, such an interpreta-tion is not demonstrated yet, since in the field, the observed boudinsare post-migmatitic. The primary relationships between the maficgranulites and the country rocks are erased by the migmatization.Presently, the mafic gneiss and amphibolites appear as restitesenclosed within metatexites (Figure 4G). Recent SHRIMP and evap-oration methods on magmatic and metamorphic zircons extractedfrom the granulitic mafic rocks yield ca 1915 Ma and 1880–1850 Maages interpreted as those of the magmatism and metamorphism,respectively (Kröner et al., 2006).
Similar HP granulites crop out also Northeast of Hengshan, inthe Sanggan area (Figure 1). There, SHRIMP U-Pb zircon dating ofthe HP granulites gives ages of 1817±12 Ma and 1872±16 Ma (Guoet al., 2002, 2005) that correspond to the recrystallization times ofzircon rims. The 1870 Ma age which is close to our U-Th/Pb chemi-cal age get on synmetamorphic monazite in the OVU (cf. below) canbe interpreted as the age of the main metamorphic event (Guo et al.,
June 2007
98
Figure 3 Cross sections (located in figure 2) trough the Trans North China Belt. A: section fromHengshan to Fuping; B: section through Lüliangshan. The migmatites contains various restites such asHP granulites (retrograded eclogites), amphibolite-gneiss of the Orthogneiss-Volcanites Unit, and TTGbasement gneiss. Although unmetamorphozed and covering the metamorphic units, the latePaleoproterozoic sedimentary rocks of the Hutuo Supergroup are folded and deformed by a slatycleavage.
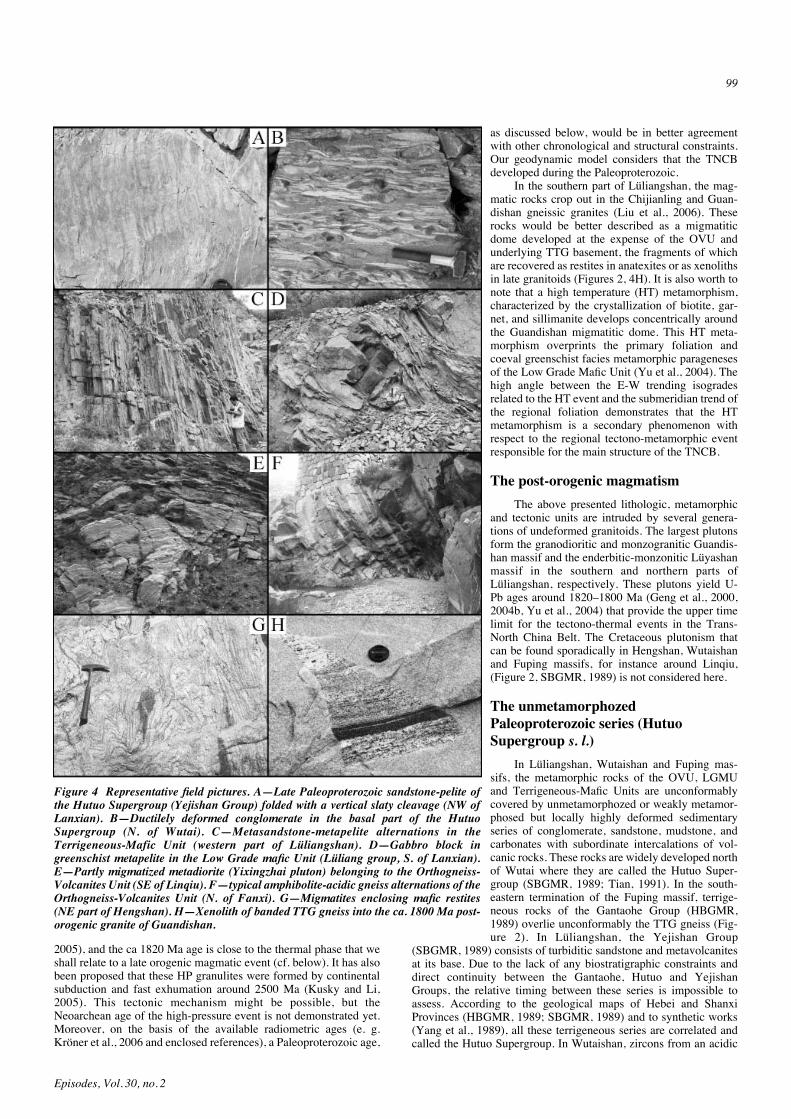
2005), and the ca 1820 Ma age is close to the thermal phase that weshall relate to a late orogenic magmatic event (cf. below). It has alsobeen proposed that these HP granulites were formed by continentalsubduction and fast exhumation around 2500 Ma (Kusky and Li,2005). This tectonic mechanism might be possible, but theNeoarchean age of the high-pressure event is not demonstrated yet.Moreover, on the basis of the available radiometric ages (e. g.Kröner et al., 2006 and enclosed references), a Paleoproterozoic age,
as discussed below, would be in better agreementwith other chronological and structural constraints.Our geodynamic model considers that the TNCBdeveloped during the Paleoproterozoic.
In the southern part of Lüliangshan, the mag-matic rocks crop out in the Chijianling and Guan-dishan gneissic granites (Liu et al., 2006). Theserocks would be better described as a migmatiticdome developed at the expense of the OVU andunderlying TTG basement, the fragments of whichare recovered as restites in anatexites or as xenolithsin late granitoids (Figures 2, 4H). It is also worth tonote that a high temperature (HT) metamorphism,characterized by the crystallization of biotite, gar-net, and sillimanite develops concentrically aroundthe Guandishan migmatitic dome. This HT meta-morphism overprints the primary foliation andcoeval greenschist facies metamorphic paragenesesof the Low Grade Mafic Unit (Yu et al., 2004). Thehigh angle between the E-W trending isogradesrelated to the HT event and the submeridian trend ofthe regional foliation demonstrates that the HTmetamorphism is a secondary phenomenon withrespect to the regional tectono-metamorphic eventresponsible for the main structure of the TNCB.
The post-orogenic magmatism The above presented lithologic, metamorphic
and tectonic units are intruded by several genera-tions of undeformed granitoids. The largest plutonsform the granodioritic and monzogranitic Guandis-han massif and the enderbitic-monzonitic Lüyashanmassif in the southern and northern parts ofLüliangshan, respectively. These plutons yield U-Pb ages around 1820–1800 Ma (Geng et al., 2000,2004b, Yu et al., 2004) that provide the upper timelimit for the tectono-thermal events in the Trans-North China Belt. The Cretaceous plutonism thatcan be found sporadically in Hengshan, Wutaishanand Fuping massifs, for instance around Linqiu,(Figure 2, SBGMR, 1989) is not considered here.
The unmetamorphozedPaleoproterozoic series (HutuoSupergroup s. l.)
In Lüliangshan, Wutaishan and Fuping mas-sifs, the metamorphic rocks of the OVU, LGMUand Terrigeneous-Mafic Units are unconformablycovered by unmetamorphozed or weakly metamor-phosed but locally highly deformed sedimentaryseries of conglomerate, sandstone, mudstone, andcarbonates with subordinate intercalations of vol-canic rocks. These rocks are widely developed northof Wutai where they are called the Hutuo Super-group (SBGMR, 1989; Tian, 1991). In the south-eastern termination of the Fuping massif, terrige-neous rocks of the Gantaohe Group (HBGMR,1989) overlie unconformably the TTG gneiss (Fig-ure 2). In Lüliangshan, the Yejishan Group
(SBGMR, 1989) consists of turbiditic sandstone and metavolcanitesat its base. Due to the lack of any biostratigraphic constraints anddirect continuity between the Gantaohe, Hutuo and YejishanGroups, the relative timing between these series is impossible toassess. According to the geological maps of Hebei and ShanxiProvinces (HBGMR, 1989; SBGMR, 1989) and to synthetic works(Yang et al., 1989), all these terrigeneous series are correlated andcalled the Hutuo Supergroup. In Wutaishan, zircons from an acidic
Episodes, Vol. 30, no. 2
99
Figure 4 Representative field pictures. A—Late Paleoproterozoic sandstone-pelite ofthe Hutuo Supergroup (Yejishan Group) folded with a vertical slaty cleavage (NW ofLanxian). B—Ductilely deformed conglomerate in the basal part of the HutuoSupergroup (N. of Wutai). C—Metasandstone-metapelite alternations in theTerrigeneous-Mafic Unit (western part of Lüliangshan). D—Gabbro block ingreenschist metapelite in the Low Grade mafic Unit (Lüliang group, S. of Lanxian).E—Partly migmatized metadiorite (Yixingzhai pluton) belonging to the Orthogneiss-Volcanites Unit (SE of Linqiu). F—typical amphibolite-acidic gneiss alternations of theOrthogneiss-Volcanites Unit (N. of Fanxi). G—Migmatites enclosing mafic restites(NE part of Hengshan). H—Xenolith of banded TTG gneiss into the ca. 1800 Ma post-orogenic granite of Guandishan.

tuff yield a SHRIMP U/Pb age of 2087+/-9Ma (Wilde et al., 2004b).In the Yejishan Group, zircons from an acidic tuff yield 2124+/-38Ma (Geng et al., 2000). The significance of these dates in the tec-tonic framework of the Trans-North China Belt is discussed below.
Structure and age constraints of theTrans-North China Belt
The bulk architecture of the above presented units is a stack ofnappes cross cut by migmatites and granitic plutons. The metamor-phic units of the TNCB are characterized by a flat lying foliationformed coevally with ductile shearing. Several tectonic-metamor-phic events of Paleoproterozoic age are responsible for the edifica-tion of the belt. The Low Grade Mafic Unit is the highest element ofthe edifice. It tectonically overlies the Orthogneiss-Volcanites Unit(Figure 3). The contact between both units is a decameter thick duc-tile shear zone with an E-W to NW-SE trending mineral and stretch-ing lineation well observed both in Wutaishan and Lüliangshan.Kinematic criteria in the mylonites, such as asymmetric pressureshadows or sigma-type porphyroclast systems, indicate a top-to-the-SE shearing. Since both units present similar lithological, metamor-phic and structural features, the Terrigeneous-Mafic Unit of Lüliang-shan is correlated with the LGMU. The occurrence of MORB-typemafic rocks, ultramafites, cherts and turbidites comply with the inter-pretation of the LGMU as an ophiolitic nappe.
In agreement with previous works (e. g. Li et al., 1990; Wilde etal., 2004, 2005; Kröner et al., 2005; Polat et al., 2005; Zhao et al.,2005), we interpret the calc-alkaline bimodal magmatic assemblageof the amphibolite-acidic gneiss series and the plutons that composethe OVU as a magmatic arc installed upon a continental basement asshown by the TTG xenoliths found in the post-tectonic granitoids orin the migmatites (Figure 4H). The rocks of the OVU are extensivelydeformed with a flat-lying foliation and a NW-SE trending stretch-ing lineation (Figure 3). The top-to-the SE sense of shear deducedfrom field and microstructural analyses is coeval with an amphibo-lite facies metamorphism. In Lüliangshan, Wutaishan and Heng-shan, the present erosion level does not expose the contact betweenthe Orthogneiss-Volcanites Unit and its TTG basement. For simplic-ity, a depositional contact is assumed in the cross-sections (Figure3). However, a layer-parallel decollement cannot be ruled out.
In western Lüliangshan, the TTG and the Khondalite Unit cor-respond to basement and cover of the Western Block, respectively.The vertical fault that separates the Terrigeneous-Mafic Unit fromthe Western Block appears as a major tectonic boundary that we callhere the Trans-North China Suture (Figure 2). In previous works (e.g. Zhao et al., 2005 and enclosed references), the boundary betweenthe TNCB and Western Block is always located to the West ofLüliangshan. Moreover, in spite of their quite distinct lithological,metamorphic and structural features, the Terrigeneous-Mafic Unitand the OVU are not distinguished but both units are placed in theJiehekou group (Liu et al., 2006). Lastly, the tectonic contactbetween the overlying Terrigeneous-Mafic Unit and underlyingOVU is post-dated by unmetamorphosed terrigeneous rocks of theYejishan group. Due to late tectonics, the unconformable contactbetween the Yejishan Group and the underlying metamorphic rocksis sheared. The terrigeneous rocks of the Yejishan group aredeformed by upright folds with an axial planar cleavage (Figure 4A).More to the East, the mafic and sedimentary rocks of the LGMU (i.e. the former Lüliang Group) are separated from the OVU by adecameter-thick mylonitic shear zone. Thus, tectonically, the rocksof the Lüliang Group must be considered as a klippe transported tothe SE above the OVU and rooted in the Trans-North China Suture.
Conversely, the reality of an ophiolitic suture between Heng-shan and Wutaishan as proposed by Polat et al. (2005) seemsunlikely since there is a lithological and structural continuity of thevolcanic-sedimentary series and plutonic rocks, such as for instance,the Yixingzhai orthogneiss of the OVU between both massifs
(Figures 2, 3). The Hengshan massif is separated in two parts by theE-W trending Zhujiafang ductile shear zone (O'Brien et al., 2005,Kröner et al., 2005, 2006). As already noticed by the above citedauthors, the retrogression of the amphibolites belonging to ourOrthogneiss-Volcanites Unit is conspicuous along the shear zone,but conversely to them, our structural observations indicate a sinis-tral shearing (Trap et al., in press). From South to North, this left lat-eral ductile fault separates the bimodal volcanites and sedimentaryrocks of the OVU from migmatites (Figures 2, 3). Since themigmatites develop after the flat-lying nappe tectonics, and containrestites of the Orthogneiss-Volcanites rocks, the Zujiafang ShearZone is as a late structure. This fault probably played an importantrole during or after the formation of the migmatites as suggested bythe contrasted metamorphic evolution experienced by the HP gran-ulites on both sides of the fault (O'Brien et al., 2005). Nevertheless,an early activity along the Zujiafang fault is possible but not docu-mented yet, therefore only the strike-slip movement is represented inour interpretative cross-section (Figure 3A).
To the East, the Orthogneiss-Volcanites Unit overthrusts theFuping Complex along the Longquanguan shear zone (Li and Qian,1991). As shown by numerous kinematic indicators, this kilometer-thick contact is a top-to-the-SE ductile shear zone. The shear zone-hanging wall consists of extensively mylonitized augen gneiss andbimodal magmatic rocks similar to the orthogneiss of the OVU. Inthe fault footwall, typical rocks of the Fuping Complex, namely themigmatized TTG basement gneiss, supracrustal rocks and Nanyinggranites are conspicuously foliated and lineated across 1 to 2 kilo-meters thick.
As suggested by geological maps (SBGMR, 1989; HBGMR,1989) and confirmed by our own survey, but never clearly pointedout previously, the doming and crustal melting of the Fuping Blockis older than the activity along the Longquanguan Shear Zone sincein the footwall of the shear zone, the Fuping migmatites and theNanying granites are foliated and lineated under post-solidus rheo-logical conditions. Thus, in our interpretation, the LongquanguanShear Zone is an intracontinental flat-lying structure developedwithin the Fuping Complex. Consequently, the continental basementthat underlies the Wutaishan, Hengshan and Lüliangshan massifs upto the Trans-North China suture, can be structurally correlated to theFuping gneiss. In the following, we shall call this basement the Fup-ing Block (Figure 3).
Along the SE margin of the Fuping Complex, near Pingshan,the terrigeneous rocks of the Gantaohe Group, correlated to theHutuo supergroup, that unconformably cover the Fuping gneisses,are deformed by a ductile low angle detachment fault with NW-SEstretching lineation and a down-dip movement (Figure 3). In a pre-vious work (Zhao et al., 2002), this ductile shear zone, called theCiyu-Xinzhuang Shear Zone, was correlated to the LonquanguanShear Zone, but neither the geometry, nor the kinematics of themylonites was provided. In our opinion, such a correlation isunlikely due to the quite different metamorphic conditions, amphi-bolite facies and greenschist facies in the Longquanguan and Ciyu-Xinzhuang Shear Zones, respectively.
The Hutuo Supergroup is well exposed between Wutai andYuanping (Figure 2). As indicated on the geological maps (SBGMR,1989), the Hutuo unconformity upon both LGMU and OVU hasbeen observed in several places during our field survey. However,the primary unconformable relationship is often no more recognized,since the conglomerate and sandstone of the Hutuo Supergroup fre-quently exhibit a vertical or even upside down attitude. The lowerpart of the Hutuo Supergroup experienced a ductile deformationcoeval with a greenschist facies metamorphism. A NW-SE trendingstretching lineation marked by elongated or boudinaged pebbles inconglomerates and quartz-chlorite pressure shadows is associatedwith a top-to-the-SE shearing (Figure 4B) that complies with the SE-verging recumbent folds, and the bedding-cleavage relationships.This ductile deformation exhibits similar geometric and kinematicfeatures to that observed in the LGMU and OVU, but differs fromthe latter on the basis of the grade of the syntectonic metamorphism.The unconformable relationships between the Hutuo Supergroup
June 2007
100

and the underlying rocks argue for the reality of two tectono-meta-morphic phases responsible for the formation of the TNCB inLüliangshan, Hengshan and Wutaishan. An early one coeval with anamphibolite facies metamorphism is responsible for the formation ofthe main foliation and nappe stacking. After the unconformabledeposition of the Hutuo terrigeneous rocks upon the metamorphicrocks, a second tectonic and metamorphic event, is responsible forthe first deformation of the Hutuo rocks whereas in the same time,the underlying units experienced a moderate structural reworkingand a metamorphic retrogression. Since both deformation phasesdevelop with the same top-to-the-SE kinematics, they likely repre-sent two stages of the same orogenic event.
Moreover, the 2070-2050 Ma Nanying magmatism of the Fup-ing Complex argues for an older Paleoproterozoic event.
The timing of the tectono-metamorphicevents
As presented above, numerous radiometric data are available to con-strain the age of the various protoliths involved in the TNCB (Guanet al., 2002; Zhao et al., 2002; Wilde et al., 2004a, 2005; Kröner etal., 2005), however, the timing of the ductile deformation andmigmatization was still poorly established since important data werereleased only recently (Kröner et al., 2006; Liu et al., 2006). In orderto implement our understanding, zircon LA-ICP-MS U/Pb andEPMA chemical U-Th/Pb datings have been undertaken. Due torestricted space, only outlines of the methods, and the most signifi-cant results are given here.
U-Pb analyses For LA-ICP-MS U-Pb analyses, zircon grains were mounted in
epoxy resin with chips of a standard material (G91500; Wiedenbecket al., 1995). Analyses were performed at the University of Montpel-lier II using a VG Plasmaquad II turbo ICP-MS coupled to a Geolas(Microlas) automated platform housing a 193 nm Compex 102 laserfrom LambdaPhysik. Analyses were conducted in a He atmosphere,which enhances sensitivity and reduces inter-element fractionation(Günter and Heinrich, 1999). Data were acquired in the peak jump-ing mode using one point per peak and measuring the 202Hg, 204(Pb+ Hg), 206Pb, 207Pb, 208Pb and 238U isotopes similarly to the proce-dure described in (Bruguier et al., 2001). The laser was fired using anenergy density of 15 J cm-2 at a frequency of 4 Hz and a spot size of26 µm. This resulted in a sensitivity of ca. 1000 cps/ppm for Pbbased on measurements on the G91500 reference material. ThePb/Pb and U/Pb isotopic ratios of unknown grains were calibratedagainst the G91500 crystal as an external standard. The contributionof 204Hg on 204Pb was estimated by measuring the 202Hg and analy-ses yielding 204Pb close to, or above, the limit of detection wererejected. Errors measured on the standard were added in quadratureto those measured on the unknown grains. This resulted in a 2 to 4%precision (1! RSD%) after all corrections have been made. Age cal-culations were done using the Isoplot program (Ludwig, 2000) andare quoted at the 2! level.
All zircons from the migmatitic leucosome in Hengshan massif(FP 52 located in Figure 2, N39° 27.225/ E113° 28.202) are translu-cent and have euhedral shapes with sharp terminations but can bebroken into two categories according to their size and color. Small(ca. 80-120 µm) colorless grains constitute a first population, and areoften surrounded by a light-yellow overgrowth. A second group ofzircons consists of bigger (ca. 150–300 µm), light-yellow elongatedgrains or fragments. Light-yellow grains and overgrowths on onehand and small colorless grains on the other hand were found to havevery different U, Th and Pb contents and ages (see Table 1). Smallcolorless grains had relatively uniform U and Th contents of 96205and 37–116 ppm respectively and Th/U ratios of 0.29–0.57. Big yel-low grains and overgrowths on the contrary had variable U contents
of 14 to 497 ppm and very low Th contents (< 1.5 ppm and down to0.1 ppm) resulting in low Th/U ratios (0.003 to 0.008) typical of zir-cons grown under high-grade metamorphic conditions (e.g.Williams and Claesson, 1987). On the Concordia diagram (Figure5), analyses distribute into two concordant batches (data-point errorellipses are 1 ! but age errors are 2 !). The small colorless zirconshave ages ranging from 2672±14 to 2698±14 Ma (2!) and yield aweighted mean 207Pb/206Pb age of 2686±7 Ma (MSWD = 1.5). Thispopulation has morphology and Th/U ratios characteristic of mag-matic zircons and its uniform age distribution indicates that the 2686Ma age represents the age of the magmatic protholith that melted toproduce the leucosome. Analyses of the second zircon populationform a tight cluster on the Concordia curve and have ages rangingfrom 1836±22 to 1856±10 Ma (2!) allowing calculation of a mean207Pb/206Pb age of 1850±5 Ma (MSWD = 0.7). The euhedral mor-phology of these grains indicates they crystallized from a melt andtheir low Th/U ratios are typical of zircons from amphibolite to gran-ulite facies rocks (e.g. Vavra et al., 1999). Their age is thus inter-preted as dating the partial melting event that affected the Archeanprotolith.
U-Pb/Th chemical dating Due to its negligible common Pb and high Th and U contents
(Parrish, 1990), monazite is a suitable chronometer for both mag-matic and metamorphic rocks. Moreover, in monazite, U, Th, andradiogenic Pb are not significantly affected by diffusion (Crowleyand Ghent, 1999; Zhu and O'Nions, 1999; Cocherie et al., 1998),thus the isotopic system remains undisturbed with respect to theseelements. U, Th, Pb contents in monazite were measured with acameca SX50 EPMA cooperated by BRGM, CNRS and OrléansUniversity with a detection limit of 150 ppm. Details of the analyti-cal procedure are given (Cocherie et al., 1998, 2005). The results arerepresented in a Th/Pb vs. U/Pb isochron diagram using an ISO-PLOT program (Ludwig, 2000) according to Cocherie and Albarède,2001. In such a plot, the slope of the regression line drawn using theexperimental data can be compared with the theoretical isochron toensure that a single age has been recorded. The EPMA dating pro-gram (Pommier et al., 2002) simplifies age calculations on monazite.All reported uncertainties are two-sigma.
Episodes, Vol. 30, no. 2
101
Figure. 5 Concordia graph for ICP-MS U-Pb dates from zirconsextracted from a migmatitic leucosome of the Hengshan Massif(sample FP 52, located in Figure 2, N39° 27.225/ E113° 28.202).The upper intercept at 2686±7 Ma corresponds to the core ofinherited grains and the 1850±5 Ma is that of the zircon rimsformed during the leucosome crystallization, (n=number ofanalyzed grains, data-point error ellipses are 1!! but age errorsare 2!!).

Monazite grains were identified within a thin section usingSEM images in back scattered mode obtained in Orléans University.Such an in situ approach preserves the primary microstructural rela-tionships between monazite and other metamorphic phases (Foster etal., 2002; Williams and Jercinovic, 2002). Sample FP 35 is a biotite-garnet-kyanite-staurolite gneiss from the Orthogneiss-VolcanitesUnit sampled in the Hengshan massif (located in Figure 2, N39°23.743/ E113° 35.831). Textural observation of this micaschistshows that biotite grains forms the macroscopic foliation. The closeassociation of monazite with biotite, either as inclusion or along thegrain boundaries, indicates that crystallization of monazite occurredduring the development of the amphibolite facies metamorphismcoevally with the first ductile shearing. SEM images do not revealany chemical zoning of the monazite grains suggesting that relictcores are absent. In the Th/Pb vs. U/Pb diagram, (Figure 6) the ana-lytical data points obtained from 9 grains plot along a well-definedregression line (MSWD = 0.78) that fits well with the theoreticalisochron at 1883±11 Ma. The mean age, calculated at the centroid ofthe population, corresponds to the amphibolite facies metamorphismdeveloped during the formation of the TNCB. It is also interpreted asthat of the emplacement of the LGMU above the OVU. Our LA-ICP-MS U/Pb and chemical U-Th/Pb ages comply with previousSHRIMP U/Pb zircon ages ranging from 1880 to 1850 Ma (Wilde etal., 2004a, 2005; Kröner et al., 2005, 2006; Liu et al., 2006) indicat-ing that primary magmatic grains experienced a recrystallizationaround 1900 Ma during the amphibolite facies metamorphism.
The problem of the age of Hutuo Supergroup The radiometric ages inferred for the amphibolite facies meta-
morphism and subsequent migmatization indicate that the Hutuounconformity must be at least younger than 1850 Ma and older than1800 Ma. However, on the basis of a SHRIMP U/Pb date from zir-cons extracted in a felsic tuff near Wutai, a 2087±9 Ma age is sug-gested for the Hutuo Supergroup (Wilde et al., 2004b). According tothe field description of the sampling site (Wilde et al., 2004b), thedated tuff is in primary sedimentary contact with marbles, garnetmicaschists and amphibolites, but according to our own field survey,the Hutuo sedimentary rocks experienced only a single low-grademetamorphism. In the sampling place of this tuff, the structure isquite complex; and a tectonic imbrication of several thrust sheetsresulting in ductile and brittle deformations can be recognized there.The discrepancy between the two sets of age can be solved if oneconsiders either that the dated felsic tuff belongs to the underlying
Low Grade Mafic Unit rather than to the Hutuo Supergroup, or alter-natively that the analyzed zircons are inherited grains. The availableradiometric constraints, including the two generations of arc mag-matism, the Fuping migmatization, the 1880–1850 Ma main tectono-metamorphic event are summarized in Figure 7, that emphasizes alsothe age problem of the Hutuo Supergroup.
Discussion
The lithosphere scale structure Our observations document a collision model for the TNCB
that agrees with previous works (e. g. Zhao et al., 2005 and enclosedreferences). Arc magmatism, ophiolites and turbidites, HP metamor-phism, synmetamorphic nappes, post-collisional migmatites recog-nized in Lüliangshan, Hengshan, Wutaishan and Fuping massif,which are among the most significant criteria for collision belt, arefulfilled in the TNCB.
However, a simple collision involving the two continentalmasses of Western (Ordos) and Eastern Blocks does not accountwell for the bulk architecture and the chronological constraints avail-able for the belt. Thus, we propose here to consider an intermediatecontinent, called here the “Fuping Block”. The existence of anArchean Fuping Block has already been invoked by earlier workers(e.g. Yang et al., 1986; Ma et al., 1987; Tian, 1991), but as statedabove, in this paper, we use “Fuping Block” to describe a large con-tinental mass that includes not only the Fuping Massif but also theTTG gneiss that underlie the Orthogneiss-Volcanites Unit (Figure
June 2007
102
Figure 6 Th/Pb vs. U/Pb plot of U-Th/Pb chemical dating ofmonazite from a biotite-garnet-kyanite-staurolite gneiss (sampleFP 35, located in Figure 2, N39° 23.743/ E113° 35.831) belongingto the Orthogneiss-Volcanites Unit.
Figure 7 Synoptic table of the magmatic, tectonic, metamorphicevents in the TNCB of Lüliangshan, Hengshan, Wutaishan andFuping massif.

3). The Low Grade Mafic Unit represents the intervening ocean thatup to now was neither clearly identified in the previous models.Moreover, the consistent top-to-the SE sense of shear coeval with asynmetamorphic nappe displacement does not agree satisfactorilywith the east directed subduction proposed for the formation of theOrthogneiss-Volcanites magmatic arc (Zhao et al., 2001; Kröner etal., 2005). A westward dipping subduction would better explain thebulk architecture of the belt and the kinematic features described inthis paper.
Our study also suggests that the Fuping Block underwent anolder event responsible for crustal melting, doming and emplace-ment of the Nanying granites at ca 2050 Ma, i.e. 200 Ma before thetectono-metamorphic events observed in Lüliangshan, Hengshanand Wutaishan. In order to account for the 2150–2050 Ma tectonic,metamorphic and magmatic events observed in the Fuping Complex,another orogenic episode must be considered. Unfortunately, Pre-cambrian rocks are not exposed east of the Fuping Complex, thus thefollowing interpretation remains hypothetical based on indirect geo-physical evidence.
The N-S trending Taihangshan Fault separates the Precam-brian rocks and the North China plain sedimentary rocks (Figure1). The important gravimetric and magnetic anomalies suggest thatthe Taihangshan Fault is a major lithospheric boundary alongwhich dense and magnetic rocks such as mafic and ultramaficrocks might occur. Obviously, like most of the large-scale conti-nental faults, the Taihangshan Fault probably moved several timesduring the geological history of the North China Block (Griffin etal., 1998; Huang and Zhao, 2004 and enclosed references). Alongthe fault, Cretaceous gabbroic plutons exhibit geochemical fea-tures indicating that the magma originates from an ultramaficsource metasomatized by subduction related melts (Wang et al.,2006). The central part of the North China Block did not experi-ence any Phanerozoic subduction since this area is quite remotefrom the Mesozoic Pacific subduction zone. Thus, in agreementwith Wang et al., (2006), we suggest that the Taihangshan faultmight be interpreted as a Paleoproterozoic suture resulting fromthe closure of an oceanic basin, called here the Taihang Ocean. TheEastern Block that collided with the Fuping Block corresponds tothe area that extends eastwards of the Taihangshan Fault, probablyup to the Tan-Lu Fault (Figure 1). A 2D lithosphere-scale cross-section is proposed in Figure 8.
A possible geodynamic scenario for the Trans-NorthChina Belt
Although still preliminary, the available data allow us to pro-pose a two steps geodynamic evolution model to account for the for-mation of the Trans-North China Belt (Figure 9). This model, at vari-ance from previous ones (Zhao et al., 2004; Kröner et al., 2005),emphasizes two diachronous east-directed subductions. Moreover,the model takes also into account the structure of the Lüliangshan,which was never considered in previous ones.
The Wutai Arc installed on the continental Fuping Blockrecords two magmatic episodes. The geodynamic setting of the old-est one, around 2540–2510 Ma, remains poorly constrained. It isnearly 400 to 450 Ma older than the tectonic and metamorphicevents observed in the Fuping Block. Such a quite unusual long timespan between subduction and collision has been already pointed out(Kröner et al., 2005; Zhao et al., 2005). Tentatively, the Wutai Arc
Episodes, Vol. 30, no. 2
103
Figure 9 Schematic geodynamic model accounting for thePaleoproterozoic evolution of the Trans North China Belt. Thebelt was built up through the closure of two oceanic domains,namely the Eastern Ocean and Lüliang Ocean. LGMU: LowGrade Mafic Unit, OVU: Orthogneiss-Volcanites Unit, LQGSZ:Longquanguan Shear Zone, THSF: Taihangshan Fault (firstPaleoproterozoic suture at ca. 2100 Ma); TNCS: Trans-NorthChina Suture (second Paleoproterozoic suture at ca. 1900 Ma).
Figure 8 Lithosphere-scale cross-section of the eastern part of theNorth China Craton (see location in figure 1). From West to East,three Archean Blocks are recognized. The Ordos Block isseparated from the Fuping Block by the Trans North ChinaSuture. Oceanic rocks belong to the Lüliang Ocean, a part of theserocks forms the Low Grade Mafic Unit (LGMU) presentlypreserved as a nappe above the Orthogneiss-Volcanites Unit(OVU) corresponding to the Wutai Arc. The Taihangshan Fault isinterpreted as an early Proterozoic suture between the Fuping andEastern Blocks (see text for details). The two generations ofmigmatites, ca. 2100 Ma and 1950 Ma are represented but the LatePaleoproterozoic and Phanerozoic granitoids have been omitted.The present lithospheric structure is inferred from (Griffin et al.,1998). The petrology and geochemistry of xenoliths show that theold Archean lithosphere has been “eroded” and replaced by a newone during Cretaceous to Cenozoic times.

can be compared to an Andean-type arc where oceanic subductionlasts also since more than 250 Ma. The available radiometric ages forthe Low Grade Mafic Unit range between 2535 Ma and 2000 Ma.This suggests that the Lüliang Ocean that separated the WesternOrdos Block and the Wutai magmatic Arc already existed inNeoarchean times. In our interpretation, the Wutai Arc is related tothe westward subduction of the Taihang Ocean. However, thisNeoarchean evolution is largely speculative.
The youngest Wutai magmatic arc formed around 2170–2120Ma in response to the westward subduction of the Taihang Oceanbefore the first continental collision between the Fuping Block andthe Eastern Block. This event occurred probably around 2100 Masince the 2070–2050 Ma migmatites and Nanying granites formedduring a post-collisional crustal melting (Guan et al., 2002; Liu et al.,2002, 2005). The suture that might corresponds to the present Tai-hangshan Fault is not exposed.
Since the tectonics related to the closure of the Lüliang Oceanis dated around 1900–1850 Ma, the Lüliang Ocean lasted more than500 Ma. Compared to the average lifetime of the present oceanicbasins, this duration is quite long. However, the Neoarchean-Paleo-proterozoic history (i.e. opening, width, etc…) of the Lüliang Oceanremains presently poorly documented. The large scatter of the radio-metric ages of the mafic rocks requires further studies.
Our structural studies suggest that the Lüliang Ocean closeddue to the subduction of the Fuping Block below the Ordos Block.The crust and oceanic sediments of the Lüliang Ocean are presentlypreserved in the Low Grade Mafic Unit. At that time, top-to-the-SEductile and synmetamorphic shearing deformed the bimodal vol-canic-sedimentary series and the calc-alkaline plutons correspond-ing to the Orthogneiss-Volcanites Unit. The Wutai Arc was sliced tothe SE by intracontinental thrusts such as the Longquanguan ShearZone. The high-pressure granulites and eclogites coeval with thecontinental subduction of the Fuping Block might also form duringthis second collisional orogenic event.
Lastly, during its exhumation, the subducted crust of the FupingBlock and the Wutai Arc rocks experienced migmatization and plu-tonism. In this scheme, the deposition of the Hutuo Supergroupoccurred immediately after the closure of the Lüliang Ocean andsubsequent collision, but continuing convergence deformed also thissedimentary unit during the second tectonic phase.
Conclusion The structural, metamorphic and magmatic features of the Trans-North China Belt allow us to conclude that the amalgamation of theNorth China Craton took place in Paleoproterozoic times throughtwo distinct continental collisions at ca 2100 Ma and 1900 Ma. TheNeoarchean to Paleoproterozoic geodynamic evolution of the TNCBis quite similar to that of the modern-type collisional orogens. Thematerials involved in the orogen, namely, ophiolites, turbidites andsubduction related magmatic rocks do not differ from those that formthe present mountain belts. The HP granulitic metamorphism, arguefor continental subduction, and the flat-lying foliation developedcoevally with an amphibolite facies metamorphism comply withcrustal thickening. Alike in many Phanerozoic belts, the migmatiza-tion and plutonism can be seen as a late to post-orogenic crustalmelting in response to the thermal disturbance due to collision. Fromthe mechanical point of view, this comparison implies that around2000-1800 Ma, the strength of the continental crust of the NorthChina Craton was already high enough to accommodate horizontalshortening by ductile flat-lying shearing.
Acknowledgements This work has been founded by NSF of China grant n° 40472116. Ascholarship from the Conseil Régional du Centre for Pierre Trap isalso acknowledged. A. Cocherie is thanked for his advices on theinterpretation of U-Th/Pb data.
References
Bai, J., 1986, The Early Precambrian geology of Wutaishan, Tianjin Scienceand Technology Press, Tianjin, 445 pp.
Bruguier, O., Telouk, P., Cocherie, A., Fouillac, AM. and Albarède, F.,2001, Evaluation of Pb-Pb and U-Pb laser ablation ICP-MS zircon datingusing matrix-matched calibration samples with a frequency quadrupled(266 nm) Nd-YAG laser: Geostandards Newsletter, v. 25, pp. 361–373.
Cawood, P., Kröner, A. and Pisarevsky, S., 2006, Precambrian plate tecton-ics: criteria and evidence: GSA Today, v. 16, pp. 4–11.
Cocherie, A., Legendre, O., Peucat, JJ. and Kouamelan, A.N., 1998, Geo-chronology of polygenetic monazites constrained by in situ electronmicroprobe Th-U-total Pb determination: Implications for lead behaviourin monazite: Geochimica et Cosmochimica Acta, v. 62, pp. 2475–2497.
Cocherie, A. and Albarede, F., 2001, An improved U-Th-Pb age calculationfor electron microprobe dating of monazite: Geochimica et Cosmochim-ica Acta, v. 65, pp. 4509–4522.
Cocherie, A., Be Mézème, E., Legendre, O., Fanning, M., Faure, M. andRossi, P., 2005, Electron microprobe dating as a tool for understandingclosure of U-Th-Pb system in monazite from migmatites: American Min-eralogist, v. 90, pp. 607–618.
Condie, K.C., Boryta, M.D., Liu, J. and Qian, X., 1992, The origin of khon-dalites: geochemical evidence from the Archean to early Proterozoicgranulite belt in the North China craton: Precambrian Research, v. 59, pp.207–223.
Crowley, J.L. and Ghent, E. D., 1999, An electron microprobe study of the U-Th-Pb systematics of metamorphosed monazite: the role of Pb diffusionversus overgrowth and recrystallization: Chem. Geol., v.157, pp.285–302.
Faure, M., Lin, W., Monié, P. and Bruguier, O., 2004, Paleoproterozoic arc-magmatism and collision in Liaodong Peninsula (NE China): Terra Nova,v. 16, pp. 75–80.
Foster, G., Gibson, HD., R. Parrish, R., Horstwood, M., Fraser, J. and Tindle,A., 2002, Textural, chemical and isotopic insights into the nature andbehaviour of metamorphic monazite: Chem. Geol, v. 191, pp. 183–207.
Geng, Y., Wan, Y., Shen, Q., Li, H. and Zhang, R., 2004a, Chronologicalframework of the early Precambrian important events in the Lüliang area,Shanxi Province: Acta Geol. Sinica v. 74, pp. 216–223.
Geng, Y., Yang, C., Song, B., Wan, Y., 2004b, Post-orogenic granites withan age of 1800 Ma in Lüliang area, North China Craton: constraints fromisotopic geochronology and geochemistry: Geol. J. China Universities, v.10, pp. 477–487.
Guan, H., Sun, M., Wilde, S., Zhou, X. and Zhai, M., 2002, SHRIMP U-Pbzircon geochronology of the Fuping Complex: implications for formationand assembly of the North China Craton: Precambrian Res. v.113, pp.1–18.
Griffin, W.L., Zhang, A., O'Reilly,S. and Ryan, C., Phanerozoic evolution ofthe Lithosphere beneath the Sino-Korean Craton: Mantle Dynamics andPlate Interactions in East Asia geodynamics, v. 27, pp. 107–126.
Günther, D. and Heinrich, CA., 1999, Enhanced sensitivity in LA-ICP-MSusing helium-argon mixture as aerosol carrier: J Anal. At. Spectrom., v.14, pp. 1369–1374.
Guo, JH., O'Brien, P. J. and Zhai, M., 2002, High-pressure granulites in theSanggan area, North China craton: metamorphic evolution, P-T paths andgeotectonic significance: J. Metam. Geology, v. 20, pp. 741–756.
Guo, JH., Sun, M., Chen, F.K. and Zhai, M., 2005, Sm-Nd and SHRIMP U-Pb zircon geochronology of high-pressure granulites in the Sanggan area,North China Craton: timing of Paleoproterozoic continental collision: J.of Asian Earth Sciences , v. 24, pp. 29–642.
HBGMR (Henan Bureau of Geology and Mineral Resources), 1989,Regional Geology of Shanxi Province, Geological Publishing House,Beijing, 742 pp.
Helmstaedt, H.H. and D.J. Scott, D.J., 1992, The Proterozoic ophiolite prob-lem, in: Condie, K. ed, Proterozoic crustal evolution, Elsevier, Amster-dam. pp. 55–95.
Huang, J.Q., 1977, The basic outline of China tectonics. Acta geol. Sin., v.52, pp. 117–135.
Huang, J. and Zhao, D., 2004, Crustal heterogeneity and seismotectonics ofthe region around Beijing, China: Tectonophysics, v. 385, pp. 159–180.
Hollings, P. and Ansdell, K., 2002, Paleoproterozoic arc magmatismimposed on an older backarc basin : implications for the tectonic evolu-tion of the trans-Hudson orogen, (Canada): GSA Bulletin, v. 114, pp.153–168.
Kusky, T.M., Li, J.H. and Tucker, R.D., 2001, The Archaean Dongwanziophiolite complex, North China Craton: 2.505 billion-year-old oceaniccrustand mantle, Science v. 292, pp. 1142–1145.
June 2007
104

Kusky, T.M. and Li, J.H., 2003, Paleoproterozoic tectonic evolution of theNorth China craton, J. Asian Earth Sci. v., 22, pp. 383–397.
Kröner, A., Wilde, S., Li, J.H. and Wang, K.Y., 2005, Age and evolution ofa late Archean to Paleoproterozoic upper to lower crustal section in theWutaishan/Hengshan/Fuping terrain of northern China. J. Asia Earth Sci-ences, v. 24, pp. 577–595.
Kröner, A., Wilde, S.A., Zhao, G.? O'Brien, P., Sun, M., Liu, D.Y., Wan,Y.S., Liu, SW and Guo, J.H., 2006, Zircon geochronology and metamor-phic evolution of mafic dykes in the Hengshan Complex of NorthernChina, : evidence for late Paleoproterozoic extension and subsequenthigh-pressure metamorphism in the North China Craton: Precambrianresearch, v. 146, pp. 45–67.
Li, J.H. and Qian, X.L., 1991, A study of Longquanguan shear zone in north-ern part of the Taihangshan, Shanxi Geology, v. 6, pp. 17–29.
Li, J., Wang, K., Wang, Q., Liu, X. and Zhao, Z., 1990, Early Proterozoic col-lision orogenic belt in Wutaishan area, China, Scientia geol. Sinica, v. 1,pp. 1–11.
Li, J.H., Kusky, TM. and Huang, X., 2002, Archean podiform chromititesand mantle tectonites in ophiolitic mélange, North China craton: a recordof early oceanic mantle processes, GSA Today, v. 12, pp. 4–11.
Liu, D.Y., Nutman, A.P., Compston, W. and Sen, Q.H., 1992, Remnants of>3800 Ma crust in the Chinese part of the Sino-Korean craton, Geology,v. 20, pp. 339–342.
Liu, S., Pan, Y., Li, J., Li, Q. and Zhang, J., 2002, Geological and isotopicgeochemical constraints on the evolution of the Fuping Complex, NorthChina Craton, Precambrian Res. v. 117, pp. 41–56.
Liu, S., Pan, Y. , Xie, Q., Zhang, J., Li, Q. and Yang, B., 2005, Geochemistryof the Paleoproterozoic Nanying granitic gneisses in the Fuping Com-plex: implications for the tectonic evolution of the Central Zone, NorthChina Craton, J. Asian Earth Sci., v. 24, pp. 643–658.
Liu, S., Zhao, G., Wilde, S., Shu, G., Sun, M., Li, Q., Tian, W. and Zhang, J.,2006, Th-U-Pb monazite geochronology of the Lüliang and Wutai Com-plexes: constraints on the tectonothermal evolution of the Trans-NorthChina orogen: Precambrian Research, v. 148, pp. 205–224.
Lu, XP, Wu FY., Guo, JH., Wilde, S. A., Yang, JH., Liu XM. and Zhang,OX., 2006, Zircon U-Pb geochronological constraints on the Paleopro-terozoic crustal evolution of the Eastern block in the North China Craton:Precambrian Research, v.146, pp. 138–164.
Ludwig, K.R., 2000, Isoplot/Ex, Version 2.4. A geochronological tool kit forMicrosoft Excel, Berkeley Geochronological Centre Spec. Publications,Berkeley, 56 pp.
Ma, X.Y., Bai, J., Suo, S.T., Lao, Q.Y. and Zhang, J.S., 1987, The Precam-brian tectonic framework and the research method in China: Geol. Pub.House, Beijing.
Maxeiner, R.O., Corrigan, D., Harper, C.T., MacDougalll, D.G. and Ansdell,K., 2005, Paleoproterozoic arc and ophiolitic rocks on the northwest-mar-gin of the Trans-Hudson orogen, Saskatchewan, Canada : their contribu-tion to a revised tectonic framework for the orogen, Precambrian Res. v.136, pp. 67–106.
Möller, A., Appel, P., Mezger, K. and Schenk, V., 1995, Evidence for a 2Gasubduction zone : eclogite in the Usagaran belt of Tanzania, Geology, v.23, pp. 1076–1070.
O'Brien, P., Walte, N. and Li, J., 2005, The petrology of two distinct granulitetypes in the Hengshan Mts, China and tectonic implications. J. Asia EarthSciences, v. 24, pp. 615–627.
Parrish, R.R., 1990, U-Pb dating of monazite and its application to geologi-cal problems: Can. J. Earth Sci., v. 27, pp. 1431–1450.
Polat, A., Kusky, T., Li, J., Fryer, B., Kerrich,R. and Patrick, K., 2005, Geo-chemistry of Neoarchean (ca. 2.55-2. 50 Ga) volcanic and ophioliticrocks in the Wutaishan greenstone Belt, central orogenic belt, NorthChina craton: implications for geodynamic setting and continentalgrowth, Geol. Soc. Amer. Bull., v. 117, pp. 1387–1399.
Pommier, A., Cocherie, A. and Legendre, O., EPMA Dating User's manual:Age calculation from electron probe microanalyser measurements of U-Th-Pb. BRGM, Orléans, France 2002, 9 pp.
SBGMR (Shanxi Bureau of Geology and Mineral Resources), 1989,Regional Geology of Shanxi Province, Geological Publishing House,Beijing, 780 pp.
Smithies, R.H., Van Krankendonk, M.J. and Champion, D.C., 2007, TheMesoarchean emergence of modern-style subduction: GondwanaResearch, v. 11, pp. 50–68.
Tian, Y.Q., Geology and mineralization of the Wutai-Henshan greenstonebelt: Shanxi, Science and Technology Press, Taiyuan, 1991, 137–152.
Trap, P., Faure, M., Lin, W. and Monié, P., Late Paleoproterozoic (1900-1800 Ma) nappe stacking and polyphase deformation in the Hengshan-Wuatishan area: Implication for the understanding of the Trans-NorthChina Belt, North China Craton, Precambrian Research, in press.
Vavra, G., Schmid, R. and Gebauer, D., Internal morphology, habit and U-Th-Pb microanalysis of amphibolite-to-granulite facies zircons: geo-chronology of the Ivrea Zone (Southern Alps): Contrib. Mineral. Petrol.v.134, pp. 380–404.
Wan, Y., Geng, Y., Shen, Q. and Zhang, R., 2000, Khondalite series-geo-chronology and geochemistry of the Jiekou Group in Lüliang area,Shanxi province, Acta Petrologica Sinica, v.16, pp. 49–58.
Wang, H. and Mo, X., 1995, An outline of the tectonic evolution of China:Episodes, v. 18, 6–16.
Wang, K., Li, J., Hao, J., Li, J. and Zhou, S., 1996, The Wutaishan orogenicbelt within the Shanxi Province, northern China: a record of late Arch-aean collision tectonics, Precambrian Res. V. 78, pp. 95–103.
Wang, Z., Wilde, S., Wang, K. and Yu, L., 2004, A MORB-arc basalt-adakiteassociation in the 2.5 Ga Wutai greenstone belt: late Archean magmatismand crustal growth in the North China Craton, Precambrian Res., v. 131,pp. 323–343.
Wang, Y., Fan, W., Zhang, H. and Peng, T., 2006, Early Cretaceous gabbroicrocks from the Taihang Mountains: implications for a paleosubduction-related lithospheric mantle beneath the central North China Craton:Lithos, v. 86, pp. 281–302.
Wiedenbeck, M., Allé, P., Corfu, F., Griffin, WL. and Meier, M., 1995, Threenatural zircon standards for U-Th-Pb, Lu-Hf, trace element and REEanalyses, Geostandards Newsletter , v. 19, pp. 1–23.
Wilde, S., Cawood, P., Wang, KY., Nemchin, A. and Zhao, G., 2004a, Deter-mining Precambrian crustal evolution in China: a case-study fromWutaishan, Shanxi Province, demonstrating the application of preciseSHRIMP U-Pb geochronology, in: Malpas, J., Fletcher, C., Ali, J. andAitchison, J. eds, Aspects of the Tectonic Evolution of China, Geol. Soc.London, Special Pub. v. 226, pp. 5–25.
Wilde, S., Zhao, G., Wang, K. and Sun, M., 2004b, First SHRIMP zircon U-Pb ages for Hutuo Group in Wutaishan: further evidence for Palaeopro-terozoic amalgamation of North China Craton, Chinese Sci. Bull. v.49,pp. 83–90.
Wilde, S., Cawood, P., Wang, K.Y. and Nemchin, A., 2005, Granitoid evolu-tion in the Late Archean Wutai Complex, North China Craton. J. AsiaEarth Sciences, v. 24, pp. 597–613.
Williams, I.S. and Claesson, S., 1987, Isotopic evidence for the Precambrianprovenance and Caledonian metamorphism of high grade paragneissesfrom the Seve Nappes, Scandinavian Caledonides; 2, Ion microprobe zir-con U-Th-Pb: Contrib. Mineral. Petrol. v. 97, pp. 205–217.
Williams, M.L. and Jercinovic, M. J., 2002, Microprobe monazite geochron-ology: putting absolute time into microstructural analysis: J. Struct.Geol., v. 24, pp. 1013–1028.
Wu, C.H. and Zhong, C.T., 1998, The Paleoproterozoic SW-NE collisionmodel for the central North China Craton, Progress in Precambrian Res.,v. 21, pp. 28–50.
Xia, X., Sun, M., Zhao, G. and Luo, Y., 2006, LA-ICP-MS U-Pb geochron-ology of detrital zircons from the Jining Complex, North China Cratonand its tectonic significance: Precambrian Research, v. 144, pp. 199–212.
Yang, Z., Cheng, Y. and Wang H., 1986, The Geology of China, ClarendonPress, Oxford, 303pp.
Yu, J., Wang, DZ., Wang, C.R. and Li, H.M., 1997, Ages of the LüliangGroup and its metamorphism in Mts Lûliang Region, Shanxi province:evidence from single grain zircon U-Pb dating: Chin. J. Geochem., v. 16,170–177.
Yu, J., Wang, D., Wang, C., Wang, L., 2004, Paleoproterozoic granitic mag-matism and metamorphism in Middle part of Lüliang range, ShanxiProvince, Geol. J. China Universities v. 10, pp. 500–512.
Zhai, M., Guo, J. and Liu, W., 2005, Neoarchean to Paleoproterozoic conti-nental evolution and tectonic history of the North China Craton : areview. J. Asia Earth Sciences, v. 24, pp. 547–561.
Zhang, Q., Dong, Y., Yuan, H. and Xu, C., 1998, Sm-Nd age of the upper-most strata of the Wutai group, Lüliang Mt area and the specific featureof the mantle at the magmatic source region, J. Chengdu College of Geol-ogy, v. 15, pp. 76–85.
Zhang, J., Zhao, G., Sun, M., Wilde, S., Li, S. and Liu, S., 2006, High-pres-sure granulites in the Trans-North China Orogen: Tectonic significanceand age: Gondwana Research, v. 9, pp. 349–362.
Zhao, G., Cawood, P., Wilde, S., Sun, M. and Lu, L., 2000, Metamorphismof basement rocks in the Central Zone of the North China Craton: impli-cations for Paleoproterozoic tectonic evolution, Precambrian Res., v. 103,pp. 55–88.
Zhao, G., Wilde, S., Cawood, P. and Sun, M., 2001, Archean blocks and theirboundaries in the North China Craton: lithological, geochemical, struc-tural and P-T path constraints and tectonic evolution. Precambrian Res, v.107, pp. 45–73.
Episodes, Vol. 30, no. 2
105

Geochronology and metamorphic P–T–X evolution of
the Eburnean granulite-facies metapelites of
Tidjenouine (Central Hoggar, Algeria): witness of the
LATEA metacratonic evolution
ABDERRAHMANE BENDAOUD1, KHADIDJA OUZEGANE1, GASTON GODARD2,
JEAN-PAUL LIEGEOIS3, JEAN-ROBERT KIENAST4, OLIVIER BRUGUIER5 &
AMAR DRARENI1
1Faculte des Sciences de la Terre, de la Geographie et de l’Amenagement du Territoire, USTHB,
BP 32, Dar el Beida 16111, Alger, Algerie (e-mail: [email protected])2Equipe Geobiosphere actuelle et primitive, CNRS IPGP, Universite Paris 7-Denis Diderot,
4 place Jussieu, case 89, Paris Cedex 05, France3Isotope Geology, Africa Museum, B-3080 Tervuren, Belgium
4Laboratoire de Geosciences Marines, UFR des Sciences Physiques de la Terre,
Universite Paris 7-Denis Diderot, UMR 7097, 4 place Jussieu, Tour 14, 5ieme Etage Paris
Cedex 05, France5ISTEEM-CNRS, cc 056, Universite de Montpellier II, Place Eugene Bataillon,
F-34095 Montpellier, France
Abstract: Central Hoggar, within the Tuareg shield to the east of the West African craton, isknown for its complexity owing to the interplay of the Eburnean and Pan-African orogenies.The Tidjenouine area in the Laouni terrane belongs to the LATEA metacraton and displaysspectacular examples of granulite-facies migmatitic metapelites. Here, we present a detailed pet-rological study coupled with in situ U–Pb zircon dating by laser-ablation inductively coupledplasma mass spectrometry (ICP-MS) that allows us to constrain the relative role of the Eburneanand Pan-African orogenies and hence to constrain how the LATEA Eburnean microcontinent hasbeen partly destabilized during the Pan-African orogeny; that is, its metacratonic evolution. Thesemetapelites have recorded different metamorphic stages. A clockwise P–T evolution is demon-strated on the basis of textural relationships, modelling in KFMASH and FMASH systems andthermobarometry. The prograde evolution implies several melting reactions involving the break-down of biotite and gedrite. Peak metamorphic P–T conditions of 860 + 50 8C and 7–8 kbar(M1) were followed by a decrease of pressure to 4.3 + 1 kbar and of temperature to around700 8C, associated with the development of migmatites (M2). After cooling, a third thermalphase at c. 650 8C and 3–4 kbar (M3) occurred. U–Pb zircon laser ablation ICP-MS analysisallows us to date the protolith of the migmatites at 2151 + 8 Ma, the granulite-facies and migma-titic metamorphisms (M1–M2) at 2062 + 39 Ma and the medium-grade metamorphic assemblage(M3) at 614 + 11 Ma. This last event is coeval with the emplacement of large Pan-African graniticbatholiths. These data show that the main metamorphic events are Eburnean in age. The Pan-African orogeny, in contrast, is associated mainly with medium-grade metamorphism but alsomega-shear zones and granitic batholiths, characterized by a high temperature gradient. Thiscan be considered as typical of a metacratonic evolution.
The Tidjenouine metapelites (Central Hoggar,Fig. 1) show a great diversity of minerals (garnet,biotite, quartz, sillimanite, gedrite, corundum,orthopyroxene, cordierite, spinel, feldspar, plagio-clase, ilmenite, rutile) forming different assem-blages depending on whole-rock composition andextent of metamorphic transformation. The rockswere involved in a prograde metamorphic evolution
followed by decompression. Granulite-facies meta-morphism was accompanied by melting favouredby biotite or gedrite dehydration. The successivestages of melting, with a progressively increasingamount of melt escape, produced metapelites witha restitic composition. In these rocks, corundum,spinel and sillimanite crystallized in the mostAll rich microdomains and orthopyroxene in the
From: ENNIH, N. & LIEGEOIS, J.-P. (eds) The Boundaries of the West African Craton. Geological Society, London,Special Publications, 297, 111–146.DOI: 10.1144/SP297.6 0305-8719/08/$15.00 # The Geological Society of London 2008.

most Mg-rich zones. In Central Hoggar, this pro-grade metamorphism in granulite facies has neverbeen described and the large variability of the meta-pelite compositions allows us to constrain the P–T–aH2O
evolution.On the other hand, the Tuareg shield is charac-
terized by the interplay of the Eburnean (c. 2 Ga)and the Pan-African (c. 0.6 Ga) orogenies. Severalterranes of this shield were mostly generatedduring the Pan-African orogeny (Black et al.1994) whereas others have been only slightlyaffected, such as the In Ouzzal terrane (Ouzeganeet al. 2003, and references therein), perfectlypreserving ultrahigh-temperature parageneses(Ouzegane & Boumaza 1996; Adjerid et al. 2008).The situation of Central Hoggar is much moredebated: for some researchers (e.g. Caby 2003),its granulite-facies metamorphism is Pan-African in
age (protoliths being mostly Palaeoproterozoicor Archaean); for others, this metamorphism is Ebur-nean in age, the Pan-African orogeny having gener-ated only high-T greenschist- or amphibolite-faciesmetamorphism, with high-pressure metamorphismbeing present only in Neoproterozoic oceanicmaterial thrust on the granulitic basement constitut-ing the LATEA metacraton (Liegeois et al. 2003;Peucat et al. 2003).
This debate sharply emphasizes the question ofhow a cratonic basement behaves during anorogeny and how it can be remobilized and whatare the consequences of such behaviour. This ques-tions also the nature of the LATEA microcontinent:craton, metacraton or mobile belt? To tackle thisproblem, this paper focuses on the well-preservedgranulites of the Tidjenouine area. It aims at (1)reconstructing the thermotectonic evolution of
Fig. 1. Geological sketch maps of the Hoggar (a, Bertrand et al. 1986), of the Tuareg shield (b, Black et al. 1994)and geological map of the study area (c, Liegeois et al. 2003). Eg-Al, Egere–Aleksod; Te, Tefedest; Az, Azrou-n-Fad;Se, Serouenout; Is, Issalane; La, Laouni; Isk, Iskel; It, In Teidini; Tz, Tazat; As-Is, Assode-Issalane.
A. BENDAOUD ET AL.112

these granulites on the basis of detailed mineralogi-cal and paragenetic study of diverse reaction tex-tures preserved in the metapelites; (2) dating themetamorphic assemblages deciphered. For thispurpose, a large number of samples of metapeliteshave been collected and studied. The P–T con-ditions and P–T path were constrained by usingtextural relationships, thermobarometry and appro-priate petrogenetic grids and P–T pseudosections.The resulting constrained P–T paths, coupledwith additional field relationships, allow us tointerpret properly the different U–Pb zircon agesprovided by laser ablation inductively coupledplasma mass spectrometry (ICP-MS) and by theolder conventional U–Pb bulk zircon method.Finally, this allows us to propose a geodynamicalevolution of the LATEA microcontinent, highlight-ing a metacratonic evolution.
Regional geology and lithology
The Tidjenouine area (Central Hoggar, Algeria;Fig. 1) is located in the NW part of the Laouniterrane (Fig. 1b), one of the 23 terranes of theTuareg shield that were amalgamated duringthe Pan-African orogeny (Black et al. 1994). TheLaouni terrane is composed of a granulite- toamphibolite-facies basement separated fromPan-African lithologies by mega-thrusts, such asthe Tessalit ophiolitic remnant in the south andthe eclogite lenses and associated oceanic materialin the Tin Begane area (Liegeois et al. 2003). TheLaouni terrane is one of the four terranes constitut-ing the LATEA micro-continent (LATEA is anacronym of Laouni, Azrou-n-fad, Tefedestand Egere-Aleksod terranes; Fig. 1b). Accordingto Liegeois et al. (2003), the Archaean and Ebur-nean LATEA microcontinent was dismemberedby mega-shear zones and intruded by granitic bath-oliths during the main episode of the Pan-Africanorogeny (640–580 Ma).
The granulite-facies rocks of the Tidjenouinearea are composed of two units: (1) migmatiticgneisses with locally recognizable metapelitic andmetabasic lenses; (2) migmatitic biotite–garnet–sillimanite metapelites interbanded with olivine–spinel marbles, sillimanite-bearing quartzites andmetabasic layers. The quartzites form 100 m thickfolded ridges, whereas the marbles occur asboudin alignments, a few metres in thickness. Allthese rocks are crosscut by Pan-African granites.At contacts between marbles and granites, skarnscan be observed. The granulite-facies metamorph-ism is accompanied by subhorizontal foliationsand tangential tectonics.
Few geochronological data are available in theLaouni terrane: these include the following: (1)
the Pan-African Anfeg granitic batholith has beendated at 608 + 7 Ma (U–Pb zircon, Bertrandet al. 1986; recalculated by Liegeois et al. 2003);(2) the Pan-African amphibolite-facies metamorph-ism of the thrust oceanic material at Tin Beganehas been dated at 685 + 20 Ma (Sm–Nd mineralisochron; Liegeois et al. 2003); (3) a granuliteand a migmatitic granite in the Tidjenouine areahave been dated to Eburnean ages of1979 + 33 Ma and 2038 + 15 Ma (U–Pb zircon,Bertrand et al. 1986; recalculated by Liegeoiset al. 2003). A migmatite from the neighbouringAzrou n’Fad terrane gave strongly discordantzircons with an upper intercept of 2131 + 12 Maand a lower intercept of 609 + 17 Ma (Barbeyet al. 1989), thus the age of the migmatitizationis ambiguous. The c. 2 Ga ages are interpretedeither as the age of the protoliths and the granulite-facies metamorphism (Bertrand & Jardim de Sa1990; Ouzegane et al. 2001; Liegeois et al.2003) or as the age of the protoliths, the granulite-facies metamorphism being Pan-African in age(Barbey et al. 1989; Caby 2003). Other workershave indicated that they cannot choose betweenthe two hypotheses (Bendaoud et al. 2004; Benya-hia et al. 2005). Three arguments sustain an Ebur-nean age for the granulite-facies metamorphism:(1) the zircons dated by Bertrand et al. (1986) inthe Tidjenouine area have not recorded thePan-African orogeny; (2) in the Gour Oumelalenregion (NE LATEA), a series of granulitic rockshave been dated both by the conventional andion microprobe U–Pb on zircon methods, and anage of c. 1.9 Ga has been inferred for the meta-morphism without any record of the Pan-Africanorogeny (Peucat et al. 2003); (3) the c. 685 Maold eclogite- and amphibolite-facies oceanicmaterial has not been affected by the granuliticmetamorphism. However, this controversialissue must be resolved by a detailed study of themetamorphic phases and by in situ zircon datingof key lithologies.
Main characteristics of the Tidjenouine
migmatitic granulites
The main Tidjenouine rock type is a medium- tocoarse-grained migmatitic orthogneiss madeof quartzþK-feldsparþ plagioclaseþ biotite withminor amounts of garnet. The metapelites thatwill be described in this study are less abundant.In the central part of the area, the orthogneissesare mainly leucomigmatites surrounded by darkermigmatitic gneiss. Their silica values range from66.4 to 76.1 wt% and the Mg/(Mgþ Fe) ratiovaries between 0.35 and 0.52. Aluminiumsaturation index (ASI, A/CNK) values between
TIDJENOUINE METAPELITES EVOLUTION 113

1.1 and 1.3 indicate strongly peraluminous compo-sitions (Table 1). Most REE patterns (Fig. 2) ofthese migmatites show pronounced depletion inheavy REE (HREE), which is a characteristic of
magmatic suites that have garnet in their source(Hanson 1989). Some samples, however, haveflatter HREE patterns. Ba occurs in the856–1825 ppm range. Sr (334–533 ppm) and Rb
Table 1. Representative geochemical data for migmatitic gneiss and metapelites from Tidjenouine area
Rock type: Type A Type C Type D Migmatitic gneiss
Sample: TD 39 TD 60 Tj 58 TD 67 Tj 5 Tj 80 Tj 139 Tj 120
SiO2 69.88 63.62 43.29 60.4 69.11 66.42 68.96 76.78TiO2 0.78 1.13 0.98 1.35 0.87 0.69 0.58 0.06Al2O3 13.68 16.81 25.76 14.68 13.69 16.15 15.62 13.1FeO* 6.7 6.2 12.1 13.18 6.15 3.63 5.13 1.55FeOFe2O3 7.45 6.89 13.45 14.65 6.84 4.03 5.7 1.73MnO 0.08 0.08 0.09 0.15 0.16 0.03 0.04 0.05MgO 2.05 2.06 10.2 6.49 0.84 1.83 3.84 0.47CaO 0.45 3.68 0.33 1.23 3.2 2.45 0.64 0.56Na2O 0.92 3.04 0.3 0.55 2.41 3.72 0.89 2.29K2O 2.56 2.18 2.52 0.16 2.09 3.43 1.6 4.84P2O5 0.04 0.51 0.09 0.33 0.25 0.26 0.1 0.12LOI 1.8 2.88 0.28 0.92 1.97Sum 99.69 100 99.89 99.73 99.74 99.93 99.94 100
Cs 0.123 1.77 0.143 1.56 2.06 0.38 0.22Rb 91.72 92 168 5.67 86.34 116.85 75.5 92.53Ba 670 912 618 114 1121 855.76 262.64 1825.35Th 12.35 29.6 0.71 13.53 50.87 13.31 8.74U 0.71 1.82 0.39 1.12 2.44 1.07 0.63Ta 0.392 1.21 0.557 1.01 0.39 0.4 0.1Nb 9.44 15 18.9 11.15 13.04 7.01 9.01 1.36La 55.35 73 28.87 58.63 142.05 54.67 33.45Ce 108.8 149 63.28 119.5 261.17 104.18 64.27Pb 5.66 11.3 2.15 14.3 31.53 5.11 28.72Pr 11.34 17.1 7.94 13.63 27.76 11 6.77Sr 102 344 49.2 40 188 334.47 81.74 533.49Nd 42.25 64.6 32.65 51.24 97.06 38.66 23.84Sm 7.19 12.9 7.5 10.27 14.42 6.81 4.48Zr 254 278 336 184 362 693.38 232.33 130.21Hf 6.05 8.2 4.25 9.46 16.57 5.28 3.6Eu 1.46 0.729 1.26 1.92 2.08 0.82 1.75Gd 5.22 9.37 8.13 8.29 8.11 5.33 3.19Tb 0.79 1.02 1.29 1.3 0.88 0.73 0.39Dy 4.17 4.82 8.72 6.91 3.21 3.71 2.1Y 22.4 43 24.8 62.3 42.4 12.67 18.68 16.57Ho 0.86 0.816 2.32 1.46 0.41 0.58 0.43Ga 19.5 24 41.8 7.13 20.7 26.9 22.61 13Er 2.2 2.25 6.37 4.06 1.35 1.5 1.09Tm 0.39 0.322 1.42 0.55 0.14 0.19 0.16Yb 2.31 2.18 10.1 4.17 1.11 1.24 1.15Lu 0.36 0.349 1.74 0.66 0.13 0.14 0.12Cu 39.6 28 9.9 16.1 29.5 8.66 12.64 5.35Cd 0.08 0.25 0.23 0.35 0.09 0.1V 118 103 162 102 50 77.18 71.84 6.19Zn 50.6 105 231 28.1 69.2 85.32 66.8 17.52Co 18.9 25 17.3 20.2 13.4 11.3 14.89 2.97Cr 108 52 137 159 50.5 56.3 87.6 9.85Ni 53.4 30 66.1 8.98 17.3 29.17 34.68 2.73
LOI, loss on ignition.
A. BENDAOUD ET AL.114

(93–117 ppm) give Rb/Sr values between 0.17 and1.26. The composition of these rocks suggeststhat their protoliths resulted from the partialmelting of the continental crust, which left agarnet-bearing residue.
The transition from the orthogneiss to the meta-pelite corresponds to a decrease in the size andabundance of the migmatitic leucosomes, whichhave a mineralogical composition identical to thatof the orthogneiss, until their total disappearance.The orthogneisses can then be considered assharing the same origin as the leucosomes, butbeing slightly more allochthonous. This indicatesthat the felsic intrusions, the granulitic metamorph-ism and the migmatitization occurred within thesame event. Garnet-bearing mafic rocks occur ascentimetre- to metre-sized boudins along thegranulite-facies foliation within the orthogneiss.Larger bodies (hundreds of metres in size) do notbear garnet. These mafic rocks are not studiedhere. The garnet-bearing mafic rocks are composedof the Grt–Cpx–Pl–Qtz primary assemblage,which broke down to Opx–Pl during the
decompressional stage. On the other hand, thegarnet-free mafic rocks with Opx–Cpx–Am–Pl + Qtz assemblage are characterized by laterdestabilization of the amphibole to Opx–Pl, afterthe decrease of pressure.
The metapelites are migmatitic and dominantlyrestitic, felsic minerals being commonly less abun-dant than the mafic ones. A strong layering isobserved: Grt–Bt–Sil–Cd-rich restitic layers alter-nate with Qtz–Pl + K-feldspar-rich leucosomes.Migmatitization and dehydration are generallythought to be caused by melting of hydrousphases such as biotite and, less commonly,gedrite. A major feature of the Tidjenouine migma-titic granulites is the presence of well-preservedpetrological textures that have developed duringprograde metamorphism (e.g. inclusions in garnetor sillimanite), as well as during retrogression(i.e. spectacular symplectites and coronas). Thisallows an accurate determination of the P–Tpath evolution.
Different assemblages (Table 2) have been dis-tinguished in the metapelites on the basis of the
1
10
100
1000
La Ce Pr Nd Pm Sm Eu Gd Tb Dy Ho Er Tm Yb Lu
Opx Free MetapeliteOpx Bearing MetapeliteGedrite Bearing Granulite
1
10
100
1000(c)
(a)
(d)
(b)
La Ce Pr Nd Pm Sm Eu Gd Tb Dy Ho Er Tm Yb Lu
0.01
0.1
1
10
100
1000
Rb Ba Th K Nb Ta La Ce Sr P Nd Zr Hf Sm Eu Ti Gd Dy Y Er Yb Lu V Fe Co Mg Cr Ni
Opx Free Metapelite
Opx Bearing Metapelite
Gedrite Bearing granulite
0.01
0.1
1
10
100
1000
Rb Ba Th K Nb Ta La Ce Sr P Nd Zr Hf Sm Eu Ti Gd Dy Y Er Yb Lu V Fe Co Mg Cr Ni
Tj 5Tj 80Tj 120Tj 139
Roc
k/C
hond
rite
s
Roc
k/P
rim
itiv
e M
antl
eR
ock/
Pri
mit
ive
Man
tle
Tj 5Tj 80Tj 120Tj 139
Roc
k/C
hond
rite
s
Migmatitic gneiss
Migmatitic gneiss
Fig. 2. REE bulk-rock compositions normalized to chondrite (a, c) and spider diagram normalized to primitive mantle(b, d) for metapelites (a and b) and migmatitic gneisses (c and d), respectively. Chondrite and primitive mantlenormalization values are from Taylor & McLennan (1985) and Sun & McDonough (1989), respectively.
TIDJENOUINE METAPELITES EVOLUTION 115

presence or absence, depending on the protolithcomposition, of phases such as orthopyroxene,gedrite, biotite, sillimanite, corundum or quartz.For example, the peak paragenesis of the mostFe-rich metapelites is garnet þ sillimanite þquartz þ biotite þ cordierite þ plagioclase + K-feldspar, whereas the most Mg-rich metapeliteshave orthopyroxeneþ garnetþ biotiteþ quartz þcordieriteþ plagioclase + K-feldspar. As theserocks occur intimately associated in the field, thevariations in the mineral assemblage are controlledby the bulk composition of the rocks rather than byP–T conditions.
Five main assemblages (Table 2), ranging fromFe-rich to Mg-rich compositions, have been distin-guished: orthopyroxene-free quartz-bearing meta-pelites (type A, Table 2); orthopyroxene-freecorundum-bearing metapelites (type B, Table 2);secondary orthopyroxene-bearing metapelites(type C, Table 2); gedrite-bearing granulites (typeD, Table 2); sillimanite-free orthopyroxene-bearingmetapelites (type E, Table 2). Migmatitic gneisseswithout sillimanite and orthopyroxene with flatHREE patterns are similar in composition toorthopyroxene-free quartz-bearing metapelites.The leucosome-free metapelites have compositionstypical of residual rocks: for instance, the secondaryorthopyroxene-bearing rocks show high contents ofFeO, MgO and Al2O3 and low contents of SiO2,K2O and Na2O, leading to high normative corun-dum (up to 12 wt%). These rocks are enriched in
light REE (LREE) and display negative Euanomalies (Eu/Eu* ¼ 0.50, Fig. 2).
The orthopyroxene-free quartz-bearing
metapelites (type A)
The orthopyroxene-free quartz-bearing metapelitesdisplay medium to coarse granoblastic texturewith a layered structure. They consist mainly ofgarnet, biotite, cordierite, sillimanite, quartz andK-feldspar porphyroblasts, with subordinateplagioclase, spinel, ilmenite and graphite. Rutile,zircon and apatite are accessory phases. All theprimary minerals (garnet, sillimanite, biotite andquartz) are deformed. A large variability inproportions exists from leucocratic varieties richin quartz and K-feldspar to melanocratic varietiesrich in garnet, biotite and sillimanite wherequartz and K-feldspar are absent. The modal per-centage of garnet varies between 2 and 25 vol%.The core of the garnet porphyroblasts frequentlycontains inclusions of biotite, sillimanite, quartzand plagioclase. This feature suggests the progradereaction
Btþ Silþ Qtz + Pl!GrtþMelt + Crd
+ Kfs + Ilm: ð1ÞIn all samples, biotite and sillimanite are never incontact, because there are always separated by
Table 2. Representative mineral assemblages of granulite-facies metapelites from Tidjenouine
Rock type: Type A Type B Type C Type D Type E
Samples: TD 80–128 TD 130 TD 57 TD 67 TD 38TD 63 TD 65 TD 134 TD 57b TD 67CTD 29 TD 39 TD 56 TD 59 TD 67A
TD 159
Quartz X X X XBiotite X X X XGarnet X X X X XSillimanite X X X XPlagioclase X X X XK-feldspar X x x x xGedrite XOrthopyroxene X X XCordierite X X X X XSpinel X X X X XCorundum XIlmenite X X X X XRutile x X x XApatite x x xMagnetite xGraphite X X XPyrite X
X, abundant; x, scarce.
A. BENDAOUD ET AL.116

symplectites, as a result of later reactions betweenthem. In the presence of quartz, we observe thegrowth of cordierite with sometimes K-feldsparfrom the assemblage biotiteþ sillimaniteþ quartz,where sillimanite occurs both as porphyroblastsand as fine needles included in cordierite cores. Inthe absence of quartz, symplectites of cordieriteþspinel and K-feldspar developed on the interfacesbetween primary biotite and sillimanite. This corre-sponds to the reactions
Btþ Silþ Qtz! Crd + KfsþMelt ð2Þ
and
Btþ Sil ! Crdþ Spl + KfsþMelt: ð3Þ
In a similar way, garnet porphyroblasts, in thepresence of sillimanite and quartz, have beenpartly resorbed, being surrounded by cordierite; inquartz-free microdomains containing garnet and sil-limanite, we observe the growth of cordieritetoward garnet and of cordieriteþ spinel symplec-tites around sillimanite grains. These texturessuggest the reactions
Grtþ Silþ Qtz! Crd ð4Þ
and
Grtþ Sil ! Crdþ Spl. ð5Þ
Garnet is also occasionally observed in anothermineral assemblage where it occurs as euhedralgrains with cordierite as result of the reaction (4),which becomes
Grt1 þ Silþ Qtz ! Crdþ Grt2: ð40Þ:
In some samples, a late sillimanite replaced primarysillimanite, crosscutting the foliation defined by theother phases composing the rock.
Orthopyroxene-free corundum-bearing
metapelites (type B)
Corundum-bearing (quartz-free) metapelites arealso the rocks richest in garnet and sillimanite.They form centimetre-sized layers. Sillimaniteassociated with spinel and biotite is rich ininclusions of garnet and corundum representingrelics of the earlier paragenesis (Fig. 3b). This tex-tural relationship suggests the existence of a veryearly melt and the corundum-consuming prograde
reaction
Grtþ CorþMeltþ Ksp! Sillþ Splþ Bt: ð6Þ
The sillimanite is separated from garnet and biotiteby cordieriteþ spinelþK-feldspar symplectites.This texture may be explained by the KFMASHunivariant reaction (Fig. 3a)
Grtþ Btþ Sil ! Splþ Crd + KspþMelt: ð7Þ
These symplectites also occur on contacts ofgarnet or biotite with sillimanite correspondingto multivariant KFMASH equilibria (3)and (6).
Secondary orthopyroxene-bearing
metapelites (type C)
Metapelites with secondary orthopyroxene aremelanocratic, aluminous and consist of alter-nating quartz-rich and silica-undersaturedsillimanite-rich layers. They are coarse-grainedheterogeneous rocks with granoblastic textureand are mainly composed of sillimanite, cor-dierite, garnet, biotite, spinel, orthopyroxene,quartz, plagioclase and smaller amounts ofilmenite, rutile, graphite and pyrite. They arecharacterized by largest abundance of plagio-clase with respect to K-feldspar and by specta-cular crystals of sillimanite up to 10 cm inlength. The garnet porphyroblasts have thesame inclusions (biotite, sillimanite quartz andplagioclase) as those of the orthopyroxene-freequartz-bearing metapelites and reaction (1)should have also operated.
The breakdown of biotite in the presence ofgarnet with sillimanite or quartz produced symp-lectites of spinelþ cordierite and cordieriteþorthopyroxene, respectively. These textures maybe explained by the reactions
Grtþ Btþ Sil! Splþ Crdþ KspþMelt ð7Þ
(Fig. 3c) and
Grtþ Btþ Qtz! Crdþ Opxþ KspþMelt: ð8Þ
One sample (Tj57b) displays the breakdown ofgarnet to orthopyroxene, cordierite, spinel andplagioclase according to the reaction (Fig. 3d)
Grt! Opxþ Splþ Crdþ PlðAn96Þ: ð9Þ
TIDJENOUINE METAPELITES EVOLUTION 117

Fig. 3. Representative reaction textures of orthopyroxene-free metapelites (a–d) and orthopyroxene-bearingmetapelites (e–h). (a) Primary, elongated garnet, sillimanite and biotite reacting out to cordierite–spinel inorthopyroxene-free, corundum-bearing metapelites (backscattered electron (BSE) image). (b) The same rock withsillimanite enclosing garnet, corundum and ilmenite (plane-polarized light). (c) Well-developed spinel–cordieritesymplectite close to sillimanite and cordierite corona between garnet and biotite, suggesting prograde reaction
A. BENDAOUD ET AL.118

In the same sample, garnet reacted with quartz andsometimes with rutile inclusions to produce ortho-pyroxene and cordierite symplectites associatedwith ilmenite:
Grtþ Qtz + Rut!Opxþ Crd
+ Ilm + Pl: ð10Þ
In the absence of biotite, garnet and sillimanitereacted to produce cordierite, spinel and quartzsymplectites following the univariant FMASHreaction
Grtþ Sil + Melt!Crdþ Spl
þ Qtz + Ksp: ð11Þ
In some microdomains, a corona of later cordieriteseparates spinel from quartz, suggesting thereaction
Splþ Qtz! Crd: ð12Þ
Gedrite-bearing granulites (type D)
The gedrite-bearing rocks contain a quartzþgarnetþ sillimaniteþ cordieriteþ orthopyroxeneþ plagioclaseþ spinelþ gedriteþ ilmeniteþ rutileassemblage with very minor K-feldspar and biotite.They display heterogranular coarse-grained texturewith spectacular coronitic and symplectitic associ-ations. Porphyroblasts of garnet, sillimanite, quartz,gedrite, rutile and ilmenite are systematically separ-ated by fine symplectites of orthopyroxeneþcordierite+ plagioclase + orthoamphibole or ofcordieriteþ spinel. The orthopyroxene occurs alsoas coronas entirely surrounding quartz or ilmenite.Plagioclase associated with quartz is antiperthitic.Quartz occurs as discontinuous ribbons that formlenses with asymmetric tails. The texture suggeststwo successive reactions: sillimanite, gedrite andquartz are separated by cordierite, plagioclase andgarnet corona structures (Fig. 3e); sillimanitereacted with gedrite giving cordierite–spinel
symplectites associated with plagioclase or melt.These features should correspond to the reactions
Silþ Gedþ Qtz ¼ Grtþ CrdþMelt ð13Þ
and
Silþ Ged ¼ Crdþ SplþMelt. ð14Þ
Other reaction textures in these rocks are similar tothose of the orthopyroxene-bearing metapelites.Garnet, quartz and sillimanite are never observedin contact and are always separated either by sym-plectitic or coronitic textures corresponding to reac-tions (4) and (5) with the implication of plagioclase(Fig. 3g). At the contact between garnet and quartz,quartz is rimmed by a corona of orthopyroxene,whereas garnet is mantled by a cordieriteþorthopyroxene symplectite (Fig. 3g and h):
Grtþ Qtz ¼ Opxþ Crd + Pl2: ð10Þ
Locally, the orthopyroxene–cordierite symplectitesare accompanied by secondary orthoamphibole andthis reaction becomes (Fig. 3f)
Grtþ Qtz + Pl1 ¼ Opxþ Crdþ Oam
+ Pl2: ð15Þ
Opx-bearing sillimanite-free
metapelites (type E)
Orthopyroxene-bearing, sillimanite-free metapelitesare distinctly marked by the absence of sillimaniteand the presence of orthopyroxene as primaryphase. They show quartz–plagioclase–K-feldsparmicrodomains corresponding to leucosome. Theserocks are coarse-grained with a polygonal granoblas-tic texture associated with a undulose extinction ofquartz and kink-bands of biotite. This suggests defor-mation at a high temperature, contemporaneouswith the granulite-facies metamorphism. The
Fig. 3. (Continued) Grtþ Silþ Bt ! Crdþ Splþ Ksp (plane-polarized light). (d) Development of complex OpxþSplþ Crdþ Pl intergrowths in cracks of garnet (plane-polarized light). (e) Gedrite originally in contact with primaryquartz (included in garnet) and sillimanite, now enclosed by multiple coronae of phase products: plagioclase and quartzafter melt, cordieriteþ spinel replacing sillimanite, and orthopyroxeneþ cordierite symplectite close to garnet (BSEimage). This complex textural relationships suggests the following successive reactions: (1) Gedþ SilþQtz !Grtþ CrdþMelt; (2) Gedþ Sil ! Splþ CrdþMelt; (3) GrtþQtz ! Opxþ Crd. (f) Close-up view of garnet andquartz breakdown to cordieriteþ orthopyroxeneþ orthoamphibole (BSE image). (g) Fine intergrowth ofcordieriteþ spinelþ calcic plagioclase close to sillimanite suggesting the reaction Grtþ Sil! Crdþ Splþ Pl2, andbreakdown of garnet at quartz contact giving orthopyroxeneþ cordierite. Layers of plagioclase and drops of quartz couldrepresent melt phases (RGB image: red, Fe; green, Ca; blue, Al). (h) Garnet reacting out with quartz toorthopyroxeneþ cordieriteþ plagioclase (it should be noted zoning in garnet (RGB image: red, Fe; green, Ca; blue, Si).
TIDJENOUINE METAPELITES EVOLUTION 119
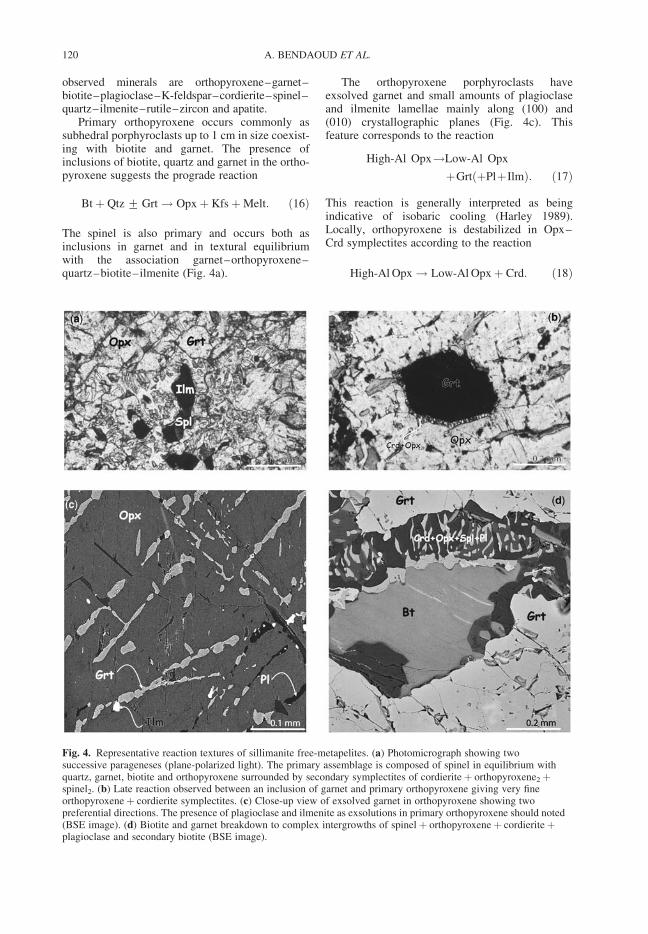
observed minerals are orthopyroxene–garnet–biotite–plagioclase–K-feldspar–cordierite–spinel–quartz–ilmenite–rutile–zircon and apatite.
Primary orthopyroxene occurs commonly assubhedral porphyroclasts up to 1 cm in size coexist-ing with biotite and garnet. The presence ofinclusions of biotite, quartz and garnet in the ortho-pyroxene suggests the prograde reaction
Btþ Qtz + Grt! Opxþ KfsþMelt: ð16Þ
The spinel is also primary and occurs both asinclusions in garnet and in textural equilibriumwith the association garnet–orthopyroxene–quartz–biotite–ilmenite (Fig. 4a).
The orthopyroxene porphyroclasts haveexsolved garnet and small amounts of plagioclaseand ilmenite lamellae mainly along (100) and(010) crystallographic planes (Fig. 4c). Thisfeature corresponds to the reaction
High-Al Opx!Low-Al Opx
þGrtðþPlþIlmÞ: ð17Þ
This reaction is generally interpreted as beingindicative of isobaric cooling (Harley 1989).Locally, orthopyroxene is destabilized in Opx–Crd symplectites according to the reaction
High-Al Opx! Low-Al Opxþ Crd: ð18Þ
Fig. 4. Representative reaction textures of sillimanite free-metapelites. (a) Photomicrograph showing twosuccessive parageneses (plane-polarized light). The primary assemblage is composed of spinel in equilibrium withquartz, garnet, biotite and orthopyroxene surrounded by secondary symplectites of cordieriteþ orthopyroxene2þspinel2. (b) Late reaction observed between an inclusion of garnet and primary orthopyroxene giving very fineorthopyroxeneþ cordierite symplectites. (c) Close-up view of exsolved garnet in orthopyroxene showing twopreferential directions. The presence of plagioclase and ilmenite as exsolutions in primary orthopyroxene should noted(BSE image). (d) Biotite and garnet breakdown to complex intergrowths of spinelþ orthopyroxeneþ cordieriteþplagioclase and secondary biotite (BSE image).
A. BENDAOUD ET AL.120
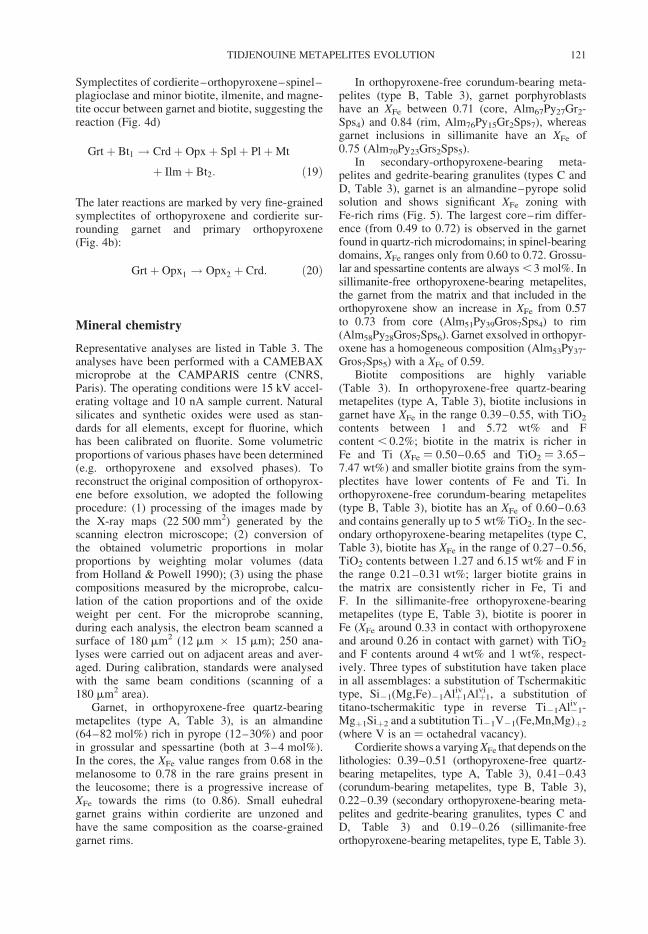
Symplectites of cordierite–orthopyroxene–spinel–plagioclase and minor biotite, ilmenite, and magne-tite occur between garnet and biotite, suggesting thereaction (Fig. 4d)
Grtþ Bt1 ! Crdþ Opxþ Splþ PlþMt
þ Ilmþ Bt2: ð19Þ
The later reactions are marked by very fine-grainedsymplectites of orthopyroxene and cordierite sur-rounding garnet and primary orthopyroxene(Fig. 4b):
Grtþ Opx1 ! Opx2 þ Crd: ð20Þ
Mineral chemistry
Representative analyses are listed in Table 3. Theanalyses have been performed with a CAMEBAXmicroprobe at the CAMPARIS centre (CNRS,Paris). The operating conditions were 15 kV accel-erating voltage and 10 nA sample current. Naturalsilicates and synthetic oxides were used as stan-dards for all elements, except for fluorine, whichhas been calibrated on fluorite. Some volumetricproportions of various phases have been determined(e.g. orthopyroxene and exsolved phases). Toreconstruct the original composition of orthopyrox-ene before exsolution, we adopted the followingprocedure: (1) processing of the images made bythe X-ray maps (22 500 mm2) generated by thescanning electron microscope; (2) conversion ofthe obtained volumetric proportions in molarproportions by weighting molar volumes (datafrom Holland & Powell 1990); (3) using the phasecompositions measured by the microprobe, calcu-lation of the cation proportions and of the oxideweight per cent. For the microprobe scanning,during each analysis, the electron beam scanned asurface of 180 mm2 (12 mm � 15 mm); 250 ana-lyses were carried out on adjacent areas and aver-aged. During calibration, standards were analysedwith the same beam conditions (scanning of a180 mm2 area).
Garnet, in orthopyroxene-free quartz-bearingmetapelites (type A, Table 3), is an almandine(64–82 mol%) rich in pyrope (12–30%) and poorin grossular and spessartine (both at 3–4 mol%).In the cores, the XFe value ranges from 0.68 in themelanosome to 0.78 in the rare grains present inthe leucosome; there is a progressive increase ofXFe towards the rims (to 0.86). Small euhedralgarnet grains within cordierite are unzoned andhave the same composition as the coarse-grainedgarnet rims.
In orthopyroxene-free corundum-bearing meta-pelites (type B, Table 3), garnet porphyroblastshave an XFe between 0.71 (core, Alm67Py27Gr2-Sps4) and 0.84 (rim, Alm76Py15Gr2Sps7), whereasgarnet inclusions in sillimanite have an XFe of0.75 (Alm70Py23Grs2Sps5).
In secondary-orthopyroxene-bearing meta-pelites and gedrite-bearing granulites (types C andD, Table 3), garnet is an almandine–pyrope solidsolution and shows significant XFe zoning withFe-rich rims (Fig. 5). The largest core–rim differ-ence (from 0.49 to 0.72) is observed in the garnetfound in quartz-rich microdomains; in spinel-bearingdomains, XFe ranges only from 0.60 to 0.72. Grossu-lar and spessartine contents are always ,3 mol%. Insillimanite-free orthopyroxene-bearing metapelites,the garnet from the matrix and that included in theorthopyroxene show an increase in XFe from 0.57to 0.73 from core (Alm51Py39Gros7Sps4) to rim(Alm58Py28Gros7Sps6). Garnet exsolved in orthopyr-oxene has a homogeneous composition (Alm53Py37-Gros7Sps5) with a XFe of 0.59.
Biotite compositions are highly variable(Table 3). In orthopyroxene-free quartz-bearingmetapelites (type A, Table 3), biotite inclusions ingarnet have XFe in the range 0.39–0.55, with TiO2
contents between 1 and 5.72 wt% and Fcontent , 0.2%; biotite in the matrix is richer inFe and Ti (XFe ¼ 0.50–0.65 and TiO2 ¼ 3.65–7.47 wt%) and smaller biotite grains from the sym-plectites have lower contents of Fe and Ti. Inorthopyroxene-free corundum-bearing metapelites(type B, Table 3), biotite has an XFe of 0.60–0.63and contains generally up to 5 wt% TiO2. In the sec-ondary orthopyroxene-bearing metapelites (type C,Table 3), biotite has XFe in the range of 0.27–0.56,TiO2 contents between 1.27 and 6.15 wt% and F inthe range 0.21–0.31 wt%; larger biotite grains inthe matrix are consistently richer in Fe, Ti andF. In the sillimanite-free orthopyroxene-bearingmetapelites (type E, Table 3), biotite is poorer inFe (XFe around 0.33 in contact with orthopyroxeneand around 0.26 in contact with garnet) with TiO2
and F contents around 4 wt% and 1 wt%, respect-ively. Three types of substitution have taken placein all assemblages: a substitution of Tschermakitictype, Si21(Mg,Fe)21Alivþ1Alvi
þ1, a substitution oftitano-tschermakitic type in reverse Ti21Aliv21-Mgþ1Siþ2 and a subtitution Ti21V21(Fe,Mn,Mg)þ2
(where V is an ¼ octahedral vacancy).Cordierite shows a varying XFe that depends on the
lithologies: 0.39–0.51 (orthopyroxene-free quartz-bearing metapelites, type A, Table 3), 0.41–0.43(corundum-bearing metapelites, type B, Table 3),0.22–0.39 (secondary orthopyroxene-bearing meta-pelites and gedrite-bearing granulites, types C andD, Table 3) and 0.19–0.26 (sillimanite-freeorthopyroxene-bearing metapelites, type E, Table 3).
TIDJENOUINE METAPELITES EVOLUTION 121
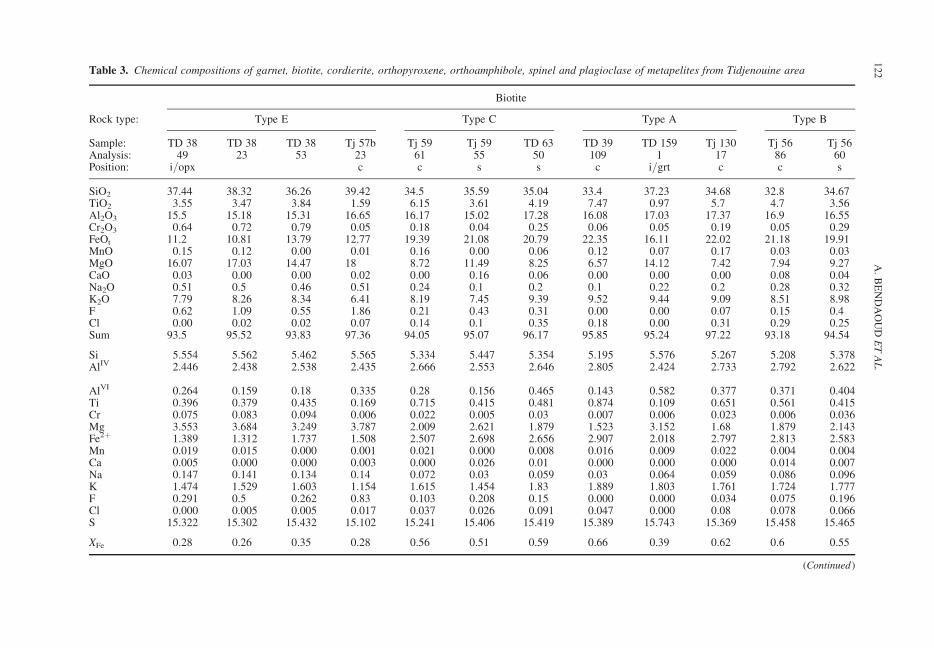
Table 3. Chemical compositions of garnet, biotite, cordierite, orthopyroxene, orthoamphibole, spinel and plagioclase of metapelites from Tidjenouine area
Biotite
Rock type: Type E Type C Type A Type B
Sample: TD 38 TD 38 TD 38 Tj 57b Tj 59 Tj 59 TD 63 TD 39 TD 159 Tj 130 Tj 56 Tj 56Analysis: 49 23 53 23 61 55 50 109 1 17 86 60Position: i/opx c c s s c i/grt c c s
SiO2 37.44 38.32 36.26 39.42 34.5 35.59 35.04 33.4 37.23 34.68 32.8 34.67TiO2 3.55 3.47 3.84 1.59 6.15 3.61 4.19 7.47 0.97 5.7 4.7 3.56Al2O3 15.5 15.18 15.31 16.65 16.17 15.02 17.28 16.08 17.03 17.37 16.9 16.55Cr2O3 0.64 0.72 0.79 0.05 0.18 0.04 0.25 0.06 0.05 0.19 0.05 0.29FeOt 11.2 10.81 13.79 12.77 19.39 21.08 20.79 22.35 16.11 22.02 21.18 19.91MnO 0.15 0.12 0.00 0.01 0.16 0.00 0.06 0.12 0.07 0.17 0.03 0.03MgO 16.07 17.03 14.47 18 8.72 11.49 8.25 6.57 14.12 7.42 7.94 9.27CaO 0.03 0.00 0.00 0.02 0.00 0.16 0.06 0.00 0.00 0.00 0.08 0.04Na2O 0.51 0.5 0.46 0.51 0.24 0.1 0.2 0.1 0.22 0.2 0.28 0.32K2O 7.79 8.26 8.34 6.41 8.19 7.45 9.39 9.52 9.44 9.09 8.51 8.98F 0.62 1.09 0.55 1.86 0.21 0.43 0.31 0.00 0.00 0.07 0.15 0.4Cl 0.00 0.02 0.02 0.07 0.14 0.1 0.35 0.18 0.00 0.31 0.29 0.25Sum 93.5 95.52 93.83 97.36 94.05 95.07 96.17 95.85 95.24 97.22 93.18 94.54
Si 5.554 5.562 5.462 5.565 5.334 5.447 5.354 5.195 5.576 5.267 5.208 5.378AlIV 2.446 2.438 2.538 2.435 2.666 2.553 2.646 2.805 2.424 2.733 2.792 2.622
AlVI 0.264 0.159 0.18 0.335 0.28 0.156 0.465 0.143 0.582 0.377 0.371 0.404Ti 0.396 0.379 0.435 0.169 0.715 0.415 0.481 0.874 0.109 0.651 0.561 0.415Cr 0.075 0.083 0.094 0.006 0.022 0.005 0.03 0.007 0.006 0.023 0.006 0.036Mg 3.553 3.684 3.249 3.787 2.009 2.621 1.879 1.523 3.152 1.68 1.879 2.143Fe2þ 1.389 1.312 1.737 1.508 2.507 2.698 2.656 2.907 2.018 2.797 2.813 2.583Mn 0.019 0.015 0.000 0.001 0.021 0.000 0.008 0.016 0.009 0.022 0.004 0.004Ca 0.005 0.000 0.000 0.003 0.000 0.026 0.01 0.000 0.000 0.000 0.014 0.007Na 0.147 0.141 0.134 0.14 0.072 0.03 0.059 0.03 0.064 0.059 0.086 0.096K 1.474 1.529 1.603 1.154 1.615 1.454 1.83 1.889 1.803 1.761 1.724 1.777F 0.291 0.5 0.262 0.83 0.103 0.208 0.15 0.000 0.000 0.034 0.075 0.196Cl 0.000 0.005 0.005 0.017 0.037 0.026 0.091 0.047 0.000 0.08 0.078 0.066S 15.322 15.302 15.432 15.102 15.241 15.406 15.419 15.389 15.743 15.369 15.458 15.465
XFe 0.28 0.26 0.35 0.28 0.56 0.51 0.59 0.66 0.39 0.62 0.6 0.55
(Continued)
A.
BE
ND
AO
UD
ET
AL
.122

Table 3. Continued
Cordierite
Rock type: Type E Type C Type D Type A Type B
Sample: TD 38 TD 38 Tj 57 Tj 57b Tj 57b TD 67C TD 67C TD 39 TD 39 Tj 56 Tj 56 Tj 130Analysis: 16 47 8 32 35 3 5 99 102 51 72 13Position: /bi /opx /opx /opx /sp /spl /opx /sill /grt
SiO2 49.94 49.95 48.73 49.97 49.22 49.79 49.29 48.41 47.86 48 48.27 49.11TiO2 0.00 0.06 0.00 0.03 0.02 0.01 0.05 0.00 0.00 0.12 0.03 0.01Al2O3 32.66 32.34 32.31 34.12 33.78 34.37 33.5 33.07 33.02 33.52 33.39 33.19MgO 9.75 10.94 8.6 10.78 9.62 10.1 9.02 7.57 6.38 7.21 6.88 7.63FeOt 5.67 4.77 7.96 5.39 6.7 6.13 7.92 10.39 11.77 10.52 10.96 9.31MnO 0.12 0.18 0.22 0.00 0.04 0.05 0.08 0.04 0.13 0.19 0.18 0.18CaO 0.04 0.01 0.04 0.04 0.05 0.05 0.00 0.03 0.07 0.04 0.03 0.06Na2O 0.18 0.19 0.2 0.12 0.12 0.14 0.13 0.08 0.09 0.13 0.12 0.08K2O 0.01 0.08 0.00 0.02 0.01 0.04 0.01 0.00 0.02 0.00 0.00 0.00F 0.00 0.05 0.00 0.08 0.09 0.00 0.00 0.00 0.00 0.09 0.07 0.00Cl 0.01 0.02 0.00 0.00 0.01 0.00 0.01 0.00 0.00 0.00 0.03 0.03Sum 98.38 98.59 98.06 100.55 99.66 100.68 100.01 99.59 99.34 99.82 99.96 99.6
Si 5.072 5.055 5.027 4.967 4.967 4.951 4.98 4.966 4.958 4.925 4.956 5.012Ti 0.000 0.004 0.000 0.002 0.001 0.001 0.004 0.000 0.000 0.009 0.002 0.001Alt 3.91 3.858 3.928 3.998 4.018 4.029 3.989 3.999 4.032 4.054 4.04 3.992Mg 1.476 1.65 1.323 1.598 1.448 1.498 1.358 1.158 0.985 1.103 1.053 1.16Fe2þ 0.482 0.404 0.686 0.448 0.566 0.51 0.67 0.891 1.02 0.903 0.941 0.794Mn 0.01 0.015 0.02 0.000 0.003 0.004 0.007 0.003 0.011 0.016 0.016 0.016Ca 0.004 0.001 0.004 0.004 0.005 0.005 0.000 0.003 0.008 0.004 0.004 0.007Na 0.036 0.038 0.04 0.023 0.024 0.028 0.025 0.016 0.018 0.025 0.023 0.015K 0.001 0.01 0.000 0.002 0.001 0.005 0.001 0.000 0.003 0.000 0.000 0.000F 0.000 0.015 0.000 0.026 0.03 0.000 0.000 0.000 0.000 0.029 0.021 0.000Cl 0.002 0.003 0.000 0.000 0.001 0.000 0.002 0.000 0.000 0.000 0.005 0.005S 10.993 11.053 11.029 11.07 11.066 11.043 11.036 11.041 11.036 11.077 11.061 11.003
XFe 0.25 0.2 0.34 0.22 0.28 0.25 0.33 0.43 0.51 0.45 0.47 0.41
(Continued)
TID
JEN
OU
INE
ME
TA
PE
LIT
ES
EV
OL
UT
ION
123

Table 3. Continued
Garnet
Rock type: Type E Type B Type C Type D Type A
Sample: TD 38 TD 38 TD 38 TD 38 Tj 56 Tj 56 Tj 130 Tj 130 Tj 130 Tj 57 Tj 57 TD 67C TD 67C TD 128 TD 128 TD 63 TD 63Analysis: 43 14 12 6 67 71 2 9 24 8 10 86 27 6 7 57 66Position: in opx ex c r c r in sill c r c r c r c r c r
SiO2 39.75 38.59 39.53 37.73 36.98 37.36 37.25 37.9 37.93 35.87 36.85 39.95 37.36 36.74 38.46 38.05 36.94TiO2 0.07 0.00 0.02 0.03 0.08 0.00 0.04 0.08 0.00 0.12 0.07 0.00 0.06 0.03 0.00 0.03 0.00Al2O3 21.67 21.41 20.99 20.62 22.12 21.75 22.18 21.3 21.35 22.17 21.37 23.02 21.69 21.68 21.76 22.03 21.94Cr2O3 0.41 0.68 0.52 0.28 0.1 0.00 0.02 0.00 0.12 0.04 0.06 0.02 0.00 0.09 0.00 0.02 0.09FeOt 23.65 24.68 23.95 27.81 32.12 35.85 33.56 32.81 34.43 26.71 35.17 24.02 35.49 30.68 34.14 34.57 36.64FeO 23.31 23.92 22.88 26.65 31.36 35.85 32.81 32.06 34.4 24.41 33.84 23.52 34.7 29.51 34.14 34.52 36.64Fe2O3 0.38 0.85 1.19 1.29 0.84 0.00 0.84 0.84 0.03 2.55 1.48 0.56 0.88 1.30 0.00 0.06 0.00MnO 1.73 1.96 1.81 2.87 0.66 1.8 2.02 1.67 2.63 0.29 0.82 0.29 0.98 1.15 3.00 0.92 1.51MgO 10.16 9.87 10.07 7.14 7.09 2.97 5.84 6.3 4.19 11.02 4.88 13.18 4.93 7.36 3.32 5.14 3.00CaO 2.54 2.4 2.74 2.42 0.83 1.00 0.53 0.53 0.59 1.11 1.52 0.85 0.88 1.20 1.02 1.08 0.89Na2O 0.02 0.03 0.03 0.00 0.03 0.05 0.00 0.02 0.03 0.06 0.02 0.01 0.01 0.04 0.00 0.00 0.02K2O 0.02 0.00 0.00 0.00 0.00 0.00 0.02 0.00 0.00 0.03 0.01 0.02 0.02 0.03 0.00 0.00 0.01Sum 100.06 99.71 99.78 99.03 100.09 100.78 101.54 100.7 101.27 97.68 100.92 101.42 101.51 99.13 101.7 101.85 101.04
Si 3.033 2.968 3.033 2.982 2.897 2.986 2.907 2.975 3.000 2.800 2.913 2.958 2.935 2.899 3.039 2.968 2.947AlIV 0.000 0.032 0.000 0.018 0.103 0.014 0.093 0.025 0.000 0.200 0.087 0.042 0.065 0.101 0.000 0.032 0.053AlVI 1.949 1.910 1.899 1.904 1.939 2.035 1.947 1.946 1.991 1.840 1.904 1.968 1.944 1.915 2.027 1.993 2.011Ti 0.004 0.000 0.001 0.002 0.005 0.000 0.002 0.005 0.000 0.007 0.004 0.000 0.004 0.002 0.000 0.002 0.000Cr 0.025 0.041 0.032 0.017 0.006 0.000 0.001 0.000 0.008 0.002 0.004 0.001 0.000 0.006 0.000 0.001 0.006Fe3þ 0.022 0.049 0.069 0.077 0.05 0.000 0.049 0.05 0.002 0.150 0.088 0.031 0.052 0.077 0.000 0.004 0.000Fe2þ 1.487 1.539 1.468 1.762 2.054 2.396 2.141 2.104 2.275 1.594 2.237 1.457 2.28 1.947 2.256 2.252 2.445Mg 1.155 1.131 1.152 0.841 0.828 0.354 0.679 0.737 0.494 1.282 0.575 1.454 0.577 0.865 0.391 0.597 0.357Mn 0.112 0.128 0.118 0.192 0.044 0.122 0.134 0.111 0.176 0.019 0.055 0.018 0.065 0.077 0.201 0.061 0.102Ca 0.208 0.198 0.225 0.205 0.07 0.086 0.044 0.045 0.05 0.093 0.129 0.067 0.074 0.101 0.086 0.09 0.076Na 0.003 0.004 0.004 0.000 0.005 0.008 0.000 0.003 0.005 0.009 0.003 0.001 0.002 0.006 0.000 0.000 0.003K 0.002 0.000 0.000 0.000 0.000 0.000 0.002 0.000 0.000 0.003 0.001 0.002 0.002 0.003 0.000 0.000 0.001S 8.00 8.00 8.00 8.00 8.00 8.00 8.00 8.00 8.00 8.00 8.00 8.00 8.00 8.00 8.00 8.00 8.00
XMg 0.44 0.42 0.44 0.32 0.29 0.13 0.24 0.26 0.18 0.45 0.20 0.50 0.20 0.31 0.15 0.21 0.13
Fe3þ/Fe3þ þ Fe2þ 0.01 0.03 0.04 0.04 0.02 0.00 0.02 0.02 0.00 0.09 0.04 0.02 0.02 0.04 0.00 0.00 0.00
Alm 0.5 0.51 0.5 0.59 0.69 0.81 0.71 0.7 0.76 0.53 0.75 0.49 0.76 0.65 0.77 0.75 0.82Sps 0.04 0.04 0.04 0.06 0.01 0.04 0.04 0.04 0.06 0.01 0.02 0.01 0.02 0.03 0.07 0.02 0.03Gr 0.07 0.07 0.08 0.07 0.02 0.03 0.01 0.01 0.02 0.03 0.04 0.02 0.02 0.03 0.03 0.03 0.03Py 0.39 0.38 0.39 0.28 0.28 0.12 0.23 0.25 0.16 0.43 0.19 0.49 0.19 0.29 0.13 0.2 0.12
(Continued)
A.
BE
ND
AO
UD
ET
AL
.124
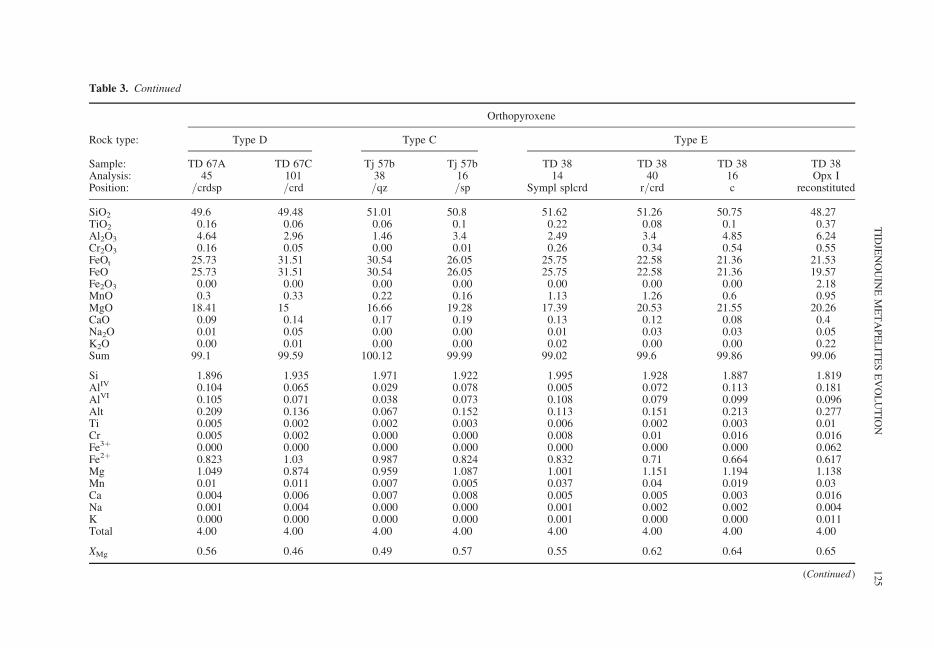
Table 3. Continued
Orthopyroxene
Rock type: Type D Type C Type E
Sample: TD 67A TD 67C Tj 57b Tj 57b TD 38 TD 38 TD 38 TD 38Analysis: 45 101 38 16 14 40 16 Opx IPosition: /crdsp /crd /qz /sp Sympl splcrd r/crd c reconstituted
SiO2 49.6 49.48 51.01 50.8 51.62 51.26 50.75 48.27TiO2 0.16 0.06 0.06 0.1 0.22 0.08 0.1 0.37Al2O3 4.64 2.96 1.46 3.4 2.49 3.4 4.85 6.24Cr2O3 0.16 0.05 0.00 0.01 0.26 0.34 0.54 0.55FeOt 25.73 31.51 30.54 26.05 25.75 22.58 21.36 21.53FeO 25.73 31.51 30.54 26.05 25.75 22.58 21.36 19.57Fe2O3 0.00 0.00 0.00 0.00 0.00 0.00 0.00 2.18MnO 0.3 0.33 0.22 0.16 1.13 1.26 0.6 0.95MgO 18.41 15 16.66 19.28 17.39 20.53 21.55 20.26CaO 0.09 0.14 0.17 0.19 0.13 0.12 0.08 0.4Na2O 0.01 0.05 0.00 0.00 0.01 0.03 0.03 0.05K2O 0.00 0.01 0.00 0.00 0.02 0.00 0.00 0.22Sum 99.1 99.59 100.12 99.99 99.02 99.6 99.86 99.06
Si 1.896 1.935 1.971 1.922 1.995 1.928 1.887 1.819AlIV 0.104 0.065 0.029 0.078 0.005 0.072 0.113 0.181AlVI 0.105 0.071 0.038 0.073 0.108 0.079 0.099 0.096Alt 0.209 0.136 0.067 0.152 0.113 0.151 0.213 0.277Ti 0.005 0.002 0.002 0.003 0.006 0.002 0.003 0.01Cr 0.005 0.002 0.000 0.000 0.008 0.01 0.016 0.016Fe3þ 0.000 0.000 0.000 0.000 0.000 0.000 0.000 0.062Fe2þ 0.823 1.03 0.987 0.824 0.832 0.71 0.664 0.617Mg 1.049 0.874 0.959 1.087 1.001 1.151 1.194 1.138Mn 0.01 0.011 0.007 0.005 0.037 0.04 0.019 0.03Ca 0.004 0.006 0.007 0.008 0.005 0.005 0.003 0.016Na 0.001 0.004 0.000 0.000 0.001 0.002 0.002 0.004K 0.000 0.000 0.000 0.000 0.001 0.000 0.000 0.011Total 4.00 4.00 4.00 4.00 4.00 4.00 4.00 4.00
XMg 0.56 0.46 0.49 0.57 0.55 0.62 0.64 0.65
(Continued)
TID
JEN
OU
INE
ME
TA
PE
LIT
ES
EV
OL
UT
ION
125
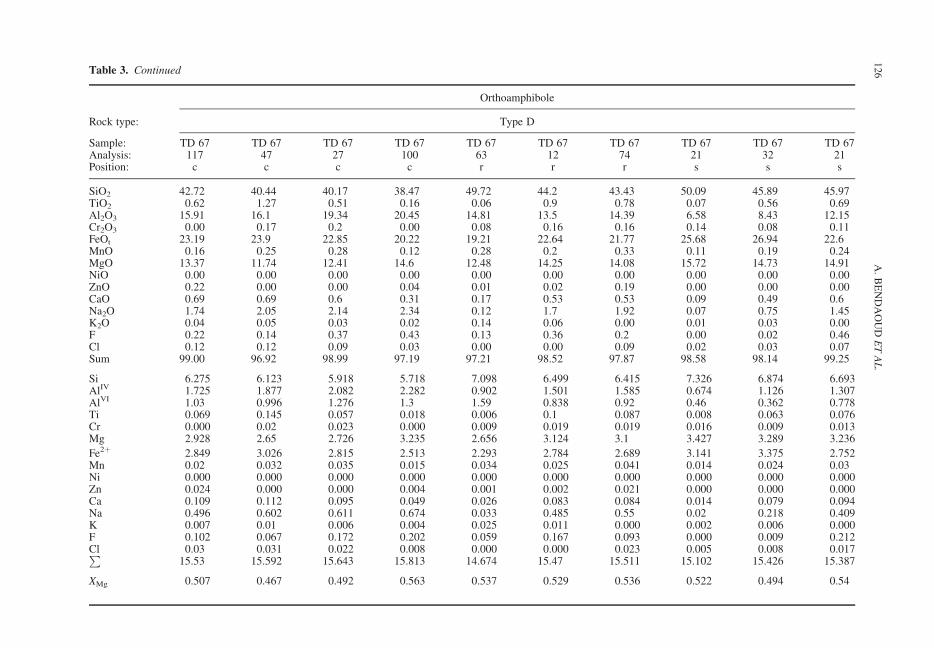
Table 3. Continued
Orthoamphibole
Rock type: Type D
Sample: TD 67 TD 67 TD 67 TD 67 TD 67 TD 67 TD 67 TD 67 TD 67 TD 67Analysis: 117 47 27 100 63 12 74 21 32 21Position: c c c c r r r s s s
SiO2 42.72 40.44 40.17 38.47 49.72 44.2 43.43 50.09 45.89 45.97TiO2 0.62 1.27 0.51 0.16 0.06 0.9 0.78 0.07 0.56 0.69Al2O3 15.91 16.1 19.34 20.45 14.81 13.5 14.39 6.58 8.43 12.15Cr2O3 0.00 0.17 0.2 0.00 0.08 0.16 0.16 0.14 0.08 0.11FeOt 23.19 23.9 22.85 20.22 19.21 22.64 21.77 25.68 26.94 22.6MnO 0.16 0.25 0.28 0.12 0.28 0.2 0.33 0.11 0.19 0.24MgO 13.37 11.74 12.41 14.6 12.48 14.25 14.08 15.72 14.73 14.91NiO 0.00 0.00 0.00 0.00 0.00 0.00 0.00 0.00 0.00 0.00ZnO 0.22 0.00 0.00 0.04 0.01 0.02 0.19 0.00 0.00 0.00CaO 0.69 0.69 0.6 0.31 0.17 0.53 0.53 0.09 0.49 0.6Na2O 1.74 2.05 2.14 2.34 0.12 1.7 1.92 0.07 0.75 1.45K2O 0.04 0.05 0.03 0.02 0.14 0.06 0.00 0.01 0.03 0.00F 0.22 0.14 0.37 0.43 0.13 0.36 0.2 0.00 0.02 0.46Cl 0.12 0.12 0.09 0.03 0.00 0.00 0.09 0.02 0.03 0.07Sum 99.00 96.92 98.99 97.19 97.21 98.52 97.87 98.58 98.14 99.25
Si 6.275 6.123 5.918 5.718 7.098 6.499 6.415 7.326 6.874 6.693AlIV 1.725 1.877 2.082 2.282 0.902 1.501 1.585 0.674 1.126 1.307AlVI 1.03 0.996 1.276 1.3 1.59 0.838 0.92 0.46 0.362 0.778Ti 0.069 0.145 0.057 0.018 0.006 0.1 0.087 0.008 0.063 0.076Cr 0.000 0.02 0.023 0.000 0.009 0.019 0.019 0.016 0.009 0.013Mg 2.928 2.65 2.726 3.235 2.656 3.124 3.1 3.427 3.289 3.236
Fe2þ 2.849 3.026 2.815 2.513 2.293 2.784 2.689 3.141 3.375 2.752Mn 0.02 0.032 0.035 0.015 0.034 0.025 0.041 0.014 0.024 0.03Ni 0.000 0.000 0.000 0.000 0.000 0.000 0.000 0.000 0.000 0.000Zn 0.024 0.000 0.000 0.004 0.001 0.002 0.021 0.000 0.000 0.000Ca 0.109 0.112 0.095 0.049 0.026 0.083 0.084 0.014 0.079 0.094Na 0.496 0.602 0.611 0.674 0.033 0.485 0.55 0.02 0.218 0.409K 0.007 0.01 0.006 0.004 0.025 0.011 0.000 0.002 0.006 0.000F 0.102 0.067 0.172 0.202 0.059 0.167 0.093 0.000 0.009 0.212Cl 0.03 0.031 0.022 0.008 0.000 0.000 0.023 0.005 0.008 0.017P
15.53 15.592 15.643 15.813 14.674 15.47 15.511 15.102 15.426 15.387
XMg 0.507 0.467 0.492 0.563 0.537 0.529 0.536 0.522 0.494 0.54
A.
BE
ND
AO
UD
ET
AL
.126

Table 3. Continued
Spinel
Rock type: Type D Type E Type C Type B Type A
Sample: TD 67N TD 67C TD 38 TD 38 TD 38 Tj 57b Tj 57b Tj 56 Tj 56 Tj 130 TD 128 TD 159Analysis: 47 35 27 28 55 6 15 48 75 19 110 10
SiO2 0.02 0.01 2.79 0.11 0.00 0.00 0.03 0.01 0.04 0.00 0.00 0.07TiO2 0.26 0.1 0.74 0.3 0.21 0.08 0.09 0.14 0.2 0.01 0.13 0.02Al2O3 58.76 59.58 29.57 46.78 43.98 60.31 57.9 58.53 58.91 59.28 56.46 61.67Cr2O3 0.93 0.16 24.86 13.42 16.13 0.08 0.15 0.00 0.06 0.17 0.00 0.00Fe2O3 2.41 2.17 0.00 2.24 0.16 2.64 3.07 2.42 1.09 1.40 3.61 0.00MgO 7.24 5.53 1.96 6.51 5.99 8.08 4.78 3.64 3.12 3.80 4.15 0.04FeO 30.47 33.14 34.94 27.8 27.66 29.00 33.41 35.55 36.64 35.37 33.83 36.78MnO 0.00 0.12 0.76 0.55 0.34 0.00 0.16 0.1 0.21 0.38 0.33 0.02ZnO n.a. 0.08 n.a. n.a. n.a. 0.45 0.38 0.2 0.08 0.01 n.a. n.a.CaO 0.02 0.00 0.35 0.21 0.00 0.03 0.00 0.00 0.01 0.00 0.00 0.00Na2O 0.01 0.00 0.12 0.05 0.07 0.00 0.01 0.05 0.00 0.00 0.00 0.00K2O 0.00 0.00 0.00 0.16 0.00 0.01 0.00 0.00 0.00 0.00 0.02 0.00Sum 100.13 100.91 96.65 98.28 95.39 100.67 100.03 100.63 100.38 100.55 98.53 98.6
Si 0.001 0.000 0.092 0.003 0.000 0.000 0.001 0.000 0.001 0.000 0.000 0.002Ti 0.005 0.002 0.018 0.007 0.005 0.002 0.002 0.003 0.004 0.001 0.003 0.000Al 1.918 1.947 1.145 1.626 1.598 1.941 1.926 1.945 1.964 1.964 1.917 2.076Cr 0.02 0.003 0.646 0.313 0.393 0.002 0.003 0.000 0.001 0.004 0.000 0.000Fe3þ 0.05 0.045 0.000 0.05 0.004 0.054 0.065 0.051 0.023 0.030 0.078 0.000Mg 0.299 0.229 0.096 0.286 0.275 0.329 0.201 0.153 0.132 0.159 0.178 0.002Fe2þ 0.706 0.768 0.96 0.686 0.713 0.662 0.789 0.838 0.867 0.831 0.815 0.879Mn 0.000 0.003 0.021 0.014 0.009 0.000 0.004 0.002 0.005 0.009 0.008 0.000Zn 0.002 0.009 0.008 0.004 0.002 0.002Ca 0.001 0.000 0.012 0.007 0.000 0.001 0.000 0.000 0.000 0.000 0.000 0.000Na 0.001 0.000 0.008 0.003 0.004 0.000 0.000 0.003 0.000 0.000 0.000 0.000K 0.000 0.000 0.000 0.006 0.000 0.000 0.000 0.000 0.000 0.000 0.001 0.000Sum 3.000 3.001 3.057 3.016 3.081 3.000 3.003 3.000 3.001 3.000 3.000 2.959
XFe2þ 0.7 0.77 0.91 0.71 0.72 0.67 0.8 0.85 0.87 0.839 0.82 1
(Continued)
TID
JEN
OU
INE
ME
TA
PE
LIT
ES
EV
OL
UT
ION
127

Table 3. Continued
Plagioclase
Rock type: Type A Type B Type C Type D Type E
Sample: TD 63 TD 63 Tj 56 Tj 57b Tj 59 TD 67C TD 67C TD 67C TD 67C TD 38 TD 38 TD 38 TD 38Analysis: 45 61 74 17 56 75 43 26 44 17 25 17 21Position: s s /Qtz /Qtz opxcrdspl s s exsol matrix
SiO2 60.37 61.46 56.2 45.01 62.34 62.16 59.84 56.76 43.78 45.86 48.72 54.97 55.06TiO2 0.09 0.00 0.02 0.01 0.01 0.02 0.03 0.00 0.07 0.08 0.05 0.00 0.01Al2O3 26 25.2 26.49 36.13 25.31 24.45 25.69 28.31 35.86 34.03 32.56 28.19 28.86Cr2O3 0.00 0.00 0.00 0.05 0.03 0.00 0.09 0.06 0.00 0.00 0.16 0.04 0.00Fe2O3 0.00 0.00 0.00 0.00 0.00 0.00 0.00 0.00 0.00 0.00 0.00 0.00 0.00MgO 0.02 0.00 0.01 0.00 0.02 0.03 0.00 0.00 0.02 0.03 0.02 0.18 0.00FeO 0.00 0.11 0.22 0.34 0.12 0.05 0.39 0.41 0.37 0.44 0.48 0.82 0.37MnO 0.00 0.03 0.07 0.03 0.01 0.00 0.02 0.00 0.00 0.00 0.07 0.04 0.00CaO 6.55 6.01 8.76 19 5.89 5.28 6.9 9.73 19.25 17.89 15.85 10.89 11.54Na2O 7.68 7.96 7.02 0.48 7.81 8.79 7.52 6.05 0.76 1.12 2.21 5.1 5.11K2O 0.21 0.37 0.04 0.00 0.23 0.34 0.11 0.12 0.02 0.05 0.02 0.06 0.04Sum 101 101.18 98.89 101.06 101.77 101.17 100.65 101.52 100.14 99.6 100.15 100.28 101.09
Si 2.661 2.702 2.558 2.056 2.716 2.731 2.654 2.518 2.027 2.124 2.228 2.478 2.463Ti 0.003 0.000 0.001 0.000 0.000 0.001 0.001 0.000 0.002 0.003 0.002 0.000 0.000Al 1.351 1.306 1.421 1.946 1.299 1.266 1.343 1.48 1.957 1.858 1.755 1.498 1.522Cr 0.000 0.000 0.000 0.002 0.001 0.000 0.003 0.002 0.000 0.000 0.006 0.001 0.000Fe3þ 0.000 0.000 0.000 0.000 0.000 0.000 0.000 0.000 0.000 0.000 0.000 0.000 0.000Mg 0.001 0.000 0.001 0.000 0.001 0.002 0.000 0.000 0.001 0.002 0.002 0.012 0.000
Fe2þ 0.000 0.004 0.009 0.013 0.004 0.002 0.014 0.015 0.014 0.017 0.018 0.031 0.014Mn 0.000 0.001 0.003 0.001 0.001 0.000 0.001 0.000 0.000 0.000 0.003 0.001 0.000Ca 0.309 0.283 0.427 0.93 0.275 0.249 0.328 0.463 0.955 0.888 0.777 0.526 0.553Na 0.656 0.678 0.62 0.043 0.66 0.749 0.647 0.521 0.068 0.101 0.196 0.446 0.443K 0.012 0.021 0.002 0.000 0.013 0.019 0.006 0.007 0.001 0.003 0.001 0.003 0.002Sum 4.99 5.00 5.04 4.99 4.97 5.02 5.00 5.01 5.03 5.00 4.99 5.00 5.00
Xan 0.32 0.29 0.41 0.956 0.29 0.245 0.334 0.467 0.933 0.895 0.798 0.539 0.554Xab 0.67 0.69 0.59 0.044 0.7 0.736 0.66 0.526 0.067 0.102 0.201 0.457 0.444Xor 0.01 0.02 0.000 0.000 0.01 0.019 0.006 0.007 0.001 0.003 0.001 0.003 0.002
c, core; r, rim; s, symplectite.
A.
BE
ND
AO
UD
ET
AL
.128

Orthopyroxene has the same composition in thegedrite-bearing granulites and metapelites with sec-ondary orthopyroxene (types C and D, Table 3): XFe
ranges between 0.43 and 0.58 (average of 0.50) andAl2O3 from 1.2 to 4.7 wt%; the most aluminousorthopyroxene is found in the symplectites(both the spinelþ cordieriteþ orthopyroxene +plagioclase and the cordieriteþ orthopyroxenesymplectites) and in the orthopyroxene aroundquartz. In sillimanite-free orthopyroxene-bearingmetapelites (type E, Table 3), the orthopyroxenein the symplectites show a XFe around 0.43 andAl2O3 contents between 2 and 3 wt%. Whereexsolution occurs, the primary orthopyroxene ispoorer in Fe (XFe 0.34–0.39) and richer in Al2O3
(3.65–5.8 wt%; Fig. 6). Image analysis and microp-robe scanning (see analytical techniques above)have allowed us to estimate the composition ofthe primary orthopyroxene before exsolution: thetwo methods give similar results with XFe around0.35 and Al2O3 contents close to 6.5 wt%.
Orthoamphibole has a formula based on 23equivalent oxygen-when calculated according toSpear (1980); this method gives the lowest Fe3þ
compatible with stoichiometry, which correspondsto a maximum of Na assigned to the A-site. Thecomposition of the Tidjenouine orthoamphibole ishighly variable (XFe 0.43–0.54, Al2O3 6.58–21.50wt%, Na2O 0.07–2.47 wt%, TiO2 0.02–1.27wt%; type D, Table 3, Fig. 7a and b) but alwayshave enough Al to be considered on the gedrite
side of the gedrite–anthophyllite solid solution.The variability in Al2O3 indicates, however, theabsence of a miscibility gap, suggesting a tempera-ture of crystallization above 600 8C (Spear 1980).The highest Al2O3 and Na2O values are found inthe core of millimetre-sized elongated zonedgrains. Orthoamphibole in symplectites havesimilar compositions to the rims of coarse-grainedgedrite. Several substitutions have taken place(Fig. 8): a substitution of edenitic type (Si21
(Na,K)Aþ2AlIVþ1; the slope of 0.56 in Figure 8
implies also a compensatory Tschermakitic substi-tution in reverse (AlIV21AlVI
21Mgþ1Siþ1). These twosubstitutions correspond to the pargasitic type sub-stitution (Robinson et al. 1971). An additionaltitano-Tschermakitic substitution (Siþ2Mgþ1Ti21
AlIV22) also occurred. These three substitutionsimply that AlIV ¼ A-site occupancyþ (AlVIþFe3þ þ 2Ti) (Robinson et al. 1971; Czarmanske &Wones 1973); indeed, the substitution of Na in theA-Site and Ti in the octohedral site must be com-pensated by the substitution of Al for Si in thetetrahedral sites.
Spinel composition has a large variabilityrelated to the bulk-rock composition: Fe-richhercynite–spinel solid solution in sillimanite-bearingmetapelites (Table 3); Fe-rich (0.82 , XFe , 1)hercynite with nearly no chromite (,0.03%), no Znand Fe3þ in orthopyroxene-free quartz-bearing meta-pelites (type A, Table 3) and corundum-bearing meta-pelites (type B; Table 3); spinel-rich hercynite (noCr, 0.67 , XFe , 0.79) in metapelites with secondaryorthopyroxene and gedrite-bearing rocks (types C andD, Table 3); and ternary solid solution betweenhercynite, chromite and spinel in sillimanite-free orthopyroxene-bearing metapelites (type E,Table 3). The spinel in the symplectites with orthop-yroxene–cordierite–plagioclase–ilmenite–magnetite
00
10
20
30
40
50
60
70
80
0 0.25 0.50 0.75 1.00 1.25 mm
XAlm
XPy
XGrs
XSps
Pl
Pl
Opx + Cr
dGrt
% Mole
Opx
+ C
rd
Fig. 5. Compositional profile across garnet ingedrite-bearing granulites.
0
0.1
0.2
0.3
0 0.2 0.4 0.6 0.8 1
Sillimanite Free Metapelites
Core of primary Opx
Secondary OpxRim of primary Opx
Reconstituted primary Opx
Gedrite bearing granulites
Secondary orthopyroxenebearing Metapelites
Td 57
Td 59
Td 57b
XMg
Alt
Fig. 6. Plot of XMg v. Alt (cations p.f.u.) inorthopyroxene of the orthopyroxene-bearingþmetapelites.
TIDJENOUINE METAPELITES EVOLUTION 129

(Herc55Chr39Sp6, XFe ¼ 0.90) is consistently richer inin Mg and Cr (Cr2O3 ¼ 25.73 wt%) than the spinel incontact with quartz (Herc60Chr26Sp14, XFe ¼ 0.70); inboth cases, Fe3þ is negligible.
Plagioclase is highly variable in composition, buteach given rock type and/or microdomain has itsown characteristics. Plagioclase has a rather constantcomposition in the orthopyroxene-free metapelites(type A, Table 3: An25–34), with the richest. An com-position found in the inclusions in garnet, whereas ithas a highly variable composition in the gedrite-bearing granulites (type D, Table 3): An75–92 in thesymplectites with orthopyroxene and cordierite;An27–47 in contact with quartz at the margin of sym-plectites, and An17–33 when included in quartz andsillimanite. Plagioclase around gedrite is zoned,
showing increasing XAn from the contact withgedrite (An23) towards the periphery (An47). Inthe secondary-orthopyroxene-bearing metapelites(type C, Table 3), the plagioclase in the leucosomeis an unzoned oligoclase (An30) whereas the plagio-clase in the spinel–orthopyroxene–cordierite sym-plectites in fissures in garnet has an almost pureanorthite composition (An95–97). Plagioclase fromsillimanite-free orthopyroxene-bearing metapelites(type E, Table 3) shows large XAn variation accordingto the microdomain: between 0.75 and 0.92 insymplectites; 0.50 and 0.58 in plagioclase exsolvedby orthopyroxene, and 0.45 , XAn , 0.57 inmatrix plagioclase.
Alkali-feldspar displays 60–99 mol% of ortho-clase component.
0
0.2
0.4
0.6
0.8
1(a)
(b)
0 0.2 0.4 0.6 0.8 1 1.2 1.4 1.6 1.8 2 2.2 2.4
AlIV
(Na
+ K
) A
Na-Gedrite
Gedrite
Ideal Gedrite
Anthophyllite
Si
XM
g
0
0.2
0.4
0.6
0.8
1
678
Anthophyllite Gedrite
Ferro-Anthophyllite
Magnesio-Anthophyllite
Ferro-Gedrite
Magnesio-Gedrite
Oam Ist coreOam Ist rimOam II
Fig. 7. Plot of orthoamphibole chemical compositions. (a) (NaþK)A v. AlIV; (b) Si v. XMg, after Leake et al. (1997).
A. BENDAOUD ET AL.130

1 2 3 44
5
6
7
8
0
0.25 0.5 0.75 1 1.25 1.50
0.2
0.4
0.6
0.8
0
0.5 1 1.5 2 2.5 3 3.5 4 4.5 50
0 1 2 3 4
12
13
14
15
16
17
18
19
Ti + 2AlIV
AlIV + AlIV
Ca + A0
2(Na + K)A + AlIV
Na A
+ N
a M4
Si +
Mg
2Si +
Mg
Si
7
8
9
10
11
Oam Ist coreOam Ist rimOam II
(a)
(b)
(c)
(d)
Fig. 8. Orthoamphibole substitutions in gedrite-bearing granulites.
TIDJENOUINE METAPELITES EVOLUTION 131

A. BENDAOUD ET AL.132
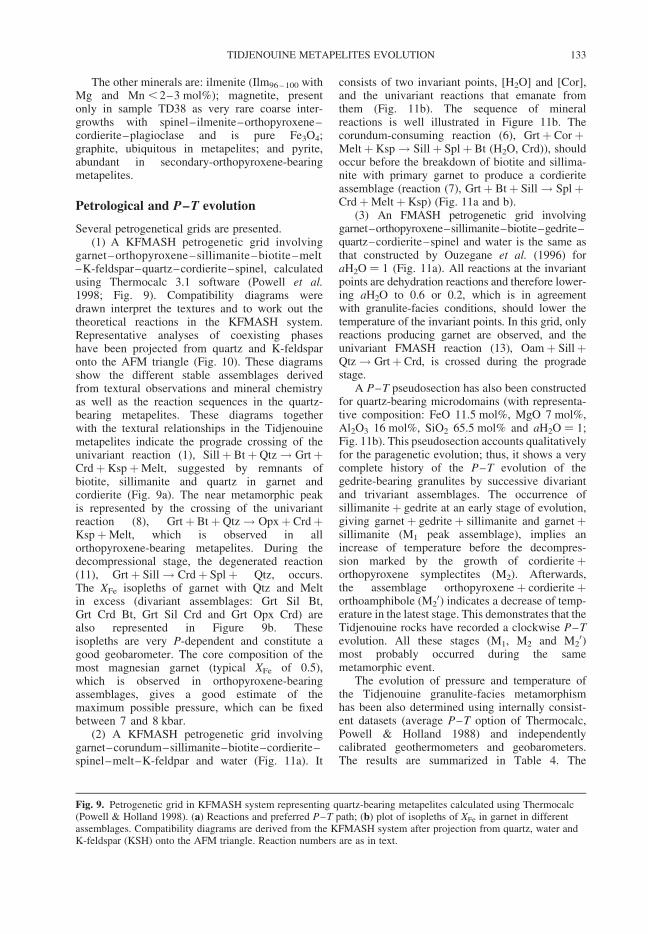
The other minerals are: ilmenite (Ilm96 – 100 withMg and Mn , 2–3 mol%); magnetite, presentonly in sample TD38 as very rare coarse inter-growths with spinel–ilmenite–orthopyroxene–cordierite–plagioclase and is pure Fe3O4;graphite, ubiquitous in metapelites; and pyrite,abundant in secondary-orthopyroxene-bearingmetapelites.
Petrological and P–T evolution
Several petrogenetical grids are presented.(1) A KFMASH petrogenetic grid involving
garnet–orthopyroxene–sillimanite–biotite–melt–K-feldspar–quartz–cordierite–spinel, calculatedusing Thermocalc 3.1 software (Powell et al.1998; Fig. 9). Compatibility diagrams weredrawn interpret the textures and to work out thetheoretical reactions in the KFMASH system.Representative analyses of coexisting phaseshave been projected from quartz and K-feldsparonto the AFM triangle (Fig. 10). These diagramsshow the different stable assemblages derivedfrom textural observations and mineral chemistryas well as the reaction sequences in the quartz-bearing metapelites. These diagrams togetherwith the textural relationships in the Tidjenouinemetapelites indicate the prograde crossing of theunivariant reaction (1), Sillþ BtþQtz! GrtþCrdþKspþMelt, suggested by remnants ofbiotite, sillimanite and quartz in garnet andcordierite (Fig. 9a). The near metamorphic peakis represented by the crossing of the univariantreaction (8), Grtþ BtþQtz! Opxþ CrdþKspþMelt, which is observed in allorthopyroxene-bearing metapelites. During thedecompressional stage, the degenerated reaction(11), Grtþ Sill! Crdþ Splþ Qtz, occurs.The XFe isopleths of garnet with Qtz and Meltin excess (divariant assemblages: Grt Sil Bt,Grt Crd Bt, Grt Sil Crd and Grt Opx Crd) arealso represented in Figure 9b. Theseisopleths are very P-dependent and constitute agood geobarometer. The core composition of themost magnesian garnet (typical XFe of 0.5),which is observed in orthopyroxene-bearingassemblages, gives a good estimate of themaximum possible pressure, which can be fixedbetween 7 and 8 kbar.
(2) A KFMASH petrogenetic grid involvinggarnet–corundum–sillimanite–biotite–cordierite–spinel–melt–K-feldpar and water (Fig. 11a). It
consists of two invariant points, [H2O] and [Cor],and the univariant reactions that emanate fromthem (Fig. 11b). The sequence of mineralreactions is well illustrated in Figure 11b. Thecorundum-consuming reaction (6), Grtþ CorþMeltþKsp! Sillþ Splþ Bt (H2O, Crd)), shouldoccur before the breakdown of biotite and sillima-nite with primary garnet to produce a cordieriteassemblage (reaction (7), Grtþ Btþ Sill! SplþCrdþMeltþKsp) (Fig. 11a and b).
(3) An FMASH petrogenetic grid involvinggarnet–orthopyroxene–sillimanite–biotite–gedrite–quartz–cordierite–spinel and water is the same asthat constructed by Ouzegane et al. (1996) foraH2O ¼ 1 (Fig. 11a). All reactions at the invariantpoints are dehydration reactions and therefore lower-ing aH2O to 0.6 or 0.2, which is in agreementwith granulite-facies conditions, should lower thetemperature of the invariant points. In this grid, onlyreactions producing garnet are observed, and theunivariant FMASH reaction (13), Oamþ SillþQtz! Grtþ Crd, is crossed during the progradestage.
A P–T pseudosection has also been constructedfor quartz-bearing microdomains (with representa-tive composition: FeO 11.5 mol%, MgO 7 mol%,Al2O3 16 mol%, SiO2 65.5 mol% and aH2O ¼ 1;Fig. 11b). This pseudosection accounts qualitativelyfor the paragenetic evolution; thus, it shows a verycomplete history of the P–T evolution of thegedrite-bearing granulites by successive divariantand trivariant assemblages. The occurrence ofsillimaniteþ gedrite at an early stage of evolution,giving garnetþ gedriteþ sillimanite and garnetþsillimanite (M1 peak assemblage), implies anincrease of temperature before the decompres-sion marked by the growth of cordieriteþorthopyroxene symplectites (M2). Afterwards,the assemblage orthopyroxeneþ cordieriteþorthoamphibole (M2
0) indicates a decrease of temp-erature in the latest stage. This demonstrates that theTidjenouine rocks have recorded a clockwise P–Tevolution. All these stages (M1, M2 and M2
0)most probably occurred during the samemetamorphic event.
The evolution of pressure and temperature ofthe Tidjenouine granulite-facies metamorphismhas been also determined using internally consist-ent datasets (average P–T option of Thermocalc,Powell & Holland 1988) and independentlycalibrated geothermometers and geobarometers.The results are summarized in Table 4. The
Fig. 9. Petrogenetic grid in KFMASH system representing quartz-bearing metapelites calculated using Thermocalc(Powell & Holland 1998). (a) Reactions and preferred P–T path; (b) plot of isopleths of XFe in garnet in differentassemblages. Compatibility diagrams are derived from the KFMASH system after projection from quartz, water andK-feldspar (KSH) onto the AFM triangle. Reaction numbers are as in text.
TIDJENOUINE METAPELITES EVOLUTION 133

Fig. 10. Petrogenetic grid in KFMASH system representing quartz-free metapelites, calculated using Thermocalc software (Powell & Holland 1998). (a) Reactions and preferredP–T path; (b) compatibility diagrams derived from the KFMASH system after projection from sillimanite, water, K-feldspar and melt onto the quartz–spinel–hercyniteplane. Reaction numbers are as in text.
A.
BE
ND
AO
UD
ET
AL
.134
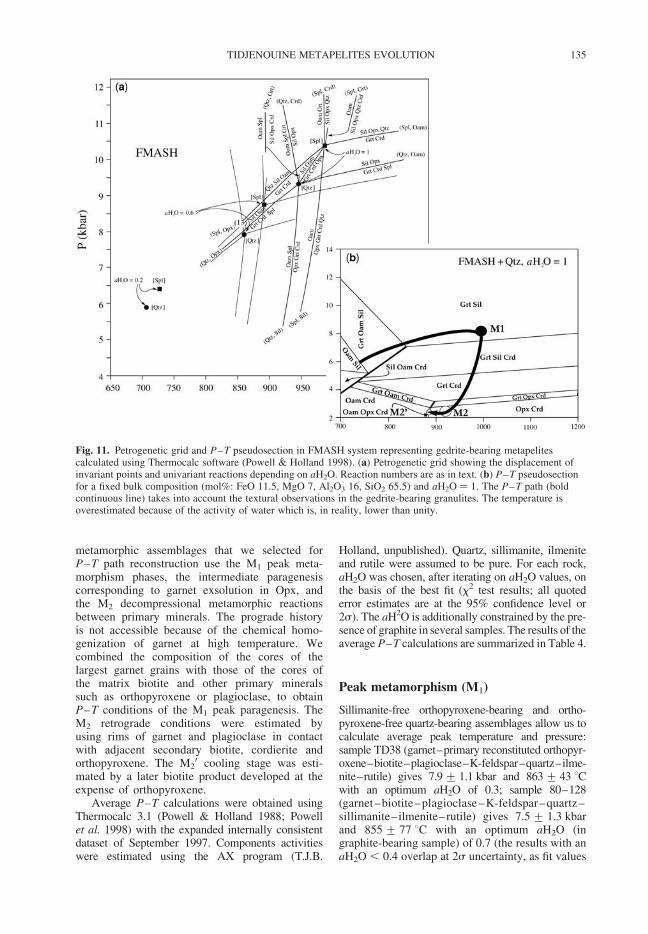
metamorphic assemblages that we selected forP–T path reconstruction use the M1 peak meta-morphism phases, the intermediate paragenesiscorresponding to garnet exsolution in Opx, andthe M2 decompressional metamorphic reactionsbetween primary minerals. The prograde historyis not accessible because of the chemical homo-genization of garnet at high temperature. Wecombined the composition of the cores of thelargest garnet grains with those of the cores ofthe matrix biotite and other primary mineralssuch as orthopyroxene or plagioclase, to obtainP–T conditions of the M1 peak paragenesis. TheM2 retrograde conditions were estimated byusing rims of garnet and plagioclase in contactwith adjacent secondary biotite, cordierite andorthopyroxene. The M2
0 cooling stage was esti-mated by a later biotite product developed at theexpense of orthopyroxene.
Average P–T calculations were obtained usingThermocalc 3.1 (Powell & Holland 1988; Powellet al. 1998) with the expanded internally consistentdataset of September 1997. Components activitieswere estimated using the AX program (T.J.B.
Holland, unpublished). Quartz, sillimanite, ilmeniteand rutile were assumed to be pure. For each rock,aH2O was chosen, after iterating on aH2O values, onthe basis of the best fit (x2 test results; all quotederror estimates are at the 95% confidence level or2s). The aH2O is additionally constrained by the pre-sence of graphite in several samples. The results of theaverage P–T calculations are summarized in Table 4.
Peak metamorphism (M1)
Sillimanite-free orthopyroxene-bearing and ortho-pyroxene-free quartz-bearing assemblages allow us tocalculate average peak temperature and pressure:sample TD38 (garnet–primary reconstituted orthopyr-oxene–biotite–plagioclase–K-feldspar–quartz–ilme-nite–rutile) gives 7.9+ 1.1 kbar and 863+ 43 8Cwith an optimum aH2O of 0.3; sample 80–128(garnet–biotite–plagioclase–K-feldspar–quartz–sillimanite–ilmenite–rutile) gives 7.5 + 1.3 kbarand 855 + 77 8C with an optimum aH2O (ingraphite-bearing sample) of 0.7 (the results with anaH2O , 0.4 overlap at 2s uncertainty, as fit values
Fig. 11. Petrogenetic grid and P–T pseudosection in FMASH system representing gedrite-bearing metapelitescalculated using Thermocalc software (Powell & Holland 1998). (a) Petrogenetic grid showing the displacement ofinvariant points and univariant reactions depending on aH2O. Reaction numbers are as in text. (b) P–T pseudosectionfor a fixed bulk composition (mol%: FeO 11.5, MgO 7, Al2O3 16, SiO2 65.5) and aH2O ¼ 1. The P–T path (boldcontinuous line) takes into account the textural observations in the gedrite-bearing granulites. The temperature isoverestimated because of the activity of water which is, in reality, lower than unity.
TIDJENOUINE METAPELITES EVOLUTION 135

Table 4. Summary of P–T estimates
Geothermometers (8C) Geobarometers (kbar) Thermocalc software Average P–T
Grt–Bt Grt–Opx Opx–Bt Grt–Crd Grt–Sil–Pl–Qtz Grt–Opx–Pl–Qtz Grt–Bt–Pl–Qtz GRIPS Grt–Crd–Sil–Qtz aH2O T P Best fit
PL 83 H 84 S et al. 90 P et al. 85 NH 81 KN 88 NP 82 H 90 (Mg) H 90 (Fe) BL 86 P & al. 85
Peak conditions
Opx-free metapelites 857 + 45 7.35 + 0.7 7.8 + 0.6 7.7 + 0.9 7.2 + 1.2 8 + 0.6
Opx-bearing
metapelites
827 + 34
Sil-free metapelites 798 + 25 855* 850* 8.1 + 1.2 8.7 + 0.5 8.5 + 1.1 8.2 + 0.8 0.3 863 + 43 7.9 + 1.1 0.95
Ged-bearing
granulites
7.9 + 1.2 8.5 + 0.6 7.2 + 0.4
Exsolution
conditions
Sil-free metapelites 812 + 25 800 + 33 6.5 + 1 6.2 + 1.1 6.8 + 0.5 0.2 814 + 38 5.5 + 1.1 0.71
Retrograde
conditions
Opx-free metapelites 705 + 35 695 + 23 4 + 1.2 4.8 + 1.1 4.6 + 1.4 4.2 + 1.3 6.25 + 1.3 4.8 + 1.1
Secondary
Opx-bearing
metapelites
610 + 86 740 + 25 660 + 45 705 + 60 2.9 + 1.1 3.5 + 0.9 3.1 + 1 3 + 1 2.75 + 0.9 4.1 + 1 5.5 + 1 0.1 731 + 98 4.3 + 1.2 1.10
Silfree metapelites 715 + 32 745 + 30 705 + 40 675 + 25 4.1 + 1.1 5.2 + 1.4 4.8 + 1 6 + 1 0.1 697 + 39 4.3 + 0.5 1.32
Ged-bearing
granulites
690 + 43 670 + 55 3 + 1.5 3.1 + 1.3 3.4 + 1.2 5.5 + 0.8 5.3 + 0.9
PL 83, Perchuck & Lavrent’eva (1983); H 84, Harley (1984); S et al. 90, Sengupta et al. (1990); P et al. 85, Perchuck et al. (1985); NH 81, Newton & Haselton (1981); KN 88, Koziol & Newton (1988); NP 82,Newton & Perkins (1982) H 90, Hoisch (1990); BL 86, Bohlen & Liotta (1986).*With reconstituted orthopyroxene.
A.
BE
ND
AO
UD
ET
AL
.136

are outside statistical limits; see other calculationsin Table 4).
Temperatures were calculated for an assumedpressure of 8 kbar, using the garnet–biotite(Perchuck & Lavrent’eva 1983), garnet–ortho-pyroxene (Harley 1984) and orthopyroxene–biotite (Sengupta et al. 1990) geothermometers.The calculated temperatures are around857 + 45 8C, 827 + 34 8C and 798 + 25 8C fororthopyroxene-free quartz-bearing metapelites,secondary-orthopyroxene-bearing metapelites andsillimanite-free orthopyroxene-bearing metapelites,respectively, using the calibration of Perchuk &Lavrent’eva (1983). The temperatures calculatedusing the estimation, by image analysis and micro-probe scanning, of the primary orthopyroxene com-positions before exsolution are around 865 8C(Grt–Opx: Harley 1984) and 848 8C (Bt–Opx:Sengupta et al. 1990).
Pressure estimates were based on the garnet–sillimanite–plagioclase–quartz, garnet–orthopyr-oxene–plagioclase–quartz, garnet–biotite–plagio-clase–quartz and garnet–rutile–ilmenite–plagio-clase–quartz assemblages. All these geobarometersgive a pressure between 7 and 8.5 kbar. The M1
granulite-facies event can thus be set at 800–875 8Cand 7–8.5 kbar (Fig. 12a).
Decompressional (M2) and cooling
evolution (M20)
The P–T conditions of the exsolutions in ortho-pyroxene of sillimanite-free metapelites can be alsocalculated. Orthopyroxene–garnet–plagioclase–biotite–K-feldspar–quartz–ilmenite–rutile assem-blage gives 5.5+ 1.1 kbar and 814+ 38 8C withaH2O ¼ 0.2 (with best results of average P–T ofThermocalc). The later stage is calculated withsample TD38 (sillimanite-free orthopyroxene-bearing metapelites) and sample TD57b (secondaryorthopyroxene-bearing metapelites). Sample TD38contains garnet–orthopyroxene–biotite–plagioclase–spinel–cordierite–quartz–K-feldspar– ilmenite–rutile assemblage and gives 4.3 + 0.5 kbar and697 + 39 8C for an optimum aH2O of 0.1.Sample TD57b is a metapelite in which garnet dis-plays cracks filled with orthopyroxene–spinel–cordierite–plagioclase; this latter assemblagesuggests 4.3 + 1.2 kbar and 731 + 98 8C for an
Metapelite
Garnet Pyroxenite
P kbar
T (°C)600 900
4
6
8
10
8007005002
Ky
And
Sill
SymplectiticStage
TidjenouinePeak of
Metamorphism
Amphibolite (Retrogressed Garnet Pyroxenite)
Amphibolitization
Panafrican reheating ?
P kbar
T (°C)600 900
4
6
8
10
8007005002
Ky
And
Sill
Peak ofMetamorphism12
14
Tin Begane
Symplectitic Stage 2of Garnet Pyroxenite
Symplectitic Stage 1of Garnet Pyroxenite
Amphibolitization
V = 45
V = 42
SymplectiticStage
Peak ofMetamorphism
Panafrican reheating ?
Tamanrasset
Prograde evolution
Biotite+ Silli
manite+ Quartz
==> Grt + Crd+ Melt
and
Grt + Cor + Melt + Ksp==> Sill
+ Spl + Bt
(a)
(b)
Fig. 12. P–T evolution of Tidjenouine metapelites. (a) P–T path; (b) comparison of Tidjenouine metapelitesevolution with the metamorphic evolution of Tamanrasset (Ouzegane et al. 2001) and Tin Begane (Derridj et al. 2003).
TIDJENOUINE METAPELITES EVOLUTION 137

optimum aH2O of 0.1. Results with an aH2O . 0.3for these two samples show fit values outside stat-istical limits. Combination of classical geobarom-eters and geothermometers (Grt–Bt, Grt–Opx,Bt–Opx and Grt–Crd: Table 4) indicates that thelater cooling stage occurred at a pressure of 3–4 kbar and temperatures from 745 to 610 8C (fromM2 to M2
0). However, the lowest temperature maycorrespond to a lower diffusion or to theamphibolitization stage.
These results show a good agreement betweenthe P–T conditions obtained from Thermocalcand those obtained from the calibrated geothermo-meters and geobarometers. The M2 granulite-facies event can thus be estimated at 700 + 50 8Cand 3–4 kbar (Fig. 12a).
The late M3 heating metamorphism
The M20 amphibolite-facies retrogression is evi-
denced by the appearance of anthophyllite in thegedrite granulites and of cummingtonite andbrown–green hornblende in the metabasic rocks.This stage is followed, along the mega-shear zone,by the crystallization of sillimanite in the meta-pelites and by the breakdown of amphibole, ifquartz is present, to orthopyroxene and plagioclase.The recrystallizations are considered as distinctfrom M2 and M2
0 because: (1) sillimanite crosscutssharply the former mineral orientation; (2) theassemblages indicate a reheating compared withthe M2
0 stage at the amphibolite–granulite tran-sition; (3) in contrast to M2 and M2
0, its develop-ment is associated spatially with the Pan-Africanmega-shear zones. This late M3 phase should haveoccurred at c. 650–700 8C. This temperature andthe association with the mega-shear zones suggeststhat this phase could be linked with the Pan-Africanbatholiths, whose emplacement is also associatedwith the mega-shear zones, particularly the Anfegand Tin Amzi batholiths present in the vicinityof the Tidjenouine granulites (Acef et al.2003; Fig. 1c).
Zircon U–Pb ages of the Tidjenouine
granulites
Zircons were hand-picked in alcohol from the leastmagnetic concentrates (18 tilt at full amperage).Selected crystals were then embedded in epoxyresin, ground and polished to expose the internalstructure. They were subsequently observed byback-scattered electron (BSE) imaging using ascanning electron microscope (SEM) at the Univer-sity of Montpellier II. The sample mounts were later
used for U–Th–Pb microanalyses using a LambdaPhysik COMPex 102 excimer laser generating15 ns pulses of radiation at a wavelength of193 nm. For analyses, the laser was coupled to aVG Plasmaquad II ICP-MS and analytical pro-cedures followed those outlined by Bruguier et al.(2001) and described in earlier reports (e.g. Neveset al. 2006). Analyses where acquired during twoanalytical sessions where the spot size of the laserbeam was 26 and 51 mm. Unknowns werebracketed by measurements of the G91500zircon standard (Wiedenbeck et al. 1995), whichwere used for mass bias and inter-element frac-tionation corrections. The calculated bias factorsand their associated errors were then added inquadrature to the errors measured on eachunknown. Accurate common Pb correctionduring laser ablation analyses is difficult toachieve, mainly because of the isobaric interfer-ence of 204Hg with 204Pb. The contribution of204Hg to 204Pb was estimated by measuring the202Hg and assuming a 202Hg/204Hg natural isoto-pic composition of 0.2298. This allows monitoringof the common Pb content of the analysed zircondomain, but corrections often resulted in spuriousages. Analyses yielding 204Pb close to or abovethe limit of detection were thus rejected, and inTable 5 we report only analyses that were foundto contain no common Pb.
Zircons were separated from the TidjenouineTJ5 granulitic-facies orthogneiss, a sample witha simple mineralogy comprising quartz, K-feldspar, plagioclase, biotite, opaque minerals,zircon and apatite. These zircons typicallypresent an internal structure characterized bythree concentric zones (Fig. 13): (1) a centralzone that is most often grey and homogeneousin BSE but sometimes has a faint oscillatoryzoning (e.g. Zr4, Fig. 13); (2) a first rim, brighterin BSE, with a spongy appearance, containingnumerous tiny inclusions of calcite; (3) a secondrim, not always developed, which is homogeneousand grey in BSE and has no inclusions. Mostgrains have rounded terminations but still preservea prismatic shape, suggesting a metamorphic cor-rosion of originally magmatic grains. In addition,a few grains are not prismatic and display moresimple internal structure (Fig. 13, Zr10). Thespongy BSE-bright areas are still zircon and theBSE-dark tiny inclusions are calcite. Thus therehas not been a destabilization of a pre-existingzircon, but a syncrystallization of zircon andcalcite from a melt. This abundance of calcite inthese intermediate zones can be correlated to thegranulitic-facies metamorphism: (1) fluidinclusions linked to the granulitic decompressionstage in the Tamanrasset area are rich in CO2
(Ouzegane et al. 2001); (2) calcite has been
A. BENDAOUD ET AL.138

Table 5. U–Th–Pb LA-ICP-MS results for zircon grains from Tidjenouine granulite TJ5
Sample Pb*(ppm)
U(ppm)
Th(ppm)
Th/U 206Pb/204Pb 208Pb/206Pb 207Pb/206Pb +(1s) 207Pb/235U +(1s) 206Pb/238U +(1s) r Apparent ages (Ma) Disc.
206Pb/238U +(1s) 207Pb/206Pb +(1s)
Spots on the 2151 Ma discordiali02 140 318 244 0.77 159797 0.215 0.13076 0.00045 6.651 0.153 0.36888 0.00838 0.99 2024 39 2108 6 4.0li03 135 306 235 0.77 163551 0.218 0.13418 0.00054 7.000 0.160 0.37830 0.00851 0.98 2068 40 2153 7 4.0li04 30 70 40 0.57 38535 0.159 0.13042 0.00048 6.606 0.170 0.36734 0.00936 0.99 2017 44 2104 6 4.1li07 143 397 170 0.43 174901 0.125 0.12763 0.00044 5.818 0.144 0.33058 0.00811 0.99 1841 39 2066 6 10.9li08 120 251 195 0.78 138113 0.217 0.13445 0.00055 7.260 0.163 0.39165 0.00863 0.98 2130 40 2157 7 1.2li10 112 256 190 0.74 129133 0.213 0.13257 0.00053 6.735 0.079 0.36848 0.00405 0.94 2022 19 2132 7 5.2li16 55 125 73 0.58 62533 0.161 0.13323 0.00054 7.179 0.135 0.39077 0.00716 0.98 2126 33 2141 7 0.7li17 83 326 110 0.34 104594 0.134 0.11517 0.00351 3.727 0.271 0.23472 0.01547 0.91 1359 80 1883 55 27.8li18 81 205 125 0.61 95732 0.169 0.12872 0.00088 6.181 0.085 0.34826 0.00414 0.87 1926 20 2081 12 7.4li24 52 126 70 0.56 60632 0.158 0.13232 0.00089 6.743 0.095 0.36960 0.00457 0.88 2028 21 2129 12 4.8qs02 48 219 77 0.35 326906 0.148 0.11281 0.00275 3.086 0.155 0.19842 0.00872 0.87 1167 47 1845 44 36.8qs03 24 93 24 0.26 220634 0.094 0.11711 0.00067 4.008 0.084 0.24820 0.00501 0.96 1429 26 1913 10 25.3qs04 85 274 148 0.54 506884 0.187 0.12378 0.00085 4.664 0.142 0.27324 0.00812 0.97 1557 41 2011 12 22.6qs05 53 123 76 0.62 333740 0.194 0.13127 0.00118 6.735 0.156 0.37210 0.00792 0.92 2039 37 2115 16 3.6qs07 61 200 74 0.37 400226 0.117 0.12274 0.00052 4.739 0.132 0.28004 0.00772 0.99 1592 39 1996 8 20.3qs08 45 114 56 0.49 319632 0.170 0.12940 0.00111 6.227 0.102 0.34900 0.00490 0.85 1930 23 2090 15 7.7qs09 90 204 158 0.78 512480 0.222 0.13427 0.00034 7.258 0.134 0.39205 0.00716 0.99 2132 33 2155 4 1.0qs10 95 220 158 0.72 599168 0.216 0.13117 0.00079 6.711 0.056 0.37109 0.00216 0.69 2035 10 2114 11 3.7qs11 55 128 80 0.62 280694 0.187 0.13436 0.00026 7.346 0.204 0.39653 0.01101 1.00 2153 51 2156 3 0.1qs12 83 193 132 0.68 474308 0.190 0.13120 0.00091 6.731 0.109 0.37208 0.00547 0.90 2039 26 2114 12 3.5qs15 62 148 90 0.61 418714 0.168 0.13313 0.00067 6.904 0.077 0.37612 0.00378 0.89 2058 18 2140 9 3.8qs16 47 128 60 0.47 249846 0.146 0.12741 0.00034 5.891 0.068 0.33532 0.00377 0.97 1864 18 2063 5 9.6qs17 71 191 117 0.61 388996 0.183 0.12971 0.00061 5.931 0.195 0.33162 0.01078 0.99 1846 52 2094 8 11.8qs19 80 181 104 0.58 470528 0.162 0.13112 0.00104 7.103 0.161 0.39294 0.00836 0.94 2136 39 2113 14 21.1qs20 76 178 127 0.71 413632 0.209 0.13150 0.00083 6.797 0.058 0.37486 0.00214 0.67 2052 10 2118 11 3.1qs22 81 221 115 0.52 513796 0.157 0.13138 0.00207 5.176 0.171 0.28575 0.00917 0.97 1620 46 2116 28 23.4qs24 87 223 138 0.62 493368 0.186 0.12958 0.00092 6.228 0.145 0.34859 0.00775 0.95 1928 37 2092 12 7.9qs25 39 130 75 0.58 235016 0.176 0.12503 0.00061 4.729 0.052 0.27429 0.00267 0.89 1563 13 2029 9 23.0qs27 3 24 1 0.04 30015 0.076 0.09180 0.00190 1.595 0.101 0.12602 0.00755 0.94 765 43 1463 39 47.7qs28 72 181 112 0.62 435708 0.200 0.13130 0.00144 6.202 0.255 0.34255 0.01356 0.96 1899 65 2115 19 10.2qs29 59 174 83 0.48 365896 0.163 0.12718 0.00096 5.318 0.226 0.30325 0.01270 0.98 1707 63 2059 13 17.1qs31 124 309 238 0.77 631400 0.226 0.13247 0.00059 6.238 0.088 0.34155 0.00456 0.95 1894 22 2131 8 11.1qs32 87 243 151 0.62 460598 0.186 0.12991 0.00209 5.585 0.217 0.31182 0.01102 0.91 1750 54 2097 28 16.6
(Continued)
TID
JEN
OU
INE
ME
TA
PE
LIT
ES
EV
OL
UT
ION
139

Table 5. Continued
Sample Pb*(ppm)
U(ppm)
Th(ppm)
Th/U 206Pb/204Pb 208Pb/206Pb 207Pb/206Pb +(1s) 207Pb/235U +(1s) 206Pb/238U +(1s) r Apparent ages (Ma) Disc.
206Pb/238U +(1s) 207Pb/206Pb +(1s)
qs33 41 98 42 0.43 217364 0.118 0.13169 0.00121 6.881 0.136 0.37902 0.00666 0.89 2072 31 2121 16 2.3qs34 64 274 97 0.35 336960 0.164 0.12129 0.00131 3.652 0.074 0.21839 0.00377 0.85 1273 20 1975 19 35.5qs35 122 295 199 0.68 560518 0.192 0.13123 0.00052 6.910 0.072 0.38190 0.00373 0.93 2085 18 2115 7 1.4
Spots on the 2062 Ma discordiali01 45 314 42 0.13 65431 0.047 0.07952 0.00069 1.683 0.185 0.15346 0.01682 1.00 920 93 1185 17 22.3li05 51 230 55 0.24 78852 0.058 0.10386 0.00222 3.179 0.186 0.22198 0.01206 0.93 1292 63 1694 39 23.7li06 88 743 30 0.04 126845 0.016 0.07834 0.00057 1.326 0.022 0.12274 0.00178 0.89 746 10 1155 14 35.4li09 36 135 38 0.28 47865 0.083 0.11461 0.00179 4.124 0.202 0.26097 0.01209 0.95 1495 62 1874 28 20.2li11 79 643 17 0.03 111001 0.015 0.08021 0.00038 1.425 0.028 0.12883 0.00250 0.97 781 14 1202 9 35.0li12 85 666 19 0.03 115340 0.024 0.08773 0.00042 1.686 0.058 0.13941 0.00472 0.99 841 27 1377 9 38.9li19 31 130 51 0.39 37315 0.149 0.10696 0.00230 3.289 0.179 0.22299 0.01112 0.92 1298 58 1748 39 25.8qs06 91 221 145 0.66 521178 0.203 0.12592 0.00097 6.222 0.062 0.35837 0.00229 0.64 1974 11 2042 14 3.3qs14 8 50 4 0.08 83814 0.069 0.08833 0.00145 2.027 0.038 0.16645 0.00146 0.47 993 8 1390 32 28.6qs18 73 204 72 0.35 441820 0.113 0.12675 0.00059 5.953 0.091 0.34065 0.00496 0.95 1890 24 2053 8 8.0qs21 61 199 83 0.42 369426 0.111 0.11877 0.00068 4.679 0.117 0.28573 0.00693 0.97 1620 35 1938 10 16.4qs23 68 181 32 0.18 450526 0.076 0.12713 0.00093 6.437 0.106 0.36724 0.00542 0.90 2016 25 2059 13 2.1qs30 72 193 86 0.44 468496 0.131 0.12402 0.00136 5.843 0.227 0.34169 0.01274 0.96 1895 61 2015 19 6.0
Spots on the concordia at 614 Mali15 10 105 1 0.01 13132 0.006 0.06081 0.00086 0.848 0.052 0.10108 0.00598 0.97 621 35 633 31 1.9li13 9 102 1 0.01 12645 0.006 0.06032 0.00058 0.836 0.018 0.10052 0.00190 0.89 617 11 615 21 20.4li21 8 89 1 0.02 11241 0.006 0.06066 0.00048 0.835 0.017 0.09982 0.00190 0.92 613 11 627 17 2.2li14 11 120 2 0.01 15700 0.005 0.06004 0.00093 0.826 0.044 0.09982 0.00506 0.96 613 30 605 34 21.4qs13 6 65 1 0.01 41346 0.011 0.06146 0.00182 0.831 0.030 0.09801 0.00194 0.56 603 11 655 64 8.0qs1 5 55 1 0.01 34388 0.018 0.06179 0.00048 0.840 0.018 0.09865 0.00197 0.93 606 12 667 17 9.0
A.
BE
ND
AO
UD
ET
AL
.140

Fig. 13. Texture of the dated Tidjenouine zircon using SEM (back-scattered electrons). White circles indicate thelocation of spot analyses. Ages indicated are the discordia or concordia ages shown Figure 14. ‘% disc.’ givesthe degree of discordance of the considered spot. ‘Spongy’ areas are made of zircon with tiny inclusions of apatite. Incrystal Zr6, there is one spot on a central grey zone with an age of 2062 Ma: this is attributed to the presence ofthe spongy zone present very close to the spot just below the analysed surface. This is just visible on close inspection ofthe picture.
TIDJENOUINE METAPELITES EVOLUTION 141

described as a granulitic metamorphic phase in thesame area (Ouzegane 1981); (3) the presence ofCa-rich minerals (Ca-plagioclase, apatite) in mel-anosome in the Tidjenouine granulite-facies mig-matite suggests that Ca was in excess during thegranulitic migmatitization. This means that theseinclusion-rich zones should be related to thegranulite-facies migmatitic event.
Sixty spots have been analysed on these zircons.They show a broad alignment from c. 2100 Ma toc. 600 Ma. When considering these results and therelation between ages and the different zircondomains (Fig. 14), the following patterns arise.
(1) Thirty-four spots in central grey zonesdefine a discordia line with an upper interceptof 2144 + 9 Ma and a lower intercept of597 + 27 Ma (2s, MSWD ¼ 1.5). Among theseanalyses, five concordant spots provide a slightlyolder but consistent age of 2151 + 8 Ma (2s, fivezircons, MSWD ¼ 1.5). We consider this last ageas the best estimate for the crystallization of these
central zones. Th/U ratios of this group varybetween 0.78 and 0.43 for spots with 206Pb/238Uages above 1700 Ma, those with younger206Pb/238U ages having ratios between 0.58and 0.26.
(2) Thirteen spots in spongy intermediate zonesdefine a discordia line with an upper interceptof 2062 + 39 Ma and a lower interceptof 681 + 63 Ma (2s, MSWD ¼ 4.1); there are notrue concordant spots in this group but four spotshave only a slight discordance below 8%: theirmean 207Pb/206Pb age is 2049 + 22 Ma; Th/Uratios of this group vary between 0.66 and 0.24for spots with 206Pb/238U ages above 1200 Ma,those with 206Pb/238U ages below 1000 Mahaving ratios between 0.03 and 0.13. We note thatthe U and Pb concentrations in these analyses arenot significantly different from those of the firstgroup (Table 5), indicating that the calciteinclusions present in these zones do not interferein these analyses, as we would expect.
Fig. 14. Zircon U–Pb concordia diagrams showing concordia and discordia ages: the grey ellipses correspond tothe zircon grey central zones, the hatched ellipses to the zircon ‘spongy’ zones; within the inset, the ellipses correspondto single zircons not displaying the corona texture of most of the Tidjenouine zircons (grey: used in the calculation;white: not used (for calculation including that spot, see text); black: result of the concordia age calculation).
A. BENDAOUD ET AL.142
(3) Five spots obtained in the non-prismaticcore-free zircons are concordant close to the pre-vious discordia lower intercepts and a sixth one isnearly concordant. Our best estimate for this batchof analyses is 614 + 11 Ma (five zircons,MSWD ¼ 0.71). Their Th/U ratios are very low,between 0.01 and 0.02. The outer rims displayedby some zircons were too thin to be analysed bythe laser ablation technique but we propose thehypothesis that a similar Pan-African age wouldhave been acquired on these zones. Finally twospots are slightly below the two discordias andhave not been included in the age calculations.
The oldest age of 2151 + 8 Ma has been deter-mined on central parts of the grains, some ofwhich are zoned and characteristic of a magmaticcrystallization. This age is thus attributed to themagmatic protolith of the granulite. The slightlyyounger age of 2062 + 39 Ma is questionable, asit has been calculated from discordant analysessampling the intermediate coronas linked to thegranulitic migmatitic event (M1 and M2 phase).The location of these data points on the left ofthe c. 2.15–0.60 Ga discordia line indicates thatthese zones have undergone U–Pb disturbances,at some times in the past, between these twoages. The limited degree of discordance of someof these analyses (,10%) is taken as evidencefor a Palaeoproterozoic age for this event. Thiswould imply that both the prograde M1 and retro-grade M2 metamorphic phases are Eburnean inage and most probably correspond to one meta-morphic path. A younger age (i.e. Neoprotero-zoic) for the granulitic event cannot be strictlyruled out in the absence of concordant analysesbut is unlikely: in this case, the spots acquiredon the intermediate zones should lie on a discordialine pointing to c. 2.15 Ga and not as much to theleft. The rare independent crystals unzoned andunaffected by the reaction coronas are dated at614 + 11 Ma, an age that can probably beapplied to the thin external rims of most zircons.This age corresponds to that of the intrusionof the neighbouring granitic batholiths suchas the Anfeg batholith (608 + 7 Ma; U–Pbzircon, Bertrand et al. 1986, recalculated byLiegeois et al. 2003) and thus to the M3 thermalmetamorphic phase, which is thus Pan-Africanin age. The fact that this phase was the most effec-tive in lowering the Th/U ratio indicates thatduring the Pan-African M3 metamorphism, onlysolid-state reactions occurred, whereas meltswere produced during the Eburnean M1 –M2
granulite-facies migmatitic event, the loweringof the Th/U ratio being favoured by metamorphicfluids (Williams et al. 1996), which probablyeased the exchange of Th between zircon andminerals such as monazite.
Discussion and conclusion
In several areas of the Laouni terrane, observedgranulitic formations are commonly associatedwith an important migmatitic event. The texturalrelationships and the P–T estimates suggest thatthe beginning and maintenance of melt productionoccurred during the prograde metamorphic evol-ution (M1) culminating at 850 8C and 7.5 kbar. Alarge part of the retrograde evolution (M2) downto 700 8C and 4 kbar, also occurred under granulite-facies conditions: the presence of early, stronglyrestitic granulites (corundum metapelites earlierthan the garnet–sillimanite–biotite metamorphicpeak) indicates that migmatitization was alreadyimportant before the M1 climax and some meltwas also produced during the late breakdown ofbiotite (M2). The M2 stage evolved eventually toan M2
0 phase in the amphibolite facies at 600 8C,which is evidenced by some late minerals such asanthophyllite, secondary biotite and cummingto-nite, depending on the rock type. This granuliticmetamorphism is Eburnean (2062 + 39 Ma). Thisclockwise retrograde P–T segment is similar tothat constructed using a variety of different rocktypes (metapelitic and metabasic rocks) from thebasement of the Laouni terrane (Ouzegane et al.2001; Bendaoud et al. 2003; Derridj et al. 2003).During this evolution aH2O generally decreased,probably because of absorption of H2O in anatecticmelts, preserving most of the granulite-facies para-geneses (M2
0 is local).Our petrological and thermobarometric study
indicates a clockwise P–T path marked by adecompression stage generating spectacular coroni-tic and symplectitic textures in both the para- andortho-derived metamorphic units. The successionof parageneses during this decompression dependson the chemical composition of the rocks. In Tidje-nouine, the metapelites and the microdomains richin Si and Mg are characterized by the appearanceof an orthopyroxene–cordierite association at theexpense of garnet, quartz and biotite, in theabsence of sillimanite. On the other hand, the meta-pelites and the microdomains rich in Al and Fedisplay the spinel–cordierite assemblage, withoutorthopyroxene, following the destabilization ofgarnet, sillimanite and biotite. The occurrence ofsillimanite inclusions in the core of primary garnetin quartz-bearing metapelites confirms that thismineral was present during the prograde stage.
The peak pressures obtained at Tamanrasset(10 kbar: Ouzegane et al. 2001) and at TinBegane (12 kbar: Derridj et al. 2003) are higherthan those obtained in the study area (7–8 kbar).This can be related to different exposed crustallevels (Bendaoud et al. 2004). Coupled with theobservation of the abundance of often subhorizontal
TIDJENOUINE METAPELITES EVOLUTION 143

shear zones, this suggests that the LATEA micro-continent is composed of a series of Eburneannappes, probably resulting from a collisionalorogeny. It is thus possible that the shear zonesinterpreted as Pan-African in age (Bertrand et al.1986) were initiated during the Eburnean orogenyand reactivated during the Pan-African orogeny.More work is needed to assess this hypothesis.The age of the protolith of the dated sample(2151 + 8 Ma) is thus probably related to a pre-collisional event such as a subduction regime. NoArchaean age is recorded here as in the otherregions of the southern LATEA (Bertrand et al.1986; Barbey et al. 1989); Archaean ages are cur-rently only known in the Gour Oumelalen region(NE LATEA; Peucat et al. 2003; Fig. 1). Thiscould suggest the existence of an Archaean conti-nent to the NE involved to the SW in a collisionalorogeny with a Palaeoproterozoic terrane, butmore geochronological, metamorphic and geo-chemical data are needed to proceed in thisinterpretation. We can point that the Eburneangranulitic metamorphism in the Archaean GourOumelalen area is younger (c. 1900 Ma; Peucatet al. 2003) than in SW LATEA (c. 2100 Ma;Barbey et al. 1989; this study). The geodynamicunderstanding of the Eburnean evolution ofHoggar is still in its infancy.
The age of 614 + 11 Ma obtained on singleunzoned zircons and the large discordance ofmany Eburnean zircons indicate that the effect ofthe Pan-African orogeny was important inLATEA although the Eburnean granulite-faciesparageneses are well preserved. Similar ageshave been obtained on the Telohat migmatites(609 + 17 Ma; U–Pb zircon lower intercept;Barbey et al. 1989). The Pan-African event ismarked by the M3 thermal metamorphism(650 8C; 3–4 kbar) that led to the destabilizationof the amphibole in the metabasic rocks and prob-ably of the biotite in the metapelites, and allowedthe crystallization of a new generation of sillima-nite not linked to the M1–M2 metamorphicphase, as postulated by Caby (2003). The M3 meta-morphism is synchronous with the largePan-African batholiths such as the Anfeg batholith(608 + 7 Ma: U–Pb zircon, Bertrand et al. 1986,recalculated by Liegeois et al. 2003); these inturn are synchronous with the development of thelarge shear zones characteristic of the Tuaregshield (Fig. 1). These batholiths are rooted in thesubvertical major shear zones and were emplacedas sheets along reactivated pre-existing subhori-zontal shear zones (Acef et al. 2003; Liegeoiset al. 2003). We can here confirm the pre-existenceof these subhorizontal shear zones, to whichwe attribute an initial Eburnean age on the basisof the above petrological results linked to
the dated c. 2060 Ma granulitic-facies metamor-phism. True dating of these shear zones remainsto be done.
These findings shed light on the LATEAPan-African metacratonic evolution (Liegeoiset al. 2003): the LATEA microcontinent wasmainly built during the Eburnean orogeny, whichgenerated a regional granulite-facies metamorph-ism, and became a craton by lithospheric thicken-ing (Black & Liegeois 1993) during theMesoproterozoic, a quiet period for LATEA (noMesoproterozoic events are recorded in centralHoggar) as for most of West Africa. This rigid cra-tonic behaviour allowed LATEA to become amal-gamated with several Neoproterozoic island arcs(Liegeois et al. 2003): the Iskel terrane at870–850 Ma (Caby et al. 1982), and the TinBegane unit at c. 685 Ma (Liegeois et al. 2003)among others, which are not yet dated. Theseaccretion events are not recorded in the Tidje-nouine granulites. The main Pan-African orogenicphase is characterized by large horizontal move-ments along mega-shear zones and the intrusionof granitoid batholiths in the 620–580 Maage range (Bertrand et al. 1986; Caby &Andreopoulos-Renaud 1989; Black et al. 1994;Liegeois et al. 1994, 2003). This phase dismem-bered the LATEA craton and heat transfer wascaused by the magmas rising along the shearzones, although many of the cratonic featureswere preserved, including the Eburnean granuliticparagenesis and probably many Eburnean struc-tures, although they were slightly to stronglyreworked. This corresponds to the notion ofmetacraton (Abdelsalam et al. 2002) that can beapplied to LATEA (Liegeois et al. 2003). Takinginto account the relatively small area of LATEA,we can suggest that it belonged, before thePan-African orogeny, to a larger craton probablyconstituting its margin. Whether LATEArepresents the former eastern boundary of theWest African craton or the western boundary ofthe Saharan craton is still a matter of debate. TheTidjenouine area demonstrates the complexity ofmetacratonic areas that result from the interplayof two orogenies on a rigid block. This is thereason why metacratonic areas are most often notwell understood and are probably now amongthe most fascinating regions to study withmodern techniques.
We warmly thank G. Rebay and P. Goncalves for theirreviews, which significantly improved the final versionof the manuscript. Lively discussions with R. Caby onthe Eburnean v. Pan-African effects in Hoggar wereappreciated. We thank N. Ennih for his editorial com-ments. This work was supported by the TASSILI 05
A. BENDAOUD ET AL.144

MDU 653 project ‘Imagerie tridimentionnelle et evolutionspatio-temporelle du Hoggar’ and by the NATOgrant EST/CLE 979766 and CNRS PICS project ‘Archi-tecture lithospherique et dynamique du manteau sous leHoggar’. We are also extremely grateful to ORGM andOPNA for logistic support during fieldwork.
References
ABDELSALAM, M., LIEGEOIS, J. P. & STERN, R. J. 2002.The Saharan metacraton. Journal of African EarthScience, 34, 119–136.
ACEF, K., LIEGEOIS, J. P., OUABADI, A. & LATOUCHE, L.2003. The Anfeg post-collisional Pan-African high-Kcalc-alkaline batholith (Central Hoggar, Algeria),result of the LATEA microcontinent metacratonisa-tion. Journal of African Earth Sciences, 37, 95–311.
ADJERID, Z., OUZEGANE, K., GODARD, G. & KIENAST,J. R. 2008. First report of ultrahigh- temperature sap-phirine spinel quartz and orthopyroxeneþ spinelþquartz parageneses discovered in Al–Mg granulitesfrom the Khanfous area (In Ouzzal metacraton,Hoggar, Algeria). In: ENNIH, N. & LIEGEOIS, J.-P.(eds) The Boundaries of the West African Craton Geo-logical Society, London, Special Publications, 297,147–167.
BARBEY,P.,BERTRAND,J.M.,ANGOUA,S.&DAUTEL,D.1989. Petrology and U/Pb geochronology of the Telohatmigmatites, Aleksod, Central Hoggar, Algeria.Contributions to Mineralogy and Petrology, 101,207–219.
BENDAOUD, A., OUZEGANE, K. & KIENAST, J. R.2003. Textures and phase relationships in ferrous gran-ulites from Tidjenouine (Hoggar, Algeria): fayalite–ferrossilite–quartz secondary assemblage. Journal ofAfrican Earth Sciences, 37, 241–255.
BENDAOUD, A., DERRIDJ, A., OUZEGANE, K. &KIENAST, J. R. 2004. Granulites of the Laouniterrane, (Tamanrasset, Tidjenouine, Tin Begane).Journal of African Earth Sciences, 39, 187–192.
BENYAHIA, O., HADDOUM, H., OUZEGANE, K.,BENDAOUD, A., DJEMAI, S. & KIENAST, J.-R.2005. Fonctionnement et role des mega zones decisaillement dans la structuration du metacraton eburn-een du LATEA au panafricain puis au phanerozoıque(region de Tamanrasset, Hoggar, Algerie). AfricanGeosciences Review, 12, 261–274.
BERTRAND, J.-M. & JARDIM DE SA, E. F. 1990. Whereare the Eburnean–Transamazonian collisionalbelts? Canadian Journal of Earth Sciences, 27,1382–1393.
BERTRAND, J. M., MICHARD, A., BOULLIER, A. M. &DAUTEL, D. 1986. Structure and U/Pb geochronologyof Central Hoggar (Algeria): a reappraisal of itsPan-African evolution. Tectonics, 5, 955–972.
BLACK, R. & LIEGEOIS, J. P. 1993. Cratons, mobile belts,alkaline rocks and continental lithospheric mantle: thePan-African testimony. Journal of the GeologicalSociety, London, 150, 89–98.
BLACK, R., LATOUCHE, L., LIEGEOIS, J. P., CABY, R. &BERTRAND, J. M. 1994. Pan-African displaced ter-ranes in the Tuareg shield (central Sahara). Geology,22, 641–644.
BOHLEN, S. R. & LIOTTA, J. J. 1986. A barometer forgarnet amphibolites and granulites. Journal of Petrol-ogy, 27, 1025–1034.
BRUGUIER, O., TELOUK, P., COCHERIE, A., FOUILLAC,A. M. & ALBAREDE, F. 2001. Evaluation of Pb–Pband U–Pb laser ablation ICP-MS zircon dating usingmatrix-matched calibration samples with a frequencyquadrupled (266 nm) Nd:YAG laser. GeostandardsNewsletter, 25, 361–373.
CABY, R. 2003. Terrane assembly and geodynamic evol-ution of central–western Hoggar: a synthesis. Journalof African Earth Sciences, 37, 133–159.
CABY, R. & ANDREOPOULOS-RENAUD, U. 1989. AgeU–Pb a 620 Ma d’un pluton synorogenique del’Adrar des Iforas (Mali). consequences pour l’age dela phase majeure de l’orogene pan-africaine. ComptesRendus de l’Academie des Sciences, 308, 307–314.
CABY, R., ANDREOPOULOS-RENAUD, U. &GRAVELLE, M. 1982. Cadre geologique et geo-chronologique U/Pb sur zircon des batholitesprecoces dans le segment pan-africain duHoggar central (Algerie). Bulletin de la SocieteGeologique de France, 24, 677 – 684.
CZAMANSKE, G. D. & WONES, D. R. 1973. Oxidationduring magmatic differentiation, FinnmarkaComplex, Oslo area, Norway. II. The mafic silicates.Journal of Petrology, 14, 349–380.
DERRIDJ, A., OUZEGANE, K., KIENAST, J. R. &BELHAI , D. 2003. P–T–X evolution in garnet pyrox-enites from Tin Begane (Central Hoggar, Algeria).Journal of African Earth Sciences, 37, 257–268.
HANSON, G. N. 1989. An approach to trace elementmodeling using a simple igneous system as anexample. In: LIPIN, R. B. & MCKAY, G. A. (eds)The Geology and Geochemistry of Rare EarthElements. Mineralogical Society of America,Reviews in Mineralogy, 21, 79–97.
HARLEY, S. L. 1984. An experimental study of the parti-tioning of Fe and Mg between garnet and orthopyro-xene. Contributions to Mineralogy and Petrology,86, 359–373.
HARLEY, S. L. 1989. The origins of granulites: a meta-morphic perspective. Geological Magazine, 126,215–247.
HOISCH, T. D. 1990. Empirical calibration of six geoba-rometers for the mineral assemblage quartzþmuscoviteþ biotiteþ plagioclaseþ garnet. Contri-butions to Mineralogy and Petrology, 104, 225–234.
HOLLAND, T. J. B. & POWELL, R. 1990. An enlarged andupdated internally consistent thermodynamic datasetwith uncertainties and correlations: the system K2O–Na2O–CaO–MgO–FeO–Fe2O3–Al2O3–TiO2–SiO2–C–H–O. Journal of Metamorphic Geology, 8, 89–124.
KOZIOL, A. M. & NEWTON, R. C. 1988. Redeterminationof the anorthite breakdown reaction and improvementof the plagioclase–garnet–Al2SiO5–quartz barom-eter. American Mineralogist, 73, 216–223.
LEAKE, B. E., WOOLLEY, A. R. & BIRCH, W. D. et al.1997. Nomenclature of amphiboles. Canadian Miner-alogist, 9, 623–651.
LIEGEOIS, J. P., BLACK, R., NAVEZ, J. & LATOUCHE, L.1994. Early and late Pan-African orogenies in the Aırassembly of terranes (Tuareg shield, Niger). Precam-brian Research, 67, 59–88.
TIDJENOUINE METAPELITES EVOLUTION 145
LIEGEOIS, J. P., LATOUCHE, L., BOUGHRARA, M.,NAVEZ, J. & GUIRAUD, M. 2003. The LATEA meta-craton (Central Hoggar, Tuareg shield, Algeria): beha-viour of an old passive margin during the Pan-Africanorogeny. Journal of African Earth Sciences, 37,161–190.
NEVES, S., BRUGUIER, O., VAUCHEZ, A., BOSCH, D.,RANGEL DA SILVA, J. M. & MARIANO, G. 2006.Timing of crust formation, deposition of supracrustalsequences, and Transamazonian and Brasiliano meta-morphism in the East Pernambuco belt (centraldomain, Borborema Province, NE Brazil): impli-cations for western Gondwana assembly. PrecambrianResearch, 149, 197–216.
NEWTON, R. C. & HASELTON, H. T. 1981. Thermodyn-amics of the garnet–plagioclase–Al2SiO5–quartzgeobarometer. In: NEWTON, R. C., NAVROTSKY, A.& WOOD, B. J. (eds) Thermodynamics of Mineralsand Melts. Springer-Verlag, New York, 131–147.
NEWTON, R. C. & PERKINS, D. I. 1982. Thermodynamiccalibration of geobarometers based on assemblagesgarnet–plagioclase–orthopyroxene (clinopyroxene)–quartz. American Mineralogist, 67, 203–222.
OUZEGANE, K. 1981. Le metamorphisme polyphase gran-ulitique de la region de Tamanrasset (Hoggar central).These de 3eme cycle, Universite, Paris VII, France.
OUZEGANE, K. & BOUMAZA, S. 1996. An example ofultrahigh-temperature metamorphism: orthopyrox-ene–sillimanite–garnet, sapphirine–quartz andspinel-quartz parageneses in Al–Mg granulites fromIn Hihaou, In Ouzzal, Hoggar. Journal of Meta-morphic Geology, 14, 693–708.
OUZEGANE, K., DJEMAI, S. & GUIRAUD, M. 1996.Gedrite garnet sillimanite bearing granulites fromAmesmessa area, south In Ouzzal, Hoggar, Algeria.Journal of Metamorphic Geology, 14, 739–753.
OUZEGANE, K., BENDAOUD, A., KIENAST, J. R. &TOURET, J. L. R. 2001. Pressure–temperature–fluidevolution in the Eburnean metabasites and metapelitesfrom Tamanrasset (Hoggar, Algeria). Journal ofGeology, 109, 247–263.
OUZEGANE, K., KIENAST, J. R., BENDAOUD, A. &DRARENI, A. 2003. A review of Archaean and Paleo-proterozoic evolution of the In Ouzzal granuliticterrane (Western Hoggar, Algeria). Journal ofAfrican Earth Sciences, 37, 207–227.
PERCHUK, L. L. & LAVRENT’EVA, I. V. 1983.Experimental investigation of exchange equilibria inthe system cordierite–garnet–biotite. In: SAXENA,S. K. (ed.) Kinetics and Equilibrium in MineralReactions. Advances in Physical Geochemistry, 3,199–239.
PERCHUK, L. L., ARANOVICH, L. Y. & PODLESSKII,K. K. et al. 1985. Precambrian granulites of theAldan shield, eastern Siberia, USSR. Journal of Meta-morphic Geology, 3, 265–310.
PEUCAT, J. J., DRARENI, A., LATOUCHE, L., DELOULE,E. & VIDAL, P. 2003. U–Pb zircon (TIMS and SIMS)and Sm–Nd whole-rock geochronology of the GourOumelalen granulitic basement, Hoggar massif,Tuareg shield, Algeria. Journal of African EarthSciences, 37, 229–239.
POWELL, R. & HOLLAND, T. J. B. 1988. An internallyconsistent data set with uncertainties and correlations:3. Applications to geobarometry worked examples anda computer program. Journal of MetamorphicGeology, 6, 173–204.
POWELL, R., HOLLAND, T. J. B. & WORLEY, B. 1998.Calculating phase diagrams involving solid solutionsvia nonlinear equations, with examples usingTHERMOCALC. Journal of Metamorphic Geology,16, 577–588.
ROBINSON, P., ROSS, M. & JAFFE, H. W. 1971.Composition of the anthophyllite–gedrite series:comparisons of gedrite–hornblende and the antho-phyllite–gedrite solvus. American Mineralogist, 56,1005–1041.
SENGUPTA, P., DASGUPTA, S., BHATTACHARYA, P. K.& MUKHERJEE, M. 1990. An orthopyroxene–biotitegeothermometer and its application in crustal granu-lites and mantle-derived rocks. Journal of Meta-morphic Geology, 8, 191–197.
SPEAR, F. S. 1980. The gedrite–anthoplyllite solvus andthe composition limits of orthoamphibole from thePost Pond volcanics, Vermont. American Mineralo-gist, 65, 1103–1118.
SUN, S. S. & MCDONOUGH, W. F., 1989. Chemical andisotopic systematics of oceanic basalts: implicationsfor mantle composition and processes. In: SAUNDERS,A. D. & NORRY, M. J. (eds) Magmatism in the OceanBasins. Geological Society, London, Special Publi-cations, 42, 313–345.
TAYLOR, S. R. & MCLENNAN, S. M. 1985. The Conti-nental Crust: its Composition and Evolution. Black-well, Oxford.
WIEDENBECK, M., ALLE, P., CORFU, F., GRIFFIN, W. L.& MEIER, M. 1995. Three natural zircon standards forU–Th–Pb, Lu–Hf, trace element and REE analyses.Geostandards Newsletter, 19, 1–23.
WILLIAM, I. S., BUICK, I. S. & CARTWRIGHT, I. 1996.An extended episode of early Mesoproterozoicmetamorphic fluid flow in the Reynold Range,central Australia. Journal of Metamorphic Geology,14, 29–47.
A. BENDAOUD ET AL.146
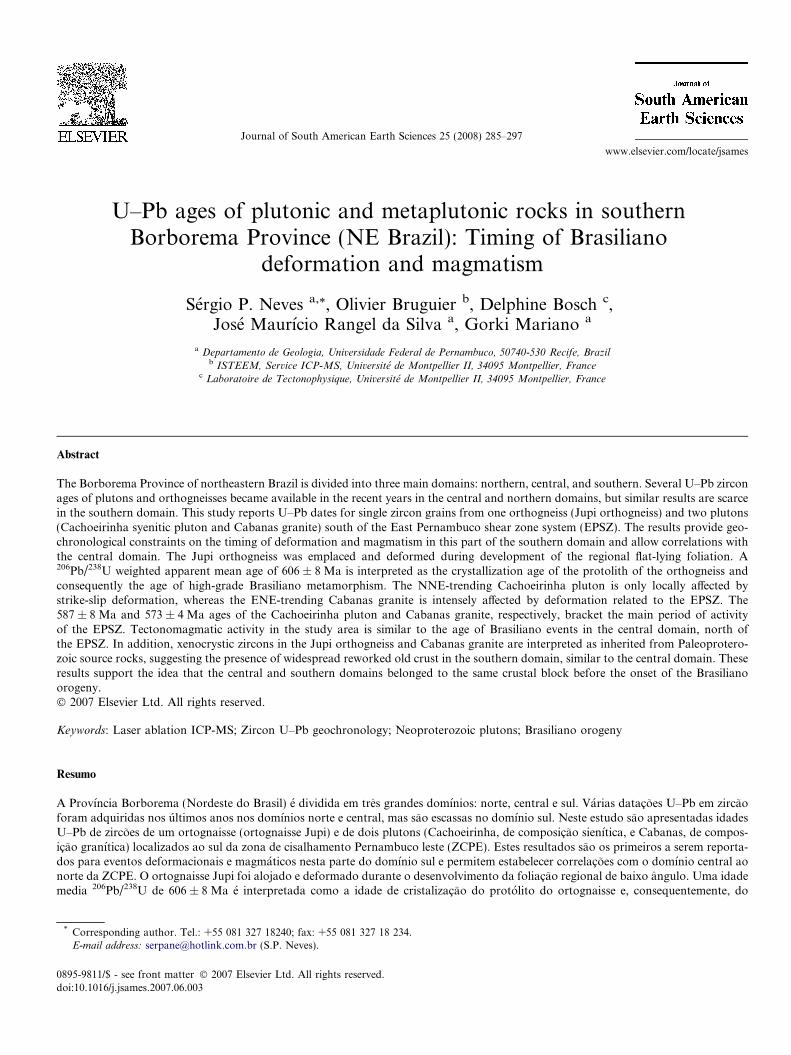
www.elsevier.com/locate/jsames
Journal of South American Earth Sciences 25 (2008) 285–297
U–Pb ages of plutonic and metaplutonic rocks in southernBorborema Province (NE Brazil): Timing of Brasiliano
deformation and magmatism
Sergio P. Neves a,*, Olivier Bruguier b, Delphine Bosch c,Jose Maurıcio Rangel da Silva a, Gorki Mariano a
a Departamento de Geologia, Universidade Federal de Pernambuco, 50740-530 Recife, Brazilb ISTEEM, Service ICP-MS, Universite de Montpellier II, 34095 Montpellier, France
c Laboratoire de Tectonophysique, Universite de Montpellier II, 34095 Montpellier, France
Abstract
The Borborema Province of northeastern Brazil is divided into three main domains: northern, central, and southern. Several U–Pb zirconages of plutons and orthogneisses became available in the recent years in the central and northern domains, but similar results are scarcein the southern domain. This study reports U–Pb dates for single zircon grains from one orthogneiss (Jupi orthogneiss) and two plutons(Cachoeirinha syenitic pluton and Cabanas granite) south of the East Pernambuco shear zone system (EPSZ). The results provide geo-chronological constraints on the timing of deformation and magmatism in this part of the southern domain and allow correlations withthe central domain. The Jupi orthogneiss was emplaced and deformed during development of the regional flat-lying foliation. A206Pb/238U weighted apparent mean age of 606 ± 8 Ma is interpreted as the crystallization age of the protolith of the orthogneiss andconsequently the age of high-grade Brasiliano metamorphism. The NNE-trending Cachoeirinha pluton is only locally affected bystrike-slip deformation, whereas the ENE-trending Cabanas granite is intensely affected by deformation related to the EPSZ. The587 ± 8 Ma and 573 ± 4 Ma ages of the Cachoeirinha pluton and Cabanas granite, respectively, bracket the main period of activityof the EPSZ. Tectonomagmatic activity in the study area is similar to the age of Brasiliano events in the central domain, north ofthe EPSZ. In addition, xenocrystic zircons in the Jupi orthogneiss and Cabanas granite are interpreted as inherited from Paleoprotero-zoic source rocks, suggesting the presence of widespread reworked old crust in the southern domain, similar to the central domain. Theseresults support the idea that the central and southern domains belonged to the same crustal block before the onset of the Brasilianoorogeny.� 2007 Elsevier Ltd. All rights reserved.
Keywords: Laser ablation ICP-MS; Zircon U–Pb geochronology; Neoproterozoic plutons; Brasiliano orogeny
Resumo
A Provıncia Borborema (Nordeste do Brasil) e dividida em tres grandes domınios: norte, central e sul. Varias datacoes U–Pb em zircaoforam adquiridas nos ultimos anos nos domınios norte e central, mas sao escassas no domınio sul. Neste estudo sao apresentadas idadesU–Pb de zircoes de um ortognaisse (ortognaisse Jupi) e de dois plutons (Cachoeirinha, de composicao sienıtica, e Cabanas, de compos-icao granıtica) localizados ao sul da zona de cisalhamento Pernambuco leste (ZCPE). Estes resultados sao os primeiros a serem reporta-dos para eventos deformacionais e magmaticos nesta parte do domınio sul e permitem estabelecer correlacoes com o domınio central aonorte da ZCPE. O ortognaisse Jupi foi alojado e deformado durante o desenvolvimento da foliacao regional de baixo angulo. Uma idademedia 206Pb/238U de 606 ± 8 Ma e interpretada como a idade de cristalizacao do protolito do ortognaisse e, consequentemente, do
0895-9811/$ - see front matter � 2007 Elsevier Ltd. All rights reserved.
doi:10.1016/j.jsames.2007.06.003
* Corresponding author. Tel.: +55 081 327 18240; fax: +55 081 327 18 234.E-mail address: [email protected] (S.P. Neves).

286 S.P. Neves et al. / Journal of South American Earth Sciences 25 (2008) 285–297
metamorfismo Brasiliano. O pluton Cachoeirinha, de direcao NNE-SSW, e afetado por deformacao nao-coaxial apenas localmente,enquanto o Granito Cabanas, de direcao ENE-WNW, e fortemente deformado na sua porcao norte pela ZCPE. As idades de587 ± 8 Ma e 573 ± 4 Ma destes dois plutons limitam o perıodo principal de funcionamento da ZCPE. A atividade termotectonicana area estudada e similar a idade de eventos brasilianos no domınio central ao norte da ZCPE. Adicionalmente, populacoes de xenoc-ristais de zircao no ortognaisse Jupi e no Granito Cabanas herdadas de fontes Paleoproterozoicas sugerem a presenca no domınio sul deextensas areas antigas retrabalhadas, similarmente ao observado no domınio central. Estes resultados indicam que os domınios central esul pertenciam ao mesmo bloco crustal antes do inıcio da orogenese Brasiliana.� 2007 Elsevier Ltd. All rights reserved.
Palavras-chave: ICP-MS; Geocronologia U–Pb; Zircao; Plutons neoproterozoicos; Orogenese Brasiliana
1. Introduction
The Neoproterozoic evolution of Borborema Province(NE Brazil) is still a contentious issue, with contrastingmodels for the tectonic setting in which magmatic anddeformational events occurred. In particular, the signifi-cance of the Cariris Velhos event and whether the Brasil-iano orogeny took place in an intracontinental settinghave been debated. The Cariris Velhos event was definedin the central domain of the Borborema Province follow-ing the recognition of a metavolcanosedimentary belt withintercalated orthogneisses of early Neoproterozoic age(Brito Neves et al., 1995). For a group of workers, thisbelt formed as a consequence of a complete orogeniccycle. They also suggested the possibility that this oro-genic event affected other portions of the BorboremaProvince, mainly in its southern domain (Brito Neveset al., 1995, 2000; Kozuch, 2003). Conversely, others con-sider that the belt where the Cariris Velhos event has beenrecorded was a continental rift intruded by intraplategranites, with deformation and metamorphism only occur-ring during the Brasiliano orogeny (Neves, 2003; Gui-maraes and Brito Neves, 2004; Neves et al., 2004).Regarding the geodynamic evolution of the BorboremaProvince during the Neoproterozoic, again two opposingviews compete. In one model, the Borborema Province isregarded as an accretionary orogen whose evolutioninvolved a collage of allochtonous terranes (Santos andMedeiros, 1999; Brito Neves et al., 2000; Santos et al.,2004). The other model proposes that intraplate tectonismdriven by far-field stresses reworked preexisting Archean–Paleoproterozoic crust and younger sedimentary succes-sions deposited dominantly in continental basin settings(Neves, 2003; Neves et al., 2004, 2006).
Geochronological data together with conventional fieldand petrologic studies are required to tackle these contro-versies. Numerous U–Pb ages of plutons and orthogneis-ses became available in recent years in the central andnorthern domains (see reviews by Brito Neves et al.,2000; Neves, 2003; Neves et al., 2006). Similar resultsare scarce in the southern domain, and their acquisitionis essential to compare tectonomagmatic events at a prov-ince-wide scale. In this paper, we report laser ablationinductively coupled plasma-mass spectrometry (LA-ICP-
MS) zircon U–Pb ages of two plutons and one orthogneisssouth of the East Pernambuco shear zone system (EPSZ),which is conventionally taken as the limit between thecentral and southern domains in the eastern part of theBorborema Province. These are the first U–Pb zircon agesreported so far for this portion of the southern domain.Along with available structural information (Neveset al., 2003, 2005), they provide well-constrained agelimits for the main period of tectonic activity related tothe Brasiliano orogeny and shed new light on the age ofbasement rocks underlying the study area. In addition,we compare our new data with recently published datapertaining to north of the EPSZ (Brito Neves et al.,2001; Guimaraes et al., 2004; Neves et al., 2006) to evalu-ate possible correlations between the central and southerndomains.
2. Geological setting
2.1. Previous geochronological work
The geology of the southern domain south of the EPSZ(Fig. 1) is dominated by high-grade, commonly migmatiticorthogneisses and metasedimentary rocks and numerouslarge igneous intrusions. Orthogneisses and supracrustalrocks are grouped, respectively, in the Belem do Sao Fran-cisco and Cabrobo complexes (Medeiros, 1998; Gomes,2001). Only a few geochronological data are available forthese units. Zircons from two samples of orthogneisseswrapped by mylonites of the EPSZ, but still preserving aflat-lying foliation, have been dated by the Pb-evaporationmethod (Neves et al., 2004). One sample, a medium-grained quartz dioritic gneiss, yields an age of2075 ± 7 Ma, interpreted as the crystallization age of theprotolith of the orthogneiss during the Transamazonianevent. The other, a coarse-grained granitic gneiss (Caruaruorthogneiss; Fig. 1), yields a Neoproterozoic age of629 ± 9 Ma, indicating the existence of a flat-lying, folia-tion-forming event during the Brasiliano orogeny.40Ar/39Ar biotite ages around 560 Ma were obtained forone pluton and a peraluminous orthogneiss (Osako,2005). These ages are older than 40Ar/39Ar biotite agesfrom granitic mylonites in the EPSZ and in plutons andcountry rocks north of the EPSZ (545–533 Ma; Neves

Fig. 1. Sketch map of Borborema Province showing the main transcurrent shear zones and its division into northern (ND), central (CD), and southern(SD) domains, with location of study area south of the East Pernambuco shear zone system (EPSZ). The main map shows the main geological units of thestudy area and location of dated samples.
S.P. Neves et al. / Journal of South American Earth Sciences 25 (2008) 285–297 287
et al., 2000), which indicates that regional cooling toaround 300–350� (approximate closure temperature forAr diffusion in biotite; e.g., Dahl, 1996) in the southerndomain was reached 15–25 Ma earlier than in the centraldomain.
Nd isotope data also provide some time constraints forthe southern domain. Nd model ages of supracrustal andmigmatitic rocks yield mostly Paleoproterozoic–Archeanages (2.0–2.6 Ga; Da Silva Filho et al., 2002; Osako,2005), but one Mesoproterozoic age (1.09 Ga) wasobtained for a sample of biotite gneiss (Da Silva Filhoet al., 2002). Most plutons also have PaleoproterozoicTDM ages, mainly between 1.8 and 2.2 Ga. However, onegroup of plutons yields distinctly younger Nd model ages,mainly between 1.5 and 1.0 Ga (Da Silva Filho et al.,2002). These data suggest that a large part of the southerndomain formed during the Paleoproterozoic but the addi-
tion of juvenile material occurred during Mesoproterozoicand/or Neoproterozoic times.
2.2. Study area
The study area comprises ortho- and paragneisses ofvariable composition and several large igneous intrusions,two of which are considered herein: the Cachoeirinha plu-ton and the Cabanas granite (Fig. 1). Grey gneisses andmigmatitic orthogneisses with mafic/intermediate proto-liths, interpreted as basement complexes, dominate in theeast. The small Caruaru orthogneiss, a biotite amphibolegranitic gneiss, occurs south of the homonymous city andis distinguished from the grey gneisses by its coarse grainsize, granitic composition, and usually lower strain. Thesouthern part of the study area is dominated by a graniticorthogneiss, here named the Jupi orthogneiss, which is

Fig. 2. (A) Field and (B,C) microstructural aspects in crossed polars of the Jupi orthogneiss. (A) Subhorizontal foliation containing a xenolith of flattenedpelitic paragneiss. (B) Foliation defined by mica flakes and an elongate K-feldspar grain (left upper side) that probably represents a magmatic crystal thatdid not fully recrystallize during synmagmatic deformation. (C) Dominant granoblastic microstructure with polygonal aggregates of quartz, K-feldspar,and plagioclase typical of high-temperature recrystallization.
288 S.P. Neves et al. / Journal of South American Earth Sciences 25 (2008) 285–297
intruded by several small bodies of diorite and leucogra-nite. In contrast with the grey gneisses, the Jupi orthogneissis a leucocratic, generally muscovite-bearing biotite gneissthat locally contains a large amount of xenoliths of peliticparagneiss (Fig. 2A). These xenoliths are petrographicallysimilar to micaschists and paragneisses that dominate thewestern part of the study area and display the assemblagebiotite ± muscovite ± sillimanite + garnet + plagioclase +quartz. The Jupi orthogneiss presents a dominantly flat-lying foliation that is cross-cut by a subvertical sinistral shearzone in its western portion (Fig. 1). A flat-lying foliation isalso dominant in the other metasedimentary and metaig-neous units, away from shear zones and Brasiliano plutons.
The biotite–muscovite-bearing Cabanas granite, whichcrops out at the southern side of the EPSZ (Fig. 1), con-tains xenoliths of high-T granitic mylonites. These xeno-liths are similar to those that resulted from deformationof granitoids of the Caruaru–Arcoverde batholith in thenorthern branch of the EPSZ, indicating intrusion afterthe onset of the activity in the EPSZ (Neves et al., 2003).The ENE-trending shape of the Cabanas granite, togetherwith the parallelism between magnetic foliations and linea-tions, obtained by anisotropy of magnetic susceptibility(AMS), inside the pluton and the mylonitic fabric of theEPSZ, indicates crystallization under the influence of thedextral transcurrent regime (Neves et al., 2003). The
contact between the Cabanas granite and the Cachoeirinhapluton was not directly observed in the field. However, (1)dikes of biotite granite and muscovite-bearing pegmatite,which might be genetically related to the Cabanas granite,locally intrude the Cachoeirinha pluton and (2) the Caba-nas granite intrudes a granitic pluton that shows concor-dant contacts with the Cachoerinha pluton. Theseobservations suggest the Cachoeirinha pluton is older thanthe Cabanas granite.
The Cachoeirinha pluton contains two main petro-graphic facies: inequigranular to porphyritic biotite amphi-bole syenite and medium-grained biotite amphibole quartzsyenite. The biotite amphibole syenite is the most abundantfacies and constitutes most of the northern and easternparts of the pluton. The biotite amphibole quartz syeniteis mostly found in the central and southern parts of the plu-ton. Magmatic foliation defined by the shape-preferred ori-entation of K-feldspar is visible in most outcrops of thebiotite amphibole syenite, especially close to the margins,with steep dips dominantly to ESE. Solid-state deforma-tion overprinting of the magmatic foliation is restricted inmost places to weak deformation at high temperatures, asshown by chessboard extinction in quartz and developmentof myrmekitic intergrowths around K-feldspar. Strongersolid-state deformation occurs along meters to tens ofmeters long sinistral and dextral shear zones. Dextral and

Fig. 3. SEM images of selected dated zircon grains of the Jupi orthogneisssample showing position of the LA-ICP-MS spots (spot size �25 lm) andcorresponding ages (errors quoted at the 2r level). (A) Euhedral zirconwith faint oscillatory zoning representative of the dominant population.(B) Elongate zircon with rounded corners. (C) Equidimensional anhedralzircon.
S.P. Neves et al. / Journal of South American Earth Sciences 25 (2008) 285–297 289
sinistral shear zones are consistently oriented NNE andENE, respectively. These observations, in association withan AMS survey, are evidence that intrusion of the Cach-oeirinha pluton occurred during bulk NW–SE shortening,with zones of non-coaxial shear developing locally (Neveset al., 2005).
3. Studied samples
The Jupi orthogneiss sample presents, in thin section, afoliation defined mainly by biotite together with thinmuscovite and subordinately by elongate grains of K-feld-spar and plagioclase (Fig. 2B and C). These elongate feld-spar grains indicate the igneous origin of the rock, butmetamorphic recrystallization is extensive. A polygonalmicrostructure in which most feldspar and quartz grainsmeet at triple junctions dominates, indicating that solid-state recrystallization occurred at high temperature(Fig. 2C). Apart from zircon, apatite is the only prominentaccessory, occurring as short prismatic crystals included orpartially included in biotite and feldspars. Zirconsextracted from this sample cluster in two distinct groupson the basis of their morphology, as observed by scanningelectronic microscopy (SEM; Fig. 3). One population con-sists of euhedral to suhedral grains with preserved crystalfaces and oscillatory zoning, typical of igneous crystalliza-tion (Fig. 3A). The other comprises equidimensionalrounded grains and elongated grains with rounded corners,which are characteristics of detrital grains transported dur-ing sedimentary processes (Fig. 3B and C).
The sample of the Cachoeirinha pluton chosen for geo-chronological work came from the biotite amphibole sye-nite facies. It contains large grains of amphibole and K-feldspar in an equigranular matrix composed of microcline,plagioclase, biotite, and minor quartz. Magnetite, sphene,zircon, and apatite occur as accessory phases. The zirconsare elongated and present bipyramidal terminations typicalof a magmatic growth (Fig. 4). The sample of the Cabanasgranite was deformed by strike-slip shearing and displaysmicrostructural features typical of mylonites deformed atintermediate temperature conditions, with porphyroclastsof K-feldspar and plagioclase wrapped by quartz, musco-vite and biotite. Zircon and apatite are the only accessoryphases. No SEM images are available for zircons of thissample.
4. Analytical techniques
Zircons were separated using conventional techniques.After crushing and sieving of the powdered samples, heavyminerals were concentrated by panning and then by heavyliquids. The heavy mineral concentrates were subsequentlyprocessed by magnetic separation on a Frantz separator.Zircon grains were hand picked from the non-magneticfraction at 1.5 A intensity and 2� side tilt. The grains werethen mounted on adhesive tape, enclosed in epoxy resinwith chips of a standard material (G91500; Wiedenbeck
et al., 1995), and polished to about half of their thickness.U–Pb data were acquired at the University of MontpellierII using a 1991 vintage VG Plasmaquad II turbo ICP-MScoupled with a Geolas (Microlas) automated platform

Fig. 4. SEM images of selected dated zircon grains of the Cachoeirinhapluton sample showing position of the LA-ICP-MS spot (spot size �25 l)and corresponding age (errors quoted at the 2r level).
290 S.P. Neves et al. / Journal of South American Earth Sciences 25 (2008) 285–297
housing a 193 nm Compex 102 laser from LambdaPhysik.Details of the analytical procedures and data reduction aredescribed in Neves et al. (2006).
5. Results
Table 1 shows the results of the analytical data for thestudied samples. Ages of zircons are expressed in termsof either their 207Pb/206Pb ratios (grains older than 1 Ga)or their 206Pb/238U ratios (grains with Neoproterozoicages). Errors for single analysis and mean ages are quotedat the 2r level.
5.1. Jupi orthogneiss
Analyses of zircons from the studied sample of the Jupiorthogneiss cluster into two age groups (Fig. 5a). Seventeenof the analyzed grains plot close to the concordia and yielda 206Pb/238U weighted apparent mean age of 606 ± 8 Ma(MSWD = 0.64; Fig. 5b). These grains are euhedral, con-tain oscillatory magmatic zoning, and have high Th/U
ratio (0.54–2.5; Table 1). Therefore, the weighted meanage is interpreted as the age of zircon crystallization froma melt (magmatic age) and, consequently, of the igneousprotolith of the orthogneiss.
Other analyses indicate old, Paleoproterozoic ages(Fig. 5c), among which six cluster close to concordia andyield a weighted 207Pb/206Pb mean age of 1980 ± 13(MSWD = 1.5). The oldest grain analysed exhibits a207Pb/206Pb age of 2108 ± 36 Ma. These ages wereobtained on rounded zircon grains or elongated zircongrains with rounded corners. In both cases, the zirconshave high Th/U ratios similar to magmatic ones. Theyare interpreted as xenocrysts inherited from the parent rockthat melted to produce the protolith of the Jupiorthogneiss.
5.2. Cachoeirinha pluton and Cabanas granite
Analysed zircons from the sample of the Cachoeirinhapluton yield a weighted 206Pb/228U mean age of587 ± 8 Ma (MSWD = 0.49; Fig. 6). The euhedral shapeand high Th/U ratio (0.48–1.55; Table 1) of the grains indi-cate that this age must correspond to the zircon crystalliza-tion age and thus to the date of emplacement of theCachoeirinha pluton.
Analyses of zircon grains from the Cabanas granite lieon a discordia with an upper intercept of 2192 ± 14 Maand a lower intercept of 570 ± 7 Ma (MSWD = 1.06;Fig. 7a). The lower intercept is anchored by 16 concordantanalyses that yield a weighted 206Pb/228U mean age of573 ± 4 (MSWD = 1.07; Fig. 7b), which is considered thebest estimate for the emplacement age of the intrusion.The upper intercept is interpreted as the average age of axenocrystic component derived from deep-seated sourcerock. One analysis at 3383 ± 30 Ma and another at1560 ± 16 Ma suggest that the parent rock also includedArchean and Mesoproterozoic components.
6. Discussion
6.1. Brasiliano-age events
The 606 ± 8 Ma age of the Jupi orthogneiss is consid-ered to represent the crystallization of its granitic proto-lith. Together with the high-temperature gneissic fabric,this age is taken as evidence that the Jupi orthogneisswas a synkinematic intrusion emplaced during a high-grade tectonic event. Likewise, the 629 ± 9 Ma age ofthe Caruaru orthogneiss (Neves et al., 2004) is interpretedas dating the emplacement of its granitic protolith. Intru-sion of the protoliths of both the Caruaru orthogneissand the Jupi orthogneiss clearly predates the developmentof transcurrent shear zones, because strike–slip-relatedmylonitic belts truncate their subhorizontal fabric (Neveset al., 2004). Considering that the structure in these tworock units parallels that present in migmatized metasedi-mentary rocks and grey orthogneisses, we propose that

Table 1U–Th–Pb LA-ICP-MS results for zircon grains from plutonic bodies of the southern domain of Borborema Province (Brazil)
Sample Pb (ppm) U (ppm) Th (ppm) Th/U 208Pb/206Pb 207Pb/206Pb ± (1s) 207Pb/235U ± (1s) 206Pb/238U ± (1s) Rho Apparent ages (Ma)
206Pb/238U ± (1s) 207Pb/206Pb ± (1s)
Cachoeirinha pluton
sc4* 23 185 200 1.08 0.375 0.0623 0.0030 0.7985 0.0531 0.0929 0.0043 0.70 573 25 686 102sc33* 52 540 257 0.48 0.165 0.0619 0.0016 0.7957 0.0258 0.0932 0.0019 0.64 574 11 672 54sc15* 60 575 425 0.74 0.227 0.0608 0.0006 0.7822 0.0243 0.0933 0.0028 0.95 575 16 631 20sc40* 43 415 232 0.56 0.218 0.0642 0.0034 0.8272 0.0462 0.0934 0.0017 0.32 575 10 750 112sc32* 19 138 133 0.97 0.465 0.0652 0.0024 0.8544 0.0882 0.0950 0.0092 0.94 585 54 782 76sc31* 22 184 200 1.08 0.357 0.0594 0.0012 0.7789 0.0301 0.0951 0.0032 0.86 586 19 581 43sc36* 36 250 156 0.62 0.444 0.0617 0.0038 0.8100 0.0578 0.0951 0.0035 0.52 586 21 665 131sc18* 58 528 465 0.88 0.251 0.0630 0.0015 0.8288 0.0416 0.0954 0.0042 0.88 587 25 710 51sc3* 26 196 304 1.55 0.448 0.0656 0.0011 0.8688 0.0609 0.0960 0.0066 0.97 591 38 795 34sc9* 23 187 286 1.53 0.442 0.0618 0.0012 0.8226 0.0289 0.0966 0.0028 0.83 594 16 666 42sc8* 60 518 376 0.73 0.234 0.0607 0.0019 0.8131 0.0302 0.0971 0.0020 0.56 597 12 630 66sc19* 65 599 555 0.93 0.252 0.0617 0.0030 0.8281 0.0535 0.0974 0.0041 0.65 599 24 663 106sc38* 53 482 357 0.74 0.251 0.0610 0.0027 0.8195 0.0622 0.0974 0.0060 0.81 599 35 639 95sc6* 27 221 199 0.90 0.297 0.0621 0.0026 0.8376 0.0412 0.0977 0.0025 0.51 601 14 679 90sc24* 44 406 235 0.58 0.184 0.0641 0.0013 0.8663 0.0288 0.0980 0.0025 0.78 603 15 745 44sc10 10 85 76 0.88 0.244 0.0624 0.0006 0.8922 0.0177 0.1037 0.0018 0.89 636 11 688 19
Mean = 586.6 ± 8.4 [1.4%] 95% conf. Wtd bydata-pt errs only, 1 of 16 rej. MSWD = 0.49,probability = 0.94
Jupi orthogneiss
sb15 9 90 202 2.25 0.394 0.0590 0.0010 0.6430 0.0115 0.0790 0.0004 0.30 490 3 567 37sb11* 5 40 48 1.19 0.354 0.0631 0.0014 0.8355 0.0288 0.0961 0.0026 0.78 591 15 711 46sb20* 6 61 33 0.54 0.254 0.0593 0.0011 0.7902 0.0295 0.0966 0.0031 0.87 595 18 578 40sb29* 8 61 96 1.57 0.481 0.0590 0.0022 0.8345 0.0438 0.1025 0.0038 0.7 629 22 568 82sb18* 5 42 41 0.98 0.323 0.0640 0.0028 0.8030 0.0505 0.0910 0.0042 0.73 561 25 742 91sb6* 3 25 38 1.49 0.378 0.0582 0.0025 0.7917 0.0423 0.0987 0.0032 0.61 607 19 536 92sb13* 3 26 31 1.18 0.371 0.0607 0.0025 0.8234 0.0429 0.0984 0.0032 0.62 605 19 629 88sb7* 4 30 51 1.71 0.394 0.0622 0.0002 0.8104 0.0298 0.0945 0.0035 1.00 582 20 680 7sb23* 3 27 26 0.97 0.343 0.0611 0.0015 0.8493 0.0332 0.1007 0.0031 0.78 619 18 644 53sb10* 6 55 62 1.14 0.335 0.0609 0.0021 0.8295 0.037 0.0989 0.0029 0.65 608 17 634 73sb16* 7 63 78 1.24 0.412 0.0618 0.0013 0.8157 0.0381 0.0957 0.0040 0.88 589 23 668 46sb5* 5 46 45 0.97 0.252 0.0596 0.0023 0.8159 0.042 0.0993 0.0034 0.67 610 20 589 82sb8* 10 79 122 1.53 0.431 0.0640 0.0014 0.8400 0.0504 0.0953 0.0053 0.93 587 31 740 45sb12* 16 118 213 1.81 0.532 0.0606 0.0010 0.8298 0.0226 0.0993 0.0022 0.82 610 13 625 34sb24* 3 24 25 1.08 0.341 0.0642 0.0017 0.8842 0.0265 0.0999 0.0015 0.51 614 9 748 55sb17* 4 34 50 1.44 0.433 0.0642 0.0022 0.9215 0.0657 0.1040 0.0065 0.87 638 38 750 73sb14* 9 71 112 1.57 0.414 0.0601 0.0011 0.8171 0.0267 0.0986 0.0027 0.84 606 16 608 38sb45* 42 315 520 1.65 0.576 0.0613 0.0011 0.8488 0.0542 0.1005 0.0062 0.96 617 36 649 38sb19 15 106 185 1.74 0.508 0.0624 0.0017 0.9275 0.0318 0.1078 0.0023 0.61 660 13 688 58
(continued on next page)
S.P
.N
eveset
al.
/J
ou
rna
lo
fS
ou
thA
merica
nE
arth
Scien
ces2
5(
20
08
)2
85
–2
97
291

Table 1 (continued)
Sample Pb (ppm) U (ppm) Th (ppm) Th/U 208Pb/206Pb 207Pb/206Pb ± (1s) 207Pb/235U ± (1s) 206Pb/238U ± (1s) Rho Apparent ages (Ma)
206Pb/238U ± (1s) 207Pb/206Pb ± (1s)
Mean = 605.7 ± 8.3 [1.4%] 95% conf. Wtd bydata-pt errs only, 2 of 19 rej. MSWD = 0.64,probability = 0.85
sb32 22 71 63 0.88 0.287 0.1206 0.0014 4.2668 0.0714 0.2566 0.0032 0.73 1472 16 1965 20sb22 60 186 103 0.56 0.163 0.1208 0.0009 4.8631 0.1584 0.2919 0.0093 0.98 1651 46 1968 13sb31 157 438 230 0.52 0.154 0.1178 0.0006 5.2940 0.0759 0.3258 0.0044 0.94 1818 21 1924 9sb21 150 370 318 0.86 0.244 0.1223 0.0008 5.7271 0.2520 0.3396 0.0148 0.99 1885 71 1990 11sb9# 171 389 416 1.07 0.301 0.1209 0.0005 5.7316 0.1800 0.3440 0.0107 0.99 1906 51 1969 7sb33# 66 172 103 0.60 0.190 0.1232 0.0008 5.9513 0.1774 0.3503 0.0102 0.97 1936 48 2003 12sb2# 189 453 409 0.90 0.258 0.1217 0.0006 5.9896 0.2679 0.3571 0.0159 0.99 1968 75 1981 8sb30# 158 364 265 0.73 0.231 0.1212 0.0013 6.0052 0.1175 0.3594 0.0059 0.84 1979 28 1974 19sb42 101 250 159 0.63 0.093 0.1307 0.0014 6.5551 0.3149 0.3637 0.0170 0.98 1999 80 2108 18sb36# 182 465 118 0.25 0.094 0.1232 0.0015 6.1800 0.0903 0.3638 0.0028 0.54 2000 13 2003 22sb1# 214 475 431 0.91 0.282 0.1218 0.0008 6.2267 0.2792 0.3708 0.0165 0.99 2033 77 1983 11
Mean = 1980 ± 13 [0.68%] 95% conf. Wtd bydata-pt errs only, 0 of 6 rej. MSWD = 1.5,probability = 0.19
Cabanas granite
yb13* 20 218 104 0.47 0.131 0.0591 0.0005 0.7297 0.012 0.0896 0.0013 0.85 553 7 570 19yb4* 19 194 116 0.60 0.164 0.0582 0.0007 0.7350 0.0128 0.0915 0.0012 0.73 565 7 539 26yb6* 16 161 77 0.48 0.136 0.0607 0.0013 0.7681 0.0187 0.0917 0.0011 0.48 566 6 629 46yb25* 33 370 61 0.16 0.067 0.0614 0.0039 0.7812 0.0582 0.0923 0.0036 0.53 569 21 652 136yb29* 87 711 1253 1.76 0.511 0.0621 0.0011 0.7949 0.0425 0.0929 0.0047 0.94 573 28 676 38yb26* 17 177 85 0.48 0.151 0.0623 0.0033 0.7981 0.0422 0.0930 0.0007 0.13 573 4 683 112yb10* 19 187 80 0.43 0.189 0.0597 0.0018 0.7696 0.0256 0.0936 0.0012 0.38 577 7 591 67yb3* 19 192 68 0.36 0.137 0.0579 0.0004 0.7484 0.0121 0.0937 0.0014 0.9 578 8 526 15yb23* 27 274 125 0.46 0.144 0.0591 0.0012 0.7651 0.0285 0.0938 0.0029 0.84 578 17 572 44yb5* 39 435 77 0.18 0.049 0.0595 0.0005 0.7701 0.0204 0.0939 0.0024 0.94 579 14 585 19yb27* 17 164 111 0.68 0.189 0.0630 0.0012 0.8179 0.0211 0.0941 0.0016 0.66 580 9 710 41yb20* 21 212 133 0.63 0.187 0.0610 0.0006 0.7939 0.0158 0.0944 0.0016 0.87 581 10 639 21yb22* 20 200 86 0.43 0.127 0.0590 0.0005 0.7679 0.0163 0.0944 0.0019 0.92 582 11 566 18yb24* 36 385 71 0.18 0.054 0.0587 0.0003 0.7673 0.0173 0.0947 0.0021 0.97 583 12 558 12yb21* 24 246 111 0.45 0.143 0.0600 0.0004 0.7887 0.0161 0.0954 0.0018 0.93 587 11 603 16yb28* 64 614 137 0.22 0.166 0.0628 0.0016 0.8346 0.0385 0.0964 0.0037 0.83 593 22 701 54yb9 21 60 78 1.30 0.352 0.0966 0.0004 3.6300 0.0988 0.2725 0.0073 0.99 1553 37 1560 8yb8 99 290 393 1.36 0.386 0.1230 0.0013 4.4349 0.0495 0.2614 0.0010 0.36 1497 5 2001 19yb11 54 161 16 0.10 0.051 0.1326 0.0006 6.0751 0.0669 0.3323 0.0033 0.92 1849 16 2133 8yb1 72 190 48 0.25 0.082 0.1345 0.0006 6.6649 0.1332 0.3594 0.007 0.98 1979 33 2158 7yb2 64 160 40 0.25 0.092 0.1338 0.0012 6.8821 0.1262 0.3731 0.0059 0.87 2044 28 2148 16yb30 45 110 31 0.28 0.167 0.1547 0.0027 7.6944 0.1647 0.3608 0.0045 0.58 1986 21 2398 30yb7 132 161 65 0.40 0.120 0.2836 0.0028 26.3895 0.4727 0.6749 0.0101 0.83 3325 39 3383 15
Mean = 572.7 ± 4.1 [0.72%] 95% conf. Wtd bydata-pt errs only, 0 of 16 rej. MSWD = 1.07,probability = 0.37
Note: For each rock, ages have been calculated on the basis of 206Pb/238U weighted averages from data labelled *. For the Jupi orthogneiss, the Paleoproterozoic age has been calculated on the basis of207Pb/206Pb weighted averages from data labeled #.
292S
.P.
Neves
eta
l./
Jo
urn
al
of
So
uth
Am
erican
Ea
rthS
ciences
25
(2
00
8)
28
5–
29
7

Fig. 5. (a) U–Pb concordia diagram for zircons from Jupi orthogneisssample (b) Zoom showing the weighted mean age of 17 Neoproterozoiczircon analyses. (c) Zoom of Paleoproterozoic zircons showing theweighted mean age of 6 zircon analyses.
520
560
600
640
680
720
0.08
0.09
0.10
0.11
0.12
0.65 0.75 0.85 0.95 1.05
207Pb/235U
206 Pb
/238 U
206Pb/238U weighted mean:587±8 Ma (n = 15)
MSWD=0.49
Cachoeirinha pluton(Borborema Province, Brazil)
Fig. 6. U–Pb concordia diagram for zircons from the Cachoeirinhapluton.
S.P. Neves et al. / Journal of South American Earth Sciences 25 (2008) 285–297 293
the extensive migmatization is coeval with the develop-ment of the regional flat-lying fabrics in orthogneissesand supracrustal rocks, formed during the Brasilianoorogeny. Therefore, these data allow the timing of thistectonic phase of the Brasiliano orogeny to be broadlyconstrained to the time span 630–600 Ma.
The 587 ± 8 Ma and 573 ± 4 Ma ages of the Cachoeir-inha pluton and Cabanas granite, respectively, are consis-tent with field relationship and internal structures in theseintrusions, which suggest that the Cachoeirinha pluton isolder than the Cabanas granite (Neves et al., 2005). Thelack of large mylonitic zones in the Cachoeirinha plutonand its NNE-trending orientation indicate that it wasnot intensely affected by strike–slip-related deformation.This indication suggests that its intrusion occurred atthe beginning of the transcurrent regime that producedthe dextral EPSZ and associated sinistral shear zones.In contrast, the presence of mylonitic xenoliths and exten-sive mylonitization of the Cabanas granite along itsnorthern side indicate that its intrusion took place whenthe transcurrent regime was fully established (Neveset al., 2003).
The existing data reveal that the main phase of tec-tonomagmatic activity in the study area lasted from 630to 570 Ma, with a first phase of low-angle tectonics, fol-lowed by strike–slip shearing. The ages of the Cachoeirin-ha pluton and Cabanas granite can be interpreted asindicating that deformation associated with the EPSZ is20–30 Ma younger than that responsible for the regionalflat-lying foliation. However, at the present time, it isnot yet unequivocal whether there was a progressivechange from one regime to the other or if they are discrete
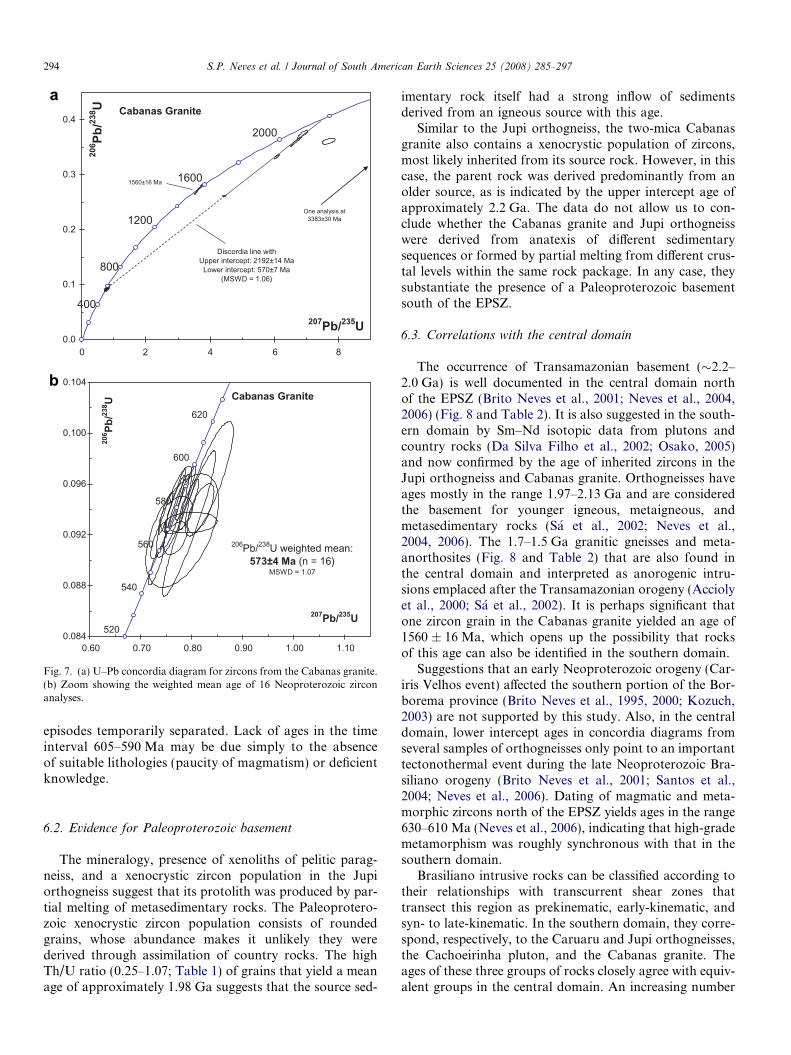
620
600
580
560
540
5200.084
0.088
0.092
0.096
0.100
0.104
0.60 0.70 0.80 0.90 1.00 1.10
207Pb/235U
206 Pb
/238 U
206Pb/238U weighted mean:573±4 Ma (n = 16)
MSWD = 1.07
Cabanas Granite
400
800
1200
1600
2000
0.0
0.1
0.2
0.3
0.4
0 2 4 6 8
207Pb/235U
206 Pb
/238 U
1560±16 Ma
One analysis at3383±30 Ma
Cabanas Granite
Discordia line withUpper intercept: 2192±14 Ma
Lower intercept: 570±7 Ma(MSWD = 1.06)
Fig. 7. (a) U–Pb concordia diagram for zircons from the Cabanas granite.(b) Zoom showing the weighted mean age of 16 Neoproterozoic zirconanalyses.
294 S.P. Neves et al. / Journal of South American Earth Sciences 25 (2008) 285–297
episodes temporarily separated. Lack of ages in the timeinterval 605–590 Ma may be due simply to the absenceof suitable lithologies (paucity of magmatism) or deficientknowledge.
6.2. Evidence for Paleoproterozoic basement
The mineralogy, presence of xenoliths of pelitic parag-neiss, and a xenocrystic zircon population in the Jupiorthogneiss suggest that its protolith was produced by par-tial melting of metasedimentary rocks. The Paleoprotero-zoic xenocrystic zircon population consists of roundedgrains, whose abundance makes it unlikely they werederived through assimilation of country rocks. The highTh/U ratio (0.25–1.07; Table 1) of grains that yield a meanage of approximately 1.98 Ga suggests that the source sed-
imentary rock itself had a strong inflow of sedimentsderived from an igneous source with this age.
Similar to the Jupi orthogneiss, the two-mica Cabanasgranite also contains a xenocrystic population of zircons,most likely inherited from its source rock. However, in thiscase, the parent rock was derived predominantly from anolder source, as is indicated by the upper intercept age ofapproximately 2.2 Ga. The data do not allow us to con-clude whether the Cabanas granite and Jupi orthogneisswere derived from anatexis of different sedimentarysequences or formed by partial melting from different crus-tal levels within the same rock package. In any case, theysubstantiate the presence of a Paleoproterozoic basementsouth of the EPSZ.
6.3. Correlations with the central domain
The occurrence of Transamazonian basement (�2.2–2.0 Ga) is well documented in the central domain northof the EPSZ (Brito Neves et al., 2001; Neves et al., 2004,2006) (Fig. 8 and Table 2). It is also suggested in the south-ern domain by Sm–Nd isotopic data from plutons andcountry rocks (Da Silva Filho et al., 2002; Osako, 2005)and now confirmed by the age of inherited zircons in theJupi orthogneiss and Cabanas granite. Orthogneisses haveages mostly in the range 1.97–2.13 Ga and are consideredthe basement for younger igneous, metaigneous, andmetasedimentary rocks (Sa et al., 2002; Neves et al.,2004, 2006). The 1.7–1.5 Ga granitic gneisses and meta-anorthosites (Fig. 8 and Table 2) that are also found inthe central domain and interpreted as anorogenic intru-sions emplaced after the Transamazonian orogeny (Acciolyet al., 2000; Sa et al., 2002). It is perhaps significant thatone zircon grain in the Cabanas granite yielded an age of1560 ± 16 Ma, which opens up the possibility that rocksof this age can also be identified in the southern domain.
Suggestions that an early Neoproterozoic orogeny (Car-iris Velhos event) affected the southern portion of the Bor-borema province (Brito Neves et al., 1995, 2000; Kozuch,2003) are not supported by this study. Also, in the centraldomain, lower intercept ages in concordia diagrams fromseveral samples of orthogneisses only point to an importanttectonothermal event during the late Neoproterozoic Bra-siliano orogeny (Brito Neves et al., 2001; Santos et al.,2004; Neves et al., 2006). Dating of magmatic and meta-morphic zircons north of the EPSZ yields ages in the range630–610 Ma (Neves et al., 2006), indicating that high-grademetamorphism was roughly synchronous with that in thesouthern domain.
Brasiliano intrusive rocks can be classified according totheir relationships with transcurrent shear zones thattransect this region as prekinematic, early-kinematic, andsyn- to late-kinematic. In the southern domain, they corre-spond, respectively, to the Caruaru and Jupi orthogneisses,the Cachoeirinha pluton, and the Cabanas granite. Theages of these three groups of rocks closely agree with equiv-alent groups in the central domain. An increasing number

Fig. 8. Simplified geological map of eastern Borborema Province showing available geochronological U–Pb and Pb–Pb ages for igneous and metaigneousrocks. All ages are U–Pb zircon ages in Ma except that labeled 1.58–168 Ga (Mo), which corresponds to monazite ages in Ga. Sources of data: Acciolyet al. (2000), Sa et al. (2002), Guimaraes et al. (2004), Neves et al. (2004), Neves et al. (2006), this work.
S.P. Neves et al. / Journal of South American Earth Sciences 25 (2008) 285–297 295
of pre-transcurrent plutons with ages between 620 and645 Ma have been recognized in the central domain (BritoNeves et al., 2003; Guimaraes et al., 2004), indicating thatthe thermal anomaly responsible for partial melting andgranite intrusion that affected this area is of approximatelythe same age as the intrusion of the protoliths of the Caru-
Table 2Summary of available geochronological data for igneous and metaigneous roc
Rock type or unit Mineral Age (Ma)
Banded orthogneiss Zircon 2125 ± 7Metagranodiorite Zircon 2097 ± 5Diotitic orthogneiss Zircon 2098 ± 15Diotitic orthogneiss Zircon 2075 ± 7Granitic gneiss Zircon 2072 ± 8Granitic gneiss Zircon 1991 ± 5Granodioritic orthogneiss Zircon 1974 ± 32Meta-anorthosite Zircon 1718 ± 19Granitic gneiss Monazite 1680 ± 100Granitic gneiss Monazite 1640 ± 90Granitic gneiss Zircon 1580 ± 90Augen gneiss Zircon 1521 ± 6Timbauba pluton Zircon 645 ± 5Caruaru orthogneiss Zircon 629 ± 9Migmatite leucosome Zircon 626 ± 15Jupi orthogneiss Zircon 606 ± 8Bom Jardim pluton Zircon 592 ± 7Caruaru–Arcoverde batholith Zircon 591 ± 5Caruaru–Arcoverde batholith Zircon 588 ± 12Caruaru–Arcoverde batholith Zircon 587 ± 5Cachoeirinha pluton Zircon 587 ± 8Cabanas Granite Zircon 573 ± 4Queimadas pluton Zircon 570 ± 24
aru and Jupi orthogneisses (629 Ma and 606 Ma, respec-tively) in the south. The most voluminous magmatism inthe central domain is represented by intrusions spatiallyassociated with strike-slip shear zones with ages mainly inthe range 592–585 Ma (Guimaraes and Da Silva Filho,1998; Brito Neves et al., 2003; Neves et al., 2004; Guimaraes
ks in eastern Borborema Province
Method Reference
U–Pb (LA-ICP-MS) Neves et al. (2006)U–Pb (LA-ICP-MS) Neves et al. (2006)Pb–Pb evaporation Neves et al. (2004)Pb–Pb evaporation Neves et al. (2004)Pb–Pb evaporation Neves et al. (2004)U–Pb (LA-ICP-MS) Neves et al. (2006)U–Pb (convencional) Sa et al. (2002)U–Pb (convencional) Accioly et al. (2000)U–Th–Pb (ion microprobe) Accioly et al. (2000)U–Th–Pb (ion microprobe) Accioly et al. (2000)U–Th–Pb (ion microprobe) Accioly et al. (2000)U–Pb (convencional) Sa et al. (2002)U–Pb (convencional) Guimaraes et al. (2004)Pb–Pb evaporation Neves et al. (2004)U–Pb (LA-ICP-MS) Neves et al. (2006)U–Pb (LA-ICP-MS) This studyU–Pb (convencional) Guimaraes et al. (2004)Pb–Pb evaporation Neves et al. (2004)U–Pb (convencional) Guimaraes et al. (2004)Pb–Pb evaporation Neves et al. (2004)U–Pb (LA-ICP-MS) This studyU–Pb (LA-ICP-MS) This studyU–Pb (convencional) Guimaraes et al. (2004)

296 S.P. Neves et al. / Journal of South American Earth Sciences 25 (2008) 285–297
et al., 2004), which overlap the age (587 Ma) of theCachoeirinha pluton. Plutons emplaced at the advancedstages of shear zone development in the central domain(Almeida et al., 2002; Guimaraes et al., 2004) are similarin age (575–570 Ma) to the Cabanas granite (Table 2).
Taken together, these results support the proposal thatthe central and southern domains underwent similar tec-tonothermal evolution during most of the Proterozoiceon. This finding weakens arguments in favor of an evolu-tion involving collage of allochtonous terranes (Santos andMedeiros, 1999; Brito Neves et al., 2000; Santos et al.,2004). Although it could be argued that previously sepa-rated blocks underwent similar geologic histories beforeconvergence and collision, it is unlikely. No evidence forpetrotectonic assemblages typical of subduction zone envi-ronments and suture zones have been documented, and theEPSZ is not a terrane boundary. Instead, detailed struc-tural study shows that the EPSZ is a relatively late Brasil-iano feature developed in an intracontinental setting(Neves et al., 1996, 2000). Therefore, the southern and cen-tral domains probably belonged to the same crustal blockbefore the onset of the Brasiliano orogeny.
7. Conclusions
This study presents the first U–Pb zircon results for thesouthern domain of the Borborema Province south of theEPSZ and places important age limits on the tectonomag-matic evolution of this region. The 606 ± 8 Ma age of theJupi orthogneiss dates the peak of high-grade Brasilianometamorphism and, consequently, the regional low-anglefoliation. Together with structural data obtained in previ-ous studies, the 587 ± 8 Ma and 573 ± 4 Ma crystalliza-tion ages of the Cachoeirinha pluton and Cabanasgranite, respectively, bracket the main period of activityof the EPSZ. The occurrence of inherited zircon compo-nents in the Jupi orthogneiss and Cabanas granite is evi-dence for a widespread Paleoproterozoic crust in thesouthern domain. These results are comparable to thosefound north of the EPSZ, which indicates these twodomains underwent similar tectonothermal evolutionduring most of the Proterozoic eon. The existence of anorogenic event of early Neoproterozoic age and thehypothesis of terrane accretion are therefore not sup-ported by the available data.
Acknowledgments
LA-ICP-MS analyses were conducted as part of post-doctoral studies by SPN, financed by the Brazilian agencyConselho Nacional de Desenvolvimento Cientıfico e Tec-
nologico (CNPq). Samples were collected during fieldworkfunded by the Fundacao de Amparo a Ciencia e Tecnologia
do Estado de Pernambuco (FACEPE).
References
Accioly, A.C.A., McReath, I., Santos, E.J., Guimaraes, I.P., Vannuci, R.,Bottazzi, R., 2000. The Passira meta-anorthositic complex and itstectonic implication, Borborema Province, Brazil. 31� InternationalGeological Congress. International Union of Geological Sciences,Abstracts, Rio de Janeiro.
Almeida, C.N., Guimaraes, I.P., Da Silva Filho, A.F., 2002. A-type post-collisional granites in the Borborema province - NE Brazil: theQueimadas pluton. Gondwana Research 5, 667–681.
Brito Neves, B.B., Van Schmus, W.R., Santos, E.J., Campos Neto, M.C.,Kozuch, M., 1995. O evento Cariris Velhos na Provıncia Borborema:integracao de dados, implicacoes e perspectivas. Revista Brasileira deGeociencias 25, 279–296.
Brito Neves, B.B., Santos, E.J., Van Schmus, W.R., 2000. Tectonichistory of the Borborema province. In: Cordani, U.G., Milani, E.J.,Thomaz Filho, A., Campos, D.A. (Eds.), Tectonic evolution of SouthAmerica. 31� International Geological Congress, Rio de Janeiro, pp.151-182.
Brito Neves, B.B., Campos Neto, M.C., Van Schmus, W.R., Fernandes,T.M.G., Souza, S.L., 2001. O terreno Alto Moxoto no leste da Paraıba(Macico Caldas Brandao). Revista Brasileira de Geociencias 31, 185–194.
Brito Neves, B.B., Passarelli, C.R., Basei, M.A.S., Santos, E.J., 2003.Idades U–Pb em zircao de alguns granitos classicos da ProvınciaBorborema. Geologia USP: Serie Cientıfica 3, 25–38.
Da Silva Filho, A.F., Guimaraes, I.P., Van Schmus, W.R., 2002. Crustalevolution of the Pernambuco-Alagoas complex, Borborema Province,NE Brazil: Nd isotopic data from Neoproterozoic granitoids. Gondw-ana Research 5, 409–422.
Dahl, P.S., 1996. The crystal-chemical basis for Ar retention in micas:inferences from interlayer partitioning and implications for geochro-nology. Contributions to Mineralogy and Petrology 123, 22–30.
Gomes, H.A., 2001. Geologia e Recursos Minerais do Estado dePernambuco. Ministerio de Minas e Energia. Secretaria de Minas eMetalurgia, CPRM – Servico Geologico do Brasil, 127 p.
Guimaraes, I.P., Brito Neves, B.B., 2004. Geochemistry characterizationof part of the Early Neoproterozoic plutonism in the CentralStructural Domain of the Borborema Province, NE Brazil. 32International Geological Congress. International Union of GeologicalSciences, Firenze.
Guimaraes, I.P., Da Silva Filho, A.F., 1998. Nd- and Sr-isotopic and U–Pb geochronologic constraints for the evolution of the shoshoniticBrasiliano Bom Jardim and Toritama complexes: evidence for aTransamazonian enriched mantle under Borborema tectonic province,Brazil. International Geology Review 40, 500–527.
Guimaraes, I.P., Da Silva Filho, A.F., Almeida, C.N., Van Schmus, W.R.,Araujo, J.M.M., Melo, S.C., Melo, E.B., 2004. Brasiliano (Pan-African) granite magmatism in the Pajeu-Paraıba belt, NortheastBrazil: an isotopic and geochronological approach. PrecambrianResearch 135, 23–53.
Kozuch, M., 2003. Isotopic and trace element geochemistry of earlyNeoproterozoic gneissic and metavolcanic rocks in the Cariris VelhosOrogen of the Borborema Province, Brazil, and their bearing ontectonic setting. PhD thesis, University of Kansas.
Medeiros, V.C., 1998. Folha Garanhuns (SC.24-Y-B): integracao geolog-ica. CPRM, Recife, unpublished internal report, 22 p.
Neves, S.P., 2003. Proterozoic history of the Borborema Province (NEBrazil): correlations with neighboring cratons and Pan-African belts,and implications for the evolution of western Gondwana. Tectonics 22,1031. doi:10.1029/2001TC00135.
Neves, S.P., Vauchez, A., Archanjo, C.J., 1996. Shear-zone controlledmagma emplacement or magma-assisted nucleation of shear zones?Insights from northeast Brazil. Tectonophysics 262, 349–365.
Neves, S.P., Vauchez, A., Feraud, G., 2000. Tectono-thermal evolution,magma emplacement, and shear zone development in the Caruaru area(Borborema Province, NE Brazil). Precambrian Research 99, 1–32.
S.P. Neves et al. / Journal of South American Earth Sciences 25 (2008) 285–297 297
Neves, S.P., Araujo, A.M.B., Correia, P.B., Mariano, G., 2003. Magneticfabrics in the Cabanas Granite (NE Brazil): interplay betweenemplacement and regional fabrics in a dextral transpressive regime.Journal of Structural Geology 25, 441–453.
Neves, S.P., Melo, S.C., Moura, C.A.V., Mariano, G., Silva, J.M.R.,2004. Zircon Pb–Pb geochronology of the Caruaru area, northeasternBrazil: temporal constraints on the Proterozoic evolution of Borbor-ema Province. International Geology Review 46, 52–63.
Neves, S.P., Mariano, G., Beltrao, B.B., Correia, P.B., 2005. Emplace-ment and deformation of the Cachoeirinha pluton (Borboremaprovince, NE Brazil) inferred through petrostructural studies:constraints on regional strain fields. Journal of South AmericanEarth Sciences 19, 127–141.
Neves, S.P., Bruguier, O., Vauchez, A., Bosch, D., Silva, J.M.R.,Mariano, G., 2006. Timing of crust formation, deposition ofsupracrustal sequences, and Transamazonian and Brasiliano meta-morphism in eastern Borborema Province (NE Brazil): implicationsfor western Gondwana assembly. Precambrian Research 149, 197–216.
Osako, L.S., 2005. Caracterizacao geologica da regiao situada entre aslocalidades de Paranatama e Currais Novos (PE), porcao centro-nortedo Complexo Pernambuco-Alagoas, Provıncia Borborema. PhDthesis, Universidade Federal de Pernambuco, Recife, 163 p.
Sa, J.M., Bertrand, J.M., Leterrier, J., Macedo, M.H.F., 2002. Geochem-istry and geochronology of pre-Brasiliano rocks from the TransversalZone, Borborema Province, Northeast Brazil. Journal of SouthAmerican Earth Sciences 14, 851–866.
Santos, E.J., Medeiros, V.C., 1999. Constraints from granitic plutonismon Proterozoic crustal growth of the Transverse Zone, BorboremaProvince, NE Brazil. Revista Brasileira de Geociencias 29, 73–84.
Santos, E.J., Nutman, A.P., Brito Neves, B.B., 2004. Idades SHRIMP U–Pb do Complexo Sertania: implicacoes sobre a evolucao tectonica dazona transversal, Provıncia Borborema. Geologia USP: Serie Cientı-fica 4, 1–12.
Wiedenbeck, M., Alle, P., Corfu, F., Griffin, W.L., Meier, M., Oberli, F.,von Quadt, A., Ruddick, J.C., Spiegel, W., 1995. Three natural zirconstandards for U–Th–Pb, Lu–Hf, trace element and REE analyses.Geostandards Newsletter 19, 1–23.

U-Pb single zircon grain dating of Present fluvial and Cenozoic aeoliansediments from Gabon: consequences on sediment provenance, reworking, and
erosion processes on the equatorial West African marginMICHEL SERANNE1, OLIVIER BRUGUIER1 and MATHIEU MOUSSAVOU2
Key-words. – West Africa margin, Continental margin, Denudation, Cenozoic, Sedimentary sources, Detrital sediment.
Abstract. – U-Pb ages obtained from detrital zircon from terrigenous sediments are used to determine the sources. Pre-sent fluvial sand-bars of the Ogooué river yield age spectra of detrital zircons in agreement with Archean and Early Pro-terozoic sources found in the drainage. The large proportion of Late Proterozoic zircons cannot be derived from primaryerosion of the watershed basement rocks, since there is no formation of that age in the area.
This later group of zircons is in good agreement with reworking of the aeolian Paleogene Batéké Sands, by re-gressive erosion in the upper reaches of the Ogooué river, as they contain a majority of Late Proterozoic age zircons.The sources of Late Proterozoic zircons in the Batéké Sand are very distant, and transported and reworked – at least inpart – by aeolian processes. Our results, together with the widely distributed Paleogene sediments over continental Afri-ca, suggests that Paleogene was a time of subdued erosion of the cratonic areas and extensive reworking, transport anddeposition within continental Africa. In contrast, our results from the Ogooué river indicate active present incision ofthe cratonic area, erosion of the previous continental sediments, and export of the river bed-load to the continental mar-gin. This temporal evolution of erosion-transport-deposition is correlated with the drastic climate change that occurredduring the Cenozoic, leading to a more efficient mechanical erosion, and it correlates with the increase of terrigenousflux to the margin, observed during the Neogene.
Datations U-Pb de zircons détritiques d’alluvions actuelles et de sables éoliens cénozoïquesau Gabon : conséquences sur les sources sédimentaires, le remaniement et l’érosion sur la
marge équatoriale d’Afrique de l’ouest
Mots-clés. – Marge Afrique de l’Ouest, Marge continentale, Dénudation, Cénozoïque, Sources sédimentaires, Sédiments détritiques.
Résumé. – Les ages U-Pb obtenus sur zircons détritiques extraits de sédiments terrigènes sont utilisés pour déterminerles sources. Les zircons issus des barres sableuses fluviatiles actuelles du fleuve Ogooué révèlent un spectre d’âge com-patible avec des sources archéennes et paléoprotérozoïques, existant dans le bassin de drainage. La proportion élevée dezircons néoprotérozoïques ne peut provenir de l’érosion primaire du substratum du bassin versant car il ne comprendpas de formations de cet âge. Ce dernier groupe de zircons peut provenir du remaniement de la formation éolienne desSables Batékés, d’âge paléogène, affleurant à l’amont du bassin versant, car elle contient une majorité des zircons d’âgenéoprotérozoïque. La source des zircons néoprotérozoïques trouvés dans les Sables Batékés sont distantes ; ils ont étéremaniés et transportés par des processus éoliens. À la lumière de la grande extension des dépôts paléogènes sur lecontinent africain, nos résultats suggèrent que le Paléogène était une période de très faible érosion du craton pendant la-quelle dominaient remaniement et transport de sédiments sur de vastes parties de l’Afrique. Au contraire, nos résultatssur les alluvions actuelles de l’Ogooué indiquent une incision très active du craton, une érosion des dépôts continentauxantérieurs, et l’évacuation de la charge détritique des rivières vers la marge continentale. Ce changement de processusd’érosion-transport-dépôt est corrélé au changement climatique majeur survenu pendant le Tertiaire, induisant une éro-sion mécanique plus efficace, et correspond à l’augmentation du flux terrigène observé sur la marge continentale, aucours du Néogène.
INTRODUCTION
The occurrence of large terrigenous depocenters on conti-nental passive margins give rise to the question of sedimentprovenance. Erosion of elevated and active orogens can ea-sily account for large sediment flux to continental margins,
as for example the erosion of the active Himalaya feeds theIndian continental margins and the Indus and Bengaldeep-sea fans (e.g. [Clift et al., 2001]. On the equatorialwest African margin, the size of the Congo deepsea fan andassociated passive margin sedimentary sequences, is surpri-singly large with respect to the tectonically stable hinter-
Bull. Soc. géol. Fr., 2008, no 1
Bull. Soc. géol. Fr., 2008, t. 179, no 1, pp. 29-40
1. Géosciences Montpellier, cc.060, CNRS-Université Montpellier 2, 34095 Montpellier, France. [email protected]. Dépt de géologie, Université des sciences et techniques Masuku, B.P. 943, Franceville, Gabon.Manuscrit déposé le 9 mars 2007; accepté après révision le 3 septembre 2007.
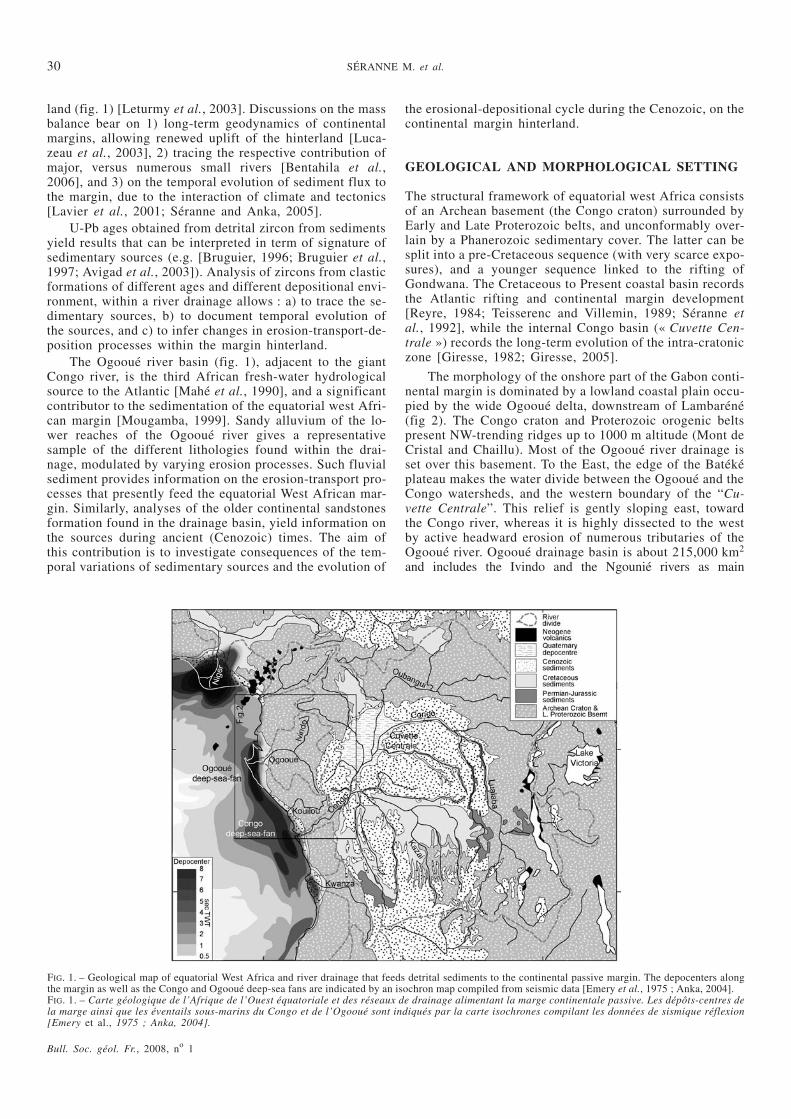
land (fig. 1) [Leturmy et al., 2003]. Discussions on the massbalance bear on 1) long-term geodynamics of continentalmargins, allowing renewed uplift of the hinterland [Luca-zeau et al., 2003], 2) tracing the respective contribution ofmajor, versus numerous small rivers [Bentahila et al.,2006], and 3) on the temporal evolution of sediment flux tothe margin, due to the interaction of climate and tectonics[Lavier et al., 2001; Séranne and Anka, 2005].
U-Pb ages obtained from detrital zircon from sedimentsyield results that can be interpreted in term of signature ofsedimentary sources (e.g. [Bruguier, 1996; Bruguier et al.,1997; Avigad et al., 2003]). Analysis of zircons from clasticformations of different ages and different depositional envi-ronment, within a river drainage allows : a) to trace the se-dimentary sources, b) to document temporal evolution ofthe sources, and c) to infer changes in erosion-transport-de-position processes within the margin hinterland.
The Ogooué river basin (fig. 1), adjacent to the giantCongo river, is the third African fresh-water hydrologicalsource to the Atlantic [Mahé et al., 1990], and a significantcontributor to the sedimentation of the equatorial west Afri-can margin [Mougamba, 1999]. Sandy alluvium of the lo-wer reaches of the Ogooué river gives a representativesample of the different lithologies found within the drai-nage, modulated by varying erosion processes. Such fluvialsediment provides information on the erosion-transport pro-cesses that presently feed the equatorial West African mar-gin. Similarly, analyses of the older continental sandstonesformation found in the drainage basin, yield information onthe sources during ancient (Cenozoic) times. The aim ofthis contribution is to investigate consequences of the tem-poral variations of sedimentary sources and the evolution of
the erosional-depositional cycle during the Cenozoic, on thecontinental margin hinterland.
GEOLOGICAL AND MORPHOLOGICAL SETTING
The structural framework of equatorial west Africa consistsof an Archean basement (the Congo craton) surrounded byEarly and Late Proterozoic belts, and unconformably over-lain by a Phanerozoic sedimentary cover. The latter can besplit into a pre-Cretaceous sequence (with very scarce expo-sures), and a younger sequence linked to the rifting ofGondwana. The Cretaceous to Present coastal basin recordsthe Atlantic rifting and continental margin development[Reyre, 1984; Teisserenc and Villemin, 1989; Séranne etal., 1992], while the internal Congo basin (« Cuvette Cen-trale ») records the long-term evolution of the intra-cratoniczone [Giresse, 1982; Giresse, 2005].
The morphology of the onshore part of the Gabon conti-nental margin is dominated by a lowland coastal plain occu-pied by the wide Ogooué delta, downstream of Lambaréné(fig 2). The Congo craton and Proterozoic orogenic beltspresent NW-trending ridges up to 1000 m altitude (Mont deCristal and Chaillu). Most of the Ogooué river drainage isset over this basement. To the East, the edge of the Batéképlateau makes the water divide between the Ogooué and theCongo watersheds, and the western boundary of the “Cu-vette Centrale”. This relief is gently sloping east, towardthe Congo river, whereas it is highly dissected to the westby active headward erosion of numerous tributaries of theOgooué river. Ogooué drainage basin is about 215,000 km2
and includes the Ivindo and the Ngounié rivers as main
Bull. Soc. géol. Fr., 2008, no 1
30 SÉRANNE M. et al.
FIG. 1. – Geological map of equatorial West Africa and river drainage that feeds detrital sediments to the continental passive margin. The depocenters alongthe margin as well as the Congo and Ogooué deep-sea fans are indicated by an isochron map compiled from seismic data [Emery et al., 1975 ; Anka, 2004].FIG. 1. – Carte géologique de l’Afrique de l’Ouest équatoriale et des réseaux de drainage alimentant la marge continentale passive. Les dépôts-centres dela marge ainsi que les éventails sous-marins du Congo et de l’Ogooué sont indiqués par la carte isochrones compilant les données de sismique réflexion[Emery et al., 1975 ; Anka, 2004].

tributaries. At the city of Lambaréné, where the river entersthe coastal plain for its final track, it has an average yearlydischarge of 4700 m3/s (although highly variable throug-hout the year) and an average suspended sediment load of19.7 106 t/y [Syvitski et al., 2005]. In spite of an averagedischarge one order of magnitude smaller than the Congo,the Ogooué has a comparable sedimentary flux (22.7 106 t/yfor the Congo). These values suggests that the Ogooué wa-tershed is a zone of active erosion and thus a significant pre-sent-day source of terrigenous sedimentation on theequatorial west African continental margin. This might nothave been true throughout geological time (e.g. [Séranneand Anka, 2005].
The Batéké Sands unconformably overly the Archeancraton and its Late Proterozoic cover, as well as the LateProterozoic Panafrican metasediments. River incision in theCuvette Centrale shows that they are also unconformableover Late Cretaceous terrigenous sediments, and are cove-red by Quaternary fluvial-lacustrine sediments. They be-long to the Kalahari system [De Ploey et al., 1968] whichextends across Africa south of the Equator, and they arecorrelated with the Cenozoic formations “Continental Ter-minal” of western Africa [Lang et al., 1990]. Two major se-dimentary sequences have been distinguished within thecontinental Batéké formation : the Grès Polymorphes andthe Sables Ocres [Cahen, 1954; Le Marechal, 1966]. Morerecent unconformable formations are described in the Cu-vette Centrale [Giresse and K’vadec, 1971] and in the coas-tal area of Gabon [Peyrot, 1998] and Congo. These younger
unconsolidated sand deposits characterise fluvio-lacustrineenvironments more or less reworked by aeolian processes;they are not present in the studied area. Dating such conti-nental formations is difficult due to the scarcity of preser-ved fossils and pollen. However there is an agreement on apost-Late Cretaceous and Pre-Miocene age (i.e. Paleogene)for the Grès Polymorphes and a Neogene age for the SablesOcres [Cahen, 1954; Le Marechal, 1966; De Ploey et al.,1968].
SAMPLING
Ogooué sands were sampled at Lambaréné (fig. 2), on thesurface of a sand bar in the active bed of the river. Itconsists of medium to coarse, well sorted sand, that is clas-sically transported as bed load and accumulated as sandbars during the two yearly high water periods (May – Juneand November – December). Such bars are formed, migrateand disappear frequently, which indicate that the sedimentssampled are typical of the current sediment bed-load of theriver. Lambaréné being located downstream of all the majortributaries of the Ogooué, this sample is thought to repre-sent a reasonably good mix of all the different sources ofthe drainage area.Batéké sands were taken from the Lékoni canyon, locatedclose to the Ogooué eastern water divide (fig. 2). The site isa tourist attraction due to the circa 150 m-incision by re-gressive erosion of the steep edge of the plateaux Batéké(650 m altitude), displaying the reddish-purple to ocre sand-stone beds. The unconsolidated sands are being activelyeroded and slope processes feed the Leconi river (tributaryof the Ogooué river) with bed-load material.
The sample comes from the top of the Paleogène GrèsPolymorphes formation (fig. 3), a white to pink, medium,well sorted and well rounded sand formation that presentsseveral metres high foresets of aeolian sand dunes. Abovethe sample, the yellow to light brown massive sand forma-tion is attributed to the Neogene Sables Ocres, which is notcomplete as it is eroded.
ANALYTICAL METHODOLOGY
Zircon grains from the sand samples were concentrated byconventional heavy liquids techniques and were subsequen-tly processed by magnetic separation using a Frantz isody-namic separator. Flawless zircons (free of visible inclusionsand fractures) from the least magnetic separates werehand-picked under alcohol and then embedded in epoxy re-sin with chips of a matrix-matching standard material(zircon standard G91500) [Wiedenbeck et al., 1995]. Themount was then slightly polished to expose the internal partof the grains, which in the case of the Ogooué sand wereobserved by scanning electron microscope (SEM) using theback-scattered electron (BSE) mode. After repolishing toremove the carbon coating, the mount was then cleanedwith soap, ultra-pure MQ water and dried with alcohol be-fore its introduction in the ablation cell. U-(Th-)Pb analyseswere performed by laser ablation ICPMS at GeosciencesMontpellier, University of Montpellier 2, following the ana-lytical procedure outlined in Bruguier et al. [2001] and gi-ven in earlier reports [Neves et al., 2006]. The spot size ofthe laser beam was 51 µm and the laser was operated using
Bull. Soc. géol. Fr., 2008, no 1
U-PB SINGLE ZIRCON GRAIN DATING OF FLUVIAL AND AEOLIAN SEDIMENTS FROM GABON 31
FIG. 2. – Geological map of the Ogooué drainage basin (thick ticked line)and surrounding area. Stars indicate the two sampling localities. Small fi-gures are radiometric ages obtained from basement rocks and compiled by[Caen-Vachette et al., 1988 ; Ledru et al., 1989].FIG. 2. – Carte géologique du bassin versant de l’Ogooué (en pointillésgras) et des zones environnantes. Les étoiles indiquent les deux localitésd’échantillonnage. Les âges radiométriques obtenus sur le substratum sontindiqués [Caen-Vachette et al., 1988 ; Ledru et al., 1989].
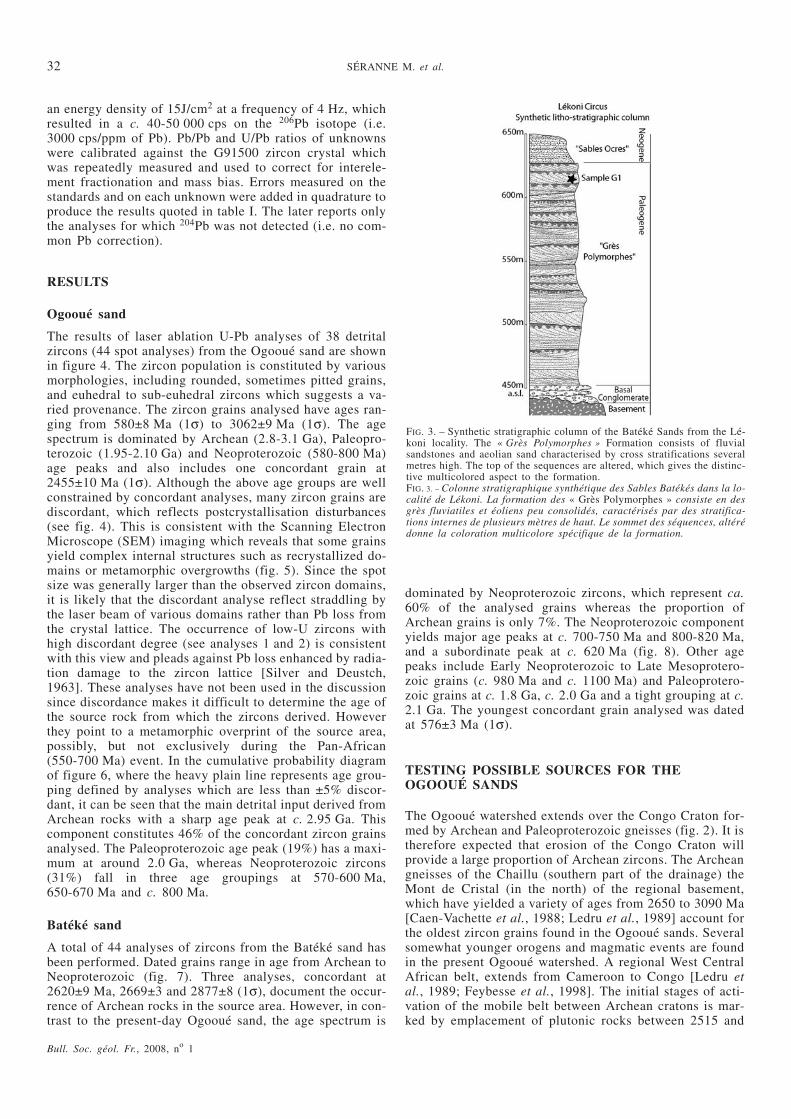
an energy density of 15J/cm2 at a frequency of 4 Hz, whichresulted in a c. 40-50 000 cps on the 206Pb isotope (i.e.3000 cps/ppm of Pb). Pb/Pb and U/Pb ratios of unknownswere calibrated against the G91500 zircon crystal whichwas repeatedly measured and used to correct for interele-ment fractionation and mass bias. Errors measured on thestandards and on each unknown were added in quadrature toproduce the results quoted in table I. The later reports onlythe analyses for which 204Pb was not detected (i.e. no com-mon Pb correction).
RESULTS
Ogooué sand
The results of laser ablation U-Pb analyses of 38 detritalzircons (44 spot analyses) from the Ogooué sand are shownin figure 4. The zircon population is constituted by variousmorphologies, including rounded, sometimes pitted grains,and euhedral to sub-euhedral zircons which suggests a va-ried provenance. The zircon grains analysed have ages ran-ging from 580±8 Ma (1σ) to 3062±9 Ma (1σ). The agespectrum is dominated by Archean (2.8-3.1 Ga), Paleopro-terozoic (1.95-2.10 Ga) and Neoproterozoic (580-800 Ma)age peaks and also includes one concordant grain at2455±10 Ma (1σ). Although the above age groups are wellconstrained by concordant analyses, many zircon grains arediscordant, which reflects postcrystallisation disturbances(see fig. 4). This is consistent with the Scanning ElectronMicroscope (SEM) imaging which reveals that some grainsyield complex internal structures such as recrystallized do-mains or metamorphic overgrowths (fig. 5). Since the spotsize was generally larger than the observed zircon domains,it is likely that the discordant analyse reflect straddling bythe laser beam of various domains rather than Pb loss fromthe crystal lattice. The occurrence of low-U zircons withhigh discordant degree (see analyses 1 and 2) is consistentwith this view and pleads against Pb loss enhanced by radia-tion damage to the zircon lattice [Silver and Deustch,1963]. These analyses have not been used in the discussionsince discordance makes it difficult to determine the age ofthe source rock from which the zircons derived. Howeverthey point to a metamorphic overprint of the source area,possibly, but not exclusively during the Pan-African(550-700 Ma) event. In the cumulative probability diagramof figure 6, where the heavy plain line represents age grou-ping defined by analyses which are less than ±5% discor-dant, it can be seen that the main detrital input derived fromArchean rocks with a sharp age peak at c. 2.95 Ga. Thiscomponent constitutes 46% of the concordant zircon grainsanalysed. The Paleoproterozoic age peak (19%) has a maxi-mum at around 2.0 Ga, whereas Neoproterozoic zircons(31%) fall in three age groupings at 570-600 Ma,650-670 Ma and c. 800 Ma.
Batéké sand
A total of 44 analyses of zircons from the Batéké sand hasbeen performed. Dated grains range in age from Archean toNeoproterozoic (fig. 7). Three analyses, concordant at2620±9 Ma, 2669±3 and 2877±8 (1σ), document the occur-rence of Archean rocks in the source area. However, in con-trast to the present-day Ogooué sand, the age spectrum is
dominated by Neoproterozoic zircons, which represent ca.60% of the analysed grains whereas the proportion ofArchean grains is only 7%. The Neoproterozoic componentyields major age peaks at c. 700-750 Ma and 800-820 Ma,and a subordinate peak at c. 620 Ma (fig. 8). Other agepeaks include Early Neoproterozoic to Late Mesoprotero-zoic grains (c. 980 Ma and c. 1100 Ma) and Paleoprotero-zoic grains at c. 1.8 Ga, c. 2.0 Ga and a tight grouping at c.2.1 Ga. The youngest concordant grain analysed was datedat 576±3 Ma (1σ).
TESTING POSSIBLE SOURCES FOR THEOGOOUÉ SANDS
The Ogooué watershed extends over the Congo Craton for-med by Archean and Paleoproterozoic gneisses (fig. 2). It istherefore expected that erosion of the Congo Craton willprovide a large proportion of Archean zircons. The Archeangneisses of the Chaillu (southern part of the drainage) theMont de Cristal (in the north) of the regional basement,which have yielded a variety of ages from 2650 to 3090 Ma[Caen-Vachette et al., 1988; Ledru et al., 1989] account forthe oldest zircon grains found in the Ogooué sands. Severalsomewhat younger orogens and magmatic events are foundin the present Ogooué watershed. A regional West CentralAfrican belt, extends from Cameroon to Congo [Ledru etal., 1989; Feybesse et al., 1998]. The initial stages of acti-vation of the mobile belt between Archean cratons is mar-ked by emplacement of plutonic rocks between 2515 and
Bull. Soc. géol. Fr., 2008, no 1
32 SÉRANNE M. et al.
FIG. 3. – Synthetic stratigraphic column of the Batéké Sands from the Lé-koni locality. The « Grès Polymorphes » Formation consists of fluvialsandstones and aeolian sand characterised by cross stratifications severalmetres high. The top of the sequences are altered, which gives the distinc-tive multicolored aspect to the formation.FIG. 3. – Colonne stratigraphique synthétique des Sables Batékés dans la lo-calité de Lékoni. La formation des « Grès Polymorphes » consiste en desgrès fluviatiles et éoliens peu consolidés, caractérisés par des stratifica-tions internes de plusieurs mètres de haut. Le sommet des séquences, altérédonne la coloration multicolore spécifique de la formation.

Bull. Soc. géol. Fr., 2008, no 1
U-PB SINGLE ZIRCON GRAIN DATING OF FLUVIAL AND AEOLIAN SEDIMENTS FROM GABON 33
TABLE 1. – U-Th-Pb laser ablation ICP-MS results for zircons from the Ogooué and Batéké sandsAll grains were selected from non magnetic separates at full magnetic field in Frantz magnetic separator.All analyses have 204Pb below detection limits and the quoted ratios are only corrected for Pb/Pb mass bias and U/Pb inter-element fractionation (uncor-rected for common Pb). * stands for radiogenicDisc. (%) is percentage discordance assuming recent lead losses.TABL. I. – Résultats des analyses U-Th-Pb par ICP-MS ablation laser pour les zircons de l’Ogooué et des sables Batéké. Tous les grains ont été sélection-nés parmi la fraction non magnétique traitée par un séparateur magnétique Frantz. Toutes les analyses ont un 204Pb inférieur au seuil de détection et lesrapports ne sont corrigés que de la discrimination de masse pour le Pb/Pb et du fractionnement du rapport inter élément U/Pb. (*) indique les isotopes ra-diogéniques. Disc (%) indique les pourcentages de discordance résultant des pertes en plomb récentes.
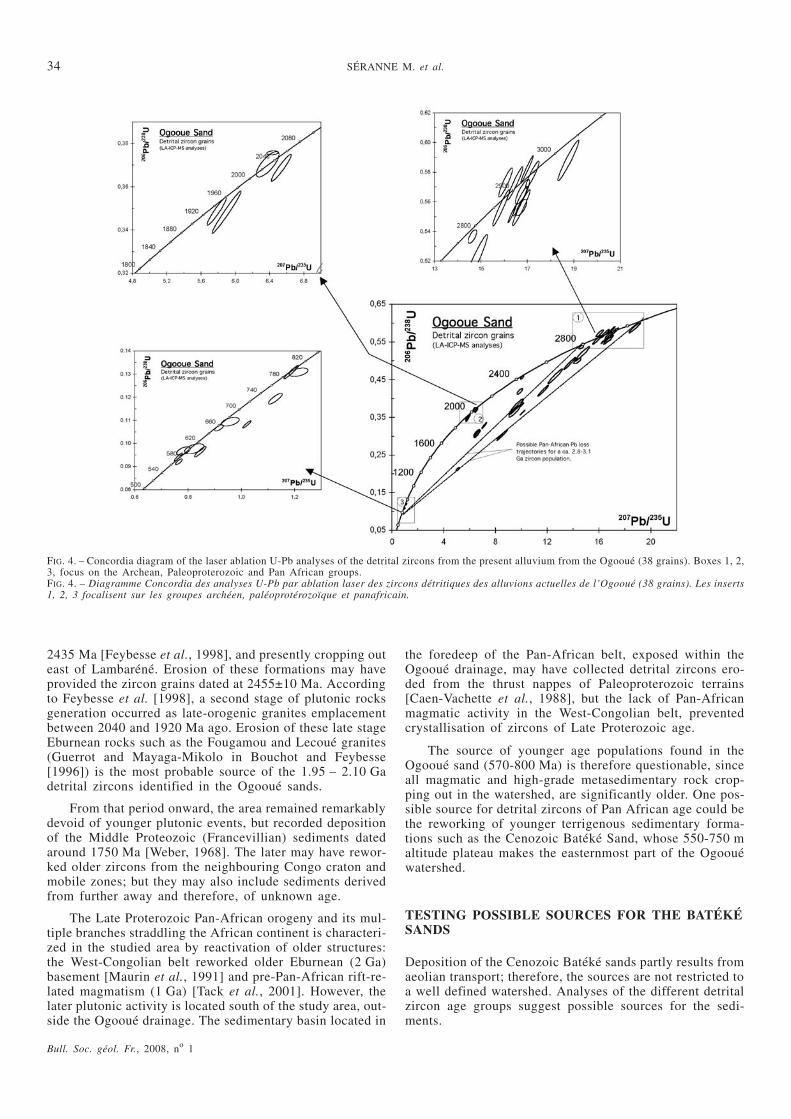
2435 Ma [Feybesse et al., 1998], and presently cropping outeast of Lambaréné. Erosion of these formations may haveprovided the zircon grains dated at 2455±10 Ma. Accordingto Feybesse et al. [1998], a second stage of plutonic rocksgeneration occurred as late-orogenic granites emplacementbetween 2040 and 1920 Ma ago. Erosion of these late stageEburnean rocks such as the Fougamou and Lecoué granites(Guerrot and Mayaga-Mikolo in Bouchot and Feybesse[1996]) is the most probable source of the 1.95 – 2.10 Gadetrital zircons identified in the Ogooué sands.
From that period onward, the area remained remarkablydevoid of younger plutonic events, but recorded depositionof the Middle Proteozoic (Francevillian) sediments datedaround 1750 Ma [Weber, 1968]. The later may have rewor-ked older zircons from the neighbouring Congo craton andmobile zones; but they may also include sediments derivedfrom further away and therefore, of unknown age.
The Late Proterozoic Pan-African orogeny and its mul-tiple branches straddling the African continent is characteri-zed in the studied area by reactivation of older structures:the West-Congolian belt reworked older Eburnean (2 Ga)basement [Maurin et al., 1991] and pre-Pan-African rift-re-lated magmatism (1 Ga) [Tack et al., 2001]. However, thelater plutonic activity is located south of the study area, out-side the Ogooué drainage. The sedimentary basin located in
the foredeep of the Pan-African belt, exposed within theOgooué drainage, may have collected detrital zircons ero-ded from the thrust nappes of Paleoproterozoic terrains[Caen-Vachette et al., 1988], but the lack of Pan-Africanmagmatic activity in the West-Congolian belt, preventedcrystallisation of zircons of Late Proterozoic age.
The source of younger age populations found in theOgooué sand (570-800 Ma) is therefore questionable, sinceall magmatic and high-grade metasedimentary rock crop-ping out in the watershed, are significantly older. One pos-sible source for detrital zircons of Pan African age could bethe reworking of younger terrigenous sedimentary forma-tions such as the Cenozoic Batéké Sand, whose 550-750 maltitude plateau makes the easternmost part of the Ogoouéwatershed.
TESTING POSSIBLE SOURCES FOR THE BATÉKÉSANDS
Deposition of the Cenozoic Batéké sands partly results fromaeolian transport; therefore, the sources are not restricted toa well defined watershed. Analyses of the different detritalzircon age groups suggest possible sources for the sedi-ments.
Bull. Soc. géol. Fr., 2008, no 1
34 SÉRANNE M. et al.
FIG. 4. – Concordia diagram of the laser ablation U-Pb analyses of the detrital zircons from the present alluvium from the Ogooué (38 grains). Boxes 1, 2,3, focus on the Archean, Paleoproterozoic and Pan African groups.FIG. 4. – Diagramme Concordia des analyses U-Pb par ablation laser des zircons détritiques des alluvions actuelles de l’Ogooué (38 grains). Les inserts1, 2, 3 focalisent sur les groupes archéen, paléoprotérozoïque et panafricain.
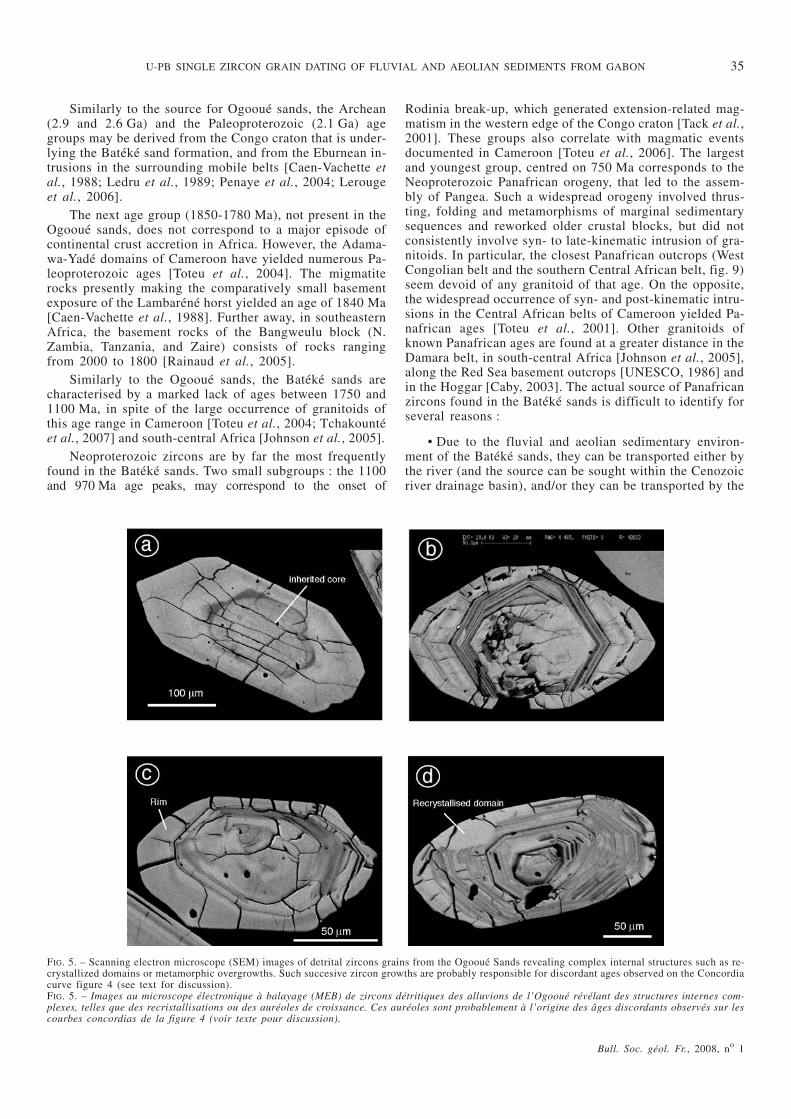
Similarly to the source for Ogooué sands, the Archean(2.9 and 2.6 Ga) and the Paleoproterozoic (2.1 Ga) agegroups may be derived from the Congo craton that is under-lying the Batéké sand formation, and from the Eburnean in-trusions in the surrounding mobile belts [Caen-Vachette etal., 1988; Ledru et al., 1989; Penaye et al., 2004; Lerougeet al., 2006].
The next age group (1850-1780 Ma), not present in theOgooué sands, does not correspond to a major episode ofcontinental crust accretion in Africa. However, the Adama-wa-Yadé domains of Cameroon have yielded numerous Pa-leoproterozoic ages [Toteu et al., 2004]. The migmatiterocks presently making the comparatively small basementexposure of the Lambaréné horst yielded an age of 1840 Ma[Caen-Vachette et al., 1988]. Further away, in southeasternAfrica, the basement rocks of the Bangweulu block (N.Zambia, Tanzania, and Zaire) consists of rocks rangingfrom 2000 to 1800 [Rainaud et al., 2005].
Similarly to the Ogooué sands, the Batéké sands arecharacterised by a marked lack of ages between 1750 and1100 Ma, in spite of the large occurrence of granitoids ofthis age range in Cameroon [Toteu et al., 2004; Tchakountéet al., 2007] and south-central Africa [Johnson et al., 2005].
Neoproterozoic zircons are by far the most frequentlyfound in the Batéké sands. Two small subgroups : the 1100and 970 Ma age peaks, may correspond to the onset of
Rodinia break-up, which generated extension-related mag-matism in the western edge of the Congo craton [Tack et al.,2001]. These groups also correlate with magmatic eventsdocumented in Cameroon [Toteu et al., 2006]. The largestand youngest group, centred on 750 Ma corresponds to theNeoproterozoic Panafrican orogeny, that led to the assem-bly of Pangea. Such a widespread orogeny involved thrus-ting, folding and metamorphisms of marginal sedimentarysequences and reworked older crustal blocks, but did notconsistently involve syn- to late-kinematic intrusion of gra-nitoids. In particular, the closest Panafrican outcrops (WestCongolian belt and the southern Central African belt, fig. 9)seem devoid of any granitoid of that age. On the opposite,the widespread occurrence of syn- and post-kinematic intru-sions in the Central African belts of Cameroon yielded Pa-nafrican ages [Toteu et al., 2001]. Other granitoids ofknown Panafrican ages are found at a greater distance in theDamara belt, in south-central Africa [Johnson et al., 2005],along the Red Sea basement outcrops [UNESCO, 1986] andin the Hoggar [Caby, 2003]. The actual source of Panafricanzircons found in the Batéké sands is difficult to identify forseveral reasons :
• Due to the fluvial and aeolian sedimentary environ-ment of the Batéké sands, they can be transported either bythe river (and the source can be sought within the Cenozoicriver drainage basin), and/or they can be transported by the
Bull. Soc. géol. Fr., 2008, no 1
U-PB SINGLE ZIRCON GRAIN DATING OF FLUVIAL AND AEOLIAN SEDIMENTS FROM GABON 35
FIG. 5. – Scanning electron microscope (SEM) images of detrital zircons grains from the Ogooué Sands revealing complex internal structures such as re-crystallized domains or metamorphic overgrowths. Such succesive zircon growths are probably responsible for discordant ages observed on the Concordiacurve figure 4 (see text for discussion).FIG. 5. – Images au microscope électronique à balayage (MEB) de zircons détritiques des alluvions de l’Ogooué révélant des structures internes com-plexes, telles que des recristallisations ou des auréoles de croissance. Ces auréoles sont probablement à l’origine des âges discordants observés sur lescourbes concordias de la figure 4 (voir texte pour discussion).

wind (and possibly come from outside the river watershed).The Batéké sands belong to the Cenozoic sandstones cove-ring most of the Congo cuvette; since there are no mappedPanafrican granitoids within the Congo watershed[UNESCO, 1986], a long-distance aeolian transport must beinvoked to account for the Neoproterozoic zircons.
• Alternatively, the Batéké sands rework earlier,post-Panafrican, extensive continental clastic formations,derived from the erosion of Neoproterozoic terranes. As aresult, zircons reworked from the post-Panafrican sedimen-tary sequences are mixed with zircons delivered by Paleo-gene erosion. This especially applies to the extensiveCretaceous terrigenous formations that are underlying theCenozoic sandstones of the Congo Cuvette, and has alreadybeen documented by [De Ploey et al., 1968]. The problemof the origin of zircons becomes more complex if theyare derived from reworked sedimentary formations ofpre-Atlantic rifting, as South American plate sources shouldthen be considered. In any case, the Batéké sands are domi-nantly derived from erosion of several, distant sources, witha minimum of 500 km (for Cameroon source zone).
IMPLICATION FOR EVOLUTION OF EROSIONPROCESSES DURING CENOZOIC
The contrasted detrital zircon composition of the two stu-died samples clearly shows a change in the sources for thehost sediment. We interpret this change as characterizing achange of erosion and transport processes that led to the de-position of the Batéké Sands during the Paleogene and ofthe Ogooué Sands in the present time.
The sources of present-day Ogooué sediments are allwithin the river watershed. Our results give evidence for ac-tive mechanical denudation of the craton, while headwarderosion of the poorly lithified Batéké Sands provides a
secondary source for alluvium. The sources of the CenozoicBatéké Sands gives evidence for predominant erosion of thePanafrican belts and secondary input from Archean craton.These contrasted sedimentary sources reflect a different dis-tribution of exposed Archean, Proterozoic and Panafricanterrains. The low proportion of Archean input in the BatékéSands may be due to more extensive sedimentary cover ofthe cratons during the Paleogene than presently.
Indeed, headward erosion of the Batéké Sand hills tothe east, and of the Atlantic rift margin sediments to thewest [Anka, 2004] suggests that at least the margins of theAchean cratons were covered until the Neogene. Unpublis-hed data and ongoing studies on apatite fission track analy-ses [see Anka, 2004] as well as regional studies of theuplift-erosion of the onshore Atlantic margin [Séranne andAnka, 2005] document erosional denudation of the craton,now appearing as a window between the Congo cuvette andthe coastal Mesozoic-Cenozoic basins. In addition, exten-sive weathering mantles that developed over long-term pe-riods, during the Cretaceous and Paleogene [Tardy andRoquin, 1998; Gunnell, 2003] may have protected the base-ment from mechanical erosion.
One drastic difference in the Paleogene vs Present ero-sion-transport-deposition systems comes from the obviousobservation of extensive Paleogene sediment distributionover wide areas of continental Africa [Lepersonne, 1961;Guiraud et al., 2005; Haddon and McCarthy, 2005] whichsuggests that depositional processes were dominant overerosion, and that extensive areas were subjected to deposi-tion or reworking of terrigenous sediments. In contrast,Quaternary continental deposition is restricted to the lowerpart of the Cuvette Centrale and the lowermost Ogooué del-ta, while incision and erosion processes dominate morpho-genesis of most of the region.
Bull. Soc. géol. Fr., 2008, no 1
36 SÉRANNE M. et al.
FIG. 6. – Cumulative probability diagram of Ogo-oué Sands analyses. The heavy plain line representsage grouping defined by analyses which are lessthan ± 5% discordant. This defines uneven groups:almost half of the zircons are Archean in age, onefifth are Paleoproterozoic and nearly one third areNeoproterozoic (Panafrican).FIG. 6. – Histogramme des âges obtenus sur leszircons des sables de l’Ogooué. La ligne continuereprésente les âges définis par les analyses qui pré-sentent moins de 5 % de discordance. Trois groupessont ainsi définis : quasiment la moitié des zirconssont archéens, un cinquième sont paléoprotérozoï-ques et presque un tiers sont néoprotérozoïques(Panafricain).

Alternatively – or possibly in conjunction with – diffe-rent forcings on the mechanical erosion and weathering pro-cesses active during Batéké Sand deposition can account forthe observed change. The increased amplitude of high-fre-quency climate changes driven by glacial – interglacial suc-cessions that occurred during the Neogene, and thatdrastically increased in Plio-Pleistocene times, may have fa-voured mechanical erosion [Séranne, 1999; Molnar, 2004].Geomorphology of equatorial west Africa clearly indicatesNeogene river incision, and dismanteling of possible old alte-rite cover [Peyrot, 1998; Tardy and Roquin, 1998].
Geochemical analyses of the Congo river at Brazzavilleindicate that present mechanical erosion rates (8 t/km2/y)outweighs chemical erosion rates (5 t/km2/y) in the ups-tream watershed [Gaillardet et al., 1995]. Similar climate inthe adjacent Ogooué basin would suggest a similar propor-tion of mechanical and chemical erosion. However, the relati-vely large suspended load (19.7 t/y for an area of 0.14106 km2) presently carried by the river compared with that ofthe Congo 22.8 t/y for an area of 3.7 106 km2) [data fromHarrison, 2000; http://www.wsag.unh.edu/index.html] clear-ly indicate a denudation rate one order of magnitude higherin the Ogooué than in the Congo watersheds (0.06 mm/y and0.002 mm/y, respectively). The different proportions of litho-logies exposed in the two watershed considered (dominantlysandy in the Congo, and dominantly cratonic in the Ogooué),and / or the higher mean slope gradient in the Ogooué basin,may account for such a discrepancy. The amount and distri-bution of erosion in equatorial west Africa during the Tertia-ry has been analysed by extrapolation of geological relictsurfaces [Leturmy et al., 2003]. It shows that the basementin the Ogooué watershed has suffered denudation rangingfrom several hundreds of metres up to 1 km. Such values ofdenudation are consistent with the high values gradient forthe coastal rivers (such as the Ogooué) compared with thelow gradient characterizing the Congo tributaries [Leturmyet al., 2003]. High strontium isotopic ratios from Pleisto-cene sediments, cored off the Ogooué mouth [Bentahila etal., 2006], are in agreement with a sedimentary source mos-tly derived from the Archaean craton underlying the Ogo-oué drainage, and in strong contrast with the much lowervalues characterizing the strontium isotopic ratio of the ri-vers draining the Batéké sands. Accordingly, low radiogenicvalues from the Batéké sands indicate that they have a muchyounger source, or includes a significant proportion of ayounger component. These independant sets of data support
Bull. Soc. géol. Fr., 2008, no 1
U-PB SINGLE ZIRCON GRAIN DATING OF FLUVIAL AND AEOLIAN SEDIMENTS FROM GABON 37
FIG. 7. – Concordia diagram of the laser ablation U-Pb analyses of the de-trital zircons from the Paleogene Batéké Sands (44 grains).FIG. 7. – Diagramme concordia des analyses U-Pb par ablation laser deszircons détritiques de la formation paléogène des Sables Batéké(44 grains).
FIG. 8. – Cumulative probability diagram of BatékéSands analyses. In the Paleogene Batéké Sands,60% of the analysed zircons are Neoproterozoic(Panafrican) in age, while the remaining oldergrains are spanning the Paleoproterozoic andArchean.FIG. 8. – Histogramme des âges obtenus par ana-lyse des zircons des sables Batéké. Dans cette for-mation paléogène, 60 % des zircons analysés sontd’âge protérozoïque (Panafricains), alors que lesgrains plus vieux sont répartis dans le Paléoproté-rozoïque et l’Archéen.
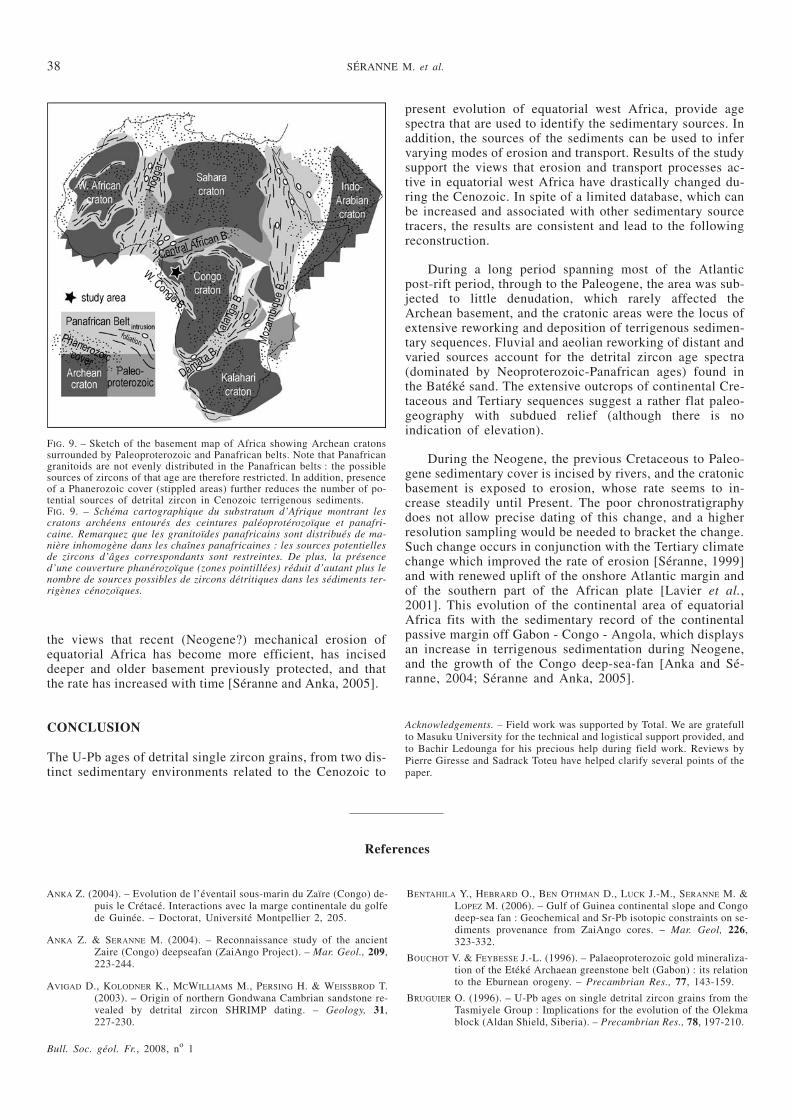
the views that recent (Neogene?) mechanical erosion ofequatorial Africa has become more efficient, has inciseddeeper and older basement previously protected, and thatthe rate has increased with time [Séranne and Anka, 2005].
CONCLUSION
The U-Pb ages of detrital single zircon grains, from two dis-tinct sedimentary environments related to the Cenozoic to
present evolution of equatorial west Africa, provide agespectra that are used to identify the sedimentary sources. Inaddition, the sources of the sediments can be used to infervarying modes of erosion and transport. Results of the studysupport the views that erosion and transport processes ac-tive in equatorial west Africa have drastically changed du-ring the Cenozoic. In spite of a limited database, which canbe increased and associated with other sedimentary sourcetracers, the results are consistent and lead to the followingreconstruction.
During a long period spanning most of the Atlanticpost-rift period, through to the Paleogene, the area was sub-jected to little denudation, which rarely affected theArchean basement, and the cratonic areas were the locus ofextensive reworking and deposition of terrigenous sedimen-tary sequences. Fluvial and aeolian reworking of distant andvaried sources account for the detrital zircon age spectra(dominated by Neoproterozoic-Panafrican ages) found inthe Batéké sand. The extensive outcrops of continental Cre-taceous and Tertiary sequences suggest a rather flat paleo-geography with subdued relief (although there is noindication of elevation).
During the Neogene, the previous Cretaceous to Paleo-gene sedimentary cover is incised by rivers, and the cratonicbasement is exposed to erosion, whose rate seems to in-crease steadily until Present. The poor chronostratigraphydoes not allow precise dating of this change, and a higherresolution sampling would be needed to bracket the change.Such change occurs in conjunction with the Tertiary climatechange which improved the rate of erosion [Séranne, 1999]and with renewed uplift of the onshore Atlantic margin andof the southern part of the African plate [Lavier et al.,2001]. This evolution of the continental area of equatorialAfrica fits with the sedimentary record of the continentalpassive margin off Gabon - Congo - Angola, which displaysan increase in terrigenous sedimentation during Neogene,and the growth of the Congo deep-sea-fan [Anka and Sé-ranne, 2004; Séranne and Anka, 2005].
Acknowledgements. – Field work was supported by Total. We are gratefullto Masuku University for the technical and logistical support provided, andto Bachir Ledounga for his precious help during field work. Reviews byPierre Giresse and Sadrack Toteu have helped clarify several points of thepaper.
Bull. Soc. géol. Fr., 2008, no 1
38 SÉRANNE M. et al.
FIG. 9. – Sketch of the basement map of Africa showing Archean cratonssurrounded by Paleoproterozoic and Panafrican belts. Note that Panafricangranitoids are not evenly distributed in the Panafrican belts : the possiblesources of zircons of that age are therefore restricted. In addition, presenceof a Phanerozoic cover (stippled areas) further reduces the number of po-tential sources of detrital zircon in Cenozoic terrigenous sediments.FIG. 9. – Schéma cartographique du substratum d’Afrique montrant lescratons archéens entourés des ceintures paléoprotérozoïque et panafri-caine. Remarquez que les granitoïdes panafricains sont distribués de ma-nière inhomogène dans les chaînes panafricaines : les sources potentiellesde zircons d’âges correspondants sont restreintes. De plus, la présenced’une couverture phanérozoïque (zones pointillées) réduit d’autant plus lenombre de sources possibles de zircons détritiques dans les sédiments ter-rigènes cénozoïques.
References
ANKA Z. (2004). – Evolution de l’éventail sous-marin du Zaïre (Congo) de-puis le Crétacé. Interactions avec la marge continentale du golfede Guinée. – Doctorat, Université Montpellier 2, 205.
ANKA Z. & SERANNE M. (2004). – Reconnaissance study of the ancientZaire (Congo) deepseafan (ZaiAngo Project). – Mar. Geol., 209,223-244.
AVIGAD D., KOLODNER K., MCWILLIAMS M., PERSING H. & WEISSBROD T.(2003). – Origin of northern Gondwana Cambrian sandstone re-vealed by detrital zircon SHRIMP dating. – Geology, 31,227-230.
BENTAHILA Y., HEBRARD O., BEN OTHMAN D., LUCK J.-M., SERANNE M. &LOPEZ M. (2006). – Gulf of Guinea continental slope and Congodeep-sea fan : Geochemical and Sr-Pb isotopic constraints on se-diments provenance from ZaiAngo cores. – Mar. Geol, 226,323-332.
BOUCHOT V. & FEYBESSE J.-L. (1996). – Palaeoproterozoic gold mineraliza-tion of the Etéké Archaean greenstone belt (Gabon) : its relationto the Eburnean orogeny. – Precambrian Res., 77, 143-159.
BRUGUIER O. (1996). – U-Pb ages on single detrital zircon grains from theTasmiyele Group : Implications for the evolution of the Olekmablock (Aldan Shield, Siberia). – Precambrian Res., 78, 197-210.
BRUGUIER O., LANCELOT J. R. & MALAVIEILLE J. (1997). – U-Pb dating onsingle detrital zircon grains from the Triassic Songpan-Ganzeflysch (Central China) : evidence for a Sino-Korean provenanceand tectonic correlations. – Earth Planet. Sci. Lett., 152,217-231.
BRUGUIER O., TELOUK P., COCHERIE A., FOUILLAC A. M. & ALBAREDE F.(2001). – Evaluation of Pb-Pb and U-Pb laser ablation ICP-MSzircon dating using matrix matched calibration samples with afrequency quadrupled (266 nm) Nd : YAG laser. – Geostand.Newslett., 25, 361-373,
CABY R. (2003). – Terrane assembly and geodynamic evolution of cen-tral–western Hoggar : a synthesis. – J. African Earth Sci., 37,133-159.
CAEN-VACHETTE M., VIALETTE Y., BASSOT J.-P. & VIDAL P. (1988). –Apport de la géochronologie isotopique à la connaissance de lagéologie gabonaise. – Chron. Rech. Min., 491, 35-53.
CAHEN L. (1954). – Géologie du Congo Belge. – Masson Editeur, Paris,577p.
CLIFT P. D., SHIMIZU N., LAYNE G., BLUSZTAJN J. S., GAEDICKE C.,SCHLÜTER H.-U., CLARK M. K. & AMJAD S. (2001). – Develop-ment of the Indus fan and its significance for erosional historyof the western Himalaya and Karakoram. – Geol. Soc. Amer.Bull., 113, 8, 1039-1051.
DE PLOEY J., LEPERSONNE J. & STOOPS G. (1968). – Sédimentologie et ori-gine des sables de la série des Sables Ocre et de la série des« Grès Polymorphes » (système du Kalahari) au Congo Occi-dental. – Musée Royal de l’Afrique Centrale, Tervuren, Bel-gique, 72.
EMERY K. O., UCHUPI E., PHILLIPS J., BOWIN C. O. & MASCLE J. (1975). –Continental margin off western Africa : Angola to Sierra Leone.– Am. Assoc. Petrol. Geol. Bull., 59, 12, 2209-2265.
FEYBESSE J. L., JOHAN V., TRIBOULET C., GUERROT C., MAYAGA-MIKOLO F.,BOUCHOT V. & N’DONGD J. E. (1998). – The West Central Afri-can belt : a model of 2.5–2.0 Ga accretion and two-phase oroge-nic evolution. – Precambrian Res., 87, 3-4, 161-216.
GAILLARDET J., DUPRE B. & ALLEGRE C. J. (1995). – A global geochemicalmass budget applied to the Congo basin rivers : Erosion ratesand continental crust composition. – Geochim. Cosmochim.Acta, 59, 17, 3469-3485.
GIRESSE P. & K’VADEC J.P. (1971). – Lithologie stratigraphique et paléocli-matologie des formations néogènes et quaternaies de la cuvettedu Congo-Brazzaville. – C.R.Somm. Séances Soc. géol. France,7, 360-361,
GIRESSE P. (1982). – La succession des sédimentations dans les bassins ma-rins et continentaux du Congo depuis le début du Mésozoïque. –Sciences Géologiques, 35, 4, 183-206.
GIRESSE P. (2005). – Meso-Cenozoic history of the Congo basin. – J. Afr.Earth Sci., 43, 301-315.
GUIRAUD R., BOSTHWORTH W., THIERRY J. & DELPLANQUE A. (2005). – Pha-nerozoic geological evolution of northern and central Africa : anoverview. – J. Afr. Earth Sci., 43, 83-143.
GUNNELL Y. (2003). – Radiometric ages of laterites and constraints onlong-term denudation rates in West Africa. – Geology, 31,131-134.
HADDON I. G. & MCCARTHY T. S. (2005). – The Mesozoic-Cenozoic inte-rior sag basins of Central Africa : The Late Cretaceous-Ceno-zoic Kalahari and Okavango basins. – J. Afr. Earth Sci., 43,316-333.
HARRISON C. G. A. (2000). – What factors control mechanical erosion ra-tes? – Internat. J. Earth Sci., 88, 752-763.
JOHNSON S. P., RIVERS T. & DE WAELE B. (2005). – A review of the Meso-proterozoic to early Palaeozoic magmatic and tectonothermalhistory of south-central Africa : implications for Rodinia andGondwana. – J. Geol. Soc. London, 162, 3, 433-450.
LANG J., KOGBE C., ALIDOU S., AZOUMA K. A., BELLION G., DUBOIS D.,DURAND A., GUIRAUD R., HOUESSOU A., KLASZ I. D., ROMANN
E., SALARD-CHEBOLDAEFF M. & TRICHET J. (1990). – The Conti-nental Terminal in West Africa. – J. Afr. Earth Sci., 10, n1/2,79-99.
LAVIER L., STECKLER M. S. & BRIGAUD F. (2001). – Climatic and tectoniccontrol on the Cenozoic evolution of the West African margin. –Mar. Geol., 178, 63-80.
LE MARECHAL A. (1966). – Contribution à l’étude des plateaux Batéké –Géologie, géomorphologie, hydrogéologie. – ORSTOM, Unpu-blished report, cote orstom-Brazzaville M.C., 137p.
LEDRU P., N’DONG J. E., JOHAN V., PRIAN J.-P., COSTE B. & HACCARD D.(1989). – Structural and metamorphic evolution of the GabonOrogenic belt : Collision tectonics in the lower Proterozoic? –Precambrian Res., 44, 227-241.
LEPERSONNE J. (1961). – Quelques problèmes de l’histoire géologique del’Afrique, au sud du Sahara, depuis la fin du Carbonifère. –Annales Soc. Géol. Belgique, 84, 1, 21-85.
LEROUGE C., COCHERIE A., TOTEU S. F., PENAYE J., MILESI J.-P., TCHAMENI
R., NSIFA E. N., FANNING C. M. & DELOULE E. (2006). – ShrimpU–Pb zircon age evidence for Paleoproterozoic sedimentationand 2.05 Ga syntectonic plutonism in the Nyong Group, South-western Cameroon : consequences for the Eburnean–Transama-zonian belt of NE Brazil and Central Africa. – J. Afr. Earth Sci.,44, 413-427.
LETURMY P., LUCAZEAU F. & BRIGAUD F. (2003). – Dynamic interactionsbetween the Gulf of Guinea passive margin and the Congo Riverdrainage basin : 1. Morphology and mass balance. – J. Geophys.Res., 108, B8, ETG 8-1.
LUCAZEAU F., BRIGAUD F. & LETURMY P. (2003). – Dynamic interactionsbetween the Gulf of Guinea passive margin and the Congo Riverdrainage basin : 2. Isostasy and uplift. – J. Geophys. Res., 108,B8, ETG 9-1.
MAHE G., LERIQUE J. & OLIVRY J.-C. (1990). – L’Ogooué au Gabon. Re-constitution des débits manquants et mise en évidence de varia-tions climatiques à l’équateur. – Hydrol. Continent., 5, 2,105-124.
MAURIN J.C., BOUDZOUMOU F., DJAMA L.-M., GIOAN P., MICHARD A.,MPEMBA-BONI J., PEUCAT J.-J., PIN C. & VICAT C. (1991). – Lachaîne protérozoïque ouestcongolienne et son avant pays auCongo : nouvelles données géochronologiques et structurales,implications en Afrique centrale. – C.R. Acad. Sci., Paris, 312,1327-1334.
MOLNAR J. (2004). – Late Cenozoic increase in accumulationn rates of ter-restrial sediments : How might climate change have affectederosion rates? – Ann. Rev. Earth Planet. Sci., 32, 67-89.
MOUGAMBA R. (1999). – Chronologie et architecture des systèmes turbidi-tiques cénozoïques du prisme sédimentaire de l’Ogooué (margeNord-Gabon). – Doctorat, Univ. Lille 1, 185+100.
NEVES S., BRUGUIER O., VAUCHEZ A., BOSCH D., SILVA J. M. R. D. & MA-
RIANO G. (2006). – Timing of crust formation, deposition of su-pracrustal sequences, and Transamazonian and Brasilianometamorphism in the East Pernambuco belt (central domain,Borborema Province, NE Brazil) : implications for westernGondwana assembly. – Precambrian Res., 149, 197-216.
PENAYE J., TOTEU S. F., TCHAMENI R., SCHMUS W. R. V., TCHAKOUNTE J.,GANWA A., MINYEM D. & NSIFA E. N. (2004). – The 2.1 Ga WestCentral African belt in Cameroon : extension and evolution. – J.Afr. Earth Sci., 39, 159-164.
PEYROT B. (1998). – Le massif de Wonga-Wongué : un paléomodelé holo-cène sur la côte gabonaise. – Travaux du Laboratoire de Géo-graphie Physique Appliquée, Bordeaux, 16, 23-44.
RAINAUD C., MASTER S., ARMSTRONG R. A. & ROBB L. J. (2005). – Geo-chronology and nature of the Palaeoproterozoic basement in theCentral African Copperbelt (Zambia and the Democratic Repu-blic of Congo), with regional implications. – J. Afr. Earth Sci.,42, 1-31.
REYRE D. (1984). – Caractères pétroliers et évolution géologique d’unemarge passive. Le cas du bassin Bas Congo – Gabon. – Bull.Centres Rech. Explor.-Prod. Elf Aquitaine, 8, 2, 303-332.
SERANNE M., SEGURET M. & FAUCHIER M. (1992). – Seismic super-unitsand post-rift evolution of the continental passive margin of sou-thern Gabon. – Bull. Soc. géol. Fr., 163, 2, 135-146.
SERANNE M. (1999). – Early Oligocene turnover on SW African continen-tal margin : a signature of Tertiary greenhouse to icehouse tran-sition? – Terra Nova, 11, 135-140.
SERANNE M. & ANKA Z. (2005). – South Atlantic continental margins ofAfrica : a comparison of the tectonics vs climate interplay on theevolution of equatorial west Africa and SW Africa margins. – J.African Earth Sci., 43, 283-300
SILVER L. T. & DEUSTCH S. (1963). – Uranium-lead isotopic variations inzircons – a case study. – J. Geol., 71, 721-758.
SYVITSKI J., VÖRÖSMARTY C., KETTNER A. & GREEN P. (2005). – Impact ofHumans on the flux of terrestrial sediment to the global coastalocean. – Science, 308, 376-380.
Bull. Soc. géol. Fr., 2008, no 1
U-PB SINGLE ZIRCON GRAIN DATING OF FLUVIAL AND AEOLIAN SEDIMENTS FROM GABON 39

TACK L., WINGATE M. T. D., LIEGEOIS J.-P., FERNANDEZ-ALONSO M. & DE-
BLOND A. (2001). – Early Neoproterozoic magmatism(1000–910 Ma) of the Zadinian and Mayumbian Groups(Bas-Congo) : onset of Rodinia rifting at the western edge of theCongo craton. – Precambrian Res., 110, 277-306.
TARDY Y. & ROQUIN C. (1998). – Dérive des continents, paléoclimats et al-térations tropicales. – Edition BRGM, Orléans, 473.
TCHAKOUNTE J. N., TOTEU S. F., SCHMUS W. R. V., PENAYE J., DELOULE E.,ONDOUA J. M., HOUKETCHANG M. B., GANWA A. A. & WHITE W.M. (2007). – Evidence of ca 1.6 Ga detrital zircon in the BafiaGroup (Cameroon) : implication for the chronostratigraphy ofthe Pan-African Belt north of the Congo craton. – C. R. Geos-cience, 339, 132-142.
TEISSERENC P. & VILLEMIN J. (1989). – Sedimentary basin of Gabon – Geo-logy and oil systems. In : J. D. EDWARDS & P. A. SANTOGROSSI,Eds, Divergent/passive margin basins. – Am. Assoc. Petrol.Geol. Mem., 48, 177-199.
TOTEU S. F., SCHMUS W. R. V., PENAYE J. & MICHARD A. (2001). – NewU–Pb and Sm–Nd data from north-central Cameroon and itsbearing on the pre-Pan African history of central Africa. – Pre-cambrian Res., 108, 45-73.
TOTEU S. F., PENAYE J. & POUDJOM DJOMANI Y. (2004). – Geodynamic evo-lution of the Pan-African belt in central Africa with special refe-rence to Cameroon. – Canad. J. Earth Sci., 41, 73-85.
TOTEU S. F., PENAYE J., DELOULE E., SCHMUS W. R. V. & TCHAMENI R.(2006). – Diachronous evolution of volcano-sedimentary basinsnorth of the Congo craton : insights from U–Pb ion microprobedating of zircons from the Poli, Lom and Yaoundé Groups (Ca-meroon). – J. African Earth Sc., 44, 428-442.
UNESCO (1986). – International geological map of Africa. – UNESCOPublishing/Commission for the Geological Map of the World(CGMW).
WEBER F. (1968). – Une série précambrienne du Gabon : le Francevillien –Sédimentologie, géochimie, relations avec les gîtes minéraux as-sociés. – Mém. Serv. Carte Géologique d’Alsace-Lorraine, 28,1-328.
WIEDENBECK M., ALLE P., CORFU F., GRIFFIN W. L. & MEIER M. (1995). –Three natural zircon standards for U-Th-Pb, Lu-Hf, trace ele-ment and REE analyses. – Geostandards Newslett., 19, 1-23.
Bull. Soc. géol. Fr., 2008, no 1
40 SÉRANNE M. et al.
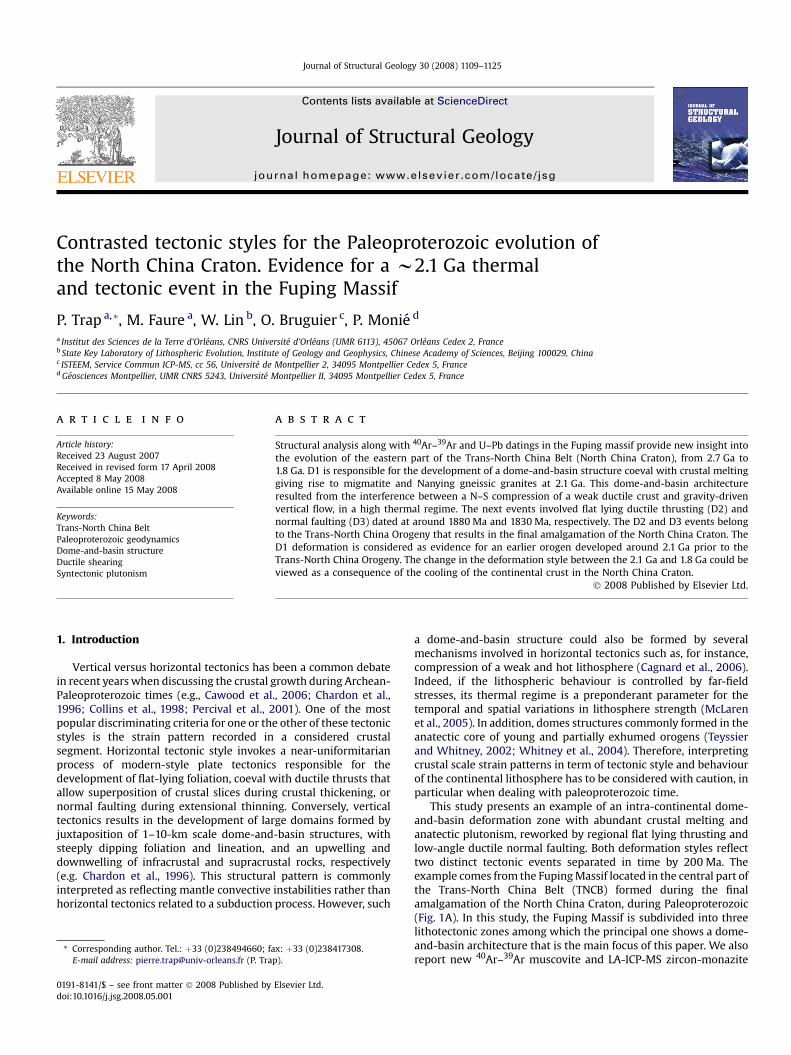
lable at ScienceDirect
Journal of Structural Geology 30 (2008) 1109–1125
Contents lists avai
Journal of Structural Geology
journal homepage: www.elsevier .com/locate/ jsg
Contrasted tectonic styles for the Paleoproterozoic evolution ofthe North China Craton. Evidence for a w2.1 Ga thermaland tectonic event in the Fuping Massif
P. Trap a,*, M. Faure a, W. Lin b, O. Bruguier c, P. Monie d
a Institut des Sciences de la Terre d’Orleans, CNRS Universite d’Orleans (UMR 6113), 45067 Orleans Cedex 2, Franceb State Key Laboratory of Lithospheric Evolution, Institute of Geology and Geophysics, Chinese Academy of Sciences, Beijing 100029, Chinac ISTEEM, Service Commun ICP-MS, cc 56, Universite de Montpellier 2, 34095 Montpellier Cedex 5, Franced Geosciences Montpellier, UMR CNRS 5243, Universite Montpellier II, 34095 Montpellier Cedex 5, France
a r t i c l e i n f o
Article history:Received 23 August 2007Received in revised form 17 April 2008Accepted 8 May 2008Available online 15 May 2008
Keywords:Trans-North China BeltPaleoproterozoic geodynamicsDome-and-basin structureDuctile shearingSyntectonic plutonism
* Corresponding author. Tel.: þ33 (0)238494660; faE-mail address: [email protected] (P. Tra
0191-8141/$ – see front matter � 2008 Published bydoi:10.1016/j.jsg.2008.05.001
a b s t r a c t
Structural analysis along with 40Ar–39Ar and U–Pb datings in the Fuping massif provide new insight intothe evolution of the eastern part of the Trans-North China Belt (North China Craton), from 2.7 Ga to1.8 Ga. D1 is responsible for the development of a dome-and-basin structure coeval with crustal meltinggiving rise to migmatite and Nanying gneissic granites at 2.1 Ga. This dome-and-basin architectureresulted from the interference between a N–S compression of a weak ductile crust and gravity-drivenvertical flow, in a high thermal regime. The next events involved flat lying ductile thrusting (D2) andnormal faulting (D3) dated at around 1880 Ma and 1830 Ma, respectively. The D2 and D3 events belongto the Trans-North China Orogeny that results in the final amalgamation of the North China Craton. TheD1 deformation is considered as evidence for an earlier orogen developed around 2.1 Ga prior to theTrans-North China Orogeny. The change in the deformation style between the 2.1 Ga and 1.8 Ga could beviewed as a consequence of the cooling of the continental crust in the North China Craton.
� 2008 Published by Elsevier Ltd.
1. Introduction
Vertical versus horizontal tectonics has been a common debatein recent years when discussing the crustal growth during Archean-Paleoproterozoic times (e.g., Cawood et al., 2006; Chardon et al.,1996; Collins et al., 1998; Percival et al., 2001). One of the mostpopular discriminating criteria for one or the other of these tectonicstyles is the strain pattern recorded in a considered crustalsegment. Horizontal tectonic style invokes a near-uniformitarianprocess of modern-style plate tectonics responsible for thedevelopment of flat-lying foliation, coeval with ductile thrusts thatallow superposition of crustal slices during crustal thickening, ornormal faulting during extensional thinning. Conversely, verticaltectonics results in the development of large domains formed byjuxtaposition of 1–10-km scale dome-and-basin structures, withsteeply dipping foliation and lineation, and an upwelling anddownwelling of infracrustal and supracrustal rocks, respectively(e.g. Chardon et al., 1996). This structural pattern is commonlyinterpreted as reflecting mantle convective instabilities rather thanhorizontal tectonics related to a subduction process. However, such
x: þ33 (0)238417308.p).
Elsevier Ltd.
a dome-and-basin structure could also be formed by severalmechanisms involved in horizontal tectonics such as, for instance,compression of a weak and hot lithosphere (Cagnard et al., 2006).Indeed, if the lithospheric behaviour is controlled by far-fieldstresses, its thermal regime is a preponderant parameter for thetemporal and spatial variations in lithosphere strength (McLarenet al., 2005). In addition, domes structures commonly formed in theanatectic core of young and partially exhumed orogens (Teyssierand Whitney, 2002; Whitney et al., 2004). Therefore, interpretingcrustal scale strain patterns in term of tectonic style and behaviourof the continental lithosphere has to be considered with caution, inparticular when dealing with paleoproterozoic time.
This study presents an example of an intra-continental dome-and-basin deformation zone with abundant crustal melting andanatectic plutonism, reworked by regional flat lying thrusting andlow-angle ductile normal faulting. Both deformation styles reflecttwo distinct tectonic events separated in time by 200 Ma. Theexample comes from the Fuping Massif located in the central part ofthe Trans-North China Belt (TNCB) formed during the finalamalgamation of the North China Craton, during Paleoproterozoic(Fig. 1A). In this study, the Fuping Massif is subdivided into threelithotectonic zones among which the principal one shows a dome-and-basin architecture that is the main focus of this paper. We alsoreport new 40Ar–39Ar muscovite and LA-ICP-MS zircon-monazite
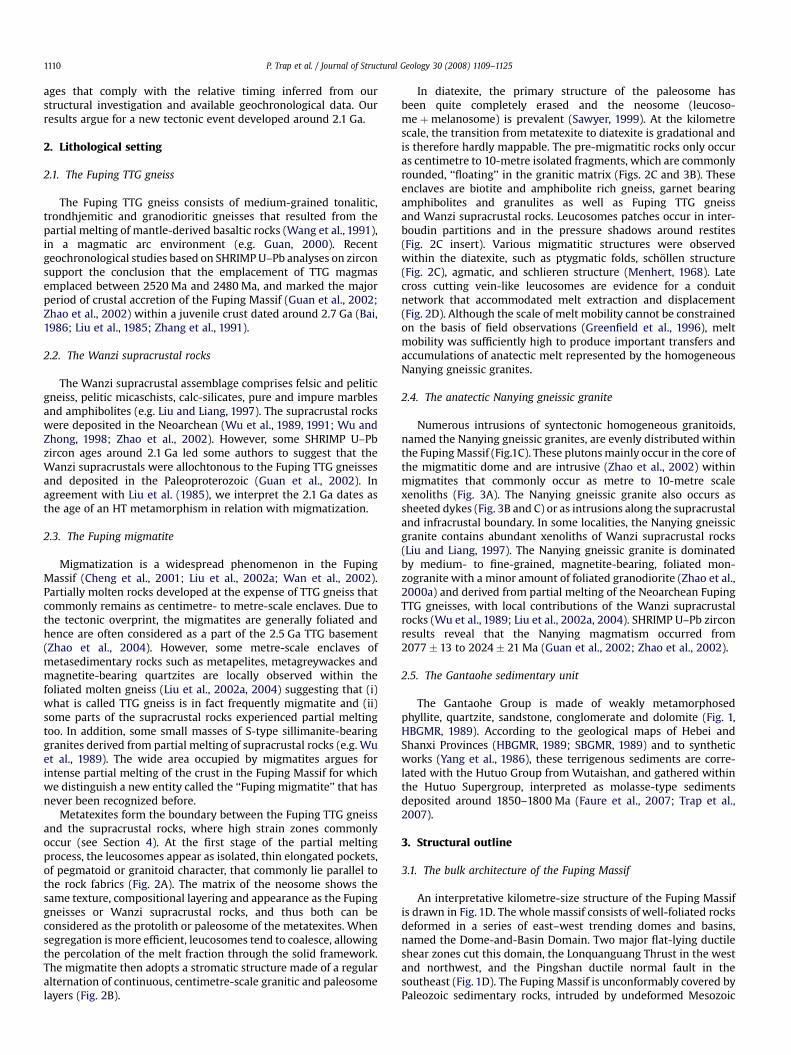
P. Trap et al. / Journal of Structural Geology 30 (2008) 1109–11251110
ages that comply with the relative timing inferred from ourstructural investigation and available geochronological data. Ourresults argue for a new tectonic event developed around 2.1 Ga.
2. Lithological setting
2.1. The Fuping TTG gneiss
The Fuping TTG gneiss consists of medium-grained tonalitic,trondhjemitic and granodioritic gneisses that resulted from thepartial melting of mantle-derived basaltic rocks (Wang et al., 1991),in a magmatic arc environment (e.g. Guan, 2000). Recentgeochronological studies based on SHRIMP U–Pb analyses on zirconsupport the conclusion that the emplacement of TTG magmasemplaced between 2520 Ma and 2480 Ma, and marked the majorperiod of crustal accretion of the Fuping Massif (Guan et al., 2002;Zhao et al., 2002) within a juvenile crust dated around 2.7 Ga (Bai,1986; Liu et al., 1985; Zhang et al., 1991).
2.2. The Wanzi supracrustal rocks
The Wanzi supracrustal assemblage comprises felsic and peliticgneiss, pelitic micaschists, calc-silicates, pure and impure marblesand amphibolites (e.g. Liu and Liang, 1997). The supracrustal rockswere deposited in the Neoarchean (Wu et al., 1989, 1991; Wu andZhong, 1998; Zhao et al., 2002). However, some SHRIMP U–Pbzircon ages around 2.1 Ga led some authors to suggest that theWanzi supracrustals were allochtonous to the Fuping TTG gneissesand deposited in the Paleoproterozoic (Guan et al., 2002). Inagreement with Liu et al. (1985), we interpret the 2.1 Ga dates asthe age of an HT metamorphism in relation with migmatization.
2.3. The Fuping migmatite
Migmatization is a widespread phenomenon in the FupingMassif (Cheng et al., 2001; Liu et al., 2002a; Wan et al., 2002).Partially molten rocks developed at the expense of TTG gneiss thatcommonly remains as centimetre- to metre-scale enclaves. Due tothe tectonic overprint, the migmatites are generally foliated andhence are often considered as a part of the 2.5 Ga TTG basement(Zhao et al., 2004). However, some metre-scale enclaves ofmetasedimentary rocks such as metapelites, metagreywackes andmagnetite-bearing quartzites are locally observed within thefoliated molten gneiss (Liu et al., 2002a, 2004) suggesting that (i)what is called TTG gneiss is in fact frequently migmatite and (ii)some parts of the supracrustal rocks experienced partial meltingtoo. In addition, some small masses of S-type sillimanite-bearinggranites derived from partial melting of supracrustal rocks (e.g. Wuet al., 1989). The wide area occupied by migmatites argues forintense partial melting of the crust in the Fuping Massif for whichwe distinguish a new entity called the ‘‘Fuping migmatite’’ that hasnever been recognized before.
Metatexites form the boundary between the Fuping TTG gneissand the supracrustal rocks, where high strain zones commonlyoccur (see Section 4). At the first stage of the partial meltingprocess, the leucosomes appear as isolated, thin elongated pockets,of pegmatoid or granitoid character, that commonly lie parallel tothe rock fabrics (Fig. 2A). The matrix of the neosome shows thesame texture, compositional layering and appearance as the Fupinggneisses or Wanzi supracrustal rocks, and thus both can beconsidered as the protolith or paleosome of the metatexites. Whensegregation is more efficient, leucosomes tend to coalesce, allowingthe percolation of the melt fraction through the solid framework.The migmatite then adopts a stromatic structure made of a regularalternation of continuous, centimetre-scale granitic and paleosomelayers (Fig. 2B).
In diatexite, the primary structure of the paleosome hasbeen quite completely erased and the neosome (leucoso-me þmelanosome) is prevalent (Sawyer, 1999). At the kilometrescale, the transition from metatexite to diatexite is gradational andis therefore hardly mappable. The pre-migmatitic rocks only occuras centimetre to 10-metre isolated fragments, which are commonlyrounded, ‘‘floating’’ in the granitic matrix (Figs. 2C and 3B). Theseenclaves are biotite and amphibolite rich gneiss, garnet bearingamphibolites and granulites as well as Fuping TTG gneissand Wanzi supracrustal rocks. Leucosomes patches occur in inter-boudin partitions and in the pressure shadows around restites(Fig. 2C insert). Various migmatitic structures were observedwithin the diatexite, such as ptygmatic folds, schollen structure(Fig. 2C), agmatic, and schlieren structure (Menhert, 1968). Latecross cutting vein-like leucosomes are evidence for a conduitnetwork that accommodated melt extraction and displacement(Fig. 2D). Although the scale of melt mobility cannot be constrainedon the basis of field observations (Greenfield et al., 1996), meltmobility was sufficiently high to produce important transfers andaccumulations of anatectic melt represented by the homogeneousNanying gneissic granites.
2.4. The anatectic Nanying gneissic granite
Numerous intrusions of syntectonic homogeneous granitoids,named the Nanying gneissic granites, are evenly distributed withinthe Fuping Massif (Fig.1C). These plutons mainly occur in the core ofthe migmatitic dome and are intrusive (Zhao et al., 2002) withinmigmatites that commonly occur as metre to 10-metre scalexenoliths (Fig. 3A). The Nanying gneissic granite also occurs assheeted dykes (Fig. 3B and C) or as intrusions along the supracrustaland infracrustal boundary. In some localities, the Nanying gneissicgranite contains abundant xenoliths of Wanzi supracrustal rocks(Liu and Liang, 1997). The Nanying gneissic granite is dominatedby medium- to fine-grained, magnetite-bearing, foliated mon-zogranite with a minor amount of foliated granodiorite (Zhao et al.,2000a) and derived from partial melting of the Neoarchean FupingTTG gneisses, with local contributions of the Wanzi supracrustalrocks (Wu et al., 1989; Liu et al., 2002a, 2004). SHRIMP U–Pb zirconresults reveal that the Nanying magmatism occurred from2077� 13 to 2024 � 21 Ma (Guan et al., 2002; Zhao et al., 2002).
2.5. The Gantaohe sedimentary unit
The Gantaohe Group is made of weakly metamorphosedphyllite, quartzite, sandstone, conglomerate and dolomite (Fig. 1,HBGMR, 1989). According to the geological maps of Hebei andShanxi Provinces (HBGMR, 1989; SBGMR, 1989) and to syntheticworks (Yang et al., 1986), these terrigenous sediments are corre-lated with the Hutuo Group from Wutaishan, and gathered withinthe Hutuo Supergroup, interpreted as molasse-type sedimentsdeposited around 1850–1800 Ma (Faure et al., 2007; Trap et al.,2007).
3. Structural outline
3.1. The bulk architecture of the Fuping Massif
An interpretative kilometre-size structure of the Fuping Massifis drawn in Fig. 1D. The whole massif consists of well-foliated rocksdeformed in a series of east–west trending domes and basins,named the Dome-and-Basin Domain. Two major flat-lying ductileshear zones cut this domain, the Lonquanguang Thrust in the westand northwest, and the Pingshan ductile normal fault in thesoutheast (Fig. 1D). The Fuping Massif is unconformably covered byPaleozoic sedimentary rocks, intruded by undeformed Mesozoic

Fig. 1. (A) Location of the Trans-North-China Belt (TNCB) between the Western and Eastern Blocks within the North China Craton. (B) Geographic relationship of the Fuping Massifwith the Hengshan-Wutaishan domain. (C) Geological map of the Fuping massif. (D) Simplified crustal-scale cross-section through the Fuping Massif, from the LongquanguanThrust to the Gantaohe Unit.
P. Trap et al. / Journal of Structural Geology 30 (2008) 1109–1125 1111
granites, and cut by Cenozoic high angle brittle faults but all thesePhanerozoic events do not alter its bulk architecture acquired inPaleoproterozoic.
3.2. The Dome-and-Basin Domain (D1 event)
The trend of the regional foliation (S1) defines a dome-and-basin structure in which foliated migmatite coincides withE–W trending elliptical antiforms, the core of which is occupiedby diatexite and anatectic Nanying gneissic granites (Fig. 1). The
Wanzi supracrustal rocks and Fuping TTG gneiss crop out in thesynformal structures and the lithological contacts are trans-posed into parallelism with the dome margins. The globaldome-and-basin structure of the Fuping Massif is described indetail in Section 4.
3.3. The Longquanguan Thrust (D2 event)
The Longquanguan Thrust (LQGT) (Li and Qian, 1991) developsboth in the western and northern parts of the Fuping Massif (Fig. 1).

P. Trap et al. / Journal of Structural Geology 30 (2008) 1109–11251112
It constitutes a w2 km thick and 150 km long tectonic contact thatmay extend more to the south and to the north-east, hidden below therecent sedimentary cover (Fig. 1). The ductile deformation relatedto the LQG shear zone involves parts of the Fuping TTG gneisses, theWanzi supracrustals and the Nanying granite (Hao et al., 1995; Li andQian,1991; Wu et al.,1989; Trap et al., 2007). Indeed, in the vicinity ofthe LQG Thrust, the Fuping rocks show near subhorizontal planarfabric (S2) that overprints the steeply dipping S1 foliation. Whengetting closer to the LQG Thrust, the S1 foliation is completely erasedby the S2 foliation. Along the Longquanguan shear zone, S2 strikesbetween N05 and N50E in its southern part and between N60 andN80E in the northern part (Figs. 4, 6 and 7). It is gently dipping to-wards the NW with a plunge ranging from 20� to 55�. The gneissicfoliation commonly exhibits mylonitic to ultramylonitic fabrics,characterized by quartz ribbons with shape ratios up to 10:1 (Fig. 5A)that form centimetre to decimetre thick high strain zones. The S2foliation holds a well-developed mineral and stretching lineation (L2)marked by elongated biotite clusters, preferentially oriented horn-blende, calcite and epidote crystals. In the western part of the FupingMassif, the lineation strikes N140–N160E, whereas it strikes N160–N170E in the northern part (Figs. 4, 6 and 7). Numerous intrafolialfolds with axes parallel to the L2 lineation can also be observed. AlongL2, abundant macroscopic and microscopic shear indicators such asasymmetrical pressure shadows around porphyroclasts, shear bands,and mica fish show a consistent top to the southeast kinematics, inagreement with previous studies (Fig. 5B and C; Hao et al., 1995; Sunet al., 2004). Therefore, considering both the S2 geometry and kine-matics, and in agreement with Li et al. (2004) we argue that the LQGShear Zone consists of a major thrust fault that allows the WutaishanMassif to overthrust to the SE upon the Fuping Massif and thereforewe prefer to use the term ‘‘Longquanguan Thrust’’ (LQGT) rather thanLongquanguan Shear Zone (Zhang et al., 2006a,b; Zhao et al., 2004).Finally some late D2 folds, overturned towards the SE, called F2,reworked both S1 and S2 (Fig. 4).
3.4. The Pingshan detachment fault (D3 event)
In the southeastern edge of the Fuping Massif, the Late Paleo-proterozoic Gantaohe Group is separated from the underlyingFuping migmatite and supracrustal rocks by the Pingshan low-an-gle normal fault (Fig. 1). This fault is a 10-metre thick ductile shearzone. The foliation (denoted here as S3) strikes consistently NE–SWand dips at 30� towards the southeast (Figs. 1 and 4). The intensityof the deformation increases progressively towards the shear zonewhere well-developed mylonitic fabrics are observed (Fig. 5D). Aconsistent N130E trending mineral lineation (L3) is marked by theelongation of quartz grains and feldspar porphyroclasts in sand-stone, stretched decimetre-scale quartz pebbles in conglomerates.Along L3, clear macroscopic shear criteria such as s-type por-phyroclast systems, asymmetric pressure shadows around por-phyroclasts, and shear bands provide a consistent top to the SEsense of shear (Fig. 5E). At the microscopic scale, sigmoidal quartz–feldpsar aggregates or white mica fishes show the same top to theSE shearing (Fig. 5F).
Fig. 2. Photographs of Fuping metatexites and diatexites. (A) Metatexite with a smallproportion of leucosome formed in the beginning of the melting reaction(N38�48.8450/E114�06.1070). (B) Stromatic structure in metatexite with alternations ofleucosome/paleosome. Insert: Pegmatoid leucosome surrounded by melanosomes(darkest area), both constitute the neosome formed in response to segregation fromthe paleosome (N38�43.7370/E�114�16.5350). (C) Diatexite with a schollen structuredefined by a prevalent trondhjemitic leucosome holding partially disrupted maficenclaves. Insert: Syn-migmatization boudinage of a mafic restite with melt occurringin the dilatant sites (N38�57.2830/E�114�34.2210). (D) Late vein-like leucosomes crosscutting the migmatitic foliation (N38�19.5650/E�113�37.0150). The veins are filled by themelt that come from the syn-folial leucosomes, illustrating the process of segregation,transposition and migration of the melt.

Fig. 3. (A) A 10-metre scale enclave of migmatite within the Nanying gneissic granite (NG). The migmatite enclave shows an agmatic structure characterized by angulose fragmentsof amphibolite surrounded by leucosome (N38�20.3760/E113�36.9530). (B and C) Picture (B) and hand drawing (C) of a funnel-shaped intrusion of granitoid sheeted dykes parallel tothe migmatitic foliation, within diatexite in the vicinity of a Nanying pluton (N38�41.3510/E114�17.9530).
P. Trap et al. / Journal of Structural Geology 30 (2008) 1109–1125 1113
4. Detailed structural analysis of the D1 event
4.1. D1 within the Fuping TTG gneiss, migmatite andsupracrustal rocks
4.1.1. The S1 foliationThe main structure in the Dome-and-Basin Domain is
a penetrative S1 foliation that develops within the Fuping TTGgneisses, the migmatite, the supracrustal rocks and to a lesserextent in the Nanying gneissic granite (see Section 4.2). At mapscale, the S1 foliation draws E–W trending elliptical domes andbasins of 10–25 km length and 2–15 km width (Figs. 6, 7 and 8). Atoutcrop scale, the S1 foliation is defined by the metamorphiclayering defined by the alternation of amphibole–biotite andquartz–feldspar rich layers. In diatexite, S1 is also defined by thecompositionally homogeneous layers of quartzo-feldspathicleucosomes that represent crystallized melts (Fig. 9). The S1 folia-tion wraps around mafic restites (Fig. 3). In addition, some thinflattened and boudinaged mafic restites develop parallel to thefoliation (Fig. 9A and B). Commonly, melt migrates from highlystrained leucosome layers, parallel to the migmatitic foliation,towards centimetre- to decimetre-scale discordant vertical veinscutting the foliation (Fig. 9A and B). The melt migration from highto low strain zones, suggests that in diatexite, the foliation developscoevally with melting.
Although regionally E–W trending (Fig. 4), S1 strikes differentlyin the southwestern part and the northeastern part of the Fuping
Massif. In the northeastern part (Fig. 6), the general trend of S1varies from N100E to N130E and domes and basins exhibit a highlyelongated shape. Throughout the dome, the dip of S1 changesregularly and defines sub-dome structures. S1 dips at 45–50� alongthe dome limb whereas it is flat lying or dips more gently (<30�) atthe top of the dome (Figs. 6 and 8). In this part of the Fuping Massif,no supracrustal rock is observed and the Fuping TTG gneiss, thathas widely escaped migmatization, crops out in synforms witha moderately dipping attitude (w40�). In the southwestern part ofthe Fuping Massif (Fig. 7), S1 strike is less regular as the generaltrend changes from N60E to N120E and domes are more rounded.The S1 foliation is steeply dipping along the dome flanks (S1 > 40�,commonly S1 > 60�) and vertical in the synform axial zone. Wanzisupracrustal rocks occupy rim synclines that surround themigmatitic domes (Figs. 7 and 8). Furthermore, the S1 patternlocally defines triangular arrangements that develop in order toaccommodate the foliation geometry between elliptical domes(Fig. 7). In this southwestern location, the sub-domes structuresoutlined by the S1 trajectories are more developed than in thenortheastern area (Figs. 6 and 7).
The gneissic migmatite grades from well-foliated stromaticmigmatite, in the dome flanks, to moderately foliated diatexitewithin the dome core, where it is sometimes almost isotropic(Fig. 2). Along the dome limbs, at the boundary with supracrustalrocks or TTG gneiss, gneissic tectonites exhibit a well-pronouncedfoliation arguing for a high strain. Some shear zones have beenpreviously described along the boundary between the Wanzi

Fig. 4. Equal area, lower hemisphere Schmidt stereograms of S1, L1, F1, S2, L2, F2, S3 and L3.
P. Trap et al. / Journal of Structural Geology 30 (2008) 1109–11251114
supracrustals and the migmatites (Liu et al., 2002a; Tang and Liu,1997). Our observations confirm that the Fuping TTG gneiss andsupracrustals experienced solid-state deformation, whereas at thesame time, deformation in the migmatites, particularly in diatexite,is accommodated by a liquid (melt) with a lower viscosity and thusa softer rheology, through penetrative flow.
Along the dome limbs, S1 is disrupted by centimetre to metre-size folds (F1) with nearly horizontal axes (Fig. 4). These drags foldsindicate an outer-part-side down displacement (Fig. 9D).
4.1.2. Stretching directionIn the migmatite, the mineral lineation (L1) is marked by
elongated biotite aggregates, the preferred orientation ofhornblende or sillimanite. However, in the field, deformed maficrestites are the most abundant and a clearer indicator of thestretching direction. Frequently, the competent layers of maficmaterial are boudinaged as isolated fragments while thesurrounding material flows in towards the boudin necks (Fig. 10A).The filled voids between boudin fragments represent dilatant siteswhere the low strain allows melt to crystallize. Commonly, it ispossible to define the X � Y � Z axes of the strain ellipsoid. In mostlocations, mafic enclaves define planar and linear (S-L) fabrics(Fig. 10A). In some places, the elongated mafic lenses definea prolate shape as shown by the circular aspect in the YZ section(Fig. 10B). This L-type constrictional strain is generally observed atthe eastern and western dome terminations.
At the scale of the entire Fuping Massif, the lineation pattern isscattered in the horizontal plane but shows a maximum in the E–Wto ESE–WNW direction. Indeed, most of the L1 lineationmeasurements trend between N80E and N120E (Fig. 4). It is worthnoting that along the dome limbs, a gently plunging lineationpredominates and highly dipping or subvertical stretching linea-tion is absent. The high strain zones that develop along the E–Wflanks of the domes are also associated with an E–W trendinglineation (Tang and Liu, 1997). Shear sense is indicated byasymmetric pressure shadows around centimetre-scale restites(Fig. 9B), centimetre-scale sigmoidal leucosomes (Fig. 9C) and dragfolds (Fig. 9D). Kinematic criteria indicate that the supracrustalrocks moved downward at the eastern and western closures of thedomes whereas horizontal shearing took place along the northernand southern flanks. However, in those flanks, the sense of shear isunclear.
Therefore two dominant finite strain fabrics occur within theDome-and-Basin Domain: (i) a planar-linear (S-L) fabric and (ii)a linear (L) fabric. The S-L fabric occurs at the top of the domeswhere foliation is flat lying, and defines a horizontal flattening. In
the core and the flanks of the domes, flattening planes are nearlyvertical, and correspond to a vertical flattening. In both cases, finitestretching (X axis) is E–W trending and shallowly dipping tohorizontal. The L-constrictional fabric lies at the eastern andwestern termination of the domes. There, the X axis remains nearE–W to ESE–WNW but plunges more steeply than within domecore and flanks.
4.1.3. Coaxial vs non-coaxial regimeKinematic indicators of a non-coaxial regime occur principally
along the dome closures. In the XZ section, shear criteria such ass-type porphyroclast systems and sigmoidal biotite along thedowndip L1 show a consistent downward motion, i.e. top to thewest and top to the east shearing at the W and E periclines,respectively. Along the dome flanks, the gently plunging lineationattests for a lateral shearing or longitudinal stretching. However,a non-coaxial regime is rarely observed at the outcrop scale.Conversely a coaxial flow can be documented by symmetricporphyroblast systems, and boudinaged enclaves. Combining thefinite strain characterized by a N–S horizontal shortening togetherwith an E W stretching, and the shear regime allows us to drawa simple structural pattern at the scale of a single dome (Fig. 11). Ageneral model for the Dome-and-Basin Domain at the scale of theentire Fuping Massif is discussed in Section 7.1.1.
4.2. D1 within the Nanying gneissic granite
The Nanying gneissic granite forms 2.5–25 km long and 2–5 kmwide homogeneous plutons. These elongated bodies, with shaperatios up to 6:1, stretch along an E–W trend in agreement with theregional pattern of S1 and L1 (Fig. 1). In Nanying gneissic granite, S1is weak but conspicuous and consistently parallel to the wellmarked foliation developed within the surrounding rocks, leadingauthors to assume that the Nanying gneissic granite underwent thesame deformation event (Liu et al., 2004; Zhao et al., 2002). Themineral preferred orientation that marks S1 becomes weakertowards the interior of the plutons, suggesting that deformation inthe presence of melt is the predominant deformation mechanismwithin these granitoids.
In the field, the magmatic layering is clearly outlined by thin,elongated pockets, 0.1–1 metre long, consisting of biotite-freeleucocratic material, which result from late magmatic quartzo-feldspathic segregation (Fig. 12A). The planar fabric defined bythese leucocratic pockets is in accordance with the S1 foliation inthe surrounding rocks. The leucocratic pocket constitutiveminerals, mainly feldspar and quartz, are not internally deformed.

Fig. 5. Deformation features along the Longquanguan Thrust (A, B and C) and the Pingshan Fault (D, E and F). (A) Mylonitized gneiss, composed of well-developed layers of quartzribbons within a matrix of biotite, feldspars and quartz. The foliation is flat lying and the lineation trends N160� , (N38�54.8790/E113�47.6000). (B) Quartz–feldspar layer ina metavolcanite showing a top to the SE kinematics (N39�04.6480/E113�07.4870). (C) Top to the SE shear criteria marked by a sigma-type porphyroclast in an augen gneiss(N39�04.8200/E113�39.1670). (D) Mylonitic zone within the Gantaohe sediments along the Pingshan Fault (N38�12.7490/E�114�04.0490). (E) Asymmetric pressure shadows arounda feldspar porphyroclast indicating a top to the SE shearing; within the same mylonitic zone (same outcrop). (F) Top to the SE shear criteria shown by sigmoidal pattern of mica andfeldspar aggregate, around the sigmoidal shape are ribbon quartz (sample FP154 dated at 1830 � 20 Ma see Section 5.1.3) (N38�20.5350/E114�12.7750).
P. Trap et al. / Journal of Structural Geology 30 (2008) 1109–1125 1115
Such elongated microgranitoid enclaves, devoid of any plasticdeformation of minerals, are strong evidence for magmatic flow(Vernon, 2000).
At the microscope scale, the S1 foliation in the Nanying gneissicgranite is defined by the statistically shape-preferred orientation ofbiotite, hornblende, feldspar and weakly to moderately elongatedquartz aggregates. No sign of significant solid-state deformationwithin biotite, such as shear bands, kinks or undulose extinction isobserved. In quartz, only a few small grains show unduloseextinction. Conversely, a range of microstructures providesevidence for deformation in the presence of melt. The bestexamples are intragranular fractures within feldspar megacryststhat are sealed by quartz which continues from inside to outsidethe phenocryst in the matrix (Fig. 12B) (Pawley and Collins,2002). Similar fabrics have been described by Hibbard (1987) as
‘‘submagmatic microfractures,’’ indicating that solid-statedeformation occurred with migrating melt still present in the rock(Bouchez et al., 1992; Vernon, 1991, 2000). Microcline occurs mostlyas filling the interstices between other minerals or replacingplagioclase in relation to fluid relocation and metasomatism duringthe late stages of magma crystallization (Marmo, 1971). Alongmicrocline margins, myrmekite lobes or fringes developed(Fig. 12C). According to Vernon (2000), a subsolidus rheologicalstate is a prerequisite for the replacement of K-feldspar bymyrmekite. This feature is conspicuously observed in synkinematicgranites (e.g., Hibbard, 1987; Marmo, 1971; Vernon, 2000).
In summary, granite fabrics indicate that the Nanying graniterepresents syntectonic plutons, i.e. were gneissified during theiremplacement that appears as coeval with the D1 deformationevent, which is characterized by a N–S shortening and an E–W

Fig. 6. Structural sketch maps of the northeastern part of the Fuping massif. (A) Geological map. (B) S1 and S2 foliation trajectories. (C) L1 and L2 lineation trajectories.
P. Trap et al. / Journal of Structural Geology 30 (2008) 1109–11251116
stretching. Due to buoyancy forces, regional stress field, density andviscosity contrasts of the anatectic magma with respect to thesurrounding Fuping TTG gneiss and supracrustal rocks, the Nanyinggneissic granite together with the diatexites form the core of theE–W elongated domes.
5. Metamorphic signature
Rocks from the Fuping Massif experienced an amphibolite togranulite facies metamorphism except those from the GantahoeUnit which are unmetamorphosed or weakly metamorphosed ingreenschist facies only. Within the Fuping migmatite, some maficgranulites provide peak P–T conditions of 0.8–1.0 GPa and750–830 �C (Liu, 1996). Previous P–T–t paths show that both maficrestites within migmatites and supracrustal rocks suffered thesame final isobaric cooling and retrogressive conditions, with thelatest stage computed at 700–750 �C and 6–7 kbar (Fig. 13; Liu andLiang, 1997; Zhao et al., 2000b). The P–T–t paths differ in theprograde evolution and for the peak metamorphism conditions(Fig. 13). Mafic enclaves within the migmatites preserve peak P–Tconditions of 850–950 �C and 8.5–9.5 kbar but do not showpetrographic evidence for an early prograde metamorphism due tosubsequent annealing (Zhao et al., 2000b). These authors postu-lated that the mafic granulites represent mafic dykes emplaced atshallow depth which were buried to a deeper crustal level. Suchmafic granulites could also represent mafic lower crustal materialexhumed through a similar P–T–t evolution, characterized byisothermal decompression followed by isobaric cooling (Fig. 13).Based on Nd-isotope data, model ages and field relationship, Liuet al. (2002b) suggest that the metabasites enclaves within themigmatites are not boudinaged mafic dykes but represent juvenilecrustal material extracted from the mantle and underplated in thelower crust. Metapelites from the supracrustal sequence sufferednear-isobaric heating from 680 �C and 8.0–9.0 kbar to 800 �C and8.0 kbar before retrogression (Liu and Liang, 1997). There is noevidence of prograde metamorphism before the isobaric heating ofthe metapelites (Fig. 13). However, pressures up to 8.0 kbar reachedby the sedimentary rocks argue for their initial burial.
A third P–T–t path shows the metamorphic evolution ofamphibolites from the adjacent OVU of the Wutaishan Massif(Fig. 13; Zhao et al., 1999). The thermal contrast and the differencein P–T–t paths between Wutaishan amphibolites and the Fupingmetabasites and metapelites imply that the central part of theFuping Massif and the Wutaishan Massif are related to two differ-ent metamorphic events and that the Longquanguan Thrust isresponsible for the juxtaposition of such distinct metamorphicdomains.
6. Timing of D1, D2 and D3 events
6.1. Structural relationship and relative timing
The three deformations D1, D2, D3 defined by S1, S2, S3 and L1,L2, L3, planar and linear structural elements, have been recognizedin the western, central, south-eastern areas of the Fuping Massif(Figs. 1 and 4). Regional mapping (Figs. 6 and 7) and overprintingrelationships indicate that they can be assigned a temporal order.Our structural study demonstrates that undoubtedly D1 and D2 aretwo distinct deformational events with D2 being younger than D1.Similarly, D3 is younger than D1 since the dome-and-basin struc-ture is reworked by the Pingshan fault. The relative timing betweenD2 and D3 is difficult to settle since the geometric superposition ofthese two deformation events is never observed in the sameoutcrop. However, the low-grade metamorphic conditions associ-ated with D3 and the contrasted tectonic regimes, namely syn-amphibolite facies thrusting for D2 and syn-greenschist to loweramphibolite facies normal faulting for D3, suggest that D2 is olderthan D3.
6.2. Geochronological constraints
6.2.1. 40Ar–39Ar datingPrevious studies in the adjacent Wutaishan Massif lead us to
propose that the Hutuo Supergroup sedimentary rocks depositedafter 1850 Ma and before 1800 Ma (Faure et al., 2007; Trap et al.,2007; see Section 2). In this consideration, the Pingshan fault might

Fig. 7. Structural sketch maps of the southwestern part of the Fuping massif. (A)Geological map. (B) S1 and S2 foliation trajectories. (C) L1 and L2 lineationtrajectories.
P. Trap et al. / Journal of Structural Geology 30 (2008) 1109–1125 1117
have functioned within this period. In order to assess the age of thePingshan ductile fault, i.e., D3 deformation, we performed40Ar–39Ar dating on a muscovite grain from a mylonite within thePingshan fault. The sample (FP154) is a fine grained muscovitebearing gneiss belonging to the fault footwall, that exhibitsa mylonitic fabric with well developed quartz ribbons andsigmoidal mica fishes and s-type feldspar aggregates showing a topto the SE shearing (Fig. 5F).
The analytical procedure for laser probe dating is similar to thatfully described by Dalrymple (1989) and consists of a continuous6 W argon-ion laser connected to a MAP 215-50 mass spectrometer.Details concerning our experimental procedure are given in Monieet al. (1994, 1997). The syn-kinematic muscovite grain (0.5 mm indiameter) yields a plateau age of 1830 � 12 Ma for 98% of 39Arreleased (Fig. 14A). Given the relatively low-temperature conditionsof deformation and the assumed closure temperature for argondiffusion in muscovite (400 �C, Hames and Bowring, 1994), the ageof 1830 � 12 Ma is interpreted as the age of the D3 fabric of theductile Pingshan normal faulting.
6.2.2. U–Pb LA-ICP-MS datingTo support structural results, three samples of migmatite were
analysed using LA-ICP-MS dating. Sample FP133 is a leucocraticsegregate from a stromatic migmatite situated in the southwesternedge of the Fuping Massif, in the footwall of the LongquanguanThrust (N38�15.5770/E113�30,3400). Sample FP135 is a diatexitesampled near a Nanying gneissic granite pluton within a migmatiticdome, east of Diantou (N38�19.5650/E113�37.0150). FP205 is a coarsegrained (1–6 mm) migmatite leucosome sampled from a dilatantsite between stretched mafic restites, near Liangang village(N39�15.7940/E115�03,7170).
Zircon grains were mounted in epoxy resin with chips ofa standard material (G91500; Wiedenbeck et al., 1995). Analyseswere performed using a VG Plasmaquad II turbo ICP-MS coupled toa Geolas (Microlas) automated platform housing a 193 nm Compex102 laser from LambdaPhysik. Details of the analytical procedureare described in Bruguier et al. (2001). Age calculations were doneusing the Isoplot program (Ludwig, 2000) and are quoted at the 2slevel. Results are shown as a Concordia plot in Fig. 14. Zircons haveeuhedral to sub-euhedral shapes, some of them yielding domainswith faint oscillatory or convolute zoning but most grains lack clearzoning features and yield rounding of their terminations. Theseobservations are interpreted as indicating that they originallycrystallized from a melt, but were subsequently subject toa metamorphic event that could have been responsible for blurringof the primary structure and rounding of their terminations.
In the Th/U versus apparent (207Pb/206Pb) age diagram ofFig. 14B, zircons from sample FP133 yield a clear tendency toyounger ages with decreasing Th/U ratios whereas the oldest agesare associated with the highest Th/U ratio. Our best estimate for theage of zircon recrystallization in sample FP133 is thus given by the207Pb/206Pb weighted mean of the youngest concordant analyses,which yields an age of 1847 � 7 Ma (Fig. 14C). Moreover, twoanalyses yield an intercept at 1875 � 13 Ma (Fig. 14C). Although thisage is calculated only starting from two analyses it should beconsidered since it is well consistent with numerous agesdocumented around 1870–1880 Ma reported in the area (Fig. 15,see Section 6.2.3). A batch of analyses yields older ages, close to2.5 Ga, and 4 grains with a low discordance degree providea 207Pb/206Pb weighted mean age of 2481 �7 Ma (Fig. 14C). Finallya concordant analysis defines an inherited component as old as2562 � 12 Ma. Monazite grains from the same sample FP133 yielda well-defined intercept age at 1837 � 6 Ma (Fig. 14D).
Alike for sample FP133, zircons from sample FP135 yielda tendency to younger ages with decreasing Th/U ratios whereasthe oldest ages are associated with the highest Th/U ratio (Fig. 14B).

Fig. 8. (A) Cross-section through the south-western part of the Fuping massif (see Fig. 7 for location). (B and C) Cross-sections thought the north-eastern part of the Fuping massif(see Fig. 6 for location).
P. Trap et al. / Journal of Structural Geology 30 (2008) 1109–11251118
Almost all analyses are quite discordant except for older agesamong which 4 analyses allows us to calculate a mean age at2456 � 11 Ma (Fig. 14E). Younger ages are too discordant to calcu-late a reliable age.
Sample FP205 yield a restricted distribution, all grains but twohaving Th/U ratios of less than 0.1 (Fig. 14B). Zircon grain analysesfrom sample FP205 also scatter in a fan-like domain, which reflectinheritance and various degrees of Pb losses. The discordancedegree is more important for zircons from this sample than fromsample FP133. This is likely to be related to the higher U content ofthe grains (>1000 ppm) in sample FP205, which enhanced Pblosses. Given the discordance and scattering of the data point it isdifficult to calculate an age, however it is noteworthy that twoanalyses plot close to the concordia and have 207Pb–206Pb ages of1846 Ma and 1865 Ma. The younger age together with three otherdiscordant ones allows calculating a weighted mean age of1842 � 12 Ma (Fig. 14F), similar to the age of zircon recrystallizationin sample FP133 at 1847 � 7 Ma. Moreover, no w2.5 Ga ages arereported but a clear inherited component yields an age around2100 Ma, with a near concordant age at 2099 � 5 Ma. This is inagreement with the age frequency histogram (Fig. 14F insert).Indeed it shows that the distribution does not follow a Gaussianlaw, but two main groups of ages appear, one around 1850 Ma anda second close to 2050 Ma, with some mixing that probably occursbetween these two ages. Unfortunately the degree of discordanceand the small amount of analyses do not allow us to calculatea reliable age around 2.0–2.1 Ga.
6.2.3. Interpretation of U–Pb LA-ICP-MS zircon agesIn sample FP133, five analyses yield a mean age at 2481 �7 Ma
while a concordant analysis defines an inherited component at2562 � 12 Ma. In sample FP135, a mean age has been calculated at2456 � 11 Ma while a near concordant analysis has an ageat 2523 � 3 Ma. Such Late Archean to Early Paleoproterozoic ageshave been widely reported in the Fuping Massif (Liu et al., 2000;Zhao et al., 2002). In particular, the ages of 2481 �7 Ma and2523 � 3 Ma are very close to the ages of 2486 � 8 Ma and
2523 � 14 Ma reported from TTG gneiss (Zhao et al., 2002). Inagreement with Zhao et al. (2002) these old ages ranging from2520 to 2480 Ma represent the timing of emplacement of the TTGmagma. The inherited zircon cores and xenocrysts documentedaround 2.7 Ga (Guan et al., 2002) argue that the TTG magmaintrudes an old continental nucleus (Bai and Dai, 1998; Wu et al.,1991; Wu and Zhong, 1998). The mean age of 2456 � 11 Mareported in the sample FP135 is a little bit younger, but similarwithin error, to the SHRIMP U–Pb age of 2474 � 20 Ma,reported by Liu et al. (1985) and interpreted by the authors asa metamorphic age.
Such old ages are not reported in sample FP205 for which theolder ones lie around 2100 Ma and represent the timing of meltcrystallization. Unfortunately, the discordance degrees as well asthe weak amount of single ages do not allow us to calculate a meanage. However, the 2.0–2.1 event is well documented in the litera-ture (Fig. 15 and references therein). A conventional multi-fractionzircon U–Pb age of 2025þ46/�36 Ma was documented fora paragneiss of the Wanzi supracrustals, and was interpreted asdating the timing of metamorphism (Liu et al., 1985). SHRIMP U–Pbzircon dating results reveal that the anatectic Nanying graniteswere emplaced between 2077 � 13 and 2024� 21 Ma (Guan et al.,2002; Zhao et al., 2002). Sun and Guan (2001) propose thata magmatic event took place at ca. 2.05 Ga while Zhao et al. (2002)report near concordant ages at 2100 Ma from what they consideredas the Fuping TTG gneiss but that we redefined here as migmatite.Guan et al. (2002) obtained a SHRIMP U–Pb age of 2097 �46 Mafrom the fine-grained paragneiss of the Wanzi supracrustals.Furthermore, zircons from a Wanzi supracrustal sillimaniteleptynite yielded two SHRIMP ages of 2507 � 14 Ma and2109 � 5 Ma (Zhao et al., 2002). Although these authors interpretthe second age as the maximum deposition age, we suggest that itmight correspond to that of the regional HT metamorphism andassociated migmatization.
Our structural study attests that the Fuping TTG gneisses, Wanzisupracrustal rocks, Fuping migmatite and the anatectic Nanyinggneissic granite experienced the same D1 deformation coeval with
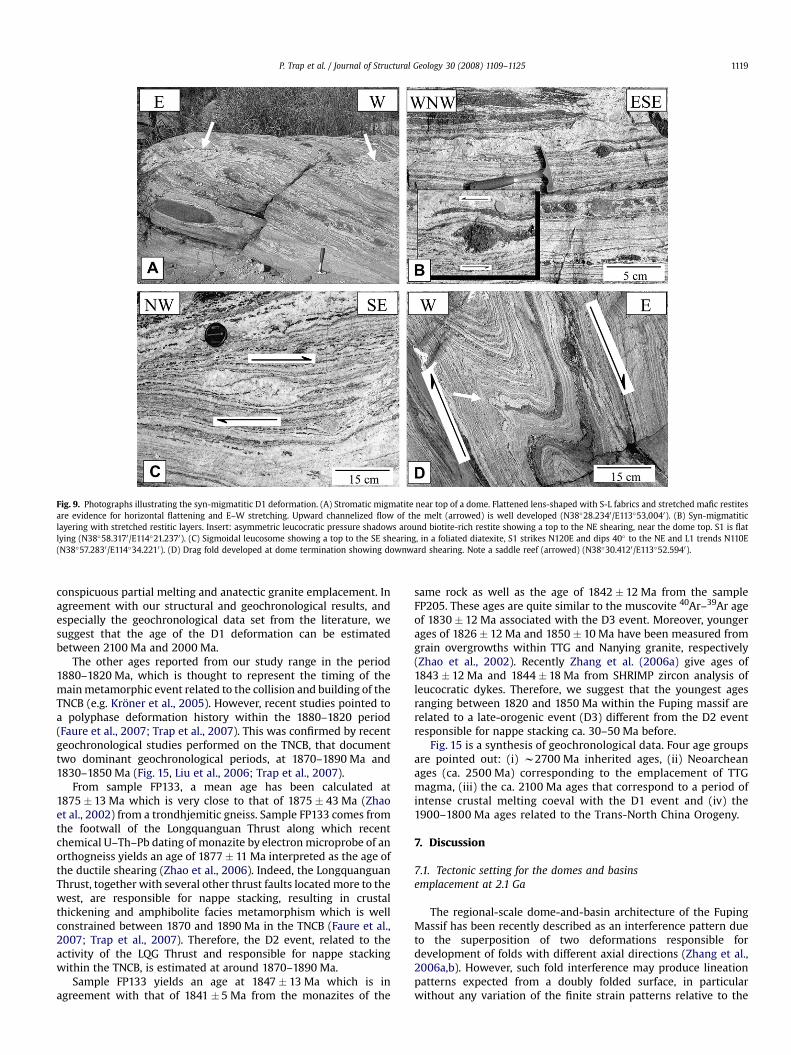
Fig. 9. Photographs illustrating the syn-migmatitic D1 deformation. (A) Stromatic migmatite near top of a dome. Flattened lens-shaped with S-L fabrics and stretched mafic restitesare evidence for horizontal flattening and E–W stretching. Upward channelized flow of the melt (arrowed) is well developed (N38�28.2340/E113�53,0040). (B) Syn-migmatiticlayering with stretched restitic layers. Insert: asymmetric leucocratic pressure shadows around biotite-rich restite showing a top to the NE shearing, near the dome top. S1 is flatlying (N38�58.3170/E114�21.2370). (C) Sigmoidal leucosome showing a top to the SE shearing, in a foliated diatexite, S1 strikes N120E and dips 40� to the NE and L1 trends N110E(N38�57.2830/E114�34.2210). (D) Drag fold developed at dome termination showing downward shearing. Note a saddle reef (arrowed) (N38�30.4120/E113�52.5940).
P. Trap et al. / Journal of Structural Geology 30 (2008) 1109–1125 1119
conspicuous partial melting and anatectic granite emplacement. Inagreement with our structural and geochronological results, andespecially the geochronological data set from the literature, wesuggest that the age of the D1 deformation can be estimatedbetween 2100 Ma and 2000 Ma.
The other ages reported from our study range in the period1880–1820 Ma, which is thought to represent the timing of themain metamorphic event related to the collision and building of theTNCB (e.g. Kroner et al., 2005). However, recent studies pointed toa polyphase deformation history within the 1880–1820 period(Faure et al., 2007; Trap et al., 2007). This was confirmed by recentgeochronological studies performed on the TNCB, that documenttwo dominant geochronological periods, at 1870–1890 Ma and1830–1850 Ma (Fig. 15, Liu et al., 2006; Trap et al., 2007).
From sample FP133, a mean age has been calculated at1875 � 13 Ma which is very close to that of 1875 � 43 Ma (Zhaoet al., 2002) from a trondhjemitic gneiss. Sample FP133 comes fromthe footwall of the Longquanguan Thrust along which recentchemical U–Th–Pb dating of monazite by electron microprobe of anorthogneiss yields an age of 1877 � 11 Ma interpreted as the age ofthe ductile shearing (Zhao et al., 2006). Indeed, the LongquanguanThrust, together with several other thrust faults located more to thewest, are responsible for nappe stacking, resulting in crustalthickening and amphibolite facies metamorphism which is wellconstrained between 1870 and 1890 Ma in the TNCB (Faure et al.,2007; Trap et al., 2007). Therefore, the D2 event, related to theactivity of the LQG Thrust and responsible for nappe stackingwithin the TNCB, is estimated at around 1870–1890 Ma.
Sample FP133 yields an age at 1847 � 13 Ma which is inagreement with that of 1841 � 5 Ma from the monazites of the
same rock as well as the age of 1842 � 12 Ma from the sampleFP205. These ages are quite similar to the muscovite 40Ar–39Ar ageof 1830 � 12 Ma associated with the D3 event. Moreover, youngerages of 1826 � 12 Ma and 1850 � 10 Ma have been measured fromgrain overgrowths within TTG and Nanying granite, respectively(Zhao et al., 2002). Recently Zhang et al. (2006a) give ages of1843 � 12 Ma and 1844 � 18 Ma from SHRIMP zircon analysis ofleucocratic dykes. Therefore, we suggest that the youngest agesranging between 1820 and 1850 Ma within the Fuping massif arerelated to a late-orogenic event (D3) different from the D2 eventresponsible for nappe stacking ca. 30–50 Ma before.
Fig. 15 is a synthesis of geochronological data. Four age groupsare pointed out: (i) w2700 Ma inherited ages, (ii) Neoarcheanages (ca. 2500 Ma) corresponding to the emplacement of TTGmagma, (iii) the ca. 2100 Ma ages that correspond to a period ofintense crustal melting coeval with the D1 event and (iv) the1900–1800 Ma ages related to the Trans-North China Orogeny.
7. Discussion
7.1. Tectonic setting for the domes and basinsemplacement at 2.1 Ga
The regional-scale dome-and-basin architecture of the FupingMassif has been recently described as an interference pattern dueto the superposition of two deformations responsible fordevelopment of folds with different axial directions (Zhang et al.,2006a,b). However, such fold interference may produce lineationpatterns expected from a doubly folded surface, in particularwithout any variation of the finite strain patterns relative to the

Fig. 10. Field evidence and schematic diagram of the two dominant deformations observed in the migmatite of the Dome-and-Basin Domain. (a) N110E vertical boudinage ofa mafic layer, the intermediate finite strain axis (Y) is vertical (N38�19.5650/E�113�37.0150). (b) Linear fabric indicated by an elongated amphibolite restite within the gneissicmigmatite, the rounded shape of the restite in section perpendicular to X axis (YZ section) shows a prolate 3D shape that argues for a constrictional finite strain (N38�56.1770/E�114�19.1930).
Fig. 11. Interpretative sketch of a single migmatitic dome of the Dome-and-BasinDomain showing top-moving downward kinematics at dome terminations and coaxialflow along dome flanks.
P. Trap et al. / Journal of Structural Geology 30 (2008) 1109–11251120
position in the dome (Whitney et al., 2004). Thus a cross-foldingmodel is not in agreement with structural features described abovefor the Fuping Massif. In the Fuping Massif, a metamorphic corecomplex setting is also precluded since large scale detachmentfaults that would accommodate extensional doming is lacking, andno unidirectional mineral lineation or consistent sense of shearhave been reported across the whole massif.
Dome-and-basin domains are widespread in Precambrianterrains and are commonly pointed out as an argument againstuniformitarianism (e.g. Choukroune et al., 1995). These dome-and-basin domains are considered to result from diapirismtriggered by gravitational instabilities. The typical structural featureis a steeply dipping mineral lineation that converges towardsa zone of intense vertical constrictional strain (Collins et al., 1998).Kinematic indicators suggest a systematic downward displacementof the supracrustal rocks relative to infracrustal ones (Bouhallieret al., 1993; Choukroune et al., 1995). However, such regionsdeformed by body force often experienced an additional episode ofregional deformation which was the result of application ofboundary forces. As a consequence, the finite strain pattern due todiapirism is partly reworked or superimposed by a deformationrelated to a regional stress field, as described in the Indian and Manshields (e.g. Choukroune et al., 1993, 1995; Bouhallier et al., 1993).The absence of steeply dipping lineation all around the domessuggests that a gravity-dominated process alone such as sagductioncannot be advocated. Even if a weak radial scattering can beobserved, the L1 stretching lineation within Fuping domes isdominantly E–W to ESE–WNW trending (Fig. 4). The constantorientation of the stretching lineation in a magmatic gneiss domehas been attributed to the influence of a regional strain field (e.g.,Whitney et al., 2004), which is, in the case of the Fuping Massif,
characterized by a N–S trending shortening and an E–W trendingstretching. However, this regional strain field alone cannot explainall the structural features observed in the Fuping domes and someevidence suggests a role of the body forces or diapirism. Numerouspetrological and structural indications show that deformation wascoeval with migmatization. Stretched restites and preferredaccumulation of melt in dilatants sites comply with theinterpretation that the boudinaged migmatitic foliation in theFuping Massif developed during melting. For instance, the S1foliation of the Fuping diatexite wraps around mafic restites (Fig. 3)
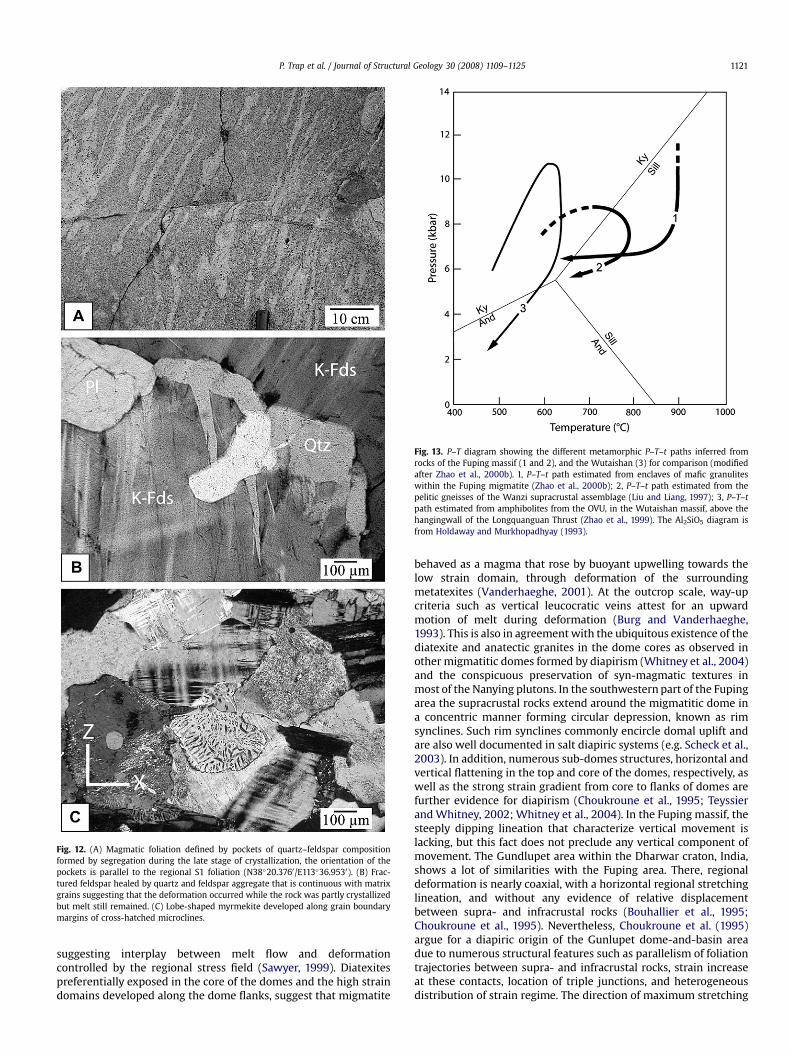
Fig. 12. (A) Magmatic foliation defined by pockets of quartz–feldspar compositionformed by segregation during the late stage of crystallization, the orientation of thepockets is parallel to the regional S1 foliation (N38�20.3760/E113�36.9530). (B) Frac-tured feldspar healed by quartz and feldspar aggregate that is continuous with matrixgrains suggesting that the deformation occurred while the rock was partly crystallizedbut melt still remained. (C) Lobe-shaped myrmekite developed along grain boundarymargins of cross-hatched microclines.
Fig. 13. P–T diagram showing the different metamorphic P–T–t paths inferred fromrocks of the Fuping massif (1 and 2), and the Wutaishan (3) for comparison (modifiedafter Zhao et al., 2000b). 1, P–T–t path estimated from enclaves of mafic granuliteswithin the Fuping migmatite (Zhao et al., 2000b); 2, P–T–t path estimated from thepelitic gneisses of the Wanzi supracrustal assemblage (Liu and Liang, 1997); 3, P–T–tpath estimated from amphibolites from the OVU, in the Wutaishan massif, above thehangingwall of the Longquanguan Thrust (Zhao et al., 1999). The Al2SiO5 diagram isfrom Holdaway and Murkhopadhyay (1993).
P. Trap et al. / Journal of Structural Geology 30 (2008) 1109–1125 1121
suggesting interplay between melt flow and deformationcontrolled by the regional stress field (Sawyer, 1999). Diatexitespreferentially exposed in the core of the domes and the high straindomains developed along the dome flanks, suggest that migmatite
behaved as a magma that rose by buoyant upwelling towards thelow strain domain, through deformation of the surroundingmetatexites (Vanderhaeghe, 2001). At the outcrop scale, way-upcriteria such as vertical leucocratic veins attest for an upwardmotion of melt during deformation (Burg and Vanderhaeghe,1993). This is also in agreement with the ubiquitous existence of thediatexite and anatectic granites in the dome cores as observed inother migmatitic domes formed by diapirism (Whitney et al., 2004)and the conspicuous preservation of syn-magmatic textures inmost of the Nanying plutons. In the southwestern part of the Fupingarea the supracrustal rocks extend around the migmatitic dome ina concentric manner forming circular depression, known as rimsynclines. Such rim synclines commonly encircle domal uplift andare also well documented in salt diapiric systems (e.g. Scheck et al.,2003). In addition, numerous sub-domes structures, horizontal andvertical flattening in the top and core of the domes, respectively, aswell as the strong strain gradient from core to flanks of domes arefurther evidence for diapirism (Choukroune et al., 1995; Teyssierand Whitney, 2002; Whitney et al., 2004). In the Fuping massif, thesteeply dipping lineation that characterize vertical movement islacking, but this fact does not preclude any vertical component ofmovement. The Gundlupet area within the Dharwar craton, India,shows a lot of similarities with the Fuping area. There, regionaldeformation is nearly coaxial, with a horizontal regional stretchinglineation, and without any evidence of relative displacementbetween supra- and infracrustal rocks (Bouhallier et al., 1995;Choukroune et al., 1995). Nevertheless, Choukroune et al. (1995)argue for a diapiric origin of the Gunlupet dome-and-basin areadue to numerous structural features such as parallelism of foliationtrajectories between supra- and infracrustal rocks, strain increaseat these contacts, location of triple junctions, and heterogeneousdistribution of strain regime. The direction of maximum stretching
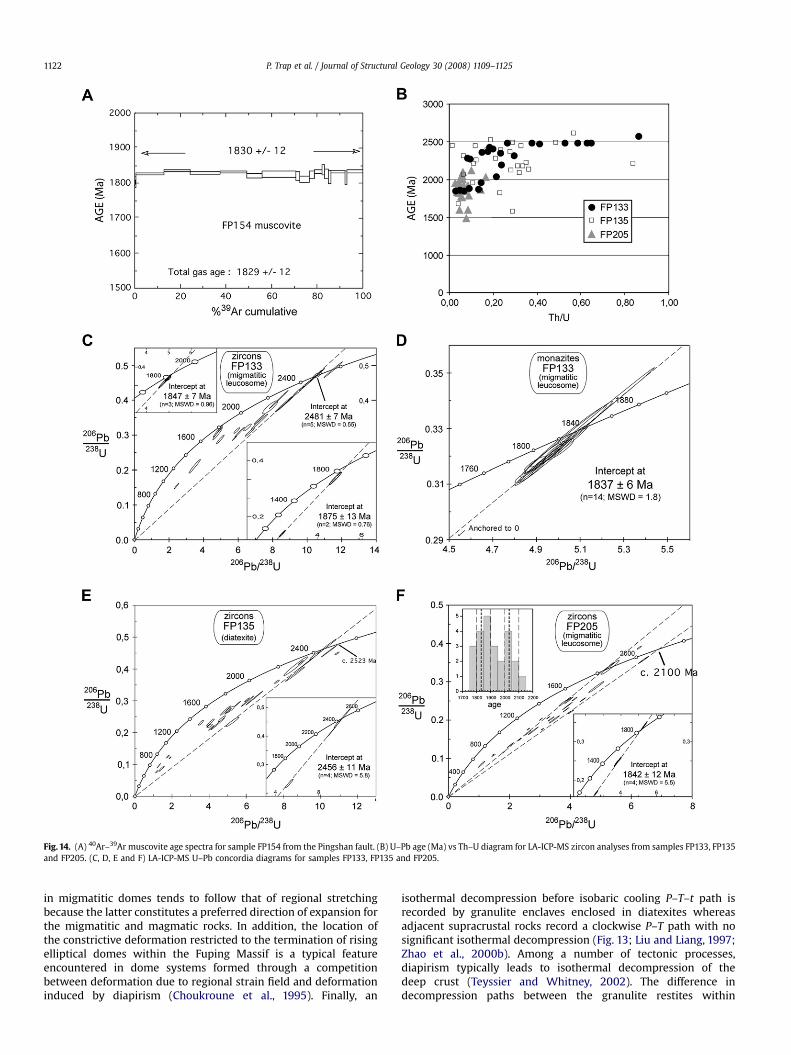
Fig. 14. (A) 40Ar–39Ar muscovite age spectra for sample FP154 from the Pingshan fault. (B) U–Pb age (Ma) vs Th–U diagram for LA-ICP-MS zircon analyses from samples FP133, FP135and FP205. (C, D, E and F) LA-ICP-MS U–Pb concordia diagrams for samples FP133, FP135 and FP205.
P. Trap et al. / Journal of Structural Geology 30 (2008) 1109–11251122
in migmatitic domes tends to follow that of regional stretchingbecause the latter constitutes a preferred direction of expansion forthe migmatitic and magmatic rocks. In addition, the location ofthe constrictive deformation restricted to the termination of risingelliptical domes within the Fuping Massif is a typical featureencountered in dome systems formed through a competitionbetween deformation due to regional strain field and deformationinduced by diapirism (Choukroune et al., 1995). Finally, an
isothermal decompression before isobaric cooling P–T–t path isrecorded by granulite enclaves enclosed in diatexites whereasadjacent supracrustal rocks record a clockwise P–T path with nosignificant isothermal decompression (Fig. 13; Liu and Liang, 1997;Zhao et al., 2000b). Among a number of tectonic processes,diapirism typically leads to isothermal decompression of thedeep crust (Teyssier and Whitney, 2002). The difference indecompression paths between the granulite restites within
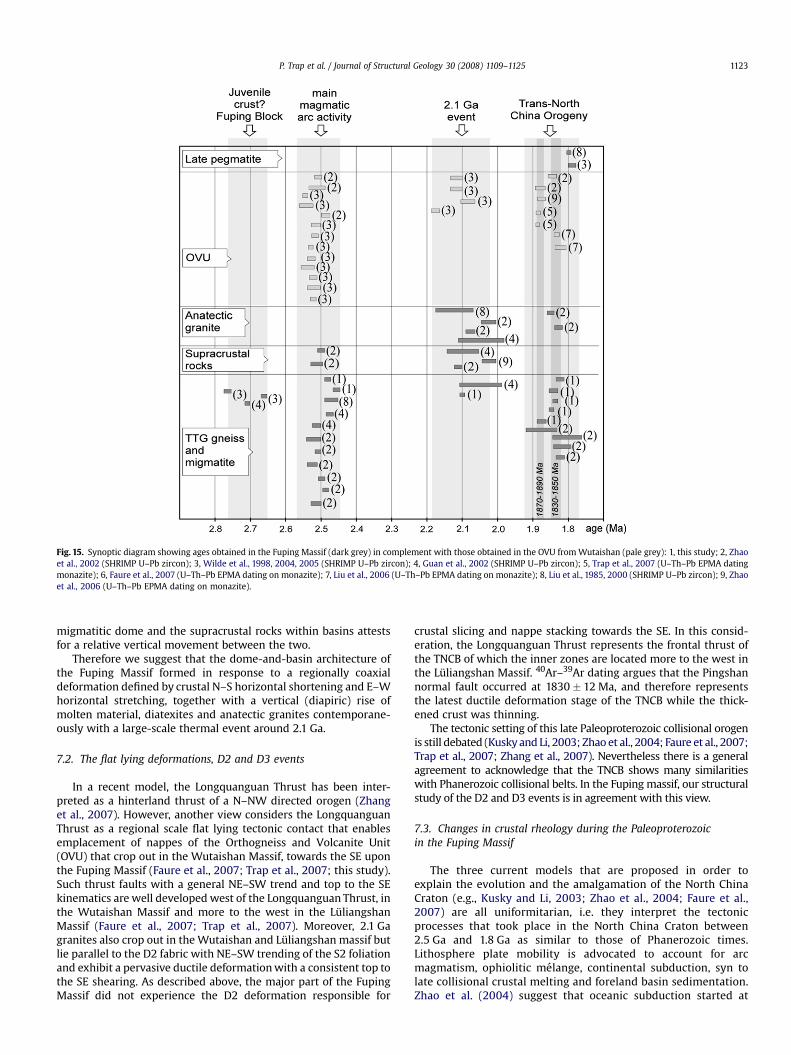
Fig. 15. Synoptic diagram showing ages obtained in the Fuping Massif (dark grey) in complement with those obtained in the OVU from Wutaishan (pale grey): 1, this study; 2, Zhaoet al., 2002 (SHRIMP U–Pb zircon); 3, Wilde et al., 1998, 2004, 2005 (SHRIMP U–Pb zircon); 4, Guan et al., 2002 (SHRIMP U–Pb zircon); 5, Trap et al., 2007 (U–Th–Pb EPMA datingmonazite); 6, Faure et al., 2007 (U–Th–Pb EPMA dating on monazite); 7, Liu et al., 2006 (U–Th–Pb EPMA dating on monazite); 8, Liu et al., 1985, 2000 (SHRIMP U–Pb zircon); 9, Zhaoet al., 2006 (U–Th–Pb EPMA dating on monazite).
P. Trap et al. / Journal of Structural Geology 30 (2008) 1109–1125 1123
migmatitic dome and the supracrustal rocks within basins attestsfor a relative vertical movement between the two.
Therefore we suggest that the dome-and-basin architecture ofthe Fuping Massif formed in response to a regionally coaxialdeformation defined by crustal N–S horizontal shortening and E–Whorizontal stretching, together with a vertical (diapiric) rise ofmolten material, diatexites and anatectic granites contemporane-ously with a large-scale thermal event around 2.1 Ga.
7.2. The flat lying deformations, D2 and D3 events
In a recent model, the Longquanguan Thrust has been inter-preted as a hinterland thrust of a N–NW directed orogen (Zhanget al., 2007). However, another view considers the LongquanguanThrust as a regional scale flat lying tectonic contact that enablesemplacement of nappes of the Orthogneiss and Volcanite Unit(OVU) that crop out in the Wutaishan Massif, towards the SE uponthe Fuping Massif (Faure et al., 2007; Trap et al., 2007; this study).Such thrust faults with a general NE–SW trend and top to the SEkinematics are well developed west of the Longquanguan Thrust, inthe Wutaishan Massif and more to the west in the LuliangshanMassif (Faure et al., 2007; Trap et al., 2007). Moreover, 2.1 Gagranites also crop out in the Wutaishan and Luliangshan massif butlie parallel to the D2 fabric with NE–SW trending of the S2 foliationand exhibit a pervasive ductile deformation with a consistent top tothe SE shearing. As described above, the major part of the FupingMassif did not experience the D2 deformation responsible for
crustal slicing and nappe stacking towards the SE. In this consid-eration, the Longquanguan Thrust represents the frontal thrust ofthe TNCB of which the inner zones are located more to the west inthe Luliangshan Massif. 40Ar–39Ar dating argues that the Pingshannormal fault occurred at 1830 � 12 Ma, and therefore representsthe latest ductile deformation stage of the TNCB while the thick-ened crust was thinning.
The tectonic setting of this late Paleoproterozoic collisional orogenis still debated (Kusky and Li, 2003; Zhao et al., 2004; Faure et al., 2007;Trap et al., 2007; Zhang et al., 2007). Nevertheless there is a generalagreement to acknowledge that the TNCB shows many similaritieswith Phanerozoic collisional belts. In the Fuping massif, our structuralstudy of the D2 and D3 events is in agreement with this view.
7.3. Changes in crustal rheology during the Paleoproterozoicin the Fuping Massif
The three current models that are proposed in order toexplain the evolution and the amalgamation of the North ChinaCraton (e.g., Kusky and Li, 2003; Zhao et al., 2004; Faure et al.,2007) are all uniformitarian, i.e. they interpret the tectonicprocesses that took place in the North China Craton between2.5 Ga and 1.8 Ga as similar to those of Phanerozoic times.Lithosphere plate mobility is advocated to account for arcmagmatism, ophiolitic melange, continental subduction, syn tolate collisional crustal melting and foreland basin sedimentation.Zhao et al. (2004) suggest that oceanic subduction started at
P. Trap et al. / Journal of Structural Geology 30 (2008) 1109–11251124
2.5 Ga and that subsequent collision occurred at 1.8 Ga, 800 Malater. During this long time span, the rheology of the continentalcrust did not change but behaved as the present one. There isa growing consensus that plate tectonics has been an activecomponent of Earth dynamics back to the Hadean (i.e., Cawoodet al., 2006). However, the rheological behaviour of the conti-nental crust was certainly different for older orogens due toa higher thermal regime and rather fast mantle convection(Richter, 1984; Marshak, 1999). Because during Archean andPaleoproterozoic the mantle was hotter than presently, somegeologists suggest that the continental crust was also hotter thanpresent (e.g., Percival, 1994). On the contrary, other researchersargue that the continental crust was not substantially hotterthan today because it may lie above a thick lithospheric rootacting as a thermal shield (Bickle, 1986; Sandiford, 1989).
In the Fuping massif, the dome-and-basin architecture formedin response to a regionally coaxial deformation defined by crustalN–S horizontal shortening and E–W horizontal stretching,contemporaneous with a large-scale thermal event. Such highthermal conditions together with the homogeneity in the characterof the deformation suggest that the lithosphere should be ratherhot and consequently the crust was mechanically softened.Deformation of a weak lithosphere associated with a high thermalregime is not restricted to the Archean but is also called upon innumerous Paleoproterozoic belts, such as the ScandinavianSvecofennides (e.g. Cagnard et al., 2006) or the 2.1 Ga granite-greenstone terrains of West Africa which formed in response tointerference between diapiric and regional tectonics (Pons et al.,1995) similar to the Fuping area.
Marshak (1999) considered some implications of high temper-ature gradients in the crust in relation to deformation style, andespecially for shear zone initiation and amplification. According tothese authors, Paleoproterozoic mylonites would be restricted toa thin portion of the upper crust that would rarely be preserved,while high-grade shear zones yielding gneissic tectonites, mightdevelop at depths where mylonites form presently. No flat lyingmylonitic shear zones developed during the 2.1 Ga tectonic eventbut gneissic tectonites formed along migmatitic dome flanks. TheLongquanguang Thrust and the Pingshan Fault are kilometre-scalemylonitic shear zones developed at a lower thermal regime around1.9–1.8 Ga. The difference in the deformation style between the 2.1and the 1.9–1.8 orogeny could be viewed as a consequence of a re-gional cooling of the continental crust during the Paleoproterozoic.When dealing with the tectonic processes and deformation stylesof the continental crust, the Neoarchean-Paleoproterozoic appearsas a transitional period in the earth history. This statement couldalso stand for the North China Craton.
8. Conclusion
The structural study of the Fuping massif provides an example ofsuperimposed tectonic styles during the Paleoproterozoic evolu-tion of the North China Craton. Structural elements developed at1.9–1.8 Ga, characterized by flat-lying syn-metamorphic foliationand ductile shearing are quite similar to those encountered inPhanerozoic collisional belts. Although its geodynamic significanceis not clearly settled yet, an earlier event, dated at ca. 2.1 Ga ischaracterized by E–W elongated granitic and migmatitic domes.Dome emplacement is the result of vertical (diapiric) rise of moltenmaterial, diatexites and anatectic granites, in a regional strain fieldcharacterized by N–S shortening and E–W stretching. Therefore,a new orogenic event dated at 2.1 Ga has to be considered in theevolution of the Fuping Massif within the North China Craton from2.7 Ga to 1.8 Ga. Other evidence for a 2.1 Ga event is found in sev-eral places in the North China Craton (e.g. Yu and Li, 1997; Wildeet al., 2005). Nevertheless, additional work at a greater scale is
necessary before reaching a satisfactory interpretation of the placeof the Fuping dome-and-basin domain in the 2.1 Ga geodynamicevolution of the whole North China Craton. Finally, such a differ-ence in tectonic styles is evidence for changes in the lithosphericrheological behaviour due to its cooling during Paleoproterozoic, inthe North China Craton.
Acknowledgements
The field work for this research was financially supported bya National Science Foundation of China grant no. 40472116.40Ar–39Ar and U–Pb LA-ICP-MS analyses were performed at theUniversity of Montpellier II, France.
References
Bai, J., 1986. The Precambrian crustal evolution of the Wutaishan area. In: Bai, J. (Ed.),The Early Precambrian Geology of Wutaishan. Tianjin Science and TechnologyPress, Tianjin, pp. 376–383 (in Chinese).
Bai, J., Dai, F.Y.,1998. Archean crust of China. In: Ma, X.Y., Bai, J. (Eds.), Precambrian CrustEvolution of China. Springer-Geological Publishing House, Beijing, pp. 15–86.
Bickle, M.J., 1986. Global thermal histories. Nature 319, 13–14.Bouchez, J.L., Delas, C., Gleizes, G., Nedelec, A., Cuney, M., 1992. Submagmatic
microfractures in granites. Geology 20, 35–38.Bouhallier, H., Choukroune, P., Ballevre, M., 1993. Diapirism, bulk homogeneous
shortening and transcurrent shearing in the Archaean Dharwar craton: theHolenarsipur area, southern India. Precambrian Res. 63, 43–58.
Bouhallier, H., Chardon, D., Choukroune, P., 1995. Strain patterns in Archaean domeand basin structures: the Darwar craton (Karnakata, South India). Earth Planet.Sci. Lett. 135, 57–75.
Bruguier, O., Telouk, P., Cocherie, A., Fouillac, A.M., Albarede, F., 2001. Evaluation ofPb–Pb and U–Pb laser ablation ICP-MS zircon dating using matrix-matchedcalibration samples with a frequency quadrupled (266 nm) Nd-YAG laser.Geostandards Newslett. J. Geostandards Geoanal. 25, 361–373.
Burg, J.P., Vanderhaeghe, O., 1993. Structures and way-up criteria in migmatites,with application to the Velay dome (French Massif Central). J. Struct. Geol. 15,1293–1301.
Cagnard, F., Brun, J.P., Gapais, D., 2006. Modes of thickening of analogue weaklithospheres. Tectonophysics 421, 145–160.
Cawood, P.A., Kroner, A., Pisarevsky, S., 2006. Precambrian plate tectonics: criteriaand evidence. J. Geol. Soc. Am. 16, 4–11.
Chardon, D., Choukroune, P., Jayananda, M., 1996. Strain patterns, decollement andincipient sagducted greenstone terrains in South India. J. Struct. Geol. 18,991–1004.
Cheng, Y.Q., Wan, Y.S., Gao, J.F., Ma, R., 2001. Petrographic Characteristics ofthree anatectically transformed metamorphic rock types of the Fuping Group –complex of the Xiaojue Region, Pingshan. Hebei. Geol. Rev. 47, 1–8 (in Chinesewith English abstract).
Choukroune, P., Auvray, B., Jahn, B.M., Chen, T., Geng, Y., Liu, D., 1993. Coupestructurale de la croute Archeenne en Hebei (Craton sino-coreen, Chine dunord). C.R. Acad. Sci. Paris 316, 669–675.
Choukroune, P., Bouhallier, H., Arndt, N.T., 1995. Soft lithosphere during periods ofArchaean crustal growth or crustal reworking. In: Coward, M.P., Ries, A. (Eds.),Early Precambrian Processes. Special Publication, vol. 95. Geological Society,London, pp. 67–86.
Collins, W.J., Van Kranendonk, M.J., Teyssier, C., 1998. Partial convective overturn ofArchaean crust in the east Pilbara Craton, Western Australia: driving mecha-nisms and tectonic implications. J. Struct. Geol. 20, 1405–1424.
Dalrymple, G.B., 1989. The GLM continuous laser system for 40Ar/39Ar dating:Description and performance characteristics. In: Shanks, W.C., Criss, R. (Eds.),New Frontiers in Stable Isotope Research. US Geol. Soc. Bull., 1890, pp. 89–96.
Faure, M., Trap, P., Lin, W., Monie, P., Bruguier, O., 2007. The formation of the NorthChina Craton by two Palaeoproterozoic continental collisions in Luliang-Hengshan-Wutaishan-Fuping massifs. Episodes 30, 1–12.
Greenfield, J.E., Clarke, G.L., Bland, M., Clark, D.J., 1996. In-situ migmatite and hybriddiatexite at Mt Stafford, central Australia. J. Metamorphic Geol. 14, 413–426.
Guan, H., 2000. The Fuping Complex and its significance in early Precambriancrustal evolution of Sino-Korean Craton. PhD thesis, The University of HongKong, Hong Kong, 223 pp.
Guan, H., Sun, M., Wilde, S.A., Zhou, X.H., Zhai, M.G., 2002. SHRIMP U–Pb zircongeochronology of the Fuping Complex: implications for formation and assem-bly of the North China craton. Precambrian Res. 113, 1–18.
Hames, W.E., Bowring, S.A., 1994. An empirical evaluation of the argon diffusiongeometry in muscovite. Earth Planet. Sci. Lett. 124, 161–167.
Hao, J., Wang, K.Y., Zhou, S.P., 1995. Discussion on stratigraphic and tectonicfeatures of ‘‘Longquanguan Group’’ in the south west piedmont of Wutaimountain and relevant problems. Sci. Geol. Sin. 30, 183–189 (in Chinese withEnglish abstract).
HBGMR (Henan Bureau of Geology and Mineral Resources), 1989. Regional Geologyof Shanxi Province. Geological Publishing House, Beijing, 742 pp.

P. Trap et al. / Journal of Structural Geology 30 (2008) 1109–1125 1125
Hibbard, M.J., 1987. Deformation of incompletely crystallized magma systems:granitic gneisses and their tectonic implications. J. Geol. 95, 543–561.
Holdaway, M.J., Murkhopadhyay, B.A., 1993. A reevaluation of the stability relationsof andalusite: thermochemical data and phase diagram for the aluminumsilicates. Am. Mineral. 78, 298–315.
Kroner, A., Wilde, S.A., Li, J.H., Wang, K.Y., 2005. Age and evolution of a late Archeanto early Palaeoproterozoic upper to lower crustal section in the Wutaishan/Hengshan/ Fuping terrain of northern China. J. Asian Earth Sci. 24, 577–596.
Kusky, T.M., Li, J.H., 2003. Paleoproterozoic tectonic evolution of the North Chinacraton. J. Asian Earth Sci. 22, 23–40.
Li, J.H., Qian, X.L., 1991. A study of Longquanguan shear zone in the northern part ofthe Taihang Mountain. Shanxi Geol. 6, 17–29 (in Chinese).
Li, J.H., Niu, S.L., Chen, Z., 2004. Discovery of the deep thrusting structure in theTaihangshan area and its tectonic implications. Adv. Natural Sci. 14, 1118–1127.
Liu, D., Page, Y., Compston, R.W., Wu, W.J., 1985. U–Pb zircon geochronology of lateArchean metamorphic rocks in the Taihangshan-Wutaishan area North China.Precambrian Res. 27, 85–109.
Liu, S.W., 1996. Study on the P–T path of granulites in Fuping area, Hebei Province.Geol. J. Univ. 2, 75–84 (in Chinese with English abstract).
Liu, S.W., Liang, H.H., 1997. Metamorphism of Al-rich gneisses from the FupingComplex, Taihang Mountain, China. Acta Petrol. Sin. 13, 303–312.
Liu, S.W., Liang, H.H., Zhao, G.C., Hua, Y.G., Jian, A.H., 2000. Isotopic chronology and geo-logical events of Precambrian complex in Taihangshan region. Sci. China 43, 386–393.
Liu, S.W., Pan, Y., Li, J.H., Li, G.G., Zhang, J., 2002a. Geological and isotopicgeochemical constraints on the evolution of the Fuping Complex, North ChinaCraton. Precambrian Res. 117, 41–56.
Liu, S.W., Li, J.H., Pan, Y.M., Zhang, J., Li, Q.G., 2002b. An Archean continental block inthe Taihangshan and Hengshan regions: constraints from geochronology andgeochemistry. Prog. Nat. Sci. 12, 568–576.
Liu, S.W., Pan, Y.M., Xie, Q.L., Zhang, J., Li, Q.G., 2004. Archean geodynamics in theCentral Zone, North China Craton: constraints from geochemistry of twocontrasting series of granitoids in the Fuping and Wutai complexes. Precam-brian Res. 130, 229–249.
Liu, S.W., Zhao, G.C., Wilde, S.A., Shu, G., Sun, M., Li, Q., Tian, W., Zhang, J., 2006. Th–U–Pb monazite geochronology of the Luliang and Wutai complexes: constraintson the tectonothermal evolution of the Trans-North China orogen. PrecambrianRes. 148, 205–224.
Ludwig, K.R., 2000. Users Manual for ISOPLOT/EX. A Geochronological Toolkit forMicrosoft Excel. In: Special Publication, Version 2, vol. 1a. BerkeleyGeochronology Center, 43 pp.
Marshak, S., 1999. Deformation style way back when: thoughts on the contrastsbetween Archean: paleoproterozoic and contemporary orogens. J. Struct. Geol.21, 1175–1182.
Marmo, V., 1971. Granite Petrology and the Granite Problem. Elsevier, Amsterdam,pp. 1-244.
McLaren, S., Sandiford, M., Powell, R., 2005. Contrasting styles of Proterozoic crustalevolution: a hot-plate tectonic model for Australian terranes. Geol. Soc. Am. 33,673–676.
Menhert, K.R., 1968. Migmatites and the Origin of Granitic Rocks. Elsevier,Amsterdam, 393 pp.
Monie, P., Torres-Roldan, R.L., Garcia-Casco, A., 1994. Cooling and exhumation of thewestern Betic Cordilleras, 40Ar/40Ar thermochronological constraints ona collapsed terrane. Tectonophysics 238, 353–379.
Monie, P., Caby, R., Arthaud, M.H., 1997. The neoproterozoic Brasiliano orogeny innortheast Brazil: 40Ar/39Ar and petrostructural data from Ceara. PrecambrianRes. 81, 241–264.
Pawley, M.J., Collins, W.J., 2002. The development of contrasting structures duringthe cooling and crystallisation of a syn-kinematic pluton. J. Struct. Geol. 24,469–483.
Percival, J.A., 1994. Archean high-grade metamorphism. In: Condie, K.C. (Ed.),Archean Crustal Evolution. Elsevier, Amsterdam, pp. 357–410.
Percival, J.A., Stern, R.A., Skulski, T., 2001. Crustal growth through successive arcmagmatism, northeastern Superior Province, Canada. Precambrian Res. 109,203–238.
Pons, J., Barbey, P., Dupuis, D., Leger, J.M., 1995. Mechanisms of pluton emplacementand structural evolution of the 2.1 Ga juvenile continental crust: the Birimien ofsouthwestern Niger. Precambrian Res. 70, 281–305.
Richter, F.M., 1984. Regionalized models for thermal evolution of the earth. EarthPlanet. Sci. Lett. 68, 471–484.
Sandiford, M., 1989. Secular trends in the thermal evolution of metamorphicterrains. Earth Planet. Sci. Lett. 95, 85–96.
Sawyer, E.W., 1999. Criteria for the recognition of partial melting. Phys. Chem. Earth24, 269–279.
SBGMR (Shanxi Bureau of Geology and Mineral Resources), 1989. Regional Geologyof Shanxi Province. Geological Publishing House, Beijing, 780 pp.
Scheck, M., Bayer, U., Lewerenz, B., 2003. Salt movements in the Northeast GermanBasin and its relation to major post-Permian tectonic phases – results from 3Dstructural modelling, backstripping and reflection seismic data. Tectonophysics361, 277–299.
Sun, M., Guan, H., 2001. Zircon U–Pb ages of the Fuping Complex and their impli-cations: some comments on the geochronological study of the precambrianhigh-grade metamorphic terranes. Acta Petrol. Sin. 17, 145–156 (in Chinese withEnglish abstract).
Sun, Z.L., Li, J.R., Liu, C.R., Zhang, Y.S., Yang, Y.H., Yan, W.S., 2004. Another view onthe Longquanguan Ductile Shear Zone. Geol. Survey Res. 27, 92–100 (in Chinesewith English abstract).
Tang, X.M., Liu, S.W., 1997. Extensional deformation belt in the Archeanmetamorphic rocks in the Northern Taihang mountains. J. Peking Univ. 33,447–455.
Teyssier, C., Whitney, D.L., 2002. Gneiss domes and orogeny. Geology 30,1139–1142.
Trap, P., Faure, M., Lin, W., Monie, P., 2007. Late Palaeoproterozoic (1900–1800 Ma)nappe stacking and polyphase deformation in the Hengshan-Wutaishan area:implication for the understanding of the Trans-North China Belt, North ChinaCraton. Precambrian Res. 156, 85–106.
Vanderhaeghe, O., 2001. Melt segregation, pervasive melt migration and magmamobility in the continental crust: the structural record from pores to orogens.Phys. Chem. Earth 26, 213–223.
Vernon, R.H., 1991. Questions about myrmekite in deformed rocks. J. Struct. Geol. 13,979–985.
Vernon, R.H., 2000. Review of microstructural evidence of magmatic and solid-stateflow. Electron. Geosci. 5 (2), 1–23.
Wan, Y.S., Cheng, Y.Q., Gao, J.F., Yang, C.H., 2002. Study on geochemistry ofhornblendic rocks and their anatectic derivatives of the Fuping Group in theXiaojue Area, Hebei Province. Acta Geol. Sin. 23, 429–434.
Wang, K.Y., Li, J.L., Liu, L.Q., 1991. Petrogenesis of the Fuping grey gneisses. Sci. Geol.Sin. 26, 254–267 (in Chinese).
Whitney, D.L., Teyssier, C., Vanderhaeghe, O., 2004. Gneiss domes and crustal flow.In: Special Paper, vol. 380. Geological Society of America. 15–33.
Wiedenbeck, M., Alle, P., Corfu, F., Griffin, W.L., Meier, M., Oberli, F., vonQuadt, A., Ruddick, J.C., Spiegel, W., 1995. Three natural zircon standards forU–Th–Pb, Lu–Hf, trace element and REE analyses. Geostandards Newslett.19, 1–23.
Wilde, S.A., Cawood, P.A., Wang, K.Y., Nemchin, A.,1998. SHRIMP U–Pb zircon dating ofgranites and gneisses in the Taihangshan-Wutaishan area: implications for thetiming of crustal growth in the North China Craton. Chin. Sci. Bull. 43, 144–145.
Wilde, S.A., Cawood, P.A., Wang, K.Y., Nemchin, A., Zhao, G.C., 2004. DeterminingPrecambrian crustal evolution in China: a case study from Wutaishan, ShanxiProvince, demonstrating the application of precise SHRIMP U–Pbgeochronology. In: Malpas, J., Fletcher, C.J.N., Ali, J.R., Aitchison, J.C. (Eds.),Aspects of the Tectonic Evolution of China. Special Publication, vol. 226. Geo-logical Society, London, pp. 5–25.
Wilde, S.A., Cawood, P.A., Wang, K.Y., Nemchin, A., 2005. Granitoid evolution in thelate Archean Wutai Complex, North China Craton. J. Asian Earth Sci. 24,597–613.
Wu, J.S., Geng, Y.S., Xu, H.F., Jin, L.G., He, S.Y., Sun, S.W., 1989. Metamorphic geologyof Fuping Group. J. Chin. Inst. Geol. 19, 1–213 (in Chinese).
Wu, J.S., Geng, Y.S., Shen, Q.H., Liu, D.Y., Li, Z.L., Zhao, D.M., 1991. The earlyPrecambrian significant geological events in the North China Craton. GeologicalPublishing House, Beijing, pp. 1-115 (in Chinese with English abstract).
Wu, C.H., Zhong, C.T., 1998. The paleaoproterozoic SW-NE collision model for thecentral North China Craton. Prog. Precambrian Res. 21, 28–50 (in Chinese).
Yang, Z., Cheng, Y., Wang, H., 1986. The Geology of China. Clarendon Press, Oxford,303 pp.
Yu, J.H., Li, H.M., 1997. Ages of the Luliang Group and its main metamorphism in theLuliang Mountains, Shanxi: evidence from single-grain zircon U–Pb ages. Geol.Rev. 43, 403–408.
Zhang, Z.Q., Wu, J.S., Xe, X.J., 1991. REE, Rb–Sr and Sm–Nd ages of the Archeanmetamorphic rocks of the Lower Fuping Subgroup and their implications.Geochimica 2, 118–126 (in Chinese).
Zhang, J., Zhao, G.C., Li, S., Sun, M., Liu, S., Yin, C.Q., 2006a. New U–Th–Pbgeochronological constraints on the structural evolution of the FupingComplex: implications for the tectonic processes of the Trans-North China or-ogen. In: IAGR Annual Convention & International Symposium 2006, pp. 59–60.Hong Kong, China(abstract).
Zhang, J., Zhao, G.C., Li, S., Sun, M., Liu, S., 2006b. Structural geology of the Fupingcomplex: constraints on the tectonic evolution of the Trans-North ChinaOrogen. In: AGU Western Pacific Geophysics Meeting Abstract No. TI2B-03.
Zhang, J., Zhao, G.C., Li, S.Z., Sun, M., Liu, S.W., Wilde, S.A., Kroner, A., Yin, C.Q., 2007.Deformation history of the Hengshan Complex: implications for the tectonicevolution of the Trans-North China Orogen. J. Struct. Geol. 29, 933–949.
Zhao, G.C., Cawood, P.A., Lu, L.Z., 1999. Petrology and P–T history of the Wutaiamphibolites: implications for tectonic evolution of the Wutai Complex, China.Precambrian Res. 93, 181–199.
Zhao, G.C., Cawood, P.A., Wilde, S.A., Lu, L.Z., 2000a. Metamorphism of basementrocks in the Central Zone of the North China Craton: implications for Paleo-proterozoic tectonic evolution. Precambrian Res. 103, 55–88.
Zhao, G.C., Wilde, S.A., Cawood, P.A., Lu, L.Z., 2000b. Petrology and P–T path of theFuping mafic granulites: implications for tectonic evolution of the central zoneof the North China Craton. J. Metamorph. Geol. 18, 375–391.
Zhao, G.C., Wilde, S.A., Cawood, P.A., Sun, M., 2002. SHRIMP U–Pb zircon ages of theFuping Complex: implications for late Archean to Paleoproterozoic accretionand assembly of the North China Craton. Am. J. Sci. 302, 191–226.
Zhao, G.C., Sun, M., Wilde, S.A., Guo, J.H., 2004. Late Archean to Palae-oproterozoic evolution of the trans-North China Orogen: insights fromsynthesis of existing data from the Hengshan-Wutai-Fuping belt. In:Malpas, J., Fletcher, C.J.N., Ali, J.R., Aitchison, J.C. (Eds.), Aspects of theTectonic Evolution of China. Special Publication, vol. 226. Geological Society,London, pp. 27–55.
Zhao, L., Zhang, J.J., Liu, S.W., 2006. Syn-deformational granites of the Long-quanguan ductile shear zone and their monazite electronic microprobe dating.Acta. Petrol. Mineral. 25, 210–218.
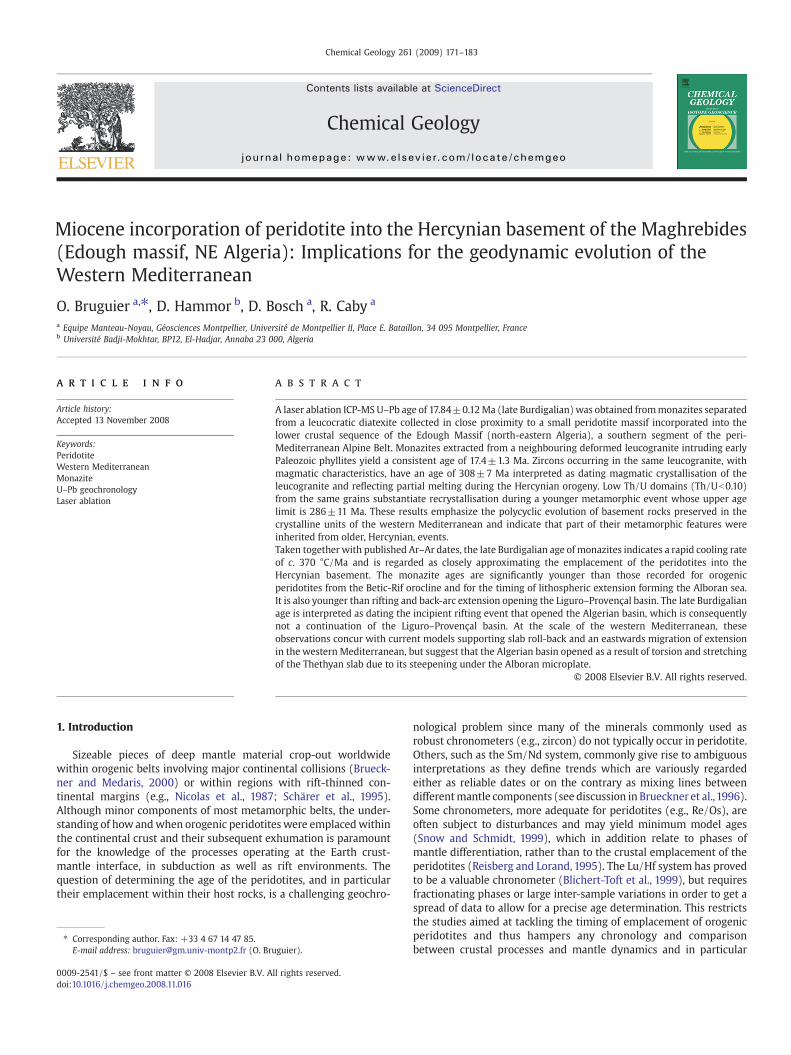
Chemical Geology 261 (2009) 171–183
Contents lists available at ScienceDirect
Chemical Geology
j ourna l homepage: www.e lsev ie r.com/ locate /chemgeo
Miocene incorporation of peridotite into the Hercynian basement of the Maghrebides(Edough massif, NE Algeria): Implications for the geodynamic evolution of theWestern Mediterranean
O. Bruguier a,⁎, D. Hammor b, D. Bosch a, R. Caby a
a Equipe Manteau-Noyau, Géosciences Montpellier, Université de Montpellier II, Place E. Bataillon, 34 095 Montpellier, Franceb Université Badji-Mokhtar, BP12, El-Hadjar, Annaba 23 000, Algeria
⁎ Corresponding author. Fax: +33 4 67 14 47 85.E-mail address: [email protected] (O. Br
0009-2541/$ – see front matter © 2008 Elsevier B.V. Adoi:10.1016/j.chemgeo.2008.11.016
a b s t r a c t
a r t i c l e i n f oArticle history:
A laser ablation ICP-MS U–P Accepted 13 November 2008Keywords:PeridotiteWestern MediterraneanMonaziteU–Pb geochronologyLaser ablation
b age of 17.84±0.12Ma (late Burdigalian)was obtained frommonazites separatedfrom a leucocratic diatexite collected in close proximity to a small peridotite massif incorporated into thelower crustal sequence of the Edough Massif (north-eastern Algeria), a southern segment of the peri-Mediterranean Alpine Belt. Monazites extracted from a neighbouring deformed leucogranite intruding earlyPaleozoic phyllites yield a consistent age of 17.4±1.3 Ma. Zircons occurring in the same leucogranite, withmagmatic characteristics, have an age of 308±7 Ma interpreted as dating magmatic crystallisation of theleucogranite and reflecting partial melting during the Hercynian orogeny. Low Th/U domains (Th/Ub0.10)from the same grains substantiate recrystallisation during a younger metamorphic event whose upper agelimit is 286±11 Ma. These results emphasize the polycyclic evolution of basement rocks preserved in thecrystalline units of the western Mediterranean and indicate that part of their metamorphic features wereinherited from older, Hercynian, events.Taken together with published Ar–Ar dates, the late Burdigalian age of monazites indicates a rapid cooling rateof c. 370 °C/Ma and is regarded as closely approximating the emplacement of the peridotites into theHercynian basement. The monazite ages are significantly younger than those recorded for orogenicperidotites from the Betic-Rif orocline and for the timing of lithospheric extension forming the Alboran sea.It is also younger than rifting and back-arc extension opening the Liguro–Provençal basin. The late Burdigalianage is interpreted as dating the incipient rifting event that opened the Algerian basin, which is consequentlynot a continuation of the Liguro–Provençal basin. At the scale of the western Mediterranean, theseobservations concur with current models supporting slab roll-back and an eastwards migration of extensionin the western Mediterranean, but suggest that the Algerian basin opened as a result of torsion and stretchingof the Thethyan slab due to its steepening under the Alboran microplate.
© 2008 Elsevier B.V. All rights reserved.
1. Introduction
Sizeable pieces of deep mantle material crop-out worldwidewithin orogenic belts involving major continental collisions (Brueck-ner and Medaris, 2000) or within regions with rift-thinned con-tinental margins (e.g., Nicolas et al., 1987; Schärer et al., 1995).Although minor components of most metamorphic belts, the under-standing of how andwhen orogenic peridotites were emplacedwithinthe continental crust and their subsequent exhumation is paramountfor the knowledge of the processes operating at the Earth crust-mantle interface, in subduction as well as rift environments. Thequestion of determining the age of the peridotites, and in particulartheir emplacement within their host rocks, is a challenging geochro-
uguier).
ll rights reserved.
nological problem since many of the minerals commonly used asrobust chronometers (e.g., zircon) do not typically occur in peridotite.Others, such as the Sm/Nd system, commonly give rise to ambiguousinterpretations as they define trends which are variously regardedeither as reliable dates or on the contrary as mixing lines betweendifferentmantle components (see discussion in Brueckner et al.,1996).Some chronometers, more adequate for peridotites (e.g., Re/Os), areoften subject to disturbances and may yield minimum model ages(Snow and Schmidt, 1999), which in addition relate to phases ofmantle differentiation, rather than to the crustal emplacement of theperidotites (Reisberg and Lorand, 1995). The Lu/Hf system has provedto be a valuable chronometer (Blichert-Toft et al., 1999), but requiresfractionating phases or large inter-sample variations in order to get aspread of data to allow for a precise age determination. This restrictsthe studies aimed at tackling the timing of emplacement of orogenicperidotites and thus hampers any chronology and comparisonbetween crustal processes and mantle dynamics and in particular

172 O. Bruguier et al. / Chemical Geology 261 (2009) 171–183

Fig. 2. Schematic cross-section of the southern contact between the Sidi Mohamed peridotite and gneissic units of the Edough massif at sampling site of Ed322. Top field photographis a view of sample Ed322, a leucocratic diatexite collected c. 20 m from the peridotite. The small black arrow indicates location of the collected sample. The lower field photograph isan outcrop view of the Sidi Mohamed peridotite (on the left), surrounded by pyroxenite (pyr) and a phlogopite-rich rock (phl). The two latter are enclosed in a network of anorthite-rich pegmatoid veins.
173O. Bruguier et al. / Chemical Geology 261 (2009) 171–183
whether emplacement of mantle material, high-grade metamorphismand crustal anatexis were coupled phenomena. On the other hand, theemplacement of hot peridotite into the crust is often accompanied bycontact metamorphism (Bosch and Bruguier 1998) or partial meltingof the surrounding rocks (Schersten et al., 2000), which makes itpossible to date emplacement of the peridotites into crustal units. Thisstudy presents laser ablation (LA-) ICP-MSU–Pb analyses ofmonazitesand zircons, extracted from a diatexite migmatite and a leucogranitethat crop out in the Edough massif (north-eastern Algeria), a windowof the crystalline basement of the Maghrebides. The diatexite wassampled close to a small peridotite body, the so-called Sidi Mohamedperidotite (c. 300×150m). The aimof this paper is three fold: 1) assessthe chronology of peridotite incorporation within the crustalsequences of the Edough massif by dating anatexis related to itsemplacement; 2) provide time constraints on basement componentssurrounding the peridotite; 3) consider the regional tectonic implica-tions of these dates for reconstructing the geodynamic evolution ofthis areawith an emphasis on the late Cenozoic kinematic evolution ofthe western Mediterranean basin.
2. Geological setting
The Kabylies and the Edough massif (north-eastern Algeria)constitute the internal zones of the Maghrebides. This belt, that runsfrom Morocco to Algeria, represents the southern segment of the peri-Mediterranean Alpine Belt (Fig. 1a) that resulted from the Cenozoiccollision between Africa and Eurasia along with a set of microplates(Iberia and Apulia) trapped in between (see Frizon de Lamotte et al.,2000 and references therein). Although an important part of the WestMediterranean orogen, this area has been studied little, thus hamperingorogen-scale tectonic correlations since it constitutes the southernflankof the belt and is located midway from its extremities, i.e., between theBetic-Rif and Calabria-Sicily. The dearth of data also impedes studiesaimed at attempting reconstructions of the evolution of the western
Fig. 1. a) Tectonic sketch map of theWesternMediterranean basin showing the location of thFrizon de Lamotte et al., 2000). The square indicates the location of c; b) enlargement of the wAlboran sea area. GK: Greater Kabylia Massif; PK: Lesser Kabylia Massif; EM: Edough Massstudied samples (★). Sampling site for sample Ed322 is shown in Fig. 2.
Mediterranean area and the development of extensional basins in abroadly N–S convergent regime (Michard et al., 2006).
The Edough massif (Fig. 1b) constitutes the easternmost crystallinebasement of the Maghrebides. Its shape is that of a broad asymmetricdome approximately 50 km long and 20 km wide (Fig. 1c) thatstructurally underlies a tectono-metamorphic pile of lower grade rocksincluding Early Paleozoic metasediments (“Alternance series”), alloch-tonous greenschist-faciesMesozoic sediments, and theNumidian flyschnappe. The granite-gneiss core of the massif is tectonically overlain tothe north by an allochtonous unit consisting of garnet amphibolites andmetagabbros with associated slices of peridotites known as theAmphibolite–Peridotite Unit (Caby et al., 2001) and derived fromtholeiitic magmas emplaced in a continental setting (Ahmed-Said andLeake,1992). The granite–gneiss domeof theEdoughmassif comprises apackage of granitoids, gneiss, diatexite migmatites and high-grademetasediments and also includes a lherzolite body with alternatingdunite andpyroxenite bands,first describedby Bossiere et al. (1988) andknown as the Sidi Mohamed peridotite. This ultramafic body forms a c.300×150moutcrop and is enclosed in diatexites and sheeted granitoidswith leucocratic bands. The eastern contact between the peridotite andthe diatexite is outlined by a twelve meter thick layer of phlogopite-dominated rock close to theMARID (Mica–Amphibole–Rutile–Ilmenite–Diopside) suite described by Dawson (1987) and by plagioclase-bearingpyroxenite containing sparse garnet (see Fig. 2). The plagioclase-bearingpyroxenite contains sodic augite that equilibrated at 750 °C and 1.2–1.4Gpa. Both rock types (phlogopite-dominated rock and pyroxenite) areincluded in an agmatitic patchwork of plagioclase rich leucocraticpegmatoid veins (see Fig. 2).
Published geochronological data for rocks of the massif are sparse.U–Pb zircon dating of gneissic units yielded ages around 600 Ma(Hammor and Lancelot, 1998) suggesting the occurrence of Pan-Africanrelatedmaterial in themassif. Metamorphicmonazite from a paragneissyielded an age of 18±5 Ma (Hammor and Lancelot, 1998), consistentwithAr/Armica ages at around 16–17Ma fromgneisses andmicaschists
e Maghrebides within the framework of theWest Mediterranean orogen (modified afterestern part of the Mediterranean basinwith location of the ultramafic complexes in theif; (c) Schematic geological sketch map of the Edough massif showing location of the

174 O. Bruguier et al. / Chemical Geology 261 (2009) 171–183
(Monié et al., 1992). The Edough massif is regarded as a Miocenemetamorphic core complex inwhich the thermal anomalywasprovidedby the upward tectonic emplacement of slices of hot mantle materialand crystallization of ultramafic cumulates (Caby et al., 2001).
Fig. 3. Scanning electronmicroscope (BSE) imaging ofmonazite and zircon from the studied shave euhedral shapes and display broad oscillatory zoning consistent with crystallisation frog): zircon grains from deformed leucogranite Ed325. The crystals have euhedral to sub-euhedgrains.When analysed, the domains with remnants of oscillatory zoning have older 206Pb/238
zircon domains are interpreted as reflecting a static recrystallisation process under metamorpleucogranitic melt. Ages are quoted at the 1σ level and correspond to 206Pb/238U ages. Circ
The studied samples (see Figs. 1c and 2) consist of a leucocraticdiatexite (Ed322) and a deformed leucogranite (Ed325). The leuco-cratic diatexite Ed322 was collected in the central part of the granitegneiss dome, along the road from Annaba to Seraïdi, at about 20 m
amples. a) and b):monazite grains from leucocratic diatexite sample Ed322. The crystalsm a melt; c): irregular-shaped monazite grain from deformed leucogranite Ed325; d) toral shapes and sometimes display a faint oscillatory zoning preserved in some part of theU ages and higher Th/U ratios. The low Th/U ratios and younger ages of the structurelesshic conditions; h): rounded anhedral zircon grain typical of xenocrysts preserved in theles are the laser ablation analysis sites.
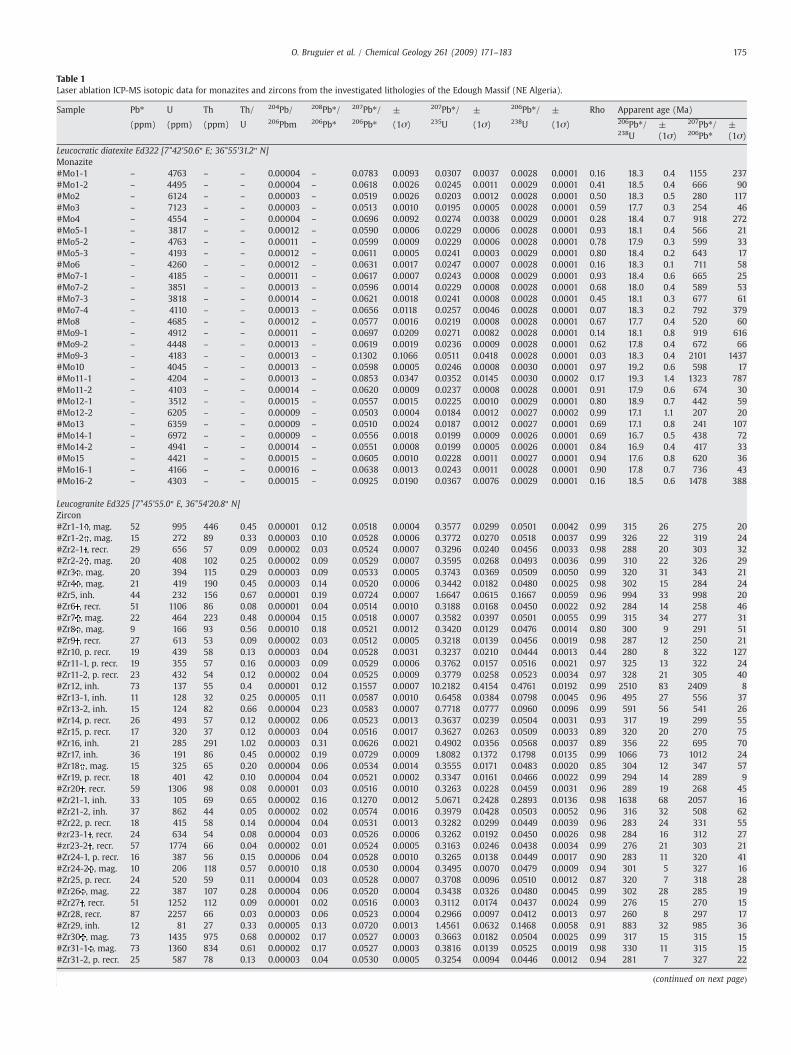
Table 1Laser ablation ICP-MS isotopic data for monazites and zircons from the investigated lithologies of the Edough Massif (NE Algeria).
Sample Pb⁎ U Th Th/ 204Pb/ 208Pb⁎/ 207Pb⁎/ ± 207Pb⁎/ ± 206Pb⁎/ ± Rho Apparent age (Ma)
(ppm) (ppm) (ppm) U 206Pbm 206Pb⁎ 206Pb⁎ (1σ) 235U (1σ) 238U (1σ) 206Pb⁎/ ± 207Pb⁎/ ±238U (1σ) 206Pb⁎ (1σ)
Leucocratic diatexite Ed322 [7°42'50.6q E; 36°55'31.2q N]Monazite#Mo1-1 – 4763 – – 0.00004 – 0.0783 0.0093 0.0307 0.0037 0.0028 0.0001 0.16 18.3 0.4 1155 237#Mo1-2 – 4495 – – 0.00004 – 0.0618 0.0026 0.0245 0.0011 0.0029 0.0001 0.41 18.5 0.4 666 90#Mo2 – 6124 – – 0.00003 – 0.0519 0.0026 0.0203 0.0012 0.0028 0.0001 0.50 18.3 0.5 280 117#Mo3 – 7123 – – 0.00003 – 0.0513 0.0010 0.0195 0.0005 0.0028 0.0001 0.59 17.7 0.3 254 46#Mo4 – 4554 – – 0.00004 – 0.0696 0.0092 0.0274 0.0038 0.0029 0.0001 0.28 18.4 0.7 918 272#Mo5-1 – 3817 – – 0.00012 – 0.0590 0.0006 0.0229 0.0006 0.0028 0.0001 0.93 18.1 0.4 566 21#Mo5-2 – 4763 – – 0.00011 – 0.0599 0.0009 0.0229 0.0006 0.0028 0.0001 0.78 17.9 0.3 599 33#Mo5-3 – 4193 – – 0.00012 – 0.0611 0.0005 0.0241 0.0003 0.0029 0.0001 0.80 18.4 0.2 643 17#Mo6 – 4260 – – 0.00012 – 0.0631 0.0017 0.0247 0.0007 0.0028 0.0001 0.16 18.3 0.1 711 58#Mo7-1 – 4185 – – 0.00011 – 0.0617 0.0007 0.0243 0.0008 0.0029 0.0001 0.93 18.4 0.6 665 25#Mo7-2 – 3851 – – 0.00013 – 0.0596 0.0014 0.0229 0.0008 0.0028 0.0001 0.68 18.0 0.4 589 53#Mo7-3 – 3818 – – 0.00014 – 0.0621 0.0018 0.0241 0.0008 0.0028 0.0001 0.45 18.1 0.3 677 61#Mo7-4 – 4110 – – 0.00013 – 0.0656 0.0118 0.0257 0.0046 0.0028 0.0001 0.07 18.3 0.2 792 379#Mo8 – 4685 – – 0.00012 – 0.0577 0.0016 0.0219 0.0008 0.0028 0.0001 0.67 17.7 0.4 520 60#Mo9-1 – 4912 – – 0.00011 – 0.0697 0.0209 0.0271 0.0082 0.0028 0.0001 0.14 18.1 0.8 919 616#Mo9-2 – 4448 – – 0.00013 – 0.0619 0.0019 0.0236 0.0009 0.0028 0.0001 0.62 17.8 0.4 672 66#Mo9-3 – 4183 – – 0.00013 – 0.1302 0.1066 0.0511 0.0418 0.0028 0.0001 0.03 18.3 0.4 2101 1437#Mo10 – 4045 – – 0.00013 – 0.0598 0.0005 0.0246 0.0008 0.0030 0.0001 0.97 19.2 0.6 598 17#Mo11-1 – 4204 – – 0.00013 – 0.0853 0.0347 0.0352 0.0145 0.0030 0.0002 0.17 19.3 1.4 1323 787#Mo11-2 – 4103 – – 0.00014 – 0.0620 0.0009 0.0237 0.0008 0.0028 0.0001 0.91 17.9 0.6 674 30#Mo12-1 – 3512 – – 0.00015 – 0.0557 0.0015 0.0225 0.0010 0.0029 0.0001 0.80 18.9 0.7 442 59#Mo12-2 – 6205 – – 0.00009 – 0.0503 0.0004 0.0184 0.0012 0.0027 0.0002 0.99 17.1 1.1 207 20#Mo13 – 6359 – – 0.00009 – 0.0510 0.0024 0.0187 0.0012 0.0027 0.0001 0.69 17.1 0.8 241 107#Mo14-1 – 6972 – – 0.00009 – 0.0556 0.0018 0.0199 0.0009 0.0026 0.0001 0.69 16.7 0.5 438 72#Mo14-2 – 4941 – – 0.00014 – 0.0551 0.0008 0.0199 0.0005 0.0026 0.0001 0.84 16.9 0.4 417 33#Mo15 – 4421 – – 0.00015 – 0.0605 0.0010 0.0228 0.0011 0.0027 0.0001 0.94 17.6 0.8 620 36#Mo16-1 – 4166 – – 0.00016 – 0.0638 0.0013 0.0243 0.0011 0.0028 0.0001 0.90 17.8 0.7 736 43#Mo16-2 – 4303 – – 0.00015 – 0.0925 0.0190 0.0367 0.0076 0.0029 0.0001 0.16 18.5 0.6 1478 388
Leucogranite Ed325 [7°45'55.0q E, 36°54'20.8q N]Zircon#Zr1-1 , mag. 52 995 446 0.45 0.00001 0.12 0.0518 0.0004 0.3577 0.0299 0.0501 0.0042 0.99 315 26 275 20#Zr1-2 , mag. 15 272 89 0.33 0.00003 0.10 0.0528 0.0006 0.3772 0.0270 0.0518 0.0037 0.99 326 22 319 24#Zr2-1 , recr. 29 656 57 0.09 0.00002 0.03 0.0524 0.0007 0.3296 0.0240 0.0456 0.0033 0.98 288 20 303 32#Zr2-2 , mag. 20 408 102 0.25 0.00002 0.09 0.0529 0.0007 0.3595 0.0268 0.0493 0.0036 0.99 310 22 326 29#Zr3 , mag. 20 394 115 0.29 0.00003 0.09 0.0533 0.0005 0.3743 0.0369 0.0509 0.0050 0.99 320 31 343 21#Zr4 , mag. 21 419 190 0.45 0.00003 0.14 0.0520 0.0006 0.3442 0.0182 0.0480 0.0025 0.98 302 15 284 24#Zr5, inh. 44 232 156 0.67 0.00001 0.19 0.0724 0.0007 1.6647 0.0615 0.1667 0.0059 0.96 994 33 998 20#Zr6 , recr. 51 1106 86 0.08 0.00001 0.04 0.0514 0.0010 0.3188 0.0168 0.0450 0.0022 0.92 284 14 258 46#Zr7 , mag. 22 464 223 0.48 0.00004 0.15 0.0518 0.0007 0.3582 0.0397 0.0501 0.0055 0.99 315 34 277 31#Zr8 , mag. 9 166 93 0.56 0.00010 0.18 0.0521 0.0012 0.3420 0.0129 0.0476 0.0014 0.80 300 9 291 51#Zr9 , recr. 27 613 53 0.09 0.00002 0.03 0.0512 0.0005 0.3218 0.0139 0.0456 0.0019 0.98 287 12 250 21#Zr10, p. recr. 19 439 58 0.13 0.00003 0.04 0.0528 0.0031 0.3237 0.0210 0.0444 0.0013 0.44 280 8 322 127#Zr11-1, p. recr. 19 355 57 0.16 0.00003 0.09 0.0529 0.0006 0.3762 0.0157 0.0516 0.0021 0.97 325 13 322 24#Zr11-2, p. recr. 23 432 54 0.12 0.00002 0.04 0.0525 0.0009 0.3779 0.0258 0.0523 0.0034 0.97 328 21 305 40#Zr12, inh. 73 137 55 0.4 0.00001 0.12 0.1557 0.0007 10.2182 0.4154 0.4761 0.0192 0.99 2510 83 2409 8#Zr13-1, inh. 11 128 32 0.25 0.00005 0.11 0.0587 0.0010 0.6458 0.0384 0.0798 0.0045 0.96 495 27 556 37#Zr13-2, inh. 15 124 82 0.66 0.00004 0.23 0.0583 0.0007 0.7718 0.0777 0.0960 0.0096 0.99 591 56 541 26#Zr14, p. recr. 26 493 57 0.12 0.00002 0.06 0.0523 0.0013 0.3637 0.0239 0.0504 0.0031 0.93 317 19 299 55#Zr15, p. recr. 17 320 37 0.12 0.00003 0.04 0.0516 0.0017 0.3627 0.0263 0.0509 0.0033 0.89 320 20 270 75#Zr16, inh. 21 285 291 1.02 0.00003 0.31 0.0626 0.0021 0.4902 0.0356 0.0568 0.0037 0.89 356 22 695 70#Zr17, inh. 36 191 86 0.45 0.00002 0.19 0.0729 0.0009 1.8082 0.1372 0.1798 0.0135 0.99 1066 73 1012 24#Zr18 , mag. 15 325 65 0.20 0.00004 0.06 0.0534 0.0014 0.3555 0.0171 0.0483 0.0020 0.85 304 12 347 57#Zr19, p. recr. 18 401 42 0.10 0.00004 0.04 0.0521 0.0002 0.3347 0.0161 0.0466 0.0022 0.99 294 14 289 9#Zr20 , recr. 59 1306 98 0.08 0.00001 0.03 0.0516 0.0010 0.3263 0.0228 0.0459 0.0031 0.96 289 19 268 45#Zr21-1, inh. 33 105 69 0.65 0.00002 0.16 0.1270 0.0012 5.0671 0.2428 0.2893 0.0136 0.98 1638 68 2057 16#Zr21-2, inh. 37 862 44 0.05 0.00002 0.02 0.0574 0.0016 0.3979 0.0428 0.0503 0.0052 0.96 316 32 508 62#Zr22, p. recr. 18 415 58 0.14 0.00004 0.04 0.0531 0.0013 0.3282 0.0299 0.0449 0.0039 0.96 283 24 331 55#zr23-1 , recr. 24 634 54 0.08 0.00004 0.03 0.0526 0.0006 0.3262 0.0192 0.0450 0.0026 0.98 284 16 312 27#zr23-2 , recr. 57 1774 66 0.04 0.00002 0.01 0.0524 0.0005 0.3163 0.0246 0.0438 0.0034 0.99 276 21 303 21#Zr24-1, p. recr. 16 387 56 0.15 0.00006 0.04 0.0528 0.0010 0.3265 0.0138 0.0449 0.0017 0.90 283 11 320 41#Zr24-2 , mag. 10 206 118 0.57 0.00010 0.18 0.0530 0.0004 0.3495 0.0070 0.0479 0.0009 0.94 301 5 327 16#Zr25, p. recr. 24 520 59 0.11 0.00004 0.03 0.0528 0.0007 0.3708 0.0096 0.0510 0.0012 0.87 320 7 318 28#Zr26 , mag. 22 387 107 0.28 0.00004 0.06 0.0520 0.0004 0.3438 0.0326 0.0480 0.0045 0.99 302 28 285 19#Zr27 , recr. 51 1252 112 0.09 0.00001 0.02 0.0516 0.0003 0.3112 0.0174 0.0437 0.0024 0.99 276 15 270 15#Zr28, recr. 87 2257 66 0.03 0.00003 0.06 0.0523 0.0004 0.2966 0.0097 0.0412 0.0013 0.97 260 8 297 17#Zr29, inh. 12 81 27 0.33 0.00005 0.13 0.0720 0.0013 1.4561 0.0632 0.1468 0.0058 0.91 883 32 985 36#Zr30 , mag. 73 1435 975 0.68 0.00002 0.17 0.0527 0.0003 0.3663 0.0182 0.0504 0.0025 0.99 317 15 315 15#Zr31-1 , mag. 73 1360 834 0.61 0.00002 0.17 0.0527 0.0003 0.3816 0.0139 0.0525 0.0019 0.98 330 11 315 15#Zr31-2, p. recr. 25 587 78 0.13 0.00003 0.04 0.0530 0.0005 0.3254 0.0094 0.0446 0.0012 0.94 281 7 327 22
(continued on next page)(continued on next page)
175O. Bruguier et al. / Chemical Geology 261 (2009) 171–183

Table 1 (continued)
Sample Pb⁎ U Th Th/ 204Pb/ 208Pb⁎/ 207Pb⁎/ ± 207Pb⁎/ ± 206Pb⁎/ ± Rho Apparent age (Ma)
(ppm) (ppm) (ppm) U 206Pbm 206Pb⁎ 206Pb⁎ (1σ) 235U (1σ) 238U (1σ) 206Pb⁎/ ± 207Pb⁎/ ±238U (1σ) 206Pb⁎ (1σ)
Monazite#Mo1-1 – 2161 – – 0.00008 – 0.0534 0.0043 0.0199 0.0022 0.0027 0.0002 0.68 17.4 1.3 346 181#Mo1-2 – 1896 – – 0.00014 – 0.0578 0.0018 0.0224 0.0018 0.0028 0.0002 0.92 18.1 1.3 521 68#Mo2 – 1443 – – 0.00018 – 0.0555 0.0071 0.0207 0.0031 0.0027 0.0002 0.50 17.4 1.3 433 287#Mo3 – 2309 – – 0.00007 – 0.0500 0.0069 0.0187 0.0030 0.0027 0.0002 0.52 17.5 1.5 196 323
: analyses used in the age calculation of the magmatic event (see text); : analyses used in the age calculation of the recrystallisation event (see text); mag.: magmatic domain; p.recr.: partly recrystallised domain; recr.: recrystallized domain; inh.: inherited grains. For monazites, Th and 208Pb were not measured as this resulted in a high signal and tripping ofthe detector. The asterisk (⁎) indicates radiogenic Pb. Rho is the error correlation between the 206Pb/238U and 207Pb/235U ratio. GPS coordinates have been estimated using GoogleEarth™.
176 O. Bruguier et al. / Chemical Geology 261 (2009) 171–183
from the Sidi Mohamed peridotite body. It consists of quartz, garnet,antiperthitic plagioclase, muscovite, minor biotite and accessorymonazite. The occurrence of garnet suggests that partial meltingtook place by dehydration melting mineral reaction (Spear et al.,1999). The leucogranite Ed 325 was collected close to the city ofAnnaba in the southeast part of the dome. The sample was taken froma sheet of protomylonitic tourmaline-bearing leucogranite intrudingphyllites and was affected by the same low- to medium-pressuremetamorphism that can be observed in the surrounding metapelites(andalusite–staurolite–garnet with temperature around 550 °C, seeCaby et al., 2001) away from the granite-gneiss core. The deformedleucogranite contains stretched globular quartz, euhedral plagioclase,K-feldspar porphyroclasts, muscovite, minor biotite and accessoryzircon and apatite, frequently included in blue tourmaline clasts.Except for inner relict domains from K-feldspar clasts, the igneousmineralogy was thoroughly replaced by metamorphic phases andboth micas are of metamorphic origin (Caby et al., 2001).
3. Analytical techniques
Zircon and monazite were hand-picked in alcohol from the leastmagnetic concentrates (6° tilt and 1° tilt at full amperage for monaziteand zircon respectively). Selected crystalswere thenembedded in epoxyresin, ground and polished to expose the internal structure. They weresubsequently examined using back-scattered electron (BSE) imagingwith a scanning electron microscope (SEM) at the University ofMontpellier II. The sample mounts were later used for U–Th–Pbmicroanalyses using a Lambda Physik CompEx 102 excimer lasergenerating 15 ns duration pulses of radiation at a wavelength of193 nm. For analyses, the laser was coupled to a VG Plasmaquad II ICP-MS and analytical procedures followed those outlined in Bruguier et al.(2001) and given in earlier reports (Dhuime et al., 2007), they are onlybriefly summarized below. Ablation experimentswere conducted underultrapure He, which enhances sensitivity and reduces Pb–U fractiona-tion (Günther andHeinrich,1999). TheHe gas streamand particles fromthe samples were then mixed with Ar before entering the plasma. Thelaserwasfired at an energy density of 15 J/cm2 at a frequency of 4 Hz forzircon and 2 Hz for monazite. During all experiments oxide level,measured using the ThO/Th ratio, was below 1%. The spot size of thelaser beamwas 26 or 51 µm for zircon and 26 µm formonazite analyses.Data were acquired in the peak jumping mode using 1 point per peakand each element was measured using an equal dwell time of 10.24 msexcept for 207Pbwhichwasmeasured during 40.96ms. Unknownswerebracketed by measurements of the G91500 (Wiedenbeck et al., 1995)and Manangotry (Poitrasson et al., 2000) standards for zircon andmonazite, respectively, where the ratio of unknown to standardwas 5:4.Standard measurements were used for mass bias and inter-elementfractionation corrections. For mass bias, all standard measurementsperformed during one session were averaged, whereas for Pb–Ufractionation, only the 4 standards bracketing the five unknowns wereused for each batch of analyses. The calculated bias factors and theirassociated errorswere then added in quadrature to the individual errors
measured on each unknown. In the course of this study, 16 analyses ofthe Managotry monazite were performed and yielded a 207Pb/206Pbweighted average of 0.05862±0.00019 (2σ), which corresponds to anageof 553±7Ma.This is ingoodagreementwith theEPMA(557±20Ma,Montel et al., 1996) or TIMS (554±4 Ma, Horstwood et al., 2003)reference ages. Reproducibility of the measured 206Pb/238U ratios was1.2% (1σ). The zircon standard G91500 (Wiedenbeck et al., 1995) wasanalysed twenty-four times and gave a 207Pb/206Pbweighted average of0.07490±0.00018 (2σ), which corresponds to an age of 1066±5 Ma.Reproducibility of the measured 206Pb/238U ratios was 1.4% (1σ).
4. Results
4.1. Leucocratic diatexite Ed322
Monazite extracted from this sample is translucent pale yellow,100–200 µm in size with a euhedral to sub-euhedral external morphology.Back-scattered electron imaging (Fig. 3a, b) shows that the crystalsdisplay broad zoning, which together with their euhedral shapes, isconsistent with crystallisation from a melt. Twenty-eight laser ablationspot analyses have been performed on sixteen grains and all haveindistinguishable 206Pb/238U ages from 16.7 to 19.3Ma (see Table 1). Onthe Terra–Wasserburg diagram (Fig. 4) they plot along a line connectingthe Stacey and Kramers common Pb composition (Stacey and Kramers,1975) and an age of 17.84±0.12 Ma (2σ, MSWD=1.07, n=28).
4.2. Leucogranite Ed325
Monazites from this sample are translucent pale yellow and haveirregular shapes suggesting growth inhibition and sub-solidus nuclea-tion (Fig. 3c). Four laser ablation spot analyses have been performed onthree grains and they yield indistinguishable within error 206Pb/238Uages from 17.4 to 18.1 Ma (see Table 1). Pinned to the Stacey–KramerscommonPb composition (Fig. 4 inset), they define an ageof 17.4±1.3Ma(2σ, MSWD=0.05, n=4), less precise, but consistent with the age ofmonazites from the leucocratic diatexite Ed322.
Zircons from this sample are colourless, translucent and havesubhedral to euhedral shapes. Back-scattered SEM imaging (Fig. 3d–f)reveals an homogeneous internal structure with no or only very faintoscillatory zoning, suggesting the grains are magmatic in origin. Somegrains in addition are characterized by a thin, BSE bright (high U) outerzone preserving the prismatic shape of the grains (Fig. 3d). Lastly, a fewgrains have rounded terminations and an ovoid morphology (Fig. 3g).Theyare interpretedasundissolved xenocrysts preserved in Zr saturatedmelt (Watson and Harrison, 1983). Grains with this morphology plotconcordantly (Fig. 5) at c. 550Ma (analyses #13), c.1000Ma (analyses#5and #17) and at c. 2400 Ma (analysis #12) and reflect the ages ofinherited sourcematerials. The remaining analyses yield 206Pb/238U agesranging from 260 Ma to 330 Ma. Spread of data along the concordia(Fig. 6) may be interpreted in terms of protracted zircon growth ordifferential Pb-losses from a single zircon population. Protracted zircongrowth can be envisioned on the basis of thermobarometric modelling
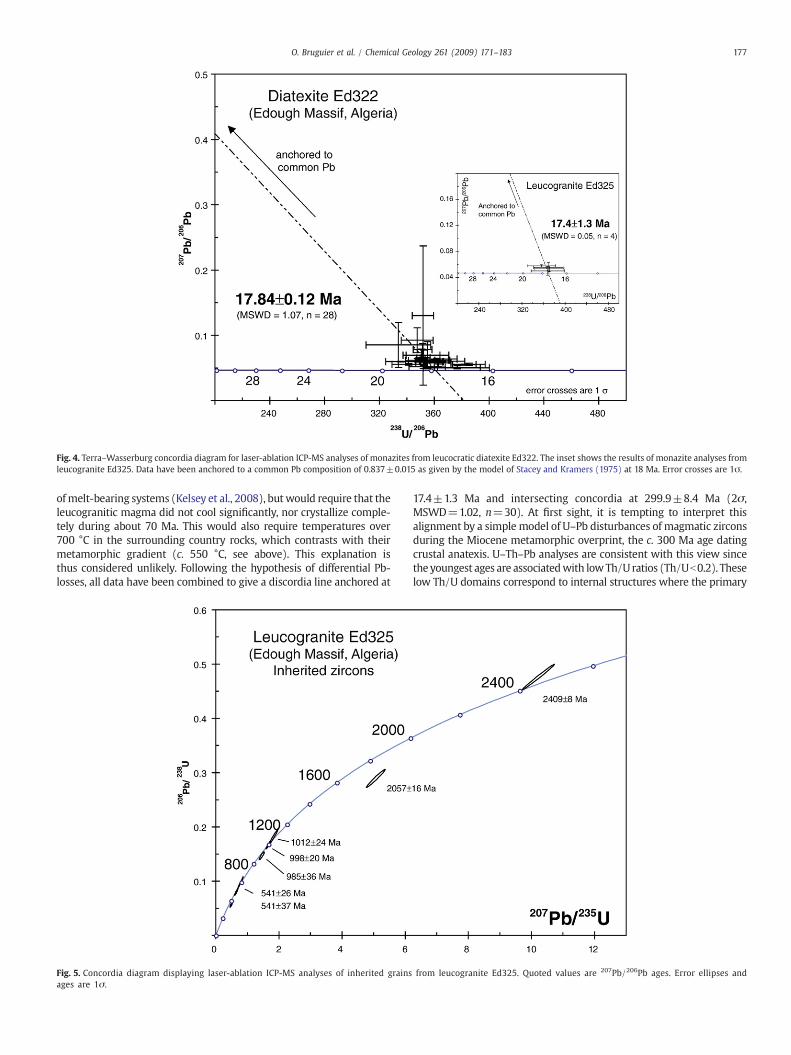
Fig. 4. Terra–Wasserburg concordia diagram for laser-ablation ICP-MS analyses of monazites from leucocratic diatexite Ed322. The inset shows the results of monazite analyses fromleucogranite Ed325. Data have been anchored to a common Pb composition of 0.837±0.015 as given by the model of Stacey and Kramers (1975) at 18 Ma. Error crosses are 1σ.
177O. Bruguier et al. / Chemical Geology 261 (2009) 171–183
ofmelt-bearing systems (Kelsey et al., 2008), butwould require that theleucogranitic magma did not cool significantly, nor crystallize comple-tely during about 70 Ma. This would also require temperatures over700 °C in the surrounding country rocks, which contrasts with theirmetamorphic gradient (c. 550 °C, see above). This explanation isthus considered unlikely. Following the hypothesis of differential Pb-losses, all data have been combined to give a discordia line anchored at
Fig. 5. Concordia diagram displaying laser-ablation ICP-MS analyses of inherited grainsages are 1σ.
17.4±1.3 Ma and intersecting concordia at 299.9±8.4 Ma (2σ,MSWD=1.02, n=30). At first sight, it is tempting to interpret thisalignment by a simple model of U–Pb disturbances of magmatic zirconsduring the Miocene metamorphic overprint, the c. 300 Ma age datingcrustal anatexis. U–Th–Pb analyses are consistent with this view sincethe youngest ages are associatedwith lowTh/Uratios (Th/Ub0.2). Theselow Th/U domains correspond to internal structures where the primary
from leucogranite Ed325. Quoted values are 207Pb/206Pb ages. Error ellipses and
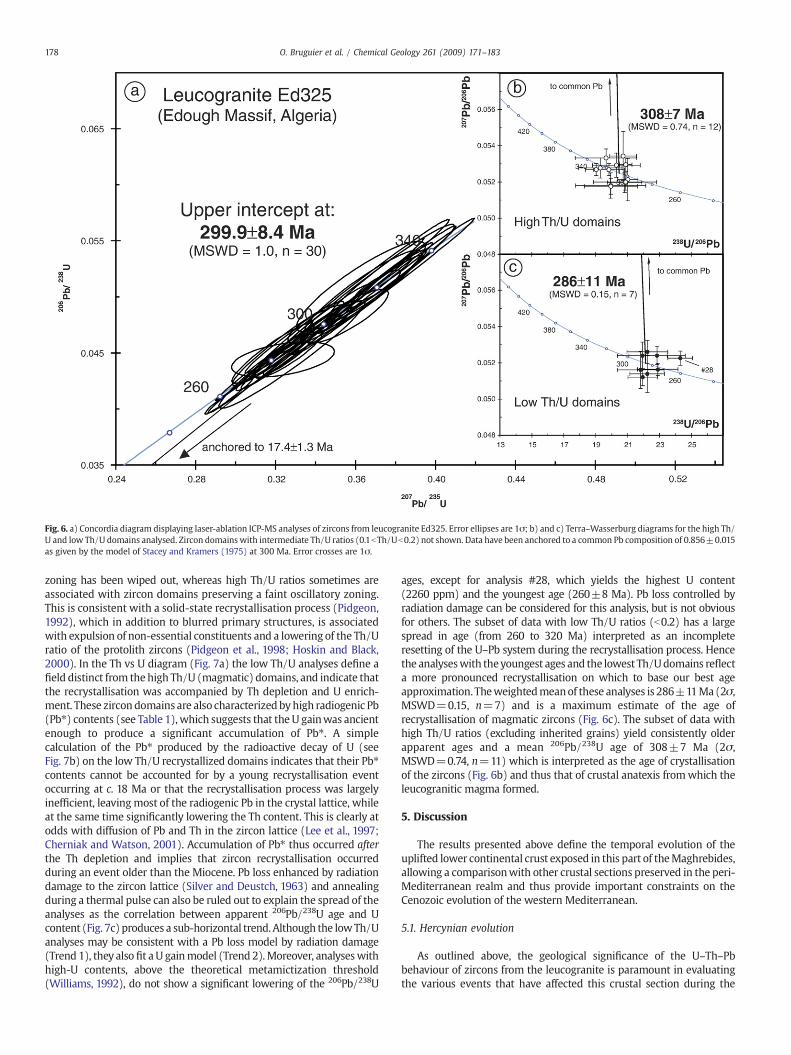
Fig. 6. a) Concordia diagram displaying laser-ablation ICP-MS analyses of zircons from leucogranite Ed325. Error ellipses are 1σ; b) and c) Terra–Wasserburg diagrams for the high Th/U and low Th/U domains analysed. Zircon domains with intermediate Th/U ratios (0.1bTh/Ub0.2) not shown. Data have been anchored to a common Pb composition of 0.856±0.015as given by the model of Stacey and Kramers (1975) at 300 Ma. Error crosses are 1σ.
178 O. Bruguier et al. / Chemical Geology 261 (2009) 171–183
zoning has been wiped out, whereas high Th/U ratios sometimes areassociated with zircon domains preserving a faint oscillatory zoning.This is consistent with a solid-state recrystallisation process (Pidgeon,1992), which in addition to blurred primary structures, is associatedwith expulsion of non-essential constituents and a lowering of the Th/Uratio of the protolith zircons (Pidgeon et al., 1998; Hoskin and Black,2000). In the Th vs U diagram (Fig. 7a) the low Th/U analyses define afield distinct from thehigh Th/U (magmatic) domains, and indicate thatthe recrystallisation was accompanied by Th depletion and U enrich-ment. These zircondomains are also characterized byhigh radiogenic Pb(Pb⁎) contents (see Table 1),which suggests that the U gainwas ancientenough to produce a significant accumulation of Pb⁎. A simplecalculation of the Pb⁎ produced by the radioactive decay of U (seeFig. 7b) on the low Th/U recrystallized domains indicates that their Pb⁎contents cannot be accounted for by a young recrystallisation eventoccurring at c. 18 Ma or that the recrystallisation process was largelyinefficient, leavingmost of the radiogenic Pb in the crystal lattice, whileat the same time significantly lowering the Th content. This is clearly atodds with diffusion of Pb and Th in the zircon lattice (Lee et al., 1997;Cherniak and Watson, 2001). Accumulation of Pb⁎ thus occurred afterthe Th depletion and implies that zircon recrystallisation occurredduring an event older than the Miocene. Pb loss enhanced by radiationdamage to the zircon lattice (Silver and Deustch, 1963) and annealingduring a thermal pulse can also be ruled out to explain the spread of theanalyses as the correlation between apparent 206Pb/238U age and Ucontent (Fig. 7c) produces a sub-horizontal trend. Although the lowTh/Uanalyses may be consistent with a Pb loss model by radiation damage(Trend 1), they also fit a U gainmodel (Trend 2).Moreover, analyseswithhigh-U contents, above the theoretical metamictization threshold(Williams, 1992), do not show a significant lowering of the 206Pb/238U
ages, except for analysis #28, which yields the highest U content(2260 ppm) and the youngest age (260±8 Ma). Pb loss controlled byradiation damage can be considered for this analysis, but is not obviousfor others. The subset of data with low Th/U ratios (b0.2) has a largespread in age (from 260 to 320 Ma) interpreted as an incompleteresetting of the U–Pb system during the recrystallisation process. Hencethe analyseswith theyoungest ages and the lowest Th/Udomains reflecta more pronounced recrystallisation on which to base our best ageapproximation. Theweightedmeanof these analyses is 286±11Ma (2σ,MSWD=0.15, n=7) and is a maximum estimate of the age ofrecrystallisation of magmatic zircons (Fig. 6c). The subset of data withhigh Th/U ratios (excluding inherited grains) yield consistently olderapparent ages and a mean 206Pb/238U age of 308±7 Ma (2σ,MSWD=0.74, n=11) which is interpreted as the age of crystallisationof the zircons (Fig. 6b) and thus that of crustal anatexis fromwhich theleucogranitic magma formed.
5. Discussion
The results presented above define the temporal evolution of theuplifted lower continental crust exposed in this part of theMaghrebides,allowing a comparisonwith other crustal sections preserved in the peri-Mediterranean realm and thus provide important constraints on theCenozoic evolution of the western Mediterranean.
5.1. Hercynian evolution
As outlined above, the geological significance of the U–Th–Pbbehaviour of zircons from the leucogranite is paramount in evaluatingthe various events that have affected this crustal section during the

Fig. 7. a) Th and U concentrations of the zircon domains analyzed. White circles: magmatic domains (Th/UN0.2); grey circles: partly recrystallised domains (0.1bTh/Ub0.2); blackcircles: recrystallised domains (Th/Ub0.1). MMD is the mean of the analysed magmatic domains (Th=280 ppm and U=606 ppm); b) Radiogenic lead (Pb⁎) and U concentrationsdiagram showing the Pb⁎ content of the recrystallised and partly recrystallised domains, either measured (□, ×), or calculated back from themeasured U content at 286Ma (□, ×) andat 18 Ma (■, +). The good agreement between the values calculated at 286 Ma and the measured values on one hand and the discrepancy with values calculated assuming arecrystallisation process at 18 Ma on the other hand is evidence for an old recrystallisation-inducing metamorphic event; c) 206Pb/238U ages and U concentration of magmatic andmetamorphic domains for zircons from sample Ed325. The dashed line is the theoretical metamictization threshold given by Williams (1992).
179O. Bruguier et al. / Chemical Geology 261 (2009) 171–183
Hercynian orogeny. This is particularly important since there is still noclear consensus on the age of theHP–HTmetamorphic event recognizedin basement rocks preserved in the western Mediterranean orogeneither in the Kabylies (e.g. Peucat et al., 1996) or in the Betics (e.g. Zeckand Whitehouse, 2002). Since many grains dated in this study havemagmatic characteristics, the late Carboniferous zircon age of 308±7Mais attributed to the age of emplacement of the granitic magma and thusto that of crustal anatexis at depth. This age is in good agreement withthe occurrence of Achritarchs described inOrdovician to Devonian blackcherty layers from the “Alternance series” (Ilavsky and Snopkova,1987),which are intruded by the dated sample. In addition, it compares wellwith ages from late- to post-tectonic granitoids (290–315 Ma) fromother segments of the Variscan orogen. In the French Massif Central,South Bohemian Massif and Iberian Massif, leucogranite emplacementand crustal melting occurred during this time interval (Fernandez-Suarez et al., 2000;Gerdes et al., 2000; Bruguier et al., 2003) and are alsowell documentedwithin the intra-Alpinemassifs (Vavra et al.,1999). It iswidely accepted that this period reflects delamination of the litho-spheric mantle (Pin and Duthou, 1990; Schaltegger, 1997). Conversely,the late Carboniferous age of 308±7Ma is at oddswith the c.606MaU–Pb zircon age from a similar sample, whichwas interpreted as reflectingthe imprint of the Pan-African orogeny in this area (Hammor andLancelot, 1998). However, the data presented by Hammor and Lancelot(1998) are strongly discordant and scattered along a calculateddiscordia. More likely they reflect various degree of inheritance in the
multigrain fractions analysed and a combination of Pb loss. In addition,the Pan-African age contrasts with geological evidence attributing anOrdovician to Devonian age for the whole metasedimentary pileintruded by these leucogranites (Ilavsky and Snopkova, 1987). Thiscasts serious doubts on the influence of the Pan-African event as anorogeny in this part of the Kabylies, although inherited grains with agesaround 550 Ma (this study) are evidence for an Early Cambriancomponent. However, these grains are best interpreted as having beenstripped off from deep-seated material, either of detrital origin (assuggested by their rounded shapes) or related to the Cambro–Ordovician rifting event that affected the northernmargin of Gondwana(Nance andMurphy,1994). In the lightof the limiteddata, it is difficult tosustain that the Pan-African event played an important role in thetectonometamorphic architecture of the Edough massif.
The U–Pb system of the studied zircons was subsequentlydisturbed and partly rejuvenated by recrystallisation processes.From the present data set, it appears that this event occurredduring the Permian and is dated at 286±11 Ma on the mostrecrystallised domains. Although this is taken as the upper agelimit for the recrystallisation-inducing metamorphic event, it isintriguing to note that this age is identical to that of the granulitefacies metamorphism in the Ivrea–Verbano zone (Pin, 1986) andsimilar to the c. 280 Ma age peak of zircons from lower crustalxenoliths from the French Massif Central and from the granuliticmetasedimentary basement from Corsica (Rossi et al., 2006). High-

180 O. Bruguier et al. / Chemical Geology 261 (2009) 171–183
grade metamorphism and magmatism at around 275–285 Ma hasalso been recognized further west in the Kabylies (Peucat et al.,1996; Hammor et al., 2006). In the Central and West Alpine Belt(African paleomargin of the Tethys), and in Corsica (Ligurian branchof the Tethys Ocean) the 280–290 Ma early Permian time intervalwas also characterized by underplating of mafic-ultramafic com-plexes at middle and lower crustal levels (Hansmann et al., 2001;Paquette et al., 2003; Hermann and Rubatto, 2003; Tribuzio et al.,1999). In the Betic Cordilleras, Zeck and Whitehouse (1999)provided an age of 285±5 Ma for the anatectic climax of themetamorphic event and monazite inclusions in garnet from theBeni–Bousera kinzigites of Morocco yielded an age of 284±27 Ma(Montel et al., 2000). The coincidence in age between these widelydistributed crustal slices preserved in the Alpine–Apennine andwest Mediterranean mountain belts supports an orogen-wide eventduring the early Permian. It is also consistent with all thesefragments being part of the same Hercynian basement section thatshared a common history before the Permian rifting that precededopening of the Tethys Ocean (Stampfli et al., 2001). The recognitionof a Hercynian metamorphic event indicates that care must betaken when reconstructing the geodynamic evolution of the Alpinebelts of North Africa, since part of the metamorphic featurespreserved in the exposed lower crust have been inherited fromolder orogenic cycles and should not be de facto attributed to theAlpine evolution.
5.2. Cenozoic evolution
The analyses of metamorphic monazites from the leucograniteEd325 and of magmatic monazites from the leucocratic diatexite Ed322yield similar ages of 17.4–17.8 Ma. Both rocks have been sampled in theEdough dome, the latter in close proximity to the Sidi Mohamedperidotite body. Since the deformation and thermal overprint increasetowards the contactwith theperidotite (Cabyet al., 2001) it is concluded
Fig. 8. Cooling path for rocks of the Edough massif. Ar/Ar mineral ages have been calculatedMonié et al. (1992). This yields ages of 17.20±0.20 Ma (n=1); 16.35±0.94 Ma (MSWD=6.respectively (95% confidence interval). The corresponding closure temperatures are 460±5(Harrison et al., 1985). For monazite, the closure temperature has been taken at 750 °C, i.e.
that these ages are related to the emplacement of hot mantle materialinto the lower crustal section of the Edough massif, which wasresponsible for a heat supply generating a thermal aureole and localanatexis. The leucocratic diatexite Ed322, located about 20 m from thecontact with the peridotites, was generated by partial melting of thesurrounding gneiss and migmatites. In the deformed leucograniteEd325, temperature conditions deduced from the staurolite–andalusiteassemblages from metapelites near Annaba (c. 550 °C after Caby et al.,2001) account for the metamorphic growth of monazite, but were notassociated with a new zircon growth episode, recrystallisation of pre-existing zirconsor Pbdiffusion. The temperature conditions experiencedby the leucogranite were too low to be responsible for Pb diffusion inzircon (Lee et al., 1997; Cherniak and Watson, 2001). This may explainthe lack of “zircon response” of the studied sample to the emplacementof the peridotite. Moreover recrystallised zircons tend to be moreresistant to subsequent disturbances and more stable, since they havealready expelled contaminant elements, and this is likely to be the casefor the investigated zircons. Lastly, except for zircon, the investigatedleucogranite contains very few Zr-bearing phases succeptible to break-down and to liberate Zr (just biotite, see Fraser et al.,1997) available for anew growth episode. Metamorphic temperature conditions prevailingduring emplacement of the peridotites (750 °C and 1.2–1.4 GPa afterCaby et al., 2001) are within the classically accepted nominal closuretemperature for Pb diffusion in monazite (≥725±25 °C after Copelandet al., 1988) but preservation of radiogenic lead under highermetamorphic conditions clearly calls for values in excess of 800 °C(Bosch et al., 2002; Kelsey et al., 2003; Cherniak et al., 2004) or evenhigher (N850 °C) when crystals are shielded by host minerals (e.g.Montel et al., 2000). Combined with published 40Ar/39Ar data fromrocks of the Edoughmassif (Monié et al., 1992), and assuming a closuretemperature corresponding to peak metamorphic conditions (750 °C),the late Burdigalian age of monazite from the leucocratic diatexiteindicates a fast cooling (anduplift rates) of 369 °C/Ma (Fig. 8). Such highcooling rates are known in the Betic Cordilleras (Zeck et al.,1992;Monié
using the Ludwig program (Ludwig, 2000) as a weighted mean of all ages reported in5; n=3) and 16.70±1.30 (MSWD=17; n=4)Ma for phlogopite, muscovite and biotite0 °C (Giletti and Tullis, 1977); 445±50 °C (Hames and Bowring, 1994) and 360±50 °C, the estimated peak metamorphic conditions. Error crosses are 1σ.

181O. Bruguier et al. / Chemical Geology 261 (2009) 171–183
et al., 1994; Platt and Witehouse, 1999) and are typical of large-scaleextensional tectonics (Platt and Vissers, 1989). They indicate rapidupward tectonic transport of the peridotite and surrounding parts of thecrust through tens of kilometres. Given this rapid cooling rate, and theassumed similarity between the monazite closure temperature and themetamorphic conditions experienced by the country rocks, the lateBurdigalian age is regarded as closely approximating emplacement ofthe peridotite within the Hercynian basement. Existing geochronologi-cal information from other occurrences of orogenic peridotites exposedin thewesternMediterranean (see Fig. 9) yield earlyMioceneages in therange 20–25 Ma, slightly, but consistently, older than the age ofemplacement of the Edough peridotite. In the Betic Cordilleras,emplacement of the Ronda peridotite (see Fig. 1) is dated at 21.5±1.8Ma (Zindler et al., 1983) and was coeval with high-T metamorphismas dated by the U–Pb method on metamorphic rims of zircons fromgneisses at between19.3±0.3 and21.2±0.7Ma (Platt andWhitehouse,1999) and anatexis of surrounding rocks at 21.8±0.5Ma (Esteban et al.,2007). The same scheme applies also for the Sebtides, on the south sideof the Straits of Gibraltar, where emplacement of the Beni–Bouseraperidotite has been dated at 25±1 Ma by the Lu–Hf method on garnetpyroxenite embedded in the peridotite. This age is slightly older, butcomparable to the 22.7±0.3 Ma SHRIMP age of zircon rim fromgranulite-facies rocks (Platt et al., 2003). Fast cooling rate followingemplacement is implied by a 40Ar/39Ar biotite age of 22.5±0.5Ma froma granulite sample around the Beni–Bousera peridotite (Michard et al.,2006). These 22–25 Ma ages are indistinguishable from those ofretrograde monazite from low-T/high-P schists from Beni–Mezala,100 km north of Beni–Bousera, that gave ages of about 21 Ma (Janotset al., 2006). Thus, we propose that emplacement of the Edoughperidotite is younger by about 2–8 Ma.
5.3. Geodynamic implications
In the Betic Cordilleras, emplacement of the peridotites into thecrustal sections has been ascribed to slab detachment followingsubduction of the Mesozoic Tethys lithosphere (Platt and Vissers,1989; Zeck, 1996; Platt and Whitehouse, 1999), which was responsiblefor fast uplift and a centrifugal displacement of mantle material,radiating from the central part of the Alboran basin at about 20–25 Ma (Zeck, 1997). Crustal thinning in the Valencia trough (Maillard
Fig. 9. Summaryof available geochronological data for emplacement of orogenic peridotites and fdata are as follow: (1) Zindler et al.,1983; (2) and (3)Platt andWhitehouse,1999; (4) Estebanet alJanots et al., 2006; (10), (11) and (12)Monié et al.,1988. The dashed line corresponds to the age ofreferences to the main geodynamic events and for explanation.
and Mauffret, 1999), clockwise rotation of the Corsica–Sardinia block(Doglioni et al., 1997) and the onset of opening of the Liguro–Provençalbasin as a back-arc basin (Speranza et al., 2002) occurred at the sameperiod. From their original position, i.e., along the eastern Iberianmarginand north of the Betic-Rif (see Carminatti et al., 1998; Jolivet andFaccenna, 2000), crustal fragments including the Alboran block and theKabylies drifted southwestward and southeastward, respectively, dur-ing this rifting event. In Greater Kabylia, 40Ar/39Ar mineral ages andbiotite Rb–Sr cooling ages in the range 20–25 Ma (Monié et al., 1988;Peucat et al., 1996; Hammor et al., 2006) indicate that basement rocksfrom this part of theKabylieswere exhumed tomid-crustal levels by thelate Oligocene–early Miocene. During this period, rifting stronglythinned the crust but, except in the Liguro–Provençal basin, did notevolved to the development of oceanic crust. The Burdigalian ages ofmonazites from the Edoughmassif are slightly but significantly younger,and together with 40Ar/39Ar ages (Monié et al., 1992), substantiate thatexhumationof deep crustal rocks in this areawasdelayedbycomparisonwith basement rocks from the Greater Kabylia and from the Betic-Riforocline. Incorporation of the peridotites into the lower crustal sectionsof the Edough massif and their fast rate of exhumation are thusattributed to a second extensional event of late Burdigalian age. Thisevent coincideswith opening of the Algerian basin (Mauffret et al., 2004)and ismatched by compressional tectonics (south-vergent thrusting andfolding) in the Rif and Tell orogens (Frizon de Lamotte et al., 2000). Sincethe oldest oceanic crust in the Algerian basin is c. 16 Ma old (Mauffretet al., 2004), we propose that incorporation of the Sidi Mohamedperidotites into continental crustal material occurred during the riftingphase and incipient continental break-up. In this view, the lateBurdigalian monazite ages from the present study are evidence thatopening of the Algerian basinwas not coeval with opening of the Liguro–Provençal basin, thus suggesting a North–South diachronism forextension similar to the Red Sea area, which displays a northwardyounging of spreading events (Nicolas et al., 1987). However, since therifting phase in the Algerian basin beganwhen spreading finished in theLiguro–Provençal basin (Rollet et al., 2002), there is no continuumbetween the two areas and we conclude that the Algerian basin is not acontinuation of the Liguro–Provençal basin. This is consistent with thesynthesis of data from seismic surveys by Mauffret et al. (2004). At thescale of the West Mediterranean basin, the Burdigalian ages fit a generalmodel of eastward younging of extensional events and widening of the
ormajor geodynamic events in theWesternMediterranean. References to geochronological., 2007; (5)Blichert-Toft et al.,1999; (6) Platt et al., 2003; (7)Michard et al., 2006; (8) and (9)the oldest oceanic crust known in theAlgerian basin (afterMauffret et al., 2004). See text for
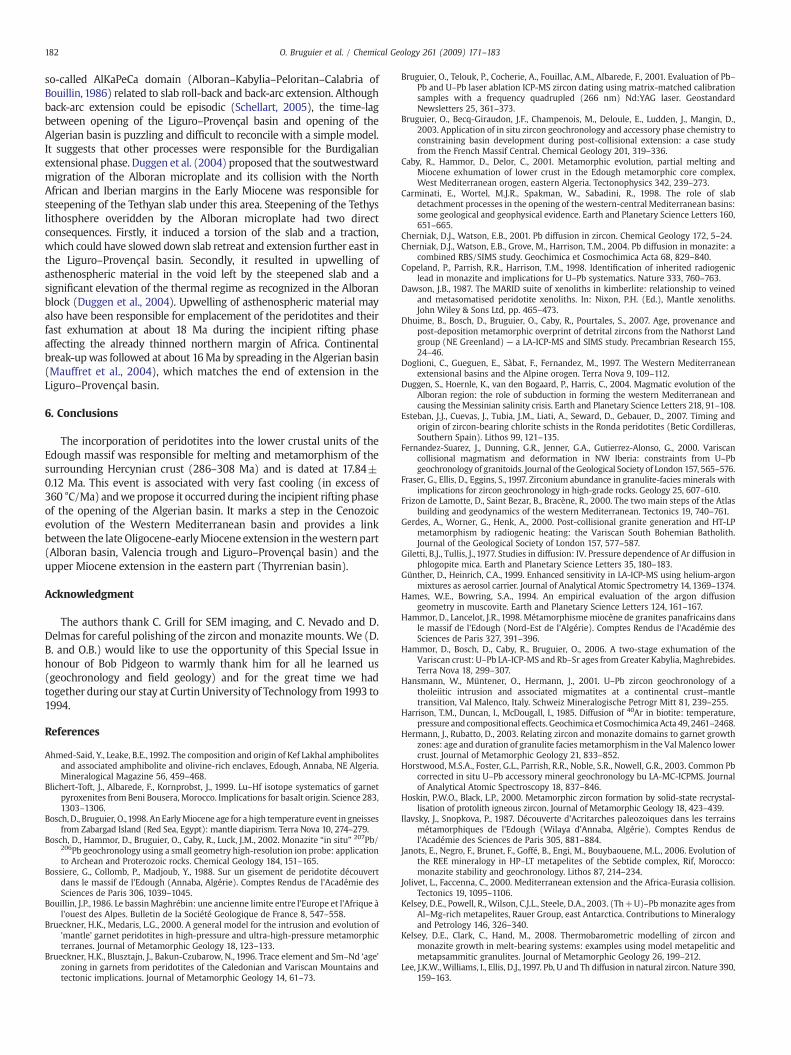
182 O. Bruguier et al. / Chemical Geology 261 (2009) 171–183
so-called AlKaPeCa domain (Alboran–Kabylia–Peloritan–Calabria ofBouillin, 1986) related to slab roll-back and back-arc extension. Althoughback-arc extension could be episodic (Schellart, 2005), the time-lagbetween opening of the Liguro–Provençal basin and opening of theAlgerian basin is puzzling and difficult to reconcile with a simple model.It suggests that other processes were responsible for the Burdigalianextensional phase. Duggen et al. (2004) proposed that the soutwestwardmigration of the Alboran microplate and its collision with the NorthAfrican and Iberian margins in the Early Miocene was responsible forsteepening of the Tethyan slab under this area. Steepening of the Tethyslithosphere overidden by the Alboran microplate had two directconsequences. Firstly, it induced a torsion of the slab and a traction,which could have slowed down slab retreat and extension further east inthe Liguro–Provençal basin. Secondly, it resulted in upwelling ofasthenospheric material in the void left by the steepened slab and asignificant elevation of the thermal regime as recognized in the Alboranblock (Duggen et al., 2004). Upwelling of asthenospheric material mayalso have been responsible for emplacement of the peridotites and theirfast exhumation at about 18 Ma during the incipient rifting phaseaffecting the already thinned northern margin of Africa. Continentalbreak-upwas followed at about 16Ma by spreading in the Algerian basin(Mauffret et al., 2004), which matches the end of extension in theLiguro–Provençal basin.
6. Conclusions
The incorporation of peridotites into the lower crustal units of theEdough massif was responsible for melting and metamorphism of thesurrounding Hercynian crust (286–308 Ma) and is dated at 17.84±0.12 Ma. This event is associated with very fast cooling (in excess of360 °C/Ma) andwepropose it occurred during the incipient rifting phaseof the opening of the Algerian basin. It marks a step in the Cenozoicevolution of the Western Mediterranean basin and provides a linkbetween the late Oligocene-earlyMiocene extension in thewesternpart(Alboran basin, Valencia trough and Liguro–Provençal basin) and theupper Miocene extension in the eastern part (Thyrrenian basin).
Acknowledgment
The authors thank C. Grill for SEM imaging, and C. Nevado and D.Delmas for careful polishing of the zircon andmonazite mounts.We (D.B. and O.B.) would like to use the opportunity of this Special Issue inhonour of Bob Pidgeon to warmly thank him for all he learned us(geochronology and field geology) and for the great time we hadtogether during our stay at Curtin University of Technology from1993 to1994.
References
Ahmed-Said, Y., Leake, B.E., 1992. The composition and origin of Kef Lakhal amphibolitesand associated amphibolite and olivine-rich enclaves, Edough, Annaba, NE Algeria.Mineralogical Magazine 56, 459–468.
Blichert-Toft, J., Albarede, F., Kornprobst, J., 1999. Lu–Hf isotope systematics of garnetpyroxenites from Beni Bousera, Morocco. Implications for basalt origin. Science 283,1303–1306.
Bosch,D., Bruguier, O.,1998. An EarlyMiocene age for a high temperature event in gneissesfrom Zabargad Island (Red Sea, Egypt): mantle diapirism. Terra Nova 10, 274–279.
Bosch, D., Hammor, D., Bruguier, O., Caby, R., Luck, J.M., 2002. Monazite “in situ” 207Pb/206Pb geochronology using a small geometry high-resolution ion probe: applicationto Archean and Proterozoic rocks. Chemical Geology 184, 151–165.
Bossiere, G., Collomb, P., Madjoub, Y., 1988. Sur un gisement de peridotite découvertdans le massif de l'Edough (Annaba, Algérie). Comptes Rendus de l'Académie desSciences de Paris 306, 1039–1045.
Bouillin, J.P., 1986. Le bassinMaghrébin: une ancienne limite entre l'Europe et l'Afrique àl'ouest des Alpes. Bulletin de la Société Geologique de France 8, 547–558.
Brueckner, H.K., Medaris, L.G., 2000. A general model for the intrusion and evolution of'mantle' garnet peridotites in high-pressure and ultra-high-pressure metamorphicterranes. Journal of Metamorphic Geology 18, 123–133.
Brueckner, H.K., Blusztajn, J., Bakun-Czubarow, N., 1996. Trace element and Sm–Nd ‘age’zoning in garnets from peridotites of the Caledonian and Variscan Mountains andtectonic implications. Journal of Metamorphic Geology 14, 61–73.
Bruguier, O., Telouk, P., Cocherie, A., Fouillac, A.M., Albarede, F., 2001. Evaluation of Pb–Pb and U–Pb laser ablation ICP-MS zircon dating using matrix-matched calibrationsamples with a frequency quadrupled (266 nm) Nd:YAG laser. GeostandardNewsletters 25, 361–373.
Bruguier, O., Becq-Giraudon, J.F., Champenois, M., Deloule, E., Ludden, J., Mangin, D.,2003. Application of in situ zircon geochronology and accessory phase chemistry toconstraining basin development during post-collisional extension: a case studyfrom the French Massif Central. Chemical Geology 201, 319–336.
Caby, R., Hammor, D., Delor, C., 2001. Metamorphic evolution, partial melting andMiocene exhumation of lower crust in the Edough metamorphic core complex,West Mediterranean orogen, eastern Algeria. Tectonophysics 342, 239–273.
Carminati, E., Wortel, M.J.R., Spakman, W., Sabadini, R., 1998. The role of slabdetachment processes in the opening of the western-central Mediterranean basins:some geological and geophysical evidence. Earth and Planetary Science Letters 160,651–665.
Cherniak, D.J., Watson, E.B., 2001. Pb diffusion in zircon. Chemical Geology 172, 5–24.Cherniak, D.J., Watson, E.B., Grove, M., Harrison, T.M., 2004. Pb diffusion in monazite: a
combined RBS/SIMS study. Geochimica et Cosmochimica Acta 68, 829–840.Copeland, P., Parrish, R.R., Harrison, T.M., 1998. Identification of inherited radiogenic
lead in monazite and implications for U–Pb systematics. Nature 333, 760–763.Dawson, J.B., 1987. The MARID suite of xenoliths in kimberlite: relationship to veined
and metasomatised peridotite xenoliths. In: Nixon, P.H. (Ed.), Mantle xenoliths.John Wiley & Sons Ltd, pp. 465–473.
Dhuime, B., Bosch, D., Bruguier, O., Caby, R., Pourtales, S., 2007. Age, provenance andpost-deposition metamorphic overprint of detrital zircons from the Nathorst Landgroup (NE Greenland) — a LA-ICP-MS and SIMS study. Precambrian Research 155,24–46.
Doglioni, C., Gueguen, E., Sàbat, F., Fernandez, M., 1997. The Western Mediterraneanextensional basins and the Alpine orogen. Terra Nova 9, 109–112.
Duggen, S., Hoernle, K., van den Bogaard, P., Harris, C., 2004. Magmatic evolution of theAlboran region: the role of subduction in forming the western Mediterranean andcausing the Messinian salinity crisis. Earth and Planetary Science Letters 218, 91–108.
Esteban, J.J., Cuevas, J., Tubia, J.M., Liati, A., Seward, D., Gebauer, D., 2007. Timing andorigin of zircon-bearing chlorite schists in the Ronda peridotites (Betic Cordilleras,Southern Spain). Lithos 99, 121–135.
Fernandez-Suarez, J., Dunning, G.R., Jenner, G.A., Gutierrez-Alonso, G., 2000. Variscancollisional magmatism and deformation in NW Iberia: constraints from U–Pbgeochronology of granitoids. Journal of theGeological Society of London 157, 565–576.
Fraser, G., Ellis, D., Eggins, S., 1997. Zirconium abundance in granulite-facies minerals withimplications for zircon geochronology in high-grade rocks. Geology 25, 607–610.
Frizon de Lamotte, D., Saint Bezar, B., Bracène, R., 2000. The two main steps of the Atlasbuilding and geodynamics of the western Mediterranean. Tectonics 19, 740–761.
Gerdes, A., Worner, G., Henk, A., 2000. Post-collisional granite generation and HT-LPmetamorphism by radiogenic heating: the Variscan South Bohemian Batholith.Journal of the Geological Society of London 157, 577–587.
Giletti, B.J., Tullis, J., 1977. Studies in diffusion: IV. Pressure dependence of Ar diffusion inphlogopite mica. Earth and Planetary Science Letters 35, 180–183.
Günther, D., Heinrich, C.A., 1999. Enhanced sensitivity in LA-ICP-MS using helium-argonmixtures as aerosol carrier. Journal of Analytical Atomic Spectrometry 14, 1369–1374.
Hames, W.E., Bowring, S.A., 1994. An empirical evaluation of the argon diffusiongeometry in muscovite. Earth and Planetary Science Letters 124, 161–167.
Hammor, D., Lancelot, J.R., 1998. Métamorphismemiocène de granites panafricains dansle massif de l'Edough (Nord-Est de l'Algérie). Comptes Rendus de l'Académie desSciences de Paris 327, 391–396.
Hammor, D., Bosch, D., Caby, R., Bruguier, O., 2006. A two-stage exhumation of theVariscan crust: U–Pb LA-ICP-MS and Rb–Sr ages from Greater Kabylia, Maghrebides.Terra Nova 18, 299–307.
Hansmann, W., Müntener, O., Hermann, J., 2001. U–Pb zircon geochronology of atholeiitic intrusion and associated migmatites at a continental crust–mantletransition, Val Malenco, Italy. Schweiz Mineralogische Petrogr Mitt 81, 239–255.
Harrison, T.M., Duncan, I., McDougall, I., 1985. Diffusion of 40Ar in biotite: temperature,pressure and compositional effects. Geochimica et Cosmochimica Acta 49, 2461–2468.
Hermann, J., Rubatto, D., 2003. Relating zircon and monazite domains to garnet growthzones: age and duration of granulite facies metamorphism in the Val Malenco lowercrust. Journal of Metamorphic Geology 21, 833–852.
Horstwood, M.S.A., Foster, G.L., Parrish, R.R., Noble, S.R., Nowell, G.R., 2003. Common Pbcorrected in situ U–Pb accessory mineral geochronology bu LA-MC-ICPMS. Journalof Analytical Atomic Spectroscopy 18, 837–846.
Hoskin, P.W.O., Black, L.P., 2000. Metamorphic zircon formation by solid-state recrystal-lisation of protolith igneous zircon. Journal of Metamorphic Geology 18, 423–439.
Ilavsky, J., Snopkova, P., 1987. Découverte d'Acritarches paleozoiques dans les terrainsmétamorphiques de l'Edough (Wilaya d'Annaba, Algérie). Comptes Rendus del'Académie des Sciences de Paris 305, 881–884.
Janots, E., Negro, F., Brunet, F., Goffé, B., Engi, M., Bouybaouene, M.L., 2006. Evolution ofthe REE mineralogy in HP–LT metapelites of the Sebtide complex, Rif, Morocco:monazite stability and geochronology. Lithos 87, 214–234.
Jolivet, L., Faccenna, C., 2000. Mediterranean extension and the Africa-Eurasia collision.Tectonics 19, 1095–1106.
Kelsey, D.E., Powell, R., Wilson, C.J.L., Steele, D.A., 2003. (Th+U)–Pbmonazite ages fromAl–Mg-rich metapelites, Rauer Group, east Antarctica. Contributions to Mineralogyand Petrology 146, 326–340.
Kelsey, D.E., Clark, C., Hand, M., 2008. Thermobarometric modelling of zircon andmonazite growth in melt-bearing systems: examples using model metapelitic andmetapsammitic granulites. Journal of Metamorphic Geology 26, 199–212.
Lee, J.K.W.,Williams, I., Ellis, D.J., 1997. Pb, U and Th diffusion in natural zircon. Nature 390,159–163.

183O. Bruguier et al. / Chemical Geology 261 (2009) 171–183
Ludwig, K.R., 2000. User's manual for Isoplot/Ex v.2.3. A geochronological toolkit forMicrosoft Excel. Berkeley Geochronology Center Special Publicatin N° 1a (2000),Berkeley, California.
Maillard, A., Mauffret, A., 1999. Crustal structure and riftogenesis of the Valencia Trough(north-western Mediterranean Sea). Sedimentary Basin 11, 357–379.
Mauffret, A., Frizon de Lamotte, D., Lallemant, S., Gorini, C., Maillard, A., 2004. E–Wopening of the Algerian Basin (Western Mediterranean). Terra Nova 16, 257–264.
Michard, A., Negro, F., Saddiqi, O., Bouybaouene, M.L., Chalouan, A., Montigny, R., Goffé,B., 2006. Pressure-temperature-time constraints on the Maghrebide mountainbuilding: evidence from the Rif-Betic transect (Morocco, Spain), Algerian correla-tions, and geodynamic implications. Comptes Rendus Geoscience 338, 92–114.
Monié, P., Maluski, H., Saadallah, A., Caby, R., 1988. New 40Ar/39Ar ages of Hercynian andalpine thermotectonic events in Grande Kabylie (Algeria). Tectonophysics 152, 53–69.
Monié, P., Montigny, R., Maluski, H., 1992. Ages 40Ar/39Ar alpins de la tectonique ductileextensive dans le massif de l'Edough (Kabylies, Algérie). Bulletin de la SociétéGéologique de France 163, 571–584.
Monié, P., Torres-Roldan, R.L., Garcia-Casco, A., 1994. Cooling and exhumationof thewestern Betic Cordilleras: 40Ar/39Ar thermochronological constraints on acollapsed terrane. Tectonophysics 238, 353–379.
Montel, J.M., Foret, S., Veschambre, M., Nicollet, C., Provost, A., 1996. Electronmicroprobe dating of monazite. Chemical Geology 131, 37–53.
Montel, J.M., Kornprobst, J., Vielzeuf, D., 2000. Preservation of old U–Th–Pb ages inshielded monazite: example from the Beni–Bousera Hercynian kinzigites (Mor-occo). Journal of Metamorphic Geology 18, 335–342.
Nance, D.R., Murphy, B.J., 1994. Contrasting basement isotopic signatures and thepalinspastic restoration of peripheral orogens: example from the NeoproterozoicAvalonian–Cadomian belt. Geology 22, 617–620.
Nicolas, A., Boudier, F., Montigny, R., 1987. Structure of Zabargad Island and early riftingof the Red Sea. Journal of Geophysical Research 92, 461–474.
Paquette, J.L., Ménot, R.P., Pin, C., Orsini, J.B., 2003. Episodic and short-lived graniticpulses in a post-collisional setting: evidence from precise U–Pb zircon datingthrough a crustal cross-section in Corsica. Chemical Geology 198, 1–20.
Peucat, J.J., Mahdjoub, Y., Drareni, A., 1996. U–Pb and Rb–Sr geochronological evidencefor late Hercynian tectonic and Alpine overthrustuing in Kabylian metamorphicbasement massifs (northern Algeria). Tectonophysics 258, 195–213.
Pidgeon, R.T., 1992. Recrystallisation of oscillatory zoned zircon — some geochronolo-gical and petrological implications. Contributions to Mineralogy and Petrology 110,463–472.
Pidgeon, R.T., Nemchin, A.A., Hitchen, G.J., 1998. Internal structures of zircons fromArchaean granites from the Darling Range batholith: implications for zirconstability and the interpretation of zircon U–Pb ages. Contributions to Mineralogyand Petrology 132, 288–299.
Pin, C., 1986. Datation U–Pb sur zircon à 285 Ma du complexe gabbro-dioritique du ValSesia-Val Mastallone et âge tardi-hercynien du métamorphisme granulitique de lazone Ivrea-Verbano (Italie). Comptes Rendus de l'Académie des Sciences de Paris303, 827–830.
Pin, C., Duthou, J.L., 1990. Sources of Hercynian granitoids from the French MassifCentral: inferences from Nd isotopes and consequences for crustal evolution.Chemical Geology 83, 281–296.
Platt, J.P., Vissers, R.L.M.,1989. Extensional collapse of thickened continental lithosphere:aworking hypothesis for the Alboran Sea and the Gibraltar arc. Geology 17, 540–543.
Platt, J.P., Whitehouse, M.J., 1999. Early Miocene high-temperature metamorphism andrapid exhumation in the Betic Cordillera (Spain): evidence from U–Pb zircon ages.Earth and Planetary Science Letters 171, 591–605.
Platt, J.P., Whitehouse, M.J., Kelley, S.P., Carter, A., Hollick, L., 2003. Simultaneousextensional exhumation across the Alboran basin: Implications for the causes oflate orogenic extension. Geology 31, 251–254.
Poitrasson, F., Chenery, S., Shepperd, T.J., 2000. Electron microprobe and LA-ICP-MSstudy of monazite hydrothermal alteration: Implications for U–Th–Pb geochronol-ogy and nuclear ceramics. Geochimica et Cosmochimica Acta 64, 3283–3297.
Reisberg, L., Lorand, J.P., 1995. Longevity of sub-continental mantle lithosphere fromosmium isotope systematics in orogenic peridotite massifs. Nature 376, 159–162.
Rollet, N., Déverchère, J., Beslier, M.O., Guennoc, P., Réhault, J.P., Sosson, M., Truffert, C.,2002. Back arc extension, tectonic inheritance, and volcanism in the Ligurian Sea,western Mediterranean. Tectonics 21, 1–23.
Rossi, P., Cocherie, A., Fanning, C.M., Deloule, E., 2006. Variscan to eo-Alpine eventsrecorded in European lower-crust zircons sampled from the French Massif Centraland Corsica, France. Lithos 87, 235–260.
Schaltegger, U., 1997. Magma pulses in the Central Variscan Belt: episodic meltgeneration and emplacement during lithospheric thinning. Terra Nova 9, 242–245.
Schärer, U., Kornprobst, J., Beslier, M.O., Boillot, G., Girardeau, J., 1995. Gabbro andrelated rock emplacement beneath rifting continental crust: U–Pb geochronologi-cal and geochemical constraints for the Galicia passive margin (Spain). Earth andPlanetary Science Letters 130, 187–200.
Schellart, W.P., 2005. Influence of the subducting plate velocity on the geometry of theslab andmigration of the subduction hinge. Earth and Planetary Science Letters 231,197–219.
Scherstén, A., Arebäck, H., Cornell, D., Hoskin, P., Aberg, A., Armstrong, R., 2000. Datingmafic-ultramafic intrusions by ion-microprobing contact-melt zircon: examplesfrom SW Sweden. Contributions to Mineralogy and Petrology 139, 115–125.
Silver, L.T., Deustch, S., 1963. Uranium-lead isotopic variations in zircons— a case study.Journal of Geology 71, 721–758.
Snow, J.E., Schmidt, G., 1999. Proterozoic melting in the northern peridotite Massif,Zabargad Island: Os isotopic evidence. Terra Nova 11, 45–50.
Spear, S., Kohn, M.J., Chenery, J.T., 1999. P–T paths for anatectic pelites. Contributions toMineralogy and Petrology 134, 17–32.
Speranza, F., Villa, I.M., Sagnotti, L., Florindo, F., Cosentino, D., Cipollari, P., Mattei, M.,2002. Age of the Corsica–Sardinia rotation and Liguro–Provençal Basin spreading:new paleomagnetic and Ar/Ar evidence. Tectonophysics 347, 231–251.
Stacey, J.S., Kramers, J.D., 1975. Approximation of terrestrial lead isotope evolution by atwo-stage model. Earth and Planetary Science Letters 26, 207–221.
Stampfli, G.M., Mosar, J., Favre, P., Pillevuit, A., Vannay, J.C., 2001. Permo-Mesozoicevolution of the western Tethys realm: the Neo-Tethys East Mediterranean Basinconnection. In: Ziegler, P.A., Cavazza, W., Robertson, A.H.F., Crasquin-Soleau, S.(Eds.), Peri-Tethys Memoir 6: Peri-Tethyan Rift/ Wrench Basins and Passive Margins,vol. 186. Memoires du Museum National d'Histoires Naturelles, pp. 51–108.
Tribuzio, R., Thirlwall, M.F., Messiga, B., 1999. Petrology, mineral and isotopegeochemistry of the Sondalo gabbroic complex (Central Alps, Northern Italy):implications for the origin of post-Variscan magmatism. Contributions to Miner-alogy and Petrology 136, 48–62.
Vavra, G., Schmid, R., Gebauer, D., 1999. Internal morphology, habit and U–Th–Pbmicroanalysis of amphibolite-to-granulite facies zircons: geochronology of theIvrea zone (Southern Alps). Contributions to Mineralogy and Petrology 134,380–404.
Watson, B.E., Harrison, T.M., 1983. Zircon saturation revisited: temperature andcomposition effects in a variety of crustal magma types. Earth and PlanetaryScience Letters 64, 295–304.
Wiedenbeck, M., Allé, P., Corfu, F., Griffin, W.L., Meier, M., 1995. Three natural zirconstandards for U–Th–Pb, Lu–Hf, trace element and REE analyses. GeostandardsNewsletter 19, 1–23.
Williams, I.S., 1992. Some observations on the use of zircon U–Pb geochronology in thestudy of granitic rocks. Transactions of the Royal Society of Edinburgh 83, 447–458.
Zeck, H.P., 1996. Betic-Rif orogeny: subduction of Mesozoic Thetys lithopshere undereastward drifting Iberia, slab detachment shortly before 22 Ma, and subsequentuplift and extensional tectonics. Tectonophysics 254, 1–16.
Zeck, H.P., 1997. Mantle peridotites outlining the Gibraltar arc— centrifugal extensionalallochtons derived from the earlier Alpine, westward subducted nappe pile.Tectonophysics 281, 195–207.
Zeck, H.P., Whitehouse, M.J., 1999. Hercynian, Pan-African, Proterozoic and Archean ionmicroprobe zircon ages for a Betic-Rif core complex, Alpine belt,WMediterranean –consequences for its P–T–t path. Contributions to Mineralogy and Petrology 134,134–149.
Zeck, H.P., Whitehouse, M.J., 2002. Repeated age resetting in zircons from Hercynian-Alpine polymetamorphic schists (Betic-Rif tectonic belt, S. Spain) — a U–Th–Pb ionmicroprobe study. Chemical Geology 182, 275–292.
Zeck, H.P., Monié, P., Villa, I.M., Hansen, B.T., 1992. Very high rates of cooling and uplift inthe Alpine belt of the Betic Cordilleras, southern Spain. Geology 20, 79–82.
Zindler, A., Staudigel, H., Hart, S.R., Endres, R., Goldstein, S., 1983. Nd and Sm isotopicstudy of a mafic layer from Ronda ultramafic complex. Nature, 304, 226–228.

Tectonophysics xxx (2009) xxx–xxx
TECTO-124536; No of Pages 23
Contents lists available at ScienceDirect
Tectonophysics
j ourna l homepage: www.e lsev ie r.com/ locate / tecto
ARTICLE IN PRESS
Conflicting structural and geochronological data from the Ibituruna quartz-syenite(SE Brazil): Effect of protracted “hot” orogeny and slow cooling rate?
Sylvain Petitgirard a,1, Alain Vauchez a,⁎, Marcos Egydio-Silva b, Olivier Bruguier a, Pierre Camps a,Patrick Monié a, Marly Babinski b, Mathieu Mondou a,b
a Geosciences-Montpellier, Université de Montpellier 2 and CNRS, Place E. Bataillon, 34095-Montpellier Cedex05, Franceb Instituto de Geociências—Universidade de São Paulo, Rua do Lago, 562—Cidade Universitária CEP 05508-080 São Paulo—SP, Brazil
⁎ Corresponding author.E-mail address: [email protected] (A. Va
1 Now at: Laboratoire de Sciences de la Terre-Ecole noAllée d'Italie 69364—Lyon Cedex07, France.
0040-1951/$ – see front matter © 2009 Elsevier B.V. Adoi:10.1016/j.tecto.2009.02.039
Please cite this article as: Petitgirard, S., et aEffect of protracted “hot” orogeny and slow
a b s t r a c t
a r t i c l e i n f oArticle history:Received 1 August 2008Received in revised form 29 December 2008Accepted 26 February 2009Available online xxxx
Keywords:Hot orogenMagmatic structure and deformationAMSU-Pb and 40Ar-39Ar geochronologySlow cooling rateSE-Brazil neoproterozoic orogeny
The Ibituruna quartz-syenite was emplaced as a sill in the Ribeira-Araçuaí Neoproterozoic belt (SoutheasternBrazil) during the last stages of the Gondwana supercontinent amalgamation. We have measured theAnisotropy of Magnetic Susceptibility (AMS) in samples from the Ibituruna sill to unravel its magnetic fabricthat is regarded as a proxy for its magmatic fabric. A large magnetic anisotropy, dominantly due to magnetite,and a consistent magnetic fabric have been determined over the entire Ibituruna massif. The magmaticfoliation and lineation are strikingly parallel to the solid-state mylonitic foliation and lineation measured inthe country-rock. Altogether, these observations suggest that the Ibituruna sill was emplaced during the hightemperature (~750 °C) regional deformation and was deformed before full solidification coherently with itscountry-rock. Unexpectedly, geochronological data suggest a rather different conclusion. LA-ICP-MS andSHRIMP ages of zircons from the Ibituruna quartz-syenite are in the range 530–535 Ma and LA-ICP-MS agesof zircons and monazites from synkinematic leucocratic veins in the country-rocks suggest a crystallization at~570–580 Ma, i.e., an HT deformation N35My older than the emplacement of the Ibituruna quartz-syenite.Conclusions from the structural and the geochronological studies are therefore conflicting. A possibleexplanation arises from 40Ar–39Ar thermochronology. We have dated amphiboles from the quartz-syenite,and amphiboles and biotites from the country-rock. Together with the ages of monazites and zircons in thecountry-rock, 40Ar–39Ar mineral ages suggest a very low cooling rate: b3 °C/My between 570 and ~500 Maand ~5 °C/My between 500 and 460 Ma. Assuming a protracted regional deformation consistent over tens ofMy, under such stable thermal conditions the fabric and microstructure of deformed rocks may remainalmost unchanged even if they underwent and recorded strain pulses separated by long periods of time. Thismay be a characteristic of slow cooling “hot orogens” that rocks deformed at significantly different periodsduring the orogeny, but under roughly unchanged temperature conditions, may display almost indiscerniblemicrostructure and fabric.
© 2009 Elsevier B.V. All rights reserved.
1. Introduction
A major issue in understanding orogenic processes is to decipherthe relationships between large-scale deformation and magmatismbecause they are tightly linked and frequently interdependent (e.g.,Hutton,1988; Tommasi et al., 1994; Bouchez and Gleizes,1995; Brown,2007; Le Roux et al., 2008). The anisotropy of magnetic susceptibility(AMS) has been extensively used to map the internal structure(magmatic foliation and lineation) of plutons and determine whetherthe emplacement of a magmatic body is early, coeval or late comparedto the main deformation in an orogenic domain (e.g., Guillet et al.,1983; Bouchez and Gleizes, 1995; Borradaile and Henry, 1997;
uchez).rmale Supérieure de Lyon, 46
ll rights reserved.
l., Conflicting structural andcooling rate? Tectonophysi
Archanjo et al., 2002). A complementary approach consists in datingthe main deformation that affected the country-rock and the crystal-lization of the magmatic rock. When magma intrusion is coeval withthe deformation, it is expected that the fabric in the magmaticintrusive and in the country-rock is similar, as are the ages of bothcrystallization of the pluton and deformation of the country-rock. Thispaper documents a complex case study where mapping of themagmatic foliation and lineation in a magmatic body (i.e. theIbituruna quartz-syenite, SE Brazil) indicates a common deformationhistory with the country-rocks. However, U–Pb geochronology carriedout on high temperature minerals (zircon and monazite) substantiatea ca. 40 My delay between the main metamorphic event affectingcountry-rocks and emplacement of the magmatic body. We proposethat this apparent inconsistency between structural mapping andisotopic dating may result from the thermal evolution of the Ribeira-Araçuaí “hot-orogen”, which is characterized by a low (b5 °C/My)regional cooling from synkinematic HT–LP (~750 °C–600 MPa)
geochronological data from the Ibituruna quartz-syenite (SE Brazil):cs (2009), doi:10.1016/j.tecto.2009.02.039

2 S. Petitgirard et al. / Tectonophysics xxx (2009) xxx–xxx
ARTICLE IN PRESS
conditions. This thermal stability, together with a protracted colli-sional orogeny might reconcile the two sets of data.
The Neoproterozoic Ribeira-Araçuai-West Congo orogen, whichextends over more than 1000 km in length and 500 km in width(Fig. 1), results from the convergence between the São Francisco andCongo cratons. The collision between the proto-South American andthe proto-African continents represents the final stage of theGondwana supercontinent assembly during the Neoproterozoic. Thepre-collisional structure between these two cratonic domains is stillpoorly understood. It was suggested that the eastern boundary of theSão Francisco craton was rifted during the early Neoproterozoic(Trompette et al., 1992; Alkmim et al., 2001), and that the collision ofthe proto-African and proto-South American continents closed anoceanic basin bounded eastward by an active margin (e.g., Pedrosa-Soares et al., 1992). Recent dating using various geochronometerssupport that collision begun after 600 Ma, lasted until ~520 Ma (Noceet al., 2004) and amalgamated continental lithosphere of contrastedage (Brueckner et al., 2000).
Deformation in the northern Ribeira-Araçuaí Belt was dominantlycontractional, as suggested by HT thrusting of a stack of allochthonousunits toward the São Francisco craton (Vauchez et al., 2007 andreferences herein). Southward, the Ribeira-Araçuai Belt displays a clearchange in dominant deformation regime (Trompette, 1994; Vauchezet al., 1994). The tectonic evolution of the southern domain ischaracterized by a transpressional regime: several major dextraltranscurrent shear zones have accommodated belt parallel displace-ments synchronous with or slightly postdating nappe tectonics(Egydio-Silva et al., 2002; Schmitt et al., 2004). This variation in
Fig. 1. Schematic reconstitution of Africa and South America before South Atlantic openingbefore ~600 Ma (white crosses=cratonic domains; white lines=neoproterozoic belts. In b600 Ma. The area delimited in the northern part of the Ribeira-Araçuaí orogen (stippled linSouth America. Small blue arrows show the main kinematics. CC=Congo craton, BB=Bras
Please cite this article as: Petitgirard, S., et al., Conflicting structural andEffect of protracted “hot” orogeny and slow cooling rate? Tectonophysi
deformation regime along the belt is progressively accommodated inthe central Ribeira-Araçuaí orogen where an association of thrust andtranscurrent tectonics has been highlighted (Egydio-Silva et al., 2005);it is spatially associated to both a bending of the belt and the southerntermination of the São Francisco craton (Vauchez et al., 1994).
The structure of the northern Ribeira-Araçuaí Belt involves severalallochthonous units thrust upon the para-autochthonous metasedi-mentary cover of the São Francisco craton (Fig. 2). Schematically,following Oliveira et al. (2000) and Vauchez et al. (2007), the stack ofallochthonous units comprises from the bottom to the top:
1) A western domain characterized by a N5 km-thick sheet of HTmylonites derived from predominantly metasedimentary proto-liths, injected by abundant synkinematic leucocratic magma;
2) A central domain mostly comprised of syn-collisional tonaliticcomplexes (+subordinate granodiorite and granite) that display apervasive magmatic fabric similar to the solid-state foliation andlineation observed in the metasedimentary country-rock;
3) An eastern domain dominated by anatexites (peraluminousdiatexites and leucogranites) resulting from pervasive partialmelting of metasediments from the middle crust.
The eastern, anatectic domain, in which several granitic bodieshave been intruded, outcrops over ~300 km parallel to the belt and upto 100 km normal to the belt (Fig. 2); it is topped by stronglydeformed, partially molten kinzigites in which abundant kinematicindicators suggest westward thrusting.
A twofold tectonic/magmatic evolutionwaspreviously suggested forthe northern Ribeira-Araçuaí orogen (Bilal et al., 2000; Noce et al.,
(after Vauchez et al., 2007). Shaded areas represent domains where collision occurredetween, the Ribeira-Araçuaí-West Congo orogen resulted from a collision younger thanes) represents the location of Fig. 2. Arrows show the convergence between Africa andilia belt, SP=São Paulo, RJ=Rio de Janeiro.
geochronological data from the Ibituruna quartz-syenite (SE Brazil):cs (2009), doi:10.1016/j.tecto.2009.02.039

Fig. 2. Simplified geological map of the northern Ribeira-Araçuaí orogen (after Vauchez et al., 2007) showing the main domains that shape the belt. From East to West: The easterndomain (1) comprises a thick (≥10 km) layer of diatexites and anatectic granites (a) topped by migmatitic kinzigites (b). The central domain comprises pre- to syn-collisionalmagmatic complexes (2=Galiléia batholith; 3=São Vitor tonalite) intruded in HT metasediments (5). The western domain (6) involves metasedimentary and meta-igneousmylonites thrust upon the para-autochthonous metasedimentary cover of the São Francisco craton (7). Late orogenic porphyritic granitoids associated with charnockites (4) intrudedthe stack of allochthonous units. 8=foliation and lineationmeasured in the field; 9=Magnetic (AMS) foliation and lineation. GV=Governador Valadares, TO=Teofilo Otoni. Squaresurrounding GV=location of this study. Top left insert: Location map showing the main cratonic domains (SFC=São Francisco craton, CC=Congo craton; AC=Amazon craton;WAC=West African craton) and neoproterozoic mobile belts in eastern South America (SA) and western central Africa (AF).
3S. Petitgirard et al. / Tectonophysics xxx (2009) xxx–xxx
ARTICLE IN PRESS
2000): 1) Between590 and560Ma, afirst stage corresponds to themaincompressional deformationduringwhichpre- to syn-collisional igneouscomplexes where emplaced; and 2) Between 530 and 500 Ma a secondstage, related to a “post-orogenic gravitational rebound”, is responsiblefor the emplacementof late- to post-kinematic, isotropic granitic bodies.
The Ibituruna quartz-syenite is located at the contact between thewestern and central domain and was attributed to the post-orogenicevolution (Bilal et al., 2000) due to its alkaline nature, its shape inmapand a Rb–Sr age of 511 Ma (Besang et al., 1977). However, fieldobservations performed on the Ibituruna syenite, such as: 1) theubiquitous presence in the quartz-syenite of a strong magmatic fabricparallel to the mylonitic fabric in the country-rock, 2) the lack ofevidence of tectonic extension, and 3) the lack of contact metamorph-ism at the syenite–country-rock interface, led us to hypothesize thatthe Ibituruna massif was emplaced within and deformed coherentlywith its mylonitic country-rock before full crystallization. To decipherthe correct scenario, we carried out a magnetic study involvingmeasurements of the anisotropy of magnetic susceptibility (AMS),and measurements of anisotropy of total and partial anhystereticremanent magnetization (AARM and pAARM, respectively) to
Please cite this article as: Petitgirard, S., et al., Conflicting structural andEffect of protracted “hot” orogeny and slow cooling rate? Tectonophysi
complement field observations. In addition, Pressure–Temperatureconditions of the mylonitic deformation of the country-rock wereestimated. Finally, U/Pb ages (LA-ICP-MS and SHRIMP) and 40Ar–39Arages were collected from several minerals extracted from both thesyenite and its host rocks.
2. The Ibituruna quartz-syenite and its country-rock
The Ibituruna quartz-syenite is a small massif (~13 km2; Fig. 3A)intruded parallel to the regional fabric as a sill whose originalthickness, although impossible to ascertain, likely did not exceed1000 m. Its composition is homogeneous over almost the entiremassif: K-feldspar, mostly microcline, sodic plagioclase, quartz,amphibole, minor amounts of biotite, interstitial calcite, clinopyrox-ene and fluorine. The grain size is fine to medium and themicrostructure is usually equilibrated: feldspar grains are polygonaland display 120° dihedral angles (Fig. 3B). Quartz, although affectedby annealing, still displays evidence of interstitial crystallization.Evidence of solid-state deformation, either in quartz or in feldspar, hasnever been observed.
geochronological data from the Ibituruna quartz-syenite (SE Brazil):cs (2009), doi:10.1016/j.tecto.2009.02.039

Fig. 3. The Ibituruna quartz-syenite. A) Picture of the Ibituruna sill above metasedimentary mylonites. West is on the right. B) Microphotograph showing the microstructure of theIbituruna quartz-syenite (crossed nicols). The microstructure is equilibrated, the crystals do not show evidence of solid-state deformation and display grain boundaries triplejunction at 120°. C) Picture of the outcrop AR412 showing the well-defined magmatic foliation and the magmatic lineation marked by amphibole.
4 S. Petitgirard et al. / Tectonophysics xxx (2009) xxx–xxx
ARTICLE IN PRESS
As already suggested by Féboli (2000), mafic minerals in thesyenite usually display a clear preferred orientation. Indeed, in mostoutcrops this orientation is well developed and defines magmaticfoliation and, less frequently, lineation. Where observed, the mag-matic foliation is gently dipping eastward and parallels the myloniticfabric observed in the country-rock (Fig. 3C). This parallelism, ifconsistent at the scale of the whole massif, would be indicative of theintrusion of syenitic magma during or slightly before the myloniticdeformation of the country-rock.
Mylonites in the western domain have undergone high-grademetamorphism (upper amphibolite to granulite facies) and pervasive,rather homogeneous thrust deformation. Numerous kinematic criteriaat various scales are observed in the field, from centimetre-scaleasymmetrical leucocratic lenses to 10 m-scale boudins of morecompetent material, and suggest westward sense of transport (Fig. 4).In thin section, mylonitic rocks display a coarse-grainedmicrostructure.Quartz grains are tabular, usually free of internal deformation features
Fig. 4. The country-rock: mylonitic metasediments. A) Pluri-metric, asymmetric boudins oleucogranite veins. Scale is 1m. B) Pelitic mylonites containing small, asymmetric lenses of leand the synchroneous injection of leucocratic magma.
Please cite this article as: Petitgirard, S., et al., Conflicting structural andEffect of protracted “hot” orogeny and slow cooling rate? Tectonophysi
such as undulose extinction or subgrain boundary, and shows evidenceof crystal growth through grain boundarymigration (lobate boundaries,inclusions of sillimanite…). Biotite is ubiquitous and prismatic sillima-nite is frequently observed; they both outline the foliation. Garnet,whenpresent, is synkinematic and exhibit biotite crystallized in pressureshadow. Cordierite is remarkably fresh and poikiloblastic. Observationsat the thin section scale are consistentwithmacroscopic tectonic criteriasuggesting westward thrusting. A large volume of leucocratic veinsmostly parallel to, and more seldom crosscutting, the foliation intrudesthe metasedimentary mylonites. Some veins are boudinaged and formsigmoid lenses. Large crystals of cordierite, garnet and feldspar occur inthese veins; quartz is interstitial, and usually free of solid-statedeformation. Altogether these observations suggest that mylonitizationoccurred under HT conditions and was accompanied by intrusion oflarge volumes of anatectic melt.
The Ibituruna massif was emplaced at the boundary between thethick mylonitic complex and the tonalitic complex of the central
f more competent layers embedded in pelitic mylonites alterning with synkinematicucocratic magma. Both pictures illustrate the top-to-west transport of this mylonitic unit
geochronological data from the Ibituruna quartz-syenite (SE Brazil):cs (2009), doi:10.1016/j.tecto.2009.02.039

Fig. 5. Geological map of the Governandor Valadares area modified from projeto Leste (Oliveira et al., 2000). Full black circles are location of sites sampled for AMS. Numbers in greyare sites sampled for P–T calibrations. Numbers in black are sites sampled for U–Pb and/or 40Ar–39Ar dating.
5S. Petitgirard et al. / Tectonophysics xxx (2009) xxx–xxx
ARTICLE IN PRESS
domain (Fig. 5). The base of this magmatic unit (the “Derribadinhatonalite”) is composed of large amounts of tonalite and leucograniteinjected in metasediments previously deformed under HT conditions.The tectonic fabric measured in the field (Fig. 6) is consistent withinthe three rock units. A meanmineral stretching lineation plunging 20°to 092E is well determined as attested by a 99% cone confidence of 6°.Average foliation trends N002E and dips 28E. The consistency of thestructural fabric suggests that the three rock types have beendeformed coherently during a single event. However structural fieldmeasurements in the syenite are scarce, especially for lineation. Tosettle the tectonic relationship between the quartz-syenite and itscountry-rock, mapping the anisotropy of magnetic susceptibility is themost appropriate approach.
3. Rock magnetism properties
The magnetic study requires a specific sampling of oriented coresdesigned to allow a reliable mapping of themagnetic/magmatic fabricover the Ibituruna quartz-syenite and a comparisonwith the structuredeveloped in the country-rock. Hence, 42 sites were sampled in theIbituruna pluton and its surroundings, amongwhich 6 are in myloniticrocks, 1 is in the Derribadinha tonalite, and 35 are in the Ibituruna
Fig. 6. Stereoplot of the structural fabric measured in the field (lower hemisphere). (A) folistretching lineations; density contours define a “best” lineation plunging 20° to N092E.
Please cite this article as: Petitgirard, S., et al., Conflicting structural andEffect of protracted “hot” orogeny and slow cooling rate? Tectonophysi
quartz-syenite. Between 2 and 7 oriented cores were drilled in eachsite. In the laboratory, samples were cut into standard cylindricalpaleomagnetic specimens, i.e., 25 mm in diameter and 22 mm inheight. A total of 353 specimens were obtained. Measurements of low-field magnetic susceptibility and its anisotropy have been achievedwith a KLY3 Kappabridge (Agico, Czech Republic) in the paleomag-netic laboratory of Montpellier, France. They have been completedwith measurements of low-field thermomagnetic curves at low- andhigh-temperature, and optical ore-microscopy observations to accu-rately identify the nature and the size of the magnetic minerals.
The bulk susceptibility Km measured for each site (Table 1) isdirectly dependent on the concentration of ferromagnetic (s.l.)minerals and is reported on Fig. 7 as iso-Km contours. Three mainareas are distinguished corresponding to three different magneticbehaviors of rocks:
(1) most samples from the Ibituruna sill display a ferromagnetic (s.l.)behavior, with Km N10−3 SI and even locally Km N10−2 SI. Suchvalues of Km are basically attributed to magnetite (Tarling andHrouda, 1993). This first-order interpretation is confirmed withthe low-field thermomagnetic curves. Rocks from the Ibiturunamassif display a characteristic Verwey transition at −150 °C+/
ation poles; red triangle represents the “best” foliation pole (N002E-28E). (B) mineral
geochronological data from the Ibituruna quartz-syenite (SE Brazil):cs (2009), doi:10.1016/j.tecto.2009.02.039

Table 1ASM data for samples from the Ibituruna quartz-syenite and its country-rock.
N K1 K2 K3 Km(ì SI)
P′ T
Az Dip Az Dip Az Dip
IbiturunaAR-410 6 87 12 178 5 291 77 12,525 1.21 0.26AR-412 9 80 22 344 15 223 63 14,602 1.28 0.47AR-414 8 98 11 21 4 273 77 8536 1.37 0.41AR-513 6 85 10 176 5 290 79 15,652 1.22 0.28AR-514 9 86 10 354 1 258 79 1502 1.47AR-515 8 85 11 3 12 229 73 15,411 1.24 0.43AR-516 8 86 15 354 7 240 74 9690 1.18 0.42AR-517 6 99 7 190 6 324 81 13,571 1.39 0.06AR-518 7 114 9 204 1 297 81 11,626 1.30 0.56AR-520 7 168 6 78 9 293 80 7110 1.27 0.66AR-521 8 109 15 16 12 249 70 27,171 1.40 0.40AR-522 9 89 16 161 20 267 59 6658 1.15 0.25AR-556 14 87 32 354 8 250 58 2901 1.04 −0.01AR-557 8 94 13 184 1 276 75 10,255 1.15 0.41AR-558 8 101 10 11 2 272 80 9732 1.13 0.33AR-559 6 114 24 20 11 268 62 5645 1.11 0.38AR-560 8 110 11 18 7 258 77 4384 1.08 0.25AR-561 11 94 9 184 5 301 80 12,910 1.50 0.55AR-582 10 118 7 26 4 237 79 5008 1.09 0.37AR-583 12 111 19 201 1 294 73 16,831 1.17 0.42AR-584 12 116 10 209 12 345 74 3516 1.06 0.25AR-585 16 127 14 34 10 274 71 6156 1.20 0.31AR-586 10 121 17 31 12 269 71 20,240 1.37 0.34AR-587 10 92 20 357 15 227 68 6520 1.09 0.23AR-588 5 104 32 0 14 251 65 7195 1.10 0.23AR-591 9 102 15 9 11 244 70 20,677 1.23 0.21AR-592 11 119 11 32 22 232 67 20,934 1.36 0.43AR-593 12 113 14 19 13 249 71 2670 1.07 0.21AR-594 13 123 24 30 6 286 66 44,486 1.56 0.36
Country-rockAR-388 8 96 18 186 2 284 72 418 1.24 0.56AR-390 8 98 13 187 3 288 74 444 1.19 0.80AR-391 8 89 22 183 9 296 66 611 1.16 0.66AR-562 6 107 28 10 17 258 55 1368 1.52 0.30AR-580 8 91 13 358 16 203 75 211 1.24 0.65AR-581 11 111 23 202 2 295 68 256 1.22 0.68AR-590 23 94 30 1 7 266 61 661 1.32 0.26
An average value is given for each site.N is the number of measured samples for each site.
Fig. 7. Map of the magnetic susceptibility. The main domains are consistent with thelithological subdivision. The metasedimentary mylonites are characterized by a lowsusceptibility and a paramagnetic behavior (light grey). The Ibituruna quartz-syenitedisplay a high susceptibility corresponding to a ferromagnetic behavior (dark grey), andthe Derribadinha tonalite (1 sample) has an intermediate susceptibility (medium grey).
6 S. Petitgirard et al. / Tectonophysics xxx (2009) xxx–xxx
ARTICLE IN PRESS
−1 °C and a Curie temperature at 575 °C+/−1 °C (Fig. 8A, B).The high values of magnetic susceptibility at room temperatureand its steep decrease at the Curie temperature suggest that theIbituruna syenite contains rather large grains of almost puremagnetite.We observed for some samples a final decrease on theK–T curve showing a low slope above the Curie temperature ofmagnetite thatmight be attributed to a small amount of hematite(Fig. 8B). Observation of polished sections under reflected light(Fig. 9) corroborates these interpretations. Samples from theIbituruna quartz-syenite systematically display large multido-main, sub-euhedralmagnetite grains containing some exsolutionlamellae of hemo-ilmenite, and in some samples large hematitegrains. Altogether, high Km values, low-field thermomagneticcurves and observation under reflected light characterize thewhole Ibituruna quartz-syenite as a magnetite-bearing pluton.Accordingly, magnetite grains are suspected to carry the majorcomponent of AMS (e.g., Archanjo et al., 1995).
(2) the bulk susceptibility of metasedimentary mylonites from thecountry-rock is usually low (Kmb10−4 SI) and denotes aparamagnetic behavior, probably due to silicate minerals(Tarling and Hrouda 1993; Borradaile and Henry, 1997). In thestudied samples the magnetic carriers likely are biotite, whichis ubiquitous, and amphibole observed in many samples.Ferromagnetic (s.l.) minerals are either absent or are in verylow concentration. This conclusion is further supported by thethermomagnetic curves that display a decrease of the suscept-ibility with temperature following a power law (Fig. 8C).
Please cite this article as: Petitgirard, S., et al., Conflicting structural andEffect of protracted “hot” orogeny and slow cooling rate? Tectonophysi
(3) Finally, the site located in the Deribadhina tonalite providedsampleswith intermediate behavior (10−4 SIbKmb10−3 SI). Thissuggests a dominant effect of paramagnetic minerals, but alsoindicates the presence of some high susceptibility ferromagnetic(s.l;) minerals such as hematite or few magnetite grains.
4. AMS measurements and magnetic fabrics
The Anisotropy of Magnetic Susceptibility (AMS) has been exten-sively used in Earth sciences, especially for tectonic investigations(Borradaile and Henry,1997). It is widely accepted that themain axes ofthe AMS ellipsoid are related to the tectonic fabric of a deformed rockand to the preferential orientation of its minerals. AMS studies inapparently isotropic rocks such as granite have shown the efficiency ofthis method (e.g., Bouchez, 1997; Borradaile and Jackson, 2004).Coupling measurements of the crystallographic preferred orientationof themagnetic carriers with AMSmeasurements inmylonites from themiddle to lower crust (Hrouda et al.,1985; Bascou et al., 2002), provideddirect evidence that theAMSellipsoid can beused as a good proxyof theductile strain fabric.
AMS is a three-dimensional property that may be defined with asecond rank tensor Kij. This tensor relates the intensity of the appliedfield H to the acquired inducedmagnetizationM through the equationMi=Kij Hj. From this tensor three eigenvectors linked to threeeigenvalues: Kmax≥Kint≥Kmin can be extracted which represents themaximum, intermediate, and minimum axis of susceptibility, respec-tively. AMS reflects the bulk susceptibility of the whole rock; itintegrates the contribution of the dia-, para-, and ferromagnetic (s.l.)minerals. The Kmax axis represents the magnetic lineation while Kmin
is the pole of magnetic foliation (the plane containing Kmax and Kint).
geochronological data from the Ibituruna quartz-syenite (SE Brazil):cs (2009), doi:10.1016/j.tecto.2009.02.039

Fig. 8. Diagrams showing the magnetic susceptibility (K) as a function of temperature. Experiments were carried out from low to high temperature using powdered samples.(A) Curves obtained under ambient air for a quartz-syenite from site AR 593. (B). Curves obtained under controlled Ar atmosphere for the same sample. At high temperature, the tailobserved possibly denotes the presence of hematite. The transition from high to low temperature is totally reversible, whereas under ambient air, a change in the susceptibilitybetween heating and cooling curves may be explained by oxidation. (C) Susceptibility curve for a sample from the mylonitic unit; the constant decrease of the susceptibility withincreasing temperature is typical of paramagnetic mineral and demonstrates an absence of iron oxides.
7S. Petitgirard et al. / Tectonophysics xxx (2009) xxx–xxx
ARTICLE IN PRESS
Different parameters (Table 1) are used to describe the magneticsusceptibility and the shape of the magnetic susceptibility ellipsoid(Jelinek, 1981):
▪ The arithmetic mean magnetic susceptibility Km=(Kmax+Kint+Kmin)/3
▪ The anisotropy degree:
PV= expffiffiffiffiffiffiffiffiffiffiffiffiffiffiffiffiffiffiffiffiffiffiffiffiffiffiffiffiffiffiffiffiffiffiffiffiffiffiffiffiffiffiffiffiffiffiffiffiffiffiffiffiffiffiffiffiffiffiffiffiffiffiffiffiffiffiffiffiffiffiffiffiffiffiffiffiffiffiffiffiffiffiffiffiffiffiffiffiffiffiffiffiffiffiffiffiffiffiffiffiffiffiffiffiffiffiffiffiffiffiffiffiffiffiffiffilnK1− lnKmð Þ2 + lnK2− lnKmð Þ2 + lnK3−Kmð Þ2
� �q
▪ The shape factor T describes the shape of the magnetic suscept-ibility ellipsoid
T =ln F − ln Lð Þln F + ln Lð Þ
where F = KintKmin
and L = KmaxKint
.T varies from +1 (oblate ellipsoid with KmaxNKint=Kmin) to −1
(prolate ellipsoid Kmax=KintNKmin).
Fig. 9. Microphotographs of magnetic minerals from the Ibituruna quartz-syenite (reflectedhematite and of hematite containing magnetite inclusions.
Please cite this article as: Petitgirard, S., et al., Conflicting structural andEffect of protracted “hot” orogeny and slow cooling rate? Tectonophysi
The mean eigenvectors, eigenvalues and 95% confidence conesabout the mean axes for each site were calculated using the bootstrapmethod of Constable and Tauxe (1990). Each value was then reportedin an equal area diagram as shown in Fig. 10A.
Since both para- and ferromagnetic minerals are present in thestudied samples, AMS is a combination of the crystallographicpreferred orientation of silicates, and of the shape anisotropy ofmagnetite. Plotting T and P′ together (Fig. 10B) shows that theanisotropy ellipsoid is consistently oblate with more than 90% valuesof the shape factor TN0.2 (Fig. 10B) independently of the anisotropyintensity of the samples. P′ spans over a rather large range of values(Table 1) from low to high anisotropy (1.04 to 1.5). Most valueshowever are N1.1 (Fig. 10C), and more than 65% are larger than 1.2,resulting in an average P′ of 1.24 that denotes a strongly anisotropicmagmatic fabric.
Reporting Kmax and Kmin on a map (Fig. 11) illustrates thedistribution of the magnetic lineation and foliation. Since mostsamples display very close values of Kmax and Kmin, the magneticfoliation and lineation are consistent over the Ibituruna pluton and itscountry-rock.
light). This picture shows large iron oxide grains of magnetite containing exsolution of
geochronological data from the Ibituruna quartz-syenite (SE Brazil):cs (2009), doi:10.1016/j.tecto.2009.02.039

8 S. Petitgirard et al. / Tectonophysics xxx (2009) xxx–xxx
ARTICLE IN PRESS
5. Anisotropy of remanent magnetization
AMS fabrics can be sometimes misinterpreted due to thecontribution of small, i.e. single domain, ferromagnetic (s.l.) grains.When present, these small minerals, may have a strong contributionto the inverse or intermediate AMS signal, and it may result in aninversion in the discrimination of Kmax and Kmin (Cañón-Tapia, 2004).
Fig. 10. Two types of AMS fabrics. (A) left: The dominant fabric (76%) displays wellconstrained principal axis, tight 95% confidence ellipses and a susceptibility ellipsoidwith an orthorhombic symmetry. right: The second type (24%) has large confidenceellipses for Kmax and Kint that are clearly overlapping. The magnetic foliation can still beaccurately defined, and is similar to those obtained from the dominant fabric type,although the magnetic lineation is less intense. (B)-plotting the magnetic susceptibilityellipsoid shape factor (T) versus the anisotropy degree (P′) shows that the susceptibilityellipsoid is consistently oblate independently of the anisotropy intensity. (C) thisdiagram shows that most samples display a large susceptibility anisotropy (65%N1.2).
Please cite this article as: Petitgirard, S., et al., Conflicting structural andEffect of protracted “hot” orogeny and slow cooling rate? Tectonophysi
AMS alone has to be carefully used to unravel the tectonic fabric. Toavoid bias in AMS interpretations, the anisotropy of remanentmagnetization (ARM) is a rather straightforward way to evaluatethe effect of these small minerals (Trindade et al., 1999).
Consequently, we measured the anisotropy of anhystereticremanent magnetization (AARM) on samples from five differentsites to isolate the ferromagnetic component of magnetic anisotropyand thus discriminate the effect of para- and ferro-magnetic fractionon AMS. We also carried out partial AARM (pAARM) measurementson the same samples to check out the possible contribution of singledomain magnetite grains on the bulk susceptibility.
AARM tensors were obtained using a special scheme of nine-directions remanence acquisition adapted from the Jelinek's (1981) 15-position diagram (Fig. 12A). This scheme gives 27 components ofremanence since we measured the 3 components of remanence (x,y,z)after each acquisition. This nine-position scheme iswell suited to obtaina reliable estimate of the anisotropy ellipsoid with its uncertainties.Measurements have been carried out on a 2G-760R cryogenicmagnetometer coupled to the 2G-600 degaussing system and to the2G-615 ARMmagnetizer (University of Montpellier, France). In practice,theprocedure startswith a demagnetizationof the9 axes byapplying analternating field (AF) of 150 mT peak-value on every axis. For eachposition, an ARM is measured by applying a bias field of 50 µT over-imposed to a 100 mT AF. After measurement, the axis is systematicallydemagnetized using an AF of 150 mT. The imparted ARM vector iscalculated by subtracting the remanence base level (corresponding tothemagnetization of the sample after the demagnetization stage) to theARM raw value obtained after magnetization of the studied axis (re-magnetization stage of the sample on the same axis). To minimize theeffects of preferential magnetization along the last AF-demagnetizedaxis, each remanence acquisition is performed in a direction orthogonalto the previous one (Fig. 12).
pAARM has been investigated to check whether single-domainmagnetite grains (size b0.05 µm) are present in the sample. Using anempirical law that links the coercitive field Hc to the grain sizethrough the relation: Hc~d−n (Day et al., 1977) a partial demagne-tization with a 50 mT AF was applied after the ARM acquisition. ARMsignal due to small magnetite grains (0–0.05 µm), which correspondto an Hc window between 50 and 100 mT (Nakamura and Borradaile,2001), was then measured.
The five selected sites present a large spatial distribution withinthe Ibituruna syenite, belong to one of the two groups previouslydefined with AMS and present a mean susceptibility value that mayvary from 10−3 to 10−2 SI.
As for AMS, AARMs results are presented on equal area diagrams ingeographical coordinates (Fig. 12). AARMs results allow a qualitativecomparison of the ferromagnetic and bulk magnetic signals. First, themagnetic fabrics remain unchanged. For instance, a pure ellipsoidalfabric in AMS remains ellipsoidal for AARM measurements (Fig. 12B).Second, AARMs measurements are well concentrated in every sampleand are close to the corresponding AMS fabric (Fig. 12B). This meansthat the magnetic fabric in the Ibituruna rocks is dominated by theferromagnetic (s.l.) signal, and that crystallographic lattices of silicates(mainly hornblende and biotite) are preferentially orientated in thesame directions as large magnetite grains. Moreover, pAARMmeasurements (Fig. 12C) display randomized positions for eachsample. This suggests that the magnetic signal due to single domainmagnetite in the bulk AMS is insignificant.
To summarize, the AARMs measurements substantiate the AMSfabrics obtained on the same samples, and suggest that the alignmentand the shape ofmulti-domainmagnetite grains dominate the observedmagnetic anisotropy. Furthermore, a crystallographic preferred orienta-tion of paramagneticmineralsmayalso contribute to thebulk anisotropy(e.g., Bascou et al., 2002). Consequently, it may be considered thatmagnetic foliations and lineations inferred from AMS measurements(Fig.11) represent reliable proxies of the strain fabric. The consistency of
geochronological data from the Ibituruna quartz-syenite (SE Brazil):cs (2009), doi:10.1016/j.tecto.2009.02.039
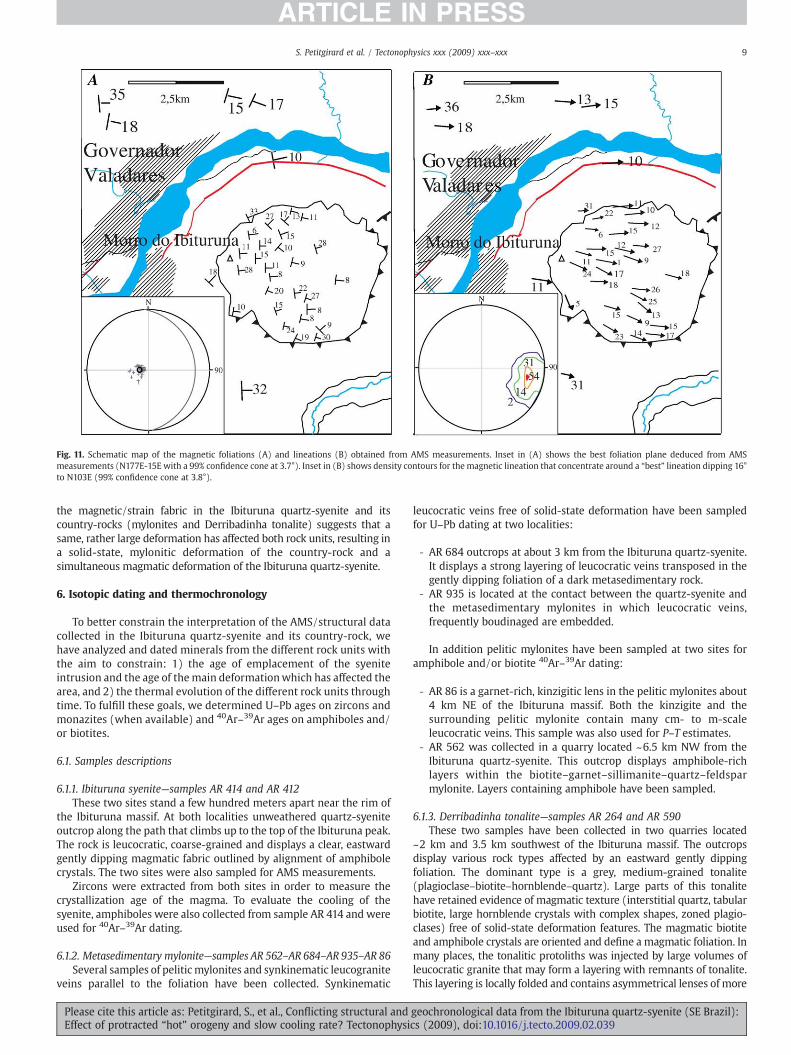
Fig. 11. Schematic map of the magnetic foliations (A) and lineations (B) obtained from AMS measurements. Inset in (A) shows the best foliation plane deduced from AMSmeasurements (N177E-15E with a 99% confidence cone at 3.7°). Inset in (B) shows density contours for the magnetic lineation that concentrate around a “best” lineation dipping 16°to N103E (99% confidence cone at 3.8°).
9S. Petitgirard et al. / Tectonophysics xxx (2009) xxx–xxx
ARTICLE IN PRESS
the magnetic/strain fabric in the Ibituruna quartz-syenite and itscountry-rocks (mylonites and Derribadinha tonalite) suggests that asame, rather large deformation has affected both rock units, resulting ina solid-state, mylonitic deformation of the country-rock and asimultaneous magmatic deformation of the Ibituruna quartz-syenite.
6. Isotopic dating and thermochronology
To better constrain the interpretation of the AMS/structural datacollected in the Ibituruna quartz-syenite and its country-rock, wehave analyzed and dated minerals from the different rock units withthe aim to constrain: 1) the age of emplacement of the syeniteintrusion and the age of themain deformationwhich has affected thearea, and 2) the thermal evolution of the different rock units throughtime. To fulfill these goals, we determined U–Pb ages on zircons andmonazites (when available) and 40Ar–39Ar ages on amphiboles and/or biotites.
6.1. Samples descriptions
6.1.1. Ibituruna syenite—samples AR 414 and AR 412These two sites stand a few hundred meters apart near the rim of
the Ibituruna massif. At both localities unweathered quartz-syeniteoutcrop along the path that climbs up to the top of the Ibituruna peak.The rock is leucocratic, coarse-grained and displays a clear, eastwardgently dipping magmatic fabric outlined by alignment of amphibolecrystals. The two sites were also sampled for AMS measurements.
Zircons were extracted from both sites in order to measure thecrystallization age of the magma. To evaluate the cooling of thesyenite, amphiboles were also collected from sample AR 414 and wereused for 40Ar–39Ar dating.
6.1.2. Metasedimentary mylonite—samples AR 562–AR 684–AR 935–AR 86Several samples of pelitic mylonites and synkinematic leucogranite
veins parallel to the foliation have been collected. Synkinematic
Please cite this article as: Petitgirard, S., et al., Conflicting structural andEffect of protracted “hot” orogeny and slow cooling rate? Tectonophysi
leucocratic veins free of solid-state deformation have been sampledfor U–Pb dating at two localities:
‐ AR 684 outcrops at about 3 km from the Ibituruna quartz-syenite.It displays a strong layering of leucocratic veins transposed in thegently dipping foliation of a dark metasedimentary rock.
‐ AR 935 is located at the contact between the quartz-syenite andthe metasedimentary mylonites in which leucocratic veins,frequently boudinaged are embedded.
In addition pelitic mylonites have been sampled at two sites foramphibole and/or biotite 40Ar–39Ar dating:
‐ AR 86 is a garnet-rich, kinzigitic lens in the pelitic mylonites about4 km NE of the Ibituruna massif. Both the kinzigite and thesurrounding pelitic mylonite contain many cm- to m-scaleleucocratic veins. This sample was also used for P–T estimates.
‐ AR 562 was collected in a quarry located ~6.5 km NW from theIbituruna quartz-syenite. This outcrop displays amphibole-richlayers within the biotite–garnet–sillimanite–quartz–feldsparmylonite. Layers containing amphibole have been sampled.
6.1.3. Derribadinha tonalite—samples AR 264 and AR 590These two samples have been collected in two quarries located
~2 km and 3.5 km southwest of the Ibituruna massif. The outcropsdisplay various rock types affected by an eastward gently dippingfoliation. The dominant type is a grey, medium-grained tonalite(plagioclase–biotite–hornblende–quartz). Large parts of this tonalitehave retained evidence of magmatic texture (interstitial quartz, tabularbiotite, large hornblende crystals with complex shapes, zoned plagio-clases) free of solid-state deformation features. The magmatic biotiteand amphibole crystals are oriented and define a magmatic foliation. Inmany places, the tonalitic protoliths was injected by large volumes ofleucocratic granite that may form a layering with remnants of tonalite.This layering is locally folded and contains asymmetrical lenses of more
geochronological data from the Ibituruna quartz-syenite (SE Brazil):cs (2009), doi:10.1016/j.tecto.2009.02.039

Fig. 12. AARMmeasurements. (A) Lambert equal area diagram showing the direction ofthe imparted anhysteritic remanent magnetization referred to the sample axes. Thecylinder axis (z) of the specimen is projected at the center of the diagram. Numbersindicate the sequence used in this study in order to orientate the sample at 90° from itslast position (except between positions 5 and 6 and positions 7 and 8). (B) AARM andAMS results for two samples from the major and the minor groups defined on Fig. 10.The similarity of these results suggests that the susceptibility fabric is dominated by theferromagnetic fraction.
10 S. Petitgirard et al. / Tectonophysics xxx (2009) xxx–xxx
ARTICLE IN PRESS
maficmaterial suggesting a top-to-the-west sense of shear. This layeringis parallel to the magmatic foliation in the tonalitic domains. We havesampled both the tonalite and the synkinematic leucocratic layers.
6.2. Analytical techniques
Large rock samples were roughly ground using a mechanicalcrusher. Pure and large amphibole and biotite crystals were selectedand handpicked from one part of the residual powder. The remainingwas finely ground and filtered to save minerals of the desired size(100–200 µm).
6.2.1. U–Pb–Th determinationTranslucent, inclusion-free zircon and monazite grains were
carefully hand-picked in alcohol from the least magnetic concentrates
Please cite this article as: Petitgirard, S., et al., Conflicting structural andEffect of protracted “hot” orogeny and slow cooling rate? Tectonophysi
(6° tilt and 1° tilt at full amperage for monazite and zircons,respectively) under a binocular microscope. Minerals were thenembedded in epoxy resin with chips of reference materials, groundand polished to expose internal structure. They were subsequentlyobserved by back-scattered electron (BSE) imaging (SEM, Universityof Montpellier, France). The sample mounts were later used for laserablation U–Th–Pb microanalyses. Laser ablation ICP-MS analyses werecarried out at Geosciences Montpellier (University of Montpellier,France) using a Lambda Physik COMPex 102 excimer laser generating15 ns duration pulses of radiation at a wavelength of 193 nm. Foranalyses, the laser was coupled to a VG Plasmaquad II ICP-MS, andanalytical procedures followed those outlined in Bruguier et al. (2001)and given in earlier reports (e.g., Hammor et al., 2006; Neves et al.,2006; Dhuime et al., 2007) except that measurements were carriedout in a He atmosphere which enhances sensitivity and reduces inter-element fractionation (Günther and Heinrich, 1999). Unknowns werebracketed by measurements of the G91500 (Wiedenbeck et al., 1995)andManangotry (Poitrasson et al., 2000) reference material for zirconand monazite respectively as external standards. A sequentialmeasurement of unknowns and standards was used in a ratio of 3:1.Gas blank before each measurement was averaged and subtracted tothe measured signals. The contribution of common Pb to the analyseswas evaluated by measuring the 204Pb. However, detection of the lowabundance 204Pb is hampered by the isobaric interference of 204Hg.Thus, after measurement of the 202Hg and correction of mercuryinterference, analyses yielding positive 204Pb counts were rejectedand Table 2 only reports analyses where no common Pb was detected.Errors measured on the standards were added in quadrature to thosemeasured on the unknown grains. This typically resulted in 1 to 3%precision (1s RSD%) after all corrections have been made. Agecalculations were made using the Isoplot program (Ludwig, 2000)and are quoted at the 2σ level. Analyses of sample AR935 wereperformed in the same way, but using an Element XR ICP-MS whichhas a ca. ten fold sensitivity compared to the VG Plasmaquad II. Theseanalyses were characterized by very high intensities on the 238Usignals of unknown samples (but not on the G91500 referencematerial which contains only 80 ppm of U). As a result, the detector(allowed to work in the triple mode Pulse counting/Analogue/Faraday) switched to the Analogue mode. This resulted in a bias of the206Pb/238U ratio calibration and a reversely discordant position of theunknown samples. As discussed below, for this sample we thusconsider only the 207Pb/206Pb ratios.
In the case of the Ibituruna syenite, LA-ICP-MS analyses werecomplemented by SHRIMP spot analyses. U–Th–Pb analyses werecarried out on samples from AR 412 site together with chips of thereference zircons TEMORA using a SHRIMP II at the Research School ofEarth Sciences, The Australian National University, Canberra, Australia.SHRIMP analytical method follows Williams (1998). Each analysisconsisted of 7 scans through the mass range, with the TEMORAreference grains analyzed for every three unknown analyses. Datawere processed using SQUID and Isoplot/EX (Ludwig, 2000);uncertainties given for individual analyses are at the 1σ level. Ageuncertainty is given at 95% confidence level.
6.2.2. 40Ar–39Ar techniques descriptionAmphiboles and biotites were irradiated in aluminum packages at
the McMaster reactor, Ontario for 40 h. For single grain analyses,minerals were stepwise degassed using a CO2 laser probe running in thecontinuous mode with a power range from 0 to 50 W. A MAP 215-50noble gasmass spectrometer was used to collect argon isotopes (36Ar to40Ar) during 12 runs. For bulk sample analyses, the irradiated mineralswere loaded into a double vacuum Staudacher type furnace. Each stepincludes 20 min of heating and 5 min of cleaning on Al–Zr getters andcold traps and 12min ofmeasurement on a VG3600mass spectrometer.
For each step using both single grain and bulk sample, classicalisotope corrections including blanks, mass discrimination radioactive
geochronological data from the Ibituruna quartz-syenite (SE Brazil):cs (2009), doi:10.1016/j.tecto.2009.02.039
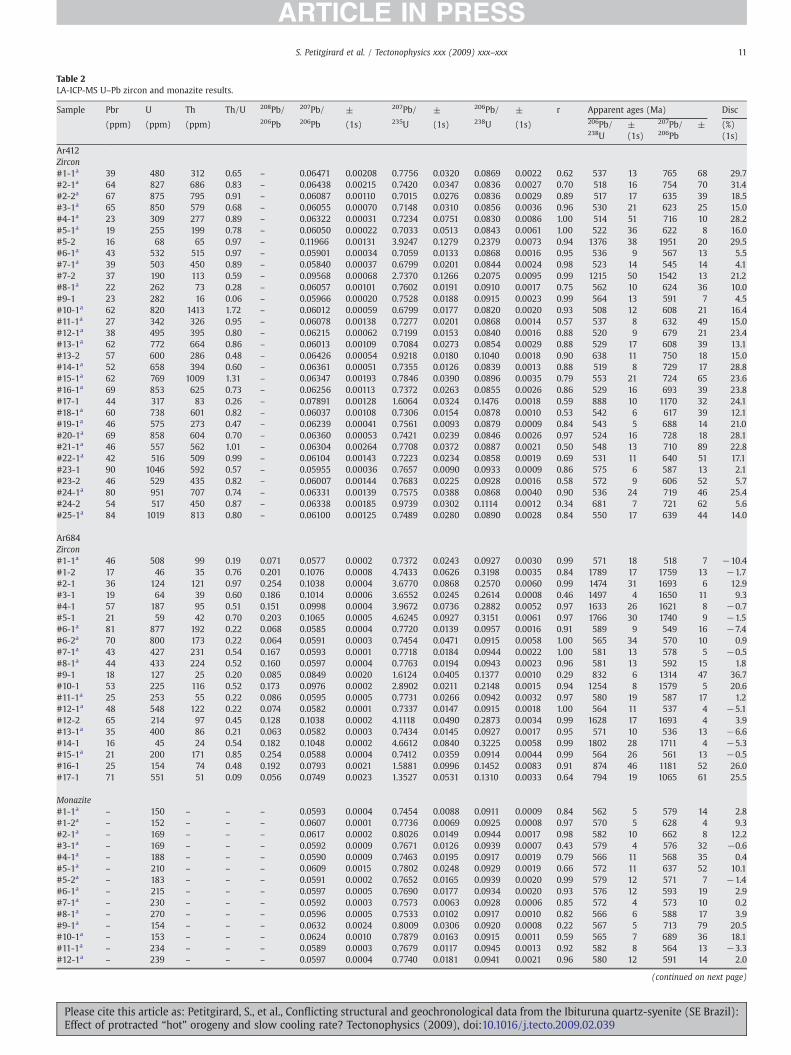
Table 2LA-ICP-MS U–Pb zircon and monazite results.
Sample Pbr U Th Th/U 208Pb/ 207Pb/ ± 207Pb/ ± 206Pb/ ± r Apparent ages (Ma) Disc
(ppm) (ppm) (ppm) 206Pb 206Pb (1s) 235U (1s) 238U (1s) 206Pb/ ± 207Pb/ ± (%)238U (1s) 206Pb (1s)
Ar412Zircon#1-1a 39 480 312 0.65 – 0.06471 0.00208 0.7756 0.0320 0.0869 0.0022 0.62 537 13 765 68 29.7#2-1a 64 827 686 0.83 – 0.06438 0.00215 0.7420 0.0347 0.0836 0.0027 0.70 518 16 754 70 31.4#2-2a 67 875 795 0.91 – 0.06087 0.00110 0.7015 0.0276 0.0836 0.0029 0.89 517 17 635 39 18.5#3-1a 65 850 579 0.68 – 0.06055 0.00070 0.7148 0.0310 0.0856 0.0036 0.96 530 21 623 25 15.0#4-1a 23 309 277 0.89 – 0.06322 0.00031 0.7234 0.0751 0.0830 0.0086 1.00 514 51 716 10 28.2#5-1a 19 255 199 0.78 – 0.06050 0.00022 0.7033 0.0513 0.0843 0.0061 1.00 522 36 622 8 16.0#5-2 16 68 65 0.97 – 0.11966 0.00131 3.9247 0.1279 0.2379 0.0073 0.94 1376 38 1951 20 29.5#6-1a 43 532 515 0.97 – 0.05901 0.00034 0.7059 0.0133 0.0868 0.0016 0.95 536 9 567 13 5.5#7-1a 39 503 450 0.89 – 0.05840 0.00037 0.6799 0.0201 0.0844 0.0024 0.98 523 14 545 14 4.1#7-2 37 190 113 0.59 – 0.09568 0.00068 2.7370 0.1266 0.2075 0.0095 0.99 1215 50 1542 13 21.2#8-1a 22 262 73 0.28 – 0.06057 0.00101 0.7602 0.0191 0.0910 0.0017 0.75 562 10 624 36 10.0#9-1 23 282 16 0.06 – 0.05966 0.00020 0.7528 0.0188 0.0915 0.0023 0.99 564 13 591 7 4.5#10-1a 62 820 1413 1.72 – 0.06012 0.00059 0.6799 0.0177 0.0820 0.0020 0.93 508 12 608 21 16.4#11-1a 27 342 326 0.95 – 0.06078 0.00138 0.7277 0.0201 0.0868 0.0014 0.57 537 8 632 49 15.0#12-1a 38 495 395 0.80 – 0.06215 0.00062 0.7199 0.0153 0.0840 0.0016 0.88 520 9 679 21 23.4#13-1a 62 772 664 0.86 – 0.06013 0.00109 0.7084 0.0273 0.0854 0.0029 0.88 529 17 608 39 13.1#13-2 57 600 286 0.48 – 0.06426 0.00054 0.9218 0.0180 0.1040 0.0018 0.90 638 11 750 18 15.0#14-1a 52 658 394 0.60 – 0.06361 0.00051 0.7355 0.0126 0.0839 0.0013 0.88 519 8 729 17 28.8#15-1a 62 769 1009 1.31 – 0.06347 0.00193 0.7846 0.0390 0.0896 0.0035 0.79 553 21 724 65 23.6#16-1a 69 853 625 0.73 – 0.06256 0.00113 0.7372 0.0263 0.0855 0.0026 0.86 529 16 693 39 23.8#17-1 44 317 83 0.26 – 0.07891 0.00128 1.6064 0.0324 0.1476 0.0018 0.59 888 10 1170 32 24.1#18-1a 60 738 601 0.82 – 0.06037 0.00108 0.7306 0.0154 0.0878 0.0010 0.53 542 6 617 39 12.1#19-1a 46 575 273 0.47 – 0.06239 0.00041 0.7561 0.0093 0.0879 0.0009 0.84 543 5 688 14 21.0#20-1a 69 858 604 0.70 – 0.06360 0.00053 0.7421 0.0239 0.0846 0.0026 0.97 524 16 728 18 28.1#21-1a 46 557 562 1.01 – 0.06304 0.00264 0.7708 0.0372 0.0887 0.0021 0.50 548 13 710 89 22.8#22-1a 42 516 509 0.99 – 0.06104 0.00143 0.7223 0.0234 0.0858 0.0019 0.69 531 11 640 51 17.1#23-1 90 1046 592 0.57 – 0.05955 0.00036 0.7657 0.0090 0.0933 0.0009 0.86 575 6 587 13 2.1#23-2 46 529 435 0.82 – 0.06007 0.00144 0.7683 0.0225 0.0928 0.0016 0.58 572 9 606 52 5.7#24-1a 80 951 707 0.74 – 0.06331 0.00139 0.7575 0.0388 0.0868 0.0040 0.90 536 24 719 46 25.4#24-2 54 517 450 0.87 – 0.06338 0.00185 0.9739 0.0302 0.1114 0.0012 0.34 681 7 721 62 5.6#25-1a 84 1019 813 0.80 – 0.06100 0.00125 0.7489 0.0280 0.0890 0.0028 0.84 550 17 639 44 14.0
Ar684Zircon#1-1a 46 508 99 0.19 0.071 0.0577 0.0002 0.7372 0.0243 0.0927 0.0030 0.99 571 18 518 7 −10.4#1-2 17 46 35 0.76 0.201 0.1076 0.0008 4.7433 0.0626 0.3198 0.0035 0.84 1789 17 1759 13 −1.7#2-1 36 124 121 0.97 0.254 0.1038 0.0004 3.6770 0.0868 0.2570 0.0060 0.99 1474 31 1693 6 12.9#3-1 19 64 39 0.60 0.186 0.1014 0.0006 3.6552 0.0245 0.2614 0.0008 0.46 1497 4 1650 11 9.3#4-1 57 187 95 0.51 0.151 0.0998 0.0004 3.9672 0.0736 0.2882 0.0052 0.97 1633 26 1621 8 −0.7#5-1 21 59 42 0.70 0.203 0.1065 0.0005 4.6245 0.0927 0.3151 0.0061 0.97 1766 30 1740 9 −1.5#6-1a 81 877 192 0.22 0.068 0.0585 0.0004 0.7720 0.0139 0.0957 0.0016 0.91 589 9 549 16 −7.4#6-2a 70 800 173 0.22 0.064 0.0591 0.0003 0.7454 0.0471 0.0915 0.0058 1.00 565 34 570 10 0.9#7-1a 43 427 231 0.54 0.167 0.0593 0.0001 0.7718 0.0184 0.0944 0.0022 1.00 581 13 578 5 −0.5#8-1a 44 433 224 0.52 0.160 0.0597 0.0004 0.7763 0.0194 0.0943 0.0023 0.96 581 13 592 15 1.8#9-1 18 127 25 0.20 0.085 0.0849 0.0020 1.6124 0.0405 0.1377 0.0010 0.29 832 6 1314 47 36.7#10-1 53 225 116 0.52 0.173 0.0976 0.0002 2.8902 0.0211 0.2148 0.0015 0.94 1254 8 1579 5 20.6#11-1a 25 253 55 0.22 0.086 0.0595 0.0005 0.7731 0.0266 0.0942 0.0032 0.97 580 19 587 17 1.2#12-1a 48 548 122 0.22 0.074 0.0582 0.0001 0.7337 0.0147 0.0915 0.0018 1.00 564 11 537 4 −5.1#12-2 65 214 97 0.45 0.128 0.1038 0.0002 4.1118 0.0490 0.2873 0.0034 0.99 1628 17 1693 4 3.9#13-1a 35 400 86 0.21 0.063 0.0582 0.0003 0.7434 0.0145 0.0927 0.0017 0.95 571 10 536 13 −6.6#14-1 16 45 24 0.54 0.182 0.1048 0.0002 4.6612 0.0840 0.3225 0.0058 0.99 1802 28 1711 4 −5.3#15-1a 21 200 171 0.85 0.254 0.0588 0.0004 0.7412 0.0359 0.0914 0.0044 0.99 564 26 561 13 −0.5#16-1 25 154 74 0.48 0.192 0.0793 0.0021 1.5881 0.0996 0.1452 0.0083 0.91 874 46 1181 52 26.0#17-1 71 551 51 0.09 0.056 0.0749 0.0023 1.3527 0.0531 0.1310 0.0033 0.64 794 19 1065 61 25.5
Monazite#1-1a – 150 – – – 0.0593 0.0004 0.7454 0.0088 0.0911 0.0009 0.84 562 5 579 14 2.8#1-2a – 152 – – – 0.0607 0.0001 0.7736 0.0069 0.0925 0.0008 0.97 570 5 628 4 9.3#2-1a – 169 – – – 0.0617 0.0002 0.8026 0.0149 0.0944 0.0017 0.98 582 10 662 8 12.2#3-1a – 169 – – – 0.0592 0.0009 0.7671 0.0126 0.0939 0.0007 0.43 579 4 576 32 −0.6#4-1a – 188 – – – 0.0590 0.0009 0.7463 0.0195 0.0917 0.0019 0.79 566 11 568 35 0.4#5-1a – 210 – – – 0.0609 0.0015 0.7802 0.0248 0.0929 0.0019 0.66 572 11 637 52 10.1#5-2a – 183 – – – 0.0591 0.0002 0.7652 0.0165 0.0939 0.0020 0.99 579 12 571 7 −1.4#6-1a – 215 – – – 0.0597 0.0005 0.7690 0.0177 0.0934 0.0020 0.93 576 12 593 19 2.9#7-1a – 230 – – – 0.0592 0.0003 0.7573 0.0063 0.0928 0.0006 0.85 572 4 573 10 0.2#8-1a – 270 – – – 0.0596 0.0005 0.7533 0.0102 0.0917 0.0010 0.82 566 6 588 17 3.9#9-1a – 154 – – – 0.0632 0.0024 0.8009 0.0306 0.0920 0.0008 0.22 567 5 713 79 20.5#10-1a – 153 – – – 0.0624 0.0010 0.7879 0.0163 0.0915 0.0011 0.59 565 7 689 36 18.1#11-1a – 234 – – – 0.0589 0.0003 0.7679 0.0117 0.0945 0.0013 0.92 582 8 564 13 −3.3#12-1a – 239 – – – 0.0597 0.0004 0.7740 0.0181 0.0941 0.0021 0.96 580 12 591 14 2.0
(continued on next page)
11S. Petitgirard et al. / Tectonophysics xxx (2009) xxx–xxx
ARTICLE IN PRESS
Please cite this article as: Petitgirard, S., et al., Conflicting structural and geochronological data from the Ibituruna quartz-syenite (SE Brazil):Effect of protracted “hot” orogeny and slow cooling rate? Tectonophysics (2009), doi:10.1016/j.tecto.2009.02.039
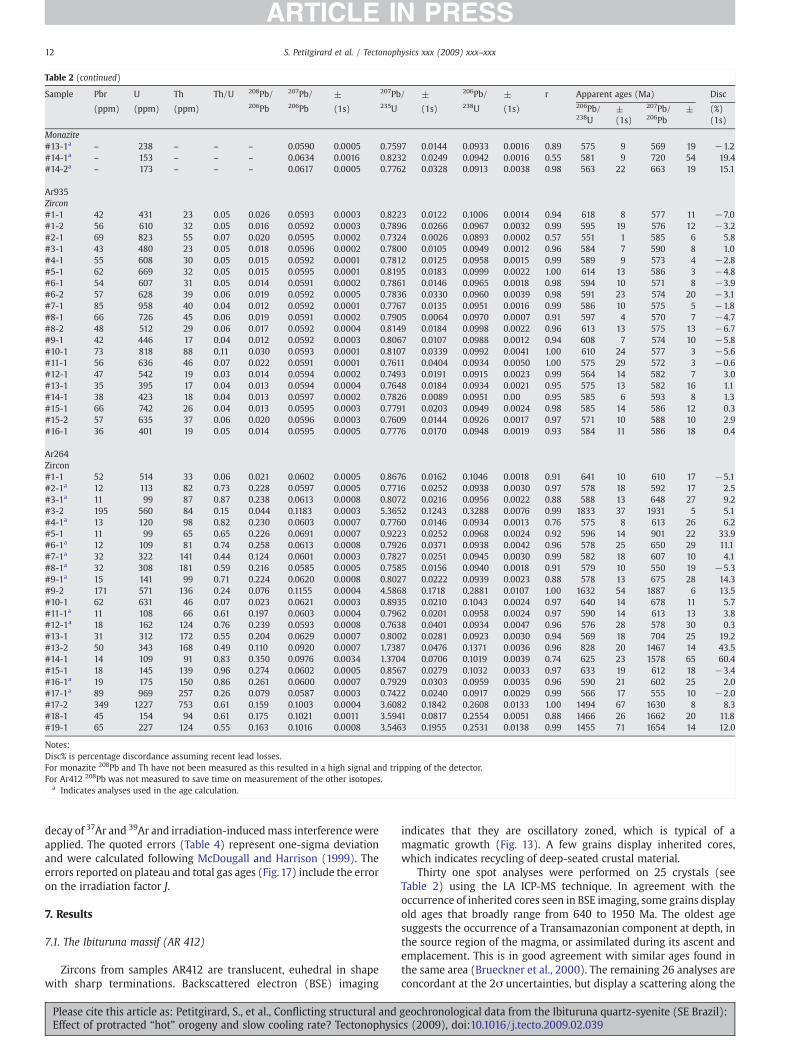
Table 2 (continued)
Sample Pbr U Th Th/U 208Pb/ 207Pb/ ± 207Pb/ ± 206Pb/ ± r Apparent ages (Ma) Disc
(ppm) (ppm) (ppm) 206Pb 206Pb (1s) 235U (1s) 238U (1s) 206Pb/ ± 207Pb/ ± (%)238U (1s) 206Pb (1s)
Monazite#13-1a – 238 – – – 0.0590 0.0005 0.7597 0.0144 0.0933 0.0016 0.89 575 9 569 19 −1.2#14-1a – 153 – – – 0.0634 0.0016 0.8232 0.0249 0.0942 0.0016 0.55 581 9 720 54 19.4#14-2a – 173 – – – 0.0617 0.0005 0.7762 0.0328 0.0913 0.0038 0.98 563 22 663 19 15.1
Ar935Zircon#1-1 42 431 23 0.05 0.026 0.0593 0.0003 0.8223 0.0122 0.1006 0.0014 0.94 618 8 577 11 −7.0#1-2 56 610 32 0.05 0.016 0.0592 0.0003 0.7896 0.0266 0.0967 0.0032 0.99 595 19 576 12 −3.2#2-1 69 823 55 0.07 0.020 0.0595 0.0002 0.7324 0.0026 0.0893 0.0002 0.57 551 1 585 6 5.8#3-1 43 480 23 0.05 0.018 0.0596 0.0002 0.7800 0.0105 0.0949 0.0012 0.96 584 7 590 8 1.0#4-1 55 608 30 0.05 0.015 0.0592 0.0001 0.7812 0.0125 0.0958 0.0015 0.99 589 9 573 4 −2.8#5-1 62 669 32 0.05 0.015 0.0595 0.0001 0.8195 0.0183 0.0999 0.0022 1.00 614 13 586 3 −4.8#6-1 54 607 31 0.05 0.014 0.0591 0.0002 0.7861 0.0146 0.0965 0.0018 0.98 594 10 571 8 −3.9#6-2 57 628 39 0.06 0.019 0.0592 0.0005 0.7836 0.0330 0.0960 0.0039 0.98 591 23 574 20 −3.1#7-1 85 958 40 0.04 0.012 0.0592 0.0001 0.7767 0.0135 0.0951 0.0016 0.99 586 10 575 5 −1.8#8-1 66 726 45 0.06 0.019 0.0591 0.0002 0.7905 0.0064 0.0970 0.0007 0.91 597 4 570 7 −4.7#8-2 48 512 29 0.06 0.017 0.0592 0.0004 0.8149 0.0184 0.0998 0.0022 0.96 613 13 575 13 −6.7#9-1 42 446 17 0.04 0.012 0.0592 0.0003 0.8067 0.0107 0.0988 0.0012 0.94 608 7 574 10 −5.8#10-1 73 818 88 0.11 0.030 0.0593 0.0001 0.8107 0.0339 0.0992 0.0041 1.00 610 24 577 3 −5.6#11-1 56 636 46 0.07 0.022 0.0591 0.0001 0.7611 0.0404 0.0934 0.0050 1.00 575 29 572 3 −0.6#12-1 47 542 19 0.03 0.014 0.0594 0.0002 0.7493 0.0191 0.0915 0.0023 0.99 564 14 582 7 3.0#13-1 35 395 17 0.04 0.013 0.0594 0.0004 0.7648 0.0184 0.0934 0.0021 0.95 575 13 582 16 1.1#14-1 38 423 18 0.04 0.013 0.0597 0.0002 0.7826 0.0089 0.0951 0.00 0.95 585 6 593 8 1.3#15-1 66 742 26 0.04 0.013 0.0595 0.0003 0.7791 0.0203 0.0949 0.0024 0.98 585 14 586 12 0.3#15-2 57 635 37 0.06 0.020 0.0596 0.0003 0.7609 0.0144 0.0926 0.0017 0.97 571 10 588 10 2.9#16-1 36 401 19 0.05 0.014 0.0595 0.0005 0.7776 0.0170 0.0948 0.0019 0.93 584 11 586 18 0.4
Ar264Zircon#1-1 52 514 33 0.06 0.021 0.0602 0.0005 0.8676 0.0162 0.1046 0.0018 0.91 641 10 610 17 −5.1#2-1a 12 113 82 0.73 0.228 0.0597 0.0005 0.7716 0.0252 0.0938 0.0030 0.97 578 18 592 17 2.5#3-1a 11 99 87 0.87 0.238 0.0613 0.0008 0.8072 0.0216 0.0956 0.0022 0.88 588 13 648 27 9.2#3-2 195 560 84 0.15 0.044 0.1183 0.0003 5.3652 0.1243 0.3288 0.0076 0.99 1833 37 1931 5 5.1#4-1a 13 120 98 0.82 0.230 0.0603 0.0007 0.7760 0.0146 0.0934 0.0013 0.76 575 8 613 26 6.2#5-1 11 99 65 0.65 0.226 0.0691 0.0007 0.9223 0.0252 0.0968 0.0024 0.92 596 14 901 22 33.9#6-1a 12 109 81 0.74 0.258 0.0613 0.0008 0.7926 0.0371 0.0938 0.0042 0.96 578 25 650 29 11.1#7-1a 32 322 141 0.44 0.124 0.0601 0.0003 0.7827 0.0251 0.0945 0.0030 0.99 582 18 607 10 4.1#8-1a 32 308 181 0.59 0.216 0.0585 0.0005 0.7585 0.0156 0.0940 0.0018 0.91 579 10 550 19 −5.3#9-1a 15 141 99 0.71 0.224 0.0620 0.0008 0.8027 0.0222 0.0939 0.0023 0.88 578 13 675 28 14.3#9-2 171 571 136 0.24 0.076 0.1155 0.0004 4.5868 0.1718 0.2881 0.0107 1.00 1632 54 1887 6 13.5#10-1 62 631 46 0.07 0.023 0.0621 0.0003 0.8935 0.0210 0.1043 0.0024 0.97 640 14 678 11 5.7#11-1a 11 108 66 0.61 0.197 0.0603 0.0004 0.7962 0.0201 0.0958 0.0024 0.97 590 14 613 13 3.8#12-1a 18 162 124 0.76 0.239 0.0593 0.0008 0.7638 0.0401 0.0934 0.0047 0.96 576 28 578 30 0.3#13-1 31 312 172 0.55 0.204 0.0629 0.0007 0.8002 0.0281 0.0923 0.0030 0.94 569 18 704 25 19.2#13-2 50 343 168 0.49 0.110 0.0920 0.0007 1.7387 0.0476 0.1371 0.0036 0.96 828 20 1467 14 43.5#14-1 14 109 91 0.83 0.350 0.0976 0.0034 1.3704 0.0706 0.1019 0.0039 0.74 625 23 1578 65 60.4#15-1 18 145 139 0.96 0.274 0.0602 0.0005 0.8567 0.0279 0.1032 0.0033 0.97 633 19 612 18 −3.4#16-1a 19 175 150 0.86 0.261 0.0600 0.0007 0.7929 0.0303 0.0959 0.0035 0.96 590 21 602 25 2.0#17-1a 89 969 257 0.26 0.079 0.0587 0.0003 0.7422 0.0240 0.0917 0.0029 0.99 566 17 555 10 −2.0#17-2 349 1227 753 0.61 0.159 0.1003 0.0004 3.6082 0.1842 0.2608 0.0133 1.00 1494 67 1630 8 8.3#18-1 45 154 94 0.61 0.175 0.1021 0.0011 3.5941 0.0817 0.2554 0.0051 0.88 1466 26 1662 20 11.8#19-1 65 227 124 0.55 0.163 0.1016 0.0008 3.5463 0.1955 0.2531 0.0138 0.99 1455 71 1654 14 12.0
Notes:Disc% is percentage discordance assuming recent lead losses.For monazite 208Pb and Th have not been measured as this resulted in a high signal and tripping of the detector.For Ar412 208Pb was not measured to save time on measurement of the other isotopes.
a Indicates analyses used in the age calculation.
12 S. Petitgirard et al. / Tectonophysics xxx (2009) xxx–xxx
ARTICLE IN PRESS
decay of 37Ar and 39Ar and irradiation-inducedmass interferencewereapplied. The quoted errors (Table 4) represent one-sigma deviationand were calculated following McDougall and Harrison (1999). Theerrors reported on plateau and total gas ages (Fig.17) include the erroron the irradiation factor J.
7. Results
7.1. The Ibituruna massif (AR 412)
Zircons from samples AR412 are translucent, euhedral in shapewith sharp terminations. Backscattered electron (BSE) imaging
Please cite this article as: Petitgirard, S., et al., Conflicting structural andEffect of protracted “hot” orogeny and slow cooling rate? Tectonophysi
indicates that they are oscillatory zoned, which is typical of amagmatic growth (Fig. 13). A few grains display inherited cores,which indicates recycling of deep-seated crustal material.
Thirty one spot analyses were performed on 25 crystals (seeTable 2) using the LA ICP-MS technique. In agreement with theoccurrence of inherited cores seen in BSE imaging, some grains displayold ages that broadly range from 640 to 1950 Ma. The oldest agesuggests the occurrence of a Transamazonian component at depth, inthe source region of the magma, or assimilated during its ascent andemplacement. This is in good agreement with similar ages found inthe same area (Brueckner et al., 2000). The remaining 26 analyses areconcordant at the 2σ uncertainties, but display a scattering along the
geochronological data from the Ibituruna quartz-syenite (SE Brazil):cs (2009), doi:10.1016/j.tecto.2009.02.039

Fig. 13. Scanning Electron Microscope BSE images of some analyzed zircons from the three main domains: the Ibituruna quartz-syenite AR412, the mylonitic unit (leucocratic veinsAR684), and the Derribadinha tonalite AR264. Some crystals display an internal structure that represents either inherited cores or overgrowths at the boundary of the grains.
13S. Petitgirard et al. / Tectonophysics xxx (2009) xxx–xxx
ARTICLE IN PRESS
Concordia (Fig. 14A), from 508±12 Ma (1s) to 575±6 Ma (1s). It istentatively proposed that this is related either to various degree ofinheritance in the analyzed grains or to recent Pb losses or acombination of both. A close examination of the data (see Table 2)indicates that within this batch of analyses, grain #9-1 has a very lowTh/U ratio of 0.06. Such Th/U ratio is usually attributed tometamorphic zircon (e.g. Williams and Claesson, 1987) and stronglycontrasts with those from all other analyzed grains (≥0.28). We thussuggest that this grain is inherited from metamorphic country-rocksand consequently older grains are considered as xenocrysts. Thisconcerns only one grain concordant at c. 570–575 Ma (analyses #23-1and #23-2 see Table 2). As we will see below, this age rangecorresponds to the main metamorphic event. The remaining 23analyses yield a 206Pb/238U weighted mean age of 534±5 Ma(MSWD=1.1) interpreted as our best estimate for emplacementand crystallization of the syenitic magma. Since this interpretationis clearly dependent on whether the age calculation includes aremaining proportion of inherited grains, zircons from this samplewere analyzed by SHRIMP,which, due to a drilling rate (ca. 0.5–1mm/h)lower than laser ablation (ca. 0.5–1 mm/s), is more suited foranalyzing complex grains. Twenty-one spots were performed bySHRIMP on 19 grains (Table 3). Among them, #1-1 and #3-1 areconcordant at 585±8 Ma (1s) and 606±6 Ma (1s), respectively,and are interpreted as inherited grains. The remaining eighteenanalyses define a single age grouping with concordant analyses(Fig. 14B). These analyses yield a 206Pb/238U weighted mean of529.9±1.3 Ma (MSWD=0.1), which is in very good agreementwith the LA-ICP-MS age and reinforces our conclusion that theIbituruna syenite was emplaced at ca. 530 Ma.
40Ar–39Ar measurements (Table 4) performed on one biotite fromsite AR 414 are reported on Fig.14D. Corresponding age spectra display
Please cite this article as: Petitgirard, S., et al., Conflicting structural andEffect of protracted “hot” orogeny and slow cooling rate? Tectonophysi
evidence of isotopic disturbance related to the presence of secondaryphases such as chlorite in biotite. Amphibole bulk separate AR414 hasa discordant age spectrumwith ages increasing more or less regularlyfrom 470 to 511 Mawith a concomitant increase of the Ca/K ratios. Itstotal gas age of 495.4±4.3 Ma and the general shape of the spectrum,however, suggest that the cooling history of this amphibole is likelysimilar to amphiboles from the metasedimentary mylonites (seebelow).
7.2. The mylonitic unit (AR 684 and AR 935)
Zircons from both sites (AR684, AR935) are elongate, euhedral anddisplay faint oscillatory zoning consistent with crystallization from amelt. Inherited cores are a common feature (e.g., Fig. 15A,B). Twentyanalyses were performed on 17 zircon grains from the leucocratic veinAR684 (Table 2). Some analyses clearly display inheritance (Table 2,Fig. 15B) with ages of ca. 1620 Ma (# 4-1) and in the range 1700–1760for concordant analyses (#1–2, 5-1 and 12-2). Since this leucocraticvein intrudes metasediments, these ages may not necessarily beattributed to crustal components at depth (i.e. basement ages), butmay be derived from detrital zircons. Such ages have been reported inthe eastern part of the Ribeira-Araçuaí Belt (Brueckner et al., 2000).These analyses set apart; the nine remaining analyses yield muchyounger ages and plot close to Concordia (Fig. 15A,C). They define aweighted mean 206Pb/238U age of 577±9 Ma (MSWD=0.5) inter-preted as dating the episode of partial melting undergone by thecountry-rocks and formation of the leucocratic vein. It is noteworthythat most zircons in this batch of analyses have low Th/U ratio (b0.1)suggesting that this character may be due to crystallization in a smallmelt volume, coeval with monazite which strongly favors Th in itscrystalline lattice, as suggested by Harley et al. (2007). Monazites
geochronological data from the Ibituruna quartz-syenite (SE Brazil):cs (2009), doi:10.1016/j.tecto.2009.02.039

Fig. 14. Zircon U–Pb ages and amphibole 40Ar/39Ar age of sample AR412 from the Ibituruna quartz-syenite. (A) and (B) LA-ICP-MS data, (C) SHRIMP data, (D) 40Ar/39Ar laser probeage spectrum of an amphibole. Values in red have been discarded. (For interpretation of the references to colour in this figure legend, the reader is referred to the web version of thisarticle.)
14 S. Petitgirard et al. / Tectonophysics xxx (2009) xxx–xxx
ARTICLE IN PRESS
were also extracted from this sample and since they are less prone toinheritance than zircon, they were also investigated for U–Pb dating.Seventeen analyses (Table 2, Fig. 15D) were performed on fourteenmonazites and yield a 206Pb/238U weighted mean age of 572±3 Ma(MSWD=0.5), slightly younger, but undistinguishable from thezircon age. Altogether, zircon and monazite from this location pointto a partial melting event occurring in the range 570–580 Ma, i.e., 40–50 My before emplacement of the Ibituruna sill. Since this sample waslocated about 3 km away from the Ibituruna massif, we alsoinvestigated another leucocratic vein, sampled at the contact withthe syenite (AR935). All zircon grains analyzed provided reverselydiscordant analyses; this was attributed to switching of the detectorfrom pulse counting to analogue mode (see analytical technique). Wethus consider that the 206Pb/238U ages are biased and, in this case, weonly rely on the 207Pb/206Pb ages. All analyzed grains haveundistinguishable apparent 207Pb/206Pb ratios and define a weightedmean age of 578±3Ma age (MSWD=1.3; Fig.16), in close agreementwith the zircon age from sample AR684. Interestingly, zircons fromthis vein also yield very low Th/U ratios (see Table 2), a feature thatmay be characteristic of zircons from migmatitic leucosome. Theseages are in good agreement with those found elsewhere in the
Please cite this article as: Petitgirard, S., et al., Conflicting structural andEffect of protracted “hot” orogeny and slow cooling rate? Tectonophysi
northern Ribeira-Aracuaí Belt. Brueckner et al. (2000), for exampleprovided garnet Sm/Nd ages of 563±19 Ma from a charnockiticgneiss of the Piedade unit and 589±9Ma from a garnet–biotite gneiss(~80 km SSW and 60 km S of the Ibituruna massif respectively). Silvaet al. (2005) also reported ages in the range 570–560 Ma for themetamorphic peak in the Araçuaí Belt. Moreover, the consistency ofresults obtained from samples collected at the contact of the syenite(AR 935) and far from it (AR684), shows that there is no noticeablevariation in the zircon U–Pb system due to thermal perturbationcaused by emplacement of the syenite.
The crystallization of HT minerals (zircons and monazites) in themylonitic unit occurred 40–50 Ma before emplacement and crystal-lization of the syenite. As for this latter one, evidence of an extendedhigh thermal gradient is abundant, interstitial quartz, annealedminerals and lack of substructures due to solid-state deformation inthose veins. This suggests that the crystallization occurred while themylonitic unit was still under HT.
A single amphibole grain from sample AR562 provides a plateauage of 501.3±4.8 Ma defined by 90% of the argon released andcorresponding to stable Ca/K ratios (Fig. 17A). Three biotites yieldplateau or pseudo-plateau ages that overlap at ~470Ma (Fig. 17B, C, D;
geochronological data from the Ibituruna quartz-syenite (SE Brazil):cs (2009), doi:10.1016/j.tecto.2009.02.039

Table 3Summary of SHRIMP U–Pb zircon results for sample AR412.
Total ratios Radiogenic ratios Age (Ma)
Grain. U Th Th/U 206Pb⁎ 204Pb/ f206238U/ ± 207Pb/ ± 206Pb/ ± 207Pb/ ± 207Pb/ ± ρ 206Pb/ ± 207Pb/ ± %
Spot (ppm) (ppm) (ppm) 206Pb % 206Pb 206Pb 238U 235U 206Pb 238U 206Pb Disc
1.1 58 65 1.13 4.8 0.000977 1.74 10.345 0.144 0.0778 0.0013 0.0950 0.0014 0.8337 0.0568 0.0637 0.0042 0.217 585 8 730 141 202.1 391 495 1.26 29.0 0.000150 0.27 11.613 0.124 0.0589 0.0004 0.0859 0.0009 0.6710 0.0132 0.0567 0.0009 0.546 531 5 478 36 −113.1 459 306 0.67 38.9 0.000054 0.10 10.134 0.107 0.0613 0.0004 0.0986 0.0010 0.8230 0.0112 0.0606 0.0005 0.779 606 6 623 18 34.1 283 307 1.09 20.3 0.002350 4.21 11.960 0.134 0.0899 0.0009 0.0801 0.0010 0.6142 0.0353 0.0556 0.0031 0.209 497 6 437 125 −145.1 523 639 1.22 38.5 0.000000 0.00 11.686 0.123 0.0588 0.0004 0.0856 0.0009 0.6935 0.0086 0.0588 0.0004 0.846 529 5 559 14 56.1 788 797 1.01 60.9 0.000888 1.58 11.115 0.116 0.0709 0.0008 0.0885 0.0009 0.7076 0.0168 0.0580 0.0012 0.443 547 6 528 47 −47.1 533 629 1.18 40.5 0.001772 3.17 11.299 0.119 0.0836 0.0015 0.0857 0.0010 0.6832 0.0346 0.0578 0.0029 0.220 530 6 523 108 −18.1 926 1020 1.10 71.0 0.003068 5.48 11.204 0.116 0.1036 0.0014 0.0844 0.0010 0.6871 0.0382 0.0591 0.0032 0.205 522 6 570 118 89.1 436 440 1.01 31.3 0.000184 0.33 11.973 0.128 0.0612 0.0005 0.0832 0.0009 0.6723 0.0113 0.0586 0.0008 0.637 515 5 551 28 610.1 641 765 1.19 46.4 0.000046 0.08 11.878 0.124 0.0584 0.0003 0.0841 0.0009 0.6702 0.0085 0.0578 0.0004 0.830 521 5 522 15 011.1 999 305 0.31 75.9 0.000014 0.02 11.303 0.116 0.0592 0.0003 0.0884 0.0009 0.7199 0.0083 0.0590 0.0003 0.890 546 5 568 11 412.1 906 1428 1.58 73.5 0.004895 8.74 10.596 0.109 0.1326 0.0081 0.0861 0.0013 0.7334 0.1379 0.0618 0.0116 0.081 533 8 666 401 2013.1 517 96 0.19 38.0 0.000024 0.04 11.674 0.135 0.0591 0.0004 0.0856 0.0010 0.6930 0.0097 0.0587 0.0005 0.828 530 6 556 17 513.2 232 280 1.21 17.0 0.000026 0.05 11.697 0.154 0.0588 0.0008 0.0854 0.0011 0.6883 0.0136 0.0584 0.0009 0.669 529 7 546 32 314.1 435 594 1.36 33.2 0.002714 4.85 11.269 0.121 0.0940 0.0033 0.0849 0.0013 0.6900 0.0852 0.0589 0.0066 0.736 525 8 565 246 715.1 930 211 0.23 70.3 0.000023 0.04 11.376 0.118 0.0587 0.0003 0.0879 0.0009 0.7075 0.0084 0.0584 0.0003 0.867 543 5 545 13 016.1 563 670 1.19 42.1 0.000995 1.78 11.485 0.121 0.0722 0.0010 0.0855 0.0009 0.6810 0.0200 0.0578 0.0016 0.366 529 5 520 60 −217.1 749 1116 1.49 54.9 0.000044 0.08 11.708 0.122 0.0582 0.0003 0.0853 0.0009 0.6775 0.0087 0.0576 0.0004 0.813 528 5 513 16 −319.1 728 163 0.22 53.7 0.000089 0.16 11.651 0.123 0.0589 0.0003 0.0857 0.0009 0.6804 0.0096 0.0576 0.0005 0.744 530 5 514 21 −320.1 715 421 0.59 52.7 0.000140 0.25 11.656 0.122 0.0595 0.0004 0.0856 0.0009 0.6783 0.0099 0.0575 0.0006 0.716 529 5 510 22 −421.1 774 467 0.60 58.9 0.000991 1.77 11.287 0.118 0.0716 0.0006 0.0870 0.0009 0.6860 0.0164 0.0572 0.0012 0.442 538 5 498 47 −822.1 559 451 0.81 41.6 0.000106 0.19 11.528 0.122 0.0588 0.0004 0.0866 0.0009 0.6838 0.0099 0.0573 0.0006 0.732 535 5 502 22 −723.1 912 1977 2.17 67.8 0.000091 0.16 11.551 0.120 0.0591 0.0003 0.0864 0.0009 0.6883 0.0089 0.0578 0.0005 0.799 534 5 521 17 −324.1 627 279 0.45 46.4 0.000065 0.12 11.618 0.122 0.0587 0.0004 0.0860 0.0009 0.6846 0.0097 0.0578 0.0005 0.743 532 5 520 21 −225.1 675 328 0.49 50.8 0.000853 1.52 11.403 0.119 0.0700 0.0010 0.0864 0.0009 0.6851 0.0184 0.0575 0.0014 0.394 534 5 512 54 −4
Notes: 1. Uncertainties given at the one σ level.2. Error in Temora reference zircon calibration was 0.59% for the analytical session.(not included in above errors but required when comparing 206Pb/238U data from different mounts).3. f206 % denotes the percentage of 206Pb that is common Pb.4. Correction for common Pb made using the measured 204Pb/206Pb ratio.5. For % Disc. 0% denotes a concordant analysis.
15S.Petitgirard
etal./
Tectonophysicsxxx
(2009)xxx–xxx
ARTICLE
INPRESS
Pleasecite
thisarticle
as:Petitgirard,S.,etal.,Con
flictingstructuraland
geochronologicaldatafrom
theIbituruna
quartz-syenite(SE
Brazil):Effect
ofprotracted
“hot”orogeny
andslow
coolingrate?
Tectonophysics(2009),doi:10.1016/j.tecto.2009.02.039

Table 440Ar/39Ar results for analyzed amphiboles and biotites.
Step 40/39 38/39 37/39 36/39 (E-3) F39Ar released %40⁎ 40⁎/39K Age Ma +- 1s.d. Ma
AR548 biotite1 44.377 0.181 0.00000 97.757 0.12 34.87 15.47 241.9 41.92 34.407 0.158 0.00000 8.000 4.84 93.08 32.03 469.1 2.03 32.339 0.149 0.00045 1.425 12.83 98.65 31.90 467.5 1.64 32.021 0.152 0.00000 1.075 16.20 98.96 31.69 464.7 2.05 31.990 0.153 0.00000 1.135 20.20 98.90 31.64 464.1 1.86 31.966 0.153 0.00000 0.783 24.75 99.23 31.72 465.1 0.87 32.205 0.153 0.00000 0.679 32.35 99.33 31.99 468.6 1.68 32.277 0.152 0.00000 1.154 38.08 98.90 31.92 467.7 1.39 32.576 0.157 0.00000 1.081 41.65 98.97 32.24 471.8 1.510 32.830 0.153 0.00044 2.860 44.41 97.38 31.97 468.4 2.311 32.144 0.151 0.00000 0.304 52.18 99.67 32.04 469.2 1.712 32.433 0.157 0.00000 0.693 61.46 99.32 32.21 471.5 1.313 32.185 0.154 0.00819 0.199 77.34 99.77 32.11 470.2 2.614 32.423 0.152 0.00000 0.426 100.00 99.56 32.28 472.4 0.7
AR562 amphibole1 126.640 0.990 8.23221 192.301 0.18 55.60 70.80 910.4 50.12 30.336 0.340 4.22452 0.003 0.29 99.95 30.72 452.2 28.53 34.141 0.189 4.60622 0.907 9.10 99.95 34.31 498.2 1.54 35.046 0.216 4.63489 2.645 37.04 98.72 34.70 503.3 1.85 34.143 0.193 4.22373 0.000 49.16 99.95 34.54 501.2 1.66 34.795 0.192 4.41112 2.799 72.89 98.53 34.38 499.2 1.67 34.599 0.158 4.11017 3.353 76.06 97.98 33.99 494.3 4.28 34.498 0.189 4.35333 1.012 98.14 99.95 34.61 502.1 2.39 35.000 0.191 4.46163 7.104 100.00 94.91 33.32 485.7 8.2
AR562 biotite J=0.0092721 37.691 0.191 0.00000 14.134 0.38 88.88 33.50 488.0 7.42 33.703 0.187 0.00000 4.873 15.49 95.68 32.25 471.9 3.93 34.364 0.193 0.04472 4.993 18.69 95.67 32.88 480.0 2.34 33.629 0.182 0.00953 2.152 23.99 98.06 32.98 481.3 2.15 33.240 0.182 0.01202 3.124 32.44 97.18 32.30 472.6 3.76 32.945 0.186 0.00813 1.059 39.30 99.00 32.62 476.7 2.27 32.483 0.177 0.00261 1.970 42.32 98.16 31.89 467.3 2.78 32.830 0.180 0.03078 2.998 46.90 97.26 31.93 467.9 2.79 33.321 0.181 0.02203 2.706 51.19 97.56 32.51 475.3 2.210 32.648 0.179 0.00000 3.305 54.91 96.96 31.66 464.3 2.011 32.752 0.181 0.00614 1.662 68.03 98.45 32.25 471.9 1.812 33.081 0.184 0.00409 1.206 100.00 98.88 32.71 477.9 2.3
T°C 40/39 38/39 37/39 36/39 (E-3) F39Ar released %40⁎ 40⁎/39K Age Ma +- 1s.d. Ma
AR86 biotite J=0.009272600 52.171 0.082 0.13465 141.536 0.05 19.81 10.34 165.3 30.0700 34.791 0.069 0.21909 88.276 0.15 25.00 8.70 140.0 11.1800 32.408 0.077 0.01555 19.804 1.32 81.88 26.54 397.1 1.6850 32.626 0.069 0.00000 6.867 5.61 93.72 30.58 450.6 0.5900 32.804 0.055 0.00214 3.308 20.47 96.96 31.81 466.5 0.4950 32.335 0.040 0.00270 0.571 39.48 99.42 32.15 470.9 0.31000 32.440 0.030 0.00867 1.139 48.64 98.90 32.08 470.0 0.31050 31.942 0.042 0.00199 1.007 63.18 99.01 31.62 464.1 0.31100 31.788 0.032 0.00091 0.408 84.77 99.56 31.65 464.5 0.21200 32.401 0.020 0.00069 0.573 98.53 99.42 32.21 471.7 0.21400 40.570 0.028 0.01120 31.238 100.00 77.20 31.32 460.2 0.9
AR412 amphibole700 51.133 0.085 0.2841 133.399 0.99 22.90 11.71 186.1 2.2800 44.631 0.074 0.1807 93.225 1.49 38.26 17.08 265.4 2.2900 41.129 0.048 0.0574 30.448 3.08 78.08 32.12 470.5 0.61000 34.864 0.040 0.0072 3.000 15.41 97.40 33.96 494.1 0.21050 33.716 0.053 0.1632 0.863 30.92 99.21 33.45 487.6 0.31100 34.722 0.115 0.9239 1.309 54.47 98.99 34.39 499.6 0.41100 34.715 0.189 1.8392 0.875 77.15 99.52 34.59 502.1 0.21150 35.299 0.218 2.2291 1.184 91.93 99.33 35.11 508.7 0.21150 35.967 0.224 2.5280 3.007 94.47 97.90 35.27 510.7 0.41200 35.832 0.247 2.7335 2.467 98.33 98.37 35.31 511.2 0.31200 37.297 0.250 2.6180 13.641 98.63 89.56 33.46 487.7 1.71400 41.118 0.249 2.6689 22.207 100.00 84.38 34.76 504.3 1.1
16 S. Petitgirard et al. / Tectonophysics xxx (2009) xxx–xxx
ARTICLE IN PRESS
Please cite this article as: Petitgirard, S., et al., Conflicting structural and geochronological data from the Ibituruna quartz-syenite (SE Brazil):Effect of protracted “hot” orogeny and slow cooling rate? Tectonophysics (2009), doi:10.1016/j.tecto.2009.02.039

Fig. 15. U–Pb ages of zircons and monazites from a synkinematic leucogranite vein injected in the metasedimentary mylonites (AR684: ~3 km away from the Ibituruna quartz-syenite)
Fig. 16. U–Pb ages of zircons from a synkinematic leucogranite vein injected in themetasedimentary mylonites a few meters below the contact with the Ibituruna quartz-syenite (AR935).
17S. Petitgirard et al. / Tectonophysics xxx (2009) xxx–xxx
ARTICLE IN PRESS
AR548 biotite: 471.6±4.3 Ma; AR562 biotite: 474.2±4.9 Ma; AR86biotite: 468±4 Ma).
7.3. The Derribadinha tonalite (AR 264)
Zircons from the Derribadinha tonalite are subeuhedral withrounded external shapes suggesting a metamorphic corrosion(Fig. 13). Inherited cores are common feature and indicate thatzircons originally crystallized from a Zr saturated melt. To determinethe age of crystallization of the tonalite, U–Pb analyses wereessentially conducted on rims around cores but some analyses werealso focused on the cores to investigate possible sources at depth.Paleoproterozoic cores, although discordant point to ages at around2 Ga (Table 2; #3-2 and #9-2) and also at around 1.6–1.7 Ga (Table 2;#17, 18 and 19). Interestingly inheritance also includes xenocrystswith ages around 640 Ma (Table 2; #1-1, 10-1 and 15-1). Among theseanalyses, the former two have low Th/U ratios (Th/Ub0.1) suggestingthey derived frommetamorphic units or frommigmatitic leucosomes.The remaining analyses (n=13) cluster close to concordia (Fig. 18A,B) at about 580 Ma and yield a 206Pb/238U weighted mean age of 580±8 Ma (MSWD=0.8). Since these analyses are from rims around
Please cite this article as: Petitgirard, S., et al., Conflicting structural and geochronological data from the Ibituruna quartz-syenite (SE Brazil):Effect of protracted “hot” orogeny and slow cooling rate? Tectonophysics (2009), doi:10.1016/j.tecto.2009.02.039
.

Fig. 17. 40Ar/39Ar laser probe age spectra of an amphibole (A), and three biotites (B, C and D) from the metasedimentary mylonites.
18 S. Petitgirard et al. / Tectonophysics xxx (2009) xxx–xxx
ARTICLE IN PRESS
cores, this age is interpreted as dating emplacement and crystal-lization of the tonalitic magma. This age is in good agreement withthose (576–594 Ma) obtained for other tonalitic bodies from the samedomain West of the Ibituruna massif (Nalini, 1997; Nalini et al., 2000;Noce et al., 2000).
8. Metamorphic conditions
The Ibituruna quartz-syenite was emplaced in mylonites predo-minantly derived from pelitic protoliths and injected with rather large
Fig.18.U–Pb ages of zircons from the Derribadinha tonalite. Data in red have been discarded.to the web version of this article.)
Please cite this article as: Petitgirard, S., et al., Conflicting structural andEffect of protracted “hot” orogeny and slow cooling rate? Tectonophysi
volumes of synkinematic leucogranite. The mineralogical compositionof these mylonites is characterized by the association biotite–quartz–plagioclase–garnet–prismatic sillimanite; in addition, depending onthe composition of the protolith, hornblende or cordierite is observed.The cordierite is usually poikiloblastic and contains prismaticsillimanite, suggesting it crystallized after sillimanite. Synkinematicleucogranite frequently contains cordierite and garnet of magmaticorigin in addition to quartz and feldspars. This mineralogicalcomposition, together with the absence of muscovite, suggests thatHT (N700 °C) and moderate pressure conditions prevailed during
(For interpretation of the references to colour in this figure legend, the reader is referred
geochronological data from the Ibituruna quartz-syenite (SE Brazil):cs (2009), doi:10.1016/j.tecto.2009.02.039
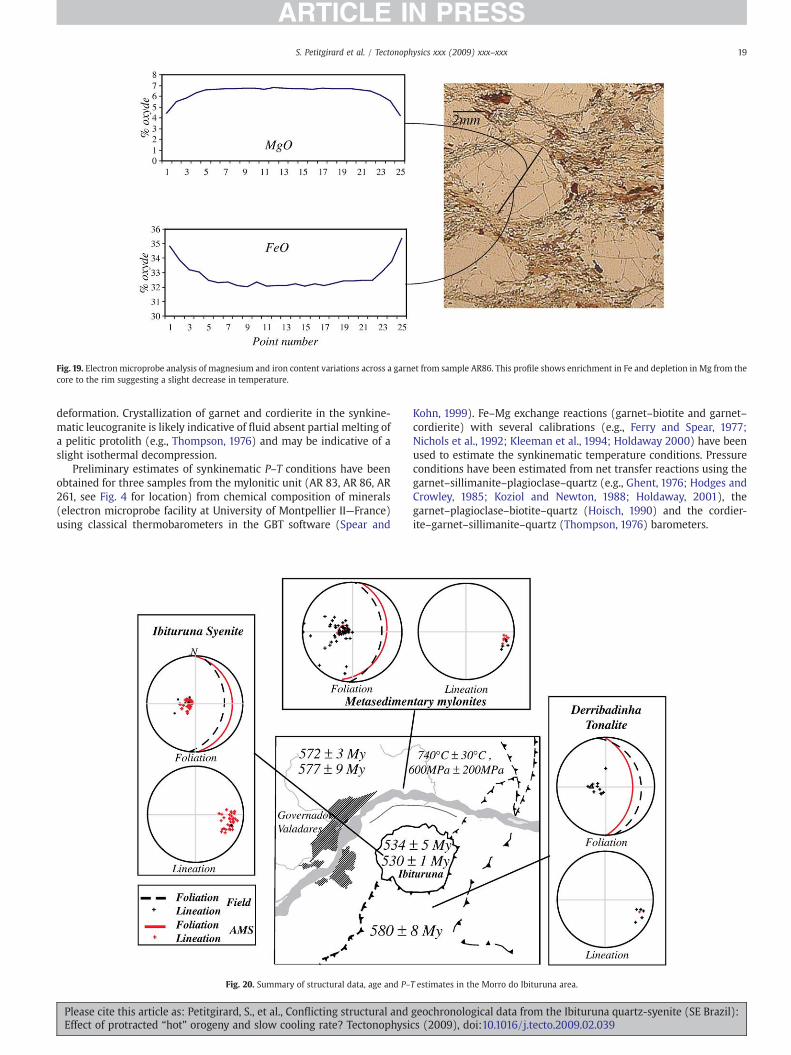
Fig. 19. Electron microprobe analysis of magnesium and iron content variations across a garnet from sample AR86. This profile shows enrichment in Fe and depletion in Mg from thecore to the rim suggesting a slight decrease in temperature.
19S. Petitgirard et al. / Tectonophysics xxx (2009) xxx–xxx
ARTICLE IN PRESS
deformation. Crystallization of garnet and cordierite in the synkine-matic leucogranite is likely indicative of fluid absent partial melting ofa pelitic protolith (e.g., Thompson, 1976) and may be indicative of aslight isothermal decompression.
Preliminary estimates of synkinematic P–T conditions have beenobtained for three samples from the mylonitic unit (AR 83, AR 86, AR261, see Fig. 4 for location) from chemical composition of minerals(electron microprobe facility at University of Montpellier II—France)using classical thermobarometers in the GBT software (Spear and
Fig. 20. Summary of structural data, age and P–
Please cite this article as: Petitgirard, S., et al., Conflicting structural andEffect of protracted “hot” orogeny and slow cooling rate? Tectonophysi
Kohn, 1999). Fe–Mg exchange reactions (garnet–biotite and garnet–cordierite) with several calibrations (e.g., Ferry and Spear, 1977;Nichols et al., 1992; Kleeman et al., 1994; Holdaway 2000) have beenused to estimate the synkinematic temperature conditions. Pressureconditions have been estimated from net transfer reactions using thegarnet–sillimanite–plagioclase–quartz (e.g., Ghent, 1976; Hodges andCrowley, 1985; Koziol and Newton, 1988; Holdaway, 2001), thegarnet–plagioclase–biotite–quartz (Hoisch, 1990) and the cordier-ite–garnet–sillimanite–quartz (Thompson, 1976) barometers.
T estimates in the Morro do Ibituruna area.
geochronological data from the Ibituruna quartz-syenite (SE Brazil):cs (2009), doi:10.1016/j.tecto.2009.02.039

Table 5Summary of U–Pb and 40Ar–39Ar ages obtained in the Ibituruna area.
Sample no. Mineral Method Age (Ma)
AR 412 Zircon 206Pb/238U LA-ICP-MS 534±5AR 412 Zircon 206Pb/238U SHRIMP 530±1AR 684 Zircon 206Pb/238U LA-ICP-MS 577±9AR 935 Zircon 207Pb/206Pb LA-ICP-MS 579±3AR 264 Zircon 206Pb/238U LA-ICP-MS 580±8AR 684 Monazite 206Pb/238U LA-ICP-MS 572±3AR 412 Amphibole 40Ar/39Ar 495±4AR 526 Amphibole 40Ar/39Ar 501±5AR 86 Biotite 40Ar/39Ar 468±4AR 526 Biotite 40Ar/39Ar 474±5AR 548 Biotite 40Ar/39Ar 472±4
20 S. Petitgirard et al. / Tectonophysics xxx (2009) xxx–xxx
ARTICLE IN PRESS
AR-83: Analyses were carried out on pelitic and leucograniticsamples. Temperature estimates on garnet–biotite pairs yield760 °C±30 °C in metasediments and 700 °C±30 °C in synkine-matic leucogranites. Pressure estimates using garnet–plagioclase–sillimanite–quartz and garnet–plagioclase–biotite–quartz fromthe metasediment suggest a pressure range of 600±200 MPa.
AR-86 Temperature estimates in this kinzigite using rim–rimmeasurements on garnet–biotite pairs were calculated at 730±30 °C.Temperature estimated from the composition of the biotite inclusionsand from the core of their host garnet yield a higher T ~780±30 °C.Pressure estimates from garnet–plagioclase–sillimanite–quartzassemblages using three different calibrations yield close values at600±170 MPa. Variation in Mg and Fe contents across large garnetscontaining biotite inclusions suggest that garnets are not in a chemicalequilibrium (Fig. 19). Rims are depleted in Mg and enriched in Ferelative to the cores.
AR-261: Temperature estimates from garnet–biotite pairs arebimodal. Analysis performed at the crystals rim suggest a T of 730±20 °C and those of biotite inclusion in garnet and garnet-core 770±30 °C. Pressure estimates from garnet–plagioclase–sillimanite–quartzassemblages yield 500±150 MPa.
The P–T conditions estimated from the 3 outcrops are consistentand suggest a HT–MP trend with an average T of 740±30 °C and P of600±200 MPa. Samples AR86 and AR261 have provided estimatesslightly higher using biotite inclusions in garnet and garnet-corecompositions. Together with the Mg–Fe variation across garnetsobserved in AR86, this suggests that the inner part of garnet haspreserved earlier, higher metamorphic conditions that have beenerased by partial re-equilibration of the outer part of the crystal. Thiswould suggest that the synkinematic P–T conditions estimated fromthe metasedimentary mylonites do not represent the peak-meta-morphism conditions but slightly retrogressive conditions. Thisconclusion should, however, be taken with caution since theestimated T may be regarded as similar or very close within errors.A more detailed investigation taking into account a larger number ofsamples and more recent thermodynamical approaches is required totest the preliminary estimates presented in this work.
9. Discussion
9.1. Magnetic and structural data
Magnetic susceptibility measurements on samples from theIbituruna syenite show that the syenite is: 1) ferromagnetic, withmagnetite as the main carrier of susceptibility, and 2) significantlyanisotropic with a mean anisotropy parameter P′ quite high, at 1.24.
Multi-domain magnetite grains are the main carriers of the AMSsignal. AARM and pAARM measurements demonstrate that singledomain magnetite grains, if present, have no incidence on the AMSsignal. There is also a part of the AMS signal that arises from thepreferred orientation of paramagnetic minerals (especially amphiboleand biotite); this component is even dominant in the metasedimentarymylonites. The preferred orientationofmaficminerals observed in someoutcrops aswell as in thin sectionsmatches well the magnetic lineationKmax, confirming that AMS is linked to mineral preferred orientation.There is a good consistency between field and magnetic foliations andlineations, inside the various lithotectonic units (metasediments,syenite, tonalite) as well as from one unit to another. Magnetic andobserved mineral lineations especially are very similar. This supportsthat AMS results obtained in the present study can be used as a reliableproxy of the tectonic fabric. Moreover, this consistency is regarded as astrong argument supporting that the syenitic magma was emplacedwithin and deformed coherently with the country-rock.
The microstructure of the syenite is characterized by an absence ofinternal deformation (substructures, recrystallization). Petrologicalevidence indicates that the magma remained under HT conditions
Please cite this article as: Petitgirard, S., et al., Conflicting structural andEffect of protracted “hot” orogeny and slow cooling rate? Tectonophysi
over a long time span. This is strongly suggested by the lack of solid-state deformation. Calcite and to a lesser extend quartz have retainedan interstitial character resulting from fluid-melt circulations whilethe magma was not completely crystallized. Moreover, small over-growths on zircons are often observed in samples from the Ibiturunasyenite and might be related to slow cooling rate after emplacementand/or to successive emplacement of sills that progressively built thepluton (Menand, 2008). P–T estimates suggest that the country-rockswere also under HT conditions that may have favored a slow coolingrate of the magma after its emplacement (Whittington et al., 2009).
Altogether, AMS, microstructural, and field evidence support that:1) the Ibituruna syenite was deformed coherently with the country-rock during HT–LP westward thrusting, and 2) this deformationoccurred when the syenite was still in the magmatic stage (i.e., wasbehaving as a suspension). This, therefore points toward a synkine-matic intrusion of the syenitic magma at the boundary between themetasedimentary mylonites and the Derribadinha tonalite.
9.2. U–Pb dating of zircons and monazites
The Ibituruna syenite show inherited components in the source ofthemagmawith ages as old as1.95Ga (AR412;#5-2),while themajorityof the analyzed zircons yield ages of 534 Ma±5 Ma (LA-ICP-MS) and530±1Ma (SHRIMP). These ages are significantly older than the Rb/Srage of 511 Ma previously published for the Ibituruna quartz-syenite(Besang et al.,1977) that probably represents a cooling age. The late andintrusive character of the syenite should be therefore reconsidered. Onthe other hand, samples from the country-rock yielded significantlyolder zircon and monazite ages at 570–580Ma (Fig. 20). These ages areconsistent with ages found elsewhere in the same orogenic segment,south and west of the Ibituruna massif. This 40–50 My age differencebetween the Ibituruna quartz-syenite and its host-rock highlights thedifficulties encountered to reconstruct the clear succession of eventsthat led to the emplacement of the syenite as it better supports a lateintrusion in its host-rock, in conflict with the conclusions drawn fromAMS data.
9.3. A paradox typical of hot orogens?
Summarizing, the structural and geochronological approachespoint toward apparently opposite conclusions:
‐ The coherence of AMS fabric and microstructure of the Ibiturunasyenitewith the structural fabric, microstructure and synkinematicP–T conditions in the country-rocks strongly support a magmaticdeformation of the syenite coeval with the solid-state deformationof the metasedimentary mylonites and the meta-tonalite. Thissuggests a syn- to late-kinematic emplacement of the syenitic sill.
‐ U–Pb dating yielded ages of ~530Ma for the syenite and 570–580Mafor the synkinematic leucocratic veins in the metasedimentarymylonites and for the Derribadinha tonalite (Table 5). For all
geochronological data from the Ibituruna quartz-syenite (SE Brazil):cs (2009), doi:10.1016/j.tecto.2009.02.039
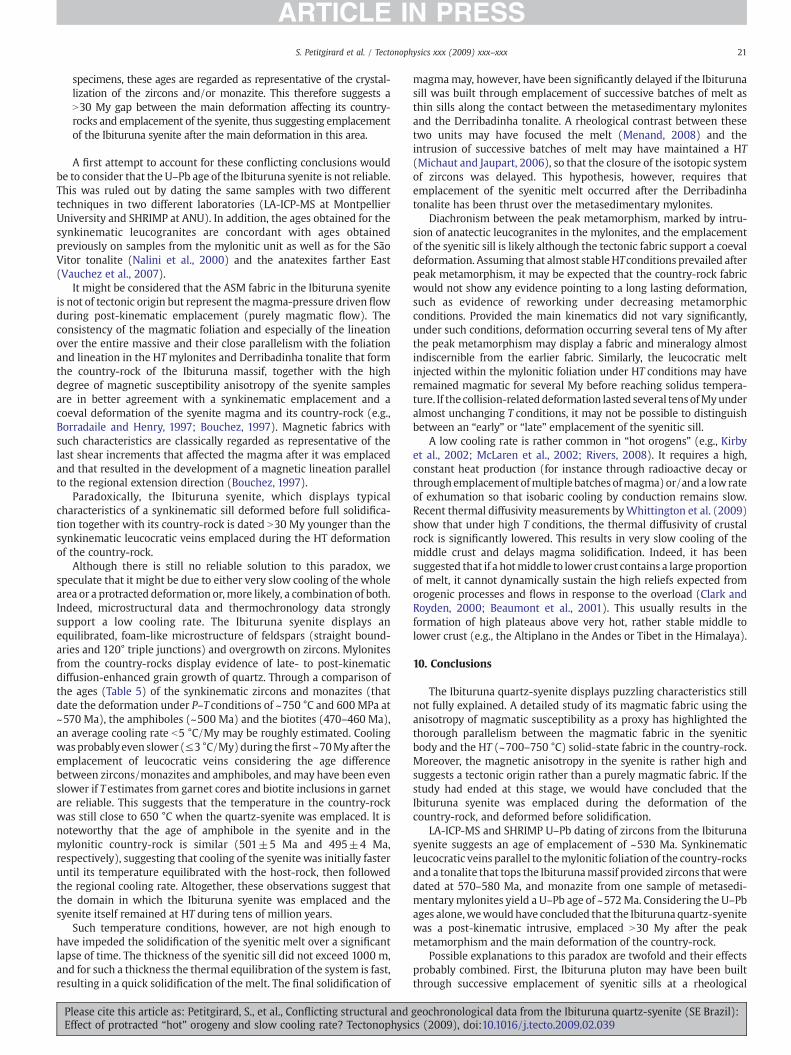
21S. Petitgirard et al. / Tectonophysics xxx (2009) xxx–xxx
ARTICLE IN PRESS
specimens, these ages are regarded as representative of the crystal-lization of the zircons and/or monazite. This therefore suggests aN30 My gap between the main deformation affecting its country-rocks and emplacement of the syenite, thus suggesting emplacementof the Ibituruna syenite after the main deformation in this area.
A first attempt to account for these conflicting conclusions wouldbe to consider that the U–Pb age of the Ibituruna syenite is not reliable.This was ruled out by dating the same samples with two differenttechniques in two different laboratories (LA-ICP-MS at MontpellierUniversity and SHRIMP at ANU). In addition, the ages obtained for thesynkinematic leucogranites are concordant with ages obtainedpreviously on samples from the mylonitic unit as well as for the SãoVitor tonalite (Nalini et al., 2000) and the anatexites farther East(Vauchez et al., 2007).
It might be considered that the ASM fabric in the Ibituruna syeniteis not of tectonic origin but represent themagma-pressure driven flowduring post-kinematic emplacement (purely magmatic flow). Theconsistency of the magmatic foliation and especially of the lineationover the entire massive and their close parallelism with the foliationand lineation in the HTmylonites and Derribadinha tonalite that formthe country-rock of the Ibituruna massif, together with the highdegree of magnetic susceptibility anisotropy of the syenite samplesare in better agreement with a synkinematic emplacement and acoeval deformation of the syenite magma and its country-rock (e.g.,Borradaile and Henry, 1997; Bouchez, 1997). Magnetic fabrics withsuch characteristics are classically regarded as representative of thelast shear increments that affected the magma after it was emplacedand that resulted in the development of a magnetic lineation parallelto the regional extension direction (Bouchez, 1997).
Paradoxically, the Ibituruna syenite, which displays typicalcharacteristics of a synkinematic sill deformed before full solidifica-tion together with its country-rock is dated N30 My younger than thesynkinematic leucocratic veins emplaced during the HT deformationof the country-rock.
Although there is still no reliable solution to this paradox, wespeculate that it might be due to either very slow cooling of the wholearea or a protracted deformation or,more likely, a combination of both.Indeed, microstructural data and thermochronology data stronglysupport a low cooling rate. The Ibituruna syenite displays anequilibrated, foam-like microstructure of feldspars (straight bound-aries and 120° triple junctions) and overgrowth on zircons. Mylonitesfrom the country-rocks display evidence of late- to post-kinematicdiffusion-enhanced grain growth of quartz. Through a comparison ofthe ages (Table 5) of the synkinematic zircons and monazites (thatdate the deformation under P–T conditions of ~750 °C and 600 MPa at~570 Ma), the amphiboles (~500 Ma) and the biotites (470–460 Ma),an average cooling rate b5 °C/My may be roughly estimated. Coolingwas probablyeven slower (≤3 °C/My)during thefirst ~70Myafter theemplacement of leucocratic veins considering the age differencebetween zircons/monazites and amphiboles, andmay have been evenslower if T estimates from garnet cores and biotite inclusions in garnetare reliable. This suggests that the temperature in the country-rockwas still close to 650 °C when the quartz-syenite was emplaced. It isnoteworthy that the age of amphibole in the syenite and in themylonitic country-rock is similar (501±5 Ma and 495±4 Ma,respectively), suggesting that cooling of the syenite was initially fasteruntil its temperature equilibrated with the host-rock, then followedthe regional cooling rate. Altogether, these observations suggest thatthe domain in which the Ibituruna syenite was emplaced and thesyenite itself remained at HT during tens of million years.
Such temperature conditions, however, are not high enough tohave impeded the solidification of the syenitic melt over a significantlapse of time. The thickness of the syenitic sill did not exceed 1000 m,and for such a thickness the thermal equilibration of the system is fast,resulting in a quick solidification of the melt. The final solidification of
Please cite this article as: Petitgirard, S., et al., Conflicting structural andEffect of protracted “hot” orogeny and slow cooling rate? Tectonophysi
magmamay, however, have been significantly delayed if the Ibiturunasill was built through emplacement of successive batches of melt asthin sills along the contact between the metasedimentary mylonitesand the Derribadinha tonalite. A rheological contrast between thesetwo units may have focused the melt (Menand, 2008) and theintrusion of successive batches of melt may have maintained a HT(Michaut and Jaupart, 2006), so that the closure of the isotopic systemof zircons was delayed. This hypothesis, however, requires thatemplacement of the syenitic melt occurred after the Derribadinhatonalite has been thrust over the metasedimentary mylonites.
Diachronism between the peak metamorphism, marked by intru-sion of anatectic leucogranites in the mylonites, and the emplacementof the syenitic sill is likely although the tectonic fabric support a coevaldeformation. Assuming that almost stable HTconditions prevailed afterpeak metamorphism, it may be expected that the country-rock fabricwould not show any evidence pointing to a long lasting deformation,such as evidence of reworking under decreasing metamorphicconditions. Provided the main kinematics did not vary significantly,under such conditions, deformation occurring several tens of My afterthe peak metamorphism may display a fabric and mineralogy almostindiscernible from the earlier fabric. Similarly, the leucocratic meltinjected within the mylonitic foliation under HT conditions may haveremained magmatic for several My before reaching solidus tempera-ture. If the collision-relateddeformation lasted several tensofMyunderalmost unchanging T conditions, it may not be possible to distinguishbetween an “early” or “late” emplacement of the syenitic sill.
A low cooling rate is rather common in “hot orogens” (e.g., Kirbyet al., 2002; McLaren et al., 2002; Rivers, 2008). It requires a high,constant heat production (for instance through radioactive decay orthroughemplacementofmultiplebatches ofmagma)or/anda low rateof exhumation so that isobaric cooling by conduction remains slow.Recent thermal diffusivity measurements byWhittington et al. (2009)show that under high T conditions, the thermal diffusivity of crustalrock is significantly lowered. This results in very slow cooling of themiddle crust and delays magma solidification. Indeed, it has beensuggested that if a hotmiddle to lower crust contains a large proportionof melt, it cannot dynamically sustain the high reliefs expected fromorogenic processes and flows in response to the overload (Clark andRoyden, 2000; Beaumont et al., 2001). This usually results in theformation of high plateaus above very hot, rather stable middle tolower crust (e.g., the Altiplano in the Andes or Tibet in the Himalaya).
10. Conclusions
The Ibituruna quartz-syenite displays puzzling characteristics stillnot fully explained. A detailed study of its magmatic fabric using theanisotropy of magmatic susceptibility as a proxy has highlighted thethorough parallelism between the magmatic fabric in the syeniticbody and the HT (~700–750 °C) solid-state fabric in the country-rock.Moreover, the magnetic anisotropy in the syenite is rather high andsuggests a tectonic origin rather than a purely magmatic fabric. If thestudy had ended at this stage, we would have concluded that theIbituruna syenite was emplaced during the deformation of thecountry-rock, and deformed before solidification.
LA-ICP-MS and SHRIMP U–Pb dating of zircons from the Ibiturunasyenite suggests an age of emplacement of ~530 Ma. Synkinematicleucocratic veins parallel to themylonitic foliation of the country-rocksand a tonalite that tops the Ibiturunamassif provided zircons thatweredated at 570–580 Ma, and monazite from one sample of metasedi-mentarymylonites yield a U–Pb age of ~572Ma. Considering the U–Pbages alone,wewouldhave concluded that the Ibituruna quartz-syenitewas a post-kinematic intrusive, emplaced N30 My after the peakmetamorphism and the main deformation of the country-rock.
Possible explanations to this paradox are twofold and their effectsprobably combined. First, the Ibituruna pluton may have been builtthrough successive emplacement of syenitic sills at a rheological
geochronological data from the Ibituruna quartz-syenite (SE Brazil):cs (2009), doi:10.1016/j.tecto.2009.02.039

22 S. Petitgirard et al. / Tectonophysics xxx (2009) xxx–xxx
ARTICLE IN PRESS
interface—the contact between the metasedimentary mylonites andthe Derribadinha tonalite—resulting in a protracted growth of themagmatic stock that may have delayed the closure of the zirconisotopic system. Second, comparison of zircons and monazites U–Pbages and 40Ar–39Ar amphiboles and biotite ages supports a lowregional cooling rate (b5 °C/My). Cooling was probably even lower(b3 °C/My) during the first tens of My after the peak metamorphism.Under such stable conditions, and assuming a rather constantkinematics lasting for tens of My, the microstructure of deformedrocks would remain almost unchanged even if they underwent andrecorded strain pulses separated by long periods of time. TheIbituruna syenite may therefore have been emplaced several tens ofMy after the peak metamorphism in a country-rock still deformingunder HT conditions. This is probably a characteristic of hot orogensthat deformation fabrics and associated mineralogy may remainunchanged although the deformation lasts for very long period oftime. Rocks recording the early stage of deformation and thoserecording later stages will finally display similar microstructural andmineralogical characteristics.
Acknowledgements
This work was made possible through funding of the collaborativeresearch by the CAPES/COFECUB (project # Te 588/07), the CNRS-FAPESP collaborative program and the Geosciences-Montpellier “Hot-Orogens Tranverse Project”. We also thank the two anonymousreviewers for their constructive suggestions and criticism.
References
Alkmim, F.F., Marshak, S., Fonseca, M.A., 2001. Assembling West Gondwana in theNeoproterozoic: clues from the São Francisco craton, Brazil. Geological Society ofAmerica Bulletin 29, 319–322.
Archanjo, C.J., Launeau, P., Bouchez, J.L., 1995. Magnetic fabric vs. magnetite and biotiteshape fabrics of the magnetite-bearing granite pluton of Gameleiras (NortheastBrazil). Physics of the Earth and Planetary Interiors 89 (1–2), 63–75.
Archanjo, C.J., Trindade, R.I.F., Bouchez, J.-L., Ernesto, M., 2002. Granite fabrics andregional-scale strain partitioning in the Serido Belt (Borborema Province, NEBrazil). Tectonics 21 (no.1), 14.
Bascou, J., Raposo, M.I.B., Vauchez, A., Egydio-Silva, M., 2002. Titanohematite lattice-preferred orientation and magnetic anisotropy in high-temperature mylonites.Earth and Planetary Science Letters 198 (1-2), 77–92.
Beaumont, C., Jamieson, R.A., Nguyen, M.H., Lee, B., 2001. Himalayan tectonics explainedby extrusion of a low-viscosity crustal channel coupled to focused surfacedenudation. Nature 414 (6865), 738–742.
Besang, C., Eberle, W.C., Lahner, L.H., Muller, P., Paulsen, S., 1977. RadiometrischeAltersbestimmungen an Gesteinem aus Minas Gerais und Espirito Santo/Brasilien.,Geol. Lb. 24, 149–179. Geologische Jahrbuch 24, 149–179.
Bilal, E., Horn, A.H., Nalini, H.A., Mello, F.M.D., Correia-Neves, J.M., Giret, A.R., Moutte, J.,Fuzikawa, K., Fernandes, M.L.S., 2000. Neoproterozoïc granitoïde suites in southernBrazil. Revista Brasileira de Geociência 30, 51–54.
Borradaile, G.J., Henry, B., 1997. Tectonic applications of magnetic susceptibility and itsanisotropy. Earth-Science Reviews 42 (1–2), 49–93.
Borradaile, G.J., Jackson, M., 2004. Anisotropy of magnetic susceptibility (AMS):magnetic petrofabrics of deformed rocks. Geological Society, London, SpecialPublications 238 (1), 299–360.
Bouchez, J.L., 1997. Granite is never isotropic. In: Bouchez, J.L., Hutton, D.H.W., Stephens,W.E. (Eds.), Granite: From Segregation of Melt to Emplacement Fabrics. Petrologyand structural geology. Kluwer Academic Publishers, pp. 95–112.
Bouchez, J.L., Gleizes, G., 1995. Two-stage deformation of the Mont-Louis-Andorragranite pluton (Variscan Pyrenees) inferred from magnetic susceptibility aniso-tropy. Journal of the Geological Society of London 152, 669–679.
Brown, M., 2007. Crustal melting and melt extraction, ascent and emplacement inorogens: mechanisms and consequences. Journal of the Geological Society 164 (4),709–730.
Brueckner, H.K., Cunningham,W.D., Alkmin, F.F., Marshak, S., 2000. Tectonic implicationof Precambrian Sm–Nd dates from the southern São Francisco craton and adjacentAraçuaí and Ribeira belts, Brazil. Precambrian Research 99, 255–269.
Bruguier, O., Telouk, P., Cocherie, A., Fouillac, A.-M., Albarede, F., 2001. Evaluation of Pb-Pb and U-Pb laser ablation ICP-MS zircon dating using matrix-matched calibrationsamples with a frequency quadrupled (266 nm) Nd-YAG laser. GeostandardsNewsletter 25 (2-3), 361–373.
Cañón-Tapia, E., 2004. Anisotropy of magnetic susceptibility of lava flows and dykes: ahistorical account. Geological Society, London, Special Publications 238 (1), 205–225.
Clark, M.K., Royden, L.H., 2000. Topographic ooze: building the eastern margin of Tibetby lower crustal flow. Geology 28 (8), 703–706.
Please cite this article as: Petitgirard, S., et al., Conflicting structural andEffect of protracted “hot” orogeny and slow cooling rate? Tectonophysi
Constable, C., Tauxe, L., 1990. The bootstrap for magnetic susceptibility tensors. Journalof Geophysical Research 95 (B6), 8383–8395.
Day, M., Fuller, M., Schmidt, V.A., 1977. Hysteresis properties of titanomagnetites: grainsize and compositional dependance. Physics of the Earth and Planetary Interiors 13,267-267.
Dhuime, B., Bosch, D., Bruguier, O., Caby, R., Pourtales, S., 2007. Age, provenance and post-deposition metamorphic overprint of detrital zircons from the Nathorst Land group(NE Greenland)—a LA-ICP-MS and SIMS study. Precambrian Research 155 (1–2),24–46.
Egydio-Silva, M., Vauchez, A., Bascou, J., Hippertt, J., 2002. High-temperaturedeformation in the Neoproterozoic transpressional Ribeira belt, southeast Brazil.Tectonophysics 352 (1–2), 203–224.
Egydio-Silva, M., Vauchez, A., Raposo, M.I.B., Bascou, J., Uhlein, A., 2005. Deformationregime variations in an arcuate transpressional orogen (Ribeira belt, SE Brazil)imaged by anisotropy of magnetic susceptibility in granulites. Journal of StructuralGeology 27 (10), 1750.
Féboli, W.L., 2000. Governador Valadares Folha SE.24-Y-A-IV. In: COMIG and CPRM(Editors), Projeto Leste, Belo Horizonte.
Ferry, J.M., Spear, F., 1977. Experimental calibration of the partitioning of Fe and Mgbetween biotite and garnet. Contributions to Mineralogy and Petrology 66 (2),113–117.
Ghent, E.D., 1976. Plagioclase-garnet-Al2SiO5-quartz: a potential geothermometer-geobarometer. American Mineralogist 61, 710–714.
Guillet, P., Bouchez, J.-L., Wagner, J.-J., 1983. Anisotropy of magnetic susceptibility andmagmatic structures in the Guerande granite massif (France). Tectonics 2 (5),419–429.
Günther, D., Heinrich, C.A., 1999. Enhanced sensitivity in LA-ICP-MS using helium–
argon mixtures as aerosol carrier. Journal of Analytical Atomic Spectrometry 14,1369–1374.
Hammor, D., Bosch, D., Caby, R., Bruguier, O., 2006. A two-stage exhumation of theVariscan crust: U–Pb LA-ICP-MS and Rb–Sr ages from Greater Kabylia, Maghrebides.Terra Nova 18 (5), 299–307.
Harley, S.L., Kelly, N.M., Moeller, A., 2007. Zircon behaviour and the thermal histories ofmountain chains. Elements 3 (1), 25–30.
Hodges, K.V., Crowley, P.D., 1985. Error estimation and empirical geothermobarometryfor pelitic systems. American Mineralogist 70 (7-8), 702–709.
Hoisch, T.D., 1990. Empirical calibration of six geobarometers for the mineralassemblage quartz+muscovite+biotite+plagioclase+garnet. Contributions toMineralogy and Petrology 104, 225–234.
Holdaway, M.J., 2000. Application of new experimental and garnet Margules data to thegarnet-biotite geothermometer. American Mineralogist 85 (7-8), 881–892.
Holdaway, M.J., 2001. Recalibration of the GASP geobarometer in light of recent garnetand plagioclase activity models and versions of the garnet-biotite geothermometer.American Mineralogist 86 (10), 1117–1129.
Hrouda, F., Siemes, H., Herres, N., Hennig-Michaeli, C., 1985. The relationship betweenthe magnetic anisotropy and the c-axis fabric in a massive hematite ore. Journal ofGeophysics 56, I74–I82.
Hutton, D.H.W., 1988. Granite emplacement mechanisms and tectonic controls:inferences from deformation studies. Transactions of the Royal Society ofEdinburgh. Earth Sciences 79, 245–255.
Jelinek, V., 1981. Characterization of the magnetic fabric of rocks. Tectonophysics 79,T63–T67.
Kirby, E., Reiners, P.W., Krol, M.A., Whipple, K.X., Hodges, K.V., Farley, K.A., Tang, W.,Chen, Z., 2002. Late Cenozoic evolution of the eastern margin of the TibetanPlateau: Inferences from 40Ar/39Ar and (U–Th)/He thermochronology. Tectonics21 (1), 1001.
Kleemann, U., Reinhardt, J., 1994. Garnet-biotite thermometry revisited - the effect ofAlVI and Ti in biotite. European Journal of Mineralogy 6, 925–941.
Koziol, A.M., Newton, R.C., 1988. Redetermination of the anorthite breakdown reactionand improvement of the plagioclase-garnet-Al2SiO5-quartz barometer. AmericanMineralogist 73, 216–223.
Le Roux, V., Tommasi, A., Vauchez, A., 2008. Feedback processes between percolationand deformation in a frozen lithosphere–asthenosphere boundary. Earth andPlanetary Science Letters 274 (3–4), 401–413.
Ludwig, K.R., 2000. Isoplot—a geochronological toolkit for Microsoft Excel. BerkeleyGeochronological Center Special Publication 1a, 1–55.
McDougall, I., Harrison, T.M.,1999. Geochronology and thermochronology by the (super40) Ar/ (super 39) Ar. Oxford University Press, New York, NY, United States (USA).
McLaren, S., Dunlap, W.J., Sandiford, M., McDougall, I., 2002. Thermochronology of highheat-producing crust at Mount Painter, South Australia: implications for tectonicreactivation of continental interiors. Tectonics 21 (4). doi:10.1029/2000TC001275.
Menand, T., 2008. The mechanics and dynamics of sills in layered elastic rocks and theirimplications for the growth of laccoliths and other igneous complexes. Earth andPlanetary Science Letters 267 (1–2), 93–99.
Michaut, C., Jaupart, C., 2006. Ultra-rapid formation of large volumes of evolvedmagma.Earth and Planetary Science Letters 250 (1–2), 38–52.
Nakamura, N., Borradaile, G.J., 2001. Strain, anisotropy of anhysteretic remanence, andanisotropy of magnetic susceptibility in a slaty tuff. Physics of the Earth andPlanetary Interiors 125 (1-4), 85–93.
Nalini, H.A., 1997. Caractérisation des suites magmatiques néoproterozoïques de larégion de Conselheiro Pena et Galiléia (Minas Gerais, Brésil). Etude géochimique etstructurale des suites Galiléia et Urucum et relation avec les pegmatites à élémentsrares associées. Doctorat Thesis, Ecole Nationale Supérieure desMines de Paris et deSaint Etienne, St Etienne, 237 pp.
Nalini, H.A., Bilal, E., Correia Neves, J.M., 2000. Syn-collisional peraluminousmagmatism in the rio doce region: mineralogy, geochemistry and isotopic data of
geochronological data from the Ibituruna quartz-syenite (SE Brazil):cs (2009), doi:10.1016/j.tecto.2009.02.039
23S. Petitgirard et al. / Tectonophysics xxx (2009) xxx–xxx
ARTICLE IN PRESS
the neoproterozoic Urucum suite (eastern Minas Gerais state, Brazil). RevistaBrasileira de Geociências 30 (1), 120–125.
Neves, S.P., Bruguier, O., Vauchez, A., Bosch, D., da Silva, J.M.R., Mariano, G., 2006. Timingof crust formation, deposition of supracrustal sequences, and Transamazonian andBrasiliano metamorphism in the East Pernambuco belt (Borborema Province, NEBrazil): implications for western Gondwana assembly. Precambrian Research 149(3–4), 197–216.
Nichols, G.T., Berry, R.F., Green, D.H., 1992. Internally consistent gahnitic spinel-cordierite-garnet equilibria in the FMASHZn system; geothermobarometry andapplications. Contributions to Mineralogy and Petrology 111 (3), 362–377.
Noce, C.M., Macambira, M.J.B., Pedrosa Soares, A.C., 2000. Chronology of Neoproterozoic–Cambrian granitic magmatism in the Araçuaí belt, eastern Brazil, based on singlezircon evaporation dating. Revista Brasileira de Geociências 30 (1), 20–29.
Noce, C.M., Pedrosa Soares, C.M., Piuzana, D., Armstrong, R., Laux, J.H., Campos, C.M.,2004. Ages of sedimentation of the kinzigitic complex and of a late orogenicthermal episode of the Araçuai Orogen, northern Espirito Santo State, Brazil: zirconand monazite U–Pb shrimp and ID-TIMS data. Revista Brasileira de Geociências 34(4), 587–592.
Oliveira, M.-J.R., Pinto, C.P., Féboli, W.L., Alves dos Santos, R., 2000. Projeto Leste—Relatorio mapa integrado 1:500.000—Geologia estrutural e tectônica, CPRM—
COMIG, Belo Horizonte.Pedrosa-Soares, A.C.,Noce, C.M.,Vidal, P.,Monteiro,R.L.B.P., Leonardos,O.H.,1992. Toward a
new tectonic model for the Late Proterozoic Araçuaí (SE Brazil)–West Congolian (SWAfrica) belt. Journal of South American Earth Sciences 6 (1/2), 33–47.
Poitrasson, F., Chenery, S., Shepperd, T.J., 2000. Electron microprobe and LA-ICP-MSstudy of monazite hydrothermal alteration: implications for U–Th–Pb geochronol-ogy and nuclear ceramics. Geochimica et Cosmochimica Acta 64, 3283–3297.
Rivers, T., 2008. Assembly and preservation of lower, mid, and upper orogenic crust inthe Grenville Province—implications for the evolution of large hot long-durationorogens. Precambrian Research 167 (3–4), 237–259.
Schmitt, R.S., Trouw, R.A.J., Van Schmus, W.R., Pimentel, M.M., 2004. Late amalgamationin the central part of West Gondwana: new geochronological data and thecharacterization of a Cambrian collisional orogeny in the Ribeira Belt (SE Brazil).Precambrian Research 133, 29–61.
Silva, L.C., McNaughton, N.J., Armstrong, R., Hartmann, L.A., Fletcher, I.R., 2005. TheNeoproterozoic Mantiqueira Province and its African connections; a zircon-basedU/Pb geochronologic subdivision for the Brasiliano/Pan-African systems oforogens. Precambrian Research 136 (3-4), 203–240.
Please cite this article as: Petitgirard, S., et al., Conflicting structural andEffect of protracted “hot” orogeny and slow cooling rate? Tectonophysi
Spear, F.S., Kohn, M.J., 1999-2006. Program Thermobarometry GTB. http://ees2.geo.rpi.edu/MetaPetaRen/Software/GTB_Prog/GTB.html.
Tarling, D.H., Hrouda, F., 1993. The magnetic anisotropy of rocks. Chapman & Hall,London, United Kingdom (GBR).
Thompson, A.B., 1976. Mineral reactions in pelitic rocks, II. Calculation of some P–T–X(Fe–Mg) phase relations. American Journal of Sciences 276, 425–454.
Tommasi, A., Vauchez, A., Fernandes, L.A.D., Porcher, C.C., 1994. Magma-assisted strainlocalization in an orogen-parallel transcurrent shear zone of southern Brazil.Tectonics 13 (2), 421–437.
Trindade, R.I.F., Raposo, M.I.B., Ernesto, M., Siqueira, R., 1999. Magnetic susceptibilityand partial anhysteretic remanence anisotropies in the magnetite-bearing granitepluton of Tourão, NE Brazil. Tectonophysics 314 (4), 443–468.
Trompette, R.R., 1994. Geology of western Gondwana (2000–500 Ma). Balkena,Rotterdam. 350 pp.
Trompette, R., Uhlein, A., Da Silva, M.E., Karmann, I., 1992. The Brasiliano São Franciscocraton revisited. Journal of South American Earth Sciences 6 (1/2), 49–57.
Vauchez, A., Tommasi, A., Egydio-Silva, M., 1994. Self-indentation of continentallithosphere. Geology 22, 967–970.
Vauchez, A., Egydio-Silva, M., Babinski, M., Tommasi, A., Uhlein, A., Liu, D., 2007.Deformation of a pervasively molten middle-crust: insights from the neoproter-ozoic Ribeira-Araçuaí orogen (SE Brazil). Terra Nova 19, 278–286.
Whittington, A.G., Hofmeister, A.M., Nabelek, P.I., 2009. Temperature-dependentthermal diffusivity of the Earth/'s crust and implications for magmatism. Nature458 (7236), 319–321.
Wiedenbeck, M., Allé, P., Corfu, F., Griffin, W.L., Meier, M., 1995. Three natural zirconstandards for U–Th–Pb, Lu–Hf, trace element and REE analyses. GeostandardsNewsletter 19, 1–23.
Williams, I.S., 1998. U–Th–Pb geochronology by ion microprobe. In: McKibben, M.A.,ShanksIII III, W.C., Ridley, W.I. (Eds.), Applications of Microanalytical Techniques toUnderstandingMineralizing Processes. Reviews in Economic Geology, vol. 7, pp.1–35.
Williams, I.S., Claesson, S., 1987. Isotopic evidence for the Precambrian provenance andCaledonian metamorphism of high grade paragneisses from the Seve Nappes,Scandinavian Caledonides; 2, Ion microprobe zircon U-Th-Pb. Contributions toMineralogy and Petrology 97 (.2), 205–217.
geochronological data from the Ibituruna quartz-syenite (SE Brazil):cs (2009), doi:10.1016/j.tecto.2009.02.039

�������� ����� ��
Repeated granitoid intrusions during the Neoproterozoic along the westernboundary of the Saharan metacraton, eastern Hoggar, Tuareg shield, Algeria:An AMS and U-Pb zircon age study
B. Henry, J.P. Liegeois, O. Nouar, M.E.M. Derder, B. Bayou, O. Bruguier, A.Ouabadi, D. Belhai, M. Amenna, A. Hemmi, M. Ayache
PII: S0040-1951(09)00233-9DOI: doi: 10.1016/j.tecto.2009.04.022Reference: TECTO 124584
To appear in: Tectonophysics
Received date: 20 February 2009Revised date: 7 April 2009Accepted date: 19 April 2009
Please cite this article as: Henry, B., Liegeois, J.P., Nouar, O., Derder, M.E.M., Bayou,B., Bruguier, O., Ouabadi, A., Belhai, D., Amenna, M., Hemmi, A., Ayache, M., Re-peated granitoid intrusions during the Neoproterozoic along the western boundary of theSaharan metacraton, eastern Hoggar, Tuareg shield, Algeria: An AMS and U-Pb zirconage study, Tectonophysics (2009), doi: 10.1016/j.tecto.2009.04.022
This is a PDF file of an unedited manuscript that has been accepted for publication.As a service to our customers we are providing this early version of the manuscript.The manuscript will undergo copyediting, typesetting, and review of the resulting proofbefore it is published in its final form. Please note that during the production processerrors may be discovered which could affect the content, and all legal disclaimers thatapply to the journal pertain.

ACC
EPTE
D M
ANU
SCR
IPT
ACCEPTED MANUSCRIPT
1
Repeated granitoid intrusions during the Neoproterozoic along the western boundary
of the Saharan metacraton, eastern Hoggar, Tuareg shield, Algeria: an AMS and U-
Pb zircon age study.
B. Henry (1), J.P Liégeois (2), O. Nouar (3), M.E.M. Derder (3), B. Bayou (3), O. Bruguier (4),
A. Ouabadi (5), D. Belhai (5), M. Amenna (3), A. Hemmi (3) and M. Ayache (3).
(1) Paléomagnétisme, IPGP and CNRS, 4 avenue de Neptune, 94107 Saint-Maur cedex,
France ([email protected]).
(2) Isotope Geology, Royal Museum for Central Africa, B-3080 Tervuren, Belgium.
(3) CRAAG, BP 63, 16340 Bouzaréah, Alger, Algeria.
(4) Géosciences Montpellier, Université de Montpellier II, 34095 Montpellier, France.
(5) Laboratoire "Géodynamique, Géologie de l'Ingénieur et Planétologie", FSTGAT /
USTHB, BP 32, El-Alia Bab Ezzouar, 16111 Alger, Algeria.
Corresponding authors: Bernard Henry. Fax (33) 1 45 11 41 90, [email protected]
Abstract
The N-S oriented Raghane shear zone (8°30') delineates the western boundary of
the Saharan metacraton and is, with the 4°50' shear zone, the most important shear zone in
the Tuareg shield. It can be followed on 1000 km in the basement from southern Aïr, Niger
to NE Hoggar, Algeria. Large subhorizontal movements have occurred during the Pan-
African orogeny and several groups of granitoids intruded during the Neoproterozoic. We
report U-Pb zircon datings (laser ICP-MS) showing that three magmatic suites of
granitoids emplaced close to the Raghane shear zone at c. 790 Ma, c. 590 and c. 550 Ma. A
comprehensive and detailed (158 sites, more than 1000 cores) magnetic fabric study was

ACC
EPTE
D M
ANU
SCR
IPT
ACCEPTED MANUSCRIPT
2
performed on 8 plutons belonging to the three magmatic suites and distributed on 200 km
along the Raghane shear zone. The main minerals in all the target plutons do not show
visible preferential magmatic orientation except in narrow shear zones. The AMS study
shows that all plutons have a magnetic lineation and foliation compatible with the
deformed zones that are zones deformed lately in post-solidus conditions. These structures
are related to the nearby mega-shear zones, the Raghane shear zone for most of them. The
old c. 793 Ma Touffok granite preserved locally its original structures. The magnetic
structures of the c. 593 Ma Ohergehem pluton, intruded in the Aouzegueur terrane, are
related to thrust structures generated by the Raghane shear zone while it is not the case of
the contemporaneous plutons in the Assodé-Issalane terrane whose structures are only
related to the subvertical shear zones. Finally, the c. 550 Ma granite group has magnetic
structure related to the N-S oriented Raghane shear zone and its associated NNE-SSW
structures when close to them, but NW-SE oriented when further. These NW-SE oriented
structures appear to be characteristic of the late Neoproterozoic evolution of the Saharan
metacraton and are in relation to the convergence with the Murzuq craton. This evolution
reflects the rheological contrast existing along the Raghane shear zone marking the western
boundary of the Saharan metacraton.
Key words: Hoggar, Pan-African, Saharan metacraton, Shear zone, Pluton, Anisotropy,
Magnetic susceptibility, LA-ICP-MS U-Pb zircon dating.
INTRODUCTION
The Saharan metacraton (Abdelsalam et al., 2002), although corresponding to the
eastern half of Sahara, is still largely unknown (Kilian, 1935; Lelubre, 1952, Guérangé and
Vialon, 1960; Bertrand et al., 1978). Its western boundary is delimited by the Raghane
ACC
EPTE
D M
ANU
SCR
IPT
ACCEPTED MANUSCRIPT
3
shear zone (Liégeois et al., 1994), N-S oriented along the 8°30' longitude and outcropping
on 1000 km from the Aïr mountains in Niger to NE Hoggar in Algeria. To the East, the
Aouzegueur, Barghot, Edembo and Djanet terranes (Black et al., 1994) belong to the
Saharan metacraton but generally present its young superstructures. Their Algerian parts
belong to the Eastern Hoggar, whose particularities compared to Central Hoggar has long
been recognized (Bertrand and Caby, 1978). The Assodé-Issalane terrane, is part of Central
Hoggar, is located to the West of the Raghane shear zone and is characterized by a Pan-
African high-temperature amphibolite facies metamorphism accompanied by a regional
partial melting exemplified by the Renatt leucogranite and migmatites (Liégeois et al.,
1994).
The main magmatic event along the Raghane shear zone occurred in the 620-580
Ma interval (Bertrand et al., 1986; Liégeois et al., 1994). Until very recently, it was
considered that the Eastern Hoggar, i.e. the Hoggar part east of the Raghane shear zone,
was stabilized early at c. 730 Ma, the age of an undeformed granite pluton considered as
late to post-orogenic (Caby, and Andreopoulos-Renaud, 1987). Current research shows
that the Eastern Hoggar was actually stabilized later than the rest of Hoggar, namely at
575-545 Ma, this period including both the intrusion of granitoids and regional
metamorphism (Fezaa et al., submitted).
A series of batholiths and plutons intruded along the Raghane shear zone. In the
field they are mostly undeformed, the deformation being localized in narrow shear zones
(Liégeois et al., 1994). The main easily visible effect is the elongated shape of the intrusive
bodies parallel to the Raghane shear zone but this is not the case for all plutons, some of
them being roughly circular. Knowing the existence in the area of granitoids of several
ages at 730 Ma, 620-580 Ma and 575-545 Ma (Bertrand et al., 1986; Caby and
Andreopoulos-Renaud, 1987; Liégeois et al., 1994; Fezaa et al., submitted) and even 800-
ACC
EPTE
D M
ANU
SCR
IPT
ACCEPTED MANUSCRIPT
4
820 Ma (Liégeois et al., 2005), we undertook a study of the Anisotropy of Magnetic
Susceptibility (AMS – e.g. King, 1966; Hrouda et al., 1971; Henry, 1974; Djouadi and
Bouchez, 1992; Archanjo et al., 1994; Borradaile and Kehlenbeck, 1996; Pignotta and
Benn, 1999; Bouchez, 2000; Tomezzoli et al., 2003; Henry et al., 2004; Auréjac et al.,
2004; Kratinova et al., 2007). We applied this structural method to eight undeformed
plutons located along the Raghane shear zone for a better understanding of their
emplacement relative to the contemporaneous tectonic stress. To reach such a goal requires
dating of some representative plutons, which has been done on three of them (U-Pb laser
ablation ICP-MS on zircon). The studied plutons belonging to three different stages (c. 790
Ma, c. 590 and c. 550 Ma), the study of their AMS aims at deciphering the complex
interplay of the successive tectonic stresses registered by nearly strain-free plutons that
occurred along a same mega shear-zone. In addition, this study provides information about
the behavior of the western margin of the Saharan metacraton during the Neoproterozoic.
GEOLOGICAL SETTING
The Tuareg shield
The Tuareg shield (Fig. 1) is composed of 23 terranes Archaean to Neoproterozoic
in age, juxtaposed after large displacements along mega-shear zones (Black et al., 1994;
Liégeois et al., 1994). Most of these shear zones are N-S oriented except to the east where
they are NW-SE oriented (Fig. 1). The central part of the shield (Central Hoggar) is
composed of well-preserved amphibolite to granulite-facies Archaean and
Paleoproterozoic terranes despite the major Pan-African reworking (Liégeois et al., 2003;
Peucat et al., 2003; Bendaoud et al., 2008). They constitute the LATEA metacraton
(Liégeois et al., 2003), located to the west of the Raghane shear zone (LATEA is the
acronym of the terranes constituting this metacraton: Laouni – Azrou n'Fad – Tefedest –

ACC
EPTE
D M
ANU
SCR
IPT
ACCEPTED MANUSCRIPT
5
Egéré-Aleksod; Liégeois et al., 2003). The metacratonization of LATEA, marked by mega-
shear zones, intrusion of batholiths (Bertrand et al., 1981; Acef et al., 2003) accompanied
by high-temperature metamorphism that can reach the amphibolite facies (Bendaoud et al.,
2008) occurred mainly at 620-600 Ma (Bertrand et al., 1981; Acef et al., 2003; Bendaoud
et al., 2008) and ended at c. 572 Ma, when high-level subcircular plutons such as the
Temaguessine pluton intruded (Abdallah et al., 2007). Later reactivations of the same shear
zones in LATEA are shown by the intrusion of subcircular alkali-calcic plutons
(Boissonnas, 1974; Azzouni-Sekkal et al., 2003) up to the Cambrian (Tioueine pluton, 524
±1 Ma; Paquette et al., 1998).
The terranes from Eastern Hoggar, by contrast to the other Hoggar terranes, are
bounded by mega-shear zones NW-SE oriented (Fig. 1), the reason why Eastern Hoggar
has long been considered as distinct (Lelubre, 1952; Bertrand and Caby, 1978). These NW-
SE shear zones join the major N-S oriented Raghane shear zone that marks the western
boundary of the Saharan metacraton (Liégeois et al., 1994; Abdelsalam et al., 2002) to
which the Eastern Hoggar terranes belong.
These terranes are the Aouzegueur, Edembo and Djanet terranes (Black et al., 1994;
Fig. 1). The two most eastern terranes are not studied here. Recent data and interpretation
indicate that they have been affected by a late Pan-African event: amphibolite (Edembo)
and greenschist facies (Djanet) metamorphism and granitoid intrusion in the 575-545 Ma
age range (Fezaa et al., submitted). The Aouzegueur terrane, just east of the Raghane shear
zone and studied here, comprises a c. 730 Ma old assemblage reminiscent of an oceanic
context (Caby and Andreopoulos-Renaud, 1987), a detrital sedimentary sequence (the
Tiririne Group; Blaise, 1961; Bertrand et al., 1978) separated from the latter by an angular
unconformity and intruded by a series of granitoid plutons and batholiths. Before this
study, only the Arigher batholith has been dated (c. 550 Ma, Rb-Sr isochron; Zeghouane et

ACC
EPTE
D M
ANU
SCR
IPT
ACCEPTED MANUSCRIPT
6
al., 2008). The Tiririne Group is more metamorphic and more deformed northward: tight
folds with N-S axial plane close to the 8°30 shear zone characterize the northern half of the
area while mainly moderate folding affected the southern half. Greenschist–facies
conditions are locally reached to the south while they are well-developed to the north.
On the other side of the Raghane shear zone is found the Assodé-Issalane terrane. It
is characterized by a high-temperature amphibolite facies metamorphism, a regional crustal
leucogranite (Renatt granite) and by high-K calc-alkaline batholiths and plutons that
intruded between 620 and 570 Ma (Guérangé and Lasserre, 1971; Bertrand et al., 1978;
Liégeois et al., 1994; 1998).
The studied plutons are located along the Raghane shear zone, in both the
Aouzegueur and Assodé-Issalane terranes (Fig. 2).
Field observation and U-Pb geochronology of the granitoids intruded along the
Raghane shear zone
U-Pb dating analytical techniques
The zircons have been analyzed in Montpellier by laser ablation ICP-MS (Inductively
Coupled Plasma Mass Spectrometer). Zircons were hand-picked in alcohol from the least
magnetic concentrates (1° tilt at full amperage). Selected crystals were then embedded in
epoxy resin, grounded and polished to expose internal structure. The sample mounts were
used for U-Th-Pb microanalyses using a Lambda Physik COMPex 102 excimer laser
generating 15 ns duration pulses of radiation at a wavelength of 193 nm. For analyses, the
laser was coupled to a Element XR sector-field ICP-MS and analytical procedures
followed those outlined in Bruguier et al. (2001) and given in earlier reports (e.g. Neves et
al., 2006; Dhuime et al., 2007). Analyses were acquired using a 26µm spot size of the laser
beam. Unknowns were bracketed by measurements of the G91500 zircon standard
ACC
EPTE
D M
ANU
SCR
IPT
ACCEPTED MANUSCRIPT
7
(Wiedenbeck et al., 1995), which were used for mass bias and inter-element fractionation
corrections. The calculated bias factors and their associated errors were then added in
quadrature to the individual errors measured on each unknown. Accurate common Pb
correction during laser ablation analyses is difficult to achieve, mainly because of the
isobaric interference of 204Hg on 204Pb. The contribution of 204Hg on 204Pb was estimated
by measuring the 202Hg and assuming a 202Hg/204Hg natural isotopic composition of
0.2298. This allows monitoring of the common Pb content of the analyzed zircon domain,
but corrections often resulted in spurious ages. Analyses yielding 204Pb close to or above
the limit of detection were thus rejected and Table 1 reports only analyses which were
found to contain no common Pb.
Granitoids in the Assodé-Issalane terrane
The Assodé-Issalane terrane that extends on 800 km from north to south (Fig. 1) is
characterized with a high-temperature amphibolite facies metamorphism accompanied by a
regional potassic leucogranite and by numerous high-K calc-alkaline batholiths and plutons
dated between 620 and 570 Ma (Guérangé and Lasserre, 1971; Bertrand et al., 1978,
Liégeois et al., 1994). This metamorphic basement is a high grade assemblage of banded
veined granitic to granodioritic gneisses, and a metasedimentary formation characterized
by fuschsite-bearing quartzites, calc-silicate gneisses and marbles, the whole being highly
deformed under ductile conditions.
This study is focused on the northern tip of the Assodé-Issalane terrane. In this area,
the Adaf pluton is dated at 593 ±17 Ma (9 zircon grains, MSWD= 0.73; recalculated from
Bertrand et al., 1978 with Isoplot, Ludwig, 2003). The similar granitic Honag pluton is
studied here and is considered as subcontemporaneous to the Adaf pluton. This pluton, just
south-west of the Adaf pluton intruded along the Honag shear zone. The Honag shear zone,
ACC
EPTE
D M
ANU
SCR
IPT
ACCEPTED MANUSCRIPT
8
NNE-SSW oriented is parallel to the shear zone limiting to the west the northern tip of the
Issalane-Assodé terrane, to which it is probably linked. The Honag pluton is made of a
pink medium-grained calc-alkaline biotite granite. Various enclaves, sometimes xenolithic,
are locally abundant (sites TR57 and TR58): they vary from a felsic to a mafic composition
and vary in size from a few cm to one hundred meters. Along the eastern boundary of the
pluton, the enclaves are N-S oriented, parallel to the structures of the metamorphic
country-rocks. Along its western boundary, along the NNE-SSW Honag shear zone, the
granite is highly deformed, presenting a foliation strongly dipping eastward (N180°/68°E)
and a lineation moderately plunging (15°) towards the south, indicating a dextral
movement with a slight uplift of the western side. Further from this shear zone (close to the
site TR59 – Fig. 2), discrete mylonitic bands alternate with undeformed granite. These
mylonites are late, affecting indistinctly the granite, the enclaves and the late dykes. The
mylonitic foliation is dipping (45°) towards the SSE.
Granitoids in the Aouzegueur terrane
The c. 600 Ma granitoid magmatic suite
In the southern part of the studied area, the Ohergehem pluton is located 7 km east
of the Raghane shear zone, close the Tiririne base of the ORGM. It is mainly composed of
a calc-alkaline biotite-bearing granodiorite (without amphibole). Its main minerals display
however a shape preferential orientation defining a foliation. The latter is present
everywhere in the pluton, except on its northeastern border. Mixing-mingling features with
a more mafic magma (dioritic) are observed mainly at the pluton boundaries. The same
foliation is observed in both magmas. Late thin dykes of quartz diorite crosscut the main
pluton and its foliation. The latter was then acquired during the magmatic crystallization of
the pluton. The metamorphic country-rocks display a foliation parallel to that of the pluton.

ACC
EPTE
D M
ANU
SCR
IPT
ACCEPTED MANUSCRIPT
9
Twenty-three zircons have been analyzed among which 11 are concordant and give
a Concordia age of 594 ±4 Ma, which is interpreted as the crystallization age of the
Ohergehem pluton (Fig. 3). This age corresponds to the main movements along the
Raghane shear zone and to the age of the main magmatic intrusions in the Assodé-Issalane
terrane such as the Adaf pluton (Bertrand et al., 1978) and the Dabaga-west in Aïr
(Liégeois et al., 1994). The twelve other zircons indicate the presence of inherited older
components in this pluton. Seven analyses are concordant between 624 ±14 Ma and 675 ±9
Ma, the others being slightly to the right of the Concordia. Such ages are known in
lithologies along the Raghane shear zone southward in the Aïr mountains in Niger
(Liégeois et al., 1994).
The c. 550 Ma granitoid magmatic suite
The large Arigher batholith is N-S elongated along the Raghane shear zone around
the Erg Kilian. It is considered as late to post-kinematic by Bertrand et al., 1978. The
granitoids from this batholith, locally rich in dark enclaves, do not present preferential
orientation of the main minerals, except close to the Raghane shear zone where they are
strongly deformed and oriented. In this deformed area, the foliation is subvertical within
the shear zone and steeps more to the east with a 70-80° westward plunge. Observed
criteria point to a mainly dextral subhorizontal movement along the shear zone.
Twenty-three zircons have been analyzed among which 14 are concordant and give
a Concordia age of 554 ±5 Ma, which is interpreted as dating the crystallization of the
Arigher batholith (Fig. 3). Five other zircons have young 206Pb/238U ages (down to 490 Ma)
suggesting that they have suffered Pb loss. The four remaining zircons are located to the
right of the Concordia and indicate the presence of an older component whose age cannot
be specified.

ACC
EPTE
D M
ANU
SCR
IPT
ACCEPTED MANUSCRIPT
10
The Oued Tiririne pluton (Fig. 2) is likely of neighboring age. It is partly covered
by alluvial deposits of the dry valleys of Tafassasset and of Tiririne, but also by the
discordant Tassilis Ordovician sandstones. This fine to middle-grained pink granite does
not show preferential orientation of its main minerals. Only locally green enclaves display
a NNE-SSW lengthening in the horizontal plane, the sole being observed. In the site TR75,
a lengthening plunging of about 50° toward the NNE has been estimated.
Three other plutons, from the same magmatic suite as the Arigher batholith, have
been studied.
The Kerkour pluton (Fig. 2) emplaced within the Tiririne series. A NE-SW-
oriented fault limiting the pluton to the NW is connected to the south with the Raghane
shear zone. Close this NE-SW fault, the granite is strongly deformed, with a foliation
dipping 70° towards the NW and a lineation plunging 60° northward.
The Tin Ghoras pluton (Fig. 2) is a circular intrusion of relatively small size. The
pluton forms a depression surrounded by high relief built by the sediments from the
Tiririne Group transformed by contact metamorphism. The outcrops correspond to the
external border of the depression and to small hills in the middle of the massif. The Tin
Ghoras pluton seals an N-S fault, satellite of the Raghane shear zone. This is a pink
medium-grained calc-alkaline high-K biotite granite with an equant texture. Close to the
contact with the host-rocks, feldspars increase in size. Microgranitic dykes crosscut the
granite. A dyke trending N120° is shifted on about 5 m by another dyke oriented N40°.
Close to this second dyke, an east-dipping rough foliation striking N10° can be observed in
the granite. This foliation corresponds to a well-developed plane of "en échelon"
fracturation in both dykes.
The sub-circular Adjou pluton (Fig. 2) is located between the Honag and Tin
Ghoras plutons, on the boundary between the Aouzegueur and Assodé-Issalane terranes.

ACC
EPTE
D M
ANU
SCR
IPT
ACCEPTED MANUSCRIPT
11
The Adjou granite comprise dark microgranular enclaves of mainly granodioritic
composition and cm- to dm-sized. Numerous NNW-SSE dykes, mostly microgranitic in
composition, crosscut the granite. These dykes generally show a N020° trending
fracturation.
The c. 800 Ma granitoid magmatic suite
Around the Oued Touffok, an elongated area along the Raghane shear zone appear
as a tectonic sliver (Fig. 2) in which intruded the Oued Touffok pluton, making an
important relief in the landscape. This is a fine to medium-grained amphibole-biotite
syenogranite. The pluton is cut in the middle by a large N-S valley, probably
corresponding to a satellite fault of the Raghane shear zone. Generally undeformed, this
pluton presents a visible planar shape preferential orientation of the main minerals, related
to a post-magmatic deformation, in the closest site (TA31 - Fig 2) to this valley.
Thirty-eight zircons have been analyzed among which 21 are concordant and give a
Concordia age of 793 ±4 Ma, which corresponds to the crystallization age of the Touffok
pluton (Fig. 3). No concordant or subconcordant zircons give younger ages. Among the
seventeen remaining analyses only strongly discordant zircon domains could indicate an
effect of the main movement along the Raghane shear zone that occurred around 600 Ma.
The Touffok tectonic sliver has not been pervasively affected by the main Pan-African
event. Another tectonic sliver along the Raghane shear zone, the Agalen area in Aïr, has
also delivered zircon ages around 800 Ma with no younger ages (Liégeois et al., 2005). For
Oued Touffok, nine inherited zircons spread along the Concordia from 1000 to 1400 Ma,
with an additional spot at 1834 ±46 Ma (Concordia age). This latter age is known to the
west in the Gour Oumelalen area (Peucat et al., 2003) and as a whole in Hoggar, including
in the Djanet sedimentary Group (Fezaa et al., subm). By opposition, Mesoproterozoic

ACC
EPTE
D M
ANU
SCR
IPT
ACCEPTED MANUSCRIPT
12
ages are lacking, as in West Africa in general (Ennih and Liégeois, 2008 and reference
therein). If the subconcordant zircons with ages between 1000 and 1400 Ma have not
suffered Pb loss and represent geologically meaningful ages, this would imply that the
Touffok sliver is strongly exotic in Hoggar. This has to be confirmed.
AMS SAMPLING SITES
The 158 sampling sites (Fig. 2) have been mostly settled along cross-sections
perpendicular to the main shear zones (e.g. roughly E-W). Enclaves and late-magmatic
dykes were locally sampled. Where possible, the working site had a size of 50 to 200 m2
where 6 or more cores were sampled (total sampling: 1064 cores).
- The large Arigher batholith has been sampled along 3 sections, a northern section with 16
sites (100 core-samples), a middle section with 11 sites (66 core-samples) and a southern
section with 11 sites (68 core-samples). In addition, 10 sites (91 core-samples) have been
chosen to the south within isolated outcrops representing apophyses of the pluton. Also, for
comparison purposes, three sites have been established to the west of the Arigher batholith:
two sites (TA09 and TA10) within brecciated rocks within the 8°30 shear zone and one site
(TA11 with 8 core-samples) within the highly deformed rocks of the Assodé-Issalane
terrane, on the other side of the Raghane shear zone.
- The small Oued Touffok pluton has been sampled in 9 sites (71 core-samples).
- The Ohergehem granite has been samples in 15 sites (120 core-samples).
- For the Honag granite, the 18 sites (125 core-samples) are located along a single section
from the Honag shear zone towards the east.
- Two sampled sections are crossing the Adjou pluton, one in its northern part (16 sites,
100 core-samples) and the other in its southern part (13 sites, 85 core-samples).
ACC
EPTE
D M
ANU
SCR
IPT
ACCEPTED MANUSCRIPT
13
- For the Tin Ghoras granite, the main E-W section (12 sites, 75 core-samples) has been
completed by 6 sites (35 core-samples) along a NNE-SSW section. Two of these sites (14
core-samples) correspond to late aplitic dykes crossing the granite.
- The outcrops of the Kerkour granite are limited in size: the sampling was made along two
short sections, with 5 sites (30 core-samples) in the north and 4 sites (24 core-samples) in a
relatively disturbed area in the south.
- The Oued Tiririne pluton was sampled in 11 sites (66 core-samples) along a NE-SW
section.
ROCK MAGNETISM
The mean susceptibility Km is generally high in the studied granitoids (Fig. 4). The
mean value per pluton varies between 4707 10-6 SI for the Oued Touffok pluton and 13733
10-6 SI for the Oued Tiririne pluton. For the other plutons, this value (in 10-6 SI) is 9757
(Arigher), 11403 (Ohergehem), 6864 (Honag), 8758 (Adjou), 5162 (Tin Ghoras) and 7244
(Kerkour). The values are generally homogeneous within each site, but can vary
significantly from one site to another in a same intrusion. A strong weathering is clearly
one of the factors affecting the mean susceptibility by decreasing its value (Henry et al.,
2007): in the Oued Tiririne pluton, the strongly weathered site TR80 has Km values varying
from 4 to 754 10-6 SI according to the samples while these values in the other sites of the
same pluton vary from 4782 to 37030 10-6 SI. The mean susceptibility in the dykes (70 10-6
and 4179 10-6 SI in the sites TR23 and TR40 of the Adjou pluton respectively, 2812 10-6 SI
in the neighboring sites TR03 and TR04 of the Tin Ghoras pluton) is lower than in their
granitic host-rocks (4218 10-6 and 5395 10-6 SI in the sites TR23 and TR40 respectively,
6625 10-6 SI in the site TR02 close to the sites TR03-TR04). The enclaves of the site TR58
in the Honag pluton have higher susceptibility (13815 10-6 SI) than the neighboring granite
ACC
EPTE
D M
ANU
SCR
IPT
ACCEPTED MANUSCRIPT
14
samples (8345 10-6 SI). The metamorphic rocks of the Issalane terrane in the site TA11
have very high susceptibility (0.2 SI).
Thermomagnetic analyses of low field magnetic susceptibility were carried out
using a KLY-3 Kappabridge with high- and low-temperatures attachments CS2-3 (AGICO,
Brno). The curves are similar for all the studied plutons, including for their aplitic dykes.
For high temperatures (Fig. 5), they point out a weak mineralogical alteration during
heating (Henry, 2007). They show mainly a sharp decrease of susceptibility around 580
°C, which is the Curie temperature of pure magnetite. The presence of pure magnetite is
also indicated by a clear Verwey transition (Fig. 5), which corresponds to a change of
mineralogical phase associated with a variation of magnetic susceptibility, occurring at low
temperature. The rectangular shape of the high temperature thermomagnetic curves and the
absence of well-expressed Hopkinson peak suggest that the magnetite is of large multi
domain (MD) size (O'Reilly, 1984).
Hysteresis loops were determined using a translation inductometer within an
electromagnet reaching 1.6 T. The curves for all the plutons, including the aplitic dykes,
are similar. Their examination (Fig. 6a) reveals a weak coercive force (Bc varies from 3 to
7 mT). The values (Fig. 6b) of the corresponding ratios of hysteresis parameters (Day et
al., 1977) confirm that the magnetite grains of the studied granites have a large
multidomain size. We can thus expect a magnetic fabric directly related to the shape of the
magnetite grains.
MAGNETIC FABRIC
AMS in low field, measured using a KLY3 Kappabridge, yields the principal
magnetic susceptibility axes maximum K1 (magnetic lineation), intermediate K2 and
minimum K3 (pole of the magnetic foliation). The Jelinek (1981) intensity P' and shape T

ACC
EPTE
D M
ANU
SCR
IPT
ACCEPTED MANUSCRIPT
15
(possibly varying from +1 for oblate to -1 for prolate) parameters were used to describe the
magnetic fabric. The data for a group of samples, at the site scale as well as at the pluton
scale, were analyzed using normalized tensor variability (Hext, 1963; Jelinek, 1978),
simple bootstrap (Henry, 1997) and bivariate (Henry and Le Goff, 1995) statistics. For
bivariate statistics (Le Goff, 1990; Le Goff et al., 1992), weighting by precision parameter
k related to measurement uncertainty was applied. The three methods gave similar results.
The magnetic zone axis (Henry, 1997) was determined, with its associated confidence
zones at 63 and 95%, in order to obtain indications about the origin (stretching or planes
intersection) of the magnetic lineation. Mean tensor data (indicated in the text by bold
characters) obtained at the pluton scale generally give only a rough indication, being only
clearly significant for data from pluton with coherent fabric, as in several of the studied
pluton here. The comparison of P' and T values from the mean tensor and from the average
of the corresponding samples data yields information about the scattering of the different
principal axes in the samples.
The c. 790 Ma granitoid magmatic suite (Aouzegueur terrane)
In the Aouzegueur terrane, close to the Raghane shear zone, the old Oued Touffok
pluton (793 ±4 Ma), most K1 and K3 axes are well-clustered (Fig. 7e), but a larger
scattering appears in some sites (in particular in the sites the farthest from the Raghane
shear zone). The P' (from 1.023 to 1.543, mean 1.160) and T (from -0.72 to 0.76, mean
0.05) values also present some scattering. The magnetic zone axis (D=11°, I=4°) coincides
with the mean K1 (D=12°, I=4°). No correlation appears between P' values and the mean
susceptibility. For the mean tensor, K3 (D=105°, I=36°) and K1 axes are well-defined
(Fig. 7f, Tab. 2). The P' (1.111) and T (-0.28) values are not well-specified as shown by a
bootstrap application to the P'-T diagram. The more prolate shape of the mean tensor
ACC
EPTE
D M
ANU
SCR
IPT
ACCEPTED MANUSCRIPT
16
compared to the samples data reflects a scattering in the samples data larger for the
magnetic foliation than for the magnetic lineation. In the single site where a post-magmatic
fabric is clearly visible, magnetic and visible foliations well agree and the P' parameter
presents the highest values obtained in the pluton.
The c. 600 Ma granitoid magmatic suite (Assodé-Issalane and Aouzegueur
terranes)
In the Assodé-Issalane terrane, in the Honag pluton (593 ±17 Ma), the principal K1
and K3 axes are relatively well-clustered (Fig. 7g), and the well-defined magnetic zone axis
(D=175°, I=25°) is not significantly different from the mean K1 axis (D=182°, I=18°). The
P' (from 1.060 to 1.414, mean 1.167) and T (from -0.77 to 0.96, mean -0.04) values again
show scattering. The P' and mean susceptibility values do not present significant
correlation. For the mean tensor, K3 (D=297°, I=54°) and K1 are well specified (Fig. 7h,
Tab. 2). On the P'-T diagram, mean P' (1.117) and T (-0.28) values are also well-defined,
as shown by bootstrapping. In the site TR49, very close to the NNE-SSW Honag shear
zone (Fig. 2), the magnetic and visible foliations and lineations coincide and the magnetic
zone axis does not correspond to the K1 axis (showing that the latter is a mineral lineation).
This is not the case in site TR48, located further from the shear zone and where the degree
of visible deformation is lower. In the site TR59 in the "undeformed" granite close to the
mylonitic zone plunging 45° toward the SSE, the magnetic foliation shows a plunge
similar to that of the mylonitic zone. In addition the magnetic foliation is mostly SSE
plunging, except close to the Honag shear zone. The magnetic lineation has a similar
orientation in all the sites.
In the Aouzegueur terrane, the contemporaneous Ohergehem pluton (594 ±4 Ma)
display most principal axes of the samples relatively well clustered, within each site as for
ACC
EPTE
D M
ANU
SCR
IPT
ACCEPTED MANUSCRIPT
17
the whole pluton, for K1 and for K3 axes (Fig. 7a). The mean K1 (D=228°, I=58°) is
statistically different (non-overlapping confidence zones at 95%) from the magnetic zone
axis (D=297°, I=34° - Fig. 7b). The P' value varies from 1.021 to 1.556 (mean 1.250), the
highest values corresponding to the highest mean susceptibilities. The T parameter value
presents also a large scattering between -0.81 and 0.73 (mean 0.09). The mean tensor K3
(D=54°, I=32°) and K1 axes are very well-defined (Fig. 7b, Tab. 2). Bootstrap
determination shows that the values for the mean tensor on the P'-T diagram (P'=1.170,
T=0.07) are also well-defined and close to the mean samples values, confirming the weak
scattering of the K1 and K3 axes in the samples data. In this pluton, there is a good
coincidence between the magnetic foliation and the foliation determined in the field, for all
the sites where it has been possible to determine it properly. On a map (Fig. 8a, b), the
magnetic foliation and lineation are coherent, except on the eastern border of the pluton
where the visible foliation also shows a more variable orientation.
The c. 550 Ma granitoid magmatic suite
On the boundary between Assodé-Issalane and Aouzegueur terranes, the Adjou
pluton has been studied through two cross-sections separated by 20 km (Fig. 2). Both
sections (Fig. 7i) show relatively well-grouped but distinct principal axes: the obtained
mean tensors (Fig. 7j, Tab. 2) indicate neighboring mean K1 axes (D=25°, I=10° and
D=41°, I=7° for the northern and southern sections, respectively) but clearly different K3
axes (D=150°, I=73° and D=134°, I=22° for the northern and southern sections,
respectively). Similarly, the mean shape is different in the northern (T=0.34) and southern
(T=-054) sections. On a map, the orientation of the magnetic lineation is very similar for
all sites from the southern section and from the middle part of the northern section.
ACC
EPTE
D M
ANU
SCR
IPT
ACCEPTED MANUSCRIPT
18
In the Arigher batholith (554 ±5 Ma) in the Aouzegueur terrane, the scattering of
the principal axes of samples is relatively high with however a clear dominant orientation
for K1 as for K3 axes (Fig. 7c). The mean K1 (D=180°, I=7°) is different from the magnetic
zone axis (D=280°, I=74°). The P' values show a large variation from 1.010 to 1.736
(mean 1.148). The T parameter values present also a very large scattering between -0.94
and 0.95 (mean 0.22). For the mean tensor, well-defined mean direction for K3 (D=88°,
I=17°) and for K1 can be determined (Fig. 7d, Tab. 2), with a lower P' value (1.067) and a
more oblate shape (T=0.51) when compared to the sample data. This indicates that in the
sample data, the K1 axes are more scattered than the K3 axes. There is an excellent
coincidence between the magnetic and visible foliations and lineations in all the sites
located in the neighborhood of the Raghane shear zone, where a post-magmatic fabric is
visible. On a map (Fig. 8c, d), the strike of the magnetic foliation is similar to that of the
Raghane shear zone close to this latter. It is often rather similar to that of the NNE-SSW
faults in the other parts of the pluton. The magnetic lineation also shows these both
directions according to the sites.
The principal K1 axes in the Tin Ghoras pluton are grouped, while K3 axes are
more scattered in the plane perpendicular to K1, with however two main clusters (Fig. 7k).
The magnetic zone axis (D=9°, I= 2°) in such a case is well-defined and coincides with the
mean K1 axis (D=9°, I=2°). The P' (from 1.029 to 1.185, mean 1.070) and T (from -0.87 to
0.82, mean -0.03) values show high variations and no clear correlation appears between the
P' and the values of mean susceptibility. For the mean tensor, K3 (D=268°, I=77°) is
associated with a lengthened confidence zone perpendicular to the well-defined K1 (Fig. 7l,
Tab. 2). The P' (1.046) and T (-0.47) values are associated with a large confidence zone on
the P'-T diagram. The shape, more prolate in the mean tensor than in the sample data,
reflects the scattering of the K3 sample data. The sites TR03 and TR04 correspond to two
ACC
EPTE
D M
ANU
SCR
IPT
ACCEPTED MANUSCRIPT
19
late-magmatic aplitic dykes of different orientation and the site TR02 to the pluton close to
these dykes. The fabric is remarkably similar in orientation in these three sites (Fig. 9). The
magnetic foliation corresponds to the visible foliation in the granite and to the equivalent
fracture plane in the dykes. The P' values in the dykes (1.126 and 1.134 in sites TR03 and
TR04 respectively) are higher than in the granite (1.079 in site TR02), although the mean
susceptibility in the dykes (3087 and 2538 in 10-6 SI for sites TR03 and TR04 respectively)
is lower than in the granite (6625 in 10-6 SI for site TR02). Let us notice that the fabric is
more oblate in the dyke almost parallel to the magnetic foliation (T=0.47) than in the dyke
perpendicular to this foliation (T=0.11); this reflects the additional flattening exerted by the
dyke walls within the dykes (Henry, 1974). On a map (Fig. 8e, f), the magnetic foliation is
mainly plunging to the W to NNW in the middle and eastern parts of the pluton, while it is
plunging eastward in its western part.
The principal axes are relatively scattered in the Kerkour pluton, with however a
dominant orientation for K1 as for K3 (Fig. 7m). The magnetic zone axis (D=230°, I=12°) is
not significantly different from the mean K1 axis (D=225°, I=1°). The P' (from 1.058 to
1.421, mean 1.202) and T (from -0.73 to 0.66, mean 0.01) values present large variations.
There is a rough global increase of P' values with the increase of the mean susceptibility.
For the mean tensor, K3 (D=134°, I=27°) is more precisely defined than K1 (Fig. 7n,
Tab. 2); P' (1.135) and T (0.44) values are not well defined. On a map, the axes orientation
from the northern section is more coherent than those from the southern one. The magnetic
lineation is plunging toward the NNE to NE in the northern section, while it is dipping
toward the W to WSW in the southern one. In the sites close to the NNE-SSW border fault,
the visible and magnetic fabrics show similar orientations.
The scattering of the principal axes is important in the Oued Tiririne pluton
(Fig. 7o), as well as the variation of the P' (from 1.013 to 1.246, mean 1.120) and T (from

ACC
EPTE
D M
ANU
SCR
IPT
ACCEPTED MANUSCRIPT
20
-0.71 to 0.71, mean -0.02) values. The magnetic zone axis (D=308°, I=3°) and the mean K1
axis (D=309°, I=5°) are not significantly different. For the mean tensor, the confidence
zone for K3 (D=45°, I=44°) and for K1 are both elongated (Fig. 7p, Tab. 2) and P' (1.127)
and T (0.26) values are not precisely defined on the P'-T diagram. On a map, the magnetic
foliation is plunging to the southwest in most sites. Similarly, the magnetic lineation is
different in the southern (WSW-ENE) and northern (WNW-ESE) parts of the pluton. The
magnetic fabric does not correspond to the fabric determined with the preferential
orientation of the enclaves.
DISCUSSION
Magnetic fabric-forming conditions
The old c. 790 Ma magmatic suite
In the old Oued Touffok pluton (793 ±3 Ma), the magnetic and visible fabrics in
the site TA31 are related to the post-magmatic deformation connected with movements
along the Raghane shear zone. However, similar orientation of the principal axes has been
obtained in most sites, but with lower P' values. This suggests that the magnetic fabric in
these sites is related to the post-magmatic deformation visible in the site TA31, the
decrease of the deformation intensity being outlined by the decrease of the P' values. In
three sites far from the site TA31, the magnetic fabric presents a different orientation (E-W
foliation). This older pluton underwent different events since its emplacement and the
fabric in these three sites could be related to emplacement. This indicates that the c. 790
Ma structures are probably preserved in the Oued Touffok sliver, except close to a N-S
satellite-fault of the Raghane shear zone in the middle of the pluton, pointing to a rather
rigid body. This is in agreement with the tectonic structures in the Tiririne Group that skirt
around the Touffok sliver (Fig. 2).

ACC
EPTE
D M
ANU
SCR
IPT
ACCEPTED MANUSCRIPT
21
The main c. 600 Ma magmatic suite (Assodé-Issalane and Aouzegueur
terranes)
The highly deformed area in the Honag pluton (593 ± 17 Ma, Assodé-Issalane
terrane) corresponds to the highest P' values. Further from the shear zone, where the
visible deformation is of lower intensity, the magnetic fabric becomes similar to that
determined in the apparently equant granite: like in the Alous-En-Tides pluton (Henry et
al., 2004), the initial magnetic fabric was not, or slightly, affected after the emplacement of
the pluton. In its central part, the Honag pluton presents a narrow mylonitized zone dipping
to the SSE. The magnetic foliation in the apparently undeformed granite close to this
mylonitized zone is parallel to the visible foliation in the mylonitized rocks, which is not
the case close to the Honag shear zone. This indicates that the shear zones present within
the pluton developed at the end of the magmatic stage under the same stress. Movements
along the main Honag shear zone also occurred during the emplacement of the Honag
pluton, as shown by the elongated shape of the pluton along the shear zone, but they
occurred also later, in a more brittle manner.
The Ohergehem pluton (594 ± 4 Ma) displays a strong visible fabric, demonstrated
to have occurred during the crystallization of the magma, which coincides with the
magnetic fabric. The latter is therefore related to the syn-magmatic deformation that
already oriented the main minerals. It also coincides with the fabric of the metamorphic
country-rocks. The difference between the magnetic zone axis and the K1 axis indicates
that the magnetic lineation is a mineral stretching lineation and is not related to an
intersection of magnetic foliations. The foliation is globally N-S while the stretching
lineation is NE-SW with a plunge of 60° to the SW. This corresponds to the Dabaga-East
plutons in Aïr (Liégeois et al., 1994), which have been considered as syn-thrust (Liégeois

ACC
EPTE
D M
ANU
SCR
IPT
ACCEPTED MANUSCRIPT
22
et al., 1998). These thrusts were probably associated with large movements that occurred
along the Raghane shear zone. The intrusion of the Ohergehem pluton occurred during the
same period as the Adaf and Honag plutons but along different structures, which can be
related to the different nature of the Assodé-Issalane and Aouzegueur terrane, the latter
belonging to the more rigid Saharan metacraton.
The c. 550 Ma magmatic event
This pluton family share similar characteristics. They are all intrusive within the
Tiririne greenschist facies sedimentary Group, pointing to a common relatively shallow
depth of intrusion. Except close to shear zones, the main minerals do not show a significant
shape preferential orientation. The stress contemporaneous to the crystallization was thus
weak and not able to induce deformation or flow orientation within the crystallizing mush.
However, the magnetic fabric is well developed (high P' values) and homogeneous within
each pluton. The magnetic zone axis did not allow interpreting the origin of the magnetic
lineation, except in the Arigher batholith: for the latter, the difference between the
magnetic zone axis and the K1 axis indicates that the latter is related to a mineral stretching
lineation.
When the "frame" of the granite is acquired by the crystallization of the main
minerals, the stress environment changed from the "hydrostatic" to the "anisotropic" type.
The anisotropy of the magnetite, which crystallized mostly during this period, reflects the
regional stress conditions during the late-magmatic stage. This is confirmed by the
homogeneity of the magnetic fabric in all these plutons, particularly the magnetic lineation
orientation that is independent from the plutons shape. This is not always the case for the
magnetic foliation, which sometimes shows, for example in Tin Ghoras pluton, coherent
variations in the orientation. Such variations are probably partly related to the shape of the

ACC
EPTE
D M
ANU
SCR
IPT
ACCEPTED MANUSCRIPT
23
intrusion, as it was already observed in the eastern part of the Teg Orak pluton (Henry et
al., 2008). An interesting example for the fabric-forming conditions is given by the Oued
Tiririne pluton. This granite often includes lengthened dark microgranular enclaves whose
preferential orientation indicates the flow direction during the initial magma emplacement.
This direction is not reflected by a shape preferential orientation of the main minerals,
which therefore crystallized mainly after the initial flowing. Measured magnetic fabric is
also independent from the flow direction, though relatively coherent in the whole pluton.
The magnetic fabric therefore corresponds to the late-magmatic crystallization stage when
the magma was not moving a lot anymore. These fabric-forming conditions during the late-
magmatic stages are also indicated by the similar fabric observed in the granite and in the
late aplitic dykes in the Tin Ghoras pluton.
The Arigher pluton is affected by a strong deformation on its western border along
the Raghane shear zone. Like in the Honag granite, the magnetic foliation is parallel to the
shear zone and P' values are high (higher than 1.2). Further east, the magnetic foliation
becomes striking NNE-SSW and P' values are lower (between 1.04 and 1.17). The NNE-
SSW direction is that of several important fractures crossing the pluton and could be
conjugated with the Raghane shear zone.
The Kerkour granite is strongly deformed along its northwestern border that
follows a NNE-SSW fault. The magnetic fabric presents a similar orientation in the
deformed and in the equant areas of the pluton. The P' values in the different sites cannot
be reliably compared due to the important variation of the mean susceptibility. The shape
of the susceptibility ellipsoid changes progressively towards the east in the northern section
from rather prolate (T=-046) very close to the fault, to neutral (T=0.03) and rather oblate
(T=0.36) in the east, without any significant change in the orientation of the sub-horizontal
NNE-SSW magnetic lineation. This indicates a syn-tectonic emplacement of the Kerkour

ACC
EPTE
D M
ANU
SCR
IPT
ACCEPTED MANUSCRIPT
24
with the tectonic movements lasting longer than the crystallization, leading to post-
magmatic structures along the fault and only high temperature orientation (AMS) in the
rest of the pluton. This tectonic activity corresponds to a strain-slip movement along the
fault.
The Tin Ghoras and Adjou plutons have a well-clustered sub-horizontal magnetic
lineation and more variable orientation of the magnetic foliation. The magnetic lineations
have a direction NNE- SSW to N-S close to that of the main shear zones (8°30 and Honag)
and reflects a shearing background related to these shear zones that should have functioned
contemporaneously. Both plutons do not show deformed areas. They intruded within N-S
structures (Raghane shear zone and one of its satellite-fault) which seem to have not been
active after the pluton emplacement.
The Oued Tiririne pluton is the only pluton studied here that is located far
eastward from the Raghane shear zone. The magnetic lineation is sub-horizontal like in the
other studied plutons, but with a very different direction (WNW-ESE). The magnetic
foliation is mainly SW-dipping with variable plunge. This orientation is parallel to the
shear zones separating the Aouzegueur, Edembo and Djanet terranes that are considered as
generated during the 575-545 Ma time interval due to the late interaction with the Murzuq
craton (Fezaa et al., submitted).
Tectonic movements and granitoid emplacement along the Raghane shear
zone, western boundary of the Saharan metacraton
The main movements along the Raghane shear zone occurred at around 600 Ma, the
main Pan-African event in the Tuareg shield (Bertrand et al., 1978; Black et al., 1994;
Liégeois et al., 1994; 2003). This movement is a N-S movement through transpression
along the western boundary of the Saharan metacraton, inducing a dextral subhorizontal

ACC
EPTE
D M
ANU
SCR
IPT
ACCEPTED MANUSCRIPT
25
movement and by secondary thrusts towards the east (Liégeois et al., 1994), i.e. towards
the Saharan metacraton, here represented by the Aouzegueur terrane.
The Ohergehem pluton (594 ±4 Ma) displays a structure in agreement with that
model: it is close to the Raghane shear zone with AMS lineations and foliation indicating
that it intruded within the thrust structures associated with the Raghane shear zone within
the Aouzegueur terrane.
The Honag pluton (593 ±17 Ma, age of the very similar and neighbor Adaf pluton)
intruded in a peculiar area, at the northern tip of the Assodé-Issalane terrane, where it is
closing in a spoon-shape structure. This means that this pluton was affected by both the
shear zones delimiting this terrane to the east (the Raghane shear zone) and to the west (the
Honag shear zone being a major satellite fault of the main shear zone located slightly to the
west). The AMS N-S lineation and NNE- SSW foliation indicate that these plutons
intruded during movements along these main shear zones that therefore functioned
contemporaneously. The discrete deformed parts seen in the fields, present along the
pluton boundaries and as discrete elongated sheared areas within the pluton, have the same
direction as the magnetic lineations: this indicates that the movements along the shear
zones continued some time after the crystallization of the magmas in more brittle
conditions.
The c. 600 Ma was thus the period of the northward movement of the Assodé-
Issalane terrane along the western boundary of the Saharan metacraton, only affected by
secondary thrust structures along the Raghane shear zone. These movements have been
probably facilitated by the magma intrusions. The cessation of these movements probably
occurred soon after the cessation of the magmatic intrusions of this magmatic suite, i.e. not
long after 590 Ma. This is in agreement with the age of the late Temaguessine pluton more

ACC
EPTE
D M
ANU
SCR
IPT
ACCEPTED MANUSCRIPT
26
to the west (582 ±5 Ma, SHRIMP U-Pb zircon age; Abdallah et al., 2007), considered as
closing the main Pan-African phase in LATEA (Central Hoggar; Abdallah et al., 2007).
During that large movement of the Assodé-Issalane terrane, some tectonic slivers
were transported along the Raghane shear zone, whose origins remain enigmatic. This is
the case of the Touffok sliver that behaved as a small rigid body during the main Pan-
African event: the subcircular Touffok granite present in this sliver has been dated here at
793 ±4 Ma, preserved locally its magmatic ASM structures; its central part has been
affected by a satellite-fault of the Raghane shear zone. Currently, this age range is not
known in Hoggar and this sliver could be exotic. A link would be possible with the c. 730
Ma age known in to the SE in the Aouzegueur terrane (Caby and Andreopoulos-Renaud,
1987) but this has to be assessed and falls beyond the aims of this paper.
The Tiririne formation is only weakly deformed and metamorphized in the southern
studied area while the degree of both deformation and metamorphism strongly increases
northwards. Bertrand et al. (1978) even pointed that this formation was overlain by a
limited thrusting by Assode-Issalane series. This implies a weak clockwise rotation of a
large block of the Assode-Issalane border relatively to Aouzegueur terrane. This is a
consequence of the rheological contrast between Assode-Issalane and Aouzegueur
terranes.
In the Oued Tiririne pluton, located further from the Raghane shear zone, the
lineations are NW-SE oriented, parallel to the main shear zones bounding the Aouzegueur
terrane to the east, separating it from the Edembo terrane. This orientation is the same as
the shear zone separating the Edembo and the Djanet terrane whose functioning has been
established at 570-545 Ma (Fezaa et al., submitted) and due to convergence with the
Murzuq terrane. We can then relate the intrusion of this pluton to this event: the NW-SE
shear zones separating the Djanet, Edembo and Aouzegueur terranes merged with the
ACC
EPTE
D M
ANU
SCR
IPT
ACCEPTED MANUSCRIPT
27
Raghane shear zone that they reactivated on its northern section, reactivation that deformed
and metamorphosed the Tiririne Group. This event appears thus to be mainly restricted to
the Saharan metacraton. With such an assumption, this pluton should be slightly older than
the last plutons that intruded within the already deformed Tiririne formation.
The last granitoid magmatic suite occurred at c. 550 Ma, as marked by the large
Arigher batholith dated at 554 ±5 Ma (U-Pb zircon, this study) and at 553 ±20 Ma (Rb-Sr
isochron, Zeghouane, 2006; Zeghouane et al., 2008). The Arigher batholith has N-S
magnetic foliation and subhorizontal lineation when close to the Raghane shear zone but a
NNE-SSW orientation can be observed eastwards. A neighboring, but more coherent,
pattern appears also in the northern plutons which show a regular evolution of the mean
magnetic fabric from the NW to the SE: The relatively close Tin Ghoras and the northern
section of Adjou give the same magnetic fabric, with subhorizontal lineation slightly
deviated toward the NNE-SSW while in the southern section of Adjou this deviation is
stronger; a NNE-SSW orientation, parallel to NNE-SSW shear zone, is reached in the
Kerkour pluton. In the same locations, mean magnetic foliation evolves from subhorizontal
(Tin Ghoras and northern Adjou section) to strong NW-plunge (Southern Adjou and
Kerkour). Moreover, the last displacements along the shear zones, N-S to the south and
NNE-SSW to the north, likely corresponded again to a very weak clockwise rotation of a
large block on the Assodé-Issalane border relatively to the Aouzegueur terrane. All this
evolution clearly illustrates the major role of the N-S Raghane shear zone and of its
associated NNE-SSW shear zones in the final structuration of all the western Aouzegueur
border, as the consequence of the Murzuq event.
The western limit of the Saharan metacraton, marked by the Raghane shear zone
remained a major separation between terranes of very contrasted rheology during the
whole Pan-African and late Pan-African period. It acted as a western boundary for the c.

ACC
EPTE
D M
ANU
SCR
IPT
ACCEPTED MANUSCRIPT
28
550 Ma Murzuq-related event and as a major boundary during the c. 600 Ma main Pan-
African event.
CONCLUSION
The N-S oriented Raghane mega-shear zone marks the western boundary of the
Saharan metacraton and is one of the major tectonic boundaries in the Hoggar, main part of
the Tuareg shield. It separates the Aouzegueur terrane to the east, affected at most by a
greenschist facies metamorphism and belonging to the Saharan metacraton, from the
Assodé-Issalane terrane, affected by a Pan-African high-temperature amphibolite facies
metamorphism to the west (Liégeois et al., 1994).
We have dated here by the U-Pb laser ICP-MS on zircon method three magmatic
suites of granitoids that appear in the field as mostly undeformed. These are:
(1) the Touffok granite (793 ±4 Ma) present in an old tectonic sliver;
(2) the Ohergehem pluton (594 ±4 Ma) from the south of the Aouzegueur terrane close to
the Raghane shear zone, an age that corresponds to the main granitic event in the Assodé-
Issalane terrane (Bertrand et al., 1978; Liégeois et al., 1994);
(3) the Arigher batholith (554 ±5 Ma) from the Aouzegueur terrane; this magmatic suite is
not known in the Assodé-Issalane terrane but is known more to the east in the Djanet and
Edembo terranes. This magmatic suite is typical of the Saharan metacraton.
The AMS (Anisotropy of Magnetic Susceptibility) that we conducted on 8 plutons
among which are the three dated bodies allow us to conclude that:
(1) The pluton parts that appear undeformed in the field have a magnetic lineation and
foliation compatible with the deformed zones seen in these plutons close to the shear
zones. This means that these plutons are syn-tectonic and that the deformed part seen in the

ACC
EPTE
D M
ANU
SCR
IPT
ACCEPTED MANUSCRIPT
29
field are zones deformed in post-solidus conditions, the shear stress continuing when the
magma has crystallized.
(2) The magnetic structure of all plutons are related to the nearby mega-shear zones, the
Raghane shear zone for most of them, i.e. a N-S to NNE-SSW subhorizontal stretching
lineation and a subvertical foliation generated by the northward movement of the Assodé-
Issalane terrane along the western boundary of the Saharan metacraton marked by the
Raghane shear zone.
Other structures of major importance are however seen:
(1) In the old Touffok tectonic sliver, the c. 793 Ma Touffok granite has a structure related
to the Raghane shear zone in its central part but preserved locally its emplacement
structure.
(2) In the c. 600 Ma granite magmatic suite, a NE-SW lineation in the western part of the
plutons studied in the Assodé-Issalane terrane (Honag pluton), reflecting the influence of
the shear zone marking the western boundary of this terrane; this pluton is indeed located
at the northern tip of the terrane where the two boundaries, eastern and western, are
converging; in the Ohergehem pluton, the foliation is globally N-S while the stretching
lineation is NE-SW with a plunge of 60° to the SW, which correspond to the thrust
structures associated with the Raghane shear zone on its eastern side as in Aïr (Liégeois et
al., 1994).
(3) The c. 550 Ma granite magmatic suite has a structure related to the Raghane shear zone
or its associated NNE-SSW structures when close to them, whatever the size of the body,
whatever the Arigher batholith or the small Tin Ghoras pluton are concerned. When further
from the Raghane shear zone, which is the case of the Oued Tiririne pluton, the lineation is
NW-SE oriented, parallel to the main shear zones bounding the Aouzegueur terrane to the
east, and characteristic of the Saharan metacraton in the Tuareg shield, resulting from a

ACC
EPTE
D M
ANU
SCR
IPT
ACCEPTED MANUSCRIPT
30
convergence with the Murzuq craton (Fezaa et al., submitted). The northern part of the
Raghane shear zone was reactivated by these late NW-SE oriented shear zones in which
they merged. This event appears thus to be mainly restricted to the Saharan metacraton.
Acknowledgements
This project is supported by the DEF-CNRS cooperation program between Algeria
and France. We are very grateful to the civil and military authorities at Tamanrasset and
Djanet, to the “Office du Parc National de l'Ahaggar” (OPNA) and to the “Office du Parc
National du Tassili” (OPNT) for their help. Positive comments G. Borradaile and M.S.
Petronis improved significantly the quality of the paper.
References
Abdallah, N., Liégeois, J.P., De Waele, B., Fezaa, N., Ouabadi, A., 2007. The Temaguessine Fe-cordierite orbicular granite (Central Hoggar, Algeria): U–Pb SHRIMP age, petrology, origin and geodynamical consequences for the late Pan-African magmatism of the Tuareg shield. J. Afric. Earth Sci. 49, 153-178.
Abdelsalam, G., Liégeois, J-P, Stern, R.J., 2002. The Saharan Metacraton. J. Afric. Earth Sci., 34: 119–136
Acef, K., Liégeois, J.P., Ouabadi, A., Latouche, L., 2003. The Anfeg post-collisional Pan-African high-K calc-alkaline batholith (Central Hoggar, Algeria), result of the LATEA microcontinent metacratonization. J. Afric. Earth Sci., 37, 295-311.
Archanjo, C. J., Bouchez, J. L. Corsini, M., Vauchez, A., 1994. The granite pluton of Pombal: magnetic fabric and place within the Brasiliano strike-slip tectonics of NE-Brazil, J. Struct. Geol.; 16: 323-335.
Arène, J., Blaise, J., Bourgeois, M., Bouvet, M. Byramjee, R., Guérangé, B., Illy, P., Reboul, C., Roche, J., Vialon, P., Lelubre, M., 1961. Geological map "Tazrouk". Bureau de Recherches Minières de l'Algérie and Bureau de Recherches Géologiques et Minières.
Auréjac, J.B., Gleizes, G., Diot, H., Bouchez, J.L., 2004. Le complexe granitique de Quérigut (Pyrénées, France) réexaminé par la technique de l'ASM: un pluton syntectonique de la transpression dextre hercynienne. Bull. soc. géol. France, 175: 157-174.
Azzouni-Sekkal, A., Liégeois, J.-P., Bechiri-Benmerzoug, F., Belaidi-Zinet, S., Bonin,B. 2003. The ‘‘Taourirt’’ magmatic province, a marker of the closing stage of the Pan-African orogeny in the Tuareg Shield: review of available data and Sr–Nd isotope evidence. J. Afric. Earth Sci., 37, 331–350.
Bendaoud A., Ouzegane K., Godard G., Liégeois J.P., Kienast J.R., Bruguier O., Drareni A., 2008. Geochronology and metamorphic P-T-X evolution of the Eburnean granulite-facies metapelites of Tidjenouine (Central Hoggar, Algeria): witness of

ACC
EPTE
D M
ANU
SCR
IPT
ACCEPTED MANUSCRIPT
31
the LATEA metacratonic evolution. In : N. Ennih and J.P. Liegeois (Eds.), The Boundaries of the West African Craton, Geol. Soc., London, Spec. Pub., 297, 111-146.
Bertrand, J.M.L., Caby, R., 1978. Geodynamic evolution of the Pan-African orogenic belt: a new interpretation of the Hoggar shield. Geol. Rundsch., 67, 357-388.
Bertrand, J.M.L., Caby, R., Ducrot, J., Lancelot, J., Moussine-Pouchkine, A., Saadallah, A. 1978. The late Pan-African intracontinental fold belt of the eastern Hoggar (central Sahara, Algeria): Geology, structural development, U/Pb geochronology, tectonic implications for the Hoggar shield. Precamb. Res., 7: 349-376.
Bertrand, J.M.L., Michard, A., Boullier, A.M., Dautel, D., 1986. Structure and U/Pb geochronology of Central Hoggar (Algeria): a reappraisal of ist Pan-African evolution. Tectonics, 5, 955.972.
Black, R, Latouche, L., Liégeois, J.-P., Caby, R., Bertrand, J.M. 1994. Pan-African displaced terranes in the Tuareg shield (Central Sahara). Geology, 22: 641-644.
Blaise, J., 1961. Sur la stratigraphie des séries anté-cambriennes dans la région du Tafassasset moyen (Ahaggar oriental). Bull. soc. géol. France, III: 184.
Boissonnas, J., 1974. Les granites à structures concentriques et quelques autres granites tardifs de la chaîne pan-africaine en Ahaggar (Sahara central, Algérie). Thèse, Centre de Recherches sur les Zones Arides, Série Géologie 16, 662 pp.
Borradaile, G.J., Kehlenbeck, M.M., 1996. Possible cryptic tectono-magnetic fabrics in "post-tectonic" granitoid plutons of the Canadian shield. Earth Planet. Sci. Lett., 137: 119-127.
Bouchez, J.L., 2000. Anisotropie de susceptibilité et fabrique des granites. Compt. Rend. Acad. Sci., Paris, Earth Planet. Sci., 330: 1-14.
Bruguier, O., Telouk, P., Cocherie, A., Fouillac, A.M., Albarede, F., 2001. Evaluation of Pb–Pb and U–Pb laser ablation ICP-MS zircon dating using matrix-matched calibration samples with a frequency quadrupled (266 nm) Nd-YAG laser. Geostandards Newslett. 25, 361–373.
Caby, R., Andreopoulos-Renaud, U. 1987. Le Hoggar oriental, bloc cratonisé à 730 Ma dans la chaîne pan-africaine du nord du continent africain. Precamb. Res., 36: 335-344.
Day, R., Fuller, M., Schmidt, V. A., 1977. Hysteresis properties of titanomagnetites: grain size and compositional dependence, Phys. Earth Planet. Int 13, 260-267.
Dhuime, B., Bosch, B., Bruguier, O., Caby, R., Pourtales, S., 2007. Age, provenance and post-deposition metamorphic overprint of detrital zircons from the prograde metasedimentary sequence of the Nathorst Land group (Eleonore Bay Supergroup, NE Greenland) - a LA-ICP-MS and SIMS study. Prec. Res., 155: 24-46.
Djouadi, M.T., Bouchez, J.L., 1992. Structure étrange du granite du Tesnou (Hoggar, Algérie). Compt. Rend. Acad. Sci. Paris, 315 II: 1231-1238.
Djouadi, M.T., Gleizes, G., Ferré, E., Bouchez, J.L., Caby, R., Lesquer, A. 1997. Oblique magmatic structures of two epizonal granite plutons, Hoggar, Algeria: late orogenic emplacement in a transcurrent orogen. Tectonophysics, 279: 351-374.
Ennih, N., Liégeois, J.P.,2008. The boundaries of the West African craton, with a special reference to the basement of the Moroccan metacratonic Anti-Atlas belt. In: Ennih, N., Liégeois, J.P., (Eds), The Boundaries of the West African Craton. Geol. Soc., London, Spec. Pub. 297, 117.
Fezaa, N, Liégeois, J.-P., Abdallah, N., Cherfouh, E.H., De Waele, B., Bruguier, O., Ouabadi, A. 2009. The Djanet terrane (Eastern Hoggar, Algeria), the Pan-African metacratonic boundary of the Murzuq craton: field, detrital and magmatic U-Pb zircon and Sr-Nd isotopes evidences. Precamb. Res. Submitted.

ACC
EPTE
D M
ANU
SCR
IPT
ACCEPTED MANUSCRIPT
32
Fomine, A., 1990. Field map of Tadoumet, Office national de la Recherche Géologique et Minière (ORGM), unpublished.
Guérangé, B., Vialon, P., 1960. Le Pharusien du bassin de Djanet dans la région du Tafassasset moyen (Ahaggar oriental, Sahara central). Compt. Rend. somm. séances soc. géol. France, 3: 557-59.
Guérangé, B., Lasserre, M., 1971. Etude géochrnologique de roches du Hoggar oriental par la méthode du strontium. Compt. Rend. somm. séances soc. géol. France, 4: 213-215.
Henry, B., 1974. Sur l'anisotropie de susceptibilité magnétique du granite récent de Novate (Italie du Nord). C. R. Acad. Sci. Paris, 278C: 1171-1174.
Henry, B., 1997. The magnetic zone axis: a new element of magnetic fabric for the interpretation of the magnetic lineation. Tectonophysics, 271: 325-329.
Henry, B., 2007. Changes in magnetic mineralogy due to heating and methodological implications. Encyclopedia of Geomagnetism and Paleomagnetism, Springer edit.: 512-515.
Henry, B., Le Goff, M., 1995. Application de l'extension bivariate de la statistique de Fisher aux données d'anisotropie de susceptibilité magnétique: intégration des incertitudes de mesure sur l'orientation des directions principales. C. R. Acad. Sci. Paris 320 II: 1037-1042
Henry, B., Djellit, H., Bayou, B., Derder, M.E.M., Ouabadi, A., Merahi, M.K., Baziz, K., Khaldi, A., Hemmi, A., 2004. Emplacement and fabric-forming conditions of the Alous-En-Tides granite, eastern border of the Tin Serririne/Tin Mersoï basin (Algeria): magnetic and visible fabrics analysis. J. Struct. Geol., 26: 1647-1657.
Henry, B., Derder, M.E.M., Bayou, B., Ouabadi, A., Belhai, D., Hemmi, A., 2006. Magnetic fabric of Late Panafrican plutons in the Tamanrasset area (Hoggar shield, Algeria) and structural implications. Africa Geosciences Review, 13: 41-52.
Henry, B., Bayou, B., Derder, M.E.M., Djellit, H., Ouabadi, A., Khaldi, A. Hemmi, A., 2007. Late Panafrican evolution of the main Hoggar fault zones: Implications of magnetic fabric study in the In Telloukh pluton (Tin Serririne basin, Algeria). J. Afric. Earth Sci. 49: 211-221, doi:10.1016/j.jafrearsci.2007.09.004.
Henry, B., Derder, M.E.M., Bayou, B., Guemache, M.A., Nouar, O., Ouabadi, A., Djellit, H., Amenna, M., Hemmi, A., 2008. Inhomogeneous shearing related with rocks composition: Evidence from a major late-Panafrican shear zone in the Tuareg shield (Algeria). Swiss J. Geol., 101: 453-464. doi:10.1007/s00015-008-1262-4.
Hext, G., 1963. The estimation of second-order tensors, with related tests and designs, Biometrika 50: 353.
Hrouda, F., Chlupáčová, M. and Rejl L., 1971. The mimetic fabric in some foliated granodiorites as indicated by magnetic anisotropy. Earth Planet. Sci. Lett., 11:, 381-384.
Jelinek, V.,1978. Statistical processing of magnetic susceptibility measured in groups of specimens. Stud. geophys. geodaet., 22: 50-62.
Jelinek, V., 1981. Characterization of the magnetic fabric of rocks. Tectonophysics, 79: 63-67.
Kilian, C., 1935. Explorations sahariennes. Geograph. J., 86, 17-25. King, R.F., 1966. The magnetic fabric of some Irish granites. Geol. J., 5, 43-66. Kratinová, Z., Schulmann, K., Edel, J.B., Ježek, J., Schaltegger, U., 2007. Model of
successive granite sheet emplacement in transtensional setting: Integrated microstructural and anisotropy of magnetic susceptibility study. Tectonics, 26, TC6003, doi:10.1029/2006TC002035.

ACC
EPTE
D M
ANU
SCR
IPT
ACCEPTED MANUSCRIPT
33
Le Goff, M., 1990. Lissage et limites d’incertitudes des courbes de migration polaire : pondération, des données et extension bivariate de la statistique Fischer, C. R. Acad. Sci. Paris, 311 II: 431-437.
Le Goff, M., Henry, B., Daly, L., 1992. Pratical method for drawing a VGP path. Phys. Earth Planet. Int., 70: 201-204.
Lelubre, M., 1952. Recherches sur la géologie de l'Ahaggar central et occidental (Sahara central). Bull. Serv. Carte Géol. Algérie, 22, tome 1, 354 p., tome 2, 387p..
Liégeois, J.P., Black, R., Navez, J., and Latouche, L., 1994. Early and late Pan-African orogenies in the Aïr assembly of terranes (Tuareg shield, Niger). Precamb. Res., 67, 59-66.
Liégeois J.P., Navez J., Hertogen, J., Black R., 1998. Contrasting origin of post-collisional high-K calc-alkaline and shoshonitic versus alkaline and peralkaline granitoids. Lithos, 45, 1-28.
Liégeois, J.P., Latouche, L., Boughrara, M., Navez, J., Guiraud, M., 2003. The LATEA metacraton (Central Hoggar, Tuareg shield, Algeria): behaviour of an old passive margin during the Panafrican orogeny. J. Afric. Earth Sci., 37, 161-190.
Liégeois, J.P., Benhallou, A., Azzouni-Sekkal, A., Yahiaoui, R., Bonin, B., 2005. The Hoggar swell and volcanism: Reactivation of the Precambrian Tuareg shield during Alpine convergence and West African Cenozoic volcanism. In Foulger, G.R., Natland, J.H., Presnall, D.C. and Anderson, D.L., (Eds), Plates, Plumes and Paradigms, Geol. Soc. America spec. Paper, 388, 379-400.
Ludwig, K.R., 2003. User's manual for Isoplot/ 3, a geochronological toolkit for Microsoft Excel. Berkeley Geochronology Center, Spec. Pub. 14, 71 pp.
Neves, S., Bruguier, O., Vauchez, A., Bosch, D., Rangel da Silva, J.M., Mariano, G., 2006. Timing of crust formation, deposition of supracrustal sequences, and Transamazonian and Brasiliano metamorphism in the East Pernambuco belt (central domain, Borborema Province, NE Brazil): implications for western Gondwana assembly. Precamb. Res., 149, 197-216.
O'Reilly, W., 1984. Rock and Mineral Magnetism. Blackie, Chapman and Hall edit, Glasgow.
Paquette, J.L., Caby, R., Djouadi, M.T,. Bouchez, J.L., 1998. U-Pb dating of the end of Pan-African orogeny in the Tuareg Shield: the post-collisional syn-shear Tioueine pluton (Western Hoggar, Algeria). Lithos, 45, 245-253.
Peucat, J.J., Drareni, A., Latouche, L., Deloule, E., Vidal, P., 2003. U-Pb zircon (TIMS and SIMS) and Sm-Nd whole rock geochronology of the Gour Oumalelen granulitic basement, Hoggar massif, Tuareg shield, Algeria. J. Afric. Earth Sci. 37, 229-239.
Pignotta, G.S., Benn, K., 1999. Magnetic fabric of the Barrington Passage pluton, Meguma Terrane, Nova Scotia: a two-stage fabric history of syntectonic emplacement. Tectonophysics, 307: 75-92.
Tomezzoli, R.N., McDonald, W.D., Tickyj, H., 2003. Composite magnetic fabrics and S-C structure in granitic gneiss of Cerro de los Viejos, La Pampa province, Argentina. J. Struct. Geol., 25, 159-169.
Vialon, P., Guérangé, B., 1959. Geological maps "Erg Kilian" and "Tiririne" – "Mission hélicoptère 1958-59". Bureau de Recherches Minières de l'Algérie.
Wiedenbeck, M., Allé, P., Corfu, F., Griffin, W.L., Meier, M., 1995. Three natural zircon standards for U-Th-Pb, Lu-Hf, trace element and REE analyses. Geostandards Newslett. 19, 1-23.

ACC
EPTE
D M
ANU
SCR
IPT
ACCEPTED MANUSCRIPT
34
Zeghouane H. 2006. Pétrologie, géochimie, géochimie isotopique et géochronologie Rb/Sr du massif granitique d’Arirer (terrane Aouzegueur, Hoggar oriental) Algérie. Th. Magister Univ. Sc. Technologie Houari Boumédiène, Alger.
Zeghouane, H., Azzouni-Sekkal, A., Liégeois, J.P., 2008. Pétrologie et géochronologie des granitoïdes du massif d'Arirer, (Aouzegueur, Hoggar oriental, Algérie). Abstract, 22th Colloquium of African Geology, Tunis, Tunisia, 259.
Figures captions
Figure 1 – General geological sketch map of the Tuareg shield showing the studied Late
Panafrican plutons. Terranes of Assodé (As), Issalane (Is), Tazat (Tz), Aouzegueur
(Az), Barghot (Ba), Djanet (Dj) and Edembo (Ed). Tihaliouine (Tih – Henry et al.,
2008), Teg Orak (Teg – Henry et al., 2008), Tesnou (Tes – Djouadi and Bouchez,
1992), Alous En Tides (AET – Henry et al., 2004), In Telloukh (ITe – Henry et al.,
2007), Tioueine (To – Djouadi et al., 1997), Tifferkit (Tf – Henry et al., 2006) and
In Tounine (Ito – Henry et al., 2006) plutons. Tadoumet (TA) and Tiririne (TR)
areas.
Figure 2 - Geological setting (A) - after Vialon and Guérangé, 1959; Arène et al., 1961;
Bertrand et al., 1978; Fomine, 1990, modified - and sampling sites in the Tiririne
(B - sites TR) and Tadoumet (C - sites TA) areas.
Figure 3 – U-Pb concordia diagrams for: A) Oued Touffok pluton (sample DAZ01); B) Tin
Ohergehem pluton (sample DAZ04) and C) Arigher batholith (sample DAZ03).
Figure 4 – Histograms in percentage of the mean susceptibility value Km (in 10-6 SI) of the
samples in the different studied plutons.
Figure 5 – Examples of normalized thermomagnetic curves of samples from the Tadoumet
(sample TIR157) and Tiririne (sample HT130) areas with indication of the mean
susceptibility (Ko in SI) of the sample.
Figure 6 – (a) Hysteresis loop after correction of the paramagnetism of samples from the
Tadoumet (sample TIR386) and Tiririne (sample HT130) areas and (b) Day plot
(Day et al., 1977) of the hysteresis parameters ratios of samples from Tadoumet

ACC
EPTE
D M
ANU
SCR
IPT
ACCEPTED MANUSCRIPT
35
(squares) and Tiririne (circles) areas (granite - full symbols – and aplitic dyke –
open symbol); SD (single domain), PSD (pseudo-single domain) and MD
(multidomain).
Figure 7 – Maximum (K1, squares) and minimum (K3, circles) principal magnetic
susceptibility axes of the samples from the Ohergehem (a), Arigher (c), Oued
Touffok (e), Honag (g), Adjou (I – open symbols: northern section, full symbols:
southern section), Tin Ghoras (k), Kerkour (m) and Oued Tiririne (o) plutons
(stereographic projection in the lower hemisphere). Confidence zone at 95% from
(d, f, h, j, l, n and p) normalized tensor variability (Hext, 1963; Jelinek, 1978) or (b)
simple bootstrap (Henry, 1997) statistics for the principal susceptibility axes
maximum K1 (squares) and minimum K3 (circles) of the samples from the
Ohergehem (b), Arigher (d), Oued Touffok (f), Honag-East (h), Adjou (j), Tin
Ghoras (l), Kerkour (n) and Oued Tiririne (p) plutons (stereographic projection in
the lower hemisphere); for the Ohergehem (b) pluton confidence zone at 63 and
95% for the magnetic zone axis (Henry, 1997).
Figure 8 – Maps of the Ohergehem (a, b), Arigher (c, d) and the Tin Ghoras (e, f) plutons
with the distribution of magnetic lineations (a, c, e) and magnetic foliations (b, d, f)
measured in the studied sites. The lengh of the symbols (arrow for lineations,
plunge indication for foliation) is proportional to the plunge values (scale on the
figure).
Figure 9 – Maximum (K1, squares) and minimum (K3, circles) principal magnetic
susceptibility axes of the samples from the sites TR2 (granite – black symbols),
TR3 (dyke – open gray symbols) and TR4 (dyke – open white symbols) in the Tin
Ghoras pluton (stereographic projection in the lower hemisphere).

ACC
EPTE
D M
ANU
SCR
IPT
ACCEPTED MANUSCRIPT
36
Table 1: U-Pb isotopic data on zircons (laser ICP-MS) Apparent ages (Ma) Sample Pb* Th U Th/U 208Pb/ 207Pb/ ± 207Pb/ ± 206Pb/ ± Rho*
206Pb/ 207Pb/ (ppm) (ppm) (ppm) 206Pb 206Pb (1σ) 235U (1σσσσ) 238U (1σσσσ) 238U ±1σ 206Pb ±1σ DAZ01 - Oued Touffok (site TA27) la17 80 756 661 1.14 0.520 0.1172 0.0020 1.3896 0.0385 0.0860 0.0019 0.80 532 11 1915 30 la8 71 626 465 1.34 0.508 0.0857 0.0031 1.3187 0.0529 0.1116 0.0018 0.41 682 11 1332 69 sa3 91 767 628 1.22 0.319 0.0884 0.0040 1.4493 0.0689 0.1189 0.0019 0.33 724 11 1391 84 lb3 102 841 646 1.30 0.439 0.0758 0.0014 1.2587 0.0315 0.1205 0.0020 0.66 733 12 1089 37 la12 107 892 658 1.36 0.417 0.0779 0.0017 1.3087 0.0332 0.1219 0.0017 0.55 741 10 1144 42 sa4 56 398 357 1.12 0.401 0.0783 0.0023 1.3468 0.0483 0.1247 0.0025 0.56 757 14 1156 58 sa5 51 308 311 0.99 0.400 0.1075 0.0025 1.8587 0.0563 0.1254 0.0025 0.65 762 14 1757 42 la16 67 468 409 1.15 0.396 0.0658 0.0014 1.1586 0.0327 0.1276 0.0023 0.64 774 13 801 45 la2 101 699 651 1.07 0.325 0.0673 0.0011 1.1843 0.0262 0.1277 0.0020 0.70 774 11 847 32 la4 119 1020 704 1.45 0.436 0.0667 0.0012 1.1883 0.0299 0.1292 0.0022 0.68 783 13 829 38 lb2 109 843 626 1.35 0.456 0.0658 0.0015 1.1760 0.0298 0.1296 0.0015 0.46 785 9 801 47 la5 73 534 455 1.17 0.352 0.0669 0.0011 1.1976 0.0274 0.1298 0.0022 0.73 787 12 835 32 la11 74 571 464 1.23 0.353 0.0655 0.0010 1.1727 0.0230 0.1299 0.0015 0.61 787 9 789 32 la7 142 1156 847 1.36 0.414 0.0658 0.0011 1.1799 0.0231 0.1300 0.0014 0.54 788 8 801 34 la13 88 636 544 1.17 0.363 0.0657 0.0013 1.1798 0.0267 0.1302 0.0014 0.47 789 8 797 41 la24 105 821 659 1.25 0.402 0.0658 0.0014 1.1826 0.0319 0.1303 0.0021 0.60 790 12 800 45 lb5 92 754 543 1.39 0.422 0.0648 0.0006 1.1688 0.0196 0.1308 0.0018 0.81 792 10 769 21 la10 59 364 392 0.93 0.285 0.0659 0.0013 1.1913 0.0331 0.1311 0.0026 0.71 794 15 803 41 sa2 19 96 157 0.61 0.256 0.0647 0.0007 1.1722 0.0242 0.1314 0.0023 0.84 796 13 765 24 la9 67 509 434 1.17 0.342 0.0653 0.0010 1.1825 0.0237 0.1314 0.0017 0.64 796 10 783 32 la18 50 282 330 0.86 0.254 0.0662 0.0010 1.1987 0.0238 0.1314 0.0016 0.62 796 9 811 32 la23 61 397 372 1.07 0.387 0.0651 0.0055 1.1825 0.1016 0.1317 0.0018 0.16 798 10 778 169 la15 68 492 413 1.19 0.352 0.0653 0.0010 1.1866 0.0243 0.1319 0.0018 0.65 798 10 783 32 lb4 87 733 491 1.49 0.475 0.0657 0.0007 1.1973 0.0221 0.1321 0.0019 0.79 800 11 798 23 la14 95 714 556 1.28 0.403 0.0649 0.0012 1.1866 0.0267 0.1326 0.0017 0.57 803 10 771 38 la22 32 145 220 0.66 0.198 0.0668 0.0011 1.2243 0.0263 0.1329 0.0018 0.64 804 10 833 34 la3 70 403 461 0.87 0.253 0.0669 0.0011 1.2262 0.0396 0.1329 0.0037 0.86 805 21 835 34 la1 79 596 483 1.23 0.356 0.0657 0.0014 1.2065 0.0312 0.1332 0.0021 0.60 806 12 797 43 ga33 46 185 211 0.88 0.265 0.0792 0.0005 2.0461 0.0301 0.1875 0.0025 0.91 1108 14 1176 12

ACC
EPTE
D M
ANU
SCR
IPT
ACCEPTED MANUSCRIPT
37
ga34 57 167 255 0.66 0.219 0.0844 0.0006 2.3193 0.0220 0.1993 0.0011 0.60 1171 6 1302 15 la20 94 120 436 0.27 0.096 0.0878 0.0014 2.5459 0.0474 0.2102 0.0022 0.56 1230 12 1379 29 ga37 131 222 589 0.38 0.127 0.0877 0.0007 2.6386 0.0426 0.2182 0.0030 0.86 1272 16 1376 16 la19 37 119 144 0.82 0.247 0.0835 0.0014 2.5746 0.0596 0.2236 0.0036 0.70 1301 19 1281 32 la25 95 251 367 0.68 0.207 0.0894 0.0014 2.8857 0.0579 0.2341 0.0028 0.61 1356 15 1412 30 ga35 171 735 537 1.37 0.404 0.0883 0.0005 2.9915 0.0215 0.2458 0.0012 0.66 1417 6 1388 10 la6 56 58 174 0.33 0.095 0.1126 0.0018 5.0652 0.1432 0.3263 0.0076 0.83 1821 37 1841 28 la21 76 119 509 0.23 0.087 0.0660 0.0010 1.5525 0.0498 0.1706 0.0048 0.88 1015 26 807 32 lb1 114 566 463 1.22 0.395 0.1003 0.0014 2.6634 0.0505 0.1926 0.0024 0.66 1135 13 1630 26 DAZ03 - Arigher Batholith (site TA49) sa19 571 2811 7083 0.40 0.124 0.0581 0.0009 0.6265 0.0134 0.0782 0.0012 0.70 485 7 535 33 sa7 103 805 1134 0.71 0.259 0.0689 0.0011 0.7507 0.0182 0.0790 0.0014 0.74 490 8 896 33 la35 104 807 1194 0.68 0.205 0.0600 0.0007 0.6590 0.0138 0.0796 0.0014 0.84 494 8 604 24 la28 51 260 571 0.45 0.172 0.0678 0.0012 0.7651 0.0170 0.0819 0.0011 0.59 507 6 862 37 la33 79 353 894 0.39 0.135 0.0627 0.0012 0.7171 0.0153 0.0830 0.0007 0.42 514 4 698 41 la30 129 868 1434 0.61 0.196 0.0613 0.0010 0.7029 0.0157 0.0832 0.0013 0.69 515 8 649 34 sa17 365 1365 4296 0.32 0.106 0.0588 0.0008 0.6824 0.0135 0.0841 0.0012 0.71 521 7 561 30 sa9 116 718 1242 0.58 0.200 0.0590 0.0010 0.7117 0.0205 0.0874 0.0021 0.82 540 12 568 35 sa6 109 604 1145 0.53 0.173 0.0598 0.0007 0.7239 0.0150 0.0878 0.0015 0.84 543 9 596 24 sa12 66 302 715 0.42 0.160 0.0587 0.0008 0.7155 0.0159 0.0883 0.0015 0.77 546 9 557 31 sa16 103 637 1084 0.59 0.174 0.0585 0.0008 0.7149 0.0160 0.0886 0.0015 0.77 547 9 549 31 sa10 17 164 162 1.01 0.305 0.0586 0.0008 0.7172 0.0160 0.0887 0.0016 0.80 548 9 554 29 la34 64 557 596 0.94 0.321 0.0581 0.0025 0.7118 0.0324 0.0888 0.0013 0.32 549 8 534 92 la26 101 592 1069 0.55 0.174 0.0601 0.0011 0.7395 0.0186 0.0892 0.0015 0.68 551 9 607 40 sa14 109 617 1144 0.54 0.169 0.0583 0.0008 0.7173 0.0169 0.0892 0.0017 0.80 551 10 541 31 la32 117 1528 1065 1.43 0.406 0.0603 0.0017 0.7439 0.0271 0.0895 0.0020 0.61 552 12 614 61 la27 75 466 797 0.59 0.183 0.0616 0.0010 0.7701 0.0197 0.0906 0.0018 0.77 559 11 662 34 sa15 232 981 2490 0.39 0.133 0.0595 0.0008 0.7469 0.0171 0.0910 0.0017 0.81 561 10 587 29 la31 62 329 652 0.50 0.154 0.0585 0.0009 0.7346 0.0167 0.0910 0.0015 0.74 562 9 550 33 sa18 63 295 665 0.44 0.142 0.0581 0.0009 0.7355 0.0168 0.0919 0.0015 0.73 567 9 532 34 sa13 107 543 1099 0.49 0.148 0.0586 0.0006 0.7434 0.0146 0.0921 0.0015 0.83 568 9 550 24 la29 38 103 367 0.28 0.168 0.0859 0.0042 1.1275 0.0572 0.0952 0.0012 0.24 586 7 1337 92 sa8 82 399 780 0.51 0.199 0.0653 0.0015 0.8664 0.0226 0.0962 0.0012 0.48 592 7 786 48 DAZ04 - Ohergehem pluton (site TA16)

ACC
EPTE
D M
ANU
SCR
IPT
ACCEPTED MANUSCRIPT
38
sb14 24 202 213 0.95 0.286 0.0606 0.0005 0.7938 0.0119 0.0950 0.0012 0.83 585 7 624 18 sb13 18 126 172 0.73 0.223 0.0602 0.0010 0.7923 0.0173 0.0954 0.0013 0.62 587 8 612 36 sb31 20 154 177 0.87 0.267 0.0600 0.0012 0.7904 0.0193 0.0955 0.0013 0.57 588 8 605 43 sb34 19 122 161 0.76 0.220 0.0595 0.0007 0.7851 0.0137 0.0957 0.0013 0.76 589 7 586 25 sb21 15 75 153 0.49 0.152 0.0598 0.0006 0.7907 0.0125 0.0959 0.0011 0.75 590 7 597 22 sb33 30 309 269 1.15 0.283 0.0603 0.0006 0.7967 0.0135 0.0958 0.0014 0.84 590 8 614 20 sb19 22 158 193 0.82 0.263 0.0604 0.0006 0.8019 0.0129 0.0963 0.0012 0.76 593 7 618 23 sb24 24 200 245 0.82 0.245 0.0601 0.0011 0.7986 0.0224 0.0964 0.0021 0.78 593 12 607 38 sb20 32 255 290 0.88 0.279 0.0605 0.0007 0.8063 0.0133 0.0966 0.0012 0.75 595 7 622 23 sb12 28 196 257 0.76 0.235 0.0607 0.0008 0.8138 0.0142 0.0972 0.0012 0.69 598 7 629 27 sb16 23 169 204 0.83 0.269 0.0601 0.0006 0.8122 0.0121 0.0981 0.0011 0.75 603 6 606 21 sb22 12 50 110 0.45 0.138 0.0607 0.0006 0.8498 0.0138 0.1015 0.0013 0.77 623 7 630 22 sb25 21 138 177 0.78 0.249 0.0625 0.0010 0.8796 0.0177 0.1021 0.0013 0.64 627 8 690 33 sb35 19 79 182 0.43 0.138 0.0608 0.0007 0.8593 0.0134 0.1024 0.0011 0.68 629 6 634 24 sb26 15 70 141 0.50 0.158 0.0642 0.0007 0.9110 0.0140 0.1030 0.0011 0.70 632 6 747 23 sb17 21 140 188 0.74 0.232 0.0623 0.0009 0.8882 0.0173 0.1033 0.0014 0.68 634 8 686 30 sb23 28 209 229 0.91 0.285 0.0618 0.0006 0.8821 0.0134 0.1036 0.0011 0.73 635 7 666 22 sb11 19 120 162 0.74 0.237 0.0658 0.0010 0.9434 0.0173 0.1040 0.0011 0.57 638 6 800 31 sb27 22 83 195 0.43 0.146 0.0653 0.0010 0.9469 0.0194 0.1052 0.0014 0.64 645 8 784 33 sb18 18 120 145 0.83 0.262 0.0613 0.0007 0.8969 0.0153 0.1061 0.0013 0.72 650 8 650 25 sb29 24 165 192 0.86 0.269 0.0625 0.0008 0.9280 0.0205 0.1077 0.0019 0.81 659 11 691 27 sb15 14 53 125 0.42 0.131 0.0639 0.0010 0.9706 0.0198 0.1101 0.0014 0.60 673 8 739 34 sb28 24 109 205 0.53 0.167 0.0617 0.0007 0.9408 0.0173 0.1106 0.0016 0.79 676 9 664 24 Pb*= radiogenic Pb; Rho*= coefficient of error correlation

ACC
EPTE
D M
ANU
SCR
IPT
ACCEPTED MANUSCRIPT
39
Table 2. Site, number of core-samples (N), mean susceptibility (Km), azimuth (Az) and
plunge (Pl) of the principal maximum (K1) and minimum (K3) – normal to the
magnetic foliation - susceptibility axes, parameters P' and T (Jelinek, 1981).
Ohergehem K1 K3 Site N Km
(10-6 SI) Az (°) Pl (°) Az (°) Pl (°) P' T
TA12 8 151 257 7 0 59 1,024 -0,56 TA13 8 12190 222 42 52 47 1,267 -0,37 TA14 10 10938 254 30 88 60 1,090 -0,46 TA15 8 8442 190 32 64 44 1,202 0,38 TA16 8 6725 233 24 38 65 1,102 -0,39 TA17 11 4636 228 63 43 27 1,300 0,11 TA18 8 30708 223 51 49 39 1,356 0,08 TA19 8 21166 231 66 59 24 1,326 -0,02 TA20 8 111 259 73 53 16 1,388 0,16 TA21 8 23168 128 67 68 22 1,341 0,13 TA22 8 5084 240 53 64 37 1,381 0,46 TA23 8 8914 180 49 31 37 1,281 -0,02 TA24 8 1531 315 34 50 7 1,053 -0,04 TA25 8 6929 239 75 56 15 1,188 -0,13 TA26 8 27352 254 69 35 17 1,315 -0,19
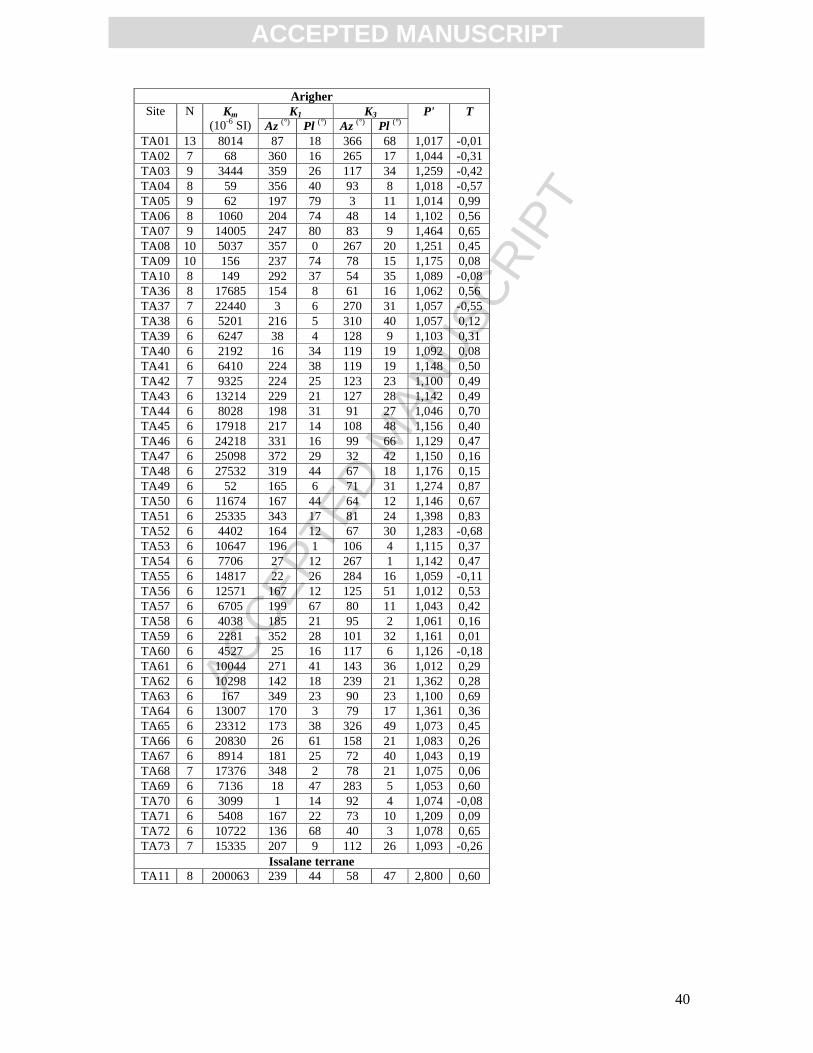
ACC
EPTE
D M
ANU
SCR
IPT
ACCEPTED MANUSCRIPT
40
Arigher K1 K3 Site N Km
(10-6 SI) Az (°) Pl (°) Az (°) Pl (°) P' T
TA01 13 8014 87 18 366 68 1,017 -0,01 TA02 7 68 360 16 265 17 1,044 -0,31 TA03 9 3444 359 26 117 34 1,259 -0,42 TA04 8 59 356 40 93 8 1,018 -0,57 TA05 9 62 197 79 3 11 1,014 0,99 TA06 8 1060 204 74 48 14 1,102 0,56 TA07 9 14005 247 80 83 9 1,464 0,65 TA08 10 5037 357 0 267 20 1,251 0,45 TA09 10 156 237 74 78 15 1,175 0,08 TA10 8 149 292 37 54 35 1,089 -0,08 TA36 8 17685 154 8 61 16 1,062 0,56 TA37 7 22440 3 6 270 31 1,057 -0,55 TA38 6 5201 216 5 310 40 1,057 0,12 TA39 6 6247 38 4 128 9 1,103 0,31 TA40 6 2192 16 34 119 19 1,092 0,08 TA41 6 6410 224 38 119 19 1,148 0,50 TA42 7 9325 224 25 123 23 1,100 0,49 TA43 6 13214 229 21 127 28 1,142 0,49 TA44 6 8028 198 31 91 27 1,046 0,70 TA45 6 17918 217 14 108 48 1,156 0,40 TA46 6 24218 331 16 99 66 1,129 0,47 TA47 6 25098 372 29 32 42 1,150 0,16 TA48 6 27532 319 44 67 18 1,176 0,15 TA49 6 52 165 6 71 31 1,274 0,87 TA50 6 11674 167 44 64 12 1,146 0,67 TA51 6 25335 343 17 81 24 1,398 0,83 TA52 6 4402 164 12 67 30 1,283 -0,68 TA53 6 10647 196 1 106 4 1,115 0,37 TA54 6 7706 27 12 267 1 1,142 0,47 TA55 6 14817 22 26 284 16 1,059 -0,11 TA56 6 12571 167 12 125 51 1,012 0,53 TA57 6 6705 199 67 80 11 1,043 0,42 TA58 6 4038 185 21 95 2 1,061 0,16 TA59 6 2281 352 28 101 32 1,161 0,01 TA60 6 4527 25 16 117 6 1,126 -0,18 TA61 6 10044 271 41 143 36 1,012 0,29 TA62 6 10298 142 18 239 21 1,362 0,28 TA63 6 167 349 23 90 23 1,100 0,69 TA64 6 13007 170 3 79 17 1,361 0,36 TA65 6 23312 173 38 326 49 1,073 0,45 TA66 6 20830 26 61 158 21 1,083 0,26 TA67 6 8914 181 25 72 40 1,043 0,19 TA68 7 17376 348 2 78 21 1,075 0,06 TA69 6 7136 18 47 283 5 1,053 0,60 TA70 6 3099 1 14 92 4 1,074 -0,08 TA71 6 5408 167 22 73 10 1,209 0,09 TA72 6 10722 136 68 40 3 1,078 0,65 TA73 7 15335 207 9 112 26 1,093 -0,26
Issalane terrane TA11 8 200063 239 44 58 47 2,800 0,60

ACC
EPTE
D M
ANU
SCR
IPT
ACCEPTED MANUSCRIPT
41
Oued Touffok K1 K3 Site N Km
(10-6 SI) Az (°) Pl (°) Az (°) Pl (°) P' T
TA27 10 8818 23 13 152 70 1,113 0,14 TA28 8 1069 192 1 102 29 1,053 0,58 TA29 8 4943 304 10 170 76 1,056 0,39 TA30 8 4558 13 13 109 23 1,173 0,07 TA31 8 9298 191 1 101 27 1,366 -0,12 TA32 7 3158 20 11 282 34 1,210 -0,44 TA33 7 2805 346 29 97 33 1,149 0,13 TA34 8 1970 187 8 91 38 1,096 0,10 TA35 8 4775 197 24 6 36 1,100 -0,59
Honag K1 K3 Site N Km
(10-6 SI) Az (°) Pl (°) Az (°) Pl (°) P' T
TR48 6 5782 356 21 261 15 1.289 -0.32 TR49 6 4640 171 11 265 19 1.204 0.01 TR50 6 102 312 29 51 16 1.085 -0.14 TR51 6 6639 191 5 299 75 1.108 -0.63 TR52 6 9607 194 11 290 29 1.156 -0.57 TR53 6 8940 195 9 290 30 1.146 -0.26 TR54 6 10120 182 18 309 62 1.161 -0.24 TR55 8 9010 190 18 306 54 1.154 -0.03 TR56 5 11116 193 18 302 45 1.197 0.11 TR57 6 7061 195 30 302 28 1.136 0.01 TR58 9 10602 183 30 299 38 1.093 -0.43 TR59 6 6780 184 23 305 50 1.104 0.10 TR60 6 11122 173 30 337 59 1.107 0.11 TR81 6 4331 194 17 359 73 1.108 0.28 TR82 6 4715 178 22 305 56 1.151 0.10 TR83 6 5825 181 24 303 51 1.165 -0.15 TR84 6 4659 163 29 298 52 1.155 0.10 TR85 6 6440 170 20 345 70 1.124 0.10 TR86 6 3374 160 26 316 61 1.144 0.51 TR87 6 4470 171 18 344 72 1.202 0.10

ACC
EPTE
D M
ANU
SCR
IPT
ACCEPTED MANUSCRIPT
42
Adjou K1 K3 Site N Km
(10-6 SI) Az (°) Pl (°) Az (°) Pl (°) P' T
TR19 6 11945 51 22 198 65 1.053 -0.02 TR20 6 6814 23 9 123 47 1.063 -0.43 TR21 10 8021 214 1 116 84 1.040 0.39 TR22 6 11831 215 2 111 80 1.037 -0.54 TR23 8 4128 244 1 336 72 1.007 0.43 TR24 6 5925 318 24 153 65 1.035 0.66 TR25 7 7192 316 19 177 65 1.045 0.60 TR26 6 9637 9 17 178 73 1.036 -0.12 TR27 6 12369 354 11 235 68 1.035 -0.18 TR28 6 8769 23 24 174 63 1.054 0.38 TR29 7 10657 24 14 135 56 1.045 0.30 TR30 7 7260 11 7 127 75 1.064 0.15 TR31 6 3899 199 8 86 71 1.057 0.26 TR32 6 1875 208 6 100 72 1.054 0.71 TR33 6 1229 80 7 203 78 1.038 -0.16 TR34 6 1951 30 11 148 68 1.055 0.35 TR35 6 6085 43 12 139 25 1.087 -0.24 TR36 6 9350 47 14 153 48 1.101 -0.40 TR37 6 7665 40 8 133 22 1.103 -0.64 TR38 6 9483 43 8 134 7 1.121 -0.25 TR39 6 5144 35 7 127 14 1.124 0.25 TR40 10 4179 36 17 294 35 1.099 -0.61 TR41 6 8501 220 2 129 16 1.080 -0.27 TR42 6 10688 234 2 141 45 1.081 -0.17 TR43 6 11537 49 10 278 75 1.043 0.10 TR44 6 13198 48 1 241 89 1.044 -0.41 TR45 9 9251 32 7 127 37 1.065 -0.22 TR46 6 12446 48 3 138 9 1.038 -0.53 TR47 6 9755 234 8 329 37 1.060 0.41
Tin Ghoras K1 K3 Site N Km
(10-6 SI) Az (°) Pl (°) Az (°) Pl (°) P' T
TR01 8 6462 196 4 292 57 1.055 0.11 TR02 6 6625 179 4 274 48 1.079 0.17 TR03 8 3087 5 2 272 50 1.126 0.47 TR04 6 2538 187 1 279 56 1.134 0.11 TR05 6 6845 21 0 291 58 1.051 -0.45 TR06 6 6183 202 1 72 88 1.038 -0.09 TR07 6 5254 192 9 93 48 1.057 -0.57 TR08 6 3424 192 12 82 57 1.053 0.27 TR09 6 6743 6 0 96 37 1.053 -0.33 TR10 6 5406 21 5 123 67 1.053 -0.95 TR11 6 5989 337 42 164 48 1.041 -0.16 TR12 6 3441 7 32 160 55 1.084 0.39 TR13 6 4622 33 25 229 64 1.060 0.61 TR14 6 5270 4 16 160 73 1.063 -0.55 TR15 6 5933 187 18 4 72 1.034 0.01 TR16 6 4441 191 17 299 46 1.032 -0.33 TR17 6 5334 184 13 76 55 1.069 -0.08 TR18 6 5495 183 10 83 43 1.063 0.35
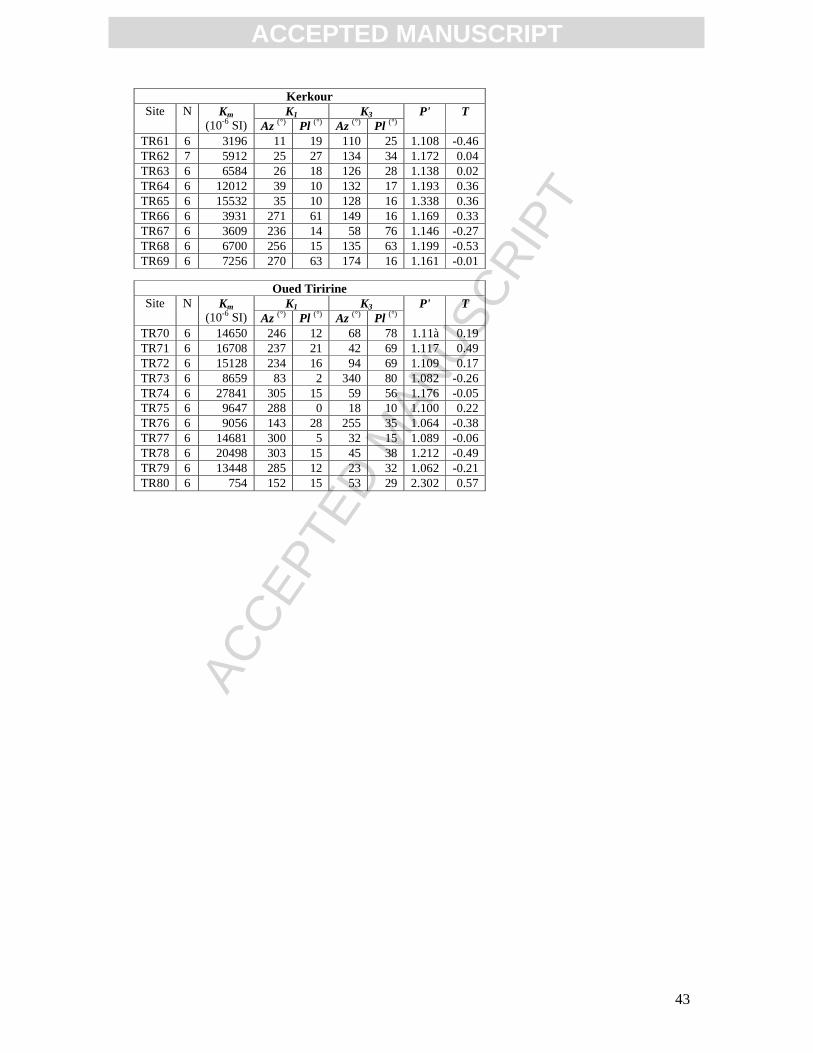
ACC
EPTE
D M
ANU
SCR
IPT
ACCEPTED MANUSCRIPT
43
Kerkour K1 K3 Site N Km
(10-6 SI) Az (°) Pl (°) Az (°) Pl (°) P' T
TR61 6 3196 11 19 110 25 1.108 -0.46 TR62 7 5912 25 27 134 34 1.172 0.04 TR63 6 6584 26 18 126 28 1.138 0.02 TR64 6 12012 39 10 132 17 1.193 0.36 TR65 6 15532 35 10 128 16 1.338 0.36 TR66 6 3931 271 61 149 16 1.169 0.33 TR67 6 3609 236 14 58 76 1.146 -0.27 TR68 6 6700 256 15 135 63 1.199 -0.53 TR69 6 7256 270 63 174 16 1.161 -0.01
Oued Tiririne K1 K3 Site N Km
(10-6 SI) Az (°) Pl (°) Az (°) Pl (°) P' T
TR70 6 14650 246 12 68 78 1.11à 0.19 TR71 6 16708 237 21 42 69 1.117 0.49 TR72 6 15128 234 16 94 69 1.109 0.17 TR73 6 8659 83 2 340 80 1.082 -0.26 TR74 6 27841 305 15 59 56 1.176 -0.05 TR75 6 9647 288 0 18 10 1.100 0.22 TR76 6 9056 143 28 255 35 1.064 -0.38 TR77 6 14681 300 5 32 15 1.089 -0.06 TR78 6 20498 303 15 45 38 1.212 -0.49 TR79 6 13448 285 12 23 32 1.062 -0.21 TR80 6 754 152 15 53 29 2.302 0.57

ACC
EPTE
D M
ANU
SCR
IPT
ACCEPTED MANUSCRIPT
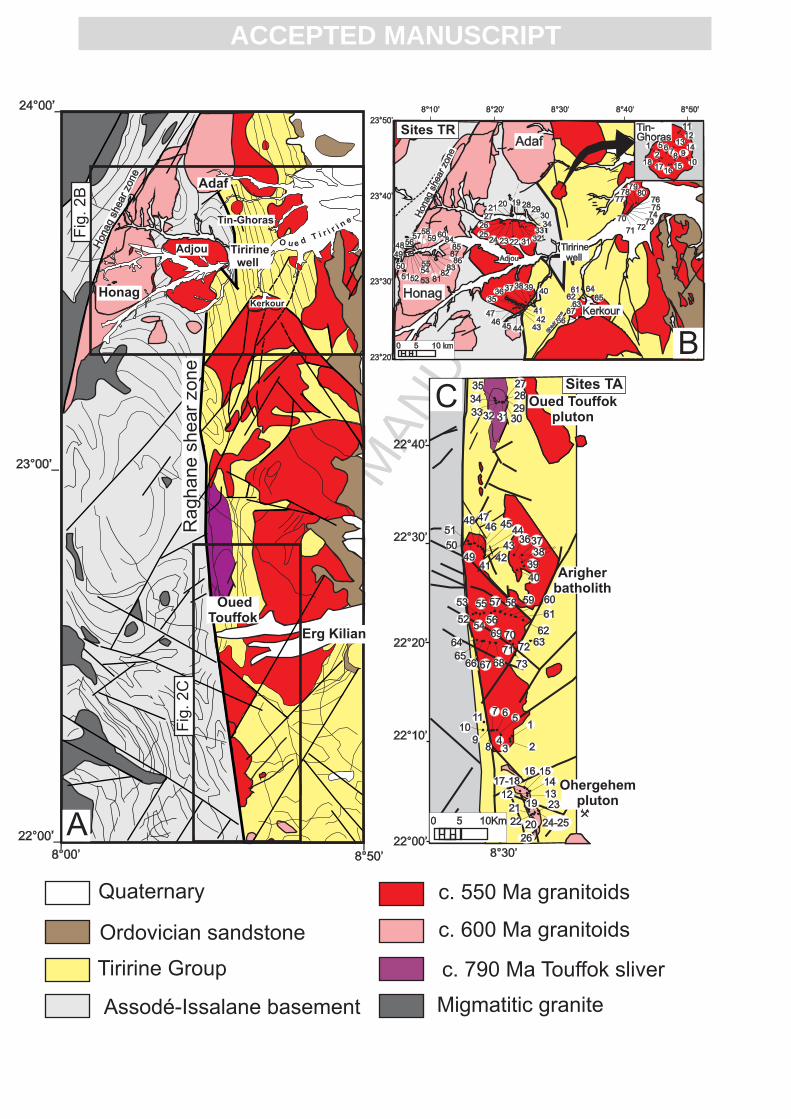
ACC
EPTE
D M
ANU
SCR
IPT
ACCEPTED MANUSCRIPT
50
5152 53
55
56
5859 60
8182
83
8485
8687
192021
2223
272625
24
2829
30
31 3233
34
4035
36373839
4746
45 44 4342
41
70
71 727374757677
7879
80
61
63
646562
66
67
6869
0 5 10 km
57
48
54
8°
30
’s
he
ar
zo
ne
12
5 678 9
10
1112
1314
151617
18
Tin-Ghoras
26
24-25
2319
20
21
22
1312
141516
17-18
1
234
567
89
1011
6372
73
71
7069
68676665
64
52
53
54
55
56
57 58 59 60
61
62
40
39
383736
4142
43
45464748
4950
51
28
29
27
30313233
34
35
0 5 10Km
44
Sites TA
She
arzo
ne
Sites TR
Honag
Adaf
Kerkour
Tiririnewell
O u e dT i r i r i n e
OuedTouffok
Erg Kilian
AdjouHonag
shearzo
ne
Adjou
Honag
shearzo
ne
Tiririnewell
Adaf
Honag
Kerkour
Tin-Ghoras
Ohergehempluton
Arigherbatholith
Oued Touffokpluton
Raghane s
hear
zone
C
A
B
49
8°10’ 8°20’ 8°30’ 8°40’ 8°50’
23°50’
23°40’
23°30’
23°20’
22°40’
22°30’
22°20’
22°10’
22°00’8°30’
22°00’_
24°00’_
8°00’ 8°50’
_ _
23°00’_
Quaternary
Ordovician sandstone
Tiririne Group
Assodé-Issalane basement Migmatitic granite
c. 790 Ma Touffok sliver
c. 600 Ma granitoids
c. 550 Ma granitoids
Fig
. 2C
Fig
. 2B

ACC
EPTE
D M
ANU
SCR
IPT
ACCEPTED MANUSCRIPT
ei66
Stamp

ACC
EPTE
D M
ANU
SCR
IPT
ACCEPTED MANUSCRIPT
05
101520253035
Oued TouffokHonagOhergehem
0 50000
Km
0102030405060
Tin GhorasAdjouOued Tiririne
Km
0 50000
0
10
20
30
40
KerkourArigher
Km
500000

ACC
EPTE
D M
ANU
SCR
IPT
ACCEPTED MANUSCRIPT
-200 0 200 400 600
0.4
0.8
1.2
1.6 K/Ko
Sample :HT130
Temperature (°C)
-6Ko=96 10 SI
-200 0 200 400 600
0.4
0.8
1.2
Sample :TIR157
Temperature (°C)
-6Ko=464 10 SI
K/Ko
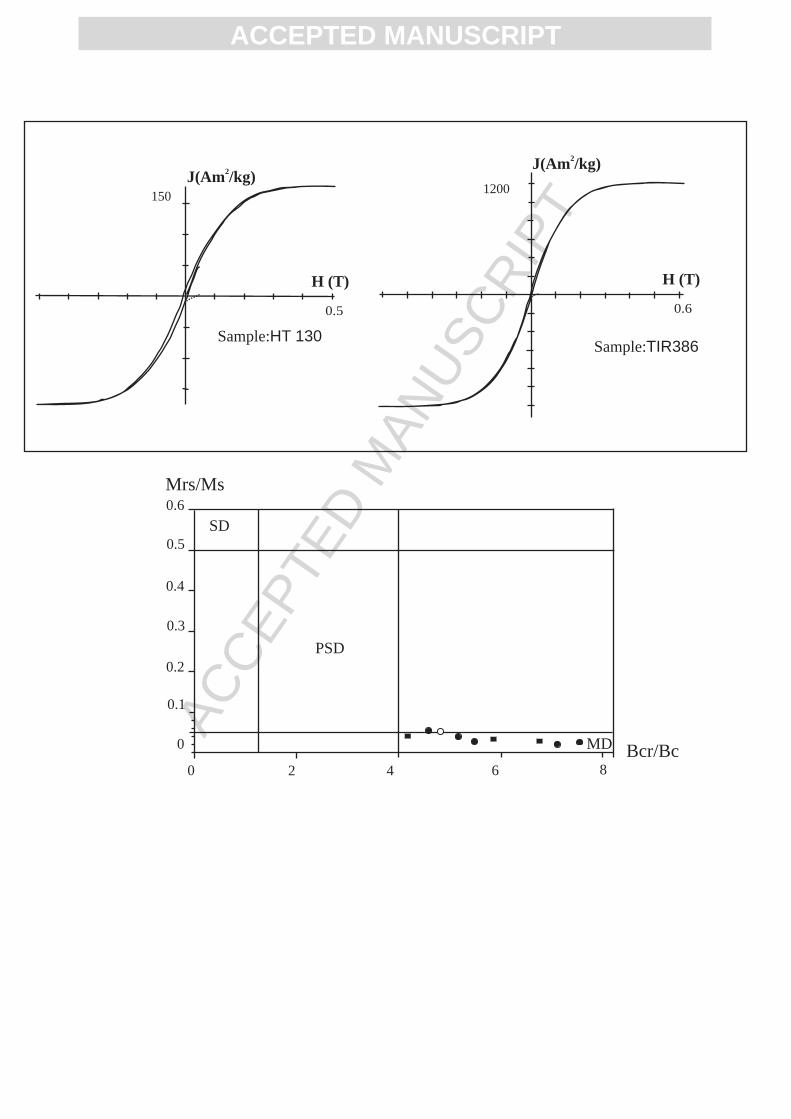
ACC
EPTE
D M
ANU
SCR
IPT
ACCEPTED MANUSCRIPT
Sample:HT 130
150
H (T)
0.5
J(Am /kg)2
1200
J(Am /kg)2
H (T)
Sample:TIR386
0.6
SD
PSD
MD
Mrs/Ms
Bcr/Bc0 2 4 6 8
0.2
0.3
0.4
0.5
0.6
0.1
0
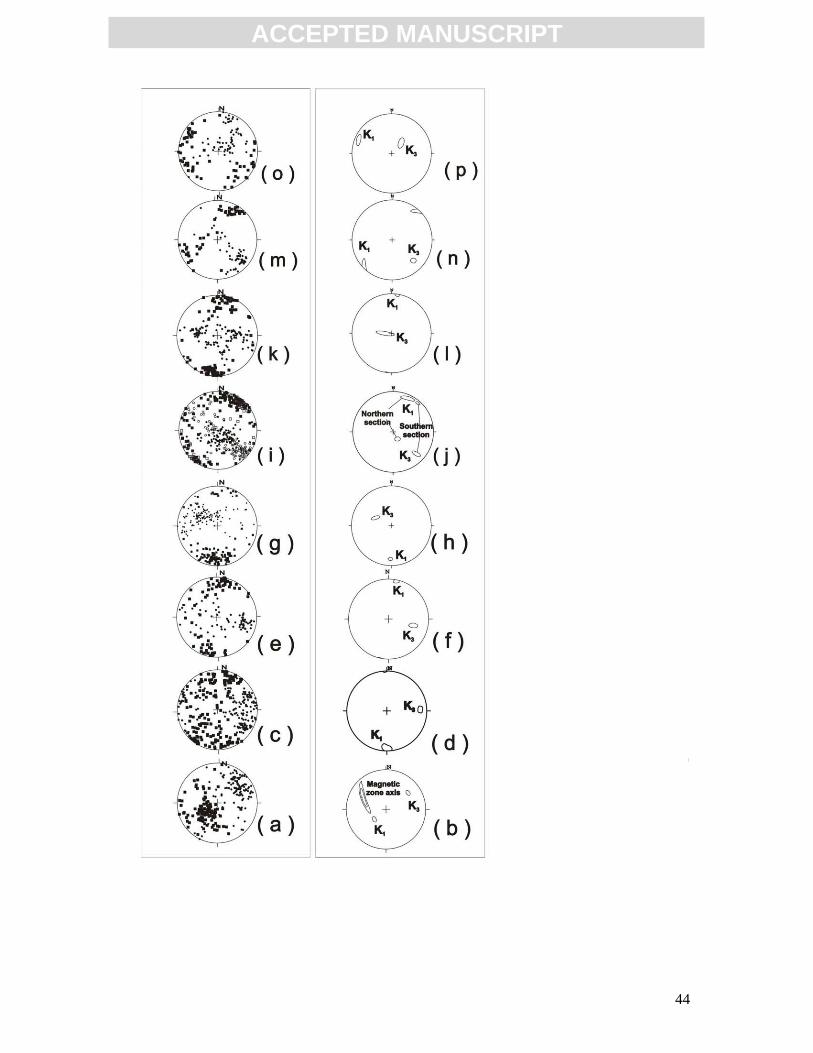
ACC
EPTE
D M
ANU
SCR
IPT
ACCEPTED MANUSCRIPT
44
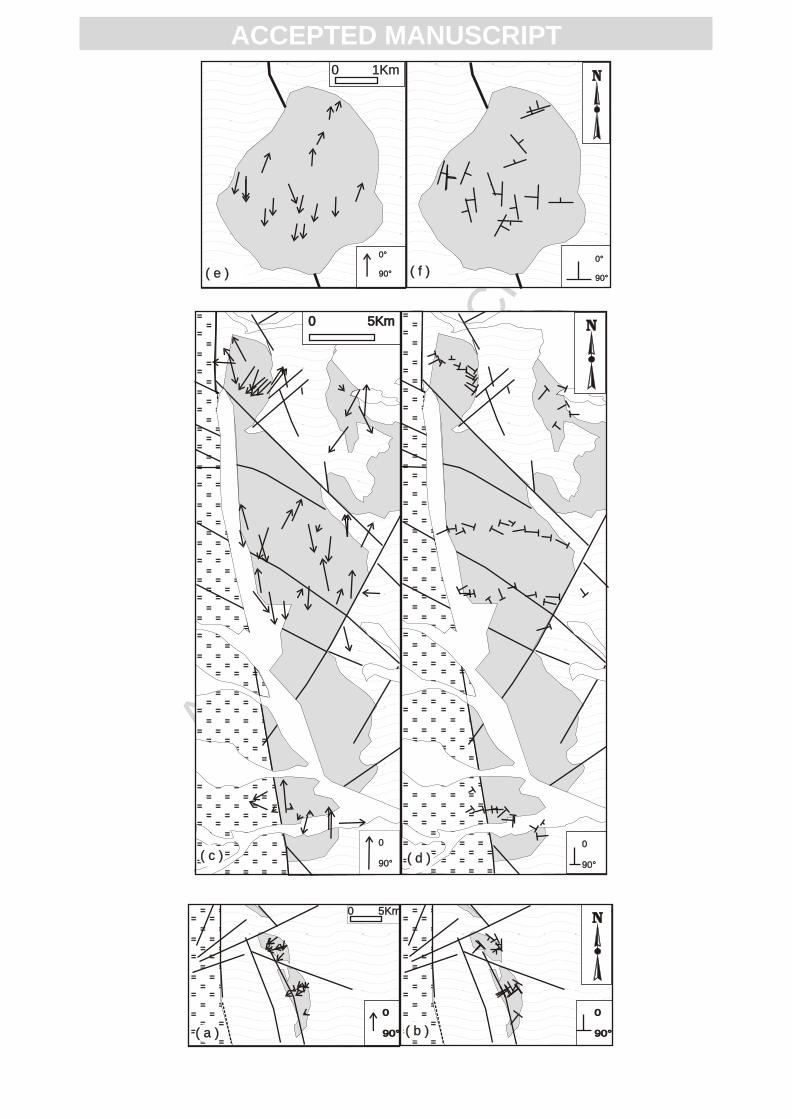
ACC
EPTE
D M
ANU
SCR
IPT
ACCEPTED MANUSCRIPT
0 5Km0 5Km
0
90°
0
90°( c )( c ) ( d )( d )
0
90°
0
90°
0°
90°
0°
90°
0°
90°
0°
90°
0 1Km0 1Km
( e )( e ) ( f )( f )
0 5Km0 5Km
0
90°
0
90°
0
90°
0
90°( a )( a ) ( b )( b )

ACC
EPTE
D M
ANU
SCR
IPT
ACCEPTED MANUSCRIPTN
![Reg. No. [TITTITT 15] - Sims Library](https://static.fdokumen.com/doc/165x107/631b195a19373759090eb4a3/reg-no-tittitt-15-sims-library.jpg)