Hungary 2021 - OECD Economic Surveys
74
OECD Economic Surveys Hungary OVERVIEW http://www.oecd.org/economy/hungary-economic-snapshot/
-
Upload
khangminh22 -
Category
Documents
-
view
2 -
download
0
Transcript of Hungary 2021 - OECD Economic Surveys

OECD Economic Surveys
Hungary OVERVIEW
http://www.oecd.org/economy/hungary-economic-snapshot/

This document, as well as any data and any map included herein, are without prejudice to the
status of or sovereignty over any territory, to the delimitation of international frontiers and
boundaries and to the name of any territory, city or area.
The statistical data for Israel are supplied by and under the responsibility of the relevant Israeli
authorities. The use of such data by the OECD is without prejudice to the status of the Golan
Heights, East Jerusalem and Israeli settlements in the West Bank under the terms of international
law.
OECD Economic Surveys: Hungary© OECD 2021
You can copy, download or print OECD content for your own use, and you can include excerpts
from OECD publications, databases and multimedia products in your own documents,
presentations, blogs, websites and teaching materials, provided that suitable acknowledgement
of OECD as source and copyright owner is given. All requests for public or commercial use and
translation rights should be submitted to [email protected]. Requests for permission to photocopy
portions of this material for public or commercial use shall be addressed directly to the Copyright
Clearance Center (CCC) at [email protected] or the Centre français d’exploitation du droit de
copie (CFC) at [email protected] of or sovereignty over any territory, to the
delimitation of international frontiers and boundaries and to the name of any territory, city or
area.

3
OECD ECONOMIC SURVEYS: HUNGARY 2021 © OECD 2021
Table of contents
Executive summary 8
1 Key Policy Insights 13 Leaving the crisis behind 13 The severe pandemic is countered by strong health measures 16 Economic prospects are improving 20
Growth is accelerating 29 Monetary policy has become more supportive 32
Financial risks require monitoring 34 Embracing innovation in the financial sector 37
Adopting a forward-looking and greener fiscal policy 38 Fiscal policy will remain supportive over the near term 38 Steps to address long-term fiscal challenges will be needed 41 Promoting more environmentally sustainable growth 43
Stronger domestic business dynamism is crucial for higher productivity growth 51 Corruption and lack of public integrity hamper business dynamism 55
An inclusive and mobile labour market is key for sustained growth 58 Improving geographical labour mobility 58 Strengthening female labour force participation 61
References 66
Tables
Table 1. Macroeconomic outlook 9 Table 1.1. Macroeconomic indicators and projections 14 Table 1.2. The past recommendations on healthcare 20 Table 1.3. Events that could lead to major changes in the outlook 32 Table 1.4. The past recommendations on monetary policy 33 Table 1.5. The past recommendations on easing competition in the financial sector 37 Table 1.6. Fiscal indicators 38 Table 1.7. The past recommendations on fiscal policy 41 Table 1.8. The past recommendations on the pension system 42 Table 1.9. Illustrative fiscal impact of recommended reforms 43 Table 1.10. Illustrative impact on GDP per capita from structural reforms 43 Table 1.11. The past recommendations on greening growth 50 Table 1.12. The past recommendations on the business environment 54 Table 1.13. The past recommendations on the business environment and corruption 58 Table 1.14. The past recommendations on labour market policies 60 Table 1.15. The past recommendations on family policies and female career prospects 64
4
OECD ECONOMIC SURVEYS: HUNGARY 2021 © OECD 2021
Figures
Figure 1. Fiscal policy has been supportive 9 Figure 2. Environmental concerns remain 10 Figure 3. Productivity growth has been low 11 Figure 4. Low adoption of advanced ICT 11 Figure 1.1. The COVID-19 pandemic had severe health and economic impacts 13 Figure 1.2. Income convergence has gathered pace 15 Figure 1.3. Violence against women has increased during the pandemic 15 Figure 1.4. The healthcare situation worsened in the second and third waves of the pandemic 17 Figure 1.5. High bed capacity was not matched by similar intensive care capacities 19 Figure 1.6. Capacity reallocation may increase mortality from other causes in the future 20 Figure 1.7. Economy activity contracted sharply in 2020 21 Figure 1.8. Better-targeted measures in the second wave moderated the economic decline, with tourism as a notable exception 21 Figure 1.9. Government support averted bankruptcies 22 Figure 1.10. Production and confidence continue to recover 23 Figure 1.11. Employment growth was driven by the expansion of large firms 24 Figure 1.12. The labour market weakened temporarily as the pandemic spread 25 Figure 1.13. The short-time work scheme provided a relatively low replacement rate 26 Figure 1.14. Unemployment of young and low-skilled workers increased before coming down again 27 Figure 1.15. Wage growth outpaces productivity improvements 27 Figure 1.16. The labour tax wedge remains high despite lower social security contributions 28 Figure 1.17. Wage and inflation pressures remain high 29 Figure 1.18. Supply chain disruptions are slowing down the recovery of the automotive sector 31 Figure 1.19. Automotive products dominate exports 32 Figure 1.20. Monetary policy remains accommodative despite inflationary pressures 33 Figure 1.21. Bank lending is strong and the share of non-performing loans has fallen 35 Figure 1.22. Banks’ low profitability and high operating costs remain a concern 36 Figure 1.23. EU funds support many activities 40 Figure 1.24. Spending pressures related to population ageing need to be addressed 42 Figure 1.25. Green growth indicators have mostly improved 44 Figure 1.26. Carbon pricing score 45 Figure 1.27. An aging car fleet is increasingly based on diesel 46 Figure 1.28. Landfill taxes are low 49 Figure 1.29. Tariffs for water and wastewater services are low 50 Figure 1.30. Strong investment drove productivity growth before the crisis 52 Figure 1.31. Business dynamics are low 52 Figure 1.32. The insolvency regime is stringent 53 Figure 1.33. Occupational entry barriers remain high 54 Figure 1.34. Corruption is perceived as high compared with other OECD countries 56 Figure 1.35. Anti-money laundering measures should be enhanced 57 Figure 1.36. Regional differences in employment and unemployment are large 59 Figure 1.37. The minimum wage is relatively high 60 Figure 1.38. Housing supply adjusts relatively slowly 61 Figure 1.39. Nursery enrolment remains low 62 Figure 1.40. The gender pay gap is high for women in their 30s and 40s 63 Figure 1.41. Women’s work-life balance hampers their career prospects 63

5
OECD ECONOMIC SURVEYS: HUNGARY 2021 © OECD 2021
Look for the StatLinks2at the bottom of the tables or graphs in this book.To download the matching Excel® spreadsheet, just type the link into yourInternet browser, starting with the http://dx.doi.org prefix, or click on the link fromthe e-book edition.
Follow OECD Publications on:
This book has... StatLinks2A service that delivers Excel® files from the printed page!
http://twitter.com/OECD_Pubs
http://www.facebook.com/OECDPublications
http://www.linkedin.com/groups/OECD-Publications-4645871
http://www.youtube.com/oecdilibrary
http://www.oecd.org/oecddirect/Alerts
OECD

6
OECD ECONOMIC SURVEYS: HUNGARY 2021 © OECD 2021
This Survey is published on the responsibility of the Economic and Development Review Committee of the OECD, which is charged with the examination of the economic situation of member countries. The economic situation and policies of Hungary were reviewed by the Committee on 28 June 2021. The draft report was then revised in the light of the discussions and given final approval as the agreed report of the whole Committee on 12 July 2021. The Secretariat’s draft report was prepared for the Committee by Jens-Christian Hoj, Martin Borowiecki, Federico Giovannelli and László Dósza with contributions from Shizuka Kato, Viktoria Kis and Thomas Weko under the supervision of Mame Fatou Diagne. Statistical research assistance was provided by Federico Giovannelli and editorial assistance by Emily Derry. The previous Survey of Hungry was issued in January 2019. Information about the latest as well as previous Surveys and more information about how Surveys are prepared is available at http://www.oecd.org/eco/surveys.

7
OECD ECONOMIC SURVEYS: HUNGARY 2021 © OECD 2021
BASIC STATISTICS OF HUNGARY, 2020* (Numbers in parentheses refer to the OECD average)**
LAND, PEOPLE AND ELECTORAL CYCLE
Population (million, 2019) 9.8 Population density per km² (2018) 107.1 (38.1)
Under 15 (%, 2019) 14.4 (17.9) Life expectancy at birth (years, 2019) 76.0 (80.2)
Over 65 (%, 2019) 19.7 (17.1) Men (2019) 72.9 (77.6)
International migrant stock (%, 2019) 5.3 (13.2) Women (2019) 79.3 (82.9)
Latest 5-year average growth (%) -0.2 (0.6) Latest general election April-2018
ECONOMY
Gross domestic product (GDP) Value added shares (%, 2019)
In current prices (billion USD) 155.1 Agriculture, forestry and fishing (2019) 4.0 (2.7)
In current prices (billion HUF) 47 743.5 Industry including construction (2019) 29.5 (26.6)
Latest 5-year average real growth (%) 2.2 (0.7) Services (2019) 66.6 (70.8)
Per capita (000 USD PPP, 2019) 34.0 (47.6)
GENERAL GOVERNMENT
Expenditure (% of GDP, OECD: 2019) 51.6 (40.6) Gross financial debt (% of GDP,OECD: 2018) 97.6 (107.6)
Revenue (% of GDP, OECD: 2019) 43.5 (37.5) Net financial debt (% of GDP, OECD: 2018) 61.0 (67.9)
EXTERNAL ACCOUNTS
Exchange rate (HUF per USD) 307.83 Main exports (% of total merchandise exports)
PPP exchange rate (USA = 1) 148.01 Machinery and transport equipment 56.7
In per cent of GDP Chemicals and related products, n.e.s. 12.6
Exports of goods and services 79.7 (50.8) Manufactured goods 9.8
Imports of goods and services 77.5 (46.9) Main imports (% of total merchandise imports)
Current account balance -0.1 (0.1) Machinery and transport equipment 47.5
Net international investment position -49.2 Manufactured goods 14.0
Chemicals and related products, n.e.s. 13.7
LABOUR MARKET, SKILLS AND INNOVATION
Employment rate (aged 15 and over, %) 54.5 (55.1) Unemployment rate, LFS (aged 15 and over, %) 4.3 (7.1)
Men (OECD: 2019) 63.6 (65.6) Youth (aged 15-24, %, OECD: 2019) 12.8 (11.8)
Women (OECD: 2019) 46.3 (49.9) Long-term unemployed (1 year and over, %) 1.2 (1.3)
Participation rate (aged 15 and over, %) 62.9 (59.6) Tertiary educational attainment (aged 25-64, %,
2019)
26.0 (38.0)
Average hours worked per year 1 660 (1 687) Gross domestic expend. on R&D (% of GDP, 2018) 1.6 (2.6)
ENVIRONMENT
Total primary energy supply per capita (toe,
2019) 2.7 (3.9) CO2 emissions from fuel combustion per capita
(tonnes, 2019) 4.7 ( 8.3)
Renewables (%, 2019) 10.3 (10.8) Water abstractions per capita (1 000 m³, 2018) 0.4
Exposure to air pollution (more than 10 g/m³ of
PM 2.5, % of population, 2019)
100.0 (61.7) Municipal waste per capita (tonnes, 2019) 0.4 (0.5)
SOCIETY
Income inequality (Gini coefficient, 2017,
OECD: latest available)
0.289 (0.318) Education outcomes (PISA score, 2018)
Relative poverty rate (%, 2017, OECD: 2016) 8.0 (11.7) Reading 476 (487)
Median disposable household income (000
USD PPP, 2017)
12.1 (19.7) Mathematics 481 (489)
Public and private spending (% of GDP) Science 481 (489)
Health care (2019) 6.4 (8.8) Share of women in parliament (%) 12.1 (31.4)
Pensions (2018, OECD: 2017) 8.6 (8.6) Net official development assistance (% of GNI, 2017) 0.1 (0.4)
Education (% of GNI, 2019) 4.4 (4.4)
* The year is indicated in parenthesis if it deviates from the year in the main title of this table. ** Where the OECD aggregate is not provided in
the source database, a simple OECD average of latest available data is calculated where data exist for at least 80% of member countries.
Source: Calculations based on data extracted from databases of the following organisations: OECD, International Energy Agency, International
Labour Organisation, International Monetary Fund, United Nations, World Bank.

8
OECD ECONOMIC SURVEYS: HUNGARY 2021 © OECD 2021
Executive summary

9
OECD ECONOMIC SURVEYS: HUNGARY 2021 © OECD 2021
The recovery is gathering pace The pandemic interrupted the strong economic growth performance in 2016-19, which entailed large increases in employment and real incomes, and the lowest unemployment rate in thirty years.
Strong growth is returning (Table 1). The government used general containment measures during the first wave and more targeted and sector-specific measures in the second wave, allowing for more economic activity. Together with stronger international demand, this benefited manufacturing and many service sectors, leaving hospitality as the most affected sector. The swift rollout of vaccine programmes allows a faster recovery from mid-2021 onwards, as pent-up demand is released and external demand strengthens. However, the pace and strength of the recovery is uncertain, reflecting the potential scarring of the economy arising from the prolonged crisis. New variants could add pressures on the health sector and potentially lead to new restrictions and lower domestic spending.
Table 1. Macroeconomic outlook
Y-o-y % changes 2020 2021 2022
Gross domestic product -5.1 4.6 5.0
Final domestic demand -3.5 2.6 5.0
Net exports (contribution to GDP growth) -2.1 2.1 0.2
Unemployment rate (% of labour force) 4.2 4.0 3.4
Consumer price index 3.3 3.9 3.9
Current account balance (% of GDP) 0.1 0.8 0.8
Note: Data for 2021 and 2022 refer to projections.
Source: OECD Economic Outlook 109 database (June 2021).
During the pandemic, the government supported jobs and incomes. A new short time working scheme has been the principal measure to contain the rising unemployment rate. Businesses have been supported by a moratorium on loan repayments, reduced interest rates, lower social security contributions and grants, contributing to a historically low number of bankruptcies. Nonetheless, corporate and household loan defaults are likely to increase, requiring the close monitoring of bank vulnerabilities.
Fiscal and monetary policies are supportive. In 2020, discretionary fiscal policy amounted to 5% of GDP, which with the weak economy raised the public deficit (Figure 1). In 2021, the economic recovery and the termination of many support measures should reduce the deficit by ½-percentage point. The release of pent-up demand
in the second half of the year should ensure that no new short-term fiscal stimulus is needed. From 2021 onwards, annual inflows of EU funds in the order of 3 ½ % of GDP will support growth. As the recovery becomes self-sustained, the fiscal focus could return to preparing for impending ageing-related spending increases and secure fiscal sustainability. The central bank has appropriately maintained an accommodative monetary policy stance, but inflation pressures remain high.
Figure 1. Fiscal policy has been supportive
Note: National accounts definition of gross public debt. The shaded
area denotes projections.
Source: OECD Economic Outlook database.
StatLink 2 https://doi.org/10.1787/888934266590
The prolonged pandemic strains people’s well- being and threatens social inclusion. Some of the social costs will be temporary. Others will have longer lasting impacts, including the effects of increased domestic violence and the educational damages created by the difficulties of providing all pupils with high-quality distant learning.
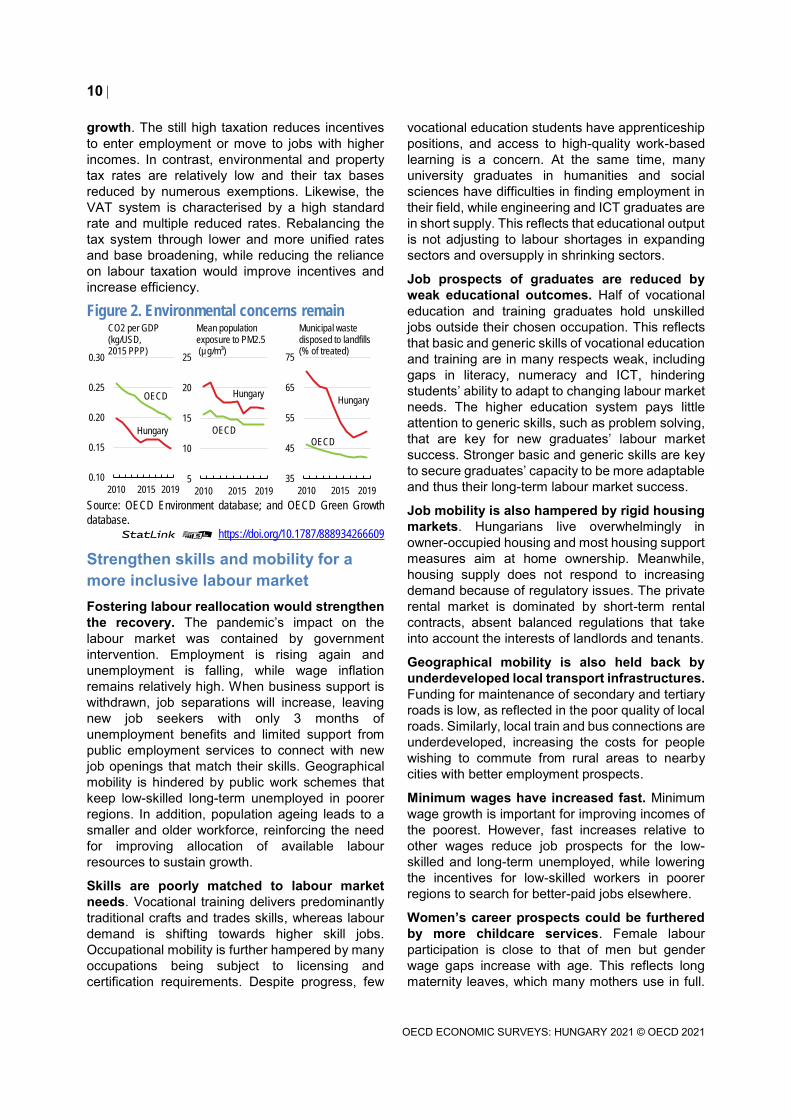
Better policy coherence would favour more sustainable growth. The environmental performance has been broadly satisfactorily in meeting 2020 emissions objectives. However, insufficient progress has been made in reducing small particles emissions and the extensive use of landfills (Figure 2). Meeting more ambitious 2030 emissions objectives and an expected increase in road transport add to environmental policy challenges. Environmental policy is based on a combination of regulation, subsidies, and tax rates that vary across sectors and activities. Some energy prices are regulated for affordability reasons, often to below-cost levels, leading to an uneven burden sharing and more costly emission reductions.
Despite reform, taxation of labour income remains high, which is not conducive to
-15
-12
-9
-6
-3
0
80
85
90
95
100
105
2015 2016 2017 2018 2019 2020 2021
Gross public debt (left-axis)
Public fiscal balance (right-axis)% of GDP % of GDP
10
OECD ECONOMIC SURVEYS: HUNGARY 2021 © OECD 2021
growth. The still high taxation reduces incentives to enter employment or move to jobs with higher incomes. In contrast, environmental and property tax rates are relatively low and their tax bases reduced by numerous exemptions. Likewise, the VAT system is characterised by a high standard rate and multiple reduced rates. Rebalancing the tax system through lower and more unified rates and base broadening, while reducing the reliance on labour taxation would improve incentives and increase efficiency.
Figure 2. Environmental concerns remain
Source: OECD Environment database; and OECD Green Growth
database.
StatLink 2 https://doi.org/10.1787/888934266609
Strengthen skills and mobility for a more inclusive labour market Fostering labour reallocation would strengthen the recovery. The pandemic’s impact on the labour market was contained by government intervention. Employment is rising again and unemployment is falling, while wage inflation remains relatively high. When business support is withdrawn, job separations will increase, leaving new job seekers with only 3 months of unemployment benefits and limited support from public employment services to connect with new job openings that match their skills. Geographical mobility is hindered by public work schemes that keep low-skilled long-term unemployed in poorer regions. In addition, population ageing leads to a smaller and older workforce, reinforcing the need for improving allocation of available labour resources to sustain growth.
Skills are poorly matched to labour market needs. Vocational training delivers predominantly traditional crafts and trades skills, whereas labour demand is shifting towards higher skill jobs. Occupational mobility is further hampered by many occupations being subject to licensing and certification requirements. Despite progress, few
vocational education students have apprenticeship positions, and access to high-quality work-based learning is a concern. At the same time, many university graduates in humanities and social sciences have difficulties in finding employment in their field, while engineering and ICT graduates are in short supply. This reflects that educational output is not adjusting to labour shortages in expanding sectors and oversupply in shrinking sectors.
Job prospects of graduates are reduced by weak educational outcomes. Half of vocational education and training graduates hold unskilled jobs outside their chosen occupation. This reflects that basic and generic skills of vocational education and training are in many respects weak, including gaps in literacy, numeracy and ICT, hindering students’ ability to adapt to changing labour market needs. The higher education system pays little attention to generic skills, such as problem solving, that are key for new graduates’ labour market success. Stronger basic and generic skills are key to secure graduates’ capacity to be more adaptable and thus their long-term labour market success.
Job mobility is also hampered by rigid housing markets. Hungarians live overwhelmingly in owner-occupied housing and most housing support measures aim at home ownership. Meanwhile, housing supply does not respond to increasing demand because of regulatory issues. The private rental market is dominated by short-term rental contracts, absent balanced regulations that take into account the interests of landlords and tenants.
Geographical mobility is also held back by underdeveloped local transport infrastructures. Funding for maintenance of secondary and tertiary roads is low, as reflected in the poor quality of local roads. Similarly, local train and bus connections are underdeveloped, increasing the costs for people wishing to commute from rural areas to nearby cities with better employment prospects.
Minimum wages have increased fast. Minimum wage growth is important for improving incomes of the poorest. However, fast increases relative to other wages reduce job prospects for the low-skilled and long-term unemployed, while lowering the incentives for low-skilled workers in poorer regions to search for better-paid jobs elsewhere.
Women’s career prospects could be furthered by more childcare services. Female labour participation is close to that of men but gender wage gaps increase with age. This reflects long maternity leaves, which many mothers use in full.
0.10
0.15
0.20
0.25
0.30
2010 2015 2019
CO2 per GDP (kg/USD, 2015 PPP)
OECD
Hungary
5
10
15
20
25
2010 2015 2019
Mean population exposure to PM2.5(µg/m³)
OECD
Hungary
35
45
55
65
75
2010 2015 2019
Municipal waste disposed to landfills (% of treated)
OECD
Hungary

11
OECD ECONOMIC SURVEYS: HUNGARY 2021 © OECD 2021
Also, women provide many more hours of unpaid work for domestic and child rearing than men.
Stronger business dynamics and more competitive markets are crucial for higher productivity growth Long-term productivity growth has been weak. Dynamic business investment has led to a cyclical upswing in productivity growth. Nonetheless, average productivity growth has been weak over the past decade (Figure 3). Despite a recent decrease in the productivity gap, there are still large underlying differences between capital-rich foreign owned investment intensive companies that compete on world markets and domestic capital-poor and low-productivity firms with low investments that are focussed on home markets with few connections to international supply chains.
Figure 3. Productivity growth has been low
Source: OECD Productivity database; and Hungarian Central
Statistical Office.
StatLink 2 https://doi.org/10.1787/888934266628
Firm entries and exits have been relatively low, pointing to weak competition. This has allowed low-productivity firms to maintain disproportionally large market shares and has slowed the reallocation of resources to high-growth firms, holding back economy-wide productivity growth and faster income convergence.
The pro-competitive regulatory framework is little used. The competition authority is not sufficiently active in sectors with high risk of collusion, with few market studies and decisions. For example, few decisions have been made in the area of public procurement, despite the high number irregularities reported by the European Commission. This reflects insufficient funding for adequate enforcement and for retaining highly specialised experts. Also, important areas are
exempt from competition scrutiny on grounds of national strategic interest.
Sectoral taxes on turnover are used in several sectors, including energy, finance and retail. Such taxes hinder new entry and investment, while exits are slowed by lengthy and costly insolvency procedures.
State-intervention in network sectors is extensive. The energy sector is dominated by state-owned quasi monopolies. In the telecom sector, the recent rewarding of new 5G spectrum to incumbents has reinforced market concentration and further reduced competitive pressures.
The formal anti-corruption framework has been enhanced in recent years. However, perceived corruption remains a multidimensional concern and several issues remain to be tackled, including improving trust in institutions and public procurement. Effective anti-corruption oversight is needed to ensure better use of public resources, including the efficient use of procurement in the roll-out of public investments, and fostering stronger business dynamics.
Digitalisation is low. Adaptation of digital technologies in smaller firms and the public sector lags behind other countries (Figure 4). A concern is high mobile internet prices, which reduce mobile broadband usage. In addition, businesses use high-speed broadband less than elsewhere. Low digital preparedness hinders the implementation of new technologies and the integration into national and international supply chains. The public sector can play an important role model by leading the adaptation of digital technologies.
Figure 4. Low adoption of advanced ICT
Note: Firms from the financial sector are excluded. High-speed
broadband are subscriptions with 100+ Mbps.
Source: OECD ICT Access and Usage by Businesses database.
StatLink 2 https://doi.org/10.1787/888934266647
-10
-5
0
5
10
15
20
25
2010 2011 2012 2013 2014 2015 2016 2017 2018 2019 2020
Real GDP per hour worked
Real business investmentY-o-y % changes
0
20
40
60
80
100
Socialmedia
Cloudcomputing
High-speedbroadband
Big dataanalysis
Hungary OECD Best performing country
% of firms (10+ employees), 2020 or latest year available

12
OECD ECONOMIC SURVEYS: HUNGARY 2021 © OECD 2021
Main Findings Key Recommendations
Macroeconomic and financial policies to support the recovery
Inflation is above the inflation target of 3% and moved outside the
central bank’s upper tolerance band of +/- 1% in spring 2021.
Continue to increase policy interest rates if inflation expectations becomes
unanchored.
Gradually exit from unconventional monetary policy measures.
Fiscal policy is supportive. Continue to provide targeted fiscal support as needed, while preparing for
fiscal consolidation once the recovery has become self-sustained.
Adopt a medium-term strategy to reduce debt and prepare for the long-run
fiscal challenges of ageing.
Population ageing is accelerating, boosting ageing-related spending
pressures.
Complete the ongoing increase of the statutory retirement age to 65 by
2022. Thereafter link it to gains in life expectancy.
Structural reforms for stronger and more sustainable growth
High labour taxes deter labour market participation and investment in
skills. The effective VAT rate is lower than the standard VAT rate.
Make the tax system more growth-friendly by further reducing the reliance on labour taxation, continuing to increase the reliance on consumption taxes and raising immobile property taxes, while addressing adverse
distributional impacts.
Simplify the VAT system by moving towards a broader-based and lower
standard VAT rate.
The tax system imposes heterogeneous abatement costs across
sectors and activities.
Gradually unify carbon taxes and set non-carbon environmental taxes and
fees according to the polluter pays principle.
Low regulated prices (often below cost) of energy, water, wastewater
and waste collection services do not incentivise investments.
Ensure cost recovery in regulated energy and introduce targeted
affordability measures to help low-income households.
Increase waste collection fees and water and wastewater service tariffs to
help finance needed investments.
Support skills development and mobility for a more inclusive labour market
Skills of vocational graduates do not meet labour market needs. Few
vocational students have apprenticeships.
Link funding for vocational schools to the number of students in work
placements.
Allow apprenticeships to start only once a placement with a company for
the work-based part of the programme is secured.
Rental housing is underdeveloped. Regulate tenancy to better balance the interest of tenants and landlords.
The short (3 months) duration of unemployment benefits discourages
geographical mobility.
Consider increasing the duration of unemployment benefits.
Local train networks are underdeveloped and local roads are poorly
maintained. Increase investment in local train networks.
Increase funding for maintenance of secondary and tertiary roads.
Introduce cost-benefit analysis and co-funding for infrastructure projects.
Employment among young mothers is low. Expand the availability of affordable, high-quality childcare.
Reduce the effective length of parental leave and continue to facilitate
more flexible working arrangements.
Ensure dynamic and competitive markets
Exemptions from competition policy reduce the effectiveness of the
competition framework.
Subject all mergers that fulfil the merger threshold to full reviews.
Establish limited and explicit public interest grounds for exemptions.
Sectoral taxes discourage expansions and new entry. Phase out distortionary sector taxes in energy, finance and retail sectors.
Public procurement lacks competition. Increase the use of e-invoicing through the electronic procurement
system.
Further enhance transparency and continue to increase the share of
public procurement subject to competitive tendering.
Prices for mobile internet are high. Phase out levies on phone calls and messages.
Strengthen network competition through auctioning of additional
spectrum to expand the number of mobile network operators.
The anti-corruption framework needs further strengthening to be more
effective.
Establish an independent anti-corruption authority or a strong
coordination committee.

13
OECD ECONOMIC SURVEYS: HUNGARY 2021 © OECD 2021
Leaving the crisis behind In 2016-19, Hungary had strong economic growth with large increases in employment and real incomes, while unemployment fell to its lowest level in the past 30 years. At the same time, public finances improved: public deficits and the public debt-to-GDP ratio shrunk. This strong economic performance came to an abrupt halt in 2020 (Table 1.1). While the first wave of the COVID-19 pandemic was relatively mild from a public health standpoint, containment restrictions and reduced international demand hit economic activity hard. The second wave of the pandemic had more severe health impacts, but milder economic consequences, reflecting more targeted containment measures and robust international demand. The third wave had severe health consequence despite a relatively fast roll out of vaccine programmes. The economic downswing and supportive fiscal policy widened the budget deficit and increased public debt (Figure 1.1)
Figure 1.1. The COVID-19 pandemic had severe health and economic impacts
Source: OECD calculations based on Ourworldindata; and OECD Economic Outlook: Statistics and Projections database.
StatLink 2 https://doi.org/10.1787/888934266666
0
200
400
600
800
1000
1200
1400
Mar-20 Jun-20 Sep-20 Dec-20 Mar-21 Jun-21
A. COVID-19 cases and hospitalisationsPer million population, 4-day moving average
New cases
Hospitalisations
0.5
1.0
1.5
2.0
2.5
3.0
3.5
4.0
4.5
5.0
34
35
36
37
38
39
40
41
42
43
2018Q1 2018Q3 2019Q1 2019Q3 2020Q1 2020Q3 2021Q1
B. GDP and unemployment
Real GDP (left-axis)
Unemployment rate (right-axis)
% of labour forceTrillion Forint
1 Key Policy Insights

14
OECD ECONOMIC SURVEYS: HUNGARY 2021 © OECD 2021
Table 1.1. Macroeconomic indicators and projections
2019 2020 2021¹ 2022¹ Current prices
(HUF billion)
Annual percentage change, volume (2015 prices)
Gross domestic product (GDP) 47524.0 -5.1 4.6 5.0
Private consumption 23455.2 -2.3 -0.1 5.7
Government consumption 9409.4 -1.0 1.6 2.5
Gross fixed capital formation 12890.0 -7.3 8.3 5.7
Housing 1522.5 16.6 10.2 0.7
Final domestic demand 45754.6 -3.5 2.6 5.0
Stockbuilding² 434.0 0.4 0.0 0.0
Total domestic demand 46188.6 -2.9 2.8 4.9
Exports of goods and services 39104.5 -6.8 9.9 5.7
Imports of goods and services 37769.1 -4.4 7.5 5.7
Net exports² 1335.4 -2.1 2.1 0.2
Memorandum items
Potential GDP . . 3.0 2.8 2.7
Output gap (% of potential GDP) . . -5.9 -4.2 -2.2
Employment . . -1.1 0.8 1.1
Unemployment rate (% of labour force) . . 4.2 4.0 3.4
GDP deflator . . 5.9 5.6 3.8
Index of consumer prices . . 3.3 3.9 3.9
Index of core inflation³ . . 3.0 3.4 3.9
Household saving ratio, net (% of household disposable income) . . 8.7¹ 8.8 6.6
Current account balance (% of GDP) . . 0.1 0.8 0.8
General government fiscal balance (% of GDP) . . -8.1 -7.5 -5.9
Underlying general government fiscal balance (% of potential GDP) . . -4.7 -6.4 -6.3
Underlying government primary fiscal balance (% of potential GDP) . . -2.6 -4.3 -4.1
General government debt, Maastricht definition (% of GDP) . . 80.4 81.9 81.9
General government net debt (% of GDP) . . 61.0 62.8 63.5
Three-month money market rate, average . . 0.5 0.4 0.4
Ten-year government bond yield, average . . 2.2 2.4 2.4
1. OECD estimates unless otherwise stated.
2. Contribution to changes in real GDP.
3. Index of consumer prices excluding food and energy.
Source: OECD Economic Outlook 109 database (June 2021).
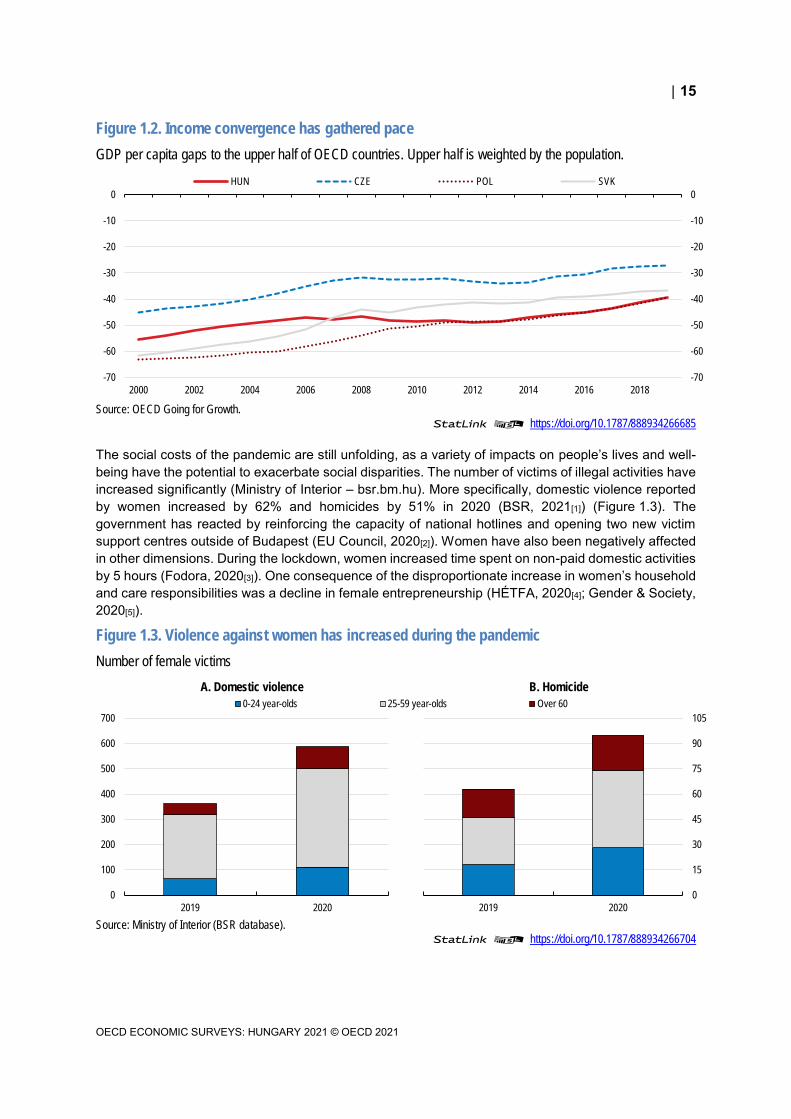
The strong pre-COVID-19 upswing accelerated income convergence (Figure 1.2). This reflected mostly strong real wage and employment increases. Growth was supported by faster productivity growth in 2017-2019, although with the onset of the pandemic, there was a strong contraction in productivity. A concern though is that despite the strong labour market performance, there are still underutilised labour resources, particularly in poorer regions.
15
OECD ECONOMIC SURVEYS: HUNGARY 2021 © OECD 2021
Figure 1.2. Income convergence has gathered pace
GDP per capita gaps to the upper half of OECD countries. Upper half is weighted by the population.
Source: OECD Going for Growth.
StatLink 2 https://doi.org/10.1787/888934266685
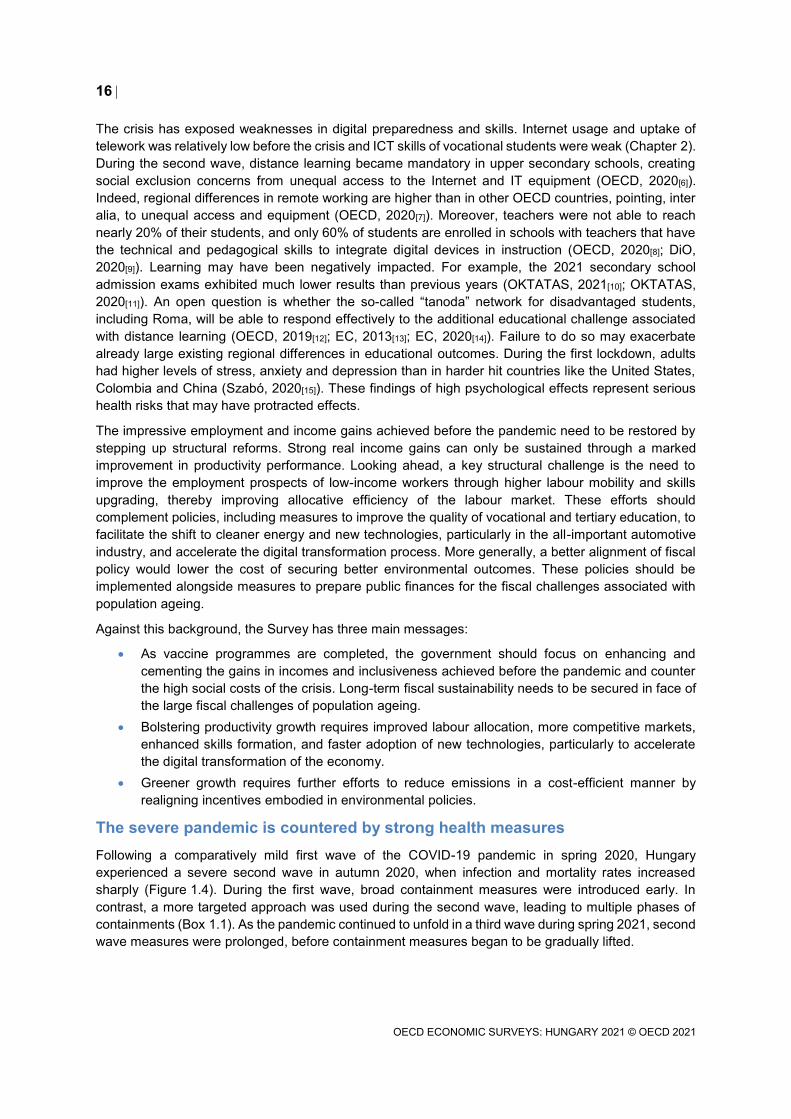
The social costs of the pandemic are still unfolding, as a variety of impacts on people’s lives and well-being have the potential to exacerbate social disparities. The number of victims of illegal activities have increased significantly (Ministry of Interior – bsr.bm.hu). More specifically, domestic violence reported by women increased by 62% and homicides by 51% in 2020 (BSR, 2021[1]) (Figure 1.3). The government has reacted by reinforcing the capacity of national hotlines and opening two new victim support centres outside of Budapest (EU Council, 2020[2]). Women have also been negatively affected in other dimensions. During the lockdown, women increased time spent on non-paid domestic activities by 5 hours (Fodora, 2020[3]). One consequence of the disproportionate increase in women’s household and care responsibilities was a decline in female entrepreneurship (HÉTFA, 2020[4]; Gender & Society, 2020[5]).
Figure 1.3. Violence against women has increased during the pandemic
Number of female victims
Source: Ministry of Interior (BSR database).
StatLink 2 https://doi.org/10.1787/888934266704
-70
-60
-50
-40
-30
-20
-10
0
-70
-60
-50
-40
-30
-20
-10
0
2000 2002 2004 2006 2008 2010 2012 2014 2016 2018
HUN CZE POL SVK
0
100
200
300
400
500
600
700
2019 2020
A. Domestic violence
0-24 year-olds 25-59 year-olds Over 60
0
15
30
45
60
75
90
105
2019 2020
B. Homicide
16
OECD ECONOMIC SURVEYS: HUNGARY 2021 © OECD 2021
The crisis has exposed weaknesses in digital preparedness and skills. Internet usage and uptake of telework was relatively low before the crisis and ICT skills of vocational students were weak (Chapter 2). During the second wave, distance learning became mandatory in upper secondary schools, creating social exclusion concerns from unequal access to the Internet and IT equipment (OECD, 2020[6]). Indeed, regional differences in remote working are higher than in other OECD countries, pointing, inter alia, to unequal access and equipment (OECD, 2020[7]). Moreover, teachers were not able to reach nearly 20% of their students, and only 60% of students are enrolled in schools with teachers that have the technical and pedagogical skills to integrate digital devices in instruction (OECD, 2020[8]; DiO, 2020[9]). Learning may have been negatively impacted. For example, the 2021 secondary school admission exams exhibited much lower results than previous years (OKTATAS, 2021[10]; OKTATAS, 2020[11]). An open question is whether the so-called “tanoda” network for disadvantaged students, including Roma, will be able to respond effectively to the additional educational challenge associated with distance learning (OECD, 2019[12]; EC, 2013[13]; EC, 2020[14]). Failure to do so may exacerbate already large existing regional differences in educational outcomes. During the first lockdown, adults had higher levels of stress, anxiety and depression than in harder hit countries like the United States, Colombia and China (Szabó, 2020[15]). These findings of high psychological effects represent serious health risks that may have protracted effects.
The impressive employment and income gains achieved before the pandemic need to be restored by stepping up structural reforms. Strong real income gains can only be sustained through a marked improvement in productivity performance. Looking ahead, a key structural challenge is the need to improve the employment prospects of low-income workers through higher labour mobility and skills upgrading, thereby improving allocative efficiency of the labour market. These efforts should complement policies, including measures to improve the quality of vocational and tertiary education, to facilitate the shift to cleaner energy and new technologies, particularly in the all-important automotive industry, and accelerate the digital transformation process. More generally, a better alignment of fiscal policy would lower the cost of securing better environmental outcomes. These policies should be implemented alongside measures to prepare public finances for the fiscal challenges associated with population ageing.
Against this background, the Survey has three main messages:
As vaccine programmes are completed, the government should focus on enhancing and cementing the gains in incomes and inclusiveness achieved before the pandemic and counter the high social costs of the crisis. Long-term fiscal sustainability needs to be secured in face of the large fiscal challenges of population ageing.
Bolstering productivity growth requires improved labour allocation, more competitive markets, enhanced skills formation, and faster adoption of new technologies, particularly to accelerate the digital transformation of the economy.
Greener growth requires further efforts to reduce emissions in a cost-efficient manner by realigning incentives embodied in environmental policies.
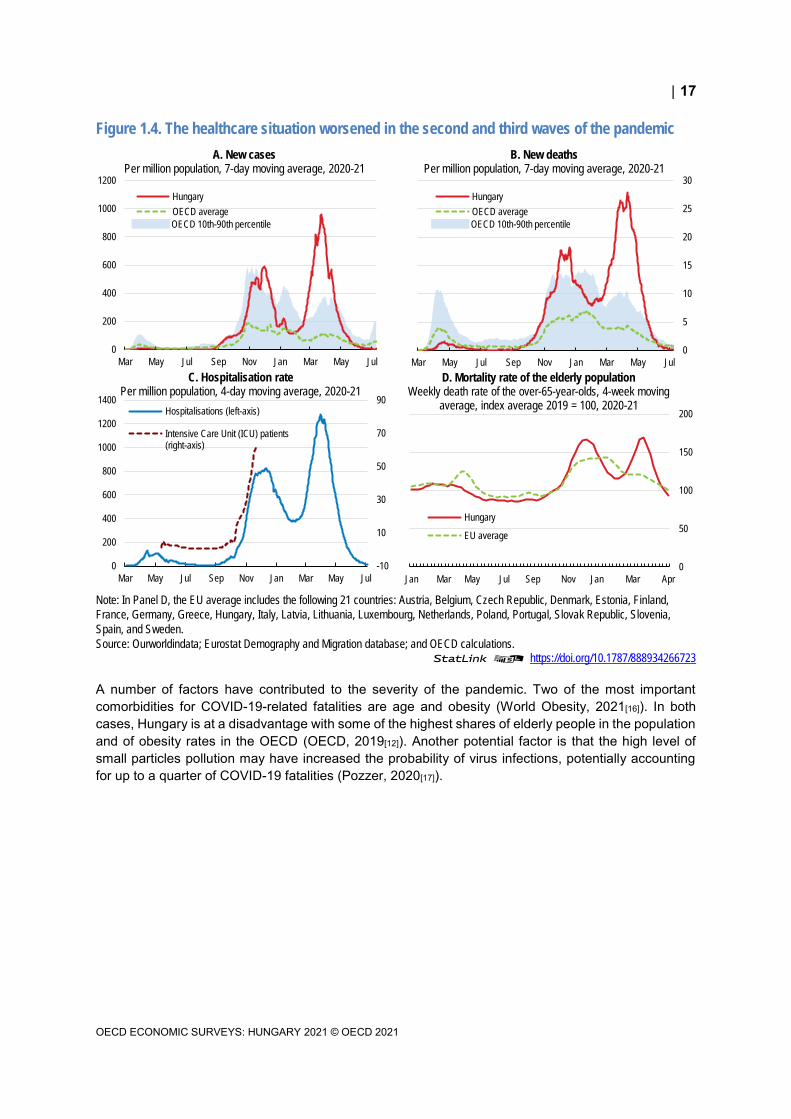
The severe pandemic is countered by strong health measures Following a comparatively mild first wave of the COVID-19 pandemic in spring 2020, Hungary experienced a severe second wave in autumn 2020, when infection and mortality rates increased sharply (Figure 1.4). During the first wave, broad containment measures were introduced early. In contrast, a more targeted approach was used during the second wave, leading to multiple phases of containments (Box 1.1). As the pandemic continued to unfold in a third wave during spring 2021, second wave measures were prolonged, before containment measures began to be gradually lifted.
17
OECD ECONOMIC SURVEYS: HUNGARY 2021 © OECD 2021
Figure 1.4. The healthcare situation worsened in the second and third waves of the pandemic
Note: In Panel D, the EU average includes the following 21 countries: Austria, Belgium, Czech Republic, Denmark, Estonia, Finland,
France, Germany, Greece, Hungary, Italy, Latvia, Lithuania, Luxembourg, Netherlands, Poland, Portugal, Slovak Republic, Slovenia,
Spain, and Sweden.
Source: Ourworldindata; Eurostat Demography and Migration database; and OECD calculations.
StatLink 2 https://doi.org/10.1787/888934266723
A number of factors have contributed to the severity of the pandemic. Two of the most important comorbidities for COVID-19-related fatalities are age and obesity (World Obesity, 2021[16]). In both cases, Hungary is at a disadvantage with some of the highest shares of elderly people in the population and of obesity rates in the OECD (OECD, 2019[12]). Another potential factor is that the high level of small particles pollution may have increased the probability of virus infections, potentially accounting for up to a quarter of COVID-19 fatalities (Pozzer, 2020[17]).
0
200
400
600
800
1000
1200
Mar May Jul Sep Nov Jan Mar May Jul
A. New casesPer million population, 7-day moving average, 2020-21
Hungary
OECD average
OECD 10th-90th percentile
0
5
10
15
20
25
30
Mar May Jul Sep Nov Jan Mar May Jul
B. New deathsPer million population, 7-day moving average, 2020-21
Hungary
OECD average
OECD 10th-90th percentile
-10
10
30
50
70
90
0
200
400
600
800
1000
1200
1400
Mar May Jul Sep Nov Jan Mar May Jul
C. Hospitalisation ratePer million population, 4-day moving average, 2020-21
Hospitalisations (left-axis)
Intensive Care Unit (ICU) patients(right-axis)
0
50
100
150
200
Jan Mar May Jul Sep Nov Jan Mar Apr
D. Mortality rate of the elderly populationWeekly death rate of the over-65-year-olds, 4-week moving
average, index average 2019 = 100, 2020-21
Hungary
EU average

18
OECD ECONOMIC SURVEYS: HUNGARY 2021 © OECD 2021
Box 1.1. From general social distancing measures to targeted limitations
The first wave (starting in March 2020) was characterized by strict restrictions:
General stay at home order with a few exceptions such as work, essential shopping activities and outdoor recreation
Distance learning in all educational institutions Postponement of all non-vital healthcare treatment Mandatory use of masks in shops and public transport from May onwards Closure of boarders and strict home quarantine rules Exclusive shopping hours for elderly people. Restricted opening hours for non-essential shops Military officers took control over hospitals, to facilitate logistics and inventory management
Measures in the second wave (starting in November) were more targeted and introduced in November:
Night curfew between 8 pm and 5 am Private events permitted for max. 10 persons and all public assemblies prohibited Individual outdoor activities allowed, sports events held behind closed doors Restaurants only allowed to provide takeaway services. Canteens open Hotels were only allowed to receive business guests until end-April Closure of leisure and entertainment facilities until 1 May Distance learning introduced for secondary schools, universities and colleges Hospitals non-vital treatments postponed but outpatient care, fertility programmes, cancer and
cardiovascular treatments, cancer screening and transplantation continued as usual
New restrictions in the third wave (starting in March 2021):
Closure of shops (except for food stores, pharmacies, drugstores and fuel stations) and service providers until 8th April, however, with many exceptions
Closure of all schools with distance learning for primary schools until 19 April for grades 1-4 and until 10 May for grades 5-8 as well as for secondary schools. Closure of kindergartens
Source: (koronavirus.gov.hu, 2020[18]; Portfolio, 2020[19]; Portfolio, 2020[19])
Prior to the pandemic, hospital capacities were characterised by a high number of hospital beds with intensive care capacities slightly below the OECD average (Figure 1.5). The relatively low number of doctors and other skilled health care workers was only partially compensated for by the reallocation of healthcare workers to COVID-19 treatment (OECD, 2019[12]). The government took several measures to respond to the health crisis, including expanding testing and intensive care capacity (see below). It also raised the wages of nurses by about 20% and nearly doubled the base salaries of doctors as part of a three-year wage rise programme to reward and retain health professionals. In all, health spending was raised by about 2.4 percentage point of GDP in 2020. If necessary, the government should be ready to further raise remuneration levels to retain and attract health professionals, as recommended in the last Survey.

19
OECD ECONOMIC SURVEYS: HUNGARY 2021 © OECD 2021
Figure 1.5. High bed capacity was not matched by similar intensive care capacities
Note: In Panel B, the OECD aggregate is an unweighted average of other 22 available countries included in the figure. Data for GBR refer
to England.
Source: OECD Health Statistics database; OECD/European Union (2020), Health at a Glance: Europe 2020: State of Health in the EU
Cycle, OECD Publishing, Paris, https://doi.org/10.1787/82129230-en; and OECD (2020), "Beyond containment: Health systems responses
to COVID-19 in the OECD", OECD Policy Responses to Coronavirus (COVID-19), OECD Publishing, Paris,
https://doi.org/10.1787/6ab740c0-en.
StatLink 2 https://doi.org/10.1787/888934266742
The reallocation of health resources reduced the supply of outpatient and inpatient treatments, notably in the first wave (Figure 1.6, Panel A). This led to a substantial decline in surgical interventions and shorter waiting lists for elective surgeries, such as heart and prostate problems (OECD/European Union, 2020[20]) (Figure 1.6, Panel B). This suggests a reduced capacity to detect symptoms for many diseases, such as cardiovascular problems, potentially later leading to more treatments and higher mortality, putting additional strains on the health sector (OECD, 2021[21]). Looking ahead, capacity constrains in hospitals should be addressed by raising investment and enhancing the role of hospital managers through performance-related bonuses and in investment decisions, as recommended in the last Survey (Table 1.2) (OECD, 2019[12]).
The rollout of the vaccination programme began in early 2021 and was accelerated by administrating the Russian Sputnik V and the Chinese Sinopharm coronavirus vaccines despite absence of approval by the European Medical Agency, securing a relatively swift and broad-based vaccine roll-out (HCSO, 2021[22]). Looking ahead, better preparedness for future surges in healthcare needs and other non-standard events, like a mass vaccination, calls for a greater flexibility of healthcare system. This would require measures to reduce hospital stays by enhancing outpatient care as was discussed in the previous Survey (Table 1.2) (OECD, 2019[23]).
0
5
10
15
20
25
30
35
40
0
5
10
15
20
25
30
35
40
ME
X (
2017
)
NZ
L (2
019)
IRL
(201
6)
JPN
(20
19)
NLD
(20
18)
CH
L (2
017)
DN
K (
2014
)
NO
R (
2018
)
ITA
(20
20)
AU
S (
2019
)
ES
P (
2017
)
PO
L (2
019)
GB
R (
2020
)
KO
R (
2019
)
HU
N (
2018
)
CH
E (
2018
)
OE
CD
CA
N (
2014
)
FR
A (
2018
)
BE
L (2
019)
US
A (
2018
)
AU
T (
2018
)
DE
U (
2017
)
B. Intensive care capacity Number of intensive care beds, per 100 000 population, 2020 or latest available year
0
2
4
6
8
10
12
14
0
2
4
6
8
10
12
14
ME
X
CO
L
CH
L
SW
E
GB
R
CA
N
NZ
L
DN
K
ISL
TU
R
US
A
IRL
ES
P
ISR
ITA
NLD
PR
T
NO
R
FIN
AU
S
GR
C
LUX
SV
N
OE
CD
ES
T
CH
E
LVA
BE
L
SV
K
FR
A
LTU
PO
L
CZ
E
HU
N
AU
T
DE
U
KO
R
A. General hospital capacityTotal hospital beds, per 1 000 population, 2019 or latest available year
Total Occupied Unoccupied

20
OECD ECONOMIC SURVEYS: HUNGARY 2021 © OECD 2021
Figure 1.6. Capacity reallocation may increase mortality from other causes in the future
Source: National Health Insurance Fund (NEAK); and OECD calculations.
StatLink 2 https://doi.org/10.1787/888934266761
Table 1.2. The past recommendations on healthcare
Recommendations in previous survey Action taken
Reduce hospital stays by enhancing outpatient care and concentrate inpatient care in fewer, better-equipped and more specialised hospitals.
In 2020, a new health authority, the National Hospital Directorate-General, was established to create a new national health care management system.
Reorganisation of hospitals with focus on creating county integrated systems with country hospitals given greater autonomy in organising local care. Introduction of telehealth services to facilitate outpatient treatment.
Strengthen price signals in health care provision by regularly updating the DRG tariffs.
The update of DRG tariffs started in 2019. New tariffs were introduced in certain fields.
Phase out the use of output volume limits. Output volume limits were phased out. Case-based frameworks were introduced and will be reviewed annually.
Increase hospitals autonomy by enhancing the role of hospital managers through performance-related bonuses and greater autonomy in investment decisions.
County hospitals have been given greater autonomy for local care organisation.
Strengthen the gatekeeper role of GPs by increasing the share of pay-for-performance financing.
No action taken
Promote group practices for GPs. Program to set up group practices launched in 2020.
Group practice participation led to higher wage increases for doctors.
Increase taxes on alcohol and tobacco products. Taxes on alcoholic drinks increased by 20% in 2019. Excise duty on tobacco increased in several phases.
Continue to raise remuneration levels in order to retain and attract health professionals.
Remuneration of doctors increases in three steps by 2023. Salaries of nurses increased by 30 percent in 2022.
Update and clearly define the publicly funded health benefit package as part of an approach to limiting informal out-of-pocket payments.
According to a modification of law, informal payments are considered as bribe and are to be strictly punished.
Establish a voluntary health insurance market that can supplement the publicly funded health benefit package.
No action taken
Integrate the various long-term care systems. A LTC strategy has been prepared and submitted for approval.
Improve access to home and institution-based care. No action taken
Economic prospects are improving During the first wave of the pandemic in spring 2020, the economy contracted sharply under the impact of containment measures and slower international demand (Figure 1.7). During the second wave, growth picked up as new containment measures became more targeted, enabling more economic activity. This was helped by a recovery in world trade, particularly supporting the important automotive industry. On the other hand, the important tourism sector remained depressed in face of international travel restrictions (Figure 1.8).
-70
-60
-50
-40
-30
-20
-10
0
10
Jan Feb Mar Apr May Jun Jul Aug Sep Oct Nov Dec
A. Health care servicesY-o-y % changes, 2020
Outpatient treatment
In-patient treatment
-80
-60
-40
-20
0
20
40
Spine Hip Knee Cataract Prostate Heart Adenoid
B. Number of surgeries and people in waiting listBy illness type, y-o-y % changes, 2020
Surgeries Waiting list

21
OECD ECONOMIC SURVEYS: HUNGARY 2021 © OECD 2021
Figure 1.7. Economy activity contracted sharply in 2020
Source: OECD Economic Outlook: Statistics and Projections database; and OECD calculations.
StatLink 2 https://doi.org/10.1787/888934266780
Figure 1.8. Better-targeted measures in the second wave moderated the economic decline, with tourism as a notable exception
Source: Hungarian Central Statistical Office.
StatLink 2 https://doi.org/10.1787/888934266799
80
85
90
95
100
105
2018Q1 2018Q3 2019Q1 2019Q3 2020Q1 2020Q3 2021Q1
A. Real GDPIndex 2019Q4 = 100
Hungary
OECD
EU
-18
-12
-6
0
6
12
2018Q1 2018Q3 2019Q1 2019Q3 2020Q1 2020Q3 2021Q1
B. Contributions to GDP growthPercentage points
Net exportsStockbuildingInvestmentGovernment consumptionPrivate consumptionReal GDP (y-o-y % change)
-120
-100
-80
-60
-40
-20
0
20
40
-120
-100
-80
-60
-40
-20
0
20
40
Jan Feb Mar Apr May Jun Jul Aug Sep Oct Nov Dec
B .Number of tourist arrivalsY-o-y % changes, 2020
Total Domestic International
-60
-50
-40
-30
-20
-10
0
10
-60
-50
-40
-30
-20
-10
0
10
Accommodation& food
Health Transports Manufacturing Construction Agriculture Education Information &communication
Financial &ins. services
A. Real value added by sectorY-o-y % changes, 2020
Q2 Q4

22
OECD ECONOMIC SURVEYS: HUNGARY 2021 © OECD 2021
In 2020, private consumption contracted sharply as containment measures and uncertainty following the COVID-19 outbreak restrained household spending and increased the private savings rate. Private investments and exports fell markedly, despite a strong rebound in the second half of the year as faster international trade bolstered the export sector and generous government subsidies boosted construction activity. Public consumption increased as the government raised support to businesses, wage support and home-building subsidies. The number of bankruptcies fell by 50% year-on-year in 2020, suggesting that government support has also prevented the exit of unproductive businesses (Figure 1.9). The economy avoided a second dip at the end of 2020 and in early 2021, as restrictions affected mostly service sectors, while industrial production, construction and exports continued their recovery (Figure 1.10, Panel A). Business confidence continued to strengthen despite the onset of a third wave in spring 2021 (Figure 1.10, Panel B).
Figure 1.9. Government support averted bankruptcies
Note: The bankruptcy rate is defined as the number of bankruptcy proceedings of legal entities (aggregated as of the date of publication
and cumulated for 4 quarters, in Panel A) divided by the number of legal entities operating (a year before in Panel A and same year in Panel
B).
Source: Opten; Magyar Nemzeti Bank (Hungarian Central Bank); and Hungarian Central Statistical Office.
StatLink 2 https://doi.org/10.1787/888934266818
0
1
2
3
4
5
6
7
8
9
0
1
2
3
4
5
6
7
8
9
2002Q2 2003Q4 2005Q2 2006Q4 2008Q2 2009Q4 2011Q2 2012Q4 2014Q2 2015Q4 2017Q2 2018Q4 2020Q2
A. Quarterly bankruptcy rate by sector%
Agriculture Manufacturing Construction Real estate Other services Total
0.0
0.5
1.0
1.5
2.0
2.5
3.0
3.5
0.0
0.5
1.0
1.5
2.0
2.5
3.0
3.5
B. Annual bankruptcy rate by sector%
2019 2020

23
OECD ECONOMIC SURVEYS: HUNGARY 2021 © OECD 2021
Figure 1.10. Production and confidence continue to recover
Note: In Panel A, manufacturing and construction refer to production indices s.a., while exports of goods and services are expressed in real
terms. In Panel B, the headline PMI is a number from 0 to 100. A PMI above 50 represent an expansion when compared with the previous
month. A PMI reading under 50 represents a contraction, and a reading at 50 indicates no change.
Source: OECD Economic Outlook: Statistics and Projections database; OECD Main Economic Indicators database; GKI; and Refinitiv
Datastream.
StatLink 2 https://doi.org/10.1787/888934266837
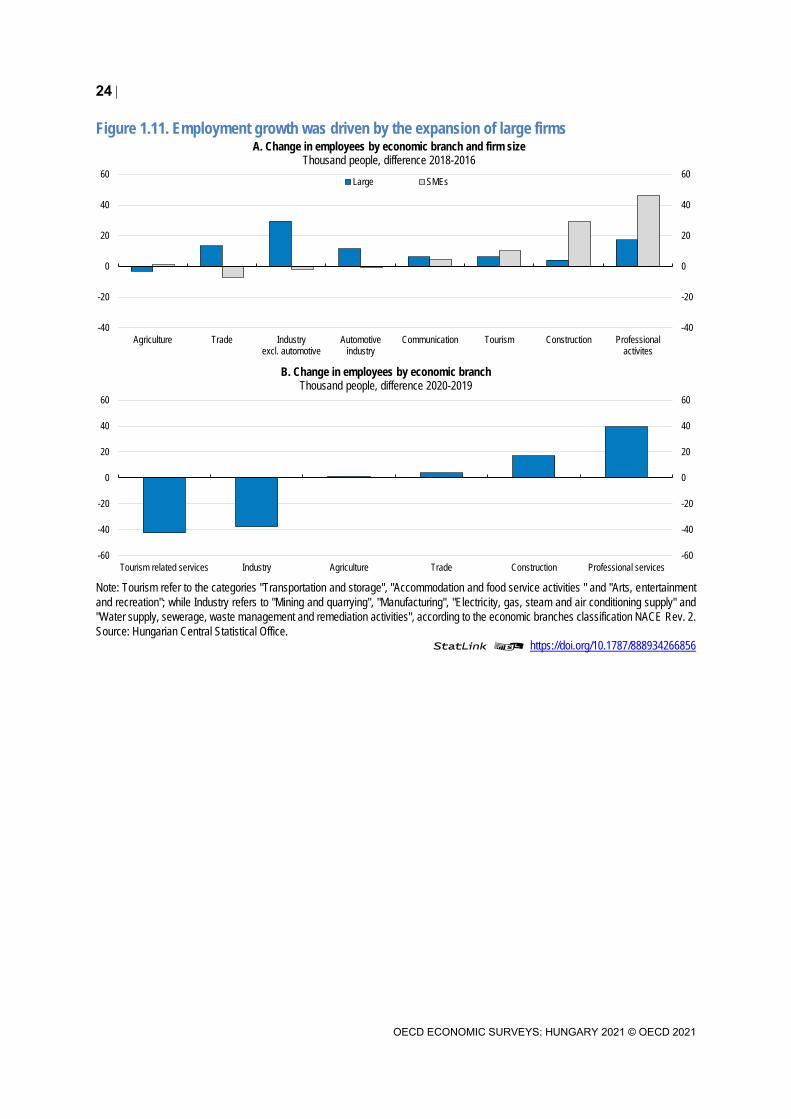
The strong 2016-2019 recovery led to strong employment growth across the economy, particularly in services, construction and traditional manufacturing sectors. Hiring was mostly in larger firms in export-oriented manufacturing and trade sectors between and 2016 and 2018, before SME hiring became more dynamic, particularly in the service sectors (Figure 1.11, Panel A). In addition, the number of self-employed rose sharply in 2019, which partly reflected tax advantages of self-employed. Despite important (temporary) employment losses in 2020, many sectors continue to be faced with important labour shortages. Moreover, employment growth continued in sectors that were less exposed to restrictions and/or where telework was more feasible, returning employment levels to pre-pandemic levels (Figure 1.11, Panel B). This helped to ensure that unemployment only increased temporarily in 2020 before falling back towards its historically low level (Figure 1.12, Panel B).
Wage distribution is being compressed as the strong wage dynamics is more pronounced in low-wage sectors, such as construction and accommodation services, and less so in the high-wage financial services and IT sectors (Figure 1.12, Panel C). In 2016-21, labour costs grew less rapidly as employers’ social security contributions have been reduced by a total of 11.5 percentage points. As the reductions were not accompanied by other revenue increasing measures or spending reductions, the public sector’s structural balance was eroded. In addition, growth in unit labour costs was more moderate as productivity was bolstered by an investment surge. Some of the increase in labour costs were transferred to consumers through higher prices. Nevertheless, not all types of firms fared well during the expansion. Notably, foreign-owned large companies in the industrial sector grew amidst increasing wage pressures, although employment gains in the service sector became more important as the upswing matured.
50
60
70
80
90
100
110
2018Q1 2018Q3 2019Q1 2019Q3 2020Q1 2020Q3 2021Q1
A. Production indices and exportsIndex 2019Q4 = 100
Manufacturing
Construction
Exports of goods and services
-75
-50
-25
0
25
50
75
2018Q1 2018Q3 2019Q1 2019Q3 2020Q1 2020Q3 2021Q1
B. Business and consumer confidenceBalance, s.a.
Consumer confidence index
Business confidence index - Services
Purchasing Managers' index - Manufacturing
24
OECD ECONOMIC SURVEYS: HUNGARY 2021 © OECD 2021
Figure 1.11. Employment growth was driven by the expansion of large firms
Note: Tourism refer to the categories "Transportation and storage", "Accommodation and food service activities " and "Arts, entertainment
and recreation"; while Industry refers to "Mining and quarrying", "Manufacturing", "Electricity, gas, steam and air conditioning supply" and
"Water supply, sewerage, waste management and remediation activities", according to the economic branches classification NACE Rev. 2.
Source: Hungarian Central Statistical Office.
StatLink 2 https://doi.org/10.1787/888934266856
-60
-40
-20
0
20
40
60
-60
-40
-20
0
20
40
60
Tourism related services Industry Agriculture Trade Construction Professional services
B. Change in employees by economic branch Thousand people, difference 2020-2019
-40
-20
0
20
40
60
-40
-20
0
20
40
60
Agriculture Trade Industryexcl. automotive
Automotiveindustry
Communication Tourism Construction Professionalactivites
A. Change in employees by economic branch and firm sizeThousand people, difference 2018-2016
Large SMEs

25
OECD ECONOMIC SURVEYS: HUNGARY 2021 © OECD 2021
Figure 1.12. The labour market weakened temporarily as the pandemic spread
Note: Data are seasonally adjusted. In Panel C, real average wages refers to the national-accounts-based total wage bill divided by the
number of hours worked in the total economy, deflated by a price deflator for private final consumption expenditures in 2019 prices.
Source: OECD Main Economic Indicators database; OECD Labour Statistics database; OECD National Accounts database; and OECD
calculations.
StatLink 2 https://doi.org/10.1787/888934266875
A major factor in minimising the rise in unemployment in 2020 was the introduction of a short-time working scheme for the duration of the first wave of the pandemic (Box 1.2). The OECD secretariat estimates that the 2020 unemployment rate could have been more than 4 percentage point higher without the scheme that provides a wage cost subsidy to employers that keep their workers employed during the pandemic. In the second wave, the scheme was replaced by a sectoral wage subsidy, focussing on the most affected sectors as in many other OECD countries.
-4
-3
-2
-1
0
1
2
3
4
5
2015-Q1 2016-Q1 2017-Q1 2018-Q1 2019-Q1 2020-Q1
A. Employment growthTotal employees, y-o-y % changes
HUN CZE POL SVK EU
0
2
4
6
8
10
12
14
2015-Q1 2016-Q1 2017-Q1 2018-Q1 2019-Q1 2020-Q1
B. Unemployment ratePopulation aged 15-74, % of labour force
0
10
20
30
40
50
60
70
80
2015-Q1 2016-Q1 2017-Q1 2018-Q1 2019-Q1 2020-Q1 2021-Q1
D. Labour shortages% of firms pointing to labour shortages as an obstacle
-4
0
4
8
12
16
2015-Q1 2016-Q1 2017-Q1 2018-Q1 2019-Q1 2020-Q1 2021-Q1
C. Wage growthReal average wages, y-o-y % changes
HUN CZE POL SVK EU

26
OECD ECONOMIC SURVEYS: HUNGARY 2021 © OECD 2021
Box 1.2. Hungary’s short-time work scheme
The short-time work scheme was introduced in early 2020 and subsidises 70% of net earnings (up to a maximum of 70% of two times the minimum wage) of furloughed workers for up to 3 months, conditional on a fall in work time of at least 15% (OECD, 2020[24]) (Figure 1.13). Employers continued to pay social security contributions for hours worked, while the government subsidised the remaining labour costs. At the end of 2020, the scheme was replaced by a new wage support scheme, which provides a subsidy of 50% of wage costs to enterprises in the most-affected sectors to strengthen incentives for using the subsidy only for viable jobs and to increase working hours. Over time, the subsidy has been prolonged and the list of covered sectors expanded. One characteristic of the scheme may have dampened employment transitions as employers had to commit to retain supported workers.
Figure 1.13. The short-time work scheme provided a relatively low replacement rate
Note: Replacement rates for Belgium, Netherlands, Spain, and the United Kingdom are shown in percent of gross earnings. In Hungary,
employers pay social security contributions of 15.5% since July 2020 (down from 17.5%). In France, only wages up to 450% of the minimum
wage were subsidised. In the United Kingdom, employers continued to pay pension and employers' social security contributions.
Source: OECD COVID-19 Country Policy Tracker https://www.oecd.org/economy/; and WIFO (2021) "Kurzarbeit als Kriseninstrument in der
COVID-19-Pandemie", Austrian Institute of Economic Research, Vienna, March.
StatLink 2 https://doi.org/10.1787/888934266894
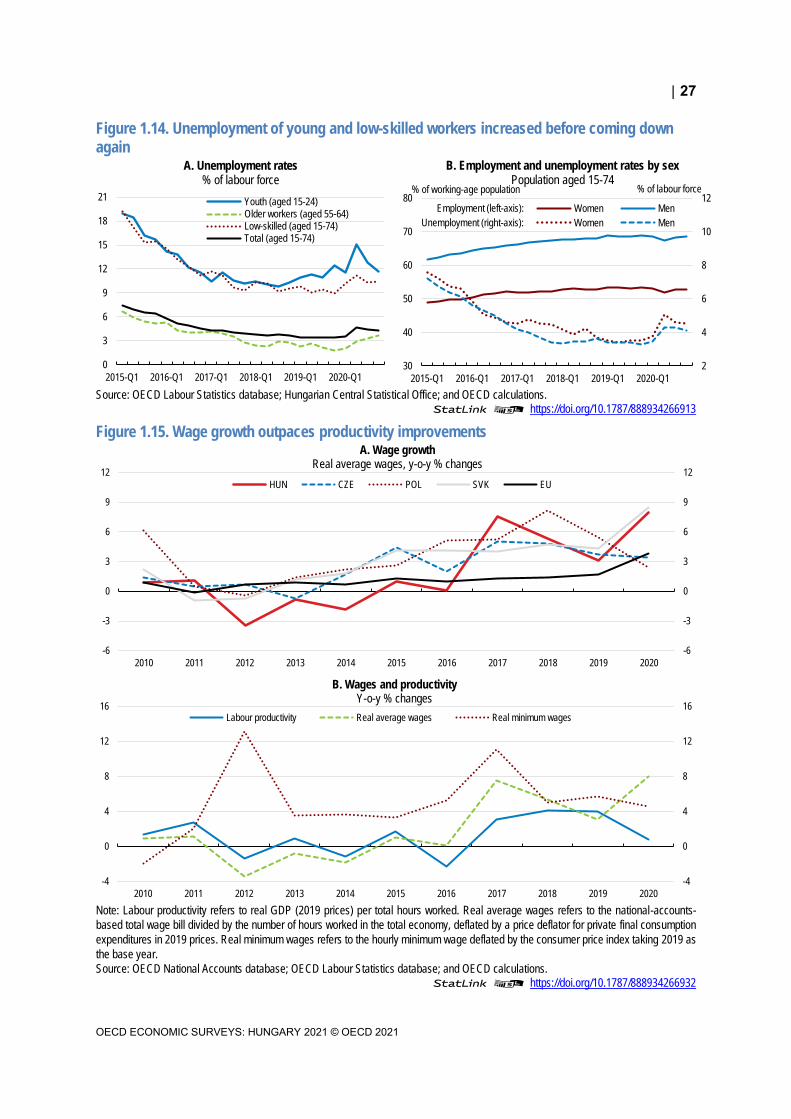
During the first wave, part-time work and flexible telework arrangements increased but only temporarily, so that flexible employment opportunities that could improve work-life balance remained limited (Hungarian Central Statistical Office, 2021[25]). Teleworking is less prevalent than elsewhere in the OECD due to the high share of manufacturing jobs, but also due to the weaker digital preparedness of companies and workers (Chapter 2). During the second wave, a growing problem was that nearly half of new job seekers did not receive financial assistance as their unemployment benefits expired or they were not eligible for social assistance (Hungarian National Employment Service, 2021[26]). Initially, there was a sharp increase in the unemployment rate of young and unskilled workers, before it came down again (Figure 1.14). Younger workers also had a higher job separation risk because they are twice as often on temporary work contracts than other workers (HÉTFA Research Institute, 2020[27]; OECD, 2021[28]).
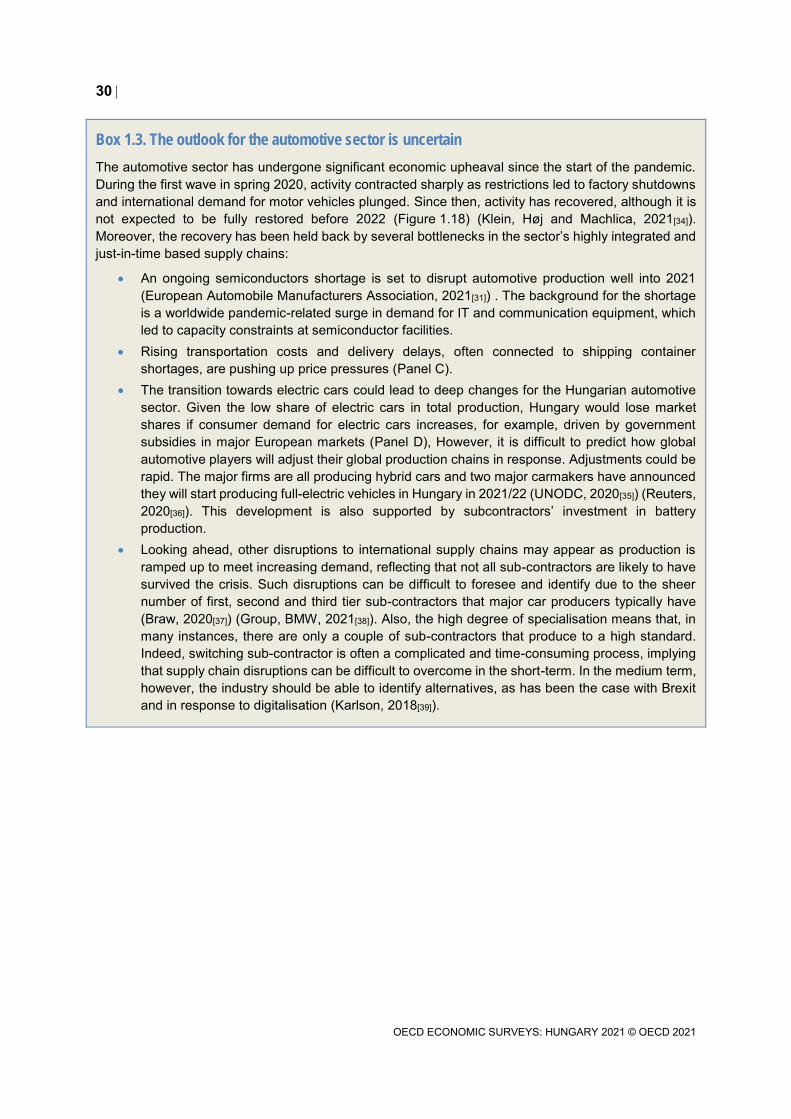
Wage agreements point to slower but still relatively high wage growth, estimated at around 6% in 2021, and continuing to be higher than in neighbouring countries (Figure 1.15, Panel A). Prior to the COVID-19 crisis, the tight labour market and high minimum wage increases fuelled real wage growth and income convergence. However, real wage growth has consistently outpaced labour productivity growth since 2015, reducing the sustainability of continued rapid wage increases (Figure 1.15, Panel B).
0
10
20
30
40
50
60
70
80
90
100
DEU BEL ESP HUN AUT GBR ITA FRA DNK NLD
A. Replacement rate% of net earnings for hours not worked
Spring 2020 Autumn 2020
0
10
20
30
40
50
60
70
80
90
100
NLD ESP DNK DEU GBR HUN ITA AUT BEL FRA
B. Government contribution to the costs of hours not worked% of gross earnings, assuming a 25% reduction in revenues
27
OECD ECONOMIC SURVEYS: HUNGARY 2021 © OECD 2021
Figure 1.14. Unemployment of young and low-skilled workers increased before coming down again
Source: OECD Labour Statistics database; Hungarian Central Statistical Office; and OECD calculations.
StatLink 2 https://doi.org/10.1787/888934266913
Figure 1.15. Wage growth outpaces productivity improvements
Note: Labour productivity refers to real GDP (2019 prices) per total hours worked. Real average wages refers to the national-accounts-
based total wage bill divided by the number of hours worked in the total economy, deflated by a price deflator for private final consumption
expenditures in 2019 prices. Real minimum wages refers to the hourly minimum wage deflated by the consumer price index taking 2019 as
the base year.
Source: OECD National Accounts database; OECD Labour Statistics database; and OECD calculations.
StatLink 2 https://doi.org/10.1787/888934266932
0
3
6
9
12
15
18
21
2015-Q1 2016-Q1 2017-Q1 2018-Q1 2019-Q1 2020-Q1
A. Unemployment rates% of labour force
Youth (aged 15-24)Older workers (aged 55-64)Low-skilled (aged 15-74)Total (aged 15-74)
2
4
6
8
10
12
30
40
50
60
70
80
2015-Q1 2016-Q1 2017-Q1 2018-Q1 2019-Q1 2020-Q1
B. Employment and unemployment rates by sexPopulation aged 15-74
Women Men
Women Men
% of working-age population % of labour force
Employment (left-axis):
Unemployment (right-axis):
-4
0
4
8
12
16
-4
0
4
8
12
16
2010 2011 2012 2013 2014 2015 2016 2017 2018 2019 2020
B. Wages and productivityY-o-y % changes
Labour productivity Real average wages Real minimum wages
-6
-3
0
3
6
9
12
-6
-3
0
3
6
9
12
2010 2011 2012 2013 2014 2015 2016 2017 2018 2019 2020
A. Wage growthReal average wages, y-o-y % changes
HUN CZE POL SVK EU

28
OECD ECONOMIC SURVEYS: HUNGARY 2021 © OECD 2021
The tripartite wage-agreement raised minimum wages (for unskilled and skilled workers) by 8% in 2020 and 4% in 2021. To avoid excessive labour cost increases, the government compensated employers by lowering their social security contribution rates again (Figure 1.16). Moreover, further cuts in social security contributions will be implemented if real wage growth in the private sector exceeds 6%. Such a development would also trigger an additional percentage point increase in the minimum wage. On the other hand, external competitiveness was aided by a 10% depreciation of the forint against the Euro since early 2020.
Headline inflation remains above the central bank’s target of 3%, and went outside the upper tolerance band of plus 1 per cent as it reached 5.3% in early summer 2021. The elevated inflation was underpinned by higher energy prices. Looking ahead, the effects of indirect tax increases will add 0.7 percentage point to inflation during 2021 and 0.2 percentage point in 2022 (MNB, 2021[29]). Core inflation reached 4.8% in early summer 2021. Surveys from early 2021 indicate rising household inflation expectations (European Commission, 2021[30]). The currency depreciation will add to price pressures in 2021 (Figure 1.17).
Figure 1.16. The labour tax wedge remains high despite lower social security contributions
For a single person with average earnings, as a percentage of gross wages, 2020
Note: The tax wedge is the sum of personal income tax and employee plus employer social security contributions together with any payroll
tax less cash transfers, expressed as a percentage of labour costs for a single person (without children) on average earnings.
Source: OECD Taxing wages database.
StatLink 2 https://doi.org/10.1787/888934266951
0
10
20
30
40
50
60
0
10
20
30
40
50
60
CH
L
NZ
L
ME
X
CH
E
ISR
KO
R
US
A
AU
S
CA
N
GB
R
ISL
IRL
JPN
OE
CD
PO
L
DN
K
NO
R
NL
D
ES
T
LT
U
LU
X
ES
P
TU
R
GR
C
FIN
SV
K
PR
T
LV
A
SW
E
SV
N
HU
N
CZ
E
ITA
FR
A
AU
T
DE
U
BE
L
A. Average tax wedge
0
5
10
15
20
25
30
35
40
0
5
10
15
20
25
30
35
40
CH
L
DN
K
NZ
L
LT
U
ISR
AU
S
ISL
CH
E
US
A
CA
N
KO
R
GB
R
IRL
ME
X
NL
D
NO
R
LU
X
JPN
SV
N
OE
CD
PO
L
TU
R
HU
N
FIN
DE
U
PR
T
LV
A
GR
C
BE
L
AU
T
ES
P
SV
K
SW
E
ITA
CZ
E
ES
T
FR
A
B. Average rate of employer's social security contributions

29
OECD ECONOMIC SURVEYS: HUNGARY 2021 © OECD 2021
Figure 1.17. Wage and inflation pressures remain high
Note: Core inflation excludes energy and food. The scale is inverted in the right axis for exchange rate, where higher values indicate that
the currency depreciates, while lower values that it appreciates.
Source: OECD Main Economic Indicators database; and IMF International Financial Statistics database.
StatLink 2 https://doi.org/10.1787/888934266970
Growth is accelerating
Growth prospects rely heavily on export demand, as the economy is strongly integrated in global value chains (OECD, 2019[23]). European countries account for the majority of exports, which are concentrated in transport equipment and machinery (Figure 1.19). Exports fell sharply in the first half of 2020 as international demand dropped abruptly and disruptions affected manufacturing supply chains (Box 1.3). Trade in the automotive sector declined as demand for passenger cars contracted by nearly a quarter in the European Union in 2020 (European Automobile Manufacturers Association, 2021[31]). The decline in exports was even more pronounced in tourism, which saw a decline in overnight stays of about 60% in 2020 (Hungarian Central Statistical Office, 2021[32]). At the same time, imports fell, reflecting weak domestic consumption and the high import content of exports. A negative current account balance emerged in the first half of 2020, but turned positive again as exports bounced back to pre-pandemic levels early 2021 on the back of stronger international demand (MNB, 2021[33]).
Economic activity is projected to recover in the second half of 2021, with the completion of vaccine programmes and the lifting of restrictions. Private consumption will be boosted by the release of pent-up demand, as uncertainty recedes and real income growth accelerates, before slowing to more sustainable pace in 2022. External demand will strengthen with the projected recovery in major European trading partners in 2021 and 2022. In the same period, investment will be fuelled by stronger inflows of foreign direct investment and EU recovery funds (see below). The labour market will recover and could reach pre-pandemic levels already in late 2021, despite the observed increase in long-term unemployment. Wage growth is projected to remain high, as labour market conditions tighten. In 2021, indirect tax increases and currency depreciation further add to inflation pressures.
290
300
310
320
330
340
350
360
370-2
-1
0
1
2
3
4
5
6
2015 2016 2017 2018 2019 2020 2021
Headline inflation (left-axis) Core inflation (left-axis) Exchange rate (right-axis)
Y-o-y % changes Forint per Euro (inverted scale)
30
OECD ECONOMIC SURVEYS: HUNGARY 2021 © OECD 2021
Box 1.3. The outlook for the automotive sector is uncertain
The automotive sector has undergone significant economic upheaval since the start of the pandemic. During the first wave in spring 2020, activity contracted sharply as restrictions led to factory shutdowns and international demand for motor vehicles plunged. Since then, activity has recovered, although it is not expected to be fully restored before 2022 (Figure 1.18) (Klein, Høj and Machlica, 2021[34]). Moreover, the recovery has been held back by several bottlenecks in the sector’s highly integrated and just-in-time based supply chains:
An ongoing semiconductors shortage is set to disrupt automotive production well into 2021 (European Automobile Manufacturers Association, 2021[31]) . The background for the shortage is a worldwide pandemic-related surge in demand for IT and communication equipment, which led to capacity constraints at semiconductor facilities.
Rising transportation costs and delivery delays, often connected to shipping container shortages, are pushing up price pressures (Panel C).
The transition towards electric cars could lead to deep changes for the Hungarian automotive sector. Given the low share of electric cars in total production, Hungary would lose market shares if consumer demand for electric cars increases, for example, driven by government subsidies in major European markets (Panel D), However, it is difficult to predict how global automotive players will adjust their global production chains in response. Adjustments could be rapid. The major firms are all producing hybrid cars and two major carmakers have announced they will start producing full-electric vehicles in Hungary in 2021/22 (UNODC, 2020[35]) (Reuters, 2020[36]). This development is also supported by subcontractors’ investment in battery production.
Looking ahead, other disruptions to international supply chains may appear as production is ramped up to meet increasing demand, reflecting that not all sub-contractors are likely to have survived the crisis. Such disruptions can be difficult to foresee and identify due to the sheer number of first, second and third tier sub-contractors that major car producers typically have (Braw, 2020[37]) (Group, BMW, 2021[38]). Also, the high degree of specialisation means that, in many instances, there are only a couple of sub-contractors that produce to a high standard. Indeed, switching sub-contractor is often a complicated and time-consuming process, implying that supply chain disruptions can be difficult to overcome in the short-term. In the medium term, however, the industry should be able to identify alternatives, as has been the case with Brexit and in response to digitalisation (Karlson, 2018[39]).
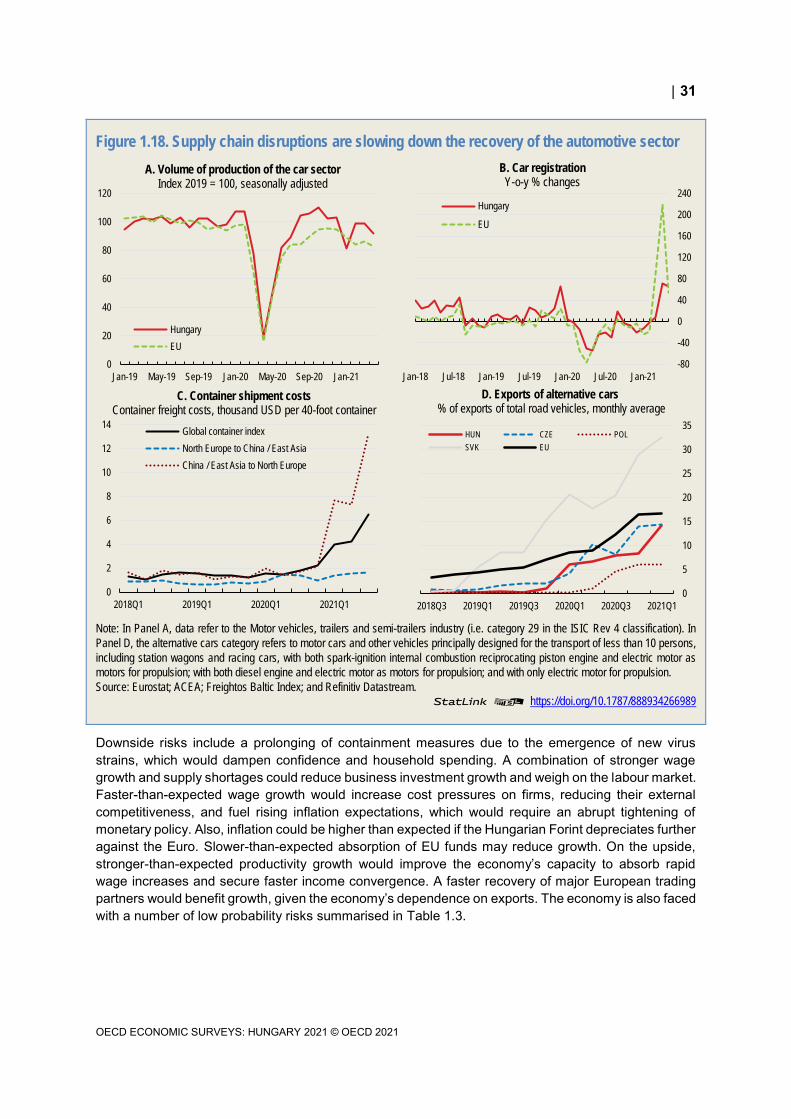
31
OECD ECONOMIC SURVEYS: HUNGARY 2021 © OECD 2021
Figure 1.18. Supply chain disruptions are slowing down the recovery of the automotive sector
Note: In Panel A, data refer to the Motor vehicles, trailers and semi-trailers industry (i.e. category 29 in the ISIC Rev 4 classification). In
Panel D, the alternative cars category refers to motor cars and other vehicles principally designed for the transport of less than 10 persons,
including station wagons and racing cars, with both spark-ignition internal combustion reciprocating piston engine and electric motor as
motors for propulsion; with both diesel engine and electric motor as motors for propulsion; and with only electric motor for propulsion.
Source: Eurostat; ACEA; Freightos Baltic Index; and Refinitiv Datastream.
StatLink 2 https://doi.org/10.1787/888934266989
Downside risks include a prolonging of containment measures due to the emergence of new virus strains, which would dampen confidence and household spending. A combination of stronger wage growth and supply shortages could reduce business investment growth and weigh on the labour market. Faster-than-expected wage growth would increase cost pressures on firms, reducing their external competitiveness, and fuel rising inflation expectations, which would require an abrupt tightening of monetary policy. Also, inflation could be higher than expected if the Hungarian Forint depreciates further against the Euro. Slower-than-expected absorption of EU funds may reduce growth. On the upside, stronger-than-expected productivity growth would improve the economy’s capacity to absorb rapid wage increases and secure faster income convergence. A faster recovery of major European trading partners would benefit growth, given the economy’s dependence on exports. The economy is also faced with a number of low probability risks summarised in Table 1.3.
0
20
40
60
80
100
120
Jan-19 May-19 Sep-19 Jan-20 May-20 Sep-20 Jan-21
Hungary
EU
A. Volume of production of the car sectorIndex 2019 = 100, seasonally adjusted
-80
-40
0
40
80
120
160
200
240
Jan-18 Jul-18 Jan-19 Jul-19 Jan-20 Jul-20 Jan-21
B. Car registrationY-o-y % changes
Hungary
EU
0
5
10
15
20
25
30
35
2018Q3 2019Q1 2019Q3 2020Q1 2020Q3 2021Q1
D. Exports of alternative cars% of exports of total road vehicles, monthly average
HUN CZE POL
SVK EU
0
2
4
6
8
10
12
14
2018Q1 2019Q1 2020Q1 2021Q1
Global container index
North Europe to China / East Asia
China / East Asia to North Europe
C. Container shipment costsContainer freight costs, thousand USD per 40-foot container

32
OECD ECONOMIC SURVEYS: HUNGARY 2021 © OECD 2021
Figure 1.19. Automotive products dominate exports
Exports of goods and services, % of total, 2019
Note: In Panel A, the CEEC (Central and Eastern Europe Countries) aggregate includes Czech Republic, Poland, Romania and Slovak
Republic. In Panel B, the category "Machinery and other transport equipment" includes "Other transport equipment" (i.e. "Railway vehicles
& associated equipment", "Aircraft & associated equipment; spacecraft, etc." and "Ships, boats & floating structures") and "Machinery" (i.e.
"Power generating machinery and equipment", "Specialised machinery", "Metal working machinery", "Other industrial machinery and parts",
"Office machines and automatic data processing machines", "Telecommunication and sound recording apparatus", and "Electrical
machinery, apparatus and appliances, n.e.s."), in line with the Standard International Trade Classification (SITC) Revision 3,
https://unctadstat.unctad.org/en/Classifications/DimSitcRev3Products_Official_Hierarchy.pdf.
Source: OECD International Trade by Commodity Statistics (ITCS) database; OECD International Balanced Trade Statistics database; and
OECD calculations.
StatLink 2 https://doi.org/10.1787/888934267008
Table 1.3. Events that could lead to major changes in the outlook
Financial amplification of
the COVID-19 crisis
A rise in bankruptcies could lead to a significant increase in non-performing loans, with adverse pressures on
banks and financial stability.
Turbulences in financial
markets
Abruptly rising interest-rate differentials with the US could lead to capital outflows and reduce banks’ willingness
to lend and dampen investment.
Intensification of global
trade tensions
Weak global trade and supply chain disruptions in the automotive sector would weigh on exports and increase
costs for businesses, leading to lower investment.
Monetary policy has become more supportive In 2020, the central bank eased its accommodative monetary policy stance further by reducing the base rate from 0.9% to 0.6%, while keeping the overnight deposit rate unchanged at -0.05% (Figure 1.20, Panel A). Furthermore, the central bank started its bond-purchasing programme to contain a sharp rise in long-term yields in spring 2020 as international investors reduced their demand for government bonds (MNB, 2020[40]) (Figure 1.20, Panel B). Nonetheless, long-term yields rose by 0.25 basis points to 2.8% between late 2019 and spring 2021 (Figure 1.20, Panel C). Moreover, the yield curve is steeper than in other countries in the region, which may reflect higher inflation expectations (MNB, 2021[29]). As part of its unconventional policy measures, the central bank raised the volume of zero interest rate re-financing loans to credit institutions by 240% under the Funding for Growth Scheme with the aim of encouraging lending to SMEs and prevent bankruptcies. In all, the central bank raised the amount of loan programmes to businesses and for corporate bond purchases, reaching 8 ½% of GDP by mid-2021. In June 2021, the central bank announced the phasing out the Funding for Growth Scheme Go! for SMEs once HUF 3 000 will be exhausted, although other unconventional measures such as the Bond Funding for Growth Scheme for large enterprises remain in place. The central bank should eventually exit these unconventional monetary measures to return to market-based credit allocation. To increase the
Germany, 26%
CEEC, 17%
Austria, 5%
Italy, 5%France, 4%
United Kingdom, 4%
Netherlands, 4%
United States, 4%
Rest of the World, 31%
A. By destinationRoad vehicles,
15%
Machinery and other transport
equipment, 33%
Chemicals and related products,
9%
Other manufactured goods, 8%
Food and live animals, 5%
Other goods, 12%
Services, 18%
B. By product and service

33
OECD ECONOMIC SURVEYS: HUNGARY 2021 © OECD 2021
efficiency of the banking system’s liquidity management, the central bank activated its one-week deposit tender facility with a favourable interest rate of 0.9% compared with -0.05% for overnight deposits. Following the introduction, there was a short-lived appreciation in summer 2020 before the depreciation resumed. In June 2021, the central bank announced a tightening cycle and raised its base rate by 30 basis points to 0.9% to prevent a de-anchoring of inflation expectations as inflation moved outside the central bank’s upper tolerance band of 3 + 1% in spring 2021.
Looking ahead, the central bank expects headline inflation to peak in the second quarter of 2021 under the impact of higher indirect taxes and rising fuel prices, and in line with rising household inflation expectations (MNB, 2021[29]) (European Commission, 2021[30]) (Figure 1.20, Panel D). In such circumstances, further depreciation of the forint against the euro risks keeping inflation above the central bank’s tolerance band. A concern is that a continued depreciation of the forint could trigger capital outflows that induce the central bank to abruptly tighten monetary policy, leading to higher market rates. Also, should inflation expectations be unhinged, a less accommodative stance may be required. (Table 1.4).
Figure 1.20. Monetary policy remains accommodative despite inflationary pressures
Note: In Panel B, other domestic assets include mortgage bonds, loans by credit institutions, and bonds issued by non-financial corporations.
Source: BIS; and Magyar Nemzeti Bank (Hungarian Central Bank).
StatLink 2 https://doi.org/10.1787/888934267027
Table 1.4. The past recommendations on monetary policy
Recommendations in previous survey Action taken
Gradually increase policy interest rates. MNB base rate decreased from 0.9 to 0.6 percent in 2020. In June
2021, the MNB base rate was raised by 0.3 pp to 0.9 percent.
Continue to exit from unconventional monetary policy measures. The MNB announced the phasing out of the Funding for Growth Scheme Go! while extending other unconventional tools under the
Funding for Growth programme.
0.0
0.5
1.0
1.5
2.0
2.5
A. The policy rate remained low%
HUN CZE POL
2015 2016 2017 2018 2019 20200
5
10
15
20
25
30
35
Jan-20 Apr-20 Jul-20 Oct-20 Jan-21 Apr-21
B. Central bank’s asset purchases increasedMontlhy average stocks, % of 2020 GDP
Government bonds issued by central governmentFunding for Growth SchemeExternal assetsOther domestic assets
-1
0
1
2
3
4
5
C. Long-term yields are on the rise10-year government benchmark yields, %
HUN CZE POL
2015 2016 2017 2018 2019 20200
1
2
3
4
5
6
7
D. Inflation expectations are risingY-o-y % changes
HUN CZE POL
2015 2016 2017 2018 2019 2020

34
OECD ECONOMIC SURVEYS: HUNGARY 2021 © OECD 2021
Financial risks require monitoring
Banks remain well capitalised with sufficient capital buffers to provide credit to the private sector (Figure 1.21, Panel A). At the end of 2020, the banking sector’s average capital adequacy ratio was 18.3%, well above national and international regulatory Pillar I requirements of 8% (Figure 1.21, Panel B). A concern, though, is that the banking sector’s profitability remained low, while the share of loss-making institutions more than quadrupled to 22% (and 11% in terms of total assets) (MNB, 2020[41]). On a positive note, the share of non-performing loans has continued to decline, preparing banks for the likely increase in loan losses when government support measures (see below) are phased out (Figure 1.21 , Panel D).
Prior to the crisis, regulations have made banks build up capital buffers. In early 2020, the central bank allowed banks to use these buffers to strengthen their ability to lend to the private sector (MNB, 2020[42]). In addition, funding opportunities for banks were expanded by the Central Bank’s long-term collateralised loans. In addition, the overnight and one-week rates were increased by 0.95 basis points to 1.85%. The more attractive rates boosted banks’ deposits in the central bank. Moreover, the central bank announced further funding of around 6% of GDP into the financial system via its “Funding for Growth” scheme. The scheme provides banks’ with funding at a subsidised zero percent interest rate on the condition that they lend to SMEs at a maximum lending rate of 2.5%. In response to central bank and government measures, the liquidity coverage ratio of the banking sector improved by 56 percentage points to 206% from the end of 2019 to end of 2020.
High operating costs hold down bank profitability (Figure 1.22, Panels A and B). Profitability may temporarily decline further under the impact of a new temporary bank levy of 0.19% on turnover in 2020. High operating costs may be related to low competition in the banking sector, as reflected in low credit penetration with the second lowest household credit-to-GDP ratio in the EU, many small credit institutions, a low level of digitalisation and continued high degree of state involvement. The state maintains a 30% stake in the second largest banking group in Hungary. In addition, government subsidised loans account for about one third of new bank lending, which reduce competition in the sector, as banks have to offer similar conditions as those for subsidised loans (Figure 1.22, Panel C). Subsidised loans expanded already in 2019 driven by the introduction of mortgage subsidies, and remained high during the crisis as the central banks’ business loan programmes were expanded. The government could spur competition in the sector through privatisation of its remaining stakes in the banking sector and a reduction of subsidised loans, as recommended in the last Survey (OECD, 2019[23]). A more competitive banking sector would also support the emergence of a more dynamic business sector (Chapter 2). A withdrawal of the bank levy would help improve banks’ profitability.
To help bridge the temporary payment difficulties of borrowers, the government introduced a loan repayment moratorium in early 2020. Non-performing loans are likely to increase once the loan repayment moratorium ends at the end of September 2021. Three out of four firms in hospitality sector were participating in the moratorium in early 2021 (MNB, 2020[41]). In 2020, banks had put aside provisions for loan losses of 0.7% of GDP. The central bank’s stress test of a severe economic downturn’s impact on the financial sector indicates that banks would need an additional 1.2% of GDP as loan loss provisions over a two-year horizon. This affects mostly smaller banks. However, the rise in non-performing loans could be even higher and affect bigger parts of the banking system as the central banks considers about 15% of credit institutions’ corporate loans as high-risk (MNB, 2020[41]).

35
OECD ECONOMIC SURVEYS: HUNGARY 2021 © OECD 2021
Figure 1.21. Bank lending is strong and the share of non-performing loans has fallen
Note: In Panel B, regulatory capital to risk-weighted assets ratio is calculated using total regulatory capital as the numerator and risk-
weighted assets as the denominator. It measures the capital adequacy of deposit takers. Capital adequacy and availability ultimately
determine the degree of robustness of financial institutions to withstand shocks to their balance sheets. In Panel C, the return on assets
(ROA) indicator provides information on the deposit takers' (DTs) profitability relative to total assets and can be an indicator of how efficiently
the DTs manage their assets to generate earnings. The return on equity (ROE) indicator is intended to measure DTs’ efficiency in using
capital. It also offers information on the ability of DTs to internally generate capital through retained earnings, and the attractiveness of the
sector to new equity investment.
Source: Magyar Nemzeti Bank (Hungarian Central Bank); and IMF, Financial Soundness Indicators (FSIs) database.
StatLink 2 https://doi.org/10.1787/888934267046
-10
-5
0
5
10
15
20
25
-6
-3
0
3
6
9
12
15
A. Growth rate of outstanding loans%
Corporate sector, q-o-q (left-axis)
Corporate sector, y-o-y (right-axis)
SME sector, y-o-y (right-axis)
2014 20162012 20182010 20202008
16
17
18
19
20
21
22
HUN POL SVK OECD CZE
B. Regulatory capital to risk-weighted assets%, Q4 2020 or latest available quarter
0.0
0.5
1.0
1.5
2.0
2.5R
etur
n on
ass
ets,
%HUN CZE POL
SVK OECD
C. Return on assets vs return on equity
2016 2017 2018 2019 2020
0
5
10
15
20
25
Ret
urn
on e
quity
, %
2016 2017 2018 2019 2020
0
5
10
15
20
25
0
5
10
15
20
25
D. Non-performing loan ratio%
Household sector Corporate sector
2015 2016 2017 2018 2019 2020
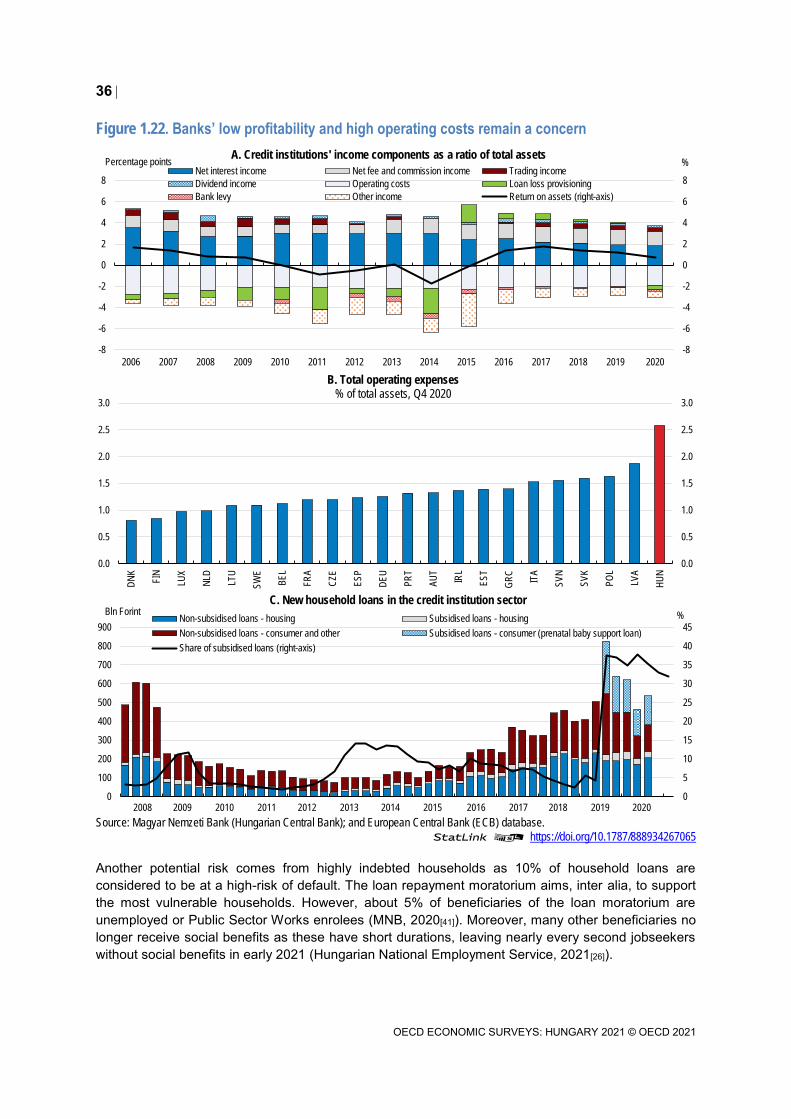
36
OECD ECONOMIC SURVEYS: HUNGARY 2021 © OECD 2021
Figure 1.22. Banks’ low profitability and high operating costs remain a concern
Source: Magyar Nemzeti Bank (Hungarian Central Bank); and European Central Bank (ECB) database.
StatLink 2 https://doi.org/10.1787/888934267065
Another potential risk comes from highly indebted households as 10% of household loans are considered to be at a high-risk of default. The loan repayment moratorium aims, inter alia, to support the most vulnerable households. However, about 5% of beneficiaries of the loan moratorium are unemployed or Public Sector Works enrolees (MNB, 2020[41]). Moreover, many other beneficiaries no longer receive social benefits as these have short durations, leaving nearly every second jobseekers without social benefits in early 2021 (Hungarian National Employment Service, 2021[26]).
-8
-6
-4
-2
0
2
4
6
8
-8
-6
-4
-2
0
2
4
6
8
2006 2007 2008 2009 2010 2011 2012 2013 2014 2015 2016 2017 2018 2019 2020
A. Credit institutions' income components as a ratio of total assets
Net interest income Net fee and commission income Trading income
Dividend income Operating costs Loan loss provisioning
Bank levy Other income Return on assets (right-axis)
Percentage points %
0.0
0.5
1.0
1.5
2.0
2.5
3.0
0.0
0.5
1.0
1.5
2.0
2.5
3.0
DN
K
FIN
LUX
NLD
LTU
SW
E
BE
L
FR
A
CZ
E
ES
P
DE
U
PR
T
AU
T
IRL
ES
T
GR
C
ITA
SV
N
SV
K
PO
L
LVA
HU
N
B. Total operating expenses% of total assets, Q4 2020
0
5
10
15
20
25
30
35
40
45
0
100
200
300
400
500
600
700
800
900
C. New household loans in the credit institution sector
Non-subsidised loans - housing Subsidised loans - housing
Non-subsidised loans - consumer and other Subsidised loans - consumer (prenatal baby support loan)
Share of subsidised loans (right-axis)
Bln Forint %
2014 20162012 20182010 20202008 2015 20172013 201920112009

37
OECD ECONOMIC SURVEYS: HUNGARY 2021 © OECD 2021
Once the loan moratoria are phased out at the end of September 2021, the number of non-performing loans is likely to increase, requiring close monitoring. In case of a sharp increase in the share of non-performing loans, the central bank should raise the capital surcharge on banks that keep their non-performing loans to encourage rapid resolution. In addition, measures to facilitate the disposal of non-performing loans could be taken, such as the development of a secondary market and a framework for selling impaired loans, as recommended in the last Survey (OECD, 2019[23]).
Embracing innovation in the financial sector
The high regulatory burden in the financial sector hinders market entry, including of new FinTech companies, as discussed in Chapter 2. Evidence shows that stronger competition in the financial sector can increase the sector’s profitability by reducing financial services costs (Financial Conduct Authority, 2019[43]). The central bank has stepped up its efforts to ease the introduction of new financial products by providing temporary regulatory waivers for financial institutions on a case-by-case basis (MNB, 2018[44]). However, the legal environment only makes these measures available for financial institutions with a licence for financial activities, such as banks. In contrast, young firms without such licence cannot benefit from easier market entry. Extending the central bank’s room for manoeuvre to be able to give waivers to non-licenced FinTech companies within the Regulatory Sandbox environment can promote competition in the financial sector (see Chapter 2). Furthermore, a closer alignment of FinTech regulations in the region can support the regional integration of FinTech markets. Estonia, Latvia and Lithuania, for instance, agreed to harmonise their regulations regarding new FinTech products and technologies to facilitate market entry of new financial players, as recommended in past Surveys (Table 1.5). New entry of products and market participants would support the emergence of a more dynamic financial sector.
Many new applications of FinTech remain unregulated, despite their potential risks for financial stability and concerns about consumer and investor protection. The central bank has stepped up its efforts in this regard and established a dedicated unit that monitors the international practise for promoting FinTech products and companies (MNB, 2019[45]). However, the central bank has no mandate to supervise new FinTech activities, including Initial Coin Offerings that raise capital via crypto-assets such as bitcoins. Such a measure would be an extension of the Central Bank’s supervision of FinTech activities that include crowd funding services as from November 2021. Extending the central bank’s mandate to supervise new FinTech activities would reduce regulatory gaps, particularly with respect to consumer and investor protection, as done in Australia and the United Kingdom. Moreover, a single supervisor would facilitate regular updates of the regulatory framework and the supervisory powers required in view of the rapid evolution of FinTech technologies.
Table 1.5. The past recommendations on easing competition in the financial sector
Recommendations in previous survey Action taken
Develop a strategy for the asset management company to
step-up offloading of nonperforming assets.
A repurchase programme for debtors reduced the real estate portfolio
of National Asset Management Agency.
Promote a regional stock exchange. No action taken
Adjust regulation to facilitate the introduction and adoption of
new financial technologies. Credit institutions have to submit a comprehensive digital
transformation strategy to the central bank by 31 October 2021.
Regulation of earnings from crypto assets will be introduced from
January 2022.

38
OECD ECONOMIC SURVEYS: HUNGARY 2021 © OECD 2021
Adopting a forward-looking and greener fiscal policy Fiscal policy will remain supportive over the near term
A comprehensive fiscal stimulus package supported economic activity in 2020 and early 2021 (Box 1.4). In 2020, the fiscal stance became more expansionary as COVID-related fiscal measures of about 5% of GDP were implemented. Adding the effects of the automatic stabilisers, the public deficit widened by 6 percentage points to 8.1% of GDP. Moreover, the downward trend in the public debt-to-GDP ratio was reversed (Hungarian Central Statistical Office, 2021[46]) (Table 1.6). The bulk of the fiscal expansion consisted of support to firms, including grants, equity injections and subsidies through the Economic Protection Fund (8½% of GDP), while discretionary spending on health (2½ % of GDP) and various wage support programmes (0.3% of GDP) were less sizeable. On the revenue side, a cut in employers’ social security contributions from 17.5 to 15.5% and tax deferrals reduced government revenues by nearly ½% of GDP.
Table 1.6. Fiscal indicators Per cent of GDP
2018 2019 2020 20211 20221
Spending and revenue
Total revenue 43.8 43.6 43.5 44.6 45.0
Total expenditure 45.9 45.7 51.6 52.1 50.9
Net interest payments 2.3 2.2 2.3 2.3 2.3
Budget balance
Fiscal balance -2.1 -2.1 -8.1 -7.5 -5.9
Cyclically adjusted fiscal balance2 -2.5 -3.1 -4.7 -5.2 -4.8
Underlying primary fiscal balance2 -0.2 -0.9 -2.6 -4.3 -4.1
Public debt
Gross debt (Maastricht definition) 69.1 65.5 80.4 81.9 81.9
Gross debt (national accounts definition)3 86.6 83.5 97.6 99.4 99.4
Net debt 55.8 53.9 61.0 62.8 63.5
1. OECD estimates unless otherwise stated.
2. As a percentage of potential GDP.
3. National Accounts definition includes state guarantees, among other items.
Source: OECD Economic Outlook 109 database (June 2021)..
The 2021 budget introduced new stimulus measures (Hungarian Government, 2020[47]; Hungarian Government, 2021[48]). Revenues will be reduced due to a temporary cut in the VAT rate for new dwellings, while the public wage bill will be boosted by wage increases for health personnel. Most of the 2020 crisis-related fiscal measures were temporary. A noticeable exemption was the two percentage points reduction in employers’ social security contributions that permanently reduces the revenue-to-GDP ratio by nearly ½%. The continued lowering of labour taxes is welcome from a growth perspective and helps firms to preserve their competitiveness through the reduction in their labour costs. The continued reductions in social security contributions also increase the structural deficit, which eventually will have to be financed through lower spending or higher taxation. Some of the reductions have been financed through more efficient collection of VAT revenues as shown in the more than halving of VAT gap since 2013 (European Commission, 2020[49]). Looking ahead, the lowering of social security contributions could be part of a growth enhancing and revenue neutral tax reform if compensated by higher taxation of consumption, negative environmental externalities, and real estates (see below). A relatively straight forward increase in consumption taxes to cover the revenue shortfall from the lower labour taxation would be to move towards a broader-based and lower standard VAT rate (OECD, 2019[23]).

39
OECD ECONOMIC SURVEYS: HUNGARY 2021 © OECD 2021
Box 1.4. The fiscal response to the COVID-19 pandemics
In 2020 and early 2021, the government put in place a fiscal stimulus package to support the economy during the pandemic. Additional measures were introduced to bolster health capacity.
Most fiscal spending went to state support for ailing companies: grants, equity injections and subsidies of about 5.1% of GDP provided liquidity support to firms. Enterprises could apply for up to EUR 800 thousand per company. The state-owned Magyar Fejlesztési Bank provided subsidised public loans to companies at a favourable interest rate of 0.1% backed by a 90% government loan guarantee. In addition, the government allocated 2.1% of GDP to keep state-owned enterprises afloat.
To lower labour costs and incentivise hiring, the government enacted a 2-percentage point cut to employers’ social contributions from 17.5% to 15.5%, starting in mid-2020 (0.3% of GDP). A fourth of the tax cut is financed by a new levy on the retail sector.
To protect jobs, a temporary short-time work scheme subsidised 70% of wage costs of furloughed workers for up to 3 months, conditional on a fall in employment of at least 15% (0.3% of GDP). During the second COVID-19 wave at the end of 2020 and in early 2021, wage support was introduced, covering 50% of wage costs of enterprises in the most affected sectors.
To boost the construction sector, starting in 2021, the government temporarily exempted home purchases for families that qualify for the Family Housing Subsidy from the asset acquisition tax and temporarily reintroduced the lowest VAT rate of 5% for new dwellings (0.6% of GDP).
Additional public investment of 1½% of GDP was allocated to infrastructure needs in 2020. In 2021 and 2022, additional public investment of 3.8% of GDP will be financed by the inflow of EU funds.
Further measures include tax deferrals and the suspension of social security contributions for sectors particularly hard-hit by the pandemic such as hospitality, as well as the extension of existing state guarantee schemes for business loans operated by the central bank: The Funding for Growth scheme Go! (FGS Go!) and the Funding for Growth Scheme Fix (FGS Fix) for SMEs, and the Bond Funding for Growth Scheme (BGS) for large corporations.
Health measures of nearly 2½ % of GDP in 2020 included the procurement of protective equipment, financial support to step up testing facilities and critical care capacity in hospitals, and a lump sum payment for health workers. Furthermore, the government spent 0.6% of GDP for wage increases for nurses and doctors in order to stem the outflow of health professionals from the public health sector.
Source: (Hungarian Government, 2020[47]; Hungarian Government, 2021[48])
The economic recovery will also be supported by additional EU subsidies from the Next Generation EU Funds and the Recovery and Resilience Fund. These will boost the total EU funds that Hungary will receive to 3 ½ % of GDP annually between 2021 and 2026. The subsidies will mainly go to areas that this Survey identifies as important for future growth, such as education, green investment, digitalisation and transport infrastructures (Box 1.5)

40
OECD ECONOMIC SURVEYS: HUNGARY 2021 © OECD 2021
Box 1.5. The recovery is boosted by EU new funds
Hungary is a main beneficiary of EU funds. Over the 2021-2027, Hungary will receive standard structural funds of EUR 34.4 billion (a quarter of GDP in 2020) of which nearly two-thirds are from the cohesion policy funds, encompassing the European Regional Development Fund, the European Social Fund and the Cohesion Fund, and the rest is related to the Common Agricultural Policy (European Commission, 2020[50]).
The EU’s NextGenerationEU temporary recovery instrument aims at repairing the pandemic’s economic and social damages as well as facilitating the green and digital transformation (Figure 1.23). The centrepiece of the NextGenerationEU is the Recovery and Resilience Facility (RRF), which will make available EUR 18.1 billion between 2021 and 2026, of which EUR 7.2 billion are grants and EUR 9.6 billion loans, although the government has renounced the use of the loan facility. In addition, Hungary will receive EUR 0.9 billion from the NextGenerationEU’s REACT EU program. In total, Hungary will receive EU funds to the tune of 3 ½ % of GDP every year until 2027, providing a substantial boost to the economy.
The government’s draft plan allocates one third of RRF grants to health to improve primary care, expand prevention and chronic disease management, digitalise the administration of health procedures, and finance the recent wage increases for doctors. A quarter of RRF funds will be used to develop railway systems to double the number of passengers and reduce CO2 emission, notably through electrification and a shift toward urban public transport. Education will receive a fifth of the funds to improve education quality, support the digital transition of public education, advance R&D capacity of universities, and, to a lesser extent, vocational education and adult training to develop skills and competencies that are necessary in the labour market.
The remaining RRF funds will be used for the green transformation of the economy. In particularly, energy investments will pursue the EU's 2030 emission reduction objectives. Another important environmental area is waste and water management in the industrial sector, and water management programmes in agriculture to reduce the impact of global warming on production.
Smaller funds are allocated to regional development programmes in the most disadvantaged municipalities to improve social housing conditions.
Figure 1.23. EU funds support many activities
Note: Preliminary information.
Source: Government of Hungary.
StatLink 2 https://doi.org/10.1787/888934267084
Health35%
Transport infrastructure
25%
Education20%
Renewable energy11%
Waste and water
treatment6%
Local development3%
A. European Recovery and Resilience Facility Fund allocation by purpose (EUR 7.2 bn)
Economic development
25%
Infrastructure19%
Regional development
18%
Environment and energy
17%
Digitalisation10%
Human resources
7%
Technical execution
4%
Agriculture0.2%
B. European Cohesion FundFund allocation by purpose (EUR 22.5 bn)

41
OECD ECONOMIC SURVEYS: HUNGARY 2021 © OECD 2021
The expected strong recovery starting in the second half of 2021 means that the economy is unlikely to require additional temporary fiscal support in 2021 and 2022. Growth in 2022 is sufficiently strong to allow a narrowing of public deficit to 6% of GDP. Nonetheless, the recovery may remain fragile, as the extend of the pandemic’s economic scarring is unknown, and the government should abstain from implementing fiscal measures to further reduce the deficit until the recovery becomes self-sustained (Hungarian Government, 2020[47]; Hungarian Government, 2021[48]). Some sectors such as tourism may struggle if international demand does not bounce back sufficiently or if national and international supply chains need to be restored. Expansive fiscal policy in such circumstances is unlikely to gain traction. Instead, the government should rely on structural policies to ease entry conditions and other regulations, while supporting efficient reallocation of labour and capital, as recommended in the last Survey (OECD, 2019[23]). Looking ahead, the need for strong fiscal policy intervention during crises could be reduced by strengthening the relatively small automatic stabilisers, for example, by extending the internationally short duration of unemployment benefits (see below) (Maravalle and Rawdanowicz, 2020[51]) (Table 1.7)
Table 1.7. The past recommendations on fiscal policy
Recommendations in previous survey Action taken
Tighten fiscal policy to avoid overheating of the economy. No action taken
Continue to lower the tax wedge while increasing the reliance on
consumption taxes.
Social security contributions decreased further from 19.5 in 2019 to 15.5 in July 2020. The government has announced an additional
reduction by 0.5 percentage point reduction in July 2022.
Move towards a single VAT rate. Particularly, phase out the reduced
rates for tourism services.
VAT on new dwellings was temporarily reduced to 5% from 2016-
2019 and again in 2021-2022.
Steps to address long-term fiscal challenges will be needed
The government aims at securing a downward trend in the public debt-to-GDP ratio towards the maximum target of 50% as stipulated in the constitution. Over the past decade, vulnerabilities related to public debt diminished. Public debt as a share of GDP was reduced by 15 percentage points to 65% by 2019 (Maastricht definition). Also, the share of debt held by foreigners nearly halved to 34% and the share of foreign currency loans was reduced from about half to 20% by 2020. Over the medium- to long-term, it is also important to reduce public debt to create fiscal space to respond to increasing ageing-related fiscal pressures, including rising health and pension expenditures.
According to OECD estimates, the current fiscal stance will lead to rapid increases in the public debt-to-GDP ratio if ageing-related spending increases are not contained (Figure 1.24, Baseline scenario). Ageing-related costs are expected to reach 12.4% of GDP by 2070, driven by strong increases in pension and care expenditures (European Commission, 2021[52]). Public debt could be even higher in case long-term growth is 1 percentage point lower than expected, for example if structural reforms fail to raise productivity growth (Figure 1.24, Risk scenario). Once the recovery has become self-sustained, a fiscal consolidation effort that includes containment of ageing-related spending increases and which requires an improvement in the structural budget deficit of 2.3% of GDP by 2024, and thereafter a structural surplus of 0.2% of GDP, could achieve the government’s debt objective (Figure 1.24, Consolidation scenario). Such a large fiscal challenge requires measures to control expenditure growth and raise revenues, including structural reform to expand the labour force and improve productivity growth.
Higher pension outlays will account for more than half of all ageing-related spending increases by 2060 (European Commission, 2021[52]). The current pension system leads to relatively low effective retirement ages despite recent increases, large variations in benefits between workers with similar careers but retiring at different time, and a high risk of old-age poverty. In order to increase labour participation of older workers and better align contributions with benefits, the last Survey recommended linking retirement age to gains in life expectancy, removing exemptions, and promoting flexible

42
OECD ECONOMIC SURVEYS: HUNGARY 2021 © OECD 2021
retirement schemes for those beyond retirement age as well as the introduction of a basic state pension (OECD, 2019[23]). So far, however, no substantial measures have been taken (Table 1.8). To contain ageing related spending pressures, the government should complete the ongoing increase of the statutory retirement age to 65 by 2022 and thereafter link it to gains in life expectancy.
Figure 1.24. Spending pressures related to population ageing need to be addressed
General government debt, Maastricht definition, as a percentage of GDP
Note: The baseline scenario assumes that increased spending on health and pensions will add an additional 5.3 percentage point of GDP
to annual government spending by 2070, in line with European Commission (2021). The consolidation scenario assumes a primary surplus
of 0.2% of GDP from 2024, complying with medium-term objective from the government's Convergence Programme, which is subject to
change. The risk scenario assumes that real GDP growth is 1 percentage point lower than currently projected for the entire simulation
period, for example if structural reforms fail to raise productivity growth.
Source: Adapted from OECD (2021), OECD Economic Outlook: Statistics and Projections (database), June; Guillemette, Y. and D. Turner
(2018), "The Long View: Scenarios for the World Economy to 2060", OECD Economic Policy Paper No. 22., OECD Publishing, Paris; and
European Commission (2021), "The 2021 Ageing Report - Economic and Budgetary Projections for the 28 EU Member States (2019-2070)"
Directorate-General for Economic and Financial Affairs.
StatLink 2 https://doi.org/10.1787/888934267103
Table 1.8. The past recommendations on the pension system
Recommendations in previous survey Action taken
Complete the ongoing increase of the statutory retirement age to 65 by
2022. Thereafter link it to gains in life expectancy.
No action taken
Introduce a basic state pension to guarantee a minimum income for all
pensioners.
No action taken
Impose a single flat accruals rate of around 2%. No action taken
Implement flexible retirement, with a symmetrical system of actuarially
neutral pension increments and decrements of around 6% a year. No action taken
Provide incentives for participation in third pillar voluntary pension
funds. No action taken
Introduce a basic state pension to guarantee a minimum income for all
pensioners. No action taken
The recommended reforms in this Survey would substantially strengthen economic growth. The reforms would in most cases expand the tax base, creating fiscal space over the medium-term (Box 1.6). The space could be used to further strengthen growth, for example through productivity-enhancing investments in infrastructure, or to counter the fiscal challenges associated with population ageing.
0
50
100
150
200
250
300
350
400
0
50
100
150
200
250
300
350
400
2000 2005 2010 2015 2020 2025 2030 2035 2040 2045 2050 2055 2060 2065 2070
Baseline Consolidation scenario Risk scenario

43
OECD ECONOMIC SURVEYS: HUNGARY 2021 © OECD 2021
Box 1.6. The impact of selected policy recommendations
Table 1.9 presents estimates of the fiscal impact of selected recommended reforms based on the OECD Economics Department Long-term Model. The results are merely indicative and do not allow for behavioural responses. Table 1.10 quantifies the impact on growth of the main reforms recommended in this Survey.
Table 1.9. Illustrative fiscal impact of recommended reforms
Fiscal savings (+) and costs (-) after 10 years
% of GDP
Reduce labour taxes to the OECD average -2.5
Withdraw distortionary sector taxes in energy, finance and retail sectors -0.6
Reduce state-ownership in network sectors to the average of the 5 best performing OECD countries 0.6
Increase competition in service sectors to the average of the 5 best performing OECD countries 1.1
Reduce the time and costs associated with insolvencies to the OECD average 0.5
Ensure that minimum wage growth does not outpace median wage growth to align employment rates of young and
low-skilled workers in Eastern regions with the average of Central and Western regions 0.4
Align property taxation with the OECD average 0.9
Reduce VAT exemptions to have a broader-based and lower standard VAT rate 0.7
Increase labour mobility and align employment rates of low-skilled workers in Eastern regions with the average of
Central and Western regions
0.7
Total revenues 1.8
Withdraw mortgage subsidies 0.6
Exit from subsidised loan programmes 0.4
Total expenditures 1.0
Source: Simulations based on the OECD Economics Department Long-term Model.
Table 1.10. Illustrative impact on GDP per capita from structural reforms
Difference in GDP per capita level from the baseline 10 years after the reforms, %
%
Competition reforms
Reduce state-ownership in network sectors to the average of the 5 best performing OECD countries 1.2
Increase competition in service sectors to the average of the 5 best performing OECD countries 2.1
Reduce the time and costs associated with insolvencies to the OECD average 0.9
Labour market reforms
Ensure that minimum wage growth does not outpace median wage growth to align employment rates of young
and low-skilled workers in Eastern regions with the average of Central and Western regions 0.7
Reduce labour taxes to the OECD average while increasing less distortive taxes 1.4
Increase labour mobility and align employment rates of low-skilled workers in Eastern regions with the average of
Central and Western regions 1.3
Total impact on GDP per capita 7.6
Source: Simulations based on the OECD Economics Department Long-term Model.
Promoting more environmentally sustainable growth
The government has broadly reached its environmental objectives, such as the 2020 targets for CO2 emissions reduction and the share of renewable energy in total energy supply (Figure 1.25, Panels A and B). Looking ahead, policies must also be adjusted to reach the EU’s new and more ambitious target of a 55% reduction in GHG emissions by 2030. The next National Environmental Programme for 2020-2026 that will determine policies to achieve the 2030 GHG emission reduction objective is still in preparation. Moreover, more progress is needed in some areas, such as in reducing the population’s extensive exposure to small particles emission (Figure 1.25, Panels C). Indeed, air pollution is estimated to account for 9000 premature deaths per year and, through increased risk of comorbidities,

44
OECD ECONOMIC SURVEYS: HUNGARY 2021 © OECD 2021
many of the COVID-19 related fatalities (Pozzer, 2020[17]) (OECD, 2019[23]). Another area of concern is the continued high reliance on landfills in waste management (Figure 1.25, Panels D).
Environmental objectives are to a large degree pursued through regulatory measures, such as standards and subsidies. Taxation also plays an important role. Indeed, the share of environmental taxes is larger than the OECD average. Most of these taxes are related to taxation of energy and vehicles (Figure 1.25, Panel E). Nonetheless, there is scope for further greening the tax mix by taxing polluting activities in line with their environmental damages, i.e. setting tax rates according to the polluter pays principle to promote more sustainable economic growth. The associated revenue increases could be used to lower the relatively high taxation of labour, offsetting negative labour effects.
Figure 1.25. Green growth indicators have mostly improved
Source: OECD Environment database; and OECD Green Growth database.
StatLink 2 https://doi.org/10.1787/888934267122
0.0
0.1
0.2
0.3
0.4
1990 2005 2019
A. CO2 intensity
CO2 per GDP - production based (kg/USD, 2015 PPP prices)
OECD
Hungary
0
3
6
9
12
15
18
1990 2005 2019
B. Energy intensity
Total primary energy supply per GDP (ktoe/100 USD 2015 PPP)
OECD
Hungary
0
2
4
6
8
10
12
14
1990 2005 2019
% of renewables in total primary energy supply
OECD
Hungary
0
5
10
15
20
25
2000 2014 2019
C. Population exposure to air pollution
Mean population exposure to PM2.5 (µg/m³)
OECD
Hungary
0
20
40
60
80
100
Hungary OECD
>25
15<25
10<15
0<10
% of population exposed to PM2.5, 2019 (µg/m³)
0
20
40
60
80
100
Hungary OECD
D. Municipal waste generation and recycling
Other
RecyclingandComposting
Landfill
Incineration
Municipal waste 2019 (% of treated)
350
400
450
500
550
600
2000 2010 2019
Municipal waste generated (kg/person)
OECD
Hungary
0
1
2
3
4
Hungary OECD
E. Environment-related taxes
Other
Motor vehicles
Energy
Total in 2000
Environment-related tax revenue,2019 (% of GDP)
0.0
0.1
0.2
0.3
0.4
0.5
0.6
0.7
0.8
Hungary TUR USA
Unleaded petrolDiesel
Tax rate of unleaded petrol and diesel, 2020-Q3 (USD/litre)
0
2
4
6
8
10
12
Hungary OECD
% of all technologies, 2018
0
5
10
15
20
25
Hungary OECD
F. Environment-related technologies
2018
1990
Inventions per capita, 2018 (patents/million persons)
Agriculture and mining
Manufacturing
Electricity andother utilities
Construction
Trade
Transportation
Services
0
20
40
60
80
100
Hungary
% of tonnes of CO2-equivalent emissions, 2019

45
OECD ECONOMIC SURVEYS: HUNGARY 2021 © OECD 2021
Better aligned environmental policies would be more effective
Energy taxation varies across energy types. As in other countries, tax rates are higher on transport fuels than on fuels for other purposes, but generally rates are relatively low. Non-transport fuel tax rates are mostly close to the EU minimum rates and are not systematically adjusted for inflation. Furthermore, effective rates are lowered by subsidies and exemptions, which includes a reduced VAT rate for district heating (almost entirely produced with fossil fuels); an up to 82% refund (and 83.5% if the international oil price is below 50 USD/barrel) on excise tax for diesel used in agriculture; a lower tax rate on diesel for commercial hauliers; and a subsidy to public heating suppliers. In addition, the regulated prices for electricity, gas and heating are lower than the associated cost of production (OECD, 2018[53]). The subsidies improve affordability but lack targeting. In addition to dis-incentivising improvements to the thermic efficiency of houses, they act as an entry barrier into the highly concentrated energy market and reduce investment incentives (IEA, 2017[54]). From an environmental perspective, the impact of different tax rates and associated subsidies and exemptions are relatively low effective tax rates on CO2 and higher abatement costs (Figure 1.26).
Figure 1.26. Carbon pricing score Carbon pricing score at EUR 60 per tonne CO2, including emissions from the combustion of biomass, %, 2018
Note: The OECD aggregate is an unweighted average.
Source: OECD Tax and Climate database.
StatLink 2 https://doi.org/10.1787/888934267141
The most efficient tax measure to reduce CO2 emissions would be a uniform carbon tax on all sectors outside the EU’s ETS (Box 1.7). Carbon content is already taxed in non-uniform ways, including many exemptions and subsidies, imposing uneven and expensive reduction burdens on sectors and activities. Introducing a unified carbon tax without major economic disruptions requires the simultaneous introduction of a low rate across all activities and sectors and thereafter gradually increase the rate as other taxes and exemptions are gradually removed. Non-carbon taxes can be used to combat other polluting activities such as waste landfill, water pollution and abstraction, to mention a few (OECD, 2018[53]).
Emissions from transportation have increased along with economic activity. This trend is likely to continue. The low number of cars per capita is set to increase with higher incomes. Also, with current policies, labour mobility will continue to be enabled through transport rather than through the rigid housing market (OECD, 2018[53]). Moreover, the average age of the expanding car fleet is increasing, reflecting that most car purchases consist of imported used cars (Figure 1.27, Panel A) (OECD, 2019[55]). Older cars are typically more polluting because of their higher fuel consumption per kilometre and small particles emissions. This is exacerbated by the increasing share of cars with diesel engines (Figure 1.27, Panel B). Moreover, road transportation is encouraged by low transportation fuel taxation
0
10
20
30
40
50
60
70
80
0
10
20
30
40
50
60
70
80
CH
L
AU
S
US
A
TU
R
JPN
CO
L
ES
T
SW
E
LVA
CZ
E
ME
X
NZ
L
FIN
BE
L
CA
N
HU
N
PO
L
ISR
SV
K
OE
CD
DE
U
PR
T
LTU
DN
K
ES
P
GR
C
GB
R
AU
T
KO
R
NLD IT
A
IRL
FR
A
ISL
SV
N
NO
R
LUX
CH
E

46
OECD ECONOMIC SURVEYS: HUNGARY 2021 © OECD 2021
(Figure 1.27, Panel C). In 2016, the government linked excise taxes on transport fuels to world market prices for crude oil, allowing the rates to increase temporarily when oil prices fall below a threshold of USD 50$/barrel, but this provision has rarely been triggered. The government should instead raise the internationally low transport fuel taxes, and taxation of diesel fuel should be higher than taxation of gasoline to reflect diesel’s higher carbon contents
Box 1.7. The EU Emissions Trading Scheme and Market Stability Reserve
The EU Emissions Trading Scheme has operated since 2005, covering CO2, N2O and PFC emissions from electricity generation, industry and intra-EEA flights in 23 European countries, amounting to about 40% of total EU emissions. Large emitters are required to hold permits equal to the quantity of their emissions. About a third of Hungarian greenhouse gas emissions are covered in the ETS, compared with 40% on average in the EU. Until recently, an over-supply of emission allowances, free allocation and low carbon prices led to a limited effect on low-carbon investments in Hungary.
The Market Stability Reserve from 2019 withdraws permits from the market if thresholds for the number of permits in circulation are exceeded and, from 2023 onwards, can trigger cancellation of permits. This aims to stabilise permit prices and reduce the “waterbed” effect, where additional abatement in one country allows an increase in emissions elsewhere. Together with the more ambitious emission reduction target of at least 55% by 2030, this has contributed to a fifty percent increase in ETS prices since autumn 2020. In spring 2021, the ETS price reached more than EUR 40/tonnes, approaching the average CO2 tax in Hungary.
(OECD, 2018[56]); (Flues and van Dender, 2020[57]); (European Environment Agency, 2019[58]) (OECD, 2018[53]).
Figure 1.27. An aging car fleet is increasingly based on diesel
Source: Eurostat; ACEA; and European Environment Agency.
StatLink 2 https://doi.org/10.1787/888934267160
0
20
40
60
80
100
1998 2000 2002 2004 2006 2008 2010 2012 2014 2016 2018
A. Car fleet by ageAs % of total fleet
Less than 2 years 2 to 5 years 5 to 10 years Over 10 years
0
20
40
60
80
100
2012 2013 2014 2015 2016 2017 2018 2019
B. Car fleet by motor energy typeAs % of total fleet
Petrol Diesel Alternative energy
0
100
200
300
400
500
600
700
800
0
100
200
300
400
500
600
700
800
POL HUN SWE ESP LTU LUX LVA AUT CZE SVK EST SVN IRL BEL DNK DEU GBR PRT FRA GRC FIN ITA NLD
C. Road fuel excise dutiesEuros per 1000 litres of road fuel
Petrol Diesel

47
OECD ECONOMIC SURVEYS: HUNGARY 2021 © OECD 2021
Some measures have been taken to curb emissions from transportation, including tax exemptions for electric vehicles (EV). Electric city buses are mandatory and subsidised to cover the 40% higher price vis-à-vis conventional buses. Subsidies are also provided for investment in charging stations for buses. The overall costs of installing electric city buses could be higher as more electric buses are required to cover the same range as conventional buses. Heavy-duty vehicles with lower emissions benefit from a discount on the vehicle tax. Company car taxes take into account emission categories. This could be extended with the purpose of achieving a less polluting car fleet by linking ad valorem vehicle taxes to cars’ environmental performance. Such a measure would also increase incentives for purchasing electric vehicles, which account for less than 0.5% of all passenger vehicles. More electric vehicles would also increase incentives to expand and upgrade the relatively small network of charging stations (IEA, 2020[59]).
Taxing company car benefits in line with the taxation of wage incomes would discourage tax arbitration and reduce driving incentives. Hungary is one of the few OECD countries that do not tax the personal use of company cars, leading to a favourable tax treatment vis-à-vis wage income. In consequence, nearly a quarter of all registered, and more than half of all new, cars are company cars. The associated tax expenditures amount to about half of all vehicle-related taxes. The favourable tax treatment encourages private car use and commuting, leading to higher emissions of GHGs and small particles. Additional problems include noise pollution, more congestion and accidents.
The negative environmental effects of low transportation fuel taxation are not offset by a general distance-based toll system. An electronic toll system is in place for motorways and main roads. On these, heavy vehicles pay toll based on distance and on the vehicle’s emissions standards (www.toll-charge.hu). On the other hand, other vehicles are subject to a time-based toll with vignettes valid for a week, a month or a year (13 months). However, time-based toll systems are weakly linked to distance travelled and emissions. Introducing distance-based tolls for smaller vehicles that are also linked to the vehicles environmental performance would better align transportation needs with the full cost of road transportation.
Transportation is also a major source of small particles emissions. Inner-city emissions of small particles could be reduced by supplementing a distance-based road toll system with traffic congestion charges in urban centres. This could be combined with time-based fees for parking places. Further measures to reduce inner-city pollution include strengthening public transportation with a focus on improving efficiency and effectiveness, such as by having uniform ticket systems and better interconnections between various modes of public transportation (OECD, 2019[23]). In addition, soft transport modes, such as cycling and walking, could be encouraged by developing the associated infrastructures (OECD, 2015[60])
Heating is another important emitter of small particles and GHGs. This reflects that nearly 80% of the housing stock is not meeting modern energy and thermal requirements, with particularly low efficiency in the large share of the housing stock that was constructed between WWII and 1991. As most heating systems are obsolete, many households continue to use coal and wood for heating and cooking purposes. An additional problem is that an estimated one third of household waste is illegally used for such purposes (OECD, 2018[53]).
In line with the EU’s Energy Performance of Buildings Directive that targets a highly-energy efficient and decarbonised building stock by 2050, a number of subsidy programmes are in place to improve the energy and thermal efficiency of the housing stock. These include support for replacing doors and windows, improving thermal insulation, while increasing the reliance on renewable energy sources and district heating. The efficiency of such subsidies is reduced by the regulation of prices on energy for heating purposes. Lowering heating prices boost demand for heating, which counters the subsidy schemes’ focus on reducing heating demand through efficiency improvements.
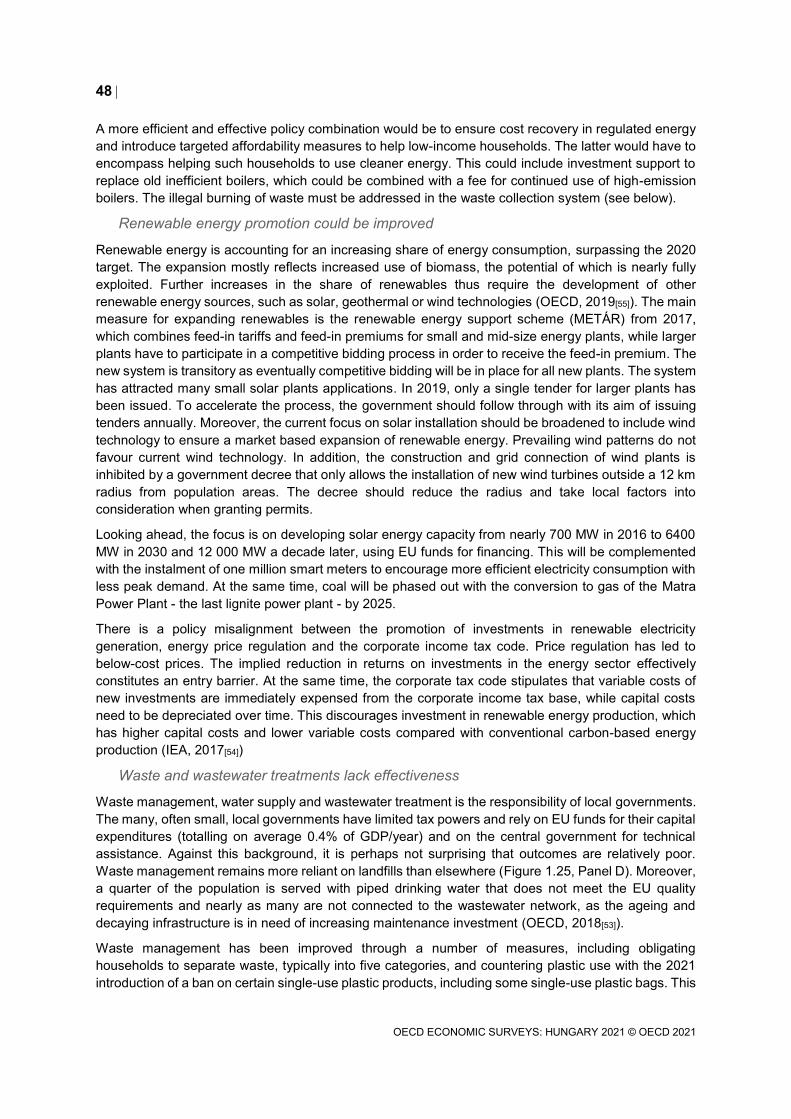
48
OECD ECONOMIC SURVEYS: HUNGARY 2021 © OECD 2021
A more efficient and effective policy combination would be to ensure cost recovery in regulated energy and introduce targeted affordability measures to help low-income households. The latter would have to encompass helping such households to use cleaner energy. This could include investment support to replace old inefficient boilers, which could be combined with a fee for continued use of high-emission boilers. The illegal burning of waste must be addressed in the waste collection system (see below).
Renewable energy promotion could be improved
Renewable energy is accounting for an increasing share of energy consumption, surpassing the 2020 target. The expansion mostly reflects increased use of biomass, the potential of which is nearly fully exploited. Further increases in the share of renewables thus require the development of other renewable energy sources, such as solar, geothermal or wind technologies (OECD, 2019[55]). The main measure for expanding renewables is the renewable energy support scheme (METÁR) from 2017, which combines feed-in tariffs and feed-in premiums for small and mid-size energy plants, while larger plants have to participate in a competitive bidding process in order to receive the feed-in premium. The new system is transitory as eventually competitive bidding will be in place for all new plants. The system has attracted many small solar plants applications. In 2019, only a single tender for larger plants has been issued. To accelerate the process, the government should follow through with its aim of issuing tenders annually. Moreover, the current focus on solar installation should be broadened to include wind technology to ensure a market based expansion of renewable energy. Prevailing wind patterns do not favour current wind technology. In addition, the construction and grid connection of wind plants is inhibited by a government decree that only allows the installation of new wind turbines outside a 12 km radius from population areas. The decree should reduce the radius and take local factors into consideration when granting permits.
Looking ahead, the focus is on developing solar energy capacity from nearly 700 MW in 2016 to 6400 MW in 2030 and 12 000 MW a decade later, using EU funds for financing. This will be complemented with the instalment of one million smart meters to encourage more efficient electricity consumption with less peak demand. At the same time, coal will be phased out with the conversion to gas of the Matra Power Plant - the last lignite power plant - by 2025.
There is a policy misalignment between the promotion of investments in renewable electricity generation, energy price regulation and the corporate income tax code. Price regulation has led to below-cost prices. The implied reduction in returns on investments in the energy sector effectively constitutes an entry barrier. At the same time, the corporate tax code stipulates that variable costs of new investments are immediately expensed from the corporate income tax base, while capital costs need to be depreciated over time. This discourages investment in renewable energy production, which has higher capital costs and lower variable costs compared with conventional carbon-based energy production (IEA, 2017[54])
Waste and wastewater treatments lack effectiveness
Waste management, water supply and wastewater treatment is the responsibility of local governments. The many, often small, local governments have limited tax powers and rely on EU funds for their capital expenditures (totalling on average 0.4% of GDP/year) and on the central government for technical assistance. Against this background, it is perhaps not surprising that outcomes are relatively poor. Waste management remains more reliant on landfills than elsewhere (Figure 1.25, Panel D). Moreover, a quarter of the population is served with piped drinking water that does not meet the EU quality requirements and nearly as many are not connected to the wastewater network, as the ageing and decaying infrastructure is in need of increasing maintenance investment (OECD, 2018[53]).
Waste management has been improved through a number of measures, including obligating households to separate waste, typically into five categories, and countering plastic use with the 2021 introduction of a ban on certain single-use plastic products, including some single-use plastic bags. This

49
OECD ECONOMIC SURVEYS: HUNGARY 2021 © OECD 2021
complements the system with product fees for other single-use plastic items. However, the key problems in waste management are fragmentation, inefficient control and monitoring, together with low frequency of waste collection and sorting efficiency (OECD, 2018[53]). Looking ahead, the government wants to use financial resources from the EU’s Recovery and Resilience Facility to promote the circular economy, particularly in the area of waste management. Indeed, improving waste management requires substantial investment in expanding planning and management capacity of large complex projects at the local level. As already raised in the last Survey, a degree of co-financing would also improve project selection to secure the most efficient use of available financial resources (OECD, 2019[55]).
Reaping the full benefit of such investment requires better use of price signals. In 2013, a low landfill tax of EUR 10 per tonnes of non-hazardous waste was introduced. Despite planned regular increases, the landfill tax remains relatively low, effectively frozen at the 2014 levels (Figure 1.28). As a minimum, landfill taxes should be raised to cost-based levels, but preferably further to include environmental damages. Waste collection fees should be set in a similar manner (OECD, 2019[55]). Likewise, the tariffs for water and wastewater services are relatively low and cover only 90% of operating costs (Figure 1.29). Such fees should be raised to cover both current and future costs and provide adequate financial resources to maintain and expand water-related networks.
Figure 1.28. Landfill taxes are low
Landfill tax, Euro per tonne, situation as of 19th March 2020
Note: Data for BEL refer to Flanders; data for FRA refer to the average rates for waste in ‘authorized’ landfills with 75% energy recovery
from captured biogas, in ‘authorized’ bioreactor landfill cells with biogas recovery and other ‘authorized’ landfills; data for ITA refer to the
maximum tax allowed from national legislation (rates vary from region to region); data for SVK refer to the average of the different progressive
rates; data for ESP refer to the average of the different regional rates; data for CHE refer to the average of rates for inert waste, stabilized
waste, bottom ash, construction waste and underground landfill in a foreign country. Detailed information is available at the following link:
https://www.cewep.eu/wp-content/uploads/2017/12/Landfill-taxes-and-bans-overview.pdf.
Source: Confederation of European Waste-to-Energy Plants (CEWEP).
StatLink 2 https://doi.org/10.1787/888934267179
0
20
40
60
80
100
120
0
20
40
60
80
100
120
LTU
LUX
GR
C
PR
T
SV
N
CH
E
ES
P
HU
N
CZ
E
SV
K
ITA
ES
T
NLD
FR
A
PO
L
LVA
SW
E
FIN IRL
DN
K
AU
T
BE
L

50
OECD ECONOMIC SURVEYS: HUNGARY 2021 © OECD 2021
Figure 1.29. Tariffs for water and wastewater services are low
Tariff for water and wastewater services, USD per m³, 2017 or latest available year
Note: Data for GBR1 refer to Scotland, while data for GBR2 refer to England and Wales.
Source: OECD (2018), OECD Environmental Performance Reviews: Hungary 2018, OECD Environmental Performance Reviews, OECD
Publishing, Paris, https://doi.org/10.1787/9789264298613-en.
StatLink 2 https://doi.org/10.1787/888934267198
More generally, a wide range of levies is applied on pollution and resource use. Beside the landfill tax, and water and wastewater tariff, there are also levies and fees on emissions of NOx, and on a number of products, such as batteries, packaging, electric appliances and electronic equipment, tires, etc. to reduce consumption and create a financial source for recycling. These levies have had a limited impact, as rates tend to be low, not systematically adjusted, and the associated income not connected to collection and treatment. In addition, effectiveness is further reduced by exemptions and rebates (OECD, 2018[53]). The landfill tax, water and wastewater tariffs and emission levies should be adjusted according to the polluter pays principle to improve resource utilisation and reduce pollution in line with past recommendations (Table 1.11). In addition, the planned 2023 deposit refund systems for bottles and cans could be extended to other material use.
Table 1.11. The past recommendations on greening growth
Recommendations in previous survey Action taken
Increase the reliance on road tolls and car taxes that take vehicles’
environmental performance into account.
Road tolls were updated in 2019 in accordance with the polluter pays
principle.
Use fiscal incentives for replacing households’ inefficient heating
system. Smart heating cost sharing systems were introduced in 2019.
Introduce congestion charges and strengthen public transport. Elaboration of an integrated e-ticket system. Timetable adjustments
and vehicle purchases aim to increase quality of public transport.
Better financial disclosure of environmental risks would promote sustainable investments
The financial sector is in general unaware of the extent of its exposure to climate-related risk with only 6% of banks (on a voluntary basis) following European guidelines on the reporting of climate-related information, although other banks report by other standards (MNB, 2021[61]) (Euractiv, 2021[62]). Such risks include potential financial asset losses arising from the implementation of measures to reach zero carbon emissions by 2050. Indeed, sectors with high carbon emissions (such as energy, manufacturing and agriculture) account for nearly a third of all corporate loans (MNB, 2020[41]). Information on environmental risks is necessary to ensure that investors understand their exposure to enable financial markets to adequately price the asset costs of climate change.
0.0
0.5
1.0
1.5
2.0
2.5
3.0
3.5
4.0
0.0
0.5
1.0
1.5
2.0
2.5
3.0
3.5
4.0
ME
X
KO
R
TU
R
GR
C
LVA
CH
L
SV
N
PO
L
SV
K
JPN
ITA
ISR
HU
N
NZ
L
PR
T
ES
T
ES
P
CZ
E
FIN
US
A
CA
N
SW
E
NO
R
GB
R2
ISL
CH
E
FR
A
NLD
GB
R1
AU
T
AU
S
DE
U
BE
L
DN
K
LUX
Water Wastewater

51
OECD ECONOMIC SURVEYS: HUNGARY 2021 © OECD 2021
In 2020, the central bank launched the preferential regulatory capital programme to support investment in the green transition. Under this programme, the central bank reduced regulatory capital requirements for banks by the amount of their environmental and sustainable investment. The preferential regulatory capital programme initially covers only investment in green bonds and renewable energy, which banks can easily calculate using EU Taxonomies, excluding other environmental and sustainable investments. Furthermore, a Green Mortgage Purchase Program will be introduced to support demand for green covered bonds issued by banks. Green bonds currently account for 5.6% of total non-financial corporate bonds, slightly higher than the 5% share in the European Union (MNB, 2021[61]). However, this programme does not address the lack of criteria for disclosing climate-related information to obtain green bond status. Thus, to strengthen the allocative function of the financial market, regulation is needed to improve the financial disclosure of climate-change related risks. More generally, the financial disclosure of environmental costs in line with European guidelines should be mandatory for listed companies, banks, insurance companies, and other companies designated by the central bank as public-interest entities (European Commission, 2019[63]). This could be combined with giving the central bank the regulatory power to verify climate-related risks in companies’ financial statements as in the United Kingdom.
Stronger domestic business dynamism is crucial for higher productivity growth Productivity growth was relatively weak in the last decade. Only between 2017 and 2019 did it take off on the back of the cyclical upswing in investment (Figure 1.30, Panels A and B). Despite a recent decrease in the productivity gap, there is still a large difference in productivity levels between larger capital-rich foreign-owned firms that compete on world markets and smaller domestically owned capital-poor and low-productivity firms that are focussed on home markets. While not all domestic firms are small and have low productivity, only few domestic firms innovate and most are poorly integrated into national and regional supply chains. This is reflected in low domestic value added in final foreign demand (Figure 1.30, Panels C and D).
Low business dynamism reflects new entry that has struggled until recently to catch up to levels seen elsewhere in the region, and a marked slowing of business exit rates and bankruptcies (Figure 1.31). This points to weak competition, which has helped low-productivity firms to maintain disproportionally large market shares, which has slowed the reallocation of resources to more productive enterprises (Muraközy, Bisztray and Reizer, 2019[64]) (Bauer et al., 2020[65]). Importantly, higher business dynamism would bolster economy-wide productivity growth and thus faster income convergence.

52
OECD ECONOMIC SURVEYS: HUNGARY 2021 © OECD 2021
Figure 1.30. Strong investment drove productivity growth before the crisis
Source: OECD Productivity database; OECD Economic Outlook: Statistics and Projections database; OECD Trade by Enterprise
Characteristics (ISIC rev4) database; OECD Trade in Value Added (TiVA) database; and OECD Structural Analysis (STAN) databases.
StatLink 2 https://doi.org/10.1787/888934267217
Figure 1.31. Business dynamics are low
Note: Data refer to the business economy except activities of holding companies. The entry rate refers to the birth rate defined as the number
of enterprise births in the reference period (t) divided by the number of enterprises active in t. The exit rate refers to the death rate defined
as the number of enterprise deaths in the reference period (t) divided by the number of enterprises active in t. The CEEC (Central and
Eastern Europe Countries) aggregate includes Czech Republic, Poland and Slovak Republic.
Source: Eurostat Business demography by size class database; and Magyar Nemzeti Bank (Hungarian Central Bank).
StatLink 2 https://doi.org/10.1787/888934267236
-4
-2
0
2
4
6
8
2010 2012 2014 2016 2018 2020
A. ProductivityReal GDP per hour worked, y-o-y % changes
HUN CZE POL
SVK EU
-15
-10
-5
0
5
10
15
20
25
2010 2012 2014 2016 2018 2020
B. Non-residential investment Real non-residential fixed capital formation,
y-o-y % changes
0
5
10
15
20
25
30
35
40
45
SVK CZE HUN POL AUT
C. Contribution of SMEs to total exports
% of export value, 2018
0
25
50
75
100
125
150
175
200
0
25
50
75
100
125
150
175
200
LVA
PO
L
TUR
HU
N
LTU
CH
L
ME
X
CZE
ES
T
PR
T
SV
K
GR
C
SV
N
ES
P
KO
R
NZL
JPN
ITA
OE
CD
DE
U
ISR
GB
R
NLD
FRA
AU
T
FIN
ISL
CA
N
BE
L
DN
K
AU
S
SW
E
US
A
LUX
CH
E
IRL
NO
R
D. Domestic value added embodied in foreign final demand per workerThousand USD, 2015
7
8
9
10
11
12
13
14
15
2008 2010 2012 2014 2016 2018
A. Business entry rate%
Hungary CEEC
7
8
9
10
11
12
13
14
15
2008 2010 2012 2014 2016 2018
B. Business exit rate%
53
OECD ECONOMIC SURVEYS: HUNGARY 2021 © OECD 2021
Business dynamics is held back by the weak enforcement of the existing pro-competitive regulatory framework, even in sectors with high risk of collusion, including public procurement. A stronger competition authority should have the financial resources for adequate enforcement, to carry out market studies, as well as the ability to retain highly qualified staff (OECD, 2019[66]; OECD, 2020[67]). In the same vain, business dynamism is reduced by slow and costly insolvency procedures with long discharge periods that hinder the re-entry of entrepreneurs and the orderly reallocation of resources to other activities and more productive firms, particularly a concern in the current economic situation (Figure 1.32) (Adalet McGowan, Andrews and Millot, 2017[68]). Quicker and more efficient procedures would help to accelerate market exits of failed firms and bolster the position of new entrants. Other barriers to business dynamisms include state-intervention in the form of price control and ownership in the energy and telecommunication sector, as well as turnover-based sectoral taxes that hinder entry and expansion of productive businesses (Table 1.12) (Chapter 2).
Figure 1.32. The insolvency regime is stringent
Scores in selected aspects of insolvency schemes, 2016
Source: Andrews, D., M. Adalet McGowan and V. Millot (2017), "Confronting the zombies: Policies for productivity revival", OECD Economic
Policy Papers, No. 21.
StatLink 2 https://doi.org/10.1787/888934267255
An abundance of licensing and certification requirements has led to the one of the highest number of regulated professions in the European Union, hampering occupational mobility and boosting wages for workers in these professions (Figure 1.33) (European Commission, 2020[69]) (Koumenta and Pagliero, 2018[70]). Since 2015, the government has reduced occupational entry regulation for selected sectors, mainly in craft and technical professions. Reducing licensing and certification requirements in other sectors, and particularly those heavily affected by the pandemics (tourism and entertainment) would bolster new entry and support employment transitions. A more efficient allocation of labour from low to high productivity firms would bolster overall productivity growth (Bambalaite, Nicoletti and von Rueden, 2020[71]).
0.0
0.5
1.0
1.5
2.0
2.5
3.0
0.0
0.5
1.0
1.5
2.0
2.5
3.0
GB
R
FR
A
JPN
US
A
CH
E
DN
K
CH
L
DE
U
ES
P
FIN
IRL
ISR
SV
N
NZ
L
PR
T
AU
T
GR
C
SV
K
ITA
KO
R
ME
X
AU
S
LV
A
PO
L
TU
R
NO
R
SW
E
CA
N
LT
U
BE
L
CZ
E
NL
D
HU
N
ES
T
Personal costs to failed entrepreneurs Lack of prevention and streamlining Barriers to restructuring

54
OECD ECONOMIC SURVEYS: HUNGARY 2021 © OECD 2021
Figure 1.33. Occupational entry barriers remain high
Note: In Panel A, workers in licensed occupations declared that without having a professional certification, licence, or taking an entry exam,
it would be illegal to practice their occupations. Workers in certified occupations proclaimed that they have a license, certificate, or that they
passed an exam to practice their occupation. However, it would not be illegal to practice their occupations without it.
Source: Koumenta and Pagliero, 2017 and Koumenta and Pagliero, 2016, based on the EU Survey of Occupational Regulation; and
Bambalaite, I., G. Nicoletti and C. von Rueden (2020), "Occupational entry regulations and their effects on productivity in services: Firm-
level evidence", OECD Economics Department Working Papers, No. 1605; and European Commission (2020), Regulated Professions
database (2020), European Commission, Brussels, https://ec.europa.eu/growth/tools-databases/regprof/ (accessed 26 November 2020).
StatLink 2 https://doi.org/10.1787/888934267274
Table 1.12. The past recommendations on the business environment
Recommendations in previous survey Action taken
Establish a regulatory impact assessment (RIA) commission. No action taken
Remove sector exemptions to apply the modern competition policy
framework as widely as possible. No action taken
Complement EU’s structural funds by focusing Hungarian financed
public infrastructure investments on bolstering agglomeration effect. No action taken
Secure non-discriminatory third party access in all network sectors to
bolster entry incentives. No action taken
Introduce market-based energy pricing and open segments to
competition. No action taken
Facilitate new entry in the retail sector. No action taken
Stimulate investment in telecommunication. Authorities conducted spectrum awards and bidding for frequency bands in 2020 and early 2021. A fourth operator was excluded from
the auction for failing to meet eligibility criteria.
0
10
20
30
40
50
60
70
80
0
10
20
30
40
50
60
70
80
FIN
PR
T
SW
E
ITA
DN
K
BE
L
FR
A
GR
C
SV
N
ES
T
LVA
ES
P
GB
R
CZ
E
LUX
PO
L
EU
LTU
AU
T
SV
K
HU
N
NLD IR
L
DE
U
A. Share of occupationsShare of occupations subject to licensing and certification, %, 2015
Licensed Certified
0
100
200
300
400
500
0
100
200
300
400
500
LTU
ES
T
SW
E
BE
L
GR
C
DE
U
DN
K
IRL
ITA
NLD
ES
P
FIN
AU
T
EU
LUX
PR
T
LVA
FR
A
SV
N
SV
K
PO
L
CZ
E
HU
N
B. Number of regulated professions2020
55
OECD ECONOMIC SURVEYS: HUNGARY 2021 © OECD 2021
Corruption and lack of public integrity hamper business dynamism
The formal anti-corruption and public integrity system has been improved with the implementation of the 2015-2018 National Anti-Corruption Programme, emphasising the integrity of the state administration and strengthening law-enforcement agencies (EC, 2020[72]). The system contains comprehensive definitions of corruption, criminalities and different forms of bribery, in accordance with the international bribery recommendation of the OECD Working Group on Bribery (OECD, 2020[73]). These developments are welcome as even perceived corruption reduces economic efficiency, leads to waste of public resources, widens economic and social inequalities, and inhibits trust in institutions (OECD, 2017[74]).
The government’s National Anti-Corruption Strategy for 2020-2022 is continuing the anti-corruption and public integrity efforts. The strategy aims at further reinforcing corruption prevention and addressing integrity risk areas where corruption is still perceived as a concern, such as conflict of interest, lobbying, interconnections between business and politics, the justice system, and independent control mechanisms (EC, 2020[72]) (GRECO, 2020[75]). For example, the Ministry of Interior will, in cooperation with the University of Public Service, identify the positions and jobs in the public administration that are most exposed to corruption and integrity risks (Hungarian Government, 2020[47]). These efforts go in the right direction of addressing the findings of the Hungarian State Audit Office (ASZ) that government, including local administrative bodies, and the higher education sector have higher risks of corruption than other public institutions (ASZ, 2020[76]).
Despite the strengthening of the formal anti-corruption and public integrity framework, international indicators show that corruption is still perceived to be higher than in any other OECD countries (Figure 1.34). Since MONEYVAL’s assessment in 2016, anti-money laundering measures have been taken to meet international standards. Nonetheless, the OECD indicators of the effectiveness of the anti-money laundering system continue to show some weaknesses, particularly in terms of coordination among involved institutions (Figure 1.35). In addition, the EU in the beginning of 2020 raised concerns regarding an extensive use of rule-by-decree and the declaration of an unlimited state-of-emergency, although the COVID-19 crisis has been managed in line with the Constitution (ensuring that the Constitutional Court provides independent and constitutional review of legal provisions). The EU Council recommends emergency measures to be proportionate, limited in time, and not hamper the normal business activities and the stability of the regulatory environment, which should be ensured through effective and independent oversight of the emergency measures (EU Council, 2020[77]) (Transparency International, 2021[78]). In November 2020, a state of emergency was declared for the second time. The accompanying legal acts contain strict deadlines for extending the temporary scope of the emergency measures.
The independence and accountability of the judiciary system are vital to a strong anti-corruption and public integrity system, as well as a crucial determinant of economic performance as a well-functioning judicial system helps to attract investments, reduce transaction costs, and deter businesses from opportunistic behaviour (OECD, 2013[79]) (European Commission, 2020[80]). The European Commission has recognised positive developments regarding the quality and efficiency of the Hungarian justice system, notably a high level of overall digitalisation and an adequate length of proceedings (EC, 2020[72]).In addition, court proceedings are estimated to be more than 20% faster than the European median and with lower costs as attorney fees being a third of the OECD average (OECD, 2013[81]) (CEPEJ-STAT, 2021[82]). (OECD, 2020[83]). Moreover, a Treaty on European Union procedure’s concerns regarding possible power imbalances between the National Judicial Council and the Parliament-elected President of the National Office for Judiciary was dealt with, among others, by increasing checks-and-balances on the appointment of independent judges. Nonetheless, not all the concerns of the Council of Europe have been addressed (GRECO, 2020[75]) (Venice Commission, 2019[84]). Also, the judges’ remuneration was significantly increased, although concerns have been raised whether a new performance-related bonus system may weaken judges’ independence (Council

56
OECD ECONOMIC SURVEYS: HUNGARY 2021 © OECD 2021
of Europe, 2018[85]) (EC, 2020[72]). However, there has not been any prosecution of corruption cases involving high-level officials or their immediate circle, despite the Prosecutor General’s Office finding that most corruption related cases involve public officials (EU Council, 2019[86]) (EC, 2020[87]).
Figure 1.34. Corruption is perceived as high compared with other OECD countries
Note: Panel A indicates that perception of corruption is low when the index is close to 100, whereas it is high when the index is close to
zero. Panel B shows the point estimate and the margin of error. Both Panel B and Panel C refer to the indicator capturing perceptions of the
extent to which public power is exercised for private gain, including both petty and grand forms of corruption, as well as "capture" of the
state by elites and private interests. Panel D shows sector-based subcomponents of the “Control of Corruption” indicator by the Varieties of
Democracy Project.
Source: Panel A: Transparency International; Panels B & C: World Bank, Worldwide Governance Indicators; Panel D: Varieties of
Democracy Institute; University of Gothenburg; and University of Notre Dame.
StatLink 2 https://doi.org/10.1787/888934267293
0
20
40
60
80
100
HU
NS
VK
GR
CIT
AC
ZE
PO
LL
VA
LT
US
VN
PR
TK
OR
ES
PU
SA
FR
AIR
LE
ST
AU
TB
EL
GB
RD
EU
LU
XN
LD FIN
SW
ED
NK
A. Corruption Perceptions IndexScale: 0 (worst) to 100 (best), 2020
-2.5
-1.5
-0.5
0.5
1.5
2.5
GR
C
HU
N
ITA
SV
K
LV
A
CZ
E
PO
L
ES
P
LT
U
KO
R
PR
T
SV
N
US
A
FR
A
IRL
ES
T
AU
T
BE
L
GB
R
DE
U
NLD
DN
K
LU
X
SW
E
FIN
B. Control of corruptionScale: -2.5 (worst) to 2.5 (best), 2019
-0.2
0
0.2
0.4
0.6
0.8
1
1.2
1.4
1996 1998 2000 2002 2004 2006 2008 2010 2012 2014 2016 2018
C. Evolution of "Control of Corruption"Scale: -2.5 (higher) to 2.5 (lower corruption)
OECD HUN
0
0.25
0.5
0.75
1Executive bribery
Executive embezzlement
Public sector bribery
Public sectorembezzlement
Legislature corruption
Judicial corruption
D. Corruption by sector, "Control of Corruption"Scale: 0 (worst) to 1 (best), 2019
OECD Best performer OECD
Worst performer OECD HUN
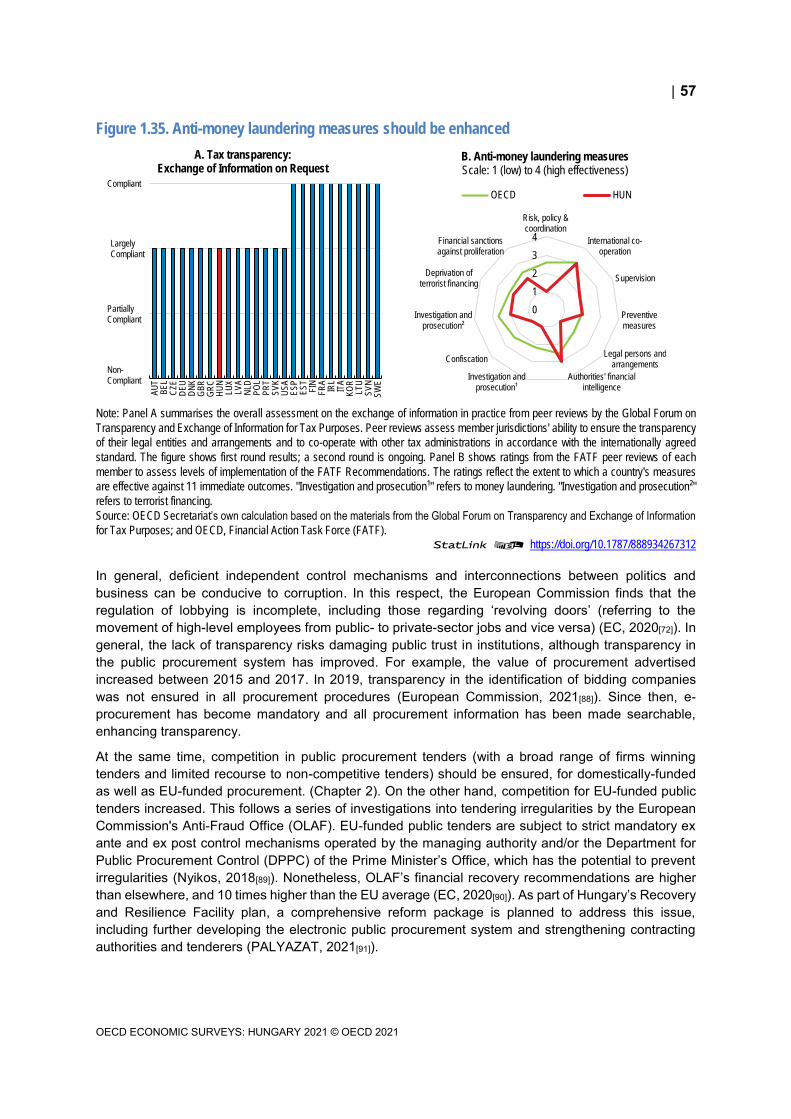
57
OECD ECONOMIC SURVEYS: HUNGARY 2021 © OECD 2021
Figure 1.35. Anti-money laundering measures should be enhanced
Note: Panel A summarises the overall assessment on the exchange of information in practice from peer reviews by the Global Forum on
Transparency and Exchange of Information for Tax Purposes. Peer reviews assess member jurisdictions' ability to ensure the transparency
of their legal entities and arrangements and to co-operate with other tax administrations in accordance with the internationally agreed
standard. The figure shows first round results; a second round is ongoing. Panel B shows ratings from the FATF peer reviews of each
member to assess levels of implementation of the FATF Recommendations. The ratings reflect the extent to which a country's measures
are effective against 11 immediate outcomes. "Investigation and prosecution¹" refers to money laundering. "Investigation and prosecution²"
refers to terrorist financing.
Source: OECD Secretariat’s own calculation based on the materials from the Global Forum on Transparency and Exchange of Information
for Tax Purposes; and OECD, Financial Action Task Force (FATF).
StatLink 2 https://doi.org/10.1787/888934267312
In general, deficient independent control mechanisms and interconnections between politics and business can be conducive to corruption. In this respect, the European Commission finds that the regulation of lobbying is incomplete, including those regarding ‘revolving doors’ (referring to the movement of high-level employees from public- to private-sector jobs and vice versa) (EC, 2020[72]). In general, the lack of transparency risks damaging public trust in institutions, although transparency in the public procurement system has improved. For example, the value of procurement advertised increased between 2015 and 2017. In 2019, transparency in the identification of bidding companies was not ensured in all procurement procedures (European Commission, 2021[88]). Since then, e-procurement has become mandatory and all procurement information has been made searchable, enhancing transparency.
At the same time, competition in public procurement tenders (with a broad range of firms winning tenders and limited recourse to non-competitive tenders) should be ensured, for domestically-funded as well as EU-funded procurement. (Chapter 2). On the other hand, competition for EU-funded public tenders increased. This follows a series of investigations into tendering irregularities by the European Commission's Anti-Fraud Office (OLAF). EU-funded public tenders are subject to strict mandatory ex ante and ex post control mechanisms operated by the managing authority and/or the Department for Public Procurement Control (DPPC) of the Prime Minister’s Office, which has the potential to prevent irregularities (Nyikos, 2018[89]). Nonetheless, OLAF’s financial recovery recommendations are higher than elsewhere, and 10 times higher than the EU average (EC, 2020[90]). As part of Hungary’s Recovery and Resilience Facility plan, a comprehensive reform package is planned to address this issue, including further developing the electronic public procurement system and strengthening contracting authorities and tenderers (PALYAZAT, 2021[91]).
0
1
2
3
4
Risk, policy &coordination
International co-operation
Supervision
Preventivemeasures
Legal persons andarrangements
Authorities' financialintelligence
Investigation andprosecution¹
Confiscation
Investigation andprosecution²
Deprivation ofterrorist financing
Financial sanctionsagainst proliferation
B. Anti-money laundering measuresScale: 1 (low) to 4 (high effectiveness)
OECD HUN
AU
TB
EL
CZ
ED
EU
DN
KG
BR
GR
CH
UN
LUX
LVA
NLD
PO
LP
RT
SV
KU
SA
ES
PE
ST
FIN
FR
AIR
LIT
AK
OR
LTU
SV
NS
WE
A. Tax transparency: Exchange of Information on Request
Partially Compliant
Compliant
Non-Compliant
Largely Compliant

58
OECD ECONOMIC SURVEYS: HUNGARY 2021 © OECD 2021
Hungary recently amended its constitution by introducing a new notion of public funds and rules on public trust funds (Hungarian Government, 2020[92]). Some NGOs’ interpretations of these amendments have been critical and have argued that the new rules may ease the transformation of public funds into private assets (Hungarian Helsinki Committee, 2020[93]) (Transparency International, 2021[78]). As a growing share of public assets have been transferred to an increasing number of public trust funds that are subject to specific financial scrutiny, it is important that transparency over public funds and full application of public procurement procedures are ensured in accordance with current legislation and good public management practices (Hungarian Government, 2020[94]) (Hungarian Government, 2021[95]). Overall, as much as possible, all public procurement should be subject to competitive tendering to secure transparent procedures and improve cost efficiency. This principle in addition to full financial scrutiny should apply to all public institutions, including public trust funds, to strengthen trust in public institutions, raise transparency and enhance competition (Chapter 2).
The establishment of an independent anti-corruption agency or a strong coordination committee would strengthen the effectiveness and integrity of the institutional anti-corruption and integrity system (as recommended in previous Surveys) and promote interventions in areas with high risks of corruption. This would bolster coordination among the bodies responsible for corruption prevention, investigation and prosecution, namely the National Protective Service, the Central Chief Prosecution Office and the State Audit Office (EC, 2020[72]). Such a measure should be complemented with assigning clear responsibilities to actors in the integrity system to ensure co-operation, avoid overlaps and prevent fragmentation in corruption prevention, as recommended by the OECD Council on Public Integrity (OECD, 2020[96]) (Table 1.13). Although Hungary has already adopted part of the recommendations of the Council of Europe’s Group of States against Corruption (GRECO), further action is needed to strengthen public integrity in areas such as conflict of interests, lobbying, rules of conduct and parliamentarians’ asset declarations, and to ensure the independence and transparency of the judicial system (GRECO, 2020[75]).
Table 1.13. The past recommendations on the business environment and corruption
Recommendations in previous survey Action taken
Strengthen public procurement through a more effective e-
procurement system.
The functionalities of the central electronic procurement improved:
new modules and connection to other registers were added.
Establish a dedicated anti-corruption agency. No action taken
An inclusive and mobile labour market is key for sustained growth Looking forward, the largest challenge for labour market policies is to support reallocation of labour resources. The projected strong recovery will boost labour demand. At the same time, the withdrawal of support to businesses will lead to the closure of non-viable firms and job losses. Moreover, population ageing will lead to a smaller and older labour force. Consequently, future growth will rely more on improving labour allocation and higher productivity growth and less on mobilising under-utilised labour resources.
Improving geographical labour mobility
On some metrics, geographical mobility is relatively high (OECD, 2021[97]). Other metrics point to lower mobility, such as the fact that the number of households moving within a two-year period is less than a third of that in the Nordic countries (OECD, 2019[12]). At the overall level, geographical labour mobility is insufficient to prevent persistent pockets of high unemployment in poor regions. Better geographical mobility include incentives to seek jobs within the vicinity of the unemployed, typically through commuting, or outside, typically through moving residence. Both instances include job-to-job mobility that foster productivity and income growth – a particular concern as tenures are relatively high in Hungary (OECD, 2019[12]).

59
OECD ECONOMIC SURVEYS: HUNGARY 2021 © OECD 2021
The persistent pockets of high unemployment also reflect that unemployed workers can re-apply for unemployment benefits after enrolment in the Public Works Schemes (Figure 1.36). The Schemes provide public employment to long-term unemployed, but they seldom give access to the primary labour market, reflecting that they do not encourage job search in more employment-rich regions and have a low training content (Chapter 2). A more effective solution would be to phase out the Public Works Schemes and rebalance active labour market policy spending towards job assistance and placement (OECD, 2018[98]; Card, Kluve and Weber, 2017[99]). Such a measure may entail increasing funding for public employment services to enhance their effectiveness for job placements and training capacity, as discussed in the last Survey (OECD, 2019[23]). Furthermore, the fast growth in minimum wages has left the ratio of the minimum wage to the median wage higher than in many other OECD countries. The ratio has decreased in recent years, but it is higher in poorer areas with lower average wages. This reduces incentives for workers in poorer areas to find jobs in more prosperous parts within or in other regions, i.e. the difference is too small to offset commuting and moving costs, and the creation of jobs for low-skilled workers (Figure 1.37) (Hungarian Central Statistical Office, 2021[100]). In absolute terms, the minimum wage is among the lowest in Europe and continued improvements of minimum wages is important for raising incomes of low-skilled workers. The government is supporting job opportunities for low-skilled workers through various wage subsidies. Looking forward, wage agreements could supplement such efforts by ensuring that minimum wage growth does not outpace median wage growth to encourage mobility of and expand job opportunities for low-skilled workers (Chapter 2).
The short duration of unemployment benefits also discourages geographical mobility as jobseekers have insufficient time to search for employment that matches their skills (Hungarian National Employment Service, 2021[26]). Extending the duration of unemployment benefits would provide adequate income support during employment transitions (Table 1.14) (Chapter 2). Leaving the relatively low replacement rate at 43% for singles and 54% for couples with children should preserve search incentives.
Figure 1.36. Regional differences in employment and unemployment are large Employment rate as % of working age population and unemployment rate (in brackets) as % of labour force,
population aged 15-74, 2020
Note: Average monthly number of participants in the Public Work Schemes are included in the unemployment rate.
Source: Hungarian Central Statistical Office; and OECD calculations.
StatLink 2 https://doi.org/10.1787/888934267331

60
OECD ECONOMIC SURVEYS: HUNGARY 2021 © OECD 2021
Table 1.14. The past recommendations on labour market policies
Recommendations in previous survey Action taken
Continue to reduce public work schemes and to enhance training of
participants and other job seekers.
The number of participants in the Public Work Schemes decreased
until March 2020, but increased somewhat later.
Extend duration of unemployment benefits and provide geographical
mobility support and activation measures.
In 2021, the rules on mobility and housing allowance were simplified
and the level of support was connected to the minimum wage.
Create a tool set to promote lifelong learning. No action taken
Enhance the geographical reach of public work schemes. Since 2019, Public Work Schemes are available only in municipalities under certain income threshold, although this still include more than
90% of all municipalities.
Tax policy in recent years has been focussed on reducing employers’ social security contributions and corporate tax rates. Nonetheless, unemployed and low-skilled workers still face high tax wedges, reducing incentives to enter employment and seek income gains, as described above. In addition, high average tax rates for high earners may deter investment in skills. A more growth friendly tax system would lower labour tax wedges, which would raise labour market participation and reduce inequalities, and increase the reliance indirect taxes and taxes on immobile property. Complexity has also increased with negative effects for transparency and work incentives, as tax relief is being provided to special groups, including personal income tax exemption for people younger than 25, various reductions of VAT rates, and targeted measures to encourage homeownership, particularly for families with children. Indeed, the general thrust of tax reform should be on broadening tax bases and reducing rates (OECD, 2019[55]).
Figure 1.37. The minimum wage is relatively high
Minimum relative to median wage of full-time workers, ratio, 2019
Source: OECD Labour Earnings database; OECD calculation based on Hungarian Central Statistical Office database.
StatLink 2 https://doi.org/10.1787/888934267350
Geographical mobility is also restricted by a combination of large regional house price differences and a very small rental markets, limiting the options for unemployed people and low-income earners from poorer regions to move to prosperous regions (MNB, 2019[101]). The small rental market reflects the lack of clear and well-balanced rules for the notice period and maintenance responsibilities, creating legal uncertainty for tenants and landlords as well as discouraging long-term rental contracts (MNB, 2019[102]). In addition, lengthy court procedures for dispute resolution further increase the costs of longer-term contracts. A more effective dispute resolution, better possibilities for terminating long-term contracts as well as clear rules for tenants’ and landlords’ obligations would reduce uncertainty and make long-term renting more attractive (Chapter 2).
0.3
0.4
0.5
0.6
0.7
0.3
0.4
0.5
0.6
0.7
IRL
CZ
E
ES
T
BE
L
LVA
NLD
DE
U
GR
C
SV
K
ES
P
HU
N
LTU
PO
L
LUX
GB
R
ISR
SV
N
PR
T
FR
A
2020 estimate

61
OECD ECONOMIC SURVEYS: HUNGARY 2021 © OECD 2021
The dominant owner-occupied housing segment is supported by generous mortgage subsidies and an advantageous tax treatment. The withdrawal of mortgage subsidies, such as zero interest rate loans, combined with taxing owner-occupied housing in line with other saving vehicles would help limit price increases in the housing market and improve geographical mobility (Chapter 2). Moreover, housing supply is only slowly adjusting to high house prices (Figure 1.38, Panel A). This reflects the prevalence of many regulated professions in construction, barriers to foreign entry, and lengthy processes for obtaining construction permits (OECD, 2019[23]) (Figure 1.38, Panel B). The Ministry of Finance is reviewing these issues within various EU programmes with the aim of reducing such regulatory burdens (KPMG&VVA, 2020[103]). A more flexible housing supply could be encouraged by reducing regulatory burden and number of regulated professions in the construction sector.
Figure 1.38. Housing supply adjusts relatively slowly
Note: Panel A shows estimates of the long-run supply elasticity from 1980Q1 to 2017Q4.
Source: Cavalleri, M., B. Cournède and E. Özsöğüt (2019), "How responsive are housing markets in the OECD? National level estimates",
OECD Economics Department Working Papers, No. 1589, OECD Publishing, Paris, https://doi.org/10.1787/4777e29a-en; and World Bank
2020 Doing Business.
StatLink 2 https://doi.org/10.1787/888934267369
Strengthening female labour force participation
Female labour market participation is generally high but low for mothers with young children. This problem could be further aggravated by the increase in women’s care obligations during the crisis (see above). More generally, their low employment rates reflect a combination of a long maternity leave of up to three years and few available nursery places. The latter can lead to young mothers taking the full maternity leave period (Gábos and Makay, 2020[104]). Compared with the OECD average, the total
0.0
0.5
1.0
1.5
2.0
2.5
3.0
0.0
0.5
1.0
1.5
2.0
2.5
3.0
CH
E
NLD
BE
L
FR
A
AU
T
ITA
DE
U
ISR
PR
T
GB
R
FIN
SV
N
CA
N
AU
S
NZ
L
HU
N
ZA
F
JPN
ES
P
NO
R
IRL
DN
K
SV
K
SW
E
US
A
A. Estimated supply elasticities
0
50
100
150
200
250
300
350
0
50
100
150
200
250
300
350
KO
R
DN
K
FIN
LTU
US
A
ME
X
ISL
GB
R
NZ
L
TU
K
ES
T
JPN
NO
R
SW
E
AU
S
DE
U
CO
L
PO
L
ES
P
OE
CD
LUX
CH
E
PR
T
NLD IR
L
GR
C
ITA
LVA
HU
N
CH
L
ISR
BE
L
FR
A
AU
T
CZ
E
SV
N
CA
N
SV
K
B. Construction permitsDays to obtain a construction permit, 2019
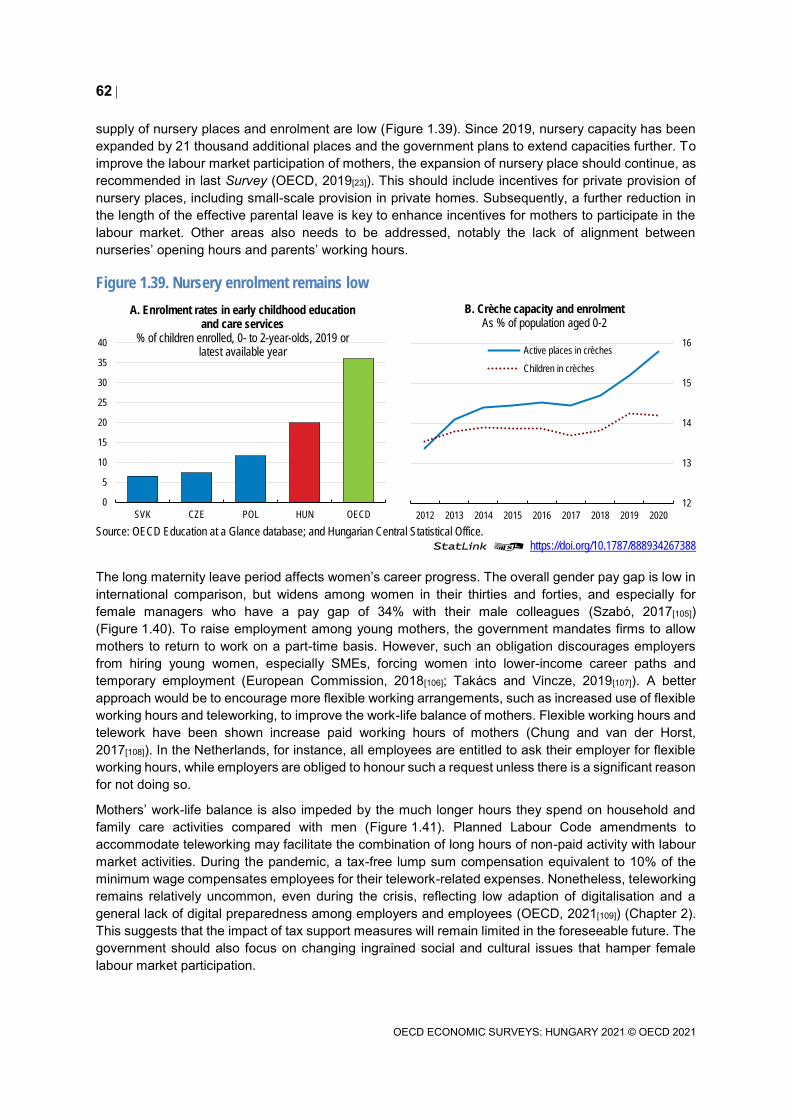
62
OECD ECONOMIC SURVEYS: HUNGARY 2021 © OECD 2021
supply of nursery places and enrolment are low (Figure 1.39). Since 2019, nursery capacity has been expanded by 21 thousand additional places and the government plans to extend capacities further. To improve the labour market participation of mothers, the expansion of nursery place should continue, as recommended in last Survey (OECD, 2019[23]). This should include incentives for private provision of nursery places, including small-scale provision in private homes. Subsequently, a further reduction in the length of the effective parental leave is key to enhance incentives for mothers to participate in the labour market. Other areas also needs to be addressed, notably the lack of alignment between nurseries’ opening hours and parents’ working hours.
Figure 1.39. Nursery enrolment remains low
Source: OECD Education at a Glance database; and Hungarian Central Statistical Office.
StatLink 2 https://doi.org/10.1787/888934267388
The long maternity leave period affects women’s career progress. The overall gender pay gap is low in international comparison, but widens among women in their thirties and forties, and especially for female managers who have a pay gap of 34% with their male colleagues (Szabó, 2017[105]) (Figure 1.40). To raise employment among young mothers, the government mandates firms to allow mothers to return to work on a part-time basis. However, such an obligation discourages employers from hiring young women, especially SMEs, forcing women into lower-income career paths and temporary employment (European Commission, 2018[106]; Takács and Vincze, 2019[107]). A better approach would be to encourage more flexible working arrangements, such as increased use of flexible working hours and teleworking, to improve the work-life balance of mothers. Flexible working hours and telework have been shown increase paid working hours of mothers (Chung and van der Horst, 2017[108]). In the Netherlands, for instance, all employees are entitled to ask their employer for flexible working hours, while employers are obliged to honour such a request unless there is a significant reason for not doing so.
Mothers’ work-life balance is also impeded by the much longer hours they spend on household and family care activities compared with men (Figure 1.41). Planned Labour Code amendments to accommodate teleworking may facilitate the combination of long hours of non-paid activity with labour market activities. During the pandemic, a tax-free lump sum compensation equivalent to 10% of the minimum wage compensates employees for their telework-related expenses. Nonetheless, teleworking remains relatively uncommon, even during the crisis, reflecting low adaption of digitalisation and a general lack of digital preparedness among employers and employees (OECD, 2021[109]) (Chapter 2). This suggests that the impact of tax support measures will remain limited in the foreseeable future. The government should also focus on changing ingrained social and cultural issues that hamper female labour market participation.
0
5
10
15
20
25
30
35
40
SVK CZE POL HUN OECD
A. Enrolment rates in early childhood education and care services
% of children enrolled, 0- to 2-year-olds, 2019 or latest available year
12
13
14
15
16
2012 2013 2014 2015 2016 2017 2018 2019 2020
B. Crèche capacity and enrolmentAs % of population aged 0-2
Active places in crèches
Children in crèches

63
OECD ECONOMIC SURVEYS: HUNGARY 2021 © OECD 2021
Figure 1.40. The gender pay gap is high for women in their 30s and 40s
Note: In Panel A, the gender pay gap is the difference between median wages of men and women relative to the median wages of men.
In Panel B, the gender pay gap is defined as the difference between average gross hourly earnings of men and women paid employees
relative to the average gross hourly earnings of men paid employees. Data refer to NACE Rev. 2 activities B to S, except O (i.e. Public
administration and defence; compulsory social security).
In both Panels, data refer to full-time employees with usual weekly working hours equal to or greater than 30 hours per week.
Source: OECD Gender wage gap database; and Eurostat Gender pay gap database.
StatLink 2 https://doi.org/10.1787/888934267407
Figure 1.41. Women’s work-life balance hampers their career prospects
Women's time spent in work by type, minutes per day
Source: OECD Gender database.
StatLink 2 https://doi.org/10.1787/888934267426
0
5
10
15
20
25
30
35
40
0
5
10
15
20
25
30
35
40
CO
L
LUX
BE
L
DN
K
NO
R
SV
N
HU
N
ITA
GR
C
NZ
L
TU
R
SW
E
IRL
ES
P
FR
A
PO
L
AU
S
PR
T
CH
L
LTU
ISL
OE
CD
NLD
SV
K
CZ
E
AU
T
CH
E
DE
U
GB
R
ES
T
CA
N
US
A
ME
X
FIN
LVA
ISR
JPN
KO
R
A. Gender pay gapMedian wages, full time employees, %
2019 or latest available year
2010 or closest available year
-5
0
5
10
15
20
25
30
-5
0
5
10
15
20
25
30
LUX
ITA
BE
L
GR
C
ES
P
PR
T
NLD
NO
R
SV
N
SW
E
FR
A
PO
L
IRL
DN
K
ISL
CH
E
FIN
LTU
GB
R
DE
U
AU
T
HU
N
LVA
SV
K
CZ
E
ES
T
B. Gender pay gap by age groupMean wages, 1974-1983 cohort, %
35-44 year-olds (2018)
25-34 year-olds (2008)
0
50
100
150
200
250
300
350
0
50
100
150
200
250
300
350
KO
R
SW
E
CA
N
FR
A
JPN
NLD
NO
R
FIN
BE
L
LUX
DE
U
DN
K
GB
R
ES
T
LVA
GR
C
OE
CD
NZ
L
AU
T
US
A
SV
N
ES
P
LTU
IRL
HU
N
PO
L
TU
R
ITA
AU
S
PR
T
ME
X
Unpaid work Paid work
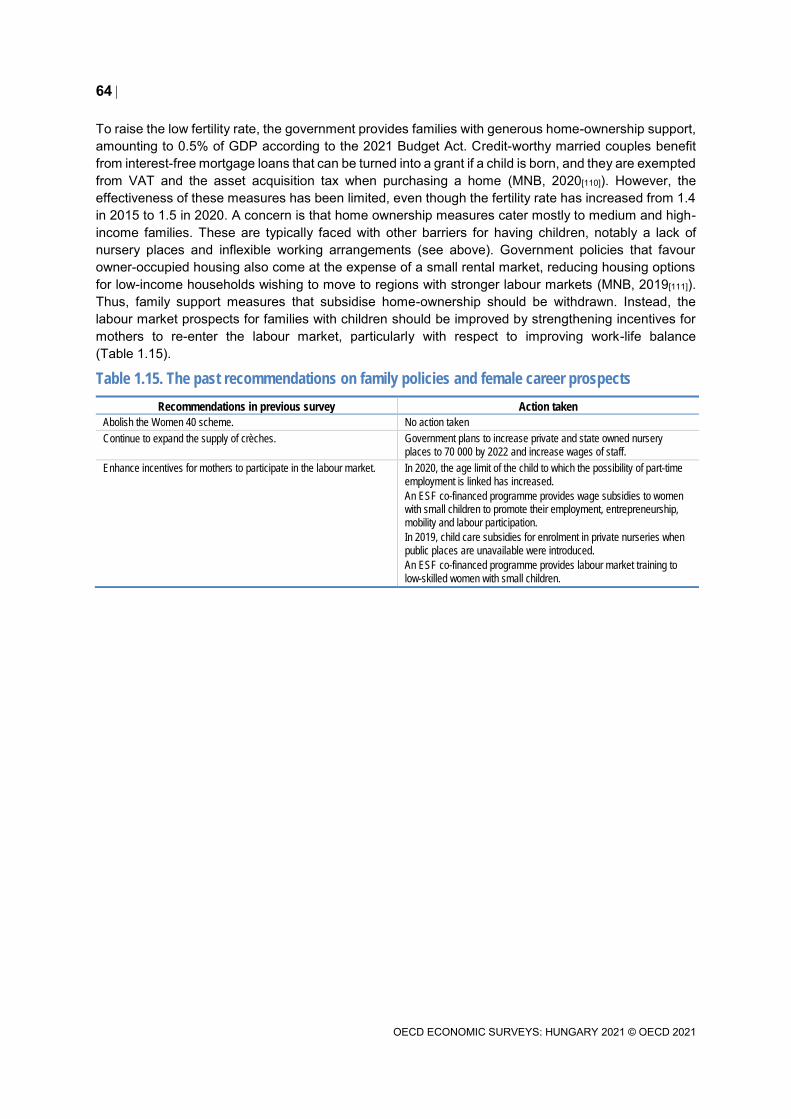
64
OECD ECONOMIC SURVEYS: HUNGARY 2021 © OECD 2021
To raise the low fertility rate, the government provides families with generous home-ownership support, amounting to 0.5% of GDP according to the 2021 Budget Act. Credit-worthy married couples benefit from interest-free mortgage loans that can be turned into a grant if a child is born, and they are exempted from VAT and the asset acquisition tax when purchasing a home (MNB, 2020[110]). However, the effectiveness of these measures has been limited, even though the fertility rate has increased from 1.4 in 2015 to 1.5 in 2020. A concern is that home ownership measures cater mostly to medium and high-income families. These are typically faced with other barriers for having children, notably a lack of nursery places and inflexible working arrangements (see above). Government policies that favour owner-occupied housing also come at the expense of a small rental market, reducing housing options for low-income households wishing to move to regions with stronger labour markets (MNB, 2019[111]). Thus, family support measures that subsidise home-ownership should be withdrawn. Instead, the labour market prospects for families with children should be improved by strengthening incentives for mothers to re-enter the labour market, particularly with respect to improving work-life balance (Table 1.15).
Table 1.15. The past recommendations on family policies and female career prospects
Recommendations in previous survey Action taken
Abolish the Women 40 scheme. No action taken
Continue to expand the supply of crèches. Government plans to increase private and state owned nursery
places to 70 000 by 2022 and increase wages of staff.
Enhance incentives for mothers to participate in the labour market. In 2020, the age limit of the child to which the possibility of part-time
employment is linked has increased.
An ESF co-financed programme provides wage subsidies to women with small children to promote their employment, entrepreneurship,
mobility and labour participation.
In 2019, child care subsidies for enrolment in private nurseries when
public places are unavailable were introduced.
An ESF co-financed programme provides labour market training to
low-skilled women with small children.

65
OECD ECONOMIC SURVEYS: HUNGARY 2021 © OECD 2021
MAIN FINDINGS RECOMMENDATIONS (key recommendations in bold)
Macroeconomic and financial policies to support the recovery
Inflation is above the inflation target of 3% and moved outside the
central bank’s upper tolerance band of +/- 1% in spring 2021.
Continue to increase policy interest rates if inflation expectations
become unanchored. Gradually exit from unconventional monetary policy measures.
Fiscal policy is supportive. Continue to provide targeted fiscal support as needed, while preparing for fiscal consolidation once the recovery has become self-sustained.
Adopt a medium-term strategy to reduce debt and prepare for long-run fiscal challenges of ageing.
Population ageing is accelerating, boosting ageing related spending
pressures.
Complete the ongoing increase of the statutory retirement age to
65 by 2022. Thereafter link it to gains in life expectancy.
The number of non-performing loans is likely to increase. Stand ready to increase the capital charge on non-performing loans.
Continue to develop the secondary market for impaired assets.
Healthcare capacities are constrained. Enhance autonomy of hospitals to adjust supply of health services.
Structural reforms for stronger, inclusive and more sustainable growth
High labour taxes deter labour market participation and investment in skills. The effective VAT rate is lower than the standard VAT rate.
Make the tax system more growth-friendly by further reducing the reliance on labour taxation and continuing increasing the reliance on consumption taxes and raising immobile property taxes, while
addressing adverse distributional impacts. Simplify the VAT system by moving towards a broader-based and lower standard VAT rate.
Employment among young mothers is low. Expand the availability of affordable, high-quality childcare. Reduce the effective length of parental leave and continue to
facilitate more flexible working arrangements.
The tax system imposes heterogeneous abatement costs across sectors and activities.
Gradually unify carbon taxes and set non-carbon environmental taxes and fees according to the polluter pays principle.
Low regulated prices (often below cost) of energy, water, wastewater and waste collection services do not incentivise investments.
Ensure cost recovery in regulated energy and introduce targeted affordability measures to help low-income households.
Increase waste collection fees and water and wastewater service tariffs to help finance needed investments.
The car fleet is old and polluting. Link vehicle taxes to environmental performance.
Favourable tax treatment encourages private car use for commuting. Tax the private use of company cars in line with wage.
Emissions from road transport are increasing. Introduce distance-based road pricing and congestion charges.
Strengthen business dynamism
The number of regulated professions remains high. Liberalise entry conditions in services sectors by reducing certification and licensing requirements.
The anti-corruption framework needs further strengthening to be more effective.
Establish an independent anti-corruption authority or a strong coordination committee.
Strengthen public integrity in conflict of interest, lobbying, rules of conduct, parliamentarians’ asset declarations, and independence and transparency of the judicial system.

66
OECD ECONOMIC SURVEYS: HUNGARY 2021 © OECD 2021
References
Adalet McGowan, M., D. Andrews and V. Millot (2017), “Insolvency regimes, zombie firms and capital reallocation”, OECD Economics Department Working Papers, No. 1399, OECD Publishing, Paris, https://dx.doi.org/10.1787/5a16beda-en.
[68]
ASZ (2020), ASZ (State Audit Office) - A KÖZSZFÉRA INTEGRITÁSÁNAK ELEMZÉSE (Analysis of public integrity 2019), https://www.met.hu/downloads.php?fn=/metadmin/doc/2020/05/407f84c50f6175b33e5c76724e83dfbf-asz-integritas-elemzes-2019-2020-04-29.pdf.
[76]
Bambalaite, I., G. Nicoletti and C. von Rueden (2020), “Occupational entry regulations and their effects on productivity in services: Firm-level evidence”, OECD Economics Department Working Papers, No. 1605, OECD Publishing, Paris, https://dx.doi.org/10.1787/c8b88d8b-en.
[71]
Bauer, P. et al. (2020), Productivity in Europe: Trends and drivers in a service-based economy, Publications Office of the European Union, Luxembourg.
[65]
Braw, E. (2020), “Blindsided on the Supply Side”, Foreign policy, https://foreignpolicy.com/2020/03/04/blindsided-on-the-supply-side.
[37]
BSR (2021), Ministry of Interior data, https://bsr.bm.hu/Document/Index. [1]
Card, D., J. Kluve and A. Weber (2017), “What Works? A Meta Analysis of Recent Active Labor Market Program Evaluations”, Journal of the European Economic Association, Vol. 16/3, pp. 894-931, http://dx.doi.org/10.1093/jeea/jvx028.
[99]
CEPEJ-STAT (2021), Dynamic database of European judicial systems, https://public.tableau.com/app/profile/cepej/viz/CEPEJ-Overviewv20201_0EN/Overview (accessed on 4 June 2021).
[82]
Chung, H. and M. van der Horst (2017), “Women’s employment patterns after childbirth and the perceived access to and use of flexitime and teleworking”, Human Relations, Vol. 71/1, pp. 47-72, http://dx.doi.org/10.1177/0018726717713828.
[108]
Constitutional Court (2016), Annulling the amendment to the Act on the Hungarian National Bank; transparency of public spending, http://public.mkab.hu/dev/dontesek.nsf/0/0E2BE7972D40CA0DC1257F710051F921?OpenDocument&english.
[115]
Council of Europe (2018), European judicial systems, https://rm.coe.int/rapport-avec-couv-18-09-2018-en/16808def9c.
[85]
CRCB (2020), New Trends in Corruption Risks and Intensity of Competition in the Hungarian Public Procurement from January 2005 to April 2020.
[112]
DiO (2020), Infographics about teachers’ digital teaching experiences – Survey results, https://www.ppk.elte.hu/dio-infografika-a-pedagogusok-digitalis-oktatasi-tapasztalatairol.
[9]
EC (2020), 2020 Country Report Hungary, https://eur-lex.europa.eu/legal-content/EN/TXT/?qid=1584543810241&uri=CELEX%3A52020SC0516.
[87]

67
OECD ECONOMIC SURVEYS: HUNGARY 2021 © OECD 2021
EC (2020), 2020 European Semester: Hungary - National Reform Programme 2020, https://ec.europa.eu/info/sites/info/files/2020-european-semester-national-reform-programme-hungary_en.pdf.
[14]
EC (2020), 2020 Rule of Law Report - Country Chapter on the rule of law situation in Hungary, https://ec.europa.eu/info/sites/info/files/hu_rol_country_chapter.pdf.
[72]
EC (2020), The OLAF report 2019 - Twentieth report of the European Anti-Fraud Office, Publications Office of the European Union, https://ec.europa.eu/anti-fraud/sites/antifraud/files/olaf_report_2019_en.pdf.
[90]
EC (2013), Preventing early school leaving in Europe - Lessons learned from second chance education - Annex one, Case study compendium, https://op.europa.eu/s/oMJX.
[13]
ECB (2016), Letter (QZ-61) of ECB President Mario Draghi to Mr Csaba Molnár (Member of the European Parliament).
[116]
EU Council (2020), “Council recommendation of 20 July 2020 on the 2020 National Reform Programme of Hungary and delivering a Council opinion on the 2020 Convergence Programme of Hungary”, Official Journal of the European Union, https://eur-lex.europa.eu/legal-content/EN/TXT/?uri=CELEX%3A32020H0826%2817%29.
[77]
EU Council (2020), The state of play regarding support for victims of terrorism, particularly in cross-border situations - Report from the German Presidency, https://data.consilium.europa.eu/doc/document/ST-13175-2020-REV-2/en/pdf.
[2]
EU Council (2019), Council recommendation of 9 July 2019 on the 2019 National Reform Programme of Hungary and delivering a Council opinion on the 2019 Convergence Programme of Hungary, https://eur-lex.europa.eu/legal-content/EN/TXT/?uri=uriserv:OJ.C_.2019.301.01.0101.01.ENG.
[86]
Euractiv (2021), Hungary brings coal exit forward by five years, to 2025, https://www.euractiv.com/section/climate-environment/news/hungary-brings-coal-exit-forward-by-five-years-to-2025/ (accessed on 2 April 2021).
[62]
European Automobile Manufacturers Association (2021), Passenger car registrations: -23.7% in 2020; -3.3% in December (webpage), https://www.acea.be/press-releases/article/passenger-car-registrations-23.7-in-2020-3.3-in-december (accessed on 8 March 2021).
[31]
European Commission (2021), Full business and consumer survey results (incl. ESI, EEI, sectoral CIs) - 25 February 2021, European Commission, Brussels, https://ec.europa.eu/info/sites/info/files/full_bcs_2021_02_en.pdf (accessed on 17 March 2021).
[30]
European Commission (2021), Single Market Scoreboard - Public procurement, https://ec.europa.eu/internal_market/scoreboard/performance_per_policy_area/public_procurement/index_en.htm (accessed on 27 May 2021).
[88]
European Commission (2021), The 2021 Ageing Report: Economic and Budgetary Projections for the EU Member States (2019-2070), http://dx.doi.org/10.2765/84455.
[52]
68
OECD ECONOMIC SURVEYS: HUNGARY 2021 © OECD 2021
European Commission (2020), Regulated Professions database, European Commission, Brussels, https://ec.europa.eu/growth/tools-databases/regprof/ (accessed on 23 February 2021).
[69]
European Commission (2020), Study and Reportson the VAT Gap in the EU-28 member States: 2020 Final Report, September 2020.
[49]
European Commission (2020), The 2020 EU justice scoreboard, Publications Office of the European Union, 2020, https://ec.europa.eu/info/sites/default/files/justice_scoreboard_2020_en.pdf.
[80]
European Commission (2020), The EU’s 2021-2027 long-term Budget and NextGenerationEU Facts and Figures, http://dx.doi.org/10.2761/808559.
[50]
European Commission (2019), Guidelines on Reporting Climate-related Information, European Commission, Brussels, https://ec.europa.eu/finance/docs/policy/190618-climate-related-information-reporting-guidelines_en.pdf (accessed on 2 April 2021).
[63]
European Commission (2018), Gender pay gap in EU countries based on SES (2014), Publication Office of the European Union, Luxembourg, https://ec.europa.eu/info/sites/info/files/aid_development_cooperation_fundamental_rights/report-gender-pay-gap-eu-countries_october2018_en_0.pdf (accessed on 11 April 2021).
[106]
European Environment Agency (2019), Trends and projections in Europe 2019: Tracking progress towards Europe’s climate and energy targets.
[58]
Financial Conduct Authority (2019), The Impact and Effectiveness of Innovate, Financial Conduct Authority, London.
[43]
Flues, F. and K. van Dender (2020), “Carbon pricing design: Effectiveness, efficiency and feasibility: An investment perspective”, OECD Taxation Working Papers, No. 48, OECD Publishing, Paris, https://dx.doi.org/10.1787/91ad6a1e-en.
[57]
Fodora, F. (2020), The impact of COVID-19 on the gender division of childcare work in Hungary, https://doi.org/10.1080/14616696.2020.1817522.
[3]
Gábos and Makay (2020), ’Hungary country note’, in Koslowki, A., Blum, S., Dobrotic, I. Kaufman, G. and Moss, P. (eds.).
[104]
Gender & Society (2020), “Revolution unstalled?: The impact of the COVID-19 crisis on the domestic division of labor in Hungary”, Gender & Society blog. G&S, https://gendersociety.wordpress.com/2020/05/28/revolution-unstalled-the-impact-of-the-covid-19-crisis-on-the-domestic-division-of-labor-in-hungary/.
[5]
GRECO (2020), Corruption prevention in respect of members of parliament, judges and prosecutors - Second interim compliance report - Hungary, https://rm.coe.int/fourth-evaluation-round-corruption-prevention-in-respect-of-members-of/1680a062e9.
[75]
Group, BMW (2021), Global Supplier Network, https://www.bmwgroup.com/en/responsibility/supply-chain-management.html.
[38]
HCSO (2021), HCSO Weekly monitor. [22]
69
OECD ECONOMIC SURVEYS: HUNGARY 2021 © OECD 2021
HÉTFA (2020), Female entrepreneurs in the time of COVID-19: 1 hour less for business, 2 hours more for family, https://hetfa.eu/2020/06/female-entrepreneurs-in-the-time-of-covid-19-1-hour-less-for-business-2-hours-more-for-family/.
[4]
HÉTFA Research Institute (2020), The epidemic poses a much greater threat to young people’s labor market opportunities than to their health (A járvány sokkal jobban veszélyezteti a fiatalok munkaerőpiaci esélyeit, mint az egészségét) (in Hungarian), https://hetfa.hu/2020/07/14/a-koronavirus-valsag-hatasa-a-fiatalok-munkaeropiaci-lehetosegeire-a-hetfa-uj-gyorselemzese-a-portfolion/ (accessed on 2 March 2021).
[27]
Hungarian Central Statistical Office (2021), “Average monthly gross earnings of full-time employees by the geographic area of the local unit (2000-2017)”, in Hungarian Central Statistical Office (ed.), Time series of annual, regional statistics – Society (database), https://www.ksh.hu/docs/eng/xstadat/xstadat_annual/i_qli049b.html (accessed on 23 February 2021).
[100]
Hungarian Central Statistical Office (2021), Balance of general government sector, year 2020 and the 4th quarter of 2020, first release, http://www.ksh.hu/docs/eng/xftp/gyor/krm/ekrm2012.html (accessed on 5 April 2021).
[46]
Hungarian Central Statistical Office (2021), Infra-annual data - People doing telework on the labour market, 2009–2021, Hungarian Central Statistical Office, Budapest, https://www.ksh.hu/stadat_infra_9_17 (accessed on 12 April 2021).
[25]
Hungarian Central Statistical Office (2021), “The number of inbound trips to Hungary and the related expenditures”, in Hungarian Central Statistical Office (ed.), Infra-annual data - Tourism, catering (database), http://www.ksh.hu/stadat_infra_4_5 (accessed on 8 March 2021).
[32]
Hungarian Government (2021), Bill on public trust foundations performing public functions, https://www.parlament.hu/irom41/15710/15710.pdf.
[95]
Hungarian Government (2021), Government Decree 196/2021. (IV. 28.). [48]
Hungarian Government (2020), Government Decree 569/2020. (XII. 9.). [47]
Hungarian Government (2020), The Ninth Amendment to the Fundamental Law of Hungary, https://www.parlament.hu/irom41/13647/13647.pdf (accessed on (accessed 28 April 2021).).
[94]
Hungarian Government (2020), The Ninth Amendment to the Fundamental Law of Hungary, https://www.parlament.hu/irom41/13647/13647.pdf.
[92]
Hungarian Helsinki Committee (2020), What happened in the last 48 hours in Hungary and how it affects the rule of law and human rights, https://helsinki.hu/wp-content/uploads/HHC_RoL_flash_report_Hungary_12112020.pdf.
[93]
Hungarian National Employment Service (2021), Summary Report of the National Employment Service, February 2021, Hungarian National Employment Service, Budapest, https://nfsz.munka.hu/nfsz/document/1/4/3/3/doc_url/nfsz_havi_reszletes_adatok_2021_02.pdf (accessed on 10 March 2021).
[26]
IEA (2020), Global EV Outlook 2020, https://www.iea.org/reports/global-ev-outlook-2020. [59]
70
OECD ECONOMIC SURVEYS: HUNGARY 2021 © OECD 2021
IEA (2017), Energy Policies of IEA Countries: Hungary 2017, OECD Publishing. [54]
Karlson, J. (2018), “The impact of potential Brexit scenarios on German car exports to the UK: an application of the gravity model”, Journal of Shipping and Trade, http://dx.doi.org/10.1186/s41072-018-0038-x.
[39]
Klein, C., J. Høj and G. Machlica (2021), “The impacts of the COVID-19 crisis on the automotive sector in Central and Eastern European Countries”, OECD Economics Department Working Papers, No. 1658, OECD Publishing, Paris, https://dx.doi.org/10.1787/a7d40030-en.
[34]
koronavirus.gov.hu (2020), Megjelent a kijárási korlátozásról szóló rendelet, https://koronavirus.gov.hu/cikkek/megjelent-kijarasi-korlatozasrol-szolo-rendelet (accessed on 27 March 2020).
[18]
Koumenta, M. and M. Pagliero (2018), “Occupational Regulation in the European Union: Coverage and Wage Effects”, British Journal of Industrial Relations, Vol. 57/4, pp. 818-849, http://dx.doi.org/10.1111/bjir.12441.
[70]
KPMG&VVA (2020), Strengthening the Regulatory Processes for Improved Competitiveness and Productivity of Businesses in Hungary.
[103]
Maravalle, A. and Ł. Rawdanowicz (2020), “How effective are automatic fiscal stabilisers in the OECD countries?”, OECD Economics Department Working Papers, No. 1635, OECD Publishing, Paris, https://dx.doi.org/10.1787/f1fb9d6a-en.
[51]
MNB (2021), Balance of Payments, International Investment Position (database), Magyar Nemzeti Bank, Budapest, https://www.mnb.hu/en/statistics/statistical-data-and-information/statistical-time-series/viii-balance-of-payments-foreign-direct-investment-international-investment-position/balance-of-payments-international-investment-position/data-according-to-bpm6-methodology (accessed on 8 March 2021).
[33]
MNB (2021), Green Finance Report: Status Report on the Sustainability of the Hungarian Financial System, Magyar Nemzeti Bank, Budapest, https://www.mnb.hu/letoltes/20210303-zold-penzugyi-jelentes-angol.pdf (accessed on 2 April 2021).
[61]
MNB (2021), Inflation Report, Magyar Nemzeti Bank, Budapest, https://www.mnb.hu/letoltes/eng-ir-digitalis-7.pdf (accessed on 27 March 2021).
[29]
MNB (2020), Financial Stability Report, Magyar Nemzeti Bank, Budapest. [41]
MNB (2020), Housing Market Report, November 2020. [110]
MNB (2020), Inflation Report, Magyar Nemzeti Bank, Budapest, https://www.mnb.hu/letoltes/eng-ir-16.pdf (accessed on 27 March 2021).
[40]
MNB (2020), MNB supports lending activity of banking system by releasing capital buffer requirements for systemically important banks, https://www.mnb.hu/en/pressroom/press-releases/press-releases-2020/mnb-supports-lending-activity-of-banking-system-by-releasing-capital-buffer-requirements-for-systemically-important-banks (accessed on 29 March 2021).
[42]

71
OECD ECONOMIC SURVEYS: HUNGARY 2021 © OECD 2021
MNB (2019), Financial Stability Report, Magyar Nemzeti Bank, Budapest, https://www.mnb.hu/letoltes/financial-stability-report-2019-december.pdf (accessed on 23 February 2021).
[101]
MNB (2019), Financial Stability report, 2019 December. [111]
MNB (2019), Fintech Strategy, Magyar Nemzeti Bank, Budapest, https://www.mnb.hu/letoltes/mnb-fintech-strategy-eng-cov.pdf (accessed on 17 February 2021).
[45]
MNB (2019), Housing Market Report, Magyar Nemzeti Bank, Budapest, https://www.mnb.hu/letoltes/lakaspiaci-jelentes-2019-november-en.pdf (accessed on 22 February 2021).
[102]
MNB (2018), MNB Decree 47/2018 (XII.17.) on diverging rules of compliance with obligations under certain MNB Decrees, Magyar Nemzeti Bank, Budapest.
[44]
Muraközy, B., M. Bisztray and B. Reizer (2019), Productivity differences in Hungary and mechanisms of TFP growth slowdown, Publications Office of the EU, Luxembourg, http://dx.doi.org/10.2873/33213 (accessed on 12 February 2021).
[64]
Nyikos, G. (2018), The Impact of the Public Procurement Control System on the Hungarian Public Administration., Central European Public Administration Review, https://doi.org/10.17573/cepar.2018.2.07.
[89]
OECD (2021), “ICT Access and Usage by Households and Individuals”, OECD Telecommunications and Internet Statistics (database), https://dx.doi.org/10.1787/b9823565-en (accessed on 22 February 2021).
[109]
OECD (2021), OECD Employment and Labour Market Statistics (database), OECD Publishing, Paris, http://dx.doi.org/10.1787/lfs-data-en.
[28]
OECD (2021), State of Health in the EU. [21]
OECD (2021), The laws of attraction: Economic drivers of inter-retgional migration, housing costs and the role of policies, OECD Publishing.
[97]
OECD (2020), “Legal fees are relatively high: Cost of attorney fees (% of claim), 2019” - in OECD Economic Surveys: Costa Rica 2020, OECD Publishing, https://doi.org/10.1787/21831f26-en.
[83]
OECD (2020), A framework to guide an education response to the COVID-19 Pandemic of 2020, OECD Publishing, https://doi.org/10.1787/6ae21003-en.
[8]
OECD (2020), Annual Report on Competition Policy Developments in Hungary - 2019, OECD, Paris, https://one.oecd.org/document/DAF/COMP/AR(2020)13/en/pdf (accessed on 11 March 2021).
[67]
OECD (2020), Directorate for Financial and Enterprise Affairs Working Group on Bribery in international business transactions - Phase 4 written follow-up report by Hungary, https://one.oecd.org/document/DAF/WGB(2020)4/FINAL/en/pdf.
[73]

72
OECD ECONOMIC SURVEYS: HUNGARY 2021 © OECD 2021
OECD (2020), “Job retention schemes during the COVID-19 lockdown and beyond”, OECD Policy Brief, OECD Publishing, Paris, https://www.oecd.org/coronavirus/policy-responses/job-retention-schemes-during-the-covid-19-lockdown-and-beyond-0853ba1d/ (accessed on 23 February 2021).
[24]
OECD (2020), OECD Public Integrity Handbook, OECD Publishing, https://doi.org/10.1787/ac8ed8e8-en.
[96]
OECD (2020), The impact of COVID-19 on student equity and inclusion: Supporting vulnerable students during school closures and school re-openings, OECD Publishing, http://www.oecd.org/coronavirus/policy-responses/the-impact-of-covid-19-on-student-equity-and-inclusion-supporting-vulnerable-students-during-school-closures-and-school-re-openings-d593b5c8/.
[6]
OECD (2020), The territorial impact of COVID-19: Managing the crisis across levels of government, OECD Publishing, http://www.oecd.org/coronavirus/policy-responses/the-territorial-impact-of-covid-19-managing-the-crisis-across-levels-of-government-d3e314e1/.
[7]
OECD (2019), Annual Report on Competition Policy Developments in Hungary - 2018, OECD, Paris, https://one.oecd.org/document/DAF/COMP/AR(2019)13/en/pdf (accessed on 11 March 2021).
[66]
OECD (2019), Economic Survey of Hungary, 2019, OECD. [55]
OECD (2019), OECD Economic Surveys: Hungary 2019, OECD Publishing, https://doi.org/10.1787/eco_surveys-hun-2019-en.
[12]
OECD (2019), OECD Economic Surveys: Hungary 2019, OECD Publishing, Paris, https://dx.doi.org/10.1787/eco_surveys-hun-2019-en.
[23]
OECD (2018), Effective Carbon Rates 2018: Pricing Carbon Emissions Through Taxes and Emissions Trading, OECD Publishing, Paris, https://dx.doi.org/10.1787/9789264305304-en.
[56]
OECD (2018), Good Jobs for All in a Changing World of Work: The OECD Jobs Strategy, OECD Publishing, Paris, https://dx.doi.org/10.1787/9789264308817-en.
[98]
OECD (2018), OECD Environmental Performance Reviews:Hungary 2018, OECD Publishing. [53]
OECD (2017), OECD Recommendation of the Council on Public Integrity, https://www.oecd.org/gov/ethics/OECD-Recommendation-Public-Integrity.pdf.
[74]
OECD (2015), Governing the City, OECD Publishing, http://dx.doi.org/10.1787/9789264226500-en.
[60]
OECD (2013), Judicial Performance and its Determinants: A Cross-Country Perspective, OECD Publishing, https://doi.org/10.1787/5k44x00md5g8-en.
[79]
OECD (2013), What makes civil justice effective?, OECD Publishing, https://www.oecd.org/economy/growth/Civil%20Justice%20Policy%20Note.pdf.
[81]
OECD/European Union (2020), Health at a Glance: Europe 2020: State of Health in the EU Cycle, OECD Publishing, Paris, https://dx.doi.org/10.1787/82129230-en.
[20]

73
OECD ECONOMIC SURVEYS: HUNGARY 2021 © OECD 2021
OKTATAS (2021), A középfokú írásbeli felvételi vizsgadolgozatok eredményei 2021, https://www.oktatas.hu/pub_bin/dload/kozoktatas/beiskolazas/2021/OH_honlap_felveteli_eredmenyek_gyorsstat_2021_KPF.pdf.
[10]
OKTATAS (2020), A középfokú írásbeli felvételi vizsgadolgozatok eredményei 2007-2020, https://www.oktatas.hu/pub_bin/dload/kozoktatas/beiskolazas/OH_honlap_felveteli_eredmenyek_2007_2020_KPF.pdf.
[11]
PALYAZAT (2021), Recovery and resilience plan of Hungary, https://www.palyazat.gov.hu/download.php?objectId=1092372.
[91]
Portfolio (2020), “Minden részlet megjelent: ilyen lesz az új világ szerdától Magyarországon a koronavírus miatt”, Minden részlet megjelent: ilyen lesz az új világ szerdától Magyarországon a koronavírus miatt, https://www.portfolio.hu/gazdasag/20201110/minden-reszlet-megjelent-ilyen-lesz-az-uj-vilag-szerdatol-magyarorszagon-a-koronavirus-miatt-456876 (accessed on 10 November 2020).
[19]
Pozzer, A. (2020), “Regional and global contributions of air pollution to risk of death from COVID-19”, Cardiovascular Research, Vol. Volume 116/Issue 14, pp. Pages 2247–2253, https://doi.org/10.1093/cvr/cvaa288.
[17]
Public Procurement Authority (2016), Decision n. D.349/11/2016, https://www.kozbeszerzes.hu/adatbazis/letoltes/portal_504400/?pdf=1.
[114]
Reuters (2020), Germany’s Daimler to produce fully electric compact SUV in Hungary. [36]
Szabó, C. (2020), “Psychological effects of the COVID-19 pandemic on Hungarian adults”, International Journal of Environmental Research and Public Health, Vol. 17/24, https://doi.org/10.3390/ijerph17249565.
[15]
Szabó, Z. (2017), Szomorú statisztika: ennyire becsülik meg a női menedzserek munkáját (Sad Statistics: This is how the Work of Female Managers is valued) (in Hungarian), https://www.napi.hu/nemzetkozi_gazdasag/szomoru_statisztika_ennyire_becsulik_meg_a_noi_menedzserek_munkajat.631036.html (accessed on 11 April 2021).
[105]
Takács, O. and J. Vincze (2019), “The gender pay gap in Hungary: New results with a new methodology”, Discussion Paper, No. MT-DP – 2019/24, Centre for Economic and Regional Studies, Budapest, https://kti.krtk.hu/wp-content/uploads/2019/12/MTDP1924.pdf (accessed on 11 April 2021).
[107]
Transparency International (2021), Hungary’s rule of law backsliding continues amidst the covid-19 crisis, https://www.transparency.org/en/blog/hungarys-rule-of-law-backsliding-continues-amidst-the-covid-19-crisis.
[78]
UNODC (2020), World Drug Report 2020, https://wdr.unodc.org/wdr2020/index.htm. [35]
Venice Commission (2019), Opinion on the law on administrative courts and on the entry into force of the law on administrative courts and certain transitional rules, https://www.venice.coe.int/webforms/documents/default.aspx?pdffile=CDL-AD(2019)004-e.
[84]
74
OECD ECONOMIC SURVEYS: HUNGARY 2021 © OECD 2021
Venice Commission (2017), Poland - Opinion on the Draft Act amending the Act on the Supreme Court, https://www.venice.coe.int/webforms/documents/?pdf=CDL-AD(2017)031-e.
[113]
World Obesity (2021), The Covid-19 and Obesity: the 20201 Atlas - the cost fo not addressing the global obesity crisis - March 2021, https://www.worldobesityday.org/assets/downloads/COVID-19-and-Obesity-The-2021-Atlas.pdf.
[16]