MERCURY Background - OECD
159
GENERAL DISTRIBUTION OCDE/GD(94)98 OECD ENVIRONMENT MONOGRAPH SERIES NO. 103 RISK REDUCTION MONOGRAPH NO. 4: MERCURY Background and National Experience with Reducing Risk ORGANISATION FOR ECONOMIC CO-OPERATION AND DEVELOPMENT Paris 1995 COMPLETE DOCUMENT AVAILABLE ON OLIS IN ITS ORIGINAL FORMAT
-
Upload
khangminh22 -
Category
Documents
-
view
2 -
download
0
Transcript of MERCURY Background - OECD

GENERAL DISTRIBUTION
OCDE/GD(94)98
OECD ENVIRONMENT MONOGRAPH SERIES NO. 103
RISK REDUCTION MONOGRAPH NO. 4:
MERCURY
Background and National Experience with Reducing Risk
ORGANISATION FOR ECONOMIC CO-OPERATION AND DEVELOPMENT
Paris 1995
COMPLETE DOCUMENT AVAILABLE ON OLIS IN ITS ORIGINAL FORMAT

2

OECD Environment Monograph Series No. 103
RISK REDUCTION MONOGRAPH NO. 4:
MERCURY
Background and National Experience with Reducing Risk
Environment Directorate
ORGANISATION FOR ECONOMIC CO-OPERATION AND DEVELOPMENT
Paris
3

Also published in this series:
Risk Reduction Monograph No. 1: Lead
Risk Reduction Monograph No. 2: Methylene Chloride
Risk Reduction Monograph No. 3: Selected Brominated Flame Retardants
Risk Reduction Monograph No. 5: Cadmium
© OECD 1994, 1995
Applications for permission to reproduce or translate all or part of this material should be made to:Head of Publications Service, OECD, 2 rue André-Pascal, 75775 Paris Cedex 16, France.
4

RISK REDUCTION MONOGRAPHS
Risk Reduction Monograph No. 4: Mercury –Background and National Experience withReducing Risk is the fourth in a series of OECDdocuments concerned with risk reductionactivities for specific chemicals or groups ofchemicals. The Risk Reduction Monographscontain sections on: the commercial life cycle;the environmental life cycle, including sources ofenvironmental releases, pathways, andestimations of exposure; risk reduction andcontrol measures; and international and nationalpositions on the perceived risk.
Risk Reduction Monographs are part of theEnvironment Monograph series, which makesselected technical reports prepared by the OECDEnvironment Directorate available to a widereadership. Copies are available at no charge, inlimited quantities, from the OECD EnvironmentDirectorate, Environmental Health and SafetyDivision, 2 rue André-Pascal, 75775 ParisCedex 16, France.
Fax: (33-1) 45 24 16 75
5

6

TABLE OF CONTENTS
Foreword . . . . . . . . . . . . . . . . . . . . . . . . . . . . . . . . . . . . . . . . . . . . . . . . . . . . . . . . . 13
Executive Summary . . . . . . . . . . . . . . . . . . . . . . . . . . . . . . . . . . . . . . . . . . . . . . . . . 15
Exposé de synthèse . . . . . . . . . . . . . . . . . . . . . . . . . . . . . . . . . . . . . . . . . . . . . . . . . 21
Chapter 1 Mercury’s Properties, Production and Uses . . . . . . . . . . . . . . . . . . . . . . 27
1.1 Physical and chemical properties . . . . . . . . . . . . . . . . . . . . . . . . . . . 271.2 Production . . . . . . . . . . . . . . . . . . . . . . . . . . . . . . . . . . . . . . . . . . . 271.3 Uses . . . . . . . . . . . . . . . . . . . . . . . . . . . . . . . . . . . . . . . . . . . . . . . 32
Chapter 2 Environmental Releases . . . . . . . . . . . . . . . . . . . . . . . . . . . . . . . . . . . . 37
2.1 Introduction . . . . . . . . . . . . . . . . . . . . . . . . . . . . . . . . . . . . . . . . . . 372.2 Natural emissions . . . . . . . . . . . . . . . . . . . . . . . . . . . . . . . . . . . . . . 372.3 Anthropogenic emissions . . . . . . . . . . . . . . . . . . . . . . . . . . . . . . . . . 392.4 Contributing anthropogenic processes . . . . . . . . . . . . . . . . . . . . . . . 41
Chapter 3 Linkages to Exposure . . . . . . . . . . . . . . . . . . . . . . . . . . . . . . . . . . . . . . 51
3.1 Introduction . . . . . . . . . . . . . . . . . . . . . . . . . . . . . . . . . . . . . . . . . . 513.2 Mercury concentrations . . . . . . . . . . . . . . . . . . . . . . . . . . . . . . . . . . 513.3 Behaviour and occurrence in air . . . . . . . . . . . . . . . . . . . . . . . . . . . 513.4 Behaviour and occurrence in the aquatic environment . . . . . . . . . . . . 553.5 Behaviour and occurrence in soil . . . . . . . . . . . . . . . . . . . . . . . . . . . 573.6 Example of mass balance for mercury input . . . . . . . . . . . . . . . . . . . 583.7 IPCS data on pathways to human exposure . . . . . . . . . . . . . . . . . . . 58
Chapter 4 International and National Positions on the Risks from Mercury . . . . . . . . 63
4.1 International position (IPCS) . . . . . . . . . . . . . . . . . . . . . . . . . . . . . . . 654.2 National positions . . . . . . . . . . . . . . . . . . . . . . . . . . . . . . . . . . . . . . . 80
(continued next page)
7

Chapter 5 Mechanisms for Risk Reduction . . . . . . . . . . . . . . . . . . . . . . . . . . . . . . . 97
Annex A Mercury Risk Reduction Activities: Summary Tables . . . . . . . . . . 127
Appendix 1-7 . . . . . . . . . . . . . . . . . . . . . . . . . . . . . . . . . . . . . . . . . . . . . . . . . . . . 141
References . . . . . . . . . . . . . . . . . . . . . . . . . . . . . . . . . . . . . . . . . . . . . . . . . . . . . . 151
8

FIGURES
Chapter 1:
Figure 1.1 Primary Production of Mercury, 1925-1987
Figure 1.2 Production of Mercury from Ores and Concentrates
Figure 1.3 World Production of Mercury Compared with the Annual Average Pricein the United States
Figure 1.4 Relative Consumption of Mercury (1988-1992) in Different Countries
Figure 1.5 Use Categories of Mercury (1988-1992) in Batteries, Tooth Fillingand Chlor-alkali Production
Figure 1.6 Use of Mercury in the United States
Chapter 2:
Figure 2.1 Elimination of Mercury from General Purpose Batteries
9

TABLES
Chapter 2:
Table 2.1 Estimates of Fluxes of Mercury to the Global Atmosphere
Table 2.2 Estimates of Worldwide Emissions of Mercury to the Atmosphere,Soil and Water in 1983
Table 2.3 Mercury Emissions in the EC by Sector in 1989
Table 2.4 Annual Air Emissions in the United States
Table 2.5 Amount of Mercury as Natural Constituent in Coal and Oil Used forEnergy Production
Table 2.6 Mercury Emissions in the EC from Mercury Mining, SecondaryProduction and Non-ferrous Industry in 1989
Table 2.7 Mercury Emissions in the EC from Industrial Processes in 1989
Table 2.8 Discards of Products Containing Mercury in the Municipal Solid WasteStream 1970-2000 (United States)
Table 2.9 Mercury Emissions in the EC from Product Use in 1989
Chapter 3:
Table 3.1 Typical Mercury Concentrations in the Environment
Table 3.2 Emissions of Mercury from Soil and Water Surfaces
Table 3.3 Wet Deposition of Mercury
Table 3.4 Input of Mercury to the North Sea 1983-86
Table 3.5 Estimated Average Daily Intake and Retention of Total Mercury and MercuryCompounds (µg/day) in the General Population Not Occupationally Exposedto Mercury
Table 3.6 Intake of Methylmercury (µg/day) from Fish with Various MethylmercuryLevels and at Various Rates of Fish Consumption
10
Chapter 4:
Table 4.1 The Australian Market Basket Surveys for Cooked Battered Fish
Chapter 5:
Table 5.1 Sectorial Norms for Mercury in Industrial Wastewater Discharges in Belgium
11

12

FOREWORD
Background
In 1990, the Council of the OECD adopted a Decision-Recommendation on theCo-operative Investigation and Risk Reduction of Existing Chemicals [C(90) 163/Final].This OECD Council Act is aimed at the reduction of risks from chemicals to theenvironment, and/or to the health of the general public or workers. It is based on thepremise that international co-operation in risk reduction activities can enhance thetechnical and institutional aspects of risk management in Member countries throughburden-sharing and a reduction of duplicative efforts. Furthermore, such activities canlead to a more effective use of the knowledge about risks that is being generated through,for example, national chemicals reviews and assessments; the OECD co-operativeinvestigation of existing chemicals; and the work of other international organisationsconducting hazard and risk evaluations, such as the United Nations’ InternationalProgramme on Chemical Safety (IPCS).
International co-operation can provide a forum for the exchange of views on riskreduction strategies, thus increasing mutual understanding and facilitating theharmonization of programmes being undertaken at the national level. By means of thisforum, technical barriers to trade can also be prevented.
The OECD’s approach to risk reduction
The risk reduction process normally begins at the national level. However, theinternational character of the use and marketing of chemicals, and the mobility of certainchemicals in the environment, give risk reduction activities an international dimension.
The OECD’s approach to risk reduction relies on the sharing and exchange ofinformation on the management of specific chemicals. Readily available informationconcerning national risk reduction strategies can make comparative analyses possible.Where common interests emerge, the development and implementation of measured andconsistent responses to unacceptable health and/or environmental risks can be facilitated.
In this context, risk reduction activities can take into account all stages of achemical’s commercial and environmental life cycles, beginning with the natural resourcesneeded to produce it and extending through the chemical’s uses to its eventual disposal.The chemical’s health and environmental effects can be considered, together withexposure via all routes and media to different populations.
13

OECD work on mercury risk reduction
OECD Member countries chose mercury as one of the five chemicals (or groupsof chemicals) to be included in the initial pilot project on co-operative risk reduction. AnOECD Clearing House made up of lead countries for mercury began initial informationcollection in support of this Risk Reduction Monograph in 1992. Within the ClearingHouse, all drafts of the document including this final version were developed by Denmarkand its consultant, Arne Jensen (Water Quality Institute), with technical support from theother Clearing House country, Sweden.
The Joint Meeting of the Chemicals Group and the Management Committee ofthe Special Programme on the Control of Chemicals recommended that this document bederestricted. It is being made public under the authority of the Secretary-General.
14

EXECUTIVE SUMMARY
The main purposes of this document are:
• to provide a summary of information regarding releases of mercury to theenvironment, the ensuing environmental and human exposures, and the way OECDMember countries perceive the risks associated with exposure to mercury; and
• to describe the actions Member countries and industry have taken, or contemplatetaking, to reduce risks associated with exposure to mercury.
This document should be considered as a "snapshot" of the most recent thinkingconcerning the different activities within the field of mercury consumption and pollution. It mayassist in evaluating the effectiveness of national risk reduction strategies for mercury byidentifying common trends in setting criteria, standards or national policies. It may also suggestrationales and possibilities for concerted international actions.
Risk reduction activities for mercury are expected to continue to create information andtechnology conduits between Member countries, and to promote the development and transferof knowledge regarding the nature and efficacy of responses to deal with unacceptable risksresulting from exposure to mercury.
Chapter Summaries
1. Mercury’s Properties, Production and Uses
Mercury is a naturally occurring element in the earth’s crust. Exploitation of the greatmajority of mercury deposits is by underground mining methods. The usual process of extractingmercury consists of heating the ore or concentrate in retorts or furnaces to liberate the mercuryvapour, followed by condensation of the vapour.
Primary production of mercury worldwide decreased steadily from 10,000 tonnes in1970 to 5500 tonnes in 1990. In 1991 the estimated primary production was less than 4000tonnes. Secondary production accounts for a significant supplementary amount of mercury. Thedecrease in production has been matched by a decrease in the price of mercury.
The uses of mercury in the 1980s in OECD countries, in terms of average percentageof total use, were:
• batteries, 25 per cent;• chlor-alkali industry, 28 per cent;• electrical equipment and measurement equipment, 16 per cent;• paint, 10 per cent;• tooth fillings, 7 per cent;• all other uses, such as thermometers and laboratory equipment, 14 per cent.
15

Mercury use in OECD countries has decreased over the last 15 years for mostproducts. Significant reductions have been realised in its use in, for example, batteries, paintsand seed dressing.
2. Environmental Releases
Environmental releases of mercury can be natural in origin (e.g. geological deposits,volcanic activities) or can occur from anthropogenic sources such as industrial activities, energyproduction, and the use and disposal of consumer products.
Environmental releases of mercury to air, water or land can be from soils andvegetation, forest fires, water surfaces, geological sources (such as crustal weathering, volcanicactivities, earthquakes), and through crustal degassing, as well as from anthropogenic sourcessuch as industrial activities, energy production, and the use and disposal of consumer products.
Various researchers have estimated the global annual natural emissions of mercury.Estimates vary over several orders of magnitude depending on the natural sources included inthe estimate and the method of calculation. However, the concentrations of mercury in variouscompartments from natural and anthropogenic sources are highly variable. Therefore it wouldalso be expected that emissions to air would be variable.
Global estimates of anthropogenic emissions in 1983 are:
• 3600 metric tonnes to air;• 4600 metric tonnes to water, including atmospheric fall-out;• 8300 metric tonnes to soil, including atmospheric fall-out.
However, more recent estimates indicate that anthropogenic emissions have decreasedsince these estimates were calculated, owing to changes in technology, reduced mercury use,and method of calculating emission factors.
Regional air emission estimates in the United States and the European Union showthat the most important sources are coal combustion, followed by solid waste incineration. Thegreatest total releases to all media originate from industrial activity. Products containing mercurymay result in releases to air, water or land after being landfilled or incinerated. The releasesfrom landfills are difficult to quantify, however, because little is known about the processes whichcontrol the release of mercury.
Metal mining and production result in releases to soil, although in some countries suchas Brazil serious widespread mercury pollution has been caused by the use of mercury in goldmining.
The most significant industrial process in terms of mercury emissions has been chlor-alkali production. However, today the greatest part of emissions is converted to a solid wasteproduct which is disposed of in accordance with toxic waste regulations. The iron and steelindustry and the fertilizer industry are mainly faced with the disposal of solid waste that containsmercury.
Other examples of releases are those from dental clinics and crematoria.
16

When industrial solid wastes and post-consumer products that contain mercury are notrecycled or reused, they are generally disposed of in landfills or incinerators. For many yearshousehold batteries have been the largest source of mercury in discarded or used products.Municipal solid waste (MSW) incineration waste is estimated by US EPA to be 22 per cent ofmercury releases to air in the United States, whereas an industry evaluation of existingmunicipal waste combustors arrived at a figure amounting to 14 per cent taking into account thetype of control technology used at each facility. In the European Union, the air emission fromMSW incineration is estimated to be 32 per cent, with only 8 per cent of the incinerators havinggas-cleaning technology. When household waste is disposed of in landfills, it may give rise tothe release of mercury to groundwater or to the atmosphere. The mercury concentration inhousehold waste is expected to be reduced significantly in the next decade, following theexpected decrease in the use of mercury in batteries.
3. Linkages to Exposure
Following its release to the environment, mercury is distributed and continuouslyredistributed between and within environmental compartments. It is more mobile than otherheavy metals. In addition, inorganic mercury may be methylated by microbial activity to a moretoxic organic form that is also transferable in the environment, giving rise to bioaccumulation andbiomagnification in living organisms.
Anthropogenic mercury is released to the atmosphere as elemental mercury or asmercury compounds, in a gaseous form or as particulate material. Elemental mercury can betransported long distances, while mercury compounds are mostly deposited within 100 km ofthe source.
The greatest part of atmospheric mercury is generally assumed to be in the form ofelemental mercury vapour. Mercury is removed from the atmosphere by dry and wet deposition.
Earlier deposited anthropogenic and/or natural mercury present in the environment canbe volatilized again from the oceans (and lakes) as well as from soils. However, measurementsare still too few to draw general conclusions about mercury fluxes in the environment on aregional (or larger) scale.
The major negative effect of environmental pollution by mercury is the biomagnificationof methylmercury in the aquatic food chains. Methylmercury in biota has a biological half-lifeon the order of one year. Mercury in the aquatic environment is accumulated in biota inincreasing concentrations with time, as well as at higher trophic levels.
These problems have led to a very large effort to try to determine the regulatingmechanisms for the uptake of methylmercury in fish. However, there is still a need to elucidateconclusively the quantitative flux from different sources to fish.
Mercury concentrations in ocean surface waters are elevated in the northwest Atlanticcompared with the northwest Pacific.
Recent studies have shown that mercury in forest soils, both natural andanthropogenic, can become mobile and be transported via run-off or flooding to surface waters.This can give rise to elevated mercury concentrations in the food chain, including in fish.
17

Studies, especially in Canada, have shown that land with presumably natural elevatedmercury levels which is flooded by water produces high methylation rates of mercury, in turngiving rise to a high accumulation of mercury in fish.
Sediments in the aquatic compartment are a major sink for mercury. However,because several biogeochemical processes lead to element enrichment in surface sediments,mercury can be released to both water and the atmosphere.
There is a dynamic exchange of volatile mercury compounds between the atmosphereand the soil, mainly in the form of elemental mercury, which is easily absorbed by soil organicmatter although it is available for re-emission from certain soils.
Because of the very high affinity of several mercury compounds to soil organic matter,leaching losses to subsoil horizons, groundwater or surface water are thought to be small fornormal soils.
Several studies in Europe, the United States and Canada have suggested that mercurylevels in the environment have been increasing. There is considerable debate among scientistsabout the significance of the contribution from natural versus anthropogenic sources.
The major human intake of mercury for the general population is from food and fromdental amalgams. Fish and fish products are the dominant source of human exposure (andintake) because of their high retention of methylmercury. However, a significant intake ofelemental mercury vapour with a high retention of mercury can occur from dental amalgams,dependant on the number of fillings. Exposure to inorganic mercury compounds is mainly fromnon-fish food with a low retention of mercury.
4. International and National Positions on the Risks from Mercury
This chapter contains assessments of the risks of mercury taken from InternationalProgramme on Chemical Safety (IPCS) Environmental Health Criteria documents.
Also presented in this chapter are Member country statements in regard to nationalpositions on risks from mercury. These statements essentially present the rationale for anyactions the country has taken or contemplates taking to address the effects associated withexposure to mercury. The risk assessments and risk characterisations that have led countriesto take action have a national character. Countries develop positions on the need for riskreduction activities only after they have analysed the hazard and the significance of certainexposures and have factored in local social, economic and political considerations. Thesepositions are usually arrived at after considerable debate on the numerous factors involved, andthus are not consistent across Member countries.
Some countries believe that the use of mercury and mercury-containing productsshould be reduced, with the goal of reducing the emission of mercury to the environment andthe risks to human health. Other countries believe that the most significant routes of exposureto mercury should be managed to reduce risks to human health and the environment.
18

5. Mechanisms for Risk Reduction
Many Member countries have taken steps to reduce risks from mercury. Requests forinformation on mercury risk reduction activities were made to all Member countries in 1993-94.The national viewpoints presented in this chapter are mainly based on the responses to theserequests.
Responses were received from the majority of Member countries. Generally, it can beconcluded that:
• all countries have national legislation/regulations for mercury emissions to air, waterand soil;
• mercury in seed dressing is forbidden for nearly all uses;
• the use of mercury in paint has been forbidden in most OECD countries;
• several countries have restricted or banned the use of mercury in thermometers;
• a few countries will prohibit the use of mercury in dental fillings towards the end ofthis century;
• today the general purpose battery can be produced without mercury;
• most countries have taken measures to reduce risks from occupational exposures;
• most countries have established guidelines or standards on the mercury contentof fish or food;
• some countries have guidelines or standards for the mercury content in sewagesludge applied to agricultural land;
• some countries have established national or regional data bases (e.g. for sedimentsand fish) to identify areas of elevated metal levels;
• a few countries have a general ban on the use of mercury, with exemptions;
• several countries are parties to multilateral agreements to reduce the input ofmercury to the marine environment.
Some national risk reduction measures are shown in the tables in Annex A to thischapter. Absence of information on a particular Member country does not mean that mercuryrisk reduction activities have not taken place in that country.
19

20

EXPOSE DE SYNTHESE
Le présent document a pour principaux objectifs :
• de résumer les informations relatives aux rejets de mercure dans l’environnement,à l’exposition qui s’ensuit pour l’environnement et l’être humain, ainsi qu’à lafaçon dont les pays Membres de l’OCDE perçoivent les risques associés àl’exposition au mercure ; et
• de décrire les dispositions que ces pays et les industries concernées ont prisesou envisagent de prendre afin de réduire les risques associés à l’exposition aumercure.
Ce document doit être considéré comme un «instantané» des réflexions les plusrécentes relatives aux diverses activités liées à l’utilisation du mercure et à la pollution quis’ensuit. Il peut aider à évaluer l’efficacité des stratégies nationales de réduction des risquesliés au mercure en identifiant les tendances communes dans l’établissement de critères, denormes ou de politiques nationales. Il peut également aider à identifier des domaines où desactions internationales concertées se justifieraient et seraient possibles.
Les activités visant à réduire les risques associés au mercure devraient normalementcontinuer d’alimenter des flux d’informations et de technologie entre pays Membres etencourager l’acquisition et l’échange de connaissances relatives à la nature et à l’efficacitéde mesures prises pour faire face à des risques inacceptables qui découlent de l’expositionau mercure.
Résumé des differents chapitres
1. Propriétés, production et utilisations du mercure
Le mercure est un élément présent à l’état naturel dans la croûte terrestre.L’exploitation de la grande majorité des gisements de mercure se fait par extraction minièresouterraine. Le mercure est généralement obtenu par chauffage du minerai ou desconcentrés de façon à libérer le métal sous forme de vapeur qui est ensuite condensée.
La production mondiale de mercure primaire a diminué régulièrement pour passer de10 000 tonnes en 1970 à 5 500 tonnes en 1990. En 1991, on évaluait la production primaireà moins de 4 000 tonnes. La production secondaire représente une quantité supplémentairede mercure non négligeable. Le recul de la production s’est accompagné d’une diminution duprix du mercure.
21

Dans les années 80, les utilisations du mercure dans les pays de l’OCDE serépartissaient de la façon suivante, en pourcentages moyens de l’utilisation totale :
• piles, 25 pour cent ;• industrie du chlore et de la soude, 28 pour cent ;• équipements électriques et appareils de mesure, 16 pour cent ;• peintures, 10 pour cent ;• amalgames dentaires, 7 pour cent ;• tous autres usages, comme les thermomètres et les équipements de laboratoire,
14 pour cent.
L’utilisation de mercure dans les pays de l’OCDE a diminué au cours de ces quinzedernières années pour la plupart des produits. Les quantités de mercure utilisées, parexemple, dans les piles, les peintures et l’enrobage de semences se sont sensiblementréduites.
2. Rejets dans l’environnement
Les rejets de mercure dans l’environnement peuvent être d’origine naturelle (parexemple, dépôts géologiques, volcanisme) ou provenir de sources liées à l’activité humaine,comme l’industrie, la production d’énergie et l’utilisation et l’élimination de produits deconsommation.
Le mercure rejeté dans l’environnement, que ce soit dans l’air, dans l’eau ou dansla terre, peut provenir des sols et de la végétation, des incendies de forêt, de la surface deseaux, de sources géologiques (telles qu’érosion de la croûte terrestre, volcanisme,tremblements de terre) et du dégazage de la croûte terrestre, aussi bien que d’activitéshumaines, comme l’industrie, la production d’énergie et l’utilisation et l’élimination de produitsde consommation.
Divers chercheurs ont procédé à une estimation globale des quantités de mercureémises naturellement chaque année. Les évaluations diffèrent de plusieurs ordres degrandeur, suivant les sources naturelles considérées et les méthodes de calcul utilisées. Lesconcentrations de mercure dans divers milieux dues aux sources naturelles et anthropiquesétant extrêmement variables, on peut s’attendre à des émissions atmosphériques égalementvariables.
En 1983, les évaluations globales des émissions dues à l’activité humaine serépartissaient de la façon suivante :
• 3 600 tonnes dans l’air ;• 4 600 tonnes dans l’eau, y compris les retombées atmosphériques ;• 8 300 tonnes dans le sol, y compris les retombées atmosphériques.
Des évaluations plus récentes donnent une diminution des émissions dues à l’activitéhumaine par rapport aux estimations antérieures. La diminution est imputable à des progrèstechnologiques et à une moindre utilisation du mercure. Elle est également due à la méthodede calcul des facteurs d’émission.
22

Les évaluations des émissions atmosphériques aux Etats-Unis et dans l’Unioneuropéenne montrent que les sources les plus importantes sont d’abord la combustion decharbon puis l’incinération des déchets solides. Au total, les rejets les plus importants verstous les milieux sont dûs à l’activité industrielle. Les produits qui contiennent du mercurepeuvent entraîner, après épandage ou incinération, des rejets dans l’air, l’eau ou le sol. Cesémissions sont cependant difficiles à chiffrer, car on connaît mal les processus qui régissentla libération du mercure.
Les activités d’extraction et de production de métal s’accompagnent de rejets dansle sol, tandis que dans certains pays comme le Brésil, l’utilisation de mercure pour l’extractionde l’or a entraîné une pollution par le mercure à grande échelle.
Le procédé industriel le plus important en termes d’émissions de mercure est laproduction de chlore et de soude. Mais aujourd’hui, la plus grande partie des émissions estconvertie en déchets solides qui sont éliminés conformément aux réglementations applicablesaux déchets toxiques. La sidérurgie et le secteur des engrais sont surtout confrontés àl’élimination de déchets solides qui contiennent du mercure.
Il existe d’autres émissions comme, par exemple, celles qui proviennent desétablissements dentaires et des crématoires.
Lorsque les déchets industriels solides et les déchets de produits de consommationcontenant du mercure ne sont pas recyclés ou réutilisés, ils sont éliminés en général dans desdécharges ou dans des incinérateurs. Pendant de nombreuses années, les piles à usagedomestique ont constitué la source la plus importante de mercure dans les produits de rebutou usagés. L’incinération des ordures ménagères aux Etats-Unis est évaluée par US EPA à22 pour cent du rejet total vers l’atmosphère. Une évaluation faite par l’industrie qui tientcompte de la technologie de contrôle en oeuvre dans chacun des incinérateurs municipauxétudiés arrive à 14 pour cent. Dans l’Union Européene les rejets dûs à l’incinération desordures ménagères sont évalués à 32 pour cent du rejet total tandis que les incinérateurséquipés d’installations d’épuration des gaz contribueraient que 8 pour cent. Lorsque lesordures ménagères sont éliminées dans des décharges, elles peuvent donner lieu à desémissions de mercure vers les eaux souterraines ou vers l’atmosphère. La concentration demercure dans les ordures ménagères devrait se réduire sensiblement dans les dix prochainesannées à la suite de la diminution que devrait connaître l’utilisation du mercure dans les pilesà usage domestique.
3. Relations avec l’exposition
Une fois libéré dans l’environnement, le mercure se répartit dans les divers milieuxentre lesquels il est constamment remis en circulation. Il est plus mobile que les autresmétaux lourds. En outre, le mercure inorganique peut être méthylé sous l’effet de l’activitémicrobienne et prendre une forme organique plus toxique qui est également transférable dansl’environnement, ce qui aboutit à une bio-accumulation et à une bio-amplification dans lesorganismes vivants.
Le mercure dû à l’activité humaine est libéré dans l’atmosphère sous forme demercure élémentaire ou de composés mercuriels gazeux ou particulaires. Le mercureélémentaire peut être transporté sur de longues distances, tandis que les composésmercuriels se déposent pour la plupart à moins de 100 kilomètres de la source.
23

On estime, en général, que la plus grande partie du mercure présent dansl’atmosphère est sous forme de vapeur de mercure élémentaire. Celui-ci est éliminé del’atmosphère sous forme de dépots secs et humides.
Le mercure déjà déposé et le mercure naturel présent dans l’environnement peuventêtre à nouveau volatilisés à partir des océans (et des lacs) aussi bien qu’à partir des sols.Toutefois, trop peu de mesures ont été effectuées jusqu’à présent pour que l’on puisse établirdes conclusions générales sur les flux de mercure dans l’environnement à une échellerégionale (ou plus large).
Le principal effet négatif de la pollution de l’environnement par le mercure est labio-amplification du méthylmercure dans les chaînes alimentaires aquatiques. Le demi-tempsde séjour du méthylmercure dans les organismes vivants est de l’ordre d’une année. En milieuaquatique, le mercure s’accumule dans les organismes vivants à des concentrations quiaugmentent avec le temps, et gagne des niveaux trophiques plus élevés.
Ces problèmes ont été à l’origine d’un effort très important visant à élucider lesmécanismes qui régulent l’absorption de méthylmercure chez le poisson. Il reste cependantbeaucoup à faire avant d’établir définitivement les flux quantitatifs provenant de différentessources et aboutissant aux poissons.
Les concentrations de mercure dans les eaux de surface de l’Atlantique Nord-ouestsont plus élevés que dans le Pacifique Nord-ouest.
Des études récentes ont montré que le mercure présent dans les sols forestiers peutdevenir mobile et être entraîné par le ruissellement ou les inondations vers les eaux desurface. Ce phénomène peut conduire à des concentrations de mercure élevées dans lachaîne alimentaire, en particulier chez les poissons et cela même dans les lacs éloignés dessources d’émission.
Des études, réalisées notamment au Canada, ont montré que les terres dont lesconcentrations naturelles de mercure sont vraisemblablement fortes produisent, en casd’inondation, des taux élevés de méthylation du mercure, entraînant par la suite une forteaccumulation de mercure chez les poissons.
Les sédiments du milieu aquatique constituent un piège majeur pour le mercure.Cependant, du fait de la méthylation du mercure par des micro-organismes des sédiments,le mercure peut être à nouveau libéré, aussi bien vers l’eau que vers l’atmosphère.
On constate un échange dynamique de composés mercuriels volatils entrel’atmosphère et le sol, essentiellement sous forme de mercure élémentaire, qui est facilementabsorbé par les matières organiques du sol, bien qu’il soit susceptible d’être libéré à nouveauà partir de certains sols.
Etant donné la très grande affinité de plusieurs composés mercuriels pour lesmatières organiques des sols, on estime que les pertes par lixiviation vers des horizons dusous-sol, vers les eaux souterraines ou vers les eaux de surface, devraient être faibles dansle cas des sols courants.
24

De plusieurs études faites en Europe, aux USA et au Canada, il ressort uneaugmentation des concentrations de mercure dans l’environnement. Les scientifiques débatentdes parts respectives à attribuer aux émissions naturelles et anthropiques.
Pour l’ensemble de la population humaine, les principales voies d’absorption demercure sont l’alimentation et les amalgames dentaires. Le poisson et les produits à base depoisson sont la principale source d’exposition de l’être humain (et d’absorption), en raison dela rétention élevée du méthylmercure. Cependant, une absorption non négligeable de vapeurde mercure élémentaire, accompagnée d’une rétention élevée, peut intervenir du fait desamalgames dentaires, en fonction du nombre de plombages. L’exposition à des composésinorganiques du mercure est essentiellement due aux denrées alimentaires, autres que dupoisson, et contenant peu de mercure.
4. Positions adoptées au niveau international et national quant aux risquesimputables au mercure.
Ce chapitre contient les évaluations des risques liés au mercure établies dans lecadre du Programme international sur la sécurité des substances chimiques (PISSC).
On trouvera également dans ce chapitre des déclarations provenant de paysMembres relatifs à l’attitude adoptée actuellement par les divers pays vis-à-vis des risquesliés au mercure. Pour l’essentiel, ces déclarations donnent les raisons à la base de toutedisposition prise par un pays donné pour faire face aux effets associés à l’exposition del’environnement ou de l’être humain au mercure. Les évaluations et les descriptionsnationales des risques qui ont conduit les pays à prendre des mesures ont un caractèreprofondément national. Les pays n’ont défini leur position sur la nécessité de lancer desactivités de réduction des risques qu’après avoir analysé le danger que présentaient certainesexpositions, ainsi que leur ampleur, et avoir pris en compte des considérations locales d’ordresocial, économique et politique. Comme ces positions sont habituellement établies après undébat approfondi sur les nombreux facteurs impliqués, il ne faut par conséquent pas s’attendreà ce qu’elles soient homogènes entre les différents pays Membres.
Certaines pays ont la conviction qu’il faut limiter l’utilisation du mercure et desproduits le contenant afin de réduire les émissions dans l’environnement et par la même lesrisques pour la santé humaine. D’autres pays pensent que, pour réduire les risques tant pourla santé humaine que pour l’environnement, il suffit de contrôler les voies d’exposition les plusimportantes.
5. Dispositifs pour la réduction des risques
De nombreux pays Membres ont pris des mesures pour réduire les risques liés aumercure. Tous les pays Membres ont été invités en 1993-1994 à fournir des informations surleurs activités visant à réduire de tels risques. Les points de vue nationaux présentés dansce chapitre sont essentiellement fondés sur les réponses obtenues.
25
La majorité des pays Membres ont fourni des réponses. D’une façon générale, onpeut en conclure que :
• tous les pays disposent d’une législation/réglementation nationale relative auxémissions de mercure dans l’air, l’eau et le sol ;
• le mercure est interdit dans les enrobages des semences pour pratiquementtoutes les utilisations ;
• l’utilisation de mercure dans les peintures a été interdite dans la plupart des paysde l’OCDE ;
• plusieurs pays ont limité ou interdit l’utilisation de mercure dans les thermomètres ;
• quelques pays vont interdire l’utilisation du mercure dans les amalgamesdentaires vers la fin de ce siècle ;
• à l’heure actuelle, on peut fabriquer des piles tous usages sans mercure ;
• presque tous les pays ont pris des mesures dans le but de diminuer les risquesqu’encourent les travailleurs exposés ;
• presque tous les pays ont adopté des critères ou des normes pour le contenueen mercure du possion et des denrées alimentaires ;
• certaines pays ont adopté des critères ou des normes pour le taux de mercuredans les boues d’épuration appliquées sur les terres agricoles ;
• des pays ont developpé des bases de données nationales ou régionales (parexample pour les sédiments et les poissons) afin d’identifier des zônes où lestaux de métaux sont élevés ;
• quelques pays appliquent une interdiction générale à l’utilisation du mercure, avecdiverses exceptions ;
• plusieurs pays participent à des accords multilatéraux visant à réduire les apportsde mercure dans le milieu marin.
Quelques mesures nationales de réduction des risques sont récapitulées dans lasérie de tableaux annexée à ce chapitre. L’absence d’informations pour un pays Membredonné ne signifie pas que ce pays ne consacre pas d’activités à la réduction des risques liésau mercure.
26

CHAPTER 1
MERCURY’S PROPERTIES, PRODUCTIONAND USES
1.1 Physical and chemical properties
The physical and chemical properties of mercury are summarized in IPCSEnvironmental Health Criteria document No. 86 as follows:1
Mercury can exist in a wide variety of physical and chemical states. The differentchemical and physical forms of this element all have their intrinsic toxic properties and differentapplications in industry and agriculture, and require a separate assessment of risk.
Mercury, along with cadmium and zinc, falls into Group IIb of the Periodic Table. Inaddition to its elemental state, mercury exists in the mercury (I) and mercury (II) states in whichthe mercury atom has lost one and two electrons, respectively. The chemical compounds ofmercury (II) are much more numerous than those of mercury (I).
In addition to simple salts, such as chloride, nitrate and sulphate, mercury (II) forms animportant class of organometallic compounds. These are characterized by the attachment ofmercury to either one or two carbon atoms to form compounds of the type RHgX and RHgR’where R and R’ represent the organic moiety. The most numerous are those of the type RHgX.X may be one of a variety of anions. The carbon-mercury bond is chemically stable. It is notsplit in water nor by weak acids or bases. The stability is not due to the high strength of thecarbon-mercury bond, but to the very low affinity of mercury for oxygen. The organic moiety,R, takes a variety of forms, some of the most common being the alkyl, the phenyl, and themethoxyethyl radicals. If the anion X is nitrate or sulphate, the compound tends to be "salt-like",having appreciable solubility in water; however, the chlorides are covalent, non-polar compoundsthat are more soluble in organic solvents than in water. From the toxicological standpoint, themost important of these organometallic compounds is the subclass of short-chain alkylmercurials in which mercury is attached to the carbon atom of a methyl, ethyl, or propyl group.
1.2 Production
The major mercury deposits are commonly formed at comparatively shallow depths (afew metres to over 700 metres). Exploitation of the great majority of mercury deposits is byunderground mining methods; the deposits are usually too small and irregular for open-pitmining to be economical. The milling of the ore consists in crushing, followed sometimes by
1 IPCS (International Programme on Chemical Safety), Environmental Health Criteria 86:Mercury – Environmental Aspects, Geneva, 1989, page 12.
27

screening. Where the ore grade is less than about 2 g/kg, the ores may be beneficiated byflotation. Roasting of the ores is so efficient in extracting the mercury, however, thatbeneficiation is not widely used.
The usual mercury extraction process consists in heating the ore or concentrate inretorts or furnaces to liberate the mercury vapour, followed by condensation of the vapour(Nriagu 1979).
Mercury production has declined steadily in the last 20 years (Figures 1.1 and 1.2) .Worldwide primary production decreased from 10,000 metric tonnes in 1970 to 5500 metrictonnes in 1990. This figure was expected to be even lower in 1991.
There is significant secondary production of mercury. In 1982, the OECD (1985)estimated it to be as much as 40 per cent of primary production. Secondary production includesrecycling, recovery, and industrial reprocessing of mercury. The extent of recent secondaryproduction has not been possible to quantify; however, it should be noted that secondaryproduction does not add new mercury into society, but rather adds to the flow of mercury. Inthe United States, secondary industrial production varied between 10 and 20 per cent of totalmercury consumption in 1985-89 (Minerals Yearbook 1989).
Stockpiles of mercury in the United States are maintained for strategic defensepurposes by the National Defense Stockpile (NDS) and the Department of Energy (DOE). NDSlegislation enacted in 1992 authorizes the disposal of the entire amount of mercury stocks fromthe NDS. This mercury is to be reused over a period of years, in accordance with the legislativemandate that the sale be carried out in such a manner as to avoid undue disruption of the usualmarkets of mercury producers, processors and consumers. At the end of 1993, there was anestimated 4466 metric tonnes of mercury in the NDS groups (United States Department ofCommerce 1993).
As can be seen in Figure 1.3 , the decrease in production of mercury since the early1970s has been accompanied by a price decrease (British Geological Survey 1990). Such adecrease will have an influence on the attractiveness of secondary production (i.e. recycling)of mercury.
28

Figure 1.1 Primary Production of Mercury, 1925-1987
(tonnes per year, from Mineral Yearbook, 1972-1989)
29

Figure 1.2 Production of Mercury from Ores and Concentrates
(metric tonnes, from Metallgesellschaft 1992, based on figures in Appendix 1)
30

Figure 1.3 World Production of Mercury Compared with the AnnualAverage Price in the United States
(according to Metals Week, expressed in constant 1985 US dollars;from British Geological Survey, World Mineral Statistics 1988 to 1989)
31
1.3 Uses
The main uses of mercury vary among countries; however, based on the responsesto an OECD questionnaire submitted to Member countries (Appendix 2) the general range ofconsumption patterns for 1988-92 can be stated as follows (Appendix 3):
• batteries, range 3 to 69 per cent (average 25 per cent);• chlor-alkali industry, range 2 to 78 per cent (average 28 per cent);• electrical equipment and measurement equipment, range 1 to 50 per cent
(average 16 per cent);• paint, range 0.1 to 16 per cent (average 10 per cent);• tooth fillings, range 2 to 51 per cent (average 7 per cent);• all other uses, such as thermometers, laboratory uses, and others,
average 14 per cent.
Figure 1.4 shows the relative consumption of mercury-containing batteries, toothfillings and chlor-alkali compared with other mercury-containing products within each country.For example, the consumption of mercury-containing batteries in the United Kingdom makesup 18 per cent of the total consumption of mercury-containing products in that country.Figure 1.5 compares the total consumption of mercury-containing batteries, tooth fillings andchlor-alkali in tonnes across major regional areas. The figures are based on data inAppendix 2 and Appendix 3
In OECD countries (Appendix 2) the main uses of mercury-containing products havedecreased over the last 15 years. In Denmark the use of mercury decreased from 30 tonnesper year in 1977-78 to 16 tonnes in 1982-83, and a further reduction to about 10 tonnes wasestimated for 1990. In France, consumption decreased from 300 tonnes per year in 1970 to100 tonnes in 1985-87 (Cossa et al. 1990), with a further reduction to 61.2 tonnes in 1990-92(Appendix 2).
The figures from Norway demonstrate that mercury consumption was reduced from8.7 tonnes in 1985 to less than 3.7 tonnes in 1988-90. In Switzerland the consumption ofmercury decreased from 20 tonnes in 1986 to 10 tonnes in 1990. Similar reductions havetaken place in the Netherlands, where consumption was halved between 1980 and 1989.
Currently, use in the chlor-alkali industry, in batteries, and in the electronics industrytaken together account for most mercury consumption.
As the United States is one of the largest users of mercury-containing products, theshift in use patterns in that country is of particular significance. As can be seen in Figure 1.6 ,the use of mercury-containing products in 1990 was reduced by a factor of 3.6 from a highin 1968. One important reason for this decline is the fact that mercury was no longer usedin agriculture, amalgamation, the pulp and paper industry, and the pharmaceutical industry.Electrical equipment, batteries and the chlor-alkali industry each still account for one third ofconsumption. Paint accounted for up to 18 per cent until 1990, when a drastic decrease tookplace due to new restrictions on mercury use in paints. Battery use shows a substantialdownward trend from 1989 to 1990, whereas other uses show smaller changes since 1984(Mineral Yearbook 1986, 1989, 1990; also see Appendix 4).
32

Figure 1.4 Relative Consumption of Mercury (1988-1992) in Different Countries
(per cent, based on figures in Appendix 3)
33

Figure 1.5 Use Categories of Mercury (1988-1992) in Batteries,Tooth Filling and Chlor-alkali Production
(metric tonnes per year, based on figures in Appendix 2)
34

Figure 1.6 Use of Mercury in the United States
(metric tonnes per year, based on figures in Appendix 4)
35

36

CHAPTER 2
ENVIRONMENTAL RELEASES
2.1 Introduction
Environmental releases of mercury can be natural in origin (e.g. degassing fromgeological mineral deposits, volcanic activities) or can occur from anthropogenic sources suchas industrial activities, energy production, and the use and disposal of consumer products.
2.2 Natural emissions
Natural emissions of mercury into air, water or land originate from soils andvegetation, and from forest fires, water surfaces, and geological sources (such as crustalweathering and degassing, volcanic activities, and earthquakes).
Various researchers have estimated the global annual natural emissions of mercury.Estimates vary over several orders of magnitude depending on the natural sources includedin the estimate and the method of calculation. Estimates for natural emissions to air haveranged from 2500 to 125,000 tonnes per year. However, the concentrations of mercury invarious compartments from natural and anthropogenic sources are highly variable. It wouldtherefore be expected that the emissions to air would also be highly variable.
The most recent estimates are summarized in Table 2.1 , which shows a reasonableagreement of the size of the natural, atmospheric emissions. The estimates vary dependingon the relative contribution and importance placed on natural processes which emit mercuryto the atmosphere.
According to Lindqvist et al. (1991) there are four main natural processes by whichmercury is emitted to the atmosphere. These are:
• degassing from geological mineral deposits;
• emissions from volcanic activities;
• photoreduction of divalent mercury in natural waters;
• biological formation from methylmercury of elemental mercury or perhapsdimethylmercury.
37

Table 2.1 Estimates of Fluxes of Mercury to the Global Atmosphere
(metric tonnes of mercury per year)
Process Lindqvist et al.1984
Nriagu andPacyna 1988,Nriagu 1989
Fitzgerald1986
Lindqvist et al.1991
Anthropogenicemissions
2000-10,000 3560 (910-6200) 2000 4500 (3000-6000)
Naturalemissions
<15000 2500 (100-4900) 3000-4000 3000 (2000-9000)
Total presentemissions
2000-<25,000 6060 (1010-11,100)
5000-6000 7500 (5000-15,000)
Other studies indicate that mercury can also be released by:
• volatilization from soil (Rundgren et al. 1992);
• seismic activities like earthquakes (Varshal et al. 1985);
• geothermal sources, including oceanic crust in connection with submarinevolcanoes (Varekamp and Buseck 1986);
• crustal degassing in zones of high permeability created by faults and fractures(Stepanov and Vil d’Yayev 1984, Rasmussen 1993).
The relative significance of natural sources is reflected by the background content ofmercury in the environment. With regard to land, the crustal average abundance of mercuryis estimated at 0.08 mg/kg (Taylor 1964), which could be translated into approximately32 million metric tonnes of mercury within the first metre of rock of the earth’s continents(Garrett 1994). The concentration of the mercury in the crust varies according to a numberof factors such as rock type, as shown in Appendix 5. There are limited estimates of mercuryemissions to water, soil and vegetation from the natural weathering of the earth’s crust.However, the concentration of mercury in various compartments (e.g. soil, peat, natural gas,etc.) in nature are significant and can be highly variable, as shown in Appendix 6. Therefore,annual estimates of mercury releases that do not account for natural sources can beconsidered to be low.
It is difficult to estimate the global importance of the geochemical activities aspotential sources of releases of mercury to the environment, since the studies do not giveglobal figures for mercury fluxes. There are many reported cases of high mercuryconcentrations in local hot spots (Appendix 6), for example the geothermal fields in Iceland.The annual flux from one field with such data was only 8 kg (Edner et al. 1991).
38

2.3 Anthropogenic emissions
2.3.1 Worldwide emissions
Due to the complexity of identifying anthropogenic sources and possible emissionrates, estimates of worldwide emissions are extremely difficult to make. Using 1983 data,Nriagu and Pacyna (1988) estimated worldwide anthropogenic air emissions of mercury to be3600 tonnes in 1983. This compares with anthropogenic emissions from all sources to waterand soil, including atmospheric fall-out, of about 4600 and 8300 metric tonnes, respectively,(this does not include disposal of mine tailings, smelter slags and waste). On a global scalethe major air inputs originate from coal combustion and incineration of solid waste products,whereas the major input to water is from manufacturing processes (Table 2.2) .
Nriagu and Pacyna (1988) looked at the man-induced mobilization of mercury into thebiosphere (the terrestrial plus aquatic inputs), also for 1983, and estimated this total to beapproximately 11,000 metric tonnes per year; this figure includes totals for mine tailings,smelter slags and waste, which equal approximately 1800 tonnes.
The latest comparable estimate for the global increase in mercury mobilization is5000 metric tonnes per year (Lindqvist et al. 1991).
The latest global figures for natural and anthropogenic atmospheric emissions inTable 2.1 show that the two are of the same magnitude for the different authors. However,it must be assumed that the anthropogenic emissions have decreased since these estimateswere calculated due to changes in technology and the reduction in mercury use.
2.3.2 Regional emissions
In a recent report prepared for the Commission of the European Communities(Maxson et al. 1991), the mercury emissions in the EC were estimated as shown in Table 2.3 .While industrial activity and product use result in the greatest total release to all media, otheractivities may be higher within specific media (e.g. releases to air from fossil fuel burning aregreater than from industrial activity or product use). Detailed information on emissions fromthe subactivities that make up the main activities can be found in Appendix 7.
Emissions to air in the United States (Table 2.4 ) closely follow the pattern in theEuropean Union. As in the EU, emissions from fossil fuel burning (coal combustion) are themajor anthropogenic emission source to the air. Emissions from municipal solid wasteincineration in the United States are next in importance, as in the EU ("product use" inTable 2.3).
39

Table 2.2 Estimates of Worldwide Emissions of Mercuryto the Atmosphere, Soil and Water in 1983
(metric tonnes per year, from Nriagu and Pacyna 1988 and Nriagu 1989)
Sourcecategory
Atmosphere *min. max.
Watermin. max.
Soil **min. max.
Coalcombustion
650 3500 0 3600 370 4800
Non-ferrousmetal production
45 220 0 40 0 80
Refuse incinerationMunicipalSewage sludge
140 210015 60
no estimate no estimate
Wastewater no relevance 0 600 10 800
Wood combustion 60 300 no estimate no estimate
Metal mining insignificant input 0 150 no estimate
Urban refuse no estimate no estimate 0 260
Wastagecommercial prod.
no estimate no estimate 550 820
Manufacturingprocesses
no estimate 20 2300 no estimate
Atmosphericfall-out
no relevance 220 1800 630 4300
Phosphate fertilizerproduction and use
insignificant input no estimate no estimate
Agriculturalwaste
no estimate no estimate 0 1700
Logging and otherwood wastes
no estimate no estimate 0 2200
Dumpings ofsewage sludge
no relevance 10 310 no relevance
Total inputsMedian
910 62003560
300 88004600
1600 150008300
Mine tailings no estimate no estimate 550 2800
Smelter slagsand wastes
no estimate no estimate 50 280
NaturalMedian
100 49002500
no estimate no estimate
Total inputs to soils including mine tailings, smelter slags and wastes 2200 18,000
* Insignificant contributions to the atmosphere from: oil combustion, zinc-cadmium production, secondarynon-ferrous production, steel and iron manufacturing, cement production, and mobile sources.
** Landfills included.
40

Table 2.3 Mercury Emissions in the EC by Sector in 1989
(metric tonnes per year, Maxson et al. 1991)
Source/activity
Destination of immediate emissions
Air Water Land Total
Non-ferrous* 21 1 54 77
Fossil fuels 76 <1 12 88
Industrial 29 8 207 244
Product use 62 17 202 281
Other** 8 8 54 70
Total 197 35 529 760
% total 26 5 69 100
* Includes mercury mining, secondary production and non-ferrousproduction and refining.
** Includes cremation, sludge waste disposal and dredging.
2.4 Contributing anthropogenic processes
2.4.1 Release from energy production
Coal contains mercury as a natural component in trace amounts (0.04-0.7 mgmercury/kg) (Sabbioni et al. 1983 and Meij 1991). Given the large quantity of coal burned inelectrical power plants and in industrial, commercial and residential burners, considerableamounts of mercury are released to the environment.
Over the last ten to 15 years, a number of countries have shifted from the use of oilto the use of coal in energy production. This has resulted in a greater release of mercury dueto higher mercury content in coal. The difference in mercury content of these two energysources could be significant (Maxson et al. 1991). Due to the uncertainty over the actualconcentration of mercury in oil, mercury emissions from oil burning in the EU could beanywhere from 2.4 to 24 tonnes (Maxson et al. 1991). Several countries have estimated theamount of mercury in coal and oil used for energy production (Table 2.5 ). The burning of peatand wood also releases mercury to the atmosphere.
41
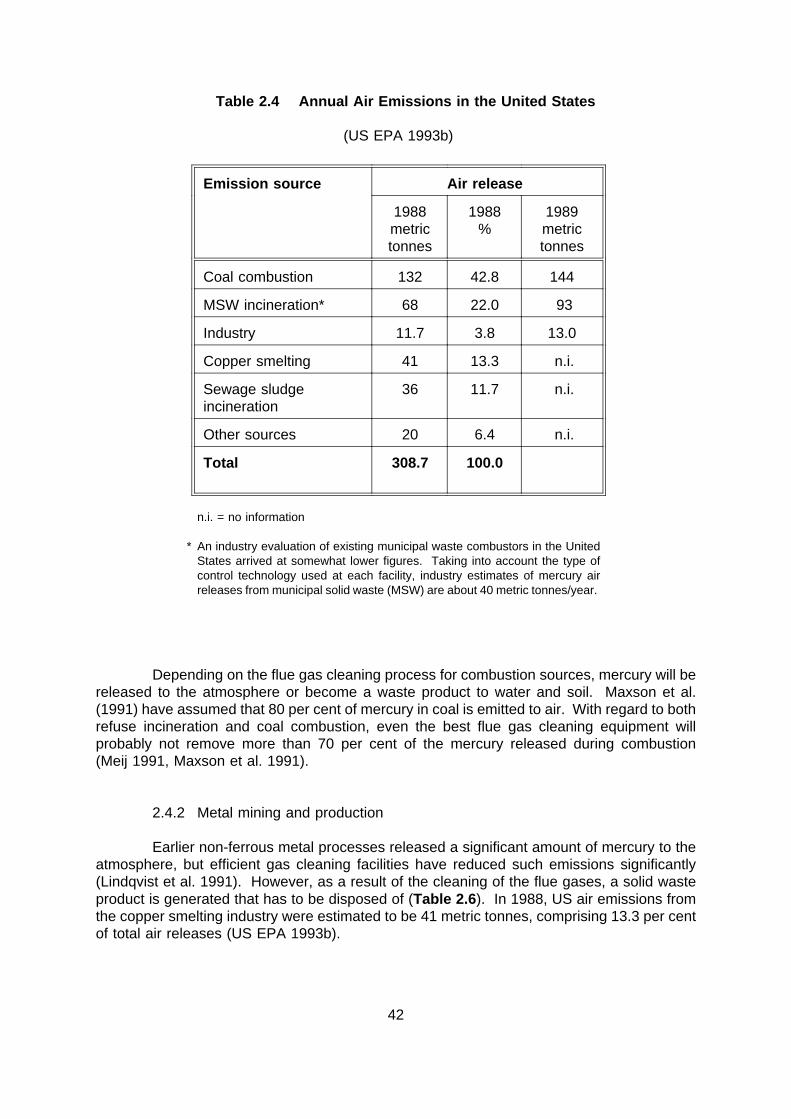
Table 2.4 Annual Air Emissions in the United States
(US EPA 1993b)
Emission source Air release
1988metrictonnes
1988%
1989metrictonnes
Coal combustion 132 42.8 144
MSW incineration* 68 22.0 93
Industry 11.7 3.8 13.0
Copper smelting 41 13.3 n.i.
Sewage sludgeincineration
36 11.7 n.i.
Other sources 20 6.4 n.i.
Total 308.7 100.0
n.i. = no information
* An industry evaluation of existing municipal waste combustors in the UnitedStates arrived at somewhat lower figures. Taking into account the type ofcontrol technology used at each facility, industry estimates of mercury airreleases from municipal solid waste (MSW) are about 40 metric tonnes/year.
Depending on the flue gas cleaning process for combustion sources, mercury will bereleased to the atmosphere or become a waste product to water and soil. Maxson et al.(1991) have assumed that 80 per cent of mercury in coal is emitted to air. With regard to bothrefuse incineration and coal combustion, even the best flue gas cleaning equipment willprobably not remove more than 70 per cent of the mercury released during combustion(Meij 1991, Maxson et al. 1991).
2.4.2 Metal mining and production
Earlier non-ferrous metal processes released a significant amount of mercury to theatmosphere, but efficient gas cleaning facilities have reduced such emissions significantly(Lindqvist et al. 1991). However, as a result of the cleaning of the flue gases, a solid wasteproduct is generated that has to be disposed of (Table 2.6 ). In 1988, US air emissions fromthe copper smelting industry were estimated to be 41 metric tonnes, comprising 13.3 per centof total air releases (US EPA 1993b).
42

Table 2.5 Amount of Mercury as Natural Constituent in Coal and OilUsed for Energy Production
(metric tonnes per year)
Rawmaterial
Denmark Finland Belgium Germany Sweden Canada
1982 1990 1987 1985 1990 1990 1988 1994
Coal 1.5 1.0 0.2 2.2-5.8 2.2-5.8 82.0-97.6 0.2 3.6*
Oil 1 1 <1.0
* Preliminary estimate for 1994. The 1982 estimate was 9 metric tonnes of mercury produced from the burningof fossil fuels (coal, natural gas, oil and derivatives).
Mining of minerals for non-ferrous metal production produces considerable amountsof tailings containing mercury which need to be disposed of. The global estimate in 1983 wasbetween 550 and 2800 metric tonnes (Nriagu and Pacyna 1988).
In Brazil mercury is still being used in gold mining, creating a mercury pollutionproblem. It has been estimated that in Brazil 58-96 tonnes is used annually for gold mining,with the consequent release of a minimum of 13 tonnes into the ecosystem (Malm et al.1990). In some former gold mining areas, mercury contamination still causes local problems.It is reported (WHO 1989) that 50,000 people may be exposed around small-scale gold miningoperations in Indonesia, Kampuchea, the Philippines, and Vietnam.
2.4.3 Other industrial processes, including the chlor-alkali industry
Table 2.7 shows the estimated mercury emissions for various industrial processesin the EC in 1989. As in the United States, the greatest number of emissions come from thechlor-alkali industry. The United States estimate for air emissions from industrial sources,excluding the chlor-alkali industry, was 11.7 metric tonnes in 1988 and 13.3 metric tonnes in1989 (US EPA 1993b). For the EC, the total figure excluding the chlor-alkali industry was6 metric tonnes in 1989. The majority of the waste from the chlor-alkali industry in theEuropean Union is disposed of in accordance with the toxic waste directive.
In 1992 the chlor-alkali industry in the EC and Scandinavia (EURO CHLOR 1994)estimated that 100 metric tonnes was disposed of in accordance with the toxic waste directive,and that 17 tonnes was released to air and 3.5 tonnes to water, which is a further reductionin comparison with the figures in Table 2.7.
Until recent years, the chlor-alkali and pulp and paper industries released significantemissions of mercury, mostly as direct discharges to soil, water, and/or air. It is estimated thatin 1960 the Swedish chlor-alkali industry released 10,000 kg mercury per year to theatmosphere. As a result of new emission control measures, by 1987 this total had beenreduced to 400 kg per year (Lindqvist et al. 1991).
43

Table 2.6 Mercury Emissions in the EC from Mercury Mining,Secondary Production and Non-ferrous Industry in 1989
(metric tonnes per year, Maxson et al. 1991)
Source/activity Air Water Land Total
Mercury mining 10 ? 20 30
Secondaryproduction
5 <1 15 21
Non-ferrousproduction/refining
6 1 19 26
Total 21 1 54 77
A chlor-alkali plant in New South Wales, Australia, disposes of approximately10 tonnes of low level immobilised brine waste annually (CEPA 1994) where mercury releaseis regulated. There are only two remaining chlor-alkali plants in Canada that use mercury, andtheir air and water releases are regulated (Environment Canada 1994).
According to US EPA, the chlor-alkali industry is the largest industrial source ofmercury releases in the United States. Referring to the 1990 US Toxics Release Inventory(TRI), the chlor-alkali facilities reported most of their quantities as off-site transfers – over 97metric tonnes. The ultimate disposition of these off-site transfers is presumably via some formof approved hazardous waste disposal. Direct releases to water and land as reported aremuch lower than air releases. In 1990 the land releases are estimated to have been 540 kg,with 360 kg as direct water releases (US EPA 1993b).
Other industrial sources of emissions include:
• the iron and steel industry, in which some of this mercury can originate from metalscrap, e.g. electrical equipment in cars;
• the fertilizer industry, in which mercury is released during the production ofsulphuric and phosphoric acid;
• the cement industry, which produces solid waste containing mercury.
In the past, the production of mercury compounds for use as seed dressings and inthe pharmaceutical industry resulted in significant emissions to air and water (e.g. Kiørboeet al. 1983). Their use as seed dressing has recently diminished or been prohibited in manycountries.
44

Table 2.7 Mercury Emissions in the EC from Industrial Processes in 1989
(metric tonnes per year, Maxson et al. 1991)
Industry Air Water Land Total
Chlor-alkali 23 5 150 178
Iron/steel 4 2 28 34
Fertilizer <1 1 3 4
Cement <1 no estimate 26 28
Total 29 8 207 244
2.4.4 Miscellaneous releases
In addition to the uses described above and emissions related to the manufacture,use, and disposal of mercury-containing products, there are a number of sources of environ-mental contamination by mercury. One example is the use of mercury in tooth fillings, whichleads to release of mercury from dental clinics. Another is release from crematoria (mercuryin tooth fillings).
2.4.5 Recycling
At present, recycling of mercury from scrap produced during industrial processes isquite extensive. However, recycling of mercury is not economical for most consumer productsbecause mercury is only present in small amounts. One exception is the mercury oxide"button" battery – commonly used in hearing aids, medical devices and pagers – whichcontains sufficient quantities of mercury. Currently, at least three companies in the UnitedStates recover mercury from these batteries (Michigan Environmental Science Board 1993).
Many countries have collection systems for products which contain mercury (e.g.batteries); however, as indicated above, the recycling is not economical, and as a result thecollected batteries are stored at hazardous waste disposal sites.
2.4.6 Incineration/landfill
When industrial solid waste and post-consumer products that contain mercury are notrecycled or reused, they are generally disposed of in landfills or burned in incinerators. In theUnited States, the quantity of mercury in the municipal waste stream has been estimated asshown in Table 2.8 . For many years household batteries have been the largest source ofmercury in discarded or used products, followed by paint residues and pigments. Significantreductions in the level of mercury in products are foreseen by the year 2000, especially since
45
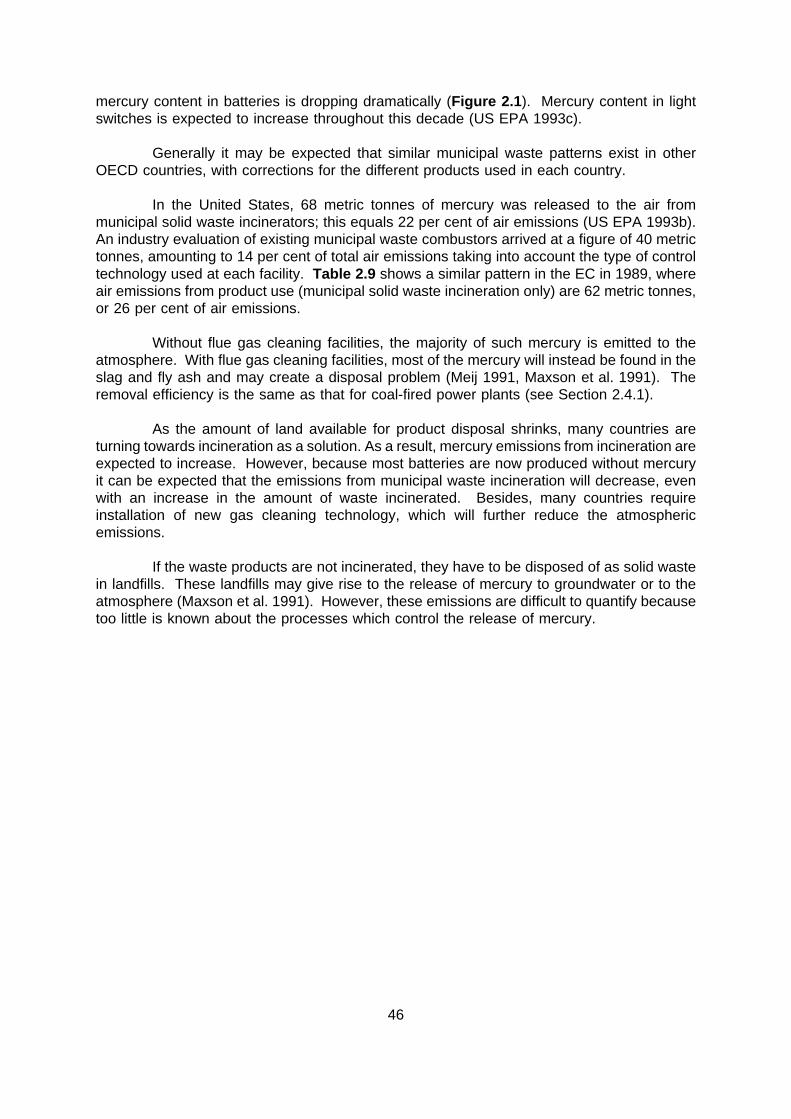
mercury content in batteries is dropping dramatically (Figure 2.1 ). Mercury content in lightswitches is expected to increase throughout this decade (US EPA 1993c).
Generally it may be expected that similar municipal waste patterns exist in otherOECD countries, with corrections for the different products used in each country.
In the United States, 68 metric tonnes of mercury was released to the air frommunicipal solid waste incinerators; this equals 22 per cent of air emissions (US EPA 1993b).An industry evaluation of existing municipal waste combustors arrived at a figure of 40 metrictonnes, amounting to 14 per cent of total air emissions taking into account the type of controltechnology used at each facility. Table 2.9 shows a similar pattern in the EC in 1989, whereair emissions from product use (municipal solid waste incineration only) are 62 metric tonnes,or 26 per cent of air emissions.
Without flue gas cleaning facilities, the majority of such mercury is emitted to theatmosphere. With flue gas cleaning facilities, most of the mercury will instead be found in theslag and fly ash and may create a disposal problem (Meij 1991, Maxson et al. 1991). Theremoval efficiency is the same as that for coal-fired power plants (see Section 2.4.1).
As the amount of land available for product disposal shrinks, many countries areturning towards incineration as a solution. As a result, mercury emissions from incineration areexpected to increase. However, because most batteries are now produced without mercuryit can be expected that the emissions from municipal waste incineration will decrease, evenwith an increase in the amount of waste incinerated. Besides, many countries requireinstallation of new gas cleaning technology, which will further reduce the atmosphericemissions.
If the waste products are not incinerated, they have to be disposed of as solid wastein landfills. These landfills may give rise to the release of mercury to groundwater or to theatmosphere (Maxson et al. 1991). However, these emissions are difficult to quantify becausetoo little is known about the processes which control the release of mercury.
46

Table 2.8 Discards of Products Containing Mercury in theMunicipal Solid Waste Stream 1970-2000 (United States)
(discards before recovery in metric tonnes, US EPA 1993c)
Products1970 1980 1989 2000 estimate
tonnes % tonnes % tonnes % tonnes %
Household batteries 282 73.7 389.6 78.4 563.6 87.6 89.4 57.0
Electric lighting 17.3 4.5 22.0 4.4 24.2 3.8 37.2 23.7
Paint residues 27.4 7.2 24.2 4.9 16.5 2.6 0.4 0.3
Fever thermometers 11.1 2.9 23.3 4.7 14.8 2.3 15.2 9.7
Thermostats 4.8 1.3 6.4 1.3 10.2 1.6 9.3 6.0
Pigments 29.3 7.7 20.9 4.2 9.1 1.4 1.4 0.9
Dental uses 8.4 2.2 6.4 1.3 3.6 0.6 2.1 1.3
Special paper coatings 0.1 0 1.1 0.2 0.9 0.1 0 0
Mercury light switches 0.4 0.1 0.4 0.1 0.4 0.1 1.7 1.1
Film pack batteries 1.9 0.5 2.6 0.5 0 0 0 0
Total discards 382.7 100 496.7 100 643.2 100 156.7 100
47

Figure 2.1 Elimination of Mercury from General Purpose Batteries(Europile, 1992)
48

Table 2.9 Mercury Emissions in the EC from Product Use in 1989
(metric tonnes per year, Maxson et al. 1991)
Product use Air* Water Land Total
Batteries 33 <1 100 133
Dentalamalgams
8 14 24 46
Electrical lightingand equipment
10 <1 30 40
Measuringand controlinstruments
6 <1 19 25
Laboratoryapplications
1 1 6 8
Phosphatefertilizers
no estimate no estimate 11 11
Industrialcatalyst
4 <1 12 16
Total 62 17 202 281
* From municipal solid waste incineration. Only 8 per cent of incinerators have gas-cleaning technology.
49

50

CHAPTER 3
LINKAGES TO EXPOSURE
3.1 Introduction
Mercury is an element which, after its release into the environment, is distributed andcontinuously redistributed between and within environmental compartments. Compared withthe other heavy metals, it is more mobile and therefore can be released to the atmosphereor to the aquatic environment again. Further, inorganic mercury may be methylated bymicrobial activity to a more toxic organic form that is also transferable in the environment,especially giving rise to bioaccumulation and biomagnification in living organisms.
Methylation of inorganic mercury takes place through the transfer of the carbanionCH3
- to the Hg2+ ion, and occurs in nature through both biotic and abiotic processes. Mercurymethylation occurs independently of whether the source of the Hg2+ ion is geological oranthropogenic.
3.2 Mercury concentrations
Typical concentrations of mercury in the different compartments in the environmentare shown in Table 3.1 (Craig 1988). High concentrations of mercury have been found in thedifferent compartments around point sources and in sediments and biota in estuaries. Furtherinformation about mercury concentrations in different matrices can be found in Appendices 5and 6. Further results will be discussed in the following sections.
3.3 Behaviour and occurrence in air
Natural and anthropogenic emissions of mercury to air contain many differentchemical forms, depending on the type of diffuse sources. Elemental mercury and differentforms of divalent mercury in gaseous or particulate phases are those most frequently emittedto air. The elemental mercury will add to the atmospheric background concentration and bespread widely by long-range transport. Apart from the magnitude of emissions, speciation isthe most important factor in determining the radius of influence of mercury emissions from apoint source (Lockeretz 1974). The divalent gasses and particulate matter will have atendency to be deposited within 100 km or less of the points of emission (Semb and Pacyna1988). Two recent studies showing increasing areal concentration gradients in proximity toa chlor-alkali plant and a municipal waste incinerator demonstrated a radius of impact of 1 kmand 1.7 km, respectively (Calasans et al. 1993, Carpi et al. 1994). However, a smaller fraction
51

of divalent and particulate mercury is distributed up to 1000-2000 km from the source areasand is also important for long-range transport of anthropogenic mercury (Lindqvist et al. 1991).
The emissions of oxidized divalent mercury compounds come from several sources,such as chlor-alkali plants and coal and refuse combustion. Elemental mercury is oxidizedin the atmosphere by ozone and other oxidants.
The emissions of mercury, for example from land, crustal degassing, vegetation, andwater surfaces, are assumed to be mainly elemental mercury. The dominant fraction ofatmospheric mercury is generally assumed to be in the form of elemental mercury vapour, witha mean atmospheric residence time in the range of a few months to two years (Lindqvist andRodhe 1985, Slemr et al. 1985). Mercury is removed from the atmosphere by dry and wetdeposition. Particulate and oxidized forms may also be present in minor quantities comparedwith elementary mercury, but are much more readily removed from the air by wet or drydeposition.
The formation of the elemental mercury is expected to be due to both biotic andabiotic processes. Elemental mercury and dimethylmercury are the principal candidates forvolatilization (emission and/or re-emission) into the atmosphere from natural waters and fromsoil surfaces.
Total vapour phase mercury fluxes (Table 3.2) from agricultural and forest soils aresubstantially smaller (by a factor of six) than those from the surface of a lake (Schroeder etal. 1989). The authors conclude that these measurements are still too few in number to drawgeneral conclusions about mercury fluxes in the environment on a regional (or larger) scale.Kim et al. 1993 have measured mercury volatilization over polluted soil and natural soil(Table 3.2) and found significant differences in the fluxes. Over the natural soils bothemission and deposition were measured. They conclude that the strength of mercuryemissions can be greatly influenced by the combined effects of surface temperature, residencetime of air masses over the source area, and turbulence conditions.
The volatilization of mercury from the ocean has been modelled by Bayens et al.1991. They found very variable volatilization rates, depending on the wind speed. Forexample, at a wind speed of 2.8 metres/second they calculated a volatilization rate of 0.05-0.7 ng mercury/m2/year, and at a wind speed of 54 metres/second they calculated avolatilization rate of 1.2-18 ng mercury/m2/year. They further conclude that these data do notallow extrapolations on longer time scales, since they have no ideas about the evolution ofthe elemental mercury gradient from water to the atmosphere.
The magnitude of the emissions and deposition are similar, leading to a stableatmospheric concentration (Lindqvist and Rodhe 1985, Fitzgerald 1986). However, it hasbeen demonstrated in a sampling programme for total gaseous mercury over the AtlanticOcean that the concentrations of total mercury in the atmosphere increased from 1977 to 1990by 1.46 per cent ± 0.17 per cent per year in the northern hemisphere, and by 1.17 per cent± 0.16 per cent in the southern hemisphere (Slemr and Langer 1992). The authors suggestthat this indicates anthropogenic sources, rather than natural sources, are at present moreimportant in the mercury cycle.
52
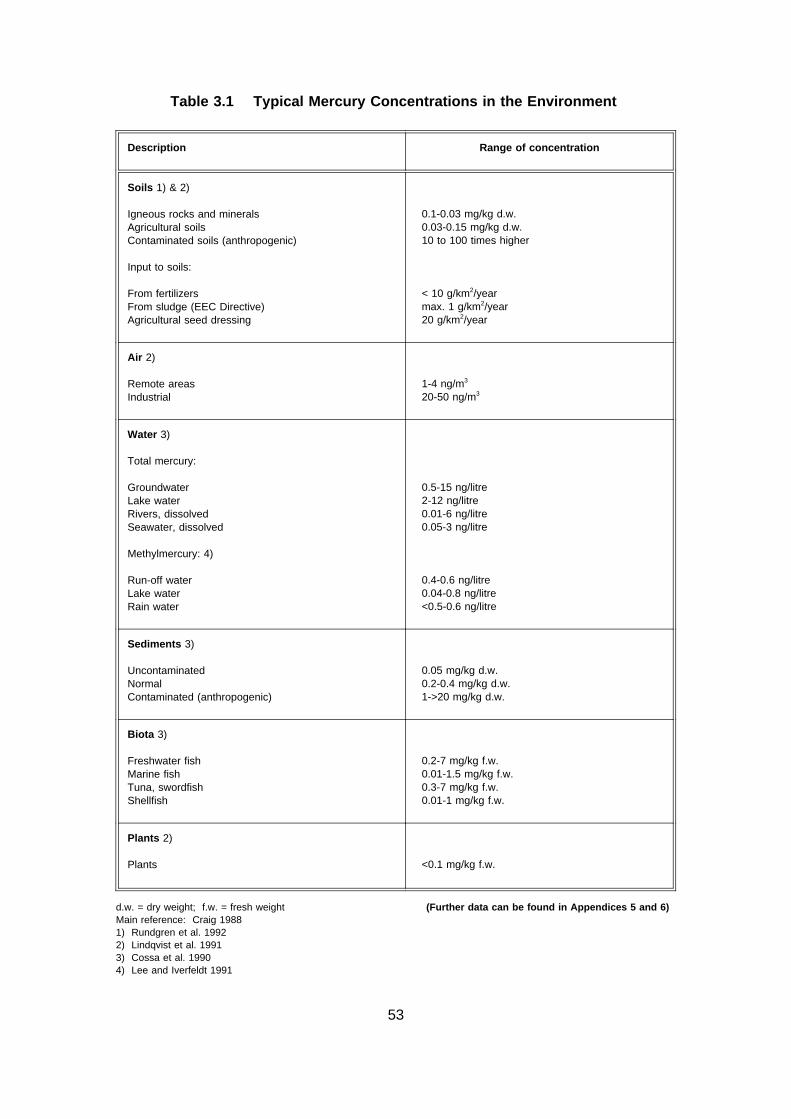
Table 3.1 Typical Mercury Concentrations in the Environment
Description Range of concentration
Soils 1) & 2)
Igneous rocks and mineralsAgricultural soilsContaminated soils (anthropogenic)
Input to soils:
From fertilizersFrom sludge (EEC Directive)Agricultural seed dressing
0.1-0.03 mg/kg d.w.0.03-0.15 mg/kg d.w.10 to 100 times higher
< 10 g/km2/yearmax. 1 g/km2/year20 g/km2/year
Air 2)
Remote areasIndustrial
1-4 ng/m3
20-50 ng/m3
Water 3)
Total mercury:
GroundwaterLake waterRivers, dissolvedSeawater, dissolved
Methylmercury: 4)
Run-off waterLake waterRain water
0.5-15 ng/litre2-12 ng/litre0.01-6 ng/litre0.05-3 ng/litre
0.4-0.6 ng/litre0.04-0.8 ng/litre<0.5-0.6 ng/litre
Sediments 3)
UncontaminatedNormalContaminated (anthropogenic)
0.05 mg/kg d.w.0.2-0.4 mg/kg d.w.1->20 mg/kg d.w.
Biota 3)
Freshwater fishMarine fishTuna, swordfishShellfish
0.2-7 mg/kg f.w.0.01-1.5 mg/kg f.w.0.3-7 mg/kg f.w.0.01-1 mg/kg f.w.
Plants 2)
Plants <0.1 mg/kg f.w.
d.w. = dry weight; f.w. = fresh weight (Further data can be found in Appendices 5 and 6)Main reference: Craig 19881) Rundgren et al. 19922) Lindqvist et al. 19913) Cossa et al. 19904) Lee and Iverfeldt 1991
53

Table 3.2 Emissions of Mercury from Soil and Water Surfaces
Site ng mercury/m 2/hectare
Reference
Contaminated floodplain,Oak Ridge, Tennessee, USA
15-160 Kim et al. 1993
Natural soil,Oak Ridge, Tennessee, USA
-6-6* Kim et al. 1993
Forest soil, Sweden 1.1 ± 0.4 Schroeder et al. 1989
Lake surface, Sweden 6.3 ± 3.6 Schroeder et al. 1989
* indicating both emission and deposition fluxes
Other researchers have found that the natural background level of mercury is notconstant over large geographic areas such as the Atlantic Ocean (Buat-Menard and Duce1987). Factors which could cause natural variations include geological sources, such as theIcelandic geysers studied by Edner et al. (1991), or temperature. Lantzy and McKenzie (1979)comment that the effect of oceanic and atmospheric temperatures on biological activity andcondensation could cause increased volatilization from equatorial waters and increaseddeposition in higher latitudes.
Although there are no reliable deposition measurements to demonstrate a decreasein mercury deposition over the last 20-30 years, a decrease in deposition as a result of variouscontrol measures might have been expected in various countries during recent years.Recently atmospheric deposition measurements have been performed in both Europe andNorth America, and similar deposition rates have been found (Table 3.3 ).
Measurement of historical deposition rates of mercury in Scandinavia using coresamples of peat bogs has demonstrated that the deposition rates in southern Scandinaviahave increased from about 10 to 30 µg/m2/year since the beginning of this century. It was notyet possible to verify that the decreased emissions resulted in a decrease in recent deposition(Jensen and Jensen 1991). A number of studies (geochemical prospecting) indicate that peatbog geochemistry (including that of "raised bogs") tends to reflect local factors such asbedrock geochemistry or glacial drift geochemistry (Armands 1967, Salmi 1967, Toverud 1977,Coker and DiLabio 1979, DiLabio and Coker 1982, DiLabio 1983). According to these studies,it would be difficult to use peat bog cores to distinguish between anthropogenic and naturalsources of mercury.
In a study from Norway (Steinnes et al. 1993), it was concluded that the average ratioof surface peat relative to pre-industrial levels is 4.1 ± 2.8 for the 13 bogs sampled. In thesoutheastern part, a ratio of about 10 is observed. Measurements of mosses havedemonstrated that the mercury deposition in the southern and southwestern part is more thantwice the level in remote areas. Moss data have been compared with atmospheric depositionmeasurements at nearby localities, where a similar trend has been found. Steinnes (1993)
54

Table 3.3 Wet Deposition of Mercury
Site µg mercury/m 2/year Reference
Southern Baltic Sea,Europe
5.9-14.8 Jensen and Iverfeldt 1994
Great Lakes, USA 6.2-9.9 Hoyer et al. 1993
Upper Midwest, USA 5.1-10.0 Sorensen et al. 1994
also indicates that the contribution of mercury from soil degassing is a complicating factor inthe use of mosses as atmospheric biomonitors. Carpi et al. (1994) overcame this problem byusing bags of homogenized sphagnum moss to map the concentration gradient around anindustrial point source. In this study, the radius of impact of mercury was found to be only oneto two kilometres.
3.4 Behaviour and occurrence in the aquatic environment
The input of mercury to the aquatic environment is the result of direct point sourceemissions, natural processes releasing mercury, and atmospheric fall-out from natural oranthropogenic sources.
The main source of mercury to the open oceans is wet deposition. Theconcentrations in the ocean surface waters are elevated in the northwest Atlantic comparedwith the northwest Pacific (0.8 and 0.4 ng/litre, respectively) (Gill and Fitzgerald 1987). Thismay indicate an influence from industrial activities in the northern hemisphere. The meanresidence time for mercury in the open oceans is relatively short in geochemical terms, about350 years (Gill and Fitzgerald 1988). The oceans are a major source of mercury to theatmosphere due to evasional fluxes of elemental mercury (Kim and Fitzgerald 1986).
The major negative effect of environmental pollution by mercury is thebiomagnification of methylmercury in the aquatic food chains. This has led to a very largeeffort in trying to determine the regulating mechanisms for the uptake of methylmercury in fish.
Mercury in the aquatic environment is accumulated in biota in increasingconcentrations with increasing age, as well as at higher trophic levels (Nriagu 1979).Methylmercury, with a biological half-life on the order of one year, is strongly retained in biota.The ratio between methylmercury and total mercury increases with trophic level, resulting inhigh concentrations of methylmercury in fish, e.g. flounder and cod, with the highestconcentrations in long-living fish such as tuna (Bacci 1989).
55

A key question in regard to the aquatic ecosystem is the source of methylmercuryentering the food chain. In-lake methylation of inorganic mercury in the water column orsediments is a possible internal source (Fitzgerald et al. 1991). The new data on methylmercuryfluxes generated at the Lake Gårdsjön catchments (Hultberg et al. 1994, Lee et al. 1994) pointto the importance of the external methylmercury load on the lake biota. Studies in Canada(Rasmussen 1993) have shown that local geological sources, like faults, can be a local mercurysource giving rise to increased local levels of mercury in the soil, vegetation, sediments and fish.However, there is still a need to elucidate conclusively the quantitative flux from different sourcesto the fish.
Recent studies in both Scandinavia and North America (Lindqvist et al. 1991) haveshown that mercury deposited earlier, especially in forest soils, becomes mobile in increasingamounts by association with organic matter and is transported via run-offs from the drainage areato surface waters. The transport is closely related to the transport of humic matter in the water(Meili 1991). This gives rise to elevated mercury concentrations in the food chain, including fish,even in lakes which are remote from direct sources (Lathrop et al. 1991).
Studies, especially in Canada, have shown that land with high naturally elevatedmercury levels, and which has been flooded with water, has a high rate of methylmercuryproduction associated with the degradation of submerged organic material (Hecky et al. 1991),which in turn gives rise to high accumulation of mercury in fish (Verdon et al. 1991). This canbe a potential problem in any area with elevated mercury levels from natural or anthropogenicsources.
Sediments are a major sink for mercury. However, because of the dynamic exchangewith the overlying water column and methylation of mercury in sediments by microorganisms,mercury can be released again to both water and the atmosphere. Methylation also gives riseto uptake of methylmercury in biota. While the net production of methylmercury is very low (i.e.0.1 per cent of total mercury in the upper part of marine sediment in a year) (Bacci 1989), it canstill have significant environmental consequences due to bioaccumulation.
There is evidence that mercury is mobile in sediments. Vertical profiles of mercury andother trace elements in sediment columns commonly display surface enrichment near thesediment/water interface. This surface enrichment of mercury and many other elementsdevelops whether the source of the element is natural or anthropogenic. Several biogeochemicalprocesses lead to element enrichment in surface sediments, including remobilization and upwardmigration in the sediment column, adsorption onto oxides in surface sediments, organic decay,and biogeochemical reactions near the sediment/water interface (Farmer 1992, Coker et al.1979). Studies in Canada (Rasmussen 1993) have suggested that surface enrichment ofmercury occurs in lake sediments remote from point sources as a result of natural processes.Krabbenhoft and Babiarz (1992) also recognised the significance of natural processes in themobility of mercury in sediments.
Measurements of mercury in Swedish freshwater sediments have indicated a five-foldincrease in mercury deposition and mercury concentration, as compared with backgroundconditions in southern Sweden, and approximately a doubling in the northernmost part of thecountry (Johansson et al. 1991). Sediments from the deep basins in the Baltic Sea show athree-fold increase over the concentrations in pre-1850 samples (Madsen and Larsen 1986).Analysis of sediments from lakes in northeastern Minnesota, remote from direct inputs ofmercury, suggest that mercury deposition has increased by a factor of about 3.5 over the last150 years. Because the increase is spatially constant across northeastern Minnesota,atmospheric pollution appears to be responsible for the increase (Pratt 1990, Swain and Helwig1989).
56

3.5 Behaviour and occurrence in soil
Mercury occurs naturally in soils due to decaying vegetation, groundwater, till or bedrockweathering, and can be introduced by atmospheric deposition (from natural or anthropogenicsources) and anthropogenic activities.
It is generally believed that the major input of mercury to soil is atmospheric fall-out.Other inputs are the spreading of sewage sludge and fertilizers. The use of organic mercurycompounds in seed dressing is another significant source, although its use has diminished overthe latest ten to 20 years.
There is a dynamic exchange of volatile mercury compounds between the atmosphereand the soil, mainly in the form of elemental mercury, which is easily absorbed by soil organicmatter, though it is available for re-emission from certain soils. Microbial and biochemicalprocesses are important for the exchange rates. Methylmercury may be quite stable, and somemethylation is known to occur by chemical and microbial processes involving inorganic mercurycompounds in soil (Rundgren et al. 1992).
Because of the very high affinity of several mercury compounds to soil organic matter,leaching losses to subsoil horizons, groundwater or surface water are thought to be small fornormal soils. In nearly neutral soils, sometimes low in organic matter, iron and clay minerals maybe important absorption sites. In acid soils, transport of the carrier organic matter constituentsis almost a prerequisite for mercury mobility, as the stability of complexes of organic matter withmercury is high at low pH values (pH 3-5). This explains the earlier mentioned mobility ofmercury in acidified forest soils (Rundgren et al. 1992).
Mercury accumulates in soil invertebrates starting at only slightly elevatedconcentrations in the soil (Rundgren et al. 1992). The accumulation of mercury in plantsincreases with increasing soil mercury concentration. Soil types have a considerable influenceon this process. Generally, the highest concentrations of mercury have been found in the roots;but translocation to other organs (e.g. leaves) has also been identified (WHO 1989).
The long-range transport and increased deposition of anthropogenic mercury havemarkedly increased the mercury content, by about five to ten times, in organic rich top soil layersin central Europe and southern Scandinavia (Lambersdorf et al. 1991, and Lindqvist et al. 1991).Mercury in soil acts as a powerful toxin, particular in respect of microorganisms. There areindications that the regionally enhanced concentrations of mercury in these areas may have anadverse effect on microbiological processes, and indirectly on the recycling of important nutrientsand on tree vitality (Godbold 1991, and Tyler 1992).
Recent Swedish mercury balances for some watersheds have demonstrated that thepresent atmospheric deposition onto forest soils is much higher, on average about three to tentimes higher, than the output via run-off waters. The highest ratios are found in the southernparts of Sweden. Obviously, mercury is still accumulating in forest soils at present atmosphericdeposition rates, giving rise to increased concentrations in these soils, despite the fact thatemissions of mercury to air have been drastically reduced in Sweden during the last decades(Lindqvist et al. 1991). It is estimated that total inputs to soils in Scandinavia have to be reducedby 80 per cent of the present deposition rates for equilibrium to be attained in the entire profileof both cultivated and forest soils (Lindqvist et al. 1991).
57

Nater and Grigal (1992) have studied the regional trends in mercury distribution acrossthe Great Lakes in the north central United States by measuring mercury both in forest floor,surface mineral soil and deeper mineral soils. They have found a significant gradient in theconcentrations of mercury in forest floor and surface mineral soil along a transect of forestedsites across the north central United States from northwestern Minnesota to eastern Michigan.This gradient is accompanied by parallel changes in wet sulphate deposition, suggesting,according to the authors, that the regional variation in mercury content is due to deposition ofanthropogenic mercury. A clear west-to-east gradient persists, with the highest net change inthe easternmost sites and also, after correction for the background concentrations, in the deeperminerals soils.
Natural sources influence the mercury cycle in remote areas. The direct capture ofmercury vapour by soil, and the reverse process, the volatilization of soil mercury, result in a nettransfer of mercury from soil to air under natural conditions (Lockeretz 1974). In addition,mercury levels in plants and soil organic matter may reflect increased proximity to naturalgeological sources (Dunn 1987).
A study in a remote non-polluted area in Wisconsin showed that 92-96 per cent ofmercury deposited on the land surface is retained by the soil (Krabbenhoft and Babiarz 1992),and 4-8 per cent is transferred to the aquatic compartment.
3.6 Example of mass balance for mercury input
To give an indication of the importance of the different inputs to the aquaticenvironment, an estimate of the input of mercury to the North Sea is given in Table 3.4 .According to the Second International Conference on the Protection of the North Sea (1987),riverine inputs, atmospheric fall-out, and dumping of dredged material are the major inputs,accounting for more than 90 per cent of the inputs to the North Sea. Based on this, in order toobtain a reduction in the inputs to the aquatic environment, it is essential to reduce these threesources of mercury pollution. It is assumed that the input pattern in the North Sea reflects thesituation in the industrialized part of the world.
3.7 IPCS data on pathways to human exposure
The three key components for understanding human exposure to mercury are the dailyintake of mercury via exposure source (e.g. food), the form of the mercury that enters the body(e.g. methylmercury), and the retention of a particular form of mercury in the body (Table 3.5) .(The significance of the form of the mercury and of retention for human health effects isdiscussed in Chapter 4.)
The intake of mercury from the ambient atmosphere has been estimated by assumingthat the concentration of total mercury is 2 ng/m3 and that 75 per cent is present as elementalmercury vapour, 5 per cent as inorganic mercury compounds, and 20 per cent as methylmercury.The daily intake of each form of mercury was estimated by assuming a daily ventilation of 20 m3,and the amount absorbed was estimated by assuming that 80 per cent of the inhaled elemental
58

Table 3.4 Input of Mercury to the North Sea 1983-86
(metric tonnes per year)
Source Minimum Maximum
River inputs 20 21
Directdischarges
5 5
Atmospheric 10 30
Dumpings
Dredgings 17 17
Sewage sludge 0.6 0.6
Industrial waste 0.2 0.2
Incinerationat sea
trace trace
Total (rounded) 50 75
vapour, 50 per cent of the inorganic mercury compounds, and 80 per cent of the methylmercurywas absorbed across the pulmonary membranes (WHO 1976).
Mercury intake from drinking water was estimated by assuming a daily water intake of2 litres and an average concentration of 25 ng/litre. It was also assumed that all the mercury isin the inorganic form. Methylmercury has been found in a few samples taken from bodies ofnatural water, but there have been no reports of methylmercury in drinking water (WHO 1990).2
For elemental mercury, the major source of exposure – and also the one with thehighest retention – is dental amalgams. It is important to note that no daily intake is detectedfor inorganic mercury compounds or methylmercury for dental amalgams.
Experimental studies have shown that mercury is released from amalgam restorationsin the mouth as vapour. The release rate of this mercury vapour is increased, for example, bychewing. Several studies have correlated the number of dental amalgam fillings or amalgamsurfaces with the mercury content in tissues from human autopsy, as well as in samples of blood,
2 It is usually assumed that Hg(OH)2 and HgCl2 are the predominant species in surfacewaters. However, organic mercury has been reported to represent 22-37 per cent of the totalmercury in lake, river and tap water from the Ottawa, Canada, area (Schintu et al. 1989).
59

Table 3.5 Estimated Average Daily Intake and Retention (figures in brackets)of Total Mercury and Mercury Compounds (µg/day) in the GeneralPopulation Not Occupationally Exposed to Mercury a (WHO 1990)
Exposure Elementalmercury vapour
Inorganic mercurycompounds
Methylmercury
Air 0.030 (0.024) 0.002 (0.001) 0.008 (0.0064)
FoodFishNon-fish
00
0.600 (0.042)3.6 (0.25)
2.4 (2.3)0
Drinking water 0 0.050 (0.0035) 0
Dental amalgams 3.8-21 (3-17) 0 0
Total 3.9-21 (3.1-17) 4.3 (0.3) 2.41 (2.31)
a See text for assumptions underlying the calculations of average daily intake and retention.
urine and plasma. Both the predicted mercury uptake from amalgam and the observedaccumulation of mercury show substantial individual variation. It is therefore difficult to makeaccurate quantitative estimations of the mercury release and uptake by the human body fromdental amalgam tooth restorations (WHO 1991). Values given are the estimated average dailyintake; the figures in parentheses represent the estimatedamount retained in the body of an adult.
For inorganic mercury compounds, the major source of exposure is through non-fishfood where retention is low.
It is clear that fish and fish products are the dominant source of human exposure tomethylmercury, even when low fish consumption is assumed. Daily methylmercury intake canvary over a wide range, depending on the amount of fish consumed and the methylmercuryconcentration in the fish (Table 3.6 ). A number of communities have been identified whereindividual intake of fish exceeded 200 µg mercury/day (WHO 1976, 1980; Turner et al. 1980;GESAMP 1986). As it is assumed that 80 per cent of this mercury is methylmercury and that95 per cent of the methylmercury is absorbed, the absorbed amount of methylmercury(>153 µg/day) will, in these cases, dominate the daily mercury exposure. On the basis ofgeneral population surveys of fish consumption, it was estimated that in Australia 0.9 per centof the population ate more than 1000 g fish/week and that this corresponded to about 20 µgmercury/day (WGMF 1980). In the United States, surveys of fish consumption (US Dept. ofCommerce 1978) were used to estimate that, with no regulatory control of the mercury contentof marketed fish, 99.81 per cent of all respondents had an upper limit mercury intake lowerthan their personal allowable daily intake (based on 30 µg mercury/day for a 70 kg person)at a 95 per cent level. An action level of 1 mg mercury/kg in fish for regulatory control wouldincrease this percentage to 99.87 per cent, and an action level of 0.5 mg mercury/kg wouldincrease it to 99.89 per cent.
60

Table 3.6 Intake of Methylmercury (µg/day) from Fish with Various MethylmercuryLevels and at Various Rates of Fish Consumption a (WHO 1990)
Consumptionof fish(g/day)
Level of methylmercury in fish (µg/kg fresh weight)
200 500 1000 2000 5000
520
100300
1000b
14
2060
200
2.51050
150500
520
100300
1000
1040
200600
2000
25100500
10005000
a Adapted from WHO (1980).
b Data from GESAMP (1986) indicate that maximum intake of fish may equal 1000 g/day.
61

62

CHAPTER 4
INTERNATIONAL AND NATIONAL POSITIONS ONTHE RISKS FROM MERCURY
This chapter contains an assessment of the risks of mercury, taken from InternationalProgramme on Chemical Safety (IPCS) Environmental Health Criteria documents.
Also presented in this chapter are country statements, provided by OECD Membercountries, in regard to national positions on risks from mercury. These statements essentiallypresent the rationale for any actions the country has taken or contemplates taking to addressthe effects associated with exposure to mercury. The risk assessments and riskcharacterisations that have led countries to take action have a national character. Countriesdevelop positions on the need for risk reduction activities only after they have analysed thehazard and the significance of certain exposures and have factored in local social, economicand political considerations. These positions are usually arrived at after considerable debateon the numerous factors involved, and thus are not consistent across Member countries.
63

64
4.1 International position (IPCS)
4.1.1 IPCS Environmental Health Criteria 86: Mercury – Environmental Aspects
The International Programme on Chemical Safety (IPCS) is a joint venture of theUnited Nations Environment Programme, the International Labour Organisation, andthe World Health Organization. The main objective of the IPCS is to carry out anddisseminate evaluations of the effects of chemicals on human health and the qualityof the environment. The Environmental Health Criteria documents prepared by IPCScontain the collective views of an international group of experts and do notnecessarily represent the decisions or the stated policy of the United NationsEnvironment Programme, the International Labour Organisation, or the World HealthOrganization.
The text below is taken directly from Chapter 9 of IPCS Environmental HealthCriteria Document No. 86: Mercury – Environmental Aspects .
EVALUATION
In evaluating the environmental hazard of mercury it is necessary to extrapolate fromlaboratory experiments to ecosystems. This must be done with extreme caution for thefollowing reasons:
(i) Speciation of mercury and its adsorption to environmental components suchas soil, sediment, organic matter, and biota limit its availability to organismsin the environment.
(ii) Environmental variables such as temperature, pH and chemical compositionof water, soil type, and geology have been shown in limited studies on anarrow range of species to affect both uptake and effect of mercury. Thereis insufficient information to fully assess the probable affects of, for example,tropical conditions and acid precipitation.
(iii) There are few data measuring mercury availability to organisms. Most datarepresent nominal or total metal concentration, rather than that componentwhich could be taken up by organisms. True exposure is, therefore, difficultto assess.
(iv) There are limited data on the behaviour of mixtures of metals from controlledexperimental work; organisms in the environment are exposed to mixtures.
(v) Experimental work seldom, if ever, is conducted on species or communitiesthat are either representative or key components of natural communities andecosystems. Studies do not consider all of the interactions betweenpopulations and all of the environmental factors affecting these populations.
65

It is probable that subtle disturbances to the community occur at much lowerconcentrations than those suggested in laboratory studies on acute effect, perhaps as muchas one order of magnitude lower.
The Marine Environment
Marine aquatic organisms at all levels accumulate mercury into tissues. This mercuryis retained for long periods if it is in an organic form. A number of factors affect thesusceptibility of aquatic organisms to mercury. These include the life-cycle stage (the larvalstage being particularly sensitive), the development of tolerance, water temperature, andsalinity. Some incidents of severe pollution have resulted in the death of fish at that time.Few follow-up studies have been reported so that it is impossible to assess the long-termhazards. Toxic effects have been produced experimentally only at concentrations much higherthan those found in the non-polluted marine environment. Furthermore, most of the studieshave been on acute lethality and have used inorganic mercury compounds in the main. Birds,particularly coastal species or those eating prey that feed in estuaries, have been affected bymercury contamination. It has adversely affected breeding and may have influencedpopulation stability.
The Freshwater Environment
Mercury compounds are acutely toxic to freshwater microorganisms. Usingphotosynthesis and/or growth as parameters, the NOTEL (No-observed-toxic-effect-level) forinorganic mercury lies between 1 and 50 µg/litre, depending on the organism, density of cellsin culture, and experimental conditions. Diversity of species in mixed culture may be affectedby 40 µg mercuric chloride/litre. For organomercury compounds, the NOTEL is 10-100 timeslower.
Aquatic plants sustain damage after exposure to inorganic mercury at concentrationsof 800 to 1200 µg/litre. Organomercury produces toxic effects at concentrations 10-100 timeslower.
Many aquatic invertebrates are sensitive to mercury toxicity, particularly as larvae.Organic mercury compounds are toxic at concentrations 10 to 100 times less than inorganicmercury. For the most sensitive species, Daphnia magna, the NOTEL for reproductiveimpairment is 3 µg/litre for inorganic mercury and < 0.04 µg/litre for methylmercury.
Freshwater fish show lethal responses to mercury in acute nominal concentrationsfrom approximately 30 µg/litre. Larvae under the same static conditions are 10 times moresensitive. In flow-through tests, fish are up to 100 times more sensitive. In both static andlow-through tests, organomercury compounds are approximately 10 times more toxic thaninorganic compounds. The NOTEL for the most sensitive parameters may be well below 0.01µg/litre.
Aquatic developmental stages of amphibia show sensitivity to mercuric compoundssimilar to that of fish.
66

The Terrestrial Environment
Based on the current state of knowledge, it is not possible to determine the trueexposure or concentration of mercury available to terrestrial organisms. It can, however, bestated that exposure via soil, soil water, and food is most important; exposure via open waterand air is less important.
Mercury has been shown, in laboratory studies, to be toxic to terrestrial organismsover a broad range of concentrations. However, most of these studies are at high exposurelevels (birds) or environmentally unrealistic exposure routes (hydroponic culture of plants).
It can be stated that acute effects would not be seen in terrestrial plants growing innatural soils, nor in terrestrial birds or mammals, other than by exposure to mercurials usedas fungicidal seed dressings. Other effects seen in birds derive from mercury in the marineenvironment.
67

4.1.2 IPCS Environmental Health Criteria 101: Methylmercury
The International Programme on Chemical Safety (IPCS) is a joint venture of theUnited Nations Environment Programme, the International Labour Organisation, andthe World Health Organization. The main objective of the IPCS is to carry out anddisseminate evaluations of the effects of chemicals on human health and the qualityof the environment. The Environmental Health Criteria documents prepared by IPCScontain the collective views of an international group of experts and do notnecessarily represent the decisions or the stated policy of the United NationsEnvironment Programme, the International Labour Organisation, or the World HealthOrganization.
The text below concerning the risks to human health from compounds ofmonomethylmercury is taken directly from Chapter 1 of IPCS EnvironmentalHealth Criteria Document No. 101: Methylmercury (WHO 1990). It examines thedata that have become available since the publication of Environmental HealthCriteria No. 1: Mercury (WHO 1976).
Identity, Physical and Chemical Properties, Analytical Methods
The solubility of methylmercury compounds in water varies greatly and depends onthe nature of the anion. Most are soluble in water but much less soluble in non-polar solvents.They generally have appreciable vapour pressures at room temperature. Mercurials, includingalkylmercurials, exhibit high affinities for sulfhydryl groups.
Bloods samples for analysis should be taken by venipuncture, avoiding devices usingmercury-containing preservatives. Current methods are capable of measuring mercury in 1-to 5-ml samples of whole blood, even in the case of non-exposed individuals. Hair is usefulin assessing exposure to methylmercury in the diet and may be sampled as single or bunchedstrands. The single-strand procedure requires both sensitive analytical methods and thedetermination of the growth phase of the hair.
The method of choice for determining total mercury in environmental and biologicalsamples is flameless atomic absorption spectroscopy (detection limits, 0.5-4.0 ng/g). Neutronactivation analysis serves as a sensitive reference method. Gas chromatography is used todetermine methylmercury directly (detection limit, 1.0 ng/g sample).
Sources of Human and Environmental Exposure
Environmental methylmercury arises largely, if not solely, from the methylation ofinorganic mercury. The major source of atmospheric mercury is the natural degassing of theearth’s crust, amounting to 2700-6000 tonnes per year. Deposition of atmospheric mercury,leaching from rocks, and anthropogenic sources all add to the mercury burden in bodies ofwater, but the exact contribution of each source is indeterminable.
About 10 000 tonnes of mercury per year are mined, subject to considerable year-to-year variation. Other important man-made sources are fossil fuels combustion, smelting of
68
sulfide ores, production of cement, and refuse incineration. The total man-made globalrelease of mercury to the atmosphere is approximately 2000-3000 tonnes per year, i.e., lessthan the natural emissions. Man-made emissions pose the greatest risk when they arereleased in confined areas.
Mercury continues to be used in the production of caustic soda and chlorine, and itis widely used in the electrical industry for lamps, controls, rectifiers, batteries and switches,as well as in the dental progression. Environmental losses can also occur from its continueduse in antifouling and mildew-proofing paints, in seed dressings, and in the extraction of gold.
Environmental Transport, Distribution, and Transformation
There is a well recognized global cycle for mercury, whereby emitted mercury vapouris converted to soluble forms (e.g., Hg++) and deposited by rain onto soil and water. Mercuryvapour has an atmospheric residence time of between 0.4 and 3 years, whereas soluble formshave residence times of a few weeks. Transport in soil and water is thus limited, and it islikely that deposition will occur within a short distance.
The change in speciation of mercury from inorganic to methylated forms is the firststep in the aquatic bioaccumulation process. Methylation can occur non-enzymically orthrough microbial action. Once methylmercury is released, it enters the food chain by rapiddiffusion and tight binding to proteins. As a result of food-chain biomagnification, highestlevels are found in the tissue of such predatory species as freshwater trout, pike, walleye,bass and ocean tuna, swordfish, and shark. The bioconcentration factor, i.e., the ratio of theconcentration of methylmercury in fish tissue to that in water, is usually between 10 000 and100 000. Levels of selenium in the water may affect the availability of mercury for uptake inaquatic biota. Reports from Sweden and Canada suggest that methylmercury concentrationsin fish may increase following the construction of artificial water reservoirs.
Environmental Levels and Human Exposure
The general population is primarily exposed to methylmercury through the diet.However, air and water, depending upon the level of contamination, can contribute significantlyto the daily intake of total mercury. In most foodstuffs, mercury is largely in the inorganic formand below the limit of detection (20 µg mercury/kg fresh weight). However, fish and fishproducts are the dominant source of methylmercury in the diet, and levels greater than 1200µg/kg have been found in the edible portions of shark, swordfish, and Mediterranean tuna.Similar levels have been found in pike, walleye, and bass taken from polluted fresh waters.
It has been estimated that humans have a daily intake of about 2.4 µg methylmercuryfrom all sources, and a daily uptake of approximately 2.3 µg.3 The total daily intake of allforms of mercury from all sources has been estimated to be 6.7 µg, with an added burden of3.8 to 21 µg of mercury of mercury vapour from dental amalgams, if present. The level ofmercury in fish, even for humans consuming only small amounts (10-20 g of fish/day), canmarkedly affect the intake of methylmercury. The consumption of 200 g of fish containing 500µg mercury/kg will result in the intake of 100 µg mercury (predominantly methylmercury). Thisamount is one-half of the recommended provisional tolerable weekly intake (WHO 1989).
3 See Table 3.5 in Chapter 3 of this OECD Risk Reduction Monograph.
69
Kinetics and Metabolism
Methylmercury in the human diet is almost completely absorbed into the bloodstreamand distributed to all tissues within about 4 days. However, maximum levels in the brain areonly reached after 5-6 days. In humans, blood to hair ratios are about 1:250, with appreciableindividual variation. Similarly, large individual differences are seen in cord to maternal bloodmercury ratios, the levels generally being higher in cord blood. Species differences exist inthe distribution of methylmercury between red blood cells and plasma (about 20:1 in humans,monkeys, and guinea-pigs, 7:1 in mice, and <100:1 in rats).
Methylmercury is converted to inorganic mercury in experimental animals andhumans. The duration of the exposure and the interval after its cessation, determine thefraction of total mercury present in tissues in the Hg++ form. In humans, after high oral intakesof methylmercury for 2 months, the following values were reported (percentage of totalmercury in tissues as inorganic mercury): whole blood, 7 per cent; plasma, 22 per cent; breastmilk, 39 per cent; urine, 73 per cent; liver, 16-40 per cent.
The rate of excretion of mercury in both laboratory animals and humans is directlyproportional to the simultaneous body burden and can be described by a single-compartmentmodel with a biological half-time, in fish-eating humans, of 39-70 days (average approximately50 days). Lactating females have significantly shorter half-times for mercury excretion thannon-lactating ones.
Mercury half-times in hair closely follow those in blood but with wider variation (35-100 days, average 65 days). Suckling mice are incapable of excreting methylmercury, butthey abruptly change to the adult rate of excretion at the end of the suckling period.
In the case of continuous exposure, a single-compartment model with a 70-day half-time predicts that the whole-body steady state (where intake equals excretion) will be attainedwithin approximately one year and that the maximum amount accumulated will be 100 timesthe average daily intake. The validity of the single-compartment model is supported by thereasonable agreement between predicted and observed blood concentrations ofmethylmercury in single-dose tracer studies, single-dose fish intake experiments, and studiesinvolving the extended controlled intake of methylmercury from fish. It is also supported byresults from the longitudinal hair analysis of individuals with very high intakes ofmethylmercury.
Mean reference values for total mercury in commonly used indicator media are: wholeblood, 8 µg/litre; hair, 2 µg/g; urine, 4 µg/litre, and placenta, 10 µg/kg wet weight. Long-termfish consumption is the major determinant of methylmercury and, usually, total mercury levelsin blood. For example, in communities in which there is a long-term daily consumption of 200µg mercury/day from fish, blood mercury levels are approximately 200 µg/litre andcorresponding hair levels about 250 times higher (50 µg/g hair).
Effects on Experimental Animals and In Vitro Systems
In every animal species studied, the nervous system is a target of methylmercury,fetuses appearing to be at higher risk than adults. Concerning effects on the nervous system,animal studies reported since 1976 provide further support to the mechanistic models usedto evaluate the available data in humans.
70

Methylmercury is fetotoxic in mice (single dose of 2.5-7.5 mg/kg); teratogenic in rats,and adversely affects the behaviour of monkey offspring (mercury doses of 50-70 µg/kg perday before and during pregnancy). It also affects spermatogenesis in mice (1 mg mercury/kgas methylmercury).
Effects on Man – Mechanism of Action
The effects of methylmercury on adults differ both qualitatively and quantitatively fromthe effects seen after prenatal or, possibly, early postnatal exposures. Thus, effects on themature human being will be considered separately from the effects on developing tissues.
The clinical and epidemiological evidence indicates that prenatal life is more sensitiveto the toxic effects of methylmercury than is adult life. The inhibition of protein synthesis isone of the earliest detectable biochemical effects in the adult brain, though the sequence ofevents leading to overt damage is not yet understood. Methylmercury can also react directlywith important receptors in the nervous system, as shown by its effect on acetylcholinereceptors in the peripheral nerves. In the case of prenatal exposure, the effects ofmethylmercury seem to be quite different and of a much more general basic nature. It affectsnormal neuronal development, leading to altered brain architecture, heterotopic cells, anddecreased brain size. Methylmercury may also be exerting an effect, perhaps throughinhibition of the microtubular system, on cell division during critical stages in the formation ofthe central nervous system.
Since 1976, a wealth of data has been reported on dose-effect and dose-responserelationships in humans. It has been derived from in-depth studies on populations exposedto methylmercury through mass poisonings or through the consumption of fish containingvarying levels of methylmercury. Again, prenatal and adult data will be considered separatelyin view of the differences, both qualitative and quantitative, in effects and dose-responserelationships.
In adults, the reported relationships between response and body burden (hair or bloodmercury concentrations) are essentially the same as those reported in Environmental HealthCriteria 1: Mercury (WHO 1976). No adverse effects have been detected with long-term dailymethylmercury intakes of 3-7 µg/kg body weight (hair mercury concentrations of approximately50-125 µg/g). Pregnant women may suffer effects at lower methylmercury exposure levelsthan non-pregnant adults, suggesting a greater risk for pregnant women.
Severe derangement of the developing central nervous system can be caused byprenatal exposure to methylmercury. The lowest level (maximum maternal hair mercuryconcentration during pregnancy) at which severe effects were observed was 404 µg/g in theIraqi outbreak and the highest no-observed-effect level for severe effects was 399 µg/g. Fish-eating populations in Canada and New Zealand have also been studied for prenatal effects,but exposure levels were far below those that caused effects in Iraq and no severe caseswere seen.
Evidence of psychomotor retardation (delayed achievement of developmentalmilestones, a history of seizures, abnormal reflexes) was seen in the Iraqi outbreak atmaternal hair levels below those associated with severe effects. The extrapolation of datasuggested that one of these effects (motor retardation) rose above the background frequencyat maternal hair levels of 10-20 µg/g. The Canadian study reported that abnormal muscle
71

tonne or reflexes were positively associated with maternal hair levels in boys but not in girls(the highest maternal hair level during pregnancy was 23.9 µg/g). The New Zealand studyreported evidence of developmental retardation (according to the Denver Test) in 4-year-oldchildren at average maternal hair mercury levels during pregnancy within the range of 6-86µg/g (the second highest value was 19.6 µg/g). The New Zealand mercury values should bemultiplied by 1.5 to convert to maximum maternal hair levels in pregnancy.
Conclusions
The general population does not face a significant health risk from methylmercury.Certain groups with a high fish consumption may attain a blood methylmercury level (about200 µg/litre, corresponding to 50 µg/g of hair) associated with a low (5 per cent) risk ofneurological damage to adults.
The fetus is at particular risk. Recent evidence shows that at peak maternal hairmercury levels above 70 µg/g there is a high risk (more than 30 per cent) of neurologicaldisorder in the offspring. A prudent interpretation of the Iraqi data implies that a 5 per centrisk may be associated with a peak mercury level of 10-20 µg/g in maternal hair.
There is a need for epidemiological studies on children exposed in utero to levels ofmethylmercury that result in peak maternal hair mercury levels below 20 µg/g, in order toscreen for those effects only detectable by available psychological and behavioral tests.
72

4.1.3 IPCS Environmental Health Criteria 118: Inorganic Mercury
The International Programme on Chemical Safety (IPCS) is a joint venture of theUnited Nations Environment Programme, the International Labour Organisation, andthe World Health Organization. The main objective of the IPCS is to carry out anddisseminate evaluations of the effects of chemicals on human health and the qualityof the environment. The Environmental Health Criteria documents prepared by IPCScontain the collective views of an international group of experts and do notnecessarily represent the decisions or the stated policy of the United NationsEnvironment Programme, the International Labour Organisation, or the World HealthOrganization.
The text below is taken directly from Chapters 1 and 12 of IPCS EnvironmentalHealth Criteria document No. 118: Inorganic Mercury (WHO 1991).
SUMMARY AND CONCLUSIONS
This [Environmental Health Criteria document] concentrates primarily on the risk tohuman health from inorganic mercury, and examines research reports that have appearedsince the publication of Environmental Health Criteria 1: Mercury (WHO, 1976). In the periodsince 1976, new research data has become available for two main health concerns relatedto inorganic mercury, i.e. mercury in dental amalgam and in skin-lightening soaps. Theemphasis in this monograph is on exposure from these two sources, but the basic kinetics andtoxicology are reviewed with all aspects of inorganic mercury in mind.
Human health concerns related to the global transport, bioaccumulation, andtransformation of inorganic mercury almost exclusively arise from the conversion of mercurycompounds into methylmercury and exposure to methylmercury in sea-food and other food.The global environmental and ecological aspects of inorganic mercury have been summarizedin this [Environmental Health Criteria document]. More detailed descriptions may be foundin Environmental Health Criteria 86: Mercury – Environmental Aspects (WHO, 1989) andEnvironmental Health Criteria 101: Methylmercury (WHO, 1990).
Identity
Mercury exists in three states: Hg0 (metallic); Hg2++ (mercurous) and Hg++(mercuric). It can form organometallic compounds, some of which have found industrial andagricultural uses.
Physical and Chemical Properties
Elemental mercury has a very high vapour pressure. The saturated atmosphere at20o C has a concentration over 200 times greater than the currently accepted concentrationfor occupational exposure.
73

Solubility in water increases in the order: elemental mercury < mercurous chloride <methylmercury chloride < mercuric chloride. Elemental mercury and the halide compoundsof alkylmercurials are soluble in non-polar solvents.
Mercury vapour is more soluble in plasma, whole blood, and haemoglobin than indistilled water, where it dissolves only slightly. The organometallic compounds are stable,although some are readily broken down by living organisms.
Analytical Methods
The most commonly used analytical methods for the quantification of total andinorganic mercury compounds are atomic absorption of cold vapour (CVAA) and neutronactivation. Detailed information relating to analytical methods are given in EnvironmentalHealth Criteria 1: Mercury (WHO, 1976) and Environmental Health Criteria 101:Methylmercury (WHO, 1990).
All analytical procedures for mercury require careful quality control and qualityassurance.
Analysis, Sampling, and Storage of Urine
Flameless atomic spectrophotometry is used in routine analysis for various media.Particular care must be take when choosing the anticoagulant used for blood sampling inorder to avoid contamination by mercury compounds. Special care must also be taken in thesampling and storage of urine, since bacterial growth can change the concentration of thenumerous forms of mercury that may be present. Addition of hydrochloric acid or bactericidalsubstances and freezing the sample are the best methods to prevent alteration of urinesamples. Correction of concentration by reference to urine density or creatinine content arerecommended.
Analysis and Sampling of Air
Analytical methods for mercury in air may be divided into instant reading methods andmethods with separate sampling and analysis stages. Instant reading methods can be usedfor the quantification of elemental mercury vapour. Sampling in acid-oxidizing media or onhopcalite is used for the quantification of total mercury.
The cold vapour atomic absorption (CVAA) technique is the most frequently usedanalytical method.
74

Sources of Human and Environmental Exposure
Natural Occurrence
The major natural sources of mercury are degassing of the earth’s crust, emissionsfrom volcanoes, and evaporation from natural bodies of water.
The natural emissions are of the order of 2700-6000 tonnes per year.
Sources due to Human Activities
The world-wide mining of mercury is estimated to yield about 10 000 tonnes/year.These activities lead to some losses of mercury and indirect discharges to the atmosphere.Other important sources are fossil fuels combustion, metal sulfide ore smelting, gold refining,cement production, refuse incineration, and industrial applications of metals.
The specific normal emission from a chloralkali plant is about 450 g of mercury perton of caustic soda produced.4
The total global amount and release of mercury due to human activities, to theatmosphere has been estimated to be up to 3000 tonnes/year.
Uses
A major use of mercury is as a cathode in the electrolysis of sodium chloride. Sincethe resultant chemicals are contaminated with mercury, their use in other industrial activitiesleads to a contamination of other products. Mercury is used in the electrical industry, incontrol instruments in the home and industry, and in laboratory and medical instruments.Some therapeutic agents contain inorganic mercury. A very large amount of mercury is usedfor the extraction of gold.
Dental silver amalgam for tooth filling contains large amounts of mercury, mixed (inthe proportion of 1:1) with alloy powder (silver, tin, copper, zinc). Copper amalgam, usedmostly in paediatric dentistry, contains up to 70 per cent mercury and up to 30 per centcopper. These uses can cause exposure of the dentist, dental assistant, and also of thepatients.
Some dark-skinned people use mercury-containing creams and soap to achieve alighter skin tone. The distribution of these products is now banned in the EEC, in NorthAmerica, and in many African countries, but mercury-containing soap is still manufactured inseveral European countries. The soaps contain up to 3 per cent of mercuric iodine and thecreams contain ammoniated mercury (up to 10 per cent).
4 The figure 450 g of mercury is based on data from six plants in one developingcountry using older technology. Regulations in most industrialized countries now limit suchemissions to between 2 and 5 g of mercury/tonne of chlorine.
75

Environmental transport, distribution, and transformation
Emitted mercury vapour is converted to soluble forms and deposited by rain onto soiland water. The atmospheric residence time fro mercury vapour is up to 3 years, whereassoluble forms have a residence time of only a few weeks.
The change in speciation of mercury from inorganic to methylated forms is the firststep in the aquatic bioaccumulation process. This can occur non-enzymically or throughmicrobial action. Methylmercury enters the food-chain of predatory species wherebiomagnification occurs.
Human exposure
The general population is primarily exposed to mercury through the diet and dentalamalgam. Depending on the concentrations in air and water, significant contributions to thedaily intake of total mercury can occur. Fish is a dominant source of human exposure tomethylmercury. Recent experimental studies have shown that mercury is released fromamalgam restorations in the mouth as vapour. The release rate of this mercury vapour isincreased, for example, by chewing. Several studies have correlated the number of dentalamalgam fillings or amalgam surfaces with the mercury content in tissues from humanautopsy, as well as in samples of blood, urine, and plasma. Both the predicted mercuryuptake from amalgam and the observed accumulation of mercury show substantial individualvariation. It is, therefore, difficult to make accurate quantitative estimations of the mercuryrelease and uptake by the human body from dental amalgam tooth restorations. Experimentalstudies in sheep have examined in greater detail the distribution of mercury released fromamalgam restorations.
Use of skin-lightening soap and creams can give rise to substantial mercuryexposure.
Occupational exposure to inorganic mercury has been investigated in chloralkaliplants, mercury mines, thermometer factories, refineries, and in dental clinics. High mercurylevels have been reported for all these occupational exposure situations, although levels varyaccording to work environment conditions.
Kinetics and metabolism
Results of both human and animal studies indicate that about 80 per cent of inhaledmetallic mercury vapour is retained by the body, whereas liquid metallic mercury is poorlyabsorbed via the gastrointestinal tract (less than 1 per cent). Inhaled inorganic mercuryaerosols are deposited in the respiratory tract and absorbed, the rate depending on particlesize. Inorganic mercury compounds are probably absorbed from the human gastrointestinaltract to a level of less than 10 per cent on average, but there is considerable individualvariation. Absorption is much higher in newborn rats.
The kidney is the main depository of mercury after the administration of elementalmercury vapour or inorganic mercury compounds (50-90 per cent of the body burden ofanimals). Significantly more mercury is transported to the brain of mice and monkeys afterthe inhalation of elemental mercury than after the intravenous injection of equivalent doses
76

of the mercuric form. The red blood cell to plasma ratio in humans is higher (≥ 1) afteradministration of elemental mercury than mercuric mercury and more mercury crosses theplacental barrier. Only a small fraction of the administered divalent mercury enters the ratfetus.
Several forms of metabolic transformation can occur:
• oxidation of metallic mercury to divalent mercury;• reduction of divalent mercury to metallic mercury;• methylation of inorganic mercury;• conversion of methylmercury to divalent inorganic mercury.
The oxidation of metallic mercury vapour to divalent ionic mercury is not fast enoughto prevent the passage of elemental mercury through the blood-brain barrier, the placenta, andother tissues. Oxidation in these tissues serves as a trap to hold the mercury and leads toaccumulation in brain and fetal tissues.
The reduction of divalent mercury to Hg0 has been demonstrated both in animals(mice and rats) and humans. The decomposition of organomercurials, includingmethylmercury, is also a source of mercuric mercury.
The faecal and urinary routes are the main pathways for the elimination of inorganicmercury in humans, although some elemental mercury is exhaled. One form of depletion isthe transfer of maternal mercury to the fetus.
The biological half-time, which only lasts a few days or weeks for most of theabsorbed mercury, is very long, probably years, for a fraction of the mercury. Such long half-times have been observed in animal experiments as well as in humans. A complicatedinterplay exists between mercury and some other elements, including selenium. The formationof a selenium complex may be responsible for the long half-time of a fraction of the mercury.
Reference and normal values
Limited information from deceased miners shows mercury concentrations in the brain,years after cessation of exposure, of several mg/kg, with still higher values in some parts ofthe brain. However, lack of quality control of the analysis makes these data uncertain.Among a small number of deceased dentists, without known symptoms of mercuryintoxication, mercury levels varied from very low concentrations up t a few hundred µg/kg inthe occipital lobe cortex and from about 100 µg/kg to a few mg/kg in the pituitary gland.
From autopsies on subjects not occupationally exposed but with a varying numberof amalgam fillings, it seems that a moderate number (about 25) of amalgam surfaces mayon average increase the brain mercury concentration by about 10 µg/kg. The correspondingincrease in the kidneys, based on a very limited number of analyses, is probably 300-400µg/kg. However, the individual variation is considerable.
Mercury levels in urine and blood can be used as indicators of exposure provided thatthe exposure is recent and relatively constant, is long-term, and is evaluated on a group basis.Recent exposure data are more reliable than those quoted in Environmental Health Criteria1: Mercury (WHO, 1976). The differences may in part be explained by different samplingtechnique for evaluating air exposure. An exposure of 40 µg mercury/m3 of air will correspond
77

to about 15-20 µg mercury/litre of blood. However, interference from methylmercury exposurecan make it difficult to evaluate exposure to low concentrations of inorganic mercury by meansof blood analysis. A way to overcome the problems is to analyse mercury in plasma oranalyse both inorganic mercury and methylmercury. The problem of interference frommethylmercury is much smaller when analysing urine, as methylmercury is excreted in theurine to only a very limited extent.
Effects in humans
Acute inhalation exposure to mercury vapour may be followed by chest pains,dyspnoea, coughing, haemoptysis, and sometimes interstitial pneumonitis leading to death.The ingestion of mercuric compounds, in particular mercuric chloride, has caused ulcerativegastroenteritis and acute tubular necrosis causing death from anuria where dialysis was notavailable.
The central nervous system is the critical organ for mercury vapour exposure.Subacute exposure has given rise to psychotic reactions characterized by delirium,hallucinations, and suicidal tendency. Occupational exposure has resulted in erethism as theprincipal feature of a broad ranging functional disturbance. With continuing exposure a finetremor develops, initially involving the hands. In the milder cases erethism and tremor regressslowly over a period of years following removal from exposure. Decreased nerve conductionvelocity has been demonstrated in mercury-exposed workers. Long-term, low-level exposurehas been associated with less pronounced symptoms of erethism.
There is very little information available on brain mercury levels in cases of mercurypoisoning, and nothing that makes it possible to estimate a no-observed-effect level or a dose-response curve.
At a urinary mercury excretion level of 100 µg mercury/g creatinine increases theincidence of some less severe toxic effects that do not lead to overt clinical impairment. INa few studies tremor, recorded electrophysiologically, has been observed at low urineconcentrations (down to 25-35 µg/g creatinine). Other studies did not show such an effect.Some of the exposed people develop proteinuria (proteins of low relative molecular mass andmicroalbuminuria). Appropriate epidemiological data covering exposure levels correspondingto less than 30-50 µg mercury/g creatinine are not available.
The exposure of the general population is generally low, but may occasionally beraised to the level of occupational exposure and can even be toxic. Thus, the mishandlingof liquid mercury has resulted in severe intoxication.
The kidney is the critical organ following the ingestion of inorganic divalent mercurysalts. Occupational exposure to metallic mercury has long been associated with thedevelopment of proteinuria, both in workers with other evidence of mercury poisoning and inthose without such evidence. Less commonly, occupational exposure has been followed bythe nephrotic syndrome, which has also occurred after the use of skin-lightening creamscontaining inorganic mercury, and even after accidental exposure. The current evidencesuggests that this nephrotic syndrome results from an immunotoxic response. Until recently,effects of elemental mercury vapour on the kidney had been reported only at doses higherthan those associated with the onset of sings and symptoms from the central nervous system.New studies have, however, reported kidney effects at lower exposure levels. Experimental
78

studies on animals have shown that inorganic mercury may induce auto-immuneglomerulonephritis in all species tested, but not in all strains, indicating a geneticpredisposition. A consequence of an immunological etiology is that, in the absence of dose-response studies for groups, of immunologically sensitive individuals, it is not scientificallypossible to set a level for mercury (e.g., in blood or urine) below which (in individual cases)mercury-related symptoms will not occur.
Both metallic mercury vapour and mercury compounds have given rise to contactdermatitis. Mercurial pharmaceuticals have been responsible for Pink disease in children, andmercury vapour exposure may be a cause of "Kawasaki" disease. In some studies, but notin others, effects on the menstrual cycle and/or fetal development have been reported. Thestandard of published epidemiological studies is such that it remains an open questionwhether mercury vapour can adversely affect the menstrual cycle or fetal development in theabsence of the well-known signs of mercury intoxication.
Recently, there has been an intense debate on the safety of dental amalgams andclaims have been made that mercury from amalgam may cause severe health hazards.Reports describing different types of symptoms and signs and the results of the fewepidemiological studies produced are inconclusive.
PREVIOUS EVALUATIONS BY INTERNATIONAL BODIES
The human risks of inorganic mercury compounds were previously evaluated inEnvironmental Health Criteria 1: Mercury (WHO 1976). More recent evaluations by theInternational Programme in Chemical Safety (IPCS) have dealt mainly with the health risksof methylmercury exposure (WHO 1990). A WHO review of the occupational health risks ofinorganic mercury (WHO 1980) and an IPCS review of the environmental aspects of mercury(WHO 1989) have been published. The recommended health-based occupational exposurelimit for metallic mercury vapour (WHO 1980) is 25 µg mercury/m3 air (TWA, long-termexposure) and 500 µg mercury/m3 air (peaks, short-term exposure). The equivalent value forlong-term exposure to inorganic mercury compounds is 50 µg mercury/m3 air (TWA) (WHO1980). A maximum individual urine mercury concentration of 50 µg/g creatinine has also beenrecommended (WHO 1980).
Regulatory standards established by national bodies in various countries and in theEuropean Community are summarized in the data profile of the International Register ofPotentially Toxic Chemicals (IRPTC, 1987).
79

4.2 National positions
Australia
The Australian Market Basket Survey examines the levels of contaminants andpesticides in the Australian diet. The 1984 survey found negligible levels of mercury in allfoods except for fish and other seafood. Surveys since 1984 have only examined the levelof mercury in seafood. The results for cooked battered fish bought in Australian Capital Citieswere as shown in Table 4.1 .
Table 4.1 The Australian Market Basket Surveys forCooked Battered Fish in mg mercury/kg (CEPA 1994)
Year 1984 1985 1990
Median 0.06 0.07 0.07
90th percentile 0.31 0.41 0.57
There is no statistical difference between the results for the three surveys.
Australia has established maximum permissible levels in food as follows:
Fish, crustaceans, molluscs 0.5 mg mercury/kg (mean level)
(sampled according to prescribed methods)
Fish, crustaceans, molluscs 1.0 mg mercury/kg (mean level)
(not sampled according to prescribed methods)
Water 0.001 mg mercury/l
Drinking chocolate, powder 0.03 mg mercury/kg
80

The National Occupational Health and Safety Commission (NOHSC) exposurestandard for aryl and inorganic mercury is currently 0.1 mg/m3 time weighted average (TWA)over eight hours (skin absorption). The occupational health surveillance requirements formercury and the exposure standards are under review.
The Australian Water Quality Guidelines set a maximum of 0.1 µg/l mercury for theprotection of aquatic ecosystems. The limit for drinking water is 1 µg/l. For other uses, suchas irrigation or livestock, the guideline is 2 µg/l. Disposal of wastes at sea requires a permitto be issued under the Environment Protection (Sea Dumping) Act 1981, which specifies thatthe waste should not contain more than 0.00015 per cent total mercury (dry weight).
The Government of Victoria has set Design Ground Level Concentrations (CLCs) forair emissions of mercury:
organic 0.0003 mg/m3
inorganic 0.017 mg/m3.
Denmark
General remarks
Mercury has no known beneficial effects whatsoever and is considered to be one ofthe most problematic substances used by society. It is well proven to cause very serious toxiceffects in humans. Also, in the environment, toxic effects are seen. In addition, due tomercury’s ability to bioaccumulate in the food chain, it could lead to serious toxic effects inhumans. Another very important fact is that mercury once released into circulation in theenvironment is non-degradable and will stay in circulation for a very long time, providingopportunity for toxic effects throughout this period.
General policy
For these reasons the exposure of humans should be kept to an absolute minimum.This can be obtained only by minimizing the use of mercury for all purposes, therebyminimizing both direct exposure and indirect exposure through environmental pollution.
Earlier it was thought that emission control of industrial sources was sufficient toreduce exposure to acceptable levels. It has become more and more obvious that this is notsufficient. This "cleaning" strategy results in waste streams from industry. Besides, productscontaining mercury are still being produced, giving rise to diffuse mercury pollution during useand mercury-containing waste after use.
81

The Netherlands
Risks and risk groups
Risks to man
Elemental mercury
• exposure via air
Exposure to elemental mercury occurs primarily through inhalation. Occasionalmeasurements indicate that the background concentration in the atmosphere is 1.5-2 ng/m-3,and 1.5-5 ng/m-3 on a national scale.
There are no reliable data on effects of exposure levels resulting in creatinineconcentrations in urine of less than 30 to 50 µg mercury/g-1 of creatinine. Theseconcentrations roughly correspond to a mercury concentration in the air of 25-40 µg/m-3.According to the WHO, it cannot be ruled out that mild effects occur in sensitive persons atthese exposure levels (WHO 1991).
The atmospheric concentrations of elemental mercury in the Netherlands are,therefore, a factor of 1000 lower than the levels at which such effects could occur. Based onthese data it is concluded that harmful effects are not expected in the general population atthese exposure levels.
• exposure via amalgam
The general population can be exposed to elemental mercury from amalgam. Acuteexposure to higher mercury concentrations (5-10 µg/m-3) occurs during dental treatment(removal of old fillings with a drill, and burnishing of fillings), while chronic exposure to lower(but elevated) mercury concentrations occurs as a result of corrosion and wear during thefunctioning of the filling.
For the patient, the mercury-vapour concentrations in the surgery and duringtreatment are, considering the brief and occasional nature, probably of less consequence thanthe chronic exposure to lower concentrations of elemental mercury from the fillings. Mercuryfrom amalgam can enter the body by several routes: through the oral mucous membranes,inhalation through the mouth, and ingestion of mercury dissolved in saliva. Estimates of theamount of mercury vapour and inorganic mercury released from amalgam fillings and theextent to which it is absorbed are inaccurate. This is due to, among other things,measurement problems and a multitude of individual factors (such as chewing gum, and thenumber of amalgam fillings). The WHO has estimated an exposure of 3-17 µg of mercuryfrom amalgam per day (WHO 1991). However, according to Dutch investigators (Schuurs andDavidson, 1993 draft) and a recent American report (DHHS 1993), the exposure is lower. TheDutch researchers have estimated a total exposure of 2.3 µg per day. The American reportestimated that seven to ten amalgam fillings result in an additional mercury exposure of 1 to5 µg per day.
82

There has been much discussion recently about the risks of mercury released fromamalgam fillings. In 1991, the WHO concluded that the reports, in which all kinds ofcomplaints and symptoms have been attributed to mercury, do not permit a conclusion aboutthe cause of the complaints. Two epidemiological studies could not demonstrate a relationbetween the number of amalagam fillings and the prevalence of all kinds of specific complaintsand symptoms on a population basis. However, the researchers did not rule out the possibilityof an association on an individual basis. Two recent Dutch studies (Schuurs and Davidson1993; Allard 1993) concluded that there is insufficient scientific evidence that mercury fromamalgam constitutes a health risk. A recent American report (DHHS 1993) arrived at thesame conclusion, but did comment that adequate epidemiological studies on effects ofexposure levels due to amalgam fillings are not available.
In summary, it can be stated that there is insufficient evidence for the existence ofa relation between the number of amalgam fillings and an increased prevalence of all kindsof complaints and symptoms, except in individual cases (allergy, auto-immunity). Thefollowing calculation can serve as an illustration: suppose that 100 per cent of the highestestimated mercury exposure from amalgam (17 µg per day; WHO IPCS 1991) would beinhaled "normally", then this means a mercury concentration in air of 17/20 (20 m3 = air intakeper day) x 1000 ng = 850 ng/m-3. This is less than 4 per cent of the concentration at which,according to the WHO, effects can occur in sensitive persons. Based on this approach,mercury from amalgam does not constitute a risk to the general population.
Inorganic mercury compounds
In calculating the daily exposure to inorganic mercury, it has been assumed thatmercury in all foodstuffs, excluding fish and fish products, is present in the inorganic form.The average and maximum exposure via food has been estimated to be 3.9 and 15.5 µg perday, respectively (corresponding to 0.065 and 0.25 µg/kg-1 body weight per day, respectively,for a 60 kg adult).
The intake from drinking water is negligible (mercury concentration in drinking wateris <0.05 µg/l-1). Assuming that all the mercury in drinking water is in the inorganic form, theaverage additional intake would be <0.10 µg per person per day (at an average consumptionof 2 l of drinking water per day). Given the concentration of inorganic mercury in the ambientair, the intake via inhalation is also negligible.
With regard to inorganic mercury, the available data for oral exposure are insufficientfor deriving a toxicological recommended level. On the basis of a comparison with organicmercury compounds (taking into account a lower absorption and lower toxicity; arbitrarily, afactor of 10) it can be assumed that a daily oral intake of 5 µg/kg-1 body weight (correspondingto 300 µg per day) does not result in adverse effects. This approach is supported by datafrom experimental animal studies.
Based on the above data it is concluded that, even assuming the maximum exposureto inorganic mercury via food and drinking water, adverse effects are not likely to occur in thegeneral population. Assuming the maximum exposure, there is a factor of 20 betweenexposure and the concentration at which (possibly) no harmful effects are expected. It shouldbe noted that this margin can be smaller for infants because of a possible higher absorption.On the other hand, infants will be exposed to mercury to a smaller extent (milk).
83

Methylmercury
In calculating the average and maximum daily exposure to methylmercury, it hasbeen assumed that all the mercury in fish and fish products is present as methylmercury andthat all other foodstuffs and drinking water do not contain organic mercury. The average andmaximum exposure to methylmercury via food has been calculated to be 0.73 and 1.92 µgper day, respectively (corresponding to 0.012 and 0.032 µg/kg-1 body weight per day for a 60kg adult). It is assumed that not more than about 20 per cent of mercury in the ambient airis present as methylmercury. This means an additional methylmercury intake of at most about0.02 µg per person per day (assuming an ambient air mercury concentration of 1.5-5 ng/m-3;80 per cent retention; air intake 20 m3). This intake is considered to be negligible comparedto the oral exposure.
The provisional tolerable weekly intake (PTWI) for methylmercury is 200 µg for adults(excluding pregnant and lactating women and their children), corresponding to 0.5 µg/kg-1 bodyweight per day. These data show that the exposure levels are at least a factor of 10 lowerthan the PTWI, so that harmful effects are not expected at the current methylmercury levels.
For pregnant and lactating women and the developing child, an intake of 40 µg perweek (corresponding to 0.1 µg/kg-1 body weight per day) will possibly not cause adverseeffects. These data show that the maximum exposure is a factor of 3 lower than the PTWI,so that harmful effects are not expected. It should be noted, however, that the consequencesof a possibly diminished ability of infants to excrete methylmercury are not known at thepresent time.
Aquatic environment
A "maximum tolerable concentration" (MTC) for dissolved mercury (inorganic plusorganic) in surface water, both fresh and salt, of 0.008 µg/l-1 has been derived. Thisconcentration in Dutch fresh surface waters corresponds to 0.05 µg/l-1 total mercury. ThisMTC is based on toxicity data for methylmercury, which is more toxic and is bioaccumulatedto a greater degree than inorganic mercury. After a strong decrease in the concentration ofmercury in the seventies, the current concentrations of mercury seem to stabilise for dissolvedmercury at 0.01 µg.1-1 and for total mercury at 0.05 µg/l-1. These concentrations refer toinorganic mercury plus methylmercury in both fresh and sa.1lt water (State and coastalwaters). The MTC mentioned above is exceeded particularly in regional waters: in 1990, atotal mercury concentration of > 0.5 µg/l-1 was measured at 7 per cent of the locationssampled in these waters, a factor of 10 higher than the MTC. However, less than 10 per centof the total mercury in surface waters is present as methylmercury, whereas the MTC hasbeen derived from data for methylmercury. Based on this information, it is concluded that therisk to aquatic ecosystems is limited, certainly in the State and coastal waters (the percentageof the total mercury present as methylmercury in shallow regional waters is not known). Inview of the data underlying the MTC, this limited risk applies also to predators (both birds andmammals) which feed on fish and/or other aquatic organisms.
A MTC for inorganic plus organic mercury in bottom sediments of 0.9 mg/kg-1 dryweight has been derived. The MTC is exceeded in a considerable proportion of thefreshwater sediments: a concentration of 1.6-15 and > 15 mg/kg-1 dry weight was measuredin 20 per cent and 1 per cent, respectively, of the sediment samples from fresh State watersand regional waters, resulting in a risk to organisms living on and in the bottom (benthic
84

organisms). It should be noted that the MTC mentioned above (derived using the equilibrium-partitioning method) probably overestimates the actual risk. This is because sulphide ispresent in sediments, which combines with inorganic mercury to form insoluble mercuricsulphide, so removing a large proportion of the inorganic mercury. It is expected that thebioavailability of this form of mercury is nil or very low. It must be noted, however, thatmercuric sulphide is slowly converted into Hg2+ under aerobic conditions; the rate of thisprocess depends on the extent to which the anaerobic part of the sediment is affected by(bio)perturbation (burrowing activities of bottom organisms; influence of wind and current). Inaddition, mercury is methylated in bottom sediments. Therefore the risk of effects dependson the rates of these two processes, which will vary from location to location.
Terrestrial environment
A MTC for total mercury (inorganic plus organic) in soil of 1.0 mg/kg-1 dry weight hasbeen derived. The current total concentrations in soil are generally < 0.5 mg/kg-1 dry weight,regardless of the soil type (sand, clay, peat) or land use (grassland, arable land, orchard,forest) and therefore lower than the MTC for inorganic mercury. Concentrations ofapproximately 1-10 mg/kg-1 dry weight have been measured in water meadows of the Statewaters and in polders raised with dredged harbour sediments, up to a factor of 10 higher thanthe MTC for inorganic mercury. In view of the toxicity data underlying the MTC, there is a riskthat microbe-mediated processes are adversely affected at such mercury levels. Because ofthe lack of toxicity data, no statement can be made about effects on other soil organisms.
Mercury exists in soil mainly as inorganic mercury, but may also occur as elementalmercury and methylmercury. There are no data on the percentage of total mercury in eachof these forms in Dutch soils. However, when "only" 5-10 per cent of the total amount ofmercury is present as methylmercury, the MTC for methylmercury is exceeded in most soilsand, considering the data underlying this MTC, there is a risk of biomagnification.
FEASIBILITY OF EMISSION REDUCTION OBJECTIVES
The general emission objective formulated for the priority substances calls for areduction in the emissions by about 60 per cent in the year 2000 relative to 1985 (MV3 1993);the emissions to water should have been reduced by about 70 per cent and those to air by50 per cent (SPEED 1993). A reduction in the emissions to (agricultural) soil, water and airof 50 per cent, 50 per cent and 80 per cent, respectively, is achievable by the year 2010. Onthe basis of two long-term scenarios (European Renaissance and Global Shift) presented inthe National Environmental Survey 1993-2015 (MV3 1993), a reduction in the emissions to(agricultural) soil, water and air of 40 per cent, 70 per cent and 65 per cent is expected for theyear 2000, while the objective is 80 per cent, 70 per cent and 50 per cent, respectively. Itfollows from this that the emission objective for air will be achieved. Regarding water thereis uncertainty, due chiefly to the uncertain emission objective in the phosphorous fertilizerindustry. The emission objective for (agricultural) soil, however, will not be achieved. Thismeans that further accumulation of mercury in soil will occur. The rate of accumulation in theupper 30 cm of the soil is estimated to be about 0.2 µg/kg-1 per year, roughly correspondingto an increase in concentration of about 0.1 per cent per year. The associated risks to manare limited. Although the relatively high mercury concentrations in shallow groundwater could
85

entail a possible threat to the future drinking water supply, the concentrations (0.005-9.6 µg/l-1)are relatively low compared to the total oral intake of mercury (about 0.4 µg/kg-1 body weight).The risks to ecosystems (in the long term) are more difficult to asses. At present, there isinsufficient insight into the chemical speciation of mercury in soil, the toxicity to soil-inhabitinganimals, and the concentrations in soil-inhabiting animals in the mercury-contaminated areasand the resulting risks to predators.
With regard to the calculated increase in concentration of 0.1 per cent per year in theupper 30 cm of the soil, attention should be drawn to the environmental protectionrequirements as laid down in the Building Materials Decree (draft AMVB), in which theimmission values of building materials are based on a soil mercury input resulting in aconcentration increase of not more than 1 per cent of the desirable level (0.3 mg mercury/kg-1)over a 100-year period (corresponding to 0.03 µg mercury/kg-1 per year) in 1 m3 of standardsoil which is to be regarded as homogeneous. The increase in the soil mercury content asa result of deposition is therefore about a factor of 2 higher than the maximum tolerableincrease due to leaching from building materials.
MEASUREMENT STRATEGIES
The present integrated criteria document supports to a considerable degree therecommendations as set down in the Evaluation Report National Measurement Programme1992. In this report, a distinction is made between exploratory measurement campaigns andregular measurement programmes, with the following being proposed:
Exploratory research
• In view of the occasional occurrence of high mercury concentrations in shallowgroundwater, a study aimed at the establishment of a possible relation betweenacidification and high(er) mercury concentrations is proposed.
• Information on concentrations in fauna in the Netherlands is limited and relatesexclusively to fauna in (relatively unpolluted) nature reserves. Further researchis advisable in order to gain insight into these concentrations in mercurycontaminated areas such as water meadows and polders raised with dredgedharbour sediments, also for assessing the risk to top predators.
Multi-year programme
• Continuation of measurements on suspended and bottom sediments and inorganisms (including fishery products) in fresh and salt surface water. At highconcentrations, measurement of methylmercury is also advisable.
The Evaluation Report Mercury of the CCRX (Pieters et al. 1993) emphasizes theimportance of measurements in fish and water birds.
86

Based on the available knowledge, it is recommended to pay attention especially tothe concentration of methylmercury in shallow regional waters and in the various soils andsoil-inhabiting animals, as part of the exploratory research.
CONCLUSIONS AND RECOMMENDATIONS
Environmental compartments
It is concluded that the emissions of mercury to the Dutch environment have fallensharply in the past few years. With regard to the environmental compartments, the followingconclusions can be drawn and recommendations made:
Soil and groundwater
In general, the mercury input to soil is determined to a considerable extent byatmospheric deposition. Although it is assumed that the deposition (due mainly to foreignsources) has decreased slightly, further accumulation of mercury will occur. This holds trueto a greater extent for agricultural soil, where the input from the use of animal manure andchemical fertilizers in particular is not fully compensated for by removal by crop plants.Autonomous developments will result in a (further) emission reduction of up to 40-50 per cent(period 2000-2010), while the emission objective has been set at 80 per cent in order toprevent further accumulation of mercury in soil. In addition to a growing demand for measureson an international level, the question remains to be solved of how grave the risks associatedwith the mercury contamination of soil are. The risks to man are limited, but those toecosystems (in the long term) are difficult to assess. For this purpose, further research intothe concentration of methylmercury in soil, its toxicity to soil-inhabiting animals, and theconcentrations in soil-inhabiting animals in mercury-contaminated areas, such as watermeadows and harbour sediments raised polders, is advisable.
Surface water and sediments
The mercury concentrations in surface water have fallen sharply as a result of thereduction in emissions. The decrease in the mercury contamination of fish, too, can be partlyattributed to this. The risk associated with the current concentrations in surface water is nilfor man and, probably, only limited for aquatic ecosystems and animals preying on fish.Considering the expected further emission reductions, this risk will decrease further in thefuture to an acceptable level.
In sedimentation areas, many highly contaminated sediments have gradually beencovered with newly supplied material having a lower mercury content. However, at locationswhere sedimentation does not occur the upper layer is heavily mercury contaminated. Interms of risks, the significance of this mercury load in the sediments is unclear. Most of themercury in Dutch sediments is present as very stable HgS, and not bioavailable to mostorganisms. However, sulphate-reducing bacteria in sediments are capable of converting thisform of mercury into methylmercury, which is readily taken up and only slowly excreted. Atpresent, there is insufficient insight into the dynamics of this conversion process and the levels
87

of methylmercury in the sediments of Dutch surface waters, particularly the shallower regionalwaters. Further research into this matter is advisable.
Air
The atmospheric mercury emissions in the Netherlands have fallen in the past fewyears, and will probably decline further to a level which surpasses the emission reductionobjective. Present and thus certainly future airborne mercury concentrations do not entail risksto man or ecosystem; the atmospheric mercury contamination is only of significance in relationto deposition.
Amalgam
Based on recent literature studies, it has been concluded that there is insufficientevidence for the existence of a relation between the number of amalgam fillings and anincreased prevalence of all kinds of complaints and symptoms. On the basis of indicativecalculations, it can be computed that the maximum exposure via inhalation is at least a factorof 25 lower than the concentration at which, according to the WHO, effects can occur insensitive individuals. Therefore, it is concluded that the risk associated with mercury fromamalgam lies, in practice, within acceptable limits.
In case of policy arguments to reduce the existing risk further, the following factsshould be considered.
Replacement of the current number of amalgam fillings (70-120 million in theNetherlands) has disadvantages. These disadvantages are not only of a financial nature (costof replacement, cost of employing other material such as composite, gold or porcelain) orphysical nature (discomfort for patients), but also concern public health aspects: the removalof amalgam is also accompanied by exposure to mercury. Although this exposure is ofshort(er) duration, the total exposure can be greater than that from not replacing the amalgamfillings. In addition, consideration should be given to the alternatives as filling, their dentalaspects, costs, and risks to man and the environment.
88

Norway
Mercury has no known essential role in biological processes, but is one of the heavymetals that has the most severe effects on the environment and on human health. The riskreduction measures regarding mercury should therefore be based on a concern both for healthand for the environment.
The ecotoxicological and toxicological properties of mercury make it one of the mosthazardous substances released to the environment. Despite the great reductions in theamounts discharged per year, the mercury concentrations in the atmosphere and in the soilare increasing and mercury is still accumulating in the soil and aquatic compartments. InNorway increased concentrations of mercury are still measured in several fjords as well as infresh water sediments. Therefore, restrictions on the consumption of some fish and shellfishspecies are still enforced in some areas.
The mercury released to the environment today, directly or indirectly, willbioaccumulate in the food chain and/or accumulate in the soil and in sediments. Thecumulative effect may be both serious ecotoxicological and food-related problems.
Hence, it is of utmost importance to achieve the greatest possible reduction in themajor sources of inputs of mercury to the environment.
Risk reduction on mercury is clearly an international issue. Mercury and mercury-containing products, as well as airborne or waterborne mercury as pollutant, will cross borders.International actions are therefore needed to reduce and solve today’s and future problemsof mercury pollution.
Mercury should be substituted wherever possible according to the technologyavailable. It is most important to reduce/substitute the use of mercury for those applicationsthat give rise to direct emissions/spreading and those that involve the greatest risk ofhazardous effects. Research and development should be encouraged to find environmentallyacceptable substitutes for areas of application where these alternatives do not exist today.
The aim should be to phase out the use of mercury.
Meanwhile, the amount of mercury released to the environment should be minimized,and highly effective recollection and recovery systems for mercury-containing products shouldbe established.
89
Sweden
Mercury is extremely toxic, is readily taken up by organisms and tends to accumulatein the food chain. In Sweden, about 10,000 lakes are exceeding the national limit of 1 mgmercury/kg-1 in 1 kg pike. Fish from low productive lakes, even in remote areas, have beenfound to have high contents of mercury. Since the end of the 1960s, the emission of mercuryin Sweden has been reduced dramatically. However, environmental concentrations areincreasing. The general pattern of atmospheric deposition of mercury with decreasing valuesfrom the southwest part of the country towards the north, strongly suggests that the depositionover Sweden is dominated by sources in other European countries.
Mercury as an environmental pollutant is a global problem and thus an internationalapproach is needed. The main strategy for risk reduction should be phasing out.
Most mercury-containing products can be substituted.
Products are an important source of environmental pollution. Mercury-containingproducts are long-lasting. There is, and has probably been for several centuries, anaccumulation of mercury in society. When not separately discarded, the mercury will reachthe environment through either waste incineration or long-term leakage from landfills.Therefore, it is important to plan for improved separate collection and for safe disposal ofmercury and mercury-containing products. In the long run, a strategy built on recycling ofmercury is not desirable.
There is an urgent need to phase out mercury and mercury compounds for allapplications unless replacement products are not available according to the state of the art.
The Swedish Parliament has stated that the use of mercury in Sweden shall cease.The aim is to end the use of mercury in processes and products, with a few exemptions, untilthe year 2000.
90

United Kingdom
Introduction
Mercury is present in all parts of the environment. This is a consequence ofemissions both from natural sources and from industrial use of mercury and its compounds.Industrial emissions may arise either from the intentional use of mercury in a particularprocess or from the burning of fossil fuels, metal processing and the use of fertilizers as aresult of its occurrence as trace impurities in raw materials. The total quantity mobilised byhuman activities is smaller than that mobilized naturally, but emissions resulting from humanactivities may nevertheless be important because they may result in high local concentrationsof mercury.
Mercury is a toxic substance having no known function in human biochemistry orphysiology. It is desirable on health grounds that human exposure to mercury be kept as lowas practicable. Where contamination by mercury exists or is likely to arise, action to reduceman-made contributions progressively should be taken as and when appropriate, takingaccount not only of the desirability of improving safety margins, but also of industrial economicviability, technical adequacy, and the availability of less hazardous substitutes.
Health Effects
Elemental mercury and inorganic mercury are poorly absorbed into body tissues,most being excreted shortly after ingestion. In contrast, the majority of methylmercurycompounds ingested with food are absorbed but excreted only very slowly. Occupationalexposure usually occurs via the lungs in the vapour phase and absorption through skin. Onceabsorbed into the body, all forms of mercury become widely distributed in tissues, the greatestaccumulation occurring in the kidney and liver with adverse effects. Elemental andalkylmercury compounds also enter the brain and, if found in large enough quantities, cancause irreversible damage to the central system.
Exposure
Mercury can be taken up by plants and animals in freshwater, marine and terrestrialenvironments. Food is a major source of exposure to mercury for most people, i.e. those notoccupationally exposed. In the UK the average dietary intake of mercury is falling. In 1987the average dietary intake was 2-3 micrograms per day, of which 1 microgram may be in theform of methylmercury with the largest intake commonly derived from fish. Intake is thereforewell below the FAO/WHO Expert Committee on Food Additives provisional tolerable weeklyintake for mercury in the diet of 0.3 milligrams, of which not more than 0.2 milligrams shouldbe organic mercury. This limit is respected by the UK Government and upheld by continuedefforts to reduce the levels of discharges of mercury to the sea, as reflected in the target ofa 70 per cent reduction for inputs by 1995 which was established at the Third North SeaConference.
91

United States
United States agencies concerned with the health and environmental effects ofmercury exposure, including the US Environmental Protection Agency, the Department ofHealth and Human Services, the Department of Transportation, and the Department of Labor,have drawn a number of conclusions regarding risks resulting from exposure to mercury.
Sources of Exposure (from ATSDR 1992b unless otherwise noted)
The major source of mercury exposure in the general population is throughconsumption of foods contaminated with mercury as a result of environmental releases ofmercury and its subsequent accumulation in the food chain. Consumption of fish is the largestsource of methylmercury exposure, while consumption of other foods is the primary source ofexposure to inorganic forms of mercury. The largest anthropogenic contributors of mercury tothe environment are coal-fired power plants, municipal waste combustors, and medical wastecombustors. These sources release mercury to the air, with subsequent deposition to land andsurface waters where transformation to methylmercury and bioaccumulation can occur.Methylmercury is found in almost all fish, with most species demonstrating levels around 0.1to 0.2 ppm, and with several predatory species showing higher levels of 1 to 2 ppm.
Exposure to elemental mercury vapor can occur in certain occupational settings andin the general population through silver-mercury dental amalgams. A 1980 survey by theNational Institute for Occupational Safety and Health (NIOSH) estimated that 70,000 workers,of whom about one-third were women, were potentially exposed to mercury vapor in theworkplace (ATSDR 1992a). Most of these workers were employed as laboratory technicians,registered nurses, and machine operators, although workers employed in many other fieldsmay be at risk of exposure. Mercury’s industrial uses are primarily in the production of chlorineand caustic soda, in ink manufacture, in electroplating operations, and in leather tanning andfelt making. Mercury constitutes a significant weight fraction of silver dental amalgams.However, studies have not shown a clear and consistent relationship between the presenceof amalgam fillings and blood levels of mercury. A recent report by the US Public HealthService (CCEHRP 1993) concludes that "current scientific evidence does not show thatexposure to mercury from amalgam restorations poses a serious health risk in humans, exceptfor an exceedingly small number of allergic reactions." However, the report cautions that thereare significant gaps in the base of information relevant to assessment of chronic low-levelmercury exposure. Mercury is also found in a variety of common household products includingfluorescent lamps, batteries, electrical switches, and thermometers. Exposure to consumersis not expected to occur during normal use of these products.
Hazard Summary (from ATSDR 1992b, IRIS 1992, NTP 1993)
Most species of mercury are well-absorbed by their expected routes of exposure.Elemental mercury vapor is rapidly absorbed via inhalation; inorganic and organic mercurycompounds are absorbed through ingestion and dermal exposure. The available evidenceindicates that the metabolism and mechanisms of toxicity are similar for all species of mercury.However, some differences exist in the absorption and distribution of the various speciesbecause of differences in their respective physical and chemical properties. For example,elemental mercury vapor is absorbed especially quickly and accumulates in brain tissue to a
92

greater extent than other mercury species. All forms of mercury can cross the placenta andexert their effects on the developing fetus.
The central nervous system (CNS) and kidneys are the key targets of mercury toxicity,with CNS effects apparently occurring at lower doses. A particularly severe manifestation ofmercury poisoning is a syndrome known as acrodynia that occurs almost exclusively inchildren. Symptoms of acrodynia include apathy, anorexia, fever, kidney damage, and mostcharacteristically, a painful blistering and peeling of the skin on the hands and feet.
EPA has established reference doses for certain mercury compounds. The ReferenceDose (RfD) is an estimate of daily exposure to the human population that is likely to be withoutan appreciable risk of deleterious effects during a lifetime. An analogous estimate forinhalation exposures is called a Reference Concentration (RfC). The RfD for oral ingestion ofmethylmercury has been set at 0.0003 mg/kg/day based on CNS effects observed in humanpoisoning incidents. The RfD Work Group has recommended lowering the RfD formethylmercury to 0.00005 mg/kg/day based on observations of retarded mental developmentand paresthesia in children whose mothers were exposed to methylmercury during pregnancy.The RfD for phenylmercuric acetate is 0.00008 mg/kg/day based on kidney damage observedin a chronic dietary study in rats. An oral RfD and inhalation RfC on inorganic mercury arepending. A tentative RfC of 0.0003 mg/m3 has been used by EPA Offices. EPA currentlyclassifies inorganic mercury as a "Group D" carcinogen, "not classifiable as to humancarcinogenicity" because of inadequate data. However, a 1993 National Toxicology ProgramReport concluded that there was "some evidence of carcinogenic activity" based on anincreased incidence of forestomach tumors in male rats administered mercuric chloride bygavage.
Risk Reduction Activities
In order to help reduce environmental and occupational exposures to mercury, anumber of US government agencies and industry groups have initiated regulatory activitiesand/or taken voluntary measures in an effort to promote public health.
Occupational Standards
The Occupational Safety and Health Administration (OSHA), part of the Departmentof Labor, has established a number of standards for industries using mercury. The OSHAstandards set permissible exposure limits (PEL) on the concentration of mercury in workplaceair over certain exposure intervals: an 8-hour time weighted average (TWA); a short termexposure limit (STEL), a maximum level for a 15-minute period; and a ceiling limit, a maximumconcentration never to be exceeded in the workplace (OSHA 1989). The National Institute forOccupational Safety and Health (NIOSH) defines an additional limit called the IDLH(Immediately Dangerous to Life and Health) level, defined as the maximum environmentalconcentration of a contaminant from which one could escape within 30 minutes without anyescape-impairing symptoms or irreversible health effects. NIOSH standards are notenforceable regulations but serve as guidance to OSHA and other regulatory bodies (NIOSH1990). The American Conference of Governmental Industrial Hygienists (ACGIH), anindependent association of professionals, has established an 8-hour TWA exposure limit calleda Threshold Limit Value (TLV) (ACGIH 1990).
93

Transportation
The Department of Transportation (DOT), under the Hazardous MaterialsTransportation Act, designates mercury and its compounds as hazardous substances whichare subject to requirements for packaging, shipping, and transportation (49 CFR 172.101,Appendix A).
Standards for Point Sources and Environmental Media
The Environmental Protection Agency (EPA) regulates mercury through actions takenin a number of its program offices. To protect the quality of the nation’s surface waters, theEPA has developed guidelines, called Ambient Water Quality Criteria, that set acceptableconcentrations of mercury in water for protection of human and aquatic life. These criteria areused to guide the development of specific effluent standards that regulate the release ofmercury in effluent wastewaters from industrial facilities and municipal waste treatment plants.These controls are implemented through specifications in individual discharge permits underthe National Pollutant Discharge Elimination System. EPA also regulates mercury as aHazardous Air Pollutant under section 112 of the Clean Air Act, with National EmissionStandards for certain industries. EPA’s Office of Emergency and Remedial Response (OERR)has set rules for emergency planning at facilities where mercury is used or stored on site, andfor mandatory reporting requirements when releases of mercury occur. EPA’s Office of SolidWaste (OSW) classifies mercury as a hazardous substance, a designation that regulates thestorage, transport, recycling and disposal of mercury wastes. In 1991, the EPA initiated the"33/50 Program", a special program to help reduce industrial releases of mercury and 16 othertoxic substances into the environment. The goal of the program is to encourage companiesto commit to voluntarily reduce their releases of some or all of these toxics by 33 per cent by1992, and 50 per cent by 1995.
Drinking Water Standards
As part of its National Primary Drinking Water Standards required under the SafeDrinking Water Act of 1986, EPA has established a maximum contaminant level (MCL) forinorganic mercury in drinking water. The Food and Drug Administration has established apermissible level of mercury in bottled water (21 CFR 103.35).
Food Standards
The Food and Drug Administration (FDA) of the Department of Health and HumanServices is responsible for regulating commercial fish and has established action levels formercury in all edible seafood.
Pesticides
EPA, under the Federal Insecticide, Fungicide, and Rodenticide Act, has restrictedthe use of mercury-containing pesticides to a small number of specific applications. The useof mercury preservatives or antimicrobials in cosmetics has been limited by the FDA, in bothits application and acceptable concentrations.
94

Drugs and Medical Devices
FDA regulates the safety of mercury-containing substances that are used in "Over-the-Counter" (OTC) drugs such as anorectal products, vaginal contraceptives, and topicalantiseptics. FDA also regulates dental mercury and amalgam alloys.
Other Products
Consumer products containing mercury that end up in municipal waste have raisedsignificant concerns with local, state, and federal authorities. Manufacturers of products suchas batteries, fluorescent lamps, coated papers, and fever thermometers have taken steps toreduce or eliminate mercury in these products. EPA in January 1993 proposed a regulationthat would allow states, manufacturers and others to set up special collection programs tofacilitate the recycling and proper management of certain hazardous consumer wastes.
95

96

CHAPTER 5
MECHANISMS FOR RISK REDUCTION
Many OECD Member countries have taken steps to reduce risks from mercury.Requests for information on mercury risk reduction activities were made to all Membercountries in 1993-94. The national viewpoints presented in this chapter are mainly based onthe responses to these requests.
Responses were received from the majority of Member countries. Also included inthis chapter are statements on risk reduction initiatives from the European battery and chlor-alkili industries.
The information provided by Member countries is summarized in the tables inAnnex A to this chapter.
97

98

Australia
Releases to air, water and soil are controlled by a variety of legislation or regulation.Sources controlled include:
• energy production with burning of coal• refuse incineration• metal mining and production• gold mining• chlor-alkali industry• dental clinics• crematoria• other emissions.
At present different regulations exist in the different states concerning mercury inbatteries.
No detailed information was received concerning legislation for use of mercury inproducts.
There is limited use of mercury in paint manufacture, but exact figures are notavailable.
The phase-out of mercurial fungicide sprays from turf applications will be completeby the end of 1996, with sales to terminate by the end of 1994. Methoxyethylmercuric saltsare still used as a pre-plant dip on sugar cane setts, on average once every seven years.Ongoing monitoring of canefield soils indicates slight increases in mercury concentrations, butnot beyond levels found in nature (see Appendix 6). It is anticipated that this use will bewithdrawn as soon as a suitable alternative is found.
Austria
The following detailed information has been received:
The use of mercury in antifouling paints was banned in 1990.
There has been a deposit on fluorescent lamps since 1991.
Batteries which contain more than 0.001 per cent mercury are prohibited; retailershave to take back used batteries and accumulators for controlled disposal.
Mercury in plant protection products and seed dressing is prohibited.
Air pollution through boiler plants (waste incineration) must not exceed 0.1 mg/m3 insmall and medium-sized plants and 0.05 mg/m3 in big plants.
99

Mercury-containing waste has to be treated as hazardous waste.
A quality standard exists for dental amalgams, which have to be labelled properly.In addition, dentists have to install amalgam separators with a separation efficiency of at least95 per cent.
The mercury limit for wastewater emissions to river or sewer and leachate emissionsis 0.01 mg/litre.
Groundwater must not contain more than 0.001 mg mercury/litre.
Mercury limits for drinking water are 0.001 mg/litre.
Limits for sewage sludge exist.
Quality standards for food range between 0.01 and 1.0 mg/kg.
The occupational health standard is 0.005 ppm.
Belgium
Only the following detailed information concerning regulations for water has beenprovided:
• Base quality for normal surface water: 0.5 µg/litre.• Emissions to surface waters (wastewater): max. 0.15 mg/litre.• Monthly: max. 0.1 g/tonne chlorine produced.• Chemical plants using mercury catalyst for production of other than vinylchloride:
monthly: max. 5 g/kg used mercury.• Fabrication of organic and non-organic mercury compounds; non-ferro and
treatment of mercury-containing toxic waste: monthly: max. 0.05 g/kg mercuryutilized.
• Fabrication of primary batteries: monthly: max. 0.03 g/kg mercury utilized.• Textiles: max. 0.02 mg/litre.• Cleaning of vessels: max. 0.01 mg/litre.• Pigments, paints, inks; cleaning of ships and cars transporting fluids: max.
0.001 mg/litre.• Pulp and paper industry: 0.
Use of mercury in paints has been forbidden since 1991, and use of mercury in seeddressing since 1990.
Use of mercury-containing batteries is regulated by the EU as described in theEuropean Union section of this chapter.
100

Table 5.1 Sectorial Norms for Mercury in Industrial WastewaterDischarges in Belgium
Activity or sector Mercury
Surfacewater
Sewer
Chlorine production
pickle: daily average per tonne of chlorine capacity 0.5 g mercury
dischargeprohibited
total discharge: month 0.05
· day 0.2
· max 1 day/month 2
new plants: discharge of lost pickle prohibited 0
Chlorinated hydrocarbons, derivates and polymers (pesticides excluded)
solvents: specific discharge volume 100 m3/kg mercury
· total mercury 0.15
· total mercury: day 10 g/kg
· total mercury: month 5 g/kg
VCM: specific discharge volume 2 m3/tonne
· total mercury 0.15
· total mercury: day 0.2 g/tonne cap.
· total mercury: month 0.1 g/tonne
Pharmaceutical industry
pure chemical: total mercury 0.15
· total mercury: day 0.2 g/kg 0.1 g/kg
· total mercury: month 0.1 g/kg 0.05 g/kg
semi-synthesis and fermentation: total mercury 0.15
· total mercury: day 0.1 g/kg
· total mercury: month 0.05 g/kg
laboratories: total mercury 0.15
· total mercury: day 0.1 g/kg
· total mercury: month 0.05 g/kg
Laboratories 0.01
Varnishes, paints, inks and pigments
· total 0.001 0.1
Non-ferrous metals
· total 0.15
· day 0.1
· month 0.05
Paper, board and pulp <DL
Cleaning of cars and ships transporting fluids 0.001 0.005
Dumps 0.15
Textile processing (ennoblement) 0.02
Cleaning of vessels 0.01
Remark: when not mentioned, unit is mg mercury/litre
101

Canada
Canada has federal legislation, regulations and guidelines relevant to the control orreduction of mercury in air, water, waste effluents, marine disposal, contaminated sites,consumer products, pest control products and for occupational exposure. A document entitledRegulatory Framework for Risk Management of Mercury in Canada is available.
Federal regulations which set criteria for air emissions from chlor-alkali factories arespecified in Annex 6 of this document. The maximum amount of mercury that may bedeposited in liquid effluent from chlor-alkali plants is 0.0025 kg mercury per ton of chlorineproduced (see Annex 6).
The recommended maximum concentration of mercury dissolved in effluent wastesis 0.001 mg/litre (National Guidelines on Physical-Chemical-Biological Treatment of HazardousWaste). The Special Waste Management Regulations in the province of British Columbiaspecify maximum mercury emission criteria of 0.2mg/m3 for hazardous waste incinerators.Recommendations for stack discharge limits and anticipated emissions for mercury are madein the Operating and Emission Guidelines for Municipal Solid Waste Incinerators published bythe Canadian Council of Ministers of the Environment (CCME). Provinces use theseguidelines when issuing permits to facilities under their respective jurisdiction. Mercuryemissions of up to 0.2 mg/m3 are anticipated from municipal solid waste incinerators operatingunder good combustion conditions and equipped with dry scrubber fabric filter systems.
Interim criteria for the assessment and remediation of water and soil have beenpublished by CCME (Interim Canadian Environmental Quality Criteria for Contaminated Sites,see Annex 5). It should be noted that these criteria are to be subjected to a validationprotocol currently being finalised within CCME.
Centralised composting sites are becoming increasingly widespread as a result ofrecycling activities. The number of centralised composting facilities, private and municipal,throughout Canada has more than tripled, from 30 sites in 1989 to over 120 sites in 1994.The amount of mercury allowed in compost is regulated under the Fertilizers Act, administeredby Agriculture Canada, at a maximum concentration of 5 mg/kg. The CCME is presentlyworking on new national guidelines for compost. Their proposal is a maximum mercuryconcentration of 0.8 mg/kg or 5 mg/kg depending on the use (unrestricted or restricted).
In Canada, disposal at sea is only permitted for non-hazardous substances andwhere it is the environmentally preferable and practical alternative. Permits are not grantedif practical opportunities are available to recycle, reuse or treat waste. Canada controlsdisposal at sea and meets its international obligations under the London Convention (1972)by means of a permit system in place since 1975. The CECA is the enabling legislation forthe permit system and includes provisions for making regulations. Under the Ocean DumpingRegulations (1988), materials containing mercury can be authorised for ocean disposal onlyif mercury occurs at or below the regulated levels (i.e. in the solid phase of a waste,0.75 mg/kg, and in the liquid phase of a waste, 1.5 mg/kg). Applications for disposal ofdredged or excavation material must include concentrations of mercury in the materialproposed for sea disposal. In keeping with decisions made at the London Convention 1972,Canada is in the process of amending the regulations to prohibit sea disposal of industrialwastes.
102

It is prohibited to sell, advertise or import into Canada toys, equipment and otherproducts for use by a child in learning or play that have applied to them a decorative orprotective coating that contains any compound of mercury introduced as such (HazardousProducts Act). Formulations containing mercury as an active ingredient are approved asmaterial preservatives for commercial products, primarily wood, under the Pest ControlProducts Act. No registered pesticide with mercurial compounds is allowed as a fungicidetreatment in seed dressing.
The Domestic Substances List, established under CEPA, identified 32 mercurycompounds in commerce in Canada. Mercury compounds not on this list are deemed to benew to Canadian commerce, and their introduction requires notification according to the NewSubstances Notification Regulations under CEPA.
Canada has Environmental Choice Guidelines concerning mercury in batteries asspecified in Annex 1, with elimination of mercury in batteries to be achieved between 1994and 1996. A voluntary removal of mercurial compounds in interior latex paint has been doneby the major Canadian paint manufacturers, but this does not apply to exterior paints. TheCanadian Paints and Coatings Association has a recycling programme for waste householdpaint and containers with limited mercury content.
Occupational exposure limits for mercury are equivalent to the values published bythe American Conference of Government and Industrial Hygienists (ACGIH) in "ThresholdLimit Value and Biological Exposure Indices" (Canada Labour Code). The presence ofmercury in workplace substances must be disclosed on material data safety sheets (IngredientDisclosure List).
Guidelines for food safety, based on technical reports from annual meetings of thejoint FAO/WHO Expert Committee on Food Additives, recommend that the total concentrationof mercury in the edible portion of fish must not exceed 0.5 ppm on a wet weight basis.Swordfish and shark are exempted; however, consumption of these species should not exceedone meal per week.
Canada has established national and regional data bases which identify elevatedlevels of metals in various media. For example, the National Geochemical Reconnaissancedata base contains sediment and/or soil data for an area 2.1 x 10⁶ km2, 80 per cent of whichcontains mercury data. There are also numerous provincial initiatives such as large data basesfor mercury in fish and baseline geochemistry programmes.
103

Denmark
Present regulation
Industrial use and emission of mercury is regulated by the Environmental ProtectionAct.
The mercury content in sewage sludge for agricultural purposes is limited, and from1995 will be further limited.
Mercury-containing waste has to be treated as hazardous waste.
Future regulation
To minimize use, the existing regulation is not sufficient. Alternative substances tomercury and processes not involving mercury have to be used. Fortunately, alternatives existfor all major uses.
The implementation of this policy is done by banning the use of mercury for productsand processes where alternatives exist. A draft regulation has been issued which meets thisobjective. The content of the draft regulation is:
• The general rule is that sale of mercury and mercury-containing products isprohibited from 1 July 1994.
• From this general rule derogations are made for those special areas, wherealternatives are not available at present. Thermometers containing mercury(except for very special uses, which are listed) are prohibited at once. Dentalfillings containing mercury (except for molar teeth, where the date is 1999) isprohibited in 1995. Derogations until further notice are also made for speciallisted uses of light sources, contacts, pressure gauges, barometers, electrodesand chemicals. Finally, use is permitted until further notice for research,education, vital applications in aircrafts, repair of existing mercury-containingequipment, and as a natural pollution in coal. For batteries and electrolysis,special rules apply.
(Also see the section on the Nordic countries in this chapter.)
104

Finland
Emissions to air, water and soil are regulated by the Air Pollution Control Act, theWater Act and the Waste Act. Emission limits are set on a case-by-case basis during theenvironmental permit procedure. Finland has also implemented the EEC Directives for thechlor-alkali industries (82/176/EEC) and other sectors (84/156/EEC) as well as for municipalwaste incineration plants (89/369/EEC and 89/429/EEC). These Directives include emissionlimits.
Use of mercury for seed dressing has been forbidden since October 1992.
There is no general ban or restriction on the use of mercury in paints. The use ofmercury in antifouling paints was banned in 1992.
Regulations concerning the use, delivery, labelling and collection of mercury-containing batteries are under preparation. These regulations, enforced in Finland, will be theEEC Directives 91/157/EEC and 93/86/EEC on batteries.
According to the Council of State Decision (282/94), sludge or a sludge mixture foragricultural use may contain maximum 2 mg mercury/kg dry weight.
Finland has approved the 1988 Declaration on the Protection of the MarineEnvironment of the Baltic Sea Area, of the Helsinki Commission (HELCOM), setting the goalof a 50 per cent decrease in discharges and emissions by 1995.
The quality standard for drinking water, established by the Ministry of Social Affairsand Health, is 1 µg mercury/litre.
According to a recommendation of the National Board of Health, fish that contains0.5-1 mg of mercury/kg should not be eaten more than once a week, and fish containing morethan 1 mg of mercury/kg should not be used at all in the human diet.
The Ministry of Social Affairs and Health has recommended that the use of amalgamsin dental fillings should cease by year 2000.
(Also see the section on the Nordic countries in this chapter.)
105

France
Control of emissions to air, water and soil are regulated by different EEC Directives,as described in the European Union subchapter.
A French order prohibits the incineration of waste containing mercury.
Use of mercury-containing batteries, paint and seed dressing is also regulated by theEU and described in the European Union subchapter.
In the future, emissions of mercury to air, water and soil will be regulated inaccordance with EEC, Paris Commission and the International Commission for Protection ofthe Rhine requirements.
The future strategy for use of mercury in products is pending, while waiting for furtherinformation in relation to:
• risk evaluation for man and environment• efficacy• economic feasibility
concerning the products or methods for substitution.
Germany
Control of emissions to air, water and soil is regulated by national legislation basedon the different EEC Directives described in the European Union subchapter.
Administrative rules on the quality standards of wastewater from dental treatmentimply that the mercury load of raw wastewater from dental treatment must be reduced by 95per cent before mixing with domestic sewage. This can be ensured by utilisation of amalgamseparators with a separation capacity of a least 95 per cent.
Sewage sludge may only be used as manure on soils which contain not more than1 mg mercury/kg air-dried soil. In addition, the mercury concentration in the sludge must notexceed 8 mg mercury/kg dried sludge.
Mercury compounds or preparations containing mercury compounds must not beused or marketed for the following purposes: as antifouling, for the protection of wood, for theimpregnation of heavy industrial textiles, and for the production of yarns for heavy industrialtextiles, and for water processing in industrial, business and municipal sectors independentof its use.
Since 1983, paints may not be provided with mercury preparations as antifoulingcompounds. Since 1982, pesticides consisting of or containing mercury compounds may notbe used.
106

It is planned that the chlor-alkali industry shall phase out the use of mercury before2010.
An ordinance was presented to the government on 8 July 1992 with the followingmain purposes:
• A ban on alkaline-manganese batteries with more than 0.025 per cent mercuryfrom 1 January 1993. For special applications, i.e. at extreme temperatures,batteries up to 0.05 per cent mercury are allowed.
• An obligation to label batteries containing more 0.025 per cent mercury or morethan 25 mg mercury/battery cell.
• To ensure that batteries are collected separately and raise the recycling rate ofbatteries.
Restrictions on the use of mercury in thermometers, contacts and similar instrumentsare under discussion.
Ireland
Control of emissions to air, water and soil are regulated by different EEC Directives,as are mercury-containing batteries, paint and seed dressing. All are described in theEuropean Union subchapter.
Japan
Different environmental legislation/regulation controls emissions to air, water and soil.
Refuse incineration is regulated concerning releases to soil, and by a waste disposaland public cleaning act.
Regulations exist for metal mining and production, which control emissions to waterand soil.
Other emissions are controlled by the Water Pollution Control Act, which sets thefollowing effluent standards:
• total mercury 0.005 mg/litre• alkyl mercury compounds not detectable
107

The purpose of the law is to prevent the pollution of public water areas andgroundwater, and thereby to protect human health and to conserve the living environment, bycontrolling effluents from factories and establishment into the public water areas andpermeations into underground. It further aims at promoting countermeasures for householdwastewater, and to protect the sufferers by deciding the liability of the proprietor of thefactories and establishment to compensate for any damage.
Japan has established Environmental Quality Standards (EQS) for Water and EffluentStandards concerning mercury and has carried out various water protection measures. Asa consequence, there are very few cases where mercury levels higher than EQS have beenmeasured in public water areas.
Household paint must not contain organomercury compounds; this has beenregulated since 1973/74.
No pesticide containing mercury, including pesticide for seed dressing, has beenregistered since 1973.
Based on the Industrial Safety and Health Law, employers should take measures todecrease the mercury level at a workplace and/or to keep workers from inhaling mercury.
In 1984, the chlor-alkali industry stopped using mercury. As a consequence, the totalamount of mercury used in Japan was reduced to 212 tonnes. 122 tonnes, more than 50 percent, was used for dry batteries.
A great deal of effort has been made to reduce the amount of mercury used for drybatteries. In 1992, no mercury addition version was achieved for both zinc-carbon battery andalkaline manganese batteries for general purpose applications. As a consequence, the totalamount of mercury used for dry batteries was reduced to be 42 tonnes. Almost all of thisamount was used for button cell batteries, mainly of the mercuric oxide type.
Eighty per cent of mercuric oxide batteries were used for hearing aid applications.As a result of extensive publicity and discussions with general consumers, the mercuric oxidebatteries for hearing aid application were replaced by zinc air batteries, and consequently,production of mercuric oxide batteries for hearing aid application was stopped in 1994. Theamount of mercury used for dry batteries will, therefore, decrease to less than 10 tonnes.
In addition, production of mercuric oxide batteries is scheduled to stop completely bythe end of 1995.
108

The Netherlands
Present regulation
• Control of the emissions to air, water and soil are regulated by national legislationbased on the different EEC Directives described in the European Unionsubchapter.
• A licence is obligatory for the drainage of mercury to surface water.
• Limits for mercury in surface water, drinking water, groundwater, soil, sewagesludge, organic fertilizers and air.
• Maximal content of mercury in batteries. Implementation of the EC Directive91/157/EEC.
• Ban on the use of shock absorbers for arms and legs containing mercury.
• Convention between the national organisation of dental surgery and the publicauthorities to collect amalgam separately with at least a 95 per cent profit.
• The use of pesticides containing mercury is not permitted.
Future regulation
In first instance, priority is given to minimizing, and where possible to replacing, theuse of mercury in the following products:
• the use of amalgam by dentists,• thermometers and other measuring instruments,• batteries,• switches,• lighting (vapour discharge lamps).
These products contribute to the greater part of the use of mercury in products.
In recent research, all mercury-containing products in the Netherlands and theavailability of alternatives were investigated. It is expected that, for some products, a longertime will be needed before the use of mercury could be phased out, because no alternativesof the same value are yet available.
109

Norway
No specific regulations have been developed which restrict the industrial use andemissions of mercury. Specific permits are set in the discharge permits for each industrial andwaste incineration plant, pursuant to the general legislation on environmental protection (thePollution Control Act).
For the chlor-alkali industry, the limit value for discharges to water is 0.25 gmercury/tonne chlorine capacity, and for emissions to air 2.5 g mercury/tonne of chlorine. Themercury-based process will be replaced with a mercury-free process by 1998.
Regulations restricting discharges from dental clinics have been proposed.Installation of mercury separators and separate collection of mercury-containing waste will berequired. Mercury-containing waste has to be treated as hazardous waste.
Mercury has not been used in paint since 1970, owing to internal agreement amongpaint producers.
It is prohibited to manufacture, export, import or sell zinc/carbon and non-rechargeable alkaline manganese batteries which contain 0.001 per cent or more mercury byweight. After 1 January 1995, the ban will include all types of batteries (even button cells).Packaging containing individual button cell batteries of the type mercury oxide, silver oxide,zinc/air or other types containing a total of 0.025 per cent mercury shall be labelled with arecycling symbol. Retailers who sell batteries that shall be marked/labelled, are obliged toaccept comparable types of batteries for appropriate disposal from the consumer, free ofcharge.
Norway has banned the use of mercury for seed dressing since 1 December 1991.
A ban on the production, import and sale of mercury-containing thermometers hasbeen notified.
It is the future strategy of the government to obtain further reduction in emissions ofmercury.
(Also see the section on the Nordic countries in this chapter.)
110

Sweden
In 1991, the Parliament stated that the use of mercury in Sweden shall cease. In1994, a general goal for ending the use of mercury in most processes and products was settill the year 2000. The Parliament also stated that the use of mercury in dental amalgamsshould have come to an end in 1997.
Several projects are planned at the Swedish environmental agencies in order to fulfilparliamentary purposes. This includes measures concerning the disposal of productscontaining mercury, as well as a plan to gradually set the use of dental mercury amalgams.
The following is a brief presentation of Swedish regulations on mercury:
The Act (1969:387) on Environmental Protection is applied for regulation and controlof industrial emissions of mercury.
Sweden has a programme for site remediation, including an inventory of differentsites where industrial and other polluting activities have taken place. The chlor-alkali industryis one of those being investigated.
Guidelines on mercury emissions from dental amalgams are set up. There is alsoan agreement on installation of mercury separators at dental clinics.
Mercury-containing waste is treated as environmentally hazardous waste (Ordinance1985:841) and is to be handled separately.
It is prohibited to transfer or to offer sewage sludge containing more than 2.5 mgmercury/kg dry weight for sale for agriculture purposes (Ordinance 1985:840, amendment1993:1271).
Import, sale, transfer and use of mercury and mercury compounds as biocides areregulated in the Ordinance (1985:836) on Pesticides. No mercury-containing product isapproved.
The use of mercury-containing seed dressing is banned (Ordinance 1979:349).
It is prohibited, in the course of business activities, to transfer alkaline batteriescontaining more than 0.025 per cent mercury and cadmium by weight. Button cell batteriesand batteries composed of button cells are exempted. Batteries containing mercury and/orcadmium shall be labelled and delivered for separate treatment. There are special fees forthe transfer of environmentally hazardous batteries (Ordinance 1989:974).
Finally, there is a prohibition on certain products containing mercury (Ordinance1991:1290). From 1 January 1992, clinical mercury in glass thermometers is prohibited forimport, manufacture in the course of business activities, and sale. The same applies to othertypes of thermometers, measuring instruments and apparatus and electrical componentscontaining mercury from 1 January 1993.
Due to actions taken by Swedish industry, the use of mercury in products notmentioned in the prohibition is also ceasing.
111

Experience to date shows that all mercury thermometers, most measuring instrumentsand most electrical components have satisfactory alternatives for different measuring situationsand for most equipment. Temporary exemptions have been granted to make it possible forsome users to successively convert to other techniques. The main policy is to exemptproducts where sufficient alternatives are not available, or where research and developmentare required to develop alternatives. Special attention is paid to safety demands.
A presentation of alternatives is given below.
Prohibited products containing mercury and their alternatives
Thermometers and other measuring instruments
For a comparable price, there are several reliable alternatives to clinical mercury inglass thermometers. There are both electric and single-use alternatives.
Mercury in glass thermometers within the measuring area -38°C to +200°C could bereplaced by thermometers with other liquids such as butyl alcohol, hexanol or xylene. Theprice is about the same. This mercury can also be replaced by electric and electronicinstruments.
For applications of up to 700°C, a Pt-100, also called a Resistant Thermo Device(RTD), can be used. Within the measuring area 400°C to 1500°C, different thermocouplescan be used.
When measuring below -38°C and above +650°C, it is not possible to use mercury.
Electrical components
With a few exceptions, there are no technical obstacles to replacing componentscontaining mercury such as level switchers, thermostats, relays and electrical contacts.Conventional relays and other contacts with mercury, also when these are contained inswitchers and thermostats, can normally be replaced by a mercury-free component. This isnot only applicable when fitting components into equipment being manufactured, but alsowhen exchanging spare parts in older equipment.
Most mercury contacts can be replaced by, for example, solid-state contacts. Severaltypes of tilt switches and most level switches can be substituted. The use of conventionalmercury relays has ceased, and the more technically developed mercury wetted relays havebecome more common. For some applications it is possible to use semi-conductors or solid-state relays instead. What seems most complicated is to substitute tilt switches when thereis no fixed reference point, for example in personal alarm systems.
(Also see the section on the Nordic countries in this chapter.)
112

Switzerland
In 1986, a regulation was established concerning a gradual decrease in mercury inalkaline and manganese batteries. These regulations are presently under revision.
Since 1986 a ban has existed on the use of mercury in all products. A list ofexemptions is given, along with a gradual reduction of mercury in the products according totechnical possibilities.
Use of mercury in paint has been forbidden for several years, and use of mercury asseed dressing has been forbidden since 1991.
Limits for emissions to air were established in the Clean Air Ordinance in 1985:
Emission limits for installations: 0.2 mg/m3 if the mass flow is 1 g/h or more. Emissionlimit for waste incineration is 0.1 mg/m3.
Limits for emissions to water were established in the Ordinance for Waste WaterDischarge in 1975:
Water quality criteria for surface water flows and impounded river water: 0.001 mgmercury/litre; quality standard for effluents discharged into surface waters: 0.01 mg mercury/litre;quality standard for effluents discharged into public sewers: 0.01 mg mercury/litre.
Limits for emissions from dental clinics (1988): Since 1993, dental clinics involved inamalgam treatment have to be equipped with an amalgam separator with at least 95 per centseparation rate.
The Ordinance on Contaminants in Soil (1986) indicates 0.8 mg/kg as a guide valuefor the total content of mercury in soil.
According to an amendment (1992) to the Ordinance on Substances (1986), themercury content shall not exceed a maximum level of 1 mg/kg in compost and 5 mg/kg insewage sludge.
Limits for emissions from the chlor-alkali industry are regulated in accordance with therecommendation of the International Commission for the Protection of the Rhine againstPollution, dated 28 June 1979. Since 1983 the water emission limit is 0.5 g/tonne chlorinecapacity.
In accordance with the recommendation of the International Conference on theProtection of the North Sea of 8 March 1990 (annex 1B), mercury cell plants shall be phasedout by 2010 and the air emission limit shall be 2 g/tonne chlorine capacity by 1996.
113

United Kingdom
Control of emissions to air, water and soil are regulated by different EEC Directives,as are mercury-containing batteries, paint and seed dressing. These are described in theEuropean Union subchapter.
There is no specific legislation controlling the supply of other mercury-containingproducts.
The future general strategy for mercury is to minimize the amounts of mercury whichcan reach the environment from man’s activities, including the use of mercury-containingproducts.
A reduction target for emissions to water from land-based sources was confirmed andextended at the third ministerial conference on the North Sea in 1990. The target requiresinputs of mercury to the North Sea to be reduced by 70 per cent, using 1985 inputs as thebaseline. This target will be applied to all coastal waters including the North Sea.
114

United States
The United States has been actively addressing the risks posed by exposure tomercury for many years. Current regulatory activities undertaken by many different governmentagencies are successfully helping to reduce potential human exposures to mercury bycontrolling its releases into the environment and limiting or discontinuing uses that result in highexposures. The US government also supports a variety of research efforts that will help tobetter evaluate the impacts of our industrial activity and improve the understanding of mercury’stoxicity. The information discussed in this chapter is summarized in the table, "United StatesRisk Reduction Efforts for Mercury", at the end of Annex A .
Mercury in Drinking Water
The Environmental Protection Agency’s Office of Ground Water and Drinking Water(OGWDW), as part of its National Primary Drinking Water Standards required under the SafeDrinking Water Act of 1986, established a maximum contaminant level (MCL) for inorganicmercury in drinking water of 0.002 mg/litre (effective July 30, 1992) (40 CFR 141.62). Thepermissible level of mercury in bottled water, set by the US Food and Drug Administration, isalso 0.002 mg/litre (21 CFR 103.35).
Standards for Mercury in Environmental Media and Point Source Controls
The Environmental Protection Agency (EPA) regulates the release of mercury intoenvironmental media (i.e. air, water, and soil) through actions taken in a number of its programoffices. The Office of Science and Technology (OST) within the Office of Water controls therelease of mercury in effluent wastewaters from industrial facilities and municipal wastewatertreatment facilities under the general pretreatment standards and effluent guidelines for existingand new sources of pollution (40 CFR 401, and 403, Appendix B). Implementation of theselimits is accomplished through individual discharge permits under the OST’s National PollutantDischarge Elimination System. EPA’s Office of Water has set additional guidelines, calledAmbient Water Quality Criteria, that recommend acceptable concentrations of mercury for theprotection of human health and aquatic species (EPA 1986). The criteria are as follows:
Human health: 1.44 x 10⁻⁴ mg/litre for ingesting both water and aquatic organisms1.46 x 10-4 mg/litre for ingesting aquatic organisms only
Aquatic life: 2.4 x 10⁻³ mg/litre for freshwater acute exposures1.2 x 10-5 mg/litre for freshwater chronic exposures2.1 x 10-3 mg/litre for marine acute exposures2.5 x 10-5 mg/litre for marine chronic exposures
The mercury content of municipal wastewater treatment sludges intended for landapplication or surface disposal is regulated by the EPA under the Clean Water Act. Themercury concentration of sludge that will be applied to agricultural land, forest land, or otherpublic contact sites may not exceed 17 mg/kg (dry wt) and the cumulative loading of mercurymay not exceed 17 kg/hectare. Sludge sold or distributed for application to a lawn or homegarden is also limited to 17 mg/kg (dry wt) of mercury and may not exceed an annual mercury
115

loading rate of 0.85 kg/hectare. Sludge sold or distributed for other types of land applicationmay not exceed a mercury concentration of 57 mg/kg (dry wt). Sludge intended for surfacedisposal at either lined or unlined facilities may not contain more than 100 g/kg (dry wt) ofmercury (EPA 1993a).
EPA regulates mercury as a Hazardous Air Pollutant (40 CFR 61.01) and hasestablished National Emission Standards for several major point source categories of mercury.The emission standards are designed to prevent monthly average mercury concentrations fromexceeding 1.0 µg/m3. Emissions from mercury ore processing facilities and mercury cell chlor-alkali plants are limited to a maximum of 2300 grams of mercury per 24 hours. Emissions fromsludge incineration plants, sludge drying plants, or a combination of these that processwastewater treatment plant sludges are limited to a maximum of 3200 grams of mercury per24 hours (40 CFR 61.52). The Clean Air Act Amendments of 1990 contain a number ofprovisions relating to additional study and regulation of mercury:
• A required study of the health and environmental risks, control technologies, andcosts of control for all mercury sources, including electric utilities and municipalwaste combustors. Results of the study, due by November, 1994, will be used toguide the development of additional emission standards for mercury (CAAA 1990).
• Identification and regulation of the 30 most significant Hazardous Air Pollutantsfrom urban "area sources" (small, numerous sources); mercury is very likely to beamong the 30 priority chemicals.
• Hazardous Air Pollutant provisions require that regulations controlling both "majorsources" and "area sources" account for at least 90 per cent of total emissions.
• A study of health and environmental impacts of atmospheric deposition to the GreatLakes, Chesapeake Bay, Lake Champlain, and coastal waters; report dueNovember, 1993; regulation as necessary due November, 1995; mercury has beenidentified as a high priority for this study.
• New Source Performance Standard for Municipal Waste Combustors – willestablish numerical emission limits for new combustors.
• Updated standards for chlor-alkali plants – primarily directed at chlorine emissionsbut may affect mercury emissions as well.
The Office of Emergency and Remedial Response (OERR), under the statutoryauthority of the Comprehensive Environmental Response Compensation and Liability Act(CERCLA) and the Emergency Planning and Community Right to Know Act (EPCRA), hasestablished mandatory reporting requirements for significant releases of mercury and has setrules for emergency planning at facilities where mercury is used or stored on site. The limitsthat trigger reporting and emergency planning requirements are defined by ReportableQuantities (RQs) and Threshold Planning Quantities (TPQs), respectively (40 CFR 302.4; 40CFR 355 Appendix A). RQs and TPQs for mercury and 14 of its compounds are listed in thetable, "United States Risk Reduction Efforts for Mercury", at the end of Annex A.
116

The potential release of mercury from transportation accidents is reduced through theDepartment of Transportation’s Hazardous Materials Transportation Act, which designatesmercury and its compounds as hazardous substances and subjects them to requirements forpackaging, shipping, and transportation (49 CFR 172.101, Appendix A).
The EPA’s Office of Solid Waste (OSW), responsible for implementing the ResourceConservation and Recovery Act (RCRA), has also designated mercury a hazardous substanceand requires that groundwater at hazardous waste treatment, storage, and disposal facilities bemonitored for its presence (40 CFR 302.4 and 264.94). RCRA’s Land Disposal Restrictionsfurther restrict the disposal of mercury-containing wastes in Subtitle C (Hazardous Waste) landdisposal facilities. Depending on the amount of mercury in the waste, mercury wastes mustundergo either a prescribed treatment technology (roasting/retorting) or meet a treatmentstandard of 0.20 mg/litre in the extract obtained from Toxicity Characteristic Leaching Procedure(40 CFR 268).
Industrial Source Reduction
In 1991, the EPA initiated the "33/50 Program", a special program to help reducereleases of mercury and 16 other toxic substances into the environment. The goal of theprogram is to encourage companies to commit to voluntarily reduce their releases of some orall of these toxics by 33 per cent by 1992, and 50 per cent by 1995. The program takesadvantage of a large EPA database that maintains information on industrial releases of toxics(the Toxics Release Inventory or TRI) to help persuade industries to reduce releases of toxicsubstances. The 33/50 Program reports that between 1988 and 1991 environmental releasesof mercury from TRI facilities were reduced by 38 per cent and that transfers of mercury for off-site treatment or disposal were reduced by 30 per cent (EPA 1993b).
Mercury in Foods
The major source of methylmercury exposure is fish consumption. The mercuryconcentration in fish at the top of the food chain can be biomagnified up to 100,000 times theconcentration in surrounding waters (ATSDR 1992a). In an effort to reduce methylmercuryexposure from fishery products, the US Food and Drug Administration (FDA) has establishedan action level for methylmercury. The action level is 1 ppm for methylmercury in the edibleportions of fish, shellfish, and other aquatic animals, whether fresh, frozen, or processed (FDACPG 7180.07). The action level is intended to eliminate from consumption those fish andfishery products whose methylmercury levels exceed the action level. Some states, however,have adopted advisory levels for sport fish that are even more stringent than the FDA actionlevel because they are concerned with specific populations whose fish consumption may behigher than that of the general population. The FDA action level is designed to addressconsumption by the general population.
Mercury exposure can also occur through the consumption of foods prepared fromcrops that have been treated with mercury-containing pesticides. During the winter of 1971-72,thousands of Iraqis were poisoned by eating homemade breads made from seed wheat that hadbeen treated with a methylmercury fungicide (ATSDR 1992a). To protect against similarincidents occurring in the US, amendments to the Federal Insecticide, Fungicide, andRodenticide Act (FIFRA) prohibit the import of food containing residues of mercury-containingpesticides that are not registered for use in the US (EPA 1991a).
117

Mercury in Products
Mercury may be found in a variety of household products, including batteries,fluorescent light bulbs, electrical switches and thermometers. The use of mercury in many ofthese applications is regulated by US government agencies or controlled voluntarily by industrygroups. As a result, industrial consumption of mercury in the US declined dramatically between1982 and 1991. After increasing from 1687 metric tons in 1982 to 1884 metric tons in 1984,mercury consumption plummeted to 473 metric tons in 1991 (US Bureau of Mines, 1986, 1991).EPA in January 1993 proposed a regulation that would allow states, manufacturers and othersto set up special collection programs to facilitate the recycling and proper management ofhazardous consumer wastes. The proposed regulation would relax some of the stringentrequirements for storage, transport, and permitting that normally apply to these wastes. Theproposed regulation covers certain mercury-containing products such as batteries but does notinclude fluorescent lamps. A brief summary of product-specific activities is presented below.
Batteries . Alkaline and mercury-zinc batteries are the most commonly used mercury-containing batteries, although mercury is also found in carbon-zinc, silver oxide, zinc air,mercury-indium-bismuth, and mercury-cadmium batteries. Because of concerns about mercuryin the municipal waste stream, battery manufacturers have taken action to reduce the amountsof mercury in batteries. The industry has announced its intention to reduce mercury in alkalinebatteries to 0.025 per cent by weight by 1992, and eventually eliminate all mercury frombatteries. According to one manufacturer, the use of mercury in one of its more commonapplications, film pack batteries, has already been discontinued (EPA 1991a). A majormanufacturer has recently announced plans to discontinue production of mercury-zinc "button"batteries because of the development of an effective zinc-air replacement (Telzow, 1992).These measures have resulted in a significant decline in the use of mercury in the batterymarket. Between 1982 and 1991 the amount of mercury consumed first increased from 852metric tons to 1024 metric tons and then declined to 78 metric tons in 1991 (US Bureau ofMines, 1986, 1991).
Paint . All uses of mercury in paint have been discontinued. Mercury was formerlyused as a biocide in two categories of paints. Marine antifouling paints utilized mercury(principally mercuric oxide) as an agent to hinder the growth of algae after the paint was appliedto the bottom of ships. Latex paints used a variety of mercury compounds [phenlymercuricacetate (PMA), 3-(chloromethoxy) propylmercuric acetate (CMPA), di(phenylmercury)dodecylsuccinate (PMDS) and phenylmercuric oleate (PMO)] as a biocide after its application,as well as a preservative to control microbial growth in the paint cans during storage. In 1972,the use of mercury as antifouling agent for marine applications was eliminated when the EPAcancelled all registrations of pesticides containing mercury for this use (EPA 1972). In July of1990, all registrations for mercury biocides used in paints and coatings, except those for PMA,were voluntarily cancelled by the registrants (EPA 1990a, 1990b). These measures resultedin mercury consumption by the paint industry declining from 234 metric tons in 1982 to 6 metrictons in 1991 (US Bureau of Mines, 1986, 1991). In May of 1991, EPA announced the voluntarycancellation of the remaining PMA registrations, which were for exterior paints and coatings(EPA 1991a, 1991b).
Pesticides and Agricultural Products . For many years mercury and mercurycompounds had been used as fungicides and insecticides for agricultural purposes. The EPA’sOffice of Prevention, Pesticides, and Toxic Substances, responsible for implementing theFederal Insecticide, Fungicide, and Rodenticide Act, has been active in regulating the use ofmercury-containing pesticides in an effort to protect public health. In 1972, all existingregistrations for mercury-containing fungicides and pesticides intended for application on food
118

crops were cancelled by the EPA (EPA 1972). Four years later, in 1976, a series ofcancellations further restricted the use of mercury-containing pesticides, effectively banning suchproducts from all but specifically stated applications (e.g. treating Dutch Elm disease, freshlysawn lumber, brown mold, and outdoor fabrics and textiles) (EPA 1976a, 1976b, 1976c). EPAeither has cancelled or has received requests for voluntary cancellation for all of theseremaining registrations. There is no current production of mercury pesticides in the US.
Special Paper Coatings . Mercury bromide and mercury acetic acid are used in thecoating of specialized paper and film used for scanning off cathode ray tubes. Only twocompanies manufacture the paper and film, and they have announced that plans are beingdeveloped to phase out the use of mercury in the coating. It is predicted that by 1995, mercurywill be eliminated entirely from use in this application (EPA 1991a).
Drugs. FDA regulates the safety of mercury-containing substances that are used in"Over-the-Counter" (OTC) drugs such as anorectal products, vaginal contraceptives, and topicalantiseptics. FDA regulates OTC drugs through the formal publication of monographs thatdescribe the conditions under which a product is "recognized as safe and effective and notmisbranded" (FDA 1992). In a proposed monograph on vaginal contraceptives, FDA placedphenyl mercuric acetate and other mercury compounds in Category II "not generally recognizedas safe" for OTC use because of the potential hazard to fetuses and breast-feeding infants. FDAalso noted that safe substitutes for the mercury-containing compounds are available (FDA1980). A proposed rule (in the form of an amended tentative final monograph) on OTCantimicrobial products placed elemental mercury and 12 mercury compounds in Category II"ingredients not generally recognized as safe for OTC first aid use" and four mercurycompounds in Category III "ingredients for which the available data are insufficient to make afinal determination for OTC first aid use." The monograph also recommends specific testingprocedures for further evaluating the safety and efficacy of Category II and Category III products(FDA 1991). FDA is continuing its evaluation of all mercury-containing OTC drugs in order tomake a final determination on their safety and efficacy (FDA 1993).
Cosmetics . Mercury compounds were previously used in skin bleaching creams andas preservatives in a variety of cosmetics. These uses of mercury have been prohibited byFDA. Current regulations allow mercury only as a preservative in cosmetics intended for usein the area of the eye and only if no effective and safe nonmercurial preservative is available.The concentration of mercury in eye-area cosmetics may not exceed 65 ppm (21 CFR 700.13).
Dental Amalgam . Dental amalgams are typically 40-50 per cent elemental mercuryby weight and account for at least half of the approximately 200 million dental restorationsperformed in the US each year. Dental amalgams represent a significant source of overallmercury exposure and probably are the major source of elemental mercury vapor exposure tothe general population. A recent report by the US Public Health Service (CCEHRP 1993)concludes, consistent with a number of similar evaluations cited in the report, that "currentscientific evidence does not show that exposure to mercury from amalgam restorations posesa serious health risk in humans, except for an exceedingly small number of allergic reactions."However, the report cautions that there are significant gaps in the base of information relevantto assessment of chronic low-level mercury exposure. Substantial research is needed to reduceuncertainties and reach more definitive conclusions regarding health risks from dentalamalgams. At present, FDA regulates dental mercury and amalgam alloys separately, as "classI" and "class II" devices, respectively. The CCEHRP report recommends that mercury and thealloys be treated as a single class II product. This would result in the maximum degree ofcontrol within the current regulatory framework for these types of products. The CCEHRP alsorecommends required disclosure of product ingredients by manufacturers of dental restoratives
119

and improved education of dental providers and patients regarding adverse reactions. Thesesteps could help in identifying and reducing the occurrence of sensitization reactions amongdental patients. The use of amalgam has declined in recent years because of a decrease indental caries and the use of alternative materials and techniques. Additional education onalternatives and proper handling, including waste management, could further reduce mercuryexposures to patients and dental practitioner and reduce the environmental releases of mercuryfrom dental offices.
Fluorescent Lamps and High Intensity Discharge Lamps (HID)
Mercury has long been used in a variety of lamps, ranging from common householdfluorescent light tubes to high intensity discharge lamps used for outdoor lighting. High powerHID lamps (e.g. 1000 watt lamp) can contain up to 250 mg mercury. The amount of mercurycontained in standard four-foot and eight-foot fluorescent tubes ranges from 35 to 75 mg. In1990, the average quantity of mercury in a standard four-foot lamp was about 40 mg. Majormanufacturers estimate that they will be able to reduce the average mercury content in a four-foot lamp to 27 mg by 1995 (NEMA 1992a). Currently, most fluorescent lamps are simplydisposed of as municipal or industrial solid waste. Combustion of these wastes is of particularconcern because current emission controls on many municipal combustors are relativelyineffective in capturing mercury. The mercury level in many fluorescent lamps exceeds theRCRA Toxicity Characteristic limit (0.2 mg/litre in the leachate, following a standard extractionprocedure), thus classifying the lamps as hazardous waste. EPA’s Office of Solid Waste isseeking comment on two alternative approaches for the management of mercury-containinglamps. One approach in the proposal is to exclude mercury lamps from classification ashazardous waste under the condition that the lamps be managed in a state-controlled landfillor recycling facility. The other approach is to include mercury in a proposed special collectionsystem that is intended to facilitate the recycling and safe disposal of non-industrial wastes (EPA1994).
Mercury in Cultural Practices
Certain cultural groups from Latin America and the Caribbean use mercury in folkmedicines and in other cultural and religious practices. The US EPA is working withorganizations that represent and assist these groups in order to provide information aboutmercury risks. Written materials and radio broadcasts are being developed. Information will beprovided in English and other native languages.
Occupational Standards for Mercury
The Occupational Safety and Health Administration (OSHA), a branch of theDepartment of Labor, regulates exposures to mercury in the workplace by establishingPermissible Exposure Limits (PEL). The 1989 PEL update included three different standardsfor mercury and its compounds: an 8-hour time weighted average (TWA) of 0.05 mg/m3 formercury vapor and 0.01 mg/m3 for alkyl mercury compounds; a Short Term Exposure Limit(STEL), a maximum level for a 15-minute period, of 0.03 mg/m3 for alkyl mercury compounds;and a ceiling limit, a maximum never to be exceeded in the workplace, of 0.1 mg/m3 for aryl andinorganic mercury (OSHA 1989). All forms of mercury were assigned a skin notation, indicatingthat the substance is absorbed through the skin, and therefore, skin contact should be avoided.However, the US Court of Appeals in July, 1992 struck down all PELs established by the 1989
120

regulation, including those standards set for mercury. OSHA announced in March, 1993 thatit would not appeal the court ruling, meaning that all PELs will revert to previous standards. Theearlier standards are: a ceiling limit of 0.1 mg/m3 for elemental mercury, inorganic mercury andalkylmercury compounds; an 8-hour TWA of 0.01 mg/m3 for alkylmercury compounds, and aceiling limit of 0.04 mg/m3 for alkylmercury compounds (OSHA 1993). Because the currentenforceable standards are not based on current data and risk assessments, OSHA does notnecessarily consider these standards to be adequately protective. Furthermore, manycompanies are expected to voluntarily follow the previous standards.
The National Institute for Occupational Safety and Health (NIOSH), which makesrecommendations to OSHA, defines an additional limit called the IDLH (Immediately Dangerousto Life and Health) level, defined as the maximum environmental concentration of a contaminantfrom which one could escape within 30 minutes without any escape-impairing symptoms orirreversible health effects. The IDLH is 28 mg/m3 for elemental mercury vapor and 10 mg/m3 fororgano (alkyl) mercury compounds. Other NIOSH standards for mercury, as well as those ofthe American Conference of Governmental Industrial Hygienists (ACGIH), an independentassociation of professionals, correspond to the 1989 OSHA standards (ACGIH 1990, NIOSH1990).
121

Nordic countries
Nordic countries have undertaken a number of joint initiatives towards protecting theenvironment.
Denmark, Sweden and Norway have signed the Ministerial Declaration of the ThirdInternational Conference on the Protection of the North Sea (Third International Conference onthe Protection of the North Sea 1990). This declaration states that the inputs of mercury, viaall pathways, are to be reduced between 1985 and 1995 by 70 per cent or more, provided thatthe use of best available technology or other low waste technology measures enables such areduction.
Denmark, Finland and Sweden have through the Helsinki Commission (HELCOM), andtheir Declaration on the Protection of the Marine Environment of the Baltic Sea Area, adoptedthe goal of reducing emissions of mercury to water and air with 50 percent not later than 1995,using 1987 as a reference year. Further, the Contracting parties are to give priority topreventive measures on mercury and its compounds.
As Contracting Parties of the Paris Commission (PARCOM), Denmark, Sweden andNorway adopted the PARCOM Recommendation 89/3 on Programmes and Measures forReducing Mercury Discharges from Various Sources.
On the commission of the Nordic Chemicals Group under the Nordic Council ofMinisters, a consultant report describing Nordic experiences regarding the technologicalpossibilities for reducing the use of mercury (Nordic Council of Ministers 1992) has beenelaborated. The report concludes that there are technologically acceptable substitutes for mostareas of application. For some applications, problems are still to be solved.
122

European Union
The European Union has regulated by different Directives the environmental pollutionfrom mercury and the use of several mercury-containing products. A list of the relevantDirectives is presented below.
EEC Directive 79/117, amended in 1991 by EEC Directive 91/188, for the phasing-outof the use of mercury in seed dressing in a few years.
EEC Directive 82/176 defines the limit values and quality objectives for mercurydischarges from the chlor-alkali industry.
Emissions to water from industrial plants are regulated by EEC Directive 84/156defining limit values and quality objectives for mercury discharges (to water) by sectorsother than the chlor-alkali industry.
EEC Directive 89/369 sets limits on emissions to the atmosphere from new municipalwaste incinerators as follows: 0.2 mg Cd+Hg/m3.
EEC Directive 89/677 bans from ultimo 1991 the use of mercury in antifouling paint,preservation of wood, impregnation of heavy-duty industrial textiles and yarn intendedfor their manufacture, and in treatment of industrial waters.
123

Statement from the European battery industry (Europile)
In 1990, alkaline batteries that were "mercury-free" were introduced into the market.They have the same technical specifications as mercury-containing batteries, and if they aresubstituted completely for mercury-containing batteries a substantial reduction in the amount ofmercury coming from exhausted alkaline batteries will be attained (see Figure 2.1 in Chapter 2).In 1994, the new batteries are expected to be "mercury-free".
From 1994, the use of mercury will be restricted to special purpose batteries whichinclude miniature button batteries designed for use in hearing aids, calculators, photographicequipment and other technical uses. These batteries comprise less than 1 per cent by weightof all batteries sold.
The mercury oxide special purpose battery, responsible for 94 per cent of all mercuryin batteries after 1994, will be collected separately for recycling or special disposal inaccordance with the European Union legislation.
In accordance with the industry policy to reduce environmental pollutants at source, themercuric oxide battery is being replaced as fast as technology will allow by low mercury-containing substitutes such as the zinc air and silver oxide batteries.
The mixing of special purpose and general purpose batteries in a collection schememakes the identification of the specialities extremely difficult and increases the cost andcomplexity of their sorting and treatment. However, collection of special purpose batteries onlyfor specific disposal is eased because:
• they will be easily identified by a special EU symbol for this purpose from March1993;
• they constitute less than 1 per cent of all batteries sold and therefore theircollection can easily be managed.
There is no environmental benefit to be gained by separate collection of generalpurpose batteries because:
• they already contain less than the European Union limits for mercury
• no general purpose batteries will contain mercury from 1994
• no economically or environmentally superior recycling techniques exist.
124

Statement from the European chlor-alkali industry (EURO CHLOR)
Emissions from the mercury cell chlor-alkali industry today
Accurate and detailed measurements made on the site of each producer show that theEuropean chlor-alkali industry released not more than 25 tonnes of mercury to the environment(figure for 1992) and the United States chlor-alkali industry less than 12 tonnes to all media (in1991).
Note that, if the United States and European chlor-alkali industry comprises each about25 per cent of the world installed capacity, in Europe most of it is in mercury cell technology andin the United States, most of it is in diaphragm cell technology.
The sum 25 + 12 = 37 metric tonnes represents only 0.7 per cent of global mercuryemissions.
In comparison, the single largest source of anthropogenic mercury emission is fossilfuel combustion, with probably much more than 1000 metric tonnes per year.
Evolution of the chlor-alkali industry
Over the last 20 years, American and European producers have significantly reducedlevels of emissions of mercury to the environment.
The plants operate under very strict regulatory requirements limiting the emissions anddischarges of mercury. Workplace safety is regulated.
Mercury emissions have been reduced by significant capital investments and by theindustry’s commitment to environmental improvement.
In Europe, since 1977 mercury emissions per tonne of chlorine capacity have beenreduced by 86.5 per cent.
In the United States since 1988, releases of mercury and mercury compounds by theindustry have been reduced by 37.6 per cent.
Potential exists to make further substantial reductions over the next 15 years. This willbe brought about through combination of plant closure, selective conversion to othertechnologies, upgrading of existing plant standards, and improvement to mercury containment.
Solid wastes
More and more facilities are now providing mercury recovery from solid wastes, so thatmercury is reused by a variety of processes. Wherever possible, the mercury is recovered bya variety of techniques such as washing or settling. Thermal desorption technology is also usedto reduce mercury discharges to land. In the United States, for example, approximately 50 percent of the facilities are currently employing mercury recovery systems.
125

The remaining solid wastes containing mercury which are finally disposed of arecompletely contained by adequate methods:
• mercury in the form of inactive sulphide• total encapsulation and containment within a membrane-lined site• use of approved landfill sites
Monitoring around the landfills confirms the security of containment; there is no lossof mercury to the environment.
This explains why the consumption of mercury by the chlor-alkali industry is not in anysense equal to the quantity of mercury emitted to the environment.
Conclusions
1. Mercury is a hazardous material and it must be handled properly. OECD shoulddetermine whether current amounts of mercury being released to the environment are notprotective of human health and the environment. If this is true, OECD needs to identify thesignificant sources and recommend steps to reduce such sources.
2. The chlor-alkali industry, in Europe and the United States, is a very small anddecreasing source of mercury to the environment.
3. The huge investment to eliminate this source and replace mercury cells withmembrane (e.g. diaphragm) cells cannot be justified on any economic grounds and will not showany significant reduction in environmental concentrations.
4. There is no sustainable environmental argument to justify the necessary investment.
126

ANNEX A (TO CHAPTER 5)
MERCURY RISK REDUCTION ACTIVITIES:
SUMMARY TABLES
127

128

Actions for use of mercury in batteries
Country Actions
Australia Different regulations in different states.
Austria Ordinance on batteries (514/1990): batteries and accumulators may not contain morethan 0.001 per cent mercury.
Belgium EEC Directive (91/157/EEC) for batteries and accumulators containing certain dangeroussubstances. Directive implemented in 1988.
Canada Under the Canadian Environmental Choice Guidelines the following levels of mercury inbatteries have been set: zinc-air batteries for hearing aids: a maximum of 40 mg/Ahrating on mercury content. Mercury reduction for cylindrical batteries: max. 0.02 per centmercury by weight by July 1, 1993. Reduced mercury content in alkaline manganesebutton or coin batteries to max. of 25 mg per cell. Elimination of mercury in batteries by1994-96 time-frame is an industry voluntary commitment and only guidelines.
Denmark EEC Directive (91/157/EEC) for batteries and accumulators containing certain dangeroussubstances. Directive implemented 1 January 1993.
Finland Regulations concerning the use, delivery, labelling, and collection of mercury-containingbatteries are under preparation. The regulations bring into force the EEC Directives onbatteries and accumulators (91/157/EEC and 93/86/EEC).
France EEC Directive (91/157/EEC) for batteries and accumulators containing certain dangeroussubstances. Directive implemented 1 January 1993.
Germany A ban of alkaline-manganese batteries with more than 0.025 per cent mercury from1 January 1993. An obligation to label batteries containing more than 0.025 per centmercury or more than 25 mg mercury/battery cell. For special applications, i.e. atextreme temperatures, batteries up to 0.05 per cent mercury are allowed.Strategy: To ensure that batteries are collected separately, and to raise the recyclingrate of batteries.
Ireland EEC Directive (91/157/EEC) for batteries and accumulators containing certain dangeroussubstances. Directive implemented 1 January 1993.
Japan Guideline of Ministry of International Trade and Industry; Production of mercuric oxidebatteries must stop completely by the end of 1995. (Production of mercuric oxidebatteries for hearing aid application, which amount is about 80 per cent of the totalmercuric oxide batteries, was already stopped completely in March 1994.)
Netherlands EEC Directive (91/157) for batteries and accumulators containing certain dangeroussubstances implemented on January 1993.
Norway It is prohibited to manufacture, export, import or sell zinc/carbon and non-rechargeablealkaline manganese batteries which contain 0.001 per cent or more mercury by weight.After 1-1-95, the ban will include all types of batteries (even button cells).Packaging containing individual button cell batteries of the type mercury oxide, silveroxide, zinc/air or other types containing a total of 0.025 per cent mercury, shall belabelled with recycling symbol.Retailers who sell batteries that shall be marked/labelled are obliged to acceptcomparable types of batteries for appropriate disposal from the consumers, free ofcharge.
Sweden An ordinance (1989) prohibits the use of some types of alkaline manganese batteries.Rules are included on labelling and collection of environmentally dangerous batteries.
Switzerland Regulations of 1986 with gradual decrease of mercury in alkaline and manganesebatteries. Under revision.
129
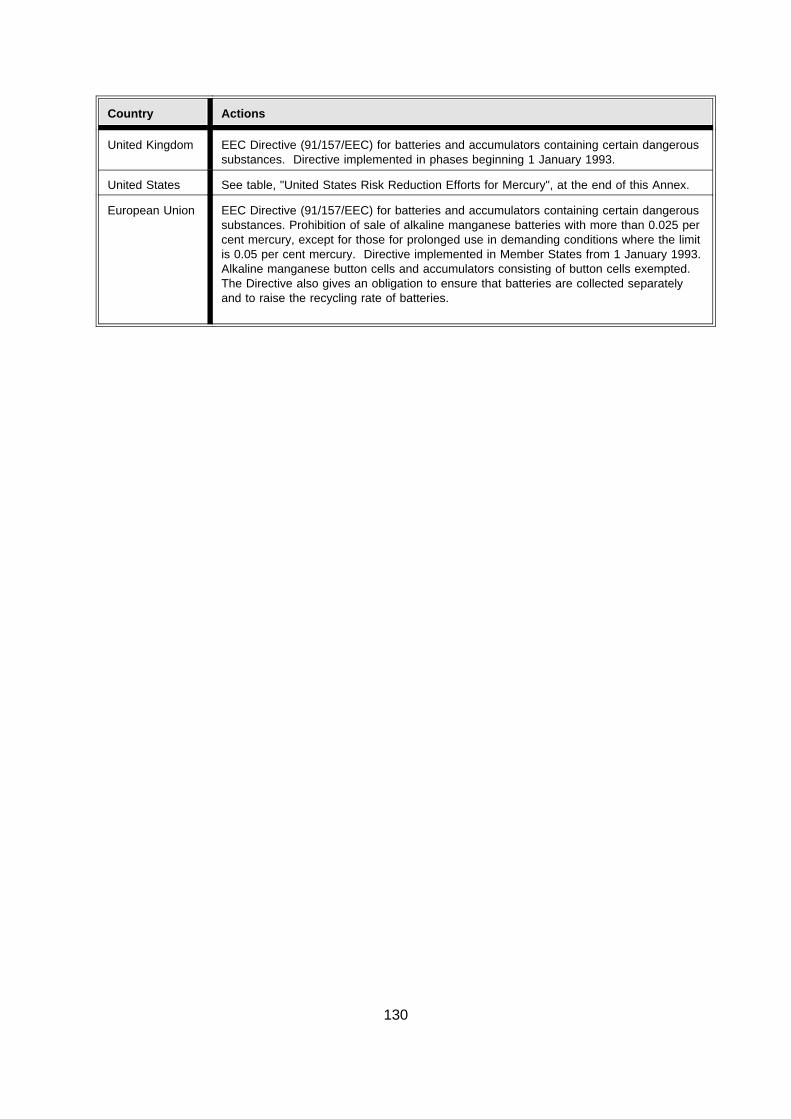
Country Actions
United Kingdom EEC Directive (91/157/EEC) for batteries and accumulators containing certain dangeroussubstances. Directive implemented in phases beginning 1 January 1993.
United States See table, "United States Risk Reduction Efforts for Mercury", at the end of this Annex.
European Union EEC Directive (91/157/EEC) for batteries and accumulators containing certain dangeroussubstances. Prohibition of sale of alkaline manganese batteries with more than 0.025 percent mercury, except for those for prolonged use in demanding conditions where the limitis 0.05 per cent mercury. Directive implemented in Member States from 1 January 1993.Alkaline manganese button cells and accumulators consisting of button cells exempted.The Directive also gives an obligation to ensure that batteries are collected separatelyand to raise the recycling rate of batteries.
130

Legislation for use of mercury in fluorescent tubes, electrical equipment,dental products, products for laboratory use, and thermometers
Country Actions
Australia Different regulations in different states; but no detailed information.
Austria Regulation on fluorescent tubes with limit value of 15 mg/kg is in preparation for coming intoforce 1996. Limit values exist for effluents from amalgam separators, and maximum valuesfor dental products.
Denmark General ban on preparation for sale of mercury and mercury-containing products (more than50 mg mercury/kg). Delayed ban and exemptions are given for different products. Forinstance, an immediate ban on mercury-containing thermometers, except for specialpurposes, as well as for dental fillings, will be implemented from 1 January 1995, withexemptions.
Germany Mercury compounds or preparations containing mercury compounds must not be used ormarketed for the following purposes: as antifouling; for the protection of wood, for theimpregnation of heavy industrial textiles; for the production of yarns for heavy industrial tex-tiles; for water processing in industrial, business and municipal sectors, independent of itsuse. Restrictions on use of mercury in thermometers, contacts and similar items are underdiscussion.
Finland No specific regulation. Products containing mercury are classified as hazardous wastewhen disposed of. The Ministry of Social Affairs and Health has recommended that the useof amalgams in dental fillings should cease by the year 2000.
Netherlands No regulation.
Norway A ban on the production, import and sale of mercury-containing thermometers has beennotified.
Sweden No regulation of fluorescent tubes. From 1 January 1992, mercury in clinical glassthermometers is prohibited for import, manufacture and sale in Sweden. The same appliesfor other types of thermometers, measuring instruments and most electrical componentscontaining mercury from 1 January 1993. Exemptions are given from the ban. It is notprohibited to use instruments that were bought before the ban came into force.The future strategy is to reduce all use of mercury. The Swedish Government has decidedthat the use of mercury amalgams in fillings of milk-teeth and in fillings of young people upto the age of 19 should cease from 1 July 1995. It is further decided that the use ofmercury amalgams in fillings of adults should end by 1997.
Switzerland Regulations in 1986 with a ban on use of mercury in all products. A list of exemptions isgiven, with gradual reduction of mercury in the products according to technical possibilities.
United Kingdom There is no specific legislation controlling the supply of these products. Disposal of theproducts is covered by waste regulations.
United States See table, "United States Risk Reduction Efforts for Mercury", at the end of this Annex.
131

Regulations for use of mercury in paints
Country Actions
Australia Restricted use.
Austria All mercury compounds banned since 1990 (Ordinance 577/1990).
Belgium All mercury compounds banned from 19 December 1991. EEC Directive89/677/EEC.
Canada Under the Hazardous Products Act, mercury is banned from use in paints appliedto children’s products, and is voluntary eliminated from interior paint, but isallowed in exterior paints.
Denmark Use forbidden since 1980.
France All mercury compounds banned from 31 March 1992. EEC Directive 89/677/EEC.
Germany Forbidden since 1983.
Finland No general ban or restrictions on use of mercury in paints. The use of mercury inantifouling paints was banned in 1992.
Ireland All mercury compounds banned by end of 1992. EEC Directive 89/677.
Japan Household paint must not contain organomercury compounds (regulated in1973/74).
Netherlands No application of mercury based on EEC Directive 89/677.
Norway Mercury has not been used since 1970, owing to internal agreement among paintproducers.
Sweden No regulations exist. Swedish paint producers do not use mercury.
Switzerland Use in paints forbidden for several years.
United Kingdom Restriction in force for several years. EEC Directive with ban from 31 March1992.
United States See table, "United States Risk Reduction Efforts for Mercury", at the end of thisAnnex.
European Union EEC Directive 89/677 bans from ultimo 1991 the use of mercury in anti-foulingpaint, preservation of wood, impregnation of heavy-duty textiles and yarn intendedfor their manufacture, and in treatment of industrial water.
132

Regulations for use of seed dressing
Country Actions
Australia Restricted use in some states, e.g. as a fungicide in sugar cane setts.Forbidden in other states.
Austria The use of mercury compounds in pesticides and seed dressing is forbiddensince 1993 (Ordinance 97/1992).
Belgium Forbidden for disinfection since 1 January 1990.
Canada Registered pesticide containing mercury, but none for seed dressing.
Denmark Forbidden since 1973, except for use in stock seed. From March 1992, all usesforbidden.
Finland Forbidden since October 1992.
France EEC Directive 91/188. Ban in force from 21 June 1991.
Germany Forbidden since 1982.
Ireland Banned from 30 June 1991.
Japan The last registered mercury-containing pesticide was in 1973.
Netherlands EEC Directive (79/117), exemption for seed potatoes until 1987.
Norway Banned from 1 December 1991.
Sweden May not be used without permission (1979). No permission given after 1 July1988.
Switzerland Forbidden for use after 1991.
United Kingdom Banned from 1991.
United States See table, "United States Risk Reduction Efforts for Mercury", at the end of thisAnnex.
European Union EEC Directive 79/117, amended 1991 by Directive 91/188, for phasing out in afew years.
133

Legislation for control of emissions to air, water and soil fromenergy production, refuse incineration, metal mining and production,gold mining, dental clinics, crematoria, and other emission sources
Country Actions
Australia Different regulations in different states, but no detailed information on limit values.
Austria Limit values depending on technical area for emissions to air between 0.1 and0.05 mg/m3; emissions to water 0.01 mg/litre.
Belgium Base quality for normal surface water: 0.5 µg/litre.Emissions to surface waters (wastewater): max. 0.15 mg/litre.Monthly: max. 0.1 g/tonne chlorine produced.Chemical plants using mercury catalyst for production of other than vinylchloride:monthly: max. 5 g/kg used mercury.Fabrication of organic and non-organic mercury compounds; non-ferrous andtreatment of mercury-containing toxic waste: monthly: max. 0.05 g/kg mercuryutilized.Fabrication of primary batteries: monthly: max. 0.03 g/kg mercury utilized.Textile: max. 0.02 mg/litre.Cleaning of vessels: max. 0.01 mg/litre.Pigments, paints, inks; cleaning of ships and cars transporting fluids: max.0.001 mg/litre.Pulp and paper industry: 0.
Canada 0.1 µg/litre in the Canadian Water Quality Guidelines for the protection of aquaticlife.
Denmark At present, no regulation of emissions to air from power plants. However, it ispossible to adopt such regulation within the Danish Environmental Protection Act.Refuse incineration and power plants require an environmental approval fromregional authorities. Danish regulations of emissions from waste incinerationplants are based on EEC Directive 89/369. Emissions to water from industrialplants are regulated by EEC Directive 84/156. Main Danish principle: reducemercury emissions by best available technology. Crematoria must hold anenvironmental approval before January 1, 1994. Guidelines for design andoperation of crematoria are issued, but do not cover mercury.Some local authorities require permits for dental clinics; limits in wastewater of5 g mercury/unit, year.
France EEC Directives. Special order prohibits the incineration of waste containingmercury.
Finland Emissions to air, water and soil are regulated by the Air Pollution Control Act, theWater Act, and the Waste Act. Emissions limits are set on a case-by-case basisduring the environmental permit procedures. EEC Directives 89/369/EEC and89/429/EEC (new municipal waste incinerators) and 84/156/EEC (mercurydischarges to waters by sectors other than the chlor-alkali industry) have beenimplemented.
Germany Energy production from burning of coal: Total concentrations of cadmium, mercuryand thallium max. 0.2 mg/m3. Wastewater: max. 0.05 mg mercury/litre. Refuseincineration: Emissions to air max. 0.05 mg/m3. Wastewater: max. 0.05 mgmercury/litre. Metal mining and production: Wastewater from non-ferrous metal:max. 0.05 mg mercury/litre. Facilities with high production capacity: max. load1 g/tonne produced metal (e.g. lead, copper, zinc). Dental clinics: Mercury load ofraw wastewater from dental treatment must be reduced by 95 per cent beforemixing with domestic sewage, amalgam separators are used. Other legislationexists for mixed industrial wastewater (0.001 mg mercury/litre).
134

Country Actions
Ireland No information; but EEC legislation in force.
Japan Legislation for refuse incineration, metal mining and production, emissions to soil,emissions to water, fertilizer control act with limits for spreading of sewage sludgeon agricultural soil.
Netherlands Wastewater limits of industry (excluding chlor-alkali) in force since 1 July 1986:vinylchloride production: <0.1 g/1000 kg production capacity of VCM; otherindustry (including production of mercury catalysts, production of organic andanorganic mercury compounds and production of mercury-containing primarybatteries): 0.03-5.0 g/kg processed mercury.Regulation on organic fertilizers: sewage sludge: <3.5 mg/kg to 31-12-1994;starting 1-1-1995: <0.75 mg/kg. clean sludge: <1.5 mg/kg to 31-12-1994. compost:<2.0 mg/kg to 31-12-1994; starting 1-1-1995: <0.3 mg/kg. clean compost: <0.7mg/kg to 31-12-1994. very clean compost: <0.2 mg/kg since 1-1-1993. black soil:<0.2+0.0017(2L+H) mg/kg since 1-1-1993."Tennis elbow shock absorber": ban starting 1-6-1993.
Norway Specific limits are set in the discharge permits for each industrial and wasteincineration plant, according to the general legislation on environmental protection.Waste incineration: limit for emissions to air is 0.1 mg mercury m-3. Metal miningand production: specific limits (0.1-8 kg/year).Regulations restricting discharges from dental clinics have been proposed.Installation of mercury separators and separate collection of mercury-containingwaste will be required. Mercury-containing waste has to be treated as hazardouswaste. Future strategy: Further reduction in emissions.
Sweden No specific limits apply for different activities. Instead, decisions on applicationpermits are made on a case-by-case basis for each plant by the CountyAdministrative Board and the National Licensing Board for EnvironmentalProtection, which are empowered to prescribe measures to reduce pollution.Since 1985, dental clinics must install amalgam separators. For crematoria,Sweden has ongoing projects aiming at installing selenium filters to minimize themercury emissions. The long term goal is to phase out on a voluntary basis alluses of mercury in Sweden. By the year 2010, the goal is to have reduced theuse of mercury by 75 per cent.
Switzerland Limits for emissions to air (1985). Limits for emissions to water (1975).Limits for emissions from dental clinics (1988). Limits for mercury in fertilizers(1986) and sewage sludge and compost (1992). Limits for mercury in soils(1986). For numeric values, see text.
United Kingdom Energy production from burning of coal: EEC Directives and use of the bestavailable technology not entailing excessive costs (BATNEEC). Maximumemission limit to air 0.6 mg mercury/m3, to water 0.02 mg mercury/litre. Refuseincineration: EEC Directive 89/369. Metal mining and production and dental clin-ics: EEC Directive 84/156 with water quality objectives. No universal establishedlimits.Crematoria: Similar to waste incineration plants; but no maximum limits foremissions to air. Emissions limits are set for individual sites through theauthorization procedure.
United States See table, "United States Risk Reduction Efforts for Mercury", at the end of thisAnnex.
135

Country Actions
European Union EEC Directive 89/369 sets limits on emissions to the atmosphere from newmunicipal waste incinerators and is as follows: 0.2 mg Cd+Hg/m3. Emissions towater from industrial plants are regulated by EEC Directive 84/156 defining limitvalues and quality objectives for mercury discharges (to water) by sectors otherthan chlor-alkali industry.
136

Legislation for control of emissions to air, water, and soil from thechlor-alkali industry and future strategy for the chlor-alkali industry
Country Actions
Canada Criteria for air:Current mercury release under the Canadian Environmental Protection Act.5 g/day/tonne of rated capacity in ventilation gases exhausted from cell rooms ofplant.0.1 g/day/tonne where the source is the hydrogen gas stream from denuders orthe gases exhausted from end boxes or retorts.No release from the ambient air tank. Maximum total allowance in a plant is1.68 kg/day.Liquid effluent under the Fisheries Act is 0.0025 kg mercury/tonne of chlorineproduced.
Denmark EEC Directive 82/176. No production since 1991.
Finland Emission limits are set on a case-by-case basis during the environmental permitprocedure. EEC Directive 82/176 has been implemented.
France EEC Directive 82/176. Elimination of mercury use by 2010.
Germany EEC Directive 82/176. Mercury emission factor is limited to 1.5 g/tonne producedchlorine (Cl2).Quality standard for wastewater is 0.2 g/tonne chlorine for a 24-hour sample.Elimination of mercury use by 2010.
Ireland EEC Directive 82/176.
Netherlands Wastewater emission limit in force since 1 July 1986: <0.5 g/1000 kg productioncapacity of chlorine.
Norway The limit value for discharges to water is 0.25 g mercury/tonne chlorine capacityand for emissions to air 2.5 g mercury/tonne chlorine. The mercury-basedprocess will be replaced with a mercury-free process by 1998.
Sweden Application permits are given case-by-case. Atmospheric emissions are todayless than 2 g mercury/tonne chlorine. Elimination of mercury use by 2010.
Switzerland Water emission limit of 0.5 g/tonne chlorine capacity in force since 1983.Phasing out of mercury cell plants by 2010. Air emission limit of 2 g/tonnechlorine capacity by 1996.
United Kingdom EEC Directive 82/176 with use of the quality objectives.
United States See table, "United States Risk Reduction Efforts for Mercury", at the end of thisAnnex.
European Union EEC Directive 82/176 defines the limit values and quality objectives for mercurydischarges from the chlor-alkali industry.
137

138
Uni
ted
Sta
tes
Ris
kR
educ
tion
Effo
rts
for
Mer
cury
Sou
rce
Act
ions
Env
ironm
enta
lm
edia
Drin
king
wat
erM
axim
umco
ntam
inan
tle
vel(
MC
L)=
0.00
2m
g/lit
re(4
0C
FR
141.
62).
Sur
face
wat
ers
Am
bien
tW
ater
Qua
lity
Crit
eria
;w
ater
&or
gani
sms=
0.14
4µg
/litr
e;or
gani
sms
only
=0.
146
µg/li
tre
(EP
A19
86).
Air
No
ambi
ent
air
stan
dard
.
Soi
lN
oso
ilst
anda
rd.
Env
ironm
enta
lso
urce
sA
irP
oint
sour
ces
Em
issi
ons
from
mer
cury
ore
proc
essi
ngfa
cilit
ies
and
mer
cury
cell
chlo
r-al
kali
plan
tsar
elim
ited
toa
max
imum
of23
00g/
24-h
r;em
issi
ons
from
slud
gein
cine
ratio
nspl
ants
,sl
udge
dryi
ngpl
ants
,or
aco
mbi
natio
nof
thes
eth
atpr
oces
sw
aste
wat
ertr
eatm
ent
plan
tsl
udge
sar
elim
ited
toa
max
imum
of32
00g
/24-
hr(4
0C
FR
61.5
2).
Wat
erpo
int
sour
ces
Effl
uent
sfr
omin
dust
rialf
acili
ties
and
mun
icip
alw
aste
wat
ertr
eatm
ent
faci
litie
sar
ere
gula
ted
thro
ugh
indu
stry
-spe
cific
pre-
trea
tmen
tst
anda
rds
and
efflu
ent
guid
elin
esfo
rex
istin
gan
dne
wso
urce
sof
pollu
tion
and
are
base
don
the
limits
ofth
eav
aila
ble
cont
rol
tech
nolo
gy(4
0C
FR
401,
403,
App
endi
xA
).
Sew
age
slud
geP
erm
issi
ble
leve
lsof
mer
cury
inm
unic
ipal
was
tew
ater
trea
tmen
tsl
udge
s:17
mg/
kgdr
yw
t.an
dcu
mul
ativ
elo
adof
17kg
/hec
tare
for
agric
ultu
rall
and;
17m
g/kg
dry
wt.
and
annu
allo
adof
0.85
kg/h
ecta
refo
rho
me
gard
enor
law
n;57
mg/
kgdr
yw
t.fo
rot
her
land
appl
icat
ion;
100
g/kg
dry
wt.
for
surf
ace
disp
osal
.
Mer
cury
-con
tain
ing
was
tes
Any
solid
was
te(in
clud
ing
soil
that
isbe
ing
disp
osed
of)
isco
nsid
ered
aha
zard
ous
subs
tanc
ean
dpr
ohib
ited
from
disp
osal
inR
CR
AS
ubtit
leD
(non
-haz
ardo
us)
land
fills
ifits
leac
hate
cont
ains
0.2
mg/
litre
mer
cury
orgr
eate
r(4
0C
FR
261.
24);
land
disp
osal
inR
CR
AS
ubtit
leC
(haz
ardo
usw
aste
)la
ndfil
lsis
allo
wed
only
afte
rpr
escr
ibed
trea
tmen
tto
redu
cem
ercu
ryin
extr
act
to0.
2m
g/lit
re.
(40
CF
R30
2.4,
268,
262.
270)
.
Foo
dstu
ffsor
feed
Act
ion
leve
lfor
met
hylm
ercu
ryin
fish,
shel
lfish
,an
dot
her
aqua
tican
imal
s=
1pp
m(F
DA
CP
G71
80.0
7);
the
impo
rtof
food
sco
ntai
ning
the
resi
due
ofm
ercu
ry-c
onta
inin
gpe
stic
ides
that
are
not
regi
ster
edfo
rus
ein
the
US
ispr
ohib
ited.
Pro
duct
sB
atte
ries
The
batte
ryin
dust
ryha
san
noun
ced
itsin
tent
ion
tore
duce
mer
cury
inal
kalin
eba
tterie
sto
0.02
5pe
rce
ntby
wei
ght
by19
92;
itis
pred
icte
dth
atap
prox
imat
ely
5pe
rce
ntof
the
mer
cury
inba
tterie
sw
illbe
reco
vere
dth
roug
hre
cycl
ing
in19
95an
dap
prox
imat
ely
20pe
rce
ntby
2000
(EP
A19
91A
).
Pai
nts/
pigm
ents
All
uses
ofm
ercu
ryin
pain
tsha
vebe
endi
scon
tinue
d(E
PA
1972
,19
90a,
1990
b,19
91a,
1991
b).
Den
talu
ses
US
Pub
licH
ealth
Ser
vice
has
rece
ntly
stud
ied
risks
from
mer
cury
amal
gam
san
dre
com
men
ded
tight
erco
ntro
lson
dent
alus
esof
mer
cury
and
furt
her
rese
arch
tore
ach
mor
ede
finiti
veco
nclu
sion
son
risk
(CC
EH
RP
1993
).
Ligh
ting
Bec
ause
man
yflu
ores
cent
lam
psar
ecl
assi
fied
asR
CR
AH
azar
dous
Was
teun
der
curr
ent
test
proc
edur
es,
EP
Ais
eval
uatin
gop
tions
for
lam
pdi
spos
al.
Maj
orop
tions
are
1)co
nditi
onal
excl
usio
nof
lam
psfr
omha
zard
ous
was
tem
anag
emen
t,an
d2)
hand
ling
ofla
mps
ina
spec
ialc
olle
ctio
nsy
stem
for
othe
r"lo
w-g
rade
"an
dsm
allq
uant
ityha
zard
ous
was
tes
such
asba
tterie
san
dho
useh
old
pest
icid
es.

139
Uni
ted
Sta
tes
Ris
kR
educ
tion
Effo
rts
for
Mer
cury
Sou
rce
Act
ions
Pes
ticid
esN
ocu
rren
tpr
oduc
tion
ofm
ercu
ry-c
onta
inin
gpe
stic
ides
.A
llfo
rmer
regi
stra
tions
have
been
canc
elle
dor
requ
ests
for
volu
ntar
yca
ncel
latio
nha
vebe
enre
ceiv
ed.
Spe
cial
pape
rco
atin
gsT
heon
lytw
oco
mpa
nies
that
man
ufac
ture
thes
epr
oduc
tsha
vean
noun
ced
that
plan
sar
ebe
ing
deve
lope
dto
phas
eou
tth
eus
eof
mer
cury
inth
eco
atin
gs;
itis
pred
icte
dth
atby
1995
mer
cury
will
beel
imin
ated
entir
ely
from
this
appl
icat
ion
(EP
A19
91a)
.
Dru
gsR
emov
alor
rest
rictio
nof
mer
cury
in"o
ver-
the-
coun
ter"
drug
ssu
chas
anor
ecta
lpro
duct
san
dto
pica
lant
isep
tics;
requ
est
for
addi
tiona
ldat
aon
othe
rO
TC
mer
cury
antim
icro
bial
s.
Cos
met
ics
The
use
ofm
ercu
ryas
apr
eser
vativ
eor
antim
icro
bial
islim
ited
toey
e-ar
eaco
smet
ics
oroi
ntm
ents
inco
ncen
trat
ions
less
than
60pp
m(2
1C
FR
700.
13)
Env
ironm
enta
lhe
alth
Occ
upat
iona
lst
anda
rds
Ace
iling
limit
of0.
1m
g/m
3fo
rel
emen
talm
ercu
ry,
inor
gani
cm
ercu
ry,
and
alky
lmer
cury
com
poun
ds;
anei
ght-
hour
TW
Aof
0.01
mg/
m3
for
alky
lmer
cury
com
poun
ds,
and
ace
iling
limit
of0.
04m
g/m
3fo
ral
kylm
ercu
ryco
mpo
unds
.N
OT
E:
mor
est
ringe
ntst
anda
rds
wer
ere
cent
lyov
ertu
rned
inU
Sco
urt.
The
prev
ious
stan
dard
sw
ere:
an8-
hour
time
wei
ghte
dav
erag
e(T
WA
)of
0.05
mg/
m3
for
mer
cury
vapo
uran
d0.
01m
g/m
3fo
ral
kylm
ercu
ryco
mpo
unds
;a
Sho
rtT
erm
Exp
osur
eLi
mit
(ST
EL)
,a
max
imum
peak
for
ape
riod
not
exce
edin
gfiv
em
inut
esin
any
two
hour
s,of
0.03
mg/
m3
for
alky
lmer
cury
com
poun
ds;
and
ace
iling
limit,
am
axim
umne
ver
tobe
exce
eded
inth
ew
orkp
lace
,of
0.1
mg/
m3
for
aryl
and
inor
gani
cm
ercu
ry.
All
form
sof
mer
cury
wer
eas
sign
eda
skin
nota
tion,
indi
catin
gth
atth
esu
bsta
nce
isab
sorb
edth
roug
hth
esk
inan
dth
eref
ore
skin
cont
act
shou
ldbe
avoi
ded
(OS
HA
1989
).

140

APPENDIX 1-7
141

142

143
App
endi
x1
Pro
duct
ion
ofM
ercu
ryfr
omO
res
and
Con
cent
rate
sin
Met
ricT
onne
s(M
etal
lges
ells
chaf
t19
92)
1981
1982
1983
1984
1985
1986
1987
1988
1989
1990
1991
Cou
ntry
/con
tinen
t
76 252
1560 67 –
53 159
1540 71 –
– –14
16 65 52
– –15
20 80 72
– –15
3913
088
– –14
7114
775
– –15
3314
467
– –14
9913
570
– –96
716
051
– –96
214
037
– – 52 74 *35
Ger
man
y,F
RIta
lyS
pain
Fin
land
Yug
osla
via
1955
1823
1533
1672
1757
1693
1764
1704
1178
1139
161
Eur
ope
1
204
246
162
182
226
262
211
9720
247
25T
urke
y
204
246
162
182
226
262
211
9720
247
25A
sia
1
877
386
828
586
801
764
756
662
587
637
431
Alg
eria
877
386
828
586
801
764
756
662
587
637
431
Afr
ica
324
096
2
229
588
8
422
186
4
238
465
7
139
457
0
–18
5*5
10
–12
4*1
40
–34
5*5
20
–65
1*4
70
–73
5*5
00
–*7
20*4
0
Dom
inic
anR
epub
licM
exic
oU
nite
dS
tate
s
1205
1185
1089
1043
965
695
264
865
1121
1235
760
Am
eric
a
4241
3640
3612
3483
3749
3414
2995
3328
3088
3058
1377
Wes
tern
coun
trie
s
153
1700
800
151
1700
800
144
1700
850
152
1600
800
158
1600
800
168
1500
850
164
1650
900
168
1650
900
131
1500
1200
126
1400
930
7512
0010
00
Cze
chos
lova
kia
US
SR
*C
hina
,P
R*
2653
2651
2694
2552
2558
2518
2714
2718
2831
2456
2275
Eas
tern
coun
trie
s
6894
6291
6306
6035
6307
5932
5709
6046
5919
5514
3652
Tot
alW
orld
1E
xclu
ding
"eas
tern
coun
trie
s"*
Est
imat
ed
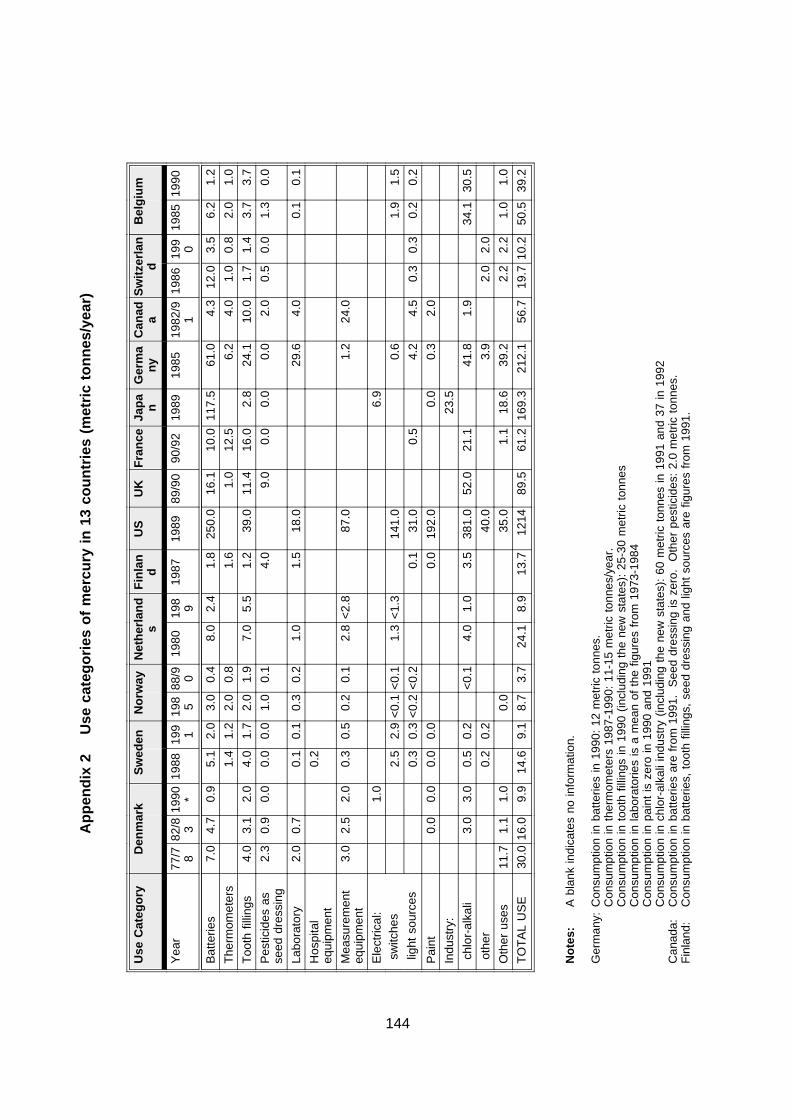
144
App
endi
x2
Use
cate
gorie
sof
mer
cury
in13
coun
trie
s(m
etric
tonn
es/y
ear)
Use
Cat
egor
yD
enm
ark
Sw
eden
Nor
way
Net
herla
nds
Fin
lan
dU
SU
KF
ranc
eJa
pa nG
erm
any
Can
ad aS
witz
erla
nd
Bel
gium
Yea
r77
/7 882
/8 319
90 *19
8819
9 119
8 588
/9 019
8019
8 919
8719
8989
/90
90/9
219
8919
8519
82/9
119
8619
9 019
8519
90
Bat
terie
s7.
04.
70.
95.
12.
03.
00.
48.
02.
41.
825
0.0
16.1
10.0
117.
561
.04.
312
.03.
56.
21.
2
The
rmom
eter
s1.
41.
22.
00.
81.
61.
012
.56.
24.
01.
00.
82.
01.
0
Too
thfil
lings
4.0
3.1
2.0
4.0
1.7
2.0
1.9
7.0
5.5
1.2
39.0
11.4
16.0
2.8
24.1
10.0
1.7
1.4
3.7
3.7
Pes
ticid
esas
seed
dres
sing
2.3
0.9
0.0
0.0
0.0
1.0
0.1
4.0
9.0
0.0
0.0
0.0
2.0
0.5
0.0
1.3
0.0
Labo
rato
ry2.
00.
70.
10.
10.
30.
21.
01.
518
.029
.64.
00.
10.
1
Hos
pita
leq
uipm
ent
0.2
Mea
sure
men
teq
uipm
ent
3.0
2.5
2.0
0.3
0.5
0.2
0.1
2.8
<2.
887
.01.
224
.0
Ele
ctric
al:
1.0
6.9
switc
hes
2.5
2.9
<0.
1<
0.1
1.3
<1.
314
1.0
0.6
1.9
1.5
light
sour
ces
0.3
0.3
<0.
2<
0.2
0.1
31.0
0.5
4.2
4.5
0.3
0.3
0.2
0.2
Pai
nt0.
00.
00.
00.
00.
019
2.0
0.0
0.3
2.0
Indu
stry
:23
.5
chlo
r-al
kali
3.0
3.0
0.5
0.2
<0.
14.
01.
03.
538
1.0
52.0
21.1
41.8
1.9
34.1
30.5
othe
r0.
20.
240
.03.
92.
02.
0
Oth
erus
es11
.71.
11.
00.
035
.01.
118
.639
.22.
22.
21.
01.
0
TO
TA
LU
SE
30.0
16.0
9.9
14.6
9.1
8.7
3.7
24.1
8.9
13.7
1214
89.5
61.2
169.
321
2.1
56.7
19.7
10.2
50.5
39.2
Not
es:
Abl
ank
indi
cate
sno
info
rmat
ion.
Ger
man
y:C
onsu
mpt
ion
inba
tterie
sin
1990
:12
met
ricto
nnes
.C
onsu
mpt
ion
inth
erm
omet
ers
1987
-199
0:11
-15
met
ricto
nnes
/yea
r.C
onsu
mpt
ion
into
oth
fillin
gsin
1990
(incl
udin
gth
ene
wst
ates
):25
-30
met
ricto
nnes
Con
sum
ptio
nin
labo
rato
ries
isa
mea
nof
the
figur
esfr
om19
73-1
984
Con
sum
ptio
nin
pain
tis
zero
in19
90an
d19
91C
onsu
mpt
ion
inch
lor-
alka
liin
dust
ry(in
clud
ing
the
new
stat
es):
60m
etric
tonn
esin
1991
and
37in
1992
Can
ada:
Con
sum
ptio
nin
batte
ries
are
from
1991
.S
eed
dres
sing
isze
ro.
Oth
erpe
stic
ides
:2.
0m
etric
tonn
es.
Fin
land
:C
onsu
mpt
ion
inba
tterie
s,to
oth
fillin
gs,
seed
dres
sing
and
light
sour
ces
are
figur
esfr
om19
91.

145
App
endi
x3
Rel
ativ
eco
nsum
ptio
nof
mer
cury
in13
coun
trie
s
Use
Cat
egor
yD
enm
ark
Sw
eden
Nor
way
Net
herla
nds
Fin
lan
dU
SU
KF
ranc e
Japa n
Ger
ma
nyC
anad a
Sw
itzer
lan
dB
elgi
umT
otal
Yea
r77
/7 982
/8 319
9 019
8 819
9119
8 588
/9 019
8019
8919
8719
8 989
/9 090
/92
1989
1985
1982
/91
1986
199 0
198 5
199 0
1980 s
Bat
terie
s23
.329
.49.
134
. 922
.034
. 610
.733
.227
.013
.120
.618
.016
.369
.428
.87.
661
.134
. 312
. 33.
125
.1
The
rmom
eter
s9.
613
.223
. 120
.111
.71.
120
.42.
97.
15.
17.
94.
02.
61.
7
Too
thfil
lings
13.3
19.4
20. 2
27. 4
18.7
23. 1
49.9
29.0
61.8
8.8
3.2
12.7
26.1
1.7
11.4
17.6
8.7
13. 7
7.3
9.4
7.0
Pes
ticid
esas
seed
dres
sing
7.7
5.6
11. 0
3.2
29.2
10.1
3.5
2.5
0.4
2.6
0.9
Labo
rato
ry6.
74.
40.
71.
13.
55.
44.
110
.91.
514
.07.
10.
20.
22.
7H
ospi
tal
equi
pmen
t1.
4
Mea
sure
men
teq
uipm
ent
10.0
15.6
20. 2
2.1
5.5
2.3
2.7
11.6
<0.
17.
20.
642
.35.
9
Ele
ctric
al:
10. 1
4.1
0.4
switc
hes
17. 1
31.9
<0. 1
<0.
15.
4<
0.1
11.6
0.3
3.8
3.8
7.5
light
sour
ces
2.1
3.3
<0. 1
<0.
10.
72.
60.
82.
07.
91.
32.
50.
40.
52.
1
Pai
nt15
.80.
13.
59.
6In
dust
ry:
13.9
1.2
chlo
r-al
kali
18.8
30. 3
3.4
2.2
16.6
11.2
25.5
31.4
58.1
34.5
19.7
3.4
67. 5
77. 8
28.4
othe
r1.
42.
23.
31.
810
.219
. 62.
4
Oth
erus
es39
.06.
910
. 10.
22.
91.
811
.018
.511
.221
. 62.
02.
65.
0
TO
TA
LU
SE
100
100
100
100
100
100
100
100
100
100
100
100
100
100
100
100
100
100
100
100
1001 2

146
App
endi
x4
Use
ofm
ercu
ryin
the
Uni
ted
Sta
tes
1959
-199
0(m
etric
tonn
es/y
ear)
Use
cate
gory
1959
1968
1978
1984
1989
1990
1959
1968
1978
1984
1989
1990
Met
ricto
nnes
/yea
rR
elat
ive
cons
umpt
ion
Agr
icul
ture
110
118
210
00
5.8
4.5
1.2
0.0
0.0
0.0
Am
alga
tion
99
0.5
00
00.
50.
30.
00.
00.
00.
0C
atal
ytic
3366
2912
00
1.7
2.5
1.7
0.7
0.0
0.0
Den
tal
9510
618
4939
455.
04.
01.
02.
73.
26.
3E
lect
riclig
ht31
342.
64.
7W
iring
/sw
itche
s14
169
11.6
9.6
Bat
terie
s42
667
761
911
7025
010
722
.525
.935
.465
.120
.614
.9C
hlor
-alk
ali
201
602
385
253
381
248
10.6
23.0
22.0
14.1
31.4
34.4
Labo
rato
ry38
6914
818
312.
02.
60.
80.
41.
54.
3In
stru
men
ts35
127
512
098
8710
718
.610
.56.
95.
57.
214
.9P
aint
121
369
309
160
192
216.
414
.117
.78.
915
.82.
9P
aper
/pul
p15
014
0.5
00
07.
90.
50.
00.
00.
00.
0P
harm
aceu
tical
s59
1515
00
3.1
0.6
0.9
0.0
0.0
0.0
Met
als
for
inve
ntor
y/ot
her
298
298
216
4875
5815
.811
.412
.42.
76.
28.
1
TO
TA
L18
9126
1817
4717
9812
1472
010
010
010
010
010
010
0

Appendix 5 Mercury Content of Rocks
(modified after Jonasson and Boyle 1979)
Rock type Range Mean(µg/kg)
Igneous
Ultrabasic rocks (dunites, kimberlites, etc.)
Basic rocksIntrusives (gabbros, diabase, etc.)Extrusives (basalt, etc.)
Intermediate rocksIntrusives (diorites, etc.)Extrusives (andesites, etc.)
Acid rocksIntrusives (granites, granodiorites,syenite, etc.)Extrusives (rhyolite, trachyte, etc.)
Alkali-rich rocks (nepheline syenites,phonolites, etc.) – (data mainly fromKhibina and Lovozero massifs, USSR)
7-250
5-845-40
13-6420-200
7-2002-200
40-1400
168
2820
3866
6262
450
Sedimentary
Recent sedimentsStream and river sedimentsLake sedimentsOcean sediments
Sandstone, arkose, conglomerate, etc.
Shales and argillitesShales, mudstones and argillitesCarbonaceous shales, bituminous shales,etc.
Limestone, dolomite, etc.EvaporitesGypsum, anthydriteHalite, sylvite, etc.
Rock phosphate (Florida)
10-70010-700
<10-2000
<10-300
5-300100-3250
40-22040- 6020-20020-200
7373
100
55
67-437
40253030
120
Metamorphic:
Quartzites, etc.AmphibolitesHornfelsSchistsGneisses
Marble, crystaline dolomites, etc.
10-10030- 9035-160
10-100025-100
10-100
5350
22510050
50
147

Appendix 6 Mercury content of various sectors in nature(modified after Jonassen and Boyle 1979)
Sector Range Remarks/Mean
Volcanic exhalations, soil, airAtmosphere
Air over mercury deposits
Soil air over mercury depositsVolcanic exhalations
2-10 ng/m-3
30-1600 " "
0-2000 " "100-9000 " "
Higher values in industrialareasLower values (0.5) overoceansHighly variableHighly variableData only from USSR,Hawaiian Islands
VOLCANIC CONDENSATES AND PRECIPITATESFumarolic condensatesSulphuric and hydrochloric acidsChloride, sulphate, fluoride and sulphur precipitatesHydrous iron oxide precipitatesOpaline silica sinters, etc. at hot spring orifices
0.3-6 µg/kg0.2-72 " "1-14,000 " "up to 0.1 per centup to 0.2 per cent
Highly variableHighly variableSome contain cinnabar,metacinnabar, nativemercury, etc.
FOSSIL FUELSPeatCoalCoal in mercuriferous basinsCrude oilsPetroleum crudes in mercuriferous beltsNatural gas
Natural gas for consumer use
Bitumens, solid hydrocarbons, asphalts, etc.
60-330 µg/kg10-8.530 " "20-300,000 " "20-2,000 " "1900- 21,000 " "Saturated with mercuryvapour0-450 mg/m3
1-3 µg/m3
2000-900,000 µg/kg
Highly variableDonbas and Donets basins,USSRLibya, USAData only from Cymric field,CaliforniaData only from Cymric field,California
GermanyGermanySome bitumens and solidhydrocarbons such asidrialite are greatly enriched(up to percentages) inmercury
LIVING ORGANISMSMarine plantsTerrestrial plantsTerrestrial plants in vicinity of mercury depositsMarine animals, molluscs, fish, seals, etc.Terrestrial (freshwater) animals, fish, birds, grayfish etc.Terrestrial (land) animals, man, birds etc.
0.1-37 µg/kg fresh nt.0-40 " " "200-30,000 " " "0.1-200 " " "0.1-200 " " "1-100 " " "
Limited data30-700 (in the dry plant)In the dry plant
Contents up to 5000 or morerecorded
SOILS AND GLACIAL DEPOSITSNormal soilsNormal tills, glacial clay, sand, etc.Soils, tills, etc. near mercury deposits, sulphide deposits, etc.Soil horizons (normal)*
A (humic)BC
Soil horizons (near mercury deposits)*A (humic)BC
20-150 µg/kg20-100 "up to 250 mg/kg
60-200 µg/kg30-140 "25-150 "
200-1860 "140-605 "150-554 "
70 µg/kg80 "
161 "89 "96 "
480 "275 "263 "
Natural watersRainwater, snowNormal stream, river and lake watersCoal mine waters (Donets Basin, USSR)Stream and river waters near mercury depositsOceans and seasHot springs and certain mineral watersNormal groundwatersGroundwaters and mine waters near polymetallic sulphide depositsOil field and other saline waters
0.01-0.48 µg/kg0.001-0.1 µg/litre1-10 "0.5-100 "0.0005-0.1 "0.01-2.5 "0.0001-0.02 "1-1000 "0.1-230 "
* Examples from Clyde Forks area, Ontario.
148

149
App
endi
x7
Mer
cury
emis
sion
sin
the
EC
(met
ricto
nnes
per
year
)in
1989
(Max
son
etal
.199
1)
Des
tinat
ion
ofim
med
iate
emis
sion
s
Sou
rce/
activ
ity
Mer
cury
min
ing
Sec
onda
rypr
oduc
tion
Non
-fer
rous
met
alpr
oduc
tion/
refin
ing:
·zi
nc/c
adm
ium
·le
ad·
copp
erS
ubto
tal:
Non
-fer
rous
Fos
silf
uels
:·
coal
·oi
l·
natu
ralg
asS
ubto
tal:
Fos
silf
uels
Indu
stria
lpro
duct
ion:
·iro
n/st
eel
·ch
lorin
e/ca
ustic
·in
dust
rialc
atal
ysts
·ce
men
t·
phos
phat
efe
rtili
zer
·m
ercu
ricox
ide,
othe
rch
emic
als
·ot
hers
,es
peci
ally
sulp
huric
acid
Sub
tota
l:in
dust
rial
Pro
duct
use:
·ba
tterie
s·
dent
alam
alga
ms
·el
ectr
iclig
htin
gan
deq
uipm
ent
·m
easu
ring/
cont
roli
nstr
umen
ts·
labo
rato
ryap
plic
atio
ns·
phos
phat
efe
rtili
zer
·in
dust
rialc
atal
ysts
Sub
tota
l:P
rodu
ctus
e
Cre
mat
ion/
buria
l
Slu
dge
was
tedi
spos
al
Dre
dgin
g
Tot
als
%of
tota
l
Gra
ms
ofm
ercu
rype
rca
pita
Air 10 5 4 1 1 6 48 244
76
423 ? 2
<1
? * 29 33 8 10 6 1 – 4 62 4 3
<1
196
26 0.6
Wat
er
? <1
<1
<1
<1 1
<1 – –
<1 2 5
<1 – 1
? *8
<1 14 <1
<1 1 –
<1 17 – 2 6 35 5
0.1
Land 20 15 162 1
19 12 – – 12 28 150 ? 26 3 ? *
207
100 24 30 19 6 11 12 202 6 28 20
529
69 1.6
Tot
al
30 21 20 3 2 26 60 244
88 34 178
<1 28 4 ? *
244
133
46 40 25 8 11 16 281
10 33 26 760
100
2.3

150

REFERENCES
ACGIH (1990) Threshold limit values and biological exposure indices. 5th ed. AmericanConference of Governmental Industrial Hygienists, Cincinnati, as referenced inATSDR 1992.
ALLARD (1993) Amalgaam. Report on a literature study (in Dutch) – draft version.
Armands, G. (1967) Geochemical Prospecting of a Uraniferous Bog Deposit at Masugusbyn,Northern Sweden. In: Kvalheim, A. (ed.), Geochemical Prospecting in Fennoscandia.New York: Interscience, 127-154.
ATSDR (1992a) Case Studies in Environmental Medicine, Mercury Toxicity. US Departmentof Health and Human Services, Public Health Service, Agency for Toxic Substancesand Disease Registry. March.
ATSDR (1992b) Toxicological Profile for Mercury, Draft. US Department of Health and HumanServices, Public Health Service, Agency for Toxic Substances and Disease Registry.
Bacci, E. (1989) Mercury in the Mediterranean. Mar. Pollut. Bull. 20:59-63.
Bayens, W. (1993) Modification of the Mercury Fluxes at the Air-Sea Interface. Water, Air andSoil Pollut. 56:731-744.
Boutron, C.F. (1986) Atmospheric Toxic Metals and Metalloids in the Snow and Ice LayersDeposited in Greenland and Antarctica from Prehistoric Times to Present. In: ToxicMetals in the Atmosphere, Nriagu, J.O. and Davidson, C.I. (eds.). Advances inEnvironmental Science and Technology 17:467-505.
British Geological Survey (1990) World Mineral Statistics 1988-89.
Buart-Menard, P. and Duce, R.A. (1987) in: Lead, Mercury, Cadmium and Arsenic in theEnvironment (SCOPE 31), Hutchinson, T.C. and Meema, K.M. (eds.), pp. 147-74.
CAAA (1990) US Clean Air Act Amendments Subsection 112(n)(1)(B).
Calasans, C.F., Malm, O. and Pfeiffer, W.C. (1993) Evaluation of atmospheric Hgcontamination through the biological monitor Tillandsia usneoides (Bromeliaceae). In:Conference Proceedings (Allan, R.J and Nriagu, J.O., eds.), International Conference:Heavy Metals in the Environment, Toronto, Canada, 12-17 September 1993. Vol. 1,pp. 344-47.
Carpi, A., Weinstein, L.H. and Ditz, D.W. (1994) Bioaccumulation of Mercury by SphagnumMoss near a Municipal Solid Waste Incinerator. Air And Waste 44:669-72.
Coker, W.B. and DiLabio, R.N.W. (1979) Initial Geochemical Results and ExplorationSignificance of Two Uraniferous Peat Bogs, Kasmere Lake, Manitoba. In: CurrentResearch, Part B, Geological Survey of Canada, paper 79-1B, pp. 199-206.
Coker, W.B., Hornbrook, E.H.W. and Carmeron, E.M. (1979) Lake Sediment GeochemistryApplied to Mineral Exploration. In: Hood, P.J. (ed.), Geophysics and Geochemistryin the Search for Metallic Ores. Geological Survey of Canada, Economic GeologyReport 31, pp. 435-478.
151

CCEHRP (1993) Dental Amalgam: A Scientific Review and Recommended Public HealthService Strategy for Research, Education and Regulation. Committee to CoordinateEnvironmental Health and Related Programs, US Public Health Service. January.
CCRX (1993) Pieters, H., Hagel P. and Ruiter, A. (1993) Kwik in Milieu en Voeding inNederland, Coördinatie Commissie voor de metingen van Radioactiviteit enXenobiotische stoffen. The Netherlands.
CEPA (Commenwealth Environment Protection Agency) (1994) Comments to the mercuryOECD report.
Cossa, D., Thibaud, Y., Romeo, M. and Gnassia-Barelli, M. (1990) Le Mercure en MilieuMarin : Biogéochimie et Écotoxicologie. Rapport Scientifique et Techniqiue IFREMER18. Nantes, 130 pp.
Craig, P.J. (1988) Organometallic Compounds in the Environment. Longman.
CUWVO (1991) De Waterkwaliteit van Nederland in 1990. Coördinatie Commissie UitvoeringWet Verontreinniging Oppervlaktewateren. The Netherlands.
DHHS (1993) Dental Amalgam: A Scientific Review and Recommended Public Health ServiceStrategy for Research, Education and Regulation. Final Report of the Subcommitteeon Risk Management of the Committee to Coordinate Environmental Health andRelated Programs. Department of Health and Human Services, Public Health Service,the Netherlands.
Dilabio, R.N.W. (1983) Geochemistry of Peat in the NEA/IAEA Athabasca Test Area. In:Cameron, E.M. (ed.), Uranium Exploration in Athabasca Basin, Saskatchewan,Canada. Geological Survey of Canada, Paper 82-11, pp. 133-38.
Dilabio, R.N.W. and Coker, W.B. (1982) Geochemistry of Peat Associated with UraniferousBedrock, Kasmere Lake Area, Manitoba. In: Davenport, P.H. (ed.), Prospecting inAreas of Glaciated Terrain – 1982. Canadian Institute of Mining and Metallurgy, pp.179-94.
Dunn, E.E. (1987) Developments in Biogeochemical Exploration. In: Garland, G.D. (ed.),Exploration ’87: Third Decennial International Conference on Geophysical andGeochemical Exploration for Minerals and Groundwater, Toronto. Special Volume,Ontario Geological Survey, 1989, pp. 417-438.
Edner, H., Faris, G.W., Sunesson, A., Svanberg, S., Bjarnson, J.O., Kristmannsdottir, H. andSigurdsson, K.H. (1991) Lidar Search for Atmospheric Mercury in IcelandicGeothermal Fields. J. Geophys, Res. 96:2977-2986.
Environment Canada (1994) Letter from Commercial Chemicals Evaluation Division toVKI/OECD (17 June 1994).
Europile (1992) Batteries and the Environment. The Association of European Dry BatteryManufacturers, Bern.
EURO CHLOR (1994) Comments to OECD Mercury Draft Status Report – November 1993.Letter to BIAC (Business and Industry Advisory Committee to the OECD), 14 March1994.
FDA (Food and Drug Administration, United States) (1980) Federal Register 45(241):82014,December 12, 1980.
152

FDA (Food and Drug Administration, United States) (1991) Federal Register 56(140):33644.July 22, 1991.
FDA (Food and Drug Administration, United States) (1992) Code of Federal Regulations, Vol.21, Part 330.
FDA (Food and Drug Administration, United States) (1993) Personal communication to USEPA.
Fitzgerald, W.F. (1986) Cycling of Mercury between the Atmosphere and Oceans. In: Buat-Ménard, P., ed., The role of Air-sea Exchange in Geochemical Cycling. R. ReidelPublishing Company, 363-408.
Fitzgerald, W.F. (1993) Global Biogeochemical Cycling of Mercury. In: ConferenceProceedings (Allan, R.J and Nriagu, J.O., eds.), International Conference: HeavyMetals in the Environment 1:320-323.
Fitzgerald, W.F., Mason. R.P. and Vandal, G.M. (1991) Atmospheric Cycling and Air-WaterExchange of Mercury over Mid-Continental Lacustrine Regions. Water, Air and SoilPollution 56:745-767.
Garrett, R.G. (1994) Concentration of Metallic Elements in Continental Crust. GeologicalSurvey of Canada.
GESAMP (1986) Review of Potentially Harmful Substances: Arsenic, Mercury and Selenium.IMO/FAO/UNESCO/WMO/WHO/IAEA/UN/UNEP Joint Group of Experts on ScientificAspects of Marine Pollution. Geneva: WHO Reports and Studies 28.
Gill, G.A. and Fitzgerald, W.F. (1987) Mercury in Surface Waters of the Open Ocean. GlobalBiogeochemical Cycles 1:199-212.
Gill, G.A. and Fitzgerald, W.F. (1988) Vertical Mercury Distributions in the Oceans. Geochim.Cosmochim. Acta 52:1719-1728.
Godbold, D.L. (1991) Mercury-induced Root Damage in Spruce Seedlings. Water, Air andSoil Pollut. 56:823-831.
Hecky, R.E., Ramsey, D.J., Bodaly, R.A. and Strange, N.E. (1991) Increased MethylmercuryContamination in Fish in Newly formed Freshwater Reservoirs. In: Advances inMercury Toxicology (Susuki, T., et al., eds.). New York: Plenum Press, 33-52.
Hoyer, M., Burke, J., Cleckner, L., Mukherjee, K. and Keeler, G. (1993) Mercury inPrecipitation: A Multi-site Study. In: Conference Proceedings (Allan, R.J and Nriagu,J.O., eds.), International Conference: Heavy Metals in the Environment, 1:332-335.
Hultberg, H., Iverfeldt, Å. and Lee, Y.-H. (1993) Methylmercury Input/Output and Accumulationin Forested Catchments and Critical Loads for Lakes in Southwestern Sweden. In:Watras, C.J. and Huckabee, J.W. (eds.), Mercury Pollution: Integration and Synthesis.Boca Raton, Florida: Lewis Publishers.
IPCS (International Programme on Chemical Safety): see WHO.
IRIS (1992) Integrated Risk Information Systems. US Environmental Protection Agency, Officeof Health and Environmental Assessment, Environmental Criteria and AssessmentOffice, Cincinnati, Ohio.
153

Jensen, A. and Iverfeldt, Å. (1994) Atmospheric Bulk Deposition of Mercury to the SouthernBaltic Sea. In: Watras, C.J. and Huckabee, J.W. (eds.), Mercury Pollution: Integrationand Synthesis. Boca Raton, Florida: Lewis Publishers.
Jensen, A. and Jensen, A. (1991) Historical Deposition Rates of Mercury in ScandinaviaEstimated by Dating and Measurement of Mercury in Cores of Peat Bogs. Water, Airand Soil Pollut. 56:769-777.
Johansson, K., Aastrup, M., Anderson, A., Bringemark, L. and Iverfeldt, Å. (1991) Mercuryin Swedish Forest Soils and Waters - Assessment of Critical Load. Water, Air andSoil Pollut. 56:267-281.
Kim, J.P. and Fitzgerald, W.F. (1986) Sea-air Partitioning of Mercury in the Equatorial PacificOcean. Science 231:1131-1133.
Kim, K.-H., Lindberg, S.E., Hanson, P.J., Meyers, T.P. and Owens, J. (1993) Application ofMicrometeorological Methods to Measurements of Mercury Emissions overContaminated Soils. In Conference Proceedings (Allan, R.J and Nriagu, J.O., eds.),International Conference: Heavy Metals in the Environment 2:328-331.
Krabbenhoft, D.P. and Babiarz, C.L. (1992) The Role of Groundwater Transport in AquaticMercury Cycling. Water Resources Research 28(12):3119-3128.
Kiørboe, T., Møhlenberg F. and Riisgård, H.U. (1983) Mercury Levels in Fish, Invertebratesand Sediments in a Recently Recorded Polluted Area (Nissum Broad, WesternLimfjord, Denmark). Mar. Pollut. Bull. 14:21-24.
Lamersdorf, N.P., Godbold, D.L. and Knoche, D. (1991) Risk Assessment of Some HeavyMetals for the Growth of Norway Spruce. Water, Air and Soil Pollut. 57-58:535-543.
Lantzy, R.J. and Mackenzie, J.L. (1979) Atmospheric Trace Metals: Global Cycles andAssessment of Man’s Input. Geochim. Cosmochim. Acta. 43, pp. 511-25.
Lathrop, R.C., Rasmussen, P.W. and Knauer, D.R. (1991) Mercury Concentrations inWalleyes from Wisconsin (US) Lakes. Water, Air and Soil Pollut. 56:295-307.
Lee, Y-H. and Iverfeldt, Å. (1991) Measurement of Methylmercury and Mercury in Run-off,Lake and Rain Water. Water, Air and Soil Pollut. 56:309-321.
Lee, Y-H., Iverfeldt, Å. and Borg, G.C. (1994) Fluxes and Turnover of Methylmercury/MercuryPools in Forest Soil. In: Watras, C.J. and Huckabee, J.W. (eds.), Mercury Pollution:Integration and Synthesis. Boca Raton, Florida: Lewis Publishers.
Lindquist, B., Jernelöv, A., Johansson, K. and Rodhe, H. (1984) Mercury in the SwedishEnvironment, Global and Local Sources. SNV PM 1816, Swedish EnvironmentProtection Agency, S-171 85. Solna, Sweden.
Lindquist, O. and Rodhe, H. (1985) Atmospheric Mercury - A Review. Tellus 37B:136-159.
Lindqvist, O., Johansson, K., Aastrup, M., Andersson, A., Bringmark, L., Hovsenius, L.,Iverfeldt, Å., Meili, M. and Timm, B. (1991) Mercury in the Swedish Environment -Recent Research on Causes, Consequences and Corrective Methods. Water, Air andSoil Pollut. 55.
Lockeretz (1974) Water, Air and Soil Pollut. Vol. 3, pp. 179-93.
154

Madsen, P.P. and Larsen, B. (1986) Accumulation of Mud Sediments and Trace Metals in theKattegat and the Belt Sea. Marine Pollution Laboratory, Denmark, Rep. Mar. Pollut.Lab. 10, 54 pp.
Malm, O., Pfeiffer, W.C., Souza, C.M. and Reuther, R. (1990) Mercury Pollution Due to GoldMining in the Madeira River Basin, Brazil. Ambio 19:11-25.
Maxson, P.A., Vonkeman, G.H., Brown, N., Stonneehouse, J., Thorntonne, I. and Kazantzis(1991) Mercury. Rational Paths through Uncharted Territory. Report prepared for theCommission of the European Communities DG XI.
Meij, R. (1991) The Fate of Mercury in Coal-fired Power Plants and the Influence of Wet Flue-gas Desulphurisation. Water, Air and Soil Poll. 56:21-33.
Meili, M. (1991) The Coupling of Mercury and Organic Matter in the Biogeochemical Cycle -Towards a Mechanistic Model for the Boreal Forest Zone. Water, Air and Soil Poll.56: 333-347.
Metallgesellschaft (1992) Metallstatistik 1981-1991. Frankfurt am Main.
Michigan Environmental Science Board (1993) Mercury in Michigan’s Environment:Environmental and Human Health Concerns (A Science Report to Govenor JohnEngler).
Minerals Yearbook (1972) Metals and Minerals. 1. US Bureau of Mines.
Minerals Yearbook (1986) Metals and Minerals. 1. US Bureau of Mines.
Minerals Yearbook (1989) Mercury. 1, 705-708. US Bureau of Mines.
Minerals Yearbook (1990) US Bureau of Mines.
Nater, E.A. and Grigal, D.F. (1992) Regional Trends in Mercury Distribution Across the GreatLakes States, North Central USA. Nature 58:139-141.
NEMA (1992a) The Management of Spent Electric Lamps Containing Mercury. NationalElectrical Manufacturers Association. October 1992.
NIOSH (1990) NIOSH pocket guide to chemical hazards. Washington, D.C.: US Departmentof Health and Human Services, Center for Disease Control, National Institute forOccupational Safety and Health, Division of Standard Development and TechnologyTransfer. NIOSH publication number 90-117, as referenced in ATSDR 1992.
Nordic Council of Ministers (1992) Assessment of Possibilities for Reducing the Use ofMercury – Summary of Experience from the Nordic Countries. 598.
Nriagu, J.O. (1979) The Biogeochemistry of Mercury in the Environment. Elsevier.
Nriagu, J.O. (1989) A Global Assessment of Natural Sources of Atmospheric Trace Metals.Nature 338:47-49.
Nriagu, J.O. and Pacyna, J.M. (1988) Quantitative Assessment of Worldwide Contaminationof Air, Water and Soils by Trace Metals. Nature 333:134-139.
NTP (1993) Toxicology and Carcinogenesis Studies of Mercuric Chloride in F344 Rats andB6C3F1 Mice. National Toxicology Program Technical Report No. 408.
155
OECD (1985) Measures to Reduce all Man-made Emissions of Mercury to the Environment.1982 Information Exchange on Mercury - Summary Report. Paris.
OSHA (1989a) Toxic and Hazardous Substances. US Department of Labor. OccupationalSafety and Health Administration. Code of Federal Regulations 29 CFR 1910.1000.
OSHA (1989b) Air Contaminants; Final Rule. US Department of Labor. Occupational Safetyand Health Administration. Code of Federal Regulations Vol. 29, Part 1910.
OSHA (1993) Occupational Safety and Health Administration. Federal Register 58(124):35338.
Pratt, G.C. (1990) Temporal Trends of Mercury Contamination in Fish and Sediment. Paperpresented at the International Conference on Mercury as an Environmental Pollutant,Gävle, Sweden, June 11-13, 1990.
Rasmussen, P.E. (1993) The Environmental Significance of Geological Sources of Mercury:A Precambrian Shield Watershed Study. Thesis, University of Waterloo, Ontario,Canada.
Rundgren, S., Rühling Å., Schlüter, K. and Tyler, G. (1992) Mercury in Soil – Distribution,Speciation and Biological Effects. Nordic Council of Ministers. Nord 1992:3, 89 pp.
Sabbioni, E., Goetz, A., Springer A. and Pietra, R. (1983) Trace Metals from Coal-fired PowerPlants: Derivation of an Average Data Base for Assessment Studies of the Situationin the European Communities. Science Total Environ. 29:213-227.
Salmi, M. (1967) Peat in Prospecting: Applications in Finland. In: Kvalheim, A. (ed.),Geochemical Prospecting in Fennoscandia. New York: Interscience, pp. 113-26.
Schintu, M., Kauri, T. and Kudo, A. (1989) Inorganic and Methyl Mercury in Inland Waters.Wat. Res. 6:699-704.
Second International Conference on the Protection of the North Sea (1987) Quality Status ofthe North Sea – Summary. The Department of the Environment, London.
Semb, A. and Pacyna, J.M. (1988) Toxic Trace Elements and Chlorinated Hydrocarbons:Sources, Atmospheric Transport and Deposition. Nordic Council of Ministers. Nord1988:74, 96 pp.
Schroeder, W. H., Munthe, J. and Lindqvist, O. (1989) Cycling of Mercury Between Water,Air and Soil Compartments of the Environment. Water, Air and Soil Pollution 48:337-347.
Schuurs, A.H.B. and Davidson, C.L. (1993) Kwik, draft report.
Slemr, F. and Langer, E. (1992) Increase in Global Atmospheric Concentrations of Mercuryfrom Measurements Over the Atlantic Ocean. Nature 355:434-437.
Slemr, F., Schuster, G. and Seiler, W. (1985) Distribution, Speciation and Budget ofAtmospheric Mercury. J. Atmospheric Chem. 3:407-434.
Sorensen, J.A, Gary, E.G., Schmidt, K.W. and Rapp, R.R. (1994) Regional Patterns ofMercury and Major Ion Deposition in the Upper Midwest, USA. In: Watras, C.J. andHuckabee. J.W. (eds.), Mercury Pollution: Integration and Synthesis. Boca Raton,Florida: Lewis Publishers.
156

SPEED (1993) Coppoolse, J., van Bentum, F., Schwartz, M., et al. Zware Metalen inOppervalaktewater bronnen en maatregelen. Samenverkings Project EffectieveEmissiereduktie Diffuse bronnen (SPEED). The Netherlands.
Steinnes, E., Andersson, E.M. and Jakobsen, E.B. (1993) Atmospheric Deposition ofMercury in Norway. In: Conference Proceedings (Allan, R.J and Nriagu, J.O., eds.),International Conference: Heavy Metals in the Environment, Vol. 1:70-73.
Stepanov, I.I. and Vil d’Yayev (1984) The Sources of Mercury Vapor. Geokhimiya 3:437-439.
Swain, E.B. and Helwig, D.D. (1989) Mercury in Fish from Northeastern Minnesota Lakes:Historical Trends, Environmental Correlates, and Potential Sources. J. MinnesotaAcad. Sci. 55:103-109.
Taylor, S.R. (1964) Geochim. Cosmochim. Acta 28:1273-85.
Telzrow, Terry (1992) Eveready Battery Company. Presentation at US EPA HouseholdHazardous Waste Management Conference. December 11, 1992.
Third International Conference on the Protection of the North Sea (1990) MinisterialDeclaration of the Third International Conference on the Protection of the North Sea.The Hague. March 7 and 8, 1990.
Toverud, Ö. (1977) Chemical and Mineralogical Aspects of Some Geochemical Anomaliesin Glacial Drift and Peat. Sveriges Geologiska undersøkning, C729.
Turner, M.D., Marsh, D.O., Smith, J.C., Clarkson, T.W., Inglis, J.B., Rubino, E.C., Chiriboga,J. and Chiriboga, C.C. (1980) Methylmercury in Populations Eating Large Quantitiesof Marine Fish. Clin. Res. 35:367-378.
Tyler, G. (1992) Critical Concentrations of Heavy Metals in the Mor Horizon of SwedishForests. Swedish Environm. Prot. Agency. Report 4078.
US Bureau of Mines (1986) Minerals Yearbook 1986, Volume 1: Metals and Minerals,Mercury, pp. 659-665.
US Bureau of Mines (1991) Mineral Industry Surveys, Mercury in 1991.
US Department of Commerce (1978) Report on the Chance of US Seafood ConsumersExceeding the Current Recommended Acceptable Daily Intake for Mercury and onRecommended Controls. US Department of Commerce, National Oceanic andAtmospheric Administration, National Marine Fisheries Service, Washington, D.C., 1-198.
US Department of Commerce (1993) Comments on OECD Co-operative Risk ReductionActivities for Certain Dangerous Chemicals: Mercury (Draft Status Report). Letter of22 December 1993 to Jim Darr, US EPA.
US EPA (1972) US Environmental Protection Agency. Pesticides Registration Notice No. 72-2.April 22, 1972.
US EPA (1976a) US Environmental Protection Agency. Federal Register 41:16497. April 19,1976.
US EPA (1976b) US Environmental Protection Agency. Federal Register 41:26742. June 29,1976.
157
US EPA (1976c) US Environmental Protection Agency. Federal Register 41:36068. August 26,1976.
US EPA (1986) Quality criteria for water. US Environmental Protection Agency. US EPA440/5-86-001, as referenced in ATSDR 1992.
US EPA (1990a) US Environmental Protection Agency. Federal Register 55(126):13756. June29, 1990.
US EPA (1990b) US Environmental Protection Agency. Federal Register 55(177):37541.September 12, 1990.
US EPA (1991a) Characterization of products containing mercury in municipal solid waste inthe United States 1970 to 1990. US Environmental Protection Agency, MunicipalSolid Waste Program, Office of Solid Waste. Prepared by Franklin and Associates.November 1991.
US EPA (1991b) US Environmental Protection Agency. Federal Register 56(132):31404. July10, 1991.
US EPA (1992a) US EPA’s 33/50 Program Second Annual Progress Report, Reducing Risksthrough Voluntary Action. US Environmental Protection Agency, Office of PollutionPrevention and Toxics, TS-792A. February 1992.
US EPA (1992b) Green Lights Update, December 1992. US Environmental Protection Agency,Office of Air and Radiation. 6202J. US EPA 430-N-92-004, pp. 12-13.
US EPA (1993a) US Environmental Protection Agency. Federal Register 58(32):9247.
US EPA (1993b) EPA’s 33/50 Program Fourth Progress Update Report, Reducing Risksthrough Voluntary Action. US Environmental Protection Agency, Office of PollutionPrevention and Toxics. September 1993.
US EPA (1993c) Characterisation of Products Containing Mercury in Municipal Solid Wastein the United States 1970 to 2000. US Environmental Protection Agency, OSW# USEPA530-R-92-013. September 1993.
US EPA (1994) US Environmental Protection Agency. Federal Register 59(143):38288.
Vandal, G.M., Fitzgerald, W.F., Boutron, C.F. and Candelone, J.-P. (1993) Variations inMercury Deposition to Antarctica Over the Past 34,000 Years. Nature 362:621-623.
Varekamp, J.C. and Buseck, P.R. (1986) Global Mercury Flux from Volcanic and GeothermalSources. Applied Geochemistry 1:65-73.
Varshal, G.M., Sobolev, G.A., Barsukov, V.L., Koltsov, A.V., Kostin, B.I., Kudinova, T.F.,Stakheyev, Yu.,I. and Tretyakova, S.P. (1985) Separation of Volatile Componentsfrom Rocks under Mechanical Loadings as the Source of HydrogeochemicalAnomalies Preceding Earthquakes. Pure and Applied Geophysics 122:463-477.
Verdon, R., Brouard, D., Demers, C., Lalumiere, R., Laperle, M. and Shetagne, R. (1991)Mercury Evolution (1978-1988) in Fishes of the la Grande Hydroelectric Complex,Quebec, Canada. Water, Air and Soil Poll. 56:405-417.
Weiss, H.V., Kiode, M. and Goldberg, E.D. (1971) Mercury in the Greenland Ice Sheet.Evidence of recent Input by Man. Science 174:692-694.
158

WGMF (1980) Report on Mercury in Fish and Fish Products. Canberra Working Group onMercury in Fish, Department of Primary Industry, p. 371.
WHO (1976) Mercury. Environmental Health Criteria 1. Geneva.
WHO (1980) Recommended Health-based Limits in Occupational Exposure to Heavy Metals.Report of WHO Study Group, World Health Organization, WHO Technical ReportSeries 647. Geneva.
WHO (1989) Mercury – Environmental Aspects. Environmental Health Criteria 86. Geneva.
WHO (1990) Methylmercury. Environmental Health Criteria 101. Geneva.
WHO (1991) Inorganic Mercury. Environmental Health Criteria 118. Geneva.
159