Telenor hungary
85
1. sustainability report 2014 Telenor hungary
-
Upload
khangminh22 -
Category
Documents
-
view
0 -
download
0
Transcript of Telenor hungary

1.
sustainabilityreport 2014Telenor hungary

Contents
1. CEO STATEMENT 3
2. ABOUT THE REPORT 42.1 Our reporting system 52.2 This report 52.3 Defining report content 6
3. OUR SUSTAINABILITY PERFORMANCE IN FIGURES 8Environmental protection 9Economic 15Social 17
4. COMPANY INFORMATION 244.1 Telenor Hungary 254.2 Governing bodies 254.3. Our services 264.4 Our customers 264.5. Economic performance 274.6. Membership in organisations 29
5. OUR STRATEGY 305.1. Corporate strategy 315.2. Our stakeholders 315.3 Corporate responsibility strategy 32
6. RESPONSIBLE CORPORATE GOVERNANCE 336.1. Our ethical principles 346.2. Legal compliance 346.3 Practices to combat corruption and promote ethical business conduct 34
6.4 Telenor’s contribution to transparent business 366.5. Sustainable supply chain 366.6. Human rights due diligence 38
7. CUSTOMERS 397.1 Innovation 407.2 Responsible marketing 407.3 Customer satisfaction 407.4. Privacy 427.5. Safety 43
8. INFOCOMMUNICATIONS TECHNOLOGY FOR THE BENEFIT OF THE SOCIETY 448.1. Safe and responsible internet use by children 458.2. ICT in education 468.3 Educational events 478.4 Animal protection 478.5 Supporting NGO activities 478.6 Disaster protection 488.7 Supporting law enforcement 48
9. COMMUNITY ENGAGEMENT 49
10. RESPONSIBLE EMPLOYMENT 5110.1. Employment data 5210.2. Equal opportunities 5310.3. Healthy working environment and work safety 5510.4. Growth opportunities at Telenor 5610.5. Employee engagement 56
11. ENVIRONMENT 5811.1. Environmental management 5911.2. Energy usage and CO2 emissions 6111.3. Radiation 6511.4. Collecting used mobile phones 6511.5. Waste management 6511.6. Paper usage 6611.7. Water consumption 66
12. FOLLOW-UP OF PREVIOUS GOALS AND SETTING OF NEW GOALS 67
13. GRI CONTENT INDEX 70
ACRONYMS 82
INDEPENDENT ASSURANCE LETTER 84
IMPRINT 85
GUIDE FOR THIS DOCUMENTThis is an interactive document. Please click on the title of the chapters to access their content directly or click on the icons
at the bottom of the pages to get the table of contents.
CONTENTS 2

Dear Reader,In this report, we provide an overview of Telenor Hungary’s sustainability activities in 2014.
Being a global operator, Telenor pays special attention to the cultural differences of its countries – both in terms of cus-tomer needs and social and environmental requirements. In all countries, we make an effort to understand the most im-portant local challenges and leverage our experience to de-velop services that make the lives of local communities more comfortable. In line with this, we also do our best to respond to the special needs of our stakeholders with our sustaina-bility initiatives. We want everybody to know of the opportu-nities offered by infocommunications technology (ICT) and close the digital divide both in geographical and social terms while strongly focusing on sustainable operation, one of our key pillars in business.
Thanks to their technology, telecom operators can help people acquire new knowledge and multiply their oppor-tunities, and they can also provide innovative solutions to make customers’ lives easier. New technology offers count-less benefits but also comes with new threats that we want to eliminate. Telenor Hungary is making continuous efforts to protect children using digital services. We not only block in-appropriate content and provide information to parents, but we also delegate volunteer staff to educate children on safe internet use.
Our key corporate governance principles include transpar-ency, trust and ethical conduct. Corruption creates an unfair business environment and hinders the efficiency, growth and
competitiveness of entire industries. This is why we do our best to run Telenor in line with ethical values and want to promote these values in Hungary. We also want to make our supplier chain transparent and we encourage our suppliers to integrate Telenor Hungary’s responsible values into their own corporate culture.
With relentless effort, we have successfully got closer to our goals of responsible operation, social welfare and environ-mental protection over the years. When new opportunities emerge, our commitment continues to grow even strong-er and we do our best to use our service and resources to further boost growth and contribute to a simpler and more equal world based on the principle of sustainability.
Finally, let me thank all colleagues who work hard to reach sustainability results worthy of the name of Telenor. Although you can never be fully satisfied with your sustainability per-formance, it is a great pleasure for us that our Hungarian business unit has earned itself a recognized position in sus-tainability as well as an international comparison. Personal-ly, I find it important to improve the sustainability of Telenor’s operation and therefore I promise all colleagues maximum support for their sustainability efforts.
CEO STATEMENT1.Christopher Laska
CEO
3CEO STATEMENT

ABOUT THE REPORT2.

2.1 Our reporting systemTelenor Hungary (hereinafter referred to as Tel-enor) has published a corporate responsibility re-port or a sustainability report in every year since 2006. These reports aim to provide an overview of the company’s economic, environmental and social performance. Our company has been publishing these reports according to the international Global Reporting Initiative (GRI)1 framework since 2008. Our previous report, published in December 2014, has already been prepared in line with the latest, 4th generation GRI standard. GRI is the most widely used and respected sustainability and responsibili-ty reporting framework in the world. For more infor-mation about the reporting framework please visit GRI’s website.
The information included in this report is based on the following sources: our annual financial state-ment; a non-financial report prepared for our par-ent company; our statutory environmental reports; our internal policies; our core principles; and our corporate data management system.
The reliability of data and information is ensured by expert and senior management reviews. In com-piling the report, special consideration was given to the completeness of information, the accuracy, timeliness and reliability of data and we also took special care to make data comparable, involve in-ternal and external stakeholders and demonstrate sustainability in context.
2.2 This reportThis report provides an overview of the economic, environmental and social performance of all organ-izational units included in Telenor’s balance sheet in 2014 in line with the GRI G4 guidelines. According to our self-classification, we have reached “Core” compliance level with the guidelines. This report has been audited for data quality and compliance with GRI G4 guidelines by independent third par-ty auditor DENKSTATT Hungary Kft. The audit pro-cess was completed with the involvement of the CR function and Telenor’s CR Expert. Members of senior management were not involved. Our report covers only Telenor’s own activities. It does not include the performance of points of sale operated by our part-ners and Telenor Common Operation Zrt. (TnCO) established in Q4 2013. To read about the sustain-ability performance of our parent company, Telenor Group (formally Telenor ASA) please click here. The figures published in the chapters of our report are also included in chapter 3 entitled ‘Our sustainabil-ity performance in figures’. The correspondence of figures included in our report to GRI G4 indicators can be checked in chapter ‘GRI Content Index’. The acronyms used in the report are explained in chap-ter ‘Acronyms’. Driven by the desire to protect the environment, we have published this report exclu-sively in an online format on our website.
1 Global Reporting Initiative
5ABOUT THE REPORT

2.3 Defining report content
Our sustainability report for 2014 has been pre-pared with the involvement of the broadest range of stakeholders available. As a first step, the areas of sustainability specified by GRI G4 were reviewed and the areas and impacts relevant for Telenor’s business were identified by CR staff responsible for sustainability. During the process, feedback from the previous year’s material aspects survey was also considered. As a result, this report includes more relevant topics than the previous year. The rele-vance of material aspects was evaluated based on two GRI criteria.
A primary survey involving both internal and external stakeholders2 was conducted. The survey included an online questionnaire fil-
led in by employees, trade organizations and NGOs, authority representatives and external
project partners.
In the quantitative part of this survey, respondents were asked to evaluate specific topics on a scale from 1 to 5 depending on their perceived relevance for their group of stakeholders and Telenor’s business. In the qualitative part of the survey, we asked respond-ents to evaluate Telenor’s sustainability reporting
system. The questionnaire was distributed to about 150 external stakeholders and about 1,100 inter-nal stakeholders. The completion rate was about the same (6% and 7%), but the material aspects survey reflects the opinion of the latter group more closely.
2 Stakeholders were identified by CR staff based on the evaluation of our operating areas: internal stakeholders: staff employed by Telenor and external staff external stakeholders: e.g. trade organizations, NGOs, authorities, external project partners 6ABOUT THE REPORT
Deg
ree
of im
pact
on
Tele
nor’s
sta
keho
lder
s
Impact on Telenor’s business
1
2
3
4
510
8
7 9 12
1317
18
19
21
2023
22
29
252627
24
30
33
32
31
3436
35 3739
38 4042
43
46
4445
41
28
14 16
15
11
6
4,8
4,6
4,4
4,2
4,0
3,8
3,6
3,4
3,2
3,0
3,0 3,2 3,4 3,6 3,8 4,0 4,2 4,4 4,6 4,8 5,0
The numbers were assigned to the aspects in an ascending order based on their impact on Telenor’s operation.

The key areas of sustainability were finalized after the evaluation of questionnaire results. Industry trends (rise in internet and mobile internet penetration, growth of smart devices, use of smart devices at an increasingly young age), however, make it essential that we address the role of ICT and smart devices in young people’s lives. As a result, this topic is also a key focus area of this report.
The following table shows whether the individual material aspects are relevant inside or outside the organization, and it also identifies the indicators published to satisfy “core” compliance requirements giving the report chapters in which they are outlined more in detail.
3 Material aspects cannot be assigned to any specific organizational unit. These material aspects are relevant for all organizational units.
NO. OF ASPECTS MATERIAL ASPECT
THE ASPECT IS RELEVANTTHE ASPECT IS OUTLINED IN DETAIL IN THE FOLLOWING
CHAPTERINDICATOR
Within the organization3
Outside the organization
31. Discrimination X 10.2 Equal opportunities G4-HR3
32. Equal wages for men and women X 10.1 Employment data G4-LA13
34. Employee-management re-lationship X 10.1 Employment data G4-LA4
35. Training and education XCustomers, young internet users
10.4 Growth opportunities at Telenor G4-LA11
36. Legal compliance in social mat-ters X Customers 6.2 Promote legal compliance G4-SO8
37. Economic performance X 4.5. Economic results G4-EC4
38. Customer health and safety Customers, local residents 7.5 Security G4-PR2
39. Anti-corruption XCustomers, supp-liers
6.3 Practices to combat corrup-tion and promote ethical busi-ness conduct
G4-SO3
40. Occupational health and safety X 10.3 Healthy working environ-ment and work safety G4-LA6
42. Innovation X Customers 7.1 InnovationNumber of
colleagues joining innovation platform
43. Legal compliance related to pro-ducts and services X Customers 3. Our sustainability performan-
ce in figures G4-PR9
44. Market presence X 10.1 Employment data G4-EC6
45. Compliance with environmental regulations X
Local residents, ecosystem
11.1 Environmental manage-ment G4-EN29
46. Customer privacy X Customers 7.5 Privacy G4-PR8
The role of ICT in the life of young generations
Young internet users
8.2 ICT in education 9. Community engagement
Number of students attending a session on
safe internet use
Deg
ree
of im
pact
on
Tele
nor’
s st
akeh
olde
rs
Hig
h
20. Employment data22. Anti-competitive behaviour23. Safety practices28. Forced labour29. Diversity and equal opportunities
3/1 Discrimination32. Equal wages to men and women34. Employee-management relationship35. Training and education36. Legal compliance in social matters37. Economic performance38. Customer health and safety39. Anti-corruption40. Occupational health and safety42. Innovation43. Legal compliance related to products and services44. Market presence45. Compliance with environmental regulations46. Customer privacy
Med
ium
1. Biodiversity2. Environmental error reporting mechanism3. Supplier assessment for labour practices4. Public policy involvement5. Supplier assessment for social impact
6. Complaint management mechanism in terms of social impact7. Materials usage8. Supplier human rights assessment9. Right of collective bargaining and workers’ free-dom of association10. Supplier environmental assessment11. Labelling12. Local communities13. Investments from a human rights’ perspective14. Retirement15. Environmental spending16. Procurement practices17. Human rights complaint management mechanism18. Water consumption19. Indirect economic impact21. Effluents and waste24. Travel25. Child labour26. Marketing communication27. Emissions30. Labour complaint management mechanism
33. Environmental impact of products and services41. Energy consumption
Low
Low Medium High
Impact on Telenor’s businessIf you have any questions or comment related to our sustainability report please feel free to contact us at [email protected].
7ABOUT THE REPORT

3. OUR SUSTAINABILITY PERFORMANCE IN FIGURES

4 gigajoule
UNIT OF MEASURE 2010 2011 2012 2013 2014 CHANGE COMPARED TO 2013 NOTE
DIRECT ENERGY CONSUMPTION
Fuel consumption from non-re-newable sources GJ4 22 552 18 534 18 820 19 114 19 898 +4,10%
Electricity GJ 223 164 226 656 213 552 202 068 224 532 +11,12%
Total direct energy use GJ 245 716 245 190 232 372 221 182 244 430 +10,51%
FUEL CONSUMPTION FROM NON-RENEWABLE SOURCES
Natural gas GJ 4 542 2 691 2 633 2 540 2 954 +16,30% Our petrol consumption in-creased due to administrative reasons. This includes an ad-ditional item not covered by previous reports.
Diesel oil GJ 17 361 15 365 15 691 16 028 15 452 -3,6%
Petrol GJ 649 478 496 546 1 492 +173,26%
Total GJ 22 552 18 534 18 820 19 114 19 898 +4,10%
ELECTRICITY
Building management GJ 17 424 17 784 18 684 18 036 18 180 +0,80%Network energy consumption increased due to infrastructure development required by the migration from 3G to 4G tech-nology.
Network operation GJ 197 964 200 880 186 876 146 628 194 508 +32,65%
Network operation (green energy) GJ 6 480 7 200 7 200 36 000 10 800 -70,00%
Heating and cooling GJ 1 296 792 792 1 404 1 044 -25,64%
Total GJ 223 164 226 656 213 552 202 068 224 532 +11,12%
Environmental protection
9OUR SUSTAINABILITY PERFORMANCE IN FIGURES

5 carbon-dioxide6 ton
UNIT OF MEASURE 2010 2011 2012 2013 2014 CHANGE COMPARED TO 2013 NOTE
ENERGY CONSUMPTION BY AREA
Network GJ 204 624 208 188 194 076 182 664 205 452 +12,48%
Building management GJ 25 272 22 392 23 220 23 076 23 472 +1,72%
Travel (air and road) GJ 21 780 21 888 21 888 23 508 41 220 +75,34%
Total GJ 251 676 252 468 239 184 229 248 270 144 +17,84%
ENERGY INTENSITY BY AREA
Network MJ/customer 57 59 55 52 59 +13,45%
Building management GJ/employee 23 21 20 22 23 +5,53%
Travel GJ/employee 20 21 19 22 41 +85,33%
ENVIRONMENTAL IMPACT OF TRAVEL AND TRANSPORTATION
Air t6 of CO25 135 242 231 289 548 +89,83%
Road travel t of CO2 1 364 1 204 1 222 1 265 2 164 +71,01%
Total t of CO2 1 498 1 446 1 453 1 554 2 712 +74,51%
10OUR SUSTAINABILITY PERFORMANCE IN FIGURES

DIRECT CO2 EMISSIONS
Electricity generation (network) t of CO2 15 8 17 3,3 11,8 +263,38%
Road travel t of CO2 1 364 1 204 1 222 1 265 2 164 +71,01%
Total direct CO2 emissions t of CO2 1 378 1 213 1 239 1 269 2 176 +71,50%
INDIRECT CO2 EMISSIONS
Electricity (network) t of CO2 19 286 18 559 17 628 13 319 17 073 +28,19%
Electricity (buildings) t of CO2 1 697 1 642 1 697 1 638 1 596 -2,59%
District heating (buildings) t of CO2 72 44 44 78 58 -25,83%
Total indirect CO2 emissions t of CO2 21 055 20 244 19 369 15 035 18 727 +24,56%
UNIT OF MEASURE 2010 2011 2012 2013 2014 CHANGE COMPARED TO 2013 NOTE
OTHER INDIRECT CO2 EMISSIONS
Air travel t of CO2 135 242 231 289 548 +89,83%
Joint projects implemented together with other business units of Telenor Group required more frequent personal encounters which resulted in more flights compared to 2013.
11OUR SUSTAINABILITY PERFORMANCE IN FIGURES

7 kilogram8 cubic meter
GREENHOUSE GAS EMISSIONS BY AREA
Network t of CO2 19 300 18 567 17 646 13 322 17 085 +28,25%
Buildings t of CO2 2 059 1 855 1 906 1 876 1 841 -1,88%
Travel t of CO2 1 498 1 446 1 453 1 554 2 711 +74,51%
Total t of CO2 22 857 21 868 21 004 16 752 21 638 +29,17%
INTENSITY OF GREENHOUSE GAS EMISSIONS BY AREA
Network CO2 kg7 /customer 5,39 5,23 5,01 3,82 4,90 +28,26%
Building management t of CO2 / employee 1,88 1,74 1,67 1,76 1,82 +3,46%
Travel t of CO2 / employee 1,37 1,36 1,27 1,46 2,68 +83,69%
WATER USAGE
Telenor House m3 8 16 838 14 261 16 588 17 480 17 579 +0,57%
Telenor stores m3 1 703 1 842 1 368 1 810 2 077 +14,75%
Total m3 18 541 16 103 17 956 19 290 19 656 +1,90%
USED PHONE COLLECTION
Quantity of collected used phones kg 2388 2688 4566 907 1082 +19,29%
UNIT OF MEASURE 2010 2011 2012 2013 2014 CHANGE COMPARED TO 2013 NOTE
12OUR SUSTAINABILITY PERFORMANCE IN FIGURES

9 Forint
ENVIRONMENTAL EXPENSES
Annual environmental manage-ment fee HUF9 5 689 600 4 490 000 -21,08%
Product fees HUF 44 000 000 35 539 392 -19,22%
Total HUF 49 689 600 40 029 392 -19,44%
TOTAL WASTE QUANTITY
Paper kg 131 311 121 614 48 070 70 872 28 400 -59,92%
The volume of communal wa-ste was increased significantly due to a change in administra-tion required by new waste management legislation.
Plastic packaging waste kg 901 97 1 320 0 4 466 -
Glass packaging waste kg 779 2 375 680 0 0 0%
Communal waste kg 66 840 68 610 68 530 58 608 156 111 +166,37%
Waste water m3 18 541 16 103 17 956 19 290 19 656 +1,90%
Electronic and telecommunications waste kg 0 0 19 514 16 683 14 560 -12,7%
Lead batteries kg 57 452 70 797 196 036 126 290 118 684 -6,02%
FINES FOR THE BREACH OF ENVIRONMENTAL LAW AND REGULATIONS
Amount of fines HUF 0 0 0 0 0 0%
UNIT OF MEASURE 2010 2011 2012 2013 2014 CHANGE COMPARED TO 2013 NOTE
G4-EN29
13OUR SUSTAINABILITY PERFORMANCE IN FIGURES

ASSESSMENT OF SUPPLIERS’ ENVIRONMENTAL IMPACT
Number of suppliers subject to impact assessment no10 - - - 42 74 +76%
Number of suppliers with major existing and potential risks iden-tified
no - - - 11 0 -100%
Number of suppliers making progress in the period under survey
no - - - 12 0 -100%
Number of contracts terminated no - - - 0 0 0%
UNIT OF MEASURE 2010 2011 2012 2013 2014 CHANGE COMPARED TO 2013 NOTE
10 number11 liter12 gigawatt-hour
RATIOS USED TO CONVERT ENVIRONMENTAL DATA
Natural gas 1m3 = 0,034 GJ
Diesel oil 1000 l11 = 34,75 GJ
Petrol 1000 l = 31,4 GJ
Electricity 1 GWh12 = 3600 GJ
Electricity 1 GWh = 316 t CO2
14OUR SUSTAINABILITY PERFORMANCE IN FIGURES

UNIT OF MEASURE 2010 2011 2012 2013 2014 CHANGE COMPARED TO 2013
PROPORTION OF SENIOR MANAGEMENT HIRED FROM THE LOCAL COMMUNITY19
No. of senior managers - - - 24 25 -
No. of local senior managers - - - 20 19 -
Ratio of Hungarian senior managers % - - - 83% 76% -8,4%
13 International Financial Reporting Standards14 million15 earnings before interest, taxes, depreciation and amortization16 earnings before interest and taxes
17 capital expenditure18 average revenue per unit19 Proportion of people of Hungarian nationality among the CEO, CxOs
and Directors
UNIT OF MEASURE 2010 2011 2012 2013 2014 CHANGE COMPARED TO 2013
OUR ECONOMIC PERFORMANCE (BASED ON IFRS13)
Sales HUF m14 165 166 160 302 157 929 152 945 156 403 +2,26%
EBITDA15 HUF m 60 294 54 894 50 835 52 950 50 747 -4,16%
EBITDA rate % 36,5 34,2 32,2 34,6 32,4 -6,36%
EBIT16 HUF m 33 269 26 078 35 420 37 119 31 852 -14,19%
CAPEX17 HUF m 8 913 15 043 11 503 11 198 13 533 +20,85%
ARPU18 index HUF 3 764 3 647 3 662 3 574 3 594 +0,56%
Economic
G4-EC6
15OUR SUSTAINABILITY PERFORMANCE IN FIGURES

UNIT OF MEASURE 2010 2011 2012 2013 2014 CHANGE COMPARED TO 2013
FINANCIAL ASSISTANCE RECEIVED FROM GOVERNMENT
Tax relief and tax credit HUF - - - 0 0 0%
Subsidies HUF - - - 0 0 0%
Investment grants, research and development grants, and other relevant types of grants
HUF - - - 0 0 0%
Fees and charges HUF - - - 0 0 0%
Financial assistance from Export Credit Agencies (ECAs) HUF - - - 0 0 0%
Financial incentives HUF - - - 0 0 0%
Other financial benefits received or receivable from any government organisation for any operation
HUF - - - 0 0 0%
Total HUF - - - 0 0 0%
INVESTMENTS AND SERVICE DEVELOPMENT INITIATIVES
UNIT OF MEASURE
INVESTMENT AND DEVELOPMENT MONETARY VALUE (HUF MILLION) CHANGE COMPARED
TO 2013 SOCIAL IMPACT OF DEVELOPMENT2013 2014
Voice HUF m 563 436 -22,55% Improvement in the quality of mobile telecommunications services including voice services to Hungarian consumers and businesses
Data HUF m 5301 8323 +57%3G and 4G projects to promote digital literacy and expand/impro-ve the supply of mobile data services to Hungarian consumers and
businesses "Internet for All"
Other network HUF m 504 478 -5% Network infrastructure modernization due to ageing and environ-mental reasons (to reduce ecological footprint)
Total HUF m 6368 9237 +45%
G4-EC4
16OUR SUSTAINABILITY PERFORMANCE IN FIGURES

Social
UNIT OF MEASURE ALL EMPLOYEES MEN WOMEN
ABSENTEE RATES
No. of fatalities 0 0 0
Workplace injury rate % 0,00179% 0,00045% 0,00134%
Occupational diseases rate Lost day rates because of workplace injuries or occupational diseases % 0,017% 0,021% 0,012%
Absentee rate20 % 3,10% 1,20% 4,72%
UNIT OF MEASURE YOUNGER THAN 30 BETWEEN 30 AND 50 OLDER THAN 50 MEN WOMEN
STAFF TURNOVER
No. of new employees 62 132 2 102 94
Ratio of new employees % 40% 16% 9% 22% 17%
No. of employees leaving the organization (voluntary leave, leave with mutual consent, retirement, death)` 19 115 1 46 89
Ratio of employees leaving the organization % 12% 14% 5% 10% 16%
G4-LA6
20 Including days lost due to non-occupational diseases and non-workplace injuries
17OUR SUSTAINABILITY PERFORMANCE IN FIGURES

SENIOR MANAGERS MIDDLE MANAGERS STAFF
COMPOSITION OF EMPLOYEE BASE
Ratio of women in the different employment categories 16,0% 33,1% 57,6%
Ratio of men in the different employment categories 84,0% 66,9% 42,4%
Ratio of employees younger than 30 in the different employment categories 0,0% 1,5% 17,7%
Ratio of employees aged 30 to 50 in the different employment categories 100,0% 94,0% 80,4%
Ratio of employees older than 50 in the different employment categories 0,0% 4,5% 1,9%
NUMBER OF CASES OF DISCRIMINATION AND MEASURES TAKEN 2014
Total no. of cases of discrimination 1
No. of cases investigated by the organisation 1
No. of cases with an action in progress 0
No. of cases with an action and follow-up completed 1
No. of cases with a closed status 1
G4-HR3
18OUR SUSTAINABILITY PERFORMANCE IN FIGURES

UNIT OF MEASURE TELENOR CONTRIBUTION
EMPLOYEE SELF- RELIANCE TOTAL
BENEFIT COMPONENTS21
Mobile phone HUF 40 000 0 40 000
Employee tariff plan HUF 96 000 0 96 000
Mobile internet HUF 97 000 0 97 000
SZÉP22 card HUF 165 000 0 165 000
Health insurance and health fund HUF 120 000 120 000 240 000
Sports card HUF 33 000 33 000 66 000
Voluntary pension fund HUF 120 000 120 000 240 000
Employee share programme HUF 60 000 240 000 300 000
Life and accident insurance HUF 30 000 0 30 000
Eyeglasses contribution HUF 18 000 0 18 000
Total HUF 779 000 513 000 1 292 000
21 Annual maximum amount/person22 Széchenyi Recreation Card
19OUR SUSTAINABILITY PERFORMANCE IN FIGURES
UNIT OF MEASURE 2010 2011 2012 2013 2014 CHANGE COMPARED TO 2013
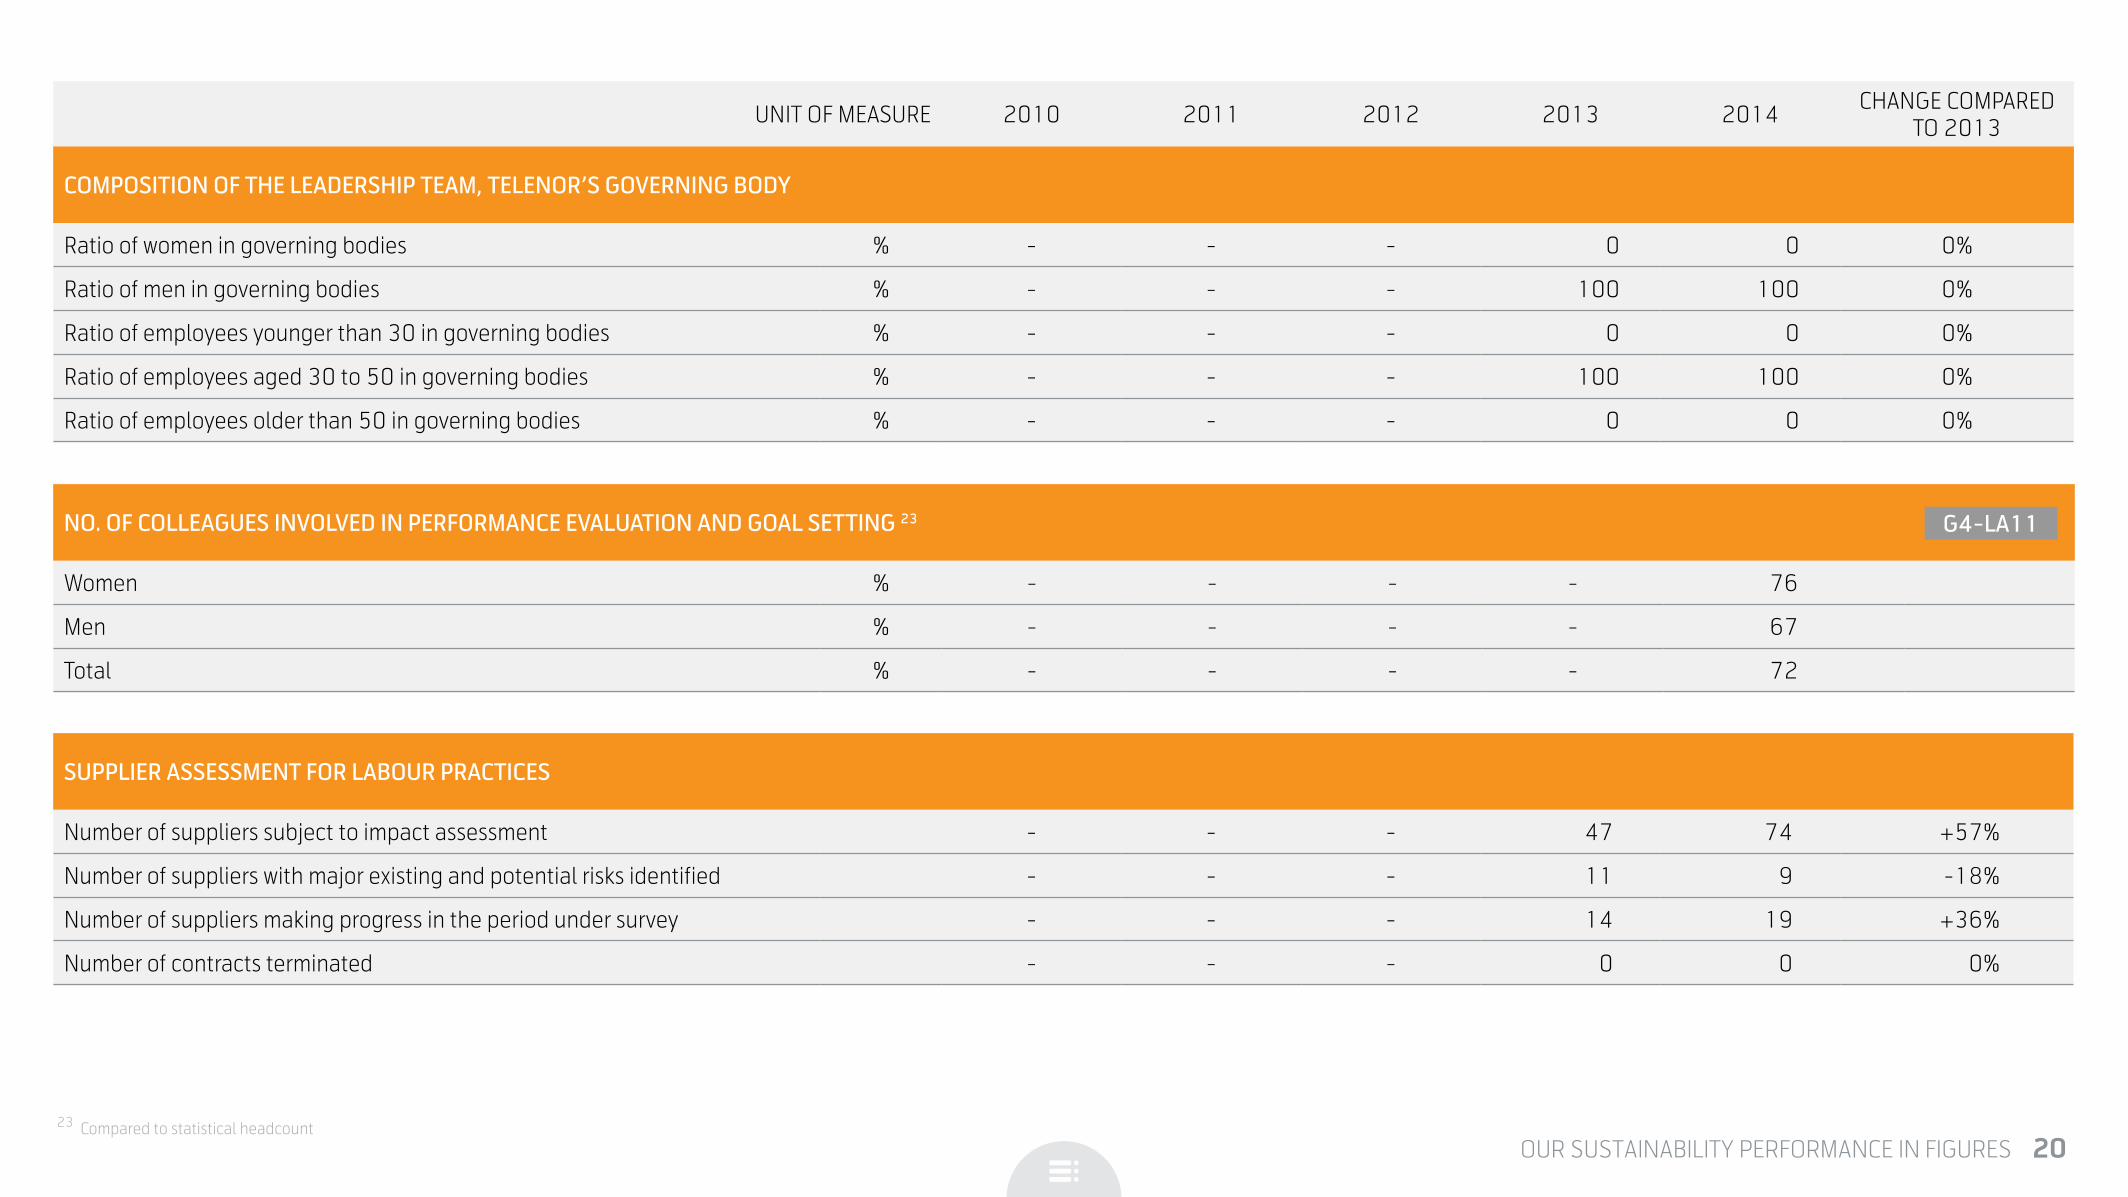
COMPOSITION OF THE LEADERSHIP TEAM, TELENOR’S GOVERNING BODY
Ratio of women in governing bodies % - - - 0 0 0%
Ratio of men in governing bodies % - - - 100 100 0%
Ratio of employees younger than 30 in governing bodies % - - - 0 0 0%
Ratio of employees aged 30 to 50 in governing bodies % - - - 100 100 0%
Ratio of employees older than 50 in governing bodies % - - - 0 0 0%
SUPPLIER ASSESSMENT FOR LABOUR PRACTICES
Number of suppliers subject to impact assessment - - - 47 74 +57%
Number of suppliers with major existing and potential risks identified - - - 11 9 -18%
Number of suppliers making progress in the period under survey - - - 14 19 +36%
Number of contracts terminated - - - 0 0 0%
NO. OF COLLEAGUES INVOLVED IN PERFORMANCE EVALUATION AND GOAL SETTING 23
Women % - - - - 76
Men % - - - - 67
Total % - - - - 72
23 Compared to statistical headcount
G4-LA11
20OUR SUSTAINABILITY PERFORMANCE IN FIGURES

TOTAL NUMBER OF LEGAL ACTIONS FOR ANTI-COMPETITIVE BEHAVIOUR, AND NON-COMPLIANCE WITH ANTI-TRUST AND MONOPOLY PROVISIONS AND THEIR OUTCOMES
No. of legal actions - - - 0 0 0%
VALUE OF POLITICAL CONTRIBUTIONS
Value of political contributions HUF - - - 0 0 0%
ASSESSMENT OF SUPPLIERS’ IMPACT ON SOCIETY
Number of suppliers subject to impact assessment - - - 42 74 +76%
Number of suppliers with major existing and potential risks identified - - - 11 0 -100%
Number of suppliers making progress in the period under survey - - - 12 19 +58%
Number of contracts terminated - - - 0 0 0%
PRIVACY COMPLAINTS
No. of privacy complaints received 46 65 35 55 169 +207%
No. of substantiated complaints 18 33 11 32 128 +300%
Substantiated complaints received from third parties 18 29 11 25 60 +140%
Substantiated complaints received from regulatory authorities 2 1 1 1 1 0%
Number of data leaks 0 3 5 4 1 -75%
Number of data thefts 0 3 1 0 1 -
Number of data losses 0 1 0 0 0 0%
UNIT OF MEASURE 2010 2011 2012 2013 2014 CHANGE COMPARED TO 2013
G4-PR8
21OUR SUSTAINABILITY PERFORMANCE IN FIGURES
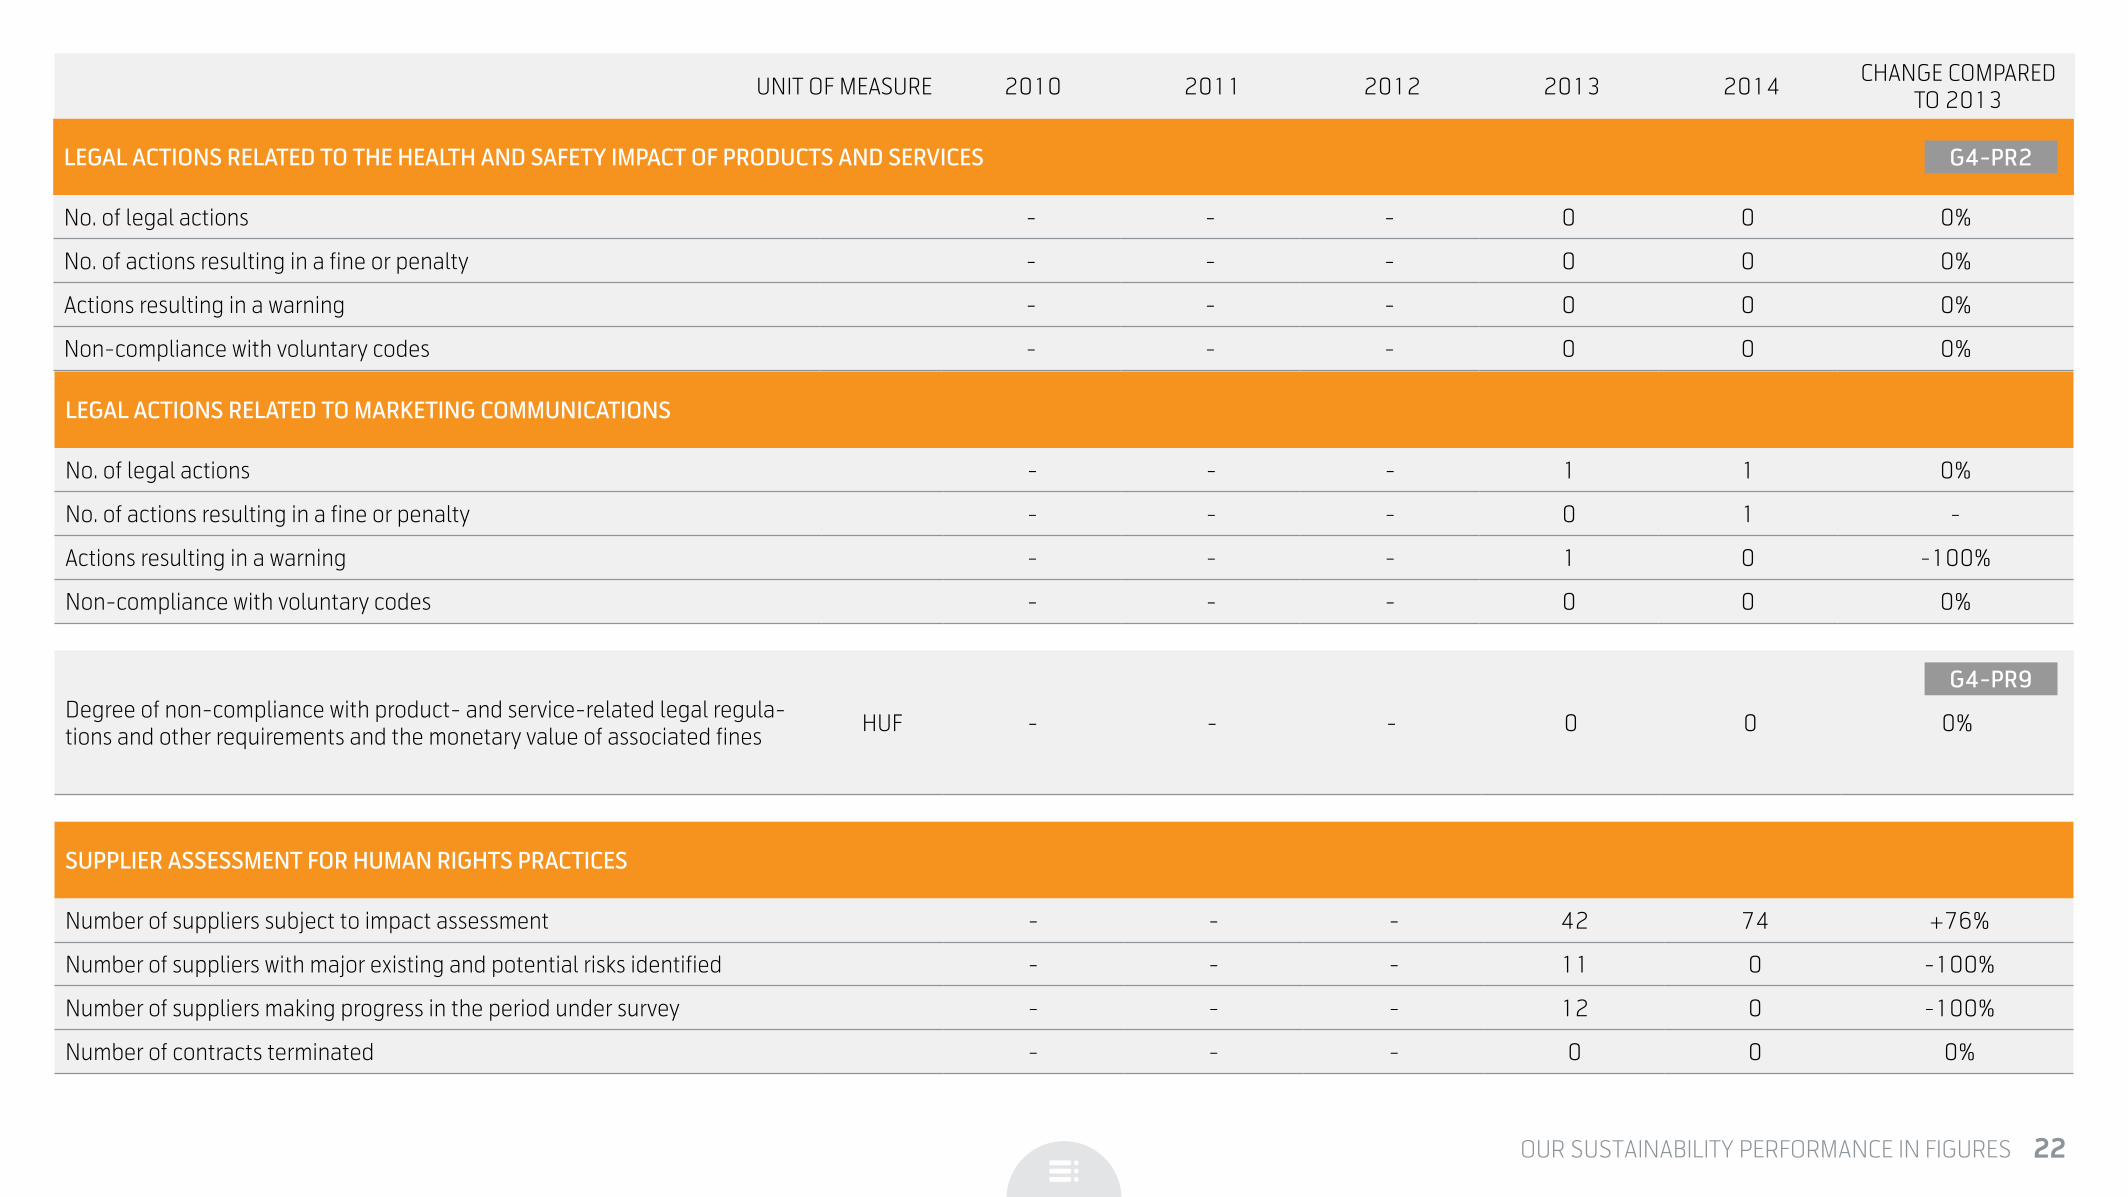
LEGAL ACTIONS RELATED TO THE HEALTH AND SAFETY IMPACT OF PRODUCTS AND SERVICES
No. of legal actions - - - 0 0 0%
No. of actions resulting in a fine or penalty - - - 0 0 0%
Actions resulting in a warning - - - 0 0 0%
Non-compliance with voluntary codes - - - 0 0 0%
UNIT OF MEASURE 2010 2011 2012 2013 2014 CHANGE COMPARED TO 2013
LEGAL ACTIONS RELATED TO MARKETING COMMUNICATIONS
No. of legal actions - - - 1 1 0%
No. of actions resulting in a fine or penalty - - - 0 1 -
Actions resulting in a warning - - - 1 0 -100%
Non-compliance with voluntary codes - - - 0 0 0%
SUPPLIER ASSESSMENT FOR HUMAN RIGHTS PRACTICES
Number of suppliers subject to impact assessment - - - 42 74 +76%
Number of suppliers with major existing and potential risks identified - - - 11 0 -100%
Number of suppliers making progress in the period under survey - - - 12 0 -100%
Number of contracts terminated - - - 0 0 0%
Degree of non-compliance with product- and service-related legal regula-tions and other requirements and the monetary value of associated fines HUF - - - 0 0 0%
G4-PR2
G4-PR9
22OUR SUSTAINABILITY PERFORMANCE IN FIGURES
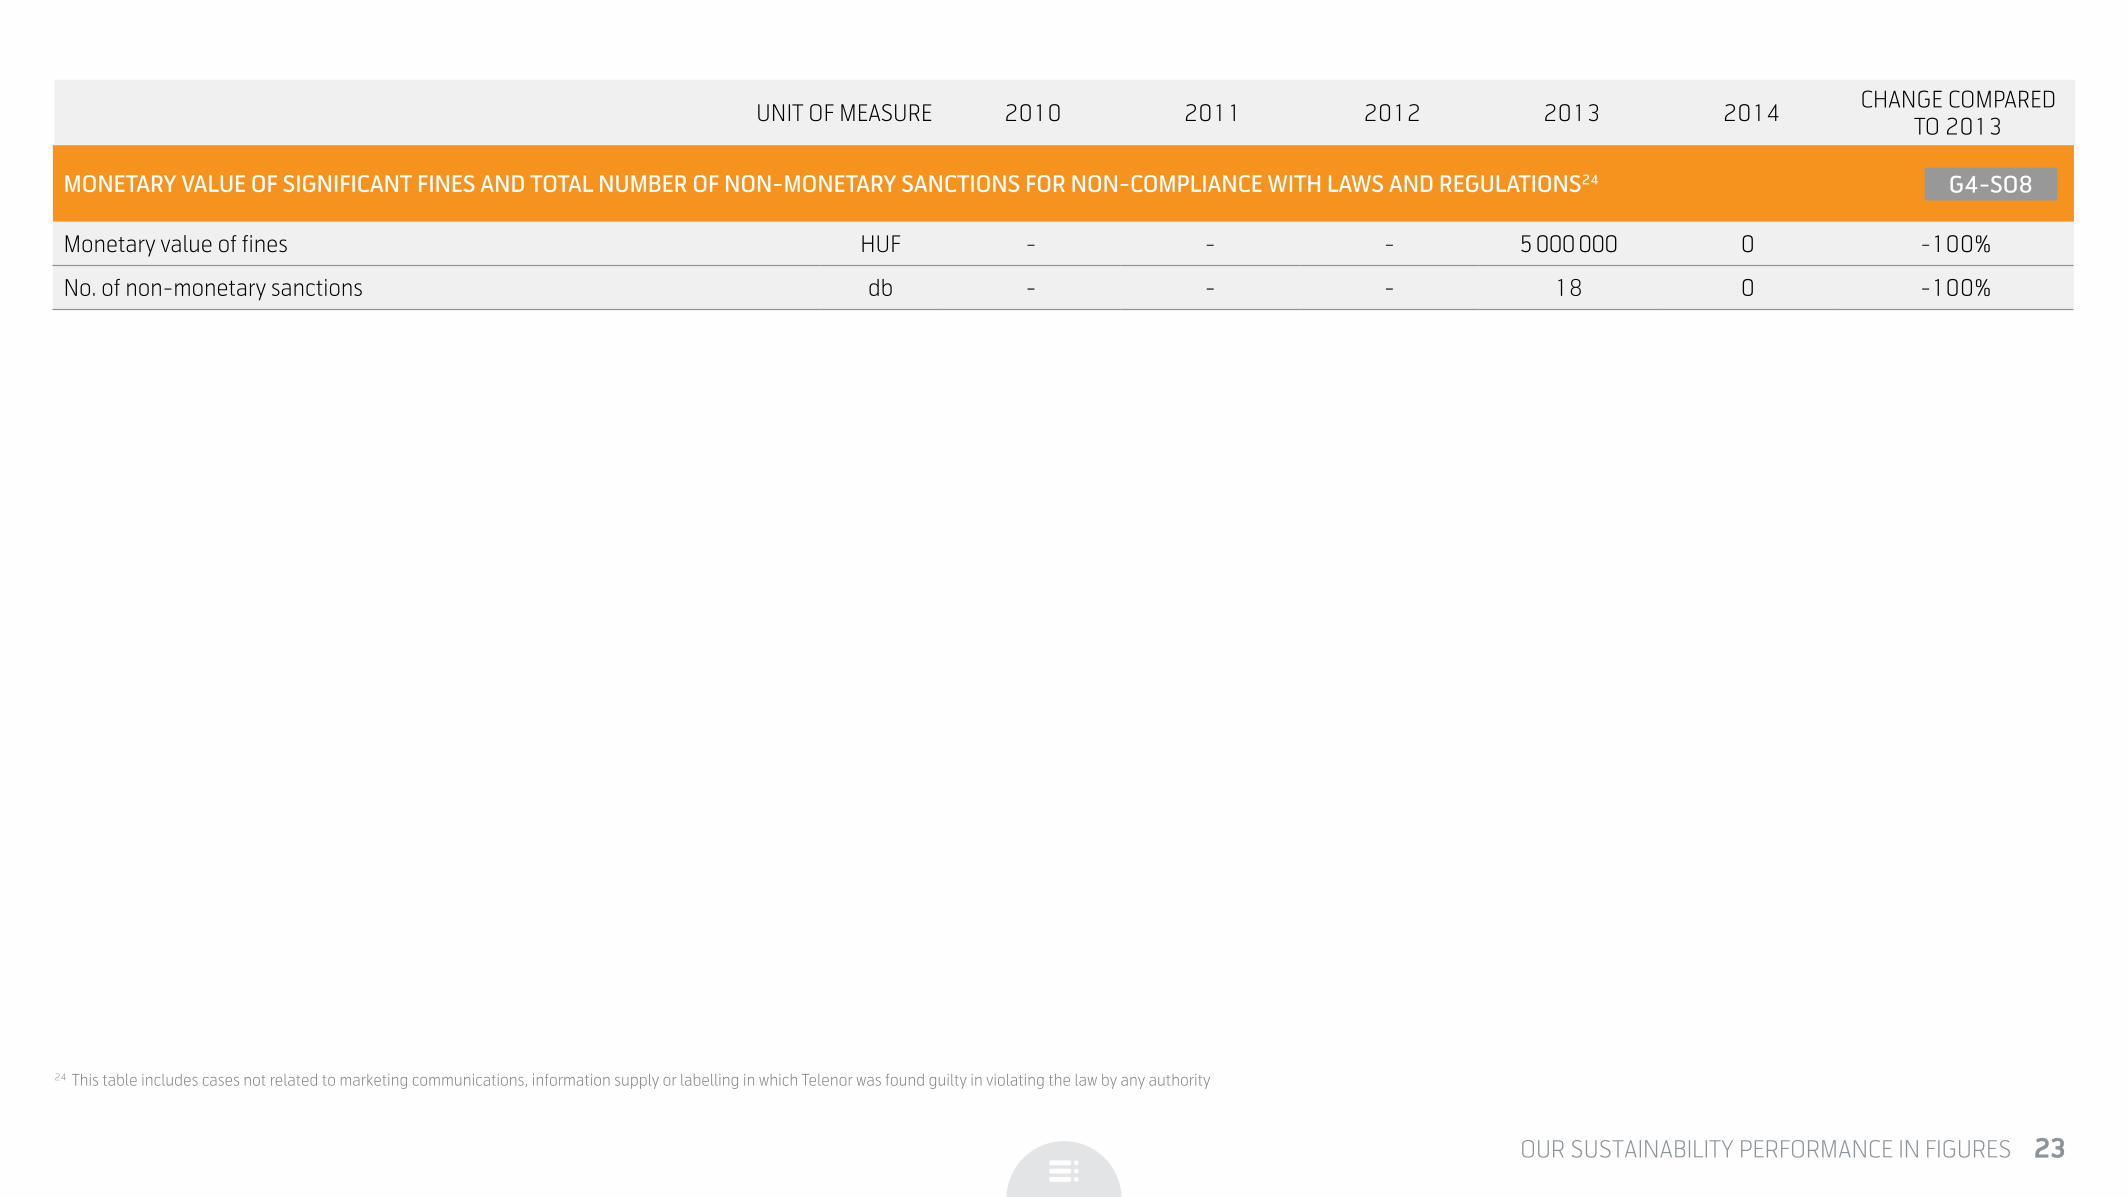
MONETARY VALUE OF SIGNIFICANT FINES AND TOTAL NUMBER OF NON-MONETARY SANCTIONS FOR NON-COMPLIANCE WITH LAWS AND REGULATIONS24
Monetary value of fines HUF - - - 5 000 000 0 -100%
No. of non-monetary sanctions db - - - 18 0 -100%
24 This table includes cases not related to marketing communications, information supply or labelling in which Telenor was found guilty in violating the law by any authority
UNIT OF MEASURE 2010 2011 2012 2013 2014 CHANGE COMPARED TO 2013
G4-SO8
23OUR SUSTAINABILITY PERFORMANCE IN FIGURES

COMPANY INFORMATION4.

4.1 Telenor HungaryTelenor Hungary, member of the global Telenor Group, is a leading provider of mobile voice and broadband services in Hungary. The company, based in Török-bálint, entered the Hungarian mobile communica-tions market under the name Pannon GSM in 1994.
The reporting period did not have any material chang-es in the size, ownership structure, setup or supplier chain of the organization. We opened two new shops during the year which is not considered a material change with respect to the activities and size of the organization.
The company is 100% owned by Telenor Group of Norway.
• Telenor Mobil Communications AS 74.96%
• NYE Telenor Mobile Communications III AS 0.03%
• TLNR Hungary Távközlési Kft. 25.01%
Norway-based Telenor Group is one of the world’s largest mobile operators and a leading global pro-vider of telecommunications, data and media com-munications services. In 2014, it had mobile oper-ations in 13 countries in the Nordics, Central and Eastern Europe and Asia, as well as an interest in VimpelCom Ltd., operating in 14 markets with al-most 186 million mobile subscriptions, 33,000 employees and an annual sales revenue of NOK 107 billion.
4.2 Governing bodiesThe major governing body of Telenor Hungary is the shareholders’ general meeting, while its operation-al management is overseen by a six-strong Board of Directors. Directors delegated to the Board by the shareholders are employed by Telenor Group. The Board of Directors is supervised by a Supervisory Board elected by the shareholders. One member of the Supervisory Board is delegated by employees which means employees participate in supervising the company’s activities through this delegate.
25 VimpelCom is a telecom operator present in many markets of the world in which Telenor has a 33% stake
26 As of 31 December 201427 As of 31 December 2014
#fixit
Chief Human Resources Officer
Chief Technical Officer
Chief Digital Services Officer
Chief Commercial OfficerChief Financial OfficerChief Corporate Development Officer
Chief Executive Officer
Telenor’s Leadership Team
Board of Directors members26: 1. Kjell Morten Johnsen,2. Ingrid Riddervold Lorange,3. Ronny Bakke Navdal,4. Katja Christina Nordgaard,5. Knut Giske,6. Nils Katla
Supervisory Board members27: • Roland Szalai,• Asbjørn Michelet Bakke,• Gunn Ringøe.
The work organization and daily business of Telenor Hungary are managed by the CEO in line with the resolutions of the shareholder’s general meeting and the Board of Directors. The CEO is employed by Telenor Group and is not a member of the Board of Directors. This position was filled by Christopher Laska in the reporting period.
25COMPANY INFORMATION
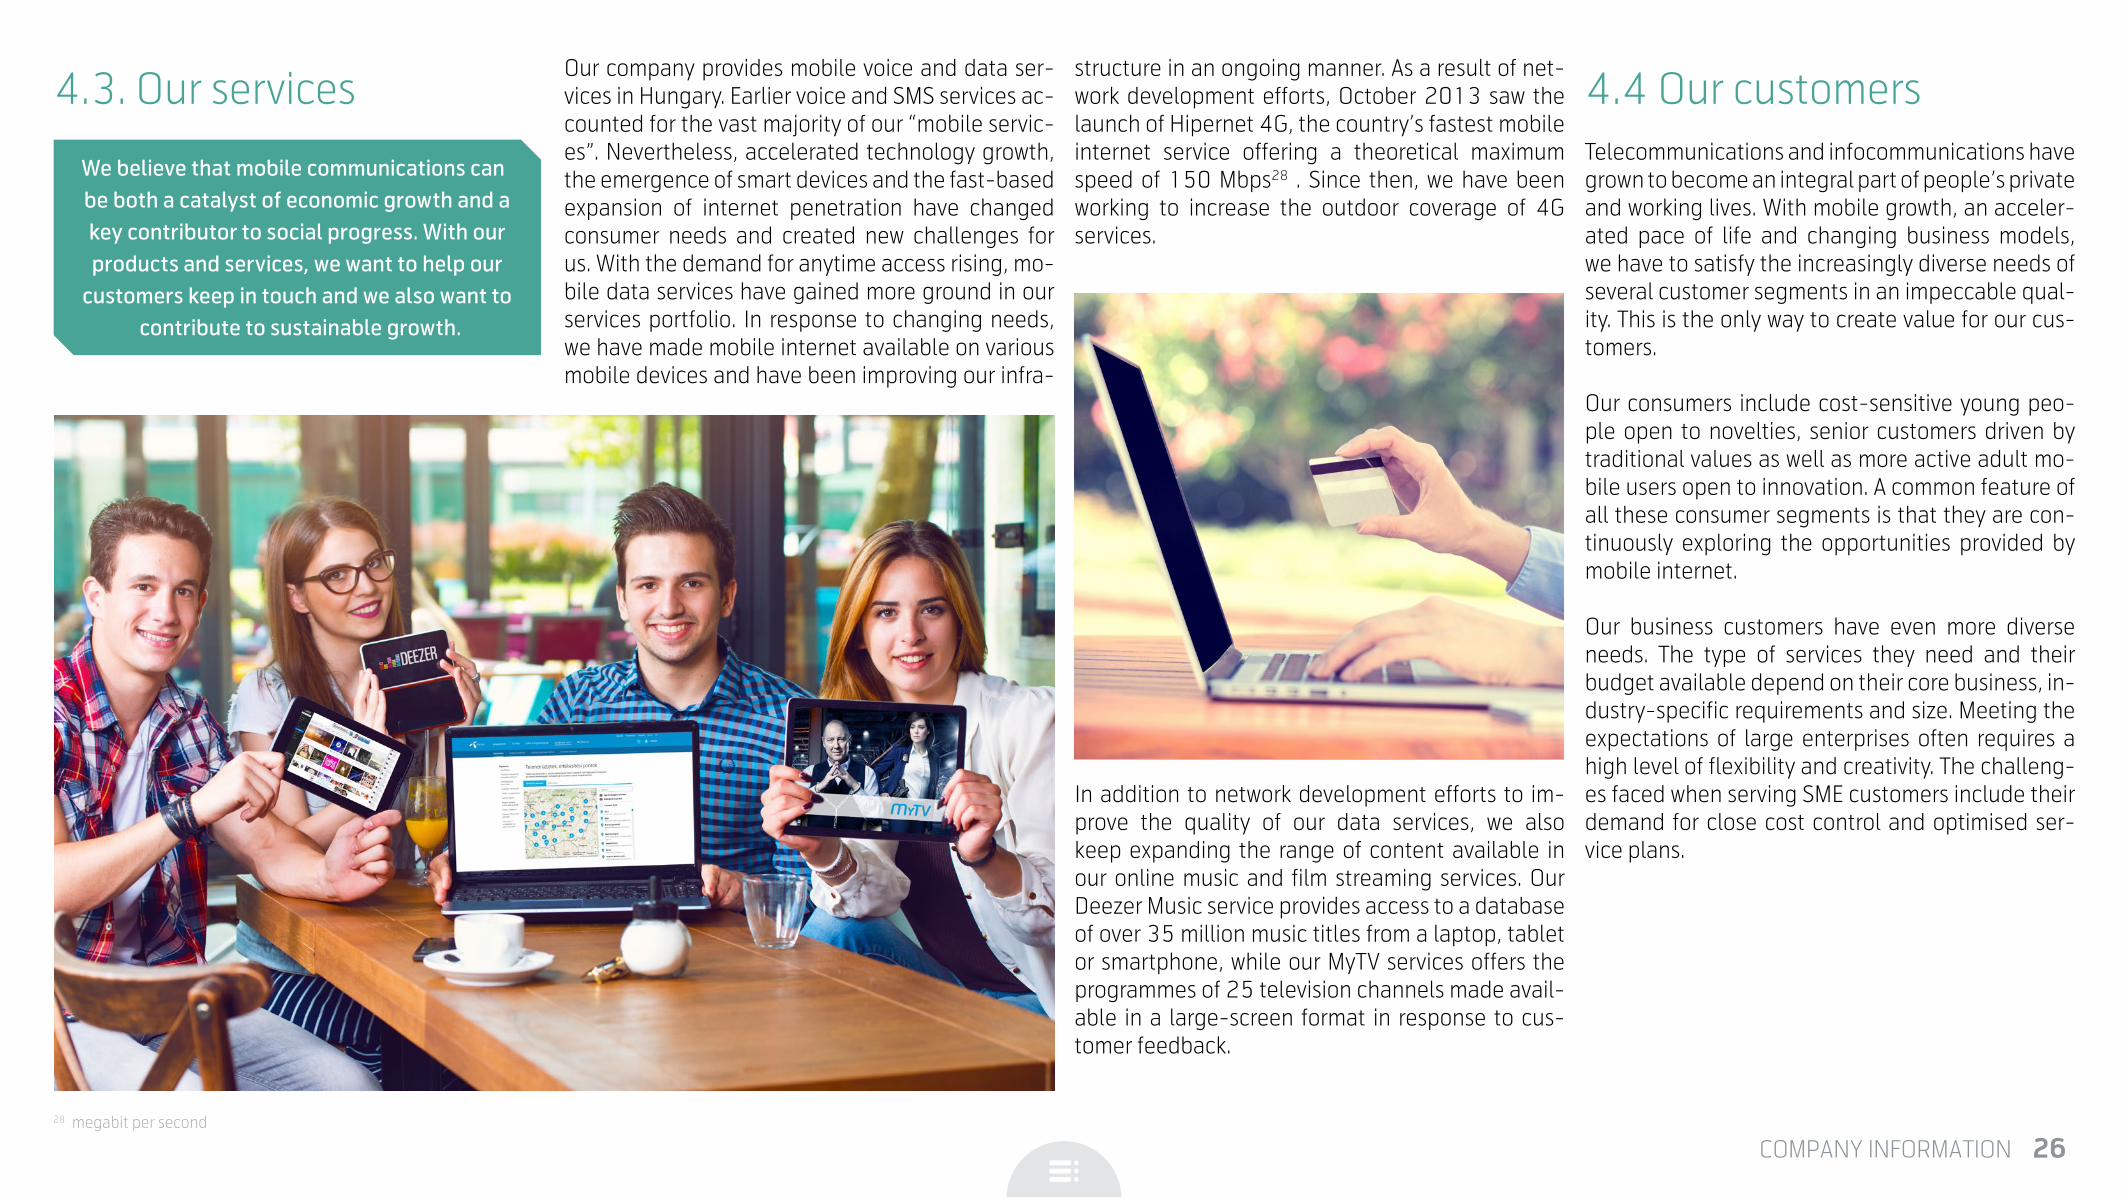
4.3. Our services
We believe that mobile communications can be both a catalyst of economic growth and a key contributor to social progress. With our products and services, we want to help our
customers keep in touch and we also want to contribute to sustainable growth.
Our company provides mobile voice and data ser-vices in Hungary. Earlier voice and SMS services ac-counted for the vast majority of our “mobile servic-es”. Nevertheless, accelerated technology growth, the emergence of smart devices and the fast-based expansion of internet penetration have changed consumer needs and created new challenges for us. With the demand for anytime access rising, mo-bile data services have gained more ground in our services portfolio. In response to changing needs, we have made mobile internet available on various mobile devices and have been improving our infra-
structure in an ongoing manner. As a result of net-work development efforts, October 2013 saw the launch of Hipernet 4G, the country’s fastest mobile internet service offering a theoretical maximum speed of 150 Mbps28 . Since then, we have been working to increase the outdoor coverage of 4G services.
In addition to network development efforts to im-prove the quality of our data services, we also keep expanding the range of content available in our online music and film streaming services. Our Deezer Music service provides access to a database of over 35 million music titles from a laptop, tablet or smartphone, while our MyTV services offers the programmes of 25 television channels made avail-able in a large-screen format in response to cus-tomer feedback.
4.4 Our customersTelecommunications and infocommunications have grown to become an integral part of people’s private and working lives. With mobile growth, an acceler-ated pace of life and changing business models, we have to satisfy the increasingly diverse needs of several customer segments in an impeccable qual-ity. This is the only way to create value for our cus-tomers.
Our consumers include cost-sensitive young peo-ple open to novelties, senior customers driven by traditional values as well as more active adult mo-bile users open to innovation. A common feature of all these consumer segments is that they are con-tinuously exploring the opportunities provided by mobile internet.
Our business customers have even more diverse needs. The type of services they need and their budget available depend on their core business, in-dustry-specific requirements and size. Meeting the expectations of large enterprises often requires a high level of flexibility and creativity. The challeng-es faced when serving SME customers include their demand for close cost control and optimised ser-vice plans.
28 megabit per second
26COMPANY INFORMATION

4.5. Economic performance
Our economic performance (based on IFRS, 2010-2014)
In 2014, our company had sales of HUF 156.403 billion which is 2.26% higher than the year before. Our operating profit, however, declined by 14% due to frequency investments and higher depreciation. In terms of our economic performance, there was a major change in our CAPEX levels. 2014 saw a rise of 20% due to network development projects im-plemented during the year.
At the end of 2014, our company had 3,482,000 subscriptions, and the number of mobile internet customers exceeded 1,184,000. The unbroken popularity of smart devices is indicated by a 3.8-fold increase in the number of tablets sold in 2014 compared to 2013.
Based on Telenor’s annual report,30 the company had total liabilities of HUF 171,675 million includ-ing equity and provisions of HUF 44,917 million and liabilities, accruals and deferred income of HUF 126,758 million.
29 Excluding frequency charges30 As at 31 December 2014
PHONE SUBSCRIPTIONS MOBILE INTERNET SUBSCRIPTIONS
MONTHLY TRAFFIC PER CUSTOMER IN 2014 (MINUTES) 189
2010 2011 2012 2013 2014
OUR ECONOMIC PERFORMANCE (BASED ON IFRS, 2010-2014)
Sales (HUF million) 165 166 160 302 157 929 152 945 156 403
EBITDA (HUF million) 60 294 54 894 50 835 52 950 50 747
EBITDA rate (%) 36,5 34,2 32,2 34,6 32,4
EBIT (HUF million) 33 269 26 078 35 420 37 119 31 852
CAPEX (HUF million)29 8 913 15 043 11 503 11 198 13 533
ARPU index (HUF million) 3 764 3 647 3 662 3 574 3 594
27COMPANY INFORMATION

Infrastructure investments (2014)
Telenor Hungary makes effort to improve the supply of telecommu-nications services to its customers and contribute to their digital lit-eracy through continuous development. To further this end, we have spent HUF 9,237 million on infrastructure development in the report-ing period. 90% of this amount was spent to improve the availability of mobile data services. For more information on the environmental impact of our network development efforts please read chapter 11.2 titled Energy consumption and CO2 emissions.
The company received no major government or political contribution and it provided no financial support to any political organisation in the reporting period.
INVESTMENTS AND SERVICE DEVELOPMENT INITIATIVES
INVESTMENT AND DEVELOPMENT MONETARY VALUE (HUF MILLION)
SOCIAL IMPACT OF DEVELOPMENT2013 2014
Voice 563 436Improvement of the quality of mobile telecommunications services including voice services to Hungarian consumers and businesses
Data 5 301 8 3233G and 4G projects to promote digital literacy and expand/improve the supply of mobile data services to Hungarian consumers and businesses "Internet for All"
Other network 504 478 Network infrastructure modernization because of ageing and environmental reasons (to reduce ecological footprint)
Total 6 368 9 237 -
28COMPANY INFORMATION

4.6. Membership in organisations
Our company is a member of the following trade and representative organisations and it supports the following initiatives:
Membership in trade organisations• GSM ASSOCIATION
• COMMUNICATIONS RECONCILIATION COUN-CIL (HÉT)
• SCIENTIFIC ASSOCIATION OF INFOCOMMUNI-CATIONS (HTE)
• ICT ASSOCIATION OF HUNGARY (IVSZ)
• HUNGARIAN MOBILE WALLET ASSOCIATION
• NMHH TECHNICAL SUPPORT SYSTEM
• SELF-REGULATORY ADVERTISING BOARD
Membership in representative organisations:• AMERICAN CHAMBER OF COMMERCE (AM-
CHAM)
• HUNGARIAN BUSINESS LEADERS FORUM (HBLF)
• KÖVET ASSOCIATION FOR SUSTAINABLE ECONOMIES
• HUNGARIAN DONORS FORUM (MAF)
• BUSINESS COUNCIL FOR SUSTAINABLE DE-VELOPMENT IN HUNGARY (BCSDH)
Endorsed initiatives• NONPROFIT INFORMATION AND EDUCATION
CENTRE (NIOK) – ADHAT DONATION LINE
• TRANSPARENCY INTERNATIONAL HUNGARY – CORPORATE SUPPORTERS’ FORUM
As a member of trade organisations, Telenor has been involved in developing the legal and regulato-ry framework of communications and commented on new and amended legal regulations on behalf of the industry. We have entered into partnership with the authorities in several fields. Through the Spektrum working group of the Communications Reconcilia-tion Council (HÉT), for example, we commented on the draft frequency management regulation of the National Media and Infocommunications Authori-ty (NMHH), and we also contributed to establishing Hungary’s official position for NMHH’s international talks about spectrum usage. We provided a complex policy status report on several topics to help NMHH develop a well-founded expert opinion.
Telenor is a contractual partner of NMHH TSR, that is, the technical support system that makes elec-tronic data unavailable temporarily or permanently as requested by a court or the National Tax Author-ity in line with effective legal regulations.
29COMPANY INFORMATION

OUR STRATEGY5.

5.1. Corporate strategyOur corporate strategy is centred around our com-mitment to meet changing and increasing customer needs at a high quality which requires the continuous development of our products and services. Our ICT solutions enable customers to keep in touch and use innovative applications in all areas of life. We want to provide them with the broadest range of products and the highest quality services to deliver a no-com-promise mobile experience. To achieve this, we strive to develop the most state-of-the-art 4G network and reasonably priced, reliable services.
5.2. Our stakeholdersOur activities and diverse services connect us to many different social groups. Our stakeholders are the members of all groups that have an impact on the company’s operation and/or are affected by the company’s activities. Our sustainable and re-sponsible corporate governance principles require continuous dialogue with all stakeholder groups to facilitate mutually beneficial long-term coopera-tion. Through the understanding of different needs and expectations, this will help us achieve a stable business performance and win the recognition and loyalty of our customers.
31 Employee Engagement Survey32 HSSE - Health, Safety, Security, Environment system
STAKEHOLDER GROUP IMPORTANCE OF DIALOGUE FORM OF DIALOGUE FREQUENCY
Employees Our business success is based on the thorough and conscientious work of our employees. Employee Engagement Survey (EES31 ) once a year
Management Our successful and sustainable operation as a company depends on our managers’ well-informed decisions. HSSE32 Committee quarterly
Telenor ASA (Owner)
Our performance has an impact on our shareholders who set economic, social and environmental expectations for us.
Reports Regular data supply Workshops, conferences
ongoing
Customers We want to use customer feedback to meet changing customer needs at all times. Customer satisfaction survey ongoing
SuppliersThe quality of our products and services also depends on our suppliers’ performance. We expect our suppliers to identify with our corporate values and abide by our policies and basic operating principles.
Supplier audits risk assessment processes once a year
NGOs NGO experts help us make the most of our positive impact on the society. Membership in organisations NGO partnership ongoing
Public sector Telenor has contributed to shaping the industry environment by commenting on several industry-specific legal regulations and active involvement in consultation through representative bodies.
Consulting on regulatory issues Membership in trade and repre-sentative organisations: Participation in forum activities
ongoing
ChildrenWe make special effort to facilitate safe and responsible internet use by the youngest generations. To achieve this, we have to develop a thorough understanding of their needs and feedback first.
Education for safe and responsib-le internet use by children Corporate volunteers’ programme at schools
once or twice a year
Local communities
Our business activities impact the lives of local communities directly. As a result, we make continuous effort to maintain a dialogue with them. Community forums as required by
local residents
Media Media channels provide the most efficient way to contact our customers and other stakeholders.
Press releases Press conferences Expert media briefings Regular information supply to the media
ongoing
Competitors In line with our principles of ethical conduct and the pertinent legal regulations, and having efficient financial management in mind, we respect the principles of fair competition.
Membership in organisations Conferences ongoing
31OUR STRATEGY

5.3 Corporate responsibility strategy
Being a leading player of the Hungarian telecom-munications industry and the Hungarian economy in general, our company has a major economic, social and environmental impact on its stakeholders. In line with our commitment to sustainable and responsible business, we do our best to identify and minimize our harmful impact, and strengthen our positive impact to maximise benefits for our stakeholders. Telenor has identified three key pillars for its CR strategy.
Economic responsibility
Being a business entity, it is our primary responsi-bility to operate profitably and reach our business goals so that our products and services can create long-term value for our stakeholders. To achieve this, we always have to focus on customer needs, create a customer-centric approach throughout the organization, tailor development efforts to cus-tomer requirements, and pursue transparent and ethical business to promote efficient competition and create value for all.
Corporate responsibility
Rather than just being an economic actor, our com-pany is deeply embedded in society, and it has an impact on and is responsible for the members of society. To demonstrate our social responsibility, we apply responsible employment practices, use our
technology for social causes and make our prod-ucts and services available to all in a safe and ac-cessible way.
Our company’s success depends on its employees. As a result, we give high priority to the establish-ment of a safe, comfortable and efficient working environment. We do our best to leverage ICT solu-tions to create maximum value for society. To imple-ment our sustainable social projects as effectively as possible, we are forging long-term cooperation with NGOs. Protecting children is an integral part of our CR strategy. There are important education and safety issues related to the use of internet and smart devices by younger generations. In line with this commitment, we have launched a programme to educate children on responsible and safe inter-net and mobile phone use.
Environmental responsibility
Our key environmental goals are outlined in the En-vironmental Policy adopted in 2013. We want to ful-ly comply with environmental regulations and mini-mize the environmental impact of our activities. Most of our environmental impact comes from energy consumption and CO2 emissions related to network operation, travel and facility management. We keep seeking development opportunities in these fields.
In addition to minimising our own environmental impact, we also actively contribute to reducing the environmental impact of our customers. To further this goal, we provide products and services enabling our customers to better manage their resources and reduce their own harmful emissions.
32OUR STRATEGY

RESPONSIBLE CORPORATE GOVERNANCE6.

6.1. Our ethical principlesMaintaining ethical corporate conduct and fighting against corruption are not only our legal and moral obligation, but also an essential precondition to creat-ing and fostering healthy and innovative competition generating real value for consumers. We want to be-come Hungary’s most respected company. To achieve that, we need to promote compliance with ethical and transparent corporate best practices in our own oper-ation as well as throughout our supply chain.
Code of Conduct, ethics and com-pliance functionTelenor’s Code of Conduct describes how we shall conduct our business in line with our values, group-level policies, regulations and management expectations.
Telenor’s Code of Conduct sets high standards of ethical business conduct for the company that need to be observed by all employees of
Telenor Group. All employees and other parties acting on behalf of Telenor must comply with
the standards of the Code of Conduct.
The Ethics & Sustainability Committee of the Tel-enor ASA Board of Directors shall oversee that the organisations’ leadership is creating an ethical at-mosphere, while it is the responsibility of unit-level local management as well as the ethical and com-pliance function to implement the Code of Conduct.
To make the values of the Telenor Way and our com-pany’s strategy easier to understand, Telenor’s Code of Conduct was upgraded in 2014. As part of the up-grade, more emphasis was given to zero tolerance on corruption, provisions were added for the trans-parent management of conflicts of interest and Tel-enor has made a clear commitment to ensuring an appropriate work-life balance for its employees.
For more information about Telenor’s Code of Con-duct and its ethical and compliance function, please read our sustainability report for 2013.
6.2. Legal complianceWe strive to fully comply with legal regulations dur-ing our daily business. Our competitive behaviour is
driven by our desire to comply with the provisions of effective legal regulations, and particularly Act LVII of 1996 on the prohibition of unfair and restrictive market practices.
Thanks to our ethical and transparent operation, Telenor was not condemned for anti-competitive behaviour in 2014.
Except for some marketing communications and in-formation supply issues described in section 7.2 of the report titled “Responsible marketing”, Telenor was not found guilty in violating the law by any au-thority in the reporting period35.
6.3 Practices to combat corruption and promote ethical business conductTelenor is firmly opposed to all forms of corruption. In our daily business, we consider the fight against corruption not only a statutory and moral obliga-tion, but also a way to ensure healthy and efficient
long-term competition and our future success. Tel-enor has zero tolerance for corruption and is com-mitted to doing business in accordance with the highest ethical standards.
To help our employees work in compliance with Tel-enor’s principles and formal policies, we published an Anti-corruption Manual in 2013 including guid-ance on how to recognize and avoid corruption.
Corruption risk assessment
In line with our principles of ethical and transpar-ent operation, we are making continuous efforts to assess and reduce the risk of corruption. During the reporting period, we conducted several corruption risk assessments.
Upon Telenor Group’s initiative, the Legal and Com-pliance Department completed a risk assessment including a questionnaire survey for employees and a workshop allowing them to discuss their ethical dilemmas.
Upon our own initiative, we performed a legal risk assessment covering all parts of our business.
During this assessment, we identified major corrup-tion risks in our reseller and supplier networks relat-ed to e.g. unfair competitive advantage and bribery.
33 By this we mean the formal identification of any of the below cases of misconduct specified in the Competition Act: unfair competition (Sections 2-7), unfair manipulation of business decisions (Sections 8-10), agreements restricting economic competition (Sections 11-20), abuse of dominant position (Sections 21-22), unauthorized concentration of companies (Sections 23-32).
34 We considered only those actions where a regulatory authority passed a resolution in calendar year 2014. We always took resolutions of first instance into account.35 We considered cases in which Telenor was found guilty in violating the law and was fined for more than HUF 1 million by the authorities.
TOTAL NUMBER OF LEGAL ACTIONS FOR ANTI-COMPETITIVE BEHAVIOUR, AND NON-COM-PLIANCE WITH ANTI-TRUST AND MONOPOLY PROVISIONS AND THEIR OUTCOMES33 2014
No. of legal actions 034
34RESPONSIBLE CORPORATE GOVERNANCE

To reduce the risk of corruption, we adopted a new local manual in 2014. This manual aimed to record corruption attempts against Telenor by customers and business partners.
We want to clearly and appropriately inform all Telenor employees about corruption and the poli-cies underpinning our corporate culture. To further this goal, the Legal and Compliance Department launched a comprehensive project to review all cor-porate policies including mandatory requirements and made their text more concise and easier to un-derstand.
To ensure appropriate training for all employees on our principles and standards, and enable them to acquire the required practical skills, we held the be-low training courses in 2014.
ASSESSMENT OF LEGAL RISK AWARENESS
ANNUAL LEGAL WORKSHOP NEWSLETTERS PRESENTATION FOR NEW
ENTRANTSANTI-CORRUPTION
E-LEARNING COURSE
Goal
Identify corruption risks through assessing emp-loyees’ legal risk aware-ness.
Keep anti-corruption knowledge and aware-ness up-to-date, deepen knowledge Topics covered: results of the survey assessing the ability to recognize legal risks, overview of Telenor’s relevant policies with spe-cial respect to anti-cor-ruption requirements and compliance with competi-tion law
Brief description of stan-dards and ethical conduct rules outlined in Telenor Group’s Code of Ethics with practical examples
A mandatory 1-hour event organized every three months for new en-trants where Telenor’s val-ues, ethical principles and expected anti-corruption conduct are discussed The concept of corruption, its manifestations, legal evaluation and warn-ing signs are introduced Colleagues are informed about whom to contact for advice and how to file a compliance report.
Employees’ knowledge about corruption-free business and appropriate behaviour is expanded through practical exam-ples.
Form Online questionnaire Workshop, presentation E-mail PresentationOnline presentation material in the form of e-learning
Invited participants
Representatives of all affected functions
Representatives of all affected functions (e.g. marketing, marketing communications, digital services, finance)
All Telenor employees New employees hired in the given period All employees
Number of participants about 350 people 194 people about 1,150 people about 20-25 people/
quarter about 1,150 people
35RESPONSIBLE CORPORATE GOVERNANCE

Reporting and investigating violationsThe Group Manual Ethics & Compliance contains clear investigation procedures and an outline of disciplinary procedures, the parties responsible for appropriate action and a promise that the discipli-nary actions will be fair and proportionate. Employ-ees who become aware of any kind of infringement are encouraged to report this to their leader or the Local or Group Ethics & Compliance Officer. Telenor runs a compliance hotline for this purpose where incidents can be reported in the official local lan-guage by phone, e-mail or postal service 24 hours a day, every day of the year. Telenor does not allow reprisals of any kind against those who in good faith report an infringement or suspicion of an infringe-ment. Misconduct that may result in disciplinary ac-tions includes failure to promptly raise a known or suspected breach.
In 2014, we had a single case when a customer attempted to bribe an account manager. This case was reported to the company by an employee. As a result, Telenor now keeps a close eye on this cus-tomer and delegates at least two employees to any meeting with this customer.
6.4 Telenor’s contribution to transparent business
Telenor Ethical Company Award
Telenor has been partnering with Transparency In-ternational Hungary (hereinafter “TI”) since 2012. We joined forces to fight corruption posing a threat to Hungary’s competitiveness and promote trans-parent business practices.
As part of our partnership, we presented the Telenor Ethical Company Award for the third time in 2014. The award was established to recognize corporate programmes aiming to promote ethical business conduct.
The Telenor Ethical Company Award was presented to Richter Gedeon Nyrt. and SIGNAL Biztosító Zrt. in the large enterprise and SME categories, respec-tively.
For more details about our partnership with TI, please read our sustainability report for 2013, or the section about Telenor’s efforts to promote busi-ness transparency on our website.
“In the pursuit of facts”
To raise young people’s awareness of the impor-tance of corruption-free and transparent business, Telenor and DUE student journalist association es-tablished ethical student journalist award “In the pursuit of facts” in 2013. The award is granted to
applicants for fact-based stories on any topic of their choice.
2014 award winners submitted stories about young smokers, the prosecution of an innocent man, and student card-related difficulties.
6.5. Sustainable supply chain
Its size, business activities and extensive supply chain make Telenor a key player of Hungary’s na-tional economy. It cooperates with many service partners in various fields36 from consulting to pur-chasing that all contribute to the company’s suc-cessful operation. As a result, we need to promote sustainability also in our partner network.
The Supply Chain Sustainability37 (SCS) function has been playing a central role in establishing and maintaining the sustainability of our supply chain since 2008. As a key function, SCS sets demanding expectations for contractual partners and monitors compliance with them to support Telenor’s high service quality and competitive position.
Acting as a consultant and monitor, the SCS function not only reduces supplier risk to Telen-or, but also reduces business risk for the suppli-ers themselves to help them implement recom-
mendations made during inspections.
36 All service providing partners are considered to be our suppliers. In 2014, we had 539 suppliers. 37 Sustainable supply chain 36RESPONSIBLE CORPORATE GOVERNANCE

Telenor framework for ensuring sustainability in the supply chain:
• MANAGEMENT COMMITMENT FROM TEL-ENOR
• EXPECTATIONS
• SUPPLIER COMMITMENT
• INSPECTIONS AND RISK MANAGEMENT
We take special care to work with partners that can identify with Telenor’s values, ethical and anti-cor-ruption principles. As part of this, we expect our contractual partners to sign an agreement on re-sponsible business behaviour to demonstrate their commitment to the Telenor Supplier Conduct Prin-ciples based on international best practices. They also have to agree to convey the Telenor Supplier Conduct Principles to their own suppliers and en-able Telenor to check compliance both in their or-ganization and at their subcontractors. We had 466 active partners registered in the reporting period (that also signed the above agreement).
In 2014, one of our aims was to reach even more suppliers in a direct and targeted way. As a result, we
distributed self-assessment questionnaires to 60 suppliers to evaluate their compliance with the Telenor’s Supplier Conduct Princip-
les. Based on the evaluation of their answers, we initiated a development dialogue with 18
contractual partners.
In most cases, this dialogue improved the under-standing of certain process goals and contributed to more efficient or compliant non-service activities.
In addition to the self-assessment, scheduled and ad-hoc comprehensive inspections were conducted at another 18 contractual partners based on a pre-liminary risk assessment. Risk analysis includes the evaluation of risks related to non-compliance with the Supplier Conduct Principles. It identifies key focus areas and ranks suppliers based on the risks associ-ated with them. Risk assessment by SCS is supported by Procurement and it also relies on previous years’ experience as an input. The annual plan is also ap-proved by the Leadership Team. Inspections are con-
ducted in different subjects and at a different level of detail. Nevertheless, all inspection programmes check compliance with effective Hungarian labour law and health & safety regulations.
In addition to filling in the self-assessment ques-tionnaire, we evaluated the compliance of our sup-pliers’ management systems and environmental and health and safety practices with Telenor Sup-plier Conduct Principles and legal regulations.
After these inspections, several corrective actions were taken in cooperation with suppliers. Telenor monitors and supports the implementation of these corrective actions.
In 2015, we will seek to improve our suppliers’ ap-proach and processes through public and invita-tion-based training courses. In addition, we plan to set up a complex supplier pre- and post-certifica-tion system that would monitor suppliers through-out their lifecycle and help manage the risks asso-ciated with them.
In order to strengthen Telenor’s SCS function, we organized an internal training course for employ-
ees to improve their skills for the evaluation of sup-pliers. As a result, there will be five more motivated volunteers available to support SCS’s consulting and inspection activities.
To further the development of Telenor and its contractual partners, we have joined the Supply Chain working group of the Business Council for Sustainable Development in Hungary. This work-ing group includes representatives from virtually all industries (e.g. food processing, transporta-tion, spare part manufacturing, automotive indus-try, etc.). This working group aims to improve the approach of Hungarian business players in terms of ethics and sustainability, identify best practices and share them within the business community as broadly as possible.
Due diligence processes for sup-pliers in 2014We carried out 74 supplier assessments in 2014 (13.7% of suppliers) covering our partners’ envi-ronmental, employment, human rights practices and social impact.
TYPES OF IMPACT ASSESSMENT
NUMBER OF SUPPLIERS SUBJECT TO IMPACT ASSESSMENT
NUMBER OF SUPPLIERS WITH MAJOR EXISTING AND POTENTIAL RISKS
IDENTIFIED
NUMBER OF SUPPLIERS MAKING PROGRESS IN THE PERIOD UNDER
SURVEYNUMBER OF CONTRACTS TERMINATED
Environmental 74 0 0 0
Employment 74 9 19 0
Human rights 74 0 0 0
Social impact 74 0 19 0
37RESPONSIBLE CORPORATE GOVERNANCE

6.6. Human rights due diligence
Telenor is present in the human rights arena in four distinct roles: as an employer, as an operator, as a customer and as an investor. Being a responsible company, we need to identify the fields where we or our partners face the risk of violating human rights. Being a telecommunications company, we also need to empower consumers and enable them to enforce their human rights providing them with ac-cess to education, healthcare and financial services. Respect for and focus on human rights is important also from a business perspective. We are committed to setting a model for our consumers and partners alike.
In addition, Telenor Group initiated a human rights due diligence process covering all operating com-panies. After analysing a wide range of documents, studying legal regulations, internal policies, inter-national and Hungarian human rights reports, and conducting a questionnaire survey among the rep-resentatives of Telenor’s stakeholder groups, we identified country- and industry-specific human rights risks and improved our understanding of Tel-enor’s practices.
The action plans developed for all 5 focus areas are currently being implemented.
The 5 focus areas identified are as follows:
CHILD PROTECTION, CHILDREN’S RIGHTS
SUSTAINABLE SUPPLY CHAIN
EQUAL OPPORTUNITIES AT THE WORKPLACE
EQUAL ACCESS TO SERVICES
WORKPLACE HEALTH AND SAFETY
38RESPONSIBLE CORPORATE GOVERNANCE

CUSTOMERS7.

To be successful, we need to ensure our custom-ers’ satisfaction with our products and services and provide them with an appropriate customer experi-ence every time they interact with Telenor. For this, we need to improve our colleagues’ customer cen-tricity and develop our products and services on an ongoing basis.
7.1 InnovationGiven the nature of our business activities and the fast pace of technology growth, our success also depends on our ability to implement innovations. To be able to meet our consumers’ and business customers’ changing needs, we established an in-novation platform promoting the identification and implementation of innovative new ideas in 2013. This platform also provides a forum to colleagues for sharing their ideas related to environmental pro-tection, health and safety. This platform was joined by 584 Telenor employees by the end of 2014. For more details about this system please read our sus-tainability report for 2013.
7.2 Responsible marketingWe seek to comply with all relevant legal regula-tions and respond to consumer and authority feed-back in all areas of our business operation including marketing. As Telenor is committed to keeping its customers well-informed, it always complies with consumer protection and other legal requirements in all phases of its marketing activities.
Telenor’s marketing activities are regulated primar-ily by Act CLV of 1997 on Consumer Protection, Act XLVIII of 2008 on the Basic Terms and Limitations of Commercial Advertising Activities, Act XLVII of 2008 on Unfair Commercial Practices, Act C of 2003 on electronic communications and Act LVII of 1996 on the prohibition of unfair and restrictive market practices. Our marketing communication activities are overseen by the National Media and Infocom-munications Authority (NMHH38), the National Con-sumer Protection Authority, and the National Com-petition Authority (GVH). These authorities request data from us both on a scheduled and on an ad hoc basis in response to consumer reports and as part of their own statutory function.
Telenor was condemned on one occasion by NMHH for its marketing communications activities during the reporting period. The Hungarian Competition Authority (GVH) found that Telenor violated the law when promoting its Családi Csomag (Family Pack-age) service. As a result, Telenor was fined for HUF 10 million.
Telenor was condemned for the lack of proper infor-mation supply about products and services several times by NMHH in 201439. These cases were due to employee mistakes related to insufficient data supply about products and services, incomplete re-sponse to complaint letters and failure to answer letters by the statutory deadline.
7.3 Customer satisfactionWe want consumers to be always satisfied with the quality of our products and services, the customer experience provided to them and implement de-velopment projects creating genuine added value for them. To ensure this, we have been conducting customer satisfaction surveys for several years. We regularly contact our customers and integrate their feedback into our development goals.
38 National Media and Infocommunications Authority39 This section includes cases when Telenor was condemned by the consumer protection authority for failing to provide appropriate information based on a specific customer complaint.
2013-2014
employees joined
Innovation Platform
40CUSTOMERS

Consumer satisfaction survey40
Telenor’s consumers had an average satisfaction score of 9 on a scale of 1 to 10 in Q4 2014 where 10 meant full satisfaction. Satisfaction has slightly improved since 2012.
Satisfaction with phone-based customer service
In order to obtain clear and measureable feedback about its performance, our customer service has been running continuous IVR-based41 customer satisfaction surveys during the year. Based on the results, we can proudly say that Telenor has maintained the excellent quality of its customer service and the high level of satisfaction and loyalty of its customers over the past five years.
40 Source: TNS, Global Brand Tracker Base: population aged 14 to 65 Question: How would you rate your overall satisfaction with Telenor? Please rate your satisfaction on a scale of 1 to 10 where 1 means “very dissatisfied” and 10 means “fully satisfied”. You can give your opinion by selecting any number be-tween 1 and 10.
41 Interactive Voice Response
9,0
8,5
8,0
Q2 2012 Q3 2012 Q4 2012 Q1 2013 Q2 2013 Q3 2013 Q4 2013 Q1 2014 Q2 2014 Q3 2014 Q4 2014
8,58,6 8,6
8,4
8,7 8,88,9 8,8 8,9 8,9 9,0
1. How would you rate your satisfaction with the customer service operator responding to your call? Please rate your satisfaction on a scale of 1 to 6 where 6 means very satisfied and 1 very dissatisfied.
2. What about your overall satisfaction with the customer service in general including availa-bility, menu system and any other aspects? Please rate your satisfaction on a scale of 1 to 6 where 6 means very satisfied and 1 very dissatisfied.
Jan
Feb
Mar
chAp
riM
ayJu
ne July
Augu
stSe
pt Okt
Nov
Dec Ja
nFe
bM
arch
Apri
May
June July
Augu
stSe
pt Okt
Nov
Dec Ja
nFe
bM
arch
Apri
May
June July
Augu
stSe
pt Okt
Nov
Dec Ja
nFe
bM
arch
Apri
May
June July
Augu
stSe
pt Okt
Nov
Dec
41CUSTOMERS
6,0
5,5
5,0
Jan
Feb
Mar
chAp
riM
ayJu
ne July
Augu
stSe
pt Okt
Nov
Dec
2010 2011 2012 2013 2014

7.4. PrivacyDue to the nature of our business activities, we manage personal data in virtually all fields on a dai-ly basis. With technology and digital growth, privacy has become more critical than ever before in recent years. Telenor follows strict privacy rules, and man-ages privacy and data availability risks in line with customer expectations.
To manage data security risks in a structured and efficient manner, Telenor Hungary complies with the ISO 27001 standard and keeps working to pro-tect not only customer data but also its own sen-sitive corporate data against potential attacks and abuse.
Telenor manages data in compliance with effective legal regulations, and in particular Act CXII of 2011 on the right of personal data protection and free-dom of information and the Communications Act. In line with its statutory obligations, Telenor outlines the rules for managing its subscribers’ personal data in its General Terms and Conditions and its in-ternal Privacy Policy.
PRIVACY COMPLAINTS 2010 2011 2012 2013 2014CHANGE
COMPARED TO 2013
No. of privacy complaints received 46 65 35 55 169 +207%
No. of substantiated complaints 18 33 11 32 128 +300%
Substantiated complaints received from third parties 18 29 11 25 60 +140%
Substantiated complaints received from regulatory authorities 2 1 1 1 1 0%
Number of data leaks 0 3 5 4 1 -75%
Number of data thefts 0 3 1 0 1 -
Number of data losses 0 1 0 0 0 0%
In 2014, we had 169 privacy complaints. In 128 cases, we made a data management mistake that we reported to NMHH as required by the law. The significant rise in the number of complaints is due to a change in the reporting process of privacy complaints. More cases were recorded as a complaint than in the previous reporting period due to more stringent rules.
We take technical and organizational measures to improve privacy. In the reporting period, e.g. we implemented an IT solution to simplify the reporting of pri-vacy violations. We also provide training courses to raise colleagues’ privacy awareness.
42CUSTOMERS

7.5. SafetyEvery piece of equipment connected to the elec-tricity network generates an electric field. Radio and television antennas as well as mobile phone anten-nas generate a radio-frequency electromagnetic field. Please note, however, the electromagnetic waves have no harmful effect on human health.
Upon constructing base stations and masts, health limits are always strictly observed.
During our activities, we closely comply with health limits on workers and local residents alike, and we follow WHO42 guidelines in developing our network.
The reporting period did not contain any court rul-ing finding Telenor guilty of violating legal regula-tions on the careful management and use43 of its products and services44 or their health and safety impact.
Degree of non-compliance with product- and ser-vice-related legal regulations and other require-ments and the monetary value of associated fines
No. of actions when legal regulations or voluntary standards on the health and safety impact of prod-ucts and services were violated in a breakdown by outcome:Jogi esetek száma 0
42 World Health Organization43 Act CLV of 1997 on consumer protection44 Act LXXXVIII of 2012 on the market supervision of products
MONETARY VALUE OF FINES (HUF) 0
NO. OF LEGAL ACTIONS 0
43CUSTOMERS

INFOCOMMUNICATIONS TECHNOLOGY FOR THE BENEFIT OF THE SOCIETY8.

8.1. Safe and responsible internet use by children
With fast-paced technology growth and the broad-er adoption and rising penetration of the inter-net and smart devices, children start using mobile phones, computers and tablets at an increasingly young age. They acquire the skills to use these un-doubtedly useful technology innovations very early in their lives which exposes them to some common online risks.
It is our responsibility to reduce the risks emerging through the use of our products and services.
We are committed to providing maximum support to children, their parents and tea-
chers enabling them to enjoy the benefits of our technology in a safe and responsible way.
We have launched several initiatives to promote safe internet use by children. Under one of them, our internet network has been blocking websites with child sexual abuse content based on a black-list provided by the National Police Headquarters (ORFK) and Interpol.
In addition, we provide a free service enabling cus-tomers to ban access to premium rate content and limit access to websites included in the operator’s white list of safe, non-adult content on their chil-dren’s mobile subscription.
Our website includes a link to NMHH’s interface for reporting online harassment, paedophile, racist or extremely violent content. We also made the Nor-ton Family free child protection filtering software available on our website as recommended by the Internet Roundtable for Child Protection in 2014.
For more information about our activities to pro-mote safe internet use by children please read our sustainability report for 2013.
Digital World
In addition to making technology solutions avail-able, we also aim to support responsible internet use by children and promote the growth of digital literacy. In line with this goal, we joined forces with MediaSmart Hungary Kft. to develop a training ma-terial titled Digital World for young schoolchildren in 2013. This material helps children develop a crit-ical approach to the internet already at young age. This material was made available as part of the ac-credited teacher training programme in 2014. As a result, fresh graduates will take safe internet skills to young schoolchildren in even more schools.
For more information about the Digital World learn-ing material please read our sustainability report for 2013 or visit the website of the Digital World pro-gramme.
Children’s rights
In 2013, UNICEF’s National Committee in Hungary and Telenor Hungary signed a partnership agree-ment. As part of this partnership, we supported UNICEF45 in launching the Ébresztő-óra programme aiming to raise awareness of children’s rights. Un-der the initiative, volunteers held playful interactive sessions across the country for more than 2,000 children and educated them on their rights.
Telenor Hungary also agreed to promote the Hel-pAPP developed by UNICEF’s National Committee in Hungary. The HelpAPP aims to help children recog-nize, avoid and manage violence. In 2014, the app was also made available on Firefox.
For more information about the partnership be-tween UNICEF and Telenor, please read our sustain-ability report for 2013 or visit our website.
45 United Nations International Children’s Emergency Fund
45INFOCOMMUNICATIONS TECHNOLOGY FOR THE BENEFIT OF THE SOCIETY

8.2. ICT in educationTelenor Hungary is committed to contributing to social growth and bridging the digital divi-de through infocommunications technology
(ICT). As part of this commitment, we support public education.
This commitment has been demonstrated several times in recent years through educating students on safe internet use. Nevertheless, our technolo-gy offers other benefits for children. Telenor’s core business provides an opportunity for using digital technology in education. The pilot education pro-gramme launched in the 2013/2014 academic year and subsequent activities to prepare the Hi-persuli programme were a practical implementa-tion of this idea.
“Hipersuli” pilot project in Áldás Street Primary School and next steps
The “Hipersuli” education pilot project launched in Áldás Street Primary School, Budapest in autumn 2013 was completed in 2014. For more informa-tion please read our sustainability report for 2013. Once the pilot project was successfully completed, we decided to extend the project to more schools. Partnerships were established, plans were prepared and arrangements were made for an academic re-search. Then the project team was set up for the Hipersuli education programme to be launched in 2015.
The Áldás Street project was evaluated to demon-strate the subsequent impact of the “Hipersuli” pi-lot programme. The survey aimed to evaluate the experience of using tablets among participating children, their parents and teachers. We wanted to find out how the use of these devices in education changed the target groups’ attitude, motivation and school results. The following chart summarises the results of focus group interviews and a ques-tionnaire survey.
Impact monitoring of “Okosuli” pilot project at Áldás Street Primary School (Source: Digital Identity Agency Magyarország Kft., 2015)
I’m very satIsfIed
8%
of students fInd classes wIth tablets more excItIng
and InterestIng.
would lIke to use tablets more often In class.
38% 64%
every day4%several days a week58%once a week25%less than once a week12%
67%I’m satIsfIed
17%I’m more
dIssatIsfIed.
8%I’m very dIssatIsfIed.
AS A PARENT, HOW SATISFIED ARE YOU WITH THE WAY TABLETS ARE USED IN CLASS?
WOULD YOU LIKE TO USE TABLETS IN CLASS FOR OTHER SUBJECTS TOO?
HOW OFTEN DO YOU USE TABLETS IN CLASS?
74% 26%yes no
46INFOCOMMUNICATIONS TECHNOLOGY FOR THE BENEFIT OF THE SOCIETY

8.3 Educational events
Smartphone Academy
With the Smartphone Academy event series, Telenor aims to present relevant, progressive and exciting topics and usage scenarios to the growing commu-nity of smartphone users. It invites renowned sub-ject matter experts to speak at these events and gives Hungarian developer teams an opportunity to introduce themselves to the wider public. These events also serve as a networking forum where par-ticipants can exchange views with each other and with invited experts.
In 2014, two Smartphone Academy events were organized. The event in March focused on wearable smart devices attracting a record number of partic-ipants. The event in April gave an overview of the past 20 years of mobile communications in Hunga-ry.
Telenor Youth Summit
Telenor Group announced its Youth Summit com-petition in partnership with the Nobel Peace Center for the second time in 2014. The competition ac-cepted applications from young people in 14 Eu-ropean and Asian Telenor countries who could use their digital native skills to demonstrate how mobile technology can be leveraged to address global so-cial challenges.
“What will happen if we bring together 28 en-thusiastic European and Asian young people and a team of global mobile industry leaders and experts at the headquarters of Telenor? Great ideas will emerge on how mobile and digital communication can be used to pro-pel social and economic changes and enable individuals and communities to realize their true potentials
said Jon Fredrik Baksaas, President and Chief Exec-utive Officer of Telenor Group.
The Hungarian winners of Telenor Youth Summit in 2014 supported talent management and helped victims of internet harassment with their ideas. The Hungarian winners were Kornélia Bálint, student of Budapest Corvinus University, and Márk Matusz, student of Berzsenyi Dániel Secondary Grammar School, Budapest (in the picture).
8.4 Animal protection
In 2013, Vigyél Haza Alapítvány (Take Me Home Foundation) and Telenor announced a smart-phone app for responsible dog ownership. The app was downloaded by over 16,000 users over a 12 month’ period and 3,800 dog owners had their pets registered in the system. Active users report-ed 420 stray dogs and 170 private individuals used the app to look for their lost dogs during this period. The initiative was joined by 25 animal protection organizations that uploaded data of 750 dogs for adoption to the system. The app’s functions provide valuable help to responsible pet owners. In addi-tion, the Foundation’s experts identified some new needs. In response to these needs, a new complex search function was added to the app in 2014. This function uses GPS coordinates to find the nearest dog walking area, dog-friendly restaurants or ac-commodation.
For more details about the app please read our sus-tainability report for 2013.
8.5 Supporting NGO activ-ities
Another way of using technology to serve the public good is to directly support NGO activities with our devices and services.
As part of this effort, we added new functions to our proprietary smartphone-based donation app ADDODA in 2014. The donation collection sites of the app connecting potential donors and char-ity organizations now include the charity shops of CSERITI-Adományháló. For more information about the app please read our sustainability report for the years 2010 to 2012.
Besides these apps, we run several donation lines and helplines using our services to help those in need. Telenor supports the fund raising activities of 60 to 70 NGOs through the 13600 “ADHAT” dona-tion line operated together with other telecommu-nications companies and the Nonprofit Information and Education Centre (NIOK) Foundation. A service of special social importance is the free 24x7 coun-selling hotline of Blue Line Child Crisis Foundation (116-111) and the Missing Children’s Hotline (116-000) (toll-free numbers).
47INFOCOMMUNICATIONS TECHNOLOGY FOR THE BENEFIT OF THE SOCIETY

8.6 Disaster protectionIn 2013, Telenor and the Hungarian Red Cross signed a strategic partnership agreement focus-ing on cooperation in disaster management related communications.
2014 saw a major expansion in the Hungarian Red Cross’ infrastructure with Telenor donating nearly 200 Hipernet enabled devices to the organization including smartphones, tablets laptops, mobile in-ternet routers, feature phones and rugged phones. In addition to the above devices, Telenor also helped the Red Cross deploy new apps.
Synaptel Kft.’s newly developed Workforce Man-agement app will significantly simplify the activities of Hungarian Red Cross staff and volunteers. The app running on tablets and smartphones supports the immediate central processing and distribution of rescue, damage and aid data to provide on-site Red Cross staff with fast and continuous access to information. In 2014, the app was used successful-ly by the Red Cross in several missions.
In the summer season, the Balaton First Aid Service (BESZ) used mobile devices, Hipernet and a smart-phone-based digital case log provided by Telenor. The data recorded using the new app enabled them to work with accurate statistics to further improve first aid activities.
As part of its disaster response efforts, the Hungar-ian Red Cross provides temporary shelter to victims forced to leave their homes during a disaster. Tel-enor installed mobile phones with unlimited out-
going calls and availability at Red Cross shelters at Christmas 2014 to enable people to keep in touch with their families. Both the service and the mobile phones were donated by Telenor which means that victims can use them free of charge, with the sup-port of Red Cross staff.
Based on the evaluation of the Hungarian Donors’ Forum independent jury, the strategic partnership between Telenor and the Hungarian Red cross was awarded a special prize in the “Joint Value Creation” category in 2014. The two organizations continue their partnership also in 2015.
8.7 Supporting law en-forcement
Telenor’s 7-strong Law Enforcement Group re-sponds to data requests from authorities on a round-the-clock basis. The number of such requests is about 40,000 per year. Our staff respond to about 160 queries every day allowing the authorities to clear up criminal cases in a fast and effective man-ner. For more details about our company’s activities supporting law enforcement agencies please read our sustainability report for 2013.
Telenor Law Enforcement Group
7persons
48INFOCOMMUNICATIONS TECHNOLOGY FOR THE BENEFIT OF THE SOCIETY

COMMUNITY ENGAGEMENT9.

Being a responsible company, we are committed to participating in the life of the society we are part of, and also beyond our market activities. For several years, Telenor has been organising events enabling its employees to join forces and act for the benefit of the society, specific social groups or their en-vironment. Our volunteer programmes generate a community experience shaping employees’ attitu-de and increasing their loyalty towards each other and to the company.
TeddOda!
In 2014, we organized our volunteer day called the TeddOda Day for the third time to lend a helping hand to local communities.
Our 2014 volunteer day involved more than 500 employees who held playful sessions about safe
internet use, privacy and the prevention of digital harassment to more than 700 students in 31 clas-
ses at 11 primary schools. Students and visitors also prepared joint presentations about the school of the future on smart devices taken to the schools by Telenor. The children contributed their creative ideas to these presentations. Most children aged 9 to 11 are comfortable using smart devices and are aware of the benefits of the internet. Nevertheless, they need to be educated on the threats of internet use and the importance of protecting their perso-nal data. Telenor staff used playful exercises to de-monstrate why sensitive data need to be managed in a careful way. At the end of the programme, each participating class received a convertible laptop and a free mobile internet subscription valid for 6 months.
“The internet offers children a great opportunity for learning, developing their skills and making their dreams come true. Being a mobile opera-tor we are responsible for teaching them to use the web responsibly and critically. Through the children’s learning material facilitating safe in-ternet use and the tablets donated to the clas-ses we want to help them avoid the threats and enjoy the freedom of exploration on the inter-net in a safe way”
(Christopher Laska, CEO of Telenor Hungary)
Cake fair
Our traditional charity cake fair held at the Telenor House in December enables colleagues to contri-bute home-made cakes, their volunteer time and cash to an organization of Telenor’s choice.
In 2014, cakes were made and sold by 45 passio-nate volunteers at the popular event which raised funds of over HUF 320,000. The funds were chan-nelled to the Red Nose Foundation who used them to help the recovery of young patients at the child-ren’s department of the Pulmonology Hospital in Törökbálint.
Charity cake fair at the Telenor House in 2014
Tedd Oda Day (2014)
50COMMUNITY ENGAGEMENT

RESPONSIBLE EMPLOYMENT10.

Our company’s employment policy was present-ed in detail in our sustainability report for 2010 to 2012. This report includes only 2014 data and the analysis of changes if any.
10.1. Employment data
Employee headcount and age composition46 Telenor’s headcount has varied between 1,000 and 1,300 for a long time driven by market trends, new business opportunities and workforce rightsizing.
Our company had 1,011 employees in 2014, the vast majority being Hungarian nationals. The ratio of non-Hungarian employees is high only in senior management (CEO, CxOs and directors). In 2014, the ratio of non-Hungarians was 24% in these po-sitions.
People younger than 30 account for 15% of head-count. 83% of employees are between 30 and 50, while only 2% are older than 50. Average age is rel-atively low (35.5) which is due partly to the nature of the industry and partly to the company’s history of 20 years. The age distribution of employees in the different employee categories mostly corre-sponds to the age distribution of total headcount with older age groups overrepresented in higher (middle management) positions.
Staff turnoverTotal staff turnover was 13.36% including a volun-tary staff turnover of 7.8% in 2014. These values represent a healthy level for a company with com-mercial and customer service activities. This was partly due to the fact that Telenor has stable results and a clear vision in the Hungarian telecommuni-cations sector.
Staff turnover data are promisingly low despite the outsourcing of call centre activities. This means that our experienced operators preferred to stay with Telenor and we managed to relocate them to other functions keeping their valuable skills and custom-er relationship experience in house.
46 We changed the methodology of classifying employees into employment categories used for the previous report. Our 2014 report has three employee categories (senior manager, manager, staff).
Statistical headcount (2008 to 2014)
2008 2009 2010 2011 2012 2013 2014
1241 1233
1093 10661141
10651011
52RESPONSIBLE EMPLOYMENT
Ratio of Hungarian and non-Hungarian senior managers (2014)
Distribution of employees by age (2014) Voluntary staff turnover by age (2014)
Voluntary staff turnover by gender (2014)
Distribution of employees by employment category (2014)
Voluntary staff turnover (%) (2008-2014)
Hungarian senior manager
Non-Hungarian senior manager
24%
76%
2,18 % Senior manager
11,52% Manager
86,30% Staff
Ratio of new employees
Ratio of new employees
Employees younger than 30
Ratio of employees leaving the organization
Ratio of employees leaving the organization
Employees between 30 and 50
Employees older than 50
Younger than 30
Men Women
Senior manager
Manager StaffBetween 30
and 50Older than 50

Telenor employees are not members of a trade un-ion and they do not have a collective bargaining agreement either. As a result, they are notified of any major organisational change (e.g. a group lay-off) in compliance with relevant legal regulations.
10.2. Equal opportunitiesProviding equal terms of employment and ca-reer opportunities, and supporting an appropriate work-life balance are key components of Telenor’s employment policy. We believe that our work-life balance practices and firm action against all kinds of negative discrimination improve our employees’ loyalty and help Telenor perform better as a com-pany.
Wage policy, equal payment to men and womenTelenor has a wage system based on wage brackets. Jobs are evaluated in our wage system based on the responsibilities associated with them and labour market demand. Our wage policy is also governed by the Code of Conduct mandatory for all Telenor employees. The Code of Conduct declares that the company objects to all kinds of discrimination and ensures equal opportunities in employment.
The wage policy and benefits scheme of our com-pany has not changed in recent years. For more de-tails please read our sustainability report for 2010 to 2012.
Gender ratios47
The gender distribution of our staff (statistical head-count) is balanced including 55% women and 45% men. The ratio of women in management positions, however, does not follow the same pattern. Only about one in three middle managers are women, and less than 20% of strategic senior management positions are filled by women. Although the Board of Directors includes several women, Telenor Hun-gary’s Leadership Team consists exclusively of men. The reason is that the ratio of women is traditionally low at the technical degree programmes relevant for Telenor already among university students. Tel-enor’s headcount composition reflects education and labour market patterns. The ratio of women in middle management positions is highest in person-al and phone-based customer service and support. However, as the management layer is thin here, the number of female middle managers at these func-tions is lower than elsewhere in the company.
Incidents of discrimination
Telenor is committed to establishing working con-ditions in line with the requirements of fair employ-ment and does its best to have ethical conduct rec-ognized at the workplace. In line with this, Telenor objects to all kinds of discrimination and ensures equal opportunities in employment.
In 2014, we had a single case potentially involving discrimination. The investigation plan prepared in response to the report was approved by the Ethical and Compliance Officer, and the investigation has been carried out. The investigation failed to clearly prove discrimination which is why it did not result in any sanction. Nevertheless, three recommenda-tions were made and have been partly or fully im-plemented by the affected people and functions.
47 We changed the methodology of classifying employees into employment categories used for the previous report. Our 2014 report has three em-ployee categories (senior manager, manager, staff).
Distribution of employees by gender within the different employment categories (2014)
Men
Women
Senior manager
Manager Staff
NO. OF CASES OF DISCRIMINATION AND MEASURES TAKEN IN 2014 2014
Total no. of cases of discrimination 1
No. of cases investigated by the organisation 1
No. of cases with an action in progress 0
No. of cases with an action and follow-up completed 1
No. of cases with a closed status 1
YOUNGER THAN 30
BETWEEN 30 AND
50
OLDER THAN 50 MEN WOMEN
No. of new employees 62 132 2 102 94
Ratio of new employees 40% 16% 9% 22% 17%
No. of employees leaving the organization (voluntary leave, leave with mutual agreement, retirement, death)
19 115 1 46 89
Ratio of employees leaving the organization 12% 14% 5% 10% 16%
53RESPONSIBLE EMPLOYMENT

Returning to work
Supporting the return to work of employees with young children is a priority in Telenor’s corporate policy. While employees are on maternity leave, our company signs a fixed-term employment con-tract with their substitutes which means that they can return from maternity leave (GYES or GYED)48 49 smoothly.
2014 saw a significant drop in the retention rate; with a slight decline in the ratio of those returning
to work. This was partly due to the fact that sever-al people on parental leave had previously filled positions that were terminated due to fast-paced changes in the industry. Some colleagues decided to become full-time mothers, or their new life situ-ation prevented them from returning to their pre-vious positions (time spent away from family was deemed to be too great).
Equal opportunities are guaranteed for employ-ees by corporate values, organizational culture and Telenor’s Code of Conduct. As a result, our experts
in charge of organizational development regularly evaluate options to improve female career manage-ment at Telenor. Part-time employment, telework-ing and flexible working hours are viable options in our new office building. Such work arrangements enable mothers with young children to return to work earlier and better manage their workplace and family obligations.
48 Child Care Allowance (Gyermekgondozási segély)49 Child Care Fee (Gyermekgondozási díj)50 Our report for 2013 included 89% instead of 86% due to a technical error.
RATIO OF RETURN AND RETENTION AFTER PARENTAL LEAVE2013 2014
MEN WOMEN MEN WOMEN
No. of employees using parental leave 1 136 0 118
No. of employees returning from parental leave 0 37 0 26
Employees still employed by Telenor 12 months after their return from parental leave 0 32 0 12
Ratio of those returning to work (no. of those returning to work/using parental leave) 0% 27% - 22%
Retention rate: no. of employees still employed 12 months after their return from parental leave/no. of employees returning to work from parental leave in the previous year
0% 86%50 - 46%
54RESPONSIBLE EMPLOYMENT

10.3. Healthy working environment and work safety
Occupational Health and Safety Management System
As part of its HSSE (Health, Safety, Security, and Environment) system, Telenor has an Occupation-al Health and Safety Management System (OHSAS) which aims to ensure the highest level of occupa-tional health and safety and identify related im-provement opportunities with the involvement of people from all affected functions. For more infor-mation about the operation and goals of OHSAS please read the HSSE chapter of our sustainability report for 2013.
2014 saw 4 work-related accidents. The injured employees went on sick leave in 3 cases.
Health awareness plays a key role in our activities. As a result, a special effort to raise our employees’ health awareness and support prevention every year was conducted. Similarly to previous years, several free programmes were organized for employees to preserve and improve their health in 2014.
Telenor employees were offered the following health programmes in 2014:
Cardiovascular screening included cholesterol and blood sugar level testing, blood pressure and body fat measurements and body mass index calcula-tion. Based on the results of the on-site screen-ing, a personalised risk assessment was conducted and presented to participants right on the spot. In addition to the risk assessment, the specialist also gave a personal health recommendation. The pro-gramme attracted 50 employees.
Staff were also provided with a melanoma screen-ing with a dermatologist available for consultation after the screening.
In summer 2014, an all-company stress test was or-ganised to help identify the most important sources of stress, related risks and protective factors. It also provided immediate feedback on employees’ rela-tionship to stress, work-life balance, physical and mental symptoms related to stress and their under-lying risks. More than 500 co8lleagues joined the anonymous test.
Together with the Hungarian Red Cross, two blood donation events were conducted in 2014: 55 and 66 employees donated blood in May and Novem-ber, respectively.
Colleagues also had an opportunity to request free anti-flu vaccination which was used by more 130 people in 2014. If required (e.g. due to trips to for-eign countries), other vaccines were also provided to staff. The Telenor House has a fully equipped, state-of-the-art fitness room, several sports grounds and saunas available to employees. These facilities are used by more and more people every year. In addi-tion to the in-house occupational medical practice there is a GP service available to colleagues on an appointment basis at the Telenor House.
51 We comply with legal regulations on documenting accidents and preparing accident statistics: Act XCIII of 1993 on Labour Safety, and MüM Decree no. 5/1993 (XII. 26.) of the Ministry of Labour on the execution of specific provisions of Act XCIII of 1993 on Labour Safety. We have no internal policy available on this subject.
52 Excluding traffic accidents
ABSENTEE RATES51 TOTAL MEN WOMEN
No. of fatalities 0 0 0
Workplace injury rate52 0,002% 0,0005% 0,001%
Occupational diseases rate 0% 0% 0%
Lost day rates due to workplace injuries or occupational diseases 0,02% 0,02% 0,01%
Absentee rate 3,1% 1,2% 4,7%
ABSENTEE RATE ALL EMPLOYEES MEN WOMEN
No. of working days 223 132 102 897 120 235
Illness-related absence (days) 6 907 1 209 5 661
Injury-related absence (days) 37 22 15
55RESPONSIBLE EMPLOYMENT

10.4. Growth opportuni-ties at Telenor
Selecting and retaining appropriately skilled and engaged employees is one of the greatest chal-lenges of today’s companies. At Telenor, we pay special attention to our employees’ performance and provide them with extra growth opportunities.
Performance evaluation, identification of talentsPerformance evaluation is managed through the Telenor Development and Performance (TDP) pro-cess. TDP is a standard process mandatory for all internal employees of Telenor Group.
We recognize top performers, that is, people with outstanding personal achievements, and we also seek to identify outstanding talents with a great growth potential. We offer them targeted develop-ment programmes such as mentoring, professional
training courses, skills enhancement courses, career coaching, involvement in strategic cross-functional projects and different inspirational programmes.
Although the process itself involved all Telenor em-ployees54, the above table showing the ratio of TDP participants in 2014 includes only those who reg-istered in the relevant IT system that they passed all phases of the process. That is, actual participation is close to 100%, and the difference is due to ad-ministrative reasons.
For more details about our performance evaluation system and “top talent” initiative, please read our sustainability reports for 2010 to 2012 and 2013.
Training
As part of its Norwegian company culture, Telenor does its best to offer its employees opportunities for continuous skills development. At our company, all employees are responsible for their own career development supported by the company through the performance management process, as well as various training, development and talent manage-ment programmes.
One of these programmes launched in 2013 pro-motes voluntary knowledge sharing within the or-ganization. Volunteers joining this initiative can share any kind of knowledge they have: in 2014, topics offered included Excel skills, graphology and body building. The success of the programme is demonstrated by the fact that the
25 different courses attracted 200 employee registrations during the reporting period.
For more details about our training systems please read our sustainability report for the years 2010 to 2012.
10.5. Employee engagement
Companies with a high ratio of engaged employees tend to perform better in business. We want to make Telenor a company where employees enjoy working and are motivated to reach our common goals. This is why we measure employee engagement every year.
The Employee Engagement Survey – or EES – aims to measure employee engagement and satisfac-tion. The results of this survey provide valuable feedback for management in setting future devel-opment directions. As the detailed description of the EES process is found in our sustainability report for 2013, the following section focuses on EES re-sults in 2014.
RATIO OF EMPLOYEES INVOLVED IN THE TDP PROCESS IN 2014 (%) 53
Women 76%
Men 67%
Total 72%
53 Compared to statistical headcount54 Colleagues absent for a longer period of time in a given year are not involved in the process (e.g. long sick leave, parental
leave). 56RESPONSIBLE EMPLOYMENT

Our key strengths are as follows: we are proud of Telenor as a work-place, we have a good understanding of our Code of Conduct and we are satisfied with our working environment.
Areas of improvement include customer-centricity, leadership de-velopment and the reinforcement of core values within the organi-sation.
EES INDEX RESULTS (2010 TO 2014) 2010 2011 2012 2013 2014
EES index 71% 81% 82% 76% 79%
Participation rate 90% 96% 95% 98,5% 99,1%
EES had a particularly high participation rate in 2014. 99.1% of employees joined the survey which means that it provided reli-able and credible results. Based on the analysis of their answers, 79% of employees are clearly committed to Telenor.
57RESPONSIBLE EMPLOYMENT

ENVIRONMENT11.

11.1. Environmental man-agement
Our environmental strategy, poli-cy and goals
Respect for the environment is an important core value for our company. Our key objective is to do business minimizing the environmental impact of our activities and complying with all environ-ment-related legal and other regulations. We also want to make people more environmentally con-scious through using our products and services. In light of this, our environmental strategy is centred around energy efficiency, renewable energy re-sources, employee engagement and harnessing the opportunities of mobile communications. Telenor provides environmental education to its employees on a regular basis encouraging them to protect the environment and prevent environmental damage.
We also have an environmental policy matching our environmental strategy which expresses our commitment to the environment and environmen-tal goals. A key principle of our policy is precaution which applies especially to radiation. Driven by our sense of responsibility for the health and safety of our customers, employees and communities, we comply with WHO safety guidelines in antenna de-sign and installation.
Our environmental goals are set by the EMS55 team involving the representatives of six functions in 2014 based on our environmental strategy, in line
with our environmental policy and other regula-tions, and considering the opinion of stakeholder groups, our environmental impact and financial as-
pects. The fulfilment of goals is reviewed on an an-nual basis when new short, mid and long term goals are also established.
Our company aims to reduce its relative car-bon emissions compared to added value56
created by Telenor by 40% by 2017 compared to 2008 as a baseline year.
In addition to reducing our use of natural resourc-es and waste production, promoting waste sort-ing, using innovative, environmentally friendly and energy efficient technologies (heat pumps, solar cells, intelligent building control) at our sites, giv-ing preference to environmental development and investment projects and integrating environmental principles into our supplier relations, we also want to make energy saving solutions available to our consumers.
55 Environmental management system (EMS)56 Added value: sum of EBITDA and employee costs
59ENVIRONMENT

Environmental Management SystemTo facilitate better response to environmental chal-lenges, Telenor set up an Environmental Manage-ment System based on the MSZ EN ISO 14001:2005 standard that was last upgraded with the help of an independent external partner in December 2013. This system ensures continuous compliance with the standard’s requirements.
The system aims to promote continuous improve-ment to reduce the company’s environmental foot-print. To further this end, we established short and medium-term environmental and financial goals to mitigate our environmental impact and develop green solutions to replace polluting activities. In-ternal and external audits are conducted to iden-tify non-compliances and improve opportunities
within the organization. Internal audits conducted in 2014 covered 9 functions, Telenor shops57 and 9 base stations.
The Environmental Management System (EMS) is running as part of the HSSE (Health, Safety, Se-curity, and Environment) system. For more details about the structure and operation of EMS and HSSE systems please read the HSSE chapter of our sus-tainability report for 2013.
Environmental spending
In 2014, our environmental activities incurred the following expenses.
Telenor was not fined for any breach of environ-mental law and regulations in the reporting period.
57 In 2014, we had 10 self-owned shops across the country all of which were audited.
ENVIRONMENTAL EXPENSES (HUF) UNIT 2013 2014
Annual environmental management fee HUF 5 689 600 4 490 000
Product fees HUF 44 000 000 35 539 392
Total HUF 49 689 600 40 029 392
ENVIRONMENTAL COMMITMENTS GOALS RESULTS
Compliance with effective en-vironmental regulations and the international ISO 14001 stan-dard
Functions, Telenor shops and base stations satisfy the requi-rements of internal and external environmental audits
Continuous compliance with legal regulations and standards in which Telenor is also suppor-ted by external experts
Reducing harmful emissions from network operation
In 2014, we had CO2 emissions capped at 19,313 tons.
As a result of intensive network development, harmful emissi-ons from network operation inc-reased in the reporting period.
Reducing harmful emissions from travel and transportation
In 2014, we had CO2 emissions capped at 1,430 tons.
Harmful emissions were up due to the travelling needs of colle-agues involved in international projects and changes in the methodology used for calcula-ting consumption.
Setting up a system capable of monitoring electric car perfor-mance
The system is up and running, performance is being monito-red.
Responsible management of waste from selling mobile com-munications devices
Ensuring the continuous ope-ration of a system for collecting used mobile phones
In 2014, 1,082 tons of used mobile phones were collected
Developing and selling mobile telecommunications solutions enabling customers to reduce their own CO2 emissions and/or energy usage.
Increasing the number of e-bil-ling customers
The number of e-billing cus-tomers was doubled in 2014.
60ENVIRONMENT

11.2. Energy usage and CO2 emissions
In 2014, 270,144 GJ of energy was used to oper-ate our mobile network and office building as well as for travel and transportation-related activities. This is 17.84% higher than our energy consumption of 229,248 GJ in 2013. Please read find the reasons of this increase in the subchapters to follow.
In 2014, we used 59 MJ of energy per subscription for network operation; 23 GJ of energy per employ-ee for building management; and 41 GJ of energy per average employee for travel.
Network operation, travel & transport and running the Telenor House accounted for 76%, 15% and 9% of our total consumption, respectively.
MJ/
cust
omer
GJ/
empl
oyee
Total energy consumption (GJ) (2010-2014)
Energy consumption in network operation (2010-2014)
Energy consumption in facility management and travel (2010-2014)
Distribution of energy consumption by field of use (2014)
61ENVIRONMENT
Building management
Network
Building management
Travel (air and road)
Travel

Our network consumed significantly more energy in 2014 (22,788 gigajoules) and there was a ma-jor increase also in travel & transport-related con-sumption (17,712 gigajoules). The energy used for running the Telenor House remained flat.
In 2014, our business operation generated CO2 emissions of 21,638 tons which is 29.17% higher than in the previous reporting period.
ELECTRICITY
Building management GJ 17 424 17 784 18 684 18 036 18 180 +0,80%
Network operation GJ 197 964 200 880 186 876 146 628 194 508 +32,65%
Network operation (green energy) GJ 6 480 7 200 7 200 36 000 10 800 -70,00%
Heating and cooling GJ 1 296 792 792 1 404 1 044 -25,64%
Total GJ 226 164 226 656 213 552 202 068 224 532 +11,12%
FUEL CONSUMPTION FROM NON-RENEWABLE SOURCES
Natural gas GJ 4 542 2 691 2 633 2 540 2 954 +16,30%
Diesel oil GJ 17 361 15 365 15 691 16 028 15 452 -3,6%
Petrol58 GJ 649 478 496 546 1 492 +173,26%
Total GJ 22 552 18 534 18 820 19 114 19 898 +4,10%
58 Fuel consumption of company cars
Distribution of energy consumption by field of use (GJ) (2010-2014)
UNIT OF MEASURE 2010 2011 2012 2013 2014 CHANGE COMPA-RED TO 2013
Network Building management
Travel (air and road)
62ENVIRONMENT

Direct CO2 emissions59
Indirect CO2 emissions
NETWORK
Electricity generation t of CO2 15 8,26 17,40 3,25 11,81 +263,38%
ROAD TRAVEL
Car travel t of CO2 1 364 1 204 1 222 1 265 2 164 +71,01%
Total t of CO2 1 378 1 213 1 239 1 269 2 176 +71,50%
NETWORK
Electricity t of CO2 19 286 18 559 17 628 13 139 17 073 +28,19%
BUILDINGS
Electricity t of CO2 1 697 1 642 1 697 1 638 1 596 -2,59%
District heating t of CO2 72 44 44 78 58 -25,83%
Total t of CO2 21 055 20 244 19 369 15 035 18 727 +24,56%
59 Unlike our sustainability report for 2013, this report does not include a section about the volume of gas used for heating the building. Such data are not available for the year 2014.
UNIT OF MEASURE 2010 2011 2012 2013 2014 CHANGE COMPA-RED TO 2013
63ENVIRONMENT

Other indirect CO2 emissions
In 2014, we had 4.90 kg of CO2 emissions per sub-scription from network operation; 1.82 tons of CO2 emissions per employee from building manage-ment; and 2.68 tons of CO2 emissions per average employee from travel.
Network
The electricity consumption of the telecommunica-tions network increased by 12.48% in 2014 com-pared to the previous year. The increase was mostly due to infrastructure development required for our migration from 3G to 4G technology. 5.2% of the total energy volume used for network operation came from green energy sources.
Building management
The headquarters of Telenor Hungary, the Telen-or House in Törökbálint, is one of Hungary’s most state-of-the-art and most environmentally fri-endly office buildings. When designing the Telenor House, we wanted it to be as environmentally cons-cious and innovative as possible. For more infor-mation about energy equipment, geothermal heat pumps, solar cells and intelligent building controls used at the Telenor House please click here to read our sustainability report for 2010 to 2012.
The reporting period saw no material change in the building’s energy consumption. The slight increa-se was due to the system adapting to changes in weather. Heat pumps produced 7,649 GJ of hea-ting/cooling energy, while the solar system produ-ced 277 GJ of energy in the reporting period.
Travel
Telenor makes effort to prevent or reduce fuel con-sumption, harmful emissions as well as emissions caused by transport and business travel. It uses en-vironmentally friendly telecommunications solu-tions as an alternative to travelling. To save time and energy, our office building offers employees several options to hold their meetings and conference calls using our technology on-site, and we also support our employees in working from home. The Telenor House includes several meeting rooms for telecon-ferencing and videoconferencing facilities. In spite of the above, energy consumption from travel inc-reased by 75.34% in 2014 over 2013 which trans-lates into 74.51% higher CO2 emissions.
UNIT OF MEASURE 2010 2011 2012 2013 2014 CHANGE COMPARED TO 2013
AIR TRAVEL
Air travel t of CO2 135 242 231 289 548 +89,83%
Electricity used in network operation (GJ)(2010-2014)
Harmful emissions in network operation (2010-2014)
Environmental impact of travel and transport (ton of CO2) (2010-2014)
Harmful emissions in facility management and travel (2010-2014)
Air Car travel
64ENVIRONMENT
kg o
f CO
2/cus
tom
ert o
f CO
2 /em
ploy
ee

The increase in travel-related energy consumption and emissions was caused by several factors. Joint projects implemented together with other business units of Telenor Group required more frequent per-sonal encounters which resulted in more flights than the year before. Based on a decision by the function responsible for environmental protection, the total fuel consumption of road transport now includes an item not presented in previous reports, namely, the fuel consumption of company buses and privately owned cars used for commuting by employees60.
Despite the increase in energy consumption and emissions in 2014, we keep seeking opportunities to reduce travel-related consumption. Goals set at a company level include a reduction in air travel, using more hybrid vehicles in the company fleet or promoting the use of the electric car available.
The Nissan Leaf electric car purchased in 2013 and the 44 hybrid cars in the fleet are used by Telenor employees. The related reduction in environmental impact and other financial implications are contin-uously being monitored in order to identify oppor-tunities for improvement.
Our company aims In 2014, about 4,100 kms were travelled by the electric car which re-duced CO2 emissions by about 468 kg, and
1,100,000 kms were travelled by hybrid cars which reduced CO2 emissions by about 3.4 tons compared to using traditional vehicles of a similar category. to reduce its relative
carbon emissions compared to added value56 created by Telenor by 40% by 2017 compared
to 2008 as a baseline year.
11.3. RadiationTelenor feels responsible for the health and safety of its customers, employees and the communities living in its service area. Therefore, it always fully complies with Hungarian and international regula-tions specifying safe exposure limits to electromag-netic fields (e.g. WHO safety limits and warnings) and internal Telenor Group policies (Telenor Guide-line on RF61 Emission Control of Cellular Radio Sites) when installing new base stations. It also provides objective guidance to stakeholders on the potential impact of radiation. For more information on base station installation practices please read our sus-tainability report for 2010 to 2012.
11.4. Collecting used mo-bile phones
Mobile telephones are made of 95% recyclable ma-terials which can be easily extracted and processed.
Their hazardous waste content can all be sorted and reused for the manufacturing of new products using state-of-the-art methods. In order to reduce the environmental impact of our business and our customers’ activities, we provide an opportunity to customers for returning their used mobile phones and batteries to self-owned and partner shops at any time. The collected used handsets are resold in foreign markets for recycling. In 2014, 1,482 tons of used mobile phones were collected.
11.5. Waste managementTelenor is committed to reducing the use of natural resources and supports the recycling of tools and materials. Within its scope of activities, Telenor en-sures sustainable waste management and makes its suppliers and contractual partners follow envi-ronmental standards in line with its own. Telenor Hungary sorts hazardous waste in compliance with the relevant Hungarian legal regulations. Of the waste produced by our services and administrative activities, we sort the following types of waste for recycling: paper waste, glass waste, plastic waste, metals, electronic waste and batteries.
In the period under survey, 20.38% of the waste produced in our office building as part of our daily business was recycled.
Nissan Leaf electric car
60 The consumption of privately owned cars was calculated based on an expert estimate.61 Radio frequency
65ENVIRONMENT

Total waste production
100% of the waste is collected by a contracted part-ner company partly for recycling and partly for safe disposal in line with respective legal regulations.
The volume of paper waste was significantly reduced from 2013 to 2014. There was a major reduction in paper waste as a result of a major scrapping project in 2013 when a large volume of unnecessary doc-uments were discarded. In 2014 we had no such event.
The increase in plastic packaging waste was due to the fact that this type of waste was not separately recorded in our waste collection system in 2013. Plastic packaging waste has been sorted since 2014.
The reporting period had no glass packaging waste produced because the glass items used in the build-ing and in the canteen are all returnable.
The major increase in communal waste was due to a change in administration required by new waste management legislation. Starting from 2014, the waste volume is calculated by Telenor rather than the company removing the waste from the site. Despite the difference in numbers, there was no change in the frequency of transporting waste from the site or in the volume of waste containers. As a result, the difference was probably caused by a dif-ference in density used for calculation.
11.6. Paper usageTelenor sorts waste and supports paperless elec-tronic document management to reduce its envi-ronmental impact. We have launched several initia-tives to62 promote the concept of a paperless office, hold e-learning courses for colleagues whenever possible and make commercial forms available in our shops in a digitized format.
The most important result of the reporting period was achieved thanks to our customers’
environmentally conscious approach: the num-ber of e-billing customers doubled in 2014
This was partly due to the introduction of simplified e-bills enabling customers to access and download their bills with a single click after giving their e-mail address or phone number.
TOTAL WASTE QUANTITY 2013 2014
Paper waste63 (kg) 70 872 28 400
Plastic packaging waste (kg) 0 4 466
Glass packaging waste (kg) 0 0
Communal waste (kg) 58 608 156 111
Waste water (m3) 19 290 19 656
Electronic and telecommunications waste (kg) 16 683 14 560
Lead batteries (kg) 126 290 118 684
11.7. Water consumption 64 Telenor used 19,656 cubic meters of water for its operation in the reporting period. 89% of this volume was consumed in the Telenor House, while the remaining 11% was consumed by the shops owned by Te-lenor. This quantity was 1.9% more than the year before. The increase was due to the renovation of the artificial lake next to the Telenor House which had to be refilled more times in 2014 than in 2013.
62 For more details on our efforts to reduce paper usage please read our sustainability report for 2013.63 Paper packaging, cardboard and confidential documents64 In our report for 2013, the chart “Total water consumption” had 15,025 m3 instead of 18,541 m3 at the year 2010 due to a technical error.
Distribution of water consumption by field of use (2014)
Total water consumption (m3) (2010-2014)
66ENVIRONMENT
Telenor House
Telenor shops

FOLLOW-UP OF PREVIOUS GOALS AND SETTING OF NEW GOALS12.

Follow-up of goals set in 2013
To ensure sustainable development and business success, we need to follow-up and evaluate past performance, keep setting new goals, improve our existing systems and seek new opportunities created by chan-ges in technology and business. In line with this, the following table shows the fulfilment of our goals set in 2013 and new goals for 2015 whose progress will be shown in our next sustainability report.
FOLLOW-UP OF GOALS SET IN 2013
Our reporting system
Closer stakeholder involvement We want the representatives of stakeholder groups to get more closely involved in developing this report. Besides questionnaire surveys, we will also use one-to-one interviews and roundtable discussions to learn their views.
Improving data collection methods We will install a software to modernize the system of data collection and enhance its efficiency.
Extending certification Next year’s report will be fully certified not only for compliance with GRI Principles but also in terms of data conformity by a third party.
Responsible corporate governance
Improving corruption-related employee awareness We will further educate our employees on corruption through new e-learning materials and transparency enhancement programmes.
Ensuring sustainability in the supply chain More supplier partners will be subject to sustainability performance audits.
Environmental management
Improving goals monitoring We will use more efficient tools to promote the realization of Telenor’s environmental performance goals and organize more and more frequent environmental activities.
Improving employees’ environmental consciousness We want to make our employees more environmentally conscious through awareness and education programmes with a special focus on environmentally friendly travel options.
Customers
Improving service related information supply to customers We want to limit the number of print copies of Telenor Felfedező Magazin (Telenor Explorer Magazine), and create the content’s digital version that will help us update a wider range of customers on our latest news in a faster manner.
Community engagement
Setting the focus of corporate volunteer programmes Corporate volunteer programmes increasingly focus on safe and responsible internet use by children.
Employee involvement Employees will be increasingly involved in internet safety awareness programmes both as organisers and as participants.
Human rights
Human rights risk assessment We develop action plans to mitigate threats and resolve issues in key human rights risk areas identified.
68FOLLOW-UP OF PREVIOUS GOALS AND SETTING OF NEW GOALS

Our goals set in 2014
OUR GOALS SET IN 2014
Our reporting system We want to improve our reporting system both in terms of stakeholder involvement and data collection methodology. A stronger IT support for data collection facilitates the acquisition of more accurate and broader data from within the organization.
Responsible corporate governanceTo facilitate responsible governance, we want to further raise employees’ awareness of corruption risks and hold training courses to develop suppliers’ approach and pro-cesses. In addition, we plan to set up a complex supplier pre- and post-certification system that would monitor suppliers throughout their lifecycle and help manage the risks associated with them efficiently.
Customers We want to improve consumer satisfaction and improve the accessibility of our services for people with disabilities. As part of this effort, we cooperate with an expert NGO in developing a proposal to make our shops fully accessible to people with disabilities.
Environmental management To reduce our employees’ environmental impact we want to improve their environmental awareness through several activities.
Infocommunications technology for the benefit of the society
We want to promote quality improvement in public education through the use of ICT tools. To further this end, we plan to launch our large-scale Hipersuli programme in 2015.
Environment To reduce our company’s environmental impact, we are committed to reducing our travel-related hazardous emissions.
Responsible employment We want diversify our workforce and promote mutual acceptance between different social groups. We plan to join forces with a competent NGO to prepare a project for hiring people with a reduced capacity to work.
69FOLLOW-UP OF PREVIOUS GOALS AND SETTING OF NEW GOALS

GRI CONTENT INDEX13.

GENERAL STANDARD DISCLOSURES CHAPTER PAGE NO (LINK)
STRATEGY AND ANALYSIS
G4-1 CEO statement 1. CEO statement 3.
ORGANIZATIONAL PROFILE
G4-3 Name of organization 4.1 Telenor Hungary 25.
G4-4 Brands, products, services 4.3 Services 26.
G4-5 Location of organization’s headquarters 4.1 Telenor Hungary 25.
G4-6 Countries where the organization operates 4.1 Telenor Hungary 25.
G4-7 Nature of ownership and legal form 4.1 Telenor Hungary 25.
G4-8 Markets served 4.4 Customers 26.
G4-9 Scale of organization
4.1 Telenor Hungary
4.5 Economic results
10.1 Employment data
25.
27.
52.
G4-10 Composition of employee base10.1 Employment data
10.2 Equal opportunities
52.
53.
G4-11 Percentage of employees covered by collective bargaining agreements 0, because our company has no collective bargaining agreement
G4-12 The organization’s supply chain 6.5 Sustainable supply chain 36.
G4-13 Significant changes during the reporting period 4.1 Telenor Hungary 25.
G4-14 How the precautionary principle is used within the organization 11.1 Environmental management 59.
G4-15 Endorsed initiatives 4.6 Membership in organisations 29.
G4-16 Membership in organisations 4.6 Membership in organisations 29.
IDENTIFIED MATERIAL ASPECTS AND BOUNDARIES
G4-17Entities included in the organization’s consolida-ted financial statements or in other equivalent do-cumentation
2.2 This report 5.
71GRI CONTENT INDEX

G4-18 Defining report content 2.3 Defining report content 6-7.
G4-19 Material aspects 2.3 Defining report content 7.
G4-20 The boundaries of material aspects within the or-ganization 2.3 Defining report content 7.
G4-21 The boundaries of material aspects outside the or-ganization 2.3 Defining report content 7.
G4-22The effect of any restatements of information pro-vided in previous reports and the reasons for such restatement
10.2 Equal opportunities
11.7. Water consumption
54.
66.
G4-23 Major changes compared to the previous reporting period in terms of report content and boundaries
No major changes happened compared to the previous reporting period in terms of report cont-ent and boundaries
STAKEHOLDER ENGAGEMENT
G4-24 Stakeholder groups engaged by the organization 5.2 Our stakeholders 31.
G4-25 Principles defining the relationship with stakehol-der groups 5.2 Our stakeholders 31.
G4-26 Stakeholder management system 5.2 Our stakeholders 31.
G4-27 Dialogues with stakeholder groups 6.5 Sustainable supply chain 37.
REPORT PROFILE
G4-28 Reporting period 2.2 This report 5.
G4-29 Date of publishing latest report 2.1 Our reporting system 5.
G4-30 Frequency of reporting 2.1 Our reporting system 5.
G4-31 Contact person 2.3 Defining report content 7.
G4-32 Compliance level 2.2 This report 5.
G4-33 The organization’s policy and current practice with regard to seeking external assurance for the report 2.2 This report 5.
GENERAL STANDARD DISCLOSURES CHAPTER PAGE NO (LINK)
72GRI CONTENT INDEX

GOVERNANCE
G4-34 Governing bodies of the organization 4.2 Governing bodies 25.
ETHICS AND INTEGRITY
G4-56 Values, principles, standards and expected con-duct of organization
5.1 Corporate strategy
6.1 Our ethical principles
31.
34.
GENERAL STANDARD DISCLOSURES CHAPTER PAGE NO (LINK)
IDENTIFIED OMISSION(S)
REASON(S) FOR OMISSION(S)
EXPLANATION FOR OMISSION(S)
THIRD-PARTY VERIFICATION
CATEGORY: ECONOMIC
ECONOMIC PERFORMANCE
G4-DMA General information about management approach4.5 Economic results
5.3 Corporate responsibility strategy
27.
32.
G4-EC1 Direct economic value generated and distributed 4.5 Economic results 27
G4-EC4 Financial assistance received from government 4.5 Economic results 27
The standard disclo-sure does not include the number and per-centage ratio of acti-vities.
The company consi-ders the amount of received tax credit as confidential in-formation.
✔
MARKET PRESENCE
G4-DMA General information about management approach 10.1 Employment data 52.
G4-EC6 Proportion of senior management hired from the local community at significant locations of opera-tion
10.1 Employment data 52. ✔
INDIRECT ECONOMIC IMPACT
G4-DMA General information about management approach4.5 Economic results
5.3 Corporate responsibility strategy
27.
32.
GENERAL STANDARD DISCLOSURES CHAPTER PAGE NO (LINK)
73GRI CONTENT INDEX

G4-EC7 Development and impact of infrastructure invest-ments and services supported 4.5 Economic results 28.
G4-EC8 Material indirect economic impacts including their magnitude
4.5 Economic results
5.3 Corporate responsibility strategy
27-28.
32.
CATEGORY: ENVIRONMENTAL
ENERGY
G4-DMA General information about management approach 11.1 Environmental management 59.
G4-EN3 Energy consumption within the organization 11.2 Energy usage and CO2 emissions 61-65.
G4-EN4 Energy consumption outside of the organization 11.2 Energy usage and CO2 emissions 61-65.
G4-EN5 Energy intensity 11.2 Energy usage and CO2 emissions 61.
G4-EN6 Reduction of energy consumption 11.2 Energy usage and CO2 emissions 61.
WATER
G4-DMA General information about management approach 11.1 Environmental management 59-60.
G4-EN8 Water consumption 11.7 Water consumption 66.
EMISSIONS
G4-DMA General information about management approach 11.1 Environmental management 59.
G4-EN15 Direct greenhouse gas (GHG) emissions 11.2 Energy usage and CO2 emissions 63.
G4-EN16 Indirect greenhouse gas (GHG) emissions 11.2 Energy usage and CO2 emissions 63.
G4-EN17 Other indirect greenhouse gas (GHG) emissions 11.2 Energy usage and CO2 emissions 64.
G4-EN18 Greenhouse gas (GHG) emissions intensity 11.2 Energy usage and CO2 emissions 64.
GENERAL STANDARD DISCLOSURES CHAPTER PAGE NO (LINK)
IDENTIFIED OMISSION(S)
REASON(S) FOR OMISSION(S)
EXPLANATION FOR OMISSION(S)
THIRD-PARTY VERIFICATION
74GRI CONTENT INDEX

EFFLUENTS AND WASTE
G4-DMA General information about management approach 11.1 Environmental management 59.
G4-EN23 Total weight of waste by type and disposal method 11.5 Waste management 66.
PRODUCTS AND SERVICES
G4-DMA General information about management approach 11.1 Environmental management 59.
G4-EN27 Extent of mitigation of environmental impact of products and services
11.4 Collecting used mobile phones
11.6 Paper usage
65.
66.
G4-EN28 Percentage of products sold and their packaging materials that are reclaimed by category
11.4 Collecting used mobile phones 65
The standard dis-closure does not in-clude the quantity of reclaimed packaging materials and the percentage rate of reclaimed products.
The information is currently unavailable.
COMPLIANCE
G4-DMA General information about management approach 11.1 Environmental management 59.
G4-EN29 Monetary value of significant fines and total number of non-monetary sanctions for non-compliance with environmental laws and regulations
11.1 Environmental management 60. ✔
TRANSPORT
G4-DMA General information about management approach 11.1 Environmental management 59.
G4-EN30
Significant environmental impact of transporting products and other goods and materials for the organization’s operations, and transporting mem-bers of the workforce
11.2 Energy usage and CO2 emissions 63-65.
OVERALL DATA
G4-DMA General information about management approach 11.1 Environmental management 59.
G4-EN31 Total environmental protection expenditures and investments by type 11.1 Environmental management 60.
GENERAL STANDARD DISCLOSURES CHAPTER PAGE NO (LINK)
IDENTIFIED OMISSION(S)
REASON(S) FOR OMISSION(S)
EXPLANATION FOR OMISSION(S)
THIRD-PARTY VERIFICATION
75GRI CONTENT INDEX

SUPPLIER ENVIRONMENTAL ASSESSMENT
G4-DMA General information about management approach 6.5 Sustainable supply chain 36.
G4-EN33Significant actual and potential negative environ-mental impacts in the supply chain and actions taken
6.5 Sustainable supply chain 37.
CATEGORY: SOCIAL
SUB-CATEGORY: LABOR PRACTICES AND DECENT WORK
EMPLOYMENT
G4-DMA General information about management approach
10.1 Employment data
10.2 Equal opportunities
52.
53.
G4-LA1Total number and rates of hiring new employees and employee turnover by age group, gender and region
10.1 Employment data 53.
The disclosure does not include data in a breakdown by re-gion.
Currently, we have no records including data in a breakdown by region.
G4-LA2Benefits provided to full-time employees that are not provided to temporary or part-time employe-es, by significant locations of operation
3. Our sustainability performance in figures 19.
G4-LA3 Return to work and retention rates after parental leave, by gender 10.2 Equal opportunities 54.
MANAGER-STAFF RELATIONSHIP
G4-DMA General information about management approach 10.1 Employment data 52
G4-LA4 Minimum period of notice for major changes in or-ganization and whether or not such period of noti-ce is indicated in the collective agreement.
10.1 Employment data 52
The disclosure does not include a spe-cific minimum pe-riod of notice.
The company does not specify any spe-cific period of notice for major organiza-tional changes.
✔
OCCUPATIONAL HEALTH AND SAFETY
G4-DMA General information about management approach 10.3 Healthy working environ-ment and work safety 55.
GENERAL STANDARD DISCLOSURES CHAPTER PAGE NO (LINK)
IDENTIFIED OMISSION(S)
REASON(S) FOR OMISSION(S)
EXPLANATION FOR OMISSION(S)
THIRD-PARTY VERIFICATION
76GRI CONTENT INDEX

G4-LA6
Type of injury and rates of injury, occupational diseases, lost days, and absenteeism, and total number of work-related fatalities, by region and by gender
10.3 Healthy working environ-ment and work safety 55.
The disclosure does not include data in a breakdown by re-gion.
Currently, we have no records including data in a breakdown by region.
✔
TRAINING AND EDUCATION
G4-DMA General information about management approach 10.4 Growth opportunities at Telenor 56
G4-LA10
Programs for skills management and lifelong lear-ning that support the continued employability of employees and assist them in managing career endings
10.4 Growth opportunities at Telenor 56
G4-LA11 Percentage of employees receiving regular perfor-mance and career development reviews, by gen-der and by employee category
10.4 Growth opportunities at Telenor 56
Disclosure does not include a break-down of employees by category.
There are no re-cords available at the company about the breakdown of employees involved in this process by category.
✔
DIVERSITY AND EQUAL OPPORTUNITIES
G4-DMA General information about management approach 10.2 Equal opportunities 53
G4-LA12
Composition of governance bodies and breakdown of employees per employee category according to gender, age group, minority group membership, and other indicators of diversity
10.2 Equal opportunities 53
Disclosure does not include classification in a breakdown by minority groups.
The company has no records about the minority-affiliation of employees.
EQUAL WAGES TO MALE AND FEMALE EMPLOYEES
G4-DMA General information about management approach 10.1 Employment data 52
G4-LA13 Comparison of the wages and non-wage benefits provided to male and female employees. 10.2 Equal opportunities 53
The standard dis-closure does not in-clude a comparison of the wages and non-wage benefits provided to male and female employees.
The company has no records about differences in the wages of male and female employees.
✔
GENERAL STANDARD DISCLOSURES CHAPTER PAGE NO (LINK)
IDENTIFIED OMISSION(S)
REASON(S) FOR OMISSION(S)
EXPLANATION FOR OMISSION(S)
THIRD-PARTY VERIFICATION
77GRI CONTENT INDEX

SUPPLIER ASSESSMENT FOR LABOR PRACTICES
G4-DMA General information about management approach 6.5 Sustainable supply chain 36.
G4-LA15Significant actual and potential negative impacts for labour practices in the supply chain and actions taken
6.5 Sustainable supply chain 37.
SUB-CATEGORY: HUMAN RIGHTS
DISCRIMINATION
G4-DMA General information about management approach 10.2 Equal opportunities 53.
G4-HR3 No. of discrimination incidents and actions taken in response to such incidents 10.2 Equal opportunities 53. ✔
EVALUATION
G4-DMA General information about management approach 6.6 Human rights due diligence 38.
G4-HR9Total number and percentage of operations that have been subject to human rights reviews or im-pact assessment
6.6 Human rights due diligence 38.
SUPPLIER HUMAN RIGHTS ASSESSMENT
G4-DMA General information about management approach 6.5 Sustainable supply chain 36.
G4-HR11Significant actual and potential negative human rights impacts in the supply chain and actions taken
6.5 Sustainable supply chain 37.
SUB-CATEGORY: SOCIAL
LOCAL COMMUNITIES
G4-DMA General information about management approach
5.3 Corporate responsibility strategy
7.5 Security
11.1 Environmental management
32.
43.
59.
GENERAL STANDARD DISCLOSURES CHAPTER PAGE NO (LINK)
IDENTIFIED OMISSION(S)
REASON(S) FOR OMISSION(S)
EXPLANATION FOR OMISSION(S)
THIRD-PARTY VERIFICATION
78GRI CONTENT INDEX

G4-SO2 Areas of business that have or may have a material impact on the local community
7.5 Security
11.1 Environmental management
11.2 Energy usage and CO2 emissions
43.
59.
61-66.
ANTI-CORRUPTION EFFORTS
G4-DMA General information about management approach6.3 Practices to combat corrup-tion and promote ethical business conduct
34.
G4-SO3 Total number and percentage of operations asses-sed for risks related to corruption and the signifi-cant risks identified
6.3 Practices to combat corrup-tion and promote ethical business conduct
34. ✔
G4-SO4 Communication and training on anti-corruption policies and procedures
6.3 Practices to combat corrup-tion and promote ethical business conduct
35.
G4-SO5 Confirmed incidents of corruption and actions taken
6.3 Practices to combat corrup-tion and promote ethical business conduct
36.
PUBLIC POLICY
G4-DMA General information about management approach 4.5 Economic results 27.
G4-SO6 Total value of political contributions by country and recipient/beneficiary 4.5 Economic results 28.
ANTI-COMPETITIVE BEHAVIOUR
G4-DMA General information about management approach
6.2 Promote legal compliance
6.3 Practices to combat corrup-tion and promote ethical business conduct
34.
G4-SO7Total number of legal actions for anti-competitive behaviour, anti-trust, and monopoly practices and their outcomes
6.2 Promote legal compliance 34.
GENERAL STANDARD DISCLOSURES CHAPTER PAGE NO (LINK)
IDENTIFIED OMISSION(S)
REASON(S) FOR OMISSION(S)
EXPLANATION FOR OMISSION(S)
THIRD-PARTY VERIFICATION
79GRI CONTENT INDEX

COMPLIANCE
G4-DMA General information about management approach 6.2 Promote legal compliance 34.
G4-SO8 Monetary value of significant fines and total num-ber of non-monetary sanctions for non-complian-ce with laws and regulations
6.2 Promote legal compliance 23. ✔
SUPPLIER ASSESSMENT FOR IMPACTS ON SOCIETY
G4-DMA General information about management approach 6.5 Sustainable supply chain 36.
G4-SO10 Significant actual and potential negative impacts on society in the supply chain and actions taken 6.5 Sustainable supply chain 37.
SUB-CATEGORY: PRODUCT LIABILITY
CUSTOMER HEALTH AND SAFETY
G4-DMA General information about management approach 7.5 Security 43.
G4-PR2
Total number of incidents of non-compliance with regulations and voluntary codes concerning the health and safety impacts of products and services during their life cycle, by type of outcomes
7.5 Security 43. ✔
PRODUCT AND SERVICE LABELING
G4-DMA General information about management approach 7.2 Responsible marketing 40.
G4-PR4
Total number of incidents of non-compliance with regulations and voluntary codes concerning pro-duct and service information and labelling, by type of outcomes
7.2 Responsible marketing 40.
G4-PR5 Results of customer satisfaction surveys 7.3 Customer satisfaction 41.
MARKETING COMMUNICATIONS
G4-DMA General information about management approach 7.2 Responsible marketing 40.
G4-PR7
Total number of incidents of non-compliance with regulations and voluntary codes concerning marke-ting communications, including advertising, promo-tion, and sponsorship, by type of outcomes
7.2 Responsible marketing 40.
GENERAL STANDARD DISCLOSURES CHAPTER PAGE NO (LINK)
IDENTIFIED OMISSION(S)
REASON(S) FOR OMISSION(S)
EXPLANATION FOR OMISSION(S)
THIRD-PARTY VERIFICATION
80GRI CONTENT INDEX

CUSTOMER PRIVACY
G4-DMA General information about management approach 7.4 Privacy 42.
G4-PR8 Total number of substantiated complaints regar-ding breaches of customer privacy and losses of customer data
7.4 Privacy 42. ✔
COMPLIANCE
G4-DMA General information about management approach 7.5 Security 43.
G4-PR9
Monetary value of significant fines and number of non-monetary sanctions for non-compliance with laws and regulations concerning the provision and use of products and services
7.5 Security 43. ✔
INNOVATION
DMA General information about management approach 7.1 Innovation 40.
Number of colleagues joining innovation platform 7.1 Innovation 40. ✔
THE ROLE OF ICT IN THE LIFE OF YOUNG GENERATIONS
DMA General information about management approach8.2 ICT in education
9. Community engagement
46.
50.
Number of students attending a session on safe internet use 9. Community engagement 50. ✔
GENERAL STANDARD DISCLOSURES CHAPTER PAGE NO (LINK)
IDENTIFIED OMISSION(S)
REASON(S) FOR OMISSION(S)
EXPLANATION FOR OMISSION(S)
THIRD-PARTY VERIFICATION
81GRI CONTENT INDEX

RÖVIDÍTÉSEK1. ACRONYMS

About the report
GRI Global Reporting Initiative
TnCO Telenor Common Operation Zrt.
Our sustainability performance in figuresARPU Average revenue per unit
CAPEX Capital expenditure excluding spectrum charges
CO2 carbon-dioxide
EBIT Earnings Before Interest and Taxes
EBITDA Earnings Before Interest, Taxes, Depre-ciation and Amortization
GJ gigajoule
GWh gigawatt-hour
HUF forint
IFRS International Financial Reporting Standards
Mbps Megabit per second
kg kilogram
l litre
m million
m3 cubic meter
MJ megajoule
SZÉP Széchenyi Recreation Card
t ton
Company information
AmCham American Chamber of Commerce
BCSDH Business Council for Sustainable Devel-opment in Hungary
HBLF Hungarian Business Leaders Forum
HÉT Communications Reconciliation Council (Hírközlési Érdekegyeztető Tanács)
HTE Science Association for Communica-tions and IT (Hírközlési és Informatikai Tudományos Egyesület)
IVSZ ICT Association of Hungary (Informa-tikai, Távközlési és Elektronikai Vál-lalkozások Szövetsége)
KÖVET KÖVET Association for Sustainable Economies
MAF Hungarian Donors Forum (Magyar Adományozói Fórum)
NIOK Nonprofit Information and Education Centre (Nonprofit Információs és Oktató Központ)
NMHH National Media and Infocommunica-tions Authority (Nemzeti Média- és Hírközlési Hatóság)
Our strategy
EES Employee Engagement Survey
Responsible corporate governance
DUE Student Journalists’ Association (Diákú-jságíró Egyesület)
SCS Supply Chain Sustainability
TI Transparency International
Customers
IVR Interactive Voice Response
KPI Key Performance Indicator
WHO World Health Organization
Infocommunications technology for the benefit of the society
ORFK National Police Headquarters (Országos Rendőr-főkapitányság)
UNICEF United Nations International Children’s Emergency Fund
Responsible employment
GYED Child Care Benefit (Gyermekkgondozási díj)
GYES Child Care Fee (Gyermekgondozási segély)
HSSE Health & Safety, Security and Environ-ment system
MEBIR Occupational Health and Safety Man-agement System
TDP Telenor Development and Performance
Environment
ISO International Organization for Stand-ardization
KIR Environmental Management System (EMS)
RF Radio Frequency
83ACRONYMS

impresszum1. Independent Assurance Letter
Denkstatt Hungary Kft. was commissioned by Telenor Magyarország Zrt. (“Telenor”) to carry out an independent third-party audit of Te-lenor’s Sustainability Report for the year 2014 (the “Report”).
Scope, criteria and methodologyThe assessment of the Report covered the following aspects:
• the application of the GRI G4 Principles for Defining Report Cont-ent and Quality;
• stakeholder engagement and materiality – these concepts are of outstanding importance in GRI G4;
• the use of the GRI G4 indicators;• compliance with the chosen ‘in accordance’ option (core);• the evaluation of data, texts, the data collection and data mana-
gement processes, as well as the generation of indicators through data checks and interviews with data owners. Denkstatt checked whether data are accurate, reproducible and reliable. The backg-round data of indicators related to material aspects were given particular attention to during the assessment.
Results and Development Recom-mendations
After the first phase of the assessment process, a Preliminary Assuran-ce Report was submitted to Telenor on the results of the first phase and necessary modifications. The final version was updated according to the recommended amendments. The expert evaluation and potential areas of improvement were summarized in a detailed Final Assurance Report. The main findings of the report were:
• the improvement of the stakeholder engagement process is ne-cessary, as referred to in the final version of Telenor’s Sustainabi-lity Report;
• in line with the materiality concept, the presence of material is-sues in the Report should reflect their significance;
• as required for the core ‘in accordance’ option, conditions must be established for the disclosure of at least one indicator related to each identified material aspect (apart from the general standard disclosures) with content and structure defined by the GRI G4 Gu-idelines;
• in order to improve the availability, management, transparency and accuracy of background data, a data management system needs to be established with support from the top management.
ConclusionsIt can be concluded the Report provides a comprehensive coverage of Telenor’s sustainability activities in 2014.
During the audit of the Report, nothing has come to our attention that would lead us to assume that the Report was not prepared in line with the GRI guidelines or it would not fulfill the requirements of the targeted GRI G4 ‘in accordance’ option (core).
IndependencyDenkstatt Hungary Kft. has no relations of any kind with Telenor that would pose a risk to the independency of the assurance process or its results.
Budapest, 2 December 2015
Edit Csizmadia
CSR ConsultantDenkstatt Hungary Kft.
84FÜGGETLEN HITELESÍTŐI LEVÉL

impresszum1.
Published by the Corporate Communications Department of Telenor Hungary
(Törökbálint, 2015)
Data collection was coordinated by Anita Fazekas-Boros and Judit Váradi. Written by Judit Váradi and Gábor Vécsei.
Contributors:
Orsolya Alagi-Zilah, Krisztina Asztalos, Zoltán Bánhidi, Attila Baranyai, dr. Orsolya Bényi, Adrienn Bércesi, Tibor Berkes, Lajos Bodnár, Gabriella Bognár, Hedvig Csókány Begitter, Imre Csőgör, dr. Tamás Érsek, Anita Fazekas-Boros, Gabriella Fehér, Rita Fülöp, Zsuzsanna Gábor, Dorottya Gál, Anett Gulyás, Attila Gyuk, Ferenc Haláchy, Petra Jankovics, Barbara Jánosa, Katalin Juhász, András Kerekes, dr. János Kőszegi, Beáta Kő-szegi Dutka, Éva Karakó, Norbert Kun, István Kutas, dr. Gábor László Kürthy, Éva Henrietta Mayr, Gergely Menich, Gabriella Mogyorósi-Bartók, István Molnár, Eszter Nagy, László Nagy, Zoltán Olasz, András Oszolik, Ottó Pajor, dr. Nikolett Pósán, Barbara Pesti, Zsolt Rozgonyi, Péter Sebestyén, Zsuzsa Steigerwald, Mónika Szabó, Ákos Thirring, Katalin Verebélyi-Gaál, Viktória Vermes
Graphic Design
Createam Advertising
imprint