Hungary diagnostic - European Bank for Reconstruction and ...
38
Hungary diagnostic by Mateusz Szczurek and Marcin Tomaszewski March 2021 PUBLIC
-
Upload
khangminh22 -
Category
Documents
-
view
4 -
download
0
Transcript of Hungary diagnostic - European Bank for Reconstruction and ...

Hungary diagnosticby Mateusz Szczurek and Marcin Tomaszewski
March 2021
PUBLIC
Contents
March 2021 2
1. Executive summary
2. Political economy
3. Economic overview
4. Key obstacles to private-sector development
1. The value-creating capacity of domestic SMEs remains subdued
2. Insufficient modern and alternative sources of finance limit economic resilience and hinder broader productivity growth
3. Ensuring adequate financing is a key issue in developing the green economy and promoting environmental sustainability
4. The institutions necessary for a sustainable market economy are strong in principle but weak in practice
5. Annex: Assessments of Transition Qualities (ATQs)
6. References
This report was prepared by Mateusz Szczurek and Marcin Tomaszewski, with contributions from Alenka Cerne (section 2 and ATQ annex); Petra Reszkető and Balázs Váradi of
the Budapest Institute (section 4.1); Philipp Paetzold and Svenja Petersen (section 4.2); Kate Galvin and Attila Toth (sections 4.3 and 4.4); Damin Chung, Melissa Engelhardt,
Federica Foiadelli, Mark Lane, Dan Meshulam, Alina Mika, Dejan Vasiljev and Susanne Wischnath (ATQ annex); Łukasz Więcławski (final editing). The views expressed in this
paper are those of the authors only and not those of the EBRD or its members.
PUBLIC
1 Executive summary
Well into the 2000s, Hungary was seen as one of the more successful post-communist
transformations to a liberal democracy and market economy in central and eastern Europe.
Impressive GDP and investment growth rates have propelled Hungary’s per capita income
convergence, although productivity gains have remained subdued compared with regional peers.
Public debt has been declining and Hungary’s external macro vulnerabilities have been
substantially reduced, largely thanks to a massive increase in the number of retail government
securities held domestically by households and banks.
This report identifies four key constraints holding back private-sector growth in Hungary:
• The value-creating capacity of domestic small and medium-sized enterprises (SMEs) remains
subdued. Hungary’s heavy reliance on imported inputs and the strong presence of foreign-
owned companies suggest that SME links to the domestic economy are weak. There is little
integration of large foreign-owned multinational enterprise with domestic SMEs, probably due
to SME skills gaps and limited interaction between stakeholders.
• Insufficient modern and alternative sources of finance limit economic resilience and hinder
broader productivity growth. Private-sector capital-market funding is marginal and there is no
support ecosystem to manage the country’s rising wave of corporate succession issues.
Hungary is also in the lower ranks of the European Union (EU) in terms of digital banking.
• Ensuring adequate financing is key to developing the green economy and promoting
environmental sustainability. Demand-side interest in green products has soared, as evidenced
by demand for Hungary’s first green government bond and those issued by companies.
• Institutions necessary for a sustainable market economy are strong in principle, but weak in
practice. Hungary is a very investor-friendly destination for export-oriented manufacturing, but
the business environment for domestically owned firms and domestic demand-oriented
sectors is very different. Creeping state intervention into an growing number of sectors
through regulation and the manipulation of market structures creates uncertainty for
entrepreneurs. As the European Commission has noted in country reports (European
Commission, 2019a; 2019b; 2019c; 2020), for example, the state has created monopolies in
several segments of the economy (such as the tobacco wholesale and retail trade, textbook
publishing and municipal waste collection). Also, increased levels of perceived corruption are
damaging competitiveness and corporate governance.
March 2021 3
Country diagnostics are an EBRD tool for identifying the main obstacles to entrepreneurship and
private-sector development. They help shape the Bank’s strategic priorities and project selection
for new country strategies and inform the EBRD’s policy engagement with national authorities.
The diagnostics assess progress on and the challenges of developing sustainable market
economies in regions where the EBRD invests. Private-sector development and entrepreneurship
are at the heart of the Bank’s mandate, but the private sector in all economies where the EBRD
invests faces a range of problems and obstacles. The diagnostics highlight the key challenges for
private companies and show where each country stands with regard to its peers in terms of the
Bank’s six transition qualities – competitive, well-governed, resilient, integrated, green and
inclusive – pointing out the main deficiencies and gaps in each quality.
The diagnostics draw on a range of methodologies and best practices for assessing how big the
various obstacles are. Extensive use is made of in-house expertise across the EBRD, along with
surveys such as the Business Environment and Enterprise Performance Survey (BEEPS) and the
Life in Transition Survey, as well as other cross-country surveys and reports from institutions such
as the European Commission, Eurostat, the International Monetary Fund, the World Bank and the
World Economic Forum. For some, the diagnostics also draw on specially commissioned studies
on specific issues critical to that country’s private-sector development.
The diagnostics are led by the EBRD’s Country Economics and Policy team and draw considerably
on the expertise of sector, governance and political experts in the Bank’s Economics, Policy and
Governance department (EPG), as well as broad consultation with experts across the EBRD. The
diagnostics are shared with the EBRD Board during the country strategy process.
The views expressed in the diagnostic papers are those of the authors alone and not of the EBRD.
For more information, go to: https://www.ebrd.com/publications/country-diagnostics
PUBLIC
March 2021 4PUBLIC
2 Political economy
Hungary is a country advanced in transition, but still facing transition gaps. It has made good progress on market economic reforms and has been firmly anchored in NATO since 1999 and the EU
since 2004.
The governing coalition, led by the centre-right Fidesz party, enjoys a comfortable majority in parliament. Fidesz is the country’s undisputed dominant political force, in power as governing party since
2010 and, previously, in coalition in 1998-2002. In the last municipal elections (held on 13 October 2019), the opposition won several large cities, including Budapest, while Fidesz strengthened its
base in smaller towns. Despite the government’s political autonomy, the public governance system is highly centralised. This means that policies are based on national and EU priorities, with
relatively little consideration for local conditions. Hungary has the second-largest regional disparities in GDP per capita of the 30 OECD countries with comparable data.
A number of developments in recent years are perceived as having negatively impacted the operation of various institutions, including the media and civil society. Increasingly concentrated
ownership of media outlets, through the Central European Press and Media Foundation, for example, coupled with a restrictive legislative framework and the absence of an independent media
regulatory body have raised concerns over editorial freedom, media competition and pluralism.
The transparency of decision-making and social dialogue has stagnated of late. The meaningful participation of civil society and business in public decision-making is limited. There are frequently
unpredictable changes in regulation and policy.
The judiciary remains largely independent of the government, though recent legislation allowing the authorities to challenge unfavourable decisions by the lower courts in the constitutional court,
among other things, have raised concern over its potential detrimental impact on the independence of the judiciary and undermined public confidence in the judicial system.
Hungary ranked 70th out of 180 countries and territories and 19th in the EU in the 2019 Transparency International Corruption Perceptions Index, placing it at the lower end of the table in both the
EU and central and eastern Europe (Transparency International, 2019). According to the 2020 European Commission country report on Hungary, no progress has been made on reinforcing the anti-
corruption framework or on addressing persisting concerns over judicial independence (European Commission, 2020).
According to recent polls, the public sees immigration as the most important issue facing the EU (European Union, 2018).
3 Economic overview3.1 Impressive GDP and investment growth rates propelling per capita income convergence,
which remains somewhat damped by weaker productivity gains relative to peers
March 2021 PUBLIC 5
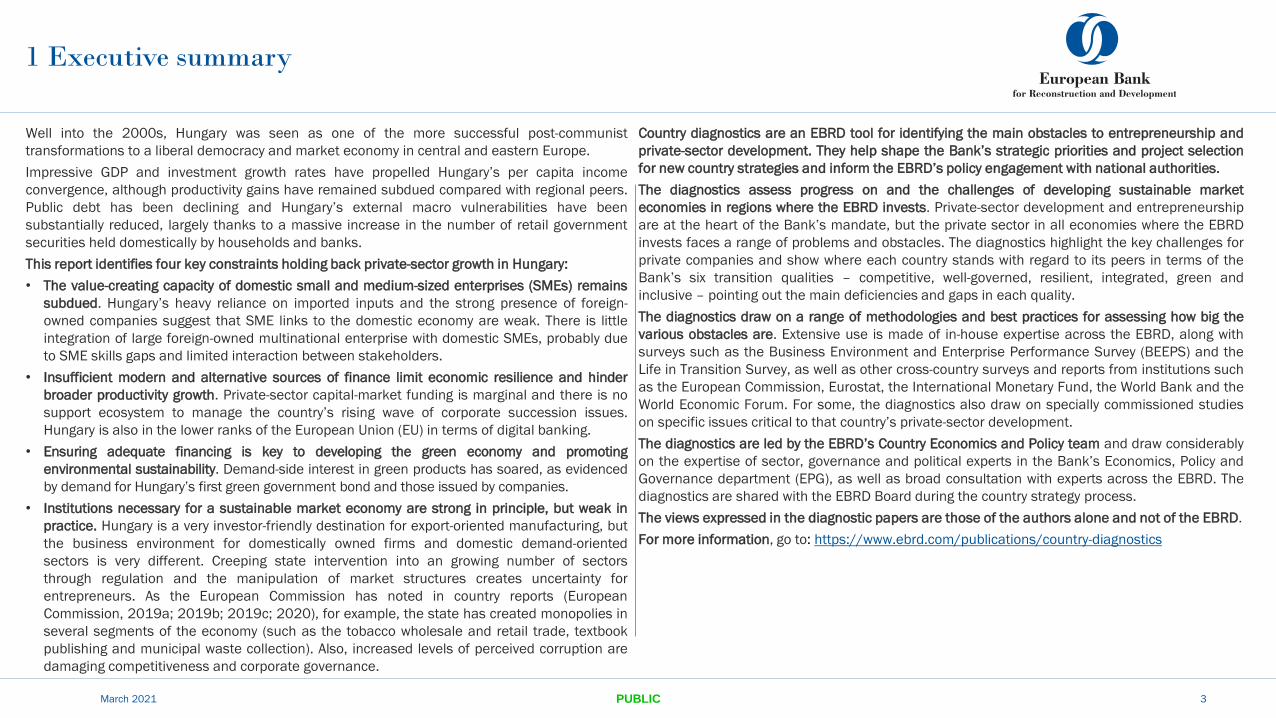
Hungary’s average per capita income level is converging with the EU average, though it remains below that of
regional peers. In the 10 years to 2018, GDP per capita increased to 70.7 per cent of the EU average, a rise of
10.5 percentage points. At the same time, average incomes in the CEE3 (the Czech Republic, Poland and the
Slovak Republic) reached almost 80 per cent of the EU average, with the Czech Republic exceeding 90 per cent
and the other central European and Baltic (CEB) economies at 75 per cent. According to European Commission
calculations (European Commission, 2019a), Hungary’s slower pace of convergence relative to the CEE3 since the
financial crisis can be explained by its relatively lower productivity gains (see top chart). Simultaneously, the rising
employment rate has played a major role in the convergence of Hungary’s per capita income.
Hungary had the strongest GDP growth of its peers in the five years to 2019. From 2014 to 2019, Hungary’s
average GDP growth rate was 4.1 per cent, well above the average of 3.3 per cent in the other CEB economies.
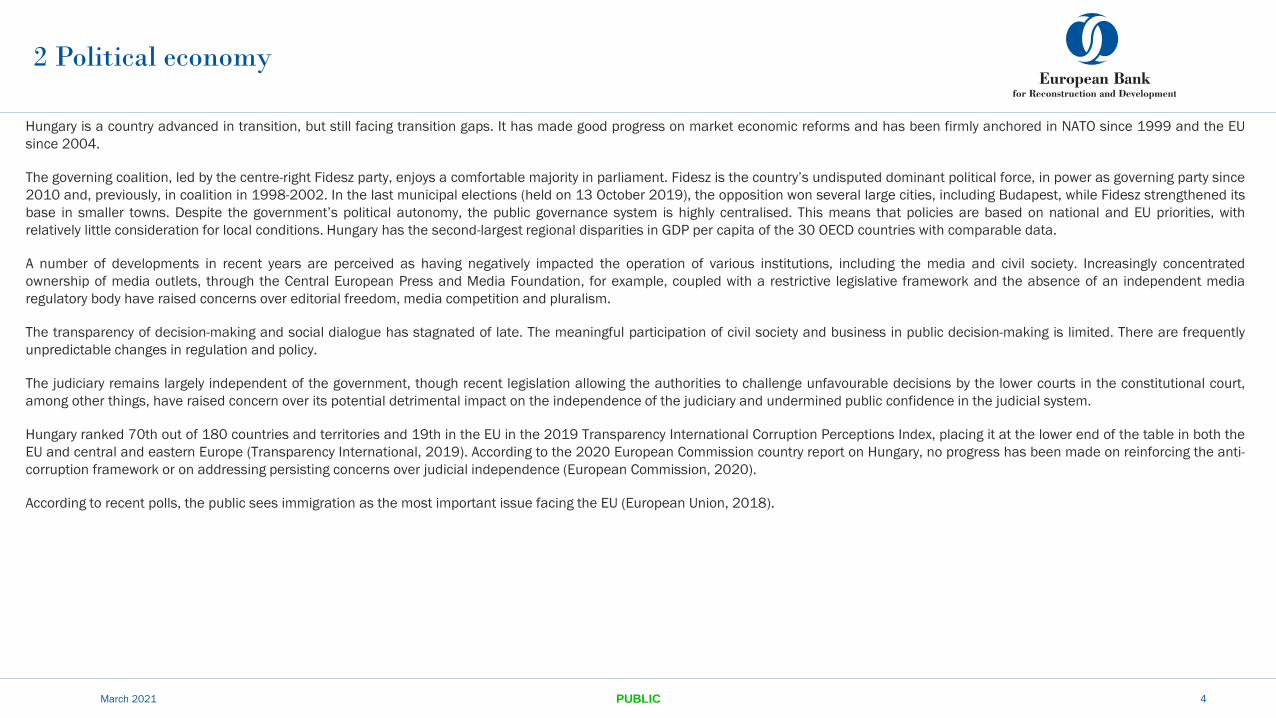
Investment has seen the most vibrant recovery in both the public and private sectors. Similar to the other EU
economies, Hungary’s public investment cycle is highly dependent on EU transfers. Following a slowdown in the
absorption of EU transfers in 2016 due to the shift to the next EU budgetary period and a change in disbursement
criteria, both public- and private-sector investment soared above the levels seen in the CEE3. According to the
European Commission database, public and private investment reached 6.0 per cent and 22.6 per cent of GDP,
respectively, in 2019 (see bottom left-hand charts). The impressive increase in private-sector investment can also
be attributed to the recovery of corporate credit, in which growth turned positive only in late 2016. Hungary’s
overall investment level was among the highest in the region in 2019, at 25.2 per cent of GDP, almost on par with
the Czech Republic (25.5 per cent) and substantially above the CEB average (20.8 per cent).
The Covid-19 crisis pushed Hungary into recession in 2020. The lockdown implemented by the government in
March 2020 to prevent the uncontrolled transmission of Covid-19 (see more in section 3.4), brought much of
Hungary’s economic activity to a halt. In 2020, the economy shrank 5.0 per cent, weighed down by a massive slide
in net exports (the drop in exports was higher than that in imports), investment and tourism revenues. The
unemployment rate stood at 4.3 per cent in December 2020, after registering a historical low of 3.4 per cent in
January 2020. Tourism and exports accounted for 13 per cent and 98 per cent of GDP, respectively. The
automotive industry (28 per cent of manufacturing output) is at the heart of the country’s high global value-chain
integration, so the temporary closure of all four car plants weighed significantly on short-term GDP growth and
employment. By way of illustration, a one-month closure of the car plants is estimated to cost the country 0.4 per
cent of annual GDP. Some car plants restarted production at the end of April, while the majority of lockdown
restrictions were gradually lifted from May. Some of them were reintroduced in November 2020 due to a second
wave of the pandemic, mainly affecting the hospitality, leisure and entertainment sectors.
Hungary’s slower pace of convergence relative to CEE3 since the
financial crisis is down to its lower productivity gains
Public investment is highly
correlated with EU fund inflows
Source: European Commission (2019a).
Note: CEE3 = Czech Republic, Poland
and Slovak Republic (PPS, EU=100).
Source: Eurostat and European Commission’s Ameco database. Note: In the bottom left-hand
chart, capital-account credit acts as a proxy for EU fund inflows.
Private-sector investment
has outpaced that of its peers
3 Economic overview3.2 Labour market tightens, as labour costs outpace recovering productivity gains
March 2021 PUBLIC 6
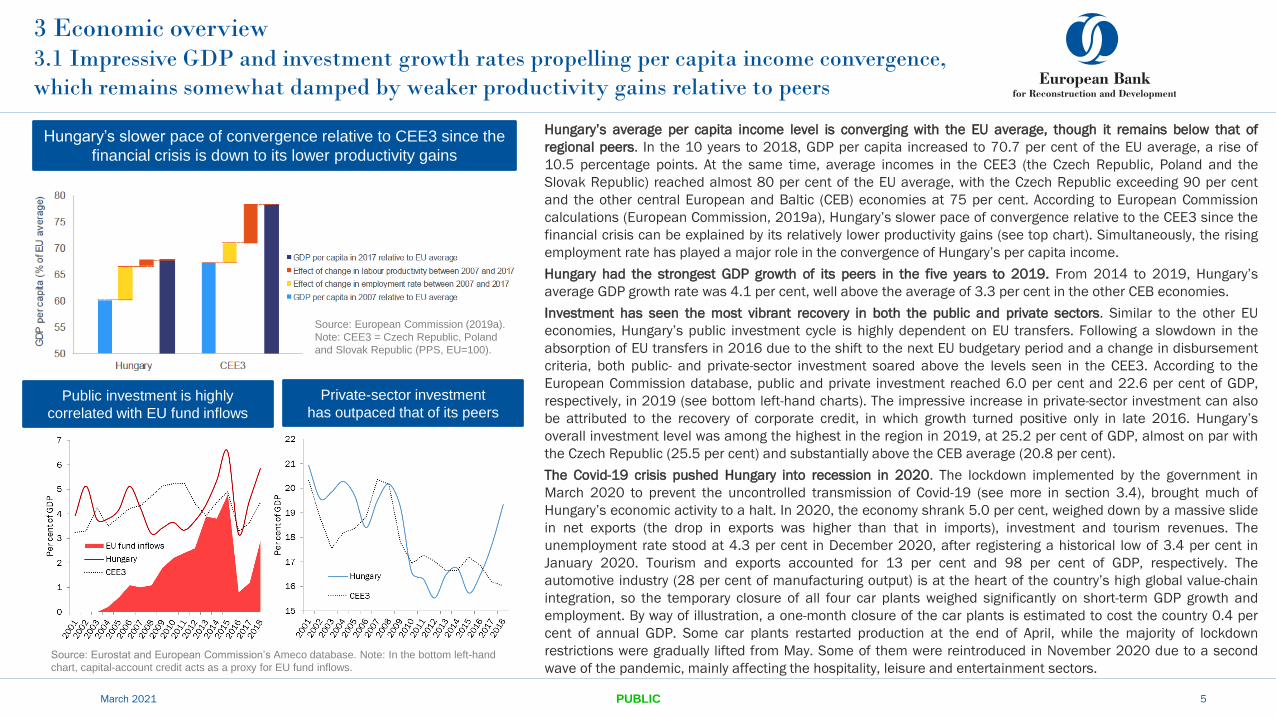
Credit growth has brought about a recovery in Hungary’s productivity growth. Real labour productivity per
hour worked has improved by a cumulative 50 per cent since 2000, though this is the weakest rebound of
the peer group, with the average CEE3 and CEB recovery at 72 per cent. Before the financial crisis,
productivity growth in Hungary was in line with that of its peers (see upper left-hand chart). The post-crisis
deleveraging in the banking sector resulted in negative corporate credit growth and scant business
investment after 2010. Since 2017, productivity growth has improved to an annual average of 3.5 per cent,
higher than in the Czech Republic, the Slovak Republic or Slovenia, but below that in Poland and the Baltic
states. In 2018, Hungary’s real labour productivity was €16.6 per hour worked, less than a third of
Germany’s (€54.7) and less than the Slovak Republic’s (€22.0), but slightly more than Poland’s (€15.2).
Aggregate productivity growth has not recovered to pre-crisis levels. While company growth has recovered,
the reallocation of resources to more efficient firms remains slow. The productivity growth of individual firms
has largely recovered to pre-crisis levels, but overall business dynamics have remained poor. Despite the
economic recovery, the entry of new firms has continued to decrease (Bauer and Endrész, 2018) and may
have been exacerbated by the rise in emigration of younger and better-educated citizens. Also, in contrast to
the CEE3, the productivity and competitiveness of the services sector has deteriorated sharply relative to EU
averages, hampered by regulatory barriers and significant state involvement (European Commission,
2019a) (see also 4.1). Productivity in the manufacturing sector is among the highest in the EU.
The labour market is tightening as labour costs outpace productivity gains. In mid-2019, Hungary’s
employment rate for the 20-64 age group was in line with the EU average of 78 per cent of the total
population. The unemployment rate registered a historical low of just 3.4 per cent, as the long-term jobless
rate fell to 32 per cent of all unemployed, below the EU-average of 40 per cent. The shrinking supply of
labour and persistent skills mismatches, especially between regions, have led to higher wages, with wage
growth accelerating sharply since 2017. As a result, in 2018, nominal unit labour costs were 85 per cent
higher than in 2000 (CEB: 68 per cent). However, average hourly wages in euro terms remained at just one-
third of the EU average, or 60 per cent adjusting for price-level differences (European Commission, 2019a).
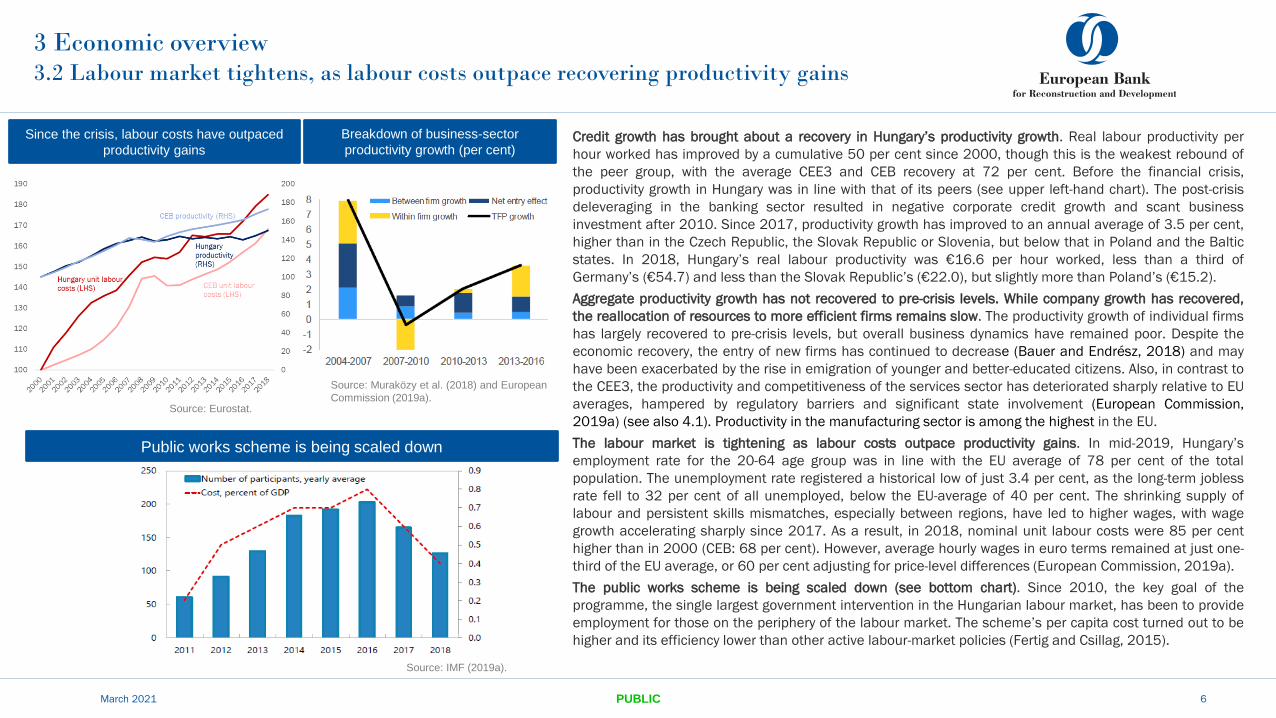
The public works scheme is being scaled down (see bottom chart). Since 2010, the key goal of the
programme, the single largest government intervention in the Hungarian labour market, has been to provide
employment for those on the periphery of the labour market. The scheme’s per capita cost turned out to be
higher and its efficiency lower than other active labour-market policies (Fertig and Csillag, 2015).
Breakdown of business-sector
productivity growth (per cent)
Public works scheme is being scaled down
Source: Muraközy et al. (2018) and European
Commission (2019a).
Source: IMF (2019a).
Since the crisis, labour costs have outpaced
productivity gains
Source: Eurostat.
3 Economic overview3.3 Public debt has been declining and external vulnerabilities have been substantially reduced, largely
due to a massive increase in the number of retail government securities held by households and banks
March 2021 PUBLIC 7
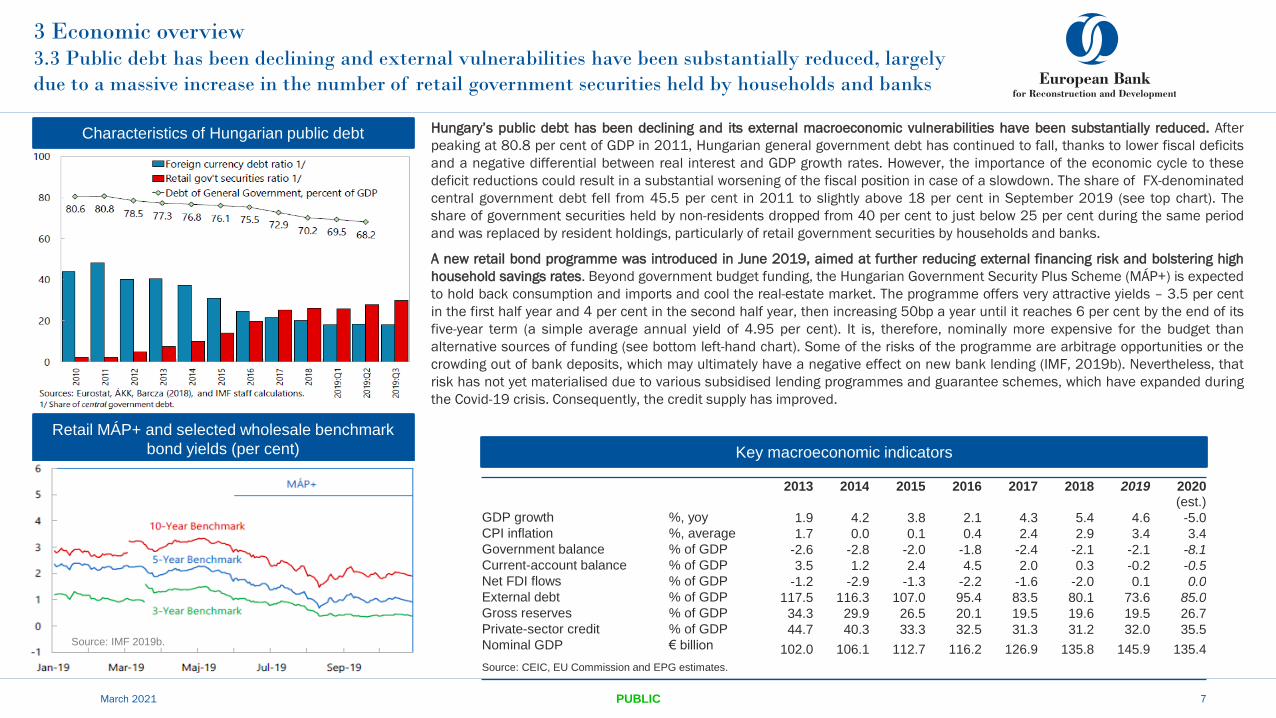
Hungary’s public debt has been declining and its external macroeconomic vulnerabilities have been substantially reduced. After
peaking at 80.8 per cent of GDP in 2011, Hungarian general government debt has continued to fall, thanks to lower fiscal deficits
and a negative differential between real interest and GDP growth rates. However, the importance of the economic cycle to these
deficit reductions could result in a substantial worsening of the fiscal position in case of a slowdown. The share of FX-denominated
central government debt fell from 45.5 per cent in 2011 to slightly above 18 per cent in September 2019 (see top chart). The
share of government securities held by non-residents dropped from 40 per cent to just below 25 per cent during the same period
and was replaced by resident holdings, particularly of retail government securities by households and banks.
A new retail bond programme was introduced in June 2019, aimed at further reducing external financing risk and bolstering high
household savings rates. Beyond government budget funding, the Hungarian Government Security Plus Scheme (MÁP+) is expected
to hold back consumption and imports and cool the real-estate market. The programme offers very attractive yields – 3.5 per cent
in the first half year and 4 per cent in the second half year, then increasing 50bp a year until it reaches 6 per cent by the end of its
five-year term (a simple average annual yield of 4.95 per cent). It is, therefore, nominally more expensive for the budget than
alternative sources of funding (see bottom left-hand chart). Some of the risks of the programme are arbitrage opportunities or the
crowding out of bank deposits, which may ultimately have a negative effect on new bank lending (IMF, 2019b). Nevertheless, that
risk has not yet materialised due to various subsidised lending programmes and guarantee schemes, which have expanded during
the Covid-19 crisis. Consequently, the credit supply has improved.
Characteristics of Hungarian public debt
Retail MÁP+ and selected wholesale benchmark
bond yields (per cent)
Source: IMF 2019b.
Key macroeconomic indicators
2013 2014 2015 2016 2017 2018 2019 2020(est.)
GDP growth %, yoy 1.9 4.2 3.8 2.1 4.3 5.4 4.6 -5.0CPI inflation %, average 1.7 0.0 0.1 0.4 2.4 2.9 3.4 3.4Government balance % of GDP -2.6 -2.8 -2.0 -1.8 -2.4 -2.1 -2.1 -8.1Current-account balance % of GDP 3.5 1.2 2.4 4.5 2.0 0.3 -0.2 -0.5Net FDI flows % of GDP -1.2 -2.9 -1.3 -2.2 -1.6 -2.0 0.1 0.0External debt % of GDP 117.5 116.3 107.0 95.4 83.5 80.1 73.6 85.0Gross reserves % of GDP 34.3 29.9 26.5 20.1 19.5 19.6 19.5 26.7Private-sector credit % of GDP 44.7 40.3 33.3 32.5 31.3 31.2 32.0 35.5Nominal GDP € billion 102.0 106.1 112.7 116.2 126.9 135.8 145.9 135.4
Source: CEIC, EU Commission and EPG estimates.
Financial sector Direct support for firms Payment holidaysTemporary
controlsSupport for individuals Increased social benefits Health
External
assistance
Po
licy
rate
red
uce
d
Liq
uid
ity
incre
ase
d
Pru
de
nti
al
req
uir
em
en
ts
loo
se
ne
d
Wa
ge
su
bsid
ies
Ta
x/so
cia
l
se
cu
rity
co
ntr
ibu
tio
ns
de
ferr
ed
Lo
an
su
bsid
ies
Gu
ara
nte
es
Insp
ecti
on
s/
au
dit
s
su
sp
en
de
d
Lo
an
s
Re
nt
Uti
liti
es
Pri
ce
s
Exp
ort
s
Un
ive
rsa
l
tra
nsfe
rs
Se
lf-
em
plo
yed
Pe
nsio
ne
rs
Lo
w-in
co
me
ho
use
ho
lds
En
ha
nce
d
sic
k le
ave
En
ha
nce
d
job
less
be
ne
fits
Pu
blic w
ork
s
Ad
dit
ion
al
sp
en
din
g
(ava
ila
ble
or
ne
go
tia
ted
)
* * * * * * * * * * * * * * *
PUBLIC
3 Economic overview3.4 The Covid-19 crisis hit the Hungarian economy hard in 2020 and the government
introduced a comprehensive set of crisis response measures
March 2021 8
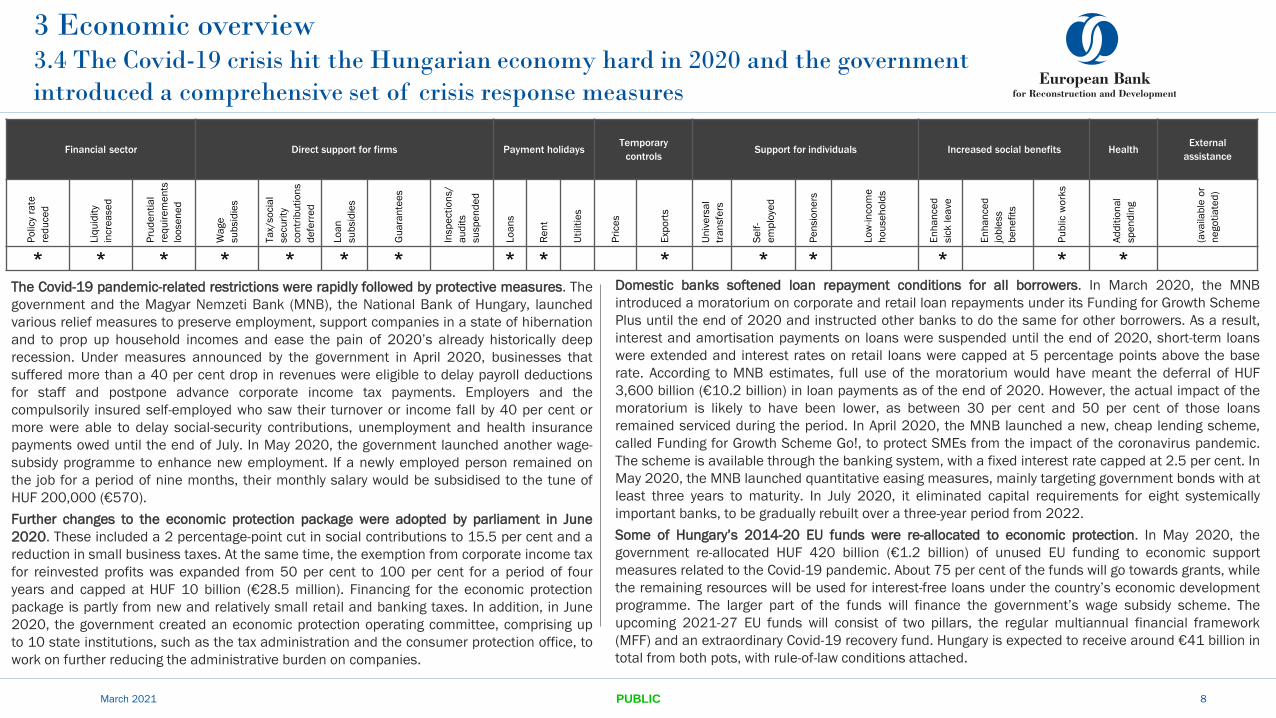
The Covid-19 pandemic-related restrictions were rapidly followed by protective measures. The
government and the Magyar Nemzeti Bank (MNB), the National Bank of Hungary, launched
various relief measures to preserve employment, support companies in a state of hibernation
and to prop up household incomes and ease the pain of 2020’s already historically deep
recession. Under measures announced by the government in April 2020, businesses that
suffered more than a 40 per cent drop in revenues were eligible to delay payroll deductions
for staff and postpone advance corporate income tax payments. Employers and the
compulsorily insured self-employed who saw their turnover or income fall by 40 per cent or
more were able to delay social-security contributions, unemployment and health insurance
payments owed until the end of July. In May 2020, the government launched another wage-
subsidy programme to enhance new employment. If a newly employed person remained on
the job for a period of nine months, their monthly salary would be subsidised to the tune of
HUF 200,000 (€570).
Further changes to the economic protection package were adopted by parliament in June
2020. These included a 2 percentage-point cut in social contributions to 15.5 per cent and a
reduction in small business taxes. At the same time, the exemption from corporate income tax
for reinvested profits was expanded from 50 per cent to 100 per cent for a period of four
years and capped at HUF 10 billion (€28.5 million). Financing for the economic protection
package is partly from new and relatively small retail and banking taxes. In addition, in June
2020, the government created an economic protection operating committee, comprising up
to 10 state institutions, such as the tax administration and the consumer protection office, to
work on further reducing the administrative burden on companies.
Domestic banks softened loan repayment conditions for all borrowers. In March 2020, the MNB
introduced a moratorium on corporate and retail loan repayments under its Funding for Growth Scheme
Plus until the end of 2020 and instructed other banks to do the same for other borrowers. As a result,
interest and amortisation payments on loans were suspended until the end of 2020, short-term loans
were extended and interest rates on retail loans were capped at 5 percentage points above the base
rate. According to MNB estimates, full use of the moratorium would have meant the deferral of HUF
3,600 billion (€10.2 billion) in loan payments as of the end of 2020. However, the actual impact of the
moratorium is likely to have been lower, as between 30 per cent and 50 per cent of those loans
remained serviced during the period. In April 2020, the MNB launched a new, cheap lending scheme,
called Funding for Growth Scheme Go!, to protect SMEs from the impact of the coronavirus pandemic.
The scheme is available through the banking system, with a fixed interest rate capped at 2.5 per cent. In
May 2020, the MNB launched quantitative easing measures, mainly targeting government bonds with at
least three years to maturity. In July 2020, it eliminated capital requirements for eight systemically
important banks, to be gradually rebuilt over a three-year period from 2022.
Some of Hungary’s 2014-20 EU funds were re-allocated to economic protection. In May 2020, the
government re-allocated HUF 420 billion (€1.2 billion) of unused EU funding to economic support
measures related to the Covid-19 pandemic. About 75 per cent of the funds will go towards grants, while
the remaining resources will be used for interest-free loans under the country’s economic development
programme. The larger part of the funds will finance the government’s wage subsidy scheme. The
upcoming 2021-27 EU funds will consist of two pillars, the regular multiannual financial framework
(MFF) and an extraordinary Covid-19 recovery fund. Hungary is expected to receive around €41 billion in
total from both pots, with rule-of-law conditions attached.
4.1 The value-creating capacity of domestic SMEs remains subdued4.1.1 Hungary’s heavy reliance on imported inputs and the strong presence of foreign-owned
companies suggest links to the domestic economy are weak
March 2021 PUBLIC 9
Today, SMEs in the non-financial business economy in Hungary account for more than two-thirds (68.3 per cent) of
total employment, slightly above the EU average of 66.6 per cent. The SME share of 54.1 per cent of total value
added is slightly below the EU average of 56.4 per cent. The productivity of Hungarian SMEs, calculated as value
added per person employed, is €19,800, less than half the EU average of €44,600. The average number of people
employed by Hungarian SMEs is 3.3, below the EU average of 3.9. As in many EU countries, the most important
SME sectors in terms of both employment and value added are manufacturing and wholesale and retail trade,
which together account for more than 40 per cent of SME employment and SME value added (European
Commission, 2019c).
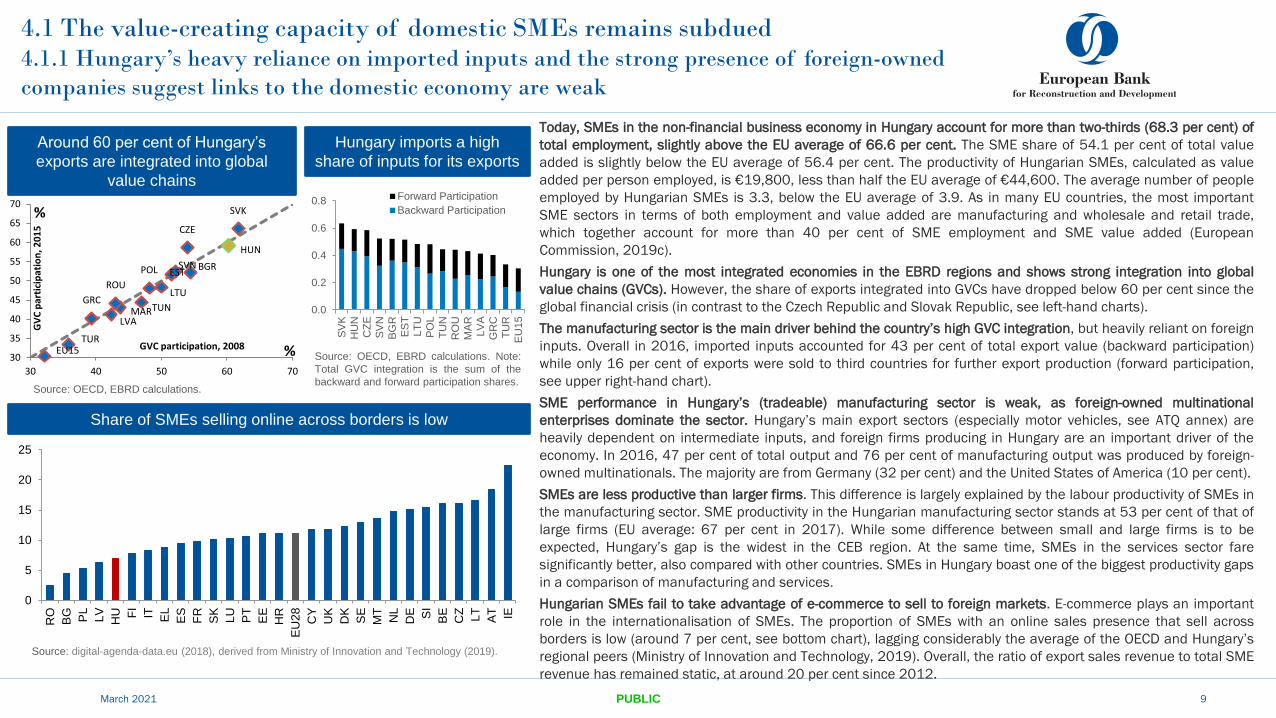
Hungary is one of the most integrated economies in the EBRD regions and shows strong integration into global
value chains (GVCs). However, the share of exports integrated into GVCs have dropped below 60 per cent since the
global financial crisis (in contrast to the Czech Republic and Slovak Republic, see left-hand charts).
The manufacturing sector is the main driver behind the country’s high GVC integration, but heavily reliant on foreign
inputs. Overall in 2016, imported inputs accounted for 43 per cent of total export value (backward participation)
while only 16 per cent of exports were sold to third countries for further export production (forward participation,
see upper right-hand chart).
SME performance in Hungary’s (tradeable) manufacturing sector is weak, as foreign-owned multinational
enterprises dominate the sector. Hungary’s main export sectors (especially motor vehicles, see ATQ annex) are
heavily dependent on intermediate inputs, and foreign firms producing in Hungary are an important driver of the
economy. In 2016, 47 per cent of total output and 76 per cent of manufacturing output was produced by foreign-
owned multinationals. The majority are from Germany (32 per cent) and the United States of America (10 per cent).
SMEs are less productive than larger firms. This difference is largely explained by the labour productivity of SMEs in
the manufacturing sector. SME productivity in the Hungarian manufacturing sector stands at 53 per cent of that of
large firms (EU average: 67 per cent in 2017). While some difference between small and large firms is to be
expected, Hungary’s gap is the widest in the CEB region. At the same time, SMEs in the services sector fare
significantly better, also compared with other countries. SMEs in Hungary boast one of the biggest productivity gaps
in a comparison of manufacturing and services.
Hungarian SMEs fail to take advantage of e-commerce to sell to foreign markets. E-commerce plays an important
role in the internationalisation of SMEs. The proportion of SMEs with an online sales presence that sell across
borders is low (around 7 per cent, see bottom chart), lagging considerably the average of the OECD and Hungary’s
regional peers (Ministry of Innovation and Technology, 2019). Overall, the ratio of export sales revenue to total SME
revenue has remained static, at around 20 per cent since 2012.
Source: digital-agenda-data.eu (2018), derived from Ministry of Innovation and Technology (2019).
0
5
10
15
20
25
RO
BG PL
LV
HU FI
IT EL
ES
FR
SK
LU
PT
EE
HR
EU
28
CY
UK
DK
SE
MT
NL
DE SI
BE
CZ
LT
AT IE
CZE
EST
GRC
HUN
LVA
LTU
POL
SVK
SVN
TUR
BGR
MAR
ROU
TUN
EU1530
35
40
45
50
55
60
65
70
30 40 50 60 70
GV
C p
arti
cip
atio
n, 2
01
5
GVC participation, 2008
%
%
0.0
0.2
0.4
0.6
0.8
SV
K
HU
N
CZ
E
SV
N
BG
R
ES
T
LT
U
PO
L
TU
N
RO
U
MA
R
LV
A
GR
C
TU
R
EU
15
Forward Participation
Backward Participation
Around 60 per cent of Hungary’s
exports are integrated into global
value chains
Hungary imports a high
share of inputs for its exports
Source: OECD, EBRD calculations.
Source: OECD, EBRD calculations. Note:
Total GVC integration is the sum of the
backward and forward participation shares.
Share of SMEs selling online across borders is low

0
20
40
60
80
100
Hungary EU-28 Poland Slovakia Slovenia CzechRepublic
Small enterprise (10–49 persons employed)
Medium-sized enterprise (50–249 persons employed)
Large firms (above 250 persons employed)
4.1 The value-creating capacity of domestic SMEs remains subdued4.1.2 Integration of large (foreign) multinationals and domestic SMEs is weak, probably due to
SME skills gaps and limited interaction between stakeholders
March 2021 PUBLIC 10
The effectiveness of SMEs’ innovation activity is low. The share of enterprises introducing innovative products or
processes (closer to technology-generated innovation) was only 15 per cent in 2018 (see upper chart), while the
corresponding ratio was 33 per cent in Slovenia, 31 per cent in the Czech Republic and 17 per cent in the Slovak
Republic. Only 14 per cent of Hungarian SMEs introduced innovation in their marketing or organisational activities,
versus 25.7 per cent in the Czech Republic, 33.2 per cent in Slovenia and 22.4 per cent in the Slovak Republic
(Ministry of Innovation and Technology, 2019). According to the EIB Investment Survey 2019 (EIB, 2019),
manufacturing and large firms are far more likely to implement digital technologies (67 per cent and 66 per cent,
respectively) than SMEs (36 per cent).
Hungary’s ability to innovate is hindered by the limited resources dedicated to innovation and stakeholder interaction.
In the EBRD’s 2018 Knowledge Economy Index (EBRD, 2019), Hungary performed worst in the innovation system
subcategory (innovation players, their resources and interactions), with a score 3.49 (out of 10), far behind its OECD
comparators (6.48). In 2011-18, a negative change could be seen, mainly driven by weak systemic links. Within the
innovation system, only 6.8 per cent of firms use foreign-licensed technology despite limited value-chain breadth. The
strength of university-industry linkages is on a par with regional peers. Integration between companies seems weak.
For example, only 9 per cent of Hungarian SMEs use integrated supply-chain invoicing mechanisms, compared with
23 per cent of SMEs across the EU (EBRD, 2019).
The proportion of SME employees participating in adult education is low. SME employees participate in just half the
training activities of large-firm employees, according to OECD data. In 2015, the percentage of employees participating
in continuing vocational training in Hungary was only about half the EU average and one-third the value of the Czech
Republic (see bottom chart). Only 14 per cent of SMEs offered ICT training to their employees, compared with 17 per
cent in the Slovak Republic and about 20 per cent in the Czech Republic (Ministry of Innovation and Technology, 2019).
The government’s strategy for strengthening Hungarian micro-, small and medium-sized enterprises (MSMEs) 2019–
30, adopted in November 2019, focuses on seven pillars:
1. Creating a business-friendly regulatory and taxation environment
2. Developing the business environment of SMEs and the means of e-government
3. Strengthening SMEs’ development capacity and enhancing their performance in innovation and digitalisation
4. Encouraging SMEs’ access to finance
5. Promoting the internationalisation of SMEs
6. Acquiring the necessary knowledge
7. Business succession planning.
Share of SMEs showing product or process innovation is low
(per cent) …
… as is the share of employees in continuing education
(per cent, 2015)
Source: OECD.
0
10
20
30
40
50
60
Source: European Commission (2018a).
4.1 The value-creating capacity of domestic SMEs remains subdued4.1.3 The scarcity of skilled labour suggests there is untapped potential in providing education
and employment opportunities to address private-sector needs
March 2021 PUBLIC 11
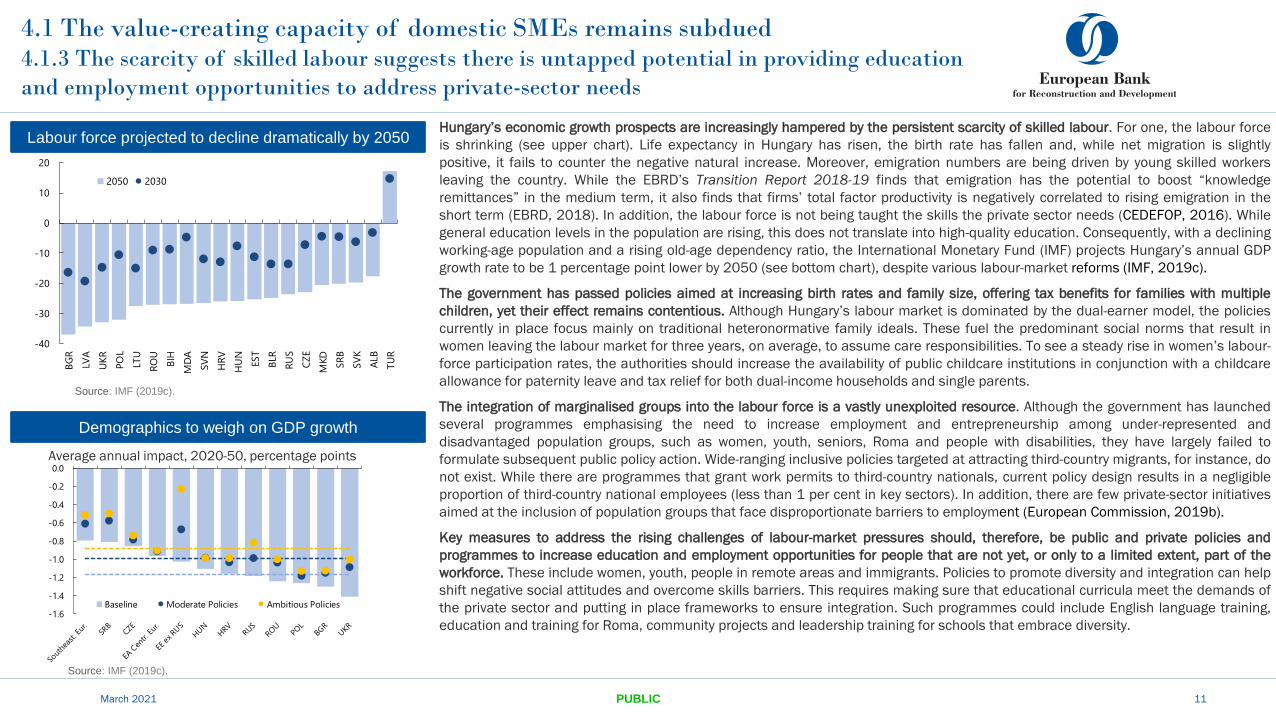
Hungary’s economic growth prospects are increasingly hampered by the persistent scarcity of skilled labour. For one, the labour force
is shrinking (see upper chart). Life expectancy in Hungary has risen, the birth rate has fallen and, while net migration is slightly
positive, it fails to counter the negative natural increase. Moreover, emigration numbers are being driven by young skilled workers
leaving the country. While the EBRD’s Transition Report 2018-19 finds that emigration has the potential to boost “knowledge
remittances” in the medium term, it also finds that firms’ total factor productivity is negatively correlated to rising emigration in the
short term (EBRD, 2018). In addition, the labour force is not being taught the skills the private sector needs (CEDEFOP, 2016). While
general education levels in the population are rising, this does not translate into high-quality education. Consequently, with a declining
working-age population and a rising old-age dependency ratio, the International Monetary Fund (IMF) projects Hungary’s annual GDP
growth rate to be 1 percentage point lower by 2050 (see bottom chart), despite various labour-market reforms (IMF, 2019c).
The government has passed policies aimed at increasing birth rates and family size, offering tax benefits for families with multiple
children, yet their effect remains contentious. Although Hungary’s labour market is dominated by the dual-earner model, the policies
currently in place focus mainly on traditional heteronormative family ideals. These fuel the predominant social norms that result in
women leaving the labour market for three years, on average, to assume care responsibilities. To see a steady rise in women’s labour-
force participation rates, the authorities should increase the availability of public childcare institutions in conjunction with a childcare
allowance for paternity leave and tax relief for both dual-income households and single parents.
The integration of marginalised groups into the labour force is a vastly unexploited resource. Although the government has launched
several programmes emphasising the need to increase employment and entrepreneurship among under-represented and
disadvantaged population groups, such as women, youth, seniors, Roma and people with disabilities, they have largely failed to
formulate subsequent public policy action. Wide-ranging inclusive policies targeted at attracting third-country migrants, for instance, do
not exist. While there are programmes that grant work permits to third-country nationals, current policy design results in a negligible
proportion of third-country national employees (less than 1 per cent in key sectors). In addition, there are few private-sector initiatives
aimed at the inclusion of population groups that face disproportionate barriers to employment (European Commission, 2019b).
Key measures to address the rising challenges of labour-market pressures should, therefore, be public and private policies and
programmes to increase education and employment opportunities for people that are not yet, or only to a limited extent, part of the
workforce. These include women, youth, people in remote areas and immigrants. Policies to promote diversity and integration can help
shift negative social attitudes and overcome skills barriers. This requires making sure that educational curricula meet the demands of
the private sector and putting in place frameworks to ensure integration. Such programmes could include English language training,
education and training for Roma, community projects and leadership training for schools that embrace diversity.
Demographics to weigh on GDP growth
Labour force projected to decline dramatically by 2050
-40
-30
-20
-10
0
10
20
BG
R
LVA
UK
R
PO
L
LTU
RO
U
BIH
MD
A
SV
N
HR
V
HU
N
EST
BLR
RU
S
CZ
E
MKD
SR
B
SV
K
ALB
TU
R
2050 2030
Sources: UN population projections, IMF staff estimates
Labor Force Projections under Baseline Scenario(Percent change from 2015)
-1.6
-1.4
-1.2
-1.0
-0.8
-0.6
-0.4
-0.2
0.0
Baseline Moderate Policies Ambitious Policies
Impact of Demographics on GDP Growth (Average yearly impact from 2020-2050, percentage points)
Source: IMF staff estimates.
Average annual impact, 2020-50, percentage points
Source: IMF (2019c).
Source: IMF (2019c).
4.2 Insufficient modern and alternative sources of finance limit economic
resilience and hinder broader productivity growth4.2.1 Hungary’s corporate bond market is one of the smallest in CEE
March 2021 PUBLIC 12
The shock-absorbing capacity of a financial system founded on multiple pillars, which includes the corporate bond market in addition
to the banking system, is far higher. In the euro area, after the outbreak of the economic crisis, the volume of outstanding bank
loans declined, while the corporate bond portfolio grew gradually. Within the EBRD regions, the corporate bond markets of the Czech
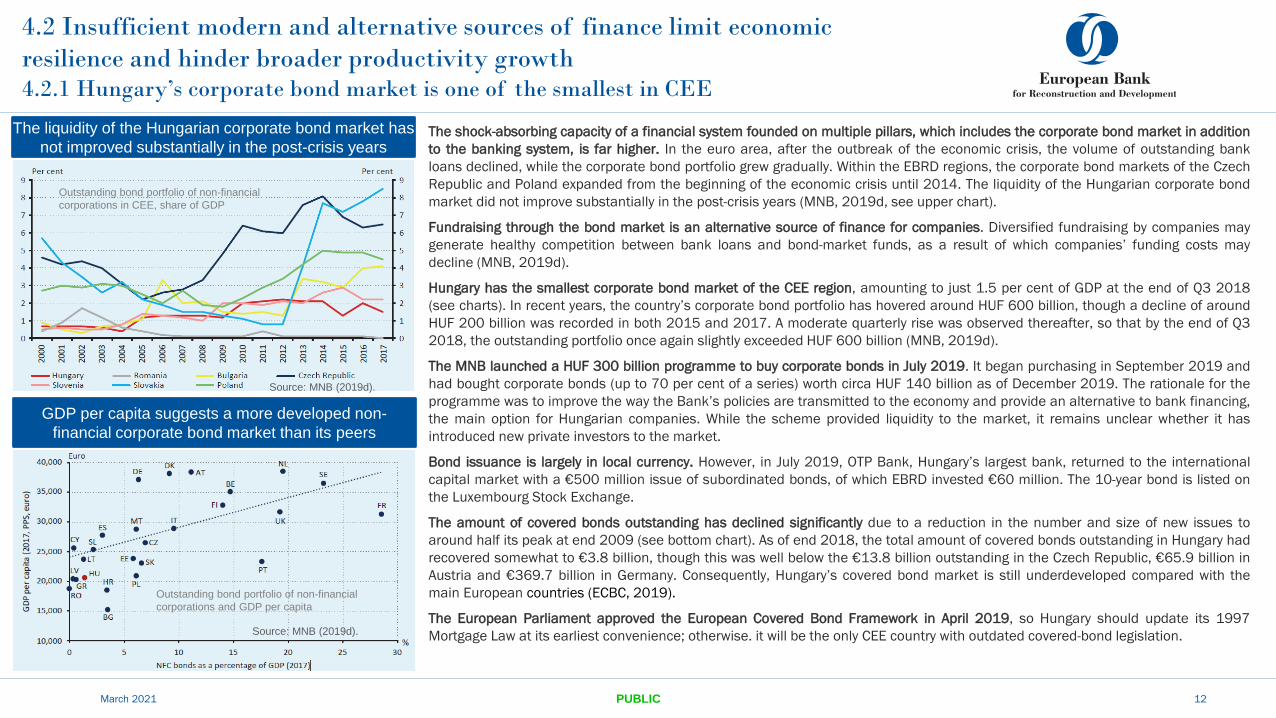
Republic and Poland expanded from the beginning of the economic crisis until 2014. The liquidity of the Hungarian corporate bond
market did not improve substantially in the post-crisis years (MNB, 2019d, see upper chart).
Fundraising through the bond market is an alternative source of finance for companies. Diversified fundraising by companies may
generate healthy competition between bank loans and bond-market funds, as a result of which companies’ funding costs may
decline (MNB, 2019d).
Hungary has the smallest corporate bond market of the CEE region, amounting to just 1.5 per cent of GDP at the end of Q3 2018
(see charts). In recent years, the country’s corporate bond portfolio has hovered around HUF 600 billion, though a decline of around
HUF 200 billion was recorded in both 2015 and 2017. A moderate quarterly rise was observed thereafter, so that by the end of Q3
2018, the outstanding portfolio once again slightly exceeded HUF 600 billion (MNB, 2019d).
The MNB launched a HUF 300 billion programme to buy corporate bonds in July 2019. It began purchasing in September 2019 and
had bought corporate bonds (up to 70 per cent of a series) worth circa HUF 140 billion as of December 2019. The rationale for the
programme was to improve the way the Bank’s policies are transmitted to the economy and provide an alternative to bank financing,
the main option for Hungarian companies. While the scheme provided liquidity to the market, it remains unclear whether it has
introduced new private investors to the market.
Bond issuance is largely in local currency. However, in July 2019, OTP Bank, Hungary’s largest bank, returned to the international
capital market with a €500 million issue of subordinated bonds, of which EBRD invested €60 million. The 10-year bond is listed on
the Luxembourg Stock Exchange.
The amount of covered bonds outstanding has declined significantly due to a reduction in the number and size of new issues to
around half its peak at end 2009 (see bottom chart). As of end 2018, the total amount of covered bonds outstanding in Hungary had
recovered somewhat to €3.8 billion, though this was well below the €13.8 billion outstanding in the Czech Republic, €65.9 billion in
Austria and €369.7 billion in Germany. Consequently, Hungary’s covered bond market is still underdeveloped compared with the
main European countries (ECBC, 2019).
The European Parliament approved the European Covered Bond Framework in April 2019, so Hungary should update its 1997
Mortgage Law at its earliest convenience; otherwise. it will be the only CEE country with outdated covered-bond legislation.
The liquidity of the Hungarian corporate bond market has
not improved substantially in the post-crisis years
GDP per capita suggests a more developed non-
financial corporate bond market than its peers
Source: MNB (2019d).
Source: MNB (2019d).
Outstanding bond portfolio of non-financial
corporations in CEE, share of GDP
Outstanding bond portfolio of non-financial
corporations and GDP per capita
13
4.2 Insufficient modern and alternative sources of finance limit economic
resilience and hinder broader productivity growth4.2.2 Capital-market funding for the private sector remains low
Hungary’s private sector continues to rely on commercial bank loans; funding through securities is practically non-existent. Wider use
of alternative sources of finance, such as covered bonds, private equity or capital markets, could support corporate development,
especially for firms struggling to access bank finance or keen to invest in innovation, green solutions or foreign expansion.
Private equity can be a useful source of external finance for companies. Perhaps more importantly, the active involvement of
private equity fund managers can help investee companies to reach new customers, operate more efficiently and improve their
management of cash and inventories. Private equity support can also help companies gain better access to credit (EBRD, 2015).
Only 1.3 per cent of all non-financial company liabilities are debt securities, among the lowest of its peers (Poland: 8 per cent,
Czech Republic: 7.1 per cent, Croatia: 2.1 per cent). One reason is that the banking sector has excess liquidity, enabling it to
provide cheap loan funding. Another is that the government securities market is crowding out the corporate bond market (see
section 4.3.3).
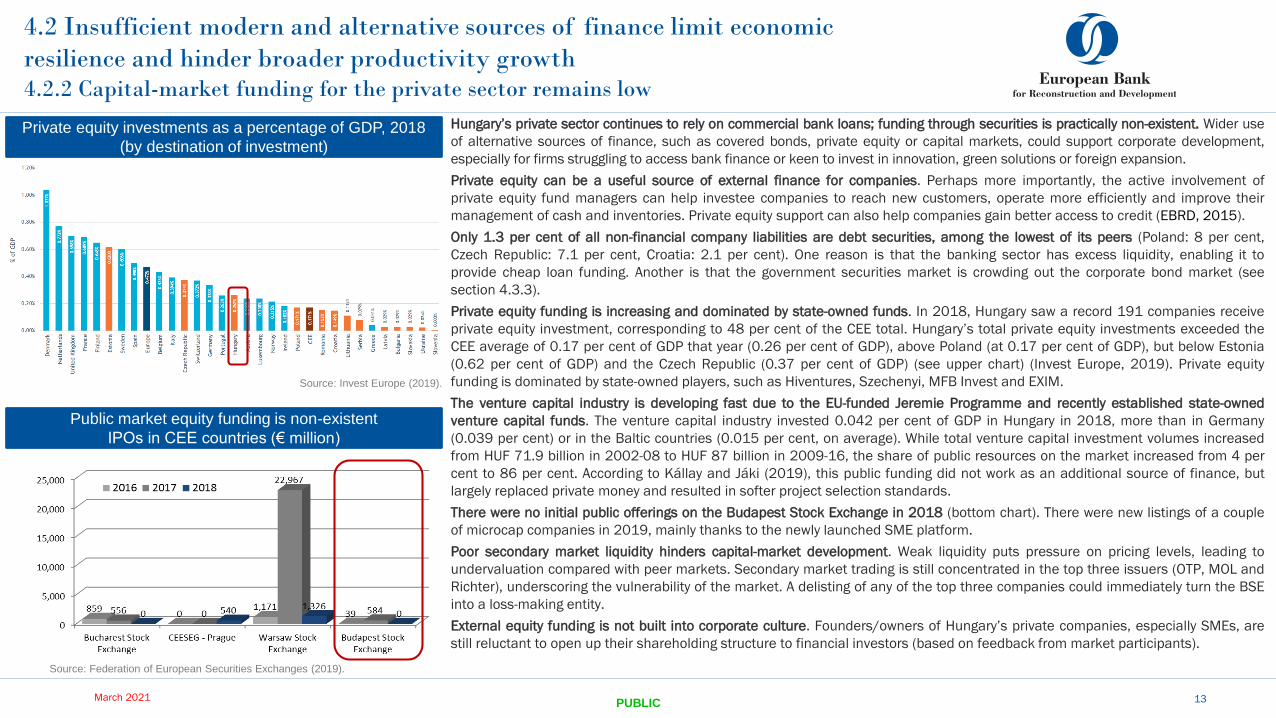
Private equity funding is increasing and dominated by state-owned funds. In 2018, Hungary saw a record 191 companies receive
private equity investment, corresponding to 48 per cent of the CEE total. Hungary’s total private equity investments exceeded the
CEE average of 0.17 per cent of GDP that year (0.26 per cent of GDP), above Poland (at 0.17 per cent of GDP), but below Estonia
(0.62 per cent of GDP) and the Czech Republic (0.37 per cent of GDP) (see upper chart) (Invest Europe, 2019). Private equity
funding is dominated by state-owned players, such as Hiventures, Szechenyi, MFB Invest and EXIM.
The venture capital industry is developing fast due to the EU-funded Jeremie Programme and recently established state-owned
venture capital funds. The venture capital industry invested 0.042 per cent of GDP in Hungary in 2018, more than in Germany
(0.039 per cent) or in the Baltic countries (0.015 per cent, on average). While total venture capital investment volumes increased
from HUF 71.9 billion in 2002-08 to HUF 87 billion in 2009-16, the share of public resources on the market increased from 4 per
cent to 86 per cent. According to Kállay and Jáki (2019), this public funding did not work as an additional source of finance, but
largely replaced private money and resulted in softer project selection standards.
There were no initial public offerings on the Budapest Stock Exchange in 2018 (bottom chart). There were new listings of a couple
of microcap companies in 2019, mainly thanks to the newly launched SME platform.
Poor secondary market liquidity hinders capital-market development. Weak liquidity puts pressure on pricing levels, leading to
undervaluation compared with peer markets. Secondary market trading is still concentrated in the top three issuers (OTP, MOL and
Richter), underscoring the vulnerability of the market. A delisting of any of the top three companies could immediately turn the BSE
into a loss-making entity.
External equity funding is not built into corporate culture. Founders/owners of Hungary’s private companies, especially SMEs, are
still reluctant to open up their shareholding structure to financial investors (based on feedback from market participants).
Public market equity funding is non-existent
IPOs in CEE countries (€ million)
Source: Federation of European Securities Exchanges (2019).
PUBLICMarch 2021
Private equity investments as a percentage of GDP, 2018
(by destination of investment)
Source: Invest Europe (2019).
14
The evolution of asset under management since the
nationalisation of the pension system Conservative asset structure
The nationalisation of Hungary’s mandatory pension funds
undermined the growth of the institutional investor base;
total assets of institutional investors (HUF billion)
10,21111,237
Source: MNB.
The role of equity instruments is marginal in funds’
portfolios; asset structure of investment funds (2018)
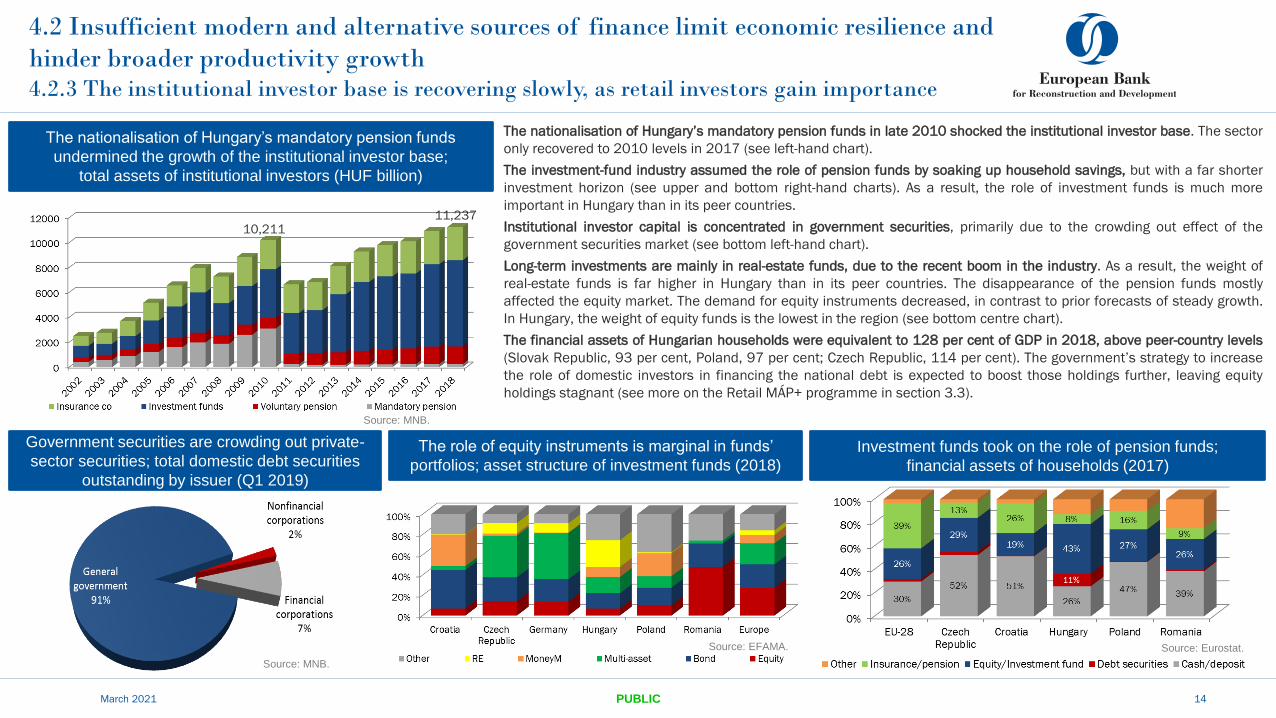
The nationalisation of Hungary’s mandatory pension funds in late 2010 shocked the institutional investor base. The sector
only recovered to 2010 levels in 2017 (see left-hand chart).
The investment-fund industry assumed the role of pension funds by soaking up household savings, but with a far shorter
investment horizon (see upper and bottom right-hand charts). As a result, the role of investment funds is much more
important in Hungary than in its peer countries.
Institutional investor capital is concentrated in government securities, primarily due to the crowding out effect of the
government securities market (see bottom left-hand chart).
Long-term investments are mainly in real-estate funds, due to the recent boom in the industry. As a result, the weight of
real-estate funds is far higher in Hungary than in its peer countries. The disappearance of the pension funds mostly
affected the equity market. The demand for equity instruments decreased, in contrast to prior forecasts of steady growth.
In Hungary, the weight of equity funds is the lowest in the region (see bottom centre chart).
The financial assets of Hungarian households were equivalent to 128 per cent of GDP in 2018, above peer-country levels
(Slovak Republic, 93 per cent, Poland, 97 per cent; Czech Republic, 114 per cent). The government’s strategy to increase
the role of domestic investors in financing the national debt is expected to boost those holdings further, leaving equity
holdings stagnant (see more on the Retail MÁP+ programme in section 3.3).
Source: EFAMA.
4.2 Insufficient modern and alternative sources of finance limit economic resilience and
hinder broader productivity growth4.2.3 The institutional investor base is recovering slowly, as retail investors gain importance
PUBLIC
Investment funds took on the role of pension funds;
financial assets of households (2017)
Source: Eurostat.
Government securities are crowding out private-
sector securities; total domestic debt securities
outstanding by issuer (Q1 2019)
Source: MNB.
March 2021
Number of
companies with
owners close to
retirement
15
4.2 Insufficient modern and alternative sources of finance limit economic resilience and
hinder broader productivity growth 4.2.4 There is no support ecosystem in place to manage the rising wave of succession issues
Corporate succession is one of the largest challenges facing the Hungarian economy. In the early 1990s, a private sector
emerged relatively quickly thanks to privatisation and the founding of new companies, with the result that many company
owners are now of a similar age, approaching retirement and having to decide what comes next for their businesses.
Many of the companies that fail to manage the generational transition will be unable to find a good alternative and could
face serious issues, such as a decline in profitability or productivity, financial problems or even bankruptcy.
About 75 per cent of Hungarian private companies are first-generation businesses, compared with 33 per cent globally.
Sixty-eight per cent of business owners believe that the same family or families will control their business in the long run,
but based on international succession statistics, only 30 per cent of family-owned businesses are successfully managed
by the second generation (Family Business Institute, Inc., 2016). Successors’ lack of experience and transitional know-
how, coupled with the absence of a support ecosystem, are likely to result in far lower success rates in Hungary.
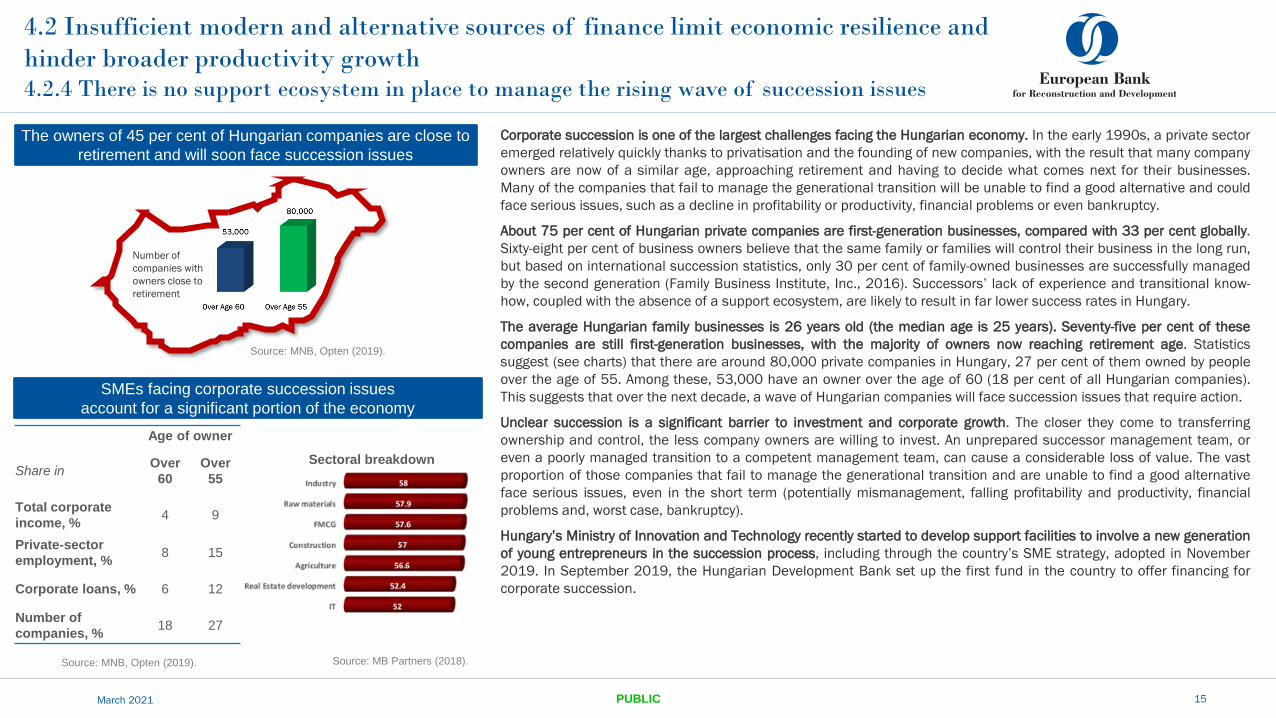
The average Hungarian family businesses is 26 years old (the median age is 25 years). Seventy-five per cent of these
companies are still first-generation businesses, with the majority of owners now reaching retirement age. Statistics
suggest (see charts) that there are around 80,000 private companies in Hungary, 27 per cent of them owned by people
over the age of 55. Among these, 53,000 have an owner over the age of 60 (18 per cent of all Hungarian companies).
This suggests that over the next decade, a wave of Hungarian companies will face succession issues that require action.
Unclear succession is a significant barrier to investment and corporate growth. The closer they come to transferring
ownership and control, the less company owners are willing to invest. An unprepared successor management team, or
even a poorly managed transition to a competent management team, can cause a considerable loss of value. The vast
proportion of those companies that fail to manage the generational transition and are unable to find a good alternative
face serious issues, even in the short term (potentially mismanagement, falling profitability and productivity, financial
problems and, worst case, bankruptcy).
Hungary’s Ministry of Innovation and Technology recently started to develop support facilities to involve a new generation
of young entrepreneurs in the succession process, including through the country’s SME strategy, adopted in November
2019. In September 2019, the Hungarian Development Bank set up the first fund in the country to offer financing for
corporate succession.
The owners of 45 per cent of Hungarian companies are close to
retirement and will soon face succession issues
SMEs facing corporate succession issues
account for a significant portion of the economy
Source: MNB, Opten (2019).
Source: MNB, Opten (2019).
PUBLICMarch 2021
Age of owner
Share inOver
60
Over
55
Total corporate
income, %4 9
Private-sector
employment, %8 15
Corporate loans, % 6 12
Number of
companies, %18 27
Source: MB Partners (2018).
Sectoral breakdown
9 19 2528
416 17
23
1722 25
19
84
10
27
1116 5
21
0
10
20
30
40
50
60
70
80
90
0
10
20
30
40
50
60
70
80
90
DK
SE FI NL
ES LT EE CZ
MT
LU UK
BE
SK PL
AT
FR PT IE CY
DE
GR IT LV HR
BG SI
RO HU
scorescore
Banking digitalisation sub-pillarPrivate sector loan volume / Staff expensesCore income / Number of employeesCost-to-incomeOperating expenses to total assets
4.2 Insufficient modern and alternative sources of finance limit economic
resilience and hinder broader productivity growth4.2.5 Hungary lies in the bottom tier of EU countries when it comes to digital banking
March 2021 PUBLIC 16
Hungary’s banking sector is classified as a digital
adopter
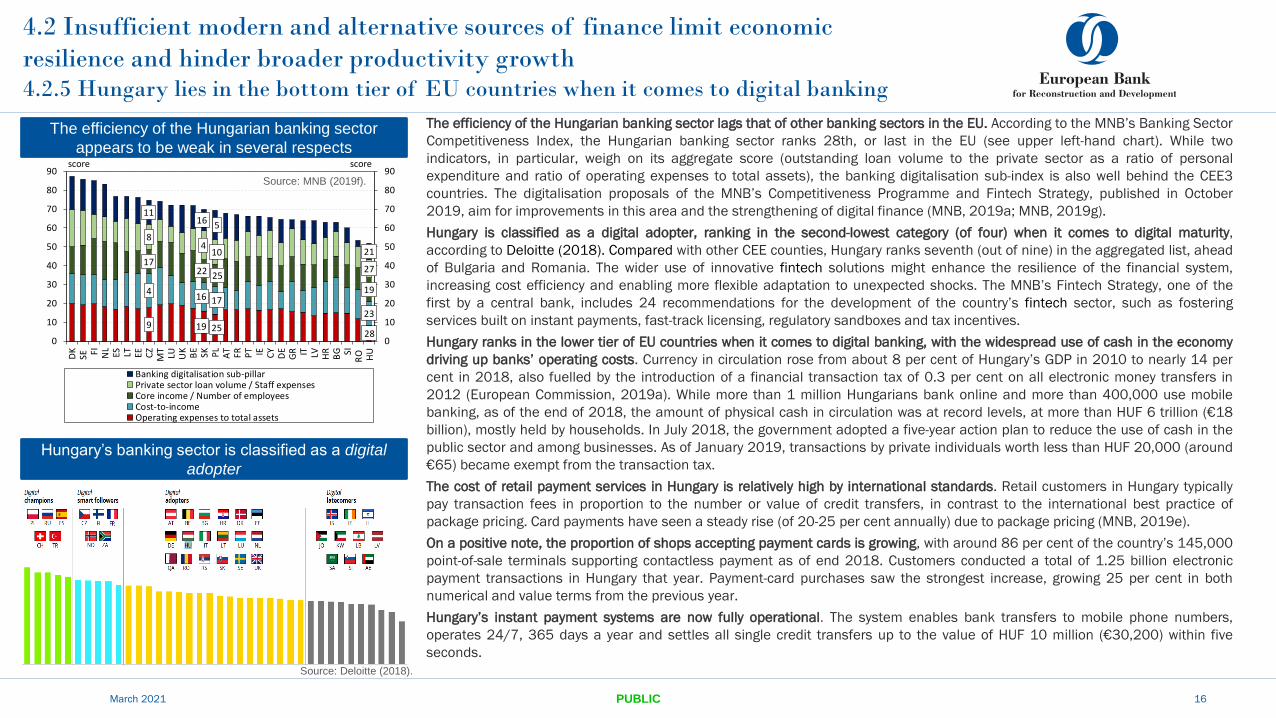
The efficiency of the Hungarian banking sector lags that of other banking sectors in the EU. According to the MNB’s Banking Sector
Competitiveness Index, the Hungarian banking sector ranks 28th, or last in the EU (see upper left-hand chart). While two
indicators, in particular, weigh on its aggregate score (outstanding loan volume to the private sector as a ratio of personal
expenditure and ratio of operating expenses to total assets), the banking digitalisation sub-index is also well behind the CEE3
countries. The digitalisation proposals of the MNB’s Competitiveness Programme and Fintech Strategy, published in October
2019, aim for improvements in this area and the strengthening of digital finance (MNB, 2019a; MNB, 2019g).
Hungary is classified as a digital adopter, ranking in the second-lowest category (of four) when it comes to digital maturity,
according to Deloitte (2018). Compared with other CEE counties, Hungary ranks seventh (out of nine) in the aggregated list, ahead
of Bulgaria and Romania. The wider use of innovative fintech solutions might enhance the resilience of the financial system,
increasing cost efficiency and enabling more flexible adaptation to unexpected shocks. The MNB’s Fintech Strategy, one of the
first by a central bank, includes 24 recommendations for the development of the country’s fintech sector, such as fostering
services built on instant payments, fast-track licensing, regulatory sandboxes and tax incentives.
Hungary ranks in the lower tier of EU countries when it comes to digital banking, with the widespread use of cash in the economy
driving up banks’ operating costs. Currency in circulation rose from about 8 per cent of Hungary’s GDP in 2010 to nearly 14 per
cent in 2018, also fuelled by the introduction of a financial transaction tax of 0.3 per cent on all electronic money transfers in
2012 (European Commission, 2019a). While more than 1 million Hungarians bank online and more than 400,000 use mobile
banking, as of the end of 2018, the amount of physical cash in circulation was at record levels, at more than HUF 6 trillion (€18
billion), mostly held by households. In July 2018, the government adopted a five-year action plan to reduce the use of cash in the
public sector and among businesses. As of January 2019, transactions by private individuals worth less than HUF 20,000 (around
€65) became exempt from the transaction tax.
The cost of retail payment services in Hungary is relatively high by international standards. Retail customers in Hungary typically
pay transaction fees in proportion to the number or value of credit transfers, in contrast to the international best practice of
package pricing. Card payments have seen a steady rise (of 20-25 per cent annually) due to package pricing (MNB, 2019e).
On a positive note, the proportion of shops accepting payment cards is growing, with around 86 per cent of the country’s 145,000
point-of-sale terminals supporting contactless payment as of end 2018. Customers conducted a total of 1.25 billion electronic
payment transactions in Hungary that year. Payment-card purchases saw the strongest increase, growing 25 per cent in both
numerical and value terms from the previous year.
Hungary’s instant payment systems are now fully operational. The system enables bank transfers to mobile phone numbers,
operates 24/7, 365 days a year and settles all single credit transfers up to the value of HUF 10 million (€30,200) within five
seconds.
Source: Deloitte (2018).
The efficiency of the Hungarian banking sector
appears to be weak in several respects
Source: MNB (2019f).
4.3 Ensuring adequate financing is a key issue in developing the green economy
and promoting environmental sustainability4.3.1 Demand-side interest in green products has soared, with Hungary’s first green government bond
and corporate issues both drawing significant interest
March 2021 PUBLIC 17
Hungary is vulnerable to climate change, according to the second National Climate Change Strategy (NES)
passed by parliament in late 2018 (Ministry of Innovation and Technology, 2018). It has high drought risk,
which could severely impact crop production, and some level of flooding risk. The NES strategy also sets out
Hungary’s decarbonisation roadmap. Key elements include promoting the replacement of fossil fuels,
increasing energy efficiency and enhancing energy saving, reducing the exploitation of natural resources and
developing the circular economy (Ministry of Innovation and Technology, 2018). The EU signed the Paris
Agreement on climate change in April 2016 and ratified it in October 2016. It has a binding target of at least a
40 per cent reduction in domestic greenhouse gas emissions by 2030 compared with 1990 levels. In line with
the EU’s commitment, Hungary submitted its integrated national energy and climate plan and national long-
term strategy to the European Commission in 2019. Ninety per cent of Hungary’s electricity generation is
expected to be emission free by 2030 and 100 per cent is projected to be emission free by 2050.
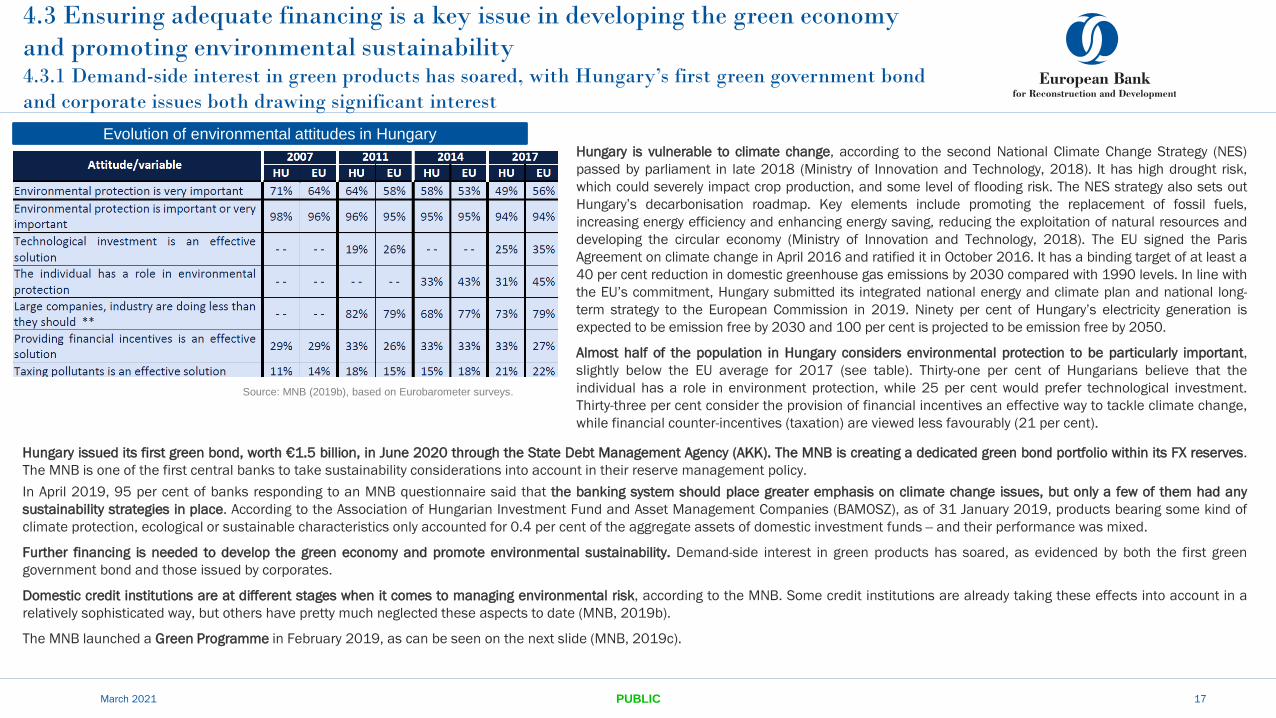
Almost half of the population in Hungary considers environmental protection to be particularly important,
slightly below the EU average for 2017 (see table). Thirty-one per cent of Hungarians believe that the
individual has a role in environment protection, while 25 per cent would prefer technological investment.
Thirty-three per cent consider the provision of financial incentives an effective way to tackle climate change,
while financial counter-incentives (taxation) are viewed less favourably (21 per cent).
Evolution of environmental attitudes in Hungary
Source: MNB (2019b), based on Eurobarometer surveys.
Hungary issued its first green bond, worth €1.5 billion, in June 2020 through the State Debt Management Agency (AKK). The MNB is creating a dedicated green bond portfolio within its FX reserves.
The MNB is one of the first central banks to take sustainability considerations into account in their reserve management policy.
In April 2019, 95 per cent of banks responding to an MNB questionnaire said that the banking system should place greater emphasis on climate change issues, but only a few of them had any
sustainability strategies in place. According to the Association of Hungarian Investment Fund and Asset Management Companies (BAMOSZ), as of 31 January 2019, products bearing some kind of
climate protection, ecological or sustainable characteristics only accounted for 0.4 per cent of the aggregate assets of domestic investment funds ‒ and their performance was mixed.
Further financing is needed to develop the green economy and promote environmental sustainability. Demand-side interest in green products has soared, as evidenced by both the first green
government bond and those issued by corporates.
Domestic credit institutions are at different stages when it comes to managing environmental risk, according to the MNB. Some credit institutions are already taking these effects into account in a
relatively sophisticated way, but others have pretty much neglected these aspects to date (MNB, 2019b).
The MNB launched a Green Programme in February 2019, as can be seen on the next slide (MNB, 2019c).
4.3 Ensuring adequate financing is a key issue in developing the green economy and
promoting environmental sustainability4.3.2 The MNB is creating a supportive environment for green finance in Hungary
March 2021 PUBLIC 18
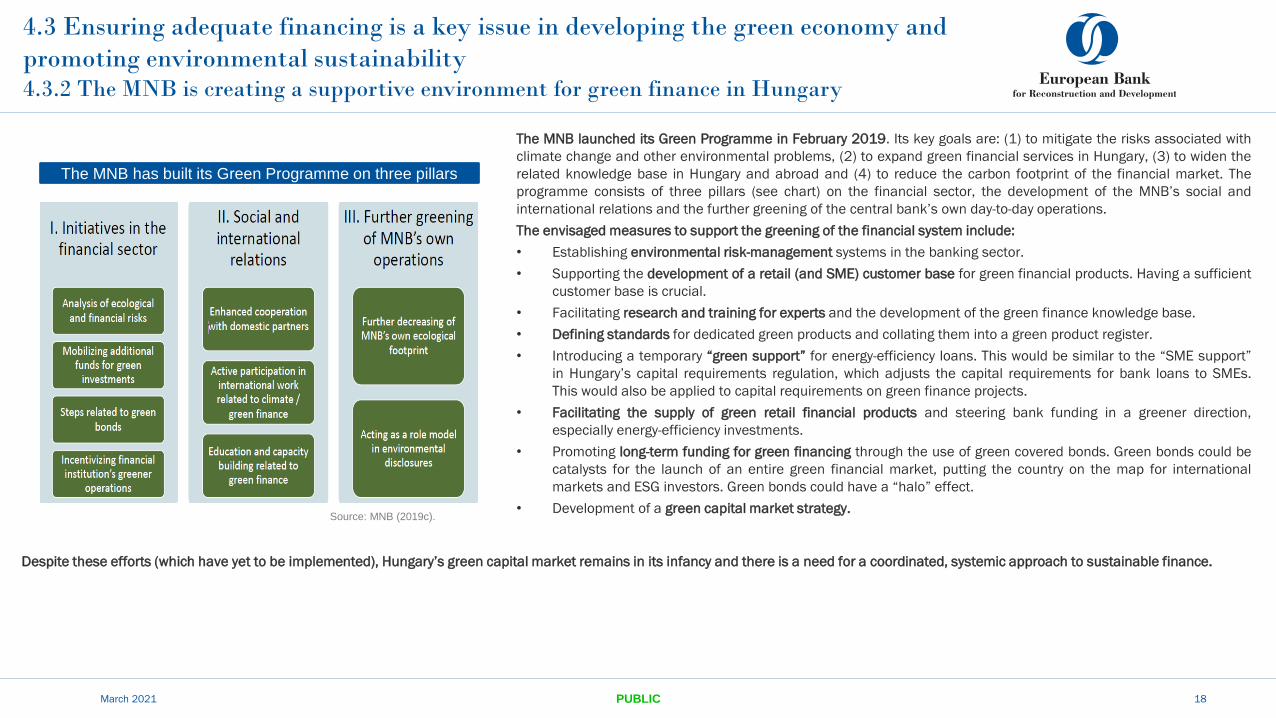
The MNB launched its Green Programme in February 2019. Its key goals are: (1) to mitigate the risks associated with
climate change and other environmental problems, (2) to expand green financial services in Hungary, (3) to widen the
related knowledge base in Hungary and abroad and (4) to reduce the carbon footprint of the financial market. The
programme consists of three pillars (see chart) on the financial sector, the development of the MNB’s social and
international relations and the further greening of the central bank’s own day-to-day operations.
The envisaged measures to support the greening of the financial system include:
• Establishing environmental risk-management systems in the banking sector.
• Supporting the development of a retail (and SME) customer base for green financial products. Having a sufficient
customer base is crucial.
• Facilitating research and training for experts and the development of the green finance knowledge base.
• Defining standards for dedicated green products and collating them into a green product register.
• Introducing a temporary “green support” for energy-efficiency loans. This would be similar to the “SME support”
in Hungary’s capital requirements regulation, which adjusts the capital requirements for bank loans to SMEs.
This would also be applied to capital requirements on green finance projects.
• Facilitating the supply of green retail financial products and steering bank funding in a greener direction,
especially energy-efficiency investments.
• Promoting long-term funding for green financing through the use of green covered bonds. Green bonds could be
catalysts for the launch of an entire green financial market, putting the country on the map for international
markets and ESG investors. Green bonds could have a “halo” effect.
• Development of a green capital market strategy.
The MNB has built its Green Programme on three pillars
Despite these efforts (which have yet to be implemented), Hungary’s green capital market remains in its infancy and there is a need for a coordinated, systemic approach to sustainable finance.
Source: MNB (2019c).
4.4 The institutions necessary for a sustainable market economy are strong in
principle, but weak in practice4.4.1 The business regulatory and institutional environment is no worse than its peers
March 2021 PUBLIC 19
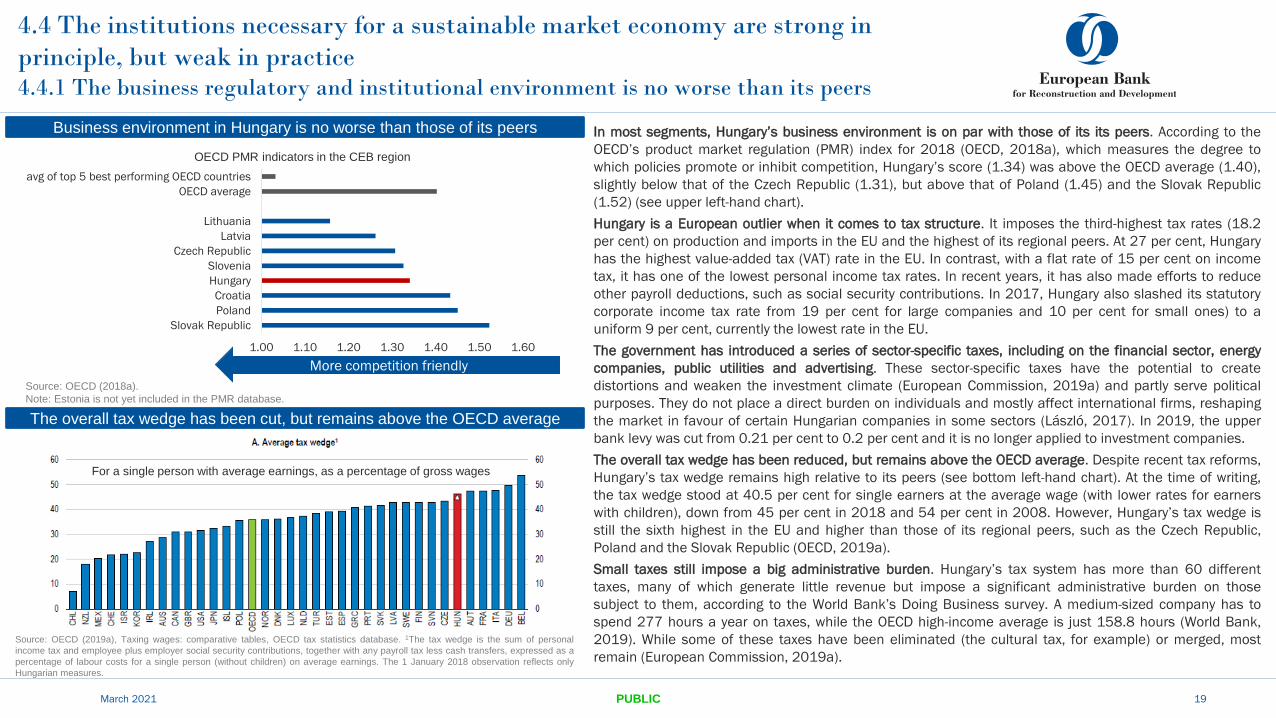
In most segments, Hungary’s business environment is on par with those of its its peers. According to the
OECD’s product market regulation (PMR) index for 2018 (OECD, 2018a), which measures the degree to
which policies promote or inhibit competition, Hungary’s score (1.34) was above the OECD average (1.40),
slightly below that of the Czech Republic (1.31), but above that of Poland (1.45) and the Slovak Republic
(1.52) (see upper left-hand chart).
Hungary is a European outlier when it comes to tax structure. It imposes the third-highest tax rates (18.2
per cent) on production and imports in the EU and the highest of its regional peers. At 27 per cent, Hungary
has the highest value-added tax (VAT) rate in the EU. In contrast, with a flat rate of 15 per cent on income
tax, it has one of the lowest personal income tax rates. In recent years, it has also made efforts to reduce
other payroll deductions, such as social security contributions. In 2017, Hungary also slashed its statutory
corporate income tax rate from 19 per cent for large companies and 10 per cent for small ones) to a
uniform 9 per cent, currently the lowest rate in the EU.
The government has introduced a series of sector-specific taxes, including on the financial sector, energy
companies, public utilities and advertising. These sector-specific taxes have the potential to create
distortions and weaken the investment climate (European Commission, 2019a) and partly serve political
purposes. They do not place a direct burden on individuals and mostly affect international firms, reshaping
the market in favour of certain Hungarian companies in some sectors (László, 2017). In 2019, the upper
bank levy was cut from 0.21 per cent to 0.2 per cent and it is no longer applied to investment companies.
The overall tax wedge has been reduced, but remains above the OECD average. Despite recent tax reforms,
Hungary’s tax wedge remains high relative to its peers (see bottom left-hand chart). At the time of writing,
the tax wedge stood at 40.5 per cent for single earners at the average wage (with lower rates for earners
with children), down from 45 per cent in 2018 and 54 per cent in 2008. However, Hungary’s tax wedge is
still the sixth highest in the EU and higher than those of its regional peers, such as the Czech Republic,
Poland and the Slovak Republic (OECD, 2019a).
Small taxes still impose a big administrative burden. Hungary’s tax system has more than 60 different
taxes, many of which generate little revenue but impose a significant administrative burden on those
subject to them, according to the World Bank’s Doing Business survey. A medium-sized company has to
spend 277 hours a year on taxes, while the OECD high-income average is just 158.8 hours (World Bank,
2019). While some of these taxes have been eliminated (the cultural tax, for example) or merged, most
remain (European Commission, 2019a).
The overall tax wedge has been cut, but remains above the OECD average
Business environment in Hungary is no worse than those of its peers
1.00 1.10 1.20 1.30 1.40 1.50 1.60
Slovak Republic
Poland
Croatia
Hungary
Slovenia
Czech Republic
Latvia
Lithuania
OECD average
avg of top 5 best performing OECD countries
Source: OECD (2018a).
Note: Estonia is not yet included in the PMR database.
OECD PMR indicators in the CEB region
More competition friendly
Source: OECD (2019a), Taxing wages: comparative tables, OECD tax statistics database. 1The tax wedge is the sum of personal
income tax and employee plus employer social security contributions, together with any payroll tax less cash transfers, expressed as a
percentage of labour costs for a single person (without children) on average earnings. The 1 January 2018 observation reflects only
Hungarian measures.
For a single person with average earnings, as a percentage of gross wages
4.4 The institutions necessary for a sustainable market economy
are strong in principle, but weak in practice4.4.2 More than half of public investment comes from EU funding, but with debatable effect
March 2021 PUBLIC 20
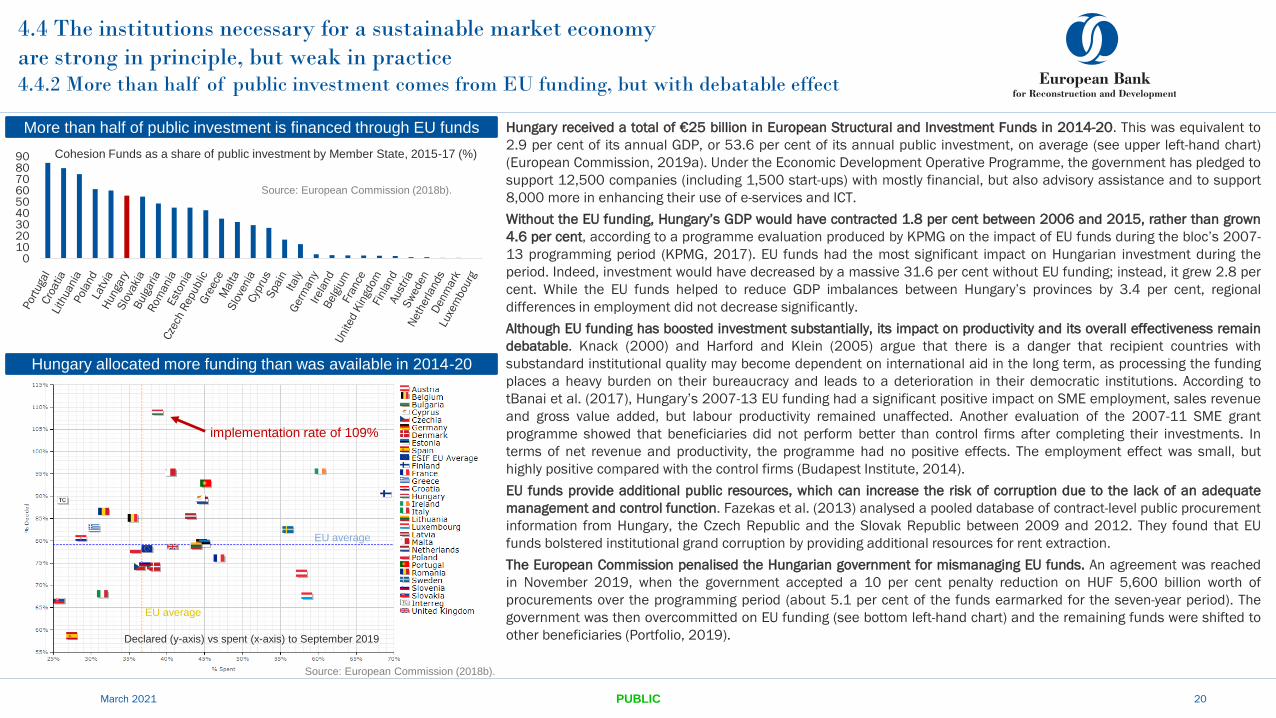
Hungary received a total of €25 billion in European Structural and Investment Funds in 2014-20. This was equivalent to
2.9 per cent of its annual GDP, or 53.6 per cent of its annual public investment, on average (see upper left-hand chart)
(European Commission, 2019a). Under the Economic Development Operative Programme, the government has pledged to
support 12,500 companies (including 1,500 start-ups) with mostly financial, but also advisory assistance and to support
8,000 more in enhancing their use of e-services and ICT.
Without the EU funding, Hungary’s GDP would have contracted 1.8 per cent between 2006 and 2015, rather than grown
4.6 per cent, according to a programme evaluation produced by KPMG on the impact of EU funds during the bloc’s 2007-
13 programming period (KPMG, 2017). EU funds had the most significant impact on Hungarian investment during the
period. Indeed, investment would have decreased by a massive 31.6 per cent without EU funding; instead, it grew 2.8 per
cent. While the EU funds helped to reduce GDP imbalances between Hungary’s provinces by 3.4 per cent, regional
differences in employment did not decrease significantly.
Although EU funding has boosted investment substantially, its impact on productivity and its overall effectiveness remain
debatable. Knack (2000) and Harford and Klein (2005) argue that there is a danger that recipient countries with
substandard institutional quality may become dependent on international aid in the long term, as processing the funding
places a heavy burden on their bureaucracy and leads to a deterioration in their democratic institutions. According to
tBanai et al. (2017), Hungary’s 2007-13 EU funding had a significant positive impact on SME employment, sales revenue
and gross value added, but labour productivity remained unaffected. Another evaluation of the 2007-11 SME grant
programme showed that beneficiaries did not perform better than control firms after completing their investments. In
terms of net revenue and productivity, the programme had no positive effects. The employment effect was small, but
highly positive compared with the control firms (Budapest Institute, 2014).
EU funds provide additional public resources, which can increase the risk of corruption due to the lack of an adequate
management and control function. Fazekas et al. (2013) analysed a pooled database of contract-level public procurement
information from Hungary, the Czech Republic and the Slovak Republic between 2009 and 2012. They found that EU
funds bolstered institutional grand corruption by providing additional resources for rent extraction.
The European Commission penalised the Hungarian government for mismanaging EU funds. An agreement was reached
in November 2019, when the government accepted a 10 per cent penalty reduction on HUF 5,600 billion worth of
procurements over the programming period (about 5.1 per cent of the funds earmarked for the seven-year period). The
government was then overcommitted on EU funding (see bottom left-hand chart) and the remaining funds were shifted to
other beneficiaries (Portfolio, 2019).
More than half of public investment is financed through EU funds
0102030405060708090
Source: European Commission (2018b).
Cohesion Funds as a share of public investment by Member State, 2015-17 (%)
Hungary allocated more funding than was available in 2014-20
EU average
EU average
implementation rate of 109%
Declared (y-axis) vs spent (x-axis) to September 2019
Source: European Commission (2018b).
4.4 The institutions necessary for a sustainable market economy are
strong in principle, but weak in practice4.4.3 Better regulation and anti-corruption efforts are needed
March 2021 PUBLIC 21
The National Anti-Corruption Plan 2015-18 had limited impact. While the anti-corruption framework primarily
focused on the integrity of public organisations and companies, there were no proposals to introduce further
reform mechanisms or to strengthen prosecutorial efforts. Investigations into high-level corruption cases remain
few and far between and the government is hesitant to join the European Public Prosecutor's Office (European
Commission, 2019a; Ministry of Justice, 2018). The Ministry of Interior announced a new anti-corruption strategy
for 2019-22, but has not published it as yet.
Hungary has no comprehensive lobbying regulation, making it more difficult to distinguish between lobbying and
undue influence. The first act on lobbying in Hungary was enacted in 2006 and repealed in 2011. There is a law
on legislative lobbying, as well as a government decree on integrity measures in public administration, adopted in
February 2013. This regulation does not require the mandatory registration of lobbyists or the disclosure of
contacts with lobbyists to an independent control body. Public representatives and bodies are not expected to
publicly disclose lobbying contacts. Furthermore, there is no mechanism for monitoring the implementation of the
obligations that do exist (European Commission, 2014).
A whistleblowers act was adopted in October 2013, aimed at strengthening the protection of whistleblowers,
primarily by introducing a system of electronic reporting. Requests that the person reporting the crime provide
his/her name do not ensure anonymity, however. Despite original plans, the government also has not established
an independent public body to effectively protect whistleblowers.
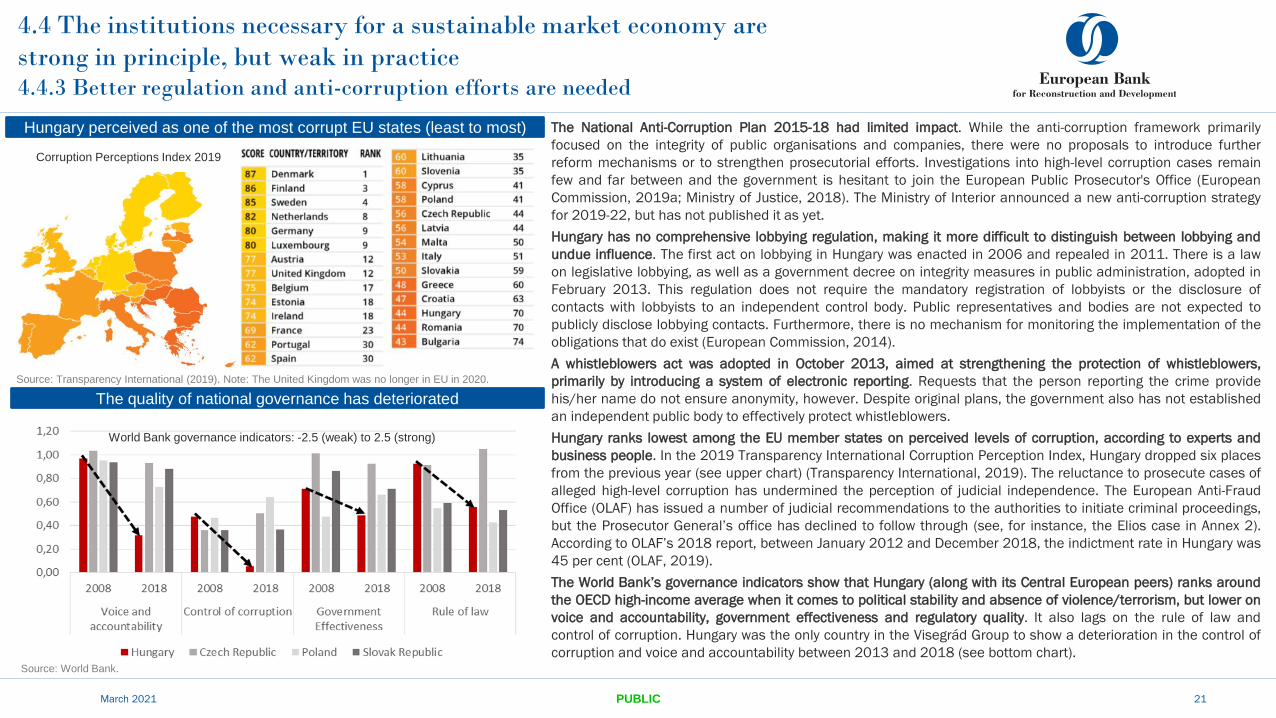
Hungary ranks lowest among the EU member states on perceived levels of corruption, according to experts and
business people. In the 2019 Transparency International Corruption Perception Index, Hungary dropped six places
from the previous year (see upper chart) (Transparency International, 2019). The reluctance to prosecute cases of
alleged high-level corruption has undermined the perception of judicial independence. The European Anti-Fraud
Office (OLAF) has issued a number of judicial recommendations to the authorities to initiate criminal proceedings,
but the Prosecutor General’s office has declined to follow through (see, for instance, the Elios case in Annex 2).
According to OLAF’s 2018 report, between January 2012 and December 2018, the indictment rate in Hungary was
45 per cent (OLAF, 2019).
The World Bank’s governance indicators show that Hungary (along with its Central European peers) ranks around
the OECD high-income average when it comes to political stability and absence of violence/terrorism, but lower on
voice and accountability, government effectiveness and regulatory quality. It also lags on the rule of law and
control of corruption. Hungary was the only country in the Visegrád Group to show a deterioration in the control of
corruption and voice and accountability between 2013 and 2018 (see bottom chart).
Hungary perceived as one of the most corrupt EU states (least to most)
Source: Transparency International (2019). Note: The United Kingdom was no longer in EU in 2020.
The quality of national governance has deteriorated
Source: World Bank.
World Bank governance indicators: -2.5 (weak) to 2.5 (strong)
Corruption Perceptions Index 2019
4.4 The institutions necessary for a sustainable market economy are strong in
principle, but weak in practice4.4.4 Developing the business environment and promoting entrepreneurship
In recent years, various Hungarian government agencies have launched plans to improve
competitiveness and productivity and to boost entrepreneurship. These include the MNB’s 180
Steps for the Sustainable Convergence of the Hungarian Economy (MNB, 2018), the 330-point
Competitiveness Programme (MNB, 2019a) and the Programme for a More Competitive Hungary
(NCC, 2019) published by the National Competitiveness Council and the Ministry of Finance. The
government has also issued a series of sector-specific policy documents (see below and Section
4.2.2).
The government wants to reindustrialise Hungary. The government’s Directions for Innovative
Industrial Development, or the Irinyi Plan, published in February 2016, envisages Hungary as
“the EU Member State where industrial production has the largest share within the gross national
product” (Ministry of National Economy, 2016). The government proposes doing so by
maintaining Hungary’s key role in motor-vehicle manufacturing and by increasing its presence in
electronics, logistics and the health industry. Key goals and tools include the application of new
and digital technologies, the use of efficient production technologies, a reduction in geographical
inequalities, increased employment and the creation of jobs, and the development of physical
and human capital (Ministry of National Economy, 2016).
The 2014-20 public-service strategy includes developing the organisational framework of a
service-oriented public administration, improving public administration human-resource
management and improving the quality of public services and e-governance (Government of
Hungary, 2015a).
The new 2019-30 export strategy targets a 50 per cent increase in the share of exporting SMEs
and product and customer base diversification, also to countries outside the EU. Hungary also
aims to integrate domestic SMEs into global value chains, create the region’s fastest and most
market-oriented export financing system and build internationally successful Hungarian brands
(Ministry of Foreign Affairs and Trade, 2019).
March 2021 PUBLIC 22
To counteract a decline in corporate credit, the MNB has been introducing various subsidised
lending products since April 2013, including several Funding for Growth Schemes. At the
beginning of 2019, it launched another programme, the Funding for Growth Scheme Fix (FGSfix),
aimed at increasing the availability of predictable, fixed-rate loan products to enhance SME
investment. In July 2019, the MNB launched a new HUF 300 billion (€930 million) corporate
bond-buying scheme (up to 70 per cent of a series). While it has provided liquidity to the market, it
remains unclear whether it will bring new private investors to the market. In parallel, the central
bank continues to run its market-based lending scheme, aimed at enhancing bank lending to
small firms, while public development banks offer financial support through loans and credit
guarantees. With private lending continuing to recover, the extent of public intervention in the
bank credit market may crowd out market lending. The abundance of competing financing
schemes also creates incentives for firms to seek out funds with the fewest strings attached,
reducing demand for better-monitored programmes (Kállay, 2014).
The proliferation of the strategies and programmes proposed by various agencies over different
timeframes raises questions over communication and coordination. There has also been very
little public-sector monitoring and evaluation of the progress of those already in place.
Despite these government efforts, Hungarian productivity growth remains sluggish.
Notwithstanding the many programmes to increase competitiveness and productivity over the last
10 years, the country’s productivity growth has been roughly on a par with that of the EU. EU
average productivity (measured as GDP per hour worked) increased 8 per cent between 2010
and 2018, while Hungary’s increased 9.3 per cent. This is a significantly lower increase than
those reported by its regional peers (the Czech Republic, at 12.5 per cent, Poland, at 26.7 per
cent and the Slovak Republic, at 19.9 per cent). Consequently, Hungarian GDP per hour is one of
the lowest in the EU and lower than all of its regional. peers (OECD, 2019b).
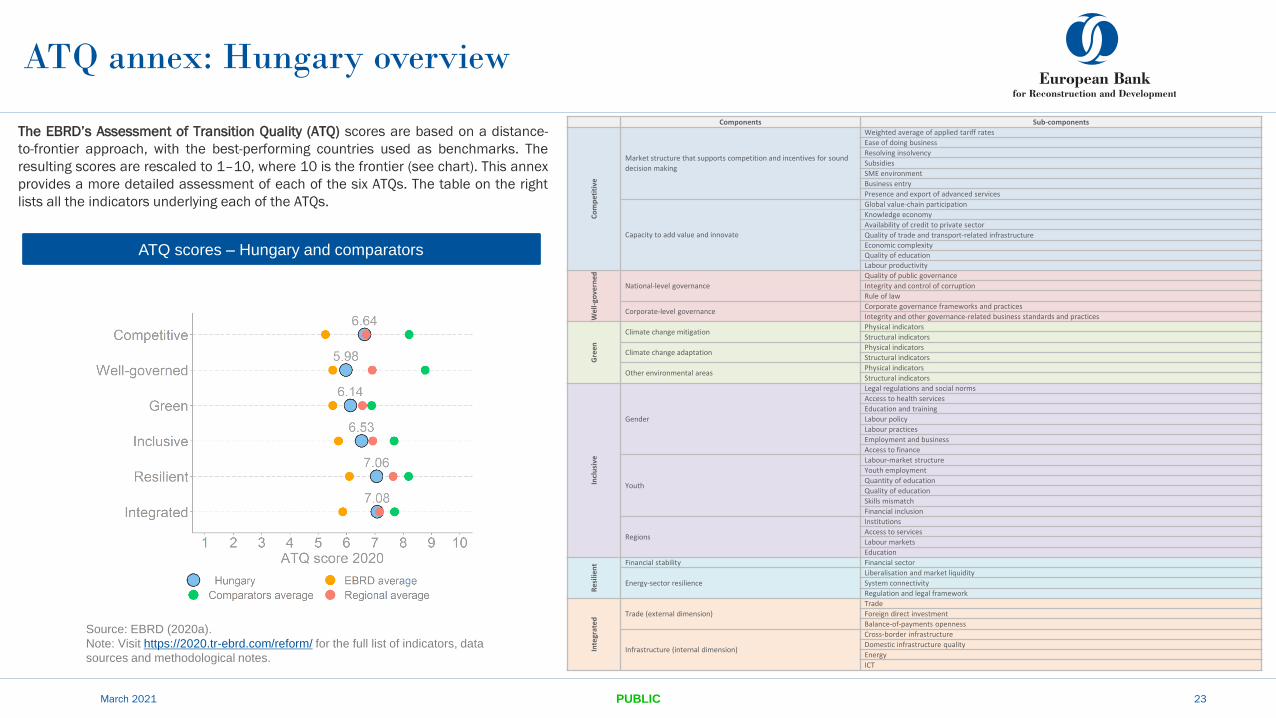
ATQ annex: Hungary overview
March 2021 PUBLIC 23
ATQ scores – Hungary and comparators
The EBRD’s Assessment of Transition Quality (ATQ) scores are based on a distance-
to-frontier approach, with the best-performing countries used as benchmarks. The
resulting scores are rescaled to 1–10, where 10 is the frontier (see chart). This annex
provides a more detailed assessment of each of the six ATQs. The table on the right
lists all the indicators underlying each of the ATQs.
Components Sub-components
Co
mp
etit
ive
Market structure that supports competition and incentives for sound
decision making
Weighted average of applied tariff rates
Ease of doing business
Resolving insolvency
Subsidies
SME environment
Business entry
Presence and export of advanced services
Capacity to add value and innovate
Global value-chain participation
Knowledge economy
Availability of credit to private sector
Quality of trade and transport-related infrastructure
Economic complexity
Quality of education
Labour productivity
Wel
l-go
vern
ed
National-level governance
Quality of public governance
Integrity and control of corruption
Rule of law
Corporate-level governanceCorporate governance frameworks and practices
Integrity and other governance-related business standards and practices
Gre
en
Climate change mitigationPhysical indicators
Structural indicators
Climate change adaptationPhysical indicators
Structural indicators
Other environmental areasPhysical indicators
Structural indicators
Incl
usi
ve
Gender
Legal regulations and social norms
Access to health services
Education and training
Labour policy
Labour practices
Employment and business
Access to finance
Youth
Labour-market structure
Youth employment
Quantity of education
Quality of education
Skills mismatch
Financial inclusion
Regions
Institutions
Access to services
Labour markets
Education
Res
ilien
t Financial stability Financial sector
Energy-sector resilience
Liberalisation and market liquidity
System connectivity
Regulation and legal frameworkIn
tegr
ated
Trade (external dimension)
Trade
Foreign direct investment
Balance-of-payments openness
Infrastructure (internal dimension)
Cross-border infrastructure
Domestic infrastructure quality
Energy
ICT
Source: EBRD (2020a).
Note: Visit https://2020.tr-ebrd.com/reform/ for the full list of indicators, data
sources and methodological notes.
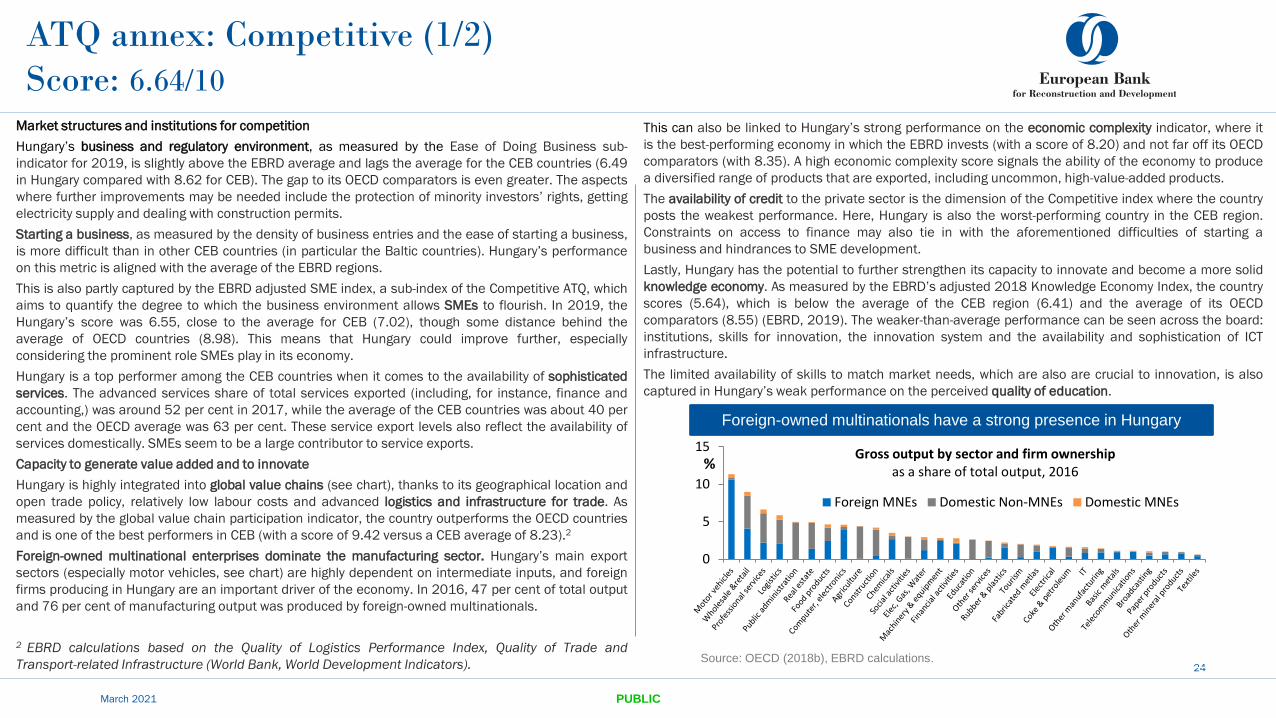
ATQ annex: Competitive (1/2)
Score: 6.64/10
Market structures and institutions for competition
Hungary’s business and regulatory environment, as measured by the Ease of Doing Business sub-
indicator for 2019, is slightly above the EBRD average and lags the average for the CEB countries (6.49
in Hungary compared with 8.62 for CEB). The gap to its OECD comparators is even greater. The aspects
where further improvements may be needed include the protection of minority investors’ rights, getting
electricity supply and dealing with construction permits.
Starting a business, as measured by the density of business entries and the ease of starting a business,
is more difficult than in other CEB countries (in particular the Baltic countries). Hungary’s performance
on this metric is aligned with the average of the EBRD regions.
This is also partly captured by the EBRD adjusted SME index, a sub-index of the Competitive ATQ, which
aims to quantify the degree to which the business environment allows SMEs to flourish. In 2019, the
Hungary’s score was 6.55, close to the average for CEB (7.02), though some distance behind the
average of OECD countries (8.98). This means that Hungary could improve further, especially
considering the prominent role SMEs play in its economy.
Hungary is a top performer among the CEB countries when it comes to the availability of sophisticated
services. The advanced services share of total services exported (including, for instance, finance and
accounting,) was around 52 per cent in 2017, while the average of the CEB countries was about 40 per
cent and the OECD average was 63 per cent. These service export levels also reflect the availability of
services domestically. SMEs seem to be a large contributor to service exports.
Capacity to generate value added and to innovate
Hungary is highly integrated into global value chains (see chart), thanks to its geographical location and
open trade policy, relatively low labour costs and advanced logistics and infrastructure for trade. As
measured by the global value chain participation indicator, the country outperforms the OECD countries
and is one of the best performers in CEB (with a score of 9.42 versus a CEB average of 8.23).2
Foreign-owned multinational enterprises dominate the manufacturing sector. Hungary’s main export
sectors (especially motor vehicles, see chart) are highly dependent on intermediate inputs, and foreign
firms producing in Hungary are an important driver of the economy. In 2016, 47 per cent of total output
and 76 per cent of manufacturing output was produced by foreign-owned multinationals.
2 EBRD calculations based on the Quality of Logistics Performance Index, Quality of Trade and
Transport-related Infrastructure (World Bank, World Development Indicators).
March 2021 PUBLIC
24
This can also be linked to Hungary’s strong performance on the economic complexity indicator, where it
is the best-performing economy in which the EBRD invests (with a score of 8.20) and not far off its OECD
comparators (with 8.35). A high economic complexity score signals the ability of the economy to produce
a diversified range of products that are exported, including uncommon, high-value-added products.
The availability of credit to the private sector is the dimension of the Competitive index where the country
posts the weakest performance. Here, Hungary is also the worst-performing country in the CEB region.
Constraints on access to finance may also tie in with the aforementioned difficulties of starting a
business and hindrances to SME development.
Lastly, Hungary has the potential to further strengthen its capacity to innovate and become a more solid
knowledge economy. As measured by the EBRD’s adjusted 2018 Knowledge Economy Index, the country
scores (5.64), which is below the average of the CEB region (6.41) and the average of its OECD
comparators (8.55) (EBRD, 2019). The weaker-than-average performance can be seen across the board:
institutions, skills for innovation, the innovation system and the availability and sophistication of ICT
infrastructure.
The limited availability of skills to match market needs, which are also are crucial to innovation, is also
captured in Hungary’s weak performance on the perceived quality of education.
0
5
10
15%
Gross output by sector and firm ownershipas a share of total output, 2016
Foreign MNEs Domestic Non-MNEs Domestic MNEs
Source: OECD (2018b), EBRD calculations.
Foreign-owned multinationals have a strong presence in Hungary
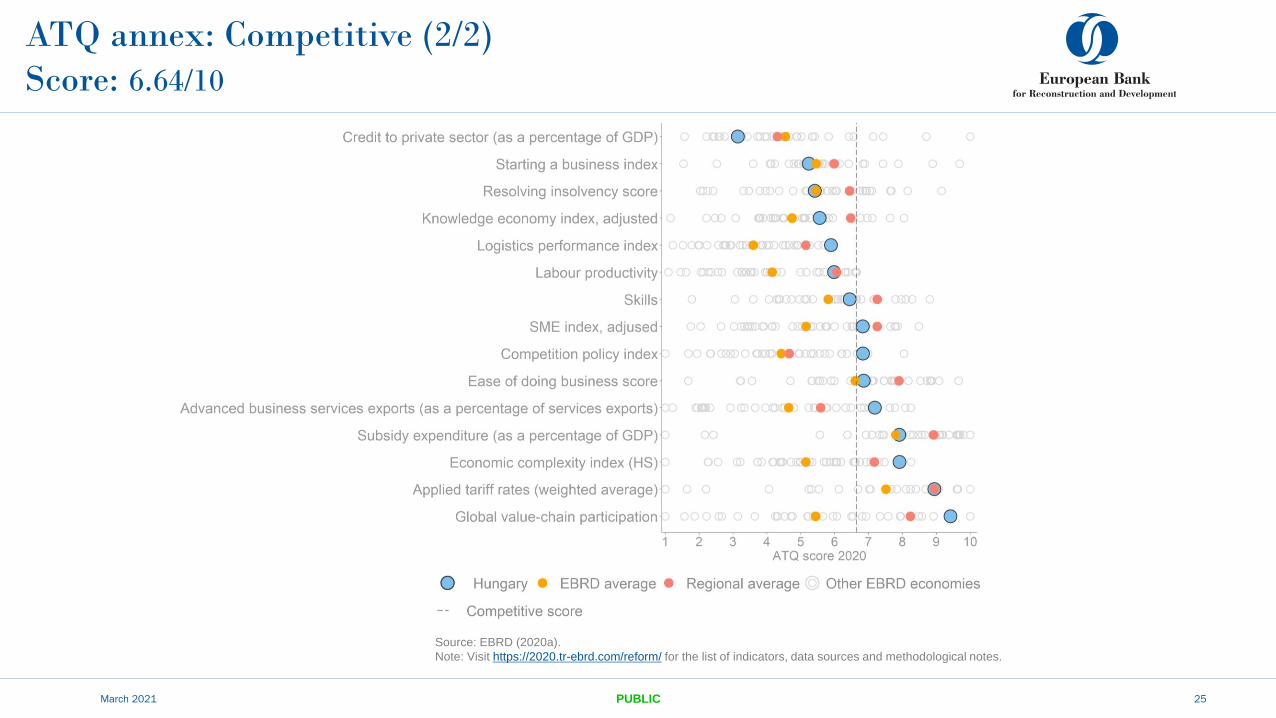
ATQ annex: Competitive (2/2)
Score: 6.64/10
March 2021 PUBLIC 25
Source: EBRD (2020a).
Note: Visit https://2020.tr-ebrd.com/reform/ for the list of indicators, data sources and methodological notes.
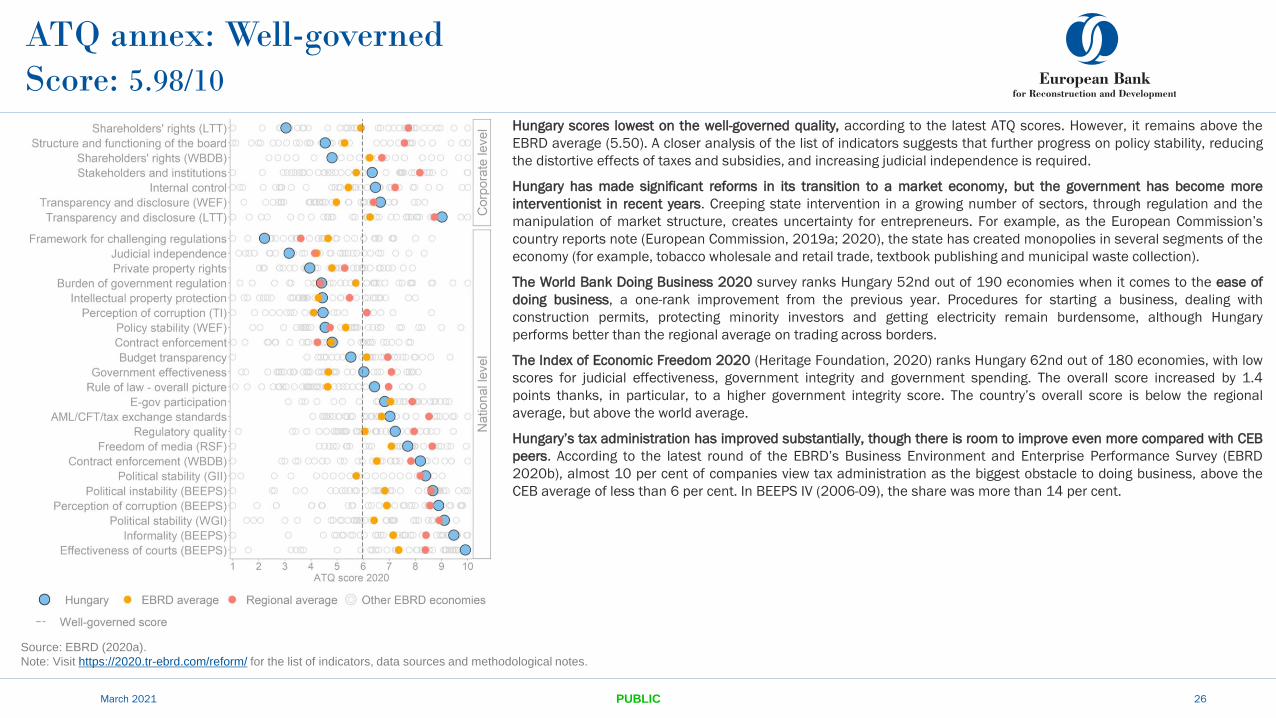
ATQ annex: Well-governed
Score: 5.98/10
March 2021 PUBLIC 26
Hungary scores lowest on the well-governed quality, according to the latest ATQ scores. However, it remains above the
EBRD average (5.50). A closer analysis of the list of indicators suggests that further progress on policy stability, reducing
the distortive effects of taxes and subsidies, and increasing judicial independence is required.
Hungary has made significant reforms in its transition to a market economy, but the government has become more
interventionist in recent years. Creeping state intervention in a growing number of sectors, through regulation and the
manipulation of market structure, creates uncertainty for entrepreneurs. For example, as the European Commission’s
country reports note (European Commission, 2019a; 2020), the state has created monopolies in several segments of the
economy (for example, tobacco wholesale and retail trade, textbook publishing and municipal waste collection).
The World Bank Doing Business 2020 survey ranks Hungary 52nd out of 190 economies when it comes to the ease of
doing business, a one-rank improvement from the previous year. Procedures for starting a business, dealing with
construction permits, protecting minority investors and getting electricity remain burdensome, although Hungary
performs better than the regional average on trading across borders.
The Index of Economic Freedom 2020 (Heritage Foundation, 2020) ranks Hungary 62nd out of 180 economies, with low
scores for judicial effectiveness, government integrity and government spending. The overall score increased by 1.4
points thanks, in particular, to a higher government integrity score. The country’s overall score is below the regional
average, but above the world average.
Hungary’s tax administration has improved substantially, though there is room to improve even more compared with CEB
peers. According to the latest round of the EBRD’s Business Environment and Enterprise Performance Survey (EBRD
2020b), almost 10 per cent of companies view tax administration as the biggest obstacle to doing business, above the
CEB average of less than 6 per cent. In BEEPS IV (2006-09), the share was more than 14 per cent.
Source: EBRD (2020a).
Note: Visit https://2020.tr-ebrd.com/reform/ for the list of indicators, data sources and methodological notes.
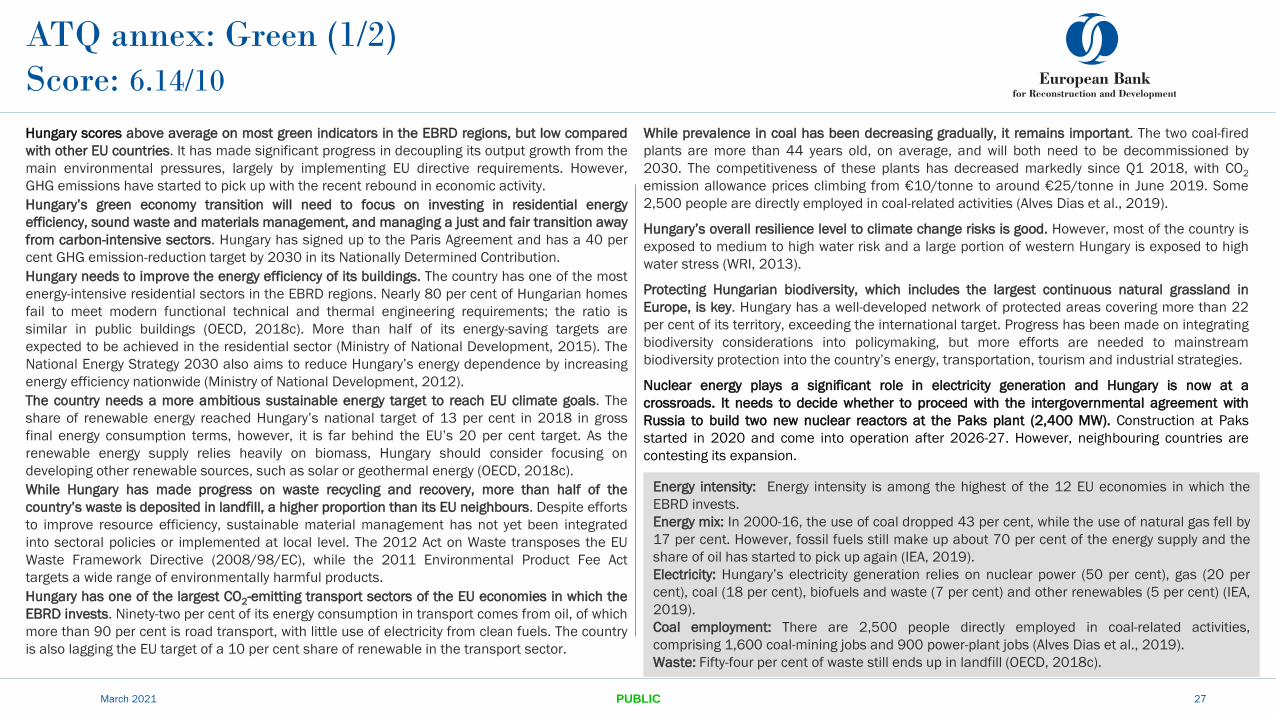
ATQ annex: Green (1/2)
Score: 6.14/10
Hungary scores above average on most green indicators in the EBRD regions, but low compared
with other EU countries. It has made significant progress in decoupling its output growth from the
main environmental pressures, largely by implementing EU directive requirements. However,
GHG emissions have started to pick up with the recent rebound in economic activity.
Hungary’s green economy transition will need to focus on investing in residential energy
efficiency, sound waste and materials management, and managing a just and fair transition away
from carbon-intensive sectors. Hungary has signed up to the Paris Agreement and has a 40 per
cent GHG emission-reduction target by 2030 in its Nationally Determined Contribution.
Hungary needs to improve the energy efficiency of its buildings. The country has one of the most
energy-intensive residential sectors in the EBRD regions. Nearly 80 per cent of Hungarian homes
fail to meet modern functional technical and thermal engineering requirements; the ratio is
similar in public buildings (OECD, 2018c). More than half of its energy-saving targets are
expected to be achieved in the residential sector (Ministry of National Development, 2015). The
National Energy Strategy 2030 also aims to reduce Hungary’s energy dependence by increasing
energy efficiency nationwide (Ministry of National Development, 2012).
The country needs a more ambitious sustainable energy target to reach EU climate goals. The
share of renewable energy reached Hungary’s national target of 13 per cent in 2018 in gross
final energy consumption terms, however, it is far behind the EU’s 20 per cent target. As the
renewable energy supply relies heavily on biomass, Hungary should consider focusing on
developing other renewable sources, such as solar or geothermal energy (OECD, 2018c).
While Hungary has made progress on waste recycling and recovery, more than half of the
country’s waste is deposited in landfill, a higher proportion than its EU neighbours. Despite efforts
to improve resource efficiency, sustainable material management has not yet been integrated
into sectoral policies or implemented at local level. The 2012 Act on Waste transposes the EU
Waste Framework Directive (2008/98/EC), while the 2011 Environmental Product Fee Act
targets a wide range of environmentally harmful products.
Hungary has one of the largest CO2-emitting transport sectors of the EU economies in which the
EBRD invests. Ninety-two per cent of its energy consumption in transport comes from oil, of which
more than 90 per cent is road transport, with little use of electricity from clean fuels. The country
is also lagging the EU target of a 10 per cent share of renewable in the transport sector.
March 2021 PUBLIC 27
While prevalence in coal has been decreasing gradually, it remains important. The two coal-fired
plants are more than 44 years old, on average, and will both need to be decommissioned by
2030. The competitiveness of these plants has decreased markedly since Q1 2018, with CO2
emission allowance prices climbing from €10/tonne to around €25/tonne in June 2019. Some
2,500 people are directly employed in coal-related activities (Alves Dias et al., 2019).
Hungary’s overall resilience level to climate change risks is good. However, most of the country is
exposed to medium to high water risk and a large portion of western Hungary is exposed to high
water stress (WRI, 2013).
Protecting Hungarian biodiversity, which includes the largest continuous natural grassland in
Europe, is key. Hungary has a well-developed network of protected areas covering more than 22
per cent of its territory, exceeding the international target. Progress has been made on integrating
biodiversity considerations into policymaking, but more efforts are needed to mainstream
biodiversity protection into the country’s energy, transportation, tourism and industrial strategies.
Nuclear energy plays a significant role in electricity generation and Hungary is now at a
crossroads. It needs to decide whether to proceed with the intergovernmental agreement with
Russia to build two new nuclear reactors at the Paks plant (2,400 MW). Construction at Paks
started in 2020 and come into operation after 2026-27. However, neighbouring countries are
contesting its expansion.
Energy intensity: Energy intensity is among the highest of the 12 EU economies in which the
EBRD invests.
Energy mix: In 2000-16, the use of coal dropped 43 per cent, while the use of natural gas fell by
17 per cent. However, fossil fuels still make up about 70 per cent of the energy supply and the
share of oil has started to pick up again (IEA, 2019).
Electricity: Hungary’s electricity generation relies on nuclear power (50 per cent), gas (20 per
cent), coal (18 per cent), biofuels and waste (7 per cent) and other renewables (5 per cent) (IEA,
2019).
Coal employment: There are 2,500 people directly employed in coal-related activities,
comprising 1,600 coal-mining jobs and 900 power-plant jobs (Alves Dias et al., 2019).
Waste: Fifty-four per cent of waste still ends up in landfill (OECD, 2018c).
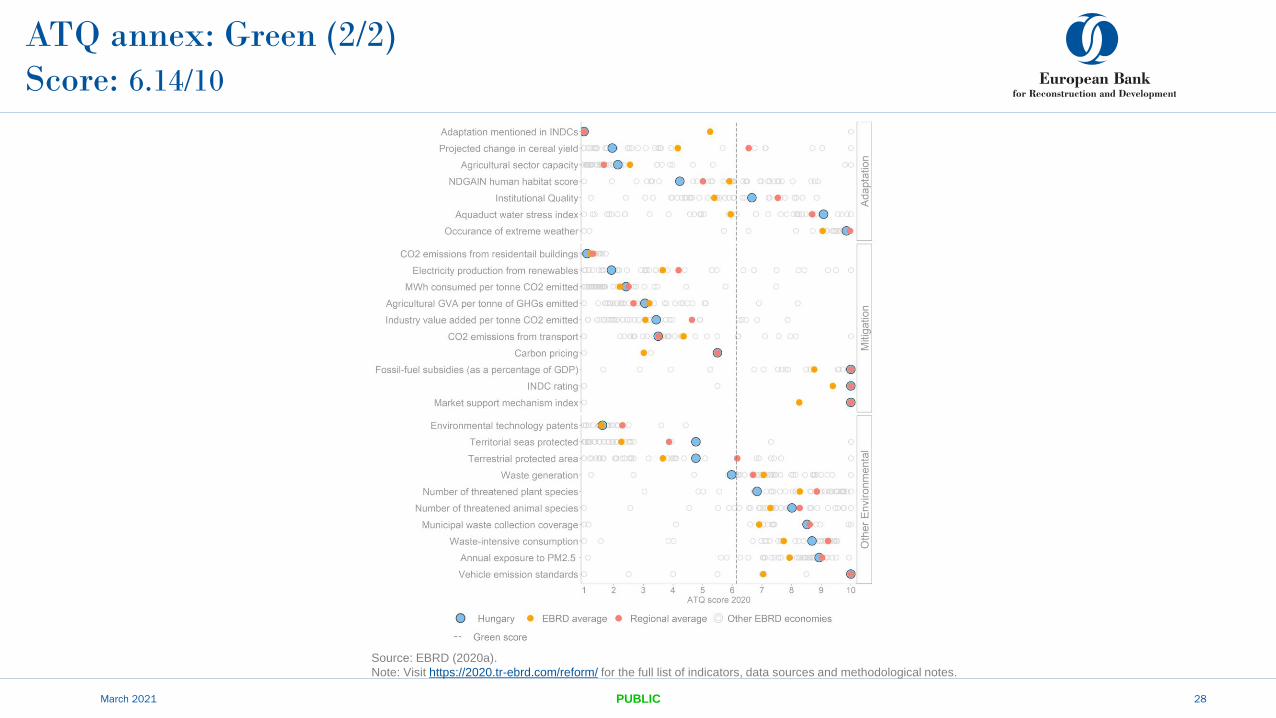
ATQ annex: Green (2/2)
Score: 6.14/10
March 2021 PUBLIC 28
Source: EBRD (2020a).
Note: Visit https://2020.tr-ebrd.com/reform/ for the full list of indicators, data sources and methodological notes.
ATQ annex: Inclusive
Score: 6.63/10
Hungary scores above average on most inclusive indicators. Total unemployment is very low, at
only 4.1 per cent for men and 4.6 per cent for women in November 2020, according to Eurostat.
The labour-force participation rate for women was 67.2 per cent, compared with 83.2 per cent for
men in Q3 2020 (Eurostat).
Gender discrepancies are partly associated with the negative effects of motherhood on labour-
market participation, as encouraged by Hungary’s family policy. The availability of childcare
facilities remains below the EU average (ILO, n.d.). Women are more likely to be employed in lesser-
paid services than men and less likely to be employed in industry and agriculture, according to the
World Bank. Only 23.3 per cent of employees in the transport sector are women. At the same time,
Hungary’s ATQ value in the World Bank’s Women, Business and the Law Index is above the EBRD
regional and CEB averages.
Employers see significant labour shortages. Fifty-one per cent of employers cite challenges filling
jobs in Hungary, with large companies finding it most difficult. Thirty-five per cent of employers cite
a lack of applicants as the major reason for the talent shortage, while a further 25 per cent cite
applicants’ excessive pay expectations (Manpower Group, 2018). The labour market has tightened
and the job vacancy rate has more than doubled since 2010 (PwC Hungary, 2021).
Due to its location, Hungary functions as transit country for irregular land migration. First-time
asylum applications peaked at more than 174,435 in 2015, according to Eurostat (2016), with the
three main source countries being Kosovo, Afghanistan and Syria. In 2015-19, there were also a
number of irregular entries through the Western Balkans, by refugees in transit to other EU
countries. In recent years, social tensions and anti-immigrant sentiment have led to restrictive
policies, such as the construction of border fences, which have dramatically decreased the number
of asylum applications.
Indicators show access to services at or above the regional average. Life expectancy at birth in
Hungary is 76 years, four years below the OECD average. Education standards in Hungary fall short
of the OECD average in PISA studies. Hungary is the worst-performing OECD country when it comes
to the correlation of educational attainment and socioeconomic background. Equity is further
hampered by early school choices and regional differences in school quality. At the same time,
overall educational achievement is high, with 84 per cent of adults aged 25-64 having completed
upper secondary education. Only 4.8 per cent of young people are not in education, employment or
training, according to Eurostat.
March 2021 29
The United Nations ranks Hungary’s population among the 10 fastest-shrinking populations
globally. The population is also aging. The share of people over 65 years of age rose from 13 per
cent in 1990 to almost 20 per cent in 2019 and it is expected to reach 29 per cent in 2060. In
2020, the median age in Hungary was estimated at 42, with around 20 per cent of Hungarians
over 65, only 10 per cent between 15 and 24 years and only 14 per cent under 14 years of age.
As the mortality rate is higher for men, women are overrepresented in the older age groups.
Seventy-four percent of people over the age of 85 in Hungary are women (United Nations, 2019).
The total dependency ratio, a measure of the pressure on the productive population, is expected
to increase to 85 per cent by 2060 from 49 per cent in 2019. Still, Hungary has a low
dependency ratio compared with the OECD average and this is mainly due to its relatively lower
life expectancy. The average OECD life expectancy at birth was 80 in 2017, compared with
Hungary’s 76 (OECD, 2019c).
LGBTI: Hungary scores just 41 per cent on the ILGA Europe scale of LGBTI equality (ILGA Europe,
2019). While equal treatment and opportunities are set in legislation for employment, health
and education, there are no administrative processes based on self-determination and the
requirements for legal gender recognition are punishing. Thirty-five per cent of all EU LGBT
survey respondents in Hungary reported experiencing harassment on the grounds of their sexual
orientation (European Union, 2020).
Roma: More than half of Roma households in Hungary suffer from economic, social and spatial
exclusion. Residential disadvantage is accompanied by low to no access to employment or
education. Most companies do not employ Roma based on prejudice and their lack of training;
at most, they are offered seasonal work (Váradi et al., 2014).
Refugees: Hungary’s hostile reaction to refugees and asylum seekers has led to deteriorating
conditions in detention centres, with reports of abuse and a lack of legal representation for
asylum seekers. The United Nations High Commissioner for Refugees has voiced serious
concern over refugees’ situation in Hungary (UNHCR, 2016).
Disabilities: Living conditions for people with disabilities are below the EU average. More than 27
per cent of people with some or a severe level of activity limitation live in a dwelling with a
leaking roof, damp walls or rot in window frames or floor (compared with the 17 per cent EU
average) (Eurostat, 2019).
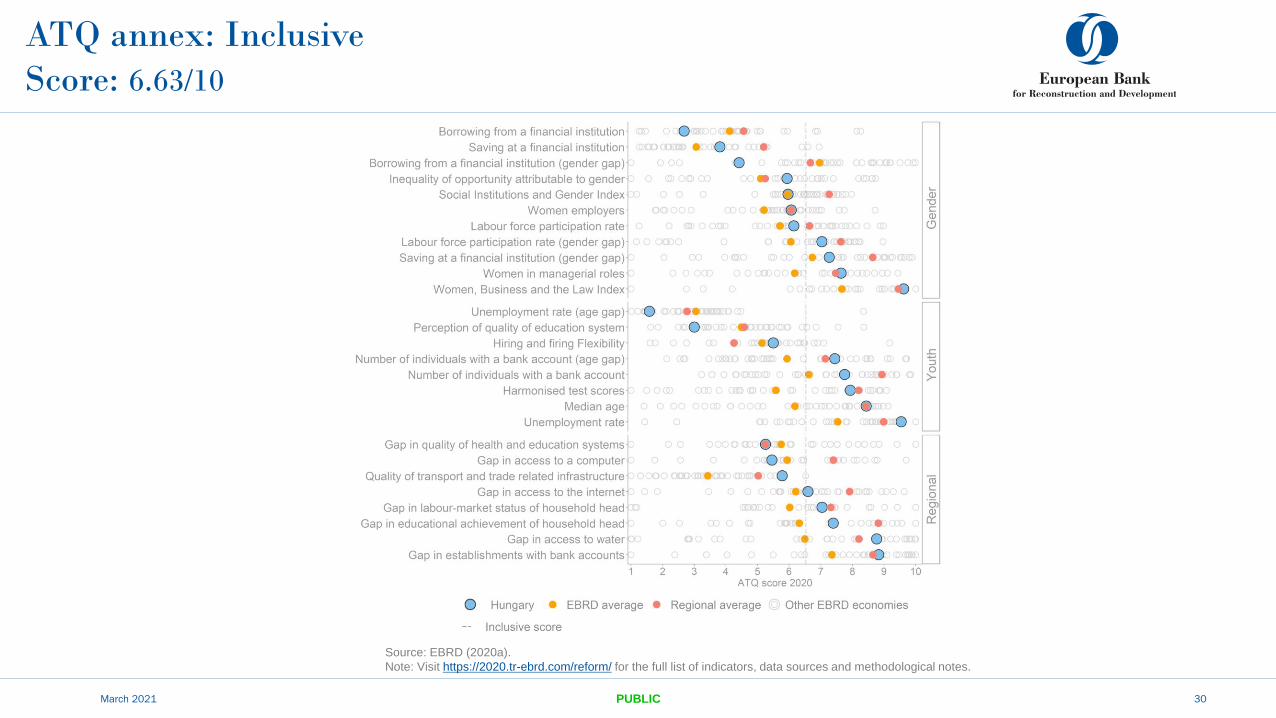
ATQ annex: Inclusive
Score: 6.63/10
March 2021 PUBLIC 30
Source: EBRD (2020a).
Note: Visit https://2020.tr-ebrd.com/reform/ for the full list of indicators, data sources and methodological notes.
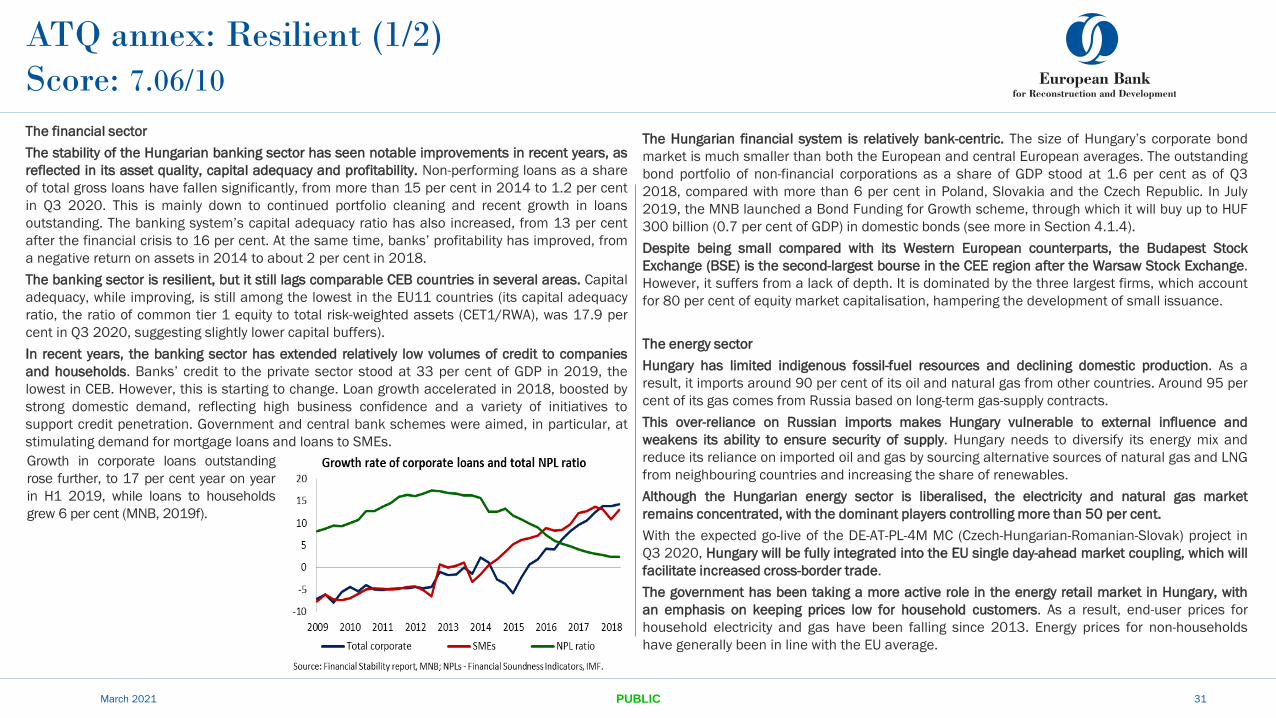
ATQ annex: Resilient (1/2)
Score: 7.06/10
The financial sector
The stability of the Hungarian banking sector has seen notable improvements in recent years, as
reflected in its asset quality, capital adequacy and profitability. Non-performing loans as a share
of total gross loans have fallen significantly, from more than 15 per cent in 2014 to 1.2 per cent
in Q3 2020. This is mainly down to continued portfolio cleaning and recent growth in loans
outstanding. The banking system’s capital adequacy ratio has also increased, from 13 per cent
after the financial crisis to 16 per cent. At the same time, banks’ profitability has improved, from
a negative return on assets in 2014 to about 2 per cent in 2018.
The banking sector is resilient, but it still lags comparable CEB countries in several areas. Capital
adequacy, while improving, is still among the lowest in the EU11 countries (its capital adequacy
ratio, the ratio of common tier 1 equity to total risk-weighted assets (CET1/RWA), was 17.9 per
cent in Q3 2020, suggesting slightly lower capital buffers).
In recent years, the banking sector has extended relatively low volumes of credit to companies
and households. Banks’ credit to the private sector stood at 33 per cent of GDP in 2019, the
lowest in CEB. However, this is starting to change. Loan growth accelerated in 2018, boosted by
strong domestic demand, reflecting high business confidence and a variety of initiatives to
support credit penetration. Government and central bank schemes were aimed, in particular, at
stimulating demand for mortgage loans and loans to SMEs.
March 2021 PUBLIC 31
The Hungarian financial system is relatively bank-centric. The size of Hungary’s corporate bond
market is much smaller than both the European and central European averages. The outstanding
bond portfolio of non-financial corporations as a share of GDP stood at 1.6 per cent as of Q3
2018, compared with more than 6 per cent in Poland, Slovakia and the Czech Republic. In July
2019, the MNB launched a Bond Funding for Growth scheme, through which it will buy up to HUF
300 billion (0.7 per cent of GDP) in domestic bonds (see more in Section 4.1.4).
Despite being small compared with its Western European counterparts, the Budapest Stock
Exchange (BSE) is the second-largest bourse in the CEE region after the Warsaw Stock Exchange.
However, it suffers from a lack of depth. It is dominated by the three largest firms, which account
for 80 per cent of equity market capitalisation, hampering the development of small issuance.
The energy sector
Hungary has limited indigenous fossil-fuel resources and declining domestic production. As a
result, it imports around 90 per cent of its oil and natural gas from other countries. Around 95 per
cent of its gas comes from Russia based on long-term gas-supply contracts.
This over-reliance on Russian imports makes Hungary vulnerable to external influence and
weakens its ability to ensure security of supply. Hungary needs to diversify its energy mix and
reduce its reliance on imported oil and gas by sourcing alternative sources of natural gas and LNG
from neighbouring countries and increasing the share of renewables.
Although the Hungarian energy sector is liberalised, the electricity and natural gas market
remains concentrated, with the dominant players controlling more than 50 per cent.
With the expected go-live of the DE-AT-PL-4M MC (Czech-Hungarian-Romanian-Slovak) project in
Q3 2020, Hungary will be fully integrated into the EU single day-ahead market coupling, which will
facilitate increased cross-border trade.
The government has been taking a more active role in the energy retail market in Hungary, with
an emphasis on keeping prices low for household customers. As a result, end-user prices for
household electricity and gas have been falling since 2013. Energy prices for non-households
have generally been in line with the EU average.
Growth in corporate loans outstanding
rose further, to 17 per cent year on year
in H1 2019, while loans to households
grew 6 per cent (MNB, 2019f).
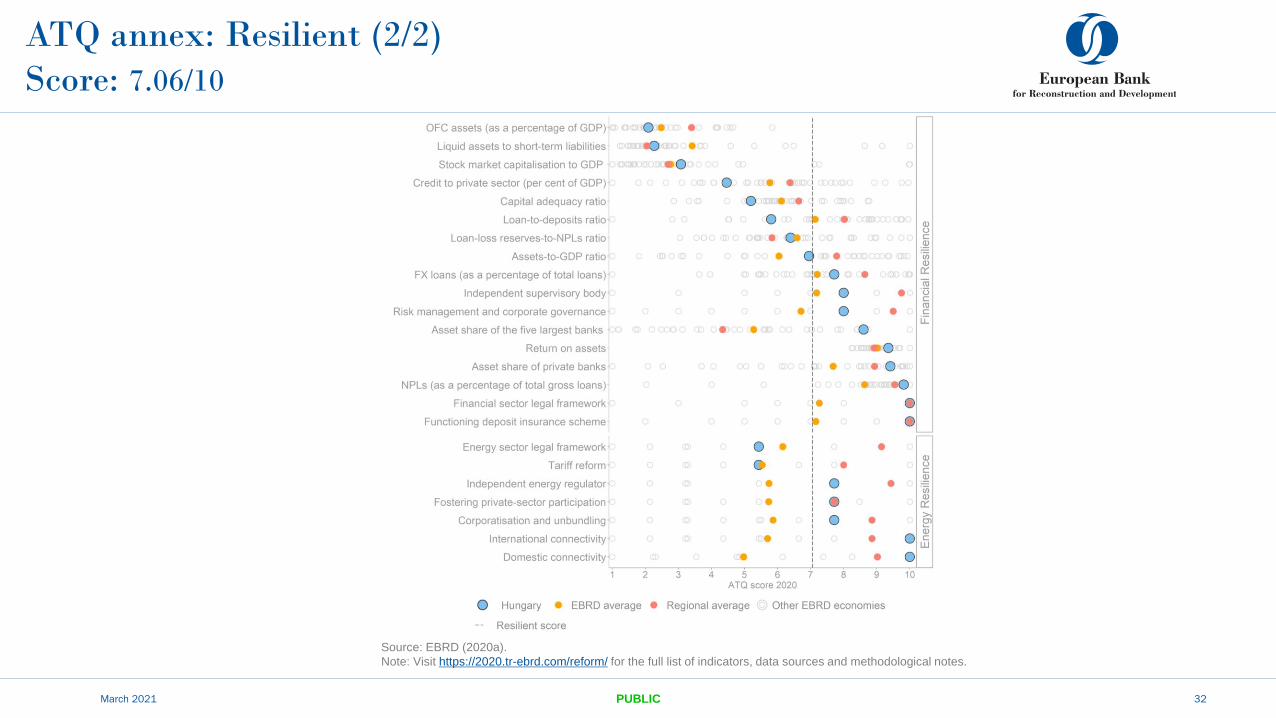
ATQ annex: Resilient (2/2)
Score: 7.06/10
March 2021 PUBLIC 32
The manufacturing sector is the main driver behind the country’s high GVC
integration, but heavily reliant on foreign inputs. Overall in 2016, imported inputs
accounted for 43% of total export value (backward participation) while only 16% of
exports were sold to 3rd countries for further export production (forward participation,
see the LHS bottom chart).
Source: EBRD (2020a).
Note: Visit https://2020.tr-ebrd.com/reform/ for the full list of indicators, data sources and methodological notes.
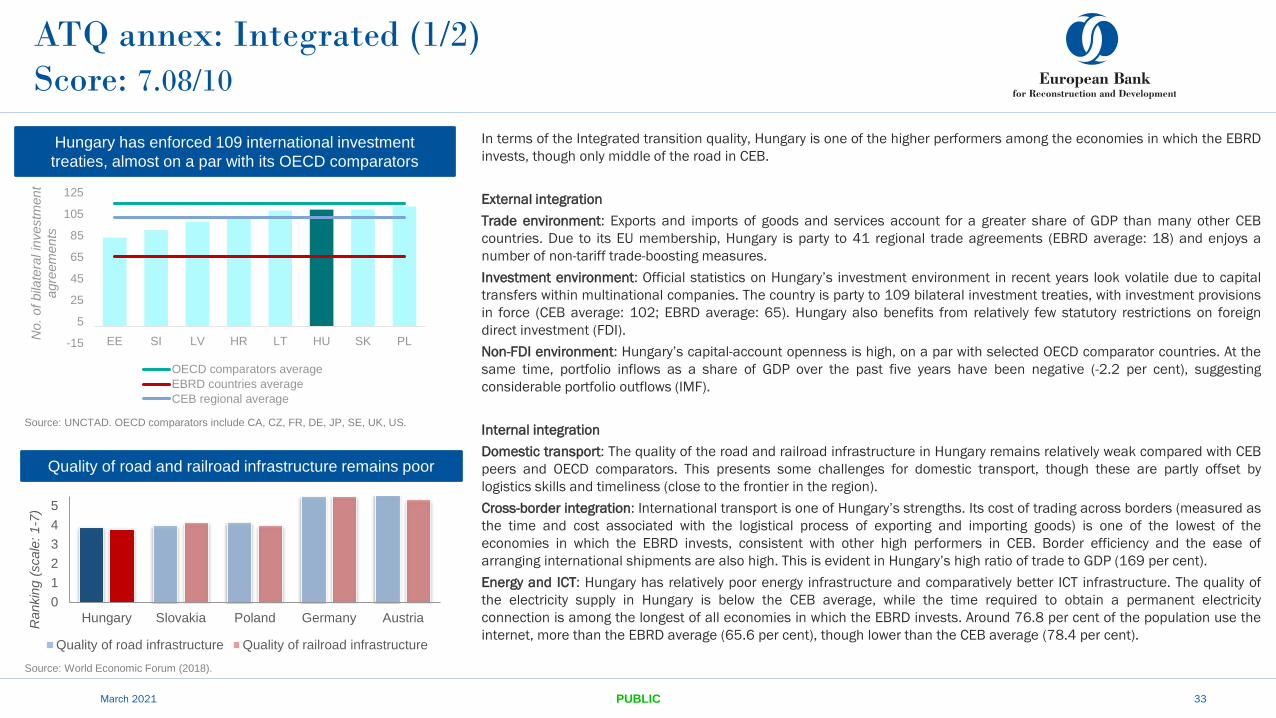
ATQ annex: Integrated (1/2)
Score: 7.08/10
March 2021 PUBLIC 33
Hungary has enforced 109 international investment
treaties, almost on a par with its OECD comparators
Quality of road and railroad infrastructure remains poor
Source: UNCTAD. OECD comparators include CA, CZ, FR, DE, JP, SE, UK, US.
Source: World Economic Forum (2018).
In terms of the Integrated transition quality, Hungary is one of the higher performers among the economies in which the EBRD
invests, though only middle of the road in CEB.
External integration
Trade environment: Exports and imports of goods and services account for a greater share of GDP than many other CEB
countries. Due to its EU membership, Hungary is party to 41 regional trade agreements (EBRD average: 18) and enjoys a
number of non-tariff trade-boosting measures.
Investment environment: Official statistics on Hungary’s investment environment in recent years look volatile due to capital
transfers within multinational companies. The country is party to 109 bilateral investment treaties, with investment provisions
in force (CEB average: 102; EBRD average: 65). Hungary also benefits from relatively few statutory restrictions on foreign
direct investment (FDI).
Non-FDI environment: Hungary’s capital-account openness is high, on a par with selected OECD comparator countries. At the
same time, portfolio inflows as a share of GDP over the past five years have been negative (-2.2 per cent), suggesting
considerable portfolio outflows (IMF).
Internal integration
Domestic transport: The quality of the road and railroad infrastructure in Hungary remains relatively weak compared with CEB
peers and OECD comparators. This presents some challenges for domestic transport, though these are partly offset by
logistics skills and timeliness (close to the frontier in the region).
Cross-border integration: International transport is one of Hungary’s strengths. Its cost of trading across borders (measured as
the time and cost associated with the logistical process of exporting and importing goods) is one of the lowest of the
economies in which the EBRD invests, consistent with other high performers in CEB. Border efficiency and the ease of
arranging international shipments are also high. This is evident in Hungary’s high ratio of trade to GDP (169 per cent).
Energy and ICT: Hungary has relatively poor energy infrastructure and comparatively better ICT infrastructure. The quality of
the electricity supply in Hungary is below the CEB average, while the time required to obtain a permanent electricity
connection is among the longest of all economies in which the EBRD invests. Around 76.8 per cent of the population use the
internet, more than the EBRD average (65.6 per cent), though lower than the CEB average (78.4 per cent).
0
1
2
3
4
5
Hungary Slovakia Poland Germany Austria
Rankin
g (
scale
: 1-7
)
Quality of road infrastructure Quality of railroad infrastructure
-15
5
25
45
65
85
105
125
EE SI LV HR LT HU SK PLNo.
of bila
tera
l in
vestm
ent
agre
em
ents
OECD comparators average
EBRD countries average
CEB regional average
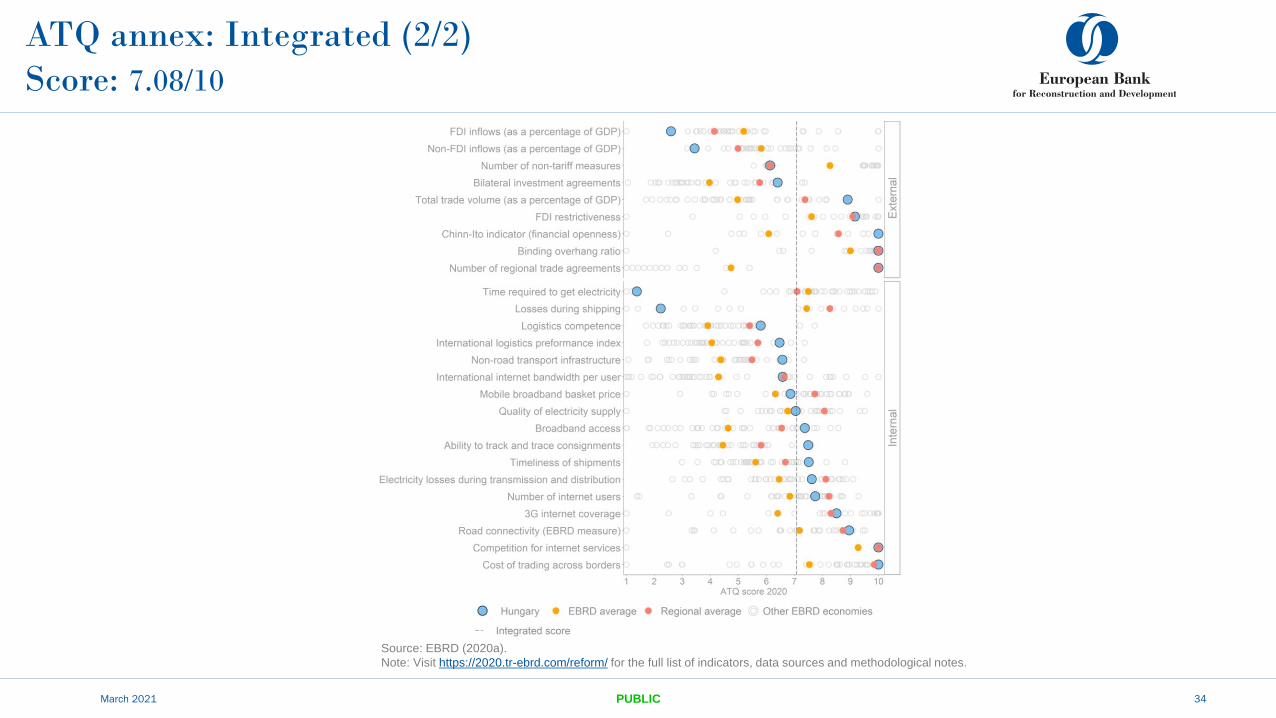
ATQ annex: Integrated (2/2)
Score: 7.08/10
March 2021 PUBLIC 34
Source: EBRD (2020a).
Note: Visit https://2020.tr-ebrd.com/reform/ for the full list of indicators, data sources and methodological notes.
March 2021 35PUBLIC
Annex 2: OLAF investigates award of public procurement contracts to
Hungarian prime minister’s son-in-law’s firm
Elios Innovatív Ltd., a company co-owned until May 2015 by István Tiborcz, son-in-law of Hungarian Prime Minister Viktor Orbán, turned over several million euros in just a few years, from 2010 to
2015, largely by winning state contracts for the procurement of public lighting, part funded by the EU. On several occasions, Elios was the sole bidder on the contracts, despite the fact that there
were at least 10-12 experienced companies in Hungary that were professionally and financially capable of carrying out such projects. The procurement often included conditions, such as earlier
high-value reference contracts in narrow categories that no other Hungary-based firm could meet (Vorák, 2015; Csurgó, 2018).
In January 2018, several news outlets reported that the European Anti-Fraud Office (OLAF) was investigating EU-funded street-light modernisation programmes in Hungary. Indeed, in its report,
delivered to the Hungarian government prior to January 2018, but not published, OLAF found serious irregularities and possible conflicts of interest in 35 public procurement contracts, worth a total
of €40 million, won by Elios Innovatív Ltd (Csikász, 2019; Norman and Komuves, 2018). OLAF recommended that the European Commission reclaim all funding spent on the projects. The report on
OLAF’s findings has never been officially published, but its contents are known thanks to a report by Hungarian online news outlet 24.hu, based on a leaked copy. In February 2019, the government
decided not to submit Elios’ invoices to the European Commission, turning down the opportunity to prove that the public tenders were not fraudulent (Kugyela and Brückner, 2019; Hollik et al.,
2019). Although the Hungarian police launched an investigation based on the OLAF report in January 2018 into allegations that Elios acquired state contacts by corrupt means, they dropped the
investigation in November 2018, claiming not to have found evidence of any crime (Kovács, 2018).
References (1/3)
Alves Dias, P., Kanellopoulos, K., Medarac, H., Kapetaki, Z., Miranda Barbosa, E., Shortall, R., et al. (2019),
EU coal regions: opportunities and challenges ahead, Science for Policy Joint Research Centre report,
European Union Publications Office, Luxembourg.
A. Banai, P. Lang, G. Nagy and M. Stancsics (2017), Impact Evaluation of EU Subsidies for Economic
Development on the Hungarian SME Sector, MNB Working Paper 8, MNB, Budapest.
G. Barcza (2018), “Is Retail Debt Too Expensive? The Case of Hungary”, Presentation at the International
Retail Debt Management Symposium, 26 April 2018, World Bank, Washington, DC.
P. Bauer and M. Endrész (2018), “Firm Dynamics and Aggregate Growth: The Case of Hungary”, Financial
and Economic Review, 17(2): 68-98.
Budapest Institute (2014), “A KKV-k Komplex Technológiafejlesztését Célzó Beavatkozások Hatásvizsgálata”
[Impact assessment of interventions for the complex technological development of SMEs], Budapest.
CEDEFOP (2016), “Hungary: Mismatch priority occupations”, Skills Panorama Hungary, European Centre for
the Development of Vocational Training, Brussels.
B. Csikász (2019), “Hungarian Authorities Secretive about OLAF’s Report on Fraud Committed by Orban’s
Son-in-Law”, Atlatszo, 15 February 2019 (available at: https://english.atlatszo.hu/2019/02/15/hungarian-
authorities-secretive-about-olafs-report-on-fraud-committed-by-orbans-son-in-law/).
D. Csurgó (2018) “Mit tudunk eddig az Elios-ügyről?”, Index.hu, 2 March 2018 (available at:
https://index.hu/gazdasag/2018/03/02/elios_olaf/).
Deloitte (2018), EMEA Digital Banking Maturity Report 2018 (available at:
https://www2.deloitte.com/content/dam/Deloitte/global/Documents/About-Deloitte/central-europe/ce-
digital-banking-maturity-study-emea.pdf?nc=1).
EBRD (2015), Transition Report 2015-16: Rebalancing finance, London.
EBRD (2018), Transition Report 2018-19: Work in transition, London.
EBRD (2019) Introducing the EBRD Knowledge Economy Index, London.
EBRD (2020a), Transition Report 2020-21: The state strikes back, London.
EBRD (2020b), Business Environment and Enterprise Performance Survey 2018-20 (BEEPS VI), London.
European Commission (2014), EU Anti-Corruption Report – Hungary, Brussels.
European Commission (2018a), European Innovation Scorecard 2018, Brussels.
European Commission (2018b), European Structural and Investment Funds, Brussels (available at:
https://cohesiondata.ec.europa.eu).
European Commission (2019a), 2019 European Semester: Country Report Hungary, Brussels.
March 2021 PUBLIC 36
European Commission (2019b), “Country profiles ‒ Hungary: Policies and progress towards investing in
children”, Brussels (available at:
https://ec.europa.eu/social/main.jsp?catId=1248&langId=en&intPageId=3644).
European Commission (2019c), “2019 SBA Fact Sheet Hungary”, Brussels.
European Commission (2020), 2020 European Semester: Country Report Hungary, Brussels.
ECBC (2019), European Covered Bond Fact Book 2019, European Covered Bond Council, Brussels.
EIB (2019), EIB Investment Survey 2019: Hungary, European Investment Bank, Luxembourg.
European Union (2018), Standard Eurobarometer 89: Factsheet for Hungary, Brussels.
European Union (2020), “EU LGBTI II. A long way to go for LGBTI equality”, European Union Agency for
Fundamental Rights, Luxembourg.
Eurostat (2016), “Record number of over 1.2 million first time asylum seekers registered in 2015 ‒ Syrians,
Afghans and Iraqis: top citizens”, 4 March 2016, Brussels (available at:
https://ec.europa.eu/eurostat/documents/2995521/7203832/3-04032016-AP-EN.pdf/790eba01-381c-
4163-bcd2-a54959b99ed6).
M. Fazekas, J. Chvalkovska, J. Skuhrovec, I.J. Tóth and L.P. King (2013), “Are EU Funds a Corruption Risk?
The Impact of EU Funds on Grand Corruption in Central and Eastern Europe”. In: A. Mungiu-Pippidi (ed.) The
Anticorruption Frontline, the ANTICORRP Project, 2: 68-89.
M. Fertig and M. Csillag (2015), Cost–benefit analysis of remedial interventions for the long-term
unemployed, ICON-INSTITUT for the European Commission Directorate-General for Employment, Social
Affairs and Inclusion, Cologne, Germany.
Government of Hungary (2015), Public Administration and Public Service Development Strategy 2014-20,
Budapest.
T. Harford and M. Klein (2005), Aid and the Resource Curse, World Bank, Washington, DC.
Heritage Foundation (2020), “Index of Economic Freedom: Hungary”, Washington, DC.
A. Hollik, E. Záborszky and D. Csurgó (2019), “Government Lets Go of EU Funds for Suspicious Projects Tied
to PM’s Son-in-Law”, Index.hu, 13 February 2019.
IEA (2019), “Key energy statistics: Hungary”, Paris (available at: https://www.iea.org/countries/hungary).
ILGA Europe (2019), “Rainbow Europe 2019” (available at: https://ilga-europe.org/rainboweurope/2019).
ILO (n.d.), “About the ILO in Hungary” webpage: https://www.ilo.org/budapest/countries-
covered/hungary/WCMS_473724/lang--en/index.htm.
References (2/3)
IMF (2019a), 2019 Article IV Consultation Staff Report and Statement by the Executive Director for
Hungary, IMF Country Report No. 19/357, Washington, DC.
IMF (2019b), Hungary: Selected Issues, IMF Country Report No. 19/358, Washington, DC.
IMF (2019c), Demographic Headwinds in Central and Eastern Europe, Departmental Paper No.19/12,
Washington, DC.
Invest Europe (2019), 2018 Central and Eastern Europe: Private Equity Statistics, Brussels.
L. Kállay (2014), Állami Támogatások És Gazdasági Teljesítmény Támogatás-Túladagolás a Magyar
Gazdaságfejlesztésben?, Közgazdasági Szemle, LXI: 279-298.
L. Kállay and E. Jáki (2019), “The impact of state intervention on the Hungarian venture capital market”,
Research-Ekonomska Istraživanja, 33(1): 1130-1145.
J. Karsai (2017), “Az Állam Kockázatit\Hoke-Piaci Részvételének Átláthatósága Magyarországon”,
Közgazdasági Szemle, 64 (12): 1316-1342.
S. Knack (2000), Aid Dependence and the Quality of Governance: A Cross-Country Empirical Analysis.
Policy Research Working Paper, Vol. 2396, World Bank, Washington, DC.
Z. Kovács (2018), “Police Drops Investigation against Former Company of PM’s Son-in-Law”, Index.Hu, 7
November 2018.
KPMG (2017), A Magyarországi Európai Uniós Források Felhasználásának És Hatásainak Elemzése a
2007-2013-as Programozási Időszak Vonatkozásában, Budapest.
T. Kugyela and G. Brückner (2019), “European Commission Held Surprise Inspection at Former Company of
Viktor Orbán’s Son-in-Law”, Index.Hu, 10 April 2019.
G. László (2017), “Robin Hood nyilaitól … Miért maradtak velünk a különadók?” Magyar Narancs, 14
December 2017.
Manpower Group (2018) Solving the Talent Shortage: Build, Buy, Borrow and Bridge. Milwaukee, WI.
Ministry of Foreign Affairs and Trade (2019), National Export Strategy 2019-30, Budapest.
Ministry of Innovation and Technology (2018), Second National Climate Change Strategy, Budapest.
Ministry of Innovation and Technology (2019), Hungary’s SME Strategy, Budapest.
Ministry of Justice (2018), “Hungary Continues to Say No to Joining European Public Prosecutor’s Office”,
Budapest.
March 2021
PUBLIC
37
Ministry of National Development (2012), National Energy Strategy 2030, Budapest.
Ministry of National Development (2015), Hungary’s National Energy Efficiency Action Plan until 2020
(NEEAP), Budapest.
Ministry of National Economy (2016), Directions for Innovative Industrial Development (Irinyi Plan),
Budapest.
B. Muraközy, M. Bisztray and B. Reizer (2018), Productivity differences in Hungary and mechanisms of TFP
growth slowdown, for DG GROW, European Commission, Brussels.
MNB (2018), 180 Steps for the Sustainable Convergence of the Hungarian Economy, Budapest.
MNB (2019a), 330-point Competitiveness Programme, Budapest.
MNB (2019b), Green Finance In Hungary Consultation, Budapest.
MNB (2019c), Green Programme, Budapest.
MNB (2019d), Considerations behind the launch of the bond funding for growth scheme (BGS), Budapest.
MNB (2019e), Payment Systems Report 2019, Budapest.
MNB (2019f), Financial Stability Report December 2019, Budapest.
MNB (2019g), Financial Innovation and Stability. Fintech Strategy of the Magyar Nemzeti Bank, Budapest.
NCC (2019), Programme for a more competitive Hungary, National Competitiveness Council and the
Ministry of Finance, Budapest.
L. Norman and A. Komuves (2018) “EU Fraud Office Finds Irregularities in Projects Linked to Hungarian
Leader’s Son-in-Law,” Wall Street Journal, 12 January 2018.
OECD (2018a), “Economy-wide Product Market Regulation Indicators”, Paris (available at:
https://www.oecd.org/economy/reform/indicators-of-product-market-regulation/).
OECD (2018b), “Trade in Value Added”, Paris (available at: https://www.oecd.org/sti/ind/measuring-trade-
in-value-added.htm).
OECD (2018c) OECD Environmental Performance Reviews: Hungary 2018, Paris.
OECD (2019a), “Tax Wedge”, Paris (available at: https://data.oecd.org/tax/tax-wedge.htm).
References 3/3
PUBLIC 38
A. Vorák (2015), “Company of Hungarian PM’s Son-in-Law Keeps Winning Public Projects Without
Competition. Here Is What Made That Possible,” Direkt36, 11 March 2015.
World Bank (2019), “Doing Business Data”, Washington, DC (available at:
https://www.doingbusiness.org/en/data).
World Economic Forum (2018) Global Competitiveness Report 2018, Geneva, Switzerland.
World Resources Institute (2013) “Aqueduct Water Risk Atlas” webpage:
https://www.wri.org/resources/maps/aqueduct-water-risk-atlas.
March 2021
OECD (2019b), “Productivity ‒ GDP per Hour Worked”, Paris (available at:
https://data.oecd.org/lprdty/gdp-per-hour-worked.htm).
OECD (2019c), “OECD Better Life Index – Hungary”, Paris (available at:
https://www.oecdbetterlifeindex.org/countries/hungary/).
Office of the Prime Minister (2019), 2018 Integrity Report of the Prime Minister’s Office, Budapest.
OLAF (2019), The OLAF report 2018, Luxembourg.
Origo (2018), “Példaértékű az összefogás a korrupció visszaszorítása érdekében”, Origo, 10 December
2018 (available at: https://www.origo.hu/itthon/20181210-sikeres-a-korrupcio-elleni-fellepes-
magyarorszagon.html).
Portfolio (2019), “Hungary's financial correction to amount to HUF 400 bn”, Portfolio, 22 November 2019
(available at: https://www.portfolio.hu/en/eu-funds/20191122/hungarys-financial-correction-to-amount-
to-huf-400-bn-407953).
PwC Hungary (2021) Hungarian CEOs expect a quick rebound in 2021: PwC’s 10th Hungarian CEO
Survey, Budapest.
P.E. Reszkető (2016), Independent Reporting Mechanism: Hungary Progress Report 2013-2014, Open
Government Partnership and the Budapest Institute, New York and Budapest.
P.E. Reszkető (2019), “A Szabályozási Hatáselemzés Jogi Szabályozása És Tényleges Hazai Gyakorlata”. In
Gy. Gajduschek and M. Sebők (eds.) Jogalkotás Minősége Magyarországon [The Quality of Law Making in
Hungary, MTA Jogtudományi Intézet, Budapest.
Transparency International (2019), Corruption Perceptions Index 2019, Berlin.
UNHCR (2016), Hungary as a country of asylum. Observations on restrictive legal measures and
subsequent practice implemented between July 2015 and March 2016, Geneva, Switzerland.
United Nations (2019), “World Population Prospects 2019 – Hungary”, New York (available at:
https://population.un.org/wpp/Graphs/Probabilistic/POP/TOT/348).
M. Váradi and T. Virág (2014), “Faces and Causes of Roma Marginalization – Experiences from Hungary”.
In: J. Szalai and V. Zentai (eds.) Faces and Causes of Roma Marginalization in Local Contexts: Hungary,
Romania, Serbia, Central European University, Budapest.