Volume 10 Issue 2 2018 Czech Republic Hungary Serbia
169
DETUROPE – THE CENTRAL EUROPEAN JOURNAL OF REGIONAL DEVELOPMENT AND TOURISM Vol. 10 Issue 2 2018 ISSN 1821-2506 0 Volume 10 Issue 2 2018 Czech Republic Hungary Serbia
-
Upload
khangminh22 -
Category
Documents
-
view
5 -
download
0
Transcript of Volume 10 Issue 2 2018 Czech Republic Hungary Serbia

DETUROPE – THE CENTRAL EUROPEAN JOURNAL OF REGIONAL DEVELOPMENT AND TOURISM
Vol. 10 Issue 2 2018 ISSN 1821-2506
0
Volume 10 Issue 2 2018
Czech Republic Hungary Serbia

DETUROPE
THE CENTRAL EUROPEAN JOURNAL OF REGIONAL
DEVELOPMENT AND TOURISM
Volume 10, Issue 2
2018

DETUROPE – the Central European Journal of Regional Development and Tourism is an international online open-access scientific journal publishing results of theoretical and applied research in the fields of regional and rural development and tourism. The articles published in this journal pass through a double-blinded peer reviewing process. Editorial board Editor-in-chief: Kamil Pícha, associate professor, University of South Bohemia Members: Zsuzsanna Bacsi, associate professor, University of Pannonia Dávid Fekete, assistant professor, Széchenyi István University Ernő Kovács, associate professor, University of Pannonia Zsuzsanna Lőke, associate professor, University of Pannonia Josef Navrátil, associate professor, University of South Bohemia Imre Nagy, professor, University of Novi Sad; Kaposvar University János Rechnitzer, professor, Széchenyi István University András Ricz, assistant professor, Regional Science Association of Subotica Sándor Somogyi, professor, Regional Science Association of Subotica, honorary editor-in-chief Dagmar Škodová Parmová, associate professor, University of South Bohemia In memoriam: Vladimír Dvořák, assistant professor, University of South Bohemia – founding Editorial board member DETUROPE is covered by Web of Science Emerging Sources Citation Index and indexed in the Scopus, ERIH plus, DOAJ (Directory of Open Access Journals), MTMT (The Hungarian National Scientific Bibliography), and the KoBSON (Serbian Consortium for Coordinated Acquisition of Electronic Resources) databases.
Published by the Regional Science Association of Subotica, Serbia in co-operation with the University of South Bohemia, Faculty of Economics and University of Pannonia, Georgikon Faculty, Kesthely, Hungary. Address of the contact information: DETUROPE. Regionális Tudományi Társaság Szabadka/Društvo za Regionalne Nauke, Corvin Mátyás/Matije Korvina 9. 24000 Szabadka/Subotica, Serbia, [email protected] ISSN 1821-2506

3
TABLE OF CONTENTS Original scientific papers: MOVING FROM COGNITIVE LOYALTY TO BEHAVIORAL LOYALTY THROUGH BRAND ROMANCE: EVIDENCE FROM HOTEL INDUSTRY OF IRAN Amir Khazaei Pool, Farhad Hanifi, Vahid Reza Mirabi, Mohammad Javad Taghipourian ...... 4 REGIONAL DEVELOPMENT AND ITS MEASUREMENT IN VISEGRAD GROUP COUNTRIES Ingrid Majerová ........................................................................................................................ 17 COLLISIONS OF ANIMALS WITH ROAD VEHICLES IN TRAFFIC IN THE CZECH REPUBLIC IN CONNECTION WITH TOURISM – ANALYSES OF CAUSES AND PREVENTION Petr Šmíd, Emílie Pecharová, Dagmar Škodová Parmová ....................................................... 38 A TELEPÜLÉSI KÖTŐDÉS ÉS A Z GENERÁCIÓ - EGY MAGYARORSZÁGI KÖZÉPVÁROS PÉLDÁJA Nikoletta Tóth-Kaszás .............................................................................................................. 54 TERRITORIAL IMPACT ASSESSMENT: COHESION POLICY AND BALANCED TERRITORIAL DEVELOPMENT (CZECHIA) Jiří Novosák, Oldřich Hájek, Lucie Severová, Daniela Spiesová, Jana Novosáková .............. 75 ASSESSMENT OF THE INTERRELATIONS BETWEEN HEALTH AND HOUSING CONDITIONS IN A HUNGARIAN ROMA SETTLEMENT Csaba Bálint ............................................................................................................................. 91 THE ROLE OF NATURAL RESOURCES IN THE ECOTOURISM DEVELOPMENT – RESIDENTS’ PERCEPTIONS IN SUBOTICA (NORTHERN SERBIA) Aleksandra Vujko, Marko D. Petrović, Danica Gostović, Milan Radovanović, Darko Vuković ................................................................................................................................................ 112 ASSESSMENT OF SERVICE QUALITY AND CONSUMER SATISFACTION IN A HUNGARIAN SPA Zsuzsanna Lőke, Ernő Kovács, Zsuzsanna Bacsi .................................................................. 124 EFFICIENCY OF PRODUCTION FACTORS IN THE EU Martina Novotná, Tomáš Volek ............................................................................................. 147

DETUROPE – THE CENTRAL EUROPEAN JOURNAL OF REGIONAL DEVELOPMENT AND TOURISM
Vol. 10 Issue 2 2018 ISSN 1821-2506
4
Original scientific paper
MOVING FROM COGNITIVE LOYALTY TO BEHAVIORAL
LOYALTY THROUGH BRAND ROMANCE: EVIDENCE FROM
HOTEL INDUSTRY OF IRAN
Amir KHAZAEI POOLa, Farhad HANIFIb, Vahid Reza MIRABIc, Mohammad Javad TAGHIPOURIANd
aDepartment of management, Qeshm international branch, Islamic Azad University, Qeshm, Iran, e-mail: [email protected] bDepartment of management, Central Tehran branch, Islamic Azad University, Tehran, Iran, e-mail: [email protected] cDepartment of management, Central Tehran branch, Islamic Azad University, Tehran, Iran, e-mail: [email protected] dDepartment of management, Chalous branch, Islamic Azad University, Chalous, Iran, e-mail: [email protected]
Cite this article: Khazei Pool, A., Hanifi, F., Mirabi, V. R., Taghipourian, M. J. (2018). Moving from Cognitive Loyalty to Behavioral Loyalty through Brand Romance: Evidence from Hotel Industry of Iran.
Deturope, 10(2), 4-16.
Abstract
Brand romance is considered as a very important construct in marketing especially in brand area leading to the occurrence of some behaviors in consumers. However, a few types of research have been conducted on the importance of brand romance in hoteling. The present research aims to identify and test the effect of brand romance on four kinds of customer loyalty including cognitive loyalty, affective loyalty, conative loyalty and behavioral loyalty. The semi-structured interview was used to identify the measuring tool of brand romance. Then, customer loyalty questionnaire was added and distributed in the statistical society of the study. Data were tested using Smart-Pls2. Results of the research showed that brand romance had positive and significant effect on four kinds of loyalty. This research is a guide for hotel managers and marketers to perceive brand romance from viewpoints of customers. In addition, by applying suggestions, the research will help marketers create a stronger relationship between brand and customers and thus benefit from its outcomes. Keywords: brand romance, cognitive, affective, conative, behavioral, loyalty
INTRODUCTION
In recent years, researchers have paid special attention to feelings of consumer (Holbrook and
Hirschman, 1982). According to researches of Ascher (1999), human beings (consumers) are
seeking romantic relationship. Romantic relationship is not limited to males and females
rather it is available between human and object, images and ideas. Bowlby was the first
person who did a research on attachment based on the relationship between parents and
neonates (1970, 1980). Similarly, researches on marketing show that consumers can attach to
brands (Schouten & McAlexander, 1995). Such concept that reflects attachments and

Khazei Pool, A., Hanifi, F., Mirabi, V. R., Taghipourian, M. J.
5
romantic dependencies has been studied in researches on behavior of consumer (i.e. Shimp &
Madden, 1988).
Fournier (1998) believed that consumers could make romantic relationships with brands
and in some cases; such connections can be strong (Fournier, 1998). Brand romance is one of
affective attachments that were presented by Patwardhan & Balasubramanian (2011) and it
includes three dimensions of pleasure, arousal and dominance. Although brand romance of
products is increasing, it has been less paid attention in services' industry especially hoteling
in Iran. The present research aims to identify this gap and to answer following question: what
effect does the brand romance have on kinds of customer loyalty in hotels?
Concerning the importance of brand romance, marketers in services & hoteling sector
should perceive factors affecting brand romance. In products' sector, some researchers tried to
do it. For example, Patwardhan & Balasubramanian (2011) indicated that the consequences of
brand romance were attitude towards brand as a determinant and brand loyalty. Other
researchers such as Kruger et al (2013), Patwardhan (2004) and Petzer et al (2014) studied
determinants and consequences of brand romance. Kruger et al (2013) revealed that there was
a significant relationship between attitude towards brand, trust, loyalty and brand romance.
Petzer et al (2014) found brand loyalty as the consequence of brand romance. Patwardhan
(2004) indicated that subjective brand knowledge, brand novelty and brand satiety are
background factors for brand romance. In hoteling sector in Iran, most researches addressed
the effect of brand equity on satisfaction and loyalty of customer and other related constructs.
Rahimnia, Najafi, and Alavi (2014) indicated that brand preference had significant effect on
brand attachment in Homa hotel in Iran. Given the country's prospect of attracting 20 million
tourists by 2025, competition in the hotel industry will increase sharply, as even foreign
companies are planning to enter this area. Therefore, brand, branding, and then building an
emotional relationship with the brand will be one of the requirements of Iranian hotels in the
future.Therefore, the present research aims to study the effect of brand romance on four kinds
of loyalty including cognitive loyalty, affective loyalty, conative loyalty and behavioral
loyalty as consequences of brand romance and qualitative and quantitative approaches have
been used. The structure of paper has been organized as follows: first, the literature is studied;
the model and hypotheses are codified in addition to description of brand romance. Then,
results and conclusion are discussed.
Brand romance
Brand romance is an introverted subjective state in response to the brand as a stimulant and it
is identified by following factors: positive strong sense to a brand, high arousal created by the

Khazei Pool, A., Hanifi, F., Mirabi, V. R., Taghipourian, M. J.
6
brand, tendency of the brand to dominance in cognitive mind of consumer (Patwardhan &
Balasubramanian, 2011). Brand romance is appeared when the individual has knowledge on
features of the stimulants that have been evaluated positively and he/she perceive some
novelty in them thus the individual is encouraged to approach the stimulant. If the novelty is
not perceived and the knowledge on the stimulant has been evaluated poorly or negatively, the
tendency to approach the stimulant may be reduced. When the individual is satisfied with the
stimulant, perceived novelty will be reduced. The brand romance is existent in the individual.
Different individuals may experience various levels of brand romance (Patwardhan et al,
2004) because brand romance is a concept specific to an object.
Theoretical framework and hypotheses
Kruger (2013) concluded in his research that brand romance had positive and significant
relationship with behavioral and attitudinal loyalties. Cognitive loyalty is based on beliefs in
brand (Kumar Roy et al, 2009). Affective loyalty shows the favorable level of attitude and
liking of customer to a brand. On the other hand, affective loyalty refers to the amount of
consumer's liking of brand (Kumar Roy et al, 2009). Conative loyalty means to create
behavioral intentions for buying a product. Such loyalty has deeper commitment. In other
words, it refers to the level of customer's commitment to continuous purchase of a product in
future. Conative loyalty states that attitudinal loyalty should be followed by liking to do
something such as rebuying a brand. Such loyalty is stronger than affective loyalty. Conative
loyalty refers to an intense tendency to a brand loyalty (Oliver, 1999). Researchers who did
research on brand loyalty believed that commitment to brand and complete loyalty to the
brand required existence of an affective and romantic attachment between consumer and the
brand (Patwardhan & Balasubramanian, 2011; Oliver 1999). Therefore, concerning above-
mentioned, it can be assumed that:
Hypothesis 1: brand romance has a positive effect on cognitive loyalty.
Hypothesis 2: brand romance has a positive effect on affective loyalty.
Hypothesis 3: brand romance has a positive effect on conative loyalty.
Oliver (1999) stated that behavioral loyalty is a state in which behavioral intentions change
into practice (Kumay Roy et al, 2009). If a person attaches romantically a brand, he/she will
tend to pay extra money for that brand. For this purpose, the consumer tends intensely to buy
the brand. If the consumer is fond of a brand, it will be expected that positive statements are
stated about the brand (Sarkar, 2011). Therefore, it can be assumed that:
Hypothesis 4: brand romance has a positive effect on behavioral loyalty.

Khazei Pool, A., Hanifi, F., Mirabi, V. R., Taghipourian, M. J.
7
Figure 1 Conceptual model of the study
METHODS
In this research, 48 consumers above 18 years old (18 males and 30 females aged between 18
and 50 years old) were interviewed using inductive approach. The consumers were asked to
name the brand which they are fond of it. Then, some questions were asked about the reasons
why they are fond of the brand and other feelings. After deep interview and analysis of over
367 minutes of interviews with consumers, 117 items were obtained using open and axial
coding (8 constructs including: connections, arousal, dominance, passion, liking, intimacy,
pleasure and uniqueness). In the next stage, content validity of the questions was studied
using 11 doctorate students of marketing (in form of proper and improper). Then, content
validity index of Lawshe (Lawshe, 1975) was calculated for each item (based on Lawshe
table, optimal threshold amount for eleven specialists is 0.59). As a result, items in which
Lawshe amount is lower than optimal threshold were removed and number of items was
reduced to 80 ones. Concerning that such items have been specific to brands of products, to
match items with service & hoteling sector, Lawshe index was used again to identify items
appropriate for hoteling sector using the same specialists. As a result, 26 items were removed
and 54 items remained to measure brand romance with a five point scale ranging from 1
(strongly disagree) to 5 (strongly agree). Then, questions related to four loyalties (Yeboah-
Asiamah, Quaye, & Nimako, 2016) were added and the questionnaire was distributed in the
population under study and it was analyzed by Smart-PLS 2. Statistical population of the
research is 4 and 5 star hotels in Mazandaran province-north of Iran because the brand is more
tangible in such hotels. Concerning statistics obtained from cultural heritage & tourism
organization of Mazandaran province, it was found that six 4-star hotels and one 5-star hotel
were running in 2014 in the province. The 4-star hotels were Badleh, Salardareh and Navid
Brand
romance
Cognitive
loyalty
Affective
loyalty
Conative
loyalty
Behavioral
loyalty
H1
H2
H3
H4
Khazei Pool, A., Hanifi, F., Mirabi, V. R., Taghipourian, M. J.
8
located as Sari, Narenjestan-e Noor and Parsian Khazar located at Chalous, Parsian Azadi
(old) in Ramsar and Parsian Azadi Khazar (new) located at Ramsar was the 5-star hotel.
Members of statistical population were customers of the hotels. To determine sample size,
Krejcie-Morgan table was used thus 384 persons were chosen out of over 10000 persons.
Therefore, 387 questionnaires were distributed in seven hotels based on random sampling and
data were gathered.
DATA ANALYSIS AND RESULTS
Demographic analysis
Demographic features of the research showed that 34.8% of respondents were women and
65.2% were men. 21.6% of population under study were below 30 years old, 41.7% were
between 30 and 50 years old, 36.7% were above 50 years old. Regarding education, 29.2% of
people had bachelor or lower, 57% had master degree and 13.8% had doctorate degree.
Analysis of hypotheses/Evaluation of the measuring model
To test hypotheses, the external model should be evaluated. To study fitness of the measuring
model, convergent validity and reliability were used. To measure convergent validity, factor
loading and average variance extracted (AVE) were used. The result of factor loading of
questions has been shown in Tab. 1.
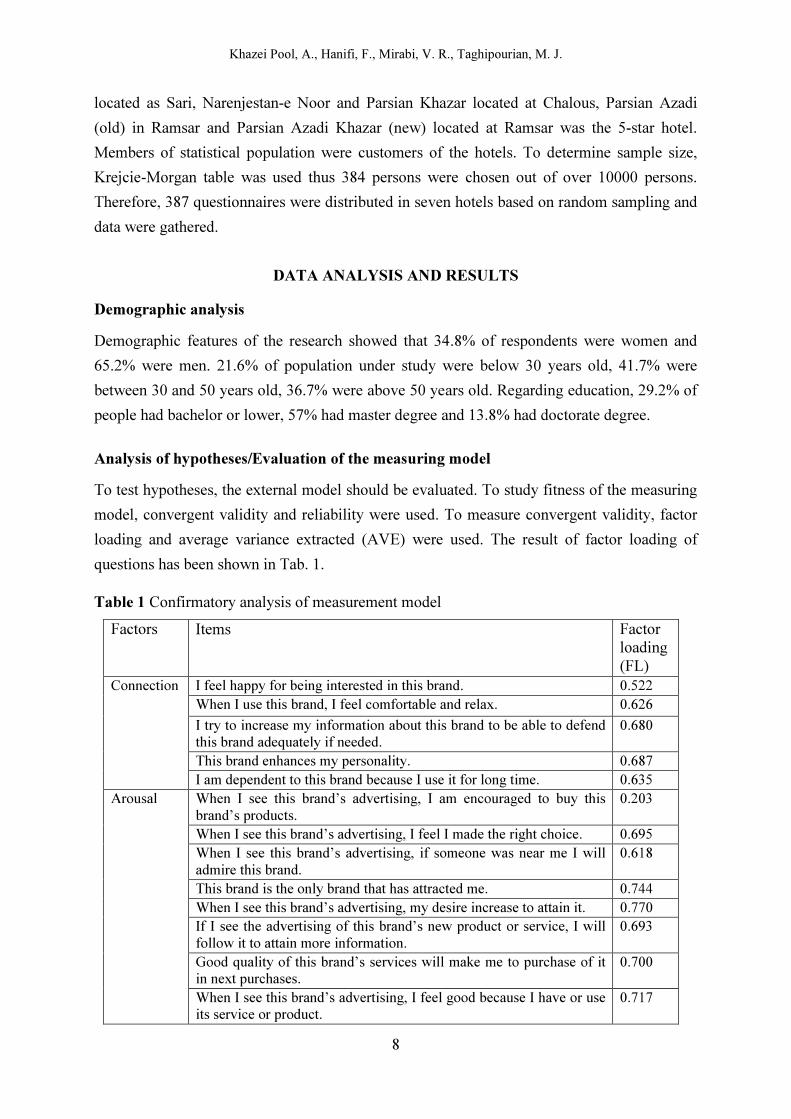
Table 1 Confirmatory analysis of measurement model
Factors Items Factor loading (FL)
Connection I feel happy for being interested in this brand. 0.522 When I use this brand, I feel comfortable and relax. 0.626
I try to increase my information about this brand to be able to defend this brand adequately if needed.
0.680
This brand enhances my personality. 0.687 I am dependent to this brand because I use it for long time. 0.635
Arousal When I see this brand’s advertising, I am encouraged to buy this brand’s products.
0.203
When I see this brand’s advertising, I feel I made the right choice. 0.695 When I see this brand’s advertising, if someone was near me I will admire this brand.
0.618
This brand is the only brand that has attracted me. 0.744 When I see this brand’s advertising, my desire increase to attain it. 0.770 If I see the advertising of this brand’s new product or service, I will follow it to attain more information.
0.693
Good quality of this brand’s services will make me to purchase of it in next purchases.
0.700
When I see this brand’s advertising, I feel good because I have or use its service or product.
0.717
Khazei Pool, A., Hanifi, F., Mirabi, V. R., Taghipourian, M. J.
9
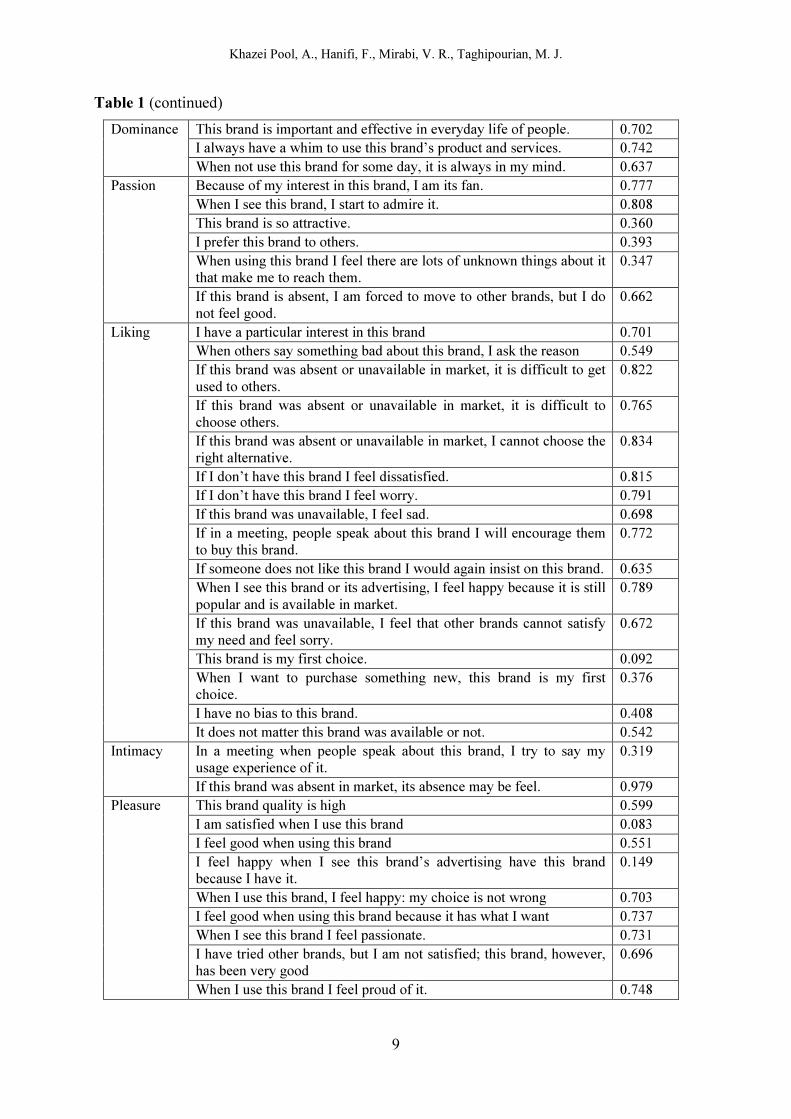
Table 1 (continued)
Dominance This brand is important and effective in everyday life of people. 0.702 I always have a whim to use this brand’s product and services. 0.742 When not use this brand for some day, it is always in my mind. 0.637
Passion Because of my interest in this brand, I am its fan. 0.777 When I see this brand, I start to admire it. 0.808 This brand is so attractive. 0.360 I prefer this brand to others. 0.393 When using this brand I feel there are lots of unknown things about it that make me to reach them.
0.347
If this brand is absent, I am forced to move to other brands, but I do not feel good.
0.662
Liking I have a particular interest in this brand 0.701 When others say something bad about this brand, I ask the reason 0.549 If this brand was absent or unavailable in market, it is difficult to get used to others.
0.822
If this brand was absent or unavailable in market, it is difficult to choose others.
0.765
If this brand was absent or unavailable in market, I cannot choose the right alternative.
0.834
If I don’t have this brand I feel dissatisfied. 0.815 If I don’t have this brand I feel worry. 0.791 If this brand was unavailable, I feel sad. 0.698 If in a meeting, people speak about this brand I will encourage them to buy this brand.
0.772
If someone does not like this brand I would again insist on this brand. 0.635 When I see this brand or its advertising, I feel happy because it is still popular and is available in market.
0.789
If this brand was unavailable, I feel that other brands cannot satisfy my need and feel sorry.
0.672
This brand is my first choice. 0.092 When I want to purchase something new, this brand is my first choice.
0.376
I have no bias to this brand. 0.408 It does not matter this brand was available or not. 0.542
Intimacy In a meeting when people speak about this brand, I try to say my usage experience of it.
0.319
If this brand was absent in market, its absence may be feel. 0.979 Pleasure This brand quality is high 0.599
I am satisfied when I use this brand 0.083 I feel good when using this brand 0.551 I feel happy when I see this brand’s advertising have this brand because I have it.
0.149
When I use this brand, I feel happy: my choice is not wrong 0.703 I feel good when using this brand because it has what I want 0.737 When I see this brand I feel passionate. 0.731 I have tried other brands, but I am not satisfied; this brand, however, has been very good
0.696
When I use this brand I feel proud of it. 0.748
Khazei Pool, A., Hanifi, F., Mirabi, V. R., Taghipourian, M. J.
10
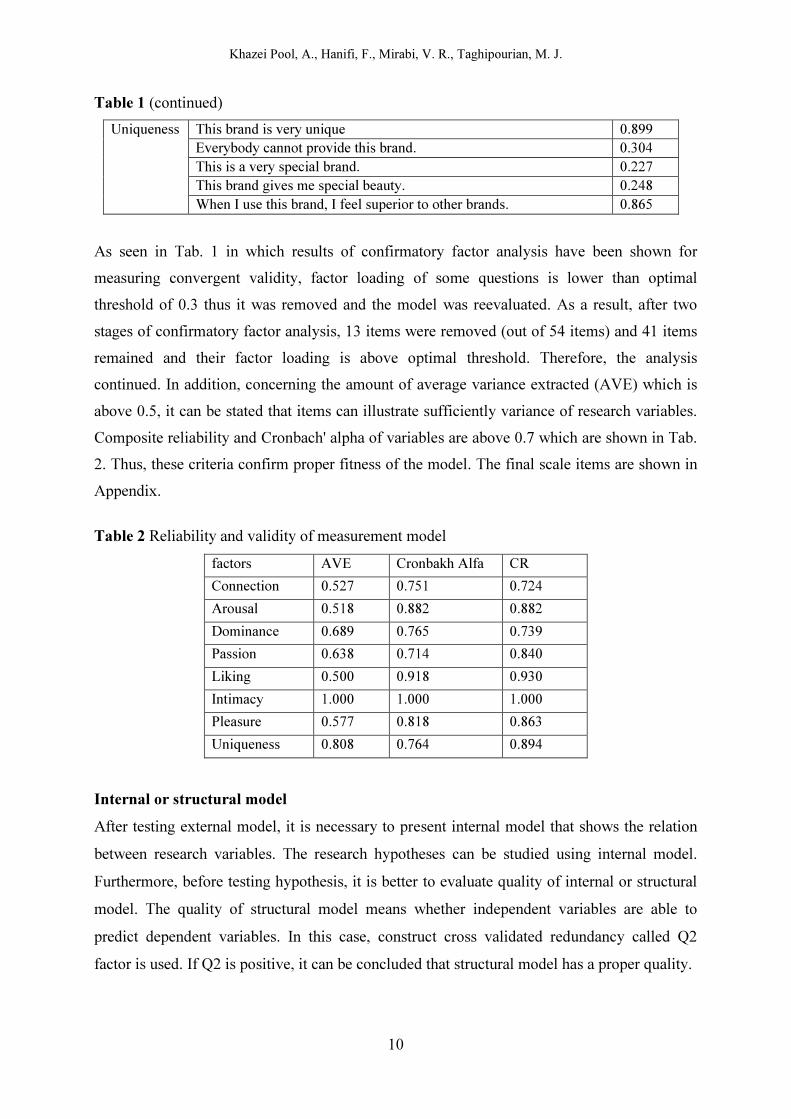
Table 1 (continued)
Uniqueness This brand is very unique 0.899 Everybody cannot provide this brand. 0.304 This is a very special brand. 0.227 This brand gives me special beauty. 0.248 When I use this brand, I feel superior to other brands. 0.865
As seen in Tab. 1 in which results of confirmatory factor analysis have been shown for
measuring convergent validity, factor loading of some questions is lower than optimal
threshold of 0.3 thus it was removed and the model was reevaluated. As a result, after two
stages of confirmatory factor analysis, 13 items were removed (out of 54 items) and 41 items
remained and their factor loading is above optimal threshold. Therefore, the analysis
continued. In addition, concerning the amount of average variance extracted (AVE) which is
above 0.5, it can be stated that items can illustrate sufficiently variance of research variables.
Composite reliability and Cronbach' alpha of variables are above 0.7 which are shown in Tab.
2. Thus, these criteria confirm proper fitness of the model. The final scale items are shown in
Appendix.
Table 2 Reliability and validity of measurement model
factors AVE Cronbakh Alfa CR
Connection 0.527 0.751 0.724
Arousal 0.518 0.882 0.882
Dominance 0.689 0.765 0.739
Passion 0.638 0.714 0.840
Liking 0.500 0.918 0.930
Intimacy 1.000 1.000 1.000
Pleasure 0.577 0.818 0.863
Uniqueness 0.808 0.764 0.894
Internal or structural model
After testing external model, it is necessary to present internal model that shows the relation
between research variables. The research hypotheses can be studied using internal model.
Furthermore, before testing hypothesis, it is better to evaluate quality of internal or structural
model. The quality of structural model means whether independent variables are able to
predict dependent variables. In this case, construct cross validated redundancy called Q2
factor is used. If Q2 is positive, it can be concluded that structural model has a proper quality.
Khazei Pool, A., Hanifi, F., Mirabi, V. R., Taghipourian, M. J.
11
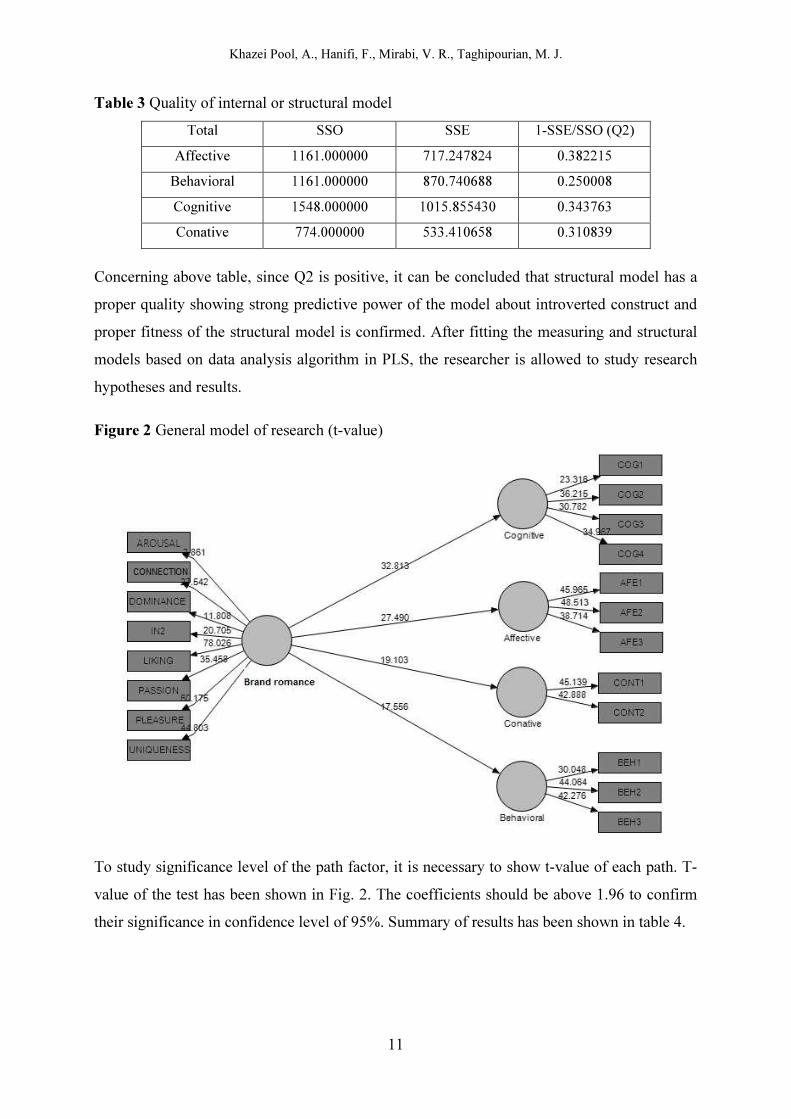
Table 3 Quality of internal or structural model
Total SSO SSE 1-SSE/SSO (Q2)
Affective 1161.000000 717.247824 0.382215
Behavioral 1161.000000 870.740688 0.250008
Cognitive 1548.000000 1015.855430 0.343763
Conative 774.000000 533.410658 0.310839
Concerning above table, since Q2 is positive, it can be concluded that structural model has a
proper quality showing strong predictive power of the model about introverted construct and
proper fitness of the structural model is confirmed. After fitting the measuring and structural
models based on data analysis algorithm in PLS, the researcher is allowed to study research
hypotheses and results.
Figure 2 General model of research (t-value)
To study significance level of the path factor, it is necessary to show t-value of each path. T-
value of the test has been shown in Fig. 2. The coefficients should be above 1.96 to confirm
their significance in confidence level of 95%. Summary of results has been shown in table 4.

Khazei Pool, A., Hanifi, F., Mirabi, V. R., Taghipourian, M. J.
12
Table 4 Path coefficients and testing results
Path path coefficient t value result
brand romance cognitive loyalty 0.759 32.813 confirmed
brand romance affective loyalty 0.733 27.490 confirmed
brand romance conative loyalty 0.653 19.103 confirmed
brand romance behavioral loyalty 0.612 17.556 confirmed
Tab. 4 shows results of hypotheses in form of path coefficients with significance level related
to research hypotheses. As seen in Tab. 4, the first hypothesis, the effect of brand romance on
cognitive loyalty, is confirmed because path significant factor of these variables is 32.813
which is higher than 1.96 showing significant effect of brand romance on cognitive loyalty in
confidence level of 95%. Thus, the hypothesis is confirmed. In other words, 75% of changes
in cognitive loyalty are due to brand romance.
Significance coefficient of the effect of brand romance on affective loyalty is higher than
optimal threshold (27.490). Therefore, such effect is significant and the hypothesis is
confirmed. Since the path coefficient is positive, the effect is positive and significant and the
size effect is 0.73. Therefore, the second hypothesis is confirmed.
Concerning significance coefficient of the effect of brand romance on conative loyalty (higher
than optimal threshold (19.103)), such effect is significant. Since the path coefficient is
positive, the effect is positive and significant. Therefore, it can be said that 65% of changes in
conative loyalty are due to brand romance. As a result, the third hypothesis is confirmed.
Significance coefficient of the effect of brand romance on affective loyalty is higher than
optimal threshold (17.556). Therefore, such effect is significant and the hypothesis is
confirmed. Since the path coefficient is positive, the effect is positive and significant thus the
effect size is 0.61. Therefore, the fourth hypothesis is confirmed.
DISCUSSION, COMPARISON AND CONCLUSION
The paper studied the effect of brand romance on customer loyalty in 4 and 5 star hotels of
Mazandaran and a scale was presented. 4 and 5 star hotels were chosen because brand is more
tangible in such hotels. First, a scale was prepared to measure brand romance by interviewing
with consumers of goods. Then, opinions of experts were obtained to proportionate the scale
with hotel and services. Consequently, confirmatory factor analysis was done on it and the
effect of brand romance on four types of loyalty was tested. Generally, there is no discussion

Khazei Pool, A., Hanifi, F., Mirabi, V. R., Taghipourian, M. J.
13
and comparison for this subject because there is no literature about this area. But few foreign
researches have been identified in this regard (Kruger et al, 2013; Patwardhan, 2004; Petzer et
al, 2014) and results of the present research are consistent with their results. Results of current
research proved that a brand romance between customers of the hotels and their brands may
be significantly effective on customers' loyalties. Oliver (1999) identified four areas of
loyalty. The first area is about the belief and cognition of customers. Being involved in belief
and cognition of the customer and being the first rank in mind of the customer are important
and critical points and it is recognized as the first stage of loyalty. Result of the research
indicated that if brand romance was created in hotels, it could be effective on belief and
cognition of hotel customers and it could remain in minds of customers. The name of hotel
will be recorded in the mind of customer as the first brand. The second area is the sense and
liking of customer to the brand. Affective loyalty is amount of liking of consumer to the brand
(Kumar Roy et al, 2009). The result indicated that creation of brand romance between
customers and hotels could lead to liking in long term. The third area is conative loyalty
which is stronger than affective loyalty. Frequent reception of defective goods will reduce
conative loyalty (Oliver, 1999). The fourth area is behavioral loyalty. It is a state by which
behavioral intentions will change into practice (Kumar Roy et al, 2009). Results of the
research showed that the romance between customers and brand of hotels could lead to
attitudinal loyalty (cognitive, affective and conative loyalties) and such attitude could change
into the practice as well thus behavioral loyalty was created in customers meaning purchase
and revisit of hotel, introducing the hotel to friends, relatives, positive statements about the
hotel. Therefore, concerning research results, followings can be suggested to the hotels:
1- The hotel managers should pay attention to brand and branding and brand identity
2- Determination of the level and amount of brand romance in hotels of Mazandaran for
future measures. If amount of brand romance is low in hotels, it should be increased.
3- Concerning that brand romance is the most effective on cognitive loyalty, hotel managers
should focus on this area and they should keep the name of brand (as a first place) in minds of
customer and some measures should be taken to reach this goal.
4- Results of the research showed that brand romance is more effective on attitudinal loyalty
of customers than behavioral loyalty. Therefore, it is necessary to take some measures in this
direction such as making customers pleasant when using services and providing unique
services in hotels.

Khazei Pool, A., Hanifi, F., Mirabi, V. R., Taghipourian, M. J.
14
The nature of the research and sample size may cause some problems for generalization of
results. In addition, samples affected by the culture may cause similar problems. Another step
in this direction is that backgrounds and consequences of brand romance are identified in
hotels of the province then they are studied quantitatively. Quantitative research may show
more issues such as the effect of identified factors and factors affecting brand romance. For
example, service features have many dimensions and the most important dimensions can be
identified as backgrounds.
REFERENCES
Ascher B. (1999), Dancing in the Dark: Romance, Yearning and the Search for the Sublime, Harper Collins Publishers Inc. N.Y. N.Y.
Fournier, S. (1998). Consumers and their brands: Developing relationship theory in consumer research. Journal of consumer research, 24(4), 343-373.
Holbrook, M. B., & Hirschman, E. C. (1982). The experiential aspects of consumption: Consumer fantasies, feelings, and fun. Journal of consumer research, 9(2), 132-140.
Kruger, L. M., Kuhn, S. W., Petzer, D. J., & Mostert, P. G. (2013). Investigating brand romance, brand attitude and brand loyalty in the cellphone industry: original research. Acta Commercii, 13(1), 1-10.
Kumar Roy, S., Butaney, G., & Bhutaney, B. (2009). Examining the effects of the customer loyalty states on the word of mouth. PACIS 2009 Proceedings, 85.
Lawshe, C. H. (1975). A quantitative approach to content validity. Personnel psychology, 28(4), 563-575.
Oliver, R. L. (1999). Whence consumer loyalty?. Journal of Marketing, 63, 33-44. Patwardhan, H., & Balasubramanian, S. K. (2011). Brand romance: a complementary
approach to explain emotional attachment toward brands. Journal of Product & Brand Management, 20(4), 297-308.
Patwardhan, H. (2004). The romance of brands: An interpersonal relationship approach to assess the antecedents and consequence of consumer attachment to the brand (Doctoral Dissertation), Southern Illinois University
Petzer, D., Mostert, P., Kruger, L-M. and Kuhn, S. (2014). The dimensios of brand romance as predictors of brand loyalty among cell phone users, South African Journal of Economic and Management Sciences, 17(4), 457-470
Rahimnia, F., Najafi, M., & Alavi, M. (2014). Brand audit and investigating the relationship between audit indicators in hospitality industry (A case of study: Shiraz Homa Hotel), New Marketing Research, 3(4), In Persian.
Sarkar, A. (2011). Romancing with a brand: A conceptual analysis of romantic consumer-brand relationship. Management & Marketing, 6(1), 79-94.
Schouten, J. W., & McAlexander, J. H. (1995). Subcultures of consumption: An ethnography of the new bikers. Journal of consumer research, 22(1), 43-61.
Shimp, T. A., & Madden, T. J. (1988). Consumer-object relations: A conceptual framework based analogously on Sternberg's triangular theory of love. NA-Advances in Consumer Research, 15, 163-168
Yeboah-Asiamah, E., Quaye, D. M., & Nimako, S. G. (2016). The effects of lucky draw sales promotion on brand loyalty in mobile telecommunication industry. African Journal of Economic and Management Studies, 7(1), 109-123.

Khazei Pool, A., Hanifi, F., Mirabi, V. R., Taghipourian, M. J.
15
Appendix Connection I feel happy for being interested in this brand. When I use this brand, I feel comfortable and relax. I try to increase my information about this brand to be able to defend this brand adequately if needed. This brand enhances my personality. I am dependent to this brand because I use it for long time. Arousal When I see this brand’s advertising, I am encouraged to buy this brand’s products. When I see this brand’s advertising, I feel I made the right choice. When I see this brand’s advertising, if someone was near me I will admire this brand. This brand is the only brand that has attracted me. When I see this brand’s advertising, my desire increase to attain it. If I see the advertising of this brand’s new product or service, I will follow it to attain more information. Good quality of this brand’s services will make me to purchase of it in next purchases. When I see this brand’s advertising, I feel good because I have or use its service or product. Dominance This brand is important and effective in everyday life of people. I always have a whim to use this brand’s product and services. When not use this brand for some day, it is always in my mind. Passion Because of my interest in this brand, I am its fan. When I see this brand, I start to admire it. This brand is so attractive. I prefer this brand to others. When using this brand I feel there are lots of unknown things about it that make me to reach them. If this brand is absent, I am forced to move to other brands, but I do not feel good. Liking I have a particular interest in this brand When others say something bad about this brand, I ask the reason If this brand was absent or unavailable in market, it is difficult to get used to others. If this brand was absent or unavailable in market, it is difficult to choose others. If this brand was absent or unavailable in market, I cannot choose the right alternative. If I don’t have this brand I feel dissatisfied. If I don’t have this brand I feel worry. If this brand was unavailable, I feel sad. If in a meeting, people speak about this brand I will encourage them to buy this brand. If someone does not like this brand I would again insist on this brand. When I see this brand or its advertising, I feel happy because it is still popular and is available in market. If this brand was unavailable, I feel that other brands cannot satisfy my need and feel sorry. This brand is my first choice. When I want to purchase something new, this brand is my first choice. I have no bias to this brand. It does not matter this brand was available or not.

Khazei Pool, A., Hanifi, F., Mirabi, V. R., Taghipourian, M. J.
16
Intimacy In a meeting when people speak about this brand, I try to say my usage experience of it. If this brand was absent in market, its absence may be feel. Pleasure This brand quality is high I am satisfied when I use this brand I feel good when using this brand I feel happy when I see this brand’s advertising have this brand because I have it. When I use this brand, I feel happy: my choice is not wrong I feel good when using this brand because it has what I want When I see this brand I feel passionate. I have tried other brands, but I am not satisfied; this brand, however, has been very good When I use this brand I feel proud of it. Uniqueness This brand is very unique Everybody cannot provide this brand. This is a very special brand. This brand gives me special beauty. When I use this brand, I feel superior to other brands.

DETUROPE – THE CENTRAL EUROPEAN JOURNAL OF REGIONAL DEVELOPMENT AND TOURISM
Vol. 10 Issue 2 2018 ISSN 1821-2506
17
Original scientific paper
REGIONAL DEVELOPMENT AND ITS MEASUREMENT IN
VISEGRAD GROUP COUNTRIES
Ingrid MAJEROVÁa
a Silesian University in Opava, School of Business Administration in Karvina Univerzitni nam. 1934/3, 73340 Karvina, Czech Republic, Phone:: +420596398256, e-mail: [email protected]
Cite this article: Majerová, I. (2018). Regional Development and its Measurement in Visegrad Group Countries. Deturope, 10(2), 17-37.
Abstract
The aim of the paper is to measure regional development and construct an index for the Visegrad Group countries at NUTS 2 level. This index, called the Regional Development Index - the RDI - is created as an extension of the Human Development Index in order to obtain a better composed index at regional level. Twelve socio-economic indicators are selected for this purpose: three economic indicators, three educational indicators, three health variables and three indicators of the standard of living which create four dimensions. These variables are tested for their reliability through the pairwise correlation and the min-max method is used for the construction of the index. The data are compared between 2008 and 2013 and the assumption about worsening the situation in regions after the crisis is set. The results show that the values of the RDI improved in nearly all regions (with the exception of Prague in the Czech Republic and Közép-Magyarország in Hungary) in the monitored years. The assumption that regional development was negatively influenced by economic crisis has not been confirmed. Keywords: Min-Max method, NUTS 2, Regional Development Index, Visegrad Group countries
INTRODUCTION
Regional or national development is usually measured by indicators such as domestic product,
national income, or alternatively by the Human Development Index and the Index of
Sustainable Economic Welfare or Gross National Happiness (Van den Bergh, 2009). While
getting the data and setting of the above mentioned measurements at national level is not too
complicated, the problem arises at the level of a region. Therefore, it is necessary to modify
the measurements at this level and to find suitable socio-economic indicators which should
contain adequate information. As Rovan & Sambt (2003) claim, the socio-economic issue
among regions should be of primary interest to economists as well as politicians and their
differences should be maintained within the sustainable limits for the sake of the welfare of
the country as a whole. The analysis of these indicators may serve as the basis for
development policy at the regional level. The major distinction in most cases is the fact that

Majerová, I.
18
regions are open spatial entities (in contrast to countries), while the competence of a region
may normally be superseded by the nations (Nijkamp & Abreu, 2009).
The aim of this paper is to construct a regional index for selected members of the European
Union by the most often used measurement of human development, the HDI, and to compare
this regional index in a period before and after the economic crisis. The countries of the
Visegrad Group (hereafter V4) at the NUTS 2 level have been chosen for the analysis. This
group includes 35 regions in the Czech Republic, Hungary, Poland and Slovakia – eight in the
Czech Republic, seven in Hungary, sixteen in Poland and four in Slovakia. The data were
obtained and compared for the years 2008 (before the crisis) and 2013 (after crisis). The
assumptions that regional development was negatively influenced by economic crisis and the
value of the RDI worsened between 2008 and 2013 were defined.
The Regional Development Index (hereafter the RDI) will be created as an extension of the
HDI in order to obtain a better composed index at regional level. Thirteen socio-economic
indicators will be selected for this purpose: three economic indicators (GDP per capita, R&D
expenditure and unemployment), three educational indicators (tertiary educated population,
people in lifelong learning and young people neither employed nor educated), three health
variables (life expectancy at birth, health personnel – number of doctors and infant mortality)
and four indicators of the standard of living (stock of vehicles i.e. – passenger cars, nights
spent at tourist accommodation establishments, victims by accidents – killed and municipal
waste). These variables will be tested for their reliability through the pairwise correlation and
the RDI will be constructed using the min-max method after the selection of the correlated
indicators.
Even though this paper is not the first attempt to study the development of (not only) the
above mentioned socio-economic indicators, it differs from the existing studies in using more
complex concepts of the given issue in the min-max method at the regional NUTS 2 level.
The paper is organized as follows: the second section presents a brief literature review, the
third section describes the model and methodology used in the paper. Section four discusses
the results in detail and the fifth section concludes the paper.
THEORETICAL BACKGROUND
The selection of indicators used in this paper was inspired by many studies in which the
authors confirmed linkages among some indicators.

Majerová, I.
19
Firstly, the implementation of the GDP indicator was influenced by Sen´s opinion (Sen,
1999) who considered the income (product) as a primary mean to achieve human
development. The relationship between economic growth and unemployment is very well
known according to Okun´s law. A further indicator, research and development expenditure
(R&D) and its increase is very important for increasing competitiveness (Bočková, 2013).
Nevima & Kiszová (2011) claim that gross domestic expenditures on research and
development are the sources for further economic growth. According to Hudec &
Prochádzková (2015), the innovative capacity of a region can be considered as its ability to
produce and commercialize innovations to drive a long-term economic growth and wealth
creation. They examined the regions of the Visegrad countries by considering R&D
expenditures by the concept of the knowledge production function (Cobb-Douglas type). The
result was that not the capital regions are the most innovative ones, because several Polish
regions (Lodzkie and Malopolskie) and Czech regions (Střední Morava and Jihovýchod)
belong to the most efficient regions. Similar results were obtained by Kozuń-Cieślak (2016)
who used the methods of the composite indicators and the DEA method.
Secondly, higher education and lifelong learning contribute to economic development as
well. Florida, Mellander & Stolarick (2008) assert that human capital and the creative class
affect regional development through different channels. Whilst the creative class outperforms
conventional educational attainment for regional labour productivity, conventional human
capital does better for regional income. Positive relation between tertiary graduates and
economic growth in Visegrad countries was found in Verner & Chudarkova (2013) as well.
The adult education systems (lifelong learning) currently in place tend to reinforce existing
economic disparities, with greater frequency of re-skilling and up-skilling by more educated
adults, with higher income levels (WEF, 2017).
Thirdly, Michaud & van Soest (2008) claim that in many industrialized countries there is a
positive association between health and wealth and population; health tends to rise with the
country's level of economic development (Semyonov et al. 2013). In addition, health
improvements tend to reduce the mortality rates of infants (Bloom & Canning, 2003). Anand
& Bärnighausen (2004) argue that a strong relevance between health personnel and infant
mortality exists in more than 80 countries.
Fourthly, Riley (2002) examined the influence of population growth, increased
urbanization and economic development on the rapid growth of motor vehicles in China.
Medlock & Soligo (2002) did a research on the effect of economic development on the
demand (numbers) of the motor vehicles in 28 countries and developed a model of the
relationship between economic development and per capita private car ownership. A practical

Majerová, I.
20
example of relationship between economic development and an amount of vehicles is obvious
with Toyota (Toyota, 2017): as the Japanese economy expanded (15% in the period of 1955-
1970), the demand for passenger cars in particular grew rapidly, and the sales volume
achieved an average annual growth rate of 32 percent. According to Tuan (2011), the gross
regional product per capita in Thailand Provinces might have strongly exponential effects on
car ownership. Shafik (1994) found out that increasing income indicates the waste generation
deterioration. Eugenio-Martin et al. (2004) state that tourism provides two positive effects on
economy: on one hand, an increase in production and income; on the other hand, as the
tourism sector is labour intensive, it causes an increase in employment. It has certainly
exerted a very important economic, productive, and cultural influence (Pérez and Nadal,
2005). Similarly, tourism plays an important role in solving economic and social problems,
providing more jobs, initiating the employment growth of economically active population and
increasing the welfare of a nation, and at the same time it has a stimulating effect on the
development of many related fields of the economy – it contributes to socio-economic
development (Gabdrakhmanov & Rubtsov, 2014). Borowy (2013) was dealing with road
traffic injuries using the discourse analysis. He explored how development has been (re-
)negotiated through the discourse of these injuries and vice versa. Gebru (2017) found that a
road traffic accident is a human security threat with multifaceted effects on the economy of
households and the national economies of states, especially in the developing countries. It
affects the national economy of countries and households directly or indirectly because it
causes a loss of the economically active population. According to Agbeboh & Osarumwense
(2013) accidents cause heavy costs to society especially in case of a loss of able bodied men
and women who would have been involved in productive economic activities as a loss of
intellectuals, a loss of resources to government and families, a loss to insurance companies
and a damage to properties. Road traffic injuries and deaths are a growing public health
problems worldwide. Banthia et al. (2006) have shown that road traffic injuries are major
causes of death and disability globally, with a disproportionate number occurring in
developing countries.
The Human Development Index is primarily a nation level indicator, estimated for a
country as a whole (Basu & Basu, 2005), but due to its general nature it cannot be applied by
all economies in general. Therefore, many countries have introduced their own modified
indexes in order to reflect their local circumstances better (Pagliani, 2010, or Gaye & Jha,
2010). Gnesi et al. (2010) have published the Index of the Regional Quality of Development
(QUARS) with the aim of providing a multidimensional measure of the development of
Italian regions, based on 41 individual indicators from different sources. The considered

Majerová, I.
21
dimensions are: Environment, Economy and labour, Rights and citizenship, Health, Education
and culture, Equal opportunities, Participation. The composite index is equal to the arithmetic
mean of seven macro-indicators, each of which corresponds to the mean of the standardized
values of the indicators that compose it.
Some authors analysed human development at regional level using cluster analysis, as in
the case of China between 1982 and 2003 (Yang & Hu, 2008) or in Kasim, Fron & Yaqub
(2011) regarding the HDI of Iraq in 2006. They divided the regions of the aforementioned
economies into four clusters. Akócsi, Bencze & Tóth (2012) analysed the Human
Development Index of the Visegrad countries on the ground of knowledge (human) resources
in the period of 2002-2007 and used 13 indicators for 35 regions according to an old
methodology of the HDI measurement.
Majerova & Nevima (2017) made the cluster analysis with the modified Human
Development Index (RNHDI) created for 46 regions of the Visegrad Group Plus countries
(countries of the V4 and Slovenia and Austria) at the NUTS 2 level. They used the same
methodology as by the HDI: three components were used – the health dimension (life
expectancy at birth), the knowledge dimension (tertiary educated people and participation rate
in education and training) and the dimension of living standard (GDP per capita in PPS). The
authors defined the hypothesis about dynamization of regions (movement from lower to
higher cluster/level of development), which was not confirmed.
The above mentioned authors (Nevima & Majerova, 2016) applied factor analysis of
human development within the same group of countries as well. Their assumption that the
most important factor of human development is economic level, measured by gross domestic
product per capita, was not confirmed and was found that the most important role is played by
another factor - life-long learning. This finding confirms that education of population is a very
important variable of regional as well as national significance.
The closest research to the topic of this paper was done by Hardeman & Dijkstra (2014)
who developed a composite indicator which was capable to measure patterns and trends in
human development across the EU region in 2012. They chose (only) six reliable indicators
out of 22 – healthy life expectancy, infant mortality, NEET, general tertiary education, net
disposable income and employment rate, using the min-max model.
OBJECTIVES AND METHODS
This paper investigates the impact of economic crisis on regional development of all regions
in the Visegrad Group countries. At first, a sample and variables (as a model) are described

Majerová, I.
22
and selected through pairwise correlation. Subsequently, they are used in the Regional
Development Index by the min-max method (according to UNDP, 2016).
Model
The economic geography of Europe is characterised by wide levels of a number of socio-
economic variables that are both a cause and a response to differences in growth and levels of
income per capita (Fingleton, 2003). As it has already been mentioned, the Visegrad Group
countries (V4) at the NUTS 2 level are analysed. There are 35 regions at this level – eight in
the Czech Republic, seven in Hungary, sixteen in Poland and four in Slovakia. The list of the
regions in our sample is shown in Table 1.
Table 1 The List of the Regions of the V4
Region St.
name
Region St.
name
Region St.
name
Praha CZ01 Lódzkie PL11 Bratislavský kraj SK01
Střední Cechy CZ02 Mazowieckie PL12 Západné Slovensko SK02
Jihozápad CZ03 Malopolskie PL21 Stredné Slovensko SK03
Severozápad CZ04
Slaskie PL22
Východné Slovensko
SK04
Severovýchod CZ05 Lubelskie PL31
Jihovýchod CZ06 Podkarpackie PL32
Střední Morava CZ07 Swietokrzyskie PL33
Moravskoslezsko CZ08 Podlaskie PL34
Wielkopolskie PL41
Közép-Magyarország
HU10 Zachodniopomorskie
PL42
Közép-Dunántúl HU21 Lubuskie PL43
Nyugat-Dunántúl HU22 Dolnoslaskie PL51
Dél-Dunántúl HU23 Opolskie PL52
Észak-Magyarország
HU31 Kujawsko-Pomorskie
PL61
Észak-Alföld HU32
Warminsko-Mazurskie
PL62
Dél-Alföld HU33 Pomorskie PL63 Source: Eurostat (2017)
As it has been noted, the annual data were obtained from the Eurostat regional database
(Eurostat, 2017), which contains data for NUTS 1 to 3 regions. Not all the data are available
for all regions of the EU and for each level of classification, so the selection of indicators was
rather limited. For the purpose of this paper, thirteen regional socio-economic variables were
chosen, the units, codes and relations of which can be found in Table 2. There are three
economic indicators (GDP per capita, R&D expenditure and unemployment), three
educational ones (tertiary educated population, proportion of people in lifelong learning and

Majerová, I.
23
young people neither employed nor in education), three health variables (life expectancy at
birth, health personnel measured by the number of doctors and infant mortality) and four
indicators of the standard of living (stock of vehicles measured by the number of passenger
cars, nights spent at tourist accommodation establishments, victims killed by accidents and
municipal waste). For the four indicators of standard of living, the three most suitable ones
have been chosen. All variables are applied in the years before crisis (2008) and after crisis
(2013), for the last year when the data of all the variables in all regions are available.
Since some variables have been listed in absolute values that are not suitable for
constructing the composite index, they have to be recalculated and relative indicators are
created, adjusting the values for the total population of the respective regions, see column
“Unit”. Some of the variables are considered to have a positive impact on development and
some of them negative. This assumption is tested in the following section and the direction is
very important for choosing a proper method of measurement (see in the following part as
well).
Table 2 Development indicators (units, codes and direction)
Indicator Unit Code Impact
Gross domestic product per capita in PPS GDP positive Research and development expenditure per capita in PPS RDE positive Unemployment rate % of total active
population (age 25-64)
UNP negative
Tertiary educated people % of total active population
TEE positive
Lifelong learning % of total population LLL positive Young people neither in employment nor in education and training
% of population (age 15-24)
NET negative
Life expectancy at birth years LEB positive Health personnel per 100 thousand
inhabitants HEP positive
Infant mortality numbers per 1000 live births
MRT negative
Stock of vehicles (passenger cars) per 1000 inhabitants PSC positive Nights spent in tourist accommodation establishment per 1000 inhabitants NTS positive Victims of accidents per Mio inhabitants VOA negative Municipal waste tones per capita WST negative Source: authors´ own processing
The first chosen variable is the GDP per capita (GDP). The per capita values reflect the
economic level better than absolute values. In contrast to income of households, GDP per
capita reflects the economic performance of all entities in the region, so it is more appropriate
for the creation of a composite index. The indicator is measured by an artificial European

Majerová, I.
24
currency unit, the purchasing power standard (PPS). The price differences across countries
and regions mean that different amounts of national currency units are needed for the same
goods and services. The Purchasing Power Standard (PPS) is a fictive currency unit that
removes differences in purchasing power, i.e. different price levels between countries. These
parities are obtained as a weighted average of relative price ratios with respect to a
homogeneous basket of goods and services, both comparable and representative for each
country. Theoretically, one PPS can buy the same amount of goods and services in each
country (Eurostat, 2014). The higher values of GDP per capita are associated with higher
levels of development.
Intramural R&D expenditures (RDE) are all expenditures for R&D performed within a
statistical unit or sector of the economy during a specific period, whatever the source of funds
(OECD, 2002, p. 108). R&D is an activity involving significant transfers of resources among
units, organisations and sectors and especially between government and other actors. The
main disadvantage of expressing R&D input series in monetary terms is that they are affected
by differences in price levels between countries and over time. It can be shown that current
exchange rates often do not reflect the balance of R&D prices between countries and that in
times of high inflation general price indices do not accurately reflect trends in the cost of
performing R&D. The OECD (2002) recommends using purchasing power parities (PPP) and
the implicit gross domestic product (GDP) for R&D statistics, although it is recognized that
they reflect the opportunity cost of the resources devoted to R&D rather than the “real”
amounts involved. For the purpose of this paper, relative indicator per capita in PPS was used.
This indicator is positive for the regional development.
An indicator of Unemployment (UNP) by sex, and age in NUTS 2 regions represents all
inhabitants aged 25 or over and is expressed as a percentage of active inhabitants in the age of
25-64 years. This age level was chosen to complement the age group used in the indicator
NET, i. e. the age group between 15 and 24. This indicator (its high level) has negative
effects on regional development, representing a social problem connected with negative
effects on economic activities.
The share of Tertiary educated people (TEE) in the productive age population of the
region is connected with the ability of people (and regions) to reflect the needs of knowledge
of economy, and it also reflects the level of human development.
Lifelong learning (LLL) as the percentage of the regional population participating in
education and training encompasses all learning activities undertaken throughout life (after
the end of initial education) with the aim of improving knowledge, skills and competences,
within personal, civic, social or employment-related perspectives (Eurostat, 2017). Due to

Majerová, I.
25
lifelong learning people extend their possibilities for increasing their incomes, well-being and
development. These indicators´ higher values are associated with higher levels of
development.
The indicator Young people neither employed nor in education or training (NET)
corresponds to the percentage of the total population of a given age group (15-24) that is not
employed and not involved in further education or training. The age group was selected to
complement the age range used for UNP to eliminate too high correlation or autocorrelation.
This variable has a negative effect on development.
The life expectancy at birth (LEB) reflects the level of health and quality of life and it
measures the qualitative aspects of living a healthy life. Its high values are associated with
higher levels of human development – the higher the healthy life expectancy of a region, the
more developed it is.
The higher values of number of health personnel are associated with higher levels of the
economic development as well. Health personnel indicator (HEP) includes medical doctors
that are active in the health care sector, irrespective of the sector of employment (i.e. whether
they are independent, employed by a hospital or any other healthcare provider). The density
rates are used to describe the availability of this kind of medical staff and expressed as their
number per 100,000 inhabitants.
Infant mortality rate (MRT) reflects the number of deaths of children under one year of
age per thousand live births. Regional differences in infant mortality may reflect the
differences in wealth and spending of healthcare. In our research, the infant mortality rate can
be a measure of the health and social condition of the region. It is a composite of a number of
component rates, which have their separate relationship with various social factors and can
often be seen as an indicator to measure the level of socio-economic diversity within regions.
The indicators of standard of living are stock of vehicles (cars), nights spent in a tourist
establishment, amount of waste, and victims of accidents. In this paper, the Stock of vehicles
represents the number of passenger cars (PSC)1 per thousand inhabitants in the mentioned
regions. The number of cars corresponds to the standard of living of the population in the
direct proportion; therefore the development impact is positive.
The variable Nights spent at tourist accommodation establishments (NST) is calculated
as total nights per thousand inhabitants spent by a guest, resident or a non-resident in a region.
1Passenger car is presented by road motor vehicle, other than a moped or a motorcycle, intended for the carriage of passengers and designed to seat no more than nine persons (including the driver). Included are: passenger cars, includes micro cars (needing no permit to be driven), vans designed and used primarily for transport of passengers, taxis, hire cars (provided that they have fewer than ten seats), ambulances and motor homes. Excluded are light goods road vehicles, as well as motor-coaches and buses, and mini-buses/mini-coaches (Eurostat, 2017).

Majerová, I.
26
Tourist establishments are hotels and similar accommodation, holiday and other short-stay
accommodation, camping grounds, recreational vehicle parks and trailer parks. As it has been
mentioned, tourism (in this research the capacity utilization of tourist facilities) contributes to
the development of a region.
The quantity of waste reflects the differences in economic wealth among regions –
wealthier regions usually generate more municipal waste and have a negative impact not only
on environment but on development as well. In this paper, Municipal waste (WST) expresses
the total waste per inhabitant in tons and it consists of waste collected by the municipal
authorities, or directly by the private sector (business or private non-profit institutions). The
bulk of the waste stream originates from households, though similar wastes from sources such
as commerce, offices, public institutions and selected municipal services are included as well.
It also contains bulky waste, but excludes waste from municipal sewage networks and
municipal construction and demolition waste (Eurostat, 2017).
The last but not least variable is the Victims of accidents (VOA) per million inhabitants of
the region. For the purpose of our paper the persons killed (any person killed immediately or
dying as a result of an injury accident2, with the exception of terrorist acts and suicides), were
selected, due to no possibility of their further positive contribution to enhance regional
development (through consumption, higher education or lifelong learning etc.). This variable
is chosen as a factor with a negative influence.
Methodology
The purpose of this paper is to construct a composite index of regional development using the
min-max model (UNDP, 2016). A majority of the previous studies were devoted to analyses
of other methods or a narrower range of this index, but a more comprehensive analysis is
made in this paper.
Concerning the RDI index, not only the same method as the HDI construction was chosen
(with minor deviations, see below), but also the same principle of its creation, i.e. – the
component indicators should be assigned the same weight and divided into the relevant
dimensions with a positive or negative influence on development. Suitability of selected
indicators, weight and impact, was tested through the pairwise correlation analysis, namely
2Injury accident is any accident involving at least one road vehicle in motion on a public road or private road to which the public has a right of access, resulting in at least one injured or killed person. It includes collisions
between road vehicles; between road vehicles and pedestrians; between road vehicles and animals or fixed
obstacles and with one road vehicle alone. Included are collisions between road and rail vehicles. Multi-vehicle
collisions are counted as only one accident provided that any successive collisions happen within a very short
time period. Injury accidents exclude accidents incurring only material damage (Eurostat, 2017).
Majerová, I.
27
the Pearson correlation coefficient (UNDP, 2015 or Halásková & Mikušová Meričková,
2017).
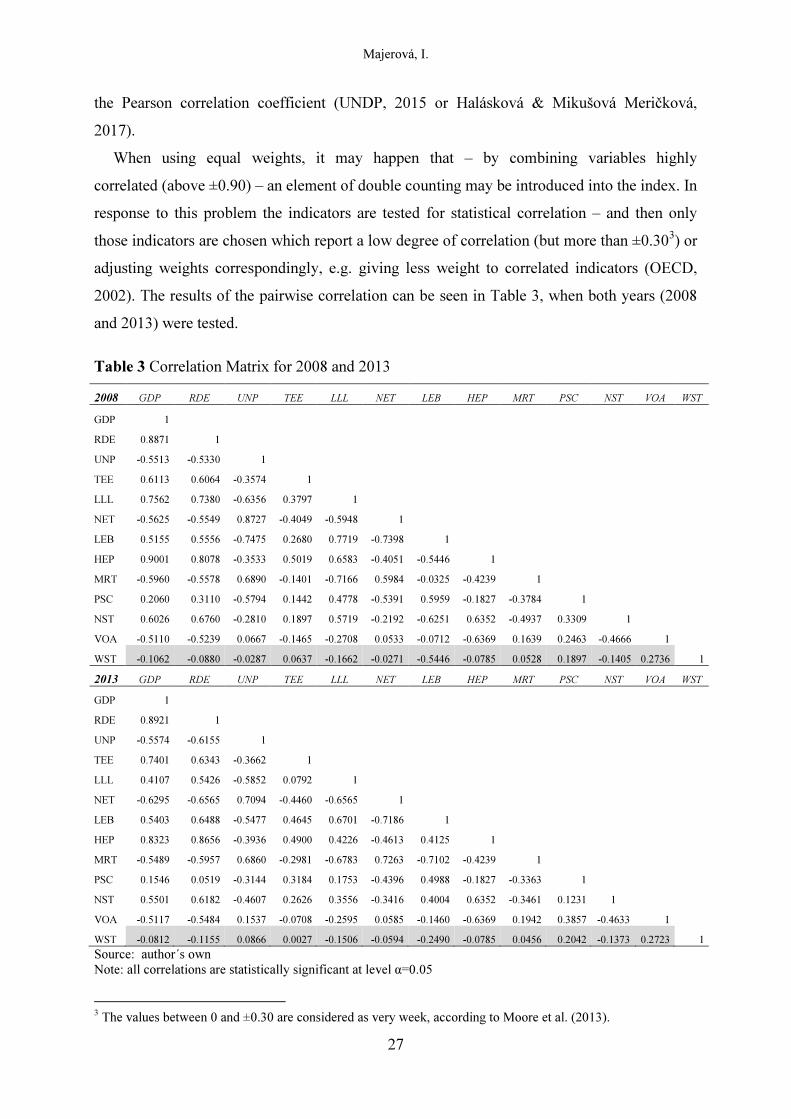
When using equal weights, it may happen that – by combining variables highly
correlated (above ±0.90) – an element of double counting may be introduced into the index. In
response to this problem the indicators are tested for statistical correlation – and then only
those indicators are chosen which report a low degree of correlation (but more than ±0.303) or
adjusting weights correspondingly, e.g. giving less weight to correlated indicators (OECD,
2002). The results of the pairwise correlation can be seen in Table 3, when both years (2008
and 2013) were tested.
Table 3 Correlation Matrix for 2008 and 2013
2008 GDP RDE UNP TEE LLL NET LEB HEP MRT PSC NST VOA WST
GDP 1
RDE 0.8871 1
UNP -0.5513 -0.5330 1
TEE 0.6113 0.6064 -0.3574 1
LLL 0.7562 0.7380 -0.6356 0.3797 1
NET -0.5625 -0.5549 0.8727 -0.4049 -0.5948 1
LEB 0.5155 0.5556 -0.7475 0.2680 0.7719 -0.7398 1
HEP 0.9001 0.8078 -0.3533 0.5019 0.6583 -0.4051 -0.5446 1
MRT -0.5960 -0.5578 0.6890 -0.1401 -0.7166 0.5984 -0.0325 -0.4239 1
PSC 0.2060 0.3110 -0.5794 0.1442 0.4778 -0.5391 0.5959 -0.1827 -0.3784 1
NST 0.6026 0.6760 -0.2810 0.1897 0.5719 -0.2192 -0.6251 0.6352 -0.4937 0.3309 1
VOA -0.5110 -0.5239 0.0667 -0.1465 -0.2708 0.0533 -0.0712 -0.6369 0.1639 0.2463 -0.4666 1
WST -0.1062 -0.0880 -0.0287 0.0637 -0.1662 -0.0271 -0.5446 -0.0785 0.0528 0.1897 -0.1405 0.2736 1
2013 GDP RDE UNP TEE LLL NET LEB HEP MRT PSC NST VOA WST
GDP 1
RDE 0.8921 1
UNP -0.5574 -0.6155 1
TEE 0.7401 0.6343 -0.3662 1
LLL 0.4107 0.5426 -0.5852 0.0792 1
NET -0.6295 -0.6565 0.7094 -0.4460 -0.6565 1
LEB 0.5403 0.6488 -0.5477 0.4645 0.6701 -0.7186 1
HEP 0.8323 0.8656 -0.3936 0.4900 0.4226 -0.4613 0.4125 1
MRT -0.5489 -0.5957 0.6860 -0.2981 -0.6783 0.7263 -0.7102 -0.4239 1
PSC 0.1546 0.0519 -0.3144 0.3184 0.1753 -0.4396 0.4988 -0.1827 -0.3363 1
NST 0.5501 0.6182 -0.4607 0.2626 0.3556 -0.3416 0.4004 0.6352 -0.3461 0.1231 1
VOA -0.5117 -0.5484 0.1537 -0.0708 -0.2595 0.0585 -0.1460 -0.6369 0.1942 0.3857 -0.4633 1
WST -0.0812 -0.1155 0.0866 0.0027 -0.1506 -0.0594 -0.2490 -0.0785 0.0456 0.2042 -0.1373 0.2723 1
Source: author´s own
Note: all correlations are statistically significant at level α=0.05
3 The values between 0 and ±0.30 are considered as very week, according to Moore et al. (2013).

Majerová, I.
28
As shown in the above table, the indicator of waste (WST) reported a very low value (less
than ±0.30) in both monitored years, so it does not correlate with any other indicators and has
been excluded for further analysis. Even though the indicator VOA showed lower values of
correlation in more than half of the cases, it has not been excluded from further analysis
(because of higher value of the rest of indicators). Then, 12 indicators with the same weight
were left, and four dimensions were created from these indicators, each with three indicators,
two positive and one negative, according to the results of correlation (see Table 4).
Table 4 Development indicators (units, codes and direction)
Dimension Indicators Index
Economic GDP (+) RDE (+) UNP (-)
EC
Education TEE (+) LLL (+) NET (-)
ED
Health LEB (+) HEP (+) MRT (-)
HE
Standard of living PSC (+) NST (+) VOA (-)
SL
Source: author´s own
The methodology of constructing a composite index follows the logic of the HDI
calculation (UND, 2016 and Hardeman & Dijkstra, 2014). However, the calculation of the
new index has to be modified. Firstly, the same values were not used due to the inclusion of
minimum values from data corresponding to the low level of development in developing
countries. For the higher perceived value of the created RDI index, data (min/max)
corresponding to the comparability of the EU regions were selected. Secondly, the
modification of the data was also based on the fact that the data used for creation of the HDI
index are unavailable at the regional level (available only at national one).
According to the chosen method, it was necessary to define the minimum and maximum
values for each indicator in the monitored years. To determine the minima, the worst results
of individual indexes from all NUTS 2 regions of the European Union have been chosen,
while for the maxima the best ones. One exception was made in case of the GDP per capita,
where the second highest value was chosen. The reason for this was easy – the highest values
of the GDP per capita are presented in the region of Luxembourg for both monitored years
and these values are extremely high, more than 20,000 PPS higher than the second highest

Majerová, I.
29
value (Hamburg). So the values of the Hamburg region were determined as maxima. The
values of indicators, regions and countries are shown in Tab. 5.
Table 5 The minimum and maximum values of indicators
Comp. 2008 2013
MIN MAX MIN MAX
GDP 7,500
(Severozapaden, BUL)
52,600
(Hamburg, GE)
7,700
(Severozapaden, BUL)
54,500
(Hamburg, GE)
RDE 6.4
(Severen tsentralen,
BUL)
1998.9
(Brabant Wallon, BE)
11.1
(Severen tsentralen,
BUL)
3500.2
(Brabant Wallon, BE)
UNP 1.6
(Utrecht, NL)
15.8
(Andalucía, ES)
2.3
(Oberbayern, GE)
33.4
(Andalucía, ES)
TEE 6.7
(Sud-Mutenia, RO)
45.0
(Helsinki-Uusimaa, FIN)
11.4
(Sud-Mutenia, RO)
49.3
(Helsinki-Uusimaa, FIN)
LLL 0.8
(Notio Aigaio, GR)
34.3
(Hovestaden, DK)
0.9
(Severentsentralen,
BUL)
35.4
(Hovestaden, DK)
NET 2.4
(Overijssel, NL)
27.1
(Campania, IT)
4.1
(Oberbayern, GE)
33.9
(Severozapaden, BL)
LEB 70.6
(Latvija)
82.3
(Marche, IT)
74.1
(Lietuva)
84.8
(Com. De Madrid, ES)
HEP 127.3
(Flevoland, NL)
831.5
(Attiki, GR)
132.3
(Flevoland, NL)
867.3
(Attiki, GR)
MRT 1.4
(Notio Aigaio, GR)
13
(Sud-Est, RO)
1.3
(Etela-Suomi, FI)
10.3
(Sud-Est, RO)
PSC 109
(Sud-Est, RO)
1,100
(Valle D´Aosta, IT)
167
(Sud-Est, RO)
1,051
(Valle D´Aosta, IT)
NST 450
(Nord-Est, RO)
48,691
(Tirol, AT)
487
(Nord-Est, RO)
62,552
(Notio Aigaio, GR)
VOA 16
(Wien, AT)
204
(Prov. Luxembourg, BE)
10
(Wien, AT)
159
(Alentejo, PT)
Source: Eurostat (2017)
To determine various indices, two types of calculations were used: index for variables with
positive direction (1)
minmax
min
VV
VVV
real
index
(1)
and index for variables with negative direction (2)
maxmin
max
VV
VVV
real
index
, (2)
where Vindex is the respective value of the 12 component indicators, Vreal is a real value,
Vmin is a minimum value and Vmax is a maximum value. The values of the sub-indexes EC,

Majerová, I.
30
ED, HE and SL are calculated as the arithmetic means of the three component values of the
dimension (3)
3
3,2,1, iii
is
VVVV
. (3)
The principle of the Regional Development Index is calculated as the geometric mean of
all the above indices, as shown in (4)
4SLHEEDELRDI . (4)
The required data for calculations of the RDI are listed in the Appendix I and II, the values
of the components are shown for the years 2008 and 2013. 2008 was the year before the crisis
in the EU and 2013 is the year after it (for which the latest data are available for all the
indicators and all the countries). Decreasing values of RDI within regions were expected in
the monitored period.
RESULTS AND DISCUSSION
Four dimensions of regional development were used for the research – an economic index, an
education index, a health index and a standard of living index. The component values of
socio-economic indicators in the indexes were calculated as coefficients according to the min-
max method with equal weights. These dimensions were then converted into the index RDI
using a geometric mean. The sub-indexes and the composite index RDI are presented in
Appendix I for the year 2008 and Appendix II for the year 2013.
The results are as follow: Firstly, the obtained values of the RDI are, with the exception of
the regions of the capitals in the Czech Republic and Slovakia (Praha and Bratislavský kraj),
very low taking into account the index interval of ‹0;1›. The first mentioned region reached
the value above 0.6 in both monitored years, the second region more than 0.5. The rest of the
regions have the values from 0.183 (Észak-Magyarország in 2008) to 0.441 (Jihovýchod in
2013). Disparities exist not only among countries, but among regions of every country as
well. The biggest differences were among the regions of Slovakia (the difference between the
highest and the lowest value is greater than the index value for the least developed region),
followed by the regions of the Czech Republic and Hungary. The most stable values of the

Majerová, I.
31
RDI were found in Poland, but here the capital region does not have an outstanding value
either.
Secondly, if we observe the differences between years 2008 and 2013 (see Figure 1), we
can see worsening of the index values in two regions - Praha and Közép-Magyarország
(arrows pointing down), the value of the RDI remained the same or improved in the rest of the
regions. The largest improvement of this index was recorded in the regions Mazowiecke and
Dolnoslaskie (arrows pointing up), both in Poland. Generally, the regions of Poland achieved
larger improvements from 2008 to 2013 than other regions of the V4 countries and no region
worsened its position from the viewpoint of the regional human development.
Figure 1 RDI in the Visegrad Group in 2008 and 2013
Source: author´s own
A comparison of the development of the RDI values from the perspective of individual
economies is shown in Table 6. The highest values of the index were achieved in the regions
with capitals in both monitored periods (with the exception of Poland in 2008, where the
region around Krakow showed the best results). On the other hand, the border regions (with
the exception of the region in central Poland in 2008) showed the lowest values of RDI index.
The Czech Republic than achieved the best results, followed by Slovakia and Poland, the
worst results on average achieved the Hungarian regions.
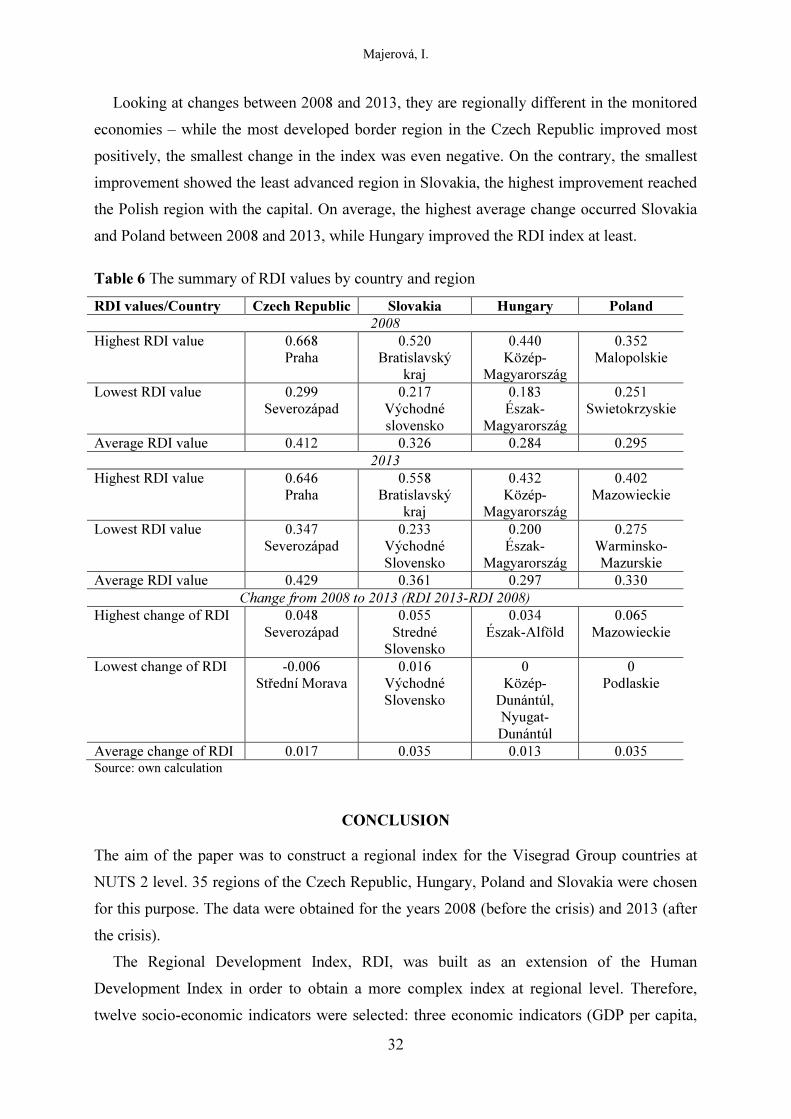
Majerová, I.
32
Looking at changes between 2008 and 2013, they are regionally different in the monitored
economies – while the most developed border region in the Czech Republic improved most
positively, the smallest change in the index was even negative. On the contrary, the smallest
improvement showed the least advanced region in Slovakia, the highest improvement reached
the Polish region with the capital. On average, the highest average change occurred Slovakia
and Poland between 2008 and 2013, while Hungary improved the RDI index at least.
Table 6 The summary of RDI values by country and region
RDI values/Country Czech Republic Slovakia Hungary Poland
2008
Highest RDI value 0.668 Praha
0.520 Bratislavský
kraj
0.440 Közép-
Magyarország
0.352 Malopolskie
Lowest RDI value 0.299 Severozápad
0.217 Východné slovensko
0.183 Észak-
Magyarország
0.251 Swietokrzyskie
Average RDI value 0.412 0.326 0.284 0.295 2013
Highest RDI value 0.646 Praha
0.558 Bratislavský
kraj
0.432 Közép-
Magyarország
0.402 Mazowieckie
Lowest RDI value 0.347 Severozápad
0.233 Východné Slovensko
0.200 Észak-
Magyarország
0.275 Warminsko-Mazurskie
Average RDI value 0.429 0.361 0.297 0.330 Change from 2008 to 2013 (RDI 2013-RDI 2008)
Highest change of RDI 0.048 Severozápad
0.055 Stredné
Slovensko
0.034 Észak-Alföld
0.065 Mazowieckie
Lowest change of RDI -0.006
Střední Morava 0.016
Východné Slovensko
0 Közép-
Dunántúl, Nyugat-Dunántúl
0 Podlaskie
Average change of RDI 0.017 0.035 0.013 0.035 Source: own calculation
CONCLUSION
The aim of the paper was to construct a regional index for the Visegrad Group countries at
NUTS 2 level. 35 regions of the Czech Republic, Hungary, Poland and Slovakia were chosen
for this purpose. The data were obtained for the years 2008 (before the crisis) and 2013 (after
the crisis).
The Regional Development Index, RDI, was built as an extension of the Human
Development Index in order to obtain a more complex index at regional level. Therefore,
twelve socio-economic indicators were selected: three economic indicators (GDP per capita,

Majerová, I.
33
R&D expenditure and unemployment), three educational (tertiary educated population, people
in lifelong learning and young people neither employed nor in education), three health
variables (life expectancy at birth, health personnel measured by number of doctors and infant
mortality) and three indicators of the standard of living (stock of vehicles measured by
passenger cars, nights spent at tourist accommodation establishments, and victims killed by
accidents). These variables were tested for their reliability by pairwise correlation and then
the RDI was constructed using the min-max method.
The results revealed huge disparities among countries and among regions. The most
developed ones are two capital regions – in the Czech Republic (Prague) and in Slovakia
(Bratislavský kraj), in contrast to the least developed regions Észak-Magyarország (Hungary)
and Východné Slovensko (Slovakia). The values of the RDI improved between 2008 and
2013 in nearly all the regions (with the exception of Prague in the Czech Republic and Közép-
Magyaroszág in Hungary). The assumptions that regional development was negatively
influenced by economic crisis, and the value of the RDI worsened between 2008 and 2013,
have not been confirmed.
The method of computation, namely, that minimum and maximum values used for the
normalisation of data were defined based on all the NUTS 2 regions of the EU, make the
computed RDI values of the V4 countries comparable to similarly computed RDI values of all
NUTS 2 regions of the EU in the selected years.
Acknowledgement
This work was supported by the students´ grant project “Influence of Selected Macroeconomic and Microeconomic Determinants on the Competitiveness of Regions and Firms in Countries of the Visegrad group Plus”. The project registration number is SGS/13/2015.
REFERENCES
Agbeboh, G. U., & Osaarumwense, O-I. (2013). Empirical Analysis of road traffic accident: A case study of Kogi State, North-Central Nigeria: Ambrose Alli University. Ekpoma Nigeria, 8(40), 1923-1933.
Akócsi, I. L., Bencze, S., & Tóth, T. (2012). New Determination of Human Development at Regional Level in the Countries of Visegrad. Selye e-studies. [10-08-2017] Retrieved from http://www.selyeuni.sk/gtk/e-studies/en/homepage/doc_details/8-201202.html
Anand, S., & Bärnighausen, T. (2004). Human resources and health outcomes: cross-country econometric study. The Lancet, 364(9445), 1603-1609.
Banthia, P., Koirala, B., Rauniyar, A., Chaudhary, D., Kharel, T., & Khadka, S. B. (2006). An epidemiological study of road traffic accident cases attending emergency department of teaching hospital. J. Nepal Med. Assoc, 45(162), 38-243.
Basu, S., & Basu, P. (2005). Regional Disparity in Australia: Analysis of Gender Development Index. International Review of Business Research Paper, 1(2), 56-66.
Majerová, I.
34
Bloom, D., & Canning, D. (2003). Health as Human Capital and its Impact on Economic Performance. The Geneva Papers on Risk and Insurance, 28(2), 304-315.
Bočková, N. (2013). Visegrad Four Countries: Evaluation in R&D Sectors of Performance. Acta Universitatis Agriculturae et Silviculturae Mendelianare Brunensis, 61(4), 873-880.
Borowy, I. (2013). Road Traffic Injuries: Social Change and Development. Medical History, 57(1), 108-138.
Eugenio-Martin, J. L., Morales, N. M., & Scarpa, R. (2004). Tourism and Economic Growth in Latin American Countries: A Panel Data Approach. FEEM Working Paper No. 26.2004. Milano: FEEM.
Eurostat (2014). Glossary: Purchasing power standard (PPS). Retrieved January 4, 2018, from ec.europa.eu/eurostat/Statistic-explained/index.php/Glossary:Purchasing_power_standard_(PPS)
Eurostat (2017). Regional Database. Retrieved September 10, 2017, from http://ec.europa.eu/eurostat/web/regions/data/database
Fingleton, B. (2003). European Regional Growth. Berlin-Heidelberg: Springer-Verlag. Florida, R., Mellander, Ch., & Stolarick, K. (2008). Inside the black box of regional
development—human capital, the creative class and tolerance. Journal of Economic Geography, 8(5), 615-649.
Gabdrakhmanov, N. K., & Rubtsov, V. A. (2014). Tourist and Recreational Positioning of Tatarstan Republic: Cluster Analysis. World Applied Sciences Journal (Management, Economics, Technology & Tourism), 30, 202-205.
Gaye, A., & Jha, S. (2010) A Review of Conceptual and Measurement Innovations in National and Regional Human Development Reports, 1998-2009. Human Development Research Paper 2010/21. New York: UNDP.
Gebru, M. K. (2017). Road traffic accident: Human security perspective. International Journal of Peace and Development Studies. 8(2), 15-24, March 2017.
Gnesi, C., Serge, E., & Villa, A. (2010). Come si vive in Italia? Rapporto QUARS 2010 – Indice di qualità regionale dello sviluppo. [08-09-2017]. Retrieved from https://www.scribd.com/document/89126214/quars-2010
Halásková, R., & Mikušová Meričková, B. (2017). Socio-economic development, income inequality and redistribution. Ekonomická revue – Central European Review of Economic Issues, 20, 29-41.
Hardeman, S., & Dijkstra, L. (2014). The EU Regional Human Development Index. JRC Science and Policy Reports. Report EUR 26817. Luxembourg: Publications Office of the European Union.
Hudec, O., & Prochádzková, M. (2015). Visegrad Countries and Regions: Innovation Performance and Efficiency. Quality Innovation Prosperity, 19(2), 55-72.
Kasim, J., Fron, H., & Yaqub, H. (2011). Using cluster analysis to assess the dimensions of the HDI in Iraq for 2006, Journal of Research Diyala humanity, 49, 625-649.
Kozuń-Cieślak, G. (2016). Two Faces of Regional Innovativeness – the Evidence from Visegrad Group States. In Sborník příspěvků XIX. mezinárodní kolokvium o regionálních vědách Čejkovice, 325-331.
Majerova, I. & Nevima, J. (2016). Factor Analysis as an Alternative Approach to Measurement of Human Development. International Journal of Economics and Statistics, 4, 180-185.
Majerova, I., & Nevima, J. (2017). The measurement of human development using the Ward method of cluster analysis. Journal of International Studies, 10(2), 239-257.

Majerová, I.
35
Medlock, K. B., & Soligo, R. (2002). Car Ownership and Economic Development with Forecasts to the Year 2015. Journal of Transport Economics and Policy, 36(2), 163-188.
Michaud, P. C. & van Soest, A. (2008). Health and wealth of elderly couples: Causality tests using dynamic panel data models. Journal of Health Economics, 27(5), 1312-1325.
Moore, D. S., Notz, W. I, & Flinger, M. A. (2013). The basic practice of statistics (6th ed.). New York, NY: W. H. Freeman and Company.
Nevima, J., & Kiszova, Z. (2011). Evaluation of regional competitiveness in case of the Czech and Slovak Republic using analytic hierarchy process. Advances in Economics, Risk Management, Political and Law Science, 1-6.
Nijkamp, P., & Abreu, M. (2009). Regional Development Theory. Submitted paper PN218MA-EOLSS. Retrieved September 7, 2017, from ftp://zappa.ubvu.vu.nl/20090029.pdf
OECD (2002). Frascati Manual. Proposed Standard Practice for Surveys on Research and Experimental Development. Paris: OECD Publications Service.
Pagliani, P. (2010). Influence of regional, national and sub-national HDRs. Human Development Research Paper 2010/19. Washington, D.C.: UNDP.
Pérez, E. A., & Nadal, J. R. (2005), Host Community Perceptions A Cluster Analysis. Annals of Tourism Research, 32(4), 925 – 941.
Riley, K. (2002). Motor Vehicles in China: The Impact of Demographic and Economic Changes. Population and Environment, 23(5), 479–494.
Rovan, J., & Sambt, J. (2003). Socio-economic Differences Among Slovenian Municipalities: A Cluster Analysis Approach. Development in Applied Statistic. Metodološki zvezki, 19, 265-278.
Semyonov, M., Lewin-Epstein, N., & Maskileyson, D. (2013). Where wealth matters more for health: The wealth–health gradient in 16 countries. Social Science & Medicine, 81, 10-17.
Sen, A. (1999). Development as Freedom. Oxford: Oxford University Publishing. Shafik, N. (1994). Economic Development and Environmental Quality: An Econometric
Analysis. Oxford Economic Papers, 46, 757-773. Toyota (2017). The High Rate of Economic Growth and Motorization. Retrieved September
11, 2017, from http://www.toyota-global.com/company/history_of_toyota/75years/text/entering_the_automotive_business/chapter1/section2/item1.html
Tuan, V. A. (2011). Dynamic Interactions between Private Passenger Car and Motorcycle Ownership in Asia: A Cross-country Analysis. Journal of the Eastern Asia Society for Transportation Studies, 9, pp. 1-16.
UNDP (2015). Training Material for Producing National Human Development Reports. UNDP Human Development Report Office, Occasional Paper. Retrieved December 15, 2017, from http://hdr.undp.org/sites/default/files/hdi_training.pdf
UNDP (2016). Human Development Report 2016. Human Development for Everyone. New York: United Nations Development Programme.
Van Den Bergh, J. C. J. M. (2009). The GDP Paradox. Journal of Economic Psychology, 30, 117-135.
Verner, T., & Chudarkova, S. (2013). The Economic Growth and Human Capital: The Case of Visegrad Countries. In A. Kocourek (Ed.), Proceedings of the 11th International Conference on Liberec Economic Forum, (pp. 610-617). Liberec: Technical University Liberec.
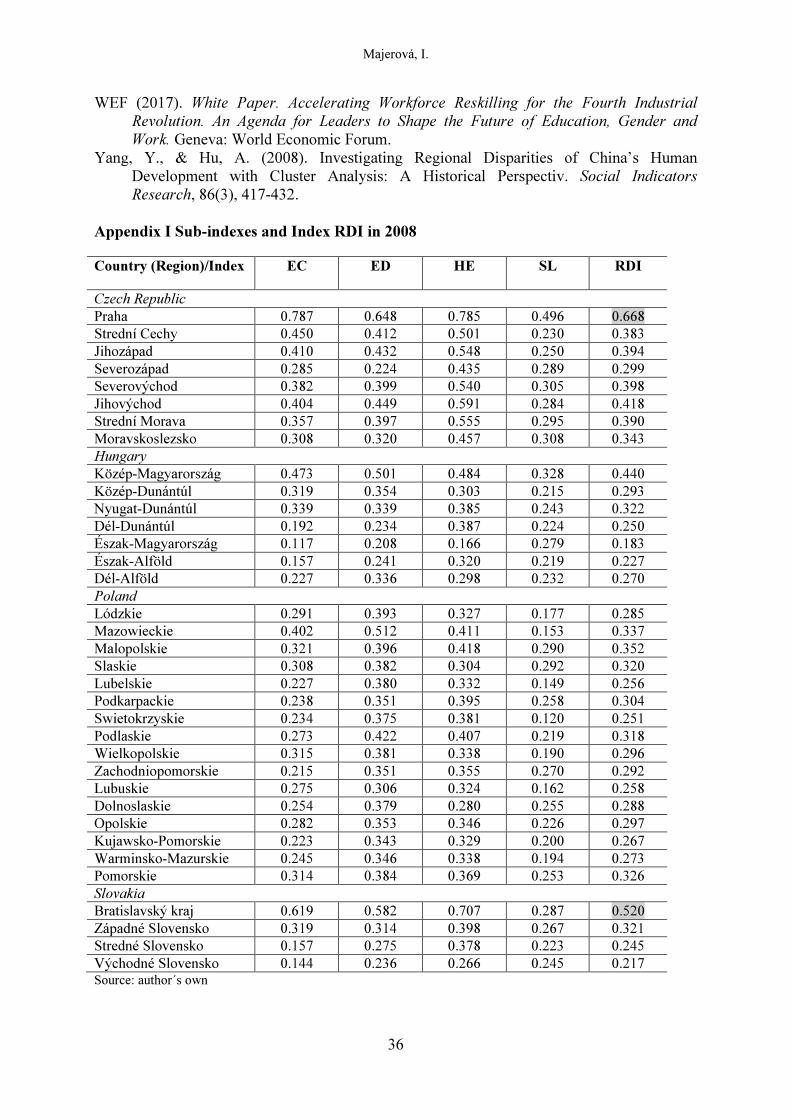
Majerová, I.
36
WEF (2017). White Paper. Accelerating Workforce Reskilling for the Fourth Industrial Revolution. An Agenda for Leaders to Shape the Future of Education, Gender and Work. Geneva: World Economic Forum.
Yang, Y., & Hu, A. (2008). Investigating Regional Disparities of China’s Human Development with Cluster Analysis: A Historical Perspectiv. Social Indicators Research, 86(3), 417-432.
Appendix I Sub-indexes and Index RDI in 2008
Country (Region)/Index EC ED HE SL RDI
Czech Republic Praha 0.787 0.648 0.785 0.496 0.668 Strední Cechy 0.450 0.412 0.501 0.230 0.383 Jihozápad 0.410 0.432 0.548 0.250 0.394 Severozápad 0.285 0.224 0.435 0.289 0.299 Severovýchod 0.382 0.399 0.540 0.305 0.398 Jihovýchod 0.404 0.449 0.591 0.284 0.418 Strední Morava 0.357 0.397 0.555 0.295 0.390 Moravskoslezsko 0.308 0.320 0.457 0.308 0.343 Hungary Közép-Magyarország 0.473 0.501 0.484 0.328 0.440 Közép-Dunántúl 0.319 0.354 0.303 0.215 0.293 Nyugat-Dunántúl 0.339 0.339 0.385 0.243 0.322 Dél-Dunántúl 0.192 0.234 0.387 0.224 0.250 Észak-Magyarország 0.117 0.208 0.166 0.279 0.183 Észak-Alföld 0.157 0.241 0.320 0.219 0.227 Dél-Alföld 0.227 0.336 0.298 0.232 0.270 Poland Lódzkie 0.291 0.393 0.327 0.177 0.285 Mazowieckie 0.402 0.512 0.411 0.153 0.337 Malopolskie 0.321 0.396 0.418 0.290 0.352 Slaskie 0.308 0.382 0.304 0.292 0.320 Lubelskie 0.227 0.380 0.332 0.149 0.256 Podkarpackie 0.238 0.351 0.395 0.258 0.304 Swietokrzyskie 0.234 0.375 0.381 0.120 0.251 Podlaskie 0.273 0.422 0.407 0.219 0.318 Wielkopolskie 0.315 0.381 0.338 0.190 0.296 Zachodniopomorskie 0.215 0.351 0.355 0.270 0.292 Lubuskie 0.275 0.306 0.324 0.162 0.258 Dolnoslaskie 0.254 0.379 0.280 0.255 0.288 Opolskie 0.282 0.353 0.346 0.226 0.297 Kujawsko-Pomorskie 0.223 0.343 0.329 0.200 0.267 Warminsko-Mazurskie 0.245 0.346 0.338 0.194 0.273 Pomorskie 0.314 0.384 0.369 0.253 0.326 Slovakia Bratislavský kraj 0.619 0.582 0.707 0.287 0.520 Západné Slovensko 0.319 0.314 0.398 0.267 0.321 Stredné Slovensko 0.157 0.275 0.378 0.223 0.245 Východné Slovensko 0.144 0.236 0.266 0.245 0.217 Source: author´s own

Majerová, I.
37
Appendix II Sub-indexes and Index RDI in 2013
Country (Region)/Index EC ED HE SL RDI
Czech Republic Praha 0.705 0.643 0.764 0.501 0.646 Strední Cechy 0.431 0.448 0.499 0.314 0.417 Jihozápad 0.421 0.436 0.509 0.300 0.409 Severozápad 0.335 0.292 0.420 0.351 0.347 Severovýchod 0.375 0.448 0.509 0.332 0.411 Jihovýchod 0.439 0.464 0.572 0.323 0.441 Strední Morava 0.373 0.384 0.476 0.320 0.384 Moravskoslezsko 0.357 0.402 0.445 0.309 0.375 Hungary Közép-Magyarország 0.465 0.460 0.476 0.342 0.432 Közép-Dunántúl 0.347 0.324 0.270 0.244 0.293 Nyugat-Dunántúl 0.371 0.310 0.348 0.268 0.322 Dél-Dunántúl 0.304 0.268 0.250 0.282 0.275 Észak-Magyarország 0.264 0.206 0.095 0.308 0.200 Észak-Alföld 0.262 0.244 0.305 0.237 0.261 Dél-Alföld 0.297 0.282 0.363 0.245 0.294 Poland Lódzkie 0.323 0.391 0.303 0.264 0.317 Mazowieckie 0.467 0.548 0.408 0.250 0.402 Malopolskie 0.340 0.414 0.424 0.342 0.378 Slaskie 0.356 0.406 0.307 0.349 0.353 Lubelskie 0.307 0.405 0.357 0.208 0.310 Podkarpackie 0.281 0.307 0.388 0.316 0.321 Swietokrzyskie 0.279 0.386 0.334 0.213 0.296 Podlaskie 0.310 0.427 0.359 0.217 0.318 Wielkopolskie 0.371 0.379 0.318 0.309 0.343 Zachodniopomorskie 0.327 0.340 0.327 0.336 0.332 Lubuskie 0.324 0.292 0.274 0.269 0.289 Dolnoslaskie 0.352 0.385 0.318 0.329 0.345 Opolskie 0.320 0.348 0.348 0.267 0.319 Kujawsko-Pomorskie 0.301 0.331 0.344 0.292 0.316 Warminsko-Mazurskie 0.292 0.299 0.266 0.247 0.275 Pomorskie 0.349 0.415 0.371 0.306 0.358 Slovakia Bratislavský kraj 0.664 0.571 0.683 0.375 0.558 Západné Slovensko 0.331 0.307 0.393 0.378 0.351 Stredné Slovensko 0.265 0.291 0.361 0.293 0.300 Východné Slovensko 0.232 0.268 0.181 0.262 0.233 Source: author´s own

DETUROPE – THE CENTRAL EUROPEAN JOURNAL OF REGIONAL DEVELOPMENT AND TOURISM
Vol. 10 Issue 2 2018 ISSN 1821-2506
38
Original scientific paper
COLLISIONS OF ANIMALS WITH ROAD VEHICLES IN TRAFFIC IN
THE CZECH REPUBLIC IN CONNECTION WITH TOURISM –
ANALYSES OF CAUSES AND PREVENTION
ANALÝZA PŘÍČIN A PREVENCE STŘETŮ ZVĚŘE S DOPRAVNÍMI
PROSTŘEDKY V SILNIČNÍM PROVOZU V ČESKÉ REPUBLICE VE
VZTAHU K CESTOVNÍMU RUCHU
Petr ŠMÍDa, Emílie PECHAROVÁa,b, Dagmar ŠKODOVÁ PARMOVÁc
1 Faculty of Environmental Sciences, Department of Applied Ecology, Czech University of Life Scientes Prague, Kamycka 129, Praha 6 – Suchdol, 165 00 - [email protected] 2 ENKI, o.p.s. – Třeboň, Dukelská 145, 379 01 Třeboň 3 Faculty of Economics, Uniersity of South Bohemia Studentská 13 370 05 České Budějovice, Czech Republic
Cite this article: Šmíd, P., Pecharová, E., Škodová Parmová, D. (2018). Collisions of Animals With Road Vehicles in Traffic in the Czech Republic in Connection with Tourism – Analyses of Causes and Prevention. Deturope. 10(2), 38-53.
Abstract
The paper analyses the collisions of animals with means of transport in road traffic in the entire territory of the Czech Republic in connection with tourism. The collisions were evaluated for the period from 2007 to 2016 under the different conditions in which they occurred, for example, season, time of day, weather conditions, visibility and the like. The development of the number of accidents in individual periods and the scope of damage in relation to the collisions are analysed in such a manner as to allow for comparison of any financial resources spent on prevention with damage that has already occurred. The result is that highest number of accidents was recorded in 2016, the lowest in 2009. After 2008, the rate of accidents involving collisions with animals had a declining trend, but rapidly increased again from 2010. Another finding is that highest damage to property occurred in 2016 in the amount of €13,974,886, while the least was in 2009 in the amount of €4,225,879. If we focus on the health and safety of people, which is the highest priority of the research, we ascertained that in the period in question a total of 923 people were injured, of whom 5 people unfortunately died of their injurie and other research results are shown in the text. Keywords: wild game, collisions, roads, means of transport, traffic safety, prevention, safety precautions, tourism, destination(s)
Abstract
Práce se zabývá analýzou střetů zvěře s dopravními prostředky v silničním provozu na území celé České republiky ve vztahu k cestovnímu ruchu. Kolize byly vyhodnocovány za období od roku 2007 do roku 2016 a to za různých podmínek, ve kterých k nim docházelo jako např. roční období, denní doba, povětrnostní podmínky, viditelnost apod. Vývoj počtu nehod v jednotlivých obdobích a rozsahu škody v souvislosti se srážkami jsou analyzovány takovým způsobem, aby bylo možné porovnat případné vynaložení finančních prostředků do prevence, s již vzniklou škodou. Výsledkem je, že nejvyšší počet nehod byl zaznamenán v roce 2016, a nejnižší v roce 2009. Po roce 2008 měla míra nehod s kolizemi se zvěří klesající trend, ale od roku 2010 se opět rychle zvýšila. Dalším zjištěním je, že k nejvetším škodám na majetku došlo v roce 2016 ve výši 13 974 886 EUR, nejméně

Šmíd, P., Pecharová, E., Škodová Parmová, D.
39
v roce 2009 ve výši 4 225 259 EUR. Pokud se zaměříme na zdraví a bezpečnost lidí, což je nejvyšší prioprita výzkumu, zjistili jsme, že ve sledovaném období bylo zraněno celkem 923 osob, z nichž bohužel 5 osob zemřelo, další výsledky výzkumu jsou uvedeny v textu. Keywords: zvěř, kolize, pozemní komunikace, dopravní prostředek, bezpečnost provozu, prevence, bezpečnostní opatření, turismus, destinace
INTRODUCTION
Road traffic density is continuously rising at such a rate that it is not possible to respond
adequately and quickly to this problem. Road transport can generally be divided into freight
and passenger transport; in passenger transport, the main reasons are business and recreational
trips. In Europe, the major means of transport for individual recreation is the passenger car
(75% in 2017), to a lesser extent bus and airplane. The journeys are mainly organised
individually (80%), and only about 15% are purchased from travel agencies and operators
(Palatková, Zichová, 2014). Individual passenger car tourism is a significant accident risk
factor.
The ever increasing need to build all types of roads is not adequately considered and
designed beforehand in such a manner as to ensure mainly the safety of the transported people
and subsequently also to protect wild game and prevent fatal collisions. A significant role in
safety is also landscaping, especially landscaping of highways and motorways (Anděl et al.,
2006).
It is also necessary to consider the potential consequences of absolute isolation of animals
by fencing and preventing their access to the road. On the other hand, when migration
structures are used, there is still a risk of animal mortality. Both an adequate number of
migration objects and fencing of the roads have their justification, and it is necessary to
combine them very prudently considering both risks (Gorčicová, 2011).
The study focuses on a comparison of the accident rate in connection with the collisions of
motor vehicles with game in the past, i.e. since 2007 for the reason that these events were not
digitally recorded before this date and the data are practically unavailable at present. Since
2007, collisions and accidents have been digitally processed and in time information has been
expanded, especially in the form of the specification of the precise sites of the events, the
visibility at the time of the accident, weather conditions, damage incurred and the like.
Unfortunately, to date no information about the specific animal involved in the collision is
recorded anywhere. Such information would be significant especially in terms of accident
prevention and the implementation of specific measures.

Šmíd, P., Pecharová, E., Škodová Parmová, D.
40
The decisive factor is timely and quality media coverage of the current situation in the
Czech Republic. This shall be one of the major preventive measures to help reduce these
collisions, significantly increase the safety of people using means of transport and save
dozens of animals every day.
The objective of the study was to collect and evaluate data about animal collisions with
motor vehicles in the entire Czech Republic for the period of 2007-2016. To process this data
in the minutest detail possible and try to ascertain the causes of these events. Furthermore, to
evaluate the collision trend and obtain data about damage occurring to personal property and
health in order to specify the consequences of the collisions and how dangerous they can be.
To make an effort to design the most effective and simple measures to prevent or at least
significantly reduce these collisions.
Traffic infrastructure in the Czech Republic and its impact on the animal population
The developing infrastructure of the Czech Republic in many cases is an almost
insurmountable obstacle for migrating animals. This mainly concerns roads but also the
railway network. The transport infrastructure is one of the significant factors of regional
development because it connects people and business entities in space within the scope of
business and recreational journeys.
It is thus necessary to continuously develop the road network. One of the possibilities is
either to modernize the current roads or build new roads to reduce the load on the current
network (Košňovský, 2014). Frequented roads constitute a barrier for many animals and
prevent them from free movement through landscape; further impacts include direct
annexation of biotopes during the construction of roads (Zikeš, 2002). The animals
subsequently seek ways in which to overcome these barriers, or search for “weak points” in
the barriers, which then creates a higher risk for road users.
Roads as a barrier
We can define a barrier in the landscape, for example, as a certain obstacle, hindrance or
barrier preventing animals from moving from one place to another. On the other hand, the
barriers may play a role in protecting animals from entering roads. It is thus significant to
determine the degree to which the barrier acts as a barrier for the animals – potential risk and
the extent to which it acts as protection from such risk.
Another concept of roads as barriers according Ascenao et al. (2017) may be that the
barrier is a raised edge or restriction that has a negative effect on the loss of natural sites and

Šmíd, P., Pecharová, E., Škodová Parmová, D.
41
may create a barrier effect because of interference and thus increase the mortality rate of
animals. It may also concern so-called invisible barriers, i.e. noise barriers that restrict the
animals to the same extent, but due to gradual domestication, animals get used to this type of
barrier and subsequently stop perceiving it with their senses (Ilgurel, 2016). On the other
hand, many research studies are considering whether the barriers that prevent animals from
entering the roads are even safe also for travellers in cars (Nycz, 2016).
An artificial man-made barrier has a significant negative impact on the population of game
to which the individual species cannot or do not adequately adapt. Highly frequented roads
such as highways and motorways, whose density in the landscape continues to grow
disproportionately, are insurmountable obstacles for many species of migrating animals
(Anděl et al., 2005).
For many large mammals, the transport barrier is not insurmountable (Tab. 1), but the
traffic density and vehicle speed make it dangerous for the animals and road users (Aanen,
1991).
Table 1 Factors that impact road migration according to Martolose et al.
Factors Probability of animals entering the communication
Increases
Without influence
Decreases
Landscape type
Heterogeneous landscape, the predominance of natural elements
Homogeneous landscape
Urbanized landscape
Accompanying vegetation of road
In field In woods Without vegetation
Traffic intensity Low Medium High Level of communication
At terrain level, on a slight slit or embankment
In a deep cut On high embankment
Fence of road Without fence Partly fence Fully fence Migration objects Witout migration
objects - With migration
objects Day time Twilight, sunrise Night Day Season Spring, autumn Summer Weather
Source: Martolos et al., 2014
Animal mortality rate caused by collisions with means of transport
If an animal collides with a motor vehicle, in 99% of the cases it entails the death of the
animal and in many cases also injury to the persons involved as well as significant material
damage.
From 2007 to 2016, 14 people died, 82 suffered serious injuries and 841 suffered minor
injuries as a result of collisions with animals on our roads. The total number of accidents was

Šmíd, P., Pecharová, E., Škodová Parmová, D.
42
63,599. It is quite certain that the animals are not to blame for all these collisions; if the
drivers respected the road traffic rules and anticipated such a collision in these dangerous
sections, this would reduce the accident rate. But there is an acute lack of adequate
information about the dangerous sections and risk of collision with animals in the Czech
Republic, which substantially differs from many other European countries (Germany,
Netherlands).
Lima (2015) discusses the response of the animal to collision with a vehicle. According to
him, in many cases, the animal is capable of avoiding the collision by natural instinct.
Naturally, this also depends on the response of the driver and electronic detection of the
vehicles. According to him, modern systems in motor vehicles give mammals a greater
chance of survival when crossing roads.
In the Czech Republic, the animals that are most frequently hit are wild boar (Sus scrofa),
European hare (Lepus europaeus), red fox (Vulpes vulpes) and European roe deer (Capreolus
capreolus) (Anděl et al., 2011). It is clear from his research that suitable fencing in
combination with an eco-duct has the consequence of reducing the risk of accidents.
Animal migration and roads are very complicated systems that should mutually respect
each other in every crossing design, and the local conditions must be evaluated during each
case of construction planning for maximum coherence between the landscape and the roads
(Anděl et al., 2006).
The behaviour of migrating animals in relation to the highway was also described by Zikěš
(2002) in his work, in which he states that if the migrating animal encounters a highway, it
may solve the arising problem in various ways, for example:
- By changing direction of movement and abandon – if the animal does not have a clear
migration destination.
- The individual may move along the highway until it finds a suitable migration object
for crossing the obstacle.
- It runs across the highway surface, which may result in a collision with a motor
vehicle.
Planting vegetation along roads is an important form of protection for animals and a
method for preventing collisions. Desai et al. (2012) states that it is necessary to plant
vegetation, not only along the roads, but also at sites with industrial zones.
Currently, this situation is often solved by fencing the roads and highways, thus blocking
animal migration. However, the biggest disadvantages are high costs and maintenance
(Kostečka, 2015).

Šmíd, P., Pecharová, E., Škodová Parmová, D.
43
Actual field research revealed many deficiencies, which do not make the fences around the
roads “protection for the animals”, but rather their killers. It is not possible to build a fence in
such a manner that it terminates a few metres before the start of the next measure in the form
of, for example, a crash barrier. Such a gap is a fatal point for the animals, which enter the
road where the other side is completely fenced off and the animal thus has no chance to find
its way back, naturally resulting in 99% of cases with a collision with passing vehicles. The
fences around the roads are described by Ascenao et al. (2013), who states that it is the most
effective method for preventing such collisions, but he emphasises that their construction
must be designed perfectly to prevent unnecessary deaths due to poor realisation and
subsequent maintenance.
Traffic density and its impact on collisions and animal mortality rate
The traffic density or intensity is a major indicator of road load. According to the Internet
resource www.ceskedalnice.cz, it is most commonly presented as the, so-called, annual
average daily intensities. However, the destination and journey distance are not evaluated in
relation to the accident rate, i.e., the ratio of recreational trips to the total load and accident
rate is not considered.
Concerning the visitation rate of the individual tourist destinations, people mostly travel by
passenger car. Naturally, this is related to the problem of collisions between vehicles and
animals on the roads. According to CzechTourism, the most visited places in the Czech
Republic are Prague followed by the ZOO in Zlín, industrial monuments in Dolní Vítkovice
and the latest top destination – Aqualand Moravia. Significant destinations are also the
mountain regions (Šumava, Krkonoše), which are very popular with tourists in the Czech
Republic (Klufová, 2016), and the spa regions (Bozóti, 2015). Further destinations for mainly
the local population are significant recreational regions such as Sázava and the Upper Vltava
catchment areas, Bohemian Paradise, Lipno, South Moravia and the like. The journeys by
passenger car to these areas are associated with a high risk of collision with animals because
the holiday-makers often depart on Friday in the late afternoon hours and return on Sunday in
the evening, often in low visibility conditions and without adequate physical rest.
According to the Road and Motorway Directorate, motorways and first-class roads are the
most frequented.

Šmíd, P., Pecharová, E., Škodová Parmová, D.
44
Figure 1 Traffic intensity on the motorways and first-class roads in 2016 (the thickness of the line indicates the relative load of the road).
Source: www.ceskedalnice.cz
The highest number of accidents occurred on first- and second-class roads, which is
naturally influenced by the fact that these are the most common roads in the Czech
Republic. The total distance of motorways and roads in the Czech Republic is almost 56,000
km, of which 1,250 km are motorways, 5,811 km are first-class roads, 14,587 km are
second-class roads, and 34,130 km are third class roads (www.rsd.cz). Generally, the Czech
Republic ranks 21stst in terms of the number of fatal traffic accidents in the EU
(www.autoklub.cz). The Tab. 2 shows the number of collisions in relation to the distance of
the individual types of roads.
Table 2 Number of collisions (2007-2016) converted to 1 km of total road distance
Types of roads Number of
collisions
Length of roads
(km)
Number of
collisions 1 km
Motorway 3380 1250 12,8 1. class 22676 5811 3,9 2. class 19967 14587 1,3 3. class 14473 34130 0,42 Source: Own processing.
METHODOLOGY
The Czech Republic has an area of 74,864 km2, and more than 55,000 km of roads. The data
used in the research was acquired from the Police of the Czech Republic and the author’s own

Šmíd, P., Pecharová, E., Škodová Parmová, D.
45
field research. At present, the Police records the accidents – collisions of animals with motor
vehicles in a high-quality manner; the location is ascertained with a precision of 1 m, the
weather conditions at the time of the accidents, light conditions and many other attributes that
can be applied very well in various statistics and research. Unfortunately, only collisions to
which the police were called and in which people were injured or major damage to property
occurred are recorded. There is no record of the type of animal involved in the collision. The
author’s own research revealed that most of the cases involve medium or large animal species,
i.e., species from the size of a hare, fox, otter or badger. Upon collision, the smaller animal
species cause almost no damage at all and for this reason, these events are not recorded
anywhere.
The basis of this work was the acquisition and processing of data on collisions of motor
vehicles with animals from 2007 to 2016 in the entire territory of the Czech Republic. The
data were acquired from the author’s own field research on the individual roads and the study
of police statistics, which contain records of the events that resulted in death or personal
injury and also those events that resulted in damage to property. The data were subsequently
processed and separated into several groups for a more detailed analysis:
map co-ordinates
date of the event
time of the event
type of road on which the event occurred
vehicle type
death toll
persons with severe injuries
persons with minor injuries
total material damage in hundreds of crowns
weather conditions at the time of the accident
visibility
The map data from the ARC GIS system were used for the clearer representation and
processing of the data.
RESULTS AND DISCUSSIONS
After processing the source data into the form in which it is used, several comparisons and
visualisations of individual years were made for the entire Czech Republic.
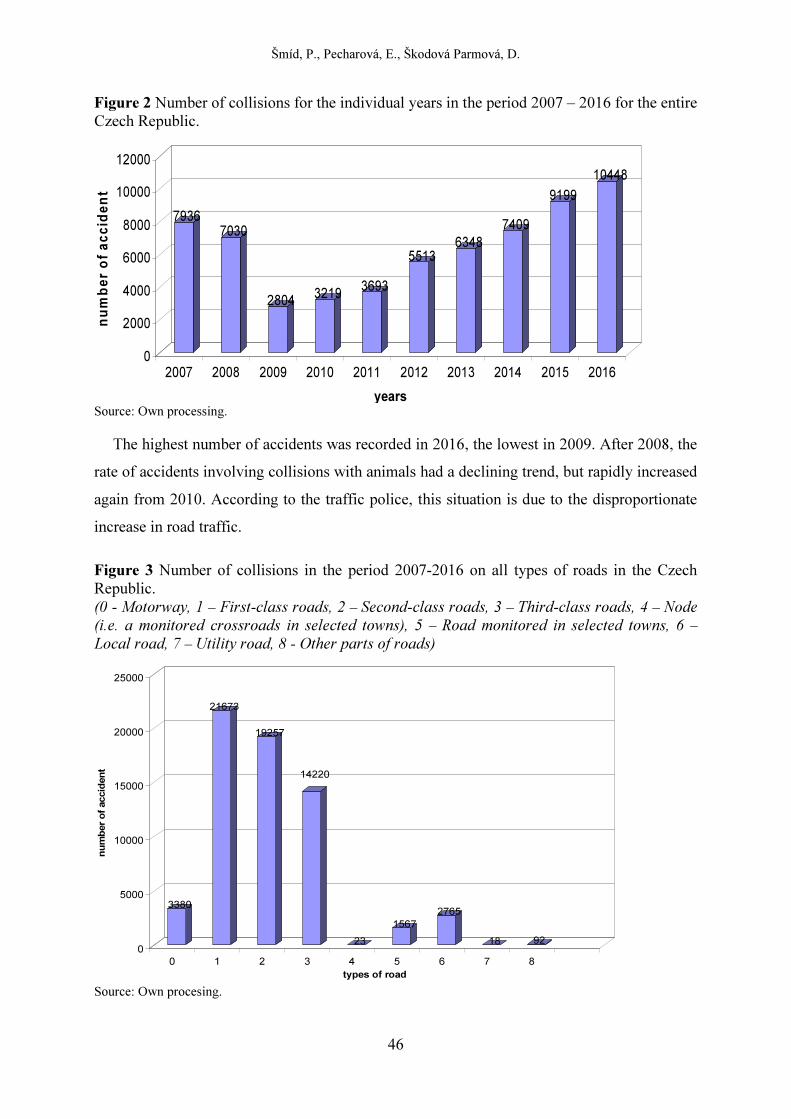
Šmíd, P., Pecharová, E., Škodová Parmová, D.
46
Figure 2 Number of collisions for the individual years in the period 2007 – 2016 for the entire Czech Republic.
Source: Own processing.
The highest number of accidents was recorded in 2016, the lowest in 2009. After 2008, the
rate of accidents involving collisions with animals had a declining trend, but rapidly increased
again from 2010. According to the traffic police, this situation is due to the disproportionate
increase in road traffic.
Figure 3 Number of collisions in the period 2007-2016 on all types of roads in the Czech Republic. (0 - Motorway, 1 – First-class roads, 2 – Second-class roads, 3 – Third-class roads, 4 – Node (i.e. a monitored crossroads in selected towns), 5 – Road monitored in selected towns, 6 – Local road, 7 – Utility road, 8 - Other parts of roads)
Source: Own procesing.
7936
7030
28043219
3693
5513
6348
7409
9199
10448
0
2000
4000
6000
8000
10000
12000
nu
mb
er o
f a
cc
ide
nt
2007 2008 2009 2010 2011 2012 2013 2014 2015 2016
years
3380
21673
19257
14220
23
1567
2765
18 920
5000
10000
15000
20000
25000
nu
mb
er
of
accid
en
t
0 1 2 3 4 5 6 7 8
types of road

Šmíd, P., Pecharová, E., Škodová Parmová, D.
47
Kušta (2011) states that collisions between animals and motor vehicles are most often
influenced by the time of the event and month in which the collision occurred. He states that
accidents mostly occurred at about 10 p.m. and the second wave of collisions occurred at
about 6 a.m. It is further stated that collisions occurred most frequently in April and May, and
the next month in line was December. From the results for the entire Czech Republic, which
we processed, it is possible to agree with this claim. On the contrary, from the results of the
Prague East District (Šmíd 2013), these data differ, since in 2008, for instance, May had the
highest rainfall followed by November, in 2009 the largest number of accidents occurred in
May followed by October.
According to my data analysis, the highest number of accidents occurred at night, without
public lighting, and the visibility was not influenced in any way by the weather conditions. A
surprise is the ascertained fact that a very high number of accidents occurred during the
daytime when the visibility was also not influenced in any way by the weather conditions
(Šmíd et al., 2014).
Similar results for Central Europe are presented by Hothorn et al. (2012) and Pokorný
(2006). The reasons may be not only the lower daily intensity of transport, but also worse
driving conditions and less passable roads in winter when vehicles run at lower speeds (this
applies mainly to first-, second- and third-class and other roads). Nevertheless, other authors
contend that there is a mild increase in the occurrence of collisions with animals in the
winter, for example, in Sweden ( Wahlström and Liberg, 1995).
The highest number of collisions on first-class roads in the Czech Republic for the given
period – 22,676. During the classification of the roads according to Act No. 13/1997 Coll., the
Road Act, the largest part of the Czech road network is composed of first-class roads; the
result shall certainly be impacted by this factor.
Figure 4 The scope of damage to property in the period 2007-2016 for the entire Czech Republic (in Euro).
Source: Own procesing.
9564596
8445392
42258834772905
5464045
82050987692075
9469456
11273369
13974886
0
2000000
4000000
6000000
8000000
10000000
12000000
14000000
am
ou
nt
(eu
ro)
2007 2008 2009 2010 2011 2012 2013 2014 2015 2016
years

Šmíd, P., Pecharová, E., Škodová Parmová, D.
48
The highest damage to property occurred in 2016 in the amount of €13,974,886, while the
least was in 2009 in the amount of €4,225,879. The total damage in the period 2007-2016 in
connection with collisions with animals on the roads for the entire Czech Republic is
€83,087,709. On average, one traffic accident results in damage amounting to €1,306.
If we focus on the health and safety of people, which is the highest priority of the research,
we ascertained that in the period in question a total of 923 people were injured, of whom 5
people unfortunately died of their injuries.
Figure 5 Collisions between animals and vehicles 2010-2016 resulting in death or severe injury of people.
Source: Own procesing.
Fig. 5 shows the places where severe injury (black spots) or death of people (red spots)
occurred in connection with the collision of a vehicle with an animal.
Table 3 Number of collisions (2007-2016) - comparison of the summer holidays (with a higher road usage associated with tourism) and selected months (before and after the holidays)
Years 2007 2008 2009 2010 2011 2012 2013 2014 2015 2016 Summer holiday
1369 1111 438 885 558 885 1027 1277 1558 1691
March – April
1428 1036 447 436 611 813 969 1242 1371 1808
September - October
1436 1294 482 708 641 1221 1169 1385 1803 1954
Source: Own procesing.

Šmíd, P., Pecharová, E., Škodová Parmová, D.
49
Tab. 3 shows the number of accidents that occurred during the summer holidays when the
traffic on the roads should have been higher for reason of travel (holidays, transport of
children going for holidays and the like). For comparison, the periods April-May and
September-October were selected at random. We determined that the holidays do not have
any significant impact on the number of accidents – collisions with animals. The holiday
period is not even different in the overall number of traffic accidents (www.autoklub.cz).
Overall, in the period 2007-2016 there were 10,799 collisions during the summer holidays;
during the selected months of April and May 22,892 collisions occurred and in September and
October there were 12,093 collisions. The reason for the lower number of incidents may thus
on the contrary be lower traffic on the roads during the summer holidays than in other months
during the year. People are taking holiday and are not travelling to work every day. On the
contrary, in the period of April-May, animals are highly active (migration) and weather
conditions are generally worse. These results are also confirmed by the accident statistics of
the Autoklub ČR (www.autoklub.cz).
Table 4 Number of collisions (2007-2016) - comparison of the Christmas season and the same days in the selected month (May)
Years 2007 2008 2009 2010 2011 2012 2013 2014 2015 2016
Christmas
24, 25, 26 53 45 22 18 22 38 42 55 70 44
May
24, 25, 26 76 65 21 31 31 57 75 50 87 94
Source: Own procesing.
A further comparison was between the Christmas season, when road traffic should have
been higher again, especially for reason of family visits and trips to winter resorts. Tab. 4
shows that the number of collisions does not differ significantly and, on the contrary, the
number of collisions on the same day of a month selected at random (May) is higher. Overall,
the Christmas season in the years in question registered 409 collisions, and 587 collisions
occurred on the same days in another month.
From the stated results, we can thus state that the free days or summer holidays do not have
any significant impact on the higher number of accidents in connection with collisions
between animals and motor vehicles. The problem is year-round and it is not possible to focus
only on individual months because the result shall not differ in any way.

Šmíd, P., Pecharová, E., Škodová Parmová, D.
50
Figure 6 Graphic representation of collisions for the period of 2007-2016 (available data from the
Czech Republic).
Source: Own procesing.
The coloured spots in the Fig. 6 show the accidents in the individual years in the entire
territory of the Czech Republic. By plotting the precise GPS co-ordinates, it was possible to
get an overview of the density of these collisions. Unfortunately, this data is missing in part of
South Bohemia, the reason being the recording of data on so-called “Euro forms”, where the
accidents are recorded by hand on a form and are not digitalized. These data are currently
unavailable, and their subsequent processing will be very difficult. However, for quality
research and a clear view of the situation in the Czech Republic, these data are indispensable
because field research allows us to get only an idea of these events but not the precise
situation.
CONCLUSION
In this paper, we confirmed the fact that collisions with animals on the roads in the Czech
Republic have a continuously rising trend. At the beginning of research, (Šmíd, 2012), we
ascertained that the great majority of roads are not in any way protected against collision with
animals and drivers are not even warned of this danger. Road signs to reduce speed or any
signs warning about the possible presence of an animal were virtually absent. On the contrary,
there was a decline in the number of warning traffic signs although the concerned road
sections are still registering accidents.
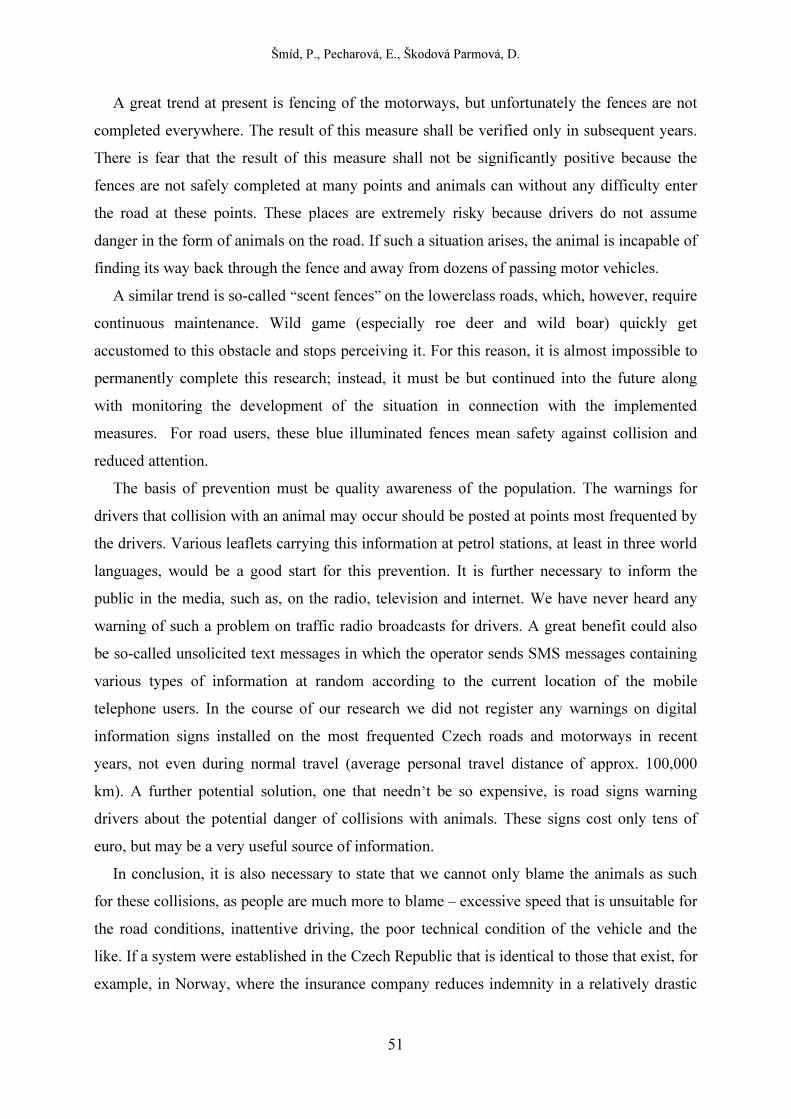
Šmíd, P., Pecharová, E., Škodová Parmová, D.
51
A great trend at present is fencing of the motorways, but unfortunately the fences are not
completed everywhere. The result of this measure shall be verified only in subsequent years.
There is fear that the result of this measure shall not be significantly positive because the
fences are not safely completed at many points and animals can without any difficulty enter
the road at these points. These places are extremely risky because drivers do not assume
danger in the form of animals on the road. If such a situation arises, the animal is incapable of
finding its way back through the fence and away from dozens of passing motor vehicles.
A similar trend is so-called “scent fences” on the lowerclass roads, which, however, require
continuous maintenance. Wild game (especially roe deer and wild boar) quickly get
accustomed to this obstacle and stops perceiving it. For this reason, it is almost impossible to
permanently complete this research; instead, it must be but continued into the future along
with monitoring the development of the situation in connection with the implemented
measures. For road users, these blue illuminated fences mean safety against collision and
reduced attention.
The basis of prevention must be quality awareness of the population. The warnings for
drivers that collision with an animal may occur should be posted at points most frequented by
the drivers. Various leaflets carrying this information at petrol stations, at least in three world
languages, would be a good start for this prevention. It is further necessary to inform the
public in the media, such as, on the radio, television and internet. We have never heard any
warning of such a problem on traffic radio broadcasts for drivers. A great benefit could also
be so-called unsolicited text messages in which the operator sends SMS messages containing
various types of information at random according to the current location of the mobile
telephone users. In the course of our research we did not register any warnings on digital
information signs installed on the most frequented Czech roads and motorways in recent
years, not even during normal travel (average personal travel distance of approx. 100,000
km). A further potential solution, one that needn’t be so expensive, is road signs warning
drivers about the potential danger of collisions with animals. These signs cost only tens of
euro, but may be a very useful source of information.
In conclusion, it is also necessary to state that we cannot only blame the animals as such
for these collisions, as people are much more to blame – excessive speed that is unsuitable for
the road conditions, inattentive driving, the poor technical condition of the vehicle and the
like. If a system were established in the Czech Republic that is identical to those that exist, for
example, in Norway, where the insurance company reduces indemnity in a relatively drastic
Šmíd, P., Pecharová, E., Škodová Parmová, D.
52
way upon determining a violation of the road traffic conditions stipulated by law (for
example, excessive speed), the number of accidents could be significantly lowered.
REFERENCES
Aanen, P., Alberts, W., Bekker, G. J., van Bohemen, H. D., & Melman, P. J. M. (1991). Nature engineering and civil engineering works. Pudoc Wageningen, Wageningen, Netherlands
Anděl, P., Hlaváč, V. & Lenner, R. (2006). Migrační objekty pro zajištění průchodnosti dálnic a silnic pro volně žijící živočichy - TP 180. Liberec, Evernia.
Anděl, P., Belková, H., Gorčicová, I., Hlaváč, V., Libosvár, T., Rozínek, R., …Vojar, J. (2011). Průchodnost silnic a dálnic pro volně žijící živočichy. Liberec, Evernia, 154 s
Anděl, P., Gorčicová, I., Hlaváč, V., Miko, L., & Andělová, H. (2005). Hodnocení fragmentace krajiny dopravou. Praha, Agentura ochrany přírody a krajiny, 99 p.
Ascensão, F., Lucas, P. S., Costa, A., & Bager, A. (2017). The effect of roads on edge permeability and movement patterns for small mammals: a case study with Montane Akodont. Landscape Ecology, 32(4), 781-790.
Ascensão, F., Clevenger, A., Santos-Reis, M., Urbano, P., & Jackson, N. (2013). Wildlife–vehicle collision mitigation: Is partial fencing the answer? An agent-based model approach. Ecological Modelling, 257, 36-43.
Autoklub (2016). Statistika nehodovosti za rok 2016, Retrieved from: http://www.autoklub.cz/dokument/12022-statistika-nehodovosti-za-rok-2016. html
Bozóti, A. (2015). Health Tourism Competitiveness – A Complex Approach. Deturope, 7, 2, 157-174.
České dálnice (2015). Intenzity dopravy 2016, Retrieved from: http://www.autoklub.cz/dokument/12022-statistika-nehodovosti-za-rok-2016. html
Desai T. B., & Nandikar, M. (2012). Impact of urbanization on avenue trees and its role in carbon sequestration: a case study in Kolhapur city. International journal of environmental scientes. 3(1), 481-486.
Gorčicová, I. (2011). Průchodnost silnic a dálnic pro volně žijící živočichy. Liberec, Evernia s.r.o.
İlgürel, N., Yügrük, A., & Neşe, A. (2016). Evaluation of noise exposure before and after noise barriers, a simulation study in Istanbul. Journal of Environmental Engineering and
Landscape Management, 24.4, 293-302. Kostečka, J., & Prášil, M. (2015). PPK-PLO. Požadavky na provedení a kvalitu plotů pro
zabránění průniku zvěře a osob na dálnicích a silnicích ve správě Ředitelství silnic a dálnic ČR. 04/2015
Kosňovský, M. (2014). Silnice v uspořádání 2 + 1. Brno, 82 p., annexes: 28 p. Doctoral thesis. Vysoké učení technické v Brně, Fakulta stavební, Ústav pozemních komunikací.
Klufová, R. (2016). Destination attractiveness of the South Bohemian region from the viewpoint of spatial data analysis. Deturope, 8(1), 92-111.
Lima, S. L., Blackwell B. F., DeVault, T. L., & Fernandéz-Jurisic, E. (2015). Animal reactions to oncoming vehicles: a conceptual review. Biological Reviews, 90(1), 60-76.
Martolos, J., Šikula, T., Libosvár, T., Anděl, P. (2014): Optimization of Measures to Prevent Collisions of Animals and Road Traffic. Transactions on Transport Sciences, 2014, 7(4): 125-134
Nycz, D. B. (2016). Influence of impact angle and humidity on TB11 virtual cash tests for SP-05/2 road safety barier. The Archives of Automotive Engineering–Archiwum Motoryzacji, 73(3), 71-88.

Šmíd, P., Pecharová, E., Škodová Parmová, D.
53
Palatková, M., & Zichová, J. (2014). Ekonomika turismu: turismus České republiky. Praha: Grada Publishing.
Police of the Czech Republic, Police presidium of the Czech republic, Statistic 2017 Ředitelství silnic a dálnic ČR (2017). Silnice a dálnice > Délky a další data komunikací,
Access from: http://www.rsd.cz/wps/portal/web/Silnice-a-dalnice/delky-a-dalsi-data-komunikaci
Šmíd, P. (2011). Analýza příčin a prevence střetu motorových vozidel se zvěří v okrese Praha východ, Diplomová práce, Fakulta životního prostředí, Katedra aplikované ekologie, Česká zemědělská univerzita v Praze
Smid, P., & Pecharova, E. (2013). Analysis of the potential causes and prevention of conflicts of motor vehicles with the game in the district of Prague-East. 13th International Multidisciplinary Scientific Geoconference and EXPO, SGEM 2013; Albena; Bulgaria; 16 June 2013 through 22 June 2013, 1, 63-70
Smid, P., Pecharova, E., Vykouk, M., Faltova, K. (2014) The causes analysis and collisions prevention of the wildlife with motor vehicles the eastern part of the central region of the Czech Republic, 14th International Multidisciplinary Scientific GeoConference SGEM 2014, www.sgem.org, SGEM2014 Conference Proceedings, ISBN 978-619-7105-17-9 / ISSN 1314-2704, June 19-25, Book 5, Vol. 1, 673-680.
Zikeš, P. (2002). Problém průchodnosti dálničních a rychlostních komunikací pro volně žijící živočichy, Dopravní fakulta Jana Pernera v Pardubicích
Zákon č. 13/1997 Sb. o pozemních komunikacích v platném znění

DETUROPE – THE CENTRAL EUROPEAN JOURNAL OF REGIONAL DEVELOPMENT AND TOURISM
Vol. 10 Issue 2 2018 ISSN 1821-2506
54
Original scientific paper
A TELEPÜLÉSI KÖTŐDÉS ÉS A Z GENERÁCIÓ - EGY
MAGYARORSZÁGI KÖZÉPVÁROS PÉLDÁJA
THE SETTLEMENT ENGAGEMENT AND THE Z GENERATION –
THE EXAMPLE OF A HUNGARIAN CITY
Nikoletta TÓTH-KASZÁS
University of Pannonia, Nagykanizsa Campus, H-8800 Nagykanizsa, Zrínyi street 18. [email protected]
Cite this article: Tóth-Kaszás, N. (2018): A települési kötédés és a z generáció - egy magyarországi középváros példája. Deturope, 10(2), 54-74.
Abstract
My research focuses on the settlement aspects of nonbusiness marketing. It highlights a problem, which today many domestic and rural communities are struggling with: the out-migration of young people. This long-lasting problem in the rural environment has continued in the 2010s and affects not only villages, small towns but mid-sized cities, as well. Many research results indicate that retention of a young workforce is a generic problem in Hungary today, almost in every settlement. In this paper I highlight the different approaches of identity and also the values that are important to the high school students, as the members of generation Z. I also analysed their bondage to the settlement where they live. I take the case of a Hungarian mid-sized city. The purpose of this study is to explore the strength of the urban attachment of the young people and the way how they see the city. Doing this, my goal is to show the direction of further development of the settlement, and thus, in the broader sense, the future development of Hungarian towns and mid-sized cities as well. Keywords: Z generation, identity, nonbusiness marketing, settlement marketing
Absztrakt
Kutatásom a nonbusiness marketing települési aspektusait vizsgálja. Azon problémát állítja középpontba, amellyel napjainkban számos hazai, vidéki település küzd: a fiatalok elvándorlását. Ez a vidéki környezetet régóta sújtó probléma a 2010-es években tovább gyűrűzött, s immár nem csak a falvakat, kisvárosokat, de a vidéki nagyvárosokat is érinti. Számos kutatás eredménye jelzi, hogy a fiatal munkaerő megtartása generális problémát jelent ma Magyarországon, szinte minden település számára. Jelen tanulmányban rávilágítok az identitás különböző megközelítéseire, továbbá arra, hogy a jelenleg középiskolás fiatalok, vagyis a Z generáció mit tartanak értéknek, kötődnek-e a településhez, ahol élnek. A vizsgálathoz egy magyarországi középváros esetét veszem alapul. A tanulmány célja, hogy feltárja a fiatalok városi kötődésének erősségét, továbbá azt, hogy milyennek látják a várost jelenleg. Mindezzel célom, hogy irányt mutassak a település további fejlődéséhez, ezáltal pedig tágabb értelemben a magyar kis- és középvárosoknak egyaránt. Kulcsszavak: Z generáció, identitás, nonbusiness marketing, településmarketing
Tóth-Kaszás, N.
55
BEVEZETÉS
Identitás, települési identitás
Az idegen szavak szótára szerint identitás latin eredetű szó, jelentése: azonosság,
önazonosság, azonosságtudat (Idegen szavak gyűjteménye/identitás). Köcsné a
következőképpen fogalmazza meg az identitás fogalmának tartalmát: „Identitás,
azonosságtudat; annak tudatosítása, hogy »ki és mi vagyok«, sőt először is, hogy »én-én
vagyok«. Az identitásnak fontos alkotóeleme a csoport-hovatartozás, a szűkebb értelemben
vett társas identitás. A társas identitás egy csoporttal való azonosulás, tehát az »én« »mi«-vé
alakítása.” (Köcsné, 2004) A szerző kiemeli, hogy az identitásnak csak egyik eleme az
önazonosság, de a szociális vagy társas identitás legalább olyan fontos. A szociális identitás
azokban az emberi közösségekben jelenik meg, ahol megfordulunk, ide tartozik a
lakókörnyezet, település is.
A helyi identitás, helyhez való ragaszkodás fogalmát a szakirodalomban több
megközelítésből vizsgálták.
Braun szerint a települési identitás egy adott helyet (város, kerület stb.) azonosít annak
tereivel, közösségével, lakóival, kultúrájával, hagyományaival és egyéb értékeivel. Ennek
forrása a mindenkori polgári büszkeség, mely a lakosok számára a valahová tartozás érzetét
kelti (Braun, 2008).
A Scannell és Gifford által megfogalmazottak szerint az identitás azt is figyelembe veszi,
mit gondolunk önmagunkról, énünkről, magában foglalja a valahová tartozás érzését és a
földrajzi helyekhez való kötődést is (Scannell – Gifford, 2010). A Scannell – Gifford
szerzőpáros három tényezőt nevezett meg, ami a helyhez való kötődés szempontjából
kiemelten fontos:
a személy, aki valamilyen mértékben kötődik a helyhez, vagy egyéni (pl. személyes
emlékek miatt), vagy közösségi szempontból (az ott élő emberek, személyes
kapcsolatok miatt),
az a pszichológiai folyamat, aminek nyomán az érzelmi kötődés kialakul,
a hely, amihez az ember kötődik (Scannell – Gifford, 2010).
Stadman a települési identitást egy másik oldalról közelítette meg. Szerinte az egyének
nem a környezetük fizikai voltához ragaszkodnak, hanem az azok által megélt élményekhez
(Stadman, 2002). Mindennek pedig akkor van a legnagyobb hatása, ha gyerekkori
élményekről beszélünk, hiszen ilyen esetben személyes vonatkozású a kötődés (Knez, 2005).
„Az egyén sohasem a külső világ valós fizikai megjelenése alapján tájékozódik, él, mozog a
térben, hanem mindig a benne élő szubjektív kép alapján cselekszik.” (Szakál, 1995:27) Egy
település, de bármely élethelyzet megítélése jelentős mértékben függ attól, hogy az egyén

Tóth-Kaszás, N.
56
mikor, milyen pillanatban látja, vagy épp éli át az adott impulzust. Erre utal a fenti idézet, s ez
teszi igazán összetetté az identitás és a települési, térségi kötődés megítélését. Az identitás
személyiségjegyekben való kifejezéséhez hozzásegíthet a Gyulavári-Malota által kifejlesztett
kultúraszemélyiség skála, mely nem csak országokra, hanem városokra is alkalmazható, és az
adott város személyiségjegyeinek percepcióját méri, melyre alapozva az identitás kialakítása
is könnyebbé válhat (Malota - Gyulavári 2014, Gyulavári - Malota 2014).
Az identitás tehát olyas valamiként határozható meg, amit az adott településről célszerű
lenne kommunikálni, s amit szeretnénk, hogy a fogyasztók gondoljanak a városról. Ebből
kifolyólag a városfejlesztés folyamatába be kell építeni az identitás tervezését is, mely a
település eredeti, másolhatatlan és egyedi értékeire épít (Kavaratzis, 2004). Ezen identitás
kialakításához a városi vezetőknek meg kell határozniuk az érintettek körét, s fel kell
ismerniük azok igényeit (Paliaga et al., 2010). A City Identity megközelítési technika
alkalmazása segítségünkre lehet ebben. A City Identity eredeti megfogalmazásban Corporate
Identity néven jelent meg a köztudatban, mint a vállalkozások marketing tevékenységét
szolgáló elem. „A Corporate Identity különböző területekből összetevődő, sajátos, adott cégre
jellemző megjelenést eredményez, aminek a visszatükröződése a Corporate Image, vagyis az a
kép, amely az ügyfelekben, a tágabb környezetben él a cégről.” (Törőcsik, 1995:18)
A City Identity módszertan alkalmazásának a térségekre, városokra nézve feltételei
vannak. A településnek elsősorban olyan kisugárzást kell adnia, amivel a településmarketing
célcsoportjai azonosulni tudnak. Fontos, hogy a városvezetés hosszú távú bizalmat ébresszen
a célcsoportokban, kommunikációja hiteles legyen. Mindezt csak akkor lehet elérni, ha a
település ismert, pozitív imázzsal, s egyedi jellemzőkkel rendelkezik, melyeket megfelelő
marketing eszközökkel hangsúlyozni is képes (Törőcsik, 1995). Az identitás egyes szerzők
szerint a települések sikerének eléréséhez is kiemelkedően fontos; hiszen „a kötődés, identitás
erősítése lehet az egyik eszköze a fiatalok helyben tartásának vagy későbbi hazahívásának ”,
(Berkesné et al., 2017., p. 15) sőt: a települések sikerének egyik fokmérője is lehet (Ernszt,
2017. p. 37.).
A City Identity tulajdonképpen az egyes szervezetek, helyek, területek, városok
megkülönböztető jegyeit foglalja magába, vagyis hozzájárul a város relatív versenyelőnyének
kifejezéséhez (László, 1998; Törőcsik, 1995). City Identity lényege tehát az, hogy
„személyiséget” adunk a településnek, aminek következtében az így kialakult identitás
vonzerőt gyakorol a célcsoportokra, akik ezt az identitást a településsel azonosítják.
Egy város CI alapelemei a következők:
A City Design (városi arculat), mely a település szimbólumainak, formai és arculati
elemeinek egymásra épülő rendszerét jelenti, ezáltal egy egységes, összehangolt,

Tóth-Kaszás, N.
57
vonzó vizuális megjelenést eredményez. Magába foglalja a település környezeti,
földrajzi, építészeti elemeit, az önábrázolást és a vizuális megjelenést is.
A City Behavior (városi kultúra) a lakosok magatartásából, a hagyományokból, a
szokásokból, a helybeliek életfilozófiájából és életszemléletéből építkezik, s ennek
hatását vizsgálja a településen kívüli közvélemény irányába.
A City Communication (városi kommunikáció) a település által használt közvetlen
kommunikációs eszközök alkalmazását jelenti, melyek így az informáláson túl
befolyásoló hatással is bírnak a közvéleményre. Nem szabad megfeledkeznünk az ún.
nem eredendő kommunikációs eszközökről sem, hiszen a „minden kommunikál elve”
a településmarketingben hatványozódva jelentkezik. Ide tartoznak tehát a közéleti
megnyilvánulások, a települési események, rendezvények is (Piskóti et al., 2002).
Ezen alapelemek egysége képes csak arra, hogy a települési identitás kialakulásához,
fejlesztéséhez hozzájáruljon, hiszen csak az elemek együttes működése képes kiváltani a
megfelelő összhatást. Ahhoz azonban, hogy ezt az egységet, s általa a céljainkat
megvalósítsuk, további kritériumoknak kell megfelelni:
a célmeghatározás során jelenjen meg az individuális és szociális érzékenység,
az identitáshordozók egyértelműen határozzák meg a települést,
az alapelemek közti kölcsönhatás miatt szinergiahatás léphet fel, vagyis az elemek
együttesen hatékonyabban működnek, mint külön-külön,
a nyilvánosságnak kiemelkedő szerepe van az identitás-kialakításban,
mivel az identitás-kialakítás egy dinamikus folyamat, a célrendszert ennek
megfelelően rugalmasan kell kezelni,
az identitás kialakítása során kétirányú kommunikációt kell kialakítani, hogy a változó
igényeknek és elképzeléseknek megfelelően fejleszthessük azt (Törőcsik, 1995).
A City Identity önmagában nem képes kialakítani a városi identitást. Annak alapját
mindenképp a település célcsoportjainak összetétele és elvárásai adják, s az általuk képviselt
„mi tudat”, mely az alapvető egyéni motiváción, teljesítményen és a településen belüli
koordináción alapul. A hármas pillér meghatározó eleme az önkormányzati küldetés és
filozófia is, melynek támasza az a településben rejlő egyediség, melyet a városvezetők
hihetően és bizalmat ébresztve képesek közvetíteni a célcsoportok felé.
Egy település identitásának, a „mi tudatnak” a kialakításáról eltérő véleményeket olvashatunk
a szakirodalomban. Kotler szerint például a település arculata és identitása alakítható,
fejleszthető. Murray szerint azonban az identitást nem lehet kialakítani, csupán felfedezni
(Braun – Otgaar, 2008). Tanulmányomban elfogadom azt a tényt, hogy identitást csak
meglévő véleményekre, benyomásokra lehet építeni, ugyanakkor hiszek abban is, hogy ezek
az impressziók alakíthatók. A települési identitás legfontosabb kiindulási pontjának tehát az

Tóth-Kaszás, N.
58
ott élők „mi tudatát” tekintem, melyet a lakók és az önkormányzat közti kapcsolat
fejlesztésével lehet a felszínre hozni, s abból tényleges identitást fejleszteni.
Az imázs és az identitás kapcsolatáról kevés feltáró tanulmányt olvashatunk a
szakirodalomban. A fennálló kapcsolat igazolásaként Braunt idézem, aki szerint a városi
imázs megerősítése a városi identitás fejlesztésével a leghatékonyabb (Braun, 2008). Szintén
Braun fogalmazott úgy, hogy az imázs és az identitás fejlesztésén való munkálkodás
tulajdonképpen megegyezik az érme két oldalával, hiszen e két elem a városmarketing fontos,
s egymástól elválaszthatatlan része.
Amennyiben magát a területterméket vizsgáljuk, szintén elengedhetetlen az imázs
vizsgálata, mert az így feltárt nézetek, eszmék, vagyis maga az identitás hozzájárulhat a
tudatos, hosszú távú területfejlesztési stratégiákhoz (Kis, 2006). A CI koncepció is segíthet
abban, hogy erősödjön a lakosok településhez való kötődése, identitása, s a település
érdekében fellépő aktív cselekvési szándék (Piskóti et al., 2002).
Egy település érintettjei és a települési PR
Egy szervezet célcsoportjait vizsgálva láthatjuk, hogy van egy olyan réteg, amely minden
szervezetben, minden társaságban megtalálható, ez pedig az a bizonyos belső közösség,
melynek véleménye, benyomásai nagymértékben befolyásolják az adott szervezetről kialakult
képet. Ezért kiemelten fontos az e célcsoporttal való kommunikálás, mely a marketingen belül
önálló ággá fejlődött; ez lett a belső PR. A belső PR jelentősége azért nőtt meg az utóbbi
években, mert a média által közreadott hírek, információk mindig jóval nagyobb elfogadással
bírnak, hitelesnek, objektívnek tűnnek szemben a szervezet által közvetlenül kommunikált
információkkal (Nyárády – Szeles, 2004).
A belső PR jelentősége megfigyelhető a települések esetében is, hiszen azt „akár tud róla,
akár nem, a település gyakorlatilag minden lakója végzi viselkedésétől, meggyőződésétől
függően ki pozitív, ki negatív irányba mozdítja el a potenciális fogyasztót a vásárlási döntés
folyamatában” (Kraftné – Fojtik, 1998:57). A települések esetében tehát ez a belső marketing
egy mondhatni „láthatatlan” tevékenység, hiszen minden lakó rendelkezik véleménnyel,
impulzussal saját lakhelye irányába, s ezen érzéseinek bárhol, bármikor hangot is adhat.
Ugyanakkor itt nem csak arról van szó, hogy egy lakó a külső potenciális vevők felé közvetíti
ezt az üzenetet, de a személyes kapcsolatok révén befelé is nagy hatású, vagyis az általa
lefestett kép, a benne élő identitás pedig nagyban meghatározza az ismerőseiben kirajzolódó
arculatot és benyomásokat is (Kraftné - Fojtik, 1998). Ha a városlakók efféle nyilvánossági
fórumokon, csatornákon vallanak véleményükről, annak meghatározó jelentősége, s abszolút
hitele van (Nyárády – Szeles, 2004). Ezt a fajta információmegosztást még szemléletesebben
a digitalizáció révén létrejött közösségimédia-felületek széles körben teszik lehetővé, ahol az

Tóth-Kaszás, N.
59
online fórumok, közösségi hálózatok (pl. Facebook, Twitter), vagy éppen tartalommegosztó
felületek (pl. YouTube) terjeszthetik – akár célzottan – az egyes városlakók véleményét
(Csordás et al., 2014).
A település lakossága felé irányuló PR tevékenység fő mozgatója tehát az „ahol érdemes
élni” gondolatkör megerősítése. Az ehhez kapcsolódó közvetlen alcélok lehetnek:
a településhez való kötődés erősítése, a „mi tudat” kialakítása,
a belső imázs javítása (helyiek által képviselt imázs),
a lakosság aktivitásának növelése (aktív részvétel a városi folyamatokban),
a belső turizmus fellendítése (Piskóti et al., 2002).
Ezen alcélokra az egymásra hatás és a dinamikus kapcsolat jellemző.
A legfontosabb PR feladatok értelmezése a település esetében a következőképpen
alakulhat:
a településhez tartozás érzésének kialakítása, belső közvélemény formálása,
lakosok nyitottságának, vendégszeretetének fejlesztése,
a városvezetés döntéseinek kommunikációs támogatása a helyi média által,
a lakosok véleményének, igényeinek megismerése által a városvezetés döntés-
előkészítésének támogatása,
a település és környezete közötti kapcsolatok koordinálása, fejlesztése és elemzése
(versenytársak, kooperációk),
a lakosok tájékoztatása a települési célokról, eredményekről, feladatokról és
problémákról,
a település környezeti imázsának fejlesztése a lakosok bevonásával,
a település arculatának tudatos fejlesztése és ápolása,
a településen belüli kommunikációs magatartás irányítása, alapozása és hitelessé
tétele.
A belső PR feladatokban érintettek körét az 1. ábra mutatja. Az ábra bal oldalán láthatók a
legfontosabb véleményformálók, a média, a lakosság és azon önkormányzati intézmények,
amelyek közvetlen, napi kapcsolatban állnak a lakókkal. A középpontban helyezkedik el
maga az önkormányzat, aki képes e PR feladatok koordinálására és delegálására. Hozzá
szorosan kapcsolódnak a civil szervezetek és az önkormányzati társaságok is, amelyek
elsősorban a célok kitűzésében lehetnek az önkormányzat segítségére. A civil szféra és az
egyetemek közti kapcsolat nem határozható meg egyértelműen, hiszen a tudományos élet
képviselői általában magánszemélyként, s nem a szervezet képviseletében működnek együtt a
civil szervezetekkel, bár ma, az egyetemek negyedik generációjának világában már ez sem
jelenthető ki egyértelműen. Mészáros ábrája szerint az üzleti világ irányába csak a
felsőoktatási intézmények hiteles kommunikációja és teljesítménye révén juthatunk el, így

Tóth-Kaszás, N.
60
rendkívül fontos e célcsoport bevonása is a kommunikációs tevékenység felépítésébe. E
tekintetben nem értek egyet a szerzővel, hiszen a települési önkormányzatok közvetlen
kapcsolatban kell, hogy álljanak az üzleti világgal. Ez megmutatkozhat a működtetés,
üzemeltetés, hatósági engedélyezés, stb. területén ugyanúgy, mint az új, betelepülni
szándékozó vállalkozásokkal való kapcsolattartásban is.
1. ábra A települési szintű belső PR
Forrás: Mészáros, 1998:8 alapján saját szerkesztés
A public relations az önkormányzatok marketing tevékenységén belül is két részre osztható:
külső és belső PR-ra. Ez utóbbi egyes megfogalmazások szerint „a hivatalon belül, az
önkormányzati vezetők és a hivatali dolgozók közötti megfelelő viszony kialakulását, a
hatékony információ-áramlást jelenti (Kozma, 2006). A külső PR pedig a hivatalon kívüli
kapcsolatokat állítja a középpontba, így érdekes módon, ha a település lakóival való
kapcsolattartás viszonylatában vizsgáljuk a public relations-t, akkor itt hivatali külső PR-ról
beszélünk.
A korábban bemutatott célcsoportok ismeretében a fenti elmélettel nem értek egyet, hiszen
meg kell különböztetnünk a már a városban lakó, betelepült személyeket és vállalkozásokat a
potenciális érdeklődőktől. A belső és külső PR fogalmát ennek értelmében a következőképp
módosítanám az önkormányzatok esetében:
önkormányzati belső PR: az önkormányzat és a település lakói, szervezetei,
vállalkozásai közti megfelelő viszony kialakulása, hatékony információ-áramlás.
önkormányzati külső PR: az önkormányzat kommunikációja, kapcsolatai a
potenciális lakók, befektetők és betelepülni szándékozó vállalkozásokkal.
Tehát a belső PR tekintetében az önkormányzatok legfontosabb feladatának tekinthető a
megfelelő tömegkommunikációs kapcsolatok kiépítése és ápolása, hiszen egy település
életében az egyik legfontosabb véleményformáló csoport a média (Kozma, 2006). E jó

Tóth-Kaszás, N.
61
kapcsolat révén arra kell tehát törekedni, hogy a településről minél több pozitív hangvételű
megjelenés valósuljon meg, hiszen ahogy azt már korábban is említettem, e hírek hitelessége
jóval nagyobb, mint a közvetlen kommunikációé.
A médián kívül ki kell emelnünk a lakossággal való jó viszony ápolását is, hiszen ebben
rejlik az identitás, s ez által az imázs is. Az önkormányzatnak azt kell sugalmaznia, hogy
igyekszik minden eseményről, hírről informálni a lakosságot; hogy megbecsüli őket, s
figyelembe veszi a véleményüket a döntés előkészítés során (Kozma, 2006). Németh et al.
(2013) szerint a folyamatok elindításában az oktatási-kutatási intézményeknek,
önkormányzatoknak, kistérségi-régiós szervezeteknek nemcsak részt kell vállalniuk, hanem
húzó szerepet kell betölteniük.
A Z generáció jellemzői
A generáció olyan emberek összessége, „akik ugyanabban a korszakban születtek, ugyanazon
időszak formálta őket, és ugyanazon társadalmi markerek voltak hatással rájuk – más szóval
a generáció egy azonos életkor és életszakasz, létfeltételek és technológia, események és
tapasztalatok által összekapcsolt csoport” (McCrindle – Wolfinger, 2010:14). Értelemszerűen
egy adott történelmi időszakban, gazdasági-politikai-társadalmi körülmények között élőket
ugyanazon impulzusok érik, így kialakulnak a maguk sajátosságai és közös jellemzői.
A generáció-elmélet két amerikai szerző, William Strauss és Neil Howe nevéhez kötődik.
Generations (1991) című könyvükben megállapították, hogy egy adott generáció tagjai
nagyon hasonlóan viselkednek, meghatározott világlátással és értékrenddel rendelkeznek. Az
egyes generációk kb. 20-25 évente váltják egymást, természetesen lágy átmentekkel, adott
esetben átfedésekkel. A szerzők szerint minden generációnak megvan a maga embertípusa.
A generációk címkézése a baby-boomerek megjelenésétől kezdődött, akik a szakirodalmi
források szerint a második világháború után született generációt képviselik. Az ő „közös
jellemzőik, hogy minden eddiginél inkább átlépték a globális, kulturális és szociogazdasági
határokat. Az ő gyermekeiket nevezzük X generációknak, akik 1965 és 1979 között születtek
(Steigervald, 2014). Az Y generáció tagjai az 1980 és 1995 közötti embereket takarja (Tari,
2015).
A Z generáció tagjai 1996 után születtek, jelentős részük már kisiskolás kortól telefon és
számítógép felhasználó. Közel felük „mozaikcsaládban” nőtt fel. Arról még nem
rendelkezünk információval, hogy az internet által biztosított végtelen információhalmaz
milyen személyiségfejlődést indukál az ő esetükben. Kisgyermekként találkozhattak már
megrázó dolgokkal, például véres vagy erotikus tartalmú képekkel, filmekkel, mely
személyiségükre nagy hatással volt. (Sulyok, 2003)

Tóth-Kaszás, N.
62
A Z generáció jelenleg, 2018-ban azon életfázisban van, amely keresi saját identitását,
ugyanakkor Tari szerint ők az első igazi globális nemzedék (Homo Globalis), vagyis saját
önálló identitásuk mellett soha egy generációra nem gyakorolt ekkora hatást a globalizáció.
Ugyanazon a kultúrán nőnek fel, ugyanazokat az ételeket, divatot, helyeket kedvelik. A
globalitás mindenben megjelenik, mindennapi életük során olyan szavakat, kifejezéseket
használnak, amelyeket más generáció nem, és meg sem ért (Tari, 2011; Darvas-Péter, 2012;
Fehérvölgyi et al., 2012). A Z generáció tagjait gyakori internethasználat jellemzi.
Szabadidejükben gyakran használják okostelefonjaikat, valamint a különböző hordozható
számítógépeiket. Gyakran tagjai valamely virtuális közösségnek is, amely elsődleges színtere
lett a kommunikációnak (Z generáció: itt vagyunk!).
A mai fiatalok az interneten felnövő, annak képi és nyelvi világát ismerő generáció tagjai.
Ez azt jelenti, hogy rövid, képekkel ellátott, naprakész információkat alkalmaznak. A
korcsoportra a „rövid figyelem” jellemző. A nekik szánt üzenetek nagy részét „a kevesebb
több” elve alapján célszerű eljuttatni. Náluk az egyszerűsítés, a lényegre törekvés vezethet
eredményre (Törőcsik et al., 2014). A bennünket körülvevő környezet negatív irányba történő
változását a tizen- és huszonévesek szokásainak kialakításával lenne visszafordítani, ráadásul
ők pozitív példaként szolgálhatnának a még náluk is fiatalabb generációknak (Magyar-Keller,
2016).
CÉLKITŰZÉSEK ÉS MÓDSZERTAN
Kutatásom a nonbusiness marketing települési aspektusait vizsgálja. Azon problémát állítja
középpontba, amellyel napjainkban számos hazai, vidéki település küzd: a fiatalok
elvándorlását. Ez a vidéki környezetet régóta sújtó probléma a 2010-es években tovább
gyűrűzött, s immár nem csak a falvakat, kisvárosokat, de a vidéki nagyvárosokat is érinti.
Számos kutatás eredménye jelzi, hogy a fiatal munkaerő megtartása generális problémát jelent
ma Magyarországon, Budapestet leszámítva minden település számára.
Jelen tanulmány célja, hogy rávilágítson az identitás és a Z generáció kapcsolódási
pontjaira, továbbá hogy mennyire kötődnek azon településhez, ahol élnek. A vizsgálathoz egy
magyarországi középváros esetét veszem alapul. A tanulmány célja, hogy feltárja a helyi
fiatalok városi kötődésének erősségét, továbbá azt, hogy milyennek látják a várost jelenleg.
Mindezzel célom, hogy irányt mutassak a település további fejlődéséhez, ezáltal pedig tágabb
értelemben a magyar kis- és középvárosoknak egyaránt.
A fentieken alapulva kiinduló hipotézisem a következő volt: A kiválasztott település
példája jól szimbolizálja a magyarországi Z generáció problémáját: az eddigi életük során
nem alakult ki erős kötődés a lakóhelyük iránt, s mivel a települést nem látják olyan helynek,
ahol a jövőjüket elképzelik, ezért a fiatalok elvándorlási hajlandósága kiemelten magas.

Tóth-Kaszás, N.
63
A fenti kutatási kérdések megválaszolása és a feltételezés beigazolására egy 2017-ben
lefolytatott átfogó kérdőíves felmérést vettem alapul. A kérdőív vizsgálat tárgyául választott
város középiskoláinak bevonásával készült. A 2016/2017-es tanévben összesen 2.905 fő
középiskolás tanulója volt a településnek, akik közül 840 fiatal töltötte ki a kérdőívet 2017.
február és május között.
A kutatási feltételezésem igazolására egyszerű statisztikai, valamint ökonometriai
elemzéseket alkalmaztam. A leíró statisztika a vizsgált jelenségek számszerűsített
bemutatására, jellemzésére alkalmas. A kutatási minta jellemzőinek feltárását, valamint az
adathalmazban történő előfordulási arányok bemutatását grafikus eszközök támogatják
(Kerékgyártó et al., 2008). Az ökonometriai elemzések közül pedig a kereszttábla elemzést és
a varianciaanalízis vettem alapul. A kereszttábla olyan statisztikai technika, amely két vagy
több változót ír le egyidejűleg egy olyan táblával, ami megmutatja két vagy több korlátozott
számú kategorizált vagy értéket felvevő változó együttes eloszlását (Sajtos-Mitev, 2007:138).
A vizsgált változók közötti összefüggést a Khi-négyzet statisztika módszerével vizsgálhatjuk,
melynek szignifikancia értéke alapján megállapítható, hogy van-e statisztikai összefüggés a
vizsgált változók között. Amennyiben a Khi-négyzet szignifikanciája < 0,05, feltételezhetjük
az összefüggést. A statisztikai szignifikancia bebizonyítását követően a kapcsolat erősségét is
megvizsgálhatjuk, erre a Cramer-V mutató a legalkalmasabb, melynek értéke -1 és 1 között
mozog, ahol a 0 és a hozzá közeli értékek a kapcsolat hiányát, míg az abszolút értékben
számított 1 vagy aközeli érték a kapcsolat szorosságát mutatja (Sajtos-Mitev, 2007:143).
A varianciaanalízis (ANOVA) módszerének segítségével azt vizsgáljuk, hogy az egyes
csoportok milyen mértékben különböznek egymástól adott változók átlagai alapján. Az
elemzés során, a vizsgált csoportok által elért faktorértékek átlagait hasonlítjuk össze, annak
érdekében, hogy megtaláljuk azon területeket, változókat, ahol a csoportok által elért
átlagértékek szignifikánsan különböznek egymástól. A varianciaanalízis során az eltérést az
F-próba alacsony szignifikanciája (Sig.<0,1) igazolja (Székelyi – Barna, 2005).
EREDMÉNYEK
A 840 megkérdezett középiskolás közül 45,7% volt nő, s 54,3% férfi. A válaszadók
27,9%-a a városi gimnázium diákja, 72,9%-a pedig valamely szakképző középiskolában
tanul.
A diákok városhoz való kötődésének vizsgálata során azt tapasztaltuk, hogy közepes
kötődésről számoltak be a fiatalok, a válaszok megoszlása normál eloszláshoz közelít (2.
ábra).

Tóth-Kaszás, N.
64
2. ábra A városhoz való kötődés hisztogramja
Forrás: saját kutatás
Az ötfokozatú skálán átlagosan 3,09-es értéket és 1,07-es szórást mutatnak az adatok. Bár
magának a skálának elemzése mindig felveti a kérdést, hogy az átlag eleget árul-e el a
válaszadók valós véleményéről, jelen eredményekből arra következtethetünk, hogy bár a
megkérdezettek csaknem fele valamilyen mértékű kötődést érez a város iránt, könnyen
‚elcsábítható‘ egy jobb élet (magasabb fizetés, jobb életkörülmények stb.) reményében. Ez
pedig, be kell látnunk, egyáltalán nem kedvező egy vidéki középváros számára. Hármas érték
egy ötfokozatú skálán tulajdonképp azt jelzi, hogy különösebb érzelmek nem kötik a
Z generáció tagjait a településhez.
1. táblázat A városhoz való kötődés leíró statisztikái
N Minimum Maximum Átlag Szórás
Mennyire kötődsz a városhoz? 840 1 5 3,09 1,068
Forrás: saját kutatás
A szülővárosról rendelkező információk és a városvezetés munkásságának értékelése
érdekében megkérdeztük a diákokat, tudják-e, ki a város polgármestere. A fiatalok 86,3%-a
helyes választ adott a kérdésre, 13,7% viszont nem jó nevet tüntetett fel a kérdésnél, vagy
üresen hagyta a cellát, ami azt jelenti, nem tudta megmondani a polgármester nevét. A kérdés
felvetése már azért is érdekes tanulsággal szolgált számunkra, mert a városi vezetői a lakosság

Tóth-Kaszás, N.
65
által közvetlen módon választott pozíciók. Igaz ugyanakkor az is, hogy a megkérdezettek
életkorukból adódóan még nem vettek részt szavazáson.
A fenti két kérdés alapján kutatási felvetésem első része beigazolódni látszik, a vizsgált
középvárosban a megkérdezett Z generációs fiatalokban nem alakult ki különösebb kötődés a
szülővárosuk és annak közvetlen környezete iránt. A helyi politika és a városvezetés
törekvései iránt nem igazán nyitottak, nem érdekli őket. Mindez részben generációs
sajátosság, részben a konkrét vizsgálat település jellemzőiből is fakadhat.
A marketingkutatásokban gyakran alkalmazott módszer a szabad asszociáció. Ennek egy
irányított verzióját alkalmazta jelen kutatás is, amely során arra a kérdésre kerestük a választ,
hogy milyen állattal tudnák a fiatalok a várost azonosítani, s milyen jellemzők miatt
gondolják így. Ez a felmérés abban segítette a munkát, hogy megismerjük, milyennek látják a
fiatalok a települést? Bír-e azon értékekkel a város, amely a Z generáció tagjainak fontosak:
jókedv, integrálás, sebesség, innováció, szabadság, együttműködés, részletesség, testre
szabhatóság (Ferincz-Szabó, 2012).
Az asszociációs kérdésre adott válaszok meglehetősen nagy szórást mutattak, összesen 124
különböző válasz érkezett, ennyi különböző állatot neveztek meg a középiskolások. A kapott
válaszok gyakorisága alapján került összeállításra a 3. ábrán szereplő szófelhő.
3. ábra A vizsgált város szabad asszociációs azonosítása egy állattal
Forrás: saját kutatás
A válaszadók közül 96-an egy lajhár jellemzőivel azonosítják a várost, 42 fő a kutyát, 37 fő a
sast, 30 fő az oroszlánt, 25 a macskát, 24 a csigát, 22 az egeret, 21-en pedig a turult említették
ennél a kérdésnél. A 4. ábra mutatja azon állat-jellemzőket, amelyek alapján a válaszadók az
adott állattal azonosították a várost.

Tóth-Kaszás, N.
66
4. ábra A szabad asszociáció indoklása
Forrás: saját kutatás
A fenti eredmények alapján elmondható, hogy a középiskolás fiatalok a várost lassú, unalmas
településnek látják. Érdekes ugyanakkor, hogy többen említették a város történelmi múltját,
vagy épp nyugodtságát, megbízhatóságát, határozottságát, barátságosságát emelték ki.
Láthatjuk, hogy a vélemény a városról legalább annyi diák szemében pozitív, mint amennyien
a negatívumokat kiemelték. A kutatás – és a település hosszú távú céljai, fenntarthatósága -
végett azonban meg kell jegyeznünk, hogy a szakirodalmi áttekintés szerint a Z generáció
számára a gyorsaság, az interaktivitás, a szociális tevékenységek, a bátorság képvisel értéket.
Lajhár
• lassú
• unalmas
• alszik
• büdös
• próbálna haladni de nem feltétlenül tud
• érdektelen
Kutya
• barátságos
• átlagos
• mindig visszavár
• sokat ugat
• mindenki szereti
• okos
• megbízható
• hűséges
• büdös, koszos
• védelmező
• kóborló
Sas
• határozott
• védelmező
• szabad
• tud repülni
• megbízható közösség
• tekintélyes
• erős és nemes
• figyelmes
Oroszlán
• vad
• erős
• nagy, hangos
• gyors
• védelmez
• elszánt
• erős
• bátor
• szép
• veszélyes
• büszke
• harcos
Macska
• nyugodt
• távolságtartó
• sokat alszik
• csendes
• szelíd
• vad
• adja a szépet, ha kell valami
• unalmas
Csiga
• lassú
• kicsi
• erős
• unalmas
• nyálkás
• gerinctelen
• halk és kicsi
• lassan fejlődik
• folyamatosan fejlődik
Egér
• kicsi
• jelentéktelen
• koszos, élősködő
• unalmas
• szegény
• átlagos, beleolvad a környezetbe
• csúnya
• haszontalan
Turul
• ritka, nagy, okos
• történelme jelentős, de manapság nem sokan tudják, miféle állat is igazából
• erős
• védelmező
• régi
• csodálatos, szép
• szabad
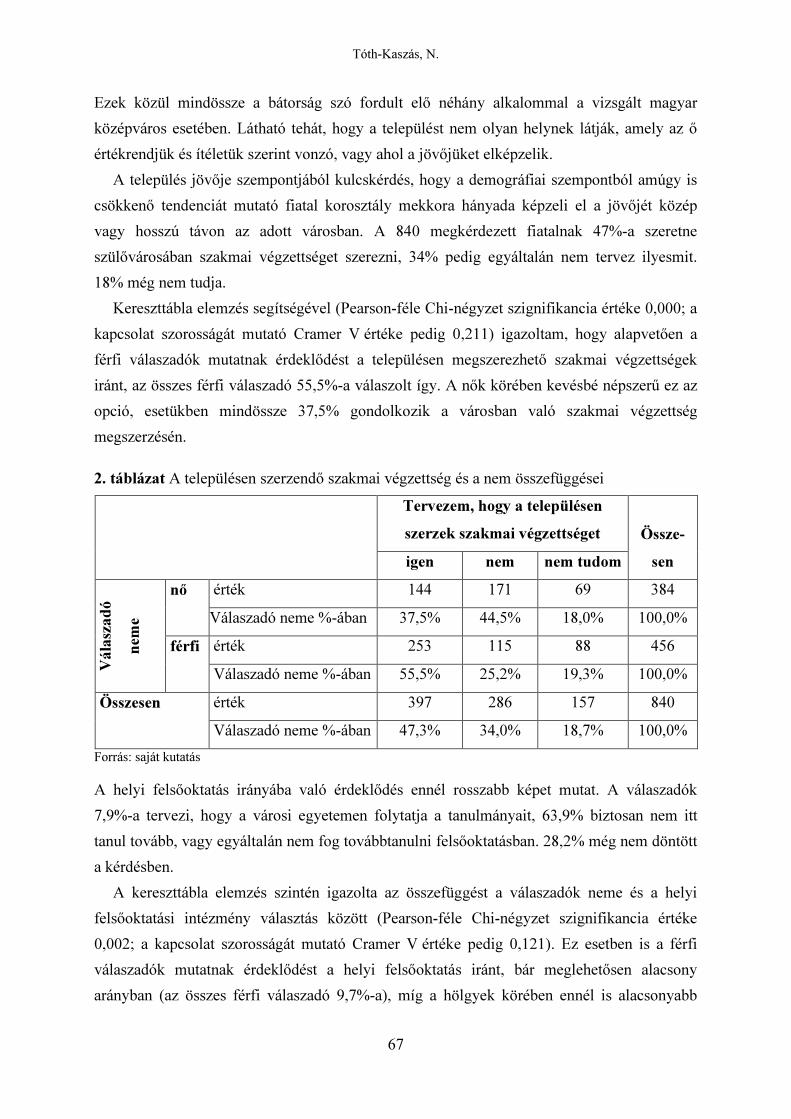
Tóth-Kaszás, N.
67
Ezek közül mindössze a bátorság szó fordult elő néhány alkalommal a vizsgált magyar
középváros esetében. Látható tehát, hogy a települést nem olyan helynek látják, amely az ő
értékrendjük és ítéletük szerint vonzó, vagy ahol a jövőjüket elképzelik.
A település jövője szempontjából kulcskérdés, hogy a demográfiai szempontból amúgy is
csökkenő tendenciát mutató fiatal korosztály mekkora hányada képzeli el a jövőjét közép
vagy hosszú távon az adott városban. A 840 megkérdezett fiatalnak 47%-a szeretne
szülővárosában szakmai végzettséget szerezni, 34% pedig egyáltalán nem tervez ilyesmit.
18% még nem tudja.
Kereszttábla elemzés segítségével (Pearson-féle Chi-négyzet szignifikancia értéke 0,000; a
kapcsolat szorosságát mutató Cramer V értéke pedig 0,211) igazoltam, hogy alapvetően a
férfi válaszadók mutatnak érdeklődést a településen megszerezhető szakmai végzettségek
iránt, az összes férfi válaszadó 55,5%-a válaszolt így. A nők körében kevésbé népszerű ez az
opció, esetükben mindössze 37,5% gondolkozik a városban való szakmai végzettség
megszerzésén.
2. táblázat A településen szerzendő szakmai végzettség és a nem összefüggései
Tervezem, hogy a településen
szerzek szakmai végzettséget Össze-
sen igen nem nem tudom
Vála
szad
ó
nem
e
nő érték 144 171 69 384
Válaszadó neme %-ában 37,5% 44,5% 18,0% 100,0%
férfi érték 253 115 88 456
Válaszadó neme %-ában 55,5% 25,2% 19,3% 100,0%
Összesen érték 397 286 157 840
Válaszadó neme %-ában 47,3% 34,0% 18,7% 100,0%
Forrás: saját kutatás
A helyi felsőoktatás irányába való érdeklődés ennél rosszabb képet mutat. A válaszadók
7,9%-a tervezi, hogy a városi egyetemen folytatja a tanulmányait, 63,9% biztosan nem itt
tanul tovább, vagy egyáltalán nem fog továbbtanulni felsőoktatásban. 28,2% még nem döntött
a kérdésben.
A kereszttábla elemzés szintén igazolta az összefüggést a válaszadók neme és a helyi
felsőoktatási intézmény választás között (Pearson-féle Chi-négyzet szignifikancia értéke
0,002; a kapcsolat szorosságát mutató Cramer V értéke pedig 0,121). Ez esetben is a férfi
válaszadók mutatnak érdeklődést a helyi felsőoktatás iránt, bár meglehetősen alacsony
arányban (az összes férfi válaszadó 9,7%-a), míg a hölgyek körében ennél is alacsonyabb
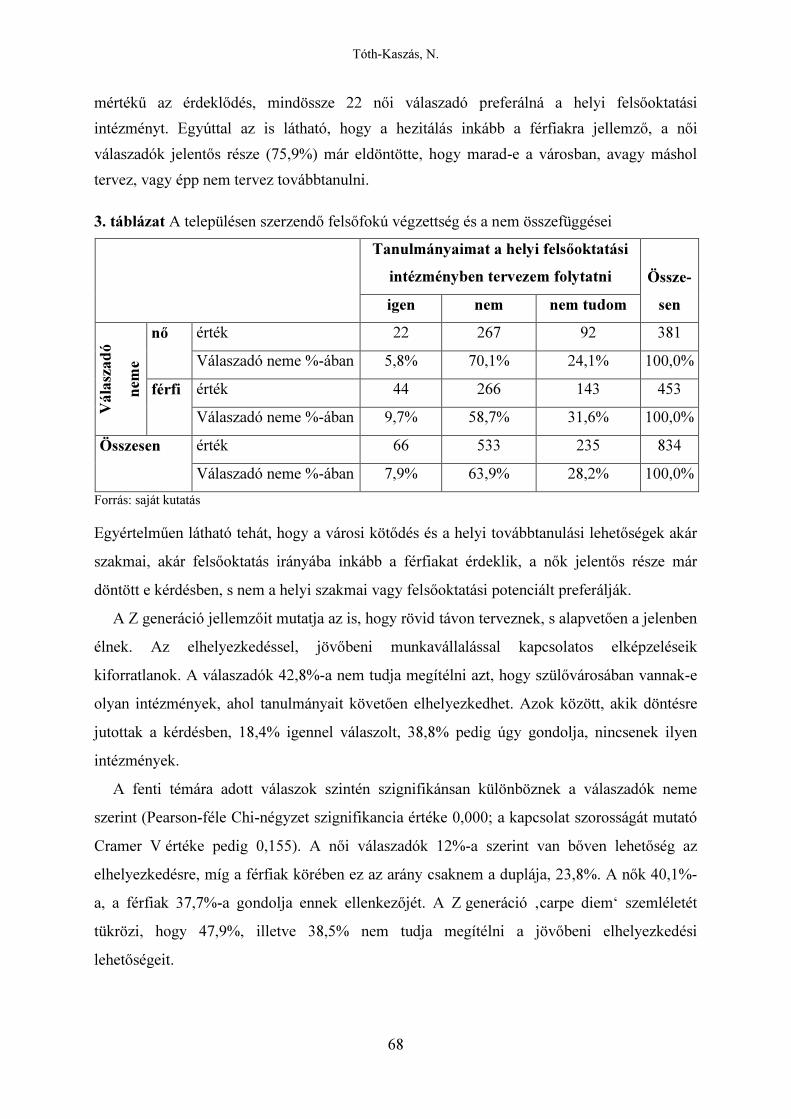
Tóth-Kaszás, N.
68
mértékű az érdeklődés, mindössze 22 női válaszadó preferálná a helyi felsőoktatási
intézményt. Egyúttal az is látható, hogy a hezitálás inkább a férfiakra jellemző, a női
válaszadók jelentős része (75,9%) már eldöntötte, hogy marad-e a városban, avagy máshol
tervez, vagy épp nem tervez továbbtanulni.
3. táblázat A településen szerzendő felsőfokú végzettség és a nem összefüggései
Tanulmányaimat a helyi felsőoktatási
intézményben tervezem folytatni Össze-
sen igen nem nem tudom
Vála
szad
ó
nem
e
nő érték 22 267 92 381
Válaszadó neme %-ában 5,8% 70,1% 24,1% 100,0%
férfi érték 44 266 143 453
Válaszadó neme %-ában 9,7% 58,7% 31,6% 100,0%
Összesen érték 66 533 235 834
Válaszadó neme %-ában 7,9% 63,9% 28,2% 100,0%
Forrás: saját kutatás
Egyértelműen látható tehát, hogy a városi kötődés és a helyi továbbtanulási lehetőségek akár
szakmai, akár felsőoktatás irányába inkább a férfiakat érdeklik, a nők jelentős része már
döntött e kérdésben, s nem a helyi szakmai vagy felsőoktatási potenciált preferálják.
A Z generáció jellemzőit mutatja az is, hogy rövid távon terveznek, s alapvetően a jelenben
élnek. Az elhelyezkedéssel, jövőbeni munkavállalással kapcsolatos elképzeléseik
kiforratlanok. A válaszadók 42,8%-a nem tudja megítélni azt, hogy szülővárosában vannak-e
olyan intézmények, ahol tanulmányait követően elhelyezkedhet. Azok között, akik döntésre
jutottak a kérdésben, 18,4% igennel válaszolt, 38,8% pedig úgy gondolja, nincsenek ilyen
intézmények.
A fenti témára adott válaszok szintén szignifikánsan különböznek a válaszadók neme
szerint (Pearson-féle Chi-négyzet szignifikancia értéke 0,000; a kapcsolat szorosságát mutató
Cramer V értéke pedig 0,155). A női válaszadók 12%-a szerint van bőven lehetőség az
elhelyezkedésre, míg a férfiak körében ez az arány csaknem a duplája, 23,8%. A nők 40,1%-
a, a férfiak 37,7%-a gondolja ennek ellenkezőjét. A Z generáció ‚carpe diem‘ szemléletét
tükrözi, hogy 47,9%, illetve 38,5% nem tudja megítélni a jövőbeni elhelyezkedési
lehetőségeit.

Tóth-Kaszás, N.
69
4. táblázat A településen elérhető elhelyezkedési lehetőségek megítélése és a nem összefüggései
A városban több intézmény van,
ahol el tudok majd helyezkedni
Összesen igen nem nem tudom
Vála
szad
ó
nem
e
nő érték 46 153 183 382
Válaszadó neme %-ában 12,0% 40,1% 47,9% 100,0%
férfi érték 108 171 175 454
Válaszadó neme %-ában 23,8% 37,7% 38,5% 100,0%
Összesen érték 154 324 358 836
Válaszadó neme %-ában 18,4% 38,8% 42,8% 100,0%
Forrás: saját kutatás
Az elvándorlás mértékét pedig az szemlélteti legjobban, hogy a 840 diákból 471 (56,1%)
egyértelműen úgy fogalmazott, hogy nem tervez a városban maradni tanulmányainak
befejezése után. 35% még bizonytalan, s csupán 74 fő (8,8%) jelezte, hogy a vizsgált
településen kíván maradni a jövőben is.
A település iránti kötődés és a fentiekben bemutatott elvándorlás mértéke közötti
összefüggés variancaelemzéssel is igazolható.
5. táblázat Varianciaelemzés a városhoz kötődés és az elvándorlás változók között (ANOVA tábla)
ANOVA
Mennyire kötődsz a városhoz
Sum of Squares df Mean Square F Sig.
Between Groups 72,848 2 36,424 34,495 ,000
Within Groups 883,808 837 1,056
Total 956,656 839
Forrás: saját kutatás
Az alábbi means plot ábrán is látható, hogy azon válaszadó fiatalok, akik a városban tervezik
jövőjüket a tanulmányaik befejezése után, átlagosan csaknem 3,6-ra értékelték a város iránti
kötődésüket. Azok, akik nem helyben tervezik a jövőjüket, 2,8-as átlagértékű kötődésről
számoltak be.

Tóth-Kaszás, N.
70
5. ábra: A városhoz való kötődés és az elvándorlási hajlandóság összefüggésének ábrázolása
Forrás: saját kutatás
A 6. táblázatban látható statisztikai adatok azt mutatják, hogy a válaszopciók páronkénti
összehasonlítása során szignifikáns különbség a fenti kérdésre igennel és nemmel felelők
között van. Azon fiatalok, akik a városban terveznek maradni, magasabb kötődést is éreznek a
város iránt (3,6), míg a nem a városban tervezők kötődése jóval alacsonyabb (2,8). Szintén
szignifikáns a különbség a kérdésre nemmel válaszolók valamint a nem tudom válaszokat
adók véleménye között, amiből arra következtethetünk, hogy akik egyértelműen nem
kötődnek a városhoz, ők szinte biztosan nem itt fognak eltelepedni, míg a hezitálók városhoz
való kötődése alapvetően magasabb. Az igennel válaszolók és a nem tudom választ adók
véleménye nem tér el egymástól szignifikánsan.
6. táblázat Varianciaelemzés a városhoz kötődést és az elvándorlás változók között
Függő változó: Mennyire kötődsz a városhoz?
(I) Terveim szerint a
városban maradok a
tanulmányaim végezte
után
(J) Terveim szerint a
városban maradok a
tanulmányaim végezte
után
Mean
Difference
(I-J)
Std.
Error Sig.
95% Confidence
Interval
Lower
Bound
Upper
Bound
LSD igen nem ,737* ,128 ,000 ,49 ,99
nem tudom ,191 ,134 ,153 -,07 ,45
nem igen -,737* ,128 ,000 -,99 -,49
nem tudom -,546* ,076 ,000 -,70 -,40
nem tudom igen -,191 ,134 ,153 -,45 ,07
nem ,546* ,076 ,000 ,40 ,70
Forrás: saját kutatás

Tóth-Kaszás, N.
71
A fenti eredmények kezdeti feltételezésem utolsó szakaszát is beigazolták. A vizsgált
magyarországi középvárosban a fiatalok elvándorlási hajlandósága kiemelten magas. Ez az
eredmény pedig igazolja és alátámasztja azt a kutatási irányt, amelybe jelen tanulmány
hátteréül szolgáló kutatói pályázatomban belekezdtem. A fiatalok elvándorlása immáron nem
csak a falvakat érinti, hanem a kis és középvárosok számára is hasonlóan negatív perspektívát
mutatnak az eredmények.
ÖSSZEGZÉS, KÖVETKEZTETÉSEK
Kutatásom célja az volt, hogy egy magyarországi középváros példáján keresztül
rámutassak a Z generáció települési kötődésének hiányára, továbbá felhívjam a figyelmet
azon problémára, amely a falvak és a kisvárosok után a középvárosokat is eléri: a jelentős
mértékű elvándorlás és népességszám csökkenés.
Jelen tanulmány egyfajta esettanulmányként egy magyarországi középváros példáját
dolgozza fel, s a 840 itt tanuló középiskolás diák körében végzett kérdőíves felmérés
eredményeit összegzi. A tanulmány a következő feltételezéssel élt: A kiválasztott település
példája jól szimbolizálja a magyarországi Z generáció problémáját: az eddigi életük során
nem alakult ki erős kötődés a lakóhelyük iránt, s mivel a települést nem látják olyan helynek,
ahol a jövőjüket elképzelik, ezért a fiatalok elvándorlási hajlandósága kiemelten magas.
A Z generációnak nevezett fiatalok jelenleg 9-23 évesek, az általunk vizsgált személyek
14-18 év közöttiek. Annak ellenére, hogy a közösséghez tartozás és a csapatszellem kiemelten
fontos értéknek minősül a generáció számára, a vizsgált fiatalok ezt a fajta identitást a
település vonatkozásában nem érzik. Sokkal inkább kötődnek a barátaikhoz, iskolatársaikhoz,
mint a településhez, városhoz, ahol élnek. Ezt mutatja az identitás erősségét bemutató táblázat
és ábra is, ahol látható, hogy a településhez való kötődésük 3,09-es átlagértékű egy ötfokozatú
skálán mérve. A kötődésük hiányára vonatkozó felvetés tehát beigazolódni látszik.
Egy szabad asszociációs kérdés formájában tártuk fel, hogy a vizsgált városról alkotott kép
mennyire egyezik meg azon értékrenddel, jellemzőkkel, amelyekkel a Z generáció tagjai
bírnak, vagy legalábbis amelyeket értékelnek. A vizsgált magyarországi középváros a legtöbb
válaszadót egy lajhárra emlékeztette, amely lassú és unalmas. Bár számos pozitívumot (szép,
védelmező, bátor) is megemlítettek a fiatalok, összességében ezek nincsenek összhangban
azon értékekkel, amelyek a generáció számára vonzóak (jókedv, sebesség, innováció,
szabadság, együttműködés stb.). Annak ellenére, hogy a válaszokból úgy tűnik, a fiatalok még
nem tervezik a jövőjüket közvetlenül, elmondhatjuk tehát, hogy a települést nem látják olyan
helynek, ahol a jövőjüket elképzelik.

Tóth-Kaszás, N.
72
Végül a vizsgált célcsoport továbbtanulási és munkába állási szándékait vizsgálva azon
eredményre jutottunk, hogy a megkérdezettek 47,3%-a szeretne szülővárosában szakmai
végzettséget szerezni; 7,9%-a tervezi, hogy a városi egyetemen folytatja a tanulmányait;
42,8%-a nem tudja megítélni azt, hogy szülővárosában van-e több olyan intézmény, ahol
tanulmányit követően elhelyezkedhet; 56,1%-a pedig egyáltalán nem tervez a városban
maradni tanulmányainak befejezése után. Megállapíthatjuk, hogy a vizsgált városban élő
fiatalok elvándorlási hajlandóság kiemelkedően magas, a középiskolások több mint fele nem
tervez a lakhelyén maradni.
Nem meglepő módon egyértelmű összefüggés mutatható ki ugyanakkor a városhoz való
kötődés és a helyben maradási szándék között: a varianciaelemzés igazolta, hogy a magasabb
kötődéssel bírók nagyobb valószínűséggel tervezik, hogy jövőjüket is a vizsgált városban
töltik.
Kutatásom folytatásként folyamatban van a települési stakeholderek kvalitatív típusú
megkérdezése, amely során a város nem üzleti típusú szereplőinek (közszolgáltatók,
közüzemek és non profit szereplők) véleményét tárom fel a Z generáció helyben tartásának
lehetőségeiről.
SUMMARY
My research focuses on the settlement aspects of nonbusiness marketing. It highlights a problem, which today many domestic and rural communities are struggling with: the out-migration of young people. This long-lasting problem in the rural environment has continued in the 2010s and affects not only villages, small towns but mid-sized cities, as well. Many research results indicate that the retention of a young workforce is a generic problem in Hungary today, almost in every settlement. Based on Stadman the individuals are not insisting on the physical nature of their environment but on the experiences they attain (Stadman, 2002). Knez (2005) complemented the above with the fact, that all of the experiences have the greatest effect when talking about childhood experiences, since in such cases the attachment is personally related. That is why in my research I am focusing on the identity strength of the Z generation: the identity, which has been formed during their childhood and adolescence, can play key roles in their retention in the city. In my paper, I accept the fact that identity can only be built on existing opinions and impressions, but I also believe that these impressions can be shaped. The most important starting point for settlement identity is the "my consciousness" of the people living there, and the real identity what can be developed by the improvement of the relationship between the inhabitants and the local government. Beside the different approaches of identity and also the values that are important to the high school students, as the members of generation Z, I also analyzed, their bondages to the settlement where they live. The generation Z means those young people, who were born after 1995. The members of the Z generation are currently in 2018 in the phase of life, in which they are looking for their own identity. However, according to Tari, they are the first true global generation (Homo Globalis). In the empirical research the case of a Hungarian mid-sized city is examined. The purpose of this study is to explore the strength of young people's urban attachment and the way how they see the city. My starting hypothesis was the following: the example of the chosen settlement symbolizes the problem of the Z generation in Hungary: no strong attachment to their place of residence has emerged in their lives so far, and since the settlement is not seen as a place where their future is imagined, young people's aspiration to emigrate is extremely high. To answer the above research question and to confirm the

Tóth-Kaszás, N.
73
assumption I took a comprehensive questionnaire survey conducted in 2017. The secondary school of the town was chosen for the survey, 840 young people completed the questionnaire between February and May 2017. Based on the literature overview and the case of the Hungarian mid-sized city I concluded that the generation Z has not real connection to this special town, where they live, they do not see the place as an attractive venue and do not plan their future in the examined settlement. This not favorable result has the message that this town, and maybe also the other Hungarian mid-sized cities should re-think their PR activities and the steps in order to improve the identity.
Acknowledgement
„ AZ EMBERI ERŐFORRÁSOK MINISZTÉRIUMA ÚNKP-17-4 KÓDSZÁMÚ ÚJ NEMZETI KIVÁLÓSÁG PROGRAMJÁNAK TÁMOGATÁSÁVAL KÉSZÜLT”
FELHASZNÁLT IRODALOM
Berkesné Rodek, N., Birkner, Z. & Ernszt, I. (2017). Köldökzsinór – A Pannon Városok Szövetségéhez tartozó városok sikerének és megtartó erejének kulcstényezői, Felsőbbfokú Tanulmányok Intézete, Savaria University Press, Kőszeg – Szombathely, ISBN 978-615-5742-03-3 pp. 15.
Braun, E., & Otgaar, A. (2008). City identity and image. Erasmus University, Rotterdam. Braun, E. (2008). City marketing: Towards an Integrated Approach. Erasmus Research
Institute of Management. Rotterdam. ISBN 978-90-5892-180-2 Csordás T., Markos-Kujbus É., & Gáti M. (2014). The Attributes of Social Media as a
Strategic Marketing Communication Tool. Journalism and Mass Communication 4 (1), 48-71.
Darvas D., & Péter E. (2012). Nagykanizsa Megyei Jogú Város Funkcióbővítő fejlesztése,
Nagykanizsa tényleg értünk szépül? In: [Pannon Egyetem, Georgikon Kar] (szerk.)Ifjúsági tudományos fórum. Konferencia helye, ideje: Keszthely, Magyarország, 2012.04.19 Keszthely: Pannon Egyetem Georgikon Kar, 2012. Paper CD-ROM Nagykanizsa Megyei. (ISBN:978 963 9639 45 4)
Ernszt, I. (2017). A siker különböző felfogásai, In: Felsőbbfokú Tanulmányok Intézete, Savaria University Press, Kőszeg – Szombathely. pp. 39.
Fehérvölgyi, B., Birkner Z., & Péter E. (2012). The trans-border co-operation as the successful realization of the 'glokal' philosophy, Deturope: Central European Journal
Of Tourism And Regional Development 4(2): 71-97. Ferincz, A., & Szabó, Zs. R. (2012). Z generáció hatása a munkáltató szervezetekre.
Munkaügyi szemle, 56(2): 88-93 Idegen szavak gyűjteménye http://idegen-szavak.hu/identit%C3%A1s. Letöltés ideje: 2018. 01.16. Gyulavári, T., & Malota, E. (2014). Az énképilleszkedés szerepe a fogyasztók turisztikai
desztinációértékelésében. Marketing és Menedzsment 2014/3. pp. 5-14. Kavaratzis, M. (2004). From city marketing to city branding: Towards the theoretical
framework for developing city brands. Place Branding. ISSN: 1744–070X. Vol. 1, 1, 58–73
Kerékgyártó, G. L., Balogh, I., & Szarvas, B. (2008). Statisztikai módszerek és alkalmazásuk
a gazdasági és társadalmi elemzésekben. Aula Kiadó, Budapest Kis, M. (2006). Versenyképesség a területfejlesztésben, image vizsgálatok. Szegedi
Tudományegyetem Mérnöki Kar. Knez, I. (2005). Attachment and identity as related to a place and its perceived climate.
Journal of Environmental Pychology, 25, pp. 207-218

Tóth-Kaszás, N.
74
Kozma, G. (2006). Place marketing. Debreceni Egyetem Kossuth Egyetemi Kiadója. Debrecen. ISBN: 963 472 975 4
Köcsné, S. I. (2004). Módszertan a tanári mesterség alapjai. A Győr-Sopron-Moson megyei Pedagógiai Intézettel együttműködve http://pszk.nyme.hu/tamop412b/tanari_mesterseg_alapjai/323_identits.html. Letöltés ideje: 2018.01.16.
Kraftné Somogyi, G., & Fojtik, J. (1998). Helymarketing, turizmusmarketing, területfejlesztés. Marketing & Menedzsment ISSN: 1219-0349. 1998/3. 55, 57. oldal
László, É. (1998). Városmarketing. Térségfejlesztési ismeretek felsőfokon II. kötet. Kereskedelmi és Gazdasági Főiskola. Szolnok. ISSN: 1419-211-X; 2. 31. oldal
Magyar M., & Keller, K. (2016). Egyetemi fesztiválok környezetbarát szempontok alapján történő vizsgálata. In: Nagy Zita Barbara (szerk.) LVIII. Georgikon Napok: Felmelegedés, ökolábnyom, élelmiszerbiztonság. Keszthely, Pannon Egyetem Georgikon Kar, 227-235. oldal
Malota, E., & Gyulavári, T. (2014). Az észlelt kultúraszemélyiség és hatása az ország turisztikai és üzleti célpontként való megítélésére. Vezetéstudomány, 45(1): 2-13. old.
McCrindle, M., & Wolfinger, E. (2010). Az XYZ ábécéje. A nemzedékek meghatározása. p. 14; 71
Mészáros, B. (1998). Településmarketing. Marketing & Menedzsment, ISSN: 1219-0349, 1998/4. 4, 8. oldal
Németh, K., Péter, E., & Birkner, Z. (2013). A települési energiaellátás innovációs kihívásai, XIX. Ifjúsági Tudományos Fórum, Pannon Egyetem Georgikon Kar, Keszthely, 2013. április 25., ISBN: 978-963-9639-51-5, 2-3 p.
Nyárádi, G., & Szeles, P. (2004). Public relations II. Perfekt Zrt. Budapest. ISBN: 9789633946060
Paliaga, M., Franjic, Z., & Strunje, Z. (2010). Methodology of valuation of cities’ brands. Ekonomska Istravizanja. ISSN: 1331-677X. Vol. 23 (2010) No. 2 (102-111)
Piskóti, I., Dankó, L. & Schupler, H. (2002). Régió- és településmarketing. Budapest. KJK-Kerszöv Jogi és Üzleti Kiadó Kft. ISBN: 963-244-683-7.
Sajtos, L., & Mitev, A. (2007). SPSS Kutatási és adatelemzési kézikönyv. Alinea Kiadó, Budapest
Scannell, L., Giffort, R., (2010). Defining place attachment: A tripartite organization framework. Journal of Environmental Psychology, 30, pp 1-10; 39
Stadman, R. (2002). Toward a social psychology of place. Environment and Behavior, 34, pp. 561-581
Steigerwald, K. (2014). Milyen a ma élő hat generáció? Üzlet&Pszichológia, [on-line]. http://kulturaonline.hu/milyen_a_ma_elo_hat_generacio_3521. Letöltve: 2018.01.16.
Strauss, W. & Howe, N. (1991). Generations: The History of America’s Future, Perennial, New York.
Sulyok, A. (2003). Az Y generáció elérésének titka. http://elib.kkf.hu/edip/D_10719.pdf Letöltés ideje: 2018.01.16.
Szakál, G. (1995). Az image mint a városmarketing eszköze. Tér és Társadalom 9(1-2): 25-31.
Székelyi, M., & Barna, I. (2005). Túlélőkészlet az SPSS-hez, Typotex Kiadó Kft., Budapest Tari, A. (2011). Z generáció. Tercium Könyvkiadó, Budapest p. 348 Törőcsik, M., Szűcs, K., & Kehl, D. (2014). Generációs gondolkodás – A Z és az Y generáció
életstílus csoportjai. Marketing & Menedzsment II. Különszám Törőcsik, M. (1995). Település- és területidentitás kialakítása marketing eszközökkel. Tér és
Társadalom. ISSN: 0237-7683. 1995/1-2. 17-18. oldal

DETUROPE – THE CENTRAL EUROPEAN JOURNAL OF REGIONAL DEVELOPMENT AND TOURISM
Vol. 10 Issue 2 2018 ISSN 1821-2506
75
Original scientific paper
TERRITORIAL IMPACT ASSESSMENT: COHESION POLICY
AND BALANCED TERRITORIAL DEVELOPMENT (CZECHIA)
Jiří NOVOSÁKa, Oldřich HÁJEKa, Lucie SEVEROVÁa, Daniela SPIESOVÁa, Jana NOVOSÁKOVÁb
a Czech University of Life Sciences, Kamýcká 129, CZ-16521 Prague; e-mail: [email protected]; [email protected], [email protected], [email protected] b NEWTON College, Václavské náměstí 11, CZ-11000 Prague
Cite this article: Novosák, J., Hájek, O., Severová, L., Spiesová, D., Novosáková, J. (2018). Territorial Impact Assessment: Cohesion policy and balanced territorial development (Czechia). Deturope, 10(2), 75-90.
Abstract
The intent of this paper is to add to the current knowledge in the field of TIA modelling by presenting a case study of cohesion policy (CP) in Czechia, 2007-2013. The empirical results are mixed. While the territorial impact of CP interventions concerning the NSRF objective of a 'Competitive Czech Economy' is higher in main metropolitan regions, CP interventions concerning the NSRF objectives of an 'Open, Flexible and Cohesive Society' and of an 'Attractive Environment' have higher impacts in regions with more desire for CP interventions. Consequently, territorial impacts of the three NSRF objectives are contrary to one another, and the observed pattern of overall territorial impacts of CP interventions is patchy, almost mosaic-like. Additionally, the paper suggests some methodological ideas for TIA modelling drawing inspirations from the prominent TEQUILA model. In particular, the spatial distribution of SF is used to model the intensity of CP interventions in a territory. A methodology how to model the potential territorial impact and the desirability of CP interventions in a territory is also presented. Keywords: Territorial Impact Assessment (TIA), Cohesion Policy, territorial goals, Czechia
INTRODUCTION
Since its first mention in the Amsterdam Treaty, territorial cohesion has become increasingly
significant in EU policy agenda (see, e.g., Davoudi, 2005; Cotella, Adams and Nunes, 2012).
Servillo (2010) stressed the importance of linking territorial cohesion to economic
development, while Davoudi (2005), Elissalde and Santamaria (2014), Colomb and Santinha
(2014), and Faludi (2005) point out the relationship between territorial and social cohesion in
the ‘European Social Model’, noting that nobody should be disadvantaged by their place of
residence. However, despite its increasing significance, the concept of territorial cohesion is
still somewhat vague because there is a variety of definitions in literature concerning this

Novosák, J., Hájek, O., Severová, L., Spiesová, D., Novosáková, J.
76
topic (see, e.g., Camagni, 2017; Servillo, 2010; Nosek, 2017; Golobič and Marat, 2011;
Camagni, 2009).
Historically, the concept of territorial cohesion relates to the EU objective of preventing
large territorial disparities (see, e.g., Camagni, 2009; Nosek, 2017; Servillo, 2010). With this
line of reasoning, it is expected that policy instruments aim to support lagging regions in order
to reduce territorial disparities and to achieve balanced territorial development and ‘territorial
justice’ (see, e.g., Malý and Mulíček, 2016; Colomb and Santinha, 2014; Colomb and
Santinha, 2014). As Colomb and Santinha (2014), Camagni (2009) note, special attention is
given to some types of territories, e.g., rural areas, declining urban areas, remote territories
and others. However, several additional aspects regarding the concept of territorial cohesion
deserve special mention:
Firstly, the concept of territorial cohesion emphasises that public services – or services of
general interest – should be provided within reasonable distances of all people. Hence,
also people living in peripheral regions are expected to have access to these types of
services (see, e.g., Colomb and Santinha, 2014; Cotella, Adams and Nunes, 2012;
Servillo, 2010; Faludi, 2005; Colomb and Santinha, 2014).
Secondly, all territories are considered to have developmental potential, which should be
identified, strengthened and exploited. Hence, endogenous development and place-based
development are associated with the concept of territorial cohesion (see, e.g., Bentley and
Pugalis, 2014; Colomb and Santinha, 2014; Abrahams, 2014). It is worth noting that also
territorial competitiveness closely relates to this aspect of territorial cohesion.
Thirdly, sectoral policies are likely to have significant territorial impacts. The concept of
territorial cohesion therefore emphasises the need for coherence between the two types of
policies on the basis of integrating the development strategies (see, e.g., Cotella, Adams
and Nunes, 2012; Davoudi, 2005; Greiving, Fleischhauer, Tarvainen, Schmidt-Thomé
and Jarva, 2008; Faludi, 2005). Note that all thematic dimensions of sustainable
development are relevant here (see, e.g., Medeiros, 2012; Nosek, 2017; Colomb and
Santinha, 2014).
Different aspects of the concept of territorial cohesion are interlinked, and thus, there is a
potential conflict between them. In this regard, the main discussion focusses on the tensions
between territorial competitiveness aims and ‘territorial justice’ aspirations (see, e.g.,
Luukkonen and Moilanen, 2012; De Propris, 2007; Servillo, 2010). It was these tensions that
broadened the concept of territorial cohesion to also include the emphasis on polycentric

Novosák, J., Hájek, O., Severová, L., Spiesová, D., Novosáková, J.
77
territorial development and territorial cooperation (see, e.g., Zaucha, Komornicki, Böhme,
Świątek and Żuber, 2014; Davoudi, 2005; Medeiros, 2012). As Malý and Mulíček (2016)
claim, polycentric territorial development recognizes the potential for metropolitan areas to
generate economic competitiveness. Territorial cooperation and functional links improve
‘territorial justice’ through developing strong metropolitan areas in peripheral regions (see,
e.g., Medeiros, 2012). Hence, polycentric development may be perceived as a bridging
concept concerning cohesion and competitiveness (see, e.g., Malý and Mulíček, 2016; Veneri
and Burgalassi, 2012).
In light of increasing significance in the concept of territorial cohesion, the interest in
territorial impact assessment (hereafter referred to as TIA) has recently grown (see, e.g.,
Camagni, 2009). TIA is relevant for all policies and instruments that have territorial impacts,
and this was used in EU transport policy assessments (see, e.g., Camagni, 2009), and also for
Slovenian energy policy (see, e.g., Golobič and Marat, 2011), cohesion policy in Portugal
(see, e.g., Medeiros, 2014; Medeiros, 2012), cohesion policy in Spain (see, e.g., Medeiros,
2017), EU environmental legislation (see, e.g., Greiving, Fleischhauer, Tarvainen, Schmidt-
Thomé and Jarva, 2008; Fischer et al., 2015), and the Slovenian NATURA 2000 programme
(see, e.g., Marat, Kolarič and Golobič, 2013). Nevertheless, despite the increasing number of
applications, there is no particular TIA methodology that has been established as conclusively
superior to others (see, e.g., Golobič and Marat, 2011; Greiving, Fleischhauer, Tarvainen,
Schmidt-Thomé and Jarva, 2008).
Golobič and Marat (2011), and Medeiros (2014) outline three general methodological steps
regarding TIA methodology: (a) the definition of the scope and framework of TIA (e.g.,
source of territorial impacts, territorial units of assessment, time of assessment – ex-ante or
ex-post, territorial objectives); (b) identification of causal mechanisms (e.g., policy objectives
and influencing factors); and (c) empirical assessment. On this basis, several TIA models
were developed and used, including the prominent TEQUILA model (see, e.g., Camagni,
2009; Greiving, Fleischhauer, Tarvainen, Schmidt-Thomé and Jarva, 2008), the TARGET-
TIA model (see, e.g., Medeiros, 2014; Medeiros, 2012), and the EATIA model (see, e.g.,
Fischer et al., 2015). The main characteristics of these models may be briefly outlined as
follows (see, e.g., Camagni, 2009; Golobič and Marat, 2011; Medeiros, 2014):
TIA models relate to the concept of territorial cohesion, and they consider a variety of
definitional aspects, which are utilised using relevant and scaled indicators.

Novosák, J., Hájek, O., Severová, L., Spiesová, D., Novosáková, J.
78
The associations between policy inputs and impacts, the intensity of policy interventions
in a territory; and the desirability of policy interventions in a territory are all considered in
calculating territorial impacts.
As indicated by TIA models, other factors may also be taken into account such as
territorial vulnerability, substitution effects, sustainability of impacts, and territorial
closeness of effects.
The intent of this paper is to add to the current knowledge in the field of TIA modelling by
presenting a case study of cohesion policy in Czechia, 2007-2013 (hereafter referred to as
CP). The main characteristics of TIA models are regarded for this purpose. Firstly, CP
interventions are assessed in terms of them being the source of territorial impacts. The
intensity of policy interventions in a territory is determined by the pattern of CP territorial
expenditures.
Secondly, the impacts of CP expenditures are defined with reference to the three strategic
objectives of the ‘National Strategic Reference Framework of the Czech Republic 2007-2013’
(hereafter referred to as NSRF): (a) a ‘Competitive Czech Economy’; (b) an ‘Open, Flexible
and Cohesive Society’; and (c) an ‘Attractive Environment’ (see, e.g., MRD CR, 2007).
Thirdly, the desirability of policy interventions in a territory is operationalized and measured
using composite indicators that relate to the three NSRF objectives. Fourthly, results are
discussed in light of balanced territorial development, which is one of the tenets of territorial
cohesion, and these characteristics are used as a guiding framework. Hence, a TIA model
based on robust empirical grounds is suggested. In this context, it is noteworthy that a number
of authors such as Medeiros (2015), Golobič and Marat (2011) argue that TIA modelling has
a lack of ‘hard quantitative data’ and an over-reliance on subjective-based judgements.
This paper is structured as follows: the second section provides the objectives and
methods. The third section presents results, which are then discussed in the following section.
The last section provides a conclusion.
OBJECTIVES AND METHODS
The main objective of this paper is to assess territorial impacts of CP interventions using TIA
modelling and to discuss results relating to balanced territorial development. The
methodology is based on the theoretical framework presented in the introduction. The starting
point is the equation inspired by the prominent TEQUILA model (see, e.g., Camagni, 2009):
TIM�= ∑ D
�,��PIM
�,� ,

Novosák, J., Hájek, O., Severová, L., Spiesová, D., Novosáková, J.
79
where TIMr shows territorial impacts of CP interventions on a region r; PIMr,o is potential
territorial impact of CP interventions that relate to an objective o on a region r; and Dr,o is the
desirability of CP interventions that relate to an objective o in a region r. TIMr, therefore,
aggregates territorial impacts for the three NSRF objectives. All calculations are based on 206
Czech regions between level LAU1 and LAU2.
The potential territorial impact PIMr,o is calculated as a product of two components: (1) the
general impact of CP interventions on the three NSRF objectives; and (2) the intensity of CP
interventions (refer to e.g., Camagni, 2009 for this approach). For this purpose, two matrices
are used. The first matrix contains priority axes of thematic and regional operational
programmes under the Convergence and Regional Competitiveness and Employment
objectives (hereafter referred to as priority axes) in rows, and contains the three NSRF
objectives in columns. The general impact of each priority axis on each NSRF objective is
determined using the intervention logic described in the NSRF and also by using expert
judgements. The impact is rated on a four-point scale (from 0 to 3) ranging from ‘no impact –
0’ to a ‘very strong impact – 3’ (see, e.g., Camagni, 2009; Medeiros, 2014 for the use of
scales), and using a three-step procedure as follows.
Firstly, the impact of each priority axis on each NSRF objective is evaluated according to
three criteria: (1) the first criterion relates to the question whether the impact of a priority axis
on a NSRF objective is explicitly mentioned in the NSRF content; (2) the second criterion
relates to the question whether priority axis indicators are of relevance to a NSRF objective;
(3) the third criterion relates to the question whether the link between priority axis indicators
and a NSRF objective may be regarded as a strong link, considering ex-ante expected
outcome values. The number of ‘yes’ responses determines the impact of each priority axis on
each NSRF objective on a four-point scale. Secondly, five experts independently explore the
impacts of each priority axis on each NSRF objective as these were rated in the first step of
the procedure. On this basis, suggestions for change are gathered and these are discussed in
the third step of the procedure and eventually made.
The second matrix contains regions in rows and the priority axes in columns. Structural
fund (hereafter referred to as SF) allocation per one inhabitant – the intensity of CP
interventions – is assigned to each priority axis and each region, and the values are
transformed to fall within a range of zero to one. Here, zero is no SF allocation and one is the
highest SF allocation among all the regions. The fact that particular priority axes have
different weights is considered by multiplying the transformed values in the matrix by the

Novosák, J., Hájek, O., Severová, L., Spiesová, D., Novosáková, J.
80
share of the total SF allocation for corresponding priority axes. The main sources of
information as of June 2016 are from the official data published by the Ministry of Regional
Development of the Czech Republic (hereafter referred to as the MRDCR), by the Ministry of
Industry and Trade of the Czech Republic (hereafter referred to as the MITCR), and also by
the Ministry of Labour and Social Affairs of the Czech Republic (hereafter referred to as the
MLSACR). Hence, the potential territorial impact PIMr,o expresses the impact of CP
interventions in a region r with respect to an objective o.
The desirability of CP intervention that relates to an objective o in a region r is calculated
on the basis of composite indicators that date from the beginning of the programming period
2007-2013. For each of the three NSRF objectives, Tab. 1 reviews individual indicators that
are aggregated to a composite indicator as the mean of their z-transformed values. Moreover,
all individual indicators are expressed in such a way that higher values imply higher
desirability of CP interventions. Finally, the values of the three composite indicators are
transformed to fall in a range between one and two, where one is the lowest desirability and
while two is the highest desirability of CP interventions (see, e.g., Camagni, 2009 for a
similar approach). The total desirability of CP interventions is calculated as the mean of the
three composite indicators.
The above-mentioned methodology is applied to separately calculate TIMr for each of the
NSRF objectives, and also for all the objectives together. Two approaches are then used to
assess the relationship between CP interventions and balanced territorial development,
hypothesizing that CP interventions contribute to balanced territorial development. Firstly,
regions are divided into quartiles according to the composite indicators for desirability of CP
interventions. The average TIMr values are calculated for each of the quartiles. To meet the
goal of contributing to balanced territorial development, it is assumed that the average TIMr
values of the first and second quartiles are relatively high, while the average TIMr values of
the third and fourth quartiles are relatively low. The significance of mean differences is tested
by the analysis of one-way variance (ANOVA). The same rationale is applied to the second
approach that is based on the correlations between the PIMr,o and Dr,o values. A negative and
significant sign of the correlation coefficients accords with balanced territorial development.

Novosák, J., Hájek, O., Severová, L., Spiesová, D., Novosáková, J.
81
Table 1 Overview of individual indicators
NSRF objective Individual indicator (year) Source
Competitive Czech Economy
The number of patent applications and utility models per 100.000 inhabitants (2002-2007)
IPOCR
The share of researchers and professionals in the economically active population (mean of 2001 and 2011)
CSO
The share of unemployed people in the population aged 15-64 years (2005-2007)
CSO
Tourism potential, log-transformed (2005) CSO
Open, Flexible and Cohesive Society
The share of unemployed people in the population aged 15-64 years (2005-2007)
CSO
The share of people receiving living allowances in the population aged 15-64 years (2007-2008)
GAC
The share of households with internet access in the total number of households (mean of 2001 and 2011)
CSO
Attractive Environment
The emission values of nineteen air pollutants per square kilometre (2007)
CHMI
The ratio between environmentally stable and environmentally unstable land-use categories (2007)
CSO
The share of population with access to sewerage infrastructure (mean of the years 2001 and 2011)
CSO
Composite indicator (2009) showing relative total waste production, household waste production and waste dumping
MoECR
The (external) accessibility of the core regional city (2005) – individual transport
CSO
The (internal) accessibility of the core regional city within the region (2005) – individual transport
CSO
Source: CHMI – Czech Hydrometeorological Institute; CSO – Czech Statistical Office; GAC – the Map of Socially Excluded Communities; IPOCR – Industrial Property Office of the Czech Republic; MoECR – Ministry of Environment of the Czech Republic
RESULTS
Empirical results are first presented using choropleth maps to visualize how TIMr values vary
across regions. In this regard, four maps are displayed in figures 1 to 4. The first three maps
show the TIMr values for the three NSRF objectives separately, while the last figure shows
the aggregate TIMr values. The maps provide initial insights regarding the spatial variation of
TIMr values.

Novosák, J., Hájek, O., Severová, L., Spiesová, D., Novosáková, J.
82
Concerning the objective of a ‘Competitive Czech Economy’ (fig. 1), an uneven spatial
distribution of TIMr values is demonstrated. However, spatial hierarchy appears to play a role
in this distribution, indicating that the main metropolitan areas have higher TIMr values.
Prague is a notable exception to this rule due to its ineligibility to receive funds under the
generous Convergence objective. However, Prague’s low value here is at least partially
compensated by high values for regions in close proximity to Prague. Additionally, there is a
tendency in the eastern regions to have higher TIMr values than those in the western regions.
Figure 1 TIMr for the NSRF objective of a ‘Competitive Czech Economy’
Source: own elaboration based on the data from the CHMI, the CSO, the GAC, the IPOCR, the MILSACR, the MITCR, the MoECR, and the MRDCR
Concerning the objective of an ‘Open, Flexible and Cohesive Society’ (fig. 2), spatial
clusters of regions with high TIMr values are found in north-western Bohemia and north-
eastern Moravia. A number of these areas are referred to as structurally disadvantaged regions
that suffer from economic decline, industrial downsizing and adverse social conditions.
Similarly to fig. 1, it is also noticed that there is a tendency that the eastern regions have
higher TIMr values than western regions, see fig. 2.

Novosák, J., Hájek, O., Severová, L., Spiesová, D., Novosáková, J.
83
Figure 2 TIMr for the NSRF objective of an ‘Open, Flexible and Cohesive Society’
Source: own elaboration based on the data from the CHMI, the CSO, the GAC, the IPOCR, the MILSACR, the MITCR, the MoECR, and the MRDCR
Fig. 3 suggests the highest level of spatial clustering of regions with similar TIMr values
for the objective of an ‘Attractive Environment’, as also indicated by Moran’s I statistic (i.e.,
0.067 for the objective of a ‘Competitive Czech Economy’; 0.071 for the objective of an
‘Open, Flexible and Cohesive Society’; and 0.239 for the objective of an ‘Attractive
Environment’). Three spatial regional clusters with high values may be identified in central
Bohemia, southern Moravia and north-eastern Moravia. In this regard, the line character of
large transport projects is important to explain the spatial concentration of high TIMr values
for the objective of an ‘Attractive Environment’.
Altogether, a mosaic spatial pattern of aggregate TIMr values is formed due to the different
territorial impacts of interventions relating to the three NSRF objectives (see fig. 4). This is
also confirmed by insignificant Moran’s I statistics (0.080) at the 1% level. The question is
thus about what information is contained of the balanced territorial development in TIMr
values. It seems that different types of regions are favored when considering the objective of
a ‘Competitive Czech Economy’ on the one hand and the objective of an ‘Open, Flexible and
Cohesive Society’ on the other hand. Therefore, this particular question is dealt with in the
remaining part of this section.

Novosák, J., Hájek, O., Severová, L., Spiesová, D., Novosáková, J.
84
Figure 3 TIMr for the NSRF objective of an ‘Attractive Environment’
Source: own elaboration based on the data from the CHMI, the CSO, the GAC, the IPOCR, the MILSACR, the MITCR, the MoECR, the MRDCR
Figure 4 TIMr for all the NSRF objectives together
Source: own elaboration based on the data from the CHMI, the CSO, the GAC, the IPOCR, the MILSACR, the MITCR, the MoECR, and the MRDCR
Tab. 2 provides the arithmetic means of TIMr for the regions classified into quartiles
according to the composite indicators for the desirability of CP interventions. In this regard,
the 4th quartile includes the regions where CP interventions are most needed. The opposite is
true for the regions classified into the 1st quartile. The most important findings can be
summarized as follows:

Novosák, J., Hájek, O., Severová, L., Spiesová, D., Novosáková, J.
85
Concerning the objective of a ‘Competitive Czech Economy’, ANOVA indicates the high
arithmetic mean of TIMr for the 1st quartile of regions as the only significant difference
compared to the arithmetic mean of the 2nd quartile of regions. Nonetheless, the mean
differences between the 1st quartile of regions on the one hand, and the 3rd and
4th quartiles of regions on the other hand, are not statistically significant.
Concerning the objective of an ‘Open, Flexible and Cohesive Society’, ANOVA indicates
the high arithmetic mean of TIMr for the 4th quartile of regions as the only significant
difference between the four quartiles of regions. The significance holds for all the pairs of
comparisons that include the 4th quartile of regions.
Concerning the objective of an ‘Attractive Environment’, the significant differences
reported by ANOVA include the following pairs of quartiles: (a) 1 and 4; (b) 2 and 4; and
(c) 1 and 3. Hence, territorial impacts seem to reflect the desirability gradient for the
objective of an ‘Attractive Environment’.
Altogether, a complex picture arises because the CP interventions relating to the three NSRF
objectives work contrary to one another. This can also be seen in the lack of statistical
significance in all the pair-wise comparisons for the three NSRF objectives together (see tab.
2; the last column).
Table 2 The arithmetic means of TIMr
Regions Competitive
Czech Economy
Open, Flexible and Cohesive
Society
Attractive Environment
All objectives together
1st quartile 0.175 0.163 0.193 0.583
2nd quartile 0.135 0.160 0.230 0.537
3rd quartile 0.150 0.168 0.278 0.590
4th quartile 0.146 0.214 0.304 0.579
Source: own elaboration based on the data from the CHMI, the CSO, the GAC, the IPOCR, the MILSACR, the MITCR, the MoECR, and the MRDCR
The correlation coefficients between the PIMr,o and Dr,o values confirm the relevance of
the above-mentioned findings (see tab. 3). Hence, the potential territorial impact of CP
interventions is inversely and significantly associated with the desirability of CP interventions
for the objective of a ‘Competitive Czech Economy’, while directly and significantly
associated with the remaining two NSRF objectives. The significance is lost in aggregate
evaluation.

Novosák, J., Hájek, O., Severová, L., Spiesová, D., Novosáková, J.
86
Table 3 The correlation coefficients between the PIMr,o and Dr,o values
Competitive
Czech Economy
Open, Flexible and Cohesive
Society
Attractive Environment
All objectives together
Correlation coefficients
-0.213** 0.156* 0.240** -0.079
** statistically significant at the 0.01 significance level; * statistically significant at the 0.05 significance level Source: own elaboration based on the data from the CHMI, the CSO, the GAC, the IPOCR, the MILSACR, the MITCR, the MoECR, and the MRDCR
DISCUSSION
The empirical results presented in the preceding section can be embedded in a broader
theoretical context. Firstly, a number of studies have emphasized the influence of spatial
factors on regional inequalities in post-communist countries (see, e.g., Ezcurra, Pascual and
Rapún, 2007; Maier and Franke, 2015; Czyz and Hauke, 2011; Krzysztofik, Tkocz, Spórna ,
& Kantor-Pietraga, 2016; Martinát et al., 2016; Ženka, Novotný, Slach and Květoň, 2015;
Marková and Švihlíková, 2016; Skokanová, Havlíček, Klusáček, & Martinát, 2017; Navratil
et al., 2018). Three factors are usually expected to be significant in this respect: (a) spatial
hierarchy and the advantages of location in the main metropolitan regions; (b) the eastern-
western gradient and the advantages of location close to the borders of western countries; and
(c) the inherited spatial specialization and the structural disadvantages of particularly old
industrial regions. The importance of these factors was also demonstrated in the TIA models
constructed, i.e., the importance of spatial hierarchy for the objective of a ‘Competitive Czech
Economy’, the importance of inherited spatial specialization for the objective of an ‘Open,
Flexible and Cohesive Society’, and the importance of the eastern-western gradient for all the
NSRF objectives. Generally, the influence of the three spatial factors needs to be considered
in planning territorial impacts for CP interventions.
Secondly, the empirical findings are relevant for the debate about the relationship between
two spatial objectives – territorial competitiveness and territorial balanced development (see,
e.g., Vanolo, 2010; Colomb and Santinha, 2014). The constructed TIA models suggest that
CP interventions work in either direction, depending on their thematic orientation (see, e.g.,
Klímová and Žítek, 2015; Hájek and Górska-Szymczak, 2017; Kaufmann and Wagner, 2005;
Severová, Chromý, Sekerka and Soukup, 2012 for relatively low impact innovation-oriented
interventions in lagging regions). Therefore, the combined effects of CP interventions can
undermine their overall contribution to balanced territorial development (see also Novosák,

Novosák, J., Hájek, O., Severová, L., Spiesová, D., Novosáková, J.
87
Hájek, Horváth and Nekolová, 2017 for this conclusion). The weight given to particular types
of CP interventions and their links to the two spatial objectives are crucial for evaluating
which of the objectives prevail.
Thirdly, the TIA models constructed extend the methodology of TIA modelling in some
directions. This is the primary way of treating the potential territorial impact of CP
interventions (PIMr), which are operationalized using ‘hard data’ relating to the spatial
distribution of CP interventions. Moreover, NSRF is taken as the main source for the gauging
general impacts of CP interventions on the three NSRF objectives, and also the weights of
objectives are set in a way that differs from previous studies and it relies more on ‘hard data’.
Generally, the constructed TIA models are less subjective in nature, thereby we can at least
partially remove one of the drawbacks of TIA methodologies (see, e.g., Golobič and Marat,
2011; Medeiros, 2015 for the problem of subjectivity in TIA modelling).
CONCLUSION
The intent of this paper is to add to the current knowledge in the field of TIA modelling by
presenting a case study of cohesion policy in Czechia (2007-2013). The findings point out the
need to address the complex nature of territorial impact of CP interventions. The territorial
impact of CP interventions relating to the NSRF objective of a ‘Competitive Czech Economy’
is greater in the main metropolitan regions, but CP interventions relating to the NSRF
objectives of an ‘Open, Flexible and Cohesive Society’ and of an ‘Attractive Environment’
have greater territorial impacts in regions with higher desirability for interventions.
Consequently, there is a mosaic pattern of overall territorial impacts of CP interventions, with
different conclusions regarding their contributions to balanced territorial development, and the
hypothesis that CP interventions contribute to balanced territorial development cannot be
conclusively accepted.
There are several political implications that can be drawn from this research. Firstly, the
overall assessment of territorial impacts of CP interventions masks the complexities that arise
from their thematic decomposition. Therefore, it is desirable to deal precisely with the
thematic dimension of both CP interventions and TIA modelling. Secondly, it is important to
define the relationship between the two spatial objectives of CP interventions: (a) territorial
competitiveness; and (b) balanced territorial development. A particular question exists about
whether the desirability of CP interventions relating to the competitiveness objective is
greater in the main metropolitan regions or whether it is greater in lagging regions. Thirdly,
Novosák, J., Hájek, O., Severová, L., Spiesová, D., Novosáková, J.
88
implementing the ideas introduced in this paper can bring fruitful results in ‘less subjective’
TIA modelling.
In our opinion, the results of this study can be helpful in order to provide methodological
guidance for practitioners. In particular, the methodology is useful for both ex-ante policy
analyses and ex-post policy analyses of territorial impacts. While the former analyses provide
information about the most suitable course of action, the latter analyses indicate whether the
actual choice was the most suitable. However, there are some limitations of using the
methodology and two of them are worth mentioning. Firstly, the matrix of general impacts of
CP interventions on the NSFR objectives can be improved by calibrating the impacts against
achieved outcome indicator values. Secondly, an outflow of SF to other regions (e.g., through
public procurements) ought to be considered in order to enhance our understanding of the
phenomenon.
Acknowledgements
This research project is supported by Faculty of Economics and Management, Czech University of Life Sciences in Prague, IGA grant number 20171011 "Application of Helpman-Krugman model for international exchange in market with food products". The authors would like to thank Martin Horst Filla for proofreading and editing. Data provision from the Czech Statistical Office (the Zlín Office) is kindly acknowledged.
REFERENCES
Abrahams, G. (2014). What “is” territorial cohesion? What does it “do”? Essentialist versus pragmatic approaches to using concepts. European Planning Studies, 22(10), 2134-2155.
Bentley, G., & Pugalis, L. (2014). Shifting paradigms: people-centred models, active regional development, space-blind policies and place-based approaches. Local Economy, 29(4-5), 283-294.
Camagni, R. (2009). Territorial impact assessment for European regions: a methodological proposal and an application to EU transport policy. Evaluation and Program Planning, 32(4), 342-350.
Camagni, R. (2017). Territorial Impact Assessment (TIA): a methodological proposal. In R. Capello (Ed.), Seminal studies in regional and urban economics (pp. 399-410). Springer: Berlin.
Colomb, C., & Santinha, G. (2014). European Union competition policy and the European territorial cohesion agenda: An impossible reconciliation? State aid rules and public service liberalization through the European spatial planning lens. European Planning Studies, 22(3), 459-480.
Cotella, G., Adams, N., & Nunes, R.J. (2012). Engaging in European spatial planning: A central and Eastern European perspective on the territorial cohesion debate. European Planning Studies, 20(7), 1197-1220.
Czyz, T., & Hauke, J. (2011), Evolution of regional disparities in Poland. Quaestiones Geographicae, 30(2), 35-48.
Davoudi, S. (2005). Understanding territorial cohesion. Planning, Practice & Research, 20(4), 433-441.

Novosák, J., Hájek, O., Severová, L., Spiesová, D., Novosáková, J.
89
De Propris, L. (2007). Reconciling cohesion and competitiveness through EU cluster policies? Policy Studies, 28(4), 327-345.
Elissalde, B., & Santamaria, F. (2014). Territorial cohesion and regional competitiveness: defining key-notions in the EU’s regional policy. Social Sciences, 3(4-1), 4-12.
Ezcurra, R., Pascual, P., & Rapún, M. (2007). The dynamics of regional disparities in Central and Eastern Europe during transition. European Planning Studies, 15(10), 1397-1421.
Faludi, A. (2005). Territorial cohesion: an unidentified political objective. Town Planning Review, 76(1), 1-13.
Fischer, T.B., Sykes, O., Gore, T., Marat, N., Golobič, M., Pinho, P., ...., Perdicoulis, A. (2015). Territorial Impact Assessment of European Draft Directives - the emergence of a new policy assessment instrument. European Planning Studies, 23(3), 433-451.
Golobič, M., & Marat, N. (2011). Territorial impact assessment: integrating territorial aspects in sectoral policies. Evaluation and Program Planning, 34(3), 163-173.
Greiving, S., Fleischhauer, M., Tarvainen, T., Schmidt-Thomé, P., & Jarva, J. (2008). A methodological concept for territorial impact assessment applied to three EU environmental policy elements. Raumforschung und Raumordnung, 66(1), 36-51.
Hájek, O., & Górska-Szymczak, J. (2017). Is there thematic concentration of public finance management in the Czech regions? International Journal of Public Administration, Management and Economic Development, 2(2), 48-56.
Kaufmann, A., & Wagner, P. (2005). EU regional policy and the stimulation of innovation: the role of the European Regional Development Fund in the Objective 1 Region Burgenland. European Planning Studies, 13(4), 581-599.
Klímová, V., & Žítek, V. (2015). Inovační paradox v Česku: Ekonomická teorie a politická realita [Innovation paradox in the Czech Republic: economic theory and political reality]. Politická ekonomie, 63(2), 147-166.
Krzysztofik, R., Tkocz, M., Spórna , T., & Kantor-Pietraga, I. (2016). Some dilemmas of post-industrialism in a region of traditional industry: The case of the Katowice conurbation, Poland. Moravian Geographical Reports, 24(1), 42-54.
Luukkonen, J., & Moilanen, H. (2012). Territoriality in the strategies and practices of the territorial cohesion policy of the European Union: territorial challenges in implementing “soft planning”. European Planning Studies, 20(3), 481-500.
Maier, K., & Franke, D. (2015). Trendy prostorové sociálně-ekonomické polarizace v Česku 2001-2011 [Trends in spatial socio-economic polarisation in the Czech Republic 2001–2011]. Czech Sociological Review, 51(1), 89-123.
Malý, J. & Mulíček, O. (2016). European territorial cohesion policies: Parallels to socialist central planning? Moravian Geographical Reports, 24(1), pp. 14-26.
Marat, N., Kolarič, Š., & Golobič, M. (2013). Slovenia as the natural park of Europe? Territorial Impact Assessment in the case of Natura 2000. Acta Geographica Slovenica, 53(1), 91-116.
Marková, J., & Švihlíková, I. (2017). Komparace vlivu PZI zemí V4 na vnější rovnováhu z pohledu platební balance [Comparison of FDI influence in Visegrad countries on the external balance from the view of the balance of payments]. Scientia et Societas, 13(4), 40-64.
Martinát, S., Dvořák, P., Frantál, B., Klusáček, P., Kunc, J., Navrátil, J., ... & Reed, M. (2016). Sustainable urban development in a city affected by heavy industry and mining? Case study of brownfields in Karvina, Czech Republic. Journal of Cleaner Production, 118, 78-87.
Medeiros, E. (2012). Territorial cohesion: a conceptual analysis. Lisbon: Alameda da Universidade.

Novosák, J., Hájek, O., Severová, L., Spiesová, D., Novosáková, J.
90
Medeiros, E. (2014). Assessing territorial impacts of the EU cohesion policy: the Portuguese case. European Planning Studies, 22(9), 1960-1988.
Medeiros, E. (2015). Territorial Impact Assessment and cross-border cooperation. Regional Studies, Regional Science, 2(1), 97-115.
Medeiros, E. (2017). European Union cohesion policy and Spain: a territorial impact assessment. Regional Studies, 51(8), 1259-1269.
MRD CR (2007). National Strategic Reference Framework of the Czech Republic 2007-2013. Prague: Ministry for Regional Development of the Czech Republic.
Navratil, J., Picha, K., Martinat, S., Nathanail, P. C., Tureckova, K., Holesinska, A. (2018). Resident’s preferences for urban brownfield revitalization: Insights from two Czech cities. Land Use Policy, 76, 224-234.
Nosek, Š. (2017). Territorial cohesion storylines in 2014–2020 Cohesion Policy. European Planning Studies, 25(12), 2157-2174.
Novosák, J., Hájek, O., Horváth, P., & Nekolová, J. (2017). Structural funding and intrastate regional disparities in post-communist countries. Transylvanian Review of Administrative Sciences, 13(51), 53-69.
Servillo, L. (2010). Territorial cohesion discourses: hegemonic strategic concepts in European spatial planning. Planning Theory & Practice, 11(3), 397-416.
Severová, L., Chromý, J., Sekerka, B., & Soukup, A. (2012). Microeconomic aspects of government subsidies in the agricultural market. Agricultural Economics 58(11), 542-548.
Skokanová, H., Havlíček, M., Klusáček, P., & Martinát, S. (2017). Five military training areas – five different trajectories of land cover development? Case studies from the Czech Republic. Geographia Cassoviensis, 11(2), 201-213.
Vanolo, A. (2010). European spatial planning between competitiveness and territorial cohesion: Shadows of neo-liberalism. European Planning Studies, 18(8), 1301-1315.
Veneri, P., & Burgalassi, D. (2012). Questioning polycentric development and its effects. Issues of definition and measurement for the Italian NUTS-2 regions. European Planning Studies, 20(6), 1017-1037.
Zaucha, J., Komornicki, T., Böhme, K., Świątek, D., & Żuber, P. (2014). Territorial keys for bringing closer the territorial agenda of the EU and Europe 2020. European Planning Studies, 22(2), 246-267.
Ženka, J., Novotný, J., Slach, O., & Květoň, V. (2015). Industrial specialization and economic performance: A case of Czech microregions. Norsk Geografisk Tidsskrift - Norwegian Journal of Geography, 69(2), 67-79.

DETUROPE – THE CENTRAL EUROPEAN JOURNAL OF REGIONAL DEVELOPMENT AND TOURISM
Vol. 10 Issue 2 2018 ISSN 1821-2506
91
Original scientific paper
ASSESSMENT OF THE INTERRELATIONS BETWEEN HEALTH AND
HOUSING CONDITIONS IN A HUNGARIAN ROMA SETTLEMENT
Csaba BÁLINTa
aSzent István University, Institute of Regional Economics and Rural Development; Address: HU-2103 Gödöllő, Páter Károly u. 1. Phone: +36308612334; E-mail: [email protected] Cite this article: Bálint, C. (2018). Assessment of the Interrelations Between Health and Housing Conditions in a Hungarian Roma Settlement. Deturope, 10(2), 91-111.
Abstract
Health is our most important value and resource – its preservation and development are crucial in terms of our quality of life and work. Health status is mainly influenced by lifestyle, health consciousness and the healthcare system, the accessibility and quality of health-related services. Rich literature discusses the relationship between housing conditions and health status as well. The disadvantaged socio-economic situation causes deteriorated living environments and, hence, the decline in health. Through the case of the Hungarian village of Bag and the Roma settlement located there, I would like to highlight the connection between housing conditions and health. Keywords: housing, health, Roma settlement, Hungary, Bag
INTRODUCTION
The concept of health was defined in 1946 at the establishment of the World Health
Organization in Geneva as follows: „Health is a state of complete physical, mental and social
well-being and not merely the absence of disease or infirmity.” (WHO, 1946) The document
of the organization of 1979 entitled ‘Global strategy for health for all by the year 2000’
distinguishes the following dimensions of health (WHO, 1981): physical health, the proper
functioning of the body; psychic health, personal world view, basic behavioural principles,
peace of mind; mental health, the ability of thinking clearly and consistently; emotional
health, the ability to recognize and express properly emotions; social health, the ability of
building relationships with others.
The above mentioned philosophical approach was followed by more pragmatic definitions.
According to Mihályi (2003) “health is the correspondence between the individual’s actual
biological functioning and the biological function available by age and sex and/or required by
the society. Health assessment is based on the functionality (abilities and limitations), the
existence and nature of pain, and the mental acceptance of all these factors by the individual.

Bálint, C.
92
Relations between health and housing conditions
Since the beginning of mankind, dwelling has played a role in the protection against natural
forces, in relaxation and regeneration of human workforce, it must provide adequate
conditions for washing, household work, studying, family and social life, and recreation.
Dwelling, home, the immediate environment and the community together form the housing
conditions. If functional and satisfactory physical, social and mental conditions are provided
in terms of health, safety, hygiene, comfort and privacy, we can talk about healthy living
conditions. (Rudnai et al., 2007)
According to the UN document of 1996 The Habitat Agenda: Chapter IV. B. “Adequate
shelter means more than a roof over one's head. It also means adequate privacy; adequate
space; physical accessibility; adequate security; security of tenure; structural stability and
durability; adequate lighting, heating and ventilation; adequate basic infrastructure, such as
water-supply, sanitation and waste-management facilities; suitable environmental quality and
health-related factors; and adequate and accessible location with regard to work and basic
facilities: all of which should be available at an affordable cost.” (UN-HABITAT, 1996)
Shaw (2004) differentiates the hard (building and physical infrastructure) and soft (e.g.
social and perception dimensions of housing) factors in the model describing the interrelation
between housing and health. Inadequate housing conditions can have a direct and indirect
impact on physical and mental health. (Wilson et al. 1998; Sharfstein, Sandel, Kahn, &
Bauchner, 2001; Thomson, Petticrew, & Morrison, 2001) Risks of infections, chronic
illnesses, injuries, poor nutrition, risk of mental problems are higher. (Krieger-Higgins, 2002)
They increase the danger of asthma, obesity, cardiovascular diseases (Pope, Burnett, & Thun,
2002) and the risk of anxiety, depression, attention disorder, drug use and aggressive
behaviour (Raffestin & Lawrence, 1990, Fullilove & Fullilove, 2000).
Overview of EU policies targeting Roma, with special focus on health and housing
As it is stated in the 2010 communication of the European Commission, “(...) a significant
part of the 10-12 million Roma in Europe live in extreme marginalisation in both rural and
urban areas and in very poor socio-economic conditions. The discrimination, social exclusion
and segregation which Roma face are mutually reinforcing. They face limited access to high
quality education, difficulties in integration into the labour market, correspondingly low
income levels, and poor health which in turn results in higher mortality rates and lower life
expectancy compared with non-Roma. Roma exclusion entails not only significant human
suffering but also significant direct costs for public budgets as well as indirect costs through
Bálint, C.
93
losses in productivity.” (EC, 2010 p. 2) Approximately, 6 million Roma people live in Central
and Eastern European countries, of which the most exposed to the challenges of the above
listed problems are: Bulgaria, Czechia, Hungary, Romania and Slovakia; these member states
received country-specific recommendations for the national inclusion reforms as part of the
European framework of national Roma integration strategies (EC, 2017).
Since 2011, the EU framework has been targeting the access of Roma to education,
employment, healthcare and housing, and the fight against discrimination in these areas.
Related to the issues discussed in this article, the 2017 ‘Midterm review of the EU framework
for national Roma integration strategies’ evaluated the achievements in the above mentioned
substantive policy areas. Related to the issues discussed in this paper, in terms of health,
provision and use of health coverage and health services, the mental and different problems,
teenage pregnancies and the lack of Roma health professionals remained challenges without
significant improvement in the countries most concerned, while the health awareness,
prevention, health literacy, health mediation, civil participation and cross-sectoral cooperation
were the areas that can be characterized by positive changes. In the field of housing, progress
has been reported regarding the housing programmes, surveillance of housing situation and
new action plans and strategies on housing, but, the limited availability and low quality of
social housing, discrimination in the housing market, as well as segregation and ghettoization
have been mentioned as deficiencies (EC, 2017)
Situation of Roma population in Hungary
Hungary is one of the countries most concerned by the poverty and exclusion of Roma
people. The investigation on the changes of the spatial distribution of the Hungarian
population by Pénzes, Tátrai, and Pásztor (2017) has been based on the population census
datasets of 1990 and 2011 that relies on self-declaration, and other two surveys (the CIKOBI
survey from 1984-87 and the survey of the University of Debrecen from 2010-13), the latter
representing external ethnic assessment. In the latest (2011) census 316,000 persons declared
themselves as Roma and according to the recent survey approximately 876,000 Roma people
lived in Hungary in 2010-2013, which is a growth of 174% compared to the estimated Roma
population of 320,000 in 1971. According to the different estimations, there are the most
Roma inhabitants in Northern Hungary and Northern Great Plain (24-30 and 24-26 per cent of
the total Roma population), the least in Central Transdanubia (5-6%) (Pénzes, Tátrai, &
Pásztor, 2017).

Bálint, C.
94
Based on the different databases, the proportion of Roma population living in villages is
around 38-50%, especially in the settlements with less population than 2,000 people. This
concentration in small rural settlements is linked to territorial disadvantages (Nemes-Nagy-
Németh, 2005), although this sort of Roma population is dynamically decreasing (Pénzes
Pásztor, & Tátrai 2015), while a slight growth of Roma population is observable in the
villages of the agglomeration of Budapest and the suburban areas of the county centres
(Bajmócy, 2014). The increasing Roma population in the capital and the cities with county
rights can be attributed to the intensifying internal migration (Szilágyi & Pénzes, 2016).
According to the 2011 population census data, 33% of the Roma population is 14 or
younger, the proportion of 15-49 years old Roma people is 43%, while 20% of them is
between 40-59%. The old age group (60 years or older) is under represented with a share of
only 4.6%, which is only one-fifth of the total population’s value (24%) for the same age
group. Overall, more than three-fourth of the Roma population is younger than 40 years of
age (at the same time, in case of the entire population this is only 49%. 58 per cent of the
Roma people above 15 years has the educational attainment level of primary school (8 grades)
only, 23% of them did not finished 8 grades, so 79% of the Roma population has no more
than primary education, while only 13% has secondary education without graduation, and
only 5% graduated in high school. The presence of university diploma is marginal, only 1% of
the Roma population has degree. Overall educational situation of the Roma women is worse
than men’s (Bernát, 2014 based on HCSO, 2011).
In 2013, 27% of the active Roma population was employed (which is very low compared
to 60% share of the non-Roma population), and, 25% of them were long-term unemployed,
that is five times bigger share than the proportion of 5% in case of non-Roma active people.
Among Roma women aged 15-64, the unemployment rate was 61% in 2011, 17 percentage
points higher than men’s value (44%) (Ivanov & Kagin, 2014).
It can be considered as a general rule that the worse is the situation of a social strata, the
more Roma are among them. More than 50 percent of the households in the lowest income
decile are Roma, but deep poverty does not only affect Roma population. In Hungary, more
than one million households are considered cumulatively poor. Every fourth household cannot
satisfy either its most basic needs on a regular basis (Messing & Molnár, 2010).
There are roughly a hundred settlements in the country that have become a permanently
poor Roma ghetto, and another two hundred which is currently in an inexorable way toward
that state (Havas, 2008). The inhabitants of the settlements are mostly but not exclusively
Roma. There are more than 1600 slums in more than 800 settlements, of which 60% are

Bálint, C.
95
located in villages. It is estimated that 16 of one hundred Roma live in Roma settlements
where not only the gas supply or bathroom is missing, but often drainage, water and
electricity, and which are impossible to approach by the ambulance, and danger of epidemics
is constant (Cserti Csapó & Orsós, 2015).
Based on the 2013 household-level large sample survey of the National Institute for
Family, Youth and Population Policy, it can be seen that, compared to the 2003 Roma survey,
generally the Roma people live in bigger dwellings and with smaller number of dwellers,
which increased the average space per one person. The larger the proportion of Roma in the
population of a settlement is, the larger the homes of the local Roma households are. Comfort
level of the Roma flats and houses also increased, especially the share of dwellings with flush
toilet. The reason of the improvement of living conditions is that dwellings which remain
vacant after the aging and dying residents, provide an attractive moving alternative for Roma
families. In the neighbourhoods where Roma families appear, the real estate prices fall, and
the cheap dwellings continue to be inhabited by other Roma families.
Although the housing conditions of the Roma population have improved remarkably in the
last decade, the indicators lag behind in both quantitative and qualitative terms compared to
the Hungarian national average (NCSSZI, 2013).
Effects of disadvantaged situation on health status in relation to the Roma population
Disadvantage can be characterized by the separate or combined existence of unfavourable
economic factors. Usually it involves low income (partly or wholly consisting of social
benefits) as well as poor housing conditions, small dwellings with a lot of residents, low per
person area, unhealthy housing conditions (wet, slate walls, basement apartments, emergency
housing, patio) poor amenities (lack of bathroom, kitchen, toilet, household utensils)
(Andorka, 2003). The environment, the social situation, the lifestyle affects the quality of life
through the health status. More frequent illnesses, disability represent a burden for the
healthcare systems, and premature deaths are typical (Forrai, 2008).
The Roma population is the social group of Hungary living in the worst socio-economic
and health circumstances. Among them the average age is lower, illness is more common,
mortality is more premature than in majority society. (Merker, 2012) Life expectancy at birth
can be 10 years below the population’s average. (Prónai, 2000; Hüse & Pénzes, 2015)
Housing and living conditions are mostly unfavourable: often lacking adequate sanitation,
running water, electricity, and waste disposal. In Roma settlements there is a higher risk of
spreading infectious diseases, such as tuberculosis, hepatitis A virus, scabbiness, pediculosis

Bálint, C.
96
and other skin diseases. Many Roma people live in one-roomed flats, although they are
equipped with electricity, they frequently lack water pipe and flush toilet. In most parts of the
settlements there is no drainage, freshwater supply and refuse collection. They often use
public spaces instead of running water for washing and cleaning. Outhouses used instead of
toilet can easily become the source of infections and epidemics, to which especially children
are exposed. (Csépe, 2010)
The low educational attainment level among the Roma population is associated with low
employment and income levels, which has a bad impact on health status and health behaviour
(Kemény & Janky, 2003). Most often, they turn to a doctor rarely and late (Gyukits, 2000):
64.2% of the Roma population rarely or never go to a general practitioner, 63% rarely or
never visit outpatient clinics, and inpatient care is never visited by 39.3% of them. Only one-
sixth of them participates in dental screening and only one third is involved in cervical and
lung screening. Among Roma people, there is a high incidence of depression, cardiovascular
disease, diabetes and cancer mortality, and all of their risk factors are higher. More than three
quarters of the Roma population are smokers, more than one third of them are overweight
(Köbli, 2011). The prejudicial, discriminatory attitude they frequently experience on behalf of
healthcare workers, does not help their situation either (Puporka & Zádori, 1999).
According to Belak, Geckova, van Dijk, J. P. & and Reijneveld (2017), regarding Roma
people, the higher alcohol consumption, the greater promiscuity, the more adverse peer
pressure and the dysfunctional social support belong to the category of myths about which
there are no evidence obtained.
Experiences of national and local housing programs
Molnár, Ádány, Ádám, Gulis, and Kósa (2010) found that the health consequences of
international and local-level housing initiatives in most cases fail to be assessed prospectively
or evaluated after implementation. This is the reason they carried out a retrospective health
impact assessment (HIA) of a Roma housing project in a Hungarian settlement called
Hencida, in comparison with the outcome evaluation of the same project. In the framework of
the project, 12 Roma families moved to new dwellings, and 46 houses were renovated from
the outside, along with the restoration of the built and natural environment of the settlement.
As a result of the research based on interviews with project-stakeholders, positive impacts on
education, in- and outdoor conditions were noted, but negative impacts on social networks,
housing expenses and maintenance, neighbourhood satisfaction and no sustained change in
health status or employment were identified. As a basis of regional or national level housing
programmes, the authors recommended small scale pilot projects with the careful selection

Bálint, C.
97
and continuous involvement of the beneficiaries, kept under control by group of professionals.
The projects’ impact on health prevails through the socio-economic determinants of health,
and not directly by the housing improvements.
Regarding the interrelations of health and housing conditions in countries most concerned
by the Roma problem, Molnár et al. (2012) analysed the national policy programmes of
Bulgaria, Hungary, Lithuania and Slovakia, by the method of health impact assessment.
Generally, it can be stated that the market-based housing is hardly accessible for Roma people
due to lack of financial resources, and so is social housing with adequate living conditions.
According to their findings, the ‘top-down’ approach of the central governments, the missing
knowledge of local conditions and decisions subordinate to politics worsen the
implementation of nationwide programmes. Instead of this, the principle of subsidiarity is
recommended to be applied for Roma housing projects, the closest to the localities and the
direct stakeholders, and HIA should be carried out for particular actions than strategic
policies, prospectively and retrospectively too.
OBJECTIVES AND METHODS
“For research into the social root causes behind any particular health-inequality, qualitative
case-studies focusing on the worse-off population’s health-endangering everyday settings and
practices represent a good starting point.” (Belak et al., 2017. p. 2)
Through the case of the Hungarian village of Bag and the Roma settlement located there, I
would like to highlight the connection between housing conditions and health. After
reviewing literature about the interrelations of Roma population’s situation in Europe and
Hungary, the disadvantaged social status, and the housing conditions and health, I will carry
out a demographic and socio-economic analysis on the village of Bag, followed by the
examination of data on local housing conditions. Focusing on the Roma settlement of the
village, I will recall findings of former field researches, characterizing the infrastructural and
social environment which can be found there.
The field research that provided the empirical results of the study, was conducted in June
2017, in the framework of the so-called Village Seminar of Szent István University, which is
one week stay at the researched location. Several topics are deeply investigated by the
participants, e.g. history, demography, spatial relations, physical infrastructure, local
governance, community life, civil activity, health, social care etc. Main methodologies of the
field research are questionnaire surveys, interviews, observations and document analyses, in
addition to the literature review and the collection, systematization and analysis of secondary

Bálint, C.
98
statistical data. The Village Seminar program aims to carry out a monitoring research for the
systematic, recurring examination of villages that make a rural phenomenon (Molnár, 2009).
Bag was visited for the first time in 2009: in choosing this settlement as a sample, it was
important to examine that, in a former agricultural, railway and industrial village near the
agglomeration of Budapest, showing quite early citizenry, how the community experienced
changes. Among others, the 2009 field research had a romological direction to explore the
Roma living in the settlement and the certain aspects of coexistence with the majority society.
The 2017 research aimed to examine the several open-ended questions regarding Roma-
Hungarian coexistence, reflecting on the changes compared to 2009.
Regarding the Roma settlement’s issues in Bag, I will review the findings of the authors
participating in the 11th village seminar, acquired in the framework of questionnaire surveys
and interviews made in summer of 2017.
I will introduce the results of my own interviews with the actors of the local healthcare
system, i.e. the general practitioner, the dentist and the district nurse, with the aim of giving a
detailed presentation of the effects of living conditions on the health status of the residents of
the Roma settlement. The interviews were done personally in June 2017, at the workplace of
the respondents, in 45-60 minutes conversations. Results of the questionnaire survey,
involving 157 Bag households, based on proportional sampling, were not used in this study,
because most of the answers from the Roma settlement can not be interpreted due to the lack
of clear understanding by the respondents.
RESULTS
Geographical location, demographic situation of Bag
The village of Bag is located in Central Hungary NUTS 2 region, in Pest (NUTS 3) county, in
Aszód (LAU 1) district, 40 km from Budapest. By public road it can be approached from the
M3 highway or from the main road no. 3, or by bus and by train. The image of the village was
transformed by the large regional investments of the past (railroad, main road Nr. 3, M3
highway), but a significant part of the settlement was able to preserve its characteristic image.
Although the village can not be classified as a settlement in the agglomeration of the capital,
its transport connections make it possible to profit from the proximity of Budapest and the
city of Gödöllő (Nagy, 2017).
Bag’s territory is 23.55 km2 and the population on 1 January 2017 was 3669. The
population dropped by 9.65% between 2010 and 2014 (of which 5.44% happened from 2010
to 2011), followed by 2.37% increase between 2014 and 2016. Since 2007, the migration
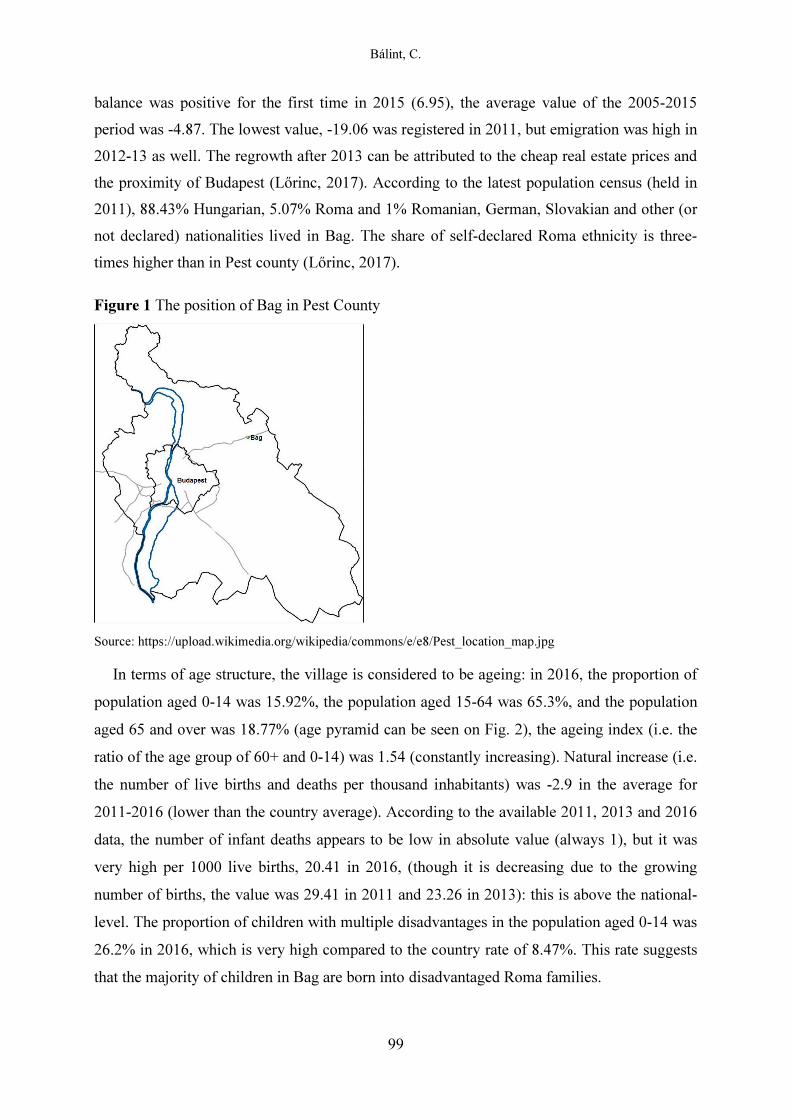
Bálint, C.
99
balance was positive for the first time in 2015 (6.95), the average value of the 2005-2015
period was -4.87. The lowest value, -19.06 was registered in 2011, but emigration was high in
2012-13 as well. The regrowth after 2013 can be attributed to the cheap real estate prices and
the proximity of Budapest (Lőrinc, 2017). According to the latest population census (held in
2011), 88.43% Hungarian, 5.07% Roma and 1% Romanian, German, Slovakian and other (or
not declared) nationalities lived in Bag. The share of self-declared Roma ethnicity is three-
times higher than in Pest county (Lőrinc, 2017).
Figure 1 The position of Bag in Pest County
Source: https://upload.wikimedia.org/wikipedia/commons/e/e8/Pest_location_map.jpg
In terms of age structure, the village is considered to be ageing: in 2016, the proportion of
population aged 0-14 was 15.92%, the population aged 15-64 was 65.3%, and the population
aged 65 and over was 18.77% (age pyramid can be seen on Fig. 2), the ageing index (i.e. the
ratio of the age group of 60+ and 0-14) was 1.54 (constantly increasing). Natural increase (i.e.
the number of live births and deaths per thousand inhabitants) was -2.9 in the average for
2011-2016 (lower than the country average). According to the available 2011, 2013 and 2016
data, the number of infant deaths appears to be low in absolute value (always 1), but it was
very high per 1000 live births, 20.41 in 2016, (though it is decreasing due to the growing
number of births, the value was 29.41 in 2011 and 23.26 in 2013): this is above the national-
level. The proportion of children with multiple disadvantages in the population aged 0-14 was
26.2% in 2016, which is very high compared to the country rate of 8.47%. This rate suggests
that the majority of children in Bag are born into disadvantaged Roma families.
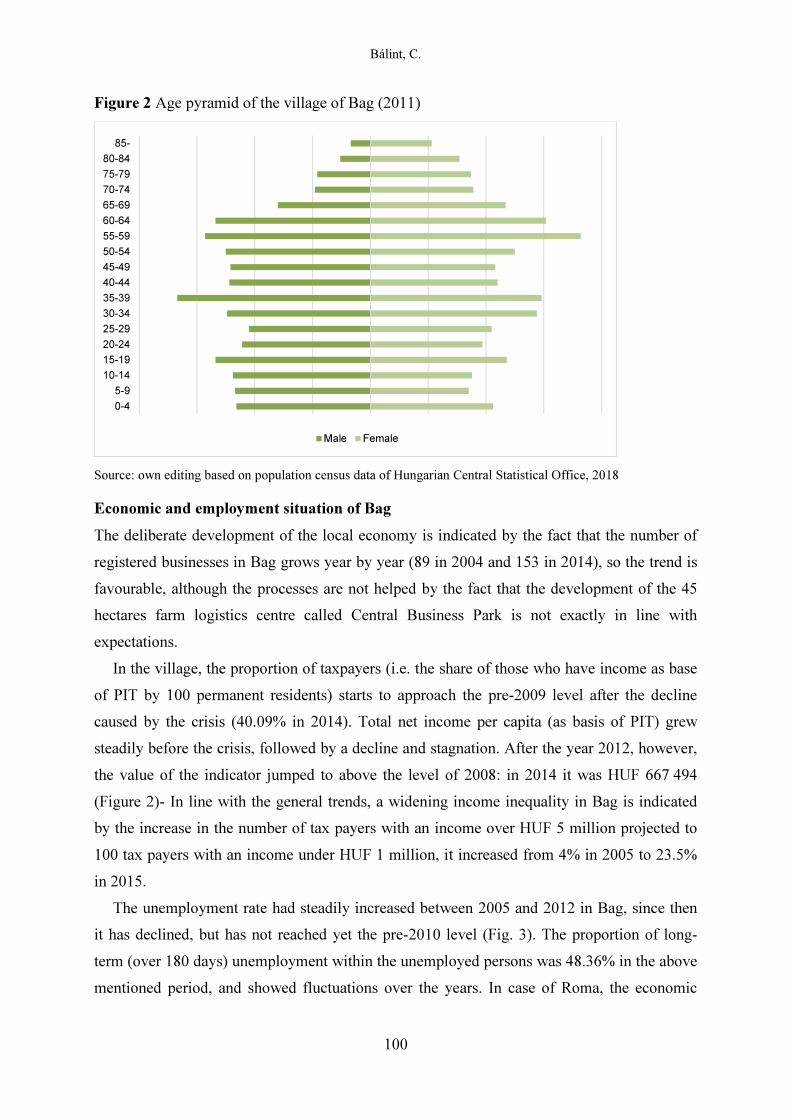
Bálint, C.
100
Figure 2 Age pyramid of the village of Bag (2011)
Source: own editing based on population census data of Hungarian Central Statistical Office, 2018
Economic and employment situation of Bag
The deliberate development of the local economy is indicated by the fact that the number of
registered businesses in Bag grows year by year (89 in 2004 and 153 in 2014), so the trend is
favourable, although the processes are not helped by the fact that the development of the 45
hectares farm logistics centre called Central Business Park is not exactly in line with
expectations.
In the village, the proportion of taxpayers (i.e. the share of those who have income as base
of PIT by 100 permanent residents) starts to approach the pre-2009 level after the decline
caused by the crisis (40.09% in 2014). Total net income per capita (as basis of PIT) grew
steadily before the crisis, followed by a decline and stagnation. After the year 2012, however,
the value of the indicator jumped to above the level of 2008: in 2014 it was HUF 667 494
(Figure 2)- In line with the general trends, a widening income inequality in Bag is indicated
by the increase in the number of tax payers with an income over HUF 5 million projected to
100 tax payers with an income under HUF 1 million, it increased from 4% in 2005 to 23.5%
in 2015.
The unemployment rate had steadily increased between 2005 and 2012 in Bag, since then
it has declined, but has not reached yet the pre-2010 level (Fig. 3). The proportion of long-
term (over 180 days) unemployment within the unemployed persons was 48.36% in the above
mentioned period, and showed fluctuations over the years. In case of Roma, the economic
85-
80-84
75-79
70-74
65-69
60-64
55-59
50-54
45-49
40-44
35-39
30-34
25-29
20-24
15-19
10-14
5-9
0-4
Male Female

Bálint, C.
101
inactivity and unemployment is strongly linked to the low educational attainment level
(Lőrinc, 2017).
Figure 3 Unemployment rate (%), 2005-2015
Source: own editing based on Hungarian Central Statistical Office, 2018
In the light of recent population census data, most of the employees were employed in
industry and construction (28.93%), 24.98% as other intellectual professions, 16.73% in
commerce and service, 16.44% as executives or intellectuals, and only 2.85% in agriculture
and forestry (10.08% in some other jobs). The employment structure therefore corresponds to
trends observed at higher territorial levels. Due to the characteristics of the village and the
proximity of Budapest and its agglomeration, the proportion of persons employed in other
settlements is 73.41% (according to the 2011 census data), so most of the employees
commute from Bag.
According to 2011 census data, for 100 employed males there were 59.3 inactive men,
while for women the same indicator’s value was 129.19. Among the inactive earners, the
proportion of pensioners and annuities is 90.68% for men and 80.86% for women. Of the 15-
59-year-old population, there were 24.2 dependent men and 21.06 dependent women for 100
persons. 61.73% of dependent men, 56.64% of dependent women study in full-time
education, in which case the social benefit of the dependency status prevails through the
increase of qualifications.
Housing conditions in Bag
In the village of Bag, the dwelling stock grew steadily until 2012, since it has been near
stagnation (1340 flats). In terms of dwelling stock per 1000 inhabitants, the highest value was
registered in 2014 with 373.61 dwellings. At the time of the 2011 census, 94.73% of the
0
1
2
3
4
5
6
7
8
9
10
2005 2006 2007 2008 2009 2010 2011 2012 2013 2014 2015
Bag Aszód District Pest County Hungary

Bálint, C.
102
dwellings were occupied and 99.25% of the dwellings were owned by private individuals.
More than a quarter of the dwellings were built before 1960, almost a quarter (24.7%)
between 1961-1970, 21.57% between 1971-1980, and 13.66% between 1981-1990. Only
14.25% of the current dwelling stock was built after the change of regime.
The construction of the public water conduit network in Bag started in 1974 (Fercsik,
2002), and the proportion of dwellings connected to it has been around 96% for a long time
(which is higher than the national average). The construction of the gas pipeline was
completed by 1995 (Fercsik, 2002), today more than 80% of household heats with gas. 64.4%
of the dwellings in Bag had central heating at the time of the 2011 census. In 2001, Bag with
four other settlements started to develop a sewage collection network (Fercsik, 2002). In
2004, 74% of households had sewage conduit, today 89% of households have sewerage
settled. In 2011, the proportion of homes with flush toilet was 94.21%.
The collection of communal waste is organized in Bag since 1975 (Fercsik, 2002), the
latest data on the ratio of dwellings involved in regular waste collection is available from
2012: 86.4%. Although the reliability of the data is questionable, the information extracted
from the data shows that the issue of selective waste collection is somewhat neglected in Bag:
in 2012, for 1000 dwellings involved in regular waste collection, 15.48 tons of selective waste
were disposed, while at country level this quantity was 26.43 tons. Taking into account that in
the average of the 2006-2016 period the amount of household waste collected per inhabitant
(67.25 t) in Bag was not much higher than the national value, the ‘poor’ situation of selective
waste management in the settlement cannot be explained by the fact that less waste was
produced.
Based on the classification of Act. LXXVIII of 1993 on Certain Rules of the Lease and
Alienation of Residential and Non- Residential Premises (”Housing Act”), according to the
latest census data, in Bag 63.61% of the dwellings have all amenities, 28.95% have principal
amenities, 2.56% have part of amenities, 4.51% are without comforts, 0.38% are emergency
dwellings. Regarding the proportion of dwellings with all amenities, the settlement exceeds
the 59.38% national level. The situation is similar in the case of dwellings without comforts:
the 4.51% value of Bag is more favourable than the national level data (5.76%).
In addition to the level of comfort, quality of life is influenced by the size of the dwelling
as well. According to the census data, Bag is also in a very favourable situation concerning
the distribution of the dwellings according to the number of rooms and the floor area. The
proportion of one-room dwellings in the settlement was only 2.18% in 2011 (10.39% at
country level), and 78.5% of the dwelling stock had 3 or more rooms in the year of the census
(compared to the country level data of 51.45%). The proportion of dwellings over 80 square

Bálint, C.
103
meters is higher in Bag, while in the lower size categories the proportions are lower in the
village (and decrease by lowering categories) in comparison with the national averages.
‘Telep’ – The Roma settlement in Bag
The Gypsy settlement is a famous, rather notorious part of the village of Bag. Some „oláh”
and „musician” Gypsy families lived in the center of the village already around 1920, their
memory is preserved by the place called „Cigánygödör” (Gypsy Pit). In 1959-60, the
Municipal Council relocated the Gypsy families living there to the edge of the village (to the
streets named Ősz and Tél utca). From the 1960s onwards, Gypsies were resettled to Bag
from all over the country, including the neighbouring Hévízgyörk, following the slum
elimination decree issued by the Hungarian Socialist Workers’ Party (MSZMP) in 1961, but
many of the Gypsies moved voluntarily. The border of the settlement was shrinking more and
more in the direction of Nyár, Dankó, Liget and Szentlászlói streets. The elimination of the
Roma settlement was not successful in Bag, and houses built with the help of „szocpol”
(housing support for families with children) modernized the Roma settlement’s environment,
contrasting with the run-down adobe huts.
By definition, the so-called ‘Telep’, Roma settlement, is a separate place composed of at
least four settlement parts that do not meet social requirements. It is characteristic that
regarding its technical state and physical appearance, it lags behind the norms prevailing in
the community (in our case, among the Hungarians) (Berey, 1991). Because of the
segregation of the Roma groups living there, the settlement is divided into the lower part, the
(less developed) upper part and the separate Tavasz street. In the less developed upper parts
(Ősz, Tél, Dankó streets) smaller adobe houses, missing public utilities and the lack of
gardens can be observed (Morvay, 2009).
In her questionnaire survey, aiming Bag’s so-called street image analysis, Tóth (2017)
concluded from the 135 evaluable answers that the quality of the public road is the worst in
the streets of the ‘Telep’. Not only the residents of the Roma settlement mentioned the bad
road quality here, but the major of Bag also: long time age there has been a plan for
reconstruction, but all the tender applications were refused because of the lack of funds, and
the municipality can not afford it on its own. The only public drinking fountains remained in
the Roma settlement, but the question arises: who should be charged and how for the use of
water? The Roma residents need the freshwater, taking into account that in most of their
dwellings there are no any water source, and it is mandatory task for the local government to
provide drinking water. In addition to the bad condition and low value of the real estates in
the Roma settlement, the houses in the neighbouring streets are getting devalued on the

Bálint, C.
104
market, which can be considered as the main reason of the disadvantageous ‘population
change’ and the expansion of the ‘Telep’ (Tóth, 2017).
The Roma settlement creates an environment for the children in which the disadvantage is
encoded: their inclusion is a serious challenge for the local kindergarten and school, and it
requires a high-level knowledge and professional skills from the educators. In the elementary
school of Bag, half of the students are disadvantaged. The effects of substance use in the
Roma settlement appear in the changed behaviour of the Roma students as well (Bogárdi,
2017).
Molnár (2009) investigated in the framework of a questionnaire survey asking 101
households, aiming mental mapping, in which parts of the village they would like to live and
where not. (Fig. 7) On the map, the most negatively perceived zone was overwhelmingly
overlapping with the Roma settlement consisting of the streets of Tél, Tavasz, Nyár, Ősz and
Dankó, and the other streets in direct contact with these. The reasons for the unfavourable
judgment of the area were partially the environmental and infrastructural conditions of the site
(waste on the streets and in the houses, unsolved rainwater drainage, unpaved roads, etc.), and
partly the conflicts with the Roma minority.
Most of the people living outside of the Roma settlement did not rely on their experiences,
they were not able to differentiate between the streets within that neighbourhood, their
opinion reflected the conflicts that complicated coexistence. Almost all of the people of the
Roma settlement expressed a negative opinion of the streets inside the settlement falling
outside of their place of residence. The community of the Roma settlement is not unified and
does not see itself as being such (Molnár, 2009).
In the recent mental mapping of Molnár (2017), significant changes can be seen compared
to 2009. Based on the 157 household-level questionnaires, Liget utca and Szentlászlói utca
from the former neighbouring streets have become part of the Roma settlement: the ethnical
transition has been completely implemented, and mostly associated with negative perceptions
by the respondents. In Nagymező utca, where in 2009 the minor negative judgment originated
from the ‘unfixed’ conflicting social interactions, now there is a ‘fixed’ physical coexistence
emerging: approximately every second household is of Roma ethnicity. The reasons of
negative opinion about the Roma settlement were e.g. deprivation, crime, untreated heaps of
garbage, lack of proper sanitation, bad quality roads etc. A lot of respondents outside the
Roma settlement have never been in this part of Bag, or had been a long time ago, and they
did not distinguish between the different streets of the ‘Telep’. For the residents of the Roma
settlement, the ‘Telep’ is not a homogeneous area: in their evaluation, Tél and Dankó utca,

Bálint, C.
105
with the messy, ramshackle houses far from the public drinking fountain are representing the
parts where they do not want to live (Molnár, 2017). (Fig. 4)
Figure 4 Mental map of Bag
Source: Molnár M. (2017)
DISCUSSION
Assessment of Roma health in Bag by local healthcare staff
In my own field research (carried out in June of 2017) I strongly relied on the interviews
made with the actors of Bag’s local healthcare system. There are two general practitioners in
the village of Bag. The doctor of district 1 is Dr. Gyöngyi Balatoni, Dr. Ibolya Cséke is
responsible for district 2. The joint building of district 1 is shared by Dr. Melánia Szabó’s
dentist's office, where she operates school dentistry as well. Night and weekend attendance
(where Dr. Gyöngyi Balatoni takes also charge) is available in the town of Tura. The nearest
specialized health care institution is the outpatient polyclinic in Aszód town. In Bag, the

Bálint, C.
106
district nurse care is divided into two districts: in district 1 Andrásné Czerok, in district 2,
Erzsébet Szemán serve as district nurse. Their office is in the vicinity of the general
practitioner’s surgery of district 2. The pharmacy is operated by dr. István Télessy.
Based on the data of the Hungarian Central Statistical Office, after the turn of the
millennium, the number of cases in the general practitioner’s surgery has increased steadily
until 2012 and then returned to the 2010 level by 2015. The number of cases treated outside
the surgery in the dwellings started in 2011 to deviate from a nearly stagnating state towards a
slightly declining trend. Although, according to the HCSO, the population of the village
declined by 9.81% from 2008, the drop in GP visits awaited until 2011, when, compared to
the previous year, natural increase decreased by 2.6, and the migration balance got lower by
6.3, with a continuing tendency.
During the interview, the general practitioner of district 1 acknowledged that in Bag the
Roma population is characterized by a youthful age structure, while the Hungarian population
is ageing: the young families leave the village and children are taken out of the local school.
According to the Doctor, the Roma population has only the sense of illness, health
consciousness is solely characteristic for the people living outside the Roma settlement.
According to the district nurse of district 2, the majority of Bag’s pregnant women are of
Roma origin. Since they give birth early (from the age of 16) and it is not uncommon that they
have three children at the age of 26, they become sort of “worn out” relatively young. Despite
the existing differences, bad health and prolonged chronic illness are not specific neither
among Roma nor among Hungarian women. In the Roma settlement, child neglect
unfortunately appears, both in material sense and in the form of verbal abuse. After having
given birth to several children, premature birth is frequent among Roma mothers. According
to the district nurse’s opinion, the women living in the settlement are mostly passive sufferers
of the bad habits of men, but they themselves also smoke usually, up to 5-6 cigarettes a day
(and many mothers occasionally or regularly consumed drug earlier in their life). Roma
children often receive prepared food – not adequate for their age – at the age of 4-5 months,
which does not reverse their development but increases the risk of allergies, diabetes and
digestive problems.
There is very poor general hygiene at the Roma settlement, generally dwellings are without
bathroom with toilet, there is no kitchen, stove, but what is even more surprising is that there
is no public drinking fountain or outhouse. Roma families live in crowded conditions, the
quality of life of the inhabitants of the settlement is spoilt in winter by the pediculosis being a
public health problem, and, from spring to autumn, by upper respiratory illnesses. It is worth

Bálint, C.
107
mentioning, that, according to the district nurse, psychological disturbances, “tics” are less
likely to occur among Roma children than among Hungarians, although at school they are
usually ashamed of coming from the Roma settlement and the difference between the home
and school environment causes considerable internal tensions for them.
It is interesting that according to the dentist, 30 years ago the condition of the local Gypsy
children's teeth was better than the Hungarians’, but nowadays, due to the consumption of
soda with a lot of sugar and the almost total lack of dental care, this situation has reversed and
drastically deteriorated. Roma patients often present at the dental practice the social insurance
card of another Roma during the visits, so their identification is also a problem.
BAGázs: a civil initiative aiming Roma integration in Bag
In 2010, the BAGázs Public Benefit Association was established by the founder president
Emőke Both, together with her friends as volunteers. The organization’s aim is to implement
the peaceful coexistence of the Roma and Hungarian population, by assisting the Roma to
formulate goals and to do something for themselves, providing tools and knowledge to make
progress. Specific objectives are the decrease of drug use and crime, dialogue-based conflict
management, promoting volunteering and alternative education methods, and through it, to
enhance social sensitivity. Particular activities are carried out in the framework of six
programs, targeting the competence development of Roma children, adult education, debt
management, legal assistance and counseling, promotion of employment, political advocacy
and community building by the help of sport. The programs are financed to the extent of 75%
by private investors and 25% by tenders. The main drawback of mission accomplishment is
the lack of public awareness about the activity of the association among the residents of Bag,
and, the lack of trust due to the late contact with the municipality government, as well as the
educational and social institutions (Mezei, 2017).
CONCLUSIONS
Physical and mental health is the most important factor in the quality of life, and its
interrelation with economic performance is obvious: a healthy person is more willing to learn,
more creative, more entrepreneurial, can work more and better and create this way the
financial and cognitive basis for maintaining and developing health. Health is heavily
influenced by housing conditions. Unfavourable socio-economic situation leads to
deteriorated housing conditions, which lead to a deterioration in health, further reducing
economic performance and the chances of creating a more favourable standard of living.

Bálint, C.
108
Millions of Roma are concerned by the disadvantage and substandard living conditions in
Europe, especially in the Central and Eastern European countries. The European Union
targets the inclusion and integration of Roma by a common framework, which provides
specific recommendations and financial resources to achieve the goals. The national strategic
programs must be based on the experiences of local small-scale housing projects, based on the
principle of subsidiarity.
In the village of Bag in Hungary, which is the subject of my analysis –based on
questionnaire and personal interviews carried out in summer 2017-, the proximity of the
motorway and the capital intensifies the ‘suctioning’ effect, low value is generated locally,
and the income is not spent in the locality. The Roma settlement in Bag is a segregated part of
the village: the Hungarian majority society, which is gradually acquiring an urban lifestyle,
while commuting and slowly migrating elsewhere, is isolated from the problem and the
society inside the Roma settlement is also divided. Among the Roma people in Bag, the
destruction of their own health (e.g. drug consumption, smoking) is not uncommon,
congestion, the low comfort level being below basic requirements, poor hygiene conditions
are also unacceptable from the point of view of public health requirements. The early and
frequent parenthood of the Roma population causes the ‘extended’ reproduction of the
problem and the possibility of outbreak is extremely limited.
The risk of ghettoization is dependent on numerous economic and ecological factors. The
Roma settlement’s spatial expansion is not a reason for ghettoization in itself, but the lack of
clean water, sanitation, waste management and the missing basic elements of comfort
jeopardizes the ‘Telep’ to become a fully segregated, more and more hopeless part of the
village. For avoiding the further deterioration of the situation and to improve the Roma
population’s health by influencing its socio-economic and environmental determinants, the
coordinated work and cooperation of the local government, the social, healthcare and
educational institutions, and the civilian sector is needed, by the continuous involvement of
the beneficiaries.
REFERENCES
Andorka, R. (2003). Bevezetés a szociológiába. Osiris, Budapest, 121-129. Bajmócy, P. (2014). A szuburbanizáció két évtizede Magyarországon In: Kóródi, T.–
Sansumné Molnár, J., Siskáné Szilasi, B., Dobos, E. (edit.): VII. Magyar Földrajzi Konferencia pp. 25–35., ME Földrajz-Geoinformatika Intézet, Miskolc
Belak, A., Geckova, A.M., van Dijk, J. P., & Reijneveld, S. A. (2017). Health-endangering everyday settings and practices in a rural segregated Roma settlement in Slovakia: A

Bálint, C.
109
descriptive summary from an exploratory longitudinal case study. BMC Public Health (2017) 17:128 DOI 10.1186/s12889-017-4029-x
Berey, K. (1991). A cigánytelepek felszámolása és újratermelődése. Cigányélet: Műhelytanulmányok, szerk. Utasi Ágnes, Bp., k..n. 1991. 106-144.
Bernát, A. (2014). Leszakadóban: a romák társadalmi helyzete a mai Magyarországon. In: Kolosi T. & Tóth, I. Gy. (2014): Társadalmi Riport 2014. TÁRKI, Budapest
Bogárdi, T. (2017). A helyi oktatás, a családsegítő- és gyermekjóléti feladatellátás működése, aktuális kihívásai Bagon. In: Molnár, M. & Kassai, Z. (2017). Acta Regionis Rurum 11. Faluszemináriumi kutatások – Bag, 138-153. DOI: 10.21408/SZIE_ACTAREG.2017
Csépe, P. (2010). Hátrányos helyzetű csoportok egészségfelmérése és egészségfejlesztése különös tekintettel a roma populációra. Doktori értekezés, SOTE, Budapest
Cserti Csapó, T. & Orsós, A. (2015). Mélyszegénység – gyermekszegénység - a cigányok/romák helyzete és esélyegyenlősége. Gypsy Studies 31. Legyen az
Esély egyenlő – esélyteremtés a Sásdi kistérségben. http://www.kompetenspedagogus.hu/sites/default/files/cserti-csapo-tibor-orsos-anna-melyszegenyseg-gyermekszegenyseg-a-ciganyok-romak-helyzete-es-eselyegyenlosege.pdf
European Commission (2010): The social and economic integration of the Roma in Europe. Brussels, 7.4.2010 COM(2010)133 final. https://eur-lex.europa.eu/legal-content/EN/TXT/PDF/?uri=CELEX:52010DC0133&from=en
European Commission (2017): Midterm review of the EU framework for national Roma integration strategies. Brussels, 30.8.2017 COM(2017) 458 final. https://eur-lex.europa.eu/legal-content/EN/TXT/PDF/?uri=CELEX:52017DC0458&from=EN
Fercsik, M. (2002). Az ezredforduló települései – Bag. CEBA Kiadó, Budapest Forrai, J. (2008). Szép lányok csúnya betegsége, avagy szemelvények a bűnös szex és a
szifilisz történetéből. Orvosi Hetilap, 149: 1897-1904. Fullilove, M.T., & Fullilove, RE. (2000). What’s housing got to do with it? Am J Public
Health. 2000;90:183–184. Gyukits, G. (2000). A romák egészségügyi ellátásának szociális háttere. Horváth, Á., Landau,
E., Szalai, J. (szerk.): Cigánynak születni. Új Mandátum, Budapest, 471-489. Havas, G. (2008). Esélyegyenlőség, deszegregáció. In: Zöld könyv a magyar közoktatásért. Hüse, L., & Pénzes, M. (2015). Egészség, telepi körülmények között – kutatási összegző.
Szakkollégiumi Tudástár 2. Evangélikus Roma Szakkollégium, Nyíregyháza Ivanov, A., & Kagin J. (2014). Roma poverty from a human right development perspective.
Roma. Inclusion Working Papers. Istanbul: UNDP Kemény, I., & Janky, B. (2003). A 2003. évi cigány felmérésről. Beszélő, 10: 64-76. Koltai, J. (Ed.) (2013). A szegénység és a társadalmi kirekesztés célzott vizsgálata a roma
lakosság körében. Project report, National Institute for Family, Youth and Population Policy
Köbli, A. (2011). Betegebbek, előbb halnak és kiszolgáltatottak a romák. http://medicalonline.hu/gyogyitas/cikk/betegebbek__elobb_halnak_es_kiszolgaltatottak_a_romak
Krieger, J., & Higgins, D. L. (2002). Housing and Health: Time Again for Public Health Action. American Journal of Public Health, May 2002, Vol. 92, No. 5, 758-768
Lőrinc, B. (2017). Demográfiai helyzetfeltárás Bag községben. In: Molnár, M. & Kassai, Zs. (2017). Acta Regionis Rurum 11. Faluszemináriumi kutatások – Bag, 34-41. DOI: 10.21408/SZIE_ACTAREG.2017
Messing, V., & Molnár, E. (2010). Válaszok a pénztelenségre: szegény cigány és nem cigány családok megélhetési stratégiái. Esély 2011/1. http://esely.org/kiadvanyok/2011_1/03messingmolnar.indd.pdf
Bálint, C.
110
Mezei, M. (2017). A BAGÁzs Közhasznú Egyesület munkásságának hatása Bag nagyközség társadalmára. In: Molnár, M. & Kassai, Zs. (2017). Acta Regionis Rurum 11. Faluszemináriumi kutatások – Bag, 154-167. DOI: 10.21408/SZIE_ACTAREG.2017
Mihályi, P. (2003). Bevezetés az egészségügy közgazdaságtanába. Veszprémi Egyetemi Kiadó, Veszprém
Molnár, M. (2009). Bag mentális térképe. In: Molnár M. – Deáky Z. (szerk.): Acta Regionis Rurum 3. A Faluszeminárium c. kurzus hallgatói és oktatói kutatómunkájának előtanulmányai 3. kötet 36-39.
Molnár, M. (2017). Bag mentális térképe: a 2009-es és a 2017-es kutatások összevetése. In: Molnár, M. & Kassai, Z. (2017). Acta Regionis Rurum 11. Faluszemináriumi kutatások – Bag, 168-177. DOI: 10.21408/SZIE_ACTAREG.2017
Molnár, Á., Ádám, B., Antova, T., Bosak, L., Dimitrov, P., Mileva, H., …Gulis, G. (2012). Health impact assessment of Roma housing policies in Central and Eastern Europe: A comparative analysis. Environmental Impact Assessment Review 33 (2012) 7–14
Molnár, Á., Ádány, R., Ádám, B., Gulis, G., & Kósa, K. (2010). Health impact assessment and evaluation of a Roma housing project in Hungary. Health & Place 16(2010)1240–1247
Morvay, J. (2009). Látható és láthatatlan határok – Térhasználat a bagi cigánytelepen. In: Molnár M., & Deáky Z. (szerk.): Acta Regionis Rurum 3. A Faluszeminárium c. kurzus hallgatói és oktatói kutatómunkájának előtanulmányai 3. kötet 43-58.
Merker, D. (2012). A romák helyzete Magyarországon. A Policy Solutions politikai elemzése a Friedrich Ebert Alapítvány számára
Nagy, J. (2017). Közlekedésföldrajzi összefüggések Bag nagyközség mindennapjaiban. In: Molnár, M., & Kassai, Z. (2017). Acta Regionis Rurum 11. Faluszemináriumi kutatások – Bag, 10-33. DOI: 10.21408/SZIE_ACTAREG.2017
Nemes Nagy, J., & Németh, N. (2005). Az átmeneti és az új térszerkezet tagoló tényezői In: FAZEKAS, K. (edit.): A hely és a fej. Munkapiac és regionalitás Magyarországon pp. 75–137., MTA KTI., Budapest
Pénzes, J., Pásztor, I. Z., & Tátrai, P. (2015). Demographic processes of developmentally peripheral areas in Hungary Stanovništvo 53(2): 87–111. doi: 10.2298/ STNV1502087P
Pénzes, J., Tátrai, P., & Pásztor, I. Z. (2017). Changes in the Spatial Distribution of the Roma Population in Hungary During the Last Decades. Területi Statisztika, 2018, 58(1): 3–26; DOI: 10.15196/TS580101
Pope, C.A. III, Burnett, R.T. & Thun, M.J. (2002). Lung cancer, cardiopulmonary mortality, and long-term exposure to fine particulate air pollution. JAMA. 2002;287:1131–1141.
Prónai, C. (2000). A magyarországi cigányok egészségi állapota a XX. század utolsó évtizedében. Kisebbségkutatás, 9: 631-637.
Puporka, L., & Zádori Z. (1999). A magyarországi romák egészségi állapota. The World Bank, Magyarországi Regionális Iroda, NGO tanulmányok (2).
Raffestin, C., & Lawrence R. (1990). An ecological perspective on housing, health and well-being. J Sociol and Soc Welfare. 1990;17:143–160.
Rudnai, P., Bakos, J., Boga, B., Kajtár, L., Nékám, K., Szabó, J., …Virágh, Z. (2007). Lakás és egészség. Országos Környezetegészségügyi Intézet, Budapest
Sharfstein, J., Sandel, M., Kahn, R., & Bauchner, H. (2001). Is child health at risk while families wait for housing vouchers? Am J Public Health. 2001;91:1191–1192
Shaw, M. (2004). Housing and public health. In: Annual Reviews of Public Health 25, 397-418
Szilágyi, F., & Pénzes, J. (Eds.) (2016). Roma népesség Magyarország északkeleti határtér-ségében. Partium Kiadó, Nagyvárad

Bálint, C.
111
Thomson, H., Petticrew, M., & Morrison, D. (2001). Health effects of housing improvement: systematic review of intervention studies. Br Med J. 2001; 323:187–190
Tóth, Z. (2017). Utcakép-elemzés Bagon. In: Molnár, M. & Kassai, Z. (2017). Acta Regionis Rurum 11. Faluszemináriumi kutatások – Bag, 50-55. DOI: 10.21408/SZIE_ACTAREG.2017
Wilson, A., Seal J.L., McManigal, L.A., Lovins, L.H., Cureton, M., & Browning, W.D. (1998). Green Development: Integrating Ecology and Real Estate. New York, NY: John Wiley
World Health Organization (1946). WHO definition of Health, Preamble to the Constitution of the World Health Organization as adopted by the International Health Conference, New York
World Health Organization (1981). Global strategy for health for all by the year 2000. WHO, Geneva, ISSN 0254-9263

DETUROPE – THE CENTRAL EUROPEAN JOURNAL OF REGIONAL DEVELOPMENT AND TOURISM
Vol. 10 Issue 2 2018 ISSN 1821-2506
112
Original scientific paper
THE ROLE OF NATURAL RESOURCES IN THE ECOTOURISM
DEVELOPMENT – RESIDENTS’ PERCEPTIONS IN SUBOTICA
(NORTHERN SERBIA)
Aleksandra VUJKOa, b, Marko D. PETROVIĆb, c*, Danica GOSTOVIĆa, Milan RADOVANOVIĆ b, c, Darko VUKOVIĆ b, d
a Novi Sad Business School, Vladimira Perića Valtera 4, Novi Sad 21000, Serbia, [email protected]; [email protected]
b South Ural State University, Institute of Sports, Tourism and Service, 76 Lenin Ave., Chelyabinsk 454080, Russia
c Geographical Institute “Jovan Cvijić” SASA, Djure Jakšića 9, Belgrade 11000, Serbia, [email protected]; [email protected]; [email protected]
d National Research University Higher School of Economics, St. Petersburg School of Economics and Management, Department for Finance, Kantemirovskaya St. 3A, Office 331, Sankt Petersburg 194100, Russia
* Correspondence to: [email protected]
Cite this article: Vujko, A., Petrović, M.D., Gostović, D., Radovanović, M., Vuković, D. (2018). The Role of Natural Resources in the Ecotourism Development – Residents’ Perceptions in Subotica (Northern Serbia). Deturope, 10(2), 112-123.
Abstract
Regardless of their type and structure, natural resources represent the basis for industrial and economic development of every country. The aim of this study is to determine and display the natural potential in the territory of the City of Subotica (Vojvodina Province in Northern Serbia), on the basis of four protected natural areas. These areas are: Palić Nature Park, Ludaško jezero Special Nature Reserve, Selevenjske pustare Special Nature Reserve and Subotička peščara Protected Landscape of Exceptional Distinction. All listed areas represent the main aspects for ecotourism development in this part of the country, so one of the aims of the research is to identify key stakeholders that should be involved in proper developing of this form of tourism. When preforming this study, survey research techniques were used. Respondents were Subotica’s residents, who were asked to rate the state of the environment in these surroundings, as well as to give their opinions about the possibilities for the development of ecotourism. Based on the analysis of the dependent and independent variables, it was concluded that the residents are generally satisfied with the conditions of the environment, they also consider that the development of this form of tourism would raise the awareness of locals about the importance of preserving these protected areas. The result may be significant when launching a new tourism product, while preserving the protected areas and adapting for future visitors’ needs. Keywords: natural resources, industrial and economic development, protected areas, ecotourism, Subotica
INTRODUCTION
The term “sustainability” has many meanings and contents and relying on the views of the
authors who dealt recently with this topic (Bacsi, 2017; Jojić Glavonjić, Todorić, Doljak, &
Golubović, 2017; Vujko, Plavša, Petrović, Radovanović, & Gajić, 2017). We conclude that

Vujko, A., Petrović, M.D., Gostović, D., Radovanović, Vuković, D.
113
for a particular community, sustainable is what enables lasting economic growth and
development, what is socially acceptable, harmonizes the relationship and measure of
economic and social development according to ecological capacities and is politically
acceptable (it can be subject to agreement in official institutions). Tourism, looking through
the prism of sustainability, is a concept based on undertaking activities that enable appropriate
financial and economic arrangements, new technological and technical solutions, promotion
and education, a new way of public communication and interaction, with an emphasis on
openness, cooperation and transparency and new coalitions for sustainable development
(Marković, Perić, Mijatov, Doljak, & Žolna, 2017; Petrović, Blešić, Vujko, & Gajić, 2017).
Between several approaches to sustainable tourism (Bacsi, 2017; Petrović, Vujko, Gajić,
Vuković, Radovanović, Jovanović & Vuković, 2018), there is some approaches that outline
its relationship with ecotourism (Ocampo, Ebisa, Ombe & Esco, 2018), following the
definition set by Blangy and Wood (1993; p. 32), according which the ecotourism is
“responsible travel to natural areas that conserves the environment and sustains the well-being
of local people”.
Often the existence of certain natural resources has a crucial impact on the development of
the local community, giving it a certain identity, which continuously allows for a high-quality
tourist interpretation of these natural resources that the observed area gravitates to, in this
case, the City of Subotica. Modern trends emphasize the development of specific forms of
tourism, and ecotourism is one of them. Urban areas having natural resources suitable for the
development of ecotourism in their immediate surroundings represent potentials for
development. The City of Subotica is the northernmost city in the Republic of Serbia and the
second largest in the Vojvodina Province. According to the 2011 census, the City of Subotica
has a population of 97.910 inhabitants while the urban area of Subotica (with adjacent urban
settlement of Palić included) has 105.681 inhabitants. It is located 10 km from the Serbian
border with Hungary and covers an area of 1,008 km2, includes the territories of the Subotica
town and 18 surrounding villages. The relief of Subotica and its surroundings was created
predominantly by wind (aeolian erosion and accumulation), which created numerous dunes
and interdune depressions mostly in the northwest-southeast direction (Kovačević, 2006). The
city’s surroundings have four protected natural areas that are specific for their numerous
protected plant and animal species. Subotička peščara is located just along the border between
Serbia and Hungary (Fig. 1).

Vujko, A., Petrović, M.D., Gostović, D., Radovanović, Vuković, D.
114
Figure 1 Observed area
Source: Google map
In geomorphologic terms, this area is homogeneous and has a plain character. It extends to the
section of the big plateau, which crosses from Hungary to our territory to the Kula-Sombor
line. Moving further to the border, the "Selevenjske pustare" Special Nature Reserve is
building on Subotička peščara. Selevenjske pustare is located between the town of Bački
Vinogradi and Horgoš, and one part of it is part of the Municipality of Kanjiža. This protected
area is characterized by the fact that for some species, it is the only habitat in our country or is
one of the few existing sites (Maravić, 1997). The small town of Palić, as well as the Palić
Nature Park, are 7 km from the center of Subotica. Palić is a very important tourist and
recreational center of this area, while the Nature Park is an area of international importance
for birds (IBA) and plants (IPA), and is part of the EMERALD network of areas of
international importance for the conservation of biological diversity. In addition to this natural
reserve, in the villages of Šupljak, Hajdukovo and Nosa, there is Ludaško jezero (Ludaš
Lake), which is also located on the eastern European migration path of birds. Ludaško jezero
is significant as one of the rare habitats for some of the rare and endangered birds, and it is
also known as a place for many other endangered plant and animal species.
The subject of this paper is to present a resource basis for the development of ecotourism
in protected natural areas, and to improve the tourism offer of the City of Subotica. The aim
of the paper is to study protected areas and bring them closer to both tourists and the local
population. The task is to popularize these protected areas, based on valorization and zoning,
as well as with the survey carried out on a sample of 328 respondents, in order to enable their
higher attendance, better understanding and use.
Vujko, A., Petrović, M.D., Gostović, D., Radovanović, Vuković, D.
115
METHODOLOGY
For the purposes of this study, the filed research was conducted, involving four protected
natural areas of Subotica (Palić, Ludaško jezero, Selevenjske pustare and Subotička peščara),
and assistance in gathering data was given by Robert Čordaš, PhD, an expert in the field of
environment protection. In addition to interview for research purposes, a survey was
conducted during 2017 (from March to September) among 400 respondents, residents of the
City of Subotica, with the aim of gaining insight into their knowledge of protected areas as
well as the views on the economic aspects of ecotourism. Total number of 328 respondents
filled questionnaire correctly. In order to obtain better results, SWOT analysis of existing
protected natural areas has been done, as well as valorization of the space by qualitative-
quantitative method. This method represents one of the more widely used methods because it
provides great freedom in research and estimates and is based on six indicators: accessibility
of resources, tourist equipment, ambience, resource specificity, importance of resources and
artistic value. Estimates i.e. set elements of tourist valorization, during the affirmation of
resources, ranged 1-5 and marked the size of the contraction zone, in fact the significance of
the destination itself. The meanings of numbers were as follows: 1 - number one denoted
inadequate quality, 2 - quality that satisfies the local tourist significance, 3 - a good quality of
resources with a regional significance, 4 - very good quality with a wider regional (national
significance) and 5 - excellent quality of resources of international importance (Čomić, &
Pjevač, 1997; Vujko, & Plavša, 2014). Valorization of natural sites is more complex than the
valorization of anthropogenic tourist values because they differ in time and way of their
origin, their elements, genesis, as well as that they can simultaneously satisfy more tourist
needs (trips, sports, recreation, hunting, fishing, nautical, education, health needs). During the
development of this work, zoning of protected natural areas was also made, on the basis of
which it is possible to connect them for the purposes of realization of tourist tours. The
connection of these protected areas is possible due to their immediate proximity, which, with
the development of pedestrian and cycling routes as well as adequate signalization, will
enable easier implementation of the tourists as well as the possibility for tourists to
independently visit these areas. In this paper, a presentation of the traffic of tourists in the
period from 2012 to 2016 was made. The data came from the database of the Republic
Statistical Office from 2017.

Vujko, A., Petrović, M.D., Gostović, D., Radovanović, Vuković, D.
116
RESULTS AND DISCUSSION
Subotica and its surroundings have natural and anthropogenic tourist potentials which can
attract more visitors. Four protected natural areas are particularly emphasized, which are
considered to have the power to attract a much larger number of tourists by arranging and
investing in them. In order to gain a better insight into the state of the environment in the City
of Subotica, SWOT analysis (Table 1) was made, which presents the internal advantages and
disadvantages, as well as the chances and threats from the environment. The main advantage
of Subotica as a tourist destination is the proximity to the border with Hungary, the proximity
of the E 75 highway as well as good connectivity with all the roads and places in the
surrounding area. What is the main topic of this work and what is needed in the future to pay
even greater attention is well-preserved natural resources, plains, forests, sands, lakes, loess
plateaus, as well as international protection statuses. It is also important to emphasize the
preserved original material and immaterial heritage of local cultures as well as multiethnicity
and tolerant mentality. Especially attractive for tourists in this area is precisely a mixture of
different nationalities, cultures, traditions and gastronomy, which also needs to put special
emphasis on further development of tourism. The main disadvantage of this area is poor
infrastructure, which leads to the fact that tourists are not able to move independently from
the city center. The second disadvantage is that there is no adequate destination management
on the basis of which Subotica as a tourist destination would be more recognizable in the
wider tourist market. The lack is also insufficient cooperation between the municipalities,
tourist organizations, economic organizations and the local population. What is possible to
present as important chances for further development of tourism is certainly the development
and placement of new forms of tourism, specifically in this case ecotourism, as well as the
involvement of the local community, which enables new jobs and a better standard of living.
All these should be accompanied by adequate marketing activities in order to make new
tourist products more visible to current and potential tourists. The main threats are the lack of
financial support, as well as domestic and foreign investments in sustainable tourism, high
unemployment and a growing trend of emigration of young and educated people. In addition,
the main threat to the development of ecotourism is the devastation of the natural areas due to
the development of the economy. The cause of the devastation of natural areas is precisely the
insufficient education of the local population on the importance of protected areas.

Vujko, A., Petrović, M.D., Gostović, D., Radovanović, Vuković, D.
117
Table 1 SWOT analysis of surrounding natural resources of the City of Subotica
STRENGTHS WEAKNESSES
Favorable geographical position
Connectivity with the surrounding areas
Well-preserved diverse nature (plains, forests, sands, lakes, loess plateaus)
International protection statuses The original and preserved material and
immaterial heritage of the local population
Multiethnicity and tolerant mentality
Poor infrastructure
Insufficient visibility in the tourism market
Insufficient information
Insufficient cooperation between the municipalities, Tourist Organization and business entities
Lack of staff in new forms of tourism
Lack of adequate receptive capacities
OPORTUNITIES THREATS
Resources for the development of ecotourism
Designing a new tourist offer
Incorporating a local community enabling new jobs and a better standard of living
Improving marketing activities
Organization of educational lectures, seminars, fairs
Lack of financial support
Devastation of natural areas due to the development of economy and tourism
Lack of domestic and foreign investments in sustainable tourism and ecotourism
Economic crisis
High level of unemployment and the trend of emigration of young and educated people
Source: Authors’ research
One of the ways in which the mentioned area could be activated is certainly tourist
valorization. Based on valorization, an estimate was made of the value of tourist attractions of
this area through which tourists can meet their needs. Based on the valorization (Table 2) it is
possible to notice that the Nature Park Palić was rated very high. The Special Nature Reserve
"Ludaško jezero" stands out immediately after this protected area. This reserve has special
significance for its specificity, due to the special and rare species of birds and plants, due to
the existence of a visitor center and ornithological station. The next reservation, which is
distinguished by its specificity, is the Special Nature Reserve "Selevenjske pustare". Although
there is no tourist equipment in this area, it is certainly significant for the rare and endangered
plant and bird species that are nesting here. Less accessible and equipped with respect to the
rest is the Landscape of Exceptional Features "Subotička peščara", but it is significant for
specific plant and animal world.
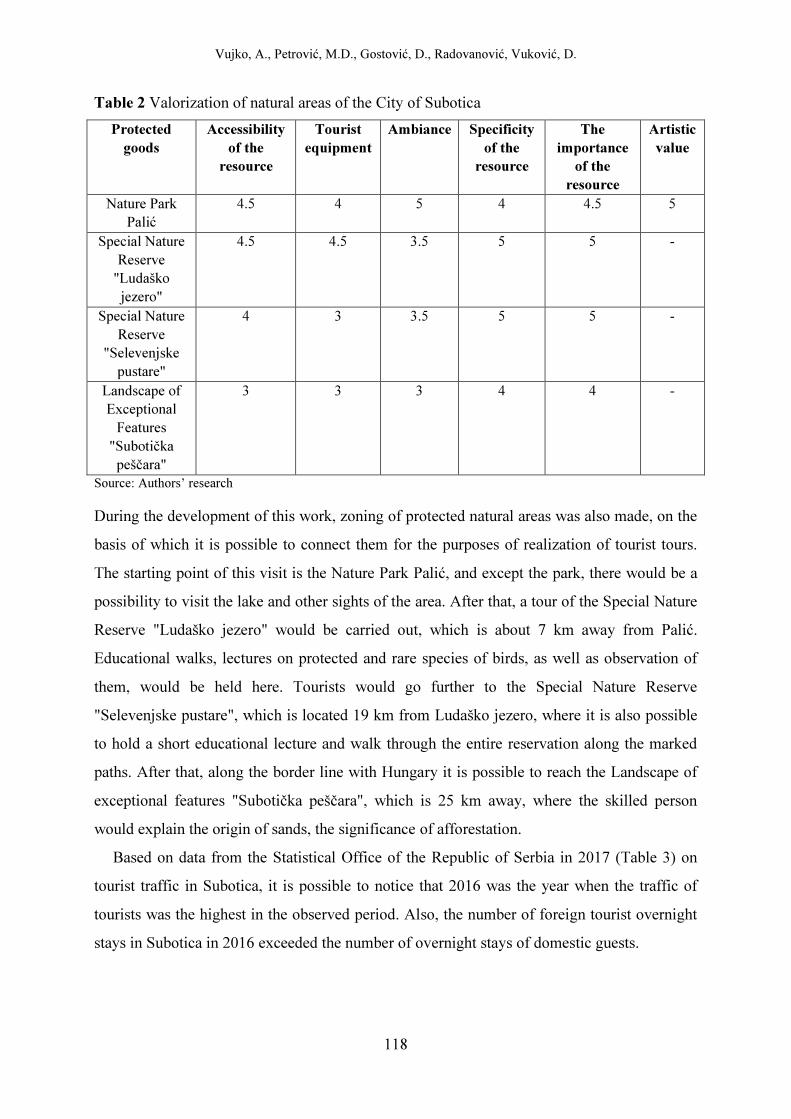
Vujko, A., Petrović, M.D., Gostović, D., Radovanović, Vuković, D.
118
Table 2 Valorization of natural areas of the City of Subotica
Protected
goods
Accessibility
of the
resource
Tourist
equipment
Ambiance Specificity
of the
resource
The
importance
of the
resource
Artistic
value
Nature Park Palić
4.5 4 5 4 4.5 5
Special Nature Reserve
"Ludaško jezero"
4.5 4.5 3.5 5 5 -
Special Nature Reserve
"Selevenjske pustare"
4 3 3.5 5 5 -
Landscape of Exceptional
Features "Subotička
peščara"
3 3 3 4 4 -
Source: Authors’ research
During the development of this work, zoning of protected natural areas was also made, on the
basis of which it is possible to connect them for the purposes of realization of tourist tours.
The starting point of this visit is the Nature Park Palić, and except the park, there would be a
possibility to visit the lake and other sights of the area. After that, a tour of the Special Nature
Reserve "Ludaško jezero" would be carried out, which is about 7 km away from Palić.
Educational walks, lectures on protected and rare species of birds, as well as observation of
them, would be held here. Tourists would go further to the Special Nature Reserve
"Selevenjske pustare", which is located 19 km from Ludaško jezero, where it is also possible
to hold a short educational lecture and walk through the entire reservation along the marked
paths. After that, along the border line with Hungary it is possible to reach the Landscape of
exceptional features "Subotička peščara", which is 25 km away, where the skilled person
would explain the origin of sands, the significance of afforestation.
Based on data from the Statistical Office of the Republic of Serbia in 2017 (Table 3) on
tourist traffic in Subotica, it is possible to notice that 2016 was the year when the traffic of
tourists was the highest in the observed period. Also, the number of foreign tourist overnight
stays in Subotica in 2016 exceeded the number of overnight stays of domestic guests.
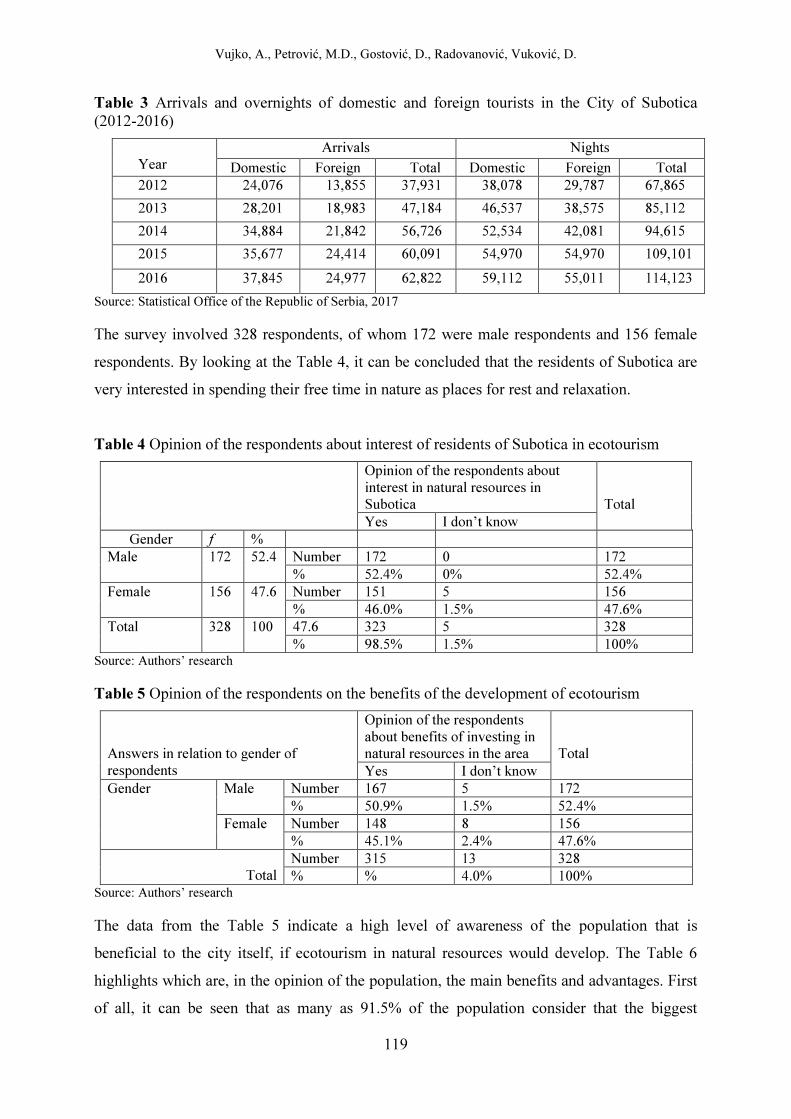
Vujko, A., Petrović, M.D., Gostović, D., Radovanović, Vuković, D.
119
Table 3 Arrivals and overnights of domestic and foreign tourists in the City of Subotica (2012-2016)
Year
Arrivals Nights Domestic Foreign Total Domestic Foreign Total
2012 24,076 13,855 37,931 38,078 29,787 67,865
2013 28,201 18,983 47,184 46,537 38,575 85,112
2014 34,884 21,842 56,726 52,534 42,081 94,615
2015 35,677 24,414 60,091 54,970 54,970 109,101
2016 37,845 24,977 62,822 59,112 55,011 114,123
Source: Statistical Office of the Republic of Serbia, 2017
The survey involved 328 respondents, of whom 172 were male respondents and 156 female
respondents. By looking at the Table 4, it can be concluded that the residents of Subotica are
very interested in spending their free time in nature as places for rest and relaxation.
Table 4 Opinion of the respondents about interest of residents of Subotica in ecotourism
Opinion of the respondents about interest in natural resources in Subotica
Total
Yes I don’t know Gender f %
Male 172 52.4 Number 172 0 172 % 52.4% 0% 52.4%
Female 156 47.6 Number 151 5 156 % 46.0% 1.5% 47.6%
Total 328 100 47.6 323 5 328 % 98.5% 1.5% 100%
Source: Authors’ research
Table 5 Opinion of the respondents on the benefits of the development of ecotourism
Answers in relation to gender of respondents
Opinion of the respondents about benefits of investing in natural resources in the area
Total
Yes I don’t know Gender Male Number 167 5 172
% 50.9% 1.5% 52.4% Female Number 148 8 156
% 45.1% 2.4% 47.6%
Total Number 315 13 328 % % 4.0% 100%
Source: Authors’ research
The data from the Table 5 indicate a high level of awareness of the population that is
beneficial to the city itself, if ecotourism in natural resources would develop. The Table 6
highlights which are, in the opinion of the population, the main benefits and advantages. First
of all, it can be seen that as many as 91.5% of the population consider that the biggest

Vujko, A., Petrović, M.D., Gostović, D., Radovanović, Vuković, D.
120
advantage of the development of ecotourism is the creation of new jobs, which directly points
to the economic aspect of tourism development. Some scientists believe that "job creation" is
one of the most important economic indicators that benefits tourism development (Gaddefors,
2005; Getz, & Carlsen, 2005; Vujko, Petrović, Dragosavac, & Gajić, 2016; Nagy, Káposzta,
& Meta, 2017). Tourist traffic which can be seen in the Table 3 shows the existence of
potential for development, as well as the importance of natural resources in terms of one of
the main motivators that drive tourists to leave the place of permanent residence.
Table 6 Opinion of the respondents on the benefits of connection between natural resources and the city
Answers in relation to gender of respondents
Gender Total Male Female
Opinion of the respondents about benefits
New jobs Number 162 138 300 % 49.4% 42.1% 91.5%
More investment in infrastructure
Number 0 7 7 % 0% 2.1% 2.1%
The young would stay in Subotica
Number 0 4 4 % 0% 1.2% 1.2%
The city would increase Number 3 3 6 % 0.9% 0.9% 1.8%
The inhabitants would have more "health trails"
Number 2 3 5 % 0.6% 0.9% 1.5%
The inhabitants would have a place to swim
Number 2 1 3 % 0.6% 0.3% 0.9%
Something else Number 3 0 3 % 0.9% 0% 0.9%
Total Number Number 156 328 % % 47.6% 100%
Source: Authors’ research
Ecotourism would contribute to the improvement of protected areas and ensure their better
conservation and protection levels. The ultimate goal is to ensure the long-term competitive
advantage of the destination on the tourism market.
CONCLUSION
Many economies of the world achieve significant market positions owing to the existence of
natural resources. In recent years, with the rapid development of technology, a stressful and
fast-moving lifestyle, there is an increasingly frequent trend of escapism in people, staying in
nature and a healthy lifestyle. The City of Subotica, as a tourist destination, has so far been
engaged in the development of many types of tourism (urban, event, cultural-historical,
sports-recreational, wine tourism, etc.), while protected nature reserves have remained

Vujko, A., Petrović, M.D., Gostović, D., Radovanović, Vuković, D.
121
neglected. It is precisely the greatest potential for further tourism development in this
destination that lies in protected natural areas. Along with the planned development of
ecotourism, these areas would be preserved from devastation and destruction, environmental
improvement would be achieved, the local population would gain insight into their overall
benefit, there would be links between different entrepreneurs, government and non-
governmental organizations and the local community. In order to facilitate the efficient
development of this type of tourism, it is necessary to include a team of experts in its
implementation and in the formation of projects, as well as to give young people the
opportunity to volunteer their contribution to their community. Based on the developed
projects, there will be an opportunity to compete for the various funds offered by the
European Union, as well as for attracting foreign investments and establishing cross-border
cooperation with countries in the region.
From all these it can be concluded that the City of Subotica has great potential for
development of ecotourism, which would increase the tourist offer on this destination. This is
a type of individual tourism or small-scale tourism, as it is mostly about groups of up to 25
people. The advantage of this type of tourism is that there is no age restriction for eco-tourists.
Ecotourism can be adapted for all ages and profiles (children, young people, adults and
retirees, biologists, ecologists, scientists, etc.). What certainly contributes to the development
of this form of tourism is that the local population sees the importance and benefits of this
form of tourism. The greatest benefit of eco-tourism development is definitely new job
creation. In this way, a responsible attitude of local communities towards protected areas in
their environment would be achieved. Campsites that could be the backbone of tourism
development should precisely be developed in these areas, and various types of workshops as
well as nature schools for children will be organized in order to educate them on the
importance of the environment and protected areas. Other activities of the camps would be
sports and recreation, cycling, educational walks, bird watching. The mission of this form of
tourism would primarily be the expansion of the business network and the establishment of
cooperation with all relevant subjects of the economic and social life that are important to
improve tourism in the City of Subotica and for planning the positioning in the market. It is
necessary to enable the connection of key stakeholders who will work together on the
formation and implementation of this tourist product. It is necessary to establish constant
information and marketing support, publication of printed publications and the creation of a
website. The most important is cooperation with the Tourist Organization of the city of

Vujko, A., Petrović, M.D., Gostović, D., Radovanović, Vuković, D.
122
Subotica, which will actively present this form of tourism and direct interested tourists to
engage in ecotourism activities.
Acknowledgments
The research was supported by Ministry of Education, Science and Technological Development, Republic of Serbia (Grant III 47007) and by the Act 211 Government of the Russian Federation, contract № 02.A03.21.0011.
REFERENCES
Bacsi, Z. (2017). Tourism and diversity. Deturope – The Central European Journal of Regional Development and Tourism, 9(2), 25-57.
Blangy, S., & Wood, M.E., (1993). Developing and implementing ecotourism guidelines for wildlands and neighboring communities, In: Lindberg, K., Hawkins, D.E. (Eds.), Ecotourism: a Guide for Planners and Managers, Vermont, North Bennington, pp. 32–54.
Čomić, D., & Pjevač, N. (1997). Turistička geografija. Belgrade: Savezni centar za unapredjenje hotelijerstva i ugostiteljstva.
Gaddefors, J. (2005). Creating context entrepreneurial opportunities in a consumer market setting. Journal of Enterprising Culture, 13(3), 199-224.
Getz, D., & Carlsen, J. (2005). Family business in tourism: State of the art. Annals of Tourism Research, 32(1), 237-258.
Jojić Glavonjić, T., Todorić, J., Doljak, D., & Golubović, N. (2017). Analysis of Tourist Motifs in the Function of Development of Cultural Tourism in the Settlements Surrounded by Protected Natural Resources. Journal of the Geographical Institute “Jovan Cvijić” SASA, 67(3), 333-340.
Kovačević, T. (2006). Opština Subotica. Novi Sad: Univerzitet u Novom Sadu, Prirodno-matematički fakultet, Departman za geografiju, turizam i hotelijerstvo.
Maravić, V. (1997). Prirodne turističke vrednosti kao komponenta razvoja turizma opštine Subotica. Novi Sad: Univerzitet u Novom Sadu, Prirodno-matematički fakultet, Departman za geografiju, turizam i hotelijerstvo.
Marković, S., Perić, M., Mijatov, M., Doljak, D., & Žolna, M. (2017). Application of Tourist Function Indicators in Tourism Development. Journal of the Geographical Institute “Jovan Cvijić” SASA, 67(2), 163-178.
Nagy, H., Káposzta, J., & Meta, B. (2017). The potentials of rural tourism in developing rural areas in Albania. Deturope – The Central European Journal of Regional Development and Tourism, 9(3), 188-206.
Ocampo, L., Ebisa, J.A., Ombe, J., & Escoto, M.G. (2018). Sustainable ecotourism indicators with fuzzy Delphi method – A Philippine perspective Short communication. Ecological Indicators, 93, 874-888
Petrović, M.D., Blešić, I., Vujko, A., & Gajić, T. (2017). The role of agritourism impact on local community in a transitional society: a report from Serbia. Transylvanian Review of Administrative Sciences, 50, 146-163.
Petrović, M.D., Vujko, A., Gajić, T., Vuković, D., Radovanović, M., Jovanović, J., & Vuković, N. (2018). Tourism as an Approach to Sustainable Rural Development in Post-Socialist Countries: A Comparative Study of Serbia and Slovenia. Sustainability, 10(54), 2-14.

Vujko, A., Petrović, M.D., Gostović, D., Radovanović, Vuković, D.
123
Vujko, A., & Plavša, J. (2014). Evaluation of National Park Fruška Gora (Serbia) for sport and recreational tourism. Acta geographica Slovenica, 54(2), 321–334.
Vujko, A., Petrović, M.D., Dragosavac, M., & Gajić, T. (2016). Differences and similarities among rural tourism in Slovenia and Serbia – perceptions of local tourism workers. Ekonomika poljoprivrede, 4, 1459-1469.
Vujko, A., Plavša J., Petrović, M.D., Radovanović, M., & Gajić, T. (2017). Modeling of tourism carrying capacity in the national parks – Fruška gora (Serbia) case study. Open Geosciences, 9, 61-72.

DETUROPE – THE CENTRAL EUROPEAN JOURNAL OF REGIONAL DEVELOPMENT AND TOURISM
Vol. 10 Issue 2 2018 ISSN 1821-2506
124
Original scientific paper
ASSESSMENT OF SERVICE QUALITY AND CONSUMER
SATISFACTION IN A HUNGARIAN SPA
Zsuzsanna LŐKEa, Ernő KOVÁCSa, Zsuzsanna BACSIa
a University of Pannonia Georgikon Faculty, Gazdasági, Társadalomtudományi és Vidékfejlesztési Tanszék, Keszthely, Deák Ferenc str. 16. 8360-Hungary email: [email protected], [email protected], [email protected]
Cite this article: Lőke, Z., Kovács, E., Bacsi, Z. (2018). Assessment Of Service Quality And Consumer Satisfaction In A Hungarian Spa. Deturope, 10(2), 124-146.
Abstract
The present analysis was carried out at one of the most important medical tourism service providers, the Hévíz Spa and St. Andrew Hospital for Rheumatic Diseases. The institution provides spa services in two locations: in the medicinal lake of Hévíz and in the 7 pools of the pool spa. The present research carried out a single cross-sectional survey of the service quality and consumer satisfaction both in the lake and in the pool bath. Altogether 300 consumers were surveyed between 27 February and 31 March 2017. The questionnaire included the double list of questions of the SERVQUAL method, about performance and importance of various factors. The customers of the two service locations significantly differ: while the customers of the medicinal lake are mainly guests paying for themselves, 70% of the customers in the pool bath are patients supported by the National Health Insurance Fund. The results of the survey (with 4.64 as the average grade of quality on a 5 – point scale) reflects the high service quality of the spa. Although the difference between the guests and the patients in the evaluation of the importance of various quality factors was not proven, there is a tendency of different ranking of the importance factors and the service quality factors (i.e. reliability, assurance, empathy, responsiveness, tangibles). The graphical representation of the values and importance made it possible to identify the quality factors that require urgent improvement, in order to provide better service quality for both the patients and the guests. Analysis of variance proved that the patients supported by the National Health Insurance Fund were more satisfied at both locations than guests paying for themselves. The high level of patient satisfaction is a very useful fact for the Hévíz Spa, because the level of satisfaction positively affects recommendations. This positive word of mouth promotion is highly valuable considering the fact, that the legislation in Hungary does not allow the promotion of health services. Keywords: spa, service quality, SERVQUAL, customer satisfaction, Hévíz
INTRODUCTION
The world of intangible problem solving from a marketing viewpoint
Services are defined by Kotler (1992) as all activities or performances that one party can offer
to another, that are not materialised, and do not result in an ownership right over anything.
The provision of services may or may not be linked to a physical product. In other words, the
service is a non-physical solution to a problem (Veres 2009). In contrast to a physical
product, services are not only intangible, but are also characterised by the fact, that consumers

Lőke, Z., Kovács, E., Bacsi, Z.
125
cannot own them after the purchase. They are usually performances or processes, which
cannot be possessed (Kenesei & Kolos, 2007).
The problematic features of services are usually referred to as the HIPI principle:
Heterogeneity, Intangibility, Perishability, Inseparability. The primary source of the problem is
the intangibility of the offer of the service provider. In contrast to the material product
services cannot be discovered by seeing, touching, tasting, smelling, or hearing (Kotler &
Keller, 2012), therefore their quality is difficult to estimate. Services, therefore, will have to
be purchased at least once, without any preliminary comparison (a “product sample”), in order
to experience their quality. This fact explains the importance of word-of-mouth promotion for
services (Veres, 2009). The variability of services is the result of the human factor. The higher
importance of the human factor in a service increases the risk of variability (Karakasné
Morvay, 2014). Perishability is a seemingly advantageous feature of services, as there is no
cost of inventory, storage, transportation, but in real life this fact is a considerable
disadvantage. In the case of material products the possibility of storing, as a puffer, can
overcome the sudden changes of demand. As this is not possible for services, there will be
peaks of demand, when some of the demand cannot be satisfied (i.e. customers will be lost),
and at times of very low demand the capacities will remain unused (Veres, 2009).
Inseparability means, that for most of the services the creation and the consumption happens
simultaneously. The customer is also involved in the production process, and the person of the
customer (as the input of the service, that cannot be standardised) influences the final quality
of the service.
In the colourful world of services the range of health tourism services mean services that
are provided with the involvement of both the person providing the service and the customer
purchasing the service, and besides intangibility they include another considerable risk
component. The frontline staff becomes a key component, functioning as the face of the
service provider. Therefore, to achieve customer satisfaction, and the necessary high quality
service provision, the selection, sustained motivation, and satisfaction of the service staff are
also crucial (Kenesei & Kolos, 2007). The customer is also involved, thus becoming an
influencing factor in performance. The stable quality of service provision does not only
depend on staff performance. The “non-standardised input”, incorporated into the service
creates considerable risk. It is particularly true for health services, that failed fulfilment of the
service can lead to damage that is several grades higher than the value of the service
transaction (Veres, 2009). In addition, for the confidential services of health tourism,
marketing has to be used for informing the customer about the benefits of the service.
Lőke, Z., Kovács, E., Bacsi, Z.
126
The service staff must precisely and professionally know the services provided. Useful
marketing tools are the information boards placed at the entrance or in the lobby of the spa
about the contents of the medicinal water or the diseases for which the water is beneficial,
indications and counter-indications, or, as in the Hévíz Spa, the exhibition describing the
history of the spa. The mouth-of-word promotion of the intangible services helps the opinion
seekers, who do not have any information about the services, and to minimise risks and
making the best decisions, will have to rely on others for recommendations (Murray, 1991).
Therefore the very satisfied customers will not only become returning customers, but will
provide positive word-of-mouth promotion improving the image of the service provider.
Value, quality, satisfaction
Utility, or value are called by Kotler and Keller (2012) the “triad of consumer value”
determined by quality, service durability, and price, including a mix of tangible and intangible
factors. Better quality and improved service provision increases value, while rising prices will
decrease consumer utility. The perceived consumer utility is the difference of total consumer
utility and total consumer cost, where total consumer utility is the economic, functional and
psychological value of the product, service provision, staff and image, while total consumer
cost is the money and non-money expenditures that the consumer spent on accessing the
product (the sum of the time, the effort and energy, the psychological and financial costs
spent on accessing and using the product (Kotler & Keller, 2012; Rekettye, 2008, 2004). For
this Rekettye (1997) uses the formula:
Perceived value = perceived utility of the product / perceived consumer costs
A high quality service means competitive advantage for a company, if, as a result, it can
attract and retain customers. Quality, however, has to be seen from the customer’s viewpoint
(Doležalová et al., 2017). Service quality is defined by Kenesei & Kolos (2007) as “the
difference between the customer’s expectations and experiences; the more the experiences
overcome the expectations, the higher is the quality perceived”. Service quality can be
understood as the utility reflected by the consumer value judgement, “…. suitability for use”
(Tomcsányi, 1994). In his book entitled the basic book of service quality Veres (2009)
underlines, that the concept of quality can be generalised only with limitations, as it is
influenced by subjective factors, and not all of its parameters are measurable, some of these
are only measurable by estimations, and the general judgement about the quality of a service
may differ from evaluation of the quality of a particular occasion. Besides the technical

Lőke, Z., Kovács, E., Bacsi, Z.
127
quality of a service, at least as important – or even more important, unique – feature is the
functional quality, i.e., the way of providing the service, e.g. the kindness and friendliness
shown by staff, the speed and ease of the service provision process (Kenesei & Kolos, 2007).
The customers’ preliminary expectations have a high weight in assessing the quality of the
service provided. Expectations (expected quality, expected service) are formed by the
customers’ earlier experiences, the recommendations and suggestions by friends, word-of-
mouth promotion, but informal sources and the promises by competitors and the marketing
communication by the service provider are also important (Webster, 1991; Kotler & Keller,
2012). An example for the disadvantageous impact of the latter may be a commercial that
promises unrealistic benefits, exaggerating the favourable features of the service, thus creating
unreasonably high consumer expectations, that the service provider is unable to satisfy even if
the service is of good quality. A contrary process is a situation when the consumer shows
tolerance towards a vis maior situation that the service provider cannot avoid, and expanding
the tolerance zone accepts a less than perfect service as satisfactory – e.g. as in the case of a
natural catastrophe (Kenesei & Kolos, 2007).
Satisfaction reflects the comparative judgements of the person about the perceived
performance of the product based on the person’s own experiences (Kotler & Keller, 2012). In
other words, it is the extent to which the product matches the consumer expectations. When
the performance matches expectations, the consumer is satisfied. When expectations are not
met, the consumer is disappointed. When, however, the performance is above the
expectations, the consumer becomes overly satisfied, or in other words, happy. Satisfaction,
in general, is, therefore, the happiness or disappointment generated by the difference between
the expected and the experienced service. Kenesei and Kolos (2007) state that in order to
retain comparative advantage, it is not enough to achieve customer satisfaction, the customer
should experience bliss: It is not enough to provide services perfectly, but by providing
service performance highly above customer expectations the emotional level of bliss should
be achieved.
Methods for measuring quality and satisfaction for services
As high quality and the satisfied customer are crucial factors in retaining the competitive
advantage of a company, customer satisfaction has to be systematically measured (Ko &
Pastore, 2005). Satisfaction is a reflection of the customer orientation of the company, and
helps to reveal the strengths and weaknesses of the service, to improve quality. The more
Lőke, Z., Kovács, E., Bacsi, Z.
128
competitive is a sector, the more important is quality and satisfaction research in marketing
(Zeithaml & Bitner, 1996). This is true even if the way of satisfaction evaluation is less exact
in the service sector, than in material production.
Information can be collected by objective and subjective methods. Objective methods
include measurable parameters, e. Sales revenue, market share, migration, consumer retain
rate, returning customer rate. Subjective explicit methods require the questioning of the
customer, implicit methods require the questioning of staff, and mystery shopping (Filiatrault,
Harvey, & Chebat, 1996).
Another method, the Critical Incident Technique (CIT) is an interactive method in relation
to a specific event, which, although rather unreliable, can be very helpful in identifying
mistakes and deficiencies (Friman 2004). Larger service providers also use the technique of
mystery shopping (mystery guest). In this technique a well-trained observer, disguised as a
customer, tests the service process, focusing on the expectations of normal customers.
Another quality assessment method, suitable for discovering service deficiencies, is the
Fishbone diagram and Blueprinting (Brown, Gummesson, Edvardsson, & Gustavsson, 1991).
The Fishbone diagram is a graphical presentation tool for the possible causes of quality
deficiencies. Nowadays companies become increasingly to complaint – friendly, who offer
easy ways for customers to make complaints, because they have understood that fast and
efficient handling of customer complaints is an excellent tool for repairing deficiencies and
stopping negative word-of-mouth statements, which would undermine the effects of
promotion.
The systematic discovery of complaint situations lead to eliminating the occurrence of
complaints, which is particularly important for health services in health tourism, because
health-related services are confidential, and the risk associated with deficient, or poorly
performed services is unacceptably high in certain service sectors, including health services
(Veres, 2009). Finally, image profiles can also be used for assessing customer satisfaction,
visually presenting the positive and less-than-perfect features of the service.
The most widely used service quality research has been published by Parasuraman,
Zeithaml, and Berry (1985a). In this research they identified the following factors that
influence the judgement of quality: 1. reliability, 2. responsiveness, 3. competence, 4. access,
5. courtesy, 6. communication, 7. credibility, 8. security, 9. empathy 10. tangible components.
To measure the expected and experienced service quality they listed 97 pairs of statements
about these factors, and then, filtering out the related factors identified 5 core factors, thus

Lőke, Z., Kovács, E., Bacsi, Z.
129
creating the SERVQUAL (SERVice QUALity) method (Brown et al., 1991). The following 5
factors were eventually identified: 1. reliability, 2. assurance, 3. tangibles, 4. responsiveness,
5. empathy. , that are measured by 22 statements valued on a 7-grade Likert scale. The
original and the modified SERVQUAL has become a widely used technique for assessing
service quality (used by dentistry, hotel management, airlines, banks, IT services, electricity
services, higher education, etc.). The original questionnaire lists both positive and negative
statements in order to capture the respondents’ attention, thus the grades given to negative
statements have to be re-coded. However, to save time, questionnaires containing only
positive statements have become increasingly popular, and Parasuraman, Zeithaml, and
Malhotra (1985b) also used a scale of only 5 values instead of the original 7-point scale,
when assessing electronic services. Altogether the 22 statements are to be assessed according
to the importance of the aspect for the customer, and according to the quality of the actual
achievement of the aspect.
In tourism research the most popular primary research tools are surveys and observations.
Personal questionnaires are generally used for assessing customer satisfaction in spite of their
expensive and time-consuming character, because questionnaires can provide excellent
quality information (both qualitative and quantitative data) for the service provider, and the
responsiveness of the surveyed customers is usually high. This is the reason why hotels
employ Guest Relation Managers, whose task includes collecting feedback from guests of the
hotel (Karakasné Morvay, 2014). Besides customer questionnaires the questionnaire-based
surveying of staff is also important (to gain information about their level of satisfaction, and
accumulated experience), that can be used for improving service quality and increasing
customer satisfaction and customer loyalty. Surveys should be conducted regularly for
discovering emerging changes.
Assessment of customer satisfaction has been widely researched and several empirical
results are known in the relevant literature. The present research could not provide a detailed
overview, but for the sake of comparison an earlier study of Bacsi, Kovács, and Lőke (2012)
should be mentioned here, because this presents the results of a survey done in 2010 about
customer satisfaction in some spa town - including Hévíz - in Western Hungary. This survey
focused on the services available in the town, not only on those provided by the spa, but
included medical treatments, bathing facilities and fitness and food services as well.

Lőke, Z., Kovács, E., Bacsi, Z.
130
OBJECTIVES AND METHODS
The location of the primary analysis was the St. Andrew Hospital for Rheumatic Diseases in
the town of Hévíz (in Western Hungary). The hospital is owned in 100% in state ownership.
Hévíz, the second most favoured tourist destinations of Hungary according to guest nights
spent in commercial accommodation, possesses a unique natural attraction, the thermal lake
of Hévíz, 44000m2 surface, with medical mud and healing water. The Saint Andrew Hospital
for Rheumatic Diseases is the caretaker of the lake and of the surrounding nature reserve area
of 620000m2. At the depth of 38 m in the bottom there is a cave where several hot and cold
springs emerge from underground, rich in minerals, and they feed the lake, resulting in a
water temperature of 24-38°C depending on the weather. Therefore the thermal lake is
suitable for bathing throughout the year. The calcium-magnesium-hydrogen carbonate content
of the water makes it beneficial for joint disorders and rheumatic diseases. A unique feature
of the lake is the fact that the patients or guests can swim in it, or bathe in a fully vertical body
position.
The first bathing establishment was built at the lake at the end of the 18th century by the
Festetics family, and this was the predecessor of the Saint Andrew Hospital of Rheumatic
Diseases, founded in 1952. This establishment facilitates the bathing in the medicinal water of
the thermal lake, and, in addition, provides the possibility of bathing in the intramural pools
filled up with the healing water flowing here through pipelines from the lake. These pools are
called Pool Bath. The typical customers of the thermal lake are guests, coming on their own,
while the majority of customers at the Pool Bath are medical tourists, i.e. patients suffering
from a medical condition, supported by the National Health Insurance Fund (NHIF – the
Hungarian acronym is OEP). However, there is an overlap between the customers of the two
locations, as the thermal lake can also be accessed by tickets supported by the NHIF. This
creates a duality for the service provider: they have to harmonise the demands of two distinct
target groups, the diseased medical tourist and the guest more interested in recreation and
enjoyment.
In order to provide treatments in the thermal lake and the spa for people of moderate
incomes, Hungarian citizens, diagnosed with diseases by specialised medical practitioners, are
entitled to purchase 15 spa tickets a year at discounted prices, supported by the National
Health Insurance Fund (Tab. 1).

Lőke, Z., Kovács, E., Bacsi, Z.
131
Table 1 Spa ticket types and prices in 2018 at the St. Andrew Hospital for Rheumatic diseases
Ticket Type Hévíz Thermal Lake Pool Bath
Normal full price ticket 3000 HUF (3-hour stay) 2000 HUF (3-hour stay)
Senior ticket (above 60 ys) 2500 HUF (3-hour stay) 1800 HUF
Student ticket (with valid student card) 2500 HUF (3-hour stay) 1500 HUF
Discounted spa ticket supported by the NHIF 1100 HUF (2-hour stay) 700 HUF
Source: Hévíz Medicinal Spa and Saint Andrew Hospital for Rheumatic Diseases. (2018). Services. (www.spaheviz.hu/en/saint_andrew/services/ and www.spaheviz.hu/en/tofurdo/services/)
The primary research method was the direct structured survey method, to allow many varied
questions and achieve a large sample size at the location of the service provision (Keller,
2010), and working with an interviewer in person provides high response rates.
The survey was conducted between 27 February and 31 March 2017. The survey sample
was divided to two parts: 50% was surveyed in the Pool Bath and 50% in the thermal lake,
questioning altogether 300 customers – patients and guests. The questionnaires were
administered by 13 interviewers – university students specialised in tourism studies. The
questionnaires contained 5- point Likert scales easily understandable for respondents. The
questionnaires contained the questions developed by Parasuraman et al. (1985a) for
measuring perceived service quality, adapted to the spa service provider. The questionnaire
used in the Pool Bath was in 96% identical to the one used in the thermal lake, to facilitate
comparisons of the two locations. The 4% difference was the question: “Staff is punctual and
keep the treatment schedule” which was asked in the Pool Bath regarding its quality and
importance aspect on a 5-point Likert scale, but was not relevant, therefore not included in the
questionnaire used in the thermal lake.
The method has received considerable criticisms since the ‘90-es, including the mission of
the double question scale, which would considerably increase the time required for
completing the survey (Veres, 2009). The double scale, though time consuming, is useful in
identifying the critical points of the service, therefore the present research included it in the
questionnaires. The questions referring to the components of the service – using a 5-point
Likert scale - asked about the performance of the Hévíz Spa, and then about the importance
of the components, and not about the expectations of the customers, as in the original model.
The 5-point scale was also used instead of the original 7-point e Likert scale by Parasuraman
et al. (1985a) in a service sector analysis. A Hungarian researcher Veres (2009) also questions
the suitability of a 7-grade Likert scale. To minimise first-order error the performance of the
service provider and the importance of the various components are asked separately in the
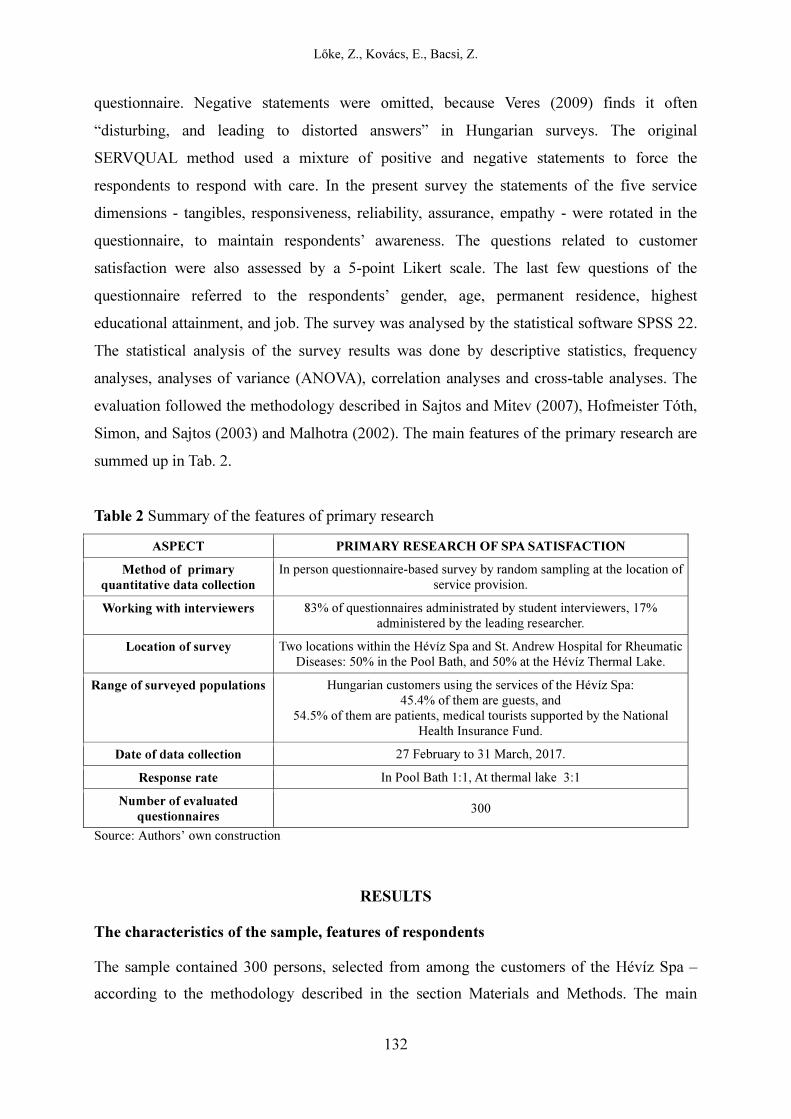
Lőke, Z., Kovács, E., Bacsi, Z.
132
questionnaire. Negative statements were omitted, because Veres (2009) finds it often
“disturbing, and leading to distorted answers” in Hungarian surveys. The original
SERVQUAL method used a mixture of positive and negative statements to force the
respondents to respond with care. In the present survey the statements of the five service
dimensions - tangibles, responsiveness, reliability, assurance, empathy - were rotated in the
questionnaire, to maintain respondents’ awareness. The questions related to customer
satisfaction were also assessed by a 5-point Likert scale. The last few questions of the
questionnaire referred to the respondents’ gender, age, permanent residence, highest
educational attainment, and job. The survey was analysed by the statistical software SPSS 22.
The statistical analysis of the survey results was done by descriptive statistics, frequency
analyses, analyses of variance (ANOVA), correlation analyses and cross-table analyses. The
evaluation followed the methodology described in Sajtos and Mitev (2007), Hofmeister Tóth,
Simon, and Sajtos (2003) and Malhotra (2002). The main features of the primary research are
summed up in Tab. 2.
Table 2 Summary of the features of primary research
ASPECT PRIMARY RESEARCH OF SPA SATISFACTION
Method of primary
quantitative data collection
In person questionnaire-based survey by random sampling at the location of service provision.
Working with interviewers 83% of questionnaires administrated by student interviewers, 17% administered by the leading researcher.
Location of survey Two locations within the Hévíz Spa and St. Andrew Hospital for Rheumatic Diseases: 50% in the Pool Bath, and 50% at the Hévíz Thermal Lake.
Range of surveyed populations Hungarian customers using the services of the Hévíz Spa: 45.4% of them are guests, and
54.5% of them are patients, medical tourists supported by the National Health Insurance Fund.
Date of data collection 27 February to 31 March, 2017.
Response rate In Pool Bath 1:1, At thermal lake 3:1
Number of evaluated
questionnaires 300
Source: Authors’ own construction
RESULTS
The characteristics of the sample, features of respondents
The sample contained 300 persons, selected from among the customers of the Hévíz Spa –
according to the methodology described in the section Materials and Methods. The main

Lőke, Z., Kovács, E., Bacsi, Z.
133
customer segment of the Hévíz Spa specialised in treating locomotor and rheumatic diseases
is the elderly population, and this is reflected in the survey sample. Altogether 51.5% of the
respondents is between 51 and 70 years of age, 19.7% of them are between 36 and 50, and
15.4% is above 70 (Tab. 3). The remaining 13.4% falls into the age categories of 26-35, 19-
25, and 14-18 (1 person) (One female respondent refused to answer the question about her
age.)
Table 3 The sample structure according to gender and age category
Age (years) Male Female Total Proportion
14-18 0 1 1 0.3%
19-25 5 6 11 3.7%
26-35 10 18 28 9.4%
36-50 28 31 59 19.7%
51-70 59 95 154 51.5%
above 70 19 27 46 15.4%
Total 121 178 299 100.0%
Source: Authors’ own results
The gender structure of the sample shows a less than 1% divergence from the customer
gender structure of the Pool Bath in 2016, therefore it properly represents the gender structure
of the customer population. In the Pool Bath 38.7% of the respondents were male and 61.3%
female (Tab. 4). In the thermal lake the majority of the customers were female, the proportion
was 42% male and 58% female guests. The total sample was made up of 121 men (40.3%)
and 179 women (59.7%).
Table 4 Gender distribution of the respondents at the two locations
Gender distribution Male Female
Pool Bath, data from 2016 38.0% 62.0%
Pool Bath ( sample size: n=150) in current primary research 38.7% 61.3%
Hévíz thermal lake ( sample size: n=150) in current primary research 42.0% 58.0%
Respondents ( sample size: n=300) in current primary research 40.3% 59.7%
Source: Authors’ own results
The largest segment of respondents according to educational attainment were those possessing
a university degree (38.67%) and those completing secondary school with matriculation
(37.67%), 14% completed a vocational secondary school and 3% has completed the 8 years of
primary school, while 20 persons refused to answer.

Lőke, Z., Kovács, E., Bacsi, Z.
134
Due to the fact, that the majority of customers are elderly, nearly half (48%) of the
respondents are retired. Somewhat less is the proportion of employees, self-employed
entrepreneurs, managers, and the smallest group is students.
Comparison of the customers of the Hévíz Thermal Lake and of the Pool Bath
The next research question was to check whether the survey would justify the expectation that
the majority of the customers of the Pool Bath are patients using the spa services by NHIF
support, while the majority of the customers in the Thermal Lake are guests, and not NHIF-
supported patients. The null-hypothesis is that the proportion of customers supported by NHIF
is the same in the Pool Bath and in the thermal lake. The managers of the Spa do not have
exact information about the proportion of the NHIF-supported patients among the customers,
only a subjective expectation, that the proportion of the NHIF-supported patients is higher in
the Pool Bath than in the thermal lake. The tests was aimed at finding out more precise
information about this feature.
A cross-table analysis was used to evaluate 290 responses, as 10 persons gave no answers
to the question whether they use the spa services by NHIF support or not. The 79.1% of the
customers in the intramural Pool Bath are patients supported by NHIF and 20.9% are guests
without NHIF support, while in the Thermal Lake the proportions are just the opposite, 28.9%
are supported by NHIF and 71.1% are not supported by NHIF (Fig. 1). The proportion of the
NHIF-supported customers in the whole sample is 54.5% and the proportion of those paying
the full price without NHIF support is 45.5% (buying a full price, or senior, or student spa
ticket).
Figure 1 Cross-table analysis of respondents using the service locations (Pool Bath or Thermal lake) and using normal spa tickets or discounted tickets supported by NHIF
Source: Authors’ own research
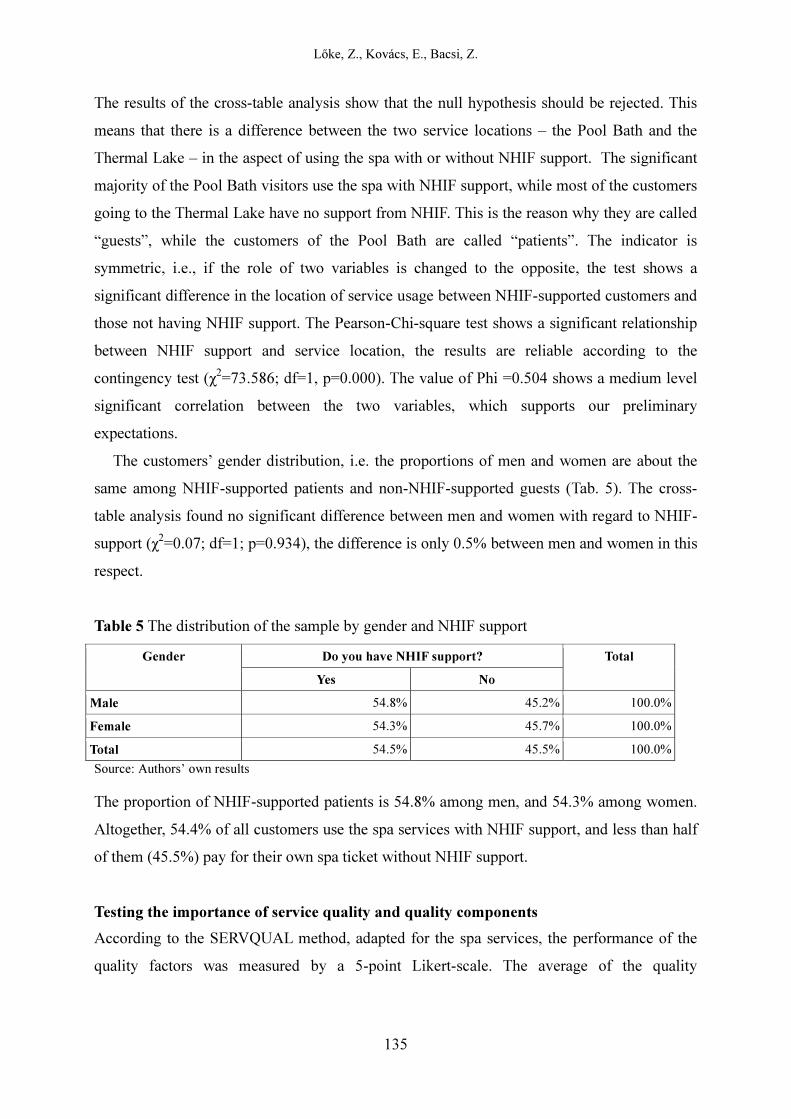
Lőke, Z., Kovács, E., Bacsi, Z.
135
The results of the cross-table analysis show that the null hypothesis should be rejected. This
means that there is a difference between the two service locations – the Pool Bath and the
Thermal Lake – in the aspect of using the spa with or without NHIF support. The significant
majority of the Pool Bath visitors use the spa with NHIF support, while most of the customers
going to the Thermal Lake have no support from NHIF. This is the reason why they are called
“guests”, while the customers of the Pool Bath are called “patients”. The indicator is
symmetric, i.e., if the role of two variables is changed to the opposite, the test shows a
significant difference in the location of service usage between NHIF-supported customers and
those not having NHIF support. The Pearson-Chi-square test shows a significant relationship
between NHIF support and service location, the results are reliable according to the
contingency test (χ2=73.586; df=1, p=0.000). The value of Phi =0.504 shows a medium level
significant correlation between the two variables, which supports our preliminary
expectations.
The customers’ gender distribution, i.e. the proportions of men and women are about the
same among NHIF-supported patients and non-NHIF-supported guests (Tab. 5). The cross-
table analysis found no significant difference between men and women with regard to NHIF-
support (χ2=0.07; df=1; p=0.934), the difference is only 0.5% between men and women in this
respect.
Table 5 The distribution of the sample by gender and NHIF support
Gender Do you have NHIF support? Total
Yes No
Male 54.8% 45.2% 100.0%
Female 54.3% 45.7% 100.0%
Total 54.5% 45.5% 100.0%
Source: Authors’ own results
The proportion of NHIF-supported patients is 54.8% among men, and 54.3% among women.
Altogether, 54.4% of all customers use the spa services with NHIF support, and less than half
of them (45.5%) pay for their own spa ticket without NHIF support.
Testing the importance of service quality and quality components
According to the SERVQUAL method, adapted for the spa services, the performance of the
quality factors was measured by a 5-point Likert-scale. The average of the quality

Lőke, Z., Kovács, E., Bacsi, Z.
136
performance was measured to be 4.640, with 0.3782 standard deviation, which indicates a
very high quality achievement by the service provider.
In spite of its time-consuming character, and the criticisms against the SERVQUAL model,
we considered it reasonable to survey the customers’ opinions about the importance of various
quality components, to reveal if there is any difference between the two customer groups
(patients and guests) regarding the importance of these components. Respondents rated the
importance of these components rather high, average scores turned out to be between 4.43 and
4.91 on a 5-point scale. For most of the quality components the average importance-scores
were higher for NHIP-supported patients. The guests gave higher scores only in two aspects,
i.e.: the whole area of the service location should be clean and hygienic (mean score =4.884,
the most important factor for guests), and the establishment should provide space suitable for
relaxation with resting chairs inside, and park and walking path outside.
Analysis of variance was applied to test the difference between the two target groups in the
assessment of importance. The null-hypothesis was that the average scores do not differ
between the two customer groups. The Levene-test showed that homogeneity of standard
deviations was true only for 5 of the 23 importance components, the rest had to be omitted
from further analysis. The analysis of variance procedure found no difference for these 5
factors between guests and visitors, therefore the null-hypothesis cannot be rejected, the
guests’ opinion about the importance of these factors does not differ significantly from the
patients’ opinions.
A ranking of importance was set up by the average scores, which showed that for NHIF-
supported patients the tangible components are the least important (all the 5 tangible factors
were given scores putting them at the last 6 places in the list). According to the guests’ scores
3 of the last 6 items in the list are tangible components, but the remaining 2 tangible
components are ranked at around the top of the list (6th and 7th place, with an average score
of 4.762 for both). These two components were: the establishment provides space suitable for
relaxation with resting chairs inside, and park and walking path outside, and the staff looks
clean and orderly. For NHIF-supported patients the most highly ranked factor by importance
were: 1. Staff is well trained, competent (4.971) 2. Staff is punctual and keep the treatment
schedule (4.896). 3. Services are performed perfectly with no errors (4.867), and these factors
well describe what the patients consider to be the most important tasks of the service provider.
Regarding the importance ranking the expectations of the two target groups, patients and
guests, seem to differ considerably.

Lőke, Z., Kovács, E., Bacsi, Z.
137
The ‘patients’ and ‘guests’ different rankings by importance of service quality components
are shown in Fig. 2 and 3. The two most important factors for NHIP-supported patients were
reliability and assurance (with only a very slight difference between the two), followed by
empathy. Their expectations reflected in the importance scores are very high for all the four
human components, while they are much less demanding in the tangible components. For
guests the first three components are assurance, empathy, and reliability, all with above-
average importance scores. The two least important components are responsiveness and
tangible components for both target groups. It is interesting to note, that for patients the
responsiveness component scored above-average, while for guests it is less than the average.
Figure 2 The difference of the average importance of various service quality components from the total average importance, by the NHIF-supported patients, on a 1-5 scale
Source: Authors’ own results
Figure 3 The difference of the average importance of various service quality components from the total average importance, by the non-NHIF-supported guests, on a 1-5 scale
Source: Authors’ own results

Lőke, Z., Kovács, E., Bacsi, Z.
138
The graphical presentation of the quality achievement and the quality importance reflects the
strategic competitive advantage of the service provider, that determine the level of customer
satisfaction (Hofmeister Tóth et al., 2003). These competitive advantages are the components,
that are considered important and the service provider performs well in them, as is shown in
the upper right quarter of Fig. 4 and 5. The good news for the service provider is that more
than half of the assessed factors belong to this group. The further improvement of these
factors is not urgent, but an improvement in them can considerably increase the overall level
of customer satisfaction. For NHIF-supported patients these factors of competitive advantage
includes several components of professional competence, e.g: staff is well trained and
competent; staff is punctual and keeps the planned schedule of treatments, the staff of the spa
show responsiveness, services are provided perfectly with no errors, etc. For guests the factors
of competitive advantage also include: staff is well trained and competent; and further factors
are the services provided at the treatments are personalised; the staff looks clean and orderly;
staff is at their place and always available, etc.
The components located at the lower right quarter of the figure are not important but well
performing factors, therefore maintaining their good performance is also important. For both
target groups this category includes: the staff and the management behave politely, and the
staff is friendly. In addition, for NHIF-supported patients the component spa staff looks clean
and orderly also belong to this category. Non-NHIF-supported guests list two additional
factors here: the staff cares about the service-related problems of the guests/patients and tries
to solve them; and the staff generates trust and confidence.
The lower left quarter is the place of service factors not important and badly performed.
These factors should be improved, but their development is not very urgent. These are so-
called necessary conditions or endowments, whose improvement would not considerably raise
consumer satisfaction (Hofmeister Tóth et al., 2003). For NHIF-supported patients these
necessary conditions include: the buildings, outer and internal space of the spa are
aesthetically pleasant; the spa is well equipped with up-to-date tools; the materials providing
information (booklets and brochures, boards, notices) are easy to read and nicely designed;
the establishment provides space suitable for relaxation with resting chairs inside, and park
and walking path outside; the staff is an excellent source of information about the services of
the spa.

Lőke, Z., Kovács, E., Bacsi, Z.
139
Figure 4 The opinion of the NHIF-supported patients of Hévíz Spa about the level of achievement and the importance of quality components
Source: Authors’ own results
Figure 5 The opinion of the non-NHIF-supported guests of Hévíz Spa about the level of achievement and the importance of quality components
Source: Authors’ own results
These necessary conditions are the same for guests and for patients, with one exception. This
exception is the component the establishment provides space suitable for relaxation with
resting chairs inside, and park and walking path outside. This component is a necessary
condition for patients, while it is ranked in the upper right category of competitive advantages
for guests.
The upper left quarter of the chart – i.e. the important, but not very well performing
components – contain the factors that should be urgently improved. These poorly performing,

Lőke, Z., Kovács, E., Bacsi, Z.
140
but very important factors would considerably increase customer satisfaction, and then they
could become competitive advantage factors. For NHIF-supported patients two factors (the
whole area of the service location is clean and hygienic; and the spa provides personalised
care for the patients according to their individual disease needs) and for non-NHIF-supported
guests three factors (the guest feels safe and secure at the service provider; the whole area of
the service location is clean and hygienic; services are provided perfectly with no errors)
belong to this category (Tab. 6 and 7). These results can be useful for the service provider in
planning the quality improvement tasks for the Pool Bath and the Thermal Lake, with respect
to the different expectations of the two target groups.
Table 6 The quality factors grouped into the four quarters, by the NHIF-supported patients’ opinions
TO BE IMPROVED URGENTLY
1. The whole area of the service location is clean
and hygienic
2. The spa provides personalised care for the
patients according to their individual disease
needs
COMPETITIVE ADVANTAGES
1. The staff of the spa show responsiveness.
2. Staff responds quickly to the requests of
guests/patients.
3. Staff is punctual and keeps the planned
schedule of treatments.
4. Services are provided perfectly with no errors.
5. Staff works quickly and efficiently.
6. Staff is reliable and they really care about
customers.
7. The staff cares about the service-related
problems of the guests/patients and tries to
solve them.
8. The staff is at their place and always available.
9. The customer feels safe and secure at the
service provider.
10. The staff answers the customers’ questions.
11. Staff is well trained and competent.
12. The staff is an excellent source of information
about the services of the spa.
13. Staff generates trust and confidence.
14. The spa provides personalised care for the
patients according to their individual disease
needs.
NECESSARY CONDITIONS, IMPROVEMENT
IS NOT URGENT
1. The buildings, outer and internal space of the
spa are aesthetically pleasant.
2. The spa is well equipped with up-to-date tools
3. The materials providing information (booklets
and brochures, boards, notices) are easy to
read and nicely designed
4. The establishment provides space suitable for
relaxation with resting chairs inside, and park
and walking path outside
5. The staff is an excellent source of information
about the services of the spa.
TO BE MAINTAINED AT THE CURRENT
LEVEL
1. The staff looks clean and orderly.
2. Staff and management behave politely.
3. The staff is friendly.
Source: Authors’ own results

Lőke, Z., Kovács, E., Bacsi, Z.
141
Table 7 The quality factors grouped into the four quarters, by the non-NHIF-supported guests’ opinions
TO BE IMPROVED URGENTLY 1. The customer feels safe and secure at the
service provider 2. The whole area of the service location is
clean and hygienic; 3. Services are provided perfectly with no
errors
COMPETITIVE ADVANTAGES 1. The staff looks clean and orderly. 2. The establishment provides space suitable
for relaxation with resting chairs inside, and park and walking path outside.
3. The staff of the spa show responsiveness. 4. Staff responds quickly to the requests of
guests/patients 5. Staff works quickly and efficiently. 6. Staff is reliable and they really care about
customers. 7. The staff is at their place and always
available. 8. The staff answers the customers’ questions. 9. Staff is well trained and competent. 10. The staff is an excellent source of
information about the services of the spa. 11. The services provided at the treatments are
personalised. 12. the spa provides personalised care for the
patients according to their individual disease needs.
NECESSARY CONDITIONS, IMPROVEMENT IS NOT URGENT 1. The buildings, outer and internal space of
the spa are aesthetically pleasant. 2. The spa is well equipped with up-to-date
tools 3. The materials providing information
(booklets and brochures, boards, notices) are easy to read and nicely designed.
4. The staff is an excellent source of information about the services of the spa.
TO BE MAINTAINED AT THE CURRENT LEVEL 1. Staff and management behave politely. 2. The staff cares about the service-related
problems of the guests/patients and tries to solve them.
3. Staff generates trust and confidence. 4. Staff is friendly.
Source: Authors’ own results
Customer satisfaction
Customers were asked to evaluate their level of satisfaction on a 5-grade Likert-scale about
the services provided by the Hévíz Spa.
The relevant literature suggests that there should be a positive correlation between service
quality and level of satisfaction with the service. To test this relationship the scores given to
the service quality factors were compared to the scores the respondents gave to the question
“to what extent are you satisfied altogether with the spa” (1-5 grade Likert scale). Results
showed a medium positive correlation at 1% level of significance (Pearsons correlation
coefficient =0.633) between quality and level of satisfaction. The respondents ranking the

Lőke, Z., Kovács, E., Bacsi, Z.
142
performance of the spa higher were found to be more satisfied with spa services, as has been
proven in many previous research publications (Al-alak & EL-refae, 2012; Kozmáné Csirmaz,
2017).
Our hypothesis was that the level of satisfaction with services is different for guests and for
patients. This hypothesis was tested at both service locations, the Pool Bath and the Thermal
Lake alike, because the Pool Bath has mainly a medical treatment atmosphere while the
Thermal Lake is a typical tourist service location. Multiple analysis of variance was applied in
testing the following three null-hyptheses, after the necessary requirements for applying the
methods were checked:
1. The level of satisfaction does not significantly differ between guests and NHIF-supported
patients.
2. The level of satisfaction does not significantly differ between the customers of the Pool
Bath and the of the Thermal Lake.
3. The interaction of the service location and the customer status (guest or patient) does not
influence the level of customer satisfaction.
The NHIF-supported patients showed higher level of satisfaction at both locations, than
guests. The level of patient satisfaction scored 4.479 in the Pool Bath and 4.585 in the
Thermal Lake, while the scores of guest satisfaction were only 4.065 in the Pool Bath and
4.347 in the Thermal Lake. Both customer groups were more satisfied with the services of the
Thermal Lake than of the Pool Bath.
As Table 8 presents, the customer status (guest or patient) significantly influences the level
of satisfaction (a 1% level of significance). Therefore the first null-hypothesis is rejected. The
second and third null-hypotheses, however, cannot be rejected, because the effect of the
service location is not significant (sig.=0.056 in Tab. 8), neither the impact of the interaction
of location and customer status (sig.=0.387), i.e., these factors do not influence the level of
customer satisfaction. Customer status, i.e. whether customers use the spa services with
support from the NHIF (patients) or without it (guests), has a significant impact on the level
of satisfaction, but this impact is not too strong, as is shown by the value Eta-square of 0.035
(which is much smaller than the theoretical high value of 1). The coefficient of determination
is very low, R2 = 0.037, i.e. the customer status (patient or guest) is responsible only for 3.7%
of the level of satisfaction. The overall average score of customer satisfaction is 4.369 (on a 5-
point scale), thus the customers are altogether quite satisfied with the services of the Hévíz
Spa.

Lőke, Z., Kovács, E., Bacsi, Z.
143
Table 8 Multiple analysis of variance (dependent variable: “To what extent are you satisfied
with the spa altogether?”, independent variables: Location, and Customer status defined by
the question “Are you a NHIF-supported customer?”)
Multiple Analysis of Variance: To what extent are you satisfied with the spa altogether?
Residual Sum
of Squares
Degree of
freedom
Mean Sum of
Squares
F Sig. Partial Eta-
square
Adjusted model 5.906a
3 1.969 3.612 0.014 0.037
Intercept 4066.476 1 4066.476 7460.464 0 0.963
Location 2.012 1 2.012 3.692 0.056 0.013
Customer status 5.677 1 5.677 10.416 0.001 0.035
Location x
customer status
0.409 1 0.409 0.751 0.387 0.003
a: R2=0.037
Source: Authors’ own results
The graphical presentation of the results shows clearly that the NHIF-supported patients are
more satisfied than non-NHIF-supported guests at both service locations (Fig. 6).
Figure 6 The overall level of customer satisfaction at the Hévíz Spa, by service location and customer target group
Source: Authors’ own results
DISCUSSION AND CONCLUSION
As Kotler and Keller (2012) state, a forward-looking company considers customer satisfaction
not only a goal in itself, but an effective marketing tool, as well. The high quality service is a
competitive advantage, contributing to the ability to retain customers and attract new ones.
For a state-owned health institution working in the health tourism sector the benefits of
positive word-of-mouth promotion by satisfied customers cannot be overestimated.

Lőke, Z., Kovács, E., Bacsi, Z.
144
As Bacsi et al. (2012) found in their survey, the spa visitors in Hévíz were mostly returning
visitors (78.4%) in 2010, whose main source of information was their former experience in
the same spa. From among the services provided by the spa, customers ranked the medical
treatments the highest, with a score of 4.53 followed by bathing (4.44) in a simple 5-point
Likert-scale, indicating a rather high level of satisfaction with spa services. Similar or slightly
lower levels of overall satisfaction were found in the present research (4.37), though the direct
comparison is not reasonable, as range of evaluated components was much wider now.
The well-known positive linear relationship between quality and level of satisfaction was
justified by the sample. Quality, as Veres (2009) notes, although a qualitative value
judgement, can be well measured on a 1-5 grade Likert scale by the questionnaire about the
performance of various service quality components defined by the SERVQUAL method
adapted to spa service providers. As the analysis of variance proved, the customer status (i.e.
being a guest or a patient) significantly influences the level of satisfaction. Patients are
generally more satisfied both in the Pool Bath and in the Thermal Lake than guests.
Surprisingly, the service location did not have any impact on the level of satisfaction. The
high level of satisfaction is very valuable for the Hévíz Spa, because satisfied customers
generate the positive image and fame of the service provider. Many studies – including
Anderson (1985) – showed that customer satisfaction has a positive impact on the number of
recommendations, and word-of-mouth promotion is strongest when customer satisfaction is
very high or very low. Positive word-of-mouth promotion cannot be overestimated for state-
owned health service providers because according to Hungarian legislation they are not
allowed to promote their services.
Although the analysis of variance did not show any significant difference between patients
and guests regarding the importance of quality components, but the ranking of the various
components differ considerably. Guests, for example, considered tangible components more
important, e.g. the spaces suitable for relaxation, and the staff’s cleanliness and orderly looks
were the 6th and 7th most important factors for them. For patients, however, tangible
components were ranked at the bottom of the importance order.
The importance and the performance of various service quality components were plotted
against each other to identify components creating comparative advantages, components
requiring maintenance but not needing urgent intervention, components to be urgently
improved for meeting customer expectations, and necessary conditions, which, even if
improved, would not lead to significant increase in customer satisfaction. These give ideas for
the service provider about what to develop in the Pool Bath and in the Thermal Lake. For the

Lőke, Z., Kovács, E., Bacsi, Z.
145
Hévíz Spa and St. Andrew Hospital for Rheumatic Diseases two components require urgent
development for the NHIF-supported patients ( individual care for patients according their
diseases, and cleanliness of the establishment) and three components for the non-NHIF-
supported guests (cleanliness of the establishment, perfect service provision without errors,
and the feeling of safety and security at the service provider).
The research proved without doubt, that the customers of the Pool Bath and those of the
Thermal Lake significantly differ. The overwhelming majority of the customers in the Pool
Bath are patients supported by the NHIF (79.1%), while the customers in the Thermal Lake
are mainly guests not supported by the NHIF (71.1%). This relationship between customer
type and service location is reasonably strong, therefore the service provider, seeking to
improve service quality and customer satisfaction, should prioritise the guests’ opinion when
planning the development of the Thermal Lake services and focus on the patients’
expectations when the development plans of the Pool Bath are considered.
REFERENCES
Al-alak, B. A., & EL-refae, G. A. (2012). The Relationships between Service Quality, Satisfaction, and Behavioral Intentions of Malaysian Spa Center Customers. International Journal of Business and Social Science, 3(1), 198-205.
Anderson, E. (1998). Customer Satisfaction and Word of Mouth. Journal of Service Research, 1 (1), 5-17.
Bacsi, Z., Kovács, E., & Lőke, Z. (2012). Spa successes and challenges in Transdanubia, Hungary – Results of a survey in three spa towns. Deturope, 4(1), 27-47.
Brown, W. S., Gummesson, E., Edvardsson, B., & Gustavsson, B. (1991). Service Quality. Lexington Books. New York.
Doležalová, H., Pícha, K., Navrátil, J., Veselá, M., & Švec, R. (2016). Perception of quality in decision making regarding purchase of organic food. Quality - Access to Success, 17(153), 86-91.
Filiatrault, P., Harvey, J., & Chebat, J-C. (1996). Service quality and service productivity management practices. Industrial Marketing Management, 25(3), 243-255.
Friman, M. (2004). The structure of affective reactions to critical incidents. Journal of Economic Psychology, 25(3), 331-353.
Hévíz Medicinal Spa and Saint Andrew Hospital for Rheumatic Diseases. (2018). Services. Retrieved March 20, 2018, from www.spaheviz.hu/en/saint_andrew/services/ and www.spaheviz.hu/en/tofurdo/services/
Hofmeister Tóth, Á., Simon, J., & Sajtos, L. (2003). Fogyasztói elégedettség [Customer satisfaction – In Hungarian]. Alinea Kiadó, Budapest.
Karakasné Morvay, K. (2014). A minőségfejlesztés és a vendégelégedettség összefüggései a hazai wellness szállodákban című doktori PhD értekezés [Relationship between quality assurance and customer satisfaction in wellness hotel sin Hungary. PhD Thesis – In Hungarian], SZIE Gödöllő. pp. 57-66, 192-205. Retrieved November 6, 2016, from https://szie.hu//file/tti/archivum/Karakasne_Klara_ertekezes.pdf
Keller, V. (2010). Az értékesítésösztönzés mint stratégia és taktika a kiskereskedelemben (Vizsgálatok kiskereskedők és fogyasztók körében a magyarországi felsőruházati termékek piacán). PhD értekezés [Sales promotion as strategy and tactics in retail

Lőke, Z., Kovács, E., Bacsi, Z.
146
(Analyses of retailers and consumers in the clothes market in Hungary. PhD Thesis – in Hungarian.] Széchenyi István Egyetem, Győr. pp. 223. Retrieved February 12, 2017, from http://rgdi.sze.hu/files/Ertekezesek,%20tezisek/Doktori_KV.pdf
Kenesei, Z., & Kolos, K. (2007). Szolgáltatásmarketing és –mendzsment [Service marketing and management – In Hungarian]. Alinea Kiadó, Budapest. pp. 48, 128-138.
Ko, Y. J., & Pastore, D. L. (2005). A hierarchical model of service quality for the recreational sport industry. Sport Marketing Quarterly, 14(2), 84-97.
Kotler, P., & Keller, K. L. (2012). Marketing menedzsment [Marketing management – Hungarian translation]. Akadémia Kiadó, Budapest. pp. 20, 149-155, 412.
Kotler, P. (1992). Marketing management elemzés, tervezés, végrehajtás és ellenőrzés. [Marketing management analysis, planning, implementation, monitoring – Hungarian translation]. Műszaki Könyvkiadó, Budapest. p. 407.
Kozmáné Csirmaz, É. (2017). A magyarországi rekreációs turizmus egyes szegmenseinek elemzése a fogyasztói elégedettség szempontjából című PhD értekezés [The analysis of some segments of recreational tourism in Hungary from the aspect of consumer satisfaction..PhD Thesis – in Hungarian], Debreceni Egyetem, Gazdálkodástudományi Kar, Debrecen. p. 156. Retrieved March 5, 2018, from https://dea.lib.unideb.hu/dea/bitstream/handle/2437/236036/Kozmane_Csirmaz_Eva_ertekezes_titkositott.pdf?sequence=1&isAllowed=y
Malhotra, N. K. (2002). Marketingkutatás [Marketing research – Hungarian translation]. KJK-KERSZÖV Jogi és Üzleti Kiadó Kft. Budapest.
Murray, K. B. (1991). A Test of Services Matketing Theory – Consumer Information Acquisition Activities. Journal of Marketing, 55(1), 10-25.
Parasuraman, A., Zeithaml, A. & Berry, L. (1985a). A Conceptual Model of Service Quality and Its Implications for Future Research. Journal of Marketing, 49 (47). in: Swarbrooke, J. & Horner, S. (2007). Consumer Behaviour in Tourism. Second edition. Published by Elsevier Ltd. Oxford, UK.
Parasuraman, A., Zeithaml, V. A. & Malhotra, A. (1985b). E-S-QUAL: A Multiple-Item Scale for Assessing Electronic Service Quality. Journal of Service Research, 7(3) 18. in: Kenesei, Z. & Kolos, K. (2007). Szolgáltatásmarketing és –menedzsment. Alinea Kiadó, Budapest. p. 140.
Rekettye, G. (1997). Az árak és a fogyasztói magatartás [Prices and consumer behaviour – In Hungarian]. Marketing & Management, 31(4), 25-26.
Rekettye, G. (2004). Az érték a marketingben [Value in marketing – In Hungarian]. Marketing & Management, 38 (2), 6-17.
Rekettye, G. (2008). Kisvállalati marketing [Marketing for SME-s – In Hungarian]. Akadémiai Kiadó, Budapest. pp. 24-25.
Sajtos, L., & Mitev, A. (2007). SPSS Kutatási és adatelemzési kézikönyv [SPSS Research and data analysis handbook – In Hungarian]. Alinea Kiadó, Budapest.
Tomcsányi, P. (1994). Piaci áruelemzés és marketing termék-stratégia [Market commodity analysis and marketing product strategy – In Hungarian]. Országos Mezőgazdasági minősítő Intézet, Budapest. p. 181-184. in Veres Z. (2009). A szolgáltatásmarketing alapkönyve. Akadémiai Kiadó Zrt., Budapest. p. 94.
Veres, Z. (2009). A szolgáltatásmarketing alapkönyve [The basic book of service marketing – In Hungarian]. Akadémiai Kiadó Zrt., Budapest. p. 33-94, 338-384.
Webster, C. (1991). Influences Upon Consumer Expectations of Services. The Journal of Services Marketing, 5 (1) Winter, 5-17. in Kenesei, Z. & Kolos, K. (2007). Szolgáltatásmarketing és –menedzsment. Alinea Kiadó, Budapest. p. 136.
Zeithaml, V., & Bitner, M. J. (1996). Services Marketing. McGraw-Hill, Maidenhead.

DETUROPE – THE CENTRAL EUROPEAN JOURNAL OF REGIONAL DEVELOPMENT AND TOURISM
Vol. 10 Issue 2 2018 ISSN 1821-2506
147
EFFICIENCY OF PRODUCTION FACTORS IN THE EU
Martina NOVOTNÁa, Tomáš VOLEKa
a Faculty of Economics, University of South Bohemia, Studentská 13, České Budějovice 370 05, Czech Republic, E-mail: [email protected], [email protected]
Cite this article: Novotná, M., Volek, T. (2018). Efficiency of Production Factors in the EU. Deturope, 10(2), 147-168
Abstract
The aim of the article is to consider, on the basis of indicators of effectiveness of production factors, the development of particular member states of the EU in the period 1996-2015 and relations between them in connection with the real business cycle in the EU and different starting positions (groups according to GVA per worker). The hypothesis that the development of labour productivity in the established groups of countries and at the intervals of the real economic cycle differs statistically significantly was verified based on the ANOVA test. The analysis illustrated different development and reaction of indicators of productivity in the monitored groups of the EU countries to the cyclic development of economies. It has been confirmed that the states with worse starting conditions have greater growth intensity in productivity and the business cycle does not interfere with the efficiency of production factors to any real extent.
Keywords: factor of production, productivity, European Union, business cycle
INTRODUCTION
The main trend in contemporary economies in Europe is to focus on dynamic growth, and the
cornerstone of dynamic growth is the increasing effectiveness of using the factors of
production, i.e. productivity growth. The development of the economies of individual EU
countries is not identical and, therefore, it can be assumed that the productivity dynamics in
particular states will develop differently as well. Cyclic development of an economy is an
important factor influencing the productivity dynamics in particular EU states. Among other
factors, the initial condition (initial level of output) of an economy can influence the actual
productivity of the unit of input. Consequently, the question is how the development of
productivities in particular economies is influenced by the business cycle and whether these
cyclic differences in the economies influence the linkages between particular productivity
indicators.
The basis for measuring country-level productivity and performance is Solow’s production
model. If Q represents output and K and L represent capital and labour inputs in "physical"
units, then the aggregate production function can be written as: Q = F (K, L; t). The variable

Novotná, M., Volek, T.
148
“t” for time appears in F to allow for technical change (Solow 1957). Other authors as Barro
and Sala-i-Martin (2004), Fried, Lovell, Schmidt, and Yaisawarng (2002), Färe, Grosskopf,
Norris, and Zhang (1994) or Chen and Inklaar (2016) have continued Solow’s fundamental
work. Into the basic equation of production function Chen and Inklaar (2016) today, add the
variable “R” which represents R & D capital (research and development). Modern growth
theory builds on this neoclassical model of exogenous growth, which views the accumulation
of physical capital, associated with a permanent flow of technical progress (Bhattacharjee, de
Castro, & Jensen-Butler, 2009) as the driver of economic growth and productivity. Economic
performance (Q) of countries to measure productivity can be expressed in economic reality in
different ways. Most often, we use measures of total economic output, income or expenditure,
such as Gross Value Added (GVA) at the regional level (Cuadrado-Roura, Mancha-Navarro,
& Garrido-Yserte, 2000) or Gross Domestic Product (GDP) at the national level (Harper,
Moulton, Rosenthal, & Wasshausen, 2009). These measures are good indicators of overall
economic activity and productivity. Productivity is generally the ratio of output to input
(Coelli, 2005). There are many different productivity measures, and the choice between them
depends on the purpose of productivity measurement, and, in many instances, on the
availability of data. The simplest and the most frequently applied measure is labour
productivity. Labour productivity is defined as gross value added (or gross output) per worker
and per worker-hour (O´Mahony, Rincon-Aznar, & Robinson, 2010). The size and dynamics
of labour productivity in the regions is one of the indicators of regional competitiveness. The
capital productivity index shows the time profile of how productively capital is used to
generate value added. The importance of all factors of production is summarised in the
indicator of total factor productivity (TFP). TFP is the empirical indicator of the effect of
technical change on productivity (Praag & Versloot, 2008). We can find common
relationships among productivity indicators. The total factor productivity determines labour
productivity, not only directly, but also indirectly, by determining capital per worker
(Prescott, 1998).
Differences in productivity can be identified between countries (Färe et al. 1994), regions
(Le Gallo & Dall’erba, 2008, Lengyel & Szakálné Kanó, 2014), sectors (Gobel & Zwick,
2012) or firms (Korcsmáros & Mura, 2017). Productivity is influenced by many factors. One
of these factors is the economic cycle. Productivity is influenced by the business cycle and
productivity affects the business cycle. First, consider how business cycles affect productivity.
Mayer, Ruth, and Scharler (2016) show that productivity increases in response to adverse
supply, demand, and wage mark-up shocks. Productivity fluctuates endogenously over the

Novotná, M., Volek, T.
149
business cycle. Saintpaul (1993) shows that demand shocks tend to have a negative impact on
productivity, both in the short and long run. An alternative approach between productivity
and business cycle shows that productivity shocks play a central role in real business cycles as
an exogenous impulse to macroeconomic activity. (Evans 1992). In the standard model of real
business cycles (Kydland & Prescott, 1982), productivity is taken as an endogenous
component (Rebelo, 2005) and productivity shocks play a central role as an exogenous
impulse to macroeconomic activity (Evans 1992). We have two types of structural shocks: (1)
technological shocks, that is, changes in the technological progress which affects productivity
in the long-run, and (2) non-technological shocks, that is, all the other shocks that affect
productivity temporarily through their effects on capital accumulation and aggregate demand
(Travaglini, 2012), such as an economic crisis. Positive productivity shocks have a significant
short-run negative impact on employment (Smets & Wouters, 2007) and the reaction of
countries through economic performance and productivity are not the same (Suchy, Kolosta,
& Koziak, 2015). Correlations between employment and productivity are negative for
technology shocks, positive for non-technology shocks (Gali, 1999).
The effect on productivity growth in the diversity across countries shows that national
systems of innovation have a strong influence on the way technology push and demand pull
effects increase productivity. Within European countries, in the same way as in sectors, either
the technological competitiveness, or the cost competitiveness model prevails as a key
mechanism for productivity growth. This result points out the importance of the patterns of
national specialization in innovation, alongside those in export, production and technology,
and opens up an additional direction for research addressing the specificity of technological
strategies and their links with specialization and performance (Crespi & Pianta, 2008).
Country variability may well be the outcome of differences in terms of the institutional setting
in which firms operate (Sala & Silva 2013).
The link between business cycle and productivity growth is different across countries.
Costello (1993) found that aggregate output growth and productivity growth are positively
correlated in the US, Germany and Japan. On the other hand, the analysis by O´Mahony &
Van Ark (2003) showed no significant effect on the productivity growth measures due to the
business cycle in the US and the EU. The key factor affecting productivity is the starting
position (initial level) of productivity. Sustainable economic growth and development in the
European Union is influenced by the starting position of old or new EU member states
(Ciegis, Jurgaityte, Rakickas, & Kareivaite, 2008; Konig, 2015) and by the heterogeneity of
the entrepreneurial processes across countries (Pušnik & Tajnikar 2010). As already

Novotná, M., Volek, T.
150
mentioned before, the development of economic efficiency indicators is influenced by the
business cycle. In the case of human labour, the efficiency indicators are labour productivity
and labour cost. Rising labour costs do not necessarily lead to higher labour productivity, but
to weaker competitiveness and lower economic growth. We can find a significant relationship
between the business cycle and labour cost or minimum wage (Sabia, 2014). The reaction of
countries is not identical. Mesina, Strozzi, and Turunen (2009) define three types of countries:
countries with mainly pro-cyclical real wages, countries with mainly counter-cyclical real
wages and the rest of the world with very different patterns of cyclicality. This paper will
show relationships between particular productivity indicators in the context of the business
cycle. The main contribution of this paper is that we establish the value of economic normalcy
of productivity indicators, by describing the pattern of indicator values during the business
cycle.
OBJECTIVES AND METHODS
The main aim of the article is to consider, on the basis of selected indicators of efficiency of
production factors, the development processes of particular member states of the EU in the
period 1996-2015, and differences and similarities between them in connection with the real
business cycle of the EU and to their different initial positions. The analysis of relations
between relevant indicators can be labelled as a trend analysis.
The relationship between indexes of selected indicators is useful to express through the
inequalities. The changes in economic activity can be measured by the variations in the
growth rates of the firm’s performance. The research question was if it is possible to establish
the economic normal of economic activity on the aggregate level of the national economy.
The authors define the term “Economic normal1” as a system of inequations that determines
the positive development of the national economy. The research question was if it is possible
to create the economic normal at the national economy level. The authors took into account
the business cycle and the initial level of output as the main factors that can significantly
affect the normal course of the national economy. Verification of economic standards
monitors the trends of indicators in the various phases of the real business cycle, depending
1 Hoffman (1992) defined “Economic normal” as a system of inequations which assess if the development of economic indicators is positive for enterprises (in the context of indicators´ relationships). Application of economic normal is based on the knowledge of index analysis. A respective index represents evolution of the respective item in time (negative or positive change) and so economic normals give a recommendation of what values of particular economic indicators are expected to enable a company or an economy to reach their goals.

Novotná, M., Volek, T.
151
on the initial position of individual countries that can influence both the intensity of the trend
and its direction.
The period 1996-2015 has been chosen for analysis, i.e. 20 years, in the knowledge that
several states had not been members of the EU at the beginning of this period. First, it is
necessary to classify the current EU-member countries according to their economic position
in the first year of monitoring (1996). . As a tool, the following ratio of labour productivity
has been used:
,
(1)
where: 1996,iGVA is gross value added in PPS for EU country “i” in 1996, (purchasing
power standard - PPS), i = 1, …, 28.
1996,iL is total employment, - domestic concept, of EU country “i” in 1996, i = 1, …,
28.
1996GVA is total aggregate gross value added for the whole EU (all the 28 countries)
in 1996,
1996L is total employment - domestic concept for the whole EU (all the 28 countries)
in 1996.
The next step of the analysis was the consideration of the dynamics of the GVA index for
the whole of the EU (i.e. all the 28 countries) in the period 1996-2015 to enable the
construction of intervals corresponding to particular stages of the real business cycle.
The purpose of the above-mentioned steps was to create groups of countries according to
their initial position, and also to monitor the dynamics of selected indicators characterizing
the effectiveness of factors of production in the various intervals of the real business cycle
defined for the whole of the EU. Analysis of variance (ANOVA) is a collection of statistical
models used to analyse the differences among group means and to identify associated
measures of variation (such as variation among and between groups), and ANOVA methods
can be used to assess the importance of one or more factors, by comparing the response
variable means at different factor levels. The null hypothesis states that all population means
(factor level means) are equal while, the alternative hypothesis states, that at least one of these
means is different from the others.
1996
1996
1996,
1996,
L
GVA
L
GVA
i
i

Novotná, M., Volek, T.
152
In the current analysis the ANOVA test was used to explore the influence of two factors on
the variance in labour productivity growth rates, by a model without interaction. The ANOVA
model for two factors without interaction may be represented by the linear statistical model,
as:
, (2)
k = 1, 2, …,K; i = 1, 2, ..,r,
where yki is level of labour productivity group of countries kth according to initial position
and ith the stage of the real business cycle,
k = 1… 4 are groups of countries according to initial level of Gross value added per
worker in basic year,
i = 1… 6 are the stages of the real business cycle.
For a detailed description of ANOVA see for example (Hebák, 2007), (Montgomery &
Runger, 2007).
The following indicators have been chosen: labour productivity, LP (i.e. gross value added
(GVA)/ total employment-domestic concept(L)), capital productivity, CP (gross value added
(GVA) / gross fixed capital formation (C)), capital-labour ratio, CLR (gross fixed capital
formation (C) / total employment domestic concept (L)), real unit labour costs, RULC
(compensation of employees (CE) /gross value added (Y)), aggregate productivity of factors
of production. Considering two factors of production: labour (L), capital (C), we can compute
the aggregate productivity of factors of production TFP =01
AA :
(3)
where Y1/Y0 is the index of real product (of GVA in prices PPS),
01CC is the index of real gross stock of long-term property (index of creation of gross
fixed capital formation),
01LL is the index of either the number of hours worked, or average number of
employees,
Lt
α is the arithmetical mean of the ratio of the compensation of employees in GVA,
in the base and current periods,
Ct is the arithmetical mean of the gross operating surplus in GVA, in the base and
current periods, thus it applies that 1CtLt
.
kiikkiy
LtCt
L
L
C
C
Y
Y
A
A
0
1
0
1
0
1
0
1..

Novotná, M., Volek, T.
153
The index of productivity of the factors of production (TFP = Total Factor Productivity
01AA ) illustrates technological benefits for economic development.
All mentioned indicators were determined as real values measured in PPS, i.e. through the
purchasing power parity of currency, as is recommended for international comparisons.
This evaluation deals only with the price relations of goods in various states, irrespective
of the impact of supply and demand for the actual currencies (Jílek, 2005).
The calculation of average annual indices, i.e. average growth rates of monitored
productivities at partial time intervals, was carried out by the geometric mean:
(4)
Where: k is average growth rate, or, as the case may be, average growth coefficient
n
kk ....
1 are chain indices of indicators,
n
uu ....
0 are values of particular indicators.
Another aim is to consider the proportional growth rates of gross fixed capital formation
(C), the number of employed people (L) and the volume of output (Y), i.e., GVA. Desirable
relationships between these indicators can be derived logically: CECYIII where IY is the
growth rate of Y (GVA), IC is the growth rate of C (gross fixed capital formation) and ICE is
the growth rate of CE (compensation of employees).
The relation between output Y and gross fixed capital formation C can be marked by the
capital productivity (CP) and expressed by the ratio:
C
Y
CP
I
I
C
C
Y
Y
C
Y
C
Y
IC
YCP
0
1
0
1
0
0
1
1
(5)
If you divide Y and C on the right side of the equation by the average number of workers,
(L) (total employment-domestic concept), capital productivity can be expressed as:
(6)
where
C
Yis the capital productivity, CP,
L
C
L
Y
C
Y
,............
011
2
0
1
21n
n
n
n
nn
n
u
u
u
u
u
u
u
ukkkk

Novotná, M., Volek, T.
154
L
Y is the labour productivity, LP and
L
C is the capital stock per worker, the level of technical equipment that labour can work
with (capital-labour ratio, CLR).
Formula (5) clearly shows that capital productivity can be expressed as a ratio of labour
productivity and capital-labour ratio. The same relations apply to the indices, i.e. growth rates
as well (multiplicative model)
(7)
When the capital productivity index equals 1 , then it is apparent from relation (5) that the
GVA index rises as quickly as the index of gross fixed capital formation; the capital
productivity remains the same and it can be called extensive development.
If the capital productivity index is higher than 1, then gross fixed capital formation
compared to GVA rises less than proportionally, which results in a relative saving in material
fixed capital and further related savings (Střeleček & Lososová, 2003). Thus capital
productivity will increase if the growth rate of economic output (Y) is higher than the growth
rate of capital (C), i.e. increasing the capital-labour ratio will result in higher labour
productivity (from relation 7).
If the capital productivity index is lower than 1, then GVA rises more slowly than gross
fixed capital formation, i.e. relative excess of gross fixed capital occurs.
For instance, if the capital-labour ratio increases, i. e. fixed assets per labour unit increases
and labour productivity remains stable (capital rises more quickly than economic output Y), a
decrease in capital productivity will occur. This may happen in the case when capital having
limited productive ability rises, so that economic output, e.g. investments into infrastructure
etc. could rise at the same speed or more quickly. The dynamics of capital productivity can be
further assessed using different dynamics of labour productivity, resulting in various
qualitative trends of development with different consequences, which will be dependent on
the real business cycle.
RESULTS
The individual steps of the analysis are based on the primary distribution of the 28 EU-
countries to groups (see the methodology). Figure 1 shows GVA per worker (domestic
L
C
L
Y
C
Y
I
I
I
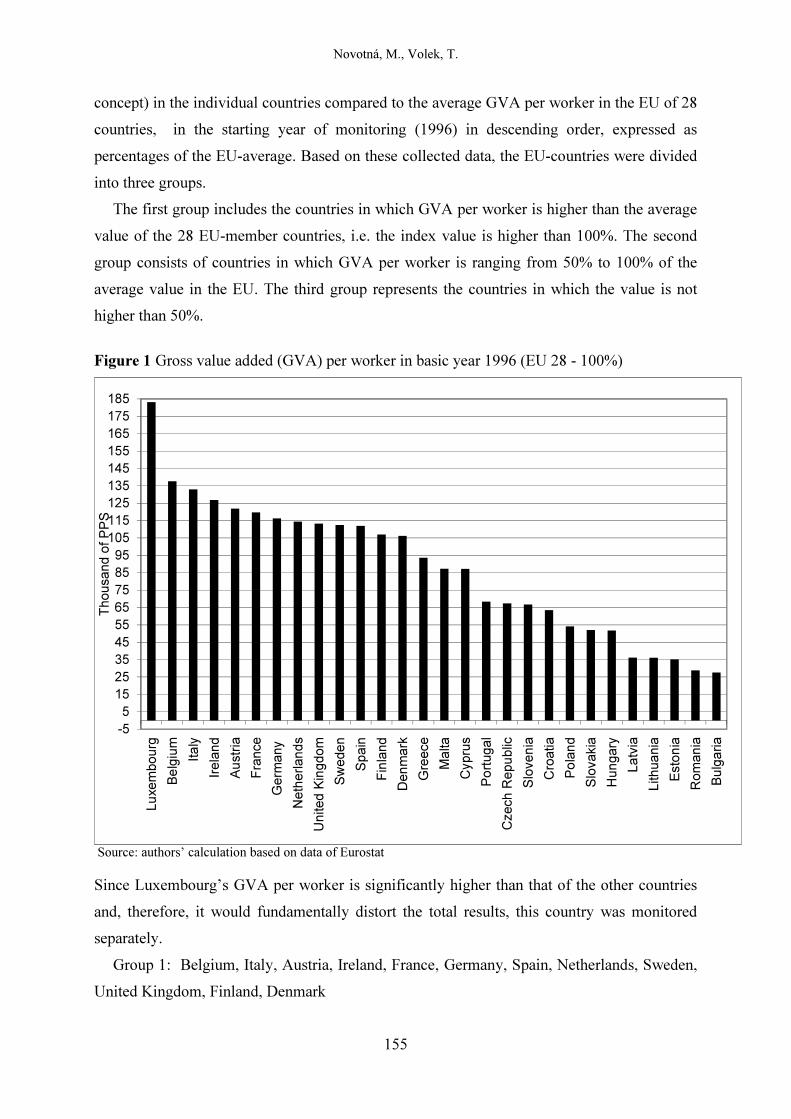
Novotná, M., Volek, T.
155
concept) in the individual countries compared to the average GVA per worker in the EU of 28
countries, in the starting year of monitoring (1996) in descending order, expressed as
percentages of the EU-average. Based on these collected data, the EU-countries were divided
into three groups.
The first group includes the countries in which GVA per worker is higher than the average
value of the 28 EU-member countries, i.e. the index value is higher than 100%. The second
group consists of countries in which GVA per worker is ranging from 50% to 100% of the
average value in the EU. The third group represents the countries in which the value is not
higher than 50%.
Figure 1 Gross value added (GVA) per worker in basic year 1996 (EU 28 - 100%)
Source: authors’ calculation based on data of Eurostat
Since Luxembourg’s GVA per worker is significantly higher than that of the other countries
and, therefore, it would fundamentally distort the total results, this country was monitored
separately.
Group 1: Belgium, Italy, Austria, Ireland, France, Germany, Spain, Netherlands, Sweden,
United Kingdom, Finland, Denmark
-5
5
15
25
35
45
55
65
75
85
95
105
115
125
135
145
155
165
175
185
Lu
xem
bourg
Be
lgiu
m
Ita
ly
Irela
nd
Au
str
ia
Fra
nce
Germ
any
Neth
erl
an
ds
United K
ingdom
Sw
eden
Sp
ain
Fin
land
Den
mark
Gre
ece
Ma
lta
Cypru
s
Po
rtugal
Czech
Repu
blic
Slo
venia
Cro
atia
Po
lan
d
Slo
vakia
Hun
gary
La
tvia
Lithua
nia
Esto
nia
Rom
ania
Bu
lga
ria
Thousand o
f P
PS

Novotná, M., Volek, T.
156
Group 2: Malta, Greece, Cyprus, Portugal, Slovenia, Czech Republic, Slovakia, Hungary,
Croatia, Poland
Group 3: Latvia, Estonia, Lithuania, Bulgaria, Romania.
The next step was the construction of the intervals that define the stages of the real
business cycle (Figure 2). The stages were inferred from the annual development (growth) of
GVA in the whole of the EU in PPS. Adamowiczh & Walcyk, (2011) show in their paper, that
one can observe progressive synchronization of cyclical fluctuations in the ‘new’ and ‘old’
EU member states, particularly evident in the timing of turning points and duration of the
recent recession. Dissimilarities were noted in the values of the turning points that resulted in
disparity in the amplitude and intensity of cyclical changes. These were higher in the ‘new’
EU countries, especially in the Baltic, states than in the EU15. Since the EU enlargement, the
‘new’ EU economies boomed with rates of cyclical growth of the gross value added and
manufacturing production (the latter to a lesser degree), much above the EU15 averages.
Figure 2 Growth rate of GVA in the European Union (28 countries)
Source: Source: authors’ calculation based on data of Eurostat
Source: Own calculations based on the data of Eurostat
Looking at the development of GVA for the whole of the EU (28 countries), it is possible to
identify the intervals by which we can cut up the 20-year period (1996 – 2015) into six
periods:
- Period 1: 1996 – 2000 is characterized by stable or slightly rising annual GVA
increases,
0,94
0,96
0,98
1
1,02
1,04
1,06
1,08
1,1
1997 1998 1999 2000 2001 2002 2003 2004 2005 2006 2007 2008 2009 2010 2011 2012 2013 2014 2015

Novotná, M., Volek, T.
157
- Period 2: 2000 – 2003 is characterized by decreasing GVA growth rates (,
- Period 3: 2003 – 2007 indicates the trend of repeatedly increasing GVA growth rates,
- Period 4: 2007 – 2009 can be described as a period of sharply decreasing GVA growth
rates, with, in 2009, the GVA growth rate reaching a negative value, i.e. the growth
rate in this year was lower than 1,
- Period 5: 2009 – 2013. The annual growth rates did not fall below 1 but still growth
rates were decreasing in this period.
- Period 6: 2013 – 2015 increasing increments of GVA.
To illustrate different performance levels of the three country groups not only the level of
labour productivity, but also the annual labour productivity growth rates are presented in
Table 1 and Figure 3. As is shown in Table 1 the level of labour productivity differs in the
three country groups.
Table 1 Average annual labour productivity per each period in thousands of PPS per employment
GEO/TIME 1996-2000 2000-2003 2003-2007 2007-2009 2009-2013 2013-2015
EU (28 countries) 36.91 42.90 48.05 49.75 52.71 56.41
Group 1 43.28 48.88 53.83 55.15 57.75 61.47
Group 2 25.52 29.01 34.00 36.30 39.62 42.53
Group 3 10.35 13.95 19.60 24.37 27.93 31.73
Luxembourg 69.92 81.61 82.53 86.32 96.33 Source: Own calculations based on the data of Eurostat
According to the expectations, the first group is above the average of the EU (of 28
countries). This group includes mainly the “old” member states, which have the most
influence on the level of the EU-average. The second group of states reaches approximately
68%-75% of the labour productivity level of the EU-average in each period, and the third
group varies between 28% and 53% of the EU-average. Luxembourg, which was assessed
separately, significantly exceeds the average labour productivity of the EU (of 28 countries):
the index varies in the periods around 165% the EU-average. The dynamics (Figure 3) differs
from the indicator levels. The average growth rate of labour productivity in the third group of
countries exceeds significantly both the average of the EU and of the first group of countries.
The dynamics of labour productivity in the second group of countries is slightly above the
average growth rate of labour productivity in the EU.

Novotná, M., Volek, T.
158
Figure 3 Average growth rate of labour productivity
Source: Own calculations based on the data of Eurostat
Regarding capital productivity in its absolute terms (Table 2), there are no such apparent
differences as for labour productivity (Figure 3). The values of this indicator, in the first group
of countries, are, again, as expected, approximately the same as of the EU average (of 28
states). The major differences between the second and third group are not obvious, and
during the first two periods of the cycle, the third group of countries even exceeds the second
one. This can be the result of the ongoing restructuring of the economy, occurring mainly in
the second group, where higher investments into fixed capital result in a lower level of the
capital productivity. The third group of countries are lagging according to the level of capital
productivity in the last observed periods. During the period of growth, this is reflected in
lower levels of capital productivity.
Table 2 Average annual capital productivity per each interval GEO/TIME 1996-2000 2000-2003 2003-2007 2007-2009 2009-2013 2013-2015
EU (28 countries) 4.22 4.26 4.14 4.19 4.52 4.60
Group 1 4.27 4.28 4.16 4.26 4.54 4.62
Group 2 3.44 3.80 3.84 3.85 4.47 4.56
Group 3 4.69 4.11 3.31 3.07 3.70 3.82
Luxembourg 4.07 4.50 4.51 4.75 4.94 Source: Own calculations based on the data of Eurostat
0,95
1
1,05
1,1
1997-2000 2001-2003 2004-2007 2008-2009 2010-2013 2014-2015
Group 1 Group 2 Group 3 European Union (28 countries)

Novotná, M., Volek, T.
159
The average growth rates of capital productivity are recorded in Figure 4. Figure 4 shows
significant fluctuations in the growth rate of capital productivity (especially for the third
group of countries). There is an obvious impact of the real business cycle. The pace of growth
in capital productivity is converging between the country groups in the period 2013-2015 (due
to an overall growth of all the countries). Comparing Figures 3 and 4, an opposite (mirror)
development can be inferred, which follows from the described relations between the
respective indicators, as shown in the methodology.
Figure 4 Average growth rate of capital productivity
Source: Own calculations based on the data of Eurostat
The statistical method ANOVA was used to verify the above grouping of the countries,
according to the initial level of the labour productivity and to the defined time periods of the
real business cycle.
The ANOVA test showed statistically significant difference in labour productivity
dynamics in the individual phases of the real business cycle (Figure 5). Proven was also a
statistically significant difference in the dynamics of labour productivity among the three
different groups of countries, according to the initial level of the indicator (Figure 6).
0,9
0,95
1
1,05
1,1
1,15
1997-2000 2001-2003 2004-2007 2008-2009 2010-2013 2014-2015
Group 1 Group 2 Group 3 European Union (28 countries)

Novotná, M., Volek, T.
160
Figure 5 Labour productivity growth rate in the periods of the real business cycle decomposed using ANOVA
Current effect: F(5, 509)=36,013, p=0,0000
Vertical columns indicate a 95% confidence interval
1996-2000 2000-2003 2003-2007 2007-2009 2009-2013 2013-2015
The periods of the real business cycle
0,96
0,97
0,98
0,99
1,00
1,01
1,02
1,03
1,04
1,05
1,06
1,07
1,08
labour
pro
duct
ivit
y g
row
th
Source: Own calculations based on the data of Eurostat
Figure 6 Labour productivity growth rates in the groups of countries decomposed using ANOVA
Vertical columns indicate a 95 % confidence interval
Current effect: F(3, 509)=27,652, p=,00000
Luxembourg Group 1 Group 2 Group 3
The groups of countries
0,99
1,00
1,01
1,02
1,03
1,04
1,05
1,06
1,07
1,08
lab
ou
r p
rod
uctivity g
row
th
Source: Own calculations based on the data of Eurostat
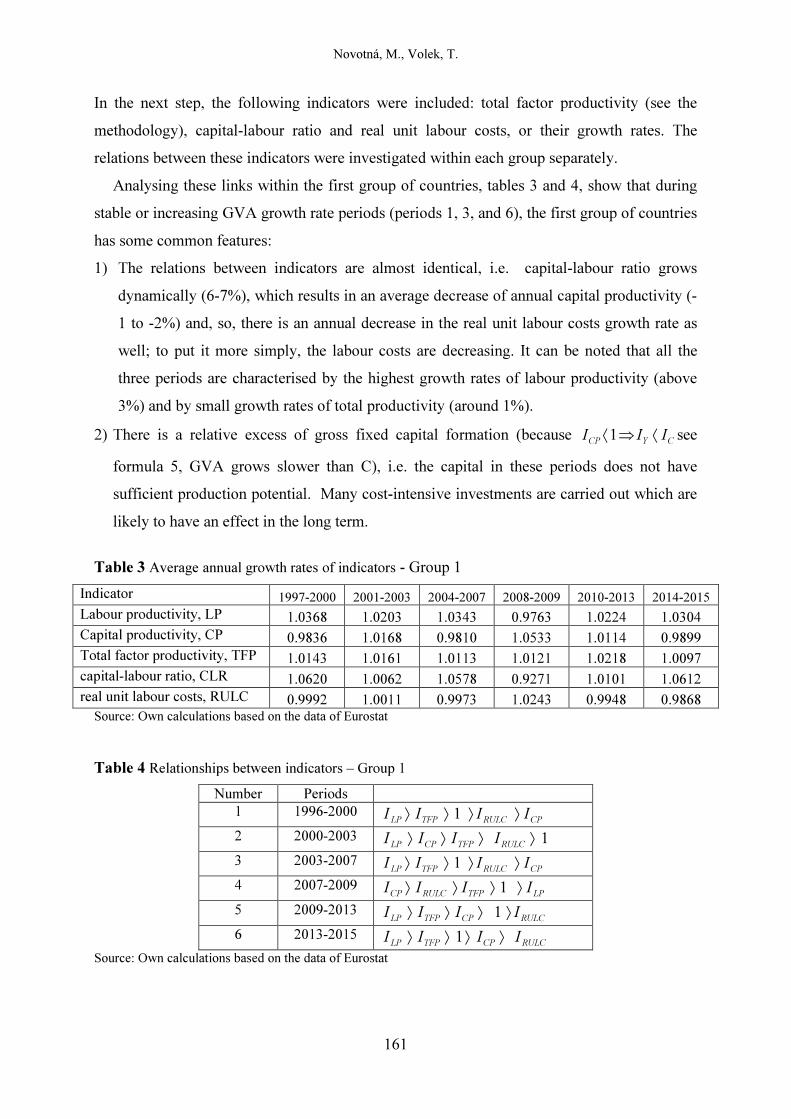
Novotná, M., Volek, T.
161
In the next step, the following indicators were included: total factor productivity (see the
methodology), capital-labour ratio and real unit labour costs, or their growth rates. The
relations between these indicators were investigated within each group separately.
Analysing these links within the first group of countries, tables 3 and 4, show that during
stable or increasing GVA growth rate periods (periods 1, 3, and 6), the first group of countries
has some common features:
1) The relations between indicators are almost identical, i.e. capital-labour ratio grows
dynamically (6-7%), which results in an average decrease of annual capital productivity (-
1 to -2%) and, so, there is an annual decrease in the real unit labour costs growth rate as
well; to put it more simply, the labour costs are decreasing. It can be noted that all the
three periods are characterised by the highest growth rates of labour productivity (above
3%) and by small growth rates of total productivity (around 1%).
2) There is a relative excess of gross fixed capital formation (because CYCPIII 1 see
formula 5, GVA grows slower than C), i.e. the capital in these periods does not have
sufficient production potential. Many cost-intensive investments are carried out which are
likely to have an effect in the long term.
Table 3 Average annual growth rates of indicators - Group 1
Indicator 1997-2000 2001-2003 2004-2007 2008-2009 2010-2013 2014-2015 Labour productivity, LP 1.0368 1.0203 1.0343 0.9763 1.0224 1.0304 Capital productivity, CP 0.9836 1.0168 0.9810 1.0533 1.0114 0.9899 Total factor productivity, TFP 1.0143 1.0161 1.0113 1.0121 1.0218 1.0097 capital-labour ratio, CLR 1.0620 1.0062 1.0578 0.9271 1.0101 1.0612 real unit labour costs, RULC 0.9992 1.0011 0.9973 1.0243 0.9948 0.9868
Source: Own calculations based on the data of Eurostat
Table 4 Relationships between indicators – Group 1
Number Periods
1 1996-2000 CPRULCTFPLPIIII 1
2 2000-2003 1RULCTFPCPLPIIII
3 2003-2007 CPRULCTFPLPIIII 1
4 2007-2009
LPTFPRULCCPIIII 1
5 2009-2013 RULCCPTFPLPIIII 1
6 2013-2015 RULCCPTFPLPIIII 1
Source: Own calculations based on the data of Eurostat

Novotná, M., Volek, T.
162
The period of decreasing GVA growth rates for the first group of countries (periods 2 and 4
and 5) can be described by these facts:
In these periods, the two highest annual growth rates of capital productivity can be noted,
which is obviously induced by considerable investments in the previous periods (especially in
period 4 GVA decreases slower than investment (GVA – decline to 2.8%; C – decline to
7.7%). Probably for this reason, total productivity is still slightly growing. However, labour
productivity lags behind and, in period 4 on average, the labour productivity growth rate is
declining annually, due to the crisis in 2009.
In Tables 5 and 6, the same indicators are monitored for the second group of countries,
including the Czech Republic, and the relations between them.
Table 5 Average annual growth rates of indicators - Group 2
Indicator 1997-2000 2001-2003 2004-2007 2008-2009 2010-2013 2014-2015 Labour productivity, LP 1.0248 1.0523 1.0448 1.0002 1.0330 1.0250 Capital productivity, CP 0.8958 1.0403 0.9759 1.0413 1.0222 0.9667 Total factor productivity, TFP 1.0268 1.0295 1.0126 1.0269 1.0403 0.9950 capital-labour ratio, CLR 1.0620 1.0321 1.0689 0.9366 0.9746 1.0599 real unit labour costs, RULC 0.9968 1.0027 0.9969 1.0161 0.9939 0.9937 Source: Own calculations based on the data of Eurostat
Table 6 Relationships between indicators – Group 2
Number Periods
1 1996-2000 CPRULCLPTFPIIII 1
2 2000-2003 1RULCTFPCPLPIIII
3 2003-2007
CPRULCTFPLPIIII 1
4 2007-2009 1LPRULCTFPCPIIII
5 2009-2013 RULCCPLPTFPIIII 1
6 2013-2015 CPRULCTFPLPIIII 1
Source: Own calculations based on the data of Eurostat
Some differences appear in the second group of countries, i.e. countries for which lower
labour productivity was reported in 1996, which can be due to the fact, that most of these
national economies are linked up with the economies of the first group of countries.
Therefore, they undergo the same stages of the real business cycle with some delay and often
with lower intensity. It is obvious that:
1) The average rate of labour productivity grows in all periods (in period 4, when a
worldwide decline was reported, the annual rate shows no change). The growth rate of
labour productivity in the 2nd and 3rd periods exceeds the growth rate of total productivity
and capital productivity, even with the constant growth of capital-labour ratio.
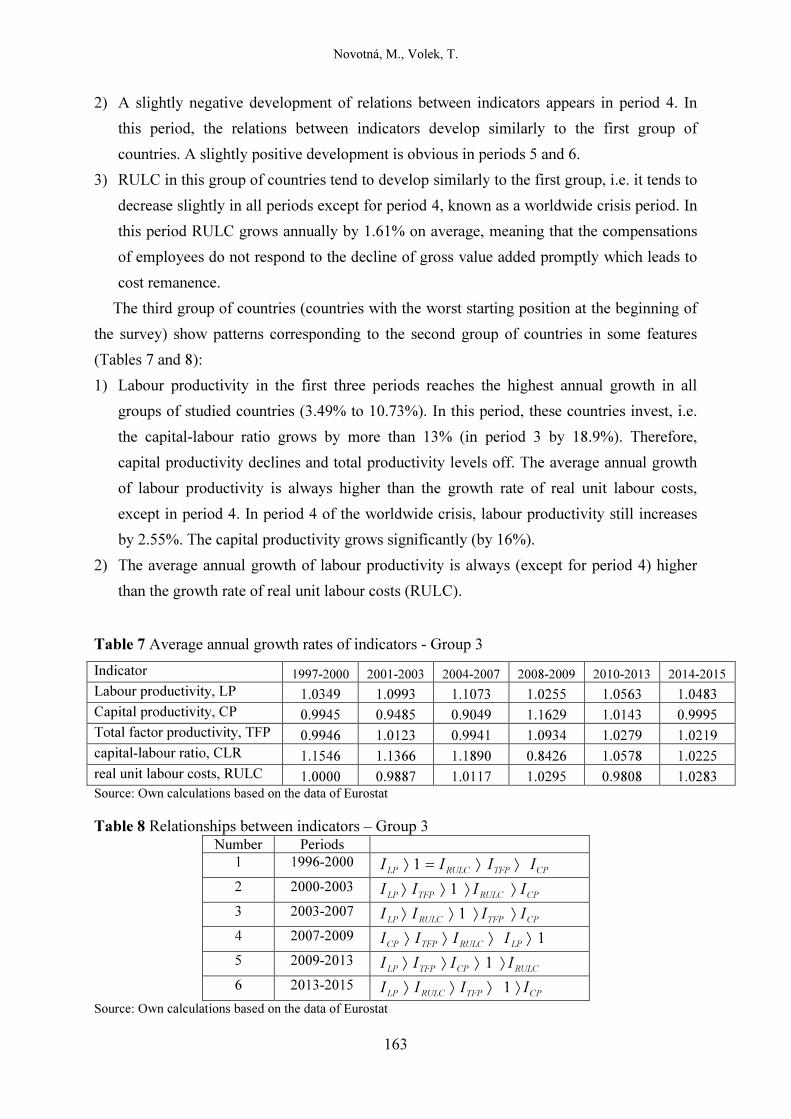
Novotná, M., Volek, T.
163
2) A slightly negative development of relations between indicators appears in period 4. In
this period, the relations between indicators develop similarly to the first group of
countries. A slightly positive development is obvious in periods 5 and 6.
3) RULC in this group of countries tend to develop similarly to the first group, i.e. it tends to
decrease slightly in all periods except for period 4, known as a worldwide crisis period. In
this period RULC grows annually by 1.61% on average, meaning that the compensations
of employees do not respond to the decline of gross value added promptly which leads to
cost remanence.
The third group of countries (countries with the worst starting position at the beginning of
the survey) show patterns corresponding to the second group of countries in some features
(Tables 7 and 8):
1) Labour productivity in the first three periods reaches the highest annual growth in all
groups of studied countries (3.49% to 10.73%). In this period, these countries invest, i.e.
the capital-labour ratio grows by more than 13% (in period 3 by 18.9%). Therefore,
capital productivity declines and total productivity levels off. The average annual growth
of labour productivity is always higher than the growth rate of real unit labour costs,
except in period 4. In period 4 of the worldwide crisis, labour productivity still increases
by 2.55%. The capital productivity grows significantly (by 16%).
2) The average annual growth of labour productivity is always (except for period 4) higher
than the growth rate of real unit labour costs (RULC).
Table 7 Average annual growth rates of indicators - Group 3
Indicator 1997-2000 2001-2003 2004-2007 2008-2009 2010-2013 2014-2015 Labour productivity, LP 1.0349 1.0993 1.1073 1.0255 1.0563 1.0483 Capital productivity, CP 0.9945 0.9485 0.9049 1.1629 1.0143 0.9995 Total factor productivity, TFP 0.9946 1.0123 0.9941 1.0934 1.0279 1.0219 capital-labour ratio, CLR 1.1546 1.1366 1.1890 0.8426 1.0578 1.0225 real unit labour costs, RULC 1.0000 0.9887 1.0117 1.0295 0.9808 1.0283 Source: Own calculations based on the data of Eurostat
Table 8 Relationships between indicators – Group 3 Number Periods
1 1996-2000 CPTFPRULCLPIIII 1
2 2000-2003 CPRULCTFPLPIIII 1
3 2003-2007 CPTFPRULCLPIIII 1
4 2007-2009 1LPRULCTFPCPIIII
5 2009-2013 RULCCPTFPLPIIII 1
6 2013-2015 CPTFPRULCLPIIII 1
Source: Own calculations based on the data of Eurostat

Novotná, M., Volek, T.
164
The tables 9 and 10 illustrate the average growth rates of the monitored indicators and the relationships between them in the EU (EU 28). The inequality in the period 4 (global economics crisis) shows a high level of consensus with the inequalities of all three groups of countries. The differences can only be seen in the dynamics of the indicators (The group 1 is characterized by the highest decrease of indicators). In the post-crisis period (Period 5) is
obvious the increase of efficiency of production factors (both partial CPLPII , and total
TFPI ),
i.e. all productivity indices were greater than 1. The differences between groups of countries are in the position productivity indices in relevant inequality.
The periods of higher growth (the period 3 and 6) are characterized by a system of
inequalities CPRULCTFPLPIIII 1 (Table 10). This inequality exists for each group of
countries with minor differences, based on the level and dynamics of the indicators.
Table 9 Average annual growth rates of indicators – EU (28 countries)
Indicator 1997-2000 2001-2003 2004-2007 2008-2009 2010-2013 2014-2015 Labour productivity, LP 1,0429 1,0282 1,0378 0,9806 1,0262 1,0309 Capital productivity, CP 0,9876 1,0175 0,9798 1,0513 1,0145 0,9929 Total factor productivity, TFP 1,0165 1,0232 1,0098 1,0131 1,0207 1,0129 capital-labour ratio, CLR 1,0559 1,0105 1,0593 0,9327 1,0115 1,0383 real unit labour costs, RULC 1,0020 0,9983 0,9948 1,0177 0,9975 0,9964
Source: Own calculations based on the data of Eurostat
Table 10 Relationships between indicators – EU (28 countries)
Number Periods
1 1996-2000 CPRULCTFPLPIIII 11
2 2000-2003
RULCCPTFPLPIIII 1
3 2003-2007
CPRULCTFPLPIIII 1
4 2007-2009
LPTFPRULCCPIIII 1
5 2009-2013
RULCCPLPTFPIIII 1
6 2013-2015
CPRULCTFPLPIIII 1
Source: Own calculations based on the data of Eurostat
DISCUSSION AND CONCLUSION
The analysis demonstrates diverse development and response patterns of the productivity
indicators in the observed groups of the EU countries, to the real business cycle during the
years 1996-2015. In general, the starting positions of the states, as a standpoint for their
division into groups, will obviously determine the dynamics of the indicators. The hypothesis
that the development of labour productivity in the 3 established groups of countries, and at the
periods of the real business cycle differs statistically significantly, was verified based on a
two-factor ANOVA test.

Novotná, M., Volek, T.
165
The analysis of one-factor productivities shows that the rate of labour productivity grows in
the same periods when GVA grows, i.e., economic output measured by gross value added
grows faster than the amount of labour as a factor of production, measured by the number of
employees. It holds true in all the 3 groups of countries. A rather different situation is seen
regarding capital productivity. The dynamics of capital productivity decreases in the periods
when the growth of GVA is increasing in the EU on average. In some groups of countries, the
intensity of growth rate differs but the trends are the same. Hence, the growth rate of gross
fixed capital formation is higher than the growth rate of the output (gross value added). This
may be due to investments into capital with lower production capacity, and to time delay. In
the periods of decreasing growth rates of gross value added, the tendency and intensity of
one-factor productivity indicators (labour productivity, capital productivity) are inverse. This
situation is explained, among other things, by the relationship between individual indices, as
described in the methodology.
Focused on the various groups of countries, the first group (countries with the highest
initial GVA per worker, i.e. higher than 100% of the EU average) most exactly corresponds to
the annual average dynamics of the l EU as a whole. A strong relationship to the business
cycle is obvious in the dynamics of the indicators of capital-labour ratio, capital productivity
and labour productivity. The annual average growth of labour productivity exceeds the
dynamics of real unit labour costs except for the crisis years 2007-2009, and so it has an anti-
inflationary effect. On the contrary, the total factor productivity (TFP) keeps growing
constantly, regardless of the business cycle.
Some differences are obvious in the second group of countries, including the Czech
Republic and other states that accessed EU in 2007. In these countries, GVA per worker
ranged between 50 – 100% of the EU average in 1996. Many national economies in this group
are connected to the economies of the first group of countries, which can lead to some delay
or lower intensity while undergoing the business cycle. Regardless of the business cycle,
labour productivity and gross value added grow faster than capital productivity and the stable
capital stock per worker in the first three monitored periods, until most of these states joined
the EU. The output growth rate was higher than the input growth rate when capital, as a factor
of production, grew faster than labour. The last three studied periods (2007-2009, 2010-2013,
2013-2015) are characterised by a lower growth rate of gross fixed capital, which could lead
to growing capital productivity and total factor productivity (except for the period 2013-
2015). The growth was initiated by labour productivity in the first three periods, and, by the
following growth of capital productivity.
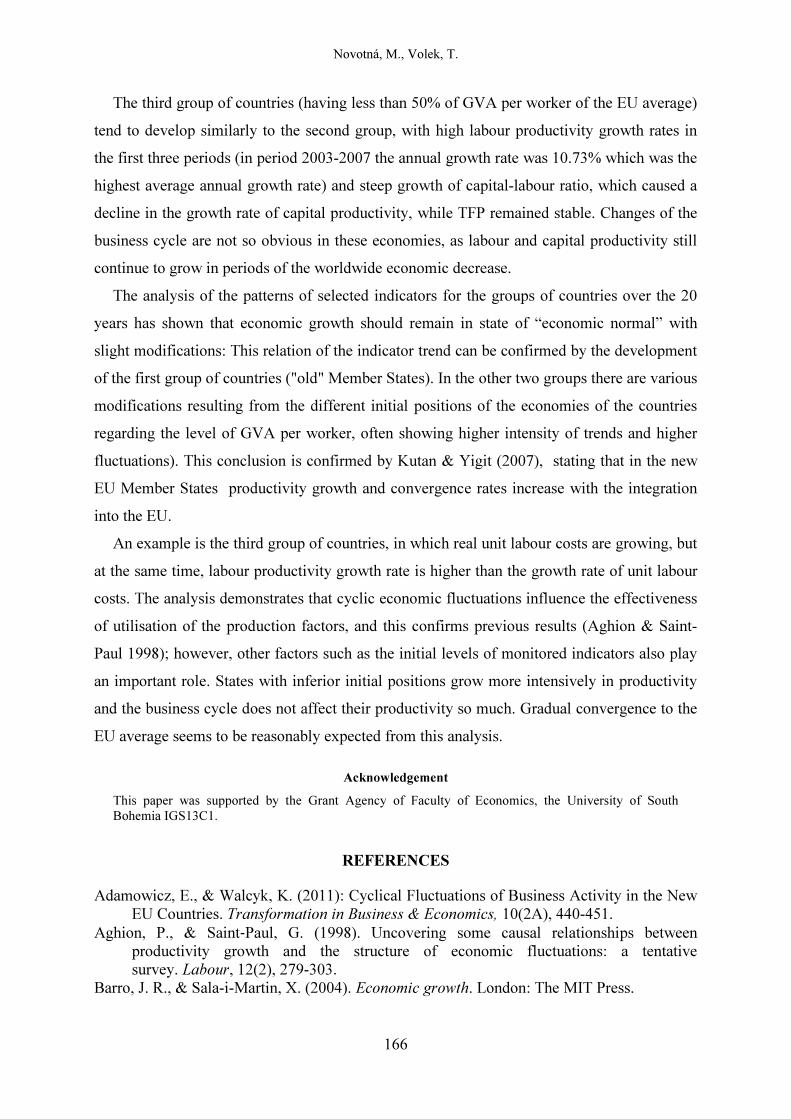
Novotná, M., Volek, T.
166
The third group of countries (having less than 50% of GVA per worker of the EU average)
tend to develop similarly to the second group, with high labour productivity growth rates in
the first three periods (in period 2003-2007 the annual growth rate was 10.73% which was the
highest average annual growth rate) and steep growth of capital-labour ratio, which caused a
decline in the growth rate of capital productivity, while TFP remained stable. Changes of the
business cycle are not so obvious in these economies, as labour and capital productivity still
continue to grow in periods of the worldwide economic decrease.
The analysis of the patterns of selected indicators for the groups of countries over the 20
years has shown that economic growth should remain in state of “economic normal” with
slight modifications: This relation of the indicator trend can be confirmed by the development
of the first group of countries ("old" Member States). In the other two groups there are various
modifications resulting from the different initial positions of the economies of the countries
regarding the level of GVA per worker, often showing higher intensity of trends and higher
fluctuations). This conclusion is confirmed by Kutan & Yigit (2007), stating that in the new
EU Member States productivity growth and convergence rates increase with the integration
into the EU.
An example is the third group of countries, in which real unit labour costs are growing, but
at the same time, labour productivity growth rate is higher than the growth rate of unit labour
costs. The analysis demonstrates that cyclic economic fluctuations influence the effectiveness
of utilisation of the production factors, and this confirms previous results (Aghion & Saint‐
Paul 1998); however, other factors such as the initial levels of monitored indicators also play
an important role. States with inferior initial positions grow more intensively in productivity
and the business cycle does not affect their productivity so much. Gradual convergence to the
EU average seems to be reasonably expected from this analysis.
Acknowledgement
This paper was supported by the Grant Agency of Faculty of Economics, the University of South Bohemia IGS13C1.
REFERENCES
Adamowicz, E., & Walcyk, K. (2011): Cyclical Fluctuations of Business Activity in the New EU Countries. Transformation in Business & Economics, 10(2A), 440-451.
Aghion, P., & Saint‐Paul, G. (1998). Uncovering some causal relationships between productivity growth and the structure of economic fluctuations: a tentative survey. Labour, 12(2), 279-303.
Barro, J. R., & Sala-i-Martin, X. (2004). Economic growth. London: The MIT Press.
Novotná, M., Volek, T.
167
Bhattacharjee, A., de Castro, E., & Jensen-Butler, C. (2009). Regional variation in productivity: a study of the Danish economy. Journal of productivity analysis, 31(3), 195–212.
Ciegis, R., Jurgaityte, R., Rakickas, A., & Kareivaite, R. (2008). The Analysis of Socio-Economic Progress and Future Perspectives in the New EU Members. Transformations in Business & Economics, 7(2), 34-54.
Costello, D. M. (1993). A cross-country, cross-industry comparison of productivity growth. Journal of Political Economy, 101(2), 207-222
Crespi, F., & Pianta, M. (2008). Diversity in innovation and productivity in Europe. Journal of Evolutionary Economics, 18(3), 529-545.
Chen, W., & Inklaar, R. (2016). Productivity spillovers of organization capital. Journal of Productivity Analysis, 45(3), 229-245.
Coelli, T. (2005). An Introduction to Efficiency and Productivity Analysis. New York: Springer.
Evans, C. L. (1992). Productivity shocks and real business cycles. Journal of Monetary Economics, 29(2), 191-208.
Cuadrado-Roura, J. R., Mancha-Navarro, T., & Garrido-Yserte, R. (2000). Regional productivity patterns in Europe: An alternative approach. Annals of Regional Science, 34(3), 365-384. doi: 10.1007/s001680000019
Färe, R., Grosskopf, S., Norris, M., & Zhang, Z. (1994). Productivity growth, technical progress, and efficiency change in industrialized countries. American Economic Review, 84(1), 66-83.
Fried, H. O., Lovell, C., Schmidt, S., & Yaisawarng, S. (2002). Accounting for environmental effects and statistical noise in data envelopment analysis. Journal of productivity Analysis, 17(1), 157-174.
Gali, J. (1999). Technology, employment, and the business cycle: do technology shocks explain aggregate fluctuations? American economic review, 89(1), 249-271.
Gobel, C., & Zwick, T. (2012). Age and Productivity: Sector Differences. Economist-Netherlands, 160(1), 35-57. doi: 10.1007/s10645-011-9173-6
Harper, M. J., Moulton, B. R., Rosenthal, S., & Wasshausen, D. B. (2009). Integrated GDP-Productivity Accounts. American Economic Review, 99, 74-79.
Hebák, P. (2007). Vícerozměrné statistické metody. Prague: Informatorium. Hoffmann, V. (1992). Úvod do podnikové ekonomiky: ředitelská analýza 2. Praha: Český
komitét pro vědecké řízení, 89 s. Jílek, J. (2005). Nástin sociálněhospodářské statistiky. Prague: Oeconomica. Konig, J. (2015). European Integration and the Effects of Country Size on Growth. Journal of
Economic Integration, 30(3), 501-531. Korcsmáros, E., Mura, L., & Šimonová, M. (2017). Identification of small and medium-sized
enterprises development in Slovakia. Journal of Applied Economic Sciences, 12(6), 1702-1712.
Kydland, F. E., & Prescott, E. C. (1982). Time to build and aggregate fluctuations. Econometrica, 50(6), 1345-1370.
Kutan, A.M., & Yigit, T. M. (2007). European integration, productivity growth and real convergence. European Economic Review, 51(6). 1370-1395.
Le Gallo, J., & Dall'erba, S. (2008). Spatial and sectoral productivity convergence between European regions, 1975-2000. Papers in Regional Science, 87(4), 505-526. doi: 10.1111/j.1435-5957.2007.00159.x
Lengyel, B., & Szakálné Kanó, I. (2014). Regional economic growth in Hungary 1998–2005: What does really matter in clusters? Acta Oeconomica, 64(3), 257-285.

Novotná, M., Volek, T.
168
Mayer, E., Ruth, S., & Scharler, J. (2016). Total factor productivity and the propagation of shocks: Empirical evidence and implications for the business cycle. Journal of Macroeconomics, 50, 335-346.
Mesina, J., Strozzi, C., & Turunen, J. (2009). Real wages over the business cycle: OECD evidence from the time and frequency domains. Journal of Economic Dynamics and Control, 33, 1183-1200.
Montgomery, D., & Runger, G. (2007). Applied Statistics and Probability for Engineers. Hoboken, N.J.: Wiley.
O'Mahony, M., Rincon-Aznar, A., & Robinson, R. (2010). Productivity growth in the US and the EU: A sectoral analysis. Review of Economics and Institutions 1(1). Retrieved from http://www.rei.unipg.it/rei/article/view/5 (accessed March 5, 2017).
O'Mahony, M., & Van Ark, B. (2003). EU productivity and competitiveness: an industry perspective: can Europe resume the catching-up process? Luxembourg: Office for Official Publications of the European Communities.
Praag, M., & Versloot, P. (2008). The Economic Benefits and Costs of Entrepreneurship: A Review of the Research. Foundations and Trends in Entrepreneurship, 4(2), 65-154.
Prescott, E. C. (1998). Lawrence R. Klein Lecture 1997: Needed: A Theory of Total Factor Productivity. International Economic Review, 39(3), 525-551.
Pušnik, K., &Tajnikar, M. (2010). Heterogeneity and Competitiveness of Entrepreneurial Processes in the European Union with Special Attention on Croatia as Candidate Country. South East European Journal of Economics and Business, 5(1), 7-18.
Rebelo, S. (2005). Real Business Cycle Models: Past, Present and Future. Scandinavian Journal of Economics, 107(2), 217-238.
Sabia, J. J. (2014). The Effects of Minimum Wages over the Business Cycle. Journal of Labor Research, 35, 227-245.
Saintpaul, G. (1993). Productivity growth and the structure of the business-cycle. European Economic Review, 37, 861-883.
Sala, H., & Silva, J. (2013). Labor productivity and vocational training: evidence from Europe. Journal of Productivity Analysis, 40(1), 31-41.
Smets, F., & Wouters, R. (2007). Shocks and frictions in US business cycles: A Bayesian DSGE approach. American Economic Review, 97, 586-606.
Solow, R. M. (1957). Technical change and the aggregate production function. The review of Economics and Statistics, 312-320.
Střeleček, F., & Lososová, J. (2003). An evaluation of the types of technical development in agriculture in the years 1995-2000. Agricultural Economics, 49(4), 151 - 165.
Suchy, M., Kolosta, S., & Koziak, R. (2015). Regional disparities in European Union in the pre-crisis and crisis periods. 18th International Colloquium on Regional Sciences, 19-24. doi: 10.5817/cz.muni.p210-7861-2015-1
Travaglini, G. (2012). Trade-off between labor productivity and capital accumulation in Italian energy sector. Journal of Policy Modeling, 34(1), 35-48.