Observations on the Progress of Welfare-State Construction in Hungary, Poland, and the Czech...
37
This article was downloaded by: [University of Valencia] On: 10 February 2015, At: 04:07 Publisher: Routledge Informa Ltd Registered in England and Wales Registered Number: 1072954 Registered office: Mortimer House, 37-41 Mortimer Street, London W1T 3JH, UK Post-Soviet Affairs Publication details, including instructions for authors and subscription information: http://www.tandfonline.com/loi/rpsa20 Observations on the Progress of Welfare-State Construction in Hungary, Poland, and the Czech Republic Jorge Garcés a , Francisco Ródenas a & Stephanie Carretero a a University of Valencia Published online: 16 May 2013. To cite this article: Jorge Garcés , Francisco Ródenas & Stephanie Carretero (2003) Observations on the Progress of Welfare-State Construction in Hungary, Poland, and the Czech Republic, Post-Soviet Affairs, 19:4, 337-371 To link to this article: http://dx.doi.org/10.2747/1060-586X.19.4.337 PLEASE SCROLL DOWN FOR ARTICLE Taylor & Francis makes every effort to ensure the accuracy of all the information (the “Content”) contained in the publications on our platform. However, Taylor & Francis, our agents, and our licensors make no representations or warranties whatsoever as to the accuracy, completeness, or suitability for any purpose of the Content. Any opinions and views expressed in this publication are the opinions and views of the authors, and are not the views of or endorsed by Taylor & Francis. The accuracy of the Content should not be relied upon and should be independently verified with primary sources of information. Taylor and Francis shall not be liable for any losses, actions, claims, proceedings, demands, costs, expenses, damages, and other liabilities whatsoever or howsoever caused arising directly or indirectly in connection with, in relation to or arising out of the use of the Content.
Transcript of Observations on the Progress of Welfare-State Construction in Hungary, Poland, and the Czech...

This article was downloaded by: [University of Valencia]On: 10 February 2015, At: 04:07Publisher: RoutledgeInforma Ltd Registered in England and Wales Registered Number: 1072954Registered office: Mortimer House, 37-41 Mortimer Street, London W1T 3JH,UK
Post-Soviet AffairsPublication details, including instructions forauthors and subscription information:http://www.tandfonline.com/loi/rpsa20
Observations on the Progressof Welfare-State Constructionin Hungary, Poland, and theCzech RepublicJorge Garcés a , Francisco Ródenas a & StephanieCarretero aa University of ValenciaPublished online: 16 May 2013.
To cite this article: Jorge Garcés , Francisco Ródenas & Stephanie Carretero (2003)Observations on the Progress of Welfare-State Construction in Hungary, Poland, andthe Czech Republic, Post-Soviet Affairs, 19:4, 337-371
To link to this article: http://dx.doi.org/10.2747/1060-586X.19.4.337
PLEASE SCROLL DOWN FOR ARTICLE
Taylor & Francis makes every effort to ensure the accuracy of all theinformation (the “Content”) contained in the publications on our platform.However, Taylor & Francis, our agents, and our licensors make norepresentations or warranties whatsoever as to the accuracy, completeness,or suitability for any purpose of the Content. Any opinions and viewsexpressed in this publication are the opinions and views of the authors, andare not the views of or endorsed by Taylor & Francis. The accuracy of theContent should not be relied upon and should be independently verified withprimary sources of information. Taylor and Francis shall not be liable for anylosses, actions, claims, proceedings, demands, costs, expenses, damages,and other liabilities whatsoever or howsoever caused arising directly orindirectly in connection with, in relation to or arising out of the use of theContent.

This article may be used for research, teaching, and private study purposes.Any substantial or systematic reproduction, redistribution, reselling, loan,sub-licensing, systematic supply, or distribution in any form to anyone isexpressly forbidden. Terms & Conditions of access and use can be found athttp://www.tandfonline.com/page/terms-and-conditions
Dow
nloa
ded
by [
Uni
vers
ity o
f V
alen
cia]
at 0
4:07
10
Febr
uary
201
5

337
Post-Soviet Affairs, 2003, 19, 4, pp. 337–371.Copyright © 2003 by V. H. Winston & Son, Inc. All rights reserved.
Observations on the Progressof Welfare-State Constructionin Hungary, Poland, and theCzech RepublicJorge Garcés, Francisco Ródenas, and Stephanie Carretero1
Abstract: Three specialists in social services present an assessment of Hungary’sperformance during the economic transition from the perspective of social policy andthe general welfare of the population. Using figures drawn from a variety of Europeansources, they offer a review of social expenditure, labor market tendencies, and thesocial security, health and education systems, comparing throughout with data fromthe Czech Republic, Poland and the European Union.
he euphoria with which the people of Hungary greeted the proclama-tion of their new republic in October 1989, insofar as it placed them in
a privileged position relative to their neighbors in western Europe, was toprove short-lived. In fact, transformation of the economic and politicalsystems—the journey from a centrally planned economy to a marketeconomy and from communism to multiparty democracy—had extremeconsequences for health services, social protection, income levels, employ-ment, and, in short, the overall welfare of the Hungarian population. Theeconomic and political transition brought with it a restructuring of theentire existing social policy, a difficult task that involved an attempt notonly to adapt to the new European framework, but also to absorb thenegative social consequences of transition as soon as possible.
1Garcés is Professor, Ródenas is Assistant Professor, and Carretero is Researcher, Departmentof Social Work and Social Services, University of Valencia (Spain). Author’s correspondence:Departamento de Trabajo Social y Servicios Sociales, Universidad de Valencia, CampusTarongers—Edificio Departamental Occidental Avda. dels Tarongers, s/n- 46022 Valencia,España. Tel.: +34963828184; fax:+34963828188. E-mail: [email protected]
T
Dow
nloa
ded
by [
Uni
vers
ity o
f V
alen
cia]
at 0
4:07
10
Febr
uary
201
5

338 GARCÉS ET AL.
In this article we analyze the changes that have taken place in Hun-garian social policy during the transition process and compare the coun-try’s present situation with that in the Czech Republic, Poland, and theEuropean Union (EU). We begin with a brief overview of the socio-eco-nomic repercussions of transition, and then examine the evolution andtransformation of various social protection systems. We review trends insocial expenditure, the labor market, social security, health, and educationsystems, as well as their relationship to the tax system. This assessment ispresented in conjunction with an extensive comparison of Hungary’s socialpolicy with the Czech and Polish welfare systems. The comparison withthe Czech Republic and Poland is justified by their inclusion with Hungaryin the next group of states to be admitted to the EU. In addition, a systematicjuxtaposition of the central European dataset with prevailing West Euro-pean patterns allows us to arrive at some general conclusions about welfarepolicies under post-communist governments.
ECONOMIC REFORM
In contrast to the “shock therapy” approach to economic reform thatwas undertaken in the Czech Republic and Poland, during the first fiveyears of transition Hungary opted for partial economic reforms. Over thisperiod the Hungarian government’s economic policy submerged the coun-try into a deep crisis that necessitated the introduction of more restrictiveeconomic criteria in March 1995 in the guise of a “stabilization package.”2
This maneuver made possible a strong economic recovery from the secondhalf of 1996 onwards, a change that appeared even more evident from 1997on (Járai, 1999).
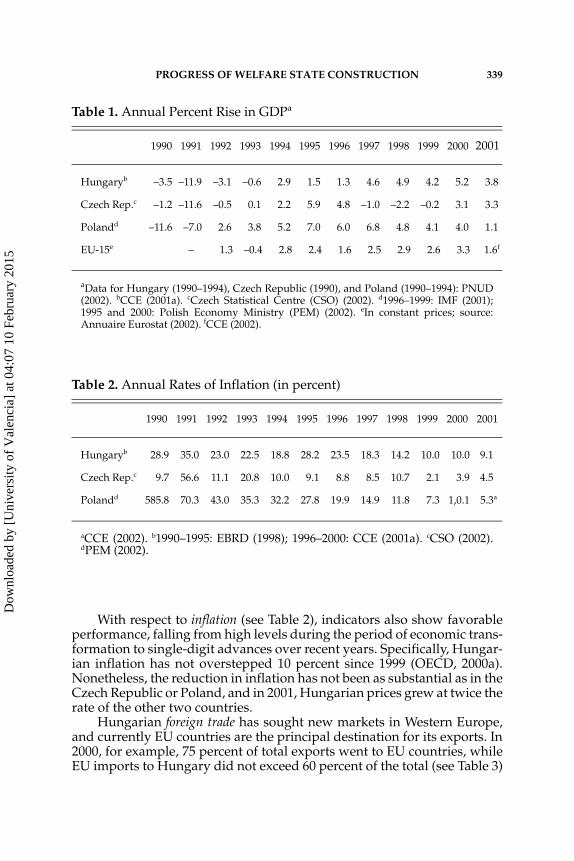
The Hungarian economy’s evolution throughout the transition can bebetter understood by analyzing growth of its main indicators. GDP, forexample, performed negatively over the first three years (between –0.8 and–11.9 percent), while from 1994 onwards it has put in good performancewith positive growth (see Table 1). Hungary’s GDP in fact shows a muchmore balanced progression than that of the Czech Republic or Poland. In2000 Hungary achieved its strongest GDP growth since the start of thetransition, with a 5.2 percent advance, putting the country ahead of Poland,the Czech Republic, and the EU average (Hungarian Central StatisticalOffice (HCSO), 2002a; Commission Communautées Européennes (CCE),2001a). Although the 2001 result of 3.8 percent annual growth was not asfavorable (HCSO, 2002b), Hungary remains the growth leader among thecountries analyzed.
2This refers to the economic stabilization program implemented by Finance Minister LajosBokros in 1995, whose aim was to encourage structural reform while also introducing a toughfiscal policy (reducing social spending for the first time), and similar policies regardingwages, the monetary exchange rate, and foreign trade. The entire package made for a veryrestrictive economic landscape in 1995 and 1996. For a detailed analysis of the political andeconomic transition in the Eastern countries and their repurcussions, see Garcés et al. (1999).
Dow
nloa
ded
by [
Uni
vers
ity o
f V
alen
cia]
at 0
4:07
10
Febr
uary
201
5
PROGRESS OF WELFARE STATE CONSTRUCTION 339
With respect to inflation (see Table 2), indicators also show favorableperformance, falling from high levels during the period of economic trans-formation to single-digit advances over recent years. Specifically, Hungar-ian inflation has not overstepped 10 percent since 1999 (OECD, 2000a).Nonetheless, the reduction in inflation has not been as substantial as in theCzech Republic or Poland, and in 2001, Hungarian prices grew at twice therate of the other two countries.
Hungarian foreign trade has sought new markets in Western Europe,and currently EU countries are the principal destination for its exports. In2000, for example, 75 percent of total exports went to EU countries, whileEU imports to Hungary did not exceed 60 percent of the total (see Table 3)
Table 1. Annual Percent Rise in GDPa
1990 1991 1992 1993 1994 1995 1996 1997 1998 1999 2000 2001
Hungaryb –3.5 –11.9 –3.1 –0.6 2.9 1.5 1.3 4.6 4.9 4.2 5.2 3.8
Czech Rep.c –1.2 –11.6 –0.5 0.1 2.2 5.9 4.8 –1.0 –2.2 –0.2 3.1 3.3
Polandd –11.6 –7.0 2.6 3.8 5.2 7.0 6.0 6.8 4.8 4.1 4.0 1.1
EU-15e – 1.3 –0.4 2.8 2.4 1.6 2.5 2.9 2.6 3.3 1.6f
aData for Hungary (1990–1994), Czech Republic (1990), and Poland (1990–1994): PNUD(2002). bCCE (2001a). cCzech Statistical Centre (CSO) (2002). d1996–1999: IMF (2001);1995 and 2000: Polish Economy Ministry (PEM) (2002). eIn constant prices; source:Annuaire Eurostat (2002). fCCE (2002).
Table 2. Annual Rates of Inflation (in percent)
1990 1991 1992 1993 1994 1995 1996 1997 1998 1999 2000 2001
Hungaryb 28.9 35.0 23.0 22.5 18.8 28.2 23.5 18.3 14.2 10.0 10.0 9.1
Czech Rep.c 9.7 56.6 11.1 20.8 10.0 9.1 8.8 8.5 10.7 2.1 3.9 4.5
Polandd 585.8 70.3 43.0 35.3 32.2 27.8 19.9 14.9 11.8 7.3 1,0.1 5.3a
aCCE (2002). b1990–1995: EBRD (1998); 1996–2000: CCE (2001a). cCSO (2002).dPEM (2002).
Dow
nloa
ded
by [
Uni
vers
ity o
f V
alen
cia]
at 0
4:07
10
Febr
uary
201
5

340 GARCÉS ET AL.
(CCE, 2001a). Like the Czech Republic and Poland, Hungary is gainingmarket share in the EU.
Yet the social effects of implementing the stabilization package are notso positive. In fact, as De Cueto has remarked (2001, p. 254), the differentmeasures involved in this package “represent the greatest attack on thewelfare state to date, insofar as they meant cuts in family and maternityaid, the introduction of education and health contributions for the firsttime, and raising the retirement age.” The government measures werepositive from the point of view of macroeconomic variables, but theybrought negative consequences for the Hungarian population, whichwatched the value of its net income fall rapidly and the emergence of anenormous gap within the social structure stemming from the deterioratingsituation of the middle classes.
The repercussions of the grave economic situation during transitionupon Hungarian society can be analyzed by viewing various social indi-cators such as health, life expectancy, or the increase in poverty.3 Thegeneral state of Hungarians’ health is poorer than that of other EU members(Hungarian Ministry for Foreign Affairs (HMFA), 2001a). Its citizens’ lifeexpectancy is also lower than the European average and lower even than
3As Simon states (2001, p. 265), the growing inequality and deterioration of living standardsis felt by the majority of citizens of former communist countries in a truly dramatic way. Thissituation is reflected not only in their general state of mind but also, as the author contends,in their political stances.
Table 3. Import and Export Trade with EU-15 Countries as a Percentage of Total Trade, 1996–2000
1996 1997 1998 1999 2000
Hungarya Exports 69.7 71.2 72.9 76.2 75.1
Imports 62.3 62.8 64.1 64.4 58.4
Polandb Exports 66.2 64.0 68.3 70.5 69.9
Imports 63.9 63.8 65.6 64.9 61.2
Czech Rep.c Exports 58.6 59.8 64.0 69.2 68.6
Imports 62.4 61.8 63.5 64.2 62.0
EU-15d Exports 63.1 61.8 63.2 63.8 62.3
Imports 63.8 62.3 62.9 62.0 58.8
aCCE (2001a). bCCE (2001b). cCCE (2001c). dAnnuaire Eurostat (2002).
Dow
nloa
ded
by [
Uni
vers
ity o
f V
alen
cia]
at 0
4:07
10
Febr
uary
201
5

PROGRESS OF WELFARE STATE CONSTRUCTION 341
in the Czech Republic and Poland. The average male life expectancy islower than 70 years (see Table 4).
As González (2001) notes, the changes provoked by the transition havemodified the Hungarian social structure. In fact, the first economic reformsto be introduced increased the disparities in income and, together with cutsin social assistance, caused greater poverty in the majority of the popula-tion, sharpening the differences between rich and poor and limitingupward mobility.
Specifically, by 2000, real wages in Hungary still had not returned totheir 1989 level, while in Poland wage levels were very close to recoveringtheir previous levels; in the Czech Republic, this had been achieved in 1996(see Table 5). Likewise, as indicated by the GINI coefficient,4 disparities inthe distribution of income and wages have been increasing in Hungary, atrend also observed in the Czech Republic and Poland. Nonetheless, in theyear 2000 the degree of inequality was smaller in Hungary than that inPoland and at a similar level to that in the Czech Republic (see Table 6).
4The GINI coefficient measures the degree to which income or consumption distributionbetween individuals or households of a particular country deviates from their distribution inconditions of absolute equality. This coefficient varies between 0 (perfect equality) and 1 (totalinequality) (UNICEF, 2002).
Table 4. Changes in Life Expectancy (in years)
1980 1990 1994 1995 1996 1997 1998 1999 2000 2001
Hungaryc Men 65.4a 65.1a 64.8b 65.3b 66.1 66.4 66.1 66.3 67.1 66.0d
Women 72.1a 73.7a 74.2b 74.5b 74.7 75.1 75.2 75.1 75.6 75.0d
Poland Men 66.9e 66.5 67.5 67.6 68.1 68.5 68.9 68.8 69.7f –
Women 75.4e 75.5 76.1 76.4 76.6 77.0 77.3 77.5 78.0f –
Czech Rep.g Men – 67.4 69.5 69.7 70.4 70.5 711 71.4 71.7 –
Women – 75.4 76.6 76.6 77.3 77.5 78.1 78.1 78.4 –
EU-15h Men – 72.8 73.8 73.9 74.2 74.6 74.6 74.9 – –
Women – 79.4 80.3 80.4 80.9 80.9 80.9 81.2 – –
aHCSO (2002a). bInforme UE (1999). cFor 1996–2000: CCE (2001a). dHMFA (2001b). e1980= 1980–1981; source: COE (1993), as quoted in UNICEF (2001). fOECD (2002a). gStatisti-cal Yearbook of Czech Republic (SYCR) (2001). hAnnuaire Eurostat (2002).
Dow
nloa
ded
by [
Uni
vers
ity o
f V
alen
cia]
at 0
4:07
10
Febr
uary
201
5

342 GARCÉS ET AL.
According to various studies carried out recently by the Tarki Instituteof Social Research (HMFA, 2001c), in 1999, 31 percent of the Hungarianpopulation was still living in conditions of poverty. The indicators of thePNUD (2001, 2002) show that in 1998, 10.1 percent of the Hungarian
Table 5. Real Wagesa (Index, base year = 100)
1989 1990 1991 1992 1993 1994 1995 1996 1997 1998 1999 2000
Hungaryb 100.0 94.3 87.7 86.5 83.1 89.1 78.2 74.3 77.1 79.6 81.0 83.9
Polandb 100.0 75.6 75.4 73.3 71.2 71.6 73.7 77.9 82.4 85.2 95.8 98.6
Czech Rep.c 100.0 93.6 68.9 76.0 78.8 84.9 92.2 100.4 102.3 101.0 107.1 109.7
aIRC estimate. CPI: EBRD (2001). b1989–1997: real net index calculated by central statis-tics office, 1998–2000: IRC estimate. cBased on gross wages; source: UNICEF (2002).
Table 6. Distribution of Wages and Income: GINI Coefficientsa
1989 1990 1991 1992 1993 1994 1995 1996 1997 1998 1999 2000
Hungary Wagesb 0.268 0.293 – 0.305 0.320 0.324 – – 0.350 – – –
Incomec 0.225 – 0.209 – 0.231 0.234 0.242 0.246 0.254 0.250 0.253 0.259
Poland Wagesd 0.207 – 0.239 0.247 0.256 0.281 0.290 0.302 0.300 0.294 0.305 –
Incomee 0.275 0.268 0.265 0.274 0.317 0.323 0.321 0.328 0.334 0.326 0.334 0.345
Czech Rep.
Wages 0.204 – 0.212 0.214 0.258 0.260 0.282 0.254 0.259 0.258 0.257 0.270
Income 0.198 0.190 – 0.215 0.214 0.230 0.216 0.230 0.239 0.212 0.232 0.231
aWages figured from monthly wages for full-time workers according to employer data;income estimates based on interpolated distribution of grouped data of household bud-get reports for the MONEE project. The procedure is described in Atkinson and Mickle-wright (1992, “Sources and Methods”). Data refers to individual distribution accordingto per capita household income. bSmall businesses were often excluded; 1989: Atkinson and Micklewright (1992); 1989refers to 1988. cMilanovic (1998, Table A4.3) estimates 0.210 for 1987 based on data from the householdbudget report. Atkinson and Micklewright (1992, table Hl1) give an alternative estimateof 0.244 for 1987 based on data from the household income report. d1989–1991: net wages; 1992–1999: gross wages. eAtkinson and Micklewright (1992, Table Pl1) estimate 0.246 for 1988 based on data fromthe household budget report; source: UNICEF (2002).
Dow
nloa
ded
by [
Uni
vers
ity o
f V
alen
cia]
at 0
4:07
10
Febr
uary
201
5

PROGRESS OF WELFARE STATE CONSTRUCTION 343
population was living on less than 50 percent of the median income, thoughonly less than 1 percent of the population had four U.S. dollars per day onwhich to subsist. However, the situation in Hungary and the Czech Repub-lic seems to be developing in a more positive way than that in Poland (seeTable 7).
This increase in poverty has affected above all the most vulnerablesectors of the population, including pensioners, the unemployed, andfamilies with children. Given this situation, it seems justified to analyze thechanges introduced by the Hungarian government in the various socialprotection systems5 in order to respond to the poverty that the transitionbrought about in the weakest sectors of the population. An analysis of themeasures planned for the future, given the country’s integration in theEuropean Union, is also in order.
SOCIAL SPENDINGA substantial percentage of the Hungarian government’s social spend-
ing goes toward financing social security programs, of which pensionsconstitute a large portion. Thus in 1999 the percentage of state expendituresearmarked for social security was similar to the average of EU countriesand slightly higher than in the Czech Republic (see Tables 8 and 9).
5An interesting analysis of social policy in Hungary can be found in Szilágyi (2001).
Table 7. Proportion of the Population Living Under the Poverty Threshold (in percent)a
50 percent of median incomeb, c US$ 4 per dayd
1987–1997e 1987–1998f 1993–1995c, e 1996–1999f
Hungary 10.1 10.1 4 <1
Poland 11.6 11.6 20 10
Czech Rep. 2.3 4.9 <1 <1
aRefers to percentage of the population living below the specified poverty line (less than50 percent of median income; less than US$ 4 per day). bPoverty line is measured at 50percent of equivalent median disposable household income. cData refers to the mostrecent year available during the period specified. dPurchasing power parity in 1990 USdollars. eSource: PNUD (2001). fSource: PNUD (2002).
Dow
nloa
ded
by [
Uni
vers
ity o
f V
alen
cia]
at 0
4:07
10
Febr
uary
201
5

344 GARCÉS ET AL.
State spending toward employment policy, however, does not reach 1percent of GDP and is far lower than that in countries such as Spain orGermany (see Table 10). The Hungarian government, under pressure fromthe EU and different international bodies such as the OECD, has graduallyreduced its spending on passive policies to such an extent that in 2001 itsinvestment in active policies was higher than spending on support for theunemployed.
Similarly, Hungarian state spending on health as a percentage of GDPhas gradually fallen while per capita spending has increased (see Tables 11and 12), although in 1999 the two figures were lower than both theirequivalents in the Czech Republic and the average of equivalent spendinglevels across the EU.
Regarding education, Hungarian state expenditure as a percentage ofGDP has followed a similar trajectory to that of Poland and has climbedhigher than that in the Czech Republic, rising during the three first years
Table 8. State Expenditures on Social Security as a Percentage of GDP
1996 1998 1999
Hungary 14.4 13.6 13.5
Poland 20.8 17.3 18.3
Czech Republic 12.2 12.3 12.9
EU-15 – 15.6a 15.2b
a1999; b2000. Sources: 1996: IMF (1998); 1998: OECD (2001a); 1999: OECD (2002a); for EU: authors’calculation from OECD (2001a, 2002a).
Table 9. State Expenditures on Pensions as a Percentage of GDP
1993 1996
Hungary 10.6 9.7
Poland 13.4 14.4
Czech Republic 7.3 8.4
Spain 11.2 –
Germany 14.3 –
Source: IMF (1998).
Dow
nloa
ded
by [
Uni
vers
ity o
f V
alen
cia]
at 0
4:07
10
Febr
uary
201
5

PROGRESS OF WELFARE STATE CONSTRUCTION 345
Table 10. State Expenditures on Employment Policies as a Percentageof GDP
Employment policies
1994 1995 1996 1997 1998 1999 2000 2001
Hungary Active 0.47 0.43 0.31 – 0.39 0.40 0.39 0.47
Passive – – – – 0.62 0.57 0.47 0.38
Poland Active 0.49 0.41 0.49 0.48 0.38 0.31 – –
Passive 1.75 1.79 1.70 1.10 0.55 0.64 0.84 1.00
Czech Rep. Active 0.15 0.14 0.12 0.11 0.13 0.18 0.22 0.21
Passive 0.16 0.13 0.13 0.20 0.23 0.30 0.29 0.24
Germanya Active 1.34 1.34 1.43 1.23 1.27 1.31 1.24 1.20
Passive 1.92 1.77 1.79 1.84 2.28 2.13 1.90 1.92
Spaina Active 0.60 0.84 0.70 0.49 0.65 0.70 0.81 0.73
Passive 2.98 2.29 2.01 1.78 1.55 1.40 1.34 1.33
aData for 1994 to 1997 only include spending on unemployment benefits. Sources: 1998–2001: OECD (2002b); 1994–1997: OECD (2001b).
Table 11. Spending on Health Care as a Percentage of GDP
Total State
1989 1998 1999 1989 1998 1999
Hungary 7.1 6.8 6.8 6.4c 5.2 5.3
Poland 5.3 6.4 6.2 4.8 4.2 4.6
Czech Rep. 5.0a 7.2 7.2 4.8 6.6 6.5
Germany 8.8 10.6 10.3b 6.7 7.9 7.8
Spain 6.3 7.1 7.7 4.9 5.4 5.4
EU-15d 7.3 8.0 7.3 – 6.0 5.9
Sources: OECD (2001a, 2002a). a1990. b1998. c1991. dAuthors’ calculation from OECD (2001a, 2002b).
Dow
nloa
ded
by [
Uni
vers
ity o
f V
alen
cia]
at 0
4:07
10
Febr
uary
201
5

346 GARCÉS ET AL.
of the transition and then falling from that date onwards. Nonetheless,while economic recovery has allowed the Hungarian government to assignmore resources to education since 1998, spending in 2000 had not regainedthe percentage level of 1989 (see Table 13). Likewise, Hungary is stillfar behind the average of OECD countries in spending per student (seeTable 14).
THE JOB MARKETThe social and economic changes that followed the fall of communism
at the beginning of the 1990s brought with them a significant transforma-tion of the Hungarian labor market, with tens of thousands of jobs dis-appearing and unemployment—which had been practically unknownduring the socialist era—becoming a palpable social phenomenon.
Table 12. Per Capita Expenditures on Health, 1990–1999a
1990 1995 1997 1998 1999
Hungary 510 625 642 705 787
Germany 1,602 2,178 2,364 2,424 2,451b
Czech Rep. 574 898 943 930 972
Poland 216 296 386 496 557
Portugal 614 1,046 1,148 1,237 1,402
Spain 815 1,063 1,183 1,218 1,469
EU-15 1,186 1,568 1,698 1,766.4 1,928
aIn USD at purchasing power parity; b1998. Sources: OECD (1999), quoted in Huber(1999); 1998: OECD (2001a); 1999: OECD (2002a).
Table 13. State Expenditures on Education as a Percentage of GDP
1989 1990 1991 1992 1993 1994 1995 1996 1997 1998 1999 2000
Hungary 5.7 5.8 6.3 6.6 6.5 6.4 5.5 4.9 4.3 4.8 5.1 5.3
Poland – 4.8 5.1 5.4 5.4 5.3 5.2 5.4 5.5 5.3 5.1 5.1
Czech Rep. 4.0 4.1 4.1 4.5 5.2 5.4 5.3 5.3 4.7 3.4 4.6 4.6
Source: UNICEF (2002).
Dow
nloa
ded
by [
Uni
vers
ity o
f V
alen
cia]
at 0
4:07
10
Febr
uary
201
5

PROGRESS OF WELFARE STATE CONSTRUCTION 347
Specifically, from January 1990 to December 1994, the working popu-lation shrank by 27 percent, and the jobless rate rose from 0.5 percent in1989 to approximately 13 percent in 1993. Long-term unemployment rosein parallel, and in 1996 almost 50 percent of the jobless belonged to thisgroup (see Table 15).
Though the economic growth of recent years has improved Hungary’slabor market, rates of participation remain low, to the degree that in 2001Hungary was in last place when compared with labor participation levelsin the Czech Republic and Poland and the average labor participation ratesfor the EU as a whole (see Table 16). Furthermore, the long-term joblessremain a high proportion of those who are unemployed—44.2 percent in2000 (CCE, 2001a)—although Hungary and Poland both enjoy rates thatare lower than the EU average. Unemployment as a whole has graduallyfallen since the beginning of the transition, and in 2001 Hungary had amuch lower rate even than Poland, the Czech Republic, and the averagerate among EU countries (see Table 17).
Table 14. Annual Expenditures on Education, per Pupil (in USD)
1997 1998
Primary Secondary Higher Primary Secondary Higher
Hungary 2,035 2,093 5,430 2,028 2,140 5,073
Poland 1,435 3,641 5,351 1,496 1,438 4,262
Czech Rep. 1,954 3,641 5,351 1,645 3,182 5,584
OECDaverage
3,851 5,274 8,601 3,940 5,294 9,063
Sources: OECD (2001a, 2002a).
Table 15. Long-Term Unemployment Rate as a Percentage of Total Jobless
1996 1997 1998 1999 2000
Hungarya 49.8 46.5 44.3 44.9 44.2
Polanda 39.1 37.9 37.5 32.9 37.9
Czech Rep.a 28.2 28.1 29.5 36.0 47.3
EU-15b 48.2 49.0 47.9 46.0 45.2
aCCE (2001a, 2001b, 2001c). bAnnuaire Eurostat (2002).
Dow
nloa
ded
by [
Uni
vers
ity o
f V
alen
cia]
at 0
4:07
10
Febr
uary
201
5

348 GARCÉS ET AL.
In Hungary, unemployment had a disproportionate effect on certainsegments of the population. Unlike the situation observed in Poland, theCzech Republic and the EU, Hungary’s male population was hit particu-larly hard (see Table 18), while Hungary had in common with the latterthree the fact that those under 25 years of age (see Table 19) and workerswith relatively low education levels were also among those groups mostharshly punished in terms of access to employment (see Table 20).
It is also worth pointing out that data for job distribution by economicsector show that a greater percentage of the population in Hungary thanin Poland and the Czech Republic is involved in the services sector and asmaller percentage is dedicated to agriculture (see Table 21).
Table 16. Employment Participation Rate Among the Work-Eligible Population (in percent)
1990 1997 1998 1999 2000 2001
Hungary – 57.8 58.4 59.9 60.2 60.0
Poland – 66.4 66.1 65.9 65.8 65.7
Czech Rep. – 72.1 72.2 72.2 71.6 71.1
EU-15a 67.4 68.1 68.6 69.1 69.6 69.2
a1990 refers to 1991; source: OECD (2002b).
Table 17. Year-End Overall Unemployment Rate (in percent)
1990 1991 1992 1993 1994 1995 1996 1997 1998 1999 2000 2001
Hungarya 0.5 - 9.9h 13.0 11.0h 10.4h 9.9 8.7 7.8 7.0 6.4 5.7b
Polandc - - 16.4 16.0 14.9 13.2 10.3 10.4 13.1 15.0 17.4d
Czech Rep.e 0.7 4.1 2.6 3.5 3.2 2.9 3.5 5.2 7.5 9.4 8.8 8.2f
EU-15g - 8.1h 9.0h 10.7 11.1 10.7 10.8 10.6 9.9 9.1 8.2 7.6h
aCCE (2001a). bHCSO (2002b). cMinistry of Economy (2001). dPEM (2002). eCSO (2002). fCCE (2001c). gAnnuaire Eurostat (2002). hOECD (2002b).
Dow
nloa
ded
by [
Uni
vers
ity o
f V
alen
cia]
at 0
4:07
10
Febr
uary
201
5

PROGRESS OF WELFARE STATE CONSTRUCTION 349
Table 18. Unemployment Rate Among Men and Women (in percent of male or female working population)
1993 1994 1995 1996 1997 1998 1999 2000
Hungary a Women – – – 8.8 7.8 7.0 6.3 5.6
Men – – – 10.7 9.5 8.5 7.5 7.0
Polandb Women – – 14.5 13.9 13.2 12.3 15.8c 18.1c
Men – – 11.8 11.0 9.6 9.2 12.4c 14.4c
Czech Rep.d Women 4.7 4.4 4.1 4.6 5.8 8.2 10.5 10.6
Men 3.3 3.3 3.2 3.3 3.9 5.0 7.3 7.3
EU-15e Women 12.2 12.7 12.4 12.4 12.3 11.7 10.8 9.7
Men 9.6 9.9 9.4 9.6 9.3 8.6 7.9 7.0
aCCE (2001a). bMinistry of Economy (2001). cCCE (2001b). dFor 1993–1995: CSO (2002);for 1996–2000: CCE (2001c). eAnnuaire Eurostat (2002).
Table 19. Unemployment Rate Among Two Age Cohorts (in percent of overall working population within each cohort)a
1996 1997 1998 1999 2000
Hungary Younger than 25 18.0 15.9 13.5 12.4 12.1
25 years and over 8.5 7.5 6.7 5.9 5.4
Poland Younger than 25 28.5 24.8 23.2 31.3 35.1
25 years and over 10.1 9.3 8.8 11.4 13.3
Czech Rep Younger than 25 7.2 8.6 12.4 17.0 17.0
25 years and over 3.3 4.1 5.3 7.2 7.4
EU-15b Younger than 25 22.0 21.1 19.5 17.9 16.2
25 years and over – – – – –
aSources: CCE (2001a, 2001b, and 2001c). bAnnuaire Eurostat (2002).
Dow
nloa
ded
by [
Uni
vers
ity o
f V
alen
cia]
at 0
4:07
10
Febr
uary
201
5

350 GARCÉS ET AL.
Table 20. Unemployment Rate Analyzed by Education Level, Among Persons Aged 25–64, in 2000
Lower level thanhigh school tier 2
Higher level than high school tier 2 Further education
Hungary 9.9 5.3 1.3
Poland 20.6 13.9 4.3
Czech Rep. 19.3 6.7 2.5
EU-15 10.6 6.5 4.3
Source: OECD (2002b).
Table 21. Employment Rates Within Major Economic Sectors as aPercentage of Overall Unemployment, 1996–2000
1996 1997 1998 1999 2000 2001
Hungarya Agriculture and forestry 8.3 7.9 7.5 7.1 6.5 6.2b
Industry 26.7 27.1 28.0 27.4 26.8 34.2b
Construction 6.0 6.0 6.2 6.6 7.0
Services 59.1 59.0 58.3 58.9 59.7 59.6b
Polandc Agriculture and forestry 22.1 20.5 19.1 18.1 18.8 –
Industry 25.5 25.3 25.0 24.4 23.8 –
Construction 6.2 6.6 7.0 6.9 7.0 –
Services 46.2 47.6 48.9 50.6 50.4 –
Czech Rep.c Agriculture and forestry 6.1 5.8 5.5 5.2 5.1 –
Industry 32.1 31.4 31.2 30.8 30.2 –
Construction 9.4 9.7 9.7 9.3 9.3 –
Services 52.3 53.1 53.6 54.7 55.4 –
aCCE (2001a). bHCSO (2002b). cCCE (2001b, 2001c).
Dow
nloa
ded
by [
Uni
vers
ity o
f V
alen
cia]
at 0
4:07
10
Febr
uary
201
5

PROGRESS OF WELFARE STATE CONSTRUCTION 351
Regarding wages (see Chart 1), the Hungarian minimum wage6 hasgradually lost ground against the CPI and the average salary since itsintroduction in 1989, and hence is in a disadvantageous position, while theminimum wage in the Czech Republic has risen in line with the averagewage. Despite the 100 percent rise in the Hungarian minimum monthlywage in 2001, from 96 to 192 Euros (CCE, 2001a), it continues to be verylow compared to other European countries.
The wage determination system in Hungary is based on agreementsnegotiated on both a national and a regional basis. At the national level,until 1999, guidelines for private-sector wage increases were approved bythe National Board for Reconciliation of Interests (NBRI), which consistedof representatives from labor, business, and the state. The NBRI was an
6For a more detailed analysis of the minimum wage in Eastern Europe, see Standing andVaughan-Whitehead (1998).
Chart 1. Comparative Summary of Job Market Developments
HUNGARY POLAND CZECH REP.
Wages Min
imu
m w
age
Introduced in 1989 Introduced in 1991
Low during the first years of transition
Increased in2001 and 2002
Up to 2002 below the minimum
subsistence level
Has gradually increasedin line with
average wages
Received by 25 percent of paid workers
Received by 4percent of paid workers
Det
erm
ined Agreements at
national and regional level. National Labor
Board (CLN)
Up to 1999at national level.
Tripartitecommission.
Legislation
Job protection: strict
Harmonization with EU regulations
Working week: 48 hours
Working week: 40 hours
Active policies
Subsidized training, employment, aids for
company creation.Program for
underprivileged groups: community work for long-term jobless, for disabled; phone work
for disabled.
Subsidized employment,
training aid for youngsters over 15 seeking work
Work council, information exchange and training, company subventions,
creation of jobs in public sector.
Programs for underprivileged groups: recycling of long-term
jobless; reservation of jobs for disabled.
Source: authors’ elaboration.
Dow
nloa
ded
by [
Uni
vers
ity o
f V
alen
cia]
at 0
4:07
10
Febr
uary
201
5
352 GARCÉS ET AL.
important forum for reaching agreement on social and economic matters,but in 1999 its authority was eclipsed, when the majority of its functionsand activities were taken up by the National Labor Board (NLB), whosepowers are strictly restricted to labor matters.
The most important changes in Hungarian labor legislation havefocused on changes carried out to harmonize regulations with the Euro-pean Union regulations that went into effect in July 2001, measures whichalso were introduced in the Czech Republic and Poland. One of the prin-cipal changes was the limitation of working time to a maximum of 12 hoursdaily and 48 hours per week, including overtime, while in Poland and theCzech Republic the weekly ceiling is 40 hours. Other no less importantchanges have been made regarding collective firings, types of job contract,the safety and health of temporary workers, protection of youngsters in theworkplace, union work committees, equal opportunity directives, and thefight against discrimination—especially in regard to wages, as well asequal gender treatment.
The active job policies introduced in Hungary are generally verysimilar to those of the other OECD members and countries in transition,such as Poland and the Czech Republic. Hungary has above all developedprograms focused on training, subsidized employment, and subsidies forcompany creation to strengthen the business environment. Subsequently,the Hungarian government, like the Czech Republic, has launchedprograms aiming to improve the access of disadvantaged groups to theworkplace.
THE SOCIAL SECURITY SYSTEM
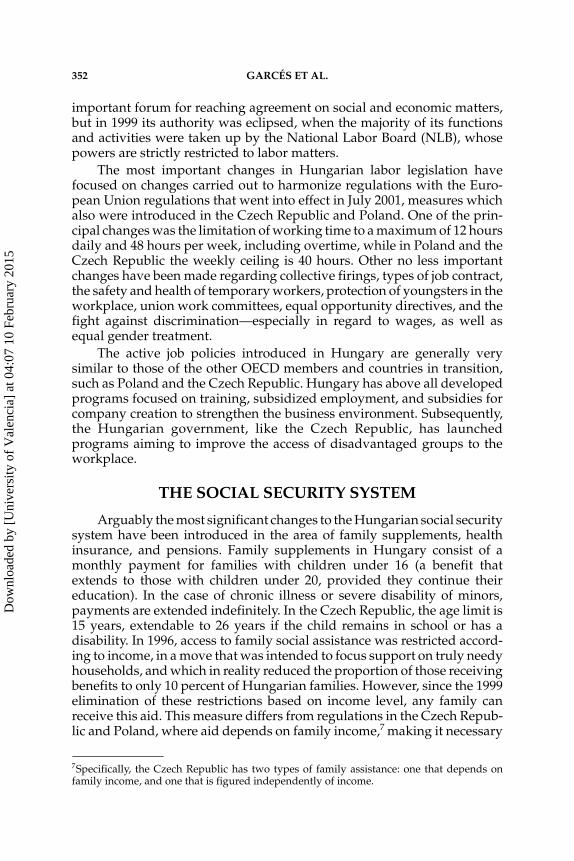
Arguably the most significant changes to the Hungarian social securitysystem have been introduced in the area of family supplements, healthinsurance, and pensions. Family supplements in Hungary consist of amonthly payment for families with children under 16 (a benefit thatextends to those with children under 20, provided they continue theireducation). In the case of chronic illness or severe disability of minors,payments are extended indefinitely. In the Czech Republic, the age limit is15 years, extendable to 26 years if the child remains in school or has adisability. In 1996, access to family social assistance was restricted accord-ing to income, in a move that was intended to focus support on truly needyhouseholds, and which in reality reduced the proportion of those receivingbenefits to only 10 percent of Hungarian families. However, since the 1999elimination of these restrictions based on income level, any family canreceive this aid. This measure differs from regulations in the Czech Repub-lic and Poland, where aid depends on family income,7 making it necessary
7Specifically, the Czech Republic has two types of family assistance: one that depends onfamily income, and one that is figured independently of income.
Dow
nloa
ded
by [
Uni
vers
ity o
f V
alen
cia]
at 0
4:07
10
Febr
uary
201
5

PROGRESS OF WELFARE STATE CONSTRUCTION 353
to review recipients’ incomes annually and determine on a case-by-casebasis whether the supplement will be renewed.
In Hungary, certain childcare benefits are notably broader than inPoland and the Czech Republic. Specifically, pregnancy and post-natalassistance lasts 24 weeks, childcare benefits extend for the first three years(or the first ten years in the case of sickness or disability), and childcarebenefits are made to families with at least three minors. In Poland, benefitsare offered only to families with children aged less than 6 for a maximumof three years, while in the Czech Republic, apart from being assigned onlyto families with children under 4 (extendable to age 7 in the case ofdisability), parents receiving any other independent income are madeineligible for childcare benefits.
In the Hungarian system, the amount of maternity aid is equal to 70percent of the mother’s previous wage, while the amount for childcare isthe same as the minimum retirement pension. In Poland, childcare benefitsdepend on the income level of the family unit, and in the Czech Republicthey are equal to the minimum wage multiplied by a ratio of 1.10.
The state system of sick leave benefits in Hungary ensures payment of75 percent of the wage currently earned. In Poland this benefit cannot beless than 80 percent of wages, and in the Czech Republic it is equivalent to50 percent of net wages for the first three days and 69 percent of net wagessubsequently for a maximum period of one year. Since 1996, Hungariancompanies must take responsibility for the first 15 days of sick leave, whilein Poland company responsibility extends through the first 35 days ofsick leave.
In July 1996, the Hungarian government proposed a reform of itspension system, with two fundamental objectives: to increase the averageretirement age to 62 years between 1996 and 2009, and to broaden the baselevel for contributions to cover a greater number of people and types ofincome. Nonetheless, Hungary was relatively late in introducing thesechanges, as the Czech Republic and Poland had launched their first reformsin 1990 and 1992, respectively. New pension guidelines first went into effectin the Czech Republic in 1995, and subsequently in Hungary and Polandin 1998.
The reform of the Hungarian pension system meant, fundamentally,the introduction of a new system based on capitalized pension funds. InHungary, as in Poland and the Czech Republic, the state PAYG (pay-as-you-go) pension system was maintained, but whereas Hungary andPoland also introduced two fully capitalized pension bases—an obligatorypension fund and a voluntary private pension fund—the Czech Republicestablished only a voluntary contribution private pension system.
Adherence to the new multi-base system was obligatory for peopleentering the job market after July 1998, while it was optional for thoseworkers under 47 years of age who were already employed at the time ofthe reform’s implementation. In Poland, meanwhile, adherence to thesystem was obligatory for those first entering the job market in January
Dow
nloa
ded
by [
Uni
vers
ity o
f V
alen
cia]
at 0
4:07
10
Febr
uary
201
5

354 GARCÉS ET AL.
1999 or later or who were under 30 at that date, and it was voluntary forworkers between 30 and 50 years of age.
Under the new system the obligatory retirement age for both sexes wasset at 62. This criterion became effective in 2001 for male workers and willbe applied to women workers beginning in 2009. In this way Hungary istrying to even out the retirement age for men and women. In this area,Poland has both the highest male retirement age of the three countries (65years) and the greatest discrepancy between the male and female retire-ment age, with women retiring five years earlier. In addition, the Polishretirement age can vary depending on the number of children an individualhas. In the Czech Republic the retirement age has been fixed at 62 years formen and 61 years for women.
In the Hungarian state system, pensions are financed through workersand the contributions of companies to the social security system, with agreater proportion of funds provided by business, a situation similar to thatof the Czech Republic (see Table 22). In Poland, however, social securitycontributions were paid exclusively by companies up to January 1, 1999.
Disability pensions are granted to workers who have fulfilled a mini-mum number of years of service, depending on the individual’s age andthe risk level of the type of job performed, and to those who have lost atleast 67 percent of their ability to work. In the majority of sectors, thefundamental criteria for a disability award are: those less than 22 years oldmust have worked for at least two years, and those over 54 must havecompleted a minimum of 20 years of employment. In Poland and the CzechRepublic it appears that legislation is less restrictive. For example, inPoland, for workers under 30 the period of service demanded varies fromone to four years, and for those over 30, five years of contributions arenecessary. The Czech Republic has the same rules as Poland, except in thecase of the age limit, which is 28.
The government has observed that disability pensions are usedincreasingly frequently by the Hungarian working population to gain
Table 22. Social Security Contributions as a Percentage of Total System Assets, 1999
Workers Companies
Hungary 5.6 27.4
Poland 0 28.1
Czech Rep. 9.8 27.9
EU-15 8.2 15.6
Source: OECD (2002a).
Dow
nloa
ded
by [
Uni
vers
ity o
f V
alen
cia]
at 0
4:07
10
Febr
uary
201
5

PROGRESS OF WELFARE STATE CONSTRUCTION 355
access to early retirement. For this reason, in 1997 the administration madethe right to disability payments temporary and imposed more frequent andwidespread medical check controls. Even more restrictive access measureswere implemented in 1998 with the aim of switching workers from thepermanent to the temporary regime for disability pensions.
THE HEALTH SYSTEM
Since 1988, numerous reforms in Hungary have modified the natureof the health care sector, and many of these were introduced ahead of othercountries in transition, such as Poland and the Czech Republic. Undoubt-edly the most significant change has centered on the elimination of the statemonopoly of the health care system, a measure also introduced in the CzechRepublic and Poland but on a different time scale. Hence, at the beginningof the 1990s, Hungary switched from a centrally planned health caresystem, financed by the state budget, to a decentralized system financedthrough a combination of health care insurance, annual budgetary reve-nues, and partial payment by patients. The Hungarian health system ismade up of a national health insurance regime, which is obligatory andbased on employment. Workers and managers must pay a health-careinsurance tax to the Health Insurance Fund (HIF). The Czech Republic alsointroduced a multi-finance system based on contributions from the centraladministration and local councils together with worker and companycontributions through wage deductions. Hungary introduced a separationbetween health service providers and users at the beginning of the 1990s,an initiative that Poland did not pursue until the reform of its health caresystem in 1999. We should also note Hungary’s creation of the PublicHealth Service in 1991 and the Family Doctors Service a year later, bothaimed at establishing an efficient primary health care system. This task wasundertaken in Poland three years later, in 1994.
Reforms in Hungary include the authorization of private medicalpractice in 1992, progressive liberalization of the pharmaceutical marketsince 1989; and privatization of wholesale chemists and the majority of thestate chemists serving the general public beginning in 1990. Though theseprivatizations are substantial in themselves, Poland went even further byprivatizing its health care services (clinics and hospitals), as did the CzechRepublic by privatizing management of its primary health care centers inthe first years of the transition, together with its chemists, clinics, andhospitals with a capacity of less than 6,000 beds.
Another of the significant changes in the Hungarian health system wasthe introduction of free choice of the family doctor at the beginning of the1990s, a measure that anticipated what was to occur in Poland in 1999,along with free choice of the health center. The decentralization of respon-sibility and transfer of health care service management to local councilsconstituted two of the principal changes introduced at the beginning of the1990s. Administration of the Hungarian health system is shared betweenlocal government, responsible for services provision, and the buyer
Dow
nloa
ded
by [
Uni
vers
ity o
f V
alen
cia]
at 0
4:07
10
Febr
uary
201
5

356 GARCÉS ET AL.
organization of state services, the Health Insurance Fund Administration(HIFA).
However, the most spectacular changes adopted by the Hungariangovernment are related to the remuneration of health care professionalsand the financing of hospitals depending on their productivity. Wages ofhealth care professionals in Hungary and the Czech Republic are based ona system of payment for services. In Hungary, payment for services inhospitals depends on a ratio assigned to the illness group to which eachdiagnosis that is made belongs, while in the Czech Republic it follows asystem of points established for each of the services required.
Analyzing some indicators of Hungary’s health care service, we see anexcessive dependence of patients on hospital services. For example, in 1999in Hungary, as in the Czech Republic, the number (per 1,000 inhabitants)of hospital beds reserved for acute cases was higher than in Poland and theEU average, and higher also than the average of OECD countries (see Table23). However, the number of health centers per 1,000 inhabitants was lessthan half the average among the OECD countries (see Table 24).
With respect to the number of health care professionals, Hungaryshows a proportion of workers in this sector similar to EU countries. In1998 the number of doctors per 1,000 inhabitants was higher in Hungarythan in the other countries under study (see Table 25). Nonetheless, one ofthe most pressing problems of the Hungarian health care system continuesto be the imbalance between the different profiles of health professionals;in particular, as in the Czech Republic, there are many more specialists thangeneral practitioners, and there are relatively few nursing professionalscompared to the number of doctors (see Table 26).
Table 23. Health Care Dataa
Hospital beds per 1,000 persons
Average hospital stay (days)
Patient admission ratio, 1998 (percent of population)
Out-patients
visits per capita, 19981980 1989 1998 1999 1986 1989 1998 1999
Hungary 9.1 9.8 9.1 8.3 13.3 12.8 11 10.0 24 15
Poland 5.6 5.7 5.4 5.1 12.5d 12.5d 11 9.3 14 5
Czech Rep. 11.4e 11.5 9.2 8.7 16.4 15.9 12 11.3 22 15
EU–15b – 8.9c 6.7f 6.7c – 14.9c – 11.2c – –
aSources: The World Bank (2000); OECD (1998a). bAnnuaire Eurostat (2002). cOECD (2002a). dData refers to 1990. eData refers to 1986. fData refers to 1993.
Dow
nloa
ded
by [
Uni
vers
ity o
f V
alen
cia]
at 0
4:07
10
Febr
uary
201
5

PROGRESS OF WELFARE STATE CONSTRUCTION 357
Table 24. Number of Beds per 1,000 Inhabitants in Three Types ofMedical Facilitya
Hospital care Emergency treatment Medical centers
Hungary 8.3 5.8 1.0
Czech Republic 9.0 6.9 0.6
Poland 5.5 – –
OECD average 7.8 4.4 2.7
aData for the latest available year; source: OECD (1999a).
Table 25. Number of Physicians per 1,000 Inhabitantsa
1980 1989 1998 1999
Hungary 2.5 2.7 3.4 3.2
Poland 1.8 2.1 2.3 2.3
Czech Rep. 2.7 2.7 2.9 3.0
EU-15b – 2.6c 3.0 3.3c
Sources: aThe World Bank (2000); OECD (1998a). bAnnuaire Eurostat (2002). cOECD (2002a).
Table 26. Number of Staff Employed in the OECD Health Care Sector per 1,000 Inhabitantsa
Total health care sector
workers Doctors SpecialistsGeneral doctors
Nursingstaff
Hungary 23.8 3.4 2.7 0.7 6.2
Czech Rep. 21.9 2.9 2.2 0.7 8.1
Poland – 2.4 – 1.8 5.6
OECD average 23.9 2.7 1.3 0.8 7.7
aData for latest available year; source: OECD (1999a).
Dow
nloa
ded
by [
Uni
vers
ity o
f V
alen
cia]
at 0
4:07
10
Febr
uary
201
5

358 GARCÉS ET AL.
As for availability of health care equipment and technology, the totalamount of high-tech equipment is very small, a situation similar to thatfound in the other two transitional countries being analyzed, in compari-son with the average of OECD countries (see Table 27).
As the European Commission’s Report (CCE, 2001a, p. 34) states,“despite a promising beginning, reform of Hungarian health care has beendelayed, and the fixed costs linked to maintenance of an inefficient infra-structure that is highly dependent on hospitalization remain high. Withobsolete equipment and badly paid doctors and nursing professionals, thequality of services is diminishing. The rapid aging of the population runsin parallel to the problems of inefficiency in the health care system, andrepresents at medium and long term a grave threat to state finance if thenecessary reforms are not carried through. There is currently no project inthis area, though midway through 2001 the government adopted a verygeneral 10 year action plan,8 without operating commitments.”
THE EDUCATION SYSTEMThe various reforms implemented in the Hungarian education system
over the decade of the 1990s centered essentially on privatization of teach-ing, decentralization of the system toward local councils, and the creationof consultation mechanisms to enable business people and unions tocontribute in greater measure to education, employment, and trainingpolicies. The prime objective of the reforms was to work toward a solutionto the problem of unemployment and the low rate of participation in thejob market of persons with the highest education levels.
8This health program will focus on the illnesses most widespread among the population, withthe aim of optimizing their treatment. To do this, a national network of preventive check-upsfor early detection of tumors and heart disease is being devised (HMFA, 2001a).
Table 27. Number of High-Tech Medical Devices per 1 MillionInhabitants, 1996
MRI Scanners Lithotriptor X rays
Hungary 1.4 5.1 0.7 3.3
Czech Rep. 1.3 8.3 0.3 6.4
Poland 0.1 0.3 0.1 0.1
OECD average 4.1 13.3 1.6 4.8
Source: OECD (1999a).
Dow
nloa
ded
by [
Uni
vers
ity o
f V
alen
cia]
at 0
4:07
10
Febr
uary
201
5

PROGRESS OF WELFARE STATE CONSTRUCTION 359
The present Hungarian education system is made up of 10 uniformlevels of “basic general education,” and education is compulsory up to 18years of age for those who entered the system in 1998 (OECD, 1998b). InPoland, education is also compulsory up to 18 years, but the structure isdifferent from the Hungarian one, with six years of primary and six ofsecondary education. Meanwhile, in the Czech Republic, where educationis compulsory up to 16 years of age, primary school lasts nine years andsecondary education from one to four years.
Participation in the various educational levels has risen over recentyears. At the present time, between 70 and 80 percent of young Hungarianswho complete their basic education requirements apply to enter university.Ninety percent of students manage to complete their secondary studies, apercentage higher than the average for OECD countries (see Table 28).Fifty-four percent of Hungarians over 18 are high school graduates, whilethe number of university students rose 150 percent between 1990 and 1999.Seventy-seven percent of university students finish their degree, so that theproportion of Hungarian degree holders has now reached the average ofthe developed European nations (HMFA, 2001d). The Hungarian educa-tion system has improved noticeably since its transformation was begunat the outset of the 1990s (see Tables 29 and 30). Nonetheless, as we arguebelow, this improvement has been more quantitative than qualitative.
Although the quality of Hungarian primary education is satisfactoryand young Hungarians obtain good results in international tests of math-ematics and science knowledge, the sound education level shown in thetechnical studies of primary school pupils is not reflected among universitystudents. According to a report recently conducted by the HungarianInstitute of State Education, young Hungarians’ performance is relatively
Table 28. Education Level of Adult Populations and Present DiplomaPass Rates (in percent)
Percentage of adult population with the following education level
Upper secondary level
At leastterciary level
Present pass rate for high school diploma
Hungary 63.3 13.2 89.8
Czech Republic 54.3 10.9 –
Poland 85.3 10.4 80.0
OECD average 61.2 13.6 79.4
Source: OECD (2002c).
Dow
nloa
ded
by [
Uni
vers
ity o
f V
alen
cia]
at 0
4:07
10
Febr
uary
201
5

360 GARCÉS ET AL.
Table 29. Participation Rates in Compulsory General Education Levelsas a Percentage of the Population Aged 3–18, in 1989 and 2000
1989 2000
Hungary 92 102
Czech Republic 92 95
Polanda 85 92
a1989 = 1990; source: UNICEF (2002).
Table 30. Gross Rates of Participation in Various Levels of Education (in percent)
1989 1990 1991 1992 1993 1994 1995 1996 1997 1998 1999 2000
Primary education
Hungarya 98.5 98.8 98.4 98.4 98.1 97.9 98.5 98.2 97.9 98.0 98.7 –
Czech Republicb 96.9 98.6 100.7 100.7 100.6 100.0 99.6 97.3 97.6 97.6 97.7 98.4
Polandc 97.9 97.5 97.3 97.1 97.2 97.1 97.2 97.4 98.0 98.1 98.3 98.6
General secondary (15–18 years)
Hungaryd 17.3 17.6 18.1 19.5 20.7 22.2 23.5 24.9 26.5 27.8 29.1 –
Czech Republice 14.1 14.9 13.1 13.0 12.3 12.7 13.6 11.9 12.4 13.4 14.5 17.3
Poland 20.3 20.9 22.5 24.3 25.9 27.7 29.5 30.3 31.8 33.7 36.2 38.9
Secondary technical/professional training (15–18 years)
Hungaryf 55.3 55.7 55.6 56.7 58.7 60.6 63.7 67.0 69.5 71.0 71.8 –
Czech Republicg 65.1 63.9 60.9 61.7 65.7 – – 60.1 60.1 57.6 61.3 68.9
Poland 69.8 68.4 66.8 66.2 66.5 67.1 67.0 67.1 66.5 65.7 65.0 64.0
Higher education (19–24 years)
Hungaryh 12.2 12.1 12.3 12.9 14.1 15.8 18.0 19.7 25.2 27.9 31.7 35.9
Czech Republici 16.6 17.2 16.0 16.6 17.5 18.6 19.8 21.1 22.1 23.7 26.0 28.2
Poland 16.0 17.0 17.1 18.6 21.2 24.0 27.2 30.8 34.8 39.2 42.8 46.3
Source: UNICEF (2002). aAged 6–13. bFor years 1989–1995: aged 6–13; 1996–2000: aged 6–14. cAged 7–14, net rates. dAged 14–17. e1989–1995: aged 14–17, 1996–2000: aged 15–18. fAged 14–17. g1989–1995: aged 14–17, 1996–2000: aged 15–18. hAged 18–23. i1989–1995: aged 18–22, 1996–2000: aged 19–23.
Dow
nloa
ded
by [
Uni
vers
ity o
f V
alen
cia]
at 0
4:07
10
Febr
uary
201
5

PROGRESS OF WELFARE STATE CONSTRUCTION 361
poor in practical subjects and natural science, while they are increasinglybetter educated in information technology and languages (HMFA, 2001d).
In this area, according to the International Adult Literacy Survey(IALS9), both Hungary and Poland are below the average of eight EUcountries in basic prose, document, and quantitative literacy (see Table 31).Likewise, Hungarians’ results in reading literacy and mathematical andscientific knowledge in the Program of International Student Assessment(PISA10) are lower than the average obtained by EU students. In 2000, theaverage EU score was 503, whereas the Czech Republic averaged 492,Hungary 490, and Poland 479 (OECD, as quoted in UNICEF, 2002).11
As we have stated above, it is evident that Hungary has managed toachieve high levels of participation in the various strata of education, butthe challenge in the future will be to turn high numbers into a higher levelof quality in the educational system. On this point, the serious problem ofinconsistency in the quality of teaching offered at various schoolsthroughout the country is fundamentally generated by two factors: (1)Hungarian education professionals, like their counterparts in health care,are poorly paid, earning incomes between 10 and 15 percent below theaverage national wage; and (2) the decentralized organization of the systemitself and the excessive powers given local councils to control the contents
9IALS, OECD International Adult Literacy Survey: a test evaluating the quality of teachingin 23 OECD countries, including the following countries in transition: the Czech Republic,Hungary, Poland, and Slovenia. Specifically, it measures prose, document, and quantitativeliteracy (UNICEF, 2002).10PISA, Program of International Student Assessment of the OECD. In 2000 this programtested the abilities of students in 32 countries to put into practice what they had been taughtin reading comprehension, mathematics, and science. It included only the following coun-tries in transition: the Czech Republic, Poland, Hungary, Lithuania, and Russia (UNICEF,2002).11The EU score was the average of the following countries: Austria, Belgium, Denmark,Finland, France, Germany, Greece, Ireland, Italy, Portugal, Spain, Sweden, and the UK.
Table 31. Average Score in Literacy (IALS) of Pupils Aged 16–25 Who Have Completed Secondary Education
Prose Document Quantitative
Hungary 265 275 290
Czech Republic 292 308 317
Poland 270 271 273
EUa 302 308 303
aAverage score of 8 EU countries: Belgium, Denmark, Finland, Germany, Netherlands,Portugal, Sweden, and the UK in 1992; source: UNICEF (2002).
Dow
nloa
ded
by [
Uni
vers
ity o
f V
alen
cia]
at 0
4:07
10
Febr
uary
201
5

362 GARCÉS ET AL.
of education programs have also allowed a wide variation in educationalstandards to emerge. To this we must add the fact that the provinces havetoo many responsibilities to coordinate the local councils’ education needs,while finances and budgets vary significantly between regions anduniversities, causing interregional imbalances that directly affect thequality and content of the courses.
THE TAX SYSTEM AND SOCIAL POLICIES
Since the beginning of the transition, the Hungarian government hasgradually raised income tax levels with the aim of financing the welfaresystem and providing relief for the disadvantaged situation of its citizens.In both Hungary and the two other countries under comparative analysis,the government adopted a tax policy composed of wage contributions tosocial security, with excessively high collection rates, and income taxrevenues (IMF, 1998). In a climate dominated by poverty and unemploy-ment, the Hungarian tax policy has caused both workers and companiesto resort to tax evasion and fraud through the shadow economy and tounderdeclare wages and salaries. To resolve this situation, between 1997and 1999 diverse reforms were implemented which involved (1) a reduc-tion in company contributions to the National Health Care Insurance Fundand introduction of a minimum contribution; (2) the opening of a range ofcontributions to social security; (3) regulation of a minimum social securitycontribution for those with more than one job; (4) creation of a sole stateagency for tax collection; and (5) the establishment of new income taxcategories.
At the present time, the tax system in Hungary does not include taxrelief, but rather offers so-called tax credits. These include deductions forwage earners whose income does not exceed the limit of 1 million forints,deductions for families with young children, and contributions to thepension system. These tax credits are very similar to Czech tax deductions,while in Poland deductions are subject to criteria such as the number ofjobs held and the distance between the home and the workplace.
In Hungary there are three income tax rates: 20, 30, and 40 percent,depending on the level of income. This differs from the Czech system,where a 5-tiered rate system is used (ranging among 15, 20, 25, 32, and 40percent), and from Poland’s system, which is composed of three income-tax levels, each with a a fixed rate plus a percentage of the surplus incomeearned over certain thresholds. In Hungary and the Czech Republic, thesole taxable unit is the individual, and joint tax declarations made bypartners, a feature of the Polish system, are not allowed.
Finally, regarding social security contributions, Hungarian wage earn-ers must pay 8 percent to the state pension fund, and 3 percent and 1.5percent, respectively, of gross income must be paid to health and unem-ployment insurance. These contributions are smaller than those in Polandand the Czech Republic (OECD, 1999b) (see Chart 2).
Dow
nloa
ded
by [
Uni
vers
ity o
f V
alen
cia]
at 0
4:07
10
Febr
uary
201
5

PROGRESS OF WELFARE STATE CONSTRUCTION 363
CONCLUSIONSThe foregoing analysis of the changes that have occurred in the social
policies of Hungary, the Czech Republic, and Poland allows us to concludethat a common trajectory exists in development of the welfare systems inthese three post-communist countries. The reforms initiated by these threegovernments in the sphere of social protection are similar, following apattern in which economic, social, and political criteria converge. Thecommon features regarding the welfare pattern followed by the threecountries may be summarized as follows: (1) decentralization and destruc-tion of the state monopoly in welfare; (2) opening the area of individualcare to the market; (3) introduction of competitive criteria into the statesector; (4) reduction of the social-benefits system’s generosity and intro-duction of scales linked to proof of income; and (5) adaptation of educationto the demands of the market economy and Western education models.Nonetheless, we must point out that though many points of similarity canbe identified among the various reforms that have been enacted, therhythm of the implementation of new measures and the dates at which theproposed targets have been met are different for each country studied.
One reason for the marked similarity among the reforms undertakenby the three countries under analysis here may be the influence exertedupon all three by the systematic evaluations and recommendations ofinternational institutions. In particular, the guidelines established by theOECD and EU have served as a significant shaping force. From 1991 in thecase of Hungary and the Czech Republic, and 1992 for Poland, the OECDhas periodically published economic reports on the evolution of economicindicators in each country. At the same time, from 1997 the EuropeanCommission has drawn up annual reports on political, economic, andsocial indicators of convergence for these countries en route toward fullmembership in the EU.
Chart 2. Contributions to Social Security
HUNGARY POLAND CZECH REPUBLIC
Pensions: 8 percent of gross wage.
Health: 3 percent of gross wage.
Unemployment: 1.5 percent of gross wage.
Retirement pension: 9.76 percent of gross wage before contributions.
Disability: 6.50 percentof gross wage before contributions.
Health: 2.45 percent of gross wage before contributions.
Health insurance: 4.50 percent of gross wage.
Sickness: 1.10 percent of gross wage.
Retirement pension: 6.50 percent of gross wage.
Unemployment: 0.40 percent of gross wage.
Source: Authors’ elaboration from OECD data (1999b).
Dow
nloa
ded
by [
Uni
vers
ity o
f V
alen
cia]
at 0
4:07
10
Febr
uary
201
5

364 GARCÉS ET AL.
Table 32 summarizes the common features regarding the welfaremodel followed by Hungary, the Czech Republic, and Poland in variousspheres, showing the year when the reforms necessary to introduce thenew systems or the appropriate changes to existing systems were enacted.
In the first place, the job market has experienced substantial changes interms of the creation of labor policies to relieve the unemployment problemthat has emerged in the course of the transition process. The patternfollowed in this area was already present in the first measures adopted atthe beginning of the 1990s, linked to so-called passive policies: that is, thosethat strove to maintain unemployed persons’ income levels. Toward thisend, economic benefits were created that aimed to alleviate the lack of jobsand to relax access criteria for certain pensions, such as retirement anddisability. The international bodies that were closely monitoring the evo-lution of economic indicators attacked these measures, and their proposalsfor the future focused particularly on the need to increase social expendi-ture. The recommendations of the international institutions that the threegovernments followed stressed the need to limit access to alternativeeconomic benefits to work (in particular, early retirements and labor dis-ability payments), to share labor costs between employers and workers,and to improve state mediation in employment offices (including adoptingthe technology necessary to create a labor database). Above all, the inter-national institutions emphasized the need to design and implement activejob creation policies such as subsidies to private companies for hiringworkers and investment in occupational training.
Regarding the pension system, the most important change that definesthe pattern followed by these three post-communist countries has centeredon the transition from a benefits-distribution system to a capitalizationsystem, together with the introduction of cost restraint measures, such asraising the retirement age or changes in the calculation system for pensionamounts. All these measures have their origins in the OECD and EUrecommendations and were enacted following vulnerability studies on thepensions system inherited from the previous regime. The new system hasthree fundamental principles: (1) maintenance of the flow of worker pay-ments toward pensioners through a modified redistribution system (adirect link is established between quotas and future pensions, with strongincentives for late retirement); (2) creation of capitalized pension funds andbodies to administer and supervise them; and (3) promotion of additional(and hence voluntary) private pension fund payment. Hungary andPoland chose to make their capitalized pension funds obligatory, while theCzech Republic kept these funds optional. This decision was made in partbecause the Czech government does not consider it an urgent measure,with the population’s average age increasing at a slower rate than in othercountries, which allows the opportunity to plan for the consequences overa longer term.
The wide range of social benefits, linked to free, universal, and verygenerous systems, has given way to a situation that is similar in all threecountries. This situation entails the elimination of some aid (in particular,
Dow
nloa
ded
by [
Uni
vers
ity o
f V
alen
cia]
at 0
4:07
10
Febr
uary
201
5

PROGRESS OF WELFARE STATE CONSTRUCTION 365Ta
ble
32.
Com
mon
Pat
tern
s of
Wel
fare
Dev
elop
men
t in
Thr
ee P
ost-
Com
mu
nist
Cou
ntri
es
Soci
al s
ecur
ity
sphe
reC
omm
unis
t wel
fare
pol
icie
sP
ost-
com
mu
nist
wel
fare
pol
icie
s
Year
of i
mpl
emen
tati
on o
f new
sys
tem
and
/or
chan
ge
Hun
gary
Cze
ch R
epub
lic
Pol
and
Lab
orFu
ll em
ploy
men
t (t
he e
xist
ence
of u
nem
ploy
men
t is
not
off
icia
lly r
ecog
nize
d)
–Int
rod
ucti
on o
f pas
sive
em
ploy
men
t pol
icie
s –A
dop
tion
of m
easu
res
limit
ing
the
gene
rosi
ty o
f lab
or p
olic
ies
and
impl
emen
tati
on o
f act
ive
empl
oym
ent p
olic
y
1989
a
1989
a
1990
b
1990
b
1989
–199
0c
1990
–199
2c
Pen
sion
sD
istr
ibu
tion
sys
tem
C
apit
aliz
atio
n sy
stem
19
98d
1994
e –199
5f19
99g
Soci
al b
enef
its
Uni
vers
al, g
ener
ous
mod
el
Red
uct
ion
of in
-kin
d b
enef
its
and
intr
odu
ctio
n of
res
tric
tive
el
igib
ility
cri
teri
a th
roug
h in
com
e te
st
1995
h19
95f
1992
i
Hea
lth
Cen
tral
ized
sta
te s
yste
m fi
nanc
ed
thro
ugh
the
stat
e bu
dge
t
–Dec
entr
aliz
atio
n of
hea
lth
care
–C
reat
ion
of p
riva
te h
ealt
h pl
ans
–Mar
ket l
iber
aliz
atio
n –I
ntro
duc
tion
of c
ompe
titi
ve
crit
eria
in th
e sy
stem
1990
j
1993
j
1989
j
1992
j
1990
f
1990
f
1990
f
1990
f
1990
k
1999
k
1991
k
1994
k
Ed
ucat
ion
Ad
apte
d to
the
need
s of
a
cent
raliz
ed p
rod
ucti
on s
yste
m–L
inke
d to
the
new
nee
ds
of th
e m
arke
t eco
nom
y an
d a
dap
ted
to
the
Eu
rope
an s
truc
ture
–Dec
entr
aliz
atio
n of
pow
ers
to
loca
l gov
ernm
ent
1993
l
1990
l
1990
m
1990
m
1999
n
1999
n
Sour
ces:
Aut
hors
’ ela
bora
tion
of
OE
CD
and
EU
dat
a. a O
EC
D (
1991
a). b O
CD
E (
1991
b). c O
EC
D (
1991
c). d
OE
CD
(20
02d
). e O
EC
D (
2000
b). f O
EC
D(1
996)
. g OE
CD
(199
8c).
h OE
CD
(199
5). i O
EC
D (1
998a
). j O
rosz
and
Bu
rns
(200
0). k O
EC
D (2
000c
). 1 O
EC
D (1
999c
). m
OE
CD
(199
7). n E
urop
ean
Com
-m
issi
on (1
999)
.
Dow
nloa
ded
by [
Uni
vers
ity o
f V
alen
cia]
at 0
4:07
10
Febr
uary
201
5

366 GARCÉS ET AL.
in-kind remuneration related to housing, food, and transport), while forthose benefits that remain, support depends upon the existence of budgetfunds and access depends on increasingly stringent economic criteria andthresholds. This has resulted in a stigmatization of the population thatobtains them—the most disadvantaged groups, which in turn has trans-formed these social benefits from subjective rights into awards for whichrecipients ought to be thankful.
At the beginning of the transition, the health system was centrallyplanned and controlled and financed through the state budget, and itproved incapable of confronting the problems that emerged as infrastruc-ture deteriorated and resources became scarce. The general discontentmentamong health care professionals, caused mainly by their low wages, hasonly added to the hardships under which the present health care systemoperates. The recommendations of Western organizations, in particular theOECD, stated to the governments of Hungary, Poland, and the CzechRepublic the need to suppress the state monopoly in the area of health andto decentralize administrative and financial authority and devolve suchauthority toward local and regional government. The recommendationsalso stressed the need to restrain health expenditures and establish newways to finance the system, thus creating a new, common standard foraction in these countries’ welfare systems. To this end, regional healthfunds were created, from which health care was to be financed. Hungaryand the Czech Republic began this reform in 1990, while Poland did notintroduce it until 1999. New health supervisory bodies also were estab-lished, and competitive criteria, such as the separation between the serviceprovider and purchaser functions, the creation of economic incentiveslinked to the quality of care and the number of patients attended, wereincorporated into the state health model. The primary care network wasimproved to act efficiently as a filter for specialized (hospital) care, bolster-ing the function of the family doctor. At the same time, hospital care wasrestructured to improve information systems, introduce technologyimprovements, rationalize costs, and optimize resources, and to stimulategreater participation of the market, in particular in the pharmaceutical area.
Finally, the education system, oriented toward training human capitalto attend to the needs of a centralized production system, has had to bereformed in a similar way in all three post-communist countries. In thisthey once again followed OECD recommendations that spoke to the neces-sity to respond to the new needs of a market economy. The pattern followedby the three countries involved creating different education paths withinthe system, linked and adjusted to the European structure and includingconcise recommendations from the European Union. At the same time, theobligatory education period has gradually been lengthened, with the aimof keeping pupils within the education system for the greatest possibleamount of time and not overloading the job market with young and lowlyqualified graduates with a high risk of under- or unemployment. Thedecentralization of the authority to fund and to decide the content ofeducation to local governments is another important reform enacted in all
Dow
nloa
ded
by [
Uni
vers
ity o
f V
alen
cia]
at 0
4:07
10
Febr
uary
201
5

PROGRESS OF WELFARE STATE CONSTRUCTION 367
three countries. The main changes in the education system occurred at thebeginning of 1990 in Hungary and the Czech Republic, but were notintroduced until 1997 in Poland.
Hungary’s process of economic transition, implemented in a gradualmanner and without the drastic changes seen in other Eastern Europeancountries during the same period, particularly in the Czech Republic andPoland, generated serious problems in the welfare area. The government’ssolution was simply to introduce restrictive measures to contain spendingthrough the so-called stabilization package. These measures, while theybrought about an improvement in economic indicators, also gave rise tosevere consequences for the population. A poor state of health, low lifeexpectancy, poverty, and unemployment are serious problems Hungariansociety must face.
In economic matters, Hungary has raised its GDP and is experiencingannual growth rates superior to those of the Czech Republic, Poland, andthe EU average. At the same time, Hungary has reduced inflation and hasalso managed to pull back its unemployment rate to previously unthink-able levels, and it now shows jobless figures lower than those of Polandand the Czech Republic. However, Hungary’s life expectancy rate is lowerthan the EU average and that for Czech and Polish citizens. The lack ofequality in the distribution of income among the population has not ceasedto grow. Poverty rates are still high, although better than those in Poland.Since the beginning of the transition, the Hungarian government has triedto implement a social policy that would act as a cushion for a substantialportion of the population, but it could not withstand the economic pressurethat financing the policy produced. Thus it has gradually decreased statebudget items relating to social protection systems while at the same timeincreasing the tax burden on its populace.
State spending on social security, pensions, and passive employmentpolicies is lower in Hungary than in Poland and the Czech Republic. Inparticular, the budget for health is the lowest of the countries analyzed. YetHungary is investing heavily in education, and state expenditures on thisitem are higher than those in Poland and the Czech Republic. AlthoughHungary has managed over recent years to raise slightly its spending onactive employment policies, and though investment is greater than in theCzech Republic and Poland, it is rather insignificant compared with otherEuropean countries.
In regard to the job market, Hungary is closing in on the EU from thepoint of view of legislation and regulations concerning active job creationpolicies. All the same, it would seem that these are not altogether success-ful, as Hungary has lower rates of worker participation in the market whencompared to the Czech Republic, Poland, and the EU average.
In the field of family assistance, Hungary has partly recovered thecharacteristics of the previous universal system. The poverty faced byfamilies and the burden they had to bear because of the restrictive policyfor access to social assistance introduced in 1995 forced the government toreact. The measures passed in 1999 caused social assistance policies to
Dow
nloa
ded
by [
Uni
vers
ity o
f V
alen
cia]
at 0
4:07
10
Febr
uary
201
5

368 GARCÉS ET AL.
revert to their previous universal status, accessible to all families withdependent children, and consolidated a system that is broader and moregenerous than either the Czech or Polish equivalents.
Although reform of the pension system came later than the programsin the Czech Republic and Poland, the number of persons dependent onthe state social security system has declined, because of an increase in theage eligibility requirements and tougher access criteria. Thus, while Hun-gary expects to reduce state spending on this system in the short term, amore accurate forecast may have to wait. Whatever the outcome, we canforesee from experience with already consolidated private pension modelsthat they “turn out more costly than state systems, especially in the initialperiod, but even, perhaps, later on also” (Towsend and Walter, 1996, andKritzer, 1996, as quoted in Ferge, 2001, p. 117).
The numerous reforms applied to Hungarian health care—a pioneer-ing system, particularly in comparison to that in Poland—have not suc-ceeded in making it more efficient. The organization of the health caresystem means that a great responsibility falls on hospital care, there are agreat many more specialist doctors than generalists, and the technology ofhealth care equipment is obsolete. Furthermore, health service profession-als are poorly paid. Nevertheless, Hungary does not plan fresh reforms tothe system to resolve these problems.
The education system has improved greatly in quantitative terms, butthe quality of teaching has been negatively affected. Hungary has managedto free up the job market by keeping students in the education system aslong as possible and has spectacularly raised participation rates in alleducational strata. However, Hungarian pupils’ test scores indicate thattheir literacy level is below that of other European countries. In this areareforms must center on greater regional equality in access to resources anda revision of the excessive powers of local authorities regarding decisionsover the content of education programs.
REFERENCES
Annuaire Eurostat, Le guide statistique de l’Europe: Données 1990–2000. Luxembourg:Eurostat, l’Office Statistique des Communautées Européennes, 2002.
Atkinson, Anthony B. and John Micklewright, Economic transformation in EasternEurope and the distribution of income. Cambridge, UK: Cambridge University Press,1992.
EBRD, Annual report. London, UK: European Bank for Reconstruction and Develop-ment, 1998.
Commission des Communautés Européennes (CCE), Rapport régulier 2001 sur lesprogrès realisés para la Hongrie sur la voie de l’adhesion. Bruxelles: Commission desCommunautés Européennes, 2001a. http://europa.eu.int/comm/enlargement
Commission des Communautées Européennes (CCE), Rapport régulier 2001 sur lesprogrès realisés par la Pologne sur la voie de l’adhesión. Bruxelles: Commission desCommunautées Européennes, 2001b. http://europa.eu.int/comm/enlargement
Dow
nloa
ded
by [
Uni
vers
ity o
f V
alen
cia]
at 0
4:07
10
Febr
uary
201
5

PROGRESS OF WELFARE STATE CONSTRUCTION 369
Commission des Communautés Européennes (CCE), Rapport régulier 2001 sur lesprogrès realisés par la République Tchèque sur la voie de l’adhesión. Bruxelles: Commissiondes Communautés Européennes, 2001c.
Commission des Communautées Européennes (CCE), Towards the Enlarged Union:Strategy Paper and Report of the European Commission on the Progress Toward Accessionby Each of the Candidate Countries, SEC 1400-1412. Bruxelles: Commission desCommunautées Européennes, 2002. http://europa.eu.int/comm/enlargement/report2002/strategy_en.pdf
Czech Statistical Office (CSO), Statistical yearbook of the Czech Republic. Prague: Scientia,2002.
De Cueto, Carlos, La transición política en Europa Central: Una experiencia de consolidacióndemocrática. Granada, Spain: Biblioteca de Ciencias Políticas y Sociología, Univer-sidad de Granada, 2001.
European Commission, Regular report from the commission on Poland’s Progress TowardsAccession. Bruxelles, 1999. http://europa.eu.int/comm/enlargement/report_10_99/pdf/en/poland_en.pdf
Ferge, Zsuzsa, “Los retos y las alternativas de la política social en los sistemas post-socialistas,” in Carlos Flores, ed., La transformación de las políticas sociales en la Europadel Este. Madrid, Spain: Informes y estudios, Ministerio de Trabajo y AsuntosSociales, 2001.
Garcés, Jorge et al., Política social, exclusió i pobresa a Rússia. Valencia, Spain: Afers, 1999.González, Carmen, “Transformaciones socioeconómicas en Hungría desde 1989,”
Papeles del Este: Transiciones postcomunistas, no. 1. Madrid: Universidad ComplutenseMadrid, January 2001. www.ucm.es/BUCM/cee/papeles/01/actas.htm
Huber, Manfred, “Health Expenditure Trends in OECD Countries,” Health Care Financ-ing Review 2, 2:99–117, 1999.
Hungarian Ministry of Foreign Affairs (HMFA), “Boletín Semanal,” Boletines semanalesen castellano, series 24, no. 31. Madrid: Magyar Nagykövetség, 2001a. www.embajada-hungria.org/s/pressdoc/hsb0302.htm
Hungarian Ministry of Foreign Affairs (HMFA), “Boletín Semanal,” Boletines semanalesen castellano, series 24, no. 6. Madrid: Magyar Nagykövetség, 2001b. www.embajada-hungria.org/s/pressdoc/hsb0209.htm
Hungarian Ministry of Foreign Affairs (HMFA), “Boletín Semanal,” Boletines semanalesen castellano, series 24, no. 9. Madrid: Magyar Nagykövetség, 2001c. www.Embajada-hungary.org/press_boletin.htm
Hungarian Ministry of Foreign Affairs (HMFA), “Boletín Semanal,” Boletines semanalesen castellano, series 24, no. 3. Madrid: Magyar Nagykövetség, 2001d.
Hungarian Central Statistical Office (HCSO), Major data. Budapest, 2002a.www.ksh.hu/pls/ksh/docs/index_efontosabb.adatok.html.
Hungarian Central Statistical Office (HCSO), Statistical Report 12/2001: ComprehensiveAssessment. Budapest: Hungarian Central Statistical Office, 2002b. www.ksu.hu
IMF, World Economy Outlook. Financial Crises: Causes and Indicators. Washington, DC:International Monetary Fund, 1998. www.imf.org/external/pubs/ft/weo/weo0598
IMF, Republic of Poland: Staff Report for the 2001 Article IV Consultation. IMF CountryReport no. 01/56. Washington, DC: International Monetary Fund, 2001.
Informe UE, Informe periódico 1999 de la comisión sobre los progresos de Hungría en el Caminode la Adhesión. Bruxelles: Commission des Communautées Européennes, 1999.
Dow
nloa
ded
by [
Uni
vers
ity o
f V
alen
cia]
at 0
4:07
10
Febr
uary
201
5

370 GARCÉS ET AL.
Járai, Zsigmond, “Economía Húngara: La economía húngara en los próximos años,”Economía Húngara: Special issue in Spanish. Budapest: Hungarian Ministry of Econo-my, 1999. www.ikm.iif.hu/HunEco/spa/p11.htm
Milanovic, Branko, Income inequality and poverty during the transition from planned tomarket economy. Washington, DC: World Bank, 1998.
Organization for Economic Cooperation and Development (OECD), ÉtudesÉconomiques de l’OCDE: Hongrie. Paris: OECD, 1991a.
Organization for Economic Cooperation and Development (OECD), ÉtudesÉconomiques de l’OCDE: République Fédérative Tchèque et Slovaque. Paris: OECD, 1991b.
Organization for Economic Cooperation and Development (OECD), ÉtudesÉconomiques de l’OCDE: Pologne. Paris: OECD, 1991c.
Organization for Economic Cooperation and Development (OECD), ÉtudesÉconomiques de l’OCDE: Hongrie. Paris: OECD, 1995.
Organization for Economic Cooperation and Development (OECD), ÉtudesÉconomiques de l’OCDE: La République Tchèque. Paris: OECD, 1996.
Organization for Economic Cooperation and Development (OECD), Thematic Reviewof the Transition From Initial Education to Working Life: Czech Republic. Paris: OECD,1997.
Organization for Economic Cooperation and Development (OECD), Health Data.Paris: OECD, 1998a.
Organization for Economic Cooperation and Development (OECD), Thematic Reviewof the Transition from Initial Education to Working Life, Hungary. Background Report.Paris: OECD, 1998b.
Organization for Economic Cooperation and Development (OECD), ÉtudesÉconomiques de l’OCDE: Pologne. Paris: OECD, 1998c.
Organization for Economic Cooperation and Development (OECD), Hongrie: leSystème de Santé. Études Économiques de l’OCDE: Thèmes spéciaux. Paris: OECD, 1999a.
Organization for Economic Cooperation and Development (OECD), Benefit Systemsand Work Incentives, 1999: Country Chapters. Paris: OECD, 1999b.
Organization for Economic Cooperation and Development (OECD), Thematic Reviewof the Transition From Initial Education to Working Life: Hungary. Paris: OECD, 1999c.
Organization for Economic Cooperation and Development (OECD), ÉtudesÉconomiques de l’OCDE: Hongrie 1999/2000. Paris: OECD, 2000a.
Organization for Economic Cooperation and Development (OECD), ÉtudesÉconomiques de l’OCDE: La République Tchèque. Paris: OECD, 2000b.
Organization for Economic Cooperation and Development (OECD), ÉtudesÉconomiques de l’OCDE: Pologne. Paris: OECD, 2000c.
Organization for Economic Cooperation and Development (OECD), OCDE en Chiffres:Statistiques sur les pays members. Paris: OECD, 2001a.
Organization for Economic Cooperation and Development (OECD), Public SocialExpenditure by Main Category, 1980–1998. Paris: OECD, 2001b. www.oecd.org
Organization for Economic Cooperation and Development (OECD), “OCDE enChiffres. Statistiques sur les pays members,” OECD Observer, 2002a (Supplement no.1).
Organization for Economic Cooperation and Development (OECD), “Statistical An-nex,” in OECD Employment Outlook. Paris: OECD, 2002b.
Organization for Economic Cooperation and Development (OECD), Education at aGlance: OECD Indicators, 2002. Paris: OECD, 2002c.
Dow
nloa
ded
by [
Uni
vers
ity o
f V
alen
cia]
at 0
4:07
10
Febr
uary
201
5

PROGRESS OF WELFARE STATE CONSTRUCTION 371
Organization for Economic Cooperation and Development (OECD), ÉtudesÉconomiques de la Hongrie. Paris: OECD, 2002d.
Orosz, Eva and Andrew Burns, The Healthcare System in Hungary. Economic DepartmentWorking Papers (ECO/WKP) 14, no. 241. Paris: OECD, 2000.
Polish Economic Ministry (PEM), Poland 2001 Report Economy. Warsaw: Polish Eco-nomic Ministry, 2001.
Polish Economy Ministry (PEM), Economic Forecasts and Analysis: Figures at December2001. Warsaw: Polish Economic Ministry, 2002. http://baltic.mg.gov.pl.
Programa de Las Naciones Unidas Para El Desarrollo (PNUD), Informe sobre el desarrollohumano 2001. Poner el adelante tecnológico al servicio del desarrollo humano. Madrid:Ediciones Mundi-Prensa, 2001.
Programa de Las Naciones Unidas Para El Desarrollo (PNUD), Informe sobre el desarrollohumano 2002. Profundizar la democracia en un mundo fragmentado. Madrid: EdicionesMundi-Prensa, 2002.
Ródenas, Francisco, Jorge Garcés, and Teresa Villarroya, “Análisis de los cambios enlos sistemas de protección social polacos,” in Carlos Flores, ed., Estudios sobre laEuropa Oriental. Valencia, Spain: Actas del II Encuentro Español de Estudios sobre laEuropa Oriental, Universitat de València, 2002.
Simon, János, “El coste social del Gran Cambio,” in Carlos Flores, ed., La transformaciónde las políticas sociales en la Europa del Este. Madrid: Informes y estudios, Ministerio deTrabajo y Asuntos Sociales, 2001.
Standing, Guy and David Vaughan-Whitehead, Los salarios mínimos en la Europa Centraly Oriental: de la protección a la exclusion. Valencia, Spain: Tirant lo Blanch, 1998.
Szilágyi, István, “La regulación jurídica de la política social en Hungría,” in CarlosFlores, ed., La transformación de las políticas sociales en la Europa del Este. Madrid:Informes y estudios, Ministerio de Trabajo y Asuntos Sociales, 2001.
Statistical Yearbook of the Czech Republic (SYCR). Prague: Scientia, 2001.UNICEF, A Decade of Transition: The MONEE PROJECT CEE/CIS/Baltics. Florence, Italy:
United Nations Children’s Fund, Innocenti Research Centre, 2001.UNICEF, Social Monitor 2002: The MONEE PROJECT CEE/CIS/Baltics. Florence, Italy:
United Nations Children’s Fund, Innocenti Research Centre, 2002.World Bank, World Development Indicators. Washington, DC: The World Bank, 2000.
Dow
nloa
ded
by [
Uni
vers
ity o
f V
alen
cia]
at 0
4:07
10
Febr
uary
201
5