Assessing Corruption: Expert Surveys versus Household Surveys, Filling the Gap
37
Working paper DT/160/2010 Assessing Corruption: Expert Surveys versus Household Surveys, Filling the Gap Thomas Roca PhD student – Lare-Efi, Groupe d’Economie du Développement – Université Montesquieu-Bordeaux IV Avenue Léon Duguit - 33608 Pessac (France) - tél : 0556848539 - fax : 0556848534 [email protected] – [email protected] http://lare-efi.u-bordeaux4.fr – http://ged.u-bordeaux4.fr
-
Upload
independent -
Category
Documents
-
view
4 -
download
0
Transcript of Assessing Corruption: Expert Surveys versus Household Surveys, Filling the Gap

Working paper
DT/160/2010
Assessing Corruption:
Expert Surveys versus Household Surveys, Filling the Gap
Thomas Roca PhD student – Lare-Efi, Groupe d’Economie du Développement – Université Montesquieu-Bordeaux IV
Avenue Léon Duguit - 33608 Pessac (France) - tél : 0556848539 - fax : 0556848534 [email protected] – [email protected]
http://lare-efi.u-bordeaux4.fr – http://ged.u-bordeaux4.fr
Assessing Corruption:
Expert Surveys versus Household Surveys, Filling the Gap
Thomas Roca
PhD student – Lare-Efi, Groupe d’Economie du Développement – Université Montesquieu-Bordeaux IV ([email protected])
Abstract:
Governance measurement is a relatively new source of entertainment for economists. The World Bank
Institute paved the way in the late 90`s with the now famous suite “Governance Matters”, I, II, III, IV… The
little imagination of KKZ1, regarding the choice of their publications title, hides the most popular aggregated
governance indicators.
Corruption focus could also claim World Bank parenthood since Transparency International birth was
the fruit of a former “affair” between James Wolfensohn and Peter Eigen.
With the prelude to household surveys systematization, a new way to measure governance and corruption saw
the day. If household surveys may stand for an interesting tool for institutional assessment, populations‟ opinions
also introduce new pitfalls.
This study aims to investigate the gap between expert and household surveys regarding corruption
measurement. Indeed, experts and populations barely agree on their estimations of corruption extent. We suggest
that press freedom, culture, permissiveness and leadership approval may cover one‟s track.
Résumé:
La mesure de la gouvernance est une source d‟occupation relativement nouvelle pour les économistes.
Le World Bank Institute a ouvert la voie à la fin des années 90 avec la désormais célèbre suite “Governance
Matters”, I, II, III, IV… Le peu d‟imagination de KKZ1 dans le choix du titre de leurs publications cache, en
réalité, les plus populaires des indicateurs de gouvernance.
L‟accent mis sur la corruption pourrait, lui aussi, revendiquer la paternité de la Banque mondiale dans la
mesure où l‟on doit la création de Transparency International à Peter Eigen ancien cadre de la Banque, mais
également, à James Wolfensohn, premier directeur de la Banque à s‟intéresser au fléau de la corruption, dans un
contexte de « de-géopolitisation » de l‟aide au développement. Avec les prémices de la systématisation des
enquêtes ménages, une nouvelle manière de mesurer la gouvernance voit le jour. Si les enquêtes menées auprès
de la population peuvent constituer un outil intéressant pour évaluer la qualité des institutions, cette prise en
compte de l‟opinion des populations introduit de nouveaux écueils.
Cette étude vise à analyser l‟écart de perception entre experts et populations, en matière de corruption.
En effet, les enquêtes d‟experts et les enquêtes ménages s‟accordent difficilement dans leurs estimations de
l‟étendue de la corruption. Nous suggérons que la liberté de la presse, la culture, la tolérance et la confiance
envers les dirigeants puissent venir fausser les pistes.
Keywords: Corruption, Governance, Corruption perception index, CPI, Transparency International, corruption
measurement, perception indicators, expert surveys, household surveys, press freedom, freedom house.
JEL classification: O11, O17, O19
1 Kaufman, D. Kraay, A. and Zoido-Lobatón, P.

2 WORKING PAPER N° 160
Table of content
TABLE OF CONTENT ............................................................................................................................................... 2
1. INTRODUCTION ............................................................................................................................................. 3
2. CONCEPTUAL FRAMEWORK .......................................................................................................................... 4
A. EXPERT SURVEY, THE MAINSTREAM WAY TO MEASURE CORRUPTION ................................................................................ 6
B. HOUSEHOLD SURVEYS: CAPTURING POPULATIONS’ PERCEPTIONS ..................................................................................... 6
3. POPULATIONS VS. EXPERTS, A GAP TO INVESTIGATE .................................................................................... 7
A. PREPARATORY ANALYSIS.......................................................................................................................................... 7
B. INTRODUCING INFORMATION AND CONFIDENCE ......................................................................................................... 11
C. APPROACHING THE GAP ........................................................................................................................................ 19
4. CORRUPTION PERCEPTION, FILLING THE GAP. ............................................................................................. 23
A. MODELING THE SPREAD. ....................................................................................................................................... 23
B. MODEL ESTIMATIONS ........................................................................................................................................... 24
C. RESULTS INTERPRETATION ..................................................................................................................................... 25
5. BIBLIOGRAPHY ............................................................................................................................................ 31
6. ANNEX ......................................................................................................................................................... 33
3 ASSESSING CORRUPTION: EXPERT SURVEYS VERSUS HOUSEHOLD SURVEYS, FILLING THE GAP
1. Introduction
Mid-90s, Washington Consensus ebbing away, the World Bank decided to focus more on governance
to explain the failure of structural adjustment. With James Wolfensohn appointment as President of the
World Bank, corruption arrived to the agenda of the IDA, and a partnership was built with Peter Eigen,
Transparency International creator and former World Bank staff member.
With the plummet of Berlin Wall, geostrategic aid allocation gave way to good governance criteria. Thus,
World Bank developed in 2000 an aid allocation formula, using two criteria: poverty struggle and politico-
institutional context. This formula was described by Ravi Kanbur in 2004:
Aid/ capita = f(CP², GDP/t-0.125)
CP = politico-institutional criteria
CP = (FG/3.5)1.5 x [0.8CPIA + 0.2ARP]
FG = Governance Factor = [ΣgCPIAg + ARPPg]/7
CPIA = Country Policy Institutional Assessment. World Bank Indicator
ARPP = Annual Review of Portfolio Performance.
To assess governance, the World Bank Institute developed the KKZ indicators, (Kaufmann,
Kraay, and Zoidon-Lobatón) constructed using expert surveys.
This kind of survey is based on investigations lead by experts using mainly qualitative assessment and
surveys to describe the different aspects of governance. Thus, governance evaluation is based on experts‟
perceptions.
Recently, a new way to measure governance emerged using household surveys to measure institutional
progress. This way, governance evaluation is no longer based on expert‟s perceptions but on population
views. While this methodology may stand for a more accurate tool to assess the reality of governance, we
suggest that household surveys, especially in corruption measurement, may be biased by information
dysfunctions and government leadership approval.
Observing a gap between experts‟ and populations‟ perceptions of corruption, we suggest that information
may explain a part of this spread. This paper aims to inform this assumption and tries to fill the gap
between experts‟ and people‟s perceptions on corruption.
Our first analysis tends to show that this gap is correlated to information accessibility (measured by
Freedom House- Freedom of press) and confidence in government. Trying to complete our analysis, we
will question other factors that may explain better this gap.
Acknowledgments: this paper only informs the spread of perception between expert surveys and
household survey (Gallup) on corruption evaluation. It gives little clue regarding the assessment quality of
each methodology. Nevertheless, this study shows robust evidences regarding population‟s and experts‟
perception bias. However, this kind of macro analysis will never replace a field study. Corruption organic
features are much more complex and hard to summarize at such a global level with the currently available
data.
4 WORKING PAPER N° 160
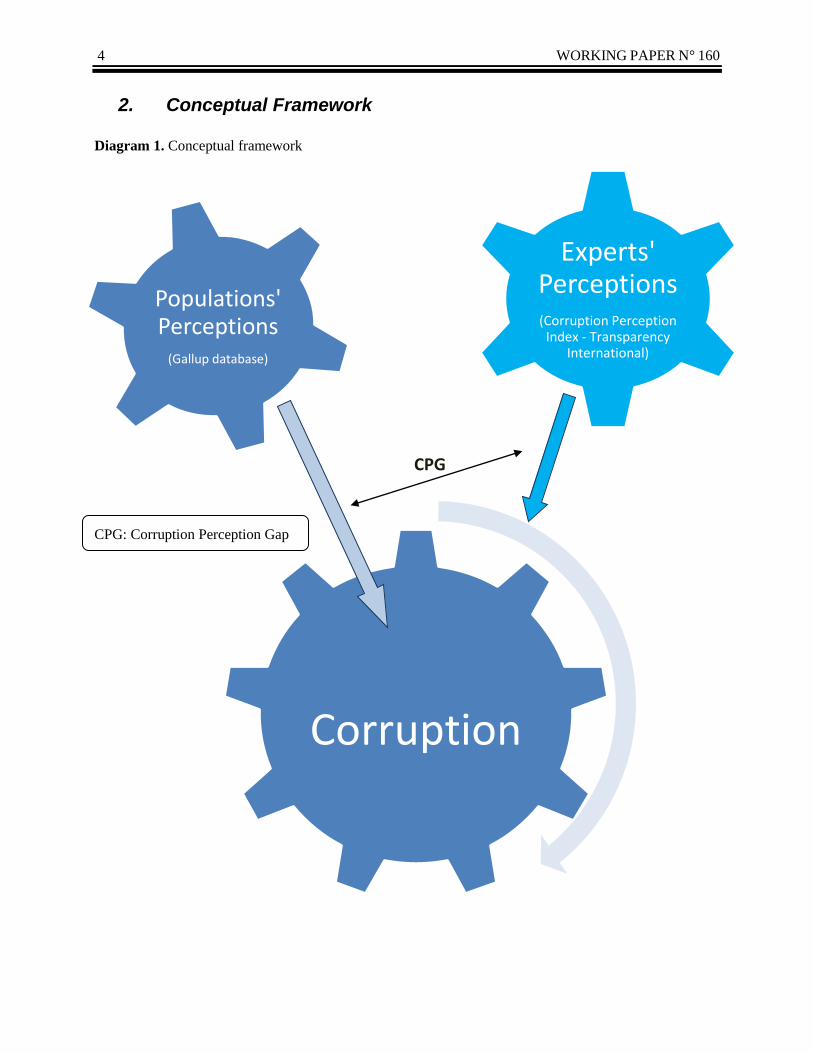
Corruption
Experts' Perceptions (Corruption Perception
Index - Transparency International)
Populations' Perceptions
(Gallup database)
CPG
2. Conceptual Framework
Diagram 1. Conceptual framework
CPG: Corruption Perception Gap

5 ASSESSING CORRUPTION: EXPERT SURVEYS VERSUS HOUSEHOLD SURVEYS, FILLING THE GAP
Questions we propose to analyze.
1. First of all, are populations‟ and experts‟ perceptions strongly correlated?
2. We suggest that populations‟ perceptions about corruption may be affected by the amount of
information individuals possess. What is the influence of media freedom in corruption perception?
3. We also suggest that the gap of perception between household surveys and expert‟s perceptions
depends likewise on the overall level of corruption in a country, but also on the confidence populations
place in their country leadership.
4. Moreover, the gap we observe between household surveys and expert surveys doesn‟t always have the
same direction, in certain countries population overestimates corruption while in others, population
underestimates it. Is there any factor leading to a misestimation of corruption?
Diagram 2. Work assumption
To analyze the gap between populations‟ and experts‟ perceptions, we used various data from
mainly six different sources: Transparency International (TI), Gallup World Poll (household surveys),
World Bank (WGI and WDI), Freedom House, Amnesty International and UNDP. Data description is
available in annex 1, page 33. Moreover, our cross country analysis covers 146 countries. (Country list
available in annex 2, p. 35).
Since corruption measurement is at the center of this analysis, we were very careful in the choice of
corruption indicators. Experts‟ evaluations are mainly composite indicators gathering different sources.
Thus, we first analyzed the methodologies used for their construction, in order to avoid methodological
issues but also to flag actors at stake.
As corruption measure, we chose two different sources: Gallup World Poll and Transparency International
(TI). The Gallup Database gathers worldwide answers to household surveys from 2006 to 2009. We
selected the “Corruption in Government” indicator. (Cf. details available in annex 1).
Experts'
Perceptions (Corruption Perception
Index - Transparency International )
Populations' Perceptions
(Gallup Database)
Gap of perception
Information
Confidence in the government
Experts’
Ideological bias
and population
tolerance
6 WORKING PAPER N° 160
A. Expert Surveys, the mainstream way to measure corruption
In this study, we draw a distinction between populations‟ and experts‟ perceptions. Therefore, we
avoided the use of the Control of Corruption (CC) index, provided by the World Bank, as expert‟s
evaluation, to compare with populations‟ perceptions of corruption. As a matter of fact, Gallup surveys
appear in the list of World Bank CC sub-component. Thereby, Worldwide Bank Institute Control of
Corruption is not entirely constructed with expert surveys. Thus, we decided to use the Corruption
Perception Index (CPI), provided by Transparency International, which only encompasses expert‟s
evaluations.
To compare rigorously population perception with expert‟s assessment, we decided to consolidate
our dataset using CPI older surveys to match with the population data. Indeed, our experts‟ survey uses
2009 data, whereas the selected variable in Gallup World Poll gathered data from 2006 to 2009.
Once consolidated, for each country, all our corruption data have the same collecting date.
However, our analysis shows that if this consolidation is more rigorous, the CPI is quite stable during this
time period. CPI 2006 and CPI 2009 are extremely correlated (Adjusted R² = 0.989, analysis in annex 3, p.
36). Analyzing the gap between expert surveys and population surveys, we used in the consolidated CPI.
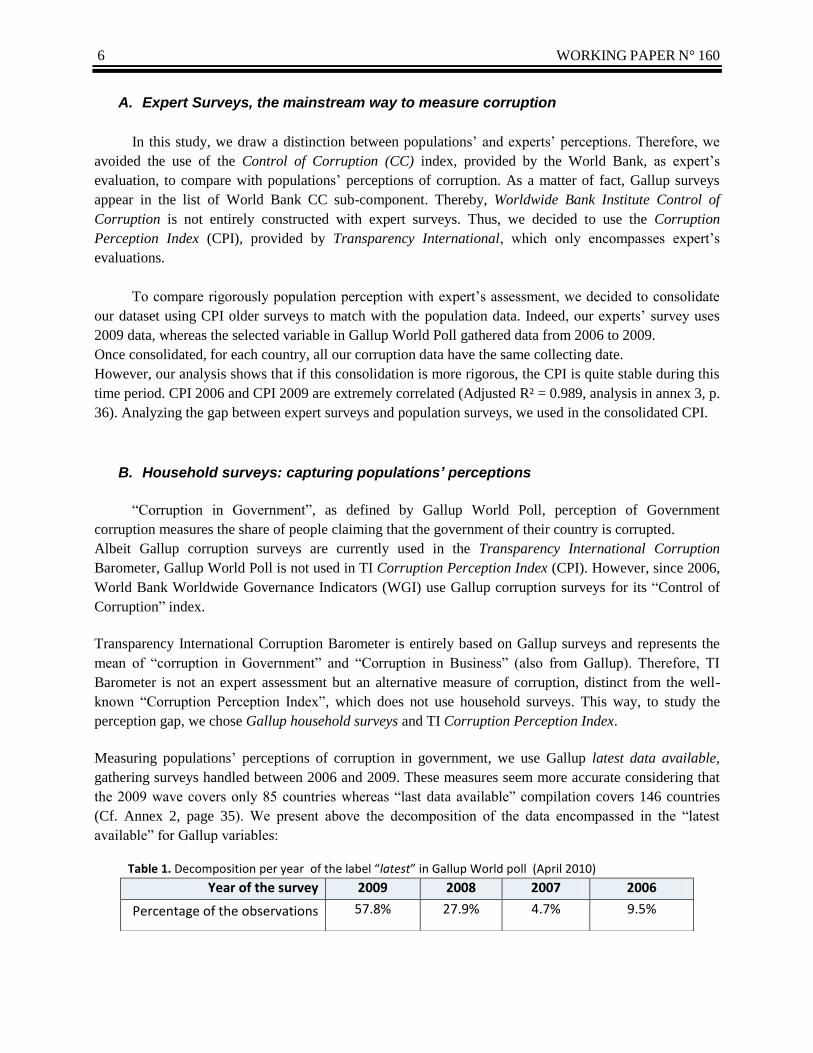
B. Household surveys: capturing populations’ perceptions
“Corruption in Government”, as defined by Gallup World Poll, perception of Government
corruption measures the share of people claiming that the government of their country is corrupted.
Albeit Gallup corruption surveys are currently used in the Transparency International Corruption
Barometer, Gallup World Poll is not used in TI Corruption Perception Index (CPI). However, since 2006,
World Bank Worldwide Governance Indicators (WGI) use Gallup corruption surveys for its “Control of
Corruption” index.
Transparency International Corruption Barometer is entirely based on Gallup surveys and represents the
mean of “corruption in Government” and “Corruption in Business” (also from Gallup). Therefore, TI
Barometer is not an expert assessment but an alternative measure of corruption, distinct from the well-
known “Corruption Perception Index”, which does not use household surveys. This way, to study the
perception gap, we chose Gallup household surveys and TI Corruption Perception Index.
Measuring populations‟ perceptions of corruption in government, we use Gallup latest data available,
gathering surveys handled between 2006 and 2009. These measures seem more accurate considering that
the 2009 wave covers only 85 countries whereas “last data available” compilation covers 146 countries
(Cf. Annex 2, page 35). We present above the decomposition of the data encompassed in the “latest
available” for Gallup variables:
Table 1. Decomposition per year of the label “latest” in Gallup World poll (April 2010)
Year of the survey 2009 2008 2007 2006
Percentage of the observations 57.8% 27.9% 4.7% 9.5%

7 ASSESSING CORRUPTION: EXPERT SURVEYS VERSUS HOUSEHOLD SURVEYS, FILLING THE GAP
NB. If we consolidated our dataset for GDP growth and unemployment rate, for more structural data like
press freedom, inequality or migration, we assumed that institutional stability on such a short run, allows
us not to perform this exercise.
To complete our analysis and understand better corruption reality, we used two other Gallup variables
“Faced bribe situation” and “gave bribe”. These indicators refer to two successive questions:
Faced bribe situation: “In the last 12 months, were you, personally, faced with this kind of situation, or
not (regardless of whether you gave a bribe/present or not)?”. The Faced bribe situation variable measures
the share of population saying “Yes”. If the answer is positive then a second question is answered, asking
if, in this case, the respondent gave any bribe. The measure of the share of people saying “Yes” is the gave
bribe variable.
3. Populations vs. experts, a gap to investigate
Population surveys systematization is relatively recent on such a scope. If household surveys were used
once in a while to control experts‟ assessments accuracy [Olken, B. (2009); Razafindrakoto M., Roubaud
F. (2005)], as far as we know, there are very few studies systematically confronting experts‟ and
populations‟ perceptions. In the following section, we present the different steps followed to analyze the
gap of corruption perceptions between populations and experts. To start properly, we performed a first
verification of the correlation levels between experts‟ and population‟s perceptions.
A. Preparatory analysis
1. Are population and experts’ perceptions on corruption correlated?
The correlation between populations‟ and experts‟ perceptions is pretty significant, albeit not strong.
Although World Bank Control of Corruption (CC) encompasses Gallup World Poll data, it seems that CC
is less correlated with Gallup “Corruption in Government”, than Transparency International CPI.
Overall, the lack of correlation suggests that, indeed, a gap of perception between experts and population
exists and is worth being investigated.
Table 2. Correlations matrix, corruption variables Corruption
Perception Index (TI-
consolidated)
Control of Corruption
(World Bank 2008)
Population perception of government
corruption (Gallup - Latest)
Faced bribe situation (Gallup- Latest)
Corruption Perception Index (TI- consolidated)
Pearson Correlation 1 .977**
.606**
.527**
Sig. (2-tailed ) . .000 .000 .000 N 177 177 142 128
Control of corruption (World Bank 2008)
Pearson Correlation 1 .580** .543**
Sig. (2-tailed ) . .000 .000 N 191 143 128
Population perception of government corruption (Gallup - Latest)
Pearson Correlation 1 .427**
Sig. (2-tailed ) . .000 N 146 126
Faced bribe situation (Gallup - Latest)
Pearson Correlation 1 Sig. (2-tailed ) . N 130
**. Correlation is significant at the 0.01 level (2-tailed)
8 WORKING PAPER N° 160
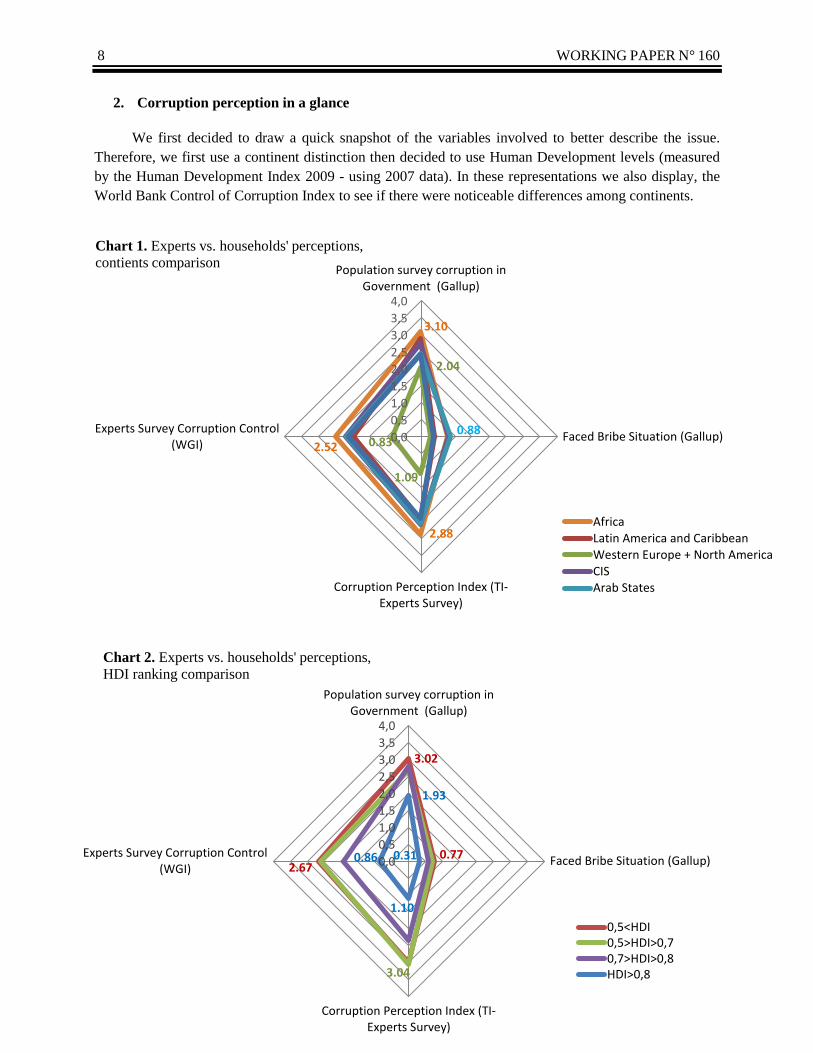
2. Corruption perception in a glance
We first decided to draw a quick snapshot of the variables involved to better describe the issue.
Therefore, we first use a continent distinction then decided to use Human Development levels (measured
by the Human Development Index 2009 - using 2007 data). In these representations we also display, the
World Bank Control of Corruption Index to see if there were noticeable differences among continents.
3.10
2.88
2.52
2.04
1.09
0.83 0.88
0,0
0,5
1,0
1,5
2,0
2,5
3,0
3,5
4,0
Population survey corruption inGovernment (Gallup)
Faced Bribe Situation (Gallup)
Corruption Perception Index (TI-Experts Survey)
Experts Survey Corruption Control(WGI)
Chart 1. Experts vs. households' perceptions,
contients comparison
AfricaLatin America and CaribbeanWestern Europe + North AmericaCISArab States
3.02
0.77 2.67
3.04
1.93
0.31
1.10
0.86 0,0
0,5
1,0
1,5
2,0
2,5
3,0
3,5
4,0
Population survey corruption inGovernment (Gallup)
Faced Bribe Situation (Gallup)
Corruption Perception Index (TI-Experts Survey)
Experts Survey Corruption Control(WGI)
Chart 2. Experts vs. households' perceptions,
HDI ranking comparison
0,5<HDI0,5>HDI>0,70,7>HDI>0,8HDI>0,8

9 ASSESSING CORRUPTION: EXPERT SURVEYS VERSUS HOUSEHOLD SURVEYS, FILLING THE GAP
With: PPC= Population’s Perception of Corruption (household Survey-
Gallup Corruption in government - latest);
EPC = Expert’s Perception of Corruption (CPI consolidated).
NB. We multiple by 4 this gap to facilitate charts representation.
This linear transformation doesn’t affect the results of these
analyzes.
To construct the previous charts, we calculated the means for the selected indexes. We rescaled our
variables from 0 to 4 in order to facilitate their representation.
These charts show in fact two different gaps: the perception gap between experts and populations, but also
the gap among populations regarding perceptions and corruption events declarations (“Faced bribe
situation” variable). This last spread appears even wider.
Thus, we assume that population views on corruption are not only the results of their experimentation but
also depend on an overall impression. Therefore, we suggest that media and confidence in government
strongly condition populations‟ judgment on corruption.
Before studying the gap among populations‟ statements, we propose to explore the gap between experts‟
and populations‟ perceptions. The previous representations give first clues regarding forces at stake and
differences among continents and Human Development levels.
We do observe that overall, Africa seems to face corruption the more, both from expert‟s findings and
populations‟ perceptions. Nevertheless, it seems that Arab States populations face bribe situations the
more. We also notice that the gap between populations‟ and experts‟ perceptions widens in Western
Europe and North America (or in HDI > 0.8, high and very high HDI level).
Aiming to analyze more precisely these perception disparities, we created an index capturing the strength
of perception spreads.
3. The Corruption Perception Gap index (CPG)
The CPG measures the gap between household surveys and expert surveys about corruption, for each
country i observed (i = 1,.., 146).
(
)
(
)
Thus, the CPG is positive if population overestimates corruption (comparing to experts), and negative if
population underestimates corruption (comparing to experts).
Readers will notice that we decided to use a relative measure instead of an absolute difference. This
choice has an impact on the size of the gap for countries with very low perceptions of corruption (both
from population and experts). This way, the error percentage could be important even if the absolute
difference is small, this is the case for only a few countries, outliers, on the very upper-west side of the
following representation.

10 WORKING PAPER N° 160
Sample size N= 139
B
4. Corruption Perception Gap distribution across Human Development levels
To have a first idea of the gap distribution, we represented the perception gap relatively to Human
Development
Chart 3. Corruption Perception Gap and Human Development Index
As first observation, we notice that the gap of perception clearly expend with Human Development.
In low and medium HDI countries, there is no remarkable trend of corruption under-estimation (nor over-
estimation), thus, experts and populations‟ perceptions appear quite similar.
Assuming that “in reality” there is less corruption in developed countries, we can state that the more
corruption, the more experts and population agree on its evaluation. We suppose that widespread
corruption is not a well kept secret in a country, and such a situation is therefore easier to inform. This
way, perceptions tend to converge.
On the other hand in developed countries, where we may assume that there is little corruption, the spread
is much more significant, suggesting that either populations or experts misevaluate corruption reality.
A
D C 29.50% 23.02%
7.91% 39.57%
Singapore
Qatar Bahrain
Saudi Arabia
Belarus
Hong Kong
Rwanda
Niger
Tajikistan
New Zealand
Iceland
Netherland Japan
Medium and low Human
Development Index
High and very high Human Development
Index
Population over-estimate corruption (compared to the experts)
Population under-estimate corruption (compared to the experts)

11 ASSESSING CORRUPTION: EXPERT SURVEYS VERSUS HOUSEHOLD SURVEYS, FILLING THE GAP
Flagging the „extreme‟ cases, we can oppose two facts:
1. In highly both democratic and developed countries, (New Zealand, Iceland, Netherlands, etc.)
populations strongly over-estimate corruption.
2. Whereas in both non-democratic and high-developed countries (Singapore, Hong Kong + Gulf
countries) populations strongly under-estimate corruption (regarding to experts).
We suggest that this observation may be more linked to freedom of press that characterizes
democracies, rather than democracy itself. However, this assumption seems hard to assess rigorously as
democracy and freedom of press are strongly associated. (Cf. analysis page 13).
Our hypothesis is that media affect a lot people whereas corruption experiments hit only a few. One
corruption event, flagged on mass media touches a very large population. This way, in high freedom of
press countries, population tends to overestimate corruption. Media amplification mechanism may explain
the difference between experience of corruption measure by “faced bribe” and populations‟ perceptions of
corruption in government.
NB. As the existing data on corruption in administration suffers from a narrow coverage, we were bound
to use “Corruption in Government” as a proxy.
B. Introducing information and confidence
Charting corruption perceptions, we‟ve suggested that information and confidence should be the
main factors impacting both experts‟ and populations‟ perceptions. In order to test this assumption, we
used different explanatory variables.
1. Freedom of press
To measure press freedom, two indicators are mainly used by researchers:
- “Freedom of Press”, provided by Freedom House.
- “Press Freedom Index” provided by Reporter Sans Frontière.
Another dataset, the Institutional Profiles Database, also provides a measure of press freedom.
In order to test the robustness of these indicators, we first decided to compare them to facts.
We therefore collected data from the Committed to Protect Journalists (CPJ), inventorying journalist
imprisoned from 2000 to 2009. Thus, we created a dummy variable coded this way:
1: this country had at least one journalist imprisoned during the period 2000 to 2009;
0: it did not
We display above the results of correlation among these different indicators:
12 WORKING PAPER N° 160
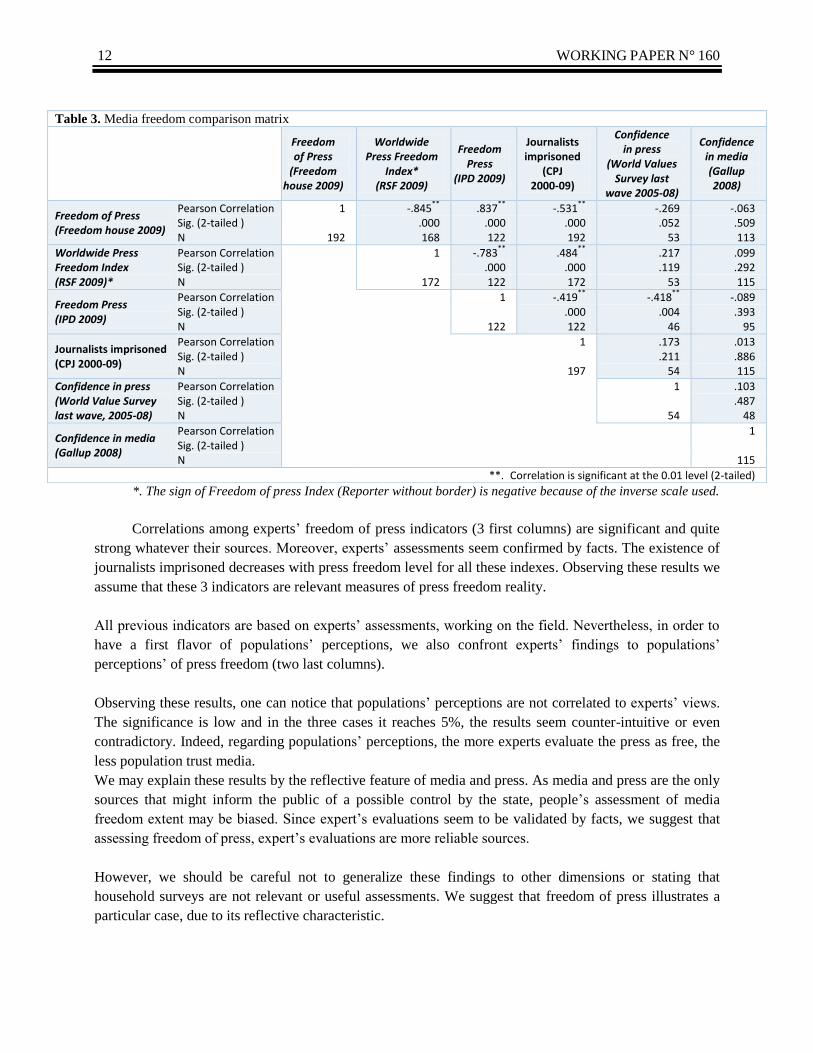
*. The sign of Freedom of press Index (Reporter without border) is negative because of the inverse scale used.
Correlations among experts‟ freedom of press indicators (3 first columns) are significant and quite
strong whatever their sources. Moreover, experts‟ assessments seem confirmed by facts. The existence of
journalists imprisoned decreases with press freedom level for all these indexes. Observing these results we
assume that these 3 indicators are relevant measures of press freedom reality.
All previous indicators are based on experts‟ assessments, working on the field. Nevertheless, in order to
have a first flavor of populations‟ perceptions, we also confront experts‟ findings to populations‟
perceptions‟ of press freedom (two last columns).
Observing these results, one can notice that populations‟ perceptions are not correlated to experts‟ views.
The significance is low and in the three cases it reaches 5%, the results seem counter-intuitive or even
contradictory. Indeed, regarding populations‟ perceptions, the more experts evaluate the press as free, the
less population trust media.
We may explain these results by the reflective feature of media and press. As media and press are the only
sources that might inform the public of a possible control by the state, people‟s assessment of media
freedom extent may be biased. Since expert‟s evaluations seem to be validated by facts, we suggest that
assessing freedom of press, expert‟s evaluations are more reliable sources.
However, we should be careful not to generalize these findings to other dimensions or stating that
household surveys are not relevant or useful assessments. We suggest that freedom of press illustrates a
particular case, due to its reflective characteristic.
Table 3. Media freedom comparison matrix
Freedom of Press
(Freedom house 2009)
Worldwide Press Freedom
Index* (RSF 2009)
Freedom Press
(IPD 2009)
Journalists imprisoned
(CPJ 2000-09)
Confidence in press
(World Values Survey last
wave 2005-08)
Confidence in media (Gallup 2008)
Freedom of Press (Freedom house 2009)
Pearson Correlation 1 -.845**
.837**
-.531**
-.269 -.063 Sig. (2-tailed ) .000 .000 .000 .052 .509 N 192 168 122 192 53 113
Worldwide Press Freedom Index (RSF 2009)*
Pearson Correlation 1 -.783**
.484**
.217 .099 Sig. (2-tailed ) .000 .000 .119 .292 N 172 122 172 53 115
Freedom Press (IPD 2009)
Pearson Correlation 1 -.419**
-.418**
-.089 Sig. (2-tailed ) .000 .004 .393 N 122 122 46 95
Journalists imprisoned (CPJ 2000-09)
Pearson Correlation 1 .173 .013 Sig. (2-tailed ) .211 .886 N 197 54 115
Confidence in press (World Value Survey last wave, 2005-08)
Pearson Correlation 1 .103 Sig. (2-tailed ) .487 N 54 48
Confidence in media (Gallup 2008)
Pearson Correlation 1 Sig. (2-tailed ) N 115
**. Correlation is significant at the 0.01 level (2-tailed)
13 ASSESSING CORRUPTION: EXPERT SURVEYS VERSUS HOUSEHOLD SURVEYS, FILLING THE GAP
3.02
1.47 2.13
2.09
2.68
3.04
2.82
3.08
3.32
1.78
1.93
1.10
3.00
0,0
0,5
1,0
1,5
2,0
2,5
3,0
3,5
4,0
Population survey corruption inGovernment (Gallup)
Corruption Perception Index (TI-Experts Survey)
Freedom of Press(FreedomHouse09)
Confidence in government (Gallup)
Cheating on taxes never justifiable(WVS08)*
Accepting bribe never justifiable(WVS08)*
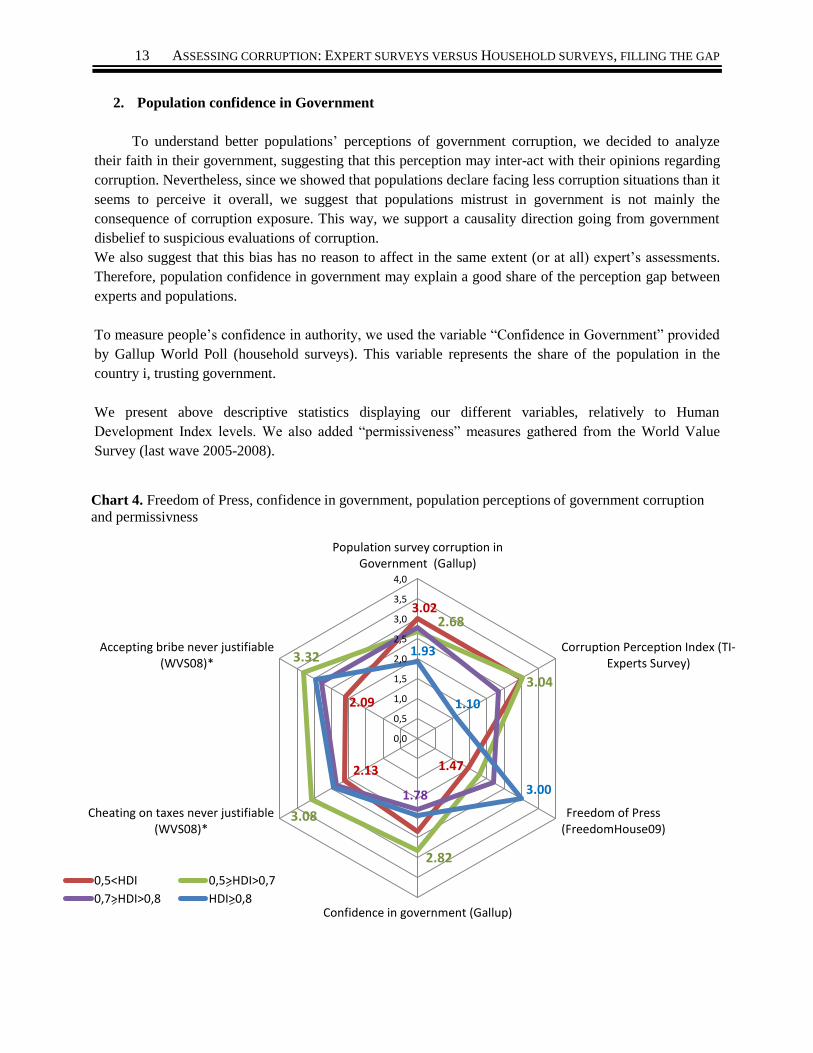
Chart 4. Freedom of Press, confidence in government, population perceptions of government corruption
and permissivness
0,5<HDI 0,5>HDI>0,7
0,7>HDI>0,8 HDI>0,8
2. Population confidence in Government
To understand better populations‟ perceptions of government corruption, we decided to analyze
their faith in their government, suggesting that this perception may inter-act with their opinions regarding
corruption. Nevertheless, since we showed that populations declare facing less corruption situations than it
seems to perceive it overall, we suggest that populations mistrust in government is not mainly the
consequence of corruption exposure. This way, we support a causality direction going from government
disbelief to suspicious evaluations of corruption.
We also suggest that this bias has no reason to affect in the same extent (or at all) expert‟s assessments.
Therefore, population confidence in government may explain a good share of the perception gap between
experts and populations.
To measure people‟s confidence in authority, we used the variable “Confidence in Government” provided
by Gallup World Poll (household surveys). This variable represents the share of the population in the
country i, trusting government.
We present above descriptive statistics displaying our different variables, relatively to Human
Development Index levels. We also added “permissiveness” measures gathered from the World Value
Survey (last wave 2005-2008).
14 WORKING PAPER N° 160
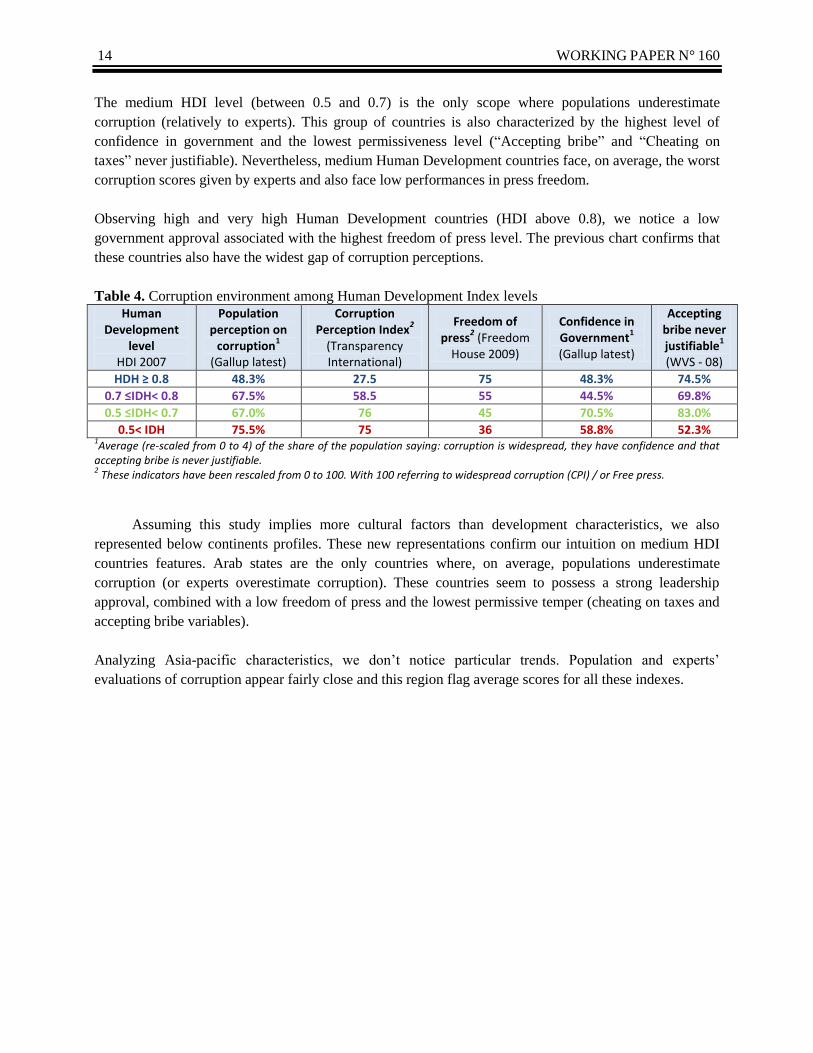
The medium HDI level (between 0.5 and 0.7) is the only scope where populations underestimate
corruption (relatively to experts). This group of countries is also characterized by the highest level of
confidence in government and the lowest permissiveness level (“Accepting bribe” and “Cheating on
taxes” never justifiable). Nevertheless, medium Human Development countries face, on average, the worst
corruption scores given by experts and also face low performances in press freedom.
Observing high and very high Human Development countries (HDI above 0.8), we notice a low
government approval associated with the highest freedom of press level. The previous chart confirms that
these countries also have the widest gap of corruption perceptions.
Table 4. Corruption environment among Human Development Index levels
Human Development
level HDI 2007
Population perception on
corruption1
(Gallup latest)
Corruption Perception Index
2
(Transparency International)
Freedom of press
2 (Freedom
House 2009)
Confidence in Government
1
(Gallup latest)
Accepting bribe never justifiable
1
(WVS - 08)
HDH ≥ 0.8 48.3% 27.5 75 48.3% 74.5%
0.7 ≤IDH< 0.8 67.5% 58.5 55 44.5% 69.8%
0.5 ≤IDH< 0.7 67.0% 76 45 70.5% 83.0%
0.5< IDH 75.5% 75 36 58.8% 52.3% 1Average (re-scaled from 0 to 4) of the share of the population saying: corruption is widespread, they have confidence and that
accepting bribe is never justifiable. 2 These indicators have been rescaled from 0 to 100. With 100 referring to widespread corruption (CPI) / or Free press.
Assuming this study implies more cultural factors than development characteristics, we also
represented below continents profiles. These new representations confirm our intuition on medium HDI
countries features. Arab states are the only countries where, on average, populations underestimate
corruption (or experts overestimate corruption). These countries seem to possess a strong leadership
approval, combined with a low freedom of press and the lowest permissive temper (cheating on taxes and
accepting bribe variables).
Analyzing Asia-pacific characteristics, we don‟t notice particular trends. Population and experts‟
evaluations of corruption appear fairly close and this region flag average scores for all these indexes.

15 ASSESSING CORRUPTION: EXPERT SURVEYS VERSUS HOUSEHOLD SURVEYS, FILLING THE GAP
3.10
2.88
1.66
1.98
2.13
2.15
0,0
0,5
1,0
1,5
2,0
2,5
3,0
3,5
4,0
Population surveycorruption in Government
(Gallup)
Corruption Perception Index(TI-Experts Survey)
Freedom of Press(FreedomHouse09)
Confidence in government(Gallup)
Cheating on taxes neverjustifiable (WVS08)*
Accepting bribe neverjustifiable (WVS08)*
Africa
2.42
2.40
2.21
2.70
2.48
2.65
0,0
0,5
1,0
1,5
2,0
2,5
3,0
3,5
4,0
Population survey corruptionin Government (Gallup)
Corruption Perception Index(TI-Experts Survey)
Freedom of Press(FreedomHouse09)
Confidence in government(Gallup)
Cheating on taxes neverjustifiable (WVS08)*
Accepting bribe neverjustifiable (WVS08)*
Asia Pacific
Latest
(Freedom house 2009)
Population surveys, corruption in government
(Gallup - Latest)
Corruption Perception Index (TI- Expert surveys - 2009)
Confidence in government (Gallup - Latest)
(Freedom house 2009)
Corruption Perception Index (TI- Expert surveys - 2009)
Confidence in government (Gallup - Latest)
Population surveys, corruption in government
(Gallup - Latest)
* Country coverage for this continent:
“Cheating on taxes never justifiable” (WVS08): 12.8%
“Accepting bribe never justifiable” (WVS08): 14.9%
Africa globally presents the lowest scores for most of these
indicators. Only Arab States score lower for the press freedom
index.
Paradoxically, Africa seems to trust its leader. Observed scores for
the confidence in Government variable belong to upper average:
Africa ranks 3rd
, behind Arab States.
It seems that press freedom and confidence in government are
not good bedfellows.
With a limited coverage, the World Values Survey, gives little clue
to evaluate population tolerance toward fraud in Africa
Asia-Pacific presents quiet homogeneous scores for most
of these indicators. Nevertheless, this continent is
characterized by a strong population confidence in
governments. (It shows the best score for this index. 67.5%
of the population of this sub-group declares having faith in
its government). Moreover the corruption perception gap
between populations and experts is very thin in Asia-Pacific.
* Country coverage for this continent:
“Cheating on taxes never justifiable” (WVS08): 35.5%
“Accepting bribe never justifiable” (WVS08): 35.5%
Chart 5. Press freedom, confidence in Government, Corruption
perceptions and fraud tolerance (Africa)
Chart 6. Press freedom, confidence in Government, Corruption
perceptions and fraud tolerance (Asia-Pacific)

16 WORKING PAPER N° 160
2.45
2.54
1.12
2.28 3.05
3.44
0,0
0,5
1,0
1,5
2,0
2,5
3,0
3,5
4,0
Population surveycorruption in
Government (Gallup)
Corruption PerceptionIndex (TI-Experts Survey)
Freedom of Press(FreedomHouse09)
Confidence ingovernment (Gallup)
Cheating on taxes neverjustifiable (WVS08)*
Accepting bribe neverjustifiable (WVS08)*
Arab States
2.75
2.56
1.97 1.54
2.03
2.65
0,0
0,5
1,0
1,5
2,0
2,5
3,0
3,5
4,0
Population survey corruptionin Government (Gallup)
Corruption Perception Index(TI-Experts Survey)
Freedom of Press(FreedomHouse09)
Confidence in government(Gallup)
Cheating on taxes neverjustifiable (WVS08)*
Accepting bribe neverjustifiable (WVS08)*
CIS
(Freedom house 2009)
Corruption Perception Index (TI- Expert surveys - 2009)
Confidence in government (Gallup - Latest)
Population surveys, corruption in government
(Gallup - Latest)
(Freedom house 2009)
Confidence in government (Gallup - Latest)
Corruption Perception Index (TI- Expert surveys - 2009)
Population surveys, corruption in government
(Gallup - Latest)
Former Soviet countries are characterized by the lowest
level of confidence populations place in their government.
These countries also record high level of corruption
perceptions. Considering experts’ perceptions this sub-group
ranks just after Africa.
* Country coverage for this continent:
“Cheating on taxes never justifiable” (WVS08): 29.6%
“Accepting bribe never justifiable” (WVS08): 29.6%
* Country coverage for this continent:
“Cheating on taxes never justifiable” (WVS08): 16.7%
“Accepting bribe never justifiable” (WVS08): 23.8%
Three major features are shared by Arab states: the lowest
scores of press freedom, associated with high confidence in
leadership (2nd
after Asia-Pacific) and the lowest tolerance
toward fraud. Nevertheless, given the limited coverage of the
World Value Surveys for this region, this last feature must be
taken cautiously.
Chart 7. Press freedom, confidence in Government, Corruption
perceptions and fraud tolerance (Arab states)
Chart 8. Press freedom, confidence in Government, Corruption
perceptions and fraud tolerance (CIS)

17 ASSESSING CORRUPTION: EXPERT SURVEYS VERSUS HOUSEHOLD SURVEYS, FILLING THE GAP
2.04
1.09
3.26 1.79
2.40
2.97
0,0
0,5
1,0
1,5
2,0
2,5
3,0
3,5
4,0
Population surveycorruption in Government
(Gallup)
Corruption PerceptionIndex (TI-Experts Survey)
Freedom of Press(FreedomHouse09)
Confidence in government(Gallup)
Cheating on taxes neverjustifiable (WVS08)*
Accepting bribe neverjustifiable (WVS08)*
Western Europe + North America
2.88
2.44
2.48 1.82
2.59
2.91
0,0
0,5
1,0
1,5
2,0
2,5
3,0
3,5
4,0
Population surveycorruption in
Government (Gallup)
Corruption PerceptionIndex (TI-Experts Survey)
Freedom of Press(FreedomHouse09)
Confidence ingovernment (Gallup)
Cheating on taxes neverjustifiable (WVS08)*
Accepting bribe neverjustifiable (WVS08)*
Latin America and Caribbean
Confidence in government (Gallup - Latest)
Corruption Perception Index (TI- Expert surveys - 2009)
Population surveys, corruption in government
(Gallup - Latest)
(Freedom house 2009)
Confidence in government (Gallup - Latest)
Corruption Perception Index (TI- Expert surveys - 2009)
Population surveys, corruption in government
(Gallup - Latest)
(Freedom house 2009)
* Country coverage for this continent:
“Cheating on taxes never justifiable” (WVS08): 57.7% “Accepting bribe never justifiable” (WVS08): 57.7%
Western Europe and North America, show the best scores
regarding both experts’ and populations’ corruption
perceptions. Paradoxically, this sub-group shows one of the
lowest government confidence levels. Once again this lack of
faith is associated with a high level of press freedom (The
highest scores).
This continent is also characterized by the bigger perception
gap regarding corruption.
Latin America and the Caribbean also present homogeneous
scores for these indicators. However, populations of this
continent show the highest distrust toward their leaders.
This lack of confidence is also associated to high levels of
press freedom (this continent ranks 2nd
).
Furthermore, we observe important levels of populations’
perceptions of corruption (penultimate, ahead Africa).
* Country coverage for this continent:
“Cheating on taxes never justifiable” (WVS08): 24.2%
“Accepting bribe never justifiable” (WVS08): 24.2%
Chart 9. Press freedom, confidence in Government, Corruption perceptions and
fraud tolerance (Western Europe and North America)
Chart 10. Press freedom, confidence in Government, Corruption perceptions
and fraud tolerance (Latin America and the Caribbean)

18 WORKING PAPER N° 160
In order to inform more precisely the impact of continent belonging on each variable, we constructed a
correlation matrix with the different factors involved. We display above the results of these estimations:
NB. To highlight continent singularities we created a dummy variable for each continent coded this way:
Not being continent J variable take the value 0 if country i1,..,n belongs to continent J; 1 if it does not.
We underlined in light grey significant results and in dark grey, “honest” correlations.
These results confirm the previous representations, putting the light on differences among continents.
For example, this table informs that “Not being an Arab country” decreases a population confidence in
government (feature shared with “Asia Pacific”,) religiosity and increases tolerance toward fraud.
“Not being a Western European - North American country” or “CIS”, increases a population religiosity
(contrarily to Africa or Arab States).
Regarding corruption variables, Western Europe or North America, clearly score better either regarding
experts‟ or populations‟ evaluations, whereas Africa seems the continent where corruption is widespread the
more.
These results are obviously not astonishing revelations, but underline clear trends. Once again, it
seems reaching a consensus on corruption perception is much easier on the bottom of the ladder.
“Accepting bribe” variable tends to confirm that continent belonging and underneath, culture, seems to
affect population tolerance toward fraud and probably corruption perception.
Table 5. Press freedom, confidence in government and cultural variables across continents
Not being an
African country
Not being an Arab States
Not being a Western
European or North American
country
Not being a CIS country
Not being a Latin American
or Caribbean country
Not being an Asia Pacific
country
Freedom of Press
(Freedom house
2009)
Pearson correlation .272**
.354**
-.484**
.066 -.165* -.039
Sig. (2-tailed) .000 .000 .000 .363 .022 .588
N 192 192 192 192 192 192
Confidence in
government
(Gallup - latest)
Pearson correlation -.072 -.171* .027 .255
** .163 -.268
**
Sig. (2-tailed) .390 .040 .749 .002 .050 .001
N 145 145 145 145 145 145
Religiosity Index
(Gallup - latest)
Pearson correlation -.549**
-.219**
.434**
.409**
-.001 .016
Sig. (2-tailed) .000 .010 .000 .000 .990 .856
N 138 138 138 138 138 138
Accepting bribe
- Never justifiable
( WVS 2005-08)
Pearson correlation .415**
-.354**
-.188 .096 -.090 .113
Sig. (2-tailed) .002 .009 .173 .491 .518 .416
N 54 54 54 54 54 54
Corruption in
government
(Gallup - latest)
Pearson correlation -.301**
.095 .346**
-.051 -.117 .103
Sig. (2-tailed) .000 .253 .000 .537 .158 .214
N 146 146 146 146 146 146
Corruption Perception
Index
(TI-consolidated)
Pearson correlation -.339**
-.057 .623**
-.102 -.027 .004
Sig. (2-tailed) .000 .453 .000 .176 .717 .961
N 177 177 177 177 177 177
**. Correlation is significant at the 0.01 level (2-tailed) *. Correlation is significant at the 0.05 level (2-tailed).

19 ASSESSING CORRUPTION: EXPERT SURVEYS VERSUS HOUSEHOLD SURVEYS, FILLING THE GAP
C. Approaching the gap
We previously described different factors able to affect populations‟ perceptions of corruption. We now
need to assess more precisely the way these factors interact with populations‟ perceptions. We will first
analyze the link between populations‟ perceptions of corruption and press freedom. Then, we will describe
the role of populations‟ faith in their government.
1. The curious case of freedom of press
Our main hypothesis is that corruption perception gap (between experts and populations) may be
explained by press freedom. Indeed, populations‟ perceptions should be affected by the extent of
information the public has access about their government behavior.
As first step, we studied the link between populations‟ perceptions of corruption and freedom of press.
Chart 11. Population perception of corruption and press freedom
Y= 1.18 + 1.93x -0.49x²
3.08
1.97
Media Bias
Sample size: N=142
20 WORKING PAPER N° 160
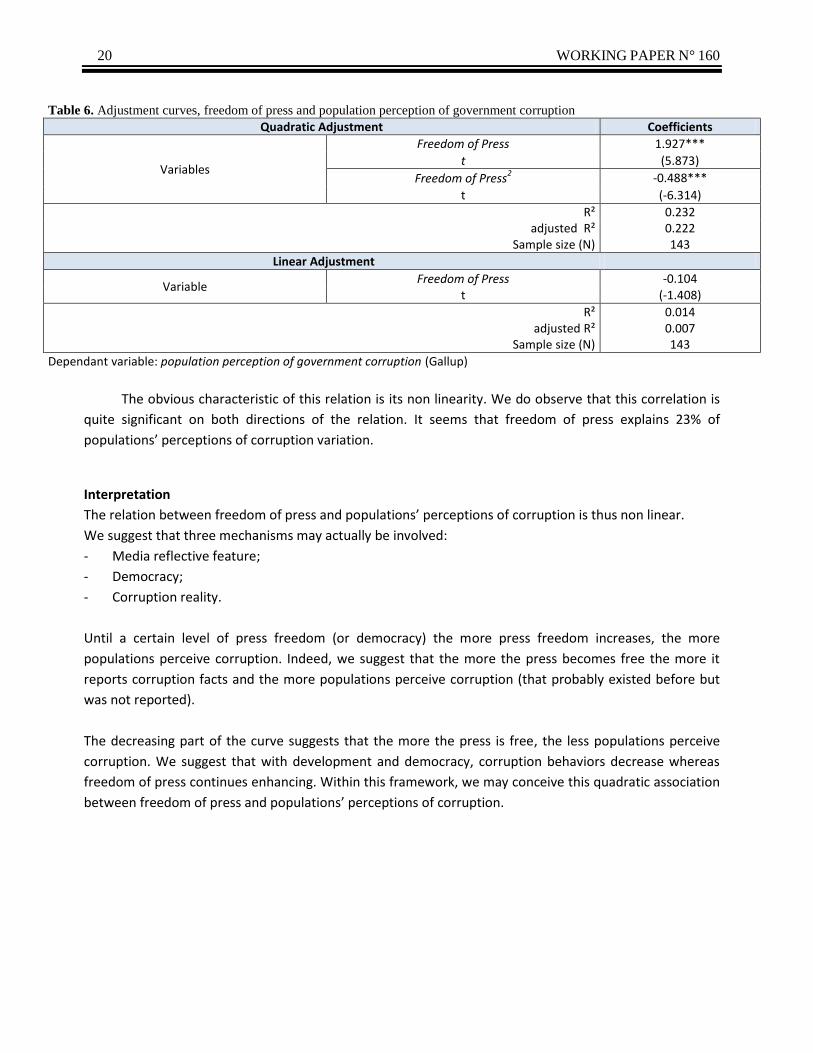
The obvious characteristic of this relation is its non linearity. We do observe that this correlation is
quite significant on both directions of the relation. It seems that freedom of press explains 23% of
populations’ perceptions of corruption variation.
Interpretation
The relation between freedom of press and populations’ perceptions of corruption is thus non linear.
We suggest that three mechanisms may actually be involved:
- Media reflective feature;
- Democracy;
- Corruption reality.
Until a certain level of press freedom (or democracy) the more press freedom increases, the more
populations perceive corruption. Indeed, we suggest that the more the press becomes free the more it
reports corruption facts and the more populations perceive corruption (that probably existed before but
was not reported).
The decreasing part of the curve suggests that the more the press is free, the less populations perceive
corruption. We suggest that with development and democracy, corruption behaviors decrease whereas
freedom of press continues enhancing. Within this framework, we may conceive this quadratic association
between freedom of press and populations’ perceptions of corruption.
Table 6. Adjustment curves, freedom of press and population perception of government corruption
Quadratic Adjustment Coefficients
Variables
Freedom of Press 1.927***
t (5.873)
Freedom of Press2 -0.488***
t (-6.314)
R² 0.232 adjusted R² 0.222
Sample size (N) 143
Linear Adjustment
Variable Freedom of Press -0.104
t (-1.408)
R² 0.014 adjusted R² 0.007
Sample size (N) 143
Dependant variable: population perception of government corruption (Gallup)
21 ASSESSING CORRUPTION: EXPERT SURVEYS VERSUS HOUSEHOLD SURVEYS, FILLING THE GAP
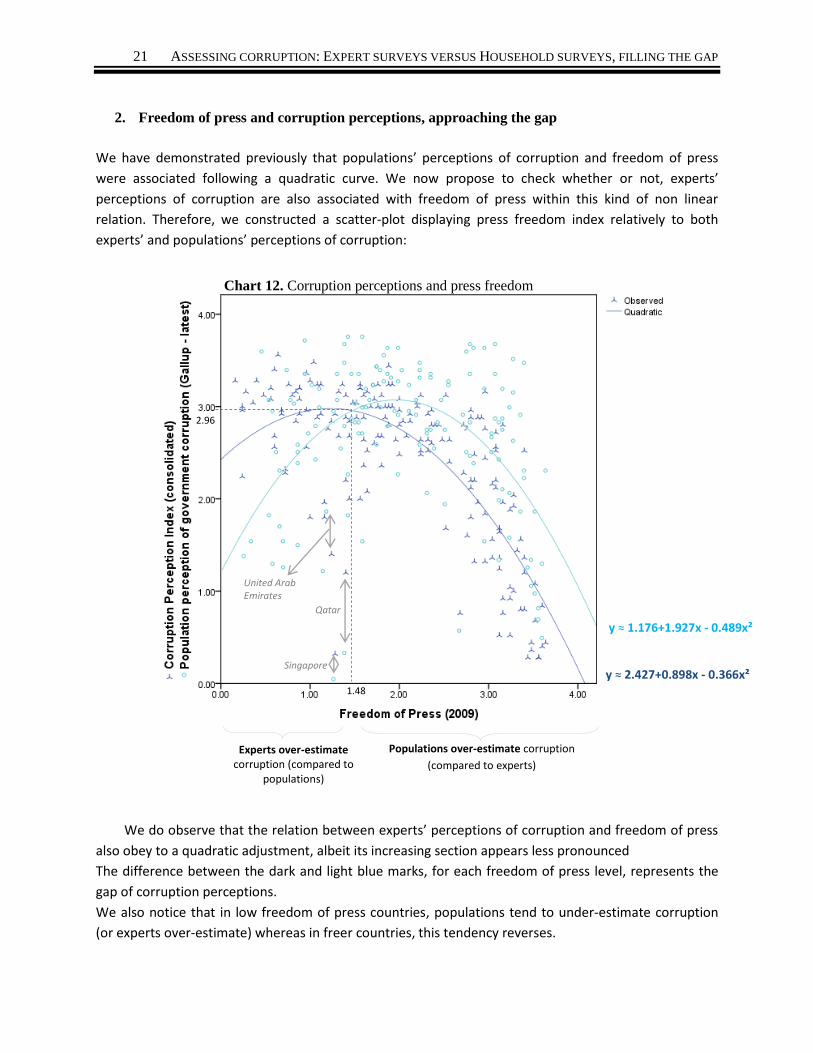
2. Freedom of press and corruption perceptions, approaching the gap
We have demonstrated previously that populations’ perceptions of corruption and freedom of press
were associated following a quadratic curve. We now propose to check whether or not, experts’
perceptions of corruption are also associated with freedom of press within this kind of non linear
relation. Therefore, we constructed a scatter-plot displaying press freedom index relatively to both
experts’ and populations’ perceptions of corruption:
We do observe that the relation between experts’ perceptions of corruption and freedom of press
also obey to a quadratic adjustment, albeit its increasing section appears less pronounced
The difference between the dark and light blue marks, for each freedom of press level, represents the
gap of corruption perceptions.
We also notice that in low freedom of press countries, populations tend to under-estimate corruption
(or experts over-estimate) whereas in freer countries, this tendency reverses.
Chart 12. Corruption perceptions and press freedom
y ≈ 2.427+0.898x - 0.366x²
y ≈ 1.176+1.927x - 0.489x²
2.96
1.48
Populations over-estimate corruption
(compared to experts)
Experts over-estimate corruption (compared to
populations)
Qatar
Singapore
United Arab Emirates

22 WORKING PAPER N° 160
Before modeling the perception gap determinants, we represented the single correlation between this
gap and freedom of press.
This representation confirms our previous observations, the more the press is free, the more the gap of
perception expands. Moreover, it seems that press freedom and the perception gap index are quite
correlated.
Chart 13. Press freedom and Corruption Perception Gap Index

23 ASSESSING CORRUPTION: EXPERT SURVEYS VERSUS HOUSEHOLD SURVEYS, FILLING THE GAP
4. Corruption perception, filling the Gap
Aiming to analyze the relative importance of the factors we previously analyzed, we constructed
8 different models to fill the gap of perceptions between experts (CPI-Transparency International) and
populations (Corruption in government - Gallup World Poll).
D. Modeling the spread
Model (A): CPGi = α+ β1Freedom of pressi + β2Confidence in Government + β3Faced Bribe Situationi +β4Non Western Europe or North American country+ β5Emigration Ratei + Ɛi Model (B): CPGi = α+ β1Freedom of pressi + β2Confidence in Governmenti + β3Emigration Ratei + β4Citizen Engagement Indexi + β5Ginii + Ɛi Model (C): CPGi = α+ β1Freedom of pressi + β2Confidence in Government + β3Happiness + β4Faced Bribe Situationi +β5Religiosity Index i + Ɛi
Model (D): CPGi = α+ β1Freedom of pressi + β2Confidence in Government+ β3Emigration Ratei + β4Citizen Engagementi + β5Gini + β6GDP Growth Ratei + Ɛi
Model (D1): CPGi = α+ β1Freedom of pressi + β2Confidence in Government+ β3Emigration Ratei + β4Ginii + β5 GDP Growth Ratei + β6 Faced Bribe Situation +Ɛi
Model (D2): CPGi = α+ β1Freedom of pressi + β2Emigration Ratei + β3 Ginii + β4GDP Growth Ratei + β5 Faced Bribe Situation Ɛi
Model (E): CPGi = α+ β1Freedom of pressi + β2Confidence in Government + β3Citizen Engagmenti + β4Happiness + β5Ginii + β6 law and orderi + β7 Non African countriesi + Ɛi
Model (F): CPGi = α+ β1Freedom of pressi + β2Confidence in Governmenti + β3 GDP per capitai + β4 square GDP per capitai + Ɛi Model (G): CPGi = α+ β1Freedom of pressi + β2Confidence in Government + β3Happiness + β4Ginii + β5 law and orderi + β6 Non African countriesi + β7 GDP per capitai + β8 square GDP/capitai + Ɛi

24 WORKING PAPER N° 160
B. Model parameters estimation
Table 7. Corruption perception, filling the gap, model parameter estimations (OLS method)
Tested models (A)1 (B) (C) (D) (D1) (D2) (E)
1 (F) (G)
Variables
Freedom of Press 0.856*** 0.762*** 0.848*** 0.777*** 0.912*** 1.020*** 0.737*** 0.756*** 0,740***
t (8.685) (9.654) (8.870) (9.378) (10.148) (11.816) (8.471) (7.328) (6,756)
Confidence in Government -0.333*** -0.385*** -0.305*** -0.357*** -0.257*** -0.316*** -0.232*** -0,246**
t (-3.766) (-4.954) (-3.495) (-4.342) (-2.712) (-3.216) (-2.766) (-2,468)
Emigration rate -0.857*** -1.145*** -1.138** -1.080*** -1.036***
t (-2.645) (-4.624) (-4.570) (-3.113) (-2.914)
Faced Bribe Situation 0.390* 0.680*** 0.232 0.520**
t (1.844) (2.998) (1.015) (2.498)
Religiosity Index -0.221**
t (-2.258)
Citizen Engagement Index 0.615*** 0.562*** 0.497**
t (3.283) (2.915) (2.028)
Happiness 0.510*** 0.348** 0,451***
t (3.953) (2.454) (3,676)
Law and order -0.375* -0,391*
t (-1.722) (-1,752)
Gini -0.13** -0.14** -0.018** -0.014* -0.034*** -0,034***
t (-2.098) (-2.156) (-2.426) (-1.784) (-3.654) (-3,602)
GDP Growth rate Consolidated -0.10 -0.022 -0.046**
t (-0.497) (-0.978) (-2.093)
Non Western Europe or Nth
Am. -0.634***
t (-3.037)
Non African country -0.340** -0,404**
t (-2.205) (-2,347)
GDP per capita, PPP 0.003*** 0,003**
t (2.684) (2,080)
square GDP per capita, PPP -4.213E-6**
-4,678E-6** t (-1.962) (-2,136)
R² 0,691 0.698 0.699 0.704 0.689 0.672 0.707 0.642 0.721
Adjusted R² 0,678 0.686 0.686 0.689 0.671 0.656 0.687 0.631 0.698
Sample size (N) 119 125 118 123 109 111 111 131 110
Colinearity test (*)
2,048 1.511 1.956 1.608 1.557 1.357 2.155 2.215 2.516 Dependent variable: CPG, Corruption Perception Gap index (gap between populations and experts).

25 ASSESSING CORRUPTION: EXPERT SURVEYS VERSUS HOUSEHOLD SURVEYS, FILLING THE GAP
(*) Maximum for the VIF value (SPSS), Test rejected if the VIF value overpass 5. [GDP and square GDP except].
C. Results Interpretation
The different models we constructed show a quite strong explanatory power. The selected variables
explain around 70% of the CPG variations. Moreover, depending of the variables involved, our panel
covers between 109 to 137 countries.
The way we measure the Corruption Perception Gap implies that the spread increases when population
overestimates corruption (relatively to experts).
Intuitive results are thus statistically demonstrated:
1. Freedom of press
As assumed previously, we find out that the more the press is free the more population overestimates
corruption. We suggest that the underlying reasoning is that media have the ability to broadly affect
population‟s perceptions. This way, one corruption act, flagged on the media, may modify durably and
widely populations‟ perceptions. We already informed the non linear relation between freedom of press
and populations perception. However, this quadratic association disappears in the perception gap.
2. Confidence in government
Population approval of sitting government clearly influences public views on corruption. The less
population trusts its government, the more the populations express bad opinions in corruption surveys.
Our results show that the less population has faith in their country leadership, the more it overestimates
corruptions (comparatively to experts.)
3. GDP per capita and GDP growth
The association between GDP per capita and our CPG index is quadratic. Our results show that, until a
certain level, the more GDP increases, the more population overestimates corruption, once reached this
level, the relation get reversed. However, it seems that the decreasing side of this curve is less
pronounced.
If GDP per capita is conceived as a gap repartition indicator within incomes, we understand GDP growth
as a consumer sentiment indicator. We therefore suppose that recession would lead to population
dissatisfaction able to influence population‟s opinion toward the sitting government.
If we tested this variable in three models, it only appears significant in the model D2. Ultimately, its
influence is weak even if stronger than the one of GDP per capita. Nevertheless, the direction of the
relation seems to confirm intuition, recession would encourage population overestimation of corruption.

26 WORKING PAPER N° 160
Economics literature, regularly underlines the link between economics crisis and corruption, declining
revenues, leading to corruption behavior increase. However, the use of time series would help to identify
better this phenomenon.
4. Faced bribe situation
Faced bribe situation refers to respondent experiments with corruption. Therefore, this variable could be
considered as a more accurate corruption measure. However, the single use of this variable may lead to
corruption overall underestimation, this may explain why the World Bank preferred the use of the other
Gallup World Poll indicator, “Corruption in Government”. Moreover touching survey respondent more
directly, we assume that some of them choose not to respond honestly to this kind of question, especially
if paying bribes is punished by their country law.
As observed in Charts 1 and 2, page 8, bribery experiment statements always appear lower than
corruption perceptions, letting the debate on the accuracy of corruption evaluation, wide open.
However, we presumed that “Faced bribe situation” variable may explain a share of the perception gap
between experts and populations, as we suppose that people‟s opinion on government corruption may be
affected by corruption events population daily faced.
Our study confirms that the more population has faced bribe situations, the more it reports corruption
(comparing to experts).
The previous variables provide intuitive results informing experts and population divergence on
corruption evaluation. However, we also observe less intuitive economic and cultural results:
5. Gini Index, the impact of income inequality
Gini Index describes the income distribution. We use data provided by UNDP in the 2009 Human
Development Report, backed on 2007 data. Gini index is scaled from 0 to 100, with 0 standing for perfect
equality in income distribution.
We suppose that income distribution is globally stable enough in short run to allow the kind of analysis
we perform.
Our findings show that if income distribution explains a share of the perception gap, its impact is limited.
Moreover, we come-up with results we consider counter-intuitive. Indeed, we expected income inequality
would impact negatively populations‟ perceptions of corruption, following two mechanisms:
- Corruption seems wider in unequal countries. (As we suggested previously, wider corruption implies
slighter gap of perception Cf. Chart 3 page 10);
- Inequality seems to be a strong vector of human dissatisfaction.
Therefore, we expected populations‟ perceptions of corruption would increase with inequality. Our results
actually demonstrate the opposite.
27 ASSESSING CORRUPTION: EXPERT SURVEYS VERSUS HOUSEHOLD SURVEYS, FILLING THE GAP
This counter intuitive result may be explained by a third contradictory factor. Income equality seems to be
a feature of very low HDI countries or very high HDI countries where populations seem also
overestimating corruption the more (relatively to experts). This overestimation distribution effect may,
this way, drives our results.
6. Religiosity Index
In the first place, we expected “Religiosity Index” to inform population tolerance toward corruption. As
main religions strictly blame corruption behaviors we expected that the more the population is religious
the less corruption. However the story appears less simplistic and we suppose that freedom of press also
interact in this process. Actually, we assume that two contradictory mechanisms should be involved.
Religious society might be less tolerant toward corruption so they would more easily claim government as
corrupted if they observe corruption in the media or in their daily life. On the other hand, if religion is
institutionalized and participate to the political system, it would be reasonable to think that corruption
behaviors would not be widespread. Thus, population would not perceive corruption too much.
On the other hand, we may also suppose that a stronger social constrain due to religious environment
could lead corruption authors to hide better their misdeeds, controlling the media for example. For
instance, the more religious countries are also the ones that control the more freedom of press, the case of
Arab States is quite significant of this reality.
Finally, our results inform that a strong religiosity2, implies less populations‟ over-estimation (or more
experts‟ over-estimation.). These results may be driven by Arab States and European or North American
countries in which we observed previously that these continents were respectively:
- one of the more (Arab states) and one of the less religious (Western Europe and North America);
- the ones where populations underestimate corruption the more (Arab States) or where
populations overestimate the more (Western Europe and North America).
7. Contestation variables: Citizen Engagement, Happiness Index and Emigration rate
The indicators we gathered to test population contestation finally did not confirm their role.
“Citizen engagement” (Gallup) describes the respondents‟ satisfaction with their community and their
social inclusion. As satisfaction variable, we also used Gallup “Happiness index” and UNDP “Emigration
rate”, expecting roughly the same impact.
We expected these variables to behave as satisfaction assessment: the less people are satisfied the more
they express negative opinions against the sitting government.
Our results did not reflect this intuition, actually they flag the opposite. As suggested previously regarding
Religiosity Index, results might be driven by external facts. It seems that engagement, happiness and
emigration rate are positively correlated with HDI levels. Therefore Western Europe countries and North
America may lead our results. As we informed already, in high HDI levels countries (or Western Europe
and North American countries) populations widely overestimate corruption.
2 measured by Gallup Religiosity Index (definition in annex 1).

28 WORKING PAPER N° 160
8. Continental differences
In order to better inform the cultural impact of continents on the previous contestation variables, we
constructed a correlation matrix with dummy variables, assuming that continent belonging, approaches
better cultural homogeneity than Human Development level:
These results confirm the previous analysis. Belonging to Africa or Western Europe and North
America, rationally leads opposite tendencies. Human Development level is also correlated to Citizen
Engagement, Happiness, Religiosity and Press freedom.
Moreover, we do observe a strong decreasing relation between religiosity and Human Development.
This matrix lightens our contestation variable distribution and show that the Happiness index increases in
Western Europe/ North America and Latin America. More generally, it seems that Happiness Index grows
with Human Development.
Table 8. Cultural variables, press freedom and continents
Non
African
Non Arab
states
Non Western Europe or
North American
Non CIS
Non Latin America
Caribbean
Non Asia
Pacific
HDI 2007
Citizen Engagment (Gallup latest)
Pearson correlation .321** -.068 -.479** .197* -.005 -.046 .529** Sig. (2-tailed) .000 .407 .000 .016 .947 .574 .000 N 150 150 150 150 150 150 147
Happiness (Gallup latest)
Pearson correlation .156 .171* -.303** .470** -.333** -.167 .283** Sig. (2-tailed) .073 .048 .000 .000 .000 .055 .001 N 133 133 133 133 133 133 130
Religiosity Index (Gallup)
Pearson correlation -.549** -.219** .434** .409** -.001 .016 -.702**
Sig. (2-tailed) .000 .010 .000 .000 .990 .856 .000 N 138 138 138 138 138 138 135
Freedom of Press (2009)
Pearson correlation Sig. (2-tailed) N
.272** .000 192
.354** .000 192
-.484** .000 192
.066
.363 192
-.165* .022 192
-.039 .588 192
.469** .000
18 **. Correlation is significant at the 0.01 level (2-tailed) *. Correlation is significant at the 0.05 level (2-tailed)
29 ASSESSING CORRUPTION: EXPERT SURVEYS VERSUS HOUSEHOLD SURVEYS, FILLING THE GAP
5. Conclusion
The different analysis performed so far demonstrated the crucial role played by press freedom in
corruption perceptions. We also described the underlying dynamics: the transition from controlled press
to free media leads to broader media coverage of corruption cases, thereby increasing corruption
perceptions (even if these perceptions are not backed by a real increase of corruption cases).
In a previous paper [Brown, J. Orme, W. Roca, T. (2010)], we already demonstrated the existence of a
media bias affecting populations‟ perceptions and, to a lower extent, TI Corruption Perception Index.
Theoretically, press freedom (and democracy) reduces corruption. The widespread reasoning is that
freedom of press - and its corollary, democracy - may reduce corruption, within the game of electoral
process and vote sanction, making politician accountable toward citizens. “Roughly, it is argued that
within the democratic game, “bad behaviors” - experienced or flagged in the media - are punished at the
ballot box”3. The accountability and vote mechanisms are hence said to prevent corruption.
This way, the relation between press freedom and corruption perception should be linear. We suggest that
the observation of a quadratic association reveals the media bias affecting both experts‟ and populations‟
judgment.
Our results also inform that populations‟ perceptions seem equally affected by people trust towards
State representatives. We have sought to show that if a share of population mistrust may be the results of
corruption exposures, these confrontations were always limited comparing to the population widespread
feeling of leadership corruption, suggesting that the causality direction goes mainly from mistrust to
corruption suspicions.
Moreover, the fact that, in both developed and democratic countries - where corruption should be lower -,
populations systematically overestimate corruption seems to support the causality direction we defend.
Overall, our study reveals that experts and populations barely agree on corruption estimation.
Evidences show that the corruption perception gap results of the combination of at least 4 factors:
Factors leading populations to overestimate4 the extent of corruption:
1. Low level of corruption;
2. High freedom of press;
3. Low confidence in Government;
4. Low tolerance or permissiveness5.
Factors leading populations to underestimate6 the extent of corruption:
1. Controlled media;
2. High level of confidence in government;
3 Brown, J. Orme, W. Roca, T. (2010) p.8.
4 Or experts to underestimate corruption/
5 This last aspect doesn‟t appear in our models as the country coverage of World Value Surveys doesn‟t allow us to
lead robust analysis. However permissiveness link with population opinion on ethical or unethical behavior seems
quite arguable theoretically. 6 Or experts to overestimate corruption.

30 WORKING PAPER N° 160
Testing economic variables, we observed that overall, economic events seem to have little influence
on the perception gap. We suggest that our Confidence in Government indicator captures a share of
population economic dissatisfaction.
In light of this analysis we suggest that neither experts‟ nor populations‟ perceptions succeed in
properly evaluate corruption extent. Nevertheless it seems that expert‟s assessments would be less biased.
However, these results remain worrying as the CPI is so much taken seriously by investors and funders,
even if Transparency International regularly warns about the misuse of its index.

31 ASSESSING CORRUPTION: EXPERT SURVEYS VERSUS HOUSEHOLD SURVEYS, FILLING THE GAP
6. Bibliography
Bardhan, P. 1997, “Corruption and Development: A Review of Issues.” Journal of Economic
Literature 35 (1997): 1020-1046.
Brown, J. Orme, W. Roca, T. “Fear and Loathing of the Corruption Perception Index: Does Transparency
International Penalize Press Freedom?” Development Economics Group (GED) Lare-efi, Université
Montesquieu Bordeaux IV, available at: http://ged.u-bordeaux4.fr/ceddt158.pdf
Chong, A, and Calderon, C. “On the Causality and Feedback Between Institutional Measures and
Economic Growth.” Economics and Politics 12(1) (2000): 69-81.
Clague, C., Institutions and Economic Development: Growth and Governance in Less Developed and
Post-Socialist Countries. Baltimore. The John Hopkins University Press, 1997.
Freedom House, 2009a, “Freedom in the World Methodology Summary”, available at:
http://www.freedomhouse.org/uploads/fiw09/FIW_MethodologySummary_ForWeb.pdf
Freedom House, 2009b, “Freedom in the World 2009 Checklist Questions”, available at:
http://www.freedomhouse.org/uploads/fiw09/FIW09_ChecklistQuestions_ForWeb.pdf
Gallup Database, World poll 2010, http://www.gallup.com/consulting/worldpoll/24046/About.aspx
Institutional Profiles Database (IPD), 2009, http://www.cepii.fr/francgraph/bdd/institutions.htm
Jonathan, I. Kaufmann D, and Pritchett, L.H. 1997, “Civil Liberties, Democracy, and the Performance of
Government Projects”. World Bank Economic Review, Vol. 11, No. 2
Johnson, S. Kaufmann, D. Zoido-Lobaton P. 1999, Corruption, Public Finances, and the Unofficial
Economy. World Bank Policy Research Working Paper #2169,1999
Kanbur, R. 2004, “Reforming the Formula: A Modest Proposal for Introducing Development Outcomes
in IDA Allocation Procedures”: http://www.arts.cornell.edu/poverty/kanbur/IDAForm.pdf
Kaufmann, D. Kraay, A et Zoidon-Lobaton, P. 1999 (A.), “Aggregating Governance Indicators”, Policy
Research Working Paper 2195, The World Bank Development Research Group Macroeconomics and
Growth and World Bank Institute Governance.
Kaufmann, D. Kraay, A et Zoidon-Lobaton, P. 1999 (B.), “Governance Matters”, Policy Research
Working Paper 2196, The World Bank Development Research Group Macroeconomics and Growth and
World Bank Institute Governance.

32 WORKING PAPER N° 160
Kaufmann, D. “Rethinking Governance: Empirical Lessons Challenge Orthodoxy.” In Global
Competitiveness Report 2002-03, World Economic Forum. Washington, D.C.
Kaufmann, D. Kraay, A. “A Growth without Governance” in Economía, Winter 2002.
Kaufmann, D. Kraay, A, and Mastruzzi, M. “Governance Matters III: Governance Indicators for 1996-
2002.” World Bank Economic Review, Vol. 18, No. 4 (2004): pp. 253-87
Kaufmann, D. Kraay, A. 2002 “Growth without Governance”, Policy Research Paper 2928-World Bank
Institute.
Knack, S. and P. Keefer. “Institutions and Economic Performance: Cross-Country Tests Using
Alternative Institutional Measures.” Economics and Politics 7 (1995): 207-27.
North, D. 1990, Institutions, Institutional Change and Economic Performance, Cambridge University
Press.
OCDE 2006, Les indicateurs de gouvernance, usages et abus, Étude du centre de développement, C.
Arndt C. et Oman C.P.
Olken, B.A. 2009, Corruption Perceptions vs. Corruption Reality, MIT and NBER, March 11, 2009
Razafindrakoto M., Roubaud F. 2005, “How far can we trust the experts‟ opinion on corruption? An
experiment based on surveys in francophone Africa ”, Transparency International, Pluto Press, London /
Ann Arbor, pp.292-295.
Roca, T. Orme, W. and Brown, J. 2010, “Fear and Loathing of the Corruption Perception Index: Does
Transparency International Penalize Press Freedom?” (October 18, 2010). Development Economic
Group (GED), Université Montesquieu Bordeaux IV, available at:
http://ged.u-bordeaux4.fr/ceddt158.pdf
Transparency International, 2009, “A short methodological note”, available at:
http://www.transparency.org/content/download/36189/568652
World Bank, 2004, Making Services Work for Poor People, World Development Report 2004.
World Bank, 2010, “Corruption and Governance, World Bank website:”
http://lnweb90.worldbank.org/eca/eca.nsf/0/e9ac26bae82d37d685256a940073f4e9?OpenDocument

33 ASSESSING CORRUPTION: EXPERT SURVEYS VERSUS HOUSEHOLD SURVEYS, FILLING THE GAP
7. Annex
Annex 1. Data
Table 1. Data used in this paper
Indicator name Provider Nature Date Methodology or Survey question
(Household surveys)
Corruption
Corruption
Perception Index
Transparency International
Expert surveys
2009
+
Consolidated
http://www.transparency.org/policy_researc
h/surveys_indices/cpi/2009
Corruption
control
World Bank, Worldwide
Governance Indicators, World
Bank Institute
Expert surveys 2008 http://info.worldbank.org/governance/wgi/i
ndex.asp
“Corruption in
Government”
Gallup International
http://www.gallup.com/ Household surveys latest
“Measure is share of people who believe
corruption is widespread in government in
their country”
“Faced Bribe
Situation”
Gallup International
http://www.gallup.com/
Household surveys latest
“In the last 12 months, were you,
personally, faced with this kind of situation,
or not (regardless of whether you gave a
bribe/present or not)? (Yes)”
Information - Media
Freedom of the
Press
Freedom house
Expert surveys 2009
http://www.freedomhouse.org/template.cfm
?page=16
Freedom of Press
Index
Reporter Sans Frontière
(Reporter Without Border) Expert surveys 2009
http://en.rsf.org/
Freedom of Press Institutional Profile Database
(IPD) Expert surveys 2009
http://www.cepii.fr/anglaisgraph/bdd/institu
tions.htm
Journalist
imprisoned
Committee to Protect
Journalist
Objective variable
measuring facts 2009 to 2000
We constructed this variable as a dummy
variable, coded 1 if the country had at least
a journalist imprisoned between 2000 and
2009. 0 if no.
“Confidence in
Media”
Gallup International
http://www.gallup.com/ Household surveys 2008
“In this country, do you have confidence in
each of the following, or not? How about
quality and integrity of the media?” (Share
of the people that answered yes)”
Confidence in
Press World Values Survey Household surveys
Last wave
2005-2008
http://www.worldvaluessurvey.org
Democracy and liberty
Polity Index
Integrated Network for
Societal Conflict Research.
(INSCR)
Experts surveys 2008
Composite Index measuring democracy
depth. http://www.systemicpeace.org/inscr/inscr.ht
m
Political Pluralism
and Participation
(Freedom House
2009)
Freedom house
Experts surveys 2009 http://www.freedomhouse.org
Political Terror
Scale
Amnesty International
Experts surveys 2008 http://www.politicalterrorscale.org/

34 WORKING PAPER N° 160
“Confidence in
government”
Gallup International
http://www.gallup.com/ Household surveys Latest
“In this country, do you have confidence in
national government?” (Share of the people
that answered yes)
“Afraid to express
political view”
Gallup International
http://www.gallup.com/ Household surveys Latest
“In your opinion, how many people in this
country, if any, are afraid to openly express
their political views?” ( Measure is share of
people who believe most of people are
afraid)
“Freedom to
choose”
Gallup International
http://www.gallup.com/ Household surveys Latest
“In this country, are you satisfied or
dissatisfied with Your freedom to choose
what you do with your life?” (Share of the
people that answered yes)
“Voiced your
opinion”
Gallup International
http://www.gallup.com/ Household surveys Latest
“Have you voiced your opinion to a public
official in the past month ”
“Law and order” Gallup International
http://www.gallup.com/ Household surveys latest
“The Law and Order Index measures
security levels that respondents report for
themselves and their families. Two
elements make up this index: one composed
of respondents' reported confidence in local
police and feeling safe walking alone at
night, and the other of two questions about
respondents' experiences with crime.”
Voter Turn out International IDEA
http://www.idea.int/ Objective variable
Latest
available
This variable gathers the parliamentary
election voter turnout. For the case of
Gabon parliamentary data were not
available, we used instead president voter
turnout. We used the last data available.
The oldest data we have are for Chad
(2002), Guinea (2002), Jordan (2003) and
Yemen (2003). For all the other countries
we have data from 2004 to 2009.
Culture and continents
Continents Objective variable
We created 6 dummy variables representing
the fact not to belong to a specific
continent.
“Religiosity
Index”
Gallup International
http://www.gallup.com/ Household surveys Latest
The Religiosity Index is a measure of the
importance of religion for respondents and
their self-reported attendance of religious
services. For religions in which attendance
at services is limited, care must be used in
interpreting the data
« Citizen
Engagment Index
»
Gallup International
http://www.gallup.com/ Household surveys Latest
The Citizen Engagement Index assesses
respondents' satisfaction with their
communities, and their inclination to
volunteer their time, money, and assistance
to others. Engaged citizens are positive
about the communities they live in and
actively give back to them.
«Happiness » Gallup International
http://www.gallup.com/ Household surveys latest
“Did you experiment happiness feelings a
lot of the day yesterday?”
(Share of the people that answered yes)
Economic variables and other indicators
Human
Development
Index (HDI)
UNDP, Human Development
Report 2009 Objective variable 2007 http://hdr.undp.org/en/
Migration rate UNDP, Human Development
Report 2009 Objective variable 2007 http://hdr.undp.org/en/
Gini index UNDP, Human Development
Report 2009 Objective variable 2007 http://hdr.undp.org/en/

35 ASSESSING CORRUPTION: EXPERT SURVEYS VERSUS HOUSEHOLD SURVEYS, FILLING THE GAP
Annex 2. Countries covered by Gallup "Corruption in Government variable"
1Date of the survey for the concerning country
GDP Annual
Growth
World Bank World
Development Indicators 2010 Objective variable Consolidated
World Bank WDI 2010
http://data.worldbank.org/data-
catalog/world-development-indicators/wdi-
2010
Unemployment
Rate
International Labor
Organization,
Objective variable
Average
between
available data
for 2005 to
2008.
KILM dataset
http://www.ilo.org/empelm/what/lang--
en/WCMS_114240
Unemployment
Rate Variation
International Labor
Organization, KILM dataset
http://www.ilo.org/empelm/w
hat/lang--en/WCMS_114240
Objective variable 2005 to 2008
This variable is the absolute difference
between the oldest and the latest data
available (between 2005 and 2008)
Table 2. «Corruption in government» (Gallup – Latest available)
Country Date1 Country Date
1 Country Date
1 Country Date
1 Country Date
1
Afghanistan 2009 Congo (DRC) 2007 Iran 2008 Namibia 2007 Sri Lanka 2009
Albania 2006 Costa Rica 2009 Iraq 2009 Nepal 2009 Sudan 2006
Algeria 2009 Cote d'Ivoire 2009 Ireland 2009 Netherlands 2008 Sweden 2008
Angola 2008 Croatia 2006 Israel 2008 New Zealand 2008 Switzerland 2006
Argentina 2009 Cyprus 2009 Italy 2009 Nicaragua 2009 Syrian Arab Republic 2009
Armenia 2009 Czech Republic 2007 Jamaica 2006 Niger 2009 Tajikistan 2009
Australia 2008 Denmark 2008 Japan 2009 Nigeria 2009 Tanzania 2008
Austria 2008 Djibouti 2009 Jordan 2009 Norway 2008 Thailand 2008
Azerbaijan 2009 Dominican Rep. 2008 Kazakhstan 2009 Palestinian Territories
2009 Macedonia (FYR) 2006
Bahrain 2009 Ecuador 2009 Kenya 2009 Pakistan 2009 Togo 2008
Bangladesh 2009 Egypt 2009 Korea (Republic of) 2009 Panama 2009 Trinidad and Tobago 2008
Belarus 2009 El Salvador 2009 Kyrgyzstan 2009 Paraguay 2009 Tunisia 2009
Belgium 2008 Estonia 2009 Laos 2008 Peru 2009 Turkey 2006
Belize 2007 Ethiopia 2008 Latvia 2009 Philippines 2009 Uganda 2009
Benin 2008 Finland 2008 Lebanon 2009 Poland 2008 Ukraine 2009
Bolivia 2009 France 2009 Liberia 2008 Portugal 2008 United Kingdom 2009
Bosnia and Hz 2006 Georgia 2009 Lithuania 2009 Qatar 2009 United States 2009
Botswana 2008 Germany 2009 Luxembourg 2008 Romania 2009 Uruguay 2009
Brazil 2009 Ghana 2009 Madagascar 2008 Russian Fed. 2009 Uzbekistan 2006
Bulgaria 2006 Greece 2009 Malawi 2009 Rwanda 2009 Venezuela 2009
Burkina Faso 2008 Guatemala 2009 Malaysia 2009 Saudi Arabia 2009 Viet Nam 2009
Burundi 2009 Guinea 2007 Mali 2008 Senegal 2009 Yemen 2009
Cambodia 2009 Guyana 2007 Malta 2008 Serbia 2006 Zambia 2008
Cameroon 2009 Haiti 2008 Mauritania 2009 Sierra Leone 2008 Zimbabwe 2009
Canada 2009 Honduras 2009 Mexico 2009 Singapore 2009 Kosovo 2008
Central African Republic
2007 Hong Kong 2008 Moldova 2009 Slovakia 2006 Puerto Rico 2006
Chad 2008 Hungary 2008 Mongolia 2008 Slovenia 2009 Taiwan 2008
Chile 2009 Iceland 2008 Montenegro 2006 Somalia 2009
Colombia 2009 India 2008 Morocco 2009 South Africa 2009

36 WORKING PAPER N° 160
Annex 3. CPI time stability
Table 3. Time comparison of the CPI correlation matrix
CPI2009 CPI2008 CPI2007 CPI2006
CPI2009 Pearson correlation 1 .998**
.995**
.989**
Sig. (2- tailed) .000 .000 .000
N 195 195 195 166
CPI2008 Pearson correlation 1 .998**
.992**
Sig. (2- tailed) .000 .000 N 195 195 166
CPI2007 Pearson correlation 1 .994**
Sig. (2- tailed) .000
N 195 166
CPI2006 Pearson correlation 1 Sig. (2- tailed) N 166
**. Correlation is significant at the 0.01 level (2-tailed)